SECURITIES AND EXCHANGE COMMISSION
CERTIFIED SHAREHOLDER REPORT OF REGISTERED MANAGEMENT
Investment Company Act file number:
811-22673
PIMCO Dynamic Income Fund
(Exact name of registrant as specified in charter)
1633 Broadway, New York, NY 10019
(Address of principal executive offices)
Treasurer (Principal Financial & Accounting Officer)
650 Newport Center Drive, Newport Beach, CA 92660
(Name and address of agent for service)
Copies to:
Registrant’s telephone number, including area code: (844) 337-4626
Date of fiscal year end: June 30
Date of reporting period: June 30, 2022
Form N-CSR is to be used by management investment companies to file reports with the Commission not later than 10 days after the transmission to stockholders of any report that is required to be transmitted to stockholders under Rule 30e-1 under the Investment Company Act of 1940 (17 CFR 270.30e-1). The Commission may use the information provided on Form N-CSR in its regulatory, disclosure review, inspection, and policymaking roles.
A registrant is required to disclose the information specified by Form N-CSR, and the Commission will make this information public. A registrant is not required to respond to the collection of information contained in Form N-CSR unless the Form displays a currently valid Office of Management and Budget (“OMB”) control number. Please direct comments concerning the accuracy of the information collection burden estimate and any suggestions for reducing the burden to Secretary, Securities and Exchange Commission, 450 Fifth Street, NW, Washington, DC 20549-0609. The OMB has reviewed this collection of information under the clearance requirements of 44 U.S.C. § 3507.
The following is a copy of the report transmitted to shareholders pursuant to Rule 30e-1 under the Investment Company Act of 1940, as amended (the “1940 Act”) (17 CFR 270.30e-1).
Annual Report
June 30, 2022
PCM Fund, Inc. | PCM | NYSE
PIMCO Global StocksPLUS
& Income Fund | PGP | NYSE
PIMCO Strategic Income Fund, Inc. | RCS | NYSE
PIMCO Access Income Fund | PAXS | NYSE
PIMCO Dynamic Income Fund | PDI | NYSE
PIMCO Dynamic Income Opportunities Fund | PDO | NYSE
| | | | | | | | |
| | |
| | | | | | Page | |
| | | | | | | | | |
| | | |
| | | | | | | 2 | |
| | | |
| | | | | | | 4 | |
| | | |
| | | | | | | 16 | |
| | | |
| | | | | | | 18 | |
| | | |
| | | | | | | 20 | |
| | | |
| | | | | | | 21 | |
| | | |
| | | | | | | 22 | |
| | | |
| | | | | | | 23 | |
| | | |
| | | | | | | 24 | |
| | | |
| | | | | | | 26 | |
| | | |
| | | | | | | 28 | |
| | | |
| | | | | | | 29 | |
| | | |
| | | | | | | 116 | |
| | | |
| | | | | | | 152 | |
| | | |
| | | | | | | 153 | |
| | | |
| | | | | | | 154 | |
| | | |
| | | | | | | 155 | |
| | | |
| | | | | | | 157 | |
| | | |
| | | | | | | 159 | |
| | | |
| | | | | | | 160 | |
| | | |
| | | | | | | 162 | |
| | | |
| | | | | | | 163 | |
| | | |
| | | | | | | 187 | |
| | | |
| | | | | | | 220 | |
| | | |
| | | | | | | 221 | |
| | | |
| | | | | | | 222 | |
| | | |
| | | | | | | 226 | |
| | | |
| | | | | | | 230 | |
| | | |
| | | | | | | 241 | |
| | | | | | | | | |
| | | |
| Fund | | Fund
Summary | | | Schedule of
Investments | |
| | | | | | | | | |
| | | |
| | | 8 | | | | 30 | |
| | | |
| | | 9 | | | | 40 | |
| | | |
| | | 10 | | | | 54 | |
| | | |
| | | 11 | | | | 67 | |
| | | |
| | | 12 | | | | 76 | |
| | | |
| | | 15 | | | | 102 | |
| | | Consolidated Schedule of Investments |
| | | | |
Letter from the Chair of the Board & President | | | | |
Dear Shareholder,
We hope that you and your family are remaining safe and healthy during these challenging times. We continue to work tirelessly to navigate markets and manage the assets that you have entrusted with us. Following this letter is the PIMCO
Closed-End
Funds Annual Report, which covers the
12-month
reporting period ended June 30, 2022. On the subsequent pages, you will find specific details regarding investment results and a discussion of the factors that most affected performance during the reporting period.
For the
12-month
reporting period ended June 30, 2022
The global economy continued to be affected by the
COVID-19
pandemic
(“COVID-19”)
and its variants. Looking back, third quarter 2021 U.S. annualized gross domestic product (“GDP”) grew 2.3%. Economic activity accelerated during the fourth quarter, as GDP growth was 6.9%. However, the U.S. economy then experienced a setback, as first quarter 2022 GDP growth was
-1.6%.
Finally, the Commerce Department’s initial estimate for second quarter 2022 annualized GDP growth — released after the reporting period ended — was 0.9%.
In the U.S., the Federal Reserve Board (the “Fed”) took several steps to tighten monetary policy to combat elevated inflation. The Fed reduced the monthly pace of its net asset purchases of Treasury securities and agency mortgage-backed securities in November 2021 and again in December. The Fed ended its monthly asset purchases in
mid-March
2022. The Fed then raised the federal funds rate 0.25% to a range between 0.25% and 0.50% in March 2022, its first rate hike since 2018. The central bank then raised rates 0.50% in its May 2022 meeting and 0.75% in its June meeting. Finally, on July 27, 2022 — after the reporting period ended — the Fed raised rates 0.75%, to a range between 2.25% and 2.50%.
Economies outside the U.S. also continued to be impacted by the pandemic. The war in Ukraine and its repercussions also led to increased uncertainties around the world. In its April 2022 World Economic Outlook Update, the International Monetary Fund (“IMF”) said it expects U.S. gross domestic product (“GDP”) growth to be 3.7% in 2022, compared to 5.7% in 2021. Elsewhere, the IMF expects 2022 GDP to grow 2.8% in the eurozone (from 5.3% in 2021), 3.7% in the U.K. (from 7.4% in 2021) and 2.4% in Japan (from 1.6% in 2021).
Several other central banks began tightening monetary policy during the period. In December 2021, the Bank of England (the “BoE”) surprised the market and raised rates for the first time since
COVID-19
began. The BoE again raised rates at its meetings in February, March, May and June 2022. The European Central Bank (the “ECB”) indicated that it intended to raise rates at its September 2022 meeting. Elsewhere, the Bank of Japan (the “BoJ”) maintained its loose monetary policy and appears likely to remain accommodative in the near future given the headwinds facing its economy.
During the reporting period, short- and long-term U.S. Treasury yields moved sharply higher. The yield on the benchmark
10-year
U.S. Treasury note was 2.98% on June 30, 2022, versus 1.45% on June 30, 2021. The Bloomberg Global Treasury Index (USD Hedged), which tracks fixed-rate, local currency government debt of investment grade countries, including developed and emerging markets, returned -7.91%. Meanwhile, the Bloomberg Global Aggregate Credit Index (USD Hedged), a widely used index of global investment grade credit bonds, returned
-12.75%.
Riskier fixed income asset classes, including high yield corporate bonds and emerging market debt, were also weak. The ICE BofAML Developed Markets High Yield Constrained Index (USD Hedged), a widely used index of below-investment-grade bonds, returned
-12.85%,
whereas emerging market external debt, as represented by the JPMorgan Emerging Markets Bond Index (EMBI) Global (USD Hedged), returned
-19.25%.
Emerging market local bonds, as represented by the JPMorgan Government Bond Index-Emerging Markets Global Diversified Index (Unhedged), returned
-19.28%.
Amid periods of volatility, global equities generally posted weak results during the reporting period as economic and geopolitical concerns weighed on investor sentiment. U.S. equities, as represented by the S&P 500 Index, returned
-10.62%.
Global equities, as represented by the MSCI World Index, returned -14.34%, while emerging market
equities, as measured by the MSCI Emerging Markets Index, returned -25.28%. Meanwhile, Japanese equities, as represented by the Nikkei 225 Index (in JPY), returned
-8.33%
and European equities, as represented by the MSCI Europe Index (in EUR), returned
-6.54%.
Commodity prices were volatile and generated mixed returns. Brent crude oil, which was approximately $75 a barrel at the start of the reporting period, rose to roughly $112 a barrel at the end of June 2022. We believe the
oil-price
increase was driven by supply shortages and stronger demand due to economic
re-openings
as
COVID-19
restrictions eased. Repercussions from the war in Ukraine also contributed to higher oil prices. In terms of other commodities prices, copper declined, whereas gold rose during the period.
Finally, there were also periods of volatility in the foreign exchange markets. We believe this was due to several factors, including economic growth expectations and changing central bank monetary policies, as well as rising inflation,
COVID-19
variants and geopolitical events. The U.S. dollar strengthened against several major currencies. For example, during the reporting period, the U.S. dollar returned 11.59%, 11.95% and 18.13% versus the euro, the British pound and the Japanese yen, respectively.
Thank you for the assets you have placed with us. We deeply value your trust, and we will continue to work diligently to meet your broad investment needs. For any questions regarding your PIMCO
Closed-End
Funds investments, please contact your financial adviser, or call the Funds’ shareholder servicing agent at (844)
33-PIMCO.
We also invite you to visit our website at pimco.com to learn more about our global viewpoints.
Sincerely,
| | |
 | |  |
| | |
 | |  |
| Deborah A. DeCotis | | Eric D. Johnson |
| Chair of the Board of Trustees | | President |
Past performance is no guarantee of future results. Unless otherwise noted, index returns reflect the reinvestment of income distributions and capital gains, if any, but do not reflect fees, brokerage commissions or other expenses of investing. It is not possible to invest directly in an unmanaged index.
| | | | |
Important Information About the Funds | | | | |
Information regarding each Fund’s principal investment strategies, principal risks and risk management strategies, the effects of each Fund’s leverage, and each Fund’s fundamental investment restrictions, including a summary of certain changes thereto during the most recent fiscal year, can be found within the relevant sections of this report. Please refer to the Table of Contents for further information.
The Board approved the reorganization (the “Reorganization”) of PIMCO Income Opportunity Fund and PIMCO Dynamic Credit and Mortgage Income Fund (each an “Acquired Fund”) with and into PIMCO Dynamic Income Fund (the “Acquiring Fund”).
At a Joint Special Meeting of Shareholders of the Acquiring Fund and Acquired Funds, held on August 6, 2021, shareholders of the Acquiring Fund and PIMCO Income Opportunity Fund approved the proposals necessary for the Acquired Funds to reorganize with and into the Acquiring Fund. No action was needed from shareholders of PIMCO Dynamic Credit and Mortgage Income Fund. Pursuant to the Reorganization, shareholders of the Acquired Funds became shareholders of the Acquiring Fund. The Reorganization was completed upon the close of business on December 10, 2021. The transaction was structured to qualify as a tax-free reorganization under Section 368(a) of the Internal Revenue Code (the “Code”). In the Reorganization, the Acquiring Fund acquired all of the assets and assumed all of the liabilities of each of the Acquired Funds in exchange for newly-issued common shares of the Acquiring Fund (“Merger Shares”). Shareholders of the Acquired Funds received Merger Shares (and cash in lieu of fractional Merger Shares, if any), equal to the aggregate net asset value of their holdings of each Acquired Fund, as applicable. The exchange was based on the net asset value per common share (“NAV”) of the Acquiring Fund and each of the Acquired Funds as of the close of business on December 10, 2021.
Effective as of December 13, 2021, the annual management fee rate paid by the Acquiring Fund to PIMCO was reduced from 1.15% to 1.10% of the Acquiring Fund’s average daily total managed assets (the “Fee Reduction”). The Fee Reduction went into effect upon the consummation of the Reorganization. Please see Note 16 — Reorganization in the Notes to Financial Statements for additional information about the Reorganization.
We believe that bond funds have an important role to play in a well-diversified investment portfolio. It is important to note, however, that in an environment where interest rates may trend upward, rising rates would negatively impact the performance of most bond funds, and fixed-income securities and other instruments held by a Fund are likely to decrease in value. A wide variety of factors can cause interest rates or yields of U.S. Treasury securities (or yields of other types of bonds) to rise (e.g., central bank monetary policies, inflation rates, general economic conditions). In addition, changes in interest rates can be sudden and unpredictable, and there is no guarantee that Fund management will anticipate such movement accurately. A Fund may lose money as a result of movements in interest rates.
As of the date of this report, interest rates in the United States and many parts of the world, including certain European countries, are ascending from historically low levels. Thus, bond funds currently face a heightened level of risk associated with rising interest rates and/or bond yields. This could be driven by a variety of factors, including but not limited to central bank monetary policies, changing inflation or real growth rates, general economic conditions, increasing bond issuances or reduced market demand for low yielding investments. Further, while bond markets have steadily grown over the past three decades, dealer inventories of corporate bonds are near historic lows in relation to market size. As a result, there has been a significant reduction in the ability of dealers to “make markets”.
Bond funds and individual bonds with a longer duration (a measure used to determine the sensitivity of a security’s price to changes in interest rates) tend to be more sensitive to changes in interest rates, usually making them more volatile than securities or funds with shorter durations. All of the factors mentioned above, individually or collectively, could lead to increased volatility and/or lower liquidity in the fixed income markets or negatively impact a Fund’s performance or cause a Fund to incur losses.
A Fund may enter into opposite sides of multiple interest rate swaps or other derivatives with respect to the same underlying reference instrument (e.g., a
10-year
U.S. treasury) that have different effective dates with respect to interest accrual time periods also for the principal purpose of generating distributable gains (characterized as ordinary income for tax purposes) that are not part of a Fund’s duration or yield curve management strategies. In such a “paired swap transaction”, a Fund would generally enter into one or more interest rate swap agreements whereby a Fund agrees to make regular payments starting at the time a Fund enters into the agreements equal to a floating interest rate in return for payments equal to a fixed interest rate (the “initial leg”). A Fund would also enter into one or more interest rate swap agreements on the same underlying instrument, but take the opposite position (i.e., in this example, a Fund would make regular payments equal to a fixed interest rate in return for receiving payments equal to a floating interest rate) with respect to a contract whereby the payment obligations do not commence until a date following the commencement of the initial leg (the “forward leg”).
A Fund may engage in investment strategies, including those that employ the use of paired swaps transactions, the use of interest rate swaps to seek to capitalize on differences between short-term and long-term interest rates and other derivatives transactions, to, among other things, seek to generate current, distributable income, even if such strategies could potentially result in declines in the Fund’s net asset value (“NAV”). A Fund’s income and gain-generating strategies, including certain derivatives strategies, may generate current income and gains taxable as ordinary income sufficient to support monthly distributions even in situations when a Fund has experienced a decline in net assets due to, for example, adverse changes in the broad U.S. or non-U.S. equity markets or a Fund’s debt investments, or arising from
its use of derivatives. For instance, a portion of a Fund’s monthly distributions may be sourced from paired swap transactions utilized to produce current distributable ordinary income for tax purposes on the initial leg, with a substantial possibility that a Fund will later realize a corresponding capital loss and potential decline in its NAV with respect to the forward leg (to the extent there are not corresponding offsetting capital gains being generated from other sources). Because some or all of these transactions may generate capital losses without corresponding offsetting capital gains, portions of a Fund’s distributions recognized as ordinary income for tax purposes (such as from paired swap transactions) may be economically similar to a taxable return of capital when considered together with such capital losses.
Classifications of the Funds’ portfolio holdings in this report are made according to financial reporting standards. The classification of a particular portfolio holding as shown in the Allocation Breakdown and Schedule of Investments or Consolidated Schedule of Investments, as applicable, sections of this report may differ from the classification used for the Funds’ compliance calculations, including those used in the Funds’ prospectus, investment objectives, regulatory, and other investment limitations and policies, which may be based on different asset class, sector or geographical classifications. Each Fund is separately monitored for compliance with respect to prospectus and regulatory requirements.
The geographical classification of foreign
(non-U.S.)
securities in this report, if any, are classified by the country of incorporation of a holding. In certain instances, a security’s country of incorporation may be different from its country of economic exposure.
Beginning in January 2020, global financial markets have experienced and may continue to experience significant volatility resulting from the spread of a novel coronavirus known as COVID-19. The outbreak of COVID-19 has resulted in travel and border restrictions, quarantines, supply chain disruptions, lower consumer demand and general market uncertainty. The effects of COVID-19 have and may continue to adversely affect the global economy, the economies of certain nations and individual issuers, all of which may negatively impact the Funds’ performance. In addition, COVID-19 and governmental responses to COVID-19 may negatively impact the capabilities of the Funds’ service providers and disrupt the Funds’ operations.
The United States’ enforcement of restrictions on U.S. investments in certain issuers and tariffs on goods from other countries, each with a focus on China, has contributed to international trade tensions and may impact portfolio securities.
The United Kingdom’s withdrawal from the European Union may impact Fund returns. The withdrawal may cause substantial volatility in foreign exchange markets, lead to weakness in the exchange rate of the British pound, result in a sustained period of market uncertainty, and destabilize some or all of the other European Union member countries and/or the Eurozone.
The Funds may invest in certain instruments that rely in some fashion upon the London Interbank Offered Rate (“LIBOR”). LIBOR is an average interest rate, determined by the ICE Benchmark Administration, that banks charge one another for the use of short-term money. The United Kingdom’s Financial Conduct Authority, which regulates LIBOR, has announced plans to ultimately phase out the use of LIBOR. The transition may result in a reduction in the value of certain instruments held by a Fund or a reduction in the effectiveness of related Fund transactions such as hedges. There remains uncertainty regarding future utilization of LIBOR and the nature of any replacement rate (e.g., the Secured Overnight Financing Rate, which is intended to replace U.S. dollar LIBOR and measures the cost of overnight borrowings through repurchase agreement transactions collateralized with U.S. Treasury securities). Any potential effects of the transition away from LIBOR on a Fund or on certain instruments in which a Fund invests can be difficult to ascertain, and they may vary depending on a variety of factors. The transition may also result in a reduction in the value of certain instruments held by a Fund or a reduction in the effectiveness of related Fund transactions such as hedges. Any such effects of the transition away from LIBOR, as well as other unforeseen effects, could result in losses to a Fund.
The common shares of the Funds trade on the New York Stock Exchange. As with any stock, the price of a Fund’s common shares will fluctuate with market conditions and other factors. If you sell your common shares of a Fund, the price received may be more or less than your original investment. Shares of closed-end management investment companies, such as the Funds, frequently trade at a discount from their NAV and may trade at a price that is less than the initial offering price and/or the NAV of such shares. Further, if a Fund’s shares trade at a price that is more than the initial offering price and/or the NAV of such shares, including at a substantial premium and/or for an extended period of time, there is no assurance that any such premium will be sustained for any period of time and will not decrease, or that the shares will not trade at a discount to NAV thereafter.
On each Fund Summary page in this Shareholder Report, the Average Annual Total Return table measures performance assuming that all dividend and capital gain distributions were reinvested. Total return is calculated by determining the percentage change in NAV or market price (as applicable) in the specified period. Returns do not reflect the deduction of taxes that a shareholder would pay on Fund distributions. Total return for a period of more than one year represents the average annual total return. Performance at market price will differ from results at NAV. Although market price returns tend to reflect investment results over time, during shorter periods returns at market price can also be influenced by factors such as changing views about a Fund, market conditions, supply and demand for the Fund’s shares, or changes in the Fund’s dividends. Performance shown is net of fees and expenses. Historical NAV performance for a Fund may have been positively impacted by fee waivers or expense limitations in place during some or all of the periods shown, if applicable. Future performance (including total return or yield) and distributions may be negatively impacted by the expiration or reduction of any such fee waivers or expense limitations.
| | | | |
Important Information About the Funds | | | | |
The dividend rate that a Fund pays on its common shares may vary as portfolio and market conditions change, and will depend on a number of factors, including without limit the amount of a Fund’s undistributed net investment income and net short- and long-term capital gains, as well as the costs of any leverage obtained by a Fund. As portfolio and market conditions change, the rate of distributions on the common shares and a Fund’s dividend policy could change. There can be no assurance that a change in market conditions or other factors will not result in a change in a Fund distribution rate or that the rate will be sustainable in the future.
The following table discloses the Inception Date and diversification status of each Fund:
| | | | | | | | | | | | |
| | | |
| | | | | | | | | |
| PCM Fund, Inc. | | | | | | | 09/02/93 | | | | Diversified | |
PIMCO Global StocksPLUS & Income Fund | | | | | | | 05/31/05 | | | | Diversified | |
| PIMCO Strategic Income Fund, Inc. | | | | | | | 02/24/94 | | | | Diversified | |
| PIMCO Access Income Fund | | | | | | | 01/31/22 | | | | Non-Diversified | |
| PIMCO Dynamic Income Fund | | | | | | | 05/30/12 | | | | Diversified | |
| PIMCO Dynamic Income Opportunities Fund | | | | | | | 01/29/21 | | | | Non-Diversified | |
An investment in a Fund is not a bank deposit and is not guaranteed or insured by the Federal Deposit Insurance Corporation or any other government agency. It is possible to lose money on investments in the Funds.
The Trustees/Directors
1
are responsible generally for overseeing the management of the Funds. The Trustees authorize the Funds to enter into service agreements with the Manager and other service providers in order to provide, and in some cases authorize service providers to procure through other parties, necessary or desirable services on behalf of the Funds. Shareholders are not parties to or third-party beneficiaries of such service agreements. Neither a Fund’s prospectus or Statement of Additional Information (“SAI”), any press release or shareholder report, any contracts filed as exhibits to a Fund’s registration statement, nor any other communications, disclosure documents or regulatory filings (including this report) from or on behalf of a Fund creates a contract between or among any shareholders of a Fund, on the one hand, and the Fund, a service provider to the Fund, and/or the Trustees or officers of the Fund, on the other hand.
The Trustees (or the Funds and their officers, service providers or other delegates acting under authority of the Trustees) may amend its most recent prospectus or use a new prospectus or SAI with respect to a Fund, adopt and disclose new or amended policies and other changes in press releases and shareholder reports and/or amend, file and/or issue any other communications, disclosure documents or regulatory filings, and may amend or enter into any contracts to which a Fund is a party, and interpret the investment objective(s), policies, restrictions and contractual provisions applicable to any Fund, without shareholder input or approval, except in circumstances in which shareholder approval is specifically required by law (such as changes to
fundamental investment policies) or where a shareholder approval requirement was specifically disclosed in a Fund’s then-current prospectus, SAI or shareholder report and is otherwise still in effect.
PIMCO has adopted written proxy voting policies and procedures (“Proxy Policy”) as required by Rule
206(4)-6
under the Investment Advisers Act of 1940, as amended. The Proxy Policy has been adopted by the Funds as the policies and procedures that PIMCO will use when voting proxies on behalf of the Funds. A description of the policies and procedures that PIMCO uses to vote proxies relating to portfolio securities of each Fund, and information about how each Fund voted proxies relating to portfolio securities held during the most recent twelve-month period ended June 30th, are available without charge, upon request, by calling the Funds at (844)
33-PIMCO,
on the Funds’ website at www.pimco.com, and on the Securities and Exchange Commission’s (“SEC”) website at www.sec.gov.
The Funds file portfolio holdings information with the SEC on
Form N-PORT
within 60 days of the end of each fiscal quarter. The Funds’ complete schedules of securities holdings as of the end of each fiscal quarter will be made available to the public on the SEC’s website at www.sec.gov and on PIMCO’s website at www.pimco.com, and will be made available, upon request, by calling PIMCO at (844) 33-PIMCO.
SEC rules allow shareholder reports to be delivered to investors by providing access to such reports online free of charge and by mailing a notice that the report is electronically available. Investors may elect to receive all reports in paper free of charge by contacting their financial intermediary or, if invested directly with a Fund, investors can inform the Fund by calling (844) 33-PIMCO. Any election to receive reports in paper will apply to all funds held with the fund complex if invested directly with a Fund or to all funds held in the investor’s account if invested through a financial intermediary, such as a broker-dealer or bank.
In April 2020, the SEC adopted amended rules modifying the registration, communications, and offering processes for registered closed-end funds and interval funds. Among other things, the amendments: (1) permit qualifying closed-end funds to use a short-form registration statement to offer securities in eligible transactions and certain funds to qualify as Well Known Seasoned Issuers; (2) permit interval funds to pay registration fees based on net issuance of shares in a manner similar to mutual funds; (3) require closed-end funds and interval funds to include additional disclosures in their annual reports; and (4) require certain information to be filed in interactive data format. The new rules have phased compliance dates, with some requirements having already taken effect and others requiring compliance as late as February 1, 2023.
In October 2020, the SEC adopted a rule related to the use of derivatives, short sales, reverse repurchase agreements and certain
| Hereinafter, the terms “Trustee” or “Trustees” used herein shall refer to a Director or Directors of applicable Funds. |
other transactions by registered investment companies that rescinds and withdraws the guidance of the SEC and its staff regarding asset segregation and cover transactions that was applicable to the Funds as of the date of this report. Subject to certain exceptions, the rule requires funds that trade derivatives and other transactions that create future payment or delivery obligations to comply with a value-at-risk leverage limit and certain derivatives risk management program and reporting requirements. These requirements may limit the ability of the Funds to use derivatives and reverse repurchase agreements and similar financing transactions as part of their investment strategies and may increase the cost of the Funds’ investments and cost of doing business, which could adversely affect investors. The rule went into effect on February 19, 2021. The compliance date for the new rule and related recordkeeping requirements is August 19, 2022.
In October 2020, the SEC adopted a rule regarding the ability of a fund to invest in other funds. The rule allows a fund to acquire shares of another fund in excess of certain limitations currently imposed by the Investment Company Act of 1940 (the “Act”) without obtaining individual exemptive relief from the SEC, subject to certain conditions. The rule also includes the rescission of certain exemptive relief from the SEC and guidance from the SEC staff for funds to invest in other funds. The effective date for the rule was January 19, 2021, and the compliance date for the rule was January 19, 2022.
In December 2020, the SEC adopted a rule addressing fair valuation of fund investments. The new rule sets forth requirements for good faith determinations of fair value as well as for the performance of fair value determinations, including related oversight and reporting obligations. The new rule also defines “readily available market quotations” for purposes of the definition of “value” under the Act, and the SEC noted that this definition will apply in all contexts under the Act. The effective date for the rule was March 8, 2021. The compliance date for the new rule and the associated recordkeeping requirements is September 8, 2022.
In May 2022, the SEC proposed amendments to a current rule governing fund naming conventions. In general, the current rule requires funds with certain types of names to adopt a policy to invest at least 80% of their assets in the type of investment suggested by the name. The proposed amendments would expand the scope of the current rule in a number of ways that would result in an expansion of the types of fund names that would require the fund to adopt an 80% investment policy under the rule. Additionally, the proposed amendments would modify the circumstances under which a fund may deviate from its 80% investment policy and address the use and valuation of derivatives instruments for purposes of the rule. The proposal’s impact on the Funds will not be known unless and until any final rulemaking is adopted.
In May 2022, the SEC proposed a framework that would require certain registered funds (such as the Funds) to disclose their environmental, social, and governance (“ESG”) investing practices. Among other things, the proposed requirements would mandate that funds meeting
three pre-defined classifications (i.e., integrated, ESG focused and/or impact funds) provide prospectus and shareholder report disclosure related to the ESG factors, criteria and processes used in managing the fund. The proposal’s impact on the Funds will not be known unless and until any final rulemaking is adopted.
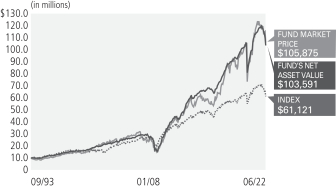
Cumulative Returns Through June 30, 2022
$10,000 invested at the end of the month when the Fund commenced operations.
Allocation Breakdown as of June 30, 2022
| | | | |
| Asset-Backed Securities | | | 31.0% | |
| | |
Non-Agency Mortgage-Backed Securities | | | 21.9% | |
| | |
| Corporate Bonds & Notes | | | 16.4% | |
| | |
| Loan Participations and Assignments | | | 14.0% | |
| | |
| Short-Term Instruments | | | 6.2% | |
| | |
| Preferred Securities | | | 2.8% | |
| | |
| U.S. Government Agencies | | | 2.4% | |
| | |
| Common Stocks | | | 2.0% | |
| | |
| Real Estate Investment Trusts | | | 1.7% | |
| | |
| Other | | | 1.6% | |
| | % of Investments, at value. |
| | Allocation Breakdown and % of investments exclude securities sold short and financial derivative instruments, if any. |
| | | | | | | | | | | | | | | | | | |
|
Average Annual Total Return (1) for the period ended June 30, 2022 | |
| | | | | | |
| | | | | 1 Year | | | 5 Year | | | 10 Year | | | Commencement
of Operations
(09/02/93) | |
 | | Market Price | | | (14.44)% | | | | 5.53% | | | | 8.47% | | | | 8.53% | |
| | NAV | | | (10.20)% | | | | 4.61% | | | | 7.79% | | | | 8.45% | |
 | | ICE BofAML US High Yield Index | | | (12.66)% | | | | 1.95% | | | | 4.40% | | | | | |
All Fund returns are net of fees and expenses and include applicable fee waivers and/or expense limitations. Absent any applicable fee waivers and/or expense limitations, performance would have been lower and there can be no assurance that any such waivers or limitations will continue in the future.
| Average Annual Return since 08/31/1993 |
It is not possible to invest directly in an unmanaged index.
| Performance quoted represents past performance. Past performance is not a guarantee or a reliable indicator of future results. Current performance may be lower or higher than performance shown. Investment return and the principal value of an investment will fluctuate. Returns shown do not reflect the deduction of taxes that a shareholder would pay on Fund distributions or the sale of Fund shares. Total return, market price, NAV, market price distribution rate, and NAV distribution rate will fluctuate with changes in market conditions. The NAV presented may differ from the NAV reported for the same period in other Fund materials. Performance current to the most recent month-end is available at www.pimco.com or via (844) 33-PIMCO. Performance is calculated assuming all dividends and distributions are reinvested at prices obtained under the Fund’s dividend reinvestment plan. Performance does not reflect any brokerage commissions in connection with the purchase or sale of Fund shares. |
| | Performance of an index is shown in light of a requirement by the Securities and Exchange Commission that the performance of an appropriate broad-based securities market index be disclosed. However, the Fund is not managed to an index nor should the index be viewed as a “benchmark” for the Fund’s performance. The index is not intended to be indicative of the Fund’s investment strategies, portfolio components or past or future performance. Please see Additional Information Regarding the Funds for a description of the Fund’s principal investment strategies. |
| Distribution rates are not performance and are calculated by annualizing the most recent distribution per share and dividing by the NAV or Market Price, as applicable, as of the reported date. Distributions may be comprised of ordinary income, net capital gains, and/or a return of capital (ROC) of your investment in the Fund. Because the distribution rate may include a ROC, it should not be confused with yield or income. If the Fund estimates that a portion of its distribution may be comprised of amounts from sources other than net investment income in accordance with its policies and good accounting practices, the Fund will notify shareholders of the estimated composition of such distribution through a Section 19 Notice. Please refer to the most recent Section 19 Notice, if applicable, for additional information regarding the estimated composition of distributions. Please visit www.pimco.com for most recent Section 19 Notice, if applicable. Final determination of a distribution’s tax character will be provided to shareholders when such information is available. |
| Represents total effective leverage outstanding, as a percentage of total managed assets. Total effective leverage consists of preferred shares, reverse repurchase agreements and other borrowings, credit default swap notional and floating rate notes issued in tender option bond transactions, as applicable (collectively “Total Effective Leverage”). The Fund may engage in other transactions not included in Total Effective Leverage disclosed above that may give rise to a form of leverage, including certain derivative transactions. For the purpose of calculating Total Effective Leverage outstanding as a percentage of total managed assets, total managed assets refer to total assets (including assets attributable to Total Effective Leverage that may be outstanding) minus accrued liabilities (other than liabilities representing Total Effective Leverage). |
Fund Information (as of June 30, 2022)
(1)
| | | | |
| Market Price | | | $9.25 | |
| | |
| NAV | | | $7.69 | |
| | |
| Premium/(Discount) to NAV | | | 20.29% | |
| | |
Market Price Distribution Rate (2) | | | 10.38% | |
| | |
| | | 12.48% | |
| | |
Total Effective Leverage (3) | | | 49.27% | |
Investment Objective and Strategy Overview
The Fund’s primary investment objective is to achieve high current income. Capital gain from the disposition of investments is a secondary objective of the Fund.
Fund Insights at NAV
The following affected performance (on a gross basis) during the reporting period:
| » | | Exposure to select corporate special situation positions contributed to absolute performance, as select issuers posted positive returns. |
| » | | Security selection in asset backed securities, most notably student loans, contributed to absolute performance, as select securities posted positive returns. |
| » | | There were no other material contributors for this Fund. |
| » | | Exposure to corporate credit detracted from absolute performance, as the asset class posted negative returns. |
| » | | Long interest rate positioning, especially in the short and intermediate portion of the curve, detracted from absolute performance, as rates increased. |
| » | | Exposure to U.S. residential mortgage credit detracted from absolute performance, as the asset class posted negative returns. |
PIMCO Global StocksPLUS
®
& Income Fund
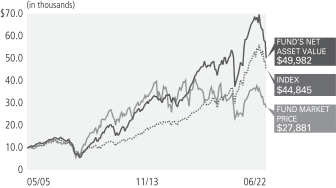
Cumulative Returns Through June 30, 2022
$10,000 invested at the end of the month when the Fund commenced operations.
Allocation Breakdown as of June 30, 2022
| | | | |
| Corporate Bonds & Notes | | | 26.8% | |
| | |
| U.S. Government Agencies | | | 22.2% | |
| | |
| Loan Participations and Assignments | | | 12.6% | |
| | |
| Short-Term Instruments | | | 12.4% | |
| | |
Non-Agency Mortgage-Backed Securities | | | 9.1% | |
| | |
| Asset-Backed Securities | | | 6.3% | |
| | |
| Preferred Securities | | | 5.2% | |
| | |
| Sovereign Issues | | | 1.6% | |
| | |
| Common Stocks | | | 1.1% | |
| | |
| Other | | | 2.7% | |
| | % of Investments, at value. |
| | Allocation Breakdown and % of investments exclude securities sold short and financial derivative instruments, if any. |
All Fund returns are net of fees and expenses and include applicable fee waivers and/or expense limitations. Absent any applicable fee waivers and/or expense limitations, performance would have been lower and there can be no assurance that any such waivers or limitations will continue in the future.
It is not possible to invest directly in an unmanaged index.
| Performance quoted represents past performance. Past performance is not a guarantee or a reliable indicator of future results. Current performance may be lower or higher than performance shown. Investment return and the principal value of an investment will fluctuate. Returns shown do not reflect the deduction of taxes that a shareholder would pay on Fund distributions or the sale of Fund shares. Total return, market price, NAV, market price distribution rate, and NAV distribution rate will fluctuate with changes in market conditions. The NAV presented may differ from the NAV reported for the same period in other Fund materials. Performance current to the most recent month-end is available at www.pimco.com or via (844) 33-PIMCO. Performance is calculated assuming all dividends and distributions are reinvested at prices obtained under the Fund’s dividend reinvestment plan. Performance does not reflect any brokerage commissions in connection with the purchase or sale of Fund shares. |
| | Performance of an index is shown in light of a requirement by the Securities and Exchange Commission that the performance of an appropriate broad-based securities market index be disclosed. However, the Fund is not managed to an index nor should the index be viewed as a “benchmark” for the Fund’s performance. The index is not intended to be indicative of the Fund’s investment strategies, portfolio components or past or future performance. Please see Additional Information Regarding the Funds for a description of the Fund’s principal investment strategies. |
| Distribution rates are not performance and are calculated by annualizing the most recent distribution per share and dividing by the NAV or Market Price, as applicable, as of the reported date. Distributions may be comprised of ordinary income, net capital gains, and/or a return of capital (ROC) of your investment in the Fund. Because the distribution rate may include a ROC, it should not be confused with yield or income. If the Fund estimates that a portion of its distribution may be comprised of amounts from sources other than net investment income in accordance with its policies and good accounting practices, the Fund will notify shareholders of the estimated composition of such distribution through a Section 19 Notice. Please refer to the most recent Section 19 Notice, if applicable, for additional information regarding the estimated composition of distributions. Please visit www.pimco.com for most recent Section 19 Notice, if applicable. Final determination of a distribution’s tax character will be provided to shareholders when such information is available. |
| Represents total effective leverage outstanding, as a percentage of total managed assets. Total effective leverage consists of preferred shares, reverse repurchase agreements and other borrowings, credit default swap notional and floating rate notes issued in tender option bond transactions, as applicable (collectively “Total Effective Leverage”). The Fund may engage in other transactions not included in Total Effective Leverage disclosed above that may give rise to a form of leverage, including certain derivative transactions. For the purpose of calculating Total Effective Leverage outstanding as a percentage of total managed assets, total managed assets refer to total assets (including assets attributable to Total Effective Leverage that may be outstanding) minus accrued liabilities (other than liabilities representing Total Effective Leverage). |
Fund Information (as of June 30, 2022)
(1)
| | | | |
| Market Price | | | $7.89 | |
| | |
| NAV | | | $7.26 | |
| | |
| Premium/(Discount) to NAV | | | 8.68% | |
| | |
Market Price Distribution Rate (2) | | | 10.49% | |
| | |
| | | 11.40% | |
| | |
Total Effective Leverage (3) | | | 41.86% | |
Investment Objective and Strategy Overview
PIMCO Global StocksPLUS
®
& Income Fund’s investment objective is to seek total return comprised of current income, current gains and long-term capital appreciation.
Fund Insights at NAV
The following affected performance (on a gross basis) during the reporting period:
| » | | Exposure to select corporate special situation positions contributed to absolute performance, as select issuers posted positive returns. |
| » | | Security selection in asset backed securities contributed to absolute performance, as select securities posted positive returns. |
| » | | Security selection in U.S. commercial mortgage credit contributed to absolute performance, as select securities posted positive returns. |
| » | | Exposure to equity index derivatives linked to the MSCI EAFE Index detracted from absolute performance, as the index posted negative performance. |
| » | | Exposure to corporate credit detracted from absolute performance, as the asset class posted negative returns. |
| » | | Exposure to U.S. agency mortgage-backed securities detracted from absolute performance, as the asset class posted negative returns. |
PIMCO Strategic Income Fund, Inc.
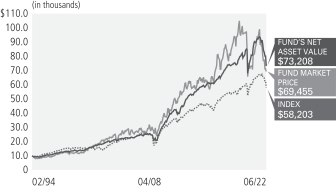
Cumulative Returns Through June 30, 2022
$10,000 invested at the end of the month when the Fund commenced operations.
Allocation Breakdown as of June 30, 2022
| | | | |
| U.S. Government Agencies | | | 30.8% | |
| | |
| Corporate Bonds & Notes | | | 29.5% | |
| | |
Non-Agency Mortgage-Backed Securities | | | 13.2% | |
| | |
| Loan Participations and Assignments | | | 8.4% | |
| | |
| Asset-Backed Securities | | | 5.0% | |
| | |
| Preferred Securities | | | 3.3% | |
| | |
| Short-Term Instruments | | | 3.0% | |
| | |
| Common Stocks | | | 2.6% | |
| | |
| Sovereign Issues | | | 2.4% | |
| | |
| Municipal Bonds & Notes | | | 1.1% | |
| | |
| Other | | | 0.7% | |
| | % of Investments, at value. |
| | Allocation Breakdown and % of investments exclude securities sold short and financial derivative instruments, if any. |
All Fund returns are net of fees and expenses and include applicable fee waivers and/or expense limitations. Absent any applicable fee waivers and/or expense limitations, performance would have been lower and there can be no assurance that any such waivers or limitations will continue in the future.
| Average Annual Return since 2/28/1994 |
It is not possible to invest directly in an unmanaged index.
| Performance quoted represents past performance. Past performance is not a guarantee or a reliable indicator of future results. Current performance may be lower or higher than performance shown. Investment return and the principal value of an investment will fluctuate. Returns shown do not reflect the deduction of taxes that a shareholder would pay on Fund distributions or the sale of Fund shares. Total return, market price, NAV, market price distribution rate, and NAV distribution rate will fluctuate with changes in market conditions. Performance current to the most recent month-end is available at www.pimco.com or via (844) 33-PIMCO. Performance is calculated assuming all dividends and distributions are reinvested at prices obtained under the Fund’s dividend reinvestment plan. Performance does not reflect any brokerage commissions in connection with the purchase or sale of Fund shares. |
| The performance information shown for the Fund includes historical performance information for the periods prior to February 8, 2002, during which the Fund had a different investment manager. As of February 8, 2002, PIMCO became the Fund’s investment manager. The Fund’s performance prior to that time may have been different if the Fund were advised by PIMCO |
| Performance of an index is shown in light of a requirement by the Securities and Exchange Commission that the performance of an appropriate broad-based securities market index be disclosed. However, the Fund is not managed to an index nor should the index be viewed as a “benchmark” for the Fund’s performance. The index is not intended to be indicative of the Fund’s investment strategies, portfolio components or past or future performance. Please see Additional Information Regarding the Funds for a description of the Fund’s principal investment strategies. |
| Distribution rates are not performance and are calculated by annualizing the most recent distribution per share and dividing by the NAV or Market Price, as applicable, as of the reported date. Distributions may be comprised of ordinary income, net capital gains, and/or a return of capital (ROC) of your investment in the Fund. Because the distribution rate may include a ROC, it should not be confused with yield or income. If the Fund estimates that a portion of its distribution may be comprised of amounts from sources other than net investment income in accordance with its policies and good accounting practices, the Fund will notify shareholders of the estimated composition of such distribution through a Section 19 Notice. Please refer to the most recent Section 19 Notice, if applicable, for additional information regarding the estimated composition of distributions. Please visit www.pimco.com for most recent Section 19 Notice, if applicable. Final determination of a distribution’s tax character will be provided to shareholders when such information is available. |
| Represents total effective leverage outstanding, as a percentage of total managed assets. Total effective leverage consists of preferred shares, reverse repurchase agreements and other borrowings, credit default swap notional and floating rate notes issued in tender option bond transactions, as applicable (collectively “Total Effective Leverage”). The Fund may engage in other transactions not included in Total Effective Leverage disclosed above that may give rise to a form of leverage, including certain derivative transactions. For the purpose of calculating Total Effective Leverage outstanding as a percentage of total managed assets, total managed assets refer to total assets (including assets attributable to Total Effective Leverage that may be outstanding) minus accrued liabilities (other than liabilities representing Total Effective Leverage). |
Fund Information (as of June 30, 2022)
(1)
| | | | |
| | | | |
| |
| | | | |
| |
Premium/(Discount) to NAV | | | | |
| |
Market Price Distribution Rate (2) | | | | |
| |
| | | | |
| |
Total Effective Leverage (3) | | | | |
Investment Objective and Strategy Overview
The Fund’s primary investment objective is to generate a level of income that is higher than that generated by high quality, intermediate-term U.S. debt securities. The Fund also seeks capital appreciation to the extent consistent with this objective.
The following affected performance (on a gross basis) during the reporting period:
| » | | Short interest rate positioning, especially in the intermediate and long end of the curve, contributed to absolute performance, as rates increased. |
| » | | Exposure to select corporate special situation positions contributed to absolute performance, as select issuers posted positive returns. |
| » | | Security selection in U.S. commercial mortgage credit contributed to absolute performance, as select securities posted positive returns. |
| » | | Exposure to corporate credit detracted from absolute performance, as the asset class posted negative returns. |
| » | | Exposure to U.S. agency mortgage-backed securities detracted from absolute performance, as the asset class posted negative returns. |
| » | | Exposure to emerging market debt detracted from absolute performance, as the asset class posted negative returns. |
Allocation Breakdown as of June 30, 2022
| | | | |
Non-Agency Mortgage-Backed Securities | | | 29.1% | |
| |
| | | 21.4% | |
| |
Loan Participations and Assignments | | | 20.6% | |
| |
| | | 18.9% | |
| |
| | | 4.6% | |
| |
| | | 1.6% | |
| |
| | | 1.4% | |
| |
| | | 2.4% | |
| | | % of Investments, at value. |
| | | Allocation Breakdown and % of investments exclude securities sold short and financial derivative instruments, if any. |
Fund Information (as of June 30, 2022)
(1)
| | | | |
| | | | |
| |
| | | | |
| |
Premium/(Discount) to NAV | | | | |
| |
Market Price Distribution Rate (2) | | | | |
| |
| | | | |
| |
Total Effective Leverage (3) | | | | |
A line graph is not included since the Fund has less than six months of performance.
| | | | |
| |
Average Annual Total Return (1) for the period ended June 30, 2022 | | | |
| |
| | | Commencement
of Operations
(01/31/22) | |
| | | | |
| | | | |
All Fund returns are net of fees and expenses and include applicable fee waivers and/or expense limitations. Absent any applicable fee waivers and/or expense limitations, performance would have been lower and there can be no assurance that any such waivers or limitations will continue in the future.
| Performance quoted represents past performance. Past performance is not a guarantee or a reliable indicator of future results. Current performance may be lower or higher than performance shown. Investment return and the principal value of an investment will fluctuate. Returns shown do not reflect the deduction of taxes that a shareholder would pay on Fund distributions or the sale of Fund shares. Total return, market price, NAV, market price distribution rate, and NAV distribution rate will fluctuate with changes in market conditions. Performance current to the most recent month-end is available at www.pimco.com or via (844) 33-PIMCO. Performance is calculated assuming all dividends and distributions are reinvested at prices obtained under the Fund’s dividend reinvestment plan. Performance does not reflect any brokerage commissions in connection with the purchase or sale of Fund shares. |
| Distribution rates are not performance and are calculated by annualizing the most recent distribution per share and dividing by the NAV or Market Price, as applicable, as of the reported date. Distributions may be comprised of ordinary income, net capital gains, and/or a return of capital (ROC) of your investment in the Fund. Because the distribution rate may include a ROC, it should not be confused with yield or income. If the Fund estimates that a portion of its distribution may be comprised of amounts from sources other than net investment income in accordance with its policies and good accounting practices, the Fund will notify shareholders of the estimated composition of such distribution through a Section 19 Notice. Please refer to the most recent Section 19 Notice, if applicable, for additional information regarding the estimated composition of distributions. Please visit www.pimco.com for most recent Section 19 Notice, if applicable. Final determination of a distribution’s tax character will be provided to shareholders when such information is available. |
| Represents total effective leverage outstanding, as a percentage of total managed assets. Total effective leverage consists of preferred shares, reverse repurchase agreements and other borrowings, credit default swap notional and floating rate notes issued in tender option bond transactions, as applicable (collectively “Total Effective Leverage”). The Fund may engage in other transactions not included in Total Effective Leverage disclosed above that may give rise to a form of leverage, including certain derivative transactions. For the purpose of calculating Total Effective Leverage outstanding as a percentage of total managed assets, total managed assets refer to total assets (including assets attributable to Total Effective Leverage that may be outstanding) minus accrued liabilities (other than liabilities representing Total Effective Leverage). |
Investment Objective and Strategy Overview
PIMCO Access Income Fund’s investment objective is to seek current income as a primary objective and capital appreciation as a secondary objective.
The following affected performance (on a gross basis) during the reporting period:
| » | | Security selection in asset-backed securities contributed to absolute performance, as select securities posted positive returns. |
| » | | Short interest rate positioning, especially in the long end of the curve, contributed to absolute performance, as rates increased. |
| » | | There were no other material contributors for this fund. |
| » | | Exposure to corporate credit detracted from absolute performance, as the asset class posted negative returns. |
| » | | Exposure to emerging market debt detracted from absolute performance, as the asset class posted negative returns. |
| » | | Exposure to U.S. mortgage credit detracted from absolute performance, as the asset class posted negative returns. |
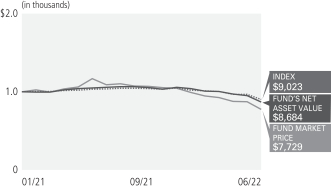
PIMCO Dynamic Income Fund
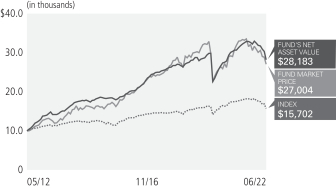
Cumulative Returns Through June 30, 2022
$10,000 invested at the end of the month when the Fund commenced operations.
Allocation Breakdown as of June 30, 2022
| | | | |
| | | | |
| |
Non-Agency Mortgage-Backed Securities | | | | |
| |
| | | | |
| |
Loan Participations and Assignments | | | | |
| |
| | | | |
| |
| | | | |
| |
| | | | |
| |
| | | | |
| |
| | | | |
| |
| | | | |
| | % of Investments, at value. |
| | Allocation Breakdown and % of investments exclude securities sold short and financial derivative instruments, if any. |
Average Annual Total Return (1) for the period ended June 30, 2022 | |
| | | | | |
| | | | | | | | | | | | | | Commencement
of Operations
(05/30/12) | |
| | | | | | | | | | | | | | | | | | |
|
| | Market Price | | | (19.10)% | | | | 3.05% | | | | 10.47% | | | | 10.60% | |
 | | NAV | | | (12.55)% | | | | 3.72% | | | | 10.54% | | | | 10.85% | |
| | ICE BofAML US High Yield Index | | | (12.66)% | | | | 1.95% | | | | 4.40% | | | | 4.57% | |
All Fund returns are net of fees and expenses and include applicable fee waivers and/or expense limitations. Absent any applicable fee waivers and/or expense limitations, performance would have been lower and there can be no assurance that any such waivers or limitations will continue in the future.
It is not possible to invest directly in an unmanaged index.
| Performance quoted represents past performance. Past performance is not a guarantee or a reliable indicator of future results. Current performance may be lower or higher than performance shown. Investment return and the principal value of an investment will fluctuate. Returns shown do not reflect the deduction of taxes that a shareholder would pay on Fund distributions or the sale of Fund shares. Total return, market price, NAV, market price distribution rate, and NAV distribution rate will fluctuate with changes in market conditions. The NAV presented may differ from the NAV reported for the same period in other Fund materials. Performance current to the most recent month-end is available at www.pimco.com or via (844) 33-PIMCO. Performance is calculated assuming all dividends and distributions are reinvested at prices obtained under the Fund’s dividend reinvestment plan. Performance does not reflect any brokerage commissions in connection with the purchase or sale of Fund shares. |
| | Performance of an index is shown in light of a requirement by the Securities and Exchange Commission that the performance of an appropriate broad-based securities market index be disclosed. However, the Fund is not managed to an index nor should the index be viewed as a “benchmark” for the Fund’s performance. The index is not intended to be indicative of the Fund’s investment strategies, portfolio components or past or future performance. Please see Additional Information Regarding the Funds for a description of the Fund’s principal investment strategies. |
| Distribution rates are not performance and are calculated by annualizing the most recent distribution per share and dividing by the NAV or Market Price, as applicable, as of the reported date. Distributions may be comprised of ordinary income, net capital gains, and/or a return of capital (ROC) of your investment in the Fund. Because the distribution rate may include a ROC, it should not be confused with yield or income. If the Fund estimates that a portion of its distribution may be comprised of amounts from sources other than net investment income in accordance with its policies and good accounting practices, the Fund will notify shareholders of the estimated composition of such distribution through a Section 19 Notice. Please refer to the most recent Section 19 Notice, if applicable, for additional information regarding the estimated composition of distributions. Please visit www.pimco.com for most recent Section 19 Notice, if applicable. Final determination of a distribution’s tax character will be provided to shareholders when such information is available. |
| Represents total effective leverage outstanding, as a percentage of total managed assets. Total effective leverage consists of preferred shares, reverse repurchase agreements and other borrowings, credit default swap notional and floating rate notes issued in tender option bond transactions, as applicable (collectively “Total Effective Leverage”). The Fund may engage in other transactions not included in Total Effective Leverage disclosed above that may give rise to a form of leverage, including certain derivative transactions. For the purpose of calculating Total Effective Leverage outstanding as a percentage of total managed assets, total managed assets refer to total assets (including assets attributable to Total Effective Leverage that may be outstanding) minus accrued liabilities (other than liabilities representing Total Effective Leverage). |
Fund Information (as of June 30, 2022)
(1)
| | | | |
| Market Price | | | $20.87 | |
| | |
| NAV | | | $19.73 | |
| | |
| Premium/(Discount) to NAV | | | 5.78% | |
| | |
Market Price Distribution Rate (2) | | | 12.68% | |
| | |
| | | 13.41% | |
| | |
Total Effective Leverage (3) | | | 48.60% | |
Investment Objective and Strategy Overview
PIMCO Dynamic Income Fund’s primary investment objective is to seek current income, and capital appreciation is a secondary objective.
Fund Insights at NAV
The following affected performance (on a gross basis) during the reporting period:
| » | | Exposure to select corporate special situation positions contributed to absolute performance, as select issuers posted positive returns. |
| » | | Security selection in asset backed securities, most notably student loans, contributed to absolute performance, as select securities posted positive returns. |
| » | | Security selection in U.S. commercial mortgage credit contributed to absolute performance, as select securities posted positive returns. |
| » | | Exposure to corporate credit detracted from absolute performance, as the asset class posted negative returns. |
| » | | Exposure to emerging market debt detracted from absolute performance, as the asset class posted negative returns. |
| » | | Exposure to U.S. residential mortgage credit detracted from absolute performance, as the asset class posted negative returns. |
| | |
Market and Net Asset Value Information | | |
The following table, presented in conformance with annual reporting requirements for funds that have filed a registration statement pursuant to General Instruction A.2 of Form N-2 (“Short Form N-2”), sets forth, for each of the periods indicated, the high and low closing market prices of the Fund’s Common Shares on the NYSE, the high and low NAV per Common Share and the high and low premium/discount to NAV per Common Share. See Note 3, Investment Valuation and Fair Value Measurements in the Notes to Financial Statements for information as to how the Fund’s NAV is determined.
| | | | | | | | | | | | | | | | | | | | | | | | |
| | | Common share market price (1) | | | Common share
net asset value | | | Premium (discount) as
a % of net asset value | |
| | | | | | | | | | | | | | | | | | |
| Quarter ended June 30, 2022 | | $ | 24.11 | | | $ | 19.73 | | | $ | 22.90 | | | $ | 19.73 | | | | 7.44% | | | | (2.33)% | |
| Quarter ended March 31, 2022 | | $ | 26.52 | | | $ | 22.11 | | | $ | 24.44 | | | $ | 22.28 | | | | 9.03% | | | | (0.99)% | |
| Quarter ended December 31, 2021 | | $ | 27.21 | | | $ | 24.75 | | | $ | 25.09 | | | $ | 24.14 | | | | 9.67% | | | | 2.32% | |
| Quarter ended September 30, 2021 | | $ | 29.09 | | | $ | 25.96 | | | $ | 25.37 | | | $ | 24.97 | | | | 15.73% | | | | 3.59% | |
| Quarter ended June 30, 2021 | | $ | 29.60 | | | $ | 28.00 | | | $ | 25.41 | | | $ | 24.57 | | | | 17.99% | | | | 13.27% | |
| Quarter ended March 31, 2021 | | $ | 28.66 | | | $ | 25.92 | | | $ | 25.21 | | | $ | 24.50 | | | | 16.33% | | | | 4.99% | |
| Quarter ended December 31, 2020 | | $ | 27.13 | | | $ | 24.17 | | | $ | 24.85 | | | $ | 23.35 | | | | 10.19% | | | | 3.15% | |
| Quarter ended September 30, 2020 | | $ | 25.36 | | | $ | 24.01 | | | $ | 23.53 | | | $ | 22.51 | | | | 10.15% | | | | 3.58% | |
| Quarter ended June 30, 2020 | | $ | 27.04 | | | $ | 20.04 | | | $ | 22.75 | | | $ | 20.05 | | | | 19.65% | | | | (0.64)% | |
| Quarter ended March 31, 2020 | | $ | 33.61 | | | $ | 17.74 | | | $ | 27.69 | | | $ | 19.29 | | | | 21.56% | | | | (12.09)% | |
| Quarter ended December 31, 2019 | | $ | 33.83 | | | $ | 32.37 | | | $ | 27.34 | | | $ | 26.76 | | | | 24.45% | | | | 18.61% | |
| Quarter ended September 30, 2019 | | $ | 32.54 | | | $ | 30.72 | | | $ | 28.38 | | | $ | 27.04 | | | | 19.37% | | | | 10.03% | |
| Quarter ended June 30, 2019 | | $ | 33.25 | | | $ | 30.73 | | | $ | 28.29 | | | $ | 27.71 | | | | 18.50% | | | | 10.30% | |
| Quarter ended March 31, 2019 | | $ | 32.50 | | | $ | 29.18 | | | $ | 27.83 | | | $ | 27.26 | | | | 17.37% | | | | 7.04% | |
| Quarter ended December 31, 2018 | | $ | 34.04 | | | $ | 26.95 | | | $ | 29.11 | | | $ | 27.13 | | | | 16.98% | | | | (0.77)% | |
| Quarter ended September 30, 2018 | | $ | 33.65 | | | $ | 31.87 | | | $ | 29.21 | | | $ | 28.81 | | | | 16.41% | | | | 9.97% | |
| Such prices reflect inter-dealer prices, without retail mark-up, mark-down or commission and may not represent actual transactions. |
The following information is presented in conformance with annual reporting requirements for funds that have filed a registration statement pursuant to General Instruction A.2 of Form N-2 (“Short Form N-2”).
Summary of Fund Expenses
The following table is intended to assist investors in understanding the fees and expenses (annualized) that an investor in Common Shares of the Fund would bear, directly or indirectly, as a result of an offering. The table reflects the use of leverage in the form of reverse repurchase agreements in an amount equal to 54.93% of the Fund’s total average managed assets (including assets attributable to reverse repurchase agreements), which reflects approximately the percentage of the Fund’s total average managed assets attributable to such leverage averaged over the fiscal year ended June 30, 2022, and shows Fund expenses as a percentage of net assets attributable to Common Shares. The percentage above does not reflect the Fund’s use of other forms of economic leverage, such as credit default swaps or other derivative instruments. The table and example below are based on the Fund’s capital structure as of June 30, 2022. The extent of the Fund’s assets attributable to leverage following an offering, and the Fund’s associated expenses, are likely to vary (perhaps significantly) from these assumptions.
Shareholder Transaction Expense
| | | | | | | | |
| | |
Sales load (as a percentage of offering price) (1) | | | | | | | | |
| | | |
Offering Expenses Borne by Common Shareholders (as a percentage of offering price) (2) | | | | | | | | |
| | | |
Dividend Reinvestment Plan Fees (3) | | | | | | | None | |
| In the event that the Common Shares to which this relates are sold to or through underwriters or dealer managers, a corresponding supplement will disclose the applicable sale load and/or commission. |
| The related supplement will disclose the estimated amount of offering expense, the offering price and the offering expenses borne by the Fund and indirectly by all of its Common Shareholders as a percentage of the offering price. |
| You will pay broker chargers if you direct your broker or the plan agent to sell your Common Shares that you acquired pursuant to a dividend reinvestment plan. You may also pay a pro rata share of brokerage commissions incurred in connection with open market purchase pursuant to the Fund’s Dividend Reinvestment Plan. |
| | | | | | | | |
| | | | | | Percentage of
Net Assets Attributable to
Common Shares (reflecting
leverage attributable to
reverse repurchase
agreements) | |
| | | |
| | | | | | | 1.99% | |
| | | |
Interest Payments on Borrowed Funds (2) | | | | | | | 0.64% | |
| | | |
| | | | | | | 0.01% | |
| | | |
| | | | | | | | |
| Management fees include fees payable to the Investment Manager for advisory services and for supervisory, administrative and other services. The Fund pays for the advisory, supervisory and administrative services it requires under what is essentially an all-in fee structure (the “unified management fee”). Pursuant to an investment management agreement, PIMCO is paid a Management Fee of 1.10% of the Fund’s |
| | average daily total managed assets. The Fund (and not PIMCO) will be responsible for certain fees and expenses which are, reflected in the table above, that are not covered by the unified management fee under the investment management agreement. Please see Note 9, Fees and Expenses in the Notes to Financial Statements for an explanation of the unified management fee. |
| Reflects the Fund’s use of leverage in the form of reverse repurchase agreements averaged over the fiscal year ended June 30, 2022, which represented 54.93% of the Fund’s total managed assets (including assets attributable to reverse repurchase agreements) as of that date, at an annual interest rate cost to the Fund of 1.64%, which is the weighted average interest rate cost during the fiscal year ended June 30, 2022. See “Effects of Leverage.” The actual amount of interest expense borne by the Fund will vary over time in accordance with the level of the Fund’s use of reverse repurchase agreements, dollar rolls and/or borrowings and variations in market interest rates. Borrowing expense is required to be treated as an expense of the Fund for accounting purposes. Any associated income or gains (or losses) realized from leverage obtained through such instruments is not reflected in the Annual Expenses table above, but would be reflected in the Fund’s performance results. |
| Other expenses are estimated for the Fund’s fiscal year ending June 30, 2023. |
| “Interest Payments on Borrowed Funds” is borne by the Fund separately from the management fees paid to PIMCO. Excluding such expense, Total Annual Expenses are 2.00%. |
Example
The following example illustrates the expenses that you would pay on a $1,000 investment in Common Shares of the Fund, assuming (1) that the Fund’s net assets do not increase or decrease, (2) that the Fund incurs total annual expenses of 2.64% of net assets attributable to Common Shares in years 1 through 10 (assuming assets attributable to reverse repurchase agreements representing 54.93% of the Fund’s total managed assets) and (3) a 5% annual return
(1)
:
| | | | | | | | | | | | | | | | | | | | |
| | | | | | | | | | | | | | | | |
| | | | | | |
| Total Expenses Incurred | | | | | | $ | 27 | | | $ | 83 | | | $ | 141 | | | $ | 299 | |
| The example above should not be considered a representation of future expenses. Actual expenses may be higher or lower than those shown. The example assumes that the estimated Interest Payments on Borrowed Funds, and Other Expenses set forth in the Annual Expenses table are accurate, that the rate listed under Total Annual Expenses remains the same each year and that all dividends and distributions are reinvested at NAV. Actual expenses may be greater or less than those assumed. Moreover, the Fund’s actual rate of return may be greater or less than the hypothetical 5% annual return shown in the example. The example does not include commissions or estimated offering expenses, which would cause the expenses shown in the example to increase |
PIMCO Dynamic Income Opportunities Fund
Cumulative Returns Through June 30, 2022
$10,000 invested at the end of the month when the Fund commenced operations.
Allocation Breakdown as of June 30, 2022
| | | | |
| | | | |
| | |
Non-Agency Mortgage-Backed Securities | | | | |
| | |
Loan Participations and Assignments | | | | |
| | |
| | | | |
| | |
| | | | |
| | |
| | | | |
| | |
Real Estate Investment Trusts | | | | |
| | |
| | | | |
| | |
Convertible Bonds & Notes | | | | |
| | |
| | | | |
| | |
| | | | |
| | |
| | | | |
| | % of Investments, at value. |
| | Allocation Breakdown and % of investments exclude securities sold short and financial derivative instruments, if any. |
| | | | | | | | | | |
| | |
Average Annual Total Return (1) for the period ended June 30, 2022 |
| | | | | | | | | | |
| | |
| | | | |
| | | | | 1 Year | | | Commencement
of Operations
(01/29/21) | |
| | Market Price | | | (33.77)% | | | | (16.63)% | |
| | NAV | | | (17.25)% | | | | (9.48)% | |
| | ICE BofAML US High Yield Index | | | (12.66)% | | | | (6.99)% | |
All Fund returns are net of fees and expenses and include applicable fee waivers and/or expense limitations. Absent any applicable fee waivers and/or expense limitations, performance would have been lower and there can be no assurance that any such waivers or limitations will continue in the future.
It is not possible to invest directly in an unmanaged index.
| Performance quoted represents past performance. Past performance is not a guarantee or a reliable indicator of future results. Current performance may be lower or higher than performance shown. Investment return and the principal value of an investment will fluctuate. Returns shown do not reflect the deduction of taxes that a shareholder would pay on Fund distributions or the sale of Fund shares. Total return, market price, NAV, market price distribution rate, and NAV distribution rate will fluctuate with changes in market conditions. The NAV presented may differ from the NAV reported for the same period in other Fund materials. Performance current to the most recent month-end is available at www.pimco.com or via (844) 33-PIMCO. Performance is calculated assuming all dividends and distributions are reinvested at prices obtained under the Fund’s dividend reinvestment plan. Performance does not reflect any brokerage commissions in connection with the purchase or sale of Fund shares. |
| | Performance of an index is shown in light of a requirement by the Securities and Exchange Commission that the performance of an appropriate broad-based securities market index be disclosed. However, the Fund is not managed to an index nor should the index be viewed as a “benchmark” for the Fund’s performance. The index is not intended to be indicative of the Fund’s investment strategies, portfolio components or past or future performance. Please see Additional Information Regarding the Funds for a description of the Fund’s principal investment strategies. |
| Distribution rates are not performance and are calculated by annualizing the most recent distribution per share and dividing by the NAV or Market Price, as applicable, as of the reported date. Distributions may be comprised of ordinary income, net capital gains, and/or a return of capital (ROC) of your investment in the Fund. Because the distribution rate may include a ROC, it should not be confused with yield or income. If the Fund estimates that a portion of its distribution may be comprised of amounts from sources other than net investment income in accordance with its policies and good accounting practices, the Fund will notify shareholders of the estimated composition of such distribution through a Section 19 Notice. Please refer to the most recent Section 19 Notice, if applicable, for additional information regarding the estimated composition of distributions. Please visit www.pimco.com for most recent Section 19 Notice, if applicable. Final determination of a distribution’s tax character will be provided to shareholders when such information is available. |
| Represents total effective leverage outstanding, as a percentage of total managed assets. Total effective leverage consists of preferred shares, reverse repurchase agreements and other borrowings, credit default swap notional and floating rate notes issued in tender option bond transactions, as applicable (collectively “Total Effective Leverage”). The Fund may engage in other transactions not included in Total Effective Leverage disclosed above that may give rise to a form of leverage, including certain derivative transactions. For the purpose of calculating Total Effective Leverage outstanding as a percentage of total managed assets, total managed assets refer to total assets (including assets attributable to Total Effective Leverage that may be outstanding) minus accrued liabilities (other than liabilities representing Total Effective Leverage). |
Fund Information (as of June 30, 2022)
(1)
| | | | |
| Market Price | | | $13.85 | |
| | |
| NAV | | | $15.35 | |
| | |
| Premium/(Discount) to NAV | | | (9.77)% | |
| | |
Market Price Distribution Rate (2) | | | 10.26% | |
| | |
| | | 9.26% | |
| | |
Total Effective Leverage (3) | | | 48.38% | |
Investment Objective and Strategy Overview
PIMCO Dynamic Income Opportunities Fund’s investment objective is to seek current income as a primary objective and capital appreciation as a secondary objective.
Fund Insights at NAV
The following affected performance (on a gross basis) during the reporting period:
| » | | Exposure to select corporate special situation positions contributed to absolute performance, as select issuers posted positive returns. |
| » | | Short interest rate positioning, especially in the long end of the curve, contributed to absolute performance, as rates increased. |
| » | | Security selection in structured credit contributed to absolute performance, as select securities posted positive returns and outperformed the broader asset class. |
| » | | Exposure to corporate credit detracted from absolute performance, as the asset class posted negative returns. |
| » | | Exposure to emerging market debt detracted from absolute performance, as the asset class posted negative returns. |
| » | | Exposure to U.S. mortgage credit detracted from absolute performance, as the asset class posted negative returns. |
| | |
| | |
| | |
| ICE BofAML US High Yield Index | | ICE BofAML U.S. High Yield Index tracks the performance of below investment grade U.S. dollar-denominated corporate bonds publicly issued in the U.S. domestic market. Qualifying bonds must have at least one year remaining term to maturity, a fixed coupon schedule and a minimum amount outstanding of USD 100 million. Bonds must be rated below investment grade based on a composite of Moody’s and S&P. |
| | |
| S&P 500 Index | | S&P 500 Index is an unmanaged market index generally considered representative of the stock market as a whole. The Index focuses on the large-cap segment of the U.S. equities market. |
* It is not possible to invest directly in an unmanaged index.
(THIS PAGE INTENTIONALLY LEFT BLANK)
| | | | | | | | | | | | | | | | | | | | | | | | | | | | | | | | |
| | | | | | | | | | |
| | | | | | | | | | | | | | | | | | | | | | | | | |
| Selected Per Share Data for the Year or Period Ended^: | | | | | Net Investment Income (Loss) (b) | | | Net
Realized/
Unrealized
Gain (Loss) | | | | | | | | | From Net
Realized
Capital
Gains | | | Tax Basis
Return of
Capital | | | | |
| | | | | | | | | |
| | | | | | | | | | | | | | | | | | | | | | | | | | | | | | | | |
| | | | | | | | | |
| | $ | 9.52 | | | $ | 0.79 | | | $ | (1.66 | ) | | $ | (0.87 | ) | | $ | (0.93 | ) | | $ | 0.00 | | | $ | (0.03 | ) | | $ | (0.96 | ) |
| | | | | | | | | |
| | | 8.47 | | | | 0.97 | | | | 1.04 | | | | 2.01 | | | | (0.96 | ) | | | 0.00 | | | | 0.00 | | | | (0.96 | ) |
| | | | | | | | | |
| | | 10.19 | | | | 0.86 | | | | (1.62 | ) | | | (0.76 | ) | | | (0.95 | ) | | | 0.00 | | | | (0.01 | ) | | | (0.96 | ) |
| | | | | | | | | |
| | | 10.23 | | | | 0.69 | | | | 0.23 | | | | 0.92 | | | | (0.96 | ) | | | 0.00 | | | | 0.00 | | | | (0.96 | ) |
| | | | | | | | | |
| | | 10.15 | | | | 0.88 | | | | 0.18 | | | | 1.06 | | | | (0.98 | ) | | | 0.00 | | | | 0.00 | | | | (0.98 | ) |
| | | | | | | | | |
PIMCO Global StocksPLUS & Income Fund | | | | | | | | | | | | | | | | | | | | | | | | | | | | | | | | |
| | | | | | | | | |
| | $ | 10.44 | | | $ | 0.87 | | | $ | (3.21 | ) | | $ | (2.34 | ) | | $ | (0.83 | ) | | $ | 0.00 | | | $ | 0.00 | | | $ | (0.83 | ) |
| | | | | | | | | |
| | | 7.47 | | | | 0.95 | | | | 2.85 | | | | 3.80 | | | | (0.83 | ) | | | 0.00 | | | | 0.00 | | | | (0.83 | ) |
| | | | | | | | | |
| | | 9.89 | | | | 1.10 | | | | (2.42 | ) | | | (1.32 | ) | | | (0.85 | ) | | | 0.00 | | | | (0.25 | ) | | | (1.10 | ) |
| | | | | | | | | |
| | | 10.50 | | | | 1.11 | | | | (0.34 | ) | | | 0.77 | | | | (1.20 | ) | | | 0.00 | | | | (0.18 | ) | | | (1.38 | ) |
| | | | | | | | | |
| | | 11.18 | | | | 1.09 | | | | (0.16 | ) | | | 0.93 | | | | (1.43 | ) | | | 0.00 | | | | (0.18 | ) | | | (1.61 | ) |
| | | | | | | | | |
PIMCO Strategic Income Fund, Inc. | | | | | | | | | | | | | | | | | | | | | | | | | | | | | | | | |
| | | | | | | | | |
| | $ | 6.55 | | | $ | 0.61 | | | $ | (1.87 | ) | | $ | (1.26 | ) | | $ | (0.60 | ) | | $ | 0.00 | | | $ | (0.01 | ) | | $ | (0.61 | ) |
| | | | | | | | | |
| | | 5.94 | | | | 0.58 | | | | 0.64 | | | | 1.22 | | | | (0.41 | ) | | | 0.00 | | | | (0.20 | ) | | | (0.61 | ) |
| | | | | | | | | |
| | | 7.12 | | | | 0.74 | | | | (1.20 | ) | | | (0.46 | ) | | | (0.49 | ) | | | 0.00 | | | | (0.23 | ) | | | (0.72 | ) |
| | | | | | | | | |
| | | 7.32 | | | | 0.60 | | | | 0.03 | | | | 0.63 | | | | (0.61 | ) | | | 0.00 | | | | (0.22 | ) | | | (0.83 | ) |
| | | | | | | | | |
| | | 7.75 | | | | 0.77 | | | | (0.34 | ) | | | 0.43 | | | | (0.86 | ) | | | 0.00 | | | | 0.00 | | | | (0.86 | ) |
| | | | | | | | | |
PIMCO Access Income Fund (Consolidated) | | | | | | | | | | | | | | | | | | | | | | | | | | | | | | | | |
| | | | | | | | | |
| | $ | 20.00 | | | $ | 0.45 | | | $ | (2.78 | ) | | $ | (2.33 | ) | | $ | (0.47 | ) | | $ | 0.00 | | | $ | 0.00 | | | $ | (0.47 | ) |
| | | | | | | | | |
PIMCO Dynamic Income Fund (Consolidated) | | | | | | | | | | | | | | | | | | | | | | | | | | | | | | | | |
| | | | | | | | | |
| | $ | 25.23 | | | $ | 2.84 | | | $ | (5.77 | ) | | $ | (2.93 | ) | | $ | (2.65 | ) | | $ | 0.00 | | | $ | 0.00 | | | $ | (2.65 | ) |
| | | | | | | | | |
| | | 22.59 | | | | 2.51 | | | | 2.57 | | | | 5.08 | | | | (2.52 | ) | | | 0.00 | | | | (0.13 | ) | | | (2.65 | ) |
| | | | | | | | | |
| | | 28.29 | | | | 2.92 | | | | (5.80 | ) | | | (2.88 | ) | | | (3.07 | ) | | | 0.00 | | | | 0.00 | | | | (3.07 | ) |
| | | | | | | | | |
| | | 28.98 | | | | 2.73 | | | | (0.37 | ) | | | 2.36 | | | | (3.15 | ) | | | 0.00 | | | | 0.00 | | | | (3.15 | ) |
| | | | | | | | | |
| | | 28.32 | | | | 2.95 | | | | 0.18 | | | | 3.13 | | | | (2.65 | ) | | | 0.00 | | | | 0.00 | | | | (2.65 | ) |
| | | | | | | | | |
PIMCO Dynamic Income Opportunities Fund (Consolidated) | | | | | | | | | | | | | | | | | | | | | | | | | | | | | | | | |
| | | | | | | | | |
| | $ | 20.50 | | | $ | 1.73 | | | $ | (5.01 | ) | | $ | (3.28 | ) | | $ | (1.79 | ) | | $ | (0.12 | ) | | $ | 0.00 | | | $ | (1.91 | ) |
| | | | | | | | | |
| | | 20.00 | | | | 0.49 | | | | 0.47 | | | | 0.96 | | | | (0.47 | ) | | | 0.00 | | | | 0.00 | | | | (0.47 | ) |
| * | Annualized, except for organizational expense, if any. |
| ^ | A zero balance may reflect actual amounts rounding to less than $0.01 or 0.01%. |
| Includes adjustments required by U.S. GAAP and may differ from net asset values and performance reported elsewhere by the Funds. |
| Per share amounts based on average number of shares outstanding during the year or period. |
| The tax characterization of distributions is determined in accordance with Federal income tax regulations. See Note 2, Distributions — Common Shares, in the Notes to Financial Statements for more information. |
| Total investment return is calculated assuming a purchase of a share at the market price on the first day and a sale of a share at the market price on the last day of each year reported. Dividends and distributions, if any, are assumed, for purposes of this calculation, to be reinvested at prices obtained under the Fund’s dividend reinvestment plan. Total investment return does not reflect brokerage commissions in connection with the purchase or sale of Fund shares. |
| Ratio includes interest expense which primarily relates to participation in borrowing and financing transactions. See Note 5, Borrowings and Other Financing Transactions, in the Notes to Financial Statements for more information. |
| See Note 2, Distributions — Common Shares, in the Notes to Financial Statements for more information regarding certain prior year values. |
| Effective December 13, 2021, the Fund’s Investment advisory fee was decreased by 0.05% to an annual rate of 1.10%. |
| | | | | | | | | | | | | | | | | | | | | | | | | | | | | | | | | | | | | | | | | | | | | | |
| | | | | | | | | | | |
| | | | | | | | | | | | | | | | | | | Ratios to Average Net Assets | | | | |
Increase
resulting from
Common Share
Offering | | | Offering Cost
Charged to
Paid in Capital | | | Net Asset Value End of Year or Period (a) | | | Market Price
End of Year
or Period | | | | | | Net Assets
Applicable to
Common
Shareholders
End of Year
or Period
(000s) | | | | | | Expenses Excluding Waivers (e) | | | Expenses
Excluding
Interest
Expense | | | Expenses
Excluding
Interest
Expense and
Waivers | | | Net
Investment
Income (Loss) | | | | |
| | | | | | | | | | | |
| | | | | | | | | | | | | | | | | | | | | | | | | | | | | | | | | | | | | | | | | | | | | | |
| | | | | | | | | | | |
| $ | N/A | | | $ | N/A | | | $ | 7.69 | | | $ | 9.25 | | | | (14.44 | )% | | $ | 90,639 | | | | 2.30 | % | | | 2.30 | % | | | 1.63 | % | | | 1.63 | % | | | 8.71 | % | | | 65 | % |
| | | | | | | | | | | |
| | N/A | | | | N/A | | | | 9.52 | | | | 11.87 | | | | 38.25 | | | | 111,154 | | | | 2.49 | | | | 2.49 | | | | 1.60 | | | | 1.60 | | | | 10.56 | | | | 127 | |
| | | | | | | | | | | |
| | N/A | | | | N/A | | | | 8.47 | | | | 9.42 | | | | (8.33 | ) | | | 98,539 | | | | 3.39 | | | | 3.39 | | | | 1.54 | | | | 1.54 | | | | 9.09 | | | | 15 | |
| | | | | | | | | | | |
| | N/A | | | | N/A | | | | 10.19 | | | | 11.32 | | | | 8.26 | | | | 118,181 | | | | 3.35 | | | | 3.35 | | | | 1.41 | | | | 1.41 | | | | 6.89 | | | | 8 | |
| | | | | | | | | | | |
| | N/A | | | | N/A | | | | 10.23 | | | | 11.45 | | | | 11.48 | | | | 118,512 | | | | 3.06 | | | | 3.06 | | | | 1.43 | | | | 1.43 | | | | 8.55 | | | | 9 | |
| | | | | | | | | | | |
| | | | | | | | | | | | | | | | | | | | | | | | | | | | | | | | | | | | | | | | | | | | | | |
| | | | | | | | | | | |
| $ | N/A | | | $ | N/A | | | $ | 7.27 | | | $ | 7.89 | | | | (22.51 | )% | | $ | 81,353 | | | | 2.09 | % | | | 2.09 | % | | | 1.76 | % | | | 1.76 | % | | | 8.96 | % | | | 373 | % |
| | | | | | | | | | | |
| | N/A | | | | N/A | | | | 10.44 | | | | 11.10 | | | | 48.12 | | | | 115,748 | | | | 2.03 | | | | 2.03 | | | | 1.66 | | | | 1.66 | | | | 10.35 | | | | 503 | |
| | | | | | | | | | | |
| | N/A | | | | N/A | | | | 7.47 | | | | 8.19 | | | | (26.51 | ) | | | 82,109 | | | | 2.78 | | | | 2.78 | | | | 1.65 | | | | 1.65 | | | | 12.56 | | | | 395 | |
| | | | | | | | | | | |
| | N/A | | | | N/A | | | | 9.89 | | | | 12.47 | | | | (7.41 | ) | | | 107,562 | | | | 2.64 | | | | 2.64 | | | | 1.53 | | | | 1.53 | | | | 11.37 | | | | 381 | |
| | | | | | | | | | | |
| | N/A | | | | N/A | | | | 10.50 | | | | 14.98 | | | | (8.96 | ) | | | 113,204 | | | | 2.36 | | | | 2.36 | | | | 1.48 | | | | 1.48 | | | | 9.84 | | | | 63 | |
| | | | | | | | | | | |
| | | | | | | | | | | | | | | | | | | | | | | | | | | | | | | | | | | | | | | | | | | | | | |
| | | | | | | | | | | |
| $ | N/A | | | $ | N/A | | | $ | 4.68 | | | $ | 5.13 | | | | (25.44 | )% | | $ | 210,018 | | | | 1.44 | % | | | 1.44 | % | | | 0.98 | % | | | 0.98 | % | | | 10.29 | % | | | 678 | % |
| | | | | | | | | | | |
| | N/A | | | | N/A | | | | 6.55 | | | | 7.61 | | | | 30.90 | | | | 290,989 | | | | 1.36 | | | | 1.36 | | | | 0.96 | | | | 0.96 | | | | 8.97 | | | | 774 | |
| | | | | | | | | | | |
| | N/A | | | | N/A | | | | 5.94 | | | | 6.37 | | | | (27.94 | ) | | | 261,163 | | | | 2.61 | | | | 2.61 | | | | 0.98 | | | | 0.98 | | | | 11.28 | | | | 679 | |
| | | | | | | | | | | |
| | N/A | | | | N/A | | | | 7.12 | | | | 9.71 | | | | 9.57 | | | | 309,287 | | | | 3.20 | | | | 3.20 | | | | 0.97 | | | | 0.97 | | | | 8.52 | | | | 655 | |
| | | | | | | | | | | |
| | N/A | | | | N/A | | | | 7.32 | | | | 9.68 | | | | 4.59 | | | | 314,540 | | | | 1.85 | | | | 1.85 | | | | 0.97 | | | | 0.97 | | | | 10.12 | | | | 5 | |
| | | | | | | | | | | |
| | | | | | | | | | | | | | | | | | | | | | | | | | | | | | | | | | | | | | | | | | | | | | |
| | | | | | | | | | | |
| $ | 0.00 | | | $ | N/A | | | $ | 17.20 | | | $ | 15.83 | | | | (18.72 | )% | | $ | 756,653 | | | | 1.79 | %* | | | 1.79 | %* | | | 1.51 | %* | | | 1.51 | %* | | | 5.81 | %* | | | 16 | % |
| | | | | | | | | | | |
| | | | | | | | | | | | | | | | | | | | | | | | | | | | | | | | | | | | | | | | | | | | | | |
| | | | | | | | | | | |
| $ | 0.07 | | | $ | 0.00 | | | $ | 19.72 | | | $ | 20.87 | | | | (19.10 | )% | | $ | 4,466,886 | | | | 2.64 | %(g) | | | 2.64 | %(g) | | | 2.00 | %(g) | | | 2.00 | %(g) | | | 12.28 | % | | | 27 | % |
| | | | | | | | | | | |
| | 0.21 | | | | 0.00 | | | | 25.23 | | | | 28.81 | | | | 29.29 | | | | 1,781,435 | | | | 2.78 | | | | 2.78 | | | | 2.04 | | | | 2.04 | | | | 10.36 | | | | 38 | |
| | | | | | | | | | | |
| | 0.25 | | | | 0.00 | | | | 22.59 | | | | 24.72 | | | | (14.18 | ) | | | 1,375,107 | | | | 3.72 | | | | 3.72 | | | | 1.99 | | | | 1.99 | | | | 11.44 | | | | 21 | |
| | | | | | | | | | | |
| | 0.10 | | | | (0.00 | ) | | | 28.29 | | | | 32.15 | | | | 12.03 | | | | 1,603,368 | | | | 3.96 | | | | 3.96 | | | | 1.89 | | | | 1.89 | | | | 9.70 | | | | 12 | |
| | | | | | | | | | | |
| | 0.18 | | | | (0.00 | ) | | | 28.98 | | | | 31.87 | | | | 15.54 | | | | 1,575,523 | | | | 4.07 | | | | 4.07 | | | | 2.01 | | | | 2.01 | | | | 10.26 | | | | 9 | |
| | | | | | | | | | | |
| | | | | | | | | | | | | | | | | | | | | | | | | | | | | | | | | | | | | | | | | | | | | | |
| | | | | | | | | | | |
| $ | N/A | | | $ | N/A | | | $ | 15.31 | | | $ | 13.85 | | | | (33.77 | )% | | $ | 1,684,507 | | | | 2.79 | % | | | 2.79 | % | | | 2.12 | % | | | 2.12 | % | | | 9.11 | % | | | 47 | % |
| | | | | | | | | | | |
| | 0.01 | | | | N/A | | | | 20.50 | | | | 23.18 | | | | 16.70 | | | | 2,227,301 | | | | 2.10 | * | | | 2.10 | * | | | 1.78 | * | | | 1.78 | * | | | 5.93 | * | | | 49 | |
Statements of Assets and Liabilities | | | | June 30, 2022 | | |
| | | | | | | | | | | | |
(Amounts in thousands , except per share amounts) | | | | | | | | PIMCO
Strategic
Income Fund,
Inc. | |
| | | |
| | | | | | | | | | | | |
| | | |
| | | | | | | | | | | | |
| | | | | | | | | | | | |
| Investments in securities* | | $ | 173,009 | | | $ | 171,511 | | | $ | 430,191 | |
| | | | |
Financial Derivative Instruments | | | | | | | | | | | | |
| Exchange-traded or centrally cleared | | | 287 | | | | 449 | | | | 1,643 | |
| Over the counter | | | 0 | | | | 279 | | | | 1,366 | |
| Cash | | | 0 | | | | 0 | | | | 1 | |
| Deposits with counterparty | | | 3,649 | | | | 6,120 | | | | 18,920 | |
| Foreign currency, at value | | | 0 | | | | 484 | | | | 2,180 | |
| Receivable for investments sold | | | 614 | | | | 2,037 | | | | 6,394 | |
| Receivable for TBA investments sold | | | 0 | | | | 32,563 | | | | 380,833 | |
| Interest and/or dividends receivable | | | 1,213 | | | | 1,686 | | | | 4,409 | |
| Other assets | | | 10 | | | | 1 | | | | 1 | |
| | | 178,782 | | | | 215,130 | | | | 845,938 | |
| | | | |
| | | | | | | | | | | | |
| | | | |
Borrowings & Other Financing Transactions | | | | | | | | | | | | |
| Payable for reverse repurchase agreements | | $ | 84,492 | | | $ | 53,282 | | | $ | 171,303 | |
| Payable for short sales | | | 0 | | | | 694 | | | | 2,610 | |
Financial Derivative Instruments | | | | | | | | | | | | |
| Exchange-traded or centrally cleared | | | 136 | | | | 2,389 | | | | 3,208 | |
| Over the counter | | | 207 | | | | 7,327 | | | | 236 | |
| Payable for investments purchased | | | 449 | | | | 2,738 | | | | 3,828 | |
| Payable for TBA investments purchased | | | 0 | | | | 66,010 | | | | 450,254 | |
| Payable for unfunded loan commitments | | | 1,732 | | | | 183 | | | | 519 | |
| Deposits from counterparty | | | 45 | | | | 223 | | | | 1,471 | |
| Distributions payable to common shareholders | | | 942 | | | | 773 | | | | 2,289 | |
| Overdraft due to custodian | | | 3 | | | | 5 | | | | 0 | |
| Accrued management fees | | | 132 | | | | 131 | | | | 175 | |
| Other liabilities | | | 5 | | | | 22 | | | | 27 | |
| | | 88,143 | | | | 133,777 | | | | 635,920 | |
| | | | |
Net Assets Applicable to Common Shareholders | | $ | 90,639 | | | $ | 81,353 | | | $ | 210,018 | |
| | | | |
Net Assets Applicable to Common Shareholders Consist of: | | | | | | | | | | | | |
| | | | |
| | $ | 12 | | | $ | 0 | | | $ | 0 | |
| Paid in capital in excess of par | | | 112,511 | | | | 134,754 | | | | 341,347 | |
| Distributable earnings (accumulated loss) | | | (21,884 | ) | | | (53,401 | ) | | | (131,329 | ) |
| | | | |
Net Assets Applicable to Common Shareholders | | $ | 90,639 | | | $ | 81,353 | | | $ | 210,018 | |
| | | | |
Common Shares Outstanding | | | 11,782 | | | | 11,197 | | | | 44,878 | |
| | | | |
Net Asset Value Per Common Share (a) | | $ | 7.69 | | | $ | 7.27 | | | $ | 4.68 | |
| | | | |
| Cost of investments in securities | | $ | 182,884 | | | $ | 200,120 | | | $ | 520,523 | |
| Cost of foreign currency held | | $ | 0 | | | $ | 524 | | | $ | 2,299 | |
| Proceeds received on short sales | | $ | 0 | | | $ | 694 | | | $ | 2,611 | |
| Cost or premiums of financial derivative instruments, net | | $ | 1,162 | | | $ | (841 | ) | | $ | 9,555 | |
| | | | |
| * Includes repurchase agreements of: | | $ | 9,475 | | | $ | 7,304 | | | $ | 2,703 | |
| A zero balance may reflect actual amounts rounding to less than one thousand. |
| ($0.001 per share), ($0.00001 per share), ($0.00001 per share), ($0.00001 per share) |
| Includes adjustments required by U.S. GAAP and may differ from net asset values and performance reported elsewhere by the Funds. |
| | | | | | |
Consolidated Statements of Assets and Liabilities | | | | June 30, 2022 | | |
| | | | | | | | | | | | |
(Amounts in thousands , except per share amounts) | | | | | | | | PIMCO
Dynamic
Income
Opportunities
Fund | |
| | | | |
| | | | | | | | | | | | |
| | | | |
| | | | | | | | | | | | |
| Investments in securities* | | $ | 1,249,883 | | | $ | 8,097,987 | | | $ | 3,119,838 | |
| Investments in Affiliates | | | 0 | | | | 104,203 | | | | 0 | |
Financial Derivative Instruments | | | | | | | | | | | | |
| Exchange-traded or centrally cleared | | | 770 | | | | 7,849 | | | | 3,410 | |
| Over the counter | | | 2,182 | | | | 28,497 | | | | 5,651 | |
| Cash | | | 3,352 | | | | 1,991 | | | | 0 | |
| Deposits with counterparty | | | 27,543 | | | | 208,502 | | | | 82,785 | |
| Foreign currency, at value | | | 599 | | | | 5,853 | | | | 4,791 | |
| Receivable for investments sold | | | 26,354 | | | | 382,057 | | | | 59,703 | |
| Receivable for Fund shares sold | | | 0 | | | | 336 | | | | 0 | |
| Interest and/or dividends receivable | | | 11,028 | | | | 92,880 | | | | 41,096 | |
| Other assets | | | 0 | | | | 1,499 | | | | 16 | |
| | | 1,321,711 | | | | 8,931,654 | | | | 3,317,290 | |
| | | | |
| | | | | | | | | | | | |
| | | | |
Borrowings & Other Financing Transactions | | | | | | | | | | | | |
| Payable for reverse repurchase agreements | | $ | 421,290 | | | $ | 4,082,822 | | | $ | 1,519,868 | |
| Payable for short sales | | | 0 | | | | 1,872 | | | | 0 | |
Financial Derivative Instruments | | | | | | | | | | | | |
| Exchange-traded or centrally cleared | | | 684 | | | | 7,840 | | | | 4,545 | |
| Over the counter | | | 258 | | | | 19,337 | | | | 4,480 | |
| Payable for investments purchased | | | 126,606 | | | | 192,388 | | | | 48,464 | |
| Payable for unfunded loan commitments | | | 4,714 | | | | 61,152 | | | | 11,571 | |
| Deposits from counterparty | | | 5,155 | | | | 40,891 | | | | 5,982 | |
| Distributions payable to common shareholders | | | 5,133 | | | | 49,913 | | | | 13,030 | |
| Overdraft due to custodian | | | 0 | | | | 0 | | | | 21,614 | |
| Accrued management fees | | | 1,216 | | | | 7,817 | | | | 3,151 | |
| Other liabilities | | | 2 | | | | 736 | | | | 78 | |
| | | 565,058 | | | | 4,464,768 | | | | 1,632,783 | |
| | | | |
Net Assets Applicable to Common Shareholders | | $ | 756,653 | | | $ | 4,466,886 | | | $ | 1,684,507 | |
| | | | |
Net Assets Applicable to Common Shareholders Consist of: | | | | | | | | | | | | |
| | | | |
| | | 0 | | | | 2 | | | | 1 | |
| Paid in capital in excess of par | | $ | 879,662 | | | $ | 6,099,269 | | | $ | 2,200,989 | |
| Distributable earnings (accumulated loss) | | | (123,009 | ) | | | (1,632,385 | ) | | | (516,483 | ) |
| | | | |
Net Assets Applicable to Common Shareholders | | $ | 756,653 | | | $ | 4,466,886 | | | $ | 1,684,507 | |
| | | | |
Common Shares Outstanding | | | 43,983 | | | | 226,558 | | | | 110,053 | |
| | | | |
Net Asset Value Per Common Share (a) | | $ | 17.20 | | | $ | 19.72 | | | $ | 15.31 | |
| | | | |
| Cost of investments in securities | | $ | 1,372,685 | | | $ | 9,428,623 | | | $ | 3,676,139 | |
| Cost of investments in Affiliates | | | 0 | | | $ | 27,066 | | | | 0 | |
| Cost of foreign currency held | | $ | 587 | | | $ | 6,282 | | | $ | 4,982 | |
| Proceeds received on short sales | | | 0 | | | | 1,926 | | | | 0 | |
| Cost or premiums of financial derivative instruments, net | | $ | (1,305 | ) | | $ | (31,534 | ) | | $ | (6,113 | ) |
| | | | |
| * Includes repurchase agreements of: | | $ | 50,200 | | | $ | 255,540 | | | $ | 105,400 | |
| A zero balance may reflect actual amounts rounding to less than one thousand. |
| Includes adjustments required by U.S. GAAP and may differ from net asset values and performance reported elsewhere by the Funds |
| | | | | | | | | | | | | |
| See Accompanying Notes | | | | | | | | | | JUNE 30, 2022 | | | |
| | | | | | | | | | | | | |
| Year Ended June 30, 2022 | | | | | | | | | |
| | | | | | | | PIMCO
Strategic
Income Fund,
Inc. | |
| | | | |
| | | | | | | | | | | | |
| | | | |
| Interest, net of foreign taxes* | | $ | 11,479 | | | $ | 11,796 | | | $ | 30,409 | |
| | | | |
| Dividends, net of foreign taxes** | | | 240 | | | | 231 | | | | 603 | |
| Total Income | | | 11,719 | | | | 12,027 | | | | 31,012 | |
| | | | |
| | | | | | | | | | | | |
| | | | |
| Management fees | | | 1,714 | | | | 1,883 | | | | 2,530 | |
| Trustee fees and related expenses | | | 13 | | | | 33 | | | | 35 | |
| Interest expense | | | 709 | | | | 358 | | | | 1,206 | |
| Miscellaneous expense | | | 8 | | | | 5 | | | | 6 | |
| Total Expenses | | | 2,444 | | | | 2,279 | | | | 3,777 | |
| | | | |
Net Investment Income (Loss) | | | 9,275 | | | | 9,748 | | | | 27,235 | |
| | | | |
Net Realized Gain (Loss): | | | | | | | | | | | | |
| | | | |
| Investments in securities | | | 1,619 | | | | (666 | ) | | | (8,048 | ) |
| Exchange-traded or centrally cleared financial derivative instruments | | | 497 | | | | 548 | | | | (1,272 | ) |
| Over the counter financial derivative instruments | | | 182 | | | | 6,695 | | | | 4,808 | |
| Foreign currency | | | 0 | | | | 42 | | | | 203 | |
| | | | |
| | | 2,298 | | | | 6,619 | | | | (4,309 | ) |
| | | | |
Net Change in Unrealized Appreciation (Depreciation): | | | | | | | | | | | | |
| | | | |
| Investments in securities | | | (18,235 | ) | | | (25,227 | ) | | | (99,193 | ) |
| | | | |
| Exchange-traded or centrally cleared financial derivative instruments | | | (3,634 | ) | | | (2,398 | ) | | | 19,495 | |
| | | | |
| Over the counter financial derivative instruments | | | (11 | ) | | | (15,077 | ) | | | (437 | ) |
| | | | |
| Foreign currency assets and liabilities | | | 0 | | | | 111 | | | | 549 | |
| | | | |
Net Change in Unrealized Appreciation (Depreciation) | | | (21,880 | ) | | | (42,591 | ) | | | (79,586 | ) |
| | | | |
Net Increase (Decrease) in Net Assets Resulting from Operations | | $ | (10,307 | ) | | $ | (26,224 | ) | | $ | (56,660 | ) |
| | | | |
| * Foreign tax withholdings | | $ | 0 | | | $ | 36 | | | $ | 90 | |
| | | | |
| ** Foreign tax withholdings - Dividends | | $ | 2 | | | $ | 2 | | | $ | 3 | |
| A zero balance may reflect actual amounts rounding to less than one thousand. |
| | | | | |
Consolidated Statements of Operations | | | | |
| | | | | | | | | | | | | |
| Year Ended June 30, 2022 | | | | | | | | | |
| | | | | | | | PIMCO
Dynamic
Income
Opportunities
Fund | |
| | | | |
| | | | | | | | | | | | |
| | | | |
| Interest, net of foreign taxes* | | $ | 25,408 | | | $ | 527,503 | | | $ | 247,182 | |
| | | | |
| Dividends, net of foreign taxes** | | | 509 | | | | 7,151 | | | | 499 | |
| Total Income | | | 25,917 | | | | 534,654 | | | | 247,681 | |
| | | | |
| | | | | | | | | | | | |
| | | | |
| Management fees | | | 5,072 | | | | 71,433 | | | | 43,917 | |
| Trustee fees and related expenses | | | 56 | | | | 463 | | | | 195 | |
| Interest expense | | | 968 | | | | 23,093 | | | | 14,029 | |
| Miscellaneous expense | | | 0 | | | | 67 | | | | 4 | |
| Total Expenses | | | 6,096 | | | | 95,056 | | | | 58,145 | |
| | | | |
Net Investment Income (Loss) | | | 19,821 | | | | 439,598 | | | | 189,536 | |
| | | | |
Net Realized Gain (Loss): | | | | | | | | | | | | |
| | | | |
| Investments in securities | | | (2,574 | ) | | | 99,563 | | | | 15,641 | |
| Exchange-traded or centrally cleared financial derivative instruments | | | (436 | ) | | | (5,144 | ) | | | (13,403 | ) |
| Over the counter financial derivative instruments | | | 2,782 | | | | 78,652 | | | | 55,517 | |
| Short sales | | | 0 | | | | 0 | | | | (132 | ) |
| Foreign currency | | | 1,231 | | | | 100 | | | | (1,741 | ) |
| | | | |
| | | 1,003 | | | | 173,171 | | | | 55,882 | |
| | | | |
Net Change in Unrealized Appreciation (Depreciation): | | | | | | | | | | | | |
| | | | |
| Investments in securities | | | (122,802 | ) | | | (1,417,224 | ) | | | (600,202 | ) |
| | | | |
| Investments in Affiliates | | | 0 | | | | 77,137 | | | | 0 | |
| | | | |
| Exchange-traded or centrally cleared financial derivative instruments | | | (2,352 | ) | | | 1,711 | | | | 1,120 | |
| | | | |
| Over the counter financial derivative instruments | | | 139 | | | | 6,732 | | | | (10,932 | ) |
| | | | |
| Foreign currency assets and liabilities | | | 1,713 | | | | 12,256 | | | | 3,127 | |
| | | | |
Net Change in Unrealized Appreciation (Depreciation) | | | (123,302 | ) | | | (1,319,388 | ) | | | (606,887 | ) |
| | | | |
Net Increase (Decrease) in Net Assets Resulting from Operations | | $ | (102,478 | ) | | $ | (706,619 | ) | | $ | (361,469 | ) |
| | | | |
| * Foreign tax withholdings - Interest | | $ | 2 | | | $ | 1,080 | | | $ | 611 | |
| | | | |
| ** Foreign tax withholdings - Dividends | | $ | 0 | | | $ | 28 | | | $ | 1 | |
| A zero balance may reflect actual amounts rounding to less than one thousand. |
| Inception date of the Fund was January 31, 2022. |
| | | | | |
Statements of Changes in Net Assets | | | | |
| | | | | | | | | | | | | | | | | |
| | | | | | | |
| | | | | |
| | | | | | | | | | | | |
| | | | | |
Increase (Decrease) in Net Assets from: | | | | | | | | | | | | | | | | |
| | | | | |
| | | | | | | | | | | | | | | | |
| | | | | |
| Net investment income (loss) | | $ | 9,275 | | | $ | 11,334 | | | $ | 9,748 | | | $ | 10,479 | |
| Net realized gain (loss) | | | 2,298 | | | | (2,978 | ) | | | 6,619 | | | | 9,293 | |
| Net change in unrealized appreciation (depreciation) | | | (21,880 | ) | | | 14,896 | | | | (42,591 | ) | | | 22,099 | |
| | | | | |
Net Increase (Decrease) in Net Assets Resulting from Operations | | | (10,307 | ) | | | 23,252 | | | | (26,224 | ) | | | 41,871 | |
| | | | | |
Distributions to Common Shareholders: | | | | | | | | | | | | | | | | |
| | | | | |
| From net investment income and/or net realized capital gains | | | (10,961 | ) | | | (11,184 | ) | | | (9,228 | ) | | | (9,146 | ) |
| Tax basis return of capital | | | (303 | ) | | | 0 | | | | 0 | | | | 0 | |
| | | | | |
Total Distributions to Common Shareholders (a) | | | (11,264 | ) | | | (11,184 | ) | | | (9,228 | ) | | | (9,146 | ) |
| | | | | |
Common Share Transactions*: | | | | | | | | | | | | | | | | |
| | | | | |
| Issued as reinvestment of distributions | | | 1,056 | | | | 547 | | | | 1,057 | | | | 914 | |
| | | | | |
Net increase (decrease) resulting from common share transactions | | | 1,056 | | | | 547 | | | | 1,057 | | | | 914 | |
| | | | | |
Total increase (decrease) in net assets applicable to common shareholders | | | (20,515 | ) | | | 12,615 | | | | (34,395 | ) | | | 33,639 | |
| | | | | |
Net Assets Applicable to Common Shareholders: | | | | | | | | | | | | | | | | |
| | | | | |
| Beginning of year | | | 111,154 | | | | 98,539 | | | | 115,748 | | | | 82,109 | |
| End of year | | $ | 90,639 | | | $ | 111,154 | | | $ | 81,353 | | | $ | 115,748 | |
| | | | | |
*Common Share Transactions: | | | | | | | | | | | | | | | | |
| | | | | |
| Shares issued as reinvestment of distributions | | | 101 | | | | 53 | | | | 107 | | | | 100 | |
| Net increase (decrease) in common shares outstanding | | | 101 | | | | 53 | | | | 107 | | | | 100 | |
| A zero balance may reflect actual amounts rounding to less than one thousand. |
| The tax characterization of distributions is determined in accordance with Federal income tax regulations. See Note 2, Dividends and Distributions to Shareholders, in the Notes to Financial Statements for more information. |
| | | | | | |
| 24 | | PIMCO CLOSED-END FUNDS | | | See Accompanying Notes | |
| | | | | | |
PIMCO
Strategic Income Fund, Inc. | |
| |
Year Ended
June 30, 2022 | | | Year Ended
June 30, 2021 | |
| |
| | | | | | |
| |
| | | | | | |
| |
| $ | 27,235 | | | $ | 25,416 | |
| | (4,309 | ) | | | (17,911 | ) |
| | (79,586 | ) | | | 46,341 | |
| |
| | (56,660 | ) | | | 53,846 | |
| |
| | | | | | |
| |
| | (26,999 | ) | | | (18,313 | ) |
| | (320 | ) | | | (8,736 | ) |
| |
| | (27,319 | ) | | | (27,049 | ) |
| |
| | | | | | |
| |
| | 3,008 | | | | 3,029 | |
| |
| | 3,008 | | | | 3,029 | |
| |
| | (80,971 | ) | | | 29,826 | |
| |
| | | | | | |
| |
| | 290,989 | | | | 261,163 | |
| $ | 210,018 | | | $ | 290,989 | |
| |
| | | | | | |
| |
| | 481 | | | | 461 | |
| | 481 | | | | 461 | |
| | | | | | | | | | | | |
| | | | ANNUAL REPORT | | | | | | | JUNE 30, 2022 | | | 25 |
| | | | |
Consolidated Statements of Changes in Net Assets | | | | |
| | | | | | | | | | | | |
| | | PIMCO Access
Income Fund | | | PIMCO Dynamic Income Fund | |
| | | |
| | Inception date through June 30, 2022 (b) | | | Year Ended
June 30, 2022 | | | Year Ended
June 30, 2021 | |
| | | |
| Increase (Decrease) in Net Assets from: | | | | | | | | | | | | |
| | | |
| Operations: | | | | | | | | | | | | |
| | | |
| Net investment income (loss) | | $ | 19,821 | | | $ | 439,598 | | | $ | 167,364 | |
| Net realized gain (loss) | | | 1,003 | | | | 173,171 | | | | (93,129 | ) |
| Net change in unrealized appreciation (depreciation) | | | (123,302 | ) | | | (1,319,388 | ) | | | 259,142 | |
| | | |
| Net Increase (Decrease) in Net Assets Applicable to Common Shareholders Resulting from Operations | | | (102,478 | ) | | | (706,619 | ) | | | 333,377 | |
| | | |
| Distributions to Common Shareholders: | | | | | | | | | | | | |
| | | |
| From net investment income and/or net realized capital gains | | | (20,531 | ) | | | (391,635 | ) | | | (167,415 | ) |
| Tax basis return of capital | | | 0 | | | | 0 | | | | (8,919 | ) |
| | | |
Total Distributions to Common Shareholders (c) | | | (20,531 | ) | | | (391,635 | ) | | | (176,334 | ) |
| | | |
| Common Share Transactions*: | | | | | | | | | | | | |
| | | |
Net proceeds from offering | | | 866,100 | | | | 181,491 | | | | 120,200 | |
| Net proceeds from equity offering | | | 13,562 | | | | 0 | | | | 106,476 | |
| Net proceeds from reorganization | | | 0 | | | | 3,562,154 | | | | 0 | |
| | | 0 | | | | 429 | | | | 240 | |
| Issued as reinvestment of distributions | | | 0 | | | | 39,631 | | | | 22,369 | |
| | | |
| Net increase (decrease) resulting from common share transactions | | | 879,662 | | | | 3,783,705 | | | | 249,285 | |
| | | |
| Total increase (decrease) in net assets applicable to common shareholders | | | 756,653 | | | | 2,685,451 | | | | 406,328 | |
| | | |
| Net Assets Applicable to Common Shareholders: | | | | | | | | | | | | |
| | | |
| Beginning of year | | | 0 | | | | 1,781,435 | | | | 1,375,107 | |
| End of year | | $ | 756,653 | | | $ | 4,466,886 | | | $ | 1,781,435 | |
| | | |
| * Common Share Transactions: | | | | | | | | | | | | |
| | | |
| Shares sold | | | 43,983 | | | | 7,210 | | | | 8,848 | |
| Shares issued in reorganization | | | 0 | | | | 147,079 | | | | 0 | |
| Shares issued as reinvestment of distributions | | | 0 | | | | 1,671 | | | | 890 | |
| Net increase (decrease) in common shares outstanding | | | 43,983 | | | | 155,960 | | | | 9,738 | |
| A zero balance may reflect actual amounts rounding to less than one thousand. |
| Inception date of the Fund was January 29, 2021. |
| Inception date of the Fund was January 31, 2022. |
| The tax characterization of distributions is determined in accordance with Federal income tax regulations. See Note 2, Dividends and Distributions to Common Shares, in the Notes to Financial Statements for more information. |
| | | | | | |
| 26 | | PIMCO CLOSED-END FUNDS | | | See Accompanying Notes | |
| | | | | | |
PIMCO Dynamic Income Opportunities Fund | |
| |
| June 30, 2022 | | | Inception date through June 30, 2021 (a) | |
| |
| | | | | | |
| |
| | | | | | |
| |
| $ | 189,536 | | | $ | 52,235 | |
| | 55,882 | | | | 6,681 | |
| | (606,887 | ) | | | 46,720 | |
| |
| | (361,469 | ) | | | 105,636 | |
| |
| | | | | | |
| |
| | (209,275 | ) | | | (51,375 | ) |
| | 0 | | | | 0 | |
| |
| | (209,275 | ) | | | (51,375 | ) |
| |
| | | | | | |
| |
| | 0 | | | | 0 | |
| | 0 | | | | 2,166,064 | |
| | 0 | | | | 0 | |
| | 0 | | | | 0 | |
| | 27,950 | | | | 6,976 | |
| |
| | 27,950 | | | | 2,173,040 | |
| |
| | (542,794 | ) | | | 2,227,301 | |
| |
| | | | | | |
| |
| | 2,227,301 | | | | 0 | |
| $ | 1,684,507 | | | $ | 2,227,301 | |
| |
| | | | | | |
| |
| | 0 | | | | 108,303 | |
| | 0 | | | | 0 | |
| | 1,401 | | | | 349 | |
| | 1,401 | | | | 108,652 | |
| | | | | | | | | | | | |
| | | | ANNUAL REPORT | | | | | | | JUNE 30, 2022 | | | 27 |
| | | | | | | | | | | | |
| Year Ended June 30, 2022 | | | | | | | | | |
| (Amounts in thousands†) | | PCM Fund,
Inc. | | | PIMCO Global StocksPLUS & Income Fund | | | PIMCO
Strategic
Income Fund,
Inc. | |
| | | |
| Cash Flows Provided by (Used for) Operating Activities: | | | | | | | | | | | | |
| | | |
| Net increase (decrease) in net assets resulting from operations | | $ | (10,307 | ) | | $ | (26,224 | ) | | $ | (56,660 | ) |
| | | |
| Adjustments to Reconcile Net Increase (Decrease) in Net Assets from Operations to Net Cash Provided by (Used for) Operating Activities: | | | | | | | | | | | | |
| | | |
| Purchases of long-term securities | | | (133,967 | ) | | | (687,078 | ) | | | (4,527,142 | ) |
| Proceeds from sales of long-term securities | | | 144,587 | | | | 701,151 | | | | 4,745,910 | |
| (Purchases) Proceeds from sales of short-term portfolio investments, net | | | 1,395 | | | | (4,197 | ) | | | (11,546 | ) |
| (Increase) decrease in deposits with counterparty | | | (2,036 | ) | | | (2,778 | ) | | | (9,969 | ) |
| (Increase) decrease in receivable for investments sold | | | 11,197 | | | | 20,150 | | | | 111,565 | |
| (Increase) decrease in interest and/or dividends receivable | | | (43 | ) | | | (344 | ) | | | (274 | ) |
| Proceeds from (Payments on) exchange-traded or centrally cleared financial derivative instruments | | | (3,271 | ) | | | (844 | ) | | | 19,530 | |
| Proceeds from (Payments on) over the counter financial derivative instruments | | | 94 | | | | 6,716 | | | | 4,779 | |
| (Increase) decrease in other assets | | | 2 | | | | 1 | | | | 1 | |
| Increase (decrease) in payable for investments purchased | | | (11,776 | ) | | | (23,668 | ) | | | (281,741 | ) |
| Increase (decrease) in payable for unfunded loan commitments | | | (696 | ) | | | (235 | ) | | | 519 | |
| Increase (decrease) in deposits from counterparty | | | 35 | | | | (8,417 | ) | | | 176 | |
| Increase (decrease) in accrued management fees | | | (14 | ) | | | (25 | ) | | | (55 | ) |
| Proceeds from (Payments on) short sales transactions, net | | | (7,526 | ) | | | (265 | ) | | | (18,150 | ) |
| Proceeds from (Payments on) foreign currency transactions | | | 0 | | | | 12 | | | | 124 | |
| Increase (decrease) in other liabilities | | | (2 | ) | | | (11 | ) | | | (1 | ) |
| | | | | | | | | | | | |
| Investments in securities | | | (1,619 | ) | | | 666 | | | | 8,048 | |
| Exchange-traded or centrally cleared financial derivative instruments | | | (497 | ) | | | (548 | ) | | | 1,272 | |
| Over the counter financial derivative instruments | | | (182 | ) | | | (6,695 | ) | | | (4,808 | ) |
| Foreign currency | | | 0 | | | | (42 | ) | | | (203 | ) |
Net Change in Unrealized (Appreciation) Depreciation | | | | | | | | | | | | |
| Investments in securities | | | 18,235 | | | | 25,227 | | | | 99,193 | |
| Exchange-traded or centrally cleared financial derivative instruments | | | 3,634 | | | | 2,398 | | | | (19,495 | ) |
| Over the counter financial derivative instruments | | | 11 | | | | 15,077 | | | | 437 | |
| Foreign currency assets and liabilities | | | 0 | | | | (111 | ) | | | (549 | ) |
| Net amortization (accretion) on investments | | | (479 | ) | | | (554 | ) | | | 4,809 | |
| | | |
| Net Cash Provided by (Used for) Operating Activities | | | 6,775 | | | | 9,362 | | | | 65,770 | |
| | | |
| Cash Flows Received from (Used for) Financing Activities: | | | | | | | | | | | | |
| | | |
| Increase (decrease) in overdraft due to custodian | | | 3 | | | | 5 | | | | 0 | |
| Cash distributions paid* | | | (10,200 | ) | | | (8,163 | ) | | | (24,286 | ) |
| Proceeds from reverse repurchase agreements | | | 355,893 | | | | 349,997 | | | | 1,534,904 | |
| Payments on reverse repurchase agreements | | | (353,127 | ) | | | (352,277 | ) | | | (1,577,988 | ) |
| | | |
| Net Cash Received from (Used for) Financing Activities | | | (7,431 | ) | | | (10,438 | ) | | | (67,370 | ) |
| | | |
| Net Increase (Decrease) in Cash and Foreign Currency | | | (656 | ) | | | (1,076 | ) | | | (1,600 | ) |
| | | |
| Cash and Foreign Currency: | | | | | | | | | | | | |
| | | |
| Beginning of year | | | 656 | | | | 1,560 | | | | 3,781 | |
| End of year | | $ | 0 | | | $ | 484 | | | $ | 2,181 | |
| | | |
| * Reinvestment of distributions | | $ | 1,056 | | | $ | 1,057 | | | $ | 3,008 | |
| | | |
| Supplemental Disclosure of Cash Flow Information: | | | | | | | | | | | | |
| | | |
| Interest expense paid during the year | | $ | 595 | | | $ | 326 | | | $ | 1,011 | |
| Non Cash Payment in Kind | | $ | 111 | | | $ | 331 | | | $ | 464 | |
| A zero balance may reflect actual amounts rounding to less than one thousand. |
A Statement of Cash Flows is presented when a Fund has a significant amount of borrowing during the year, based on the average total borrowing outstanding in relation to total assets or when substantially all of a Fund’s investments are not classified as Level 1 or 2 in the fair value hierarchy.
| | | | | |
Consolidated Statements of Cash Flows | | | | |
| | | | | | | | | | | | | |
| Year or period Ended June 30, 2022 | | | | | | | | | |
| (Amounts in thousands†) | | | | | | | | PIMCO
Dynamic
Income
Opportunities
Fund | |
| | | | |
Cash Flows Provided by (Used for) Operating Activities: | | | | | | | | | | | | |
| | | | |
| Net increase (decrease) in net assets resulting from operations | | $ | (102,478 | ) | | $ | (706,619 | ) | | $ | (361,469 | ) |
| | | | |
Adjustments to Reconcile Net Increase (Decrease) in Net Assets from Operations to Net Cash Provided by (Used for) Operating Activities: | | | | | | | | | | | | |
| | | | |
| Purchases of long-term securities | | | (1,433,526 | ) | | | (2,038,441 | ) | | | (1,711,573 | ) |
| Proceeds from sales of long-term securities | | | 143,566 | | | | 2,254,052 | | | | 2,293,748 | |
| (Purchases) Proceeds from sales of short-term portfolio investments, net | | | (82,999 | ) | | | (291,948 | ) | | | (127,713 | ) |
| (Increase) decrease in deposits with counterparty | | | (27,543 | ) | | | (167,432 | ) | | | (42,714 | ) |
| (Increase) decrease in receivable for investments sold | | | (26,354 | ) | | | (289,374 | ) | | | 397,637 | |
| (Increase) decrease in interest and/or dividends receivable | | | (11,028 | ) | | | (68,839 | ) | | | (2,104 | ) |
| Proceeds from (Payments on) exchange-traded or centrally cleared financial derivative instruments | | | (2,874 | ) | | | (4,216 | ) | | | (11,982 | ) |
| Proceeds from (Payments on) over the counter financial derivative instruments | | | 997 | | | | 79,462 | | | | 55,359 | |
| (Increase) decrease in other assets | | | 0 | | | | (500 | ) | | | (16 | ) |
| Increase (decrease) in payable for investments purchased | | | 126,606 | | | | 25,121 | | | | (437,340 | ) |
| Increase (decrease) in payable for unfunded loan commitments | | | 4,714 | | | | 39,831 | | | | (2,079 | ) |
| Increase (decrease) in deposits from counterparty | | | 5,155 | | | | 30,366 | | | | (19,891 | ) |
| Increase (decrease) in accrued management fees | | | 1,216 | | | | 4,913 | | | | (714 | ) |
| Proceeds from (Payments on) short sales transactions, net | | | 0 | | | | 1,926 | | | | (132 | ) |
| Proceeds from (Payments on) foreign currency transactions | | | 2,944 | | | | 1,015 | | | | (1,816 | ) |
| Increase (decrease) in other liabilities | | | 2 | | | | 561 | | | | (81 | ) |
| | | | | | | | | | | | |
| Investments in securities | | | 2,574 | | | | (99,563 | ) | | | (15,641 | ) |
| Exchange-traded or centrally cleared financial derivative instruments | | | 436 | | | | 5,144 | | | | 13,403 | |
| Over the counter financial derivative instruments | | | (2,782 | ) | | | (78,652 | ) | | | (55,517 | ) |
| Short sales | | | 0 | | | | 0 | | | | 132 | |
| Foreign currency | | | (1,231 | ) | | | (100 | ) | | | 1,741 | |
Net Change in Unrealized (Appreciation) Depreciation | | | | | | | | | | | | |
| Investments in securities | | | 122,802 | | | | 1,417,224 | | | | 600,202 | |
| Investments in Affiliates | | | 0 | | | | (77,137 | ) | | | 0 | |
| Exchange-traded or centrally cleared financial derivative instruments | | | 2,352 | | | | (1,711 | ) | | | (1,120 | ) |
| Over the counter financial derivative instruments | | | (139 | ) | | | (6,732 | ) | | | 10,932 | |
| Foreign currency assets and liabilities | | | (1,713 | ) | | | (12,256 | ) | | | (3,127 | ) |
| Net amortization (accretion) on investments | | | (2,300 | ) | | | (62,023 | ) | | | (14,286 | ) |
Net (decrease) from Reorganization (b) | | | 0 | | | | (228,260 | ) | | | 0 | |
| | | | |
Net Cash Provided by (Used for) Operating Activities | | | (1,281,603 | ) | | | (274,188 | ) | | | 563,839 | |
| | | | |
Cash Flows Received from (Used for) Financing Activities: | | | | | | | | | | | | |
| | | | |
Net proceeds from offering | | | 866,100 | | | | 183,021 | | | | 0 | |
| Net proceeds from equity offering | | | 13,562 | | | | 0 | | | | 0 | |
| | | 0 | | | | 429 | | | | 0 | |
| Increase (decrease) in overdraft due to custodian | | | 0 | | | | 0 | | | | 21,614 | |
| Cash distributions paid to common shareholders* | | | (15,398 | ) | | | (317,600 | ) | | | (181,160 | ) |
| Proceeds from reverse repurchase agreements | | | 699,595 | | | | 13,077,199 | | | | 7,732,927 | |
| Payments on reverse repurchase agreements | | | (278,305 | ) | | | (12,667,078 | ) | | | (8,145,847 | ) |
| | | | |
Net Cash Received from (Used for) Financing Activities | | | 1,285,554 | | | | 275,971 | | | | (572,466 | ) |
| | | | |
Net Increase (Decrease) in Cash and Foreign Currency | | | 3,951 | | | | 1,783 | | | | (8,627 | ) |
| | | | |
Cash and Foreign Currency: | | | | | | | | | | | | |
| Beginning of year or period | | | 0 | | | | 6,061 | | | | 13,418 | |
| End of year or period | | $ | 3,951 | | | $ | 7,844 | | | $ | 4,791 | |
| | | | |
| * Reinvestment of distributions | | $ | 0 | | | $ | 39,631 | | | $ | 27,950 | |
| | | | |
Supplemental Disclosure of Cash Flow Information: | | | | | | | | | | | | |
| | | | |
| Interest expense paid during the year or period | | $ | 358 | | | $ | 16,542 | | | $ | 11,810 | |
| Non Cash Payment in Kind | | $ | 140 | | | $ | 15,917 | | | $ | 6,238 | |
| A zero balance may reflect actual amounts rounding to less than one thousand. |
A Statement of Cash Flows is presented when a Fund has a significant amount of borrowing during the year or period, based on the average total borrowing outstanding in relation to total assets or when substantially all of a Fund’s investments are not classified as Level 1 or 2 in the fair value hierarchy.
| Inception date of the Fund was January 31, 2022. |
| Includes cash, accruals, assets, and liabilities received in connection with Reorganization. Please see Note 16 — Reorganization in the Notes to Financial Statements for additional information about the Reorganization. |
(Amounts in thousands*, except number of shares, contracts, units and ounces, if any)
| | | | | | | | | | | | | |
| | | | | | | | | | | |
INVESTMENTS IN SECURITIES 190.9% | |
| | |
LOAN PARTICIPATIONS AND ASSIGNMENTS 26.7% | |
| |
AAdvantage Loyalty IP Ltd. | |
5.813% (LIBOR03M + 4.750%)
due 04/20/2028 ~ | | $ | | | 800 | | | $ | | | 766 | |
| |
| |
| | | | | 2,731 | | | | | | 2,540 | |
| |
| |
7.166% (LIBOR01M + 5.500%)
due 09/01/2027 ~ | | | | | 419 | | | | | | 396 | |
| |
Caesars Resort Collection LLC | |
4.416% (LIBOR01M + 2.750%)
due 12/23/2024 ~ | | | | | 2,109 | | | | | | 2,036 | |
5.166% (LIBOR01M + 3.500%)
due 07/21/2025 ~ | | | | | 298 | | | | | | 288 | |
| |
| |
6.127% (LIBOR06M + 3.250%)
due 10/18/2028 «~ | | | | | 177 | | | | | | 159 | |
| |
Clear Channel Outdoor Holdings, Inc. | |
4.739% (LIBOR03M + 3.500%)
due 08/21/2026 ~ | | | | | 1,423 | | | | | | 1,225 | |
| |
Encina Private Credit LLC | |
5.598% (LIBOR01M + 4.274%)
due 11/30/2025 «~µ | | | | | 2,573 | | | | | | 2,509 | |
| |
Envision Healthcare Corp. | |
| | | | | 215 | | | | | | 213 | |
| | | | | 1,185 | | | | | | 1,170 | |
| |
| |
7.750% (LIBOR03M + 6.750%)
due 10/08/2026 «~ | | | | | 1,338 | | | | | | 1,345 | |
| |
Forbes Energy Services LLC (7.000% PIK) | |
7.000% due 09/30/2022 «(b) | | | | | 514 | | | | | | 0 | |
| |
| |
4.666% (LIBOR01M + 3.000%)
due 06/28/2024 «~ | | | | | 27 | | | | | | 17 | |
| |
Lealand Finance Co. BV (2.666% Cash and 3.000% PIK) | |
5.666% (LIBOR01M + 1.000%)
due 06/30/2025 ~(b) | | | | | 195 | | | | | | 100 | |
| |
| |
5.166% (LIBOR01M + 3.500%)
due 02/12/2027 ~ | | | | | 699 | | | | | | 640 | |
| |
| |
5.934% (LIBOR03M + 4.750%)
due 04/27/2028 ~ | | | | | 1,239 | | | | | | 1,074 | |
| |
Rising Tide Holdings, Inc. | |
6.416% (LIBOR01M + 4.750%)
due 06/01/2028 ~ | | | | | 1,089 | | | | | | 955 | |
| |
| |
4.813% (LIBOR03M + 3.750%)
due 10/20/2027 ~ | | | | | 300 | | | | | | 298 | |
| |
| |
| | | | | 755 | | | | | | 755 | |
| |
| |
| | | | | 1,627 | | | | | | 1,436 | |
| |
Team Health Holdings, Inc. | |
4.416% (LIBOR01M + 2.750%)
due 02/06/2024 ~ | | | | | 1,781 | | | | | | 1,591 | |
| |
| |
7.188% (LIBOR01M + 5.500%)
due 06/26/2026 «~ | | | | | 1,092 | | | | | | 761 | |
| |
| |
5.075% (LIBOR03M + 3.500%)
due 04/04/2025 ~ | | | | | 1,391 | | | | | | 1,338 | |
5.075% (LIBOR03M + 3.500%)
due 02/25/2027 ~ | | | | | 298 | | | | | | 286 | |
| |
| |
5.150% - 5.392% (LIBOR01M + 3.750%) due 04/21/2028 ~ | | | | | 792 | | | | | | 738 | |
| |
Univision Communications, Inc. | |
4.416% (LIBOR01M + 2.750%)
due 03/15/2024 ~ | | | | | 929 | | | | | | 914 | |
| |
Westmoreland Mining Holdings LLC (15.000% PIK) | |
15.000% due 03/15/2029 (b) | | | | | 806 | | | | | | 484 | |
| | | | | | | | | | | | |
| | | | | PRINCIPAL
AMOUNT
(000S) | | | | | MARKET
VALUE
(000S) | |
|
| |
7.916% (LIBOR01M + 6.250%)
due 09/21/2027 ~ | | $ | | | 167 | | | $ | | | 157 | |
| | | | | | | | | | | | |
Total Loan Participations and Assignments (Cost $27,422) | | | | |
| | | | |
| |
CORPORATE BONDS & NOTES 31.3% | |
| |
| |
|
| |
| | | | | 51 | | | | | | 48 | |
|
| |
| | | | | 900 | | | | | | 888 | |
|
| |
6.000% due 01/15/2030 (i) | | | | | 1,065 | | | | | | 738 | |
7.875% due 02/15/2025 (i) | | | | | 2,420 | | | | | | 2,343 | |
|
| |
3.875% due 02/15/2029 (i) | | | | | 200 | | | | | | 172 | |
4.500% due 09/01/2026 (i) | | | | | 200 | | | | | | 184 | |
5.750% due 02/01/2027 (i) | | | | | 900 | | | | | | 856 | |
|
Voyager Aviation Holdings LLC | |
8.500% due 05/09/2026 (i) | | | | | 2,205 | | | | | | 1,973 | |
| | | | | | | | | | | | |
| | | | | | | | | | | 7,202 | |
| | | | | | | | | | | | |
| |
| |
|
| |
5.750% due 04/20/2029 (i) | | | | | 1,300 | | | | | | 1,114 | |
|
| |
5.705% due 05/01/2040 (i) | | | | | 193 | | | | | | 180 | |
5.805% due 05/01/2050 (i) | | | | | 129 | | | | | | 119 | |
5.930% due 05/01/2060 (i) | | | | | 310 | | | | | | 283 | |
|
| |
3.137% due 11/15/2035 (i) | | | | | 100 | | | | | | 76 | |
3.187% due 11/15/2036 (i) | | | | | 100 | | | | | | 76 | |
|
| |
10.500% due 02/01/2026 (i) | | | | | 100 | | | | | | 100 | |
|
| |
10.250% due 05/01/2030 (i) | | | | | 400 | | | | | | 329 | |
|
Charter Communications Operating LLC | |
3.500% due 03/01/2042 (i) | | | | | 200 | | | | | | 139 | |
3.850% due 04/01/2061 (i) | | | | | 200 | | | | | | 132 | |
3.950% due 06/30/2062 (i) | | | | | 1,000 | | | | | | 670 | |
4.400% due 12/01/2061 (i) | | | | | 400 | | | | | | 288 | |
4.800% due 03/01/2050 (i) | | | | | 41 | | | | | | 33 | |
|
Community Health Systems, Inc. | |
8.000% due 03/15/2026 (i) | | | | | 78 | | | | | | 71 | |
|
| |
5.880% due 01/10/2028 (i) | | | | | 770 | | | | | | 811 | |
|
| |
5.250% due 12/01/2026 (i) | | | | | 660 | | | | | | 519 | |
5.750% due 12/01/2028 (i) | | | | | 400 | | | | | | 297 | |
|
| |
| | | | | 17 | | | | | | 6 | |
|
| |
| | | | | 350 | | | | | | 350 | |
|
Frontier Communications Holdings LLC | |
6.000% due 01/15/2030 (i) | | | | | 274 | | | | | | 212 | |
|
Noble Corp. PLC (11.000% Cash or 15.000% PIK) | |
11.000% due 02/15/2028 (b) | | | | | 9 | | | | | | 10 | |
|
| |
4.100% due 03/25/2061 (g)(i) | | | | | 100 | | | | | | 71 | |
|
Prime Healthcare Services, Inc. | |
7.250% due 11/01/2025 (i) | | | | | 100 | | | | | | 86 | |
|
Royal Caribbean Cruises Ltd. | |
9.125% due 06/15/2023 (i) | | | | | 100 | | | | | | 99 | |
|
| |
3.950% due 06/15/2023 (i) | | | | | 520 | | | | | | 488 | |
|
| |
4.875% due 09/30/2039 (i) | | | | | 291 | | | | | | 252 | |
5.750% due 09/30/2039 (i) | | | | | 1,974 | | | | | | 1,795 | |
|
| |
| | | | | 17 | | | | | | 16 | |
| | | | | | | | | | | | |
| | | | | PRINCIPAL
AMOUNT
(000S) | | | | | MARKET
VALUE
(000S) | |
|
| |
| | $ | | | 51 | | | $ | | | 38 | |
|
| |
| | | | | 12 | | | | | | 4 | |
|
| |
7.500% due 05/15/2025 (i) | | | | | 500 | | | | | | 496 | |
|
| |
4.625% due 04/15/2029 (i) | | | | | 1,500 | | | | | | 1,277 | |
|
| |
13.000% due 05/15/2025 (i) | | | | | 1,000 | | | | | | 1,026 | |
|
Viking Ocean Cruises Ship Ltd. | |
5.625% due 02/15/2029 (i) | | | | | 1,200 | | | | | | 948 | |
|
Wesco Aircraft Holdings, Inc. (7.500% Cash and 3.000% PIK) | |
10.500% due 11/15/2026 «(b)(i) | | | | | 4,118 | | | | | | 3,908 | |
|
| |
7.750% due 08/15/2028 (i) | | | | | 1,552 | | | | | | 1,254 | |
|
| |
5.000% due 01/15/2030 (i) | | | | | 1,100 | | | | | | 925 | |
| | | | | | | | | | | | |
| | | | | | | | | | | 18,498 | |
| | | | | | | | | | | | |
| |
| |
|
Pacific Gas & Electric Co. | |
| | | | | 2 | | | | | | 1 | |
| | | | | 2 | | | | | | 2 | |
4.200% due 03/01/2029 (i) | | | | | 500 | | | | | | 447 | |
4.300% due 03/15/2045 (i) | | | | | 463 | | | | | | 337 | |
| | | | | 22 | | | | | | 17 | |
4.500% due 07/01/2040 (i) | | | | | 53 | | | | | | 41 | |
4.500% due 12/15/2041 (i) | | | | | 26 | | | | | | 19 | |
| | | | | 9 | | | | | | 7 | |
4.750% due 02/15/2044 (i) | | | | | 1,471 | | | | | | 1,130 | |
4.950% due 07/01/2050 (i) | | | | | 826 | | | | | | 660 | |
|
Southern California Edison Co. | |
4.875% due 03/01/2049 (i) | | | | | 40 | | | | | | 36 | |
|
| |
| | | | | 19 | | | | | | 17 | |
| | | | | | | | | | | | |
| | | | | | | | | | | 2,714 | |
| | | | | | | | | | | | |
Total Corporate Bonds & Notes (Cost $32,864) | | | | |
| | | | |
| |
CONVERTIBLE BONDS & NOTES 0.6% | |
| |
| |
|
Multiplan Corp. (6.000% Cash or 7.000% PIK) | |
6.000% due 10/15/2027 (b)(i) | | | | | 700 | | | | | | 579 | |
| | | | | | | | | | | | |
Total Convertible Bonds & Notes (Cost $686) | | | | |
| | | | |
| |
MUNICIPAL BONDS & NOTES 1.3% | |
| |
| |
|
Commonwealth of Puerto Rico Bonds, Series 2022 | |
0.000% due 11/01/2043 (e) | | | | | 1,496 | | | | | | 746 | |
0.000% due 11/01/2051 (e) | | | | | 200 | | | | | | 86 | |
|
Commonwealth of Puerto Rico General Obligation Bonds, Series 2021 | |
0.000% due 07/01/2033 (e) | | | | | 76 | | | | | | 43 | |
| | | | | 59 | | | | | | 55 | |
| | | | | 53 | | | | | | 48 | |
| | | | | 46 | | | | | | 41 | |
| | | | | 45 | | | | | | 39 | |
|
Commonwealth of Puerto Rico General Obligation Notes, Series 2021 | |
0.000% due 07/01/2024 (e) | | | | | 30 | | | | | | 28 | |
| | | | | 66 | | | | | | 67 | |
| | | | | | | | | | | | |
Total Municipal Bonds & Notes (Cost $1,256) | | | | |
| | | | |
| |
U.S. GOVERNMENT AGENCIES 4.6% | |
|
| |
4.000% due 06/25/2050 (a)(i) | | | | | 3,444 | | | | | | 674 | |
| | | | | 230 | | | | | | 246 | |
| | | | | | |
| 30 | | PIMCO CLOSED-END FUNDS | | | See Accompanying Notes | |
| | | | | | | | | | | | |
| | | | | PRINCIPAL
AMOUNT
(000S) | | | | | MARKET
VALUE
(000S) | |
|
| |
0.700% due 11/25/2055 ~(a) | | $ | | | 6,094 | | | $ | | | 517 | |
2.079% due 11/25/2045 ~(a) | | | | | 1,027 | | | | | | 95 | |
3.500% due 02/25/2041 (a)(i) | | | | | 2,052 | | | | | | 266 | |
4.000% due 07/25/2050 (a)(i) | | | | | 6,320 | | | | | | 1,386 | |
4.526% due 05/25/2050 •(a)(i) | | | | | 1,815 | | | | | | 271 | |
5.000% due 03/15/2040 (a)(i) | | | | | 644 | | | | | | 39 | |
| | | | | 250 | | | | | | 258 | |
| | | | | 445 | | | | | | 435 | |
| | | | | | | | | | | | |
Total U.S. Government Agencies (Cost $4,192) | | | | |
| | | | |
| |
NON-AGENCY MORTGAGE-BACKED SECURITIES 41.9% | |
|
Adjustable Rate Mortgage Trust | |
| | | | | 61 | | | | | | 55 | |
|
Banc of America Alternative Loan Trust | |
| | | | | 84 | | | | | | 76 | |
|
Banc of America Funding Trust | |
| | | | | 226 | | | | | | 145 | |
| | | | | 43 | | | | | | 37 | |
| | | | | 42 | | | | | | 46 | |
| | | | | 340 | | | | | | 249 | |
|
Banc of America Mortgage Trust | |
| | | | | 210 | | | | | | 208 | |
| | | | | 39 | | | | | | 36 | |
|
Bancorp Commercial Mortgage Trust | |
5.074% due 08/15/2032 •(i) | | | | | 2,126 | | | | | | 2,111 | |
|
| |
| | | | | 79 | | | | | | 69 | |
|
| |
1.964% (US0001M + 0.340%) due 04/25/2037 ~ | | | | | 419 | | | | | | 385 | |
| | | | | 66 | | | | | | 65 | |
| | | | | 502 | | | | | | 283 | |
| | | | | 23 | | | | | | 14 | |
| | | | | 31 | | | | | | 26 | |
| | | | | 126 | | | | | | 117 | |
| | | | | 196 | | | | | | 113 | |
| | | | | 106 | | | | | | 81 | |
|
Bear Stearns Commercial Mortgage Securities Trust | |
| | | | | 47 | | | | | | 45 | |
|
| |
4.262% due 08/15/2036 •(i) | | | | | 588 | | | | | | 548 | |
|
CBA Commercial Small Balance Commercial Mortgage | |
| | | | | 127 | | | | | | 116 | |
|
| |
| | | | | 66 | | | | | | 60 | |
|
Chase Mortgage Finance Trust | |
| | | | | 165 | | | | | | 97 | |
|
Citigroup Commercial Mortgage Trust | |
| | | | | 426 | | | | | | 190 | |
|
Citigroup Mortgage Loan Trust | |
| | | | | 11 | | | | | | 10 | |
3.055% due 11/25/2035 ~(i) | | | | | 1,168 | | | | | | 718 | |
| | | | | 647 | | | | | | 341 | |
|
Citigroup Mortgage Loan Trust, Inc. | |
| | | | | 275 | | | | | | 179 | |
|
Citigroup Mortgage Loan Trust, Inc. Mortgage Pass-Through Certificates | |
| | | | | 70 | | | | | | 55 | |
|
Commercial Mortgage Lease-Backed Certificates | |
6.250% due 06/20/2031 ~(i) | | | | | 1,700 | | | | | | 1,668 | |
|
Commercial Mortgage Loan Trust | |
| | | | | 195 | | | | | | 33 | |
|
Connecticut Avenue Securities Trust | |
4.026% due 10/25/2041 •(i) | | | | | 800 | | | | | | 689 | |
|
Countrywide Alternative Loan Trust | |
1.476% due 12/25/2035 •(i) | | | | | 636 | | | | | | 553 | |
2.174% due 10/25/2037 •(i) | | | | | 3,613 | | | | | | 920 | |
| | | | | 133 | | | | | | 109 | |
2.204% (US0001M + 0.580%) due 02/25/2036 ^~ | | | | | 409 | | | | | | 381 | |
| | | | | 385 | | | | | | 200 | |
| | | | | 163 | | | | | | 39 | |
6.000% due 04/25/2036 ^(i) | | | | | 2,184 | | | | | | 1,262 | |
| | | | | | | | | | | | |
| | | | | PRINCIPAL
AMOUNT
(000S) | | | | | MARKET
VALUE
(000S) | |
|
Countrywide Home Loan Mortgage Pass-Through Trust | |
| | $ | | | 3 | | | $ | | | 3 | |
| | | | | 75 | | | | | | 65 | |
| | | | | 193 | | | | | | 176 | |
| | | | | 69 | | | | | | 62 | |
3.494% due 03/25/2046 ^•(i) | | | | | 373 | | | | | | 252 | |
| | | | | 183 | | | | | | 97 | |
|
Credit Suisse Commercial Mortgage Trust | |
| | | | | 1,497 | | | | | | 157 | |
|
Credit Suisse First Boston Mortgage Securities Corp. | |
| | | | | 34 | | | | | | 34 | |
|
Credit Suisse Mortgage Capital Mortgage-Backed Trust | |
6.000% due 07/25/2036 (i) | | | | | 927 | | | | | | 557 | |
| | | | | 156 | | | | | | 92 | |
| | | | | 147 | | | | | | 67 | |
|
| |
0.201% due 10/15/2036 ~(a)(i) | | | | | 147,870 | | | | | | 632 | |
3.374% due 06/15/2033 •(i) | | | | | 900 | | | | | | 844 | |
| | | | | 200 | | | | | | 181 | |
|
Extended Stay America Trust | |
5.025% due 07/15/2038 •(i) | | | | | 894 | | | | | | 862 | |
|
First Horizon Alternative Mortgage Securities Trust | |
| | | | | 7 | | | | | | 1 | |
|
| |
8.426% due 10/25/2041 •(i) | | | | | 1,100 | | | | | | 949 | |
8.726% (SOFR30A + 7.800%) due 11/25/2041 ~(i) | | | | | 1,100 | | | | | | 927 | |
|
GS Mortgage Securities Corp. Trust | |
4.744% due 10/10/2032 ~(i) | | | | | 800 | | | | | | 768 | |
| | | | | 100 | | | | | | 95 | |
|
GS Mortgage Securities Trust | |
0.583% due 08/10/2043 ~(a) | | | | | 1,826 | | | | | | 14 | |
|
| |
2.736% due 03/25/2047 ^~(i) | | | | | 618 | | | | | | 433 | |
|
HarborView Mortgage Loan Trust | |
2.112% (US0001M + 0.500%) due 01/19/2036 ~ | | | | | 414 | | | | | | 265 | |
|
IndyMac INDA Mortgage Loan Trust | |
| | | | | 115 | | | | | | 94 | |
|
IndyMac INDX Mortgage Loan Trust | |
| | | | | 61 | | | | | | 55 | |
| | | | | 98 | | | | | | 63 | |
|
JP Morgan Alternative Loan Trust | |
6.500% due 03/25/2036 ^(i) | | | | | 775 | | | | | | 520 | |
|
JP Morgan Chase Commercial Mortgage Securities Corp. | |
1.630% due 03/12/2039 ~(a) | | | | | 2 | | | | | | 0 | |
|
JP Morgan Chase Commercial Mortgage Securities Trust | |
0.507% due 02/15/2046 ~(a)(i) | | | | | 54,519 | | | | | | 169 | |
| | | | | 35 | | | | | | 154 | |
7.715% (US0001M + 6.390%) due 11/15/2038 ~(i) | | | | | 900 | | | | | | 836 | |
|
| |
| | | | | 12 | | | | | | 12 | |
|
| |
| | | | | 116 | | | | | | 85 | |
| | | | | 30 | | | | | | 34 | |
|
MASTR Adjustable Rate Mortgages Trust | |
| | | | | 237 | | | | | | 160 | |
|
MASTR Asset Securitization Trust | |
6.000% (US0001M + 6.000%) due 06/25/2036 ^~ | | | | | 160 | | | | | | 120 | |
|
Merrill Lynch Mortgage Investors Trust | |
| | | | | 24 | | | | | | 22 | |
| | | | | 54 | | | | | | 49 | |
| | | | | 3 | | | | | | 3 | |
| | | | | 46 | | | | | | 45 | |
| | | | | 2 | | | | | | 2 | |
|
| |
4.334% due 12/25/2066 ~(i) | | | | | 1,000 | | | | | | 819 | |
|
Morgan Stanley Capital Trust | |
0.415% due 11/12/2049 ~(a) | | | | | 4,522 | | | | | | 0 | |
| | | | | 400 | | | | | | 372 | |
|
Morgan Stanley Mortgage Loan Trust | |
| | | | | 192 | | | | | | 162 | |
| | | | | 143 | | | | | | 70 | |
| | | | | | | | | | | | |
| | | | | PRINCIPAL
AMOUNT
(000S) | | | | | MARKET
VALUE
(000S) | |
|
Morgan Stanley Resecuritization Trust | |
3.313% due 03/26/2037 ~(i) | | $ | | | 1,880 | | | $ | | | 1,714 | |
|
Mortgage Equity Conversion Asset Trust | |
| | | | | 122 | | | | | | 115 | |
|
Natixis Commercial Mortgage Securities Trust | |
5.223% due 03/15/2035 •(i) | | | | | 350 | | | | | | 338 | |
6.472% (TSFR1M + 5.193%) due 03/15/2035 ~(i) | | | | | 700 | | | | | | 674 | |
|
New Residential Mortgage Loan Trust | |
3.878% due 11/25/2059 ~(i) | | | | | 2,900 | | | | | | 1,808 | |
|
Nomura Asset Acceptance Corp. Alternative Loan Trust | |
2.694% due 02/25/2035 •(i) | | | | | 241 | | | | | | 240 | |
|
| |
| | | | | 12 | | | | | | 12 | |
|
Residential Accredit Loans, Inc. Trust | |
| | | | | 174 | | | | | | 143 | |
| | | | | 134 | | | | | | 119 | |
| | | | | 72 | | | | | | 62 | |
| | | | | 133 | | | | | | 115 | |
|
Residential Asset Securitization Trust | |
| | | | | 182 | | | | | | 74 | |
|
Residential Funding Mortgage Securities, Inc. Trust | |
| | | | | 101 | | | | | | 89 | |
|
Structured Adjustable Rate Mortgage Loan Trust | |
| | | | | 173 | | | | | | 116 | |
| | | | | 183 | | | | | | 122 | |
| | | | | 33 | | | | | | 30 | |
|
Structured Asset Mortgage Investments Trust | |
| | | | | 462 | | | | | | 438 | |
|
TBW Mortgage-Backed Trust | |
| | | | | 106 | | | | | | 50 | |
|
Tharaldson Hotel Portfolio Trust | |
4.600% (US0001M + 3.480%) due 11/11/2034 ~(i) | | | | | 1,126 | | | | | | 1,027 | |
|
Wachovia Bank Commercial Mortgage Trust | |
1.145% due 10/15/2041 ~(a) | | | | | 25 | | | | | | 0 | |
|
WaMu Mortgage Pass-Through Certificates Trust | |
1.723% (COF 11 + 1.500%) due 10/25/2046 ~(i) | | | | | 782 | | | | | | 719 | |
1.723% due 11/25/2046 •(i) | | | | | 464 | | | | | | 427 | |
2.524% due 10/25/2045 •(i) | | | | | 2,518 | | | | | | 2,053 | |
2.604% (US0001M + 0.980%) due 06/25/2044 ~ | | | | | 184 | | | | | | 174 | |
| | | | | 169 | | | | | | 159 | |
|
Washington Mutual Mortgage Pass-Through Certificates Trust | |
6.500% due 08/25/2036 ^(i) | | | | | 705 | | | | | | 603 | |
|
Wells Fargo Commercial Mortgage Trust | |
5.092% due 12/15/2039 ~(i) | | | | | 1,042 | | | | | | 970 | |
|
| |
3.715% due 11/10/2036 ~(i) | | | | | 2,400 | | | | | | 1,850 | |
| | | | | | | | | | | | |
Total Non-Agency Mortgage-Backed Securities (Cost $41,276) | | | | |
| | | | |
| |
ASSET-BACKED SECURITIES 59.1% | |
|
AIM Aviation Finance Ltd. | |
6.213% due 02/15/2040 þ(i) | | | | | 1,227 | | | | | | 1,004 | |
|
Asset-Backed Securities Corp. Home Equity Loan Trust | |
2.719% due 02/25/2035 •(i) | | | | | 1,594 | | | | | | 1,574 | |
4.862% (US0001M + 3.250%) due 06/21/2029 ~ | | | | | 61 | | | | | | 60 | |
|
Bear Stearns Asset-Backed Securities Trust | |
2.194% due 04/25/2036 •(i) | | | | | 1,982 | | | | | | 2,691 | |
| | | | | 74 | | | | | | 74 | |
| | | | | 32 | | | | | | 24 | |
|
Bombardier Capital Mortgage Securitization Corp. | |
| | | | | 1,185 | | | | | | 200 | |
|
Citigroup Mortgage Loan Trust | |
1.784% due 12/25/2036 •(i) | | | | | 1,125 | | | | | | 648 | |
1.844% (US0001M + 0.220%) due 12/25/2036 ~(i) | | | | | 679 | | | | | | 287 | |
2.299% due 11/25/2045 •(i) | | | | | 399 | | | | | | 398 | |
2.324% due 11/25/2046 •(i) | | | | | 1,100 | | | | | | 959 | |
| | | | | | | | | | | | |
| See Accompanying Notes | | | ANNUAL REPORT | | | | | | | JUNE 30, 2022 | | | 31 |
| | | | | | | | | | | | |
| | | | | PRINCIPAL
AMOUNT
(000S) | | | | | MARKET
VALUE
(000S) | |
|
Conseco Finance Securitizations Corp. | |
| | $ | | | 326 | | | $ | | | 117 | |
| | | | | 735 | | | | | | 666 | |
|
Countrywide Asset-Backed Certificates Trust | |
1.774% (US0001M + 0.150%) due 04/25/2047 ^~(i) | | | | | 125 | | | | | | 125 | |
1.824% (US0001M + 0.200%) due 06/25/2037 ^~(i) | | | | | 534 | | | | | | 539 | |
1.884% due 12/25/2036 ^•(i) | | | | | 788 | | | | | | 716 | |
1.894% (US0001M + 0.270%) due 09/25/2046 ~(i) | | | | | 4,123 | | | | | | 3,404 | |
2.104% due 05/25/2036 •(i) | | | | | 7,983 | | | | | | 6,591 | |
3.274% due 06/25/2035 •(i) | | | | | 4,000 | | | | | | 3,924 | |
3.499% (US0001M + 1.875%) due 10/25/2035 ~(i) | | | | | 2,168 | | | | | | 1,668 | |
|
| |
| | | | | 128 | | | | | | 119 | |
| | | | | 184 | | | | | | 177 | |
|
Flagship Credit Auto Trust | |
0.000% due 06/15/2026 «(e) | | | | | 2 | | | | | | 152 | |
0.000% due 06/15/2029 «(e) | | | | | 14 | | | | | | 5,062 | |
|
GE Capital Mortgage Services, Inc. Trust | |
| | | | | 35 | | | | | | 29 | |
|
| |
3.424% (US0001M + 1.800%) due 06/25/2035 ~(i) | | | | | 2,200 | | | | | | 2,148 | |
4.249% (US0001M + 2.625%) due 12/25/2034 ~(i) | | | | | 2,151 | | | | | | 1,691 | |
|
Home Equity Mortgage Loan Asset-Backed Trust | |
1.864% due 04/25/2037 •(i) | | | | | 3,528 | | | | | | 2,452 | |
|
HSI Asset Securitization Corp. Trust | |
1.734% (US0001M + 0.110%) due 04/25/2037 ~(i) | | | | | 3,018 | | | | | | 1,646 | |
|
| |
0.000% due 07/16/2029 «(e) | | | | | 5 | | | | | | 366 | |
0.000% due 03/15/2030 «(e) | | | | | 8 | | | | | | 630 | |
|
MASTR Asset-Backed Securities Trust | |
1.844% (US0001M + 0.220%) due 08/25/2036 ~(i) | | | | | 2,619 | | | | | | 1,121 | |
|
Morgan Stanley ABS Capital, Inc. Trust | |
1.764% due 10/25/2036 •(i) | | | | | 8,396 | | | | | | 4,274 | |
2.404% (US0001M + 0.780%) due 12/25/2034 ~ | | | | | 107 | | | | | | 103 | |
|
Morgan Stanley Home Equity Loan Trust | |
2.689% due 05/25/2035 •(i) | | | | | 1,917 | | | | | | 1,520 | |
|
National Collegiate Commutation Trust | |
| | | | | 3,500 | | | | | | 1,067 | |
|
People’s Financial Realty Mortgage Securities Trust | |
| | | | | 1,406 | | | | | | 320 | |
|
Renaissance Home Equity Loan Trust | |
7.238% due 09/25/2037 ^þ(i) | | | | | 3,443 | | | | | | 1,696 | |
|
Securitized Asset-Backed Receivables LLC Trust | |
| | | | | 439 | | | | | | 429 | |
|
SMB Private Education Loan Trust | |
0.000% due 02/16/2055 «(e) | | | | | 0 | | | | | | 336 | |
5.950% due 02/16/2055 (i) | | | | | 228 | | | | | | 224 | |
| | | | | | | | | | | | |
| | | | | PRINCIPAL
AMOUNT
(000S) | | | | | MARKET
VALUE
(000S) | |
|
SoFi Professional Loan Program LLC | |
0.000% due 01/25/2039 «(e) | | $ | | | 1,000 | | | $ | | | 94 | |
|
Sofi Professional Loan Program LLC | |
0.000% due 05/25/2040 (e) | | | | | 1,000 | | | | | | 134 | |
|
SoFi Professional Loan Program LLC | |
0.000% due 09/25/2040 «(e) | | | | | 339 | | | | | | 55 | |
|
Structured Asset Investment Loan Trust | |
3.349% due 10/25/2034 •(i) | | | | | 1,986 | | | | | | 1,905 | |
6.124% (US0001M + 4.500%) due 10/25/2033 ~ | | | | | 68 | | | | | | 72 | |
|
UCFC Manufactured Housing Contract | |
| | | | | 98 | | | | | | 88 | |
| | | | | | | | | | | | |
Total Asset-Backed Securities (Cost $56,717) | | | | |
| | | | |
| |
| | | | | SHARES | | | | | | |
| |
| |
COMMUNICATION SERVICES 0.5% | |
| | | | |
Clear Channel Outdoor Holdings, Inc. (c) | | | | | 108,013 | | | | | | 116 | |
| | | | |
iHeartMedia, Inc. ‘A’ (c) | | | | | 25,745 | | | | | | 203 | |
| | | | |
iHeartMedia, Inc. ‘B’ «(c) | | | | | 20,009 | | | | | | 142 | |
| | | | | | | | | | | | |
| | | | | | | | | | | 461 | |
| | | | | | | | | | | | |
| |
| |
| | | | |
Axis Energy Services ‘A’ «(c)(g) | | | | | 3,344 | | | | | | 49 | |
| | | | |
| | | | | 2,563 | | | | | | 65 | |
| | | | | | | | | | | | |
| | | | | | | | | | | 114 | |
| | | | | | | | | | | | |
| |
| |
| | | |
Mcdermott International Ltd. «(c) | | | 7,216 | | | | | | 4 | |
| | | |
Neiman Marcus Group Ltd. LLC «(c)(g) | | | 13,191 | | | | | | 2,280 | |
| | | |
Syniverse Holdings, Inc. «(c)(g) | | | 309,949 | | | | | | 304 | |
| | | |
Voyager Aviation Holdings LLC «(c) | | | 307 | | | | | | 0 | |
| | | |
Westmoreland Mining Holdings «(c)(g) | | | 9,231 | | | | | | 0 | |
| | | | | | | | | | | | |
| | | | | | | | | | | 2,588 | |
| | | | | | | | | | | | |
| |
| |
| | | |
Associated Materials Group, Inc. «(c) | | | 294,140 | | | | | | 68 | |
| | | | | | | | | | | | |
| |
| |
| | | | |
| | | | | 9,914 | | | | | | 248 | |
| | | | | | | | | | | | |
Total Common Stocks (Cost $3,249) | | | | |
| | | | |
| |
| | | | | | | | | | | | |
| | | | | | | | | | | |
| |
| |
| |
| | | | |
Sequa Corp. - Exp. 04/28/2024 « | | | | | 118,000 | | | $ | | | 71 | |
| | | | | | | | | | | | |
| |
INFORMATION TECHNOLOGY 1.0% | |
| | | | |
Windstream Holdings LLC -
Exp. 9/21/2055 « | | | | | 43,518 | | | | | | 928 | |
| | | | | | | | | | | | |
Total Warrants (Cost $316) | | | | |
| | | | |
| |
PREFERRED SECURITIES 5.4% | |
| |
| |
|
| |
5.159% (US0003M + 3.330%) due 09/15/2022 ~(f) | | | | | 53,000 | | | | | | 47 | |
|
Sequa Corp. (15.000% PIK) | |
| | | | | 3,788 | | | | | | 4,297 | |
|
Voyager Aviation Holdings LLC | |
| | | | | 1,842 | | | | | | 557 | |
| | | | | | | | | | | | |
Total Preferred Securities (Cost $2,841) | | | | |
| | | | |
| |
REAL ESTATE INVESTMENT TRUSTS 3.2% | |
| |
| |
| | | | |
CBL & Associates Properties, Inc. | | | | | 4,345 | | | | | | 102 | |
| | | | |
| | | | | 46,851 | | | | | | 441 | |
| | | | |
| | | | | 78,005 | | | | | | 2,324 | |
| | | | | | | | | | | | |
Total Real Estate Investment Trusts (Cost $1,353) | | | | |
| | | | |
| | | | | | | | | | | | |
| | | | | | | | | | | |
SHORT-TERM INSTRUMENTS 11.9% | |
| |
REPURCHASE AGREEMENTS (h) 10.5% | |
| | | | | | | | | 9,475 | |
| | | | | | | | | | | | |
| |
| |
1.015% due 07/14/2022 -
09/15/2022 (d)(e)(i)(l) | | $ | | | 1,238 | | | | | | 1,236 | |
| | | | | | | | | | | | |
Total Short-Term Instruments
(Cost $10,712) | | | | |
| | | | |
| | | | |
| | | | | | | | | | | | |
Total Investments in Securities
(Cost $182,884) | | | | |
| | | | |
| | | | | | | | | | | | |
Total Investments 190.9%
(Cost $182,884) | | | $ | | | | |
| |
Financial Derivative Instruments (j)(k) (0.1)% (Cost or Premiums, net $1,162) | | | | | | | | | | | | |
| |
Other Assets and Liabilities, net (90.8)% | | | | |
| | | | |
| | | $ | | | | |
| | | | | | | |
NOTES TO SCHEDULE OF INVESTMENTS:
| A zero balance may reflect actual amounts rounding to less than one thousand. |
| Security valued using significant unobservable inputs (Level 3). |
| All or a portion of this amount represents unfunded loan commitments. The interest rate for the unfunded portion will be determined at the time of funding. See Note 4, Securities and Other Investments, in the Notes to Financial Statements for more information regarding unfunded loan commitments. |
| Variable or Floating rate security. Rate shown is the rate in effect as of period end. Certain variable rate securities are not based on a published reference rate and spread, rather are determined by the issuer or agent and are based on current market conditions. Reference rate is as of reset date, which may vary by security. These securities may not indicate a reference rate and/or spread in their description. |
| Rate shown is the rate in effect as of period end. The rate may be based on a fixed rate, a capped rate or a floor rate and may convert to a variable or floating rate in the future. These securities do not indicate a reference rate and spread in their description. |
| Coupon represents a rate which changes periodically based on a predetermined schedule or event. Rate shown is the rate in effect as of period end. |
| | | | | | |
| 32 | | PIMCO CLOSED-END FUNDS | | | See Accompanying Notes | |
| Security is an Interest Only (“IO”) or IO Strip. |
| Security did not produce income within the last twelve months. |
| Coupon represents a weighted average yield to maturity. |
| Perpetual maturity; date shown, if applicable, represents next contractual call date. |
(g) RESTRICTED SECURITIES:
| | | | | | | | | | | | | | | | | | | | | | | | |
| | | | | | | | | | | | | | | | | Market Value
as Percentage
of Net Assets | |
| | | | | | | | | | | 07/01/2021 | | | $ | 49 | | | $ | 49 | | | | 0.05% | |
Neiman Marcus Group Ltd. LLC | | | | | | | | | | | 09/25/2020 | | | | 425 | | | | 2,280 | | | | 2.52 | |
| | | | | | | | | | | | | | | 27 | | | | 65 | | | | 0.07 | |
Oracle Corp. 4.100% due 03/25/2061 | | | | | | | | | | | 08/12/2021 | | | | 109 | | | | 71 | | | | 0.08 | |
| | | | | | | | | | | 05/12/2022 | | | | 304 | | | | 304 | | | | 0.33 | |
Westmoreland Mining Holdings | | | | | | | | | | | 12/08/2014 | | | | 269 | | | | 0 | | | | 0.00 | |
| | | | | | | | | | | | | | | | | | | | | | | | |
| | | $ | 1,183 | | | $ | 2,769 | | | | 3.05% | |
| | | | | | | | | | | | | | | | | | | | | | | | |
BORROWINGS AND OTHER FINANCING TRANSACTIONS
(h) REPURCHASE AGREEMENTS:
| | | | | | | | | | | | | | | | | | | | | | | | | | | | | | |
| | | | | | | | | | | | | | | | | | | Repurchase
Agreements,
at Value | | | Repurchase Agreement Proceeds to be Received (1) | |
| FICC | | | 0.400 | % | | | 06/30/2022 | | | | 07/01/2022 | | | $ | 275 | | | U.S. Treasury Notes 3.000% due 06/30/2024 | | $ | (281 | ) | | $ | 275 | | | $ | 275 | |
| JPS | | | 1.400 | | | | 06/30/2022 | | | | 07/01/2022 | | | | 9,200 | | | U.S. Treasury Bonds 2.375% due 05/15/2051 | | | (9,431 | ) | | | 9,200 | | | | 9,200 | |
| | | | | | | | | | | | | | | | | | | | | | | | | | | | | | |
Total Repurchase Agreements | | | | | | | | | | | | | | | |
| | | | | | | | | | | | | | | | | | | | | | | | | | | | | | |
REVERSE REPURCHASE AGREEMENTS:
| | | | | | | | | | | | | | | | | | | | | | | | |
| | | | | | | | | | | | | | Payable for
Reverse
Repurchase
Agreements | |
| | | 2.330 | % | | | 06/07/2022 | | | | 09/07/2022 | | | $ | | | | | (605 | ) | | $ | (606 | ) |
| | | 2.100 | | | | 05/16/2022 | | | | 08/16/2022 | | | | | | | | (5,486 | ) | | | (5,501 | ) |
| | | 1.880 | | | | 06/10/2022 | | | | 09/12/2022 | | | | | | | | (1,645 | ) | | | (1,647 | ) |
| | | 2.210 | | | | 06/14/2022 | | | | 10/12/2022 | | | | | | | | (1,435 | ) | | | (1,435 | ) |
| | | 2.370 | | | | 06/28/2022 | | | | 07/28/2022 | | | | | | | | (178 | ) | | | (178 | ) |
| | | 2.410 | | | | 06/14/2022 | | | | 10/12/2022 | | | | | | | | (1,571 | ) | | | (1,571 | ) |
| | | 1.000 | | | | 01/11/2022 | | | | 07/11/2022 | | | | | | | | (4,738 | ) | | | (4,760 | ) |
| | | 1.250 | | | | 03/16/2022 | | | | 09/16/2022 | | | | | | | | (618 | ) | | | (621 | ) |
| | | 1.250 | | | | 03/18/2022 | | | | 09/16/2022 | | | | | | | | (271 | ) | | | (272 | ) |
| | | 1.420 | | | | 04/11/2022 | | | | 09/23/2022 | | | | | | | | (660 | ) | | | (662 | ) |
| | | 1.690 | | | | 04/18/2022 | | | | 10/17/2022 | | | | | | | | (1,020 | ) | | | (1,023 | ) |
| | | 1.830 | | | | 05/13/2022 | | | | 08/12/2022 | | | | | | | | (495 | ) | | | (496 | ) |
| | | 1.940 | | | | 04/01/2022 | | | | 10/03/2022 | | | | | | | | (3,277 | ) | | | (3,293 | ) |
| | | 1.970 | | | | 06/02/2022 | | | | 09/01/2022 | | | | | | | | (900 | ) | | | (902 | ) |
| | | 2.000 | | | | 06/06/2022 | | | | 09/02/2022 | | | | | | | | (1,129 | ) | | | (1,130 | ) |
| | | 2.030 | | | | 06/03/2022 | | | | 09/02/2022 | | | | | | | | (158 | ) | | | (159 | ) |
| | | 2.050 | | | | 06/03/2022 | | | | 09/02/2022 | | | | | | | | (4,808 | ) | | | (4,816 | ) |
| | | 2.510 | | | | 06/23/2022 | | | | 12/19/2022 | | | | | | | | (3,523 | ) | | | (3,525 | ) |
| | | 2.540 | | | | 06/17/2022 | | | | 09/19/2022 | | | | | | | | (291 | ) | | | (291 | ) |
| | | 2.810 | | | | 06/03/2022 | | | | 12/02/2022 | | | | | | | | (1,680 | ) | | | (1,683 | ) |
| | | 2.910 | | | | 06/10/2022 | | | | 12/09/2022 | | | | | | | | (757 | ) | | | (759 | ) |
| | | (1.000 | ) | | | 06/17/2022 | | | | TBD | | | | | | | | (293 | ) | | | (293 | ) |
| | | 1.650 | | | | 04/07/2022 | | | | 07/07/2022 | | | | | | | | (2,224 | ) | | | (2,233 | ) |
| | | 1.875 | | | | 04/27/2022 | | | | 08/01/2022 | | | | | | | | (828 | ) | | | (830 | ) |
| | | 1.950 | | | | 05/06/2022 | | | | 08/08/2022 | | | | | | | | (297 | ) | | | (298 | ) |
| | | 1.990 | | | | 06/03/2022 | | | | 07/05/2022 | | | | | | | | (949 | ) | | | (950 | ) |
| | | 2.040 | | | | 06/03/2022 | | | | 07/05/2022 | | | | | | | | (656 | ) | | | (657 | ) |
| | | 2.160 | | | | 06/06/2022 | | | | 09/07/2022 | | | | | | | | (1,401 | ) | | | (1,403 | ) |
| | | 2.160 | | | | 06/15/2022 | | | | 07/18/2022 | | | | | | | | (159 | ) | | | (159 | ) |
| | | 2.170 | | | | 06/10/2022 | | | | 09/14/2022 | | | | | | | | (583 | ) | | | (584 | ) |
| | | 2.220 | | | | 06/10/2022 | | | | 09/14/2022 | | | | | | | | (1,659 | ) | | | (1,661 | ) |
| | | 2.300 | | | | 05/31/2022 | | | | 08/31/2022 | | | | | | | | (652 | ) | | | (653 | ) |
| | | | | | | | | | | | |
| See Accompanying Notes | | | ANNUAL REPORT | | | | | | | JUNE 30, 2022 | | | 33 |
| | | | | | | | | | | | | | | | | | | | | | | | |
| Counterparty | | | | | Settlement
Date | | | Maturity
Date | | | | | | Payable for
Reverse
Repurchase
Agreements | |
| | | 2.310 | % | | | 06/06/2022 | | | | 09/07/2022 | | | $ | | | | | (547 | ) | | $ | (548 | ) |
| | | 2.630 | | | | 06/15/2022 | | | | 09/15/2022 | | | | | | | | (258 | ) | | | (258 | ) |
| | | 2.800 | | | | 06/24/2022 | | | | 09/27/2022 | | | | | | | | (458 | ) | | | (458 | ) |
| | | 2.850 | | | | 06/23/2022 | | | | 09/23/2022 | | | | | | | | (1,453 | ) | | | (1,454 | ) |
| | | 3.000 | | | | 06/23/2022 | | | | 09/23/2022 | | | | | | | | (1,199 | ) | | | (1,200 | ) |
| | | 2.500 | | | | 06/16/2022 | | | | 09/16/2022 | | | | | | | | (2,259 | ) | | | (2,261 | ) |
| | | 1.250 | | | | 04/29/2022 | | | | 07/20/2022 | | | | | | | | (338 | ) | | | (339 | ) |
| | | 2.170 | | | | 05/27/2022 | | | | 08/29/2022 | | | | | | | | (1,833 | ) | | | (1,837 | ) |
| | | 1.450 | | | | 04/21/2022 | | | | 07/22/2022 | | | | | | | | (769 | ) | | | (771 | ) |
| | | 2.680 | | | | 06/14/2022 | | | | 09/15/2022 | | | | | | | | (4,600 | ) | | | (4,606 | ) |
| | | 0.940 | | | | 01/10/2022 | | | | 07/11/2022 | | | | | | | | (718 | ) | | | (721 | ) |
| | | 2.420 | | | | 06/24/2022 | | | | 09/26/2022 | | | | | | | | (144 | ) | | | (145 | ) |
| | | 2.370 | | | | 05/10/2022 | | | | 08/12/2022 | | | | | | | | (2,911 | ) | | | (2,916 | ) |
| | | 0.670 | | | | 01/07/2022 | | | | 07/06/2022 | | | | | | | | (38 | ) | | | (39 | ) |
| | | 0.670 | | | | 01/07/2022 | | | | 07/08/2022 | | | | | | | | (91 | ) | | | (91 | ) |
| | | 1.580 | | | | 05/03/2022 | | | | 08/03/2022 | | | | | | | | (635 | ) | | | (637 | ) |
| | | 1.630 | | | | 05/05/2022 | | | | 08/05/2022 | | | | | | | | (1,088 | ) | | | (1,091 | ) |
| | | 1.750 | | | | 06/17/2022 | | | | TBD | | | | | | | | (423 | ) | | | (423 | ) |
| | | 1.830 | | | | 06/17/2022 | | | | TBD | | | | | | | | (521 | ) | | | (521 | ) |
| | | 2.000 | | | | 05/06/2022 | | | | 08/05/2022 | | | | | | | | (663 | ) | | | (665 | ) |
| | | 2.060 | | | | 06/13/2022 | | | | 09/12/2022 | | | | | | | | (973 | ) | | | (974 | ) |
| | | 2.181 | | | | 05/24/2022 | | | | 08/24/2022 | | | | | | | | (580 | ) | | | (581 | ) |
| | | 1.720 | | | | 06/17/2022 | | | | TBD | | | | | | | | (520 | ) | | | (521 | ) |
| | | 1.750 | | | | 06/17/2022 | | | | TBD | | | | | | | | (1,036 | ) | | | (1,037 | ) |
| | | 1.760 | | | | 06/17/2022 | | | | TBD | | | | | | | | (246 | ) | | | (246 | ) |
| | | 1.800 | | | | 06/17/2022 | | | | TBD | | | | | | | | (93 | ) | | | (93 | ) |
| | | 1.300 | | | | 04/01/2022 | | | | 07/01/2022 | | | | | | | | (78 | ) | | | (78 | ) |
| | | 1.530 | | | | 04/25/2022 | | | | 07/25/2022 | | | | | | | | (91 | ) | | | (91 | ) |
| | | 1.570 | | | | 04/07/2022 | | | | 07/07/2022 | | | | | | | | (3,624 | ) | | | (3,637 | ) |
| | | 1.600 | | | | 04/08/2022 | | | | 07/08/2022 | | | | | | | | (6,200 | ) | | | (6,223 | ) |
| | | 1.690 | | | | 05/05/2022 | | | | 08/05/2022 | | | | | | | | (640 | ) | | | (642 | ) |
| | | 1.750 | | | | 06/17/2022 | | | | TBD | | | | | | | | (115 | ) | | | (115 | ) |
| | | 1.850 | | | | 06/17/2022 | | | | TBD | | | | | | | | (3,151 | ) | | | (3,153 | ) |
| | | 1.900 | | | | 06/17/2022 | | | | TBD | | | | | | | | (774 | ) | | | (775 | ) |
| | | 1.950 | | | | 06/17/2022 | | | | TBD | | | | | | | | (78 | ) | | | (78 | ) |
| | | 2.450 | | | | 06/17/2022 | | | | 09/19/2022 | | | | | | | | (146 | ) | | | (146 | ) |
| | | 2.700 | | | | 07/01/2022 | | | | 10/03/2022 | | | | | | | | (70 | ) | | | (70 | ) |
| | | | | | | | | | | | | | | | | | | | | | | | |
Total Reverse Repurchase Agreements | | | | | | | | | | | | | | | | | |
| | | | | | | | | | | | | | | | | | | | | | | | |
BORROWINGS AND OTHER FINANCING TRANSACTIONS SUMMARY
The following is a summary by counterparty of the market value of Borrowings and Other Financing Transactions and collateral pledged/(received) as of June 30, 2022:
| | | | | | | | | | | | | | | | | | | | | | | | |
| | Repurchase Agreement Proceeds to be Received (1) | | | Payable for
Reverse
Repurchase
Agreements | | | Payable for Sale-Buyback Transactions | | | Total
Borrowings and
Other Financing
Transactions | | | Collateral
Pledged/(Received) | | | | |
Global/Master Repurchase Agreement | |
| | $ | 0 | | | $ | (606 | ) | | $ | 0 | | | $ | (606 | ) | | $ | 836 | | | $ | 230 | |
| | | 0 | | | | (5,501 | ) | | | 0 | | | | (5,501 | ) | | | 6,764 | | | | 1,263 | |
| | | 0 | | | | (4,831 | ) | | | 0 | | | | (4,831 | ) | | | 5,947 | | | | 1,116 | |
| | | 0 | | | | (24,392 | ) | | | 0 | | | | (24,392 | ) | | | 30,690 | | | | 6,298 | |
| | | 0 | | | | (13,639 | ) | | | 0 | | | | (13,639 | ) | | | 17,200 | | | | 3,561 | |
| | | 0 | | | | (2,261 | ) | | | 0 | | | | (2,261 | ) | | | 2,635 | | | | 374 | |
| | | 0 | | | | (339 | ) | | | 0 | | | | (339 | ) | | | 380 | | | | 41 | |
| | | 275 | | | | 0 | | | | 0 | | | | 275 | | | | (281 | ) | | | (6 | ) |
| | | 0 | | | | (1,837 | ) | | | 0 | | | | (1,837 | ) | | | 2,398 | | | | 561 | |
| | | 9,200 | | | | 0 | | | | 0 | | | | 9,200 | | | | (9,431 | ) | | | (231 | ) |
| | | 0 | | | | (771 | ) | | | 0 | | | | (771 | ) | | | 809 | | | | 38 | |
| | | 0 | | | | (4,606 | ) | | | 0 | | | | (4,606 | ) | | | 6,102 | | | | 1,496 | |
| | | 0 | | | | (721 | ) | | | 0 | | | | (721 | ) | | | 863 | | | | 142 | |
| | | 0 | | | | (145 | ) | | | 0 | | | | (145 | ) | | | 152 | | | | 7 | |
| | | 0 | | | | (2,916 | ) | | | 0 | | | | (2,916 | ) | | | 3,679 | | | | 763 | |
| | | 0 | | | | (5,022 | ) | | | 0 | | | | (5,022 | ) | | | 5,752 | | | | 730 | |
| | | 0 | | | | (1,897 | ) | | | 0 | | | | (1,897 | ) | | | 1,997 | | | | 100 | |
| | | 0 | | | | (15,008 | ) | | | 0 | | | | (15,008 | ) | | | 18,498 | | | | 3,490 | |
| | | | | | | | | | | | | | | | | | | | | | | | |
Total Borrowings and Other Financing Transactions | | | | | | | | | | | | | | | | | | | | | | | | |
| | | | | | | | | | | | | | | | | | | | | | | | |
CERTAIN TRANSFERS ACCOUNTED FOR AS SECURED BORROWINGS
Remaining Contractual Maturity of the Agreements
| | | | | | | | | | | | | | | | | | | | |
| | | | | | | | | | | | | | | | |
Reverse Repurchase Agreements | |
| | $ | (78 | ) | | $ | (1,490 | ) | | $ | (14,885 | ) | | $ | (8,278 | ) | | $ | (24,731 | ) |
| | | 0 | | | | 0 | | | | (2,262 | ) | | | 0 | | | | (2,262 | ) |
Non-Agency Mortgage-Backed Securities | | | 0 | | | | (6,059 | ) | | | (15,209 | ) | | | (1,683 | ) | | | (22,951 | ) |
| | | 0 | | | | (13,300 | ) | | | (10,133 | ) | | | (10,583 | ) | | | (34,016 | ) |
Convertible Bonds & Notes | | | 0 | | | | 0 | | | | (462 | ) | | | 0 | | | | (462 | ) |
| | | | | | | | | | | | | | | | | | | | |
| | | | | | | | | | | | | | | | | | | | |
| | | | | | | | | | | | | | | | | | | | |
Payable for reverse repurchase agreements (5) | | | | | |
| | | | | |
| Securities with an aggregate market value of $102,991 and cash of $1,711 have been pledged as collateral under the terms of the above master agreements as of June 30, 2022. |
| Includes accrued interest. |
| The average amount of borrowings outstanding during the period ended June 30, 2022 was $(82,501) at a weighted average interest rate of 0.841%. Average borrowings may include reverse repurchase agreements and sale-buyback transactions, if held during the period. |
| Open maturity reverse repurchase agreement. |
| Net Exposure represents the net receivable/(payable) that would be due from/to the counterparty in the event of default. Exposure from borrowings and other financing transactions can only be netted across transactions governed under the same master agreement with the same legal entity. See Note 8, Master Netting Arrangements, in the Notes to Financial Statements for more information. |
| Unsettled reverse repurchase agreements liability of $(70) is outstanding at period end. |
(j) FINANCIAL DERIVATIVE INSTRUMENTS: EXCHANGE-TRADED OR CENTRALLY CLEARED
SWAP AGREEMENTS:
CREDIT DEFAULT SWAPS ON CORPORATE ISSUES - SELL PROTECTION
(1)
| | | | | | | | | | | | | | | | | | | | | | | | | | | | | | | | | | | | | | |
| | | | | | | | | | Implied Credit Spread at June 30, 2022 (2) | | | | | | | | | Unrealized
Appreciation/
(Depreciation) | | | | | | | |
| | | | | | |
| | | 1.000 | % | | Quarterly | | | 06/20/2027 | | | | 2.538 | % | | $ | 100 | | | $ | (5 | ) | | $ | (1 | ) | | $ | (6 | ) | | $ | 0 | | | $ | 0 | |
Ford Motor Credit Co. LLC | | | 5.000 | | | Quarterly | | | 06/20/2027 | | | | 4.319 | | | | 800 | | | | 84 | | | | (61 | ) | | | 23 | | | | 0 | | | | (3 | ) |
| | | | | | | | | | | | | | | | | | | | | | | | | | | | | | | | | | | | | | |
| | | | | | | | | | | | | $ | 79 | | | $ | (62 | ) | | $ | 17 | | | $ | 0 | | | $ | (3 | ) |
| | | | | | | | | | | | | | | | | | | | | | | | | | | | | | | | | | | | | | |
INTEREST RATE SWAPS
| | | | | | | | | | | | | | | | | | | | | | | | | | | | | | | | | | | | |
| | | | | | | | | | | | | | | | | | Unrealized
Appreciation/
(Depreciation) | | | Market
Value | | | | |
| | | | | | |
| | | | | 0.100 | % | | Annual | | | 01/13/2023 | | | $ | 2,500 | | | $ | 0 | | | $ | 39 | | | $ | 39 | | | $ | 0 | | | $ | 0 | |
| | | | | 1.750 | | | Annual | | | 06/15/2052 | | | | 3,400 | | | | 426 | | | | 193 | | | | 619 | | | | 0 | | | | (30 | ) |
| | | | | 2.750 | | | | | | 12/19/2023 | | | | 15,300 | | | | (131 | ) | | | 8 | | | | (123 | ) | | | 21 | | | | 0 | |
| | | | | 1.750 | | | Semi-Annual | | | 12/21/2023 | | | | 32,300 | | | | 606 | | | | (1,337 | ) | | | (731 | ) | | | 42 | | | | 0 | |
| | | | | 0.250 | | | Semi-Annual | | | 06/16/2024 | | | | 500 | | | | 1 | | | | 28 | | | | 29 | | | | 0 | | | | (1 | ) |
| | | | | 1.250 | | | Semi-Annual | | | 12/15/2026 | | | | 200 | | | | (1 | ) | | | (14 | ) | | | (15 | ) | | | 1 | | | | 0 | |
| | | | | 1.750 | | | Semi-Annual | | | 12/21/2026 | | | | 3,200 | | | | 77 | | | | (254 | ) | | | (177 | ) | | | 17 | | | | 0 | |
| | | | | 1.350 | | | Semi-Annual | | | 01/20/2027 | | | | 1,200 | | | | 0 | | | | 83 | | | | 83 | | | | 0 | | | | (7 | ) |
| | | | | 1.550 | | | Semi-Annual | | | 01/20/2027 | | | | 5,500 | | | | (19 | ) | | | (308 | ) | | | (327 | ) | | | 31 | | | | 0 | |
| | | | | 1.360 | | | Semi-Annual | | | 02/15/2027 | | | | 850 | | | | 0 | | | | 59 | | | | 59 | | | | 0 | | | | (5 | ) |
| | | | | 1.600 | | | Semi-Annual | | | 02/15/2027 | | | | 3,400 | | | | (12 | ) | | | (187 | ) | | | (199 | ) | | | 20 | | | | 0 | |
| | | | | 1.450 | | | Semi-Annual | | | 02/17/2027 | | | | 1,400 | | | | 0 | | | | 92 | | | | 92 | | | | 0 | | | | (8 | ) |
| | | | | 1.700 | | | Semi-Annual | | | 02/17/2027 | | | | 5,500 | | | | (21 | ) | | | (275 | ) | | | (296 | ) | | | 32 | | | | 0 | |
| | | | | 0.500 | | | Semi-Annual | | | 06/16/2028 | | | | 140 | | | | (7 | ) | | | (13 | ) | | | (20 | ) | | | 1 | | | | 0 | |
| | | | | 1.500 | | | Semi-Annual | | | 12/15/2028 | | | | 400 | | | | 2 | | | | 34 | | | | 36 | | | | 0 | | | | (3 | ) |
| | | | | 1.500 | | | Semi-Annual | | | 01/12/2029 | | | | 908 | | | | 0 | | | | 79 | | | | 79 | | | | 0 | | | | (6 | ) |
| | | | | 1.700 | | | Semi-Annual | | | 01/12/2029 | | | | 3,300 | | | | (13 | ) | | | (233 | ) | | | (246 | ) | | | 22 | | | | 0 | |
| | | | | 3.000 | | | Semi-Annual | | | 06/19/2029 | | | | 7,800 | | | | 630 | | | | (657 | ) | | | (27 | ) | | | 55 | | | | 0 | |
| | | | | 1.250 | | | Semi-Annual | | �� | 06/17/2030 | | | | 4,150 | | | | 186 | | | | (719 | ) | | | (533 | ) | | | 30 | | | | 0 | |
| | | | | 1.000 | | | Semi-Annual | | | 12/16/2030 | | | | 627 | | | | (15 | ) | | | 112 | | | | 97 | | | | 0 | | | | (5 | ) |
| | | | | 1.370 | | | Semi-Annual | | | 07/19/2031 | | | | 100 | | | | 0 | | | | 13 | | | | 13 | | | | 0 | | | | (1 | ) |
| | | | | | | | | | | | |
| See Accompanying Notes | | | ANNUAL REPORT | | | | | | | JUNE 30, 2022 | | | 35 |
| | | | | | | | | | | | | | | | | | | | | | | | | | | | | | | | | | | | |
Pay/Receive
Floating Rate | | Floating Rate Index | | Fixed Rate | | | Payment
Frequency | | Maturity
Date | | | Notional
Amount | | | Premiums
Paid/(Received) | | | Unrealized
Appreciation/
(Depreciation) | | | Market
Value | | | Variation Margin | |
| | Asset | | | Liability | |
| | | | | 1.360 | % | | Semi-Annual | | | 07/20/2031 | | | $ | 100 | | | $ | 0 | | | $ | 13 | | | $ | 13 | | | $ | 0 | | | $ | (1 | ) |
| | | | | 3.000 | | | Semi-Annual | | | 12/19/2038 | | | | 5,200 | | | | 18 | | | | 96 | | | | 114 | | | | 0 | | | | (45 | ) |
| | | | | 2.000 | | | Semi-Annual | | | 01/15/2050 | | | | 100 | | | | (1 | ) | | | 19 | | | | 18 | | | | 0 | | | | (1 | ) |
| | | | | 1.625 | | | Semi-Annual | | | 01/16/2050 | | | | 400 | | | | 0 | | | | 102 | | | | 102 | | | | 0 | | | | (3 | ) |
| | | | | 1.750 | | | Semi-Annual | | | 01/22/2050 | | | | 700 | | | | (4 | ) | | | 165 | | | | 161 | | | | 0 | | | | (6 | ) |
| | | | | 1.625 | | | | | | 02/03/2050 | | | | 400 | | | | (2 | ) | | | 104 | | | | 102 | | | | 0 | | | | (3 | ) |
| | | | | 1.450 | | | Semi-Annual | | | 04/07/2051 | | | | 1,300 | | | | 0 | | | | 383 | | | | 383 | | | | 0 | | | | (8 | ) |
| | | | | 1.650 | | | Semi-Annual | | | 04/08/2051 | | | | 2,200 | | | | 0 | | | | (560 | ) | | | (560 | ) | | | 15 | | | | 0 | |
| | | | | | | | | | | | | | | | | | | | | | | | | | | | | | | | | | | | |
| | | $ | 1,720 | | | $ | (2,935 | ) | | $ | (1,215 | ) | | $ | 287 | | | $ | (133 | ) |
| | | | | | | | | | | | | | | | | | | | | | | | | | | | | | | | | | | | |
| | | | | | | | | | | | | | | | | | | | | |
| | | | | | | | | | | | | | | | | | | | | | | | | | | | | | | | | | | | |
FINANCIAL DERIVATIVE INSTRUMENTS: EXCHANGE-TRADED OR CENTRALLY CLEARED SUMMARY
The following is a summary of the market value and variation margin of Exchange-Traded or Centrally Cleared Financial Derivative Instruments as of June 30, 2022:
| | | | | | | | | | | | | | | | | | | | | | | | | | | | | | | | | | | | |
| | | Financial Derivative Assets | | | | | | Financial Derivative Liabilities | |
| | | | | | | | | | | | | | | | | | Variation Margin
Liability | | | | |
| | | | | | | | | | | | | | | | | | | | | | | | | | | | |
Total Exchange-Traded or Centrally Cleared | | | | | | | | | | | | | | | | | | | | | | | | | | | | | | | | | | | | |
| | | | | | | | | | | | | | | | | | | | | | | | | | | | | | | | | | | | |
Cash of $1,856 has been pledged as collateral for exchange-traded and centrally cleared financial derivative instruments as of June 30, 2022. See Note 8, Master Netting Arrangements, in the Notes to Financial Statements for more information.
| If the Fund is a seller of protection and a credit event occurs, as defined under the terms of that particular swap agreement, the Fund will either (i) pay to the buyer of protection an amount equal to the notional amount of the swap and take delivery of the referenced obligation or underlying securities comprising the referenced index or (ii) pay a net settlement amount in the form of cash, securities or other deliverable obligations equal to the notional amount of the swap less the recovery value of the referenced obligation or underlying securities comprising the referenced index. |
| Implied credit spreads, represented in absolute terms, utilized in determining the market value of credit default swap agreements on issues as of period end serve as indicators of the current status of the payment/performance risk and represent the likelihood or risk of default for the credit derivative. The implied credit spread of a particular referenced entity reflects the cost of buying/selling protection and may include upfront payments required to be made to enter into the agreement. Wider credit spreads represent a deterioration of the referenced entity’s credit soundness and a greater likelihood or risk of default or other credit event occurring as defined under the terms of the agreement. |
| The maximum potential amount the Fund could be required to pay as a seller of credit protection or receive as a buyer of credit protection if a credit event occurs as defined under the terms of that particular swap agreement. |
| The prices and resulting values for credit default swap agreements serve as indicators of the current status of the payment/performance risk and represent the likelihood of an expected liability (or profit) for the credit derivative should the notional amount of the swap agreement be closed/sold as of the period end. Increasing market values, in absolute terms when compared to the notional amount of the swap, represent a deterioration of the underlying referenced instrument’s credit soundness and a greater likelihood or risk of default or other credit event occurring as defined under the terms of the agreement. |
(k) FINANCIAL DERIVATIVE INSTRUMENTS: OVER THE COUNTER
SWAP AGREEMENTS:
CREDIT DEFAULT SWAPS ON CREDIT INDICES - SELL PROTECTION
(1)
| | | | | | | | | | | | | | | | | | | | | | | | | | | | | | | | |
| Counterparty | | Index/Tranches | | | | | | | Maturity
Date | | | | | | | | | Unrealized
Appreciation/
(Depreciation) | | | Swap Agreements, at Value (3) | |
| | | | | | |
| GST | | | | | 0.320 | % | | Monthly | | | 07/25/2045 | | | $ | 2,020 | | | $ | (402 | ) | | $ | 265 | | | $ | 0 | | | $ | (137 | ) |
| | | | | 0.090 | | | Monthly | | | 08/25/2037 | | | | 612 | | | | (235 | ) | | | 165 | | | | 0 | | | | (70 | ) |
| | | | | | | | | | | | | | | | | | | | | | | | | | | | | | | | |
| | | | | | | | | | | | | | | | | |
| | | | | | | | | | | | | | | | | |
FINANCIAL DERIVATIVE INSTRUMENTS: OVER THE COUNTER SUMMARY
The following is a summary by counterparty of the market value of OTC financial derivative instruments and collateral pledged/(received) as of June 30, 2022:
| | | | | | | | | | | | | | | | | | | | | | | | | | | | | | | | | | | | | | | | | | | | | | | | |
| | | Financial Derivative Assets | | | | | | Financial Derivative Liabilities | | | | | | | | | | |
| | Forward
Foreign
Currency
Contracts | | | | | | | | | | | | | | | Forward
Foreign
Currency
Contracts | | | | | | | | | | | | Net Market
Value of OTC
Derivatives | | | Collateral
Pledged/Received | | | | |
| | $ | 0 | | | $ | 0 | | | $ | 0 | | | $ | 0 | | | | | | | $ | 0 | | | $ | 0 | | | $ | (207 | ) | | $ | (207 | ) | | $ | (207 | ) | | $ | 244 | | | $ | 37 | |
| | | | | | | | | | | | | | | | | | | | | | | | | | | | | | | | | | | | | | | | | | | | | | | | |
| | | | | | | | | | | | | | | | | | | | | | | | | | | | | | | | | | | | | | | | | | | | | | | | |
| | | | | | | | | | | | | | | | | | | | | | | | | | | | | | | | | | | | | | | | | | | | | | | | |
| Securities with an aggregate market value of $244 have been pledged as collateral for financial derivative instruments as governed by International Swaps and Derivatives Association, Inc. master agreements as of June 30, 2022. |
| If the Fund is a seller of protection and a credit event occurs, as defined under the terms of that particular swap agreement, the Fund will either (i) pay to the buyer of protection an amount equal to the notional amount of the swap and take delivery of the referenced obligation or underlying securities comprising the referenced index or (ii) pay a net settlement amount in the form of cash, securities or other deliverable obligations equal to the notional amount of the swap less the recovery value of the referenced obligation or underlying securities comprising the referenced index. |
| The maximum potential amount the Fund could be required to pay as a seller of credit protection or receive as a buyer of credit protection if a credit event occurs as defined under the terms of that particular swap agreement. |
| The prices and resulting values for credit default swap agreements serve as indicators of the current status of the payment/performance risk and represent the likelihood of an expected liability (or profit) for the credit derivative should the notional amount of the swap agreement be closed/sold as of the period end. Increasing market values, in absolute terms when compared to the notional amount of the swap, represent a deterioration of the underlying referenced instrument’s credit soundness and a greater likelihood or risk of default or other credit event occurring as defined under the terms of the agreement. |
| Net Exposure represents the net receivable/(payable) that would be due from/to the counterparty in the event of default. Exposure from OTC financial derivative instruments can only be netted across transactions governed under the same master agreement with the same legal entity. See Note 8, Master Netting Arrangements, in the Notes to Financial Statements for more information. |
FAIR VALUE OF FINANCIAL DERIVATIVE INSTRUMENTS
The following is a summary of the fair valuation of the Fund’s derivative instruments categorized by risk exposure. See Note 7, Principal and Other Risks, in the Notes to Financial Statements on risks of the Fund.
Fair Values of Financial Derivative Instruments on the Statements of Assets and Liabilities as of June 30, 2022:
| | | | | | | | | | | | | | | | | | | | | | | | |
| | | Derivatives not accounted for as hedging instruments | |
| | | | | | | | | | | | | | | | | | | |
Financial Derivative Instruments - Assets | |
Exchange-traded or centrally cleared | |
| | $ | 0 | | | $ | 0 | | | $ | 0 | | | $ | 0 | | | $ | 287 | | | $ | 287 | |
| | | | | | | | | | | | | | | | | | | | | | | | |
|
Financial Derivative Instruments - Liabilities | |
Exchange-traded or centrally cleared | |
| | $ | 0 | | | $ | 3 | | | $ | 0 | | | $ | 0 | | | $ | 133 | | | $ | 136 | |
| | | | | | | | | | | | | | | | | | | | | | | | |
| |
| | $ | 0 | | | $ | 207 | | | $ | 0 | | | $ | 0 | | | $ | 0 | | | $ | 207 | |
| | | | | | | | | | | | | | | | | | | | | | | | |
| | $ | 0 | | | $ | 210 | | | $ | 0 | | | $ | 0 | | | $ | 133 | | | $ | 343 | |
| | | | | | | | | | | | | | | | | | | | | | | | |
The effect of Financial Derivative Instruments on the Statements of Operations for the period ended June 30, 2022:
| | | | | | | | | | | | | | | | | | | | | | | | |
| | | Derivatives not accounted for as hedging instruments | |
| | | | | | | | | | | | | | | | | | | |
Net Realized Gain on Financial Derivative Instruments | |
Exchange-traded or centrally cleared | |
| | $ | 0 | | | $ | 7 | | | $ | 0 | | | $ | 0 | | | $ | 490 | | | $ | 497 | |
| | | | | | | | | | | | | | | | | | | | | | | | |
| |
| | $ | 0 | | | $ | 177 | | | $ | 0 | | | $ | 0 | | | $ | 5 | | | $ | 182 | |
| | | | | | | | | | | | | | | | | | | | | | | | |
| | $ | 0 | | | $ | 184 | | | $ | 0 | | | $ | 0 | | | $ | 495 | | | $ | 679 | |
| | | | | | | | | | | | | | | | | | | | | | | | |
|
Net Change in Unrealized (Depreciation) on Financial Derivative Instruments | |
Exchange-traded or centrally cleared | |
| | $ | 0 | | | $ | (60 | ) | | $ | 0 | | | $ | 0 | | | $ | (3,574 | ) | | $ | (3,634 | ) |
| | | | | | | | | | | | | | | | | | | | | | | | |
| |
| | $ | 0 | | | $ | (11 | ) | | $ | 0 | | | $ | 0 | | | $ | 0 | | | $ | (11 | ) |
| | | | | | | | | | | | | | | | | | | | | | | | |
| | $ | 0 | | | $ | (71 | ) | | $ | 0 | | | $ | 0 | | | $ | (3,574 | ) | | $ | (3,645 | ) |
| | | | | | | | | | | | | | | | | | | | | | | | |
| | | | | | | | | | | | |
| See Accompanying Notes | | | | | | | | | | JUNE 30, 2022 | | | |
FAIR VALUE MEASUREMENTS
The following is a summary of the fair valuations according to the inputs used as of June 30, 2022 in valuing the Fund’s assets and liabilities:
| | | | | | | | | | | | | | | | |
| | | | | | | | | | | | |
Investments in Securities, at Value | |
Loan Participations and Assignments | | $ | 0 | | | $ | 16,105 | | | $ | 8,086 | | | $ | 24,191 | |
| |
| | | 0 | | | | 7,202 | | | | 0 | | | | 7,202 | |
| | | 0 | | | | 14,590 | | | | 3,908 | | | | 18,498 | |
| | | 0 | | | | 2,714 | | | | 0 | | | | 2,714 | |
Convertible Bonds & Notes | |
| | | 0 | | | | 579 | | | | 0 | | | | 579 | |
| |
| | | 0 | | | | 1,153 | | | | 0 | | | | 1,153 | |
| | | 0 | | | | 4,187 | | | | 0 | | | | 4,187 | |
Non-Agency Mortgage-Backed Securities | | | 0 | | | | 37,949 | | | | 0 | | | | 37,949 | |
| | | 0 | | | | 46,884 | | | | 6,695 | | | | 53,579 | |
| |
| | | 319 | | | | 0 | | | | 142 | | | | 461 | |
| | | 65 | | | | 0 | | | | 49 | | | | 114 | |
| | | 0 | | | | 0 | | | | 2,588 | | | | 2,588 | |
| | | 0 | | | | 0 | | | | 68 | | | | 68 | |
| | | 0 | | | | 0 | | | | 248 | | | | 248 | |
| |
| | | 0 | | | | 0 | | | | 71 | | | | 71 | |
| | | 0 | | | | 0 | | | | 928 | | | | 928 | |
| |
| | | 0 | | | | 47 | | | | 4,854 | | | | 4,901 | |
| | | | | | | | | | | | | | | | |
| Category and Subcategory | | Level 1 | | | Level 2 | | | Level 3 | | | Fair
Value at
06/30/2022 | |
Real Estate Investment Trusts | |
| | $ | 2,867 | | | $ | 0 | | | $ | 0 | | | $ | 2,867 | |
| |
| | | 0 | | | | 9,475 | | | | 0 | | | | 9,475 | |
| | | 0 | | | | 1,236 | | | | 0 | | | | 1,236 | |
| | | | | | | | | | | | | | | | |
| | | | |
| | $ | 3,251 | | | $ | 142,121 | | | $ | 27,637 | | | $ | 173,009 | |
| | | | | | | | | | | | | | | | |
|
Financial Derivative Instruments - Assets | |
Exchange-traded or centrally cleared | | $ | 0 | | | $ | 287 | | | $ | 0 | | | $ | 287 | |
| | | | | | | | | | | | | | | | |
|
Financial Derivative Instruments - Liabilities | |
Exchange-traded or centrally cleared | | | 0 | | | | (136 | ) | | | 0 | | | | (136 | ) |
| | | 0 | | | | (207 | ) | | | 0 | | | | (207 | ) |
| | | | | | | | | | | | | | | | |
| | $ | 0 | | | $ | (343 | ) | | $ | 0 | | | $ | (343 | ) |
| | | | | | | | | | | | | | | | |
| | | | |
Total Financial Derivative Instruments | | $ | 0 | | | $ | (56 | ) | | $ | 0 | | | $ | (56 | ) |
| | | | | | | | | | | | | | | | |
| | | | |
| | $ | 3,251 | | | $ | 142,065 | | | $ | 27,637 | | | $ | 172,953 | |
| | | | | | | | | | | | | | | | |
The following is a reconciliation of the fair valuations using significant unobservable inputs (Level 3) for the Fund during the period ended June 30, 2022:
| | | | | | | | | | | | | | | | | | | | | | | | | | | | | | | | | | | | | | | | |
| | Beginning
Balance
at 06/30/2021 | | | | | | | | | Accrued
Discounts/
(Premiums) | | | | | | Net Change in
Unrealized
Appreciation/ | | | | | | | | | Ending
Balance
at 06/30/2022 | | | Net Change in Unrealized Appreciation/ (Depreciation) on Investments Held at 06/30/2022 (1) | |
Investments in Securities, at Value | |
Loan Participations and Assignments | | $ | 4,406 | | | $ | 6,161 | | | $ | (1,937 | ) | | $ | (57 | ) | | $ | (585 | ) | | $ | (179 | ) | | $ | 761 | | | $ | (484 | ) | | $ | 8,086 | | | $ | (1,128 | ) |
| |
| | | 0 | | | | 4,285 | | | | 0 | | | | 0 | | | | 0 | | | | (377 | ) | | | 0 | | �� | | 0 | | | | 3,908 | | | | (377 | ) |
| | | 2,930 | | | | 5,411 | | | | 0 | | | | 38 | | | | (1,820 | ) | | | 270 | | | | 0 | | | | (134 | ) | | | 6,695 | | | | (1,515 | ) |
| |
| | | 485 | | | | 0 | | | | 0 | | | | 0 | | | | 0 | | | | (343 | ) | | | 0 | | | | 0 | | | | 142 | | | | (343 | ) |
| | | 0 | | | | 49 | | | | 0 | | | | 0 | | | | 0 | | | | 0 | | | | 0 | | | | 0 | | | | 49 | | | | 0 | |
| | | 1,458 | | | | 304 | | | | 0 | | | | 0 | | | | 0 | | | | 822 | | | | 4 | | | | 0 | | | | 2,588 | | | | 822 | |
| | | 2,083 | | | | 0 | | | | (2,025 | ) | | | 0 | | | | 157 | | | | (147 | ) | | | 0 | | | | 0 | | | | 68 | | | | 68 | |
| | | 411 | | | | 0 | | | | 0 | | | | 0 | | | | 0 | | | | (163 | ) | | | 0 | | | | 0 | | | | 248 | | | | (163 | ) |
| |
| | | 80 | | | | 0 | | | | 0 | | | | 0 | | | | 0 | | | | (9 | ) | | | 0 | | | | 0 | | | | 71 | | | | (9 | ) |
| | | 971 | | | | 0 | | | | 0 | | | | 0 | | | | 0 | | | | (43 | ) | | | 0 | | | | 0 | | | | 928 | | | | (43 | ) |
| |
| | | 4,082 | | | | 0 | | | | 0 | | | | 0 | | | | 0 | | | | 772 | | | | 0 | | | | 0 | | | | 4,854 | | | | 772 | |
| | | | | | | | | | | | | | | | | | | | | | | | | | | | | | | | | | | | | | | | |
| | | | | | | | | | |
| | $ | 16,906 | | | $ | 16,210 | | | $ | (3,962 | ) | | $ | (19 | ) | | $ | (2,248 | ) | | $ | 603 | | | $ | 765 | | | $ | (618 | ) | | $ | 27,637 | | | $ | (1,916 | ) |
| | | | | | | | | | | | | | | | | | | | | | | | | | | | | | | | | | | | | | | | |
The following is a summary of significant unobservable inputs used in the fair valuations of assets and liabilities categorized within Level 3 of the fair value hierarchy:
| | | | | | | | | | | | | | | | | | |
| | Ending
Balance
at 06/30/2022 | | | Valuation Technique | | Unobservable Inputs | | | | (% Unless Noted Otherwise) | |
| | | | | | |
Investments in Securities, at Value | |
Loan Participations and Assignments | | $ | 3,264 | | | | | | | | | | 5.136-6.215 | | | | 5.965 | |
| | | 1,345 | | | | | | | | | | 100.500 | | | | — | |
| | | 3,477 | | | | | | | | | | 62.500-93.000 | | | | 87.623 | |
| |
| | | 3,908 | | | | | | | | | | 12.080 | | | | — | |
| | | 246 | | | | | | | | | | 8.500-11.000 | | | | 10.046 | |
| | | 6,449 | | | | | | | | | | | | | | 38,913.190 | |
| |
| | | 142 | | | | | | | | | | 10.000 | | | | — | |
| | | 49 | | | Other Valuation Techniques (3) | | | | | | | — | | | | — | |
| | | 2,280 | | | | | | | | | | 9.500-17.100 | | | | 9.500 | |
| | | 4 | | | Other Valuation Techniques (3) | | | | | | | — | | | | — | |
| | | 304 | | | | | | | $ | | | 0.980 | | | | — | |
| | | 68 | | | | | | | X | | | 0.977 | | | | — | |
| | | 248 | | | Other Valuation Techniques (3) | | | | | | | — | | | | — | |
| |
| | | 71 | | | | | | | X | | | 10.700 / 9.100 | | | | — | |
| | | 928 | | | Comparable Companies/Discounted Cash Flow | | | | X | | | 3.875 | | | | — | |
| |
| | | 4,297 | | | | | | | X | | | 10.700 / 9.100 | | | | — | |
| | | 557 | | | Comparable Companies/Discounted Cash Flow | | Book Value Multiple/ Discount Rate | | X/% | | | 0.260/21.660 | | | | — | |
| | | | | | | | | | | | | | | | | | |
| | $ | 27,637 | | | | | | | | | | | | | | | |
| | | | | | | | | | | | | | | | | | |
| Any difference between Net Change in Unrealized Appreciation/(Depreciation) and Net Change in Unrealized Appreciation/(Depreciation) on Investments Held at June 30, 2022 may be due to an investment no longer held or categorized as Level 3 at period end. |
| Sector type updated from Financials to Materials since prior fiscal year end. |
| Includes valuation techniques not defined in the Notes to Financial Statements as securities valued using such techniques are not considered significant to the Fund. |
| | | | | | | | | | | | |
| See Accompanying Notes | | | ANNUAL REPORT | | | | | | | JUNE 30, 2022 | | | 39 |
| | | | | | |
| | PIMCO Global StocksPLUS & Income Fund | | | | |
(Amounts in thousands*, except number of shares, contracts, units and ounces, if any)
| | | | | | | | | | | | |
| | | | | PRINCIPAL
AMOUNT
(000S) | | | | | MARKET
VALUE
(000S) | |
INVESTMENTS IN SECURITIES 210.8% | |
| |
LOAN PARTICIPATIONS AND ASSIGNMENTS 26.6% | |
|
AAdvantage Loyalty IP Ltd. | |
5.813% (LIBOR03M + 4.750%) due 04/20/2028 ~ | | $ | | | 300 | | | $ | | | 287 | |
|
| |
| | | | | 2,406 | | | | | | 2,238 | |
|
| |
7.166% (LIBOR01M + 5.500%) due 09/01/2027 ~ | | | | | 430 | | | | | | 406 | |
|
Caesars Resort Collection LLC | |
4.416% (LIBOR01M + 2.750%) due 12/23/2024 ~ | | | | | 950 | | | | | | 918 | |
5.166% (LIBOR01M + 3.500%) due 07/21/2025 ~ | | | | | 1,588 | | | | | | 1,535 | |
|
| |
5.877% (LIBOR06M + 3.000%) due 06/30/2025 ~ | | | | | 397 | | | | | | 371 | |
6.127% (LIBOR06M + 3.250%) due 10/18/2028 «~ | | | | | 185 | | | | | | 167 | |
|
Clear Channel Outdoor Holdings, Inc. | |
4.739% (LIBOR03M + 3.500%) due 08/21/2026 ~ | | | | | 1,097 | | | | | | 944 | |
|
Envision Healthcare Corp. | |
| | | | | 185 | | | | | | 182 | |
| | | | | 1,015 | | | | | | 1,003 | |
|
Forbes Energy Services LLC (7.000% PIK) | |
7.000% due 09/30/2022 «(b) | | | | | 79 | | | | | | 0 | |
|
Gateway Casinos & Entertainment Ltd. | |
9.590% (LIBOR03M + 8.000%) due 10/15/2027 ~ | | | | | 1,117 | | | | | | 1,104 | |
| | CAD | | | 244 | | | | | | 187 | |
|
| |
| | $ | | | 1,194 | | | | | | 1,118 | |
|
Intelsat Jackson Holdings SA | |
| | | | | 712 | | | | | | 653 | |
|
| |
4.666% (LIBOR01M + 3.000%) due 06/28/2024 «~ | | | | | 7 | | | | | | 5 | |
|
Lealand Finance Co. BV (2.666% Cash and 3.000% PIK) | |
5.666% (LIBOR01M + 1.000%) due 06/30/2025 ~(b) | | | | | 64 | | | | | | 33 | |
|
Promotora de Informaciones SA | |
| | EUR | | | 1,800 | | | | | | 1,869 | |
|
| |
5.166% (LIBOR01M + 3.500%) due 02/12/2027 ~ | | $ | | | 6 | | | | | | 5 | |
|
| |
5.934% (LIBOR03M + 4.750%) due 04/27/2028 ~ | | | | | 1,239 | | | | | | 1,074 | |
|
| |
4.813% (LIBOR03M + 3.750%) due 10/20/2027 ~ | | | | | 400 | | | | | | 397 | |
|
| |
| | | | | 849 | | | | | | 850 | |
|
Steenbok Lux Finco 2 SARL (10.750% PIK) | |
10.750% (EUR003M) due 12/29/2022 «~(b) | | EUR | | | 2,313 | | | | | | 1,491 | |
|
| |
| | $ | | | 1,719 | | | | | | 1,517 | |
|
Team Health Holdings, Inc. | |
4.416% (LIBOR01M + 2.750%) due 02/06/2024 ~ | | | | | 1,089 | | | | | | 972 | |
|
| |
3.916% (LIBOR01M + 2.250%) due 08/22/2024 ~ | | | | | 395 | | | | | | 381 | |
3.916% (LIBOR01M + 2.250%) due 05/30/2025 ~ | | | | | 395 | | | | | | 376 | |
3.916% (LIBOR01M + 2.250%) due 12/09/2025 ~ | | | | | 395 | | | | | | 376 | |
|
| |
5.150% - 5.392% (LIBOR01M + 3.750%) due 04/21/2028 ~ | | | | | 298 | | | | | | 277 | |
| | | | | | | | | | | | |
| | | | | PRINCIPAL
AMOUNT
(000S) | | | | | MARKET
VALUE
(000S) | |
|
Westmoreland Mining Holdings LLC (15.000% PIK) | |
15.000% due 03/15/2029 (b) | | $ | | | 1,199 | | | $ | | | 719 | |
|
| |
7.916% (LIBOR01M + 6.250%) due 09/21/2027 ~ | | | | | 235 | | | | | | 221 | |
| | | | | | | | | | | | |
Total Loan Participations and Assignments
(Cost $25,257) | | | | |
| | | | |
| |
CORPORATE BONDS & NOTES 56.6% | |
| |
| |
|
| |
| | EUR | | | 100 | | | | | | 51 | |
|
| |
5.100% due 12/31/2099 (h) | | $ | | | 13 | | | | | | 11 | |
|
Banca Monte dei Paschi di Siena SpA | |
| | EUR | | | 300 | | | | | | 263 | |
2.625% due 04/28/2025 (l) | | | | | 739 | | | | | | 688 | |
3.625% due 09/24/2024 (l) | | | | | 600 | | | | | | 582 | |
| | | | | 100 | | | | | | 62 | |
8.000% due 01/22/2030 •(l) | | | | | 721 | | | | | | 484 | |
8.500% due 09/10/2030 •(l) | | | | | 200 | | | | | | 139 | |
10.500% due 07/23/2029 (l) | | | | | 303 | | | | | | 222 | |
|
Banco de Credito del Peru SA | |
| | PEN | | | 100 | | | | | | 24 | |
|
Corestate Capital Holding SA | |
| | EUR | | | 600 | | | | | | 142 | |
|
| |
7.875% due 01/23/2024 •(h)(i)(l) | | $ | | | 200 | | | | | | 198 | |
|
| |
6.375% due 08/21/2026 •(h)(i)(l) | | | | | 400 | | | | | | 331 | |
7.250% due 09/12/2025 •(h)(i)(l) | | | | | 200 | | | | | | 174 | |
|
| |
9.500% (T-BILL 3MO + 9.500%) due 04/22/2025 ~ | | | | | 250 | | | | | | 248 | |
|
| |
3.375% due 12/15/2029 (l) | | | | | 100 | | | | | | 85 | |
|
| |
6.000% due 09/29/2023 •(h)(i)(l) | | EUR | | | 200 | | | | | | 208 | |
|
| |
3.875% due 11/13/2029 (l) | | $ | | | 200 | | | | | | 160 | |
|
| |
8.625% due 06/25/2034 «(j) | | | | | 1,100 | | | | | | 1,226 | |
|
| |
11.750% (T-BILL 3MO + 11.750%) due 04/09/2029 ~ | | | | | 250 | | | | | | 250 | |
|
| |
7.375% due 10/04/2023 •(h)(i)(l) | | | | | 200 | | | | | | 193 | |
|
| |
6.000% due 01/15/2030 (l) | | | | | 1,127 | | | | | | 781 | |
7.875% due 02/15/2025 (l) | | | | | 1,320 | | | | | | 1,278 | |
|
| |
| | | | | 300 | | | | | | 277 | |
| | | | | 200 | | | | | | 190 | |
|
Voyager Aviation Holdings LLC | |
8.500% due 05/09/2026 (l) | | | | | 2,706 | | | | | | 2,422 | |
| | | | | | | | | | | | |
| | | | | | | | | | | 10,689 | |
| | | | | | | | | | | | |
| |
| |
|
| |
5.750% due 08/15/2029 (l) | | | | | 900 | | | | | | 725 | |
|
| |
5.500% due 04/20/2026 (l) | | | | | 1,800 | | | | | | 1,660 | |
5.750% due 04/20/2029 (l) | | | | | 700 | | | | | | 600 | |
|
| |
5.705% due 05/01/2040 (l) | | | | | 181 | | | | | | 169 | |
5.805% due 05/01/2050 (l) | | | | | 173 | | | | | | 159 | |
5.930% due 05/01/2060 (l) | | | | | 239 | | | | | | 218 | |
|
| |
7.500% due 03/15/2025 (l) | | | | | 895 | | | | | | 811 | |
|
| |
| | | | | 2 | | | | | | 2 | |
| | | | | | | | | | | | |
| | | | | PRINCIPAL
AMOUNT
(000S) | | | | | MARKET
VALUE
(000S) | |
4.150% due 11/15/2030 (l) | | $ | | | 20 | | | $ | | | 18 | |
4.926% due 05/15/2037 (l) | | | | | 26 | | | | | | 23 | |
|
| |
10.250% due 05/01/2030 (l) | | | | | 400 | | | | | | 329 | |
|
| |
7.750% due 04/01/2027 (l) | | EUR | | | 132 | | | | | | 118 | |
8.750% due 04/01/2027 (l) | | $ | | | 1,887 | | | | | | 1,608 | |
|
Charter Communications Operating LLC | |
3.850% due 04/01/2061 (l) | | | | | 200 | | | | | | 132 | |
3.950% due 06/30/2062 (l) | | | | | 300 | | | | | | 201 | |
| | | | | 36 | | | | | | 29 | |
|
Community Health Systems, Inc. | |
8.000% due 03/15/2026 (l) | | | | | 481 | | | | | | 439 | |
|
| |
5.250% due 12/01/2026 (l) | | | | | 600 | | | | | | 471 | |
|
| |
| | | | | 17 | | | | | | 6 | |
|
| |
| | | | | 1,200 | | | | | | 1,200 | |
|
Frontier Communications Holdings LLC | |
6.000% due 01/15/2030 (l) | | | | | 283 | | | | | | 219 | |
|
| |
5.198% due 06/15/2034 (l) | | | | | 368 | | | | | | 299 | |
|
| |
| | | | | 300 | | | | | | 307 | |
|
Intelsat Jackson Holdings SA | |
6.500% due 03/15/2030 (l) | | | | | 2,525 | | | | | | 2,089 | |
|
| |
4.750% due 11/04/2027 (l) | | EUR | | | 100 | | | | | | 84 | |
|
| |
5.625% due 10/01/2028 (l) | | $ | | | 1,000 | | | | | | 932 | |
|
| |
4.810% due 09/17/2030 (l) | | | | | 1,200 | | | | | | 1,067 | |
|
Noble Corp. PLC (11.000% Cash or 15.000% PIK) | |
11.000% due 02/15/2028 (b) | | | | | 10 | | | | | | 11 | |
|
Odebrecht Oil & Gas Finance Ltd. | |
0.000% due 08/01/2022 (f)(h) | | | | | 322 | | | | | | 1 | |
|
| |
4.100% due 03/25/2061 (j)(l) | | | | | 100 | | | | | | 71 | |
|
| |
6.700% due 02/16/2032 (l) | | | | | 380 | | | | | | 291 | |
6.750% due 09/21/2047 (l) | | | | | 2,127 | | | | | | 1,321 | |
| | | | | 50 | | | | | | 31 | |
| | | | | 20 | | | | | | 14 | |
|
| |
1.207% due 01/19/2026 (l) | | EUR | | | 600 | | | | | | 549 | |
3.257% due 01/19/2027 (l) | | $ | | | 900 | | | | | | 783 | |
|
Royal Caribbean Cruises Ltd. | |
9.125% due 06/15/2023 (l) | | | | | 100 | | | | | | 99 | |
|
| |
3.800% due 01/08/2026 (l) | | | | | 200 | | | | | | 161 | |
5.400% due 08/08/2028 (l) | | | | | 362 | | | | | | 280 | |
|
Schenck Process Holding GmbH | |
6.875% due 06/15/2023 (l) | | EUR | | | 100 | | | | | | 103 | |
|
| |
5.676% due 04/24/2048 (l) | | $ | | | 953 | | | | | | 979 | |
|
| |
4.875% due 09/30/2039 (l) | | | | | 158 | | | | | | 137 | |
5.750% due 09/30/2039 (l) | | | | | 1,742 | | | | | | 1,584 | |
|
| |
6.125% due 08/01/2025 (l) | | | | | 17 | | | | | | 16 | |
|
| |
| | | | | 36 | | | | | | 27 | |
| | | | | 6 | | | | | | 4 | |
| | | | | 13 | | | | | | 9 | |
|
| |
| | | | | 10 | | | | | | 4 | |
|
| |
4.625% due 04/15/2029 (l) | | | | | 600 | | | | | | 511 | |
|
Valaris Ltd. (8.250% Cash or 12.000% PIK) | |
8.250% due 04/30/2028 (b) | | | | | 2 | | | | | | 2 | |
|
| |
0.000% due 12/29/2049 «~(h) | | BRL | | | 20,000 | | | | | | 1,608 | |
| | | | | | |
| 40 | | PIMCO CLOSED-END FUNDS | | | See Accompanying Notes | |
| | | | | | | | | | | | |
| | | | | PRINCIPAL
AMOUNT
(000S) | | | | | MARKET
VALUE
(000S) | |
|
| |
13.000% due 05/15/2025 (l) | | $ | | | 1,349 | | | $ | | | 1,384 | |
|
Wesco Aircraft Holdings, Inc. (7.500% Cash and 3.000% PIK) | |
10.500% due 11/15/2026 «(b)(l) | | | | | 4,365 | | | | | | 4,143 | |
|
| |
5.500% due 01/15/2026 (l) | | | | | 600 | | | | | | 416 | |
|
| |
5.000% due 01/15/2030 (l) | | | | | 1,200 | | | | | | 1,009 | |
| | | | | | | | | | | | |
| | | | | | | | | | | 29,463 | |
| | | | | | | | | | | | |
| |
| |
|
DTEK Finance PLC (3.500% Cash and 3.500% PIK) | |
7.000% due 12/31/2027 (b)(l) | | | | | 756 | | | | | | 182 | |
|
Odebrecht Drilling Norbe Ltd. (6.350% Cash and 1.000% PIK) | |
7.350% due 12/01/2026 ^(b)(l) | | | | | 498 | | | | | | 307 | |
|
Odebrecht Offshore Drilling Finance Ltd. | |
6.720% due 12/01/2022 ^(l) | | | | | 154 | | | | | | 148 | |
|
Odebrecht Offshore Drilling Finance Ltd. (6.720% Cash and 1.000% PIK) | |
7.720% due 12/01/2026 ^(b)(l) | | | | | 761 | | | | | | 190 | |
|
Oi SA (10.000% Cash or 12.000% PIK) | |
10.000% due 07/27/2025 (b)(l) | | | | | 1,000 | | | | | | 491 | |
|
Pacific Gas & Electric Co. | |
3.950% due 12/01/2047 (l) | | | | | 100 | | | | | | 69 | |
4.200% due 03/01/2029 (l) | | | | | 500 | | | | | | 447 | |
4.300% due 03/15/2045 (l) | | | | | 827 | | | | | | 603 | |
4.450% due 04/15/2042 (l) | | | | | 34 | | | | | | 26 | |
4.500% due 07/01/2040 (l) | | | | | 600 | | | | | | 466 | |
4.750% due 02/15/2044 (l) | | | | | 1,391 | | | | | | 1,069 | |
4.950% due 07/01/2050 (l) | | | | | 182 | | | | | | 145 | |
|
PG&E Wildfire Recovery Funding LLC | |
4.451% due 12/01/2049 (l) | | | | | 950 | | | | | | 959 | |
|
| |
9.250% due 07/06/2024 (l) | | | | | 743 | | | | | | 771 | |
|
| |
| | | | | 19 | | | | | | 17 | |
| | | | | | | | | | | | |
| | | | | | | | 5,890 | |
| | | | | | | | | |
Total Corporate Bonds & Notes (Cost $54,952) | | | | |
| | | | |
| |
CONVERTIBLE BONDS & NOTES 1.7% | |
| |
| |
|
Corestate Capital Holding SA | |
| | EUR | | | 100 | | | | | | 27 | |
| | | | | | | | | | | | |
| |
| |
|
| |
3.375% due 08/15/2026 (l) | | $ | | | 600 | | | | | | 407 | |
|
Royal Caribbean Cruises Ltd. | |
4.250% due 06/15/2023 (l) | | | | | 1,000 | | | | | | 960 | |
| | | | | | | | | | | | |
| | | | | | | | | | | 1,367 | |
| | | | | | | | | | | | |
Total Convertible Bonds & Notes (Cost $1,712) | | | | |
| | | | |
| |
MUNICIPAL BONDS & NOTES 1.9% | |
| |
| |
|
Chicago, Illinois General Obligation Bonds, Series 2015 | |
| | | | | 12 | | | | | | 13 | |
| | | | | | | | | | | | |
| |
| |
|
Commonwealth of Puerto Rico Bonds, Series 2022 | |
0.000% due 11/01/2043 (f) | | | | | 444 | | | | | | 221 | |
0.000% due 11/01/2051 (f) | | | | | 200 | | | | | | 86 | |
|
Commonwealth of Puerto Rico General Obligation Bonds, Series 2021 | |
0.000% due 07/01/2033 (f) | | | | | 114 | | | | | | 64 | |
| | | | | 89 | | | | | | 82 | |
| | | | | 80 | | | | | | 72 | |
| | | | | | | | | | | | |
| | | | | PRINCIPAL
AMOUNT
(000S) | | | | | MARKET
VALUE
(000S) | |
| | $ | | | 69 | | | $ | | | 61 | |
| | | | | 68 | | | | | | 59 | |
|
Commonwealth of Puerto Rico General Obligation Notes, Series 2021 | |
0.000% due 07/01/2024 (f) | | | | | 46 | | | | | | 42 | |
| | | | | 99 | | | | | | 101 | |
| | | | | | | | | | | | |
| | | | | | | | | | | 788 | |
| | | | | | | | | | | | |
| |
| |
|
Tobacco Settlement Finance Authority, West Virginia Revenue Bonds, Series 2007 | |
0.000% due 06/01/2047 (f) | | | | | 8,800 | | | | | | 713 | |
| | | | | | | | | | | | |
Total Municipal Bonds & Notes (Cost $1,715) | | | | |
| | | | |
| |
U.S. GOVERNMENT AGENCIES 46.7% | |
|
| |
3.000% due 04/25/2050 (a)(l) | | | | | 12,621 | | | | | | 1,964 | |
4.376% (US0001M + 6.000%) due 11/25/2049 ~(a) | | | | | 118 | | | | | | 21 | |
4.426% due 03/25/2037 •(a) | | | | | 134 | | | | | | 16 | |
4.526% due 11/25/2039 •(a) | | | | | 131 | | | | | | 15 | |
4.676% due 01/25/2038 •(a) | | | | | 198 | | | | | | 22 | |
4.756% (US0001M + 6.380%) due 03/25/2037 ~(a) | | | | | 165 | | | | | | 19 | |
4.776% due 12/25/2037 •(a) | | | | | 194 | | | | | | 19 | |
4.786% due 06/25/2037 •(a) | | | | | 69 | | | | | | 6 | |
4.826% (US0001M + 6.450%) due 04/25/2037 ~(a)(l) | | | | | 420 | | | | | | 52 | |
4.976% due 11/25/2035 •(a) | | | | | 39 | | | | | | 2 | |
5.176% due 11/25/2036 •(a)(l) | | | | | 767 | | | | | | 108 | |
5.576% (US0001M + 7.200%) due 02/25/2037 ~(a) | | | | | 144 | | | | | | 22 | |
6.477% (US0001M + 8.600%) due 06/25/2044 ~(l) | | | | | 224 | | | | | | 168 | |
| | | | | 11 | | | | | | 11 | |
| | | | | 220 | | | | | | 235 | |
| | | | | 21 | | | | | | 22 | |
| | | | | 1 | | | | | | 1 | |
| | | | | 34 | | | | | | 36 | |
| | | | | 0 | | | | | | 1 | |
|
| |
0.700% due 11/25/2055 ~(a) | | | | | 5,540 | | | | | | 470 | |
4.526% due 05/25/2050 •(a)(l) | | | | | 1,252 | | | | | | 187 | |
5.116% (US0001M + 6.440%) due 03/15/2037 ~(a)(l) | | | | | 336 | | | | | | 41 | |
5.246% due 09/15/2036 •(a) | | | | | 184 | | | | | | 21 | |
5.256% due 09/15/2036 •(a)(l) | | | | | 371 | | | | | | 50 | |
| | | | | 250 | | | | | | 258 | |
|
| |
4.505% due 12/20/2048 •(a)(l) | | | | | 1,042 | | | | | | 116 | |
|
| |
| | | | | 3,300 | | | | | | 3,207 | |
| | | | | 1,400 | | | | | | 1,416 | |
|
Uniform Mortgage-Backed Security | |
3.500% due 03/01/2048 - 04/01/2048 | | | | | 416 | | | | | | 407 | |
|
Uniform Mortgage-Backed Security, TBA | |
| | | | | 150 | | | | | | 135 | |
| | | | | 29,500 | | | | | | 28,345 | |
| | | | | 600 | | | | | | 601 | |
| | | | | | | | | | | | |
Total U.S. Government Agencies (Cost $37,769) | | | | |
| | | | |
| |
NON-AGENCY MORTGAGE-BACKED SECURITIES 19.1% | |
|
Banc of America Funding Trust | |
| | | | | 226 | | | | | | 145 | |
| | | | | 127 | | | | | | 118 | |
| | | | | 106 | | | | | | 99 | |
|
Banc of America Mortgage Trust | |
| | | | | 1 | | | | | | 1 | |
|
Bear Stearns Adjustable Rate Mortgage Trust | |
| | | | | 85 | | | | | | 78 | |
|
| |
| | | | | 74 | | | | | | 61 | |
| | | | | | | | | | | | |
| | | | | PRINCIPAL
AMOUNT
(000S) | | | | | MARKET
VALUE
(000S) | |
| | $ | | | 68 | | | $ | | | 46 | |
| | | | | 92 | | | | | | 81 | |
|
Bear Stearns Commercial Mortgage Securities Trust | |
| | | | | 150 | | | | | | 150 | |
|
Bear Stearns Structured Products, Inc. Trust | |
| | | | | 173 | | | | | | 145 | |
| | | | | 343 | | | | | | 285 | |
|
CBA Commercial Small Balance Commercial Mortgage | |
| | | | | 127 | | | | | | 116 | |
|
| |
| | | | | 71 | | | | | | 64 | |
|
Chevy Chase Funding LLC Mortgage-Backed Certificates | |
| | | | | 37 | | | | | | 34 | |
| | | | | 2 | | | | | | 2 | |
|
Citigroup Commercial Mortgage Trust | |
5.693% due 12/10/2049 ~(l) | | | | | 575 | | | | | | 256 | |
|
Citigroup Mortgage Loan Trust | |
| | | | | 55 | | | | | | 53 | |
3.055% due 11/25/2035 ~(l) | | | | | 1,112 | | | | | | 684 | |
|
Commercial Mortgage Loan Trust | |
| | | | | 391 | | | | | | 67 | |
|
Connecticut Avenue Securities Trust | |
| | | | | 900 | | | | | | 775 | |
|
Countrywide Alternative Loan Trust | |
1.974% due 05/25/2036 ^•(l) | | | | | 1,199 | | | | | | 399 | |
| | | | | 63 | | | | | | 41 | |
| | | | | 453 | | | | | | 337 | |
| | | | | 77 | | | | | | 68 | |
| | | | | 77 | | | | | | 72 | |
| | | | | 185 | | | | | | 178 | |
| | | | | 13 | | | | | | 9 | |
5.526% due 07/25/2036 •(a) | | | | | 784 | | | | | | 150 | |
| | | | | 31 | | | | | | 30 | |
6.500% due 08/25/2036 ^(l) | | | | | 1,000 | | | | | | 420 | |
15.335% due 07/25/2035 •(l) | | | | | 445 | | | | | | 464 | |
|
Countrywide Home Loan Mortgage Pass-Through Trust | |
| | | | | 103 | | | | | | 92 | |
| | | | | 10 | | | | | | 9 | |
| | | | | 53 | | | | | | 46 | |
| | | | | 40 | | | | | | 39 | |
| | | | | 71 | | | | | | 66 | |
| | | | | 223 | | | | | | 178 | |
| | | | | 12 | | | | | | 12 | |
| | | | | 12 | | | | | | 7 | |
|
Credit Suisse Mortgage Capital Mortgage-Backed Trust | |
| | | | | 114 | | | | | | 98 | |
|
| |
4.652% due 11/10/2046 (l) | | | | | 364 | | | | | | 129 | |
|
Extended Stay America Trust | |
5.025% due 07/15/2038 •(l) | | | | | 994 | | | | | | 958 | |
|
First Horizon Alternative Mortgage Securities Trust | |
| | | | | 165 | | | | | | 125 | |
|
First Horizon Mortgage Pass-Through Trust | |
| | | | | 212 | | | | | | 150 | |
|
| |
| | | | | 1,200 | | | | | | 1,035 | |
|
| |
| | | | | 80 | | | | | | 75 | |
|
HarborView Mortgage Loan Trust | |
2.195% (US0001M + 0.600%) due 04/19/2034 ~ | | | | | 4 | | | | | | 4 | |
| | | | | 54 | | | | | | 48 | |
| | | | | 15 | | | | | | 6 | |
| | | | | 3 | | | | | | 2 | |
|
HSI Asset Loan Obligation Trust | |
| | | | | 116 | | | | | | 86 | |
|
IndyMac INDX Mortgage Loan Trust | |
| | | | | 517 | | | | | | 588 | |
| | | | | 4 | | | | | | 4 | |
| | | | | 300 | | | | | | 280 | |
|
| |
| | | | | 228 | | | | | | 210 | |
| | | | | 26 | | | | | | 15 | |
| | | | | | | | | | | | |
| See Accompanying Notes | | | ANNUAL REPORT | | | | | | | JUNE 30, 2022 | | | 41 |
| | | | | | |
| | PIMCO Global StocksPLUS & Income Fund | | | | |
| | | | | | | | | | | | |
| | | | | PRINCIPAL
AMOUNT
(000S) | | | | | MARKET
VALUE
(000S) | |
|
MASTR Adjustable Rate Mortgages Trust | |
| | $ | | | 337 | | | $ | | | 227 | |
| | | | | 61 | | | | | | 57 | |
|
Merrill Lynch Alternative Note Asset Trust | |
1.764% (US0001M + 0.140%) due 01/25/2037 ~ | | | | | 648 | | | | | | 243 | |
|
Opteum Mortgage Acceptance Corp. Trust | |
2.164% (US0001M + 0.540%) due 07/25/2036 ~ | | | | | 179 | | | | | | 78 | |
|
RBSSP Resecuritization Trust | |
5.000% due 09/26/2036 ~(l) | | | | | 963 | | | | | | 786 | |
|
Residential Accredit Loans, Inc. Trust | |
| | | | | 74 | | | | | | 70 | |
| | | | | 357 | | | | | | 295 | |
| | | | | 266 | | | | | | 113 | |
| | | | | 118 | | | | | | 100 | |
|
Structured Adjustable Rate Mortgage Loan Trust | |
1.876% (12MTA + 1.400%) due 05/25/2035 ^~(l) | | | | | 766 | | | | | | 614 | |
| | | | | 38 | | | | | | 31 | |
| | | | | 173 | | | | | | 116 | |
| | | | | 134 | | | | | | 109 | |
| | | | | 204 | | | | | | 135 | |
|
Structured Asset Mortgage Investments Trust | |
| | | | | 257 | | | | | | 235 | |
2.184% (US0001M + 0.560%) due 02/25/2036 ^~ | | | | | 175 | | | | | | 161 | |
|
SunTrust Adjustable Rate Mortgage Loan Trust | |
| | | | | 39 | | | | | | 32 | |
|
Tharaldson Hotel Portfolio Trust | |
4.600% (US0001M + 3.480%) due 11/11/2034 ~(l) | | | | | 1,205 | | | | | | 1,099 | |
|
WaMu Mortgage Pass-Through Certificates Trust | |
| | | | | 189 | | | | | | 178 | |
| | | | | 49 | | | | | | 47 | |
|
Wells Fargo Commercial Mortgage Trust | |
5.092% due 12/15/2039 ~(l) | | | | | 1,065 | | | | | | 991 | |
|
Wells Fargo-RBS Commercial Mortgage Trust | |
0.410% due 12/15/2046 ~(a)(l) | | | | | 30,000 | | | | | | 116 | |
| | | | | | | | | | | | |
Total Non-Agency Mortgage-Backed Securities (Cost $15,988) | | | | |
| | | | |
| |
ASSET-BACKED SECURITIES 13.3% | |
|
| |
| | EUR | | | 250 | | | | | | 98 | |
|
| |
| | $ | | | 500 | | | | | | 2 | |
|
| |
| | EUR | | | 1,000 | | | | | | 701 | |
|
Bear Stearns Asset-Backed Securities Trust | |
| | $ | | | 520 | | | | | | 257 | |
18.158% due 03/25/2036 ^•(l) | | | | | 1,632 | | | | | | 1,104 | |
|
| |
| | | | | 34,966 | | | | | | 17 | |
|
Bombardier Capital Mortgage Securitization Corp. | |
| | | | | 1,421 | | | | | | 240 | |
|
California Republic Auto Receivables Trust | |
0.000% due 04/15/2025 «(f)(l) | | | | | 1,400 | | | | | | 1,545 | |
|
Carlyle Global Market Strategies CLO Ltd. | |
| | | | | 1,700 | | | | | | 580 | |
|
Carlyle Global Market Strategies Euro CLO DAC | |
| | EUR | | | 900 | | | | | | 307 | |
| | | | | 300 | | | | | | 128 | |
|
| |
| | $ | | | 600 | | | | | | 309 | |
|
Carrington Mortgage Loan Trust | |
1.774% (US0001M + 0.150%) due 08/25/2036 ~ | | | | | 43 | | | | | | 41 | |
|
Citigroup Mortgage Loan Trust | |
| | | | | 131 | | | | | | 64 | |
|
Conseco Finance Securitizations Corp. | |
| | | | | 367 | | | | | | 132 | |
|
Countrywide Asset-Backed Certificates | |
| | | | | 26 | | | | | | 24 | |
| | | | | | | | | | | | |
| | | | | PRINCIPAL
AMOUNT
(000S) | | | | | MARKET
VALUE
(000S) | |
|
Flagship Credit Auto Trust | |
0.000% due 05/15/2025 «(f) | | $ | | | 1 | | | $ | | | 60 | |
|
| |
| | | | | 32 | | | | | | 31 | |
|
| |
0.000% due 12/15/2028 «(f) | | | | | 2 | | | | | | 155 | |
0.000% due 04/16/2029 «(f) | | | | | 2 | | | | | | 100 | |
0.000% due 07/16/2029 «(f) | | | | | 2 | | | | | | 176 | |
|
Morgan Stanley ABS Capital, Inc. Trust | |
1.684% (US0001M + 0.060%) due 05/25/2037 ~ | | | | | 55 | | | | | | 49 | |
|
SMB Private Education Loan Trust | |
0.000% due 09/18/2046 «(f) | | | | | 1 | | | | | | 469 | |
0.000% due 10/15/2048 «(f) | | | | | 2 | | | | | | 693 | |
0.000% due 02/16/2055 «(f) | | | | | 0 | | | | | | 334 | |
5.950% due 02/16/2055 (l) | | | | | 220 | | | | | | 216 | |
|
Soundview Home Loan Trust | |
| | | | | 160 | | | | | | 55 | |
|
| |
0.454% (US0003M + 0.260%) due 01/06/2041 ~ | | | | | 394 | | | | | | 83 | |
| | | | | 11,112 | | | | | | 2,341 | |
|
Structured Asset Securities Corp. Mortgage Loan Trust | |
2.074% (US0001M + 0.450%) due 06/25/2035 ~ | | | | | 59 | | | | | | 59 | |
|
| |
| | | | | 400 | | | | | | 385 | |
|
Washington Mutual Asset-Backed Certificates Trust | |
| | | | | 83 | | | | | | 37 | |
| | | | | | | | | | | | |
Total Asset-Backed Securities (Cost $22,034) | | | | |
| | | | |
| |
| |
|
Argentina Government International Bond | |
0.500% due 07/09/2030 þ(l) | | | | | 512 | | | | | | 108 | |
| | | | | 23 | | | | | | 5 | |
| | | | | 97 | | | | | | 23 | |
1.125% due 07/09/2035 þ(l) | | | | | 563 | | | | | | 117 | |
| | | | | 10 | | | | | | 2 | |
1.400% due 03/25/2023 (l) | | ARS | | | 15,055 | | | | | | 55 | |
2.000% due 01/09/2038 þ(l) | | $ | | | 1,597 | | | | | | 467 | |
2.500% due 07/09/2041 þ(l) | | | | | 905 | | | | | | 235 | |
15.500% due 10/17/2026 (l) | | ARS | | | 8,480 | | | | | | 10 | |
47.331% (BADLARPP) due 10/04/2022 ~ | | | | | 132 | | | | | | 0 | |
|
Autonomous City of Buenos Aires | |
52.234% (BADLARPP + 3.750%) due 02/22/2028 ~ | | | | | 449 | | | | | | 2 | |
|
Provincia de Buenos Aires | |
49.102% due 04/12/2025 (l) | | | | | 71,001 | | | | | | 238 | |
| | | | | 8,630 | | | | | | 29 | |
|
Republic of Greece Government International Bond | |
| | EUR | | | 73 | | | | | | 74 | |
3.900% due 01/30/2033 (l) | | | | | 162 | | | | | | 172 | |
4.000% due 01/30/2037 (l) | | | | | 127 | | | | | | 141 | |
| | | | | 159 | | | | | | 178 | |
|
Romania Government International Bond | |
3.750% due 02/07/2034 (l) | | | | | 970 | | | | | | 764 | |
|
Russia Government International Bond | |
5.625% due 04/04/2042 ^(c) | | $ | | | 200 | | | | | | 59 | |
|
Ukraine Government International Bond | |
| | EUR | | | 89 | | | | | | 23 | |
|
Venezuela Government International Bond | |
| | $ | | | 50 | | | | | | 4 | |
8.250% due 10/13/2024 ^(c) | | | | | 4 | | | | | | 0 | |
9.250% due 09/15/2027 ^(c) | | | | | 62 | | | | | | 5 | |
| | | | | | | | | | | | |
Total Sovereign Issues (Cost $5,286) | | | | |
| | | | |
| |
| | | | | SHARES | | | | | | |
| |
| |
COMMUNICATION SERVICES 0.5% | |
| | | | |
Clear Channel Outdoor Holdings, Inc. (d) | | | | | 97,913 | | | | | | 105 | |
| | | | |
iHeartMedia, Inc. ‘A’ (d) | | | | | 22,927 | | | | | | 181 | |
| | | | | | | | | | | | |
| | | | | SHARES | | | | | MARKET
VALUE
(000S) | |
| | | | |
iHeartMedia, Inc. ‘B’ «(d) | | | | | 17,837 | | | $ | | | 126 | |
| | | | | | | | | | | | |
| | | | | | | | | | | 412 | |
| | | | | | | | | | | | |
| |
| |
| | | | |
Axis Energy Services ‘A’ «(d)(j) | | | | | 514 | | | | | | 8 | |
| | | | |
| | | | | 4,260 | | | | | | 108 | |
| | | | |
| | | | | 211 | | | | | | 9 | |
| | | | | | | | | | | | |
| | | | | | | | | | | 125 | |
| | | | | | | | | | | | |
| |
| |
| | | | |
| | | | | 34,279 | | | | | | 960 | |
| | | | | | | | | | | | |
| |
| |
| | | | |
Neiman Marcus Group Ltd. LLC «(d)(j) | | | | | 516 | | | | | | 89 | |
| | | | |
Sierra Hamilton Holder LLC «(d)(j) | | | | | 100,456 | | | | | | 0 | |
| | | | |
Syniverse Holdings, Inc. «(d)(j) | | | | | 288,288 | | | | | | 283 | |
| | | | |
Voyager Aviation Holdings LLC «(d) | | | | | 377 | | | | | | 0 | |
| | | | |
Westmoreland Mining Holdings «(d)(j) | | | | | 13,224 | | | | | | 0 | |
| | | | | | | | | | | | |
| | | | | | | | | | | 372 | |
| | | | | | | | | | | | |
| |
| |
| | | | |
Associated Materials Group, Inc. «(d) | | | | | 100,208 | | | | | | 23 | |
| | | | | | | | | | | | |
Total Common Stocks (Cost $4,604) | | | | |
| | | | |
| |
| |
| |
| |
| | | | |
Intelsat Jackson Holdings SA «(d) | | | | | 3,671 | | | | | | 17 | |
| | | | | | | | | | | | |
| | | | |
| | | | |
| |
| |
| |
| |
| | | | |
Intelsat Emergence SA - Exp. 02/17/2027 « | | | | | 236 | | | | | | 1 | |
| | | | |
Intelsat Jackson Holdings SA - Exp. 12/05/2025 « | | | | | 3,580 | | | | | | 18 | |
| | | | | | | | | | | | |
| | | | | | | | 19 | |
| | | | | | | | | |
| |
| |
| | | | |
Sequa Corp. - Exp. 04/28/2024 « | | | | | 121,000 | | | | | | 72 | |
| | | | | | | | | | | | |
| |
INFORMATION TECHNOLOGY 1.4% | |
| | | | |
Windstream Holdings LLC - Exp. 9/21/2055 « | | | | | 52,536 | | | | | | 1,120 | |
| | | | | | | | | | | | |
Total Warrants (Cost $1,166) | | | | |
| | | | |
| |
PREFERRED SECURITIES 11.0% | |
| |
| |
|
| |
2.794% (US0003M + 1.750%) due 01/15/2067 ~(l) | | | | | 1,000,000 | | | | | | 547 | |
|
| |
4.000% due 12/01/2030 •(h) | | | | | 200,000 | | | | | | 154 | |
|
| |
0.000% due 04/26/2028 (f) | | | | | 1,400 | | | | | | 941 | |
|
Stichting AK Rabobank Certificaten | |
6.500% due 12/29/2049 þ(h)(l) | | | | | 2,124,000 | | | | | | 2,168 | |
| | | | | | | | | | | | |
| | | | | | | | 3,810 | |
| | | | | | | | | |
| |
| | | | | | | | | | | | | |
| | | | | | | | | | | |
| |
| |
| |
5.159% (US0003M + 3.330%) due 09/15/2022 ~(h) | | | | | 28,000 | | | $ | | | 25 | |
| |
Sequa Corp. (15.000% PIK) | |
| | | | | 3,875 | | | | | | 4,396 | |
| |
Voyager Aviation Holdings LLC | |
| | | | | 2,260 | | | | | | 683 | |
| | | | | | | | | | | | | |
| | | | | | | | | 5,104 | |
| | | | | | | | | | |
Total Preferred Securities (Cost $7,935) | | | | |
| | | | | |
| | |
REAL ESTATE INVESTMENT TRUSTS 0.6% | |
| | |
| |
| | | | |
CBL & Associates Properties, Inc. | | | 2,842 | | | | | | 67 | |
| | | | | |
| | | | | 44,060 | | | | | | 415 | |
| | | | | | | | | | | | | |
Total Real Estate Investment Trusts
(Cost $318) | | | | |
| | | | | |
| | |
| | | | | | | | | | | |
SHORT-TERM INSTRUMENTS 26.2% | |
| | |
REPURCHASE AGREEMENTS (k) 9.0% | |
| | | | | | | | | | | | 7,304 | |
| | | | | | | | | | | | | |
| | |
ARGENTINA TREASURY BILLS 0.1% | |
51.298% due 09/30/2022 - 10/31/2022 (e)(f) | | ARS | | | 24,420 | | | | | | 82 | |
| | | | | | | | | | | | | |
| | |
| | | | | | | | | | | | | |
| | | | | | | | | | | |
U.S. TREASURY BILLS 12.7% | |
0.725% due 07/14/2022 - 09/01/2022 (e)(f)(l)(o) | | $ | | | 10,379 | | | $ | | | 10,371 | |
| | | | | | | | | | | | | |
| | |
U.S. TREASURY CASH MANAGEMENT BILLS 4.4% | |
1.089% due 08/23/2022 (f)(g)(l)(o) | | | | | 3,600 | | | | | | 3,592 | |
| | | | | | | | | | | | | |
Total Short-Term Instruments
(Cost $21,384) | | | | |
| | | | | |
| |
| | |
Total Investments in Securities
(Cost $200,120) | | | | |
| |
| | |
Total Investments 210.8%
(Cost $200,120) | | | $ | | | | |
| | |
Financial Derivative
Instruments (m)(n) (11.0)% (Cost or Premiums, net $(841)) | | | | | | | | | | | | |
| | |
Other Assets and Liabilities, net (99.8)% | | | | |
| | | | | |
| | | $ | | | | |
| | | | | | | | |
NOTES TO SCHEDULE OF INVESTMENTS:
| A zero balance may reflect actual amounts rounding to less than one thousand. |
| Security valued using significant unobservable inputs (Level 3). |
| All or a portion of this amount represents unfunded loan commitments. The interest rate for the unfunded portion will be determined at the time of funding. See Note 4, Securities and Other Investments, in the Notes to Financial Statements for more information regarding unfunded loan commitments. |
| Variable or Floating rate security. Rate shown is the rate in effect as of period end. Certain variable rate securities are not based on a published reference rate and spread, rather are determined by the issuer or agent and are based on current market conditions. Reference rate is as of reset date, which may vary by security. These securities may not indicate a reference rate and/or spread in their description. |
| Rate shown is the rate in effect as of period end. The rate may be based on a fixed rate, a capped rate or a floor rate and may convert to a variable or floating rate in the future. These securities do not indicate a reference rate and spread in their description. |
| Coupon represents a rate which changes periodically based on a predetermined schedule or event. Rate shown is the rate in effect as of period end. |
| Security is an Interest Only (“IO”) or IO Strip. |
| Security is not accruing income as of the date of this report. |
| Security did not produce income within the last twelve months. |
| Coupon represents a weighted average yield to maturity. |
| Coupon represents a yield to maturity. |
| Perpetual maturity; date shown, if applicable, represents next contractual call date. |
| Contingent convertible security. |
| | | | | | | | | | | | | |
| See Accompanying Notes | | | | | | | | | | JUNE 30, 2022 | | | |
| | | | | | | |
| | PIMCO Global StocksPLUS & Income Fund | | | | |
(j) RESTRICTED SECURITIES:
| | | | | | | | | | | | | | | | | | | | | | | | | |
| | | | | | | | | | | | | | | | | Market Value
as Percentage
of Net Assets | |
| | | | | | | | | | | 07/01/2021 | | | $ | 8 | | | $ | 8 | | | | 0.01 | % |
| | | | | | | | | | | | | | | 2,403 | | | | 960 | | | | 1.18 | |
Neiman Marcus Group Ltd. LLC | | | | | | | | | | | 09/25/2020 | | | | 0 | | | | 89 | | | | 0.11 | |
| | | | | | | | | | | 02/05/2021 - 02/27/2021 | | | | 52 | | | | 108 | | | | 0.13 | |
Oracle Corp. 4.100% due 03/25/2061 | | | | | | | | | | | 08/02/2021 | | | | 114 | | | | 71 | | | | 0.09 | |
Pinnacol Assurance 8.625% due 06/25/2034 | | | | | | | | | | | 06/23/2014 | | | | 1,100 | | | | 1,226 | | | | 1.51 | |
Sierra Hamilton Holder LLC | | | | | | | | | | | 07/31/2017 | | | | 25 | | | | 0 | | | | 0.00 | |
| | | | | | | | | | | 05/12/2022 | | | | 283 | | | | 283 | | | | 0.35 | |
Westmoreland Mining Holdings | | | | | | | | | | | 12/08/2014 - 08/05/2016 | | | | 370 | | | | 0 | | | | 0.00 | |
| | | | | | | | | | | | | | | | | | | | | | | | | |
| | | | $ | 4,355 | | | $ | 2,745 | | | | 3.38 | % |
| | | | | | | | | | | | | | | | | | | | | | | | | |
BORROWINGS AND OTHER FINANCING TRANSACTIONS
(k) REPURCHASE AGREEMENTS:
| | | | | | | | | | | | | | | | | | | | | | | | | | | | | | | |
| | | | | | | | | | | | | | | | | | | Repurchase
Agreements,
at Value | | | Repurchase Agreement Proceeds to be Received (1) | |
| FICC | | | 0.400 | % | | | 06/30/2022 | | | | 07/01/2022 | | | $ | 1,604 | | | U.S. Treasury Notes 3.000% due 06/30/2024 | | $ | (1,636 | ) | | $ | 1,604 | | | $ | 1,604 | |
| JPS | | | 1.400 | | | | 06/30/2022 | | | | 07/01/2022 | | | | 5,700 | | | U.S. Treasury Bonds 2.000% due 08/15/2051 | | | (5,843 | ) | | | 5,700 | | | | 5,700 | |
| | | | | | | | | | | | | | | | | | | | | | | | | | | | | | | |
Total Repurchase Agreements | | | | | | | | | | | | | | | |
| | | | | | | | | | | | | | | | | | | | | | | | | | | | | | | |
REVERSE REPURCHASE AGREEMENTS:
| | | | | | | | | | | | | | | | | | | | | | | | | |
| | | | | | | | | | | | | | Payable for
Reverse
Repurchase
Agreements | |
| | | 2.370 | % | | | 06/28/2022 | | | | 07/28/2022 | | | | $ | | | | (171 | ) | | $ | (172 | ) |
| | | (0.300 | ) | | | 06/24/2022 | | | | 07/25/2022 | | | | EUR | | | | (79 | ) | | | (83 | ) |
| | | | 1.430 | | | | 03/22/2022 | | | | 09/23/2022 | | | | $ | | | | (344 | ) | | | (346 | ) |
| | | | 1.430 | | | | 04/11/2022 | | | | 09/23/2022 | | | | | | | | (514 | ) | | | (516 | ) |
| | | | 1.690 | | | | 04/18/2022 | | | | 10/17/2022 | | | | | | | | (1,073 | ) | | | (1,077 | ) |
| | | | 1.930 | | | | 05/13/2022 | | | | 08/12/2022 | | | | | | | | (1,945 | ) | | | (1,950 | ) |
| | | | 1.950 | | | | 05/31/2022 | | | | 08/31/2022 | | | | | | | | (354 | ) | | | (354 | ) |
| | | | 1.970 | | | | 06/02/2022 | | | | 09/01/2022 | | | | | | | | (1,055 | ) | | | (1,057 | ) |
| | | | 2.050 | | | | 06/10/2022 | | | | 09/12/2022 | | | | | | | | (4,418 | ) | | | (4,423 | ) |
| | | | 2.240 | | | | 05/18/2022 | | | | 08/18/2022 | | | | | | | | (1,237 | ) | | | (1,241 | ) |
| | | (1.000 | ) | | | 06/17/2022 | | | | TBD | | | | | | | | (293 | ) | | | (293 | ) |
| | | | (0.500 | ) | | | 05/23/2022 | | | | TBD | | | | EUR | | | | (584 | ) | | | (612 | ) |
| | | | (0.380 | ) | | | 05/10/2022 | | | | 08/09/2022 | | | | | | | | (740 | ) | | | (775 | ) |
| | | | 1.950 | | | | 05/06/2022 | | | | 08/08/2022 | | | | $ | | | | (859 | ) | | | (861 | ) |
| | | | 1.950 | | | | 05/16/2022 | | | | 08/16/2022 | | | | | | | | (97 | ) | | | (97 | ) |
| | | | 2.070 | | | | 06/17/2022 | | | | TBD | | | | | | | | (149 | ) | | | (149 | ) |
| | | | 2.100 | | | | 05/16/2022 | | | | 08/16/2022 | | | | | | | | (290 | ) | | | (291 | ) |
| | | | 2.250 | | | | 06/17/2022 | | | | TBD | | | | | | | | (1,561 | ) | | | (1,563 | ) |
| | | | 2.310 | | | | 06/06/2022 | | | | 09/07/2022 | | | | | | | | (645 | ) | | | (646 | ) |
| | | | 2.440 | | | | 06/16/2022 | | | | 09/16/2022 | | | | | | | | (1,719 | ) | | | (1,721 | ) |
| | | | 2.963 | | | | 06/24/2022 | | | | 09/27/2022 | | | | | | | | (2,440 | ) | | | (2,441 | ) |
| | | 1.350 | | | | 05/02/2022 | | | | 08/02/2022 | | | | | | | | (1,554 | ) | | | (1,557 | ) |
| | | | 1.710 | | | | 04/12/2022 | | | | 10/11/2022 | | | | | | | | (153 | ) | | | (154 | ) |
| | | | 1.740 | | | | 06/07/2022 | | | | 09/07/2022 | | | | | | | | (770 | ) | | | (771 | ) |
| | | | 1.750 | | | | 06/10/2022 | | | | 09/12/2022 | | | | | | | | (701 | ) | | | (702 | ) |
| | | | 1.940 | | | | 06/08/2022 | | | | 09/07/2022 | | | | | | | | (1,548 | ) | | | (1,550 | ) |
| | | 1.400 | | | | 04/07/2022 | | | | 07/07/2022 | | | | | | | | (412 | ) | | | (414 | ) |
| | | | 2.500 | | | | 06/16/2022 | | | | 09/16/2022 | | | | | | | | (89 | ) | | | (89 | ) |
| | | (3.250 | ) | | | 06/07/2022 | | | | TBD | | | | EUR | | | | (304 | ) | | | (318 | ) |
| | | | (0.440 | ) | | | 02/17/2022 | | | | TBD | | | | | | | | (555 | ) | | | (580 | ) |
| | | | (0.370 | ) | | | 02/17/2022 | | | | TBD | | | | | | | | (125 | ) | | | (130 | ) |
| | | 2.100 | | | | 05/09/2022 | | | | 11/07/2022 | | | | $ | | | | (867 | ) | | | (869 | ) |
| | | (4.000 | ) | | | 05/19/2022 | | | | TBD | | | | EUR | | | | (82 | ) | | | (85 | ) |
| | | | (4.000 | ) | | | 06/24/2022 | | | | TBD | | | | | | | | (393 | ) | | | (412 | ) |
| | | | (3.000 | ) | | | 06/24/2022 | | | | TBD | | | | | | | | (141 | ) | | | (148 | ) |
| | | | (1.000 | ) | | | 02/18/2022 | | | | TBD | | | | | | | | (265 | ) | | | (276 | ) |
| | | | (0.450 | ) | | | 06/24/2022 | | | | TBD | | | | | | | | (472 | ) | | | (494 | ) |
| | | | | | |
| 44 | | PIMCO CLOSED-END FUNDS | | | See Accompanying Notes | |
| | | | | | | | | | | | | | | | | | | | | | | | |
| Counterparty | | | | | Settlement
Date | | | Maturity
Date | | | | | | Payable for
Reverse
Repurchase
Agreements | |
| | | (0.380 | )% | | | 05/05/2022 | | | | 08/04/2022 | | | | EUR | | | | (2,009 | ) | | $ | (2,104 | ) |
| | | (0.380 | ) | | | 05/10/2022 | | | | 08/09/2022 | | | | | | | | (96 | ) | | | (101 | ) |
| | | 1.950 | | | | 06/17/2022 | | | | 07/29/2022 | | | | $ | | | | (636 | ) | | | (637 | ) |
| | | 2.000 | | | | 06/17/2022 | | | | 07/29/2022 | | | | | | | | (888 | ) | | | (889 | ) |
| | | 2.160 | | | | 06/03/2022 | | | | 08/31/2022 | | | | | | | | (822 | ) | | | (824 | ) |
| | | 2.200 | | | | 06/17/2022 | | | | 07/29/2022 | | | | | | | | (728 | ) | | | (728 | ) |
| | | (0.400 | ) | | | 04/06/2022 | | | | TBD | | | | EUR | | | | (197 | ) | | | (206 | ) |
| | | 1.390 | | | | 04/19/2022 | | | | 07/20/2022 | | | | $ | | | | (693 | ) | | | (695 | ) |
| | | 1.880 | | | | 06/17/2022 | | | | TBD | | | | | | | | (853 | ) | | | (853 | ) |
| | | 1.900 | | | | 06/29/2022 | | | | TBD | | | | | | | | (516 | ) | | | (516 | ) |
| | | 2.250 | | | | 06/17/2022 | | | | TBD | | | | | | | | (1,233 | ) | | | (1,235 | ) |
| | | 2.700 | | | | 06/27/2022 | | | | 09/23/2022 | | | | | | | | (338 | ) | | | (338 | ) |
| | | 0.940 | | | | 01/10/2022 | | | | 07/11/2022 | | | | | | | | (798 | ) | | | (801 | ) |
| | | 1.400 | | | | 06/06/2022 | | | | 07/11/2022 | | | | | | | | (1,424 | ) | | | (1,425 | ) |
| | | 2.420 | | | | 06/24/2022 | | | | 09/26/2022 | | | | | | | | (1,096 | ) | | | (1,096 | ) |
| | | 2.620 | | | | 06/24/2022 | | | | 09/26/2022 | | | | | | | | (140 | ) | | | (140 | ) |
| | | 0.670 | | | | 01/07/2022 | | | | 07/08/2022 | | | | | | | | (435 | ) | | | (437 | ) |
| | | 1.430 | | | | 04/19/2022 | | | | 07/25/2022 | | | | | | | | (37 | ) | | | (37 | ) |
| | | 1.680 | | | | 05/10/2022 | | | | 08/10/2022 | | | | | | | | (1,070 | ) | | | (1,073 | ) |
| | | 1.740 | | | | 06/17/2022 | | | | TBD | | | | | | | | (76 | ) | | | (76 | ) |
| | | 1.750 | | | | 06/17/2022 | | | | TBD | | | | | | | | (423 | ) | | | (423 | ) |
| | | 1.820 | | | | 06/17/2022 | | | | TBD | | | | | | | | (2,063 | ) | | | (2,064 | ) |
| | | 1.850 | | | | 06/17/2022 | | | | TBD | | | | | | | | (918 | ) | | | (919 | ) |
| | | 1.980 | | | | 07/05/2022 | | | | 08/04/2022 | | | | | | | | (149 | ) | | | (149 | ) |
| | | 2.060 | | | | 06/13/2022 | | | | 09/12/2022 | | | | | | | | (160 | ) | | | (160 | ) |
| | | 2.130 | | | | 06/16/2022 | | | | 09/19/2022 | | | | | | | | (540 | ) | | | (540 | ) |
| | | 1.300 | | | | 04/01/2022 | | | | 07/01/2022 | | | | | | | | (578 | ) | | | (579 | ) |
| | | 1.350 | | | | 04/14/2022 | | | | 07/14/2022 | | | | | | | | (862 | ) | | | (865 | ) |
| | | 1.530 | | | | 04/25/2022 | | | | 07/25/2022 | | | | | | | | (151 | ) | | | (151 | ) |
| | | 1.630 | | | | 05/02/2022 | | | | 08/02/2022 | | | | | | | | (569 | ) | | | (571 | ) |
| | | 1.690 | | | | 05/05/2022 | | | | 08/05/2022 | | | | | | | | (169 | ) | | | (169 | ) |
| | | 1.780 | | | | 06/17/2022 | | | | TBD | | | | | | | | (150 | ) | | | (150 | ) |
| | | 1.800 | | | | 06/17/2022 | | | | TBD | | | | | | | | (189 | ) | | | (189 | ) |
| | | 1.850 | | | | 06/17/2022 | | | | TBD | | | | | | | | (2,132 | ) | | | (2,134 | ) |
| | | 1.850 | | | | 06/29/2022 | | | | 06/28/2024 | | | | | | | | (102 | ) | | | (102 | ) |
| | | 1.900 | | | | 06/17/2022 | | | | TBD | | | | | | | | (74 | ) | | | (74 | ) |
| | | 2.450 | | | | 06/17/2022 | | | | 09/19/2022 | | | | | | | | (123 | ) | | | (124 | ) |
| | | 2.700 | | | | 07/01/2022 | | | | 10/03/2022 | | | | | | | | (491 | ) | | | (491 | ) |
| | | | | | | | | | | | | | | | | | | | | | | | |
Total Reverse Repurchase Agreements | | | | | | | | | | | | | | | | | | | | | |
| | | | | | | | | | | | | | | | | | | | | | | | |
SHORT SALES:
| | | | | | | | | | | | | | | | | | | | |
| | | | | | | | | | | | | | | |
U.S. Government Agencies (0.9)% | |
Uniform Mortgage-Backed Security, TBA | | | 2.000 | % | | | 08/11/2052 | | | $ | 800 | | | $ | (694 | ) | | $ | (694 | ) |
| | | | | | | | | | | | | | | | | | | | |
| | | | | | | | | | | | | | | | | | | | |
| | | | | | | | | | | | | | | | | | | | |
BORROWINGS AND OTHER FINANCING TRANSACTIONS SUMMARY
The following is a summary by counterparty of the market value of Borrowings and Other Financing Transactions and collateral pledged/(received) as of June 30, 2022:
| | | | | | | | | | | | | | | | | | | | | | | | |
| | Repurchase Agreement Proceeds to be Received (1) | | | Payable for
Reverse
Repurchase
Agreements | | | Payable for Sale-Buyback Transactions | | | Total
Borrowings and
Other Financing
Transactions | | | Collateral
Pledged/(Received) | | | | |
Global/Master Repurchase Agreement | |
| | $ | 0 | | | $ | (172 | ) | | $ | 0 | | | $ | (172 | ) | | $ | 216 | | | $ | 44 | |
| | | 0 | | | | (11,047 | ) | | | 0 | | | | (11,047 | ) | | | 13,021 | | | | 1,974 | |
| | | 0 | | | | (9,449 | ) | | | 0 | | | | (9,449 | ) | | | 12,197 | | | | 2,748 | |
| | | 0 | | | | (4,734 | ) | | | 0 | | | | (4,734 | ) | | | 4,884 | | | | 150 | |
| | | 0 | | | | (503 | ) | | | 0 | | | | (503 | ) | | | 525 | | | | 22 | |
| | | 0 | | | | (1,028 | ) | | | 0 | | | | (1,028 | ) | | | 973 | | | | (55 | ) |
| | | 1,604 | | | | 0 | | | | 0 | | | | 1,604 | | | | (1,636 | ) | | | (32 | ) |
| | | 0 | | | | (869 | ) | | | 0 | | | | (869 | ) | | | 979 | | | | 110 | |
| | | 0 | | | | (6,698 | ) | | | 0 | | | | (6,698 | ) | | | 7,477 | | | | 779 | |
| | | | | | | | | | | | |
| See Accompanying Notes | | | ANNUAL REPORT | | | | | | | JUNE 30, 2022 | | | 45 |
| | | | | | |
| | PIMCO Global StocksPLUS & Income Fund | | | | |
| | | | | | | | | | | | | | | | | | | | | | | | |
| Counterparty | | Repurchase Agreement Proceeds to be Received (1) | | | Payable for
Reverse
Repurchase
Agreements | | | Payable for Sale-Buyback Transactions | | | Total
Borrowings and
Other Financing
Transactions | | | Collateral
Pledged/(Received) | | | | |
| | $ | 5,700 | | | $ | 0 | | | $ | 0 | | | $ | 5,700 | | | $ | (5,843 | ) | | $ | (143 | ) |
| | | 0 | | | | (901 | ) | | | 0 | | | | (901 | ) | | | 976 | | | | 75 | |
| | | 0 | | | | (2,942 | ) | | | 0 | | | | (2,942 | ) | | | 3,215 | | | | 273 | |
| | | 0 | | | | (801 | ) | | | 0 | | | | (801 | ) | | | 958 | | | | 157 | |
| | | 0 | | | | (2,661 | ) | | | 0 | | | | (2,661 | ) | | | 2,715 | | | | 54 | |
| | | 0 | | | | (5,878 | ) | | | 0 | | | | (5,878 | ) | | | 6,194 | | | | 316 | |
| | | 0 | | | | (5,599 | ) | | | 0 | | | | (5,599 | ) | | | 5,732 | | | | 133 | |
| | | | | | | | | | | | | | | | | | | | | | | | |
Total Borrowings and Other Financing Transactions | | | | | | | | | | | | | | | | | | | | | | | | |
| | | | | | | | | | | | | | | | | | | | | | | | |
CERTAIN TRANSFERS ACCOUNTED FOR AS SECURED BORROWINGS
Remaining Contractual Maturity of the Agreements
| | | | | | | | | | | | | | | | | | | | |
| | | | | | | | | | | | | | | | |
Reverse Repurchase Agreements | |
| | $ | (579 | ) | | $ | (4,420 | ) | | $ | (17,537 | ) | | $ | (14,079 | ) | | $ | (36,615 | ) |
Convertible Bonds & Notes | | | 0 | | | | 0 | | | | 0 | | | | (1,235 | ) | | | (1,235 | ) |
| | | 0 | | | | (414 | ) | | | (1,810 | ) | | | 0 | | | | (2,224 | ) |
Non-Agency Mortgage-Backed Securities | | | 0 | | | | (801 | ) | | | (4,755 | ) | | | 0 | | | | (5,556 | ) |
| | | 0 | | | | (172 | ) | | | (1,646 | ) | | | 0 | | | | (1,818 | ) |
| | | 0 | | | | (1,526 | ) | | | (775 | ) | | | (317 | ) | | | (2,618 | ) |
| | | 0 | | | | 0 | | | | (2,104 | ) | | | (472 | ) | | | (2,576 | ) |
| | | | | | | | | | | | | | | | | | | | |
| | | | | | | | | | | | | | | | | | | | |
| | | | | | | | | | | | | | | | | | | | |
Payable for reverse repurchase agreements (5) | | | | | |
| | | | | | | | | | | | | | | | | | | | |
| Securities with an aggregate market value of $59,502 and cash of $570 have been pledged as collateral under the terms of the above master agreements as of June 30, 2022. |
| Includes accrued interest. |
| The average amount of borrowings outstanding during the period ended June 30, 2022 was $(59,860) at a weighted average interest rate of 0.497%. Average borrowings may include reverse repurchase agreements and sale-buyback transactions, if held during the period. |
| Open maturity reverse repurchase agreement. |
| Net Exposure represents the net receivable/(payable) that would be due from/to the counterparty in the event of default. Exposure from borrowings and other financing transactions can only be netted across transactions governed under the same master agreement with the same legal entity. See Note 8, Master Netting Arrangements, in the Notes to Financial Statements for more information. |
| Unsettled reverse repurchase agreements liability of $(640) is outstanding at period end. |
(m) FINANCIAL DERIVATIVE INSTRUMENTS: EXCHANGE-TRADED OR CENTRALLY CLEARED
PURCHASED OPTIONS:
OPTIONS ON EXCHANGE-TRADED FUTURES CONTRACTS
| | | | | | | | | | | | | | | | | | | | | | | | |
| | | | | | | | | | | | | | | | | | |
Put - CME E-mini S&P 500 July 2022 Futures | | $ | 3,500.000 | | | | 07/15/2022 | | | | 214 | | | $ | 11 | | | $ | 658 | | | $ | 134 | |
| | | | | | | | | | | | | | | | | | | | | | | | |
| | | | | | | | | |
| | | | | | | | | | | | | | | | | | | | | | | | |
WRITTEN OPTIONS:
OPTIONS ON EXCHANGE-TRADED FUTURES CONTRACTS
| | | | | | | | | | | | | | | | | | | | | | | | |
| | | | | | | | | | | | | | | | | | |
Call - CME E-mini S&P 500 July 2022 Futures | | $ | 3,680.000 | | | | 07/15/2022 | | | | 214 | | | $ | 11 | | | $ | (1,255 | ) | | $ | (1,621 | ) |
| | | | | | | | | | | | | | | | | | | | | | | | |
| | | | | | | | | |
| | | | | | | | | | | | | | | | | | | | | | | | |
FUTURES CONTRACTS:
LONG FUTURES CONTRACTS
| | | | | | | | | | | | | | | | | | | | | | | | |
| Description | | Expiration
Month | | | # of
Contracts | | | Notional
Amount | | | Unrealized
Appreciation/
(Depreciation) | | | | |
| | | | | | |
E-mini S&P 500 Index September Futures | | | 09/2022 | | | | 214 | | | $ | 40,548 | | | $ | (881 | ) | | $ | 0 | | | $ | (340 | ) |
| | | | | | | | | | | | | | | | | | | | | | | | |
| | | | | | | | | | | | | |
| | | | | | | | | | | | | |
SWAP AGREEMENTS:
CREDIT DEFAULT SWAPS ON CORPORATE ISSUES - SELL PROTECTION
(1)
| | | | | | | | | | | | | | | | | | | | | | | | | | | | | | | | | | | | | | | | | | | | |
| Reference Entity | | Fixed
Receive Rate | | | Payment
Frequency | | | Maturity
Date | | | Implied Credit Spread at June 30, 2022 (2) | | | | | | Premiums
Paid/(Received) | | | Unrealized
Appreciation/
(Depreciation) | | | | | | | |
| | | | | | |
| | | 1.000 | % | | | Quarterly | | | | 06/20/2027 | | | | 2.538 | % | | | $ | | | | 100 | | | $ | (6 | ) | | $ | (1 | ) | | $ | (7 | ) | | $ | 0 | | | $ | 0 | |
| | | 5.000 | | | | Quarterly | | | | 06/20/2027 | | | | 9.229 | | | | | | | | 200 | | | | (25 | ) | | | (3 | ) | | | (28 | ) | | | 0 | | | | 0 | |
Ford Motor Credit Co. LLC | | | 5.000 | | | | Quarterly | | | | 06/20/2027 | | | | 4.319 | | | | | | | | 800 | | | | 84 | | | | (61 | ) | | | 23 | | | | 0 | | | | (3 | ) |
| | | 1.000 | | | | Quarterly | | | | 06/20/2027 | | | | 4.406 | | | | EUR | | | | 400 | | | | (35 | ) | | | (25 | ) | | | (60 | ) | | | 0 | | | | (4 | ) |
| | | 1.000 | | | | Quarterly | | | | 12/20/2025 | | | | 3.940 | | | | | | | | 700 | | | | (128 | ) | | | 60 | | | | (68 | ) | | | 0 | | | | (6 | ) |
| | | 1.000 | | | | Quarterly | | | | 06/20/2026 | | | | 4.096 | | | | | | | | 1,300 | | | | (102 | ) | | | (47 | ) | | | (149 | ) | | | 0 | | | | (12 | ) |
| | | | | | | | | | | | | | | | | | | | | | | | | | | | | | | | | | | | | | | | | | | | |
| | | | | | | | | | | | | | | $ | (212 | ) | | $ | (77 | ) | | $ | (289 | ) | | $ | 0 | | | $ | (25 | ) |
| | | | | | | | | | | | | | | | | | | | | | | | | | | | | | | | | |
INTEREST RATE SWAPS
| | | | | | | | | | | | | | | | | | | | | | | | | | | | | | | | | | | | | | |
| | Floating Rate Index | | Fixed Rate | | | Payment
Frequency | | Maturity
Date | | | | | | | | | Unrealized
Appreciation/
(Depreciation) | | | Market
Value | | | | |
| | | | | | |
| | | | | 0.750 | % | | Annual | | | 09/21/2052 | | | GBP | | | 1,100 | | | $ | 232 | | | $ | 191 | | | $ | 423 | | | $ | 0 | | | $ | (33 | ) |
| | | | | 0.100 | | | Annual | | | 01/13/2023 | | | $ | | | 3,500 | | | | 0 | | | | 54 | | | | 54 | | | | 0 | | | | 0 | |
| | | | | 1.000 | | | Annual | | | 06/15/2027 | | | | | | 25,500 | | | | (1,032 | ) | | | (1,077 | ) | | | (2,109 | ) | | | 139 | | | | 0 | |
| | | | | 1.750 | | | Annual | | | 06/15/2032 | | | | | | 220 | | | | (9 | ) | | | (11 | ) | | | (20 | ) | | | 2 | | | | 0 | |
| | | | | 1.500 | | | Annual | | | 06/15/2052 | | | | | | 5,400 | | | | 468 | | | | 753 | | | | 1,221 | | | | 0 | | | | (82 | ) |
| | | | | 1.750 | | | Annual | | | 06/15/2052 | | | | | | 6,000 | | | | 713 | | | | 380 | | | | 1,093 | | | | 0 | | | | (54 | ) |
| | | | | 6.170 | | | Maturity | | | 01/02/2023 | | | BRL | | | 19,600 | | | | (4 | ) | | | (176 | ) | | | (180 | ) | | | 1 | | | | 0 | |
| | | | | 12.670 | | | Maturity | | | 01/02/2023 | | | | | | 800 | | | | 0 | | | | 1 | | | | 1 | | | | 0 | | | | 0 | |
| | | | | 12.690 | | | Maturity | | | 01/02/2023 | | | | | | 500 | | | | 0 | | | | 0 | | | | 0 | | | | 0 | | | | 0 | |
| | | | | 12.740 | | | Maturity | | | 01/02/2023 | | | | | | 1,300 | | | | 0 | | | | 1 | | | | 1 | | | | 0 | | | | 0 | |
| | | | | 12.750 | | | Maturity | | | 01/02/2023 | | | | | | 700 | | | | 0 | | | | 0 | | | | 0 | | | | 0 | | | | 0 | |
| | | | | 12.760 | | | Maturity | | | 01/02/2023 | | | | | | 1,200 | | | | 0 | | | | 1 | | | | 1 | | | | 0 | | | | 0 | |
| | | | | 12.900 | | | Maturity | | | 01/02/2023 | | | | | | 2,700 | | | | 0 | | | | 1 | | | | 1 | | | | 0 | | | | 0 | |
| | | | | 12.930 | | | Maturity | | | 01/02/2023 | | | | | | 300 | | | | 0 | | | | 0 | | | | 0 | | | | 0 | | | | 0 | |
| | | | | 12.939 | | | Maturity | | | 01/02/2023 | | | | | | 1,400 | | | | 0 | | | | 1 | | | | 1 | | | | 0 | | | | 0 | |
| | | | | 12.946 | | | Maturity | | | 01/02/2023 | | | | | | 3,400 | | | | 0 | | | | 1 | | | | 1 | | | | 0 | | | | 0 | |
| | | | | 12.960 | | | Maturity | | | 01/02/2023 | | | | | | 2,700 | | | | 0 | | | | 1 | | | | 1 | | | | 0 | | | | 0 | |
| | | | | 12.970 | | | Maturity | | | 01/02/2023 | | | | | | 4,500 | | | | 0 | | | | 2 | | | | 2 | | | | 0 | | | | 0 | |
| | | | | 11.140 | | | Maturity | | | 01/02/2025 | | | | | | 300 | | | | 0 | | | | (2 | ) | | | (2 | ) | | | 0 | | | | 0 | |
| | | | | 11.160 | | | Maturity | | | 01/02/2025 | | | | | | 200 | | | | 0 | | | | (1 | ) | | | (1 | ) | | | 0 | | | | 0 | |
| | | | | 11.350 | | | Maturity | | | 01/02/2025 | | | | | | 200 | | | | 0 | | | | (1 | ) | | | (1 | ) | | | 0 | | | | 0 | |
| | | | | 12.000 | | | Maturity | | | 01/02/2025 | | | | | | 600 | | | | 0 | | | | (1 | ) | | | (1 | ) | | | 0 | | | | 0 | |
| | | | | 12.080 | | | Maturity | | | 01/02/2025 | | | | | | 1,000 | | | | 0 | | | | (2 | ) | | | (2 | ) | | | 1 | | | | 0 | |
| | | | | 12.140 | | | Maturity | | | 01/02/2025 | | | | | | 500 | | | | 0 | | | | (1 | ) | | | (1 | ) | | | 0 | | | | 0 | |
| | | | | 12.145 | | | Maturity | | | 01/02/2025 | | | | | | 500 | | | | 0 | | | | (1 | ) | | | (1 | ) | | | 0 | | | | 0 | |
| | | | | 12.160 | | | Maturity | | | 01/02/2025 | | | | | | 1,000 | | | | 0 | | | | (2 | ) | | | (2 | ) | | | 1 | | | | 0 | |
| | | | | 11.220 | | | Maturity | | | 01/04/2027 | | | | | | 300 | | | | 0 | | | | (2 | ) | | | (2 | ) | | | 0 | | | | 0 | |
| | | | | 11.245 | | | Maturity | | | 01/04/2027 | | | | | | 100 | | | | 0 | | | | (1 | ) | | | (1 | ) | | | 0 | | | | 0 | |
| | | | | 11.260 | | | Maturity | | | 01/04/2027 | | | | | | 100 | | | | 0 | | | | (1 | ) | | | (1 | ) | | | 0 | | | | 0 | |
| | | | | 11.700 | | | Maturity | | | 01/04/2027 | | | | | | 100 | | | | 0 | | | | 0 | | | | 0 | | | | 0 | | | | 0 | |
| | | | | 11.715 | | | Maturity | | | 01/04/2027 | | | | | | 300 | | | | 0 | | | | (1 | ) | | | (1 | ) | | | 0 | | | | 0 | |
| | | | | 11.870 | | | Maturity | | | 01/04/2027 | | | | | | 800 | | | | 0 | | | | (3 | ) | | | (3 | ) | | | 1 | | | | 0 | |
| | | | | 3.300 | | | | | | 06/19/2024 | | | CAD | | | 4,900 | | | | 369 | | | | (383 | ) | | | (14 | ) | | | 5 | | | | 0 | |
| | | | | 3.500 | | | Semi-Annual | | | 06/20/2044 | | | | | | 600 | | | | (107 | ) | | | 124 | | | | 17 | | | | 0 | | | | (4 | ) |
| | | | | 0.250 | | | Semi-Annual | | | 06/16/2024 | | | $ | | | 3,000 | | | | 8 | | | | 165 | | | | 173 | | | | 0 | | | | (6 | ) |
| | | | | 3.000 | | | Semi-Annual | | | 06/19/2024 | | | | | | 4,400 | | | | (73 | ) | | | 95 | | | | 22 | | | | 0 | | | | (10 | ) |
| | | | | 1.500 | | | Semi-Annual | | | 12/15/2028 | | | | | | 1,250 | | | | (14 | ) | | | 128 | | | | 114 | | | | 0 | | | | (8 | ) |
| | | | | 1.750 | | | Semi-Annual | | | 01/15/2030 | | | | | | 600 | | | | (7 | ) | | | 56 | | | | 49 | | | | 0 | | | | (4 | ) |
| | | | | 2.000 | | | Semi-Annual | | | 02/12/2030 | | | | | | 4,400 | | | | (78 | ) | | | 368 | | | | 290 | | | | 0 | | | | (33 | ) |
| | | | | 2.000 | | | Semi-Annual | | | 03/10/2030 | | | | | | 500 | | | | 0 | | | | 33 | | | | 33 | | | | 0 | | | | (4 | ) |
| | | | | 1.000 | | | Semi-Annual | | | 12/16/2030 | | | | | | 400 | | | | (15 | ) | | | 77 | | | | 62 | | | | 0 | | | | (3 | ) |
| | | | | | | | | | | | |
| See Accompanying Notes | | | | | | | | | | JUNE 30, 2022 | | | |
| | | | | | |
| | PIMCO Global StocksPLUS & Income Fund | | | | |
| | | | | | | | | | | | | | | | | | | | | | | | | | | | | | | | | | | | | | |
| | | | | | | | | | | | | | | | | | Unrealized
Appreciation/
(Depreciation) | | | | | | | |
| | | | | | |
| | | | | 0.750 | % | | | | | 06/16/2031 | | | $ | | | 2,229 | | | $ | (211 | ) | | $ | (197 | ) | | $ | (408 | ) | | $ | 16 | | | $ | 0 | |
| | | | | 3.000 | | | Semi-Annual | | | 12/19/2048 | | | | | | 1,900 | | | | (6 | ) | | | 3 | | | | (3 | ) | | | 19 | | | | 0 | |
| | | | | 0.650 | | | Annual | | | 02/26/2029 | | | EUR | | | 6,100 | | | | 6 | | | | (504 | ) | | | (498 | ) | | | 96 | | | | 0 | |
| | | | | 0.150 | | | Annual | | | 03/18/2030 | | | | | | 1,300 | | | | (18 | ) | | | 232 | | | | 214 | | | | 0 | | | | (21 | ) |
| | | | | 0.150 | | | Annual | | | 06/17/2030 | | | | | | 3,000 | | | | (132 | ) | | | 578 | | | | 446 | | | | 0 | | | | (51 | ) |
| | | | | 0.250 | | | Annual | | | 09/21/2032 | | | | | | 800 | | | | 72 | | | | 82 | | | | 154 | | | | 0 | | | | (14 | ) |
| | | | | 1.250 | | | Annual | | | 08/19/2049 | | | | | | 2,700 | | | | 11 | | | | 442 | | | | 453 | | | | 0 | | | | (76 | ) |
| | | | | 0.250 | | | Annual | | | 03/18/2050 | | | | | | 400 | | | | 48 | | | | (207 | ) | | | (159 | ) | | | 9 | | | | 0 | |
| | | | | 0.500 | | | Annual | | | 06/17/2050 | | | | | | 1,000 | | | | 171 | | | | (518 | ) | | | (347 | ) | | | 25 | | | | 0 | |
| | | | | 4.550 | | | Lunar | | | 02/27/2023 | | | MXN | | | 18,200 | | | | 2 | | | | (30 | ) | | | (28 | ) | | | 0 | | | | 0 | |
| | | | | 4.500 | | | Lunar | | | 03/03/2023 | | | | | | 10,700 | | | | 0 | | | | (17 | ) | | | (17 | ) | | | 0 | | | | 0 | |
| | | | | 8.675 | | | Lunar | | | 04/03/2024 | | | | | | 2,700 | | | | 0 | | | | 2 | | | | 2 | | | | 0 | | | | 0 | |
| | | | | 8.660 | | | Lunar | | | 04/04/2024 | | | | | | 1,100 | | | | 0 | | | | 1 | | | | 1 | | | | 0 | | | | 0 | |
| | | | | 8.750 | | | Lunar | | | 04/05/2024 | | | | | | 1,000 | | | | 0 | | | | 1 | | | | 1 | | | | 0 | | | | 0 | |
| | | | | 8.410 | | | Lunar | | | 03/31/2027 | | | | | | 300 | | | | 0 | | | | 0 | | | | 0 | | | | 0 | | | | 0 | |
| | | | | 8.730 | | | Lunar | | | 04/06/2027 | | | | | | 400 | | | | 0 | | | | 0 | | | | 0 | | | | 0 | | | | 0 | |
| | | | | 7.495 | | | Lunar | | | 01/14/2032 | | | | | | 200 | | | | 1 | | | | 0 | | | | 1 | | | | 0 | | | | 0 | |
| | | | | 7.498 | | | Lunar | | | 01/15/2032 | | | | | | 800 | | | | 3 | | | | 1 | | | | 4 | | | | 0 | | | | 0 | |
| | | | | 8.732 | | | Lunar | | | 03/30/2032 | | | | | | 200 | | | | 0 | | | | 0 | | | | 0 | | | | 0 | | | | 0 | |
| | | | | 8.701 | | | Lunar | | | 03/31/2032 | | | | | | 500 | | | | 0 | | | | 0 | | | | 0 | | | | 0 | | | | 0 | |
| | | | | | | | | | | | | | | | | | | | | | | | | | | | | | | | | | | | | | |
| | | | | | $ | 398 | | | $ | 636 | | | $ | 1,034 | | | $ | 315 | | | $ | (403 | ) |
| | | | | | | | | | | | | | | | | | | | | | | | |
| | | | | | | | | | | | | | | | | | | | | | | | |
| | | | | | | | | | | | | | | | | | | | | | | |
FINANCIAL DERIVATIVE INSTRUMENTS: EXCHANGE-TRADED OR CENTRALLY CLEARED SUMMARY
The following is a summary of the market value and variation margin of Exchange-Traded or Centrally Cleared Financial Derivative Instruments as of June 30, 2022:
| | | | | | | | | | | | | | | | | | | | | | | | | | | | | | | | | | | | |
| | | Financial Derivative Assets | | | | | | Financial Derivative Liabilities | |
| | | | | | | | | | | | | | | | | | Variation Margin
Liability | | | | |
| | | | | | | | | | | | | | | | | | | | | | |
Total Exchange-Traded or Centrally Cleared | | | | | | | | | | | | | | | | | | | | | | | | | | | | | | | | | | | | |
| | | | | | | | | | | | | | | | | | | | | | | | | | | | | | | | | | | | |
Cash of $5,507 has been pledged as collateral for exchange-traded and centrally cleared financial derivative instruments as of June 30, 2022. See Note 8, Master Netting Arrangements, in the Notes to Financial Statements for more information.
| If the Fund is a seller of protection and a credit event occurs, as defined under the terms of that particular swap agreement, the Fund will either (i) pay to the buyer of protection an amount equal to the notional amount of the swap and take delivery of the referenced obligation or underlying securities comprising the referenced index or (ii) pay a net settlement amount in the form of cash, securities or other deliverable obligations equal to the notional amount of the swap less the recovery value of the referenced obligation or underlying securities comprising the referenced index. |
| Implied credit spreads, represented in absolute terms, utilized in determining the market value of credit default swap agreements on issues as of period end serve as indicators of the current status of the payment/performance risk and represent the likelihood or risk of default for the credit derivative. The implied credit spread of a particular referenced entity reflects the cost of buying/selling protection and may include upfront payments required to be made to enter into the agreement. Wider credit spreads represent a deterioration of the referenced entity’s credit soundness and a greater likelihood or risk of default or other credit event occurring as defined under the terms of the agreement. |
| The maximum potential amount the Fund could be required to pay as a seller of credit protection or receive as a buyer of credit protection if a credit event occurs as defined under the terms of that particular swap agreement. |
| The prices and resulting values for credit default swap agreements serve as indicators of the current status of the payment/performance risk and represent the likelihood of an expected liability (or profit) for the credit derivative should the notional amount of the swap agreement be closed/sold as of the period end. Increasing market values, in absolute terms when compared to the notional amount of the swap, represent a deterioration of the underlying referenced instrument’s credit soundness and a greater likelihood or risk of default or other credit event occurring as defined under the terms of the agreement. |
| This instrument has a forward starting effective date. See Note 2, Securities Transactions and Investment Income, in the Notes to Financial Statements for further information. |
(n) FINANCIAL DERIVATIVE INSTRUMENTS: OVER THE COUNTER
FORWARD FOREIGN CURRENCY CONTRACTS:
| | | | | | | | | | | | | | | | | | | | | | | | |
| Counterparty | | Settlement
Month | | | Currency to
be Delivered | | | Currency to
be Received | | | Unrealized Appreciation/ (Depreciation) | |
| | | | | | |
| | | 07/2022 | | | EUR | | | 241 | | | $ | | | 258 | | | $ | 6 | | | $ | 0 | |
| | | 07/2022 | | | $ | | | 52 | | | EUR | | | 49 | | | | 0 | | | | 0 | |
| | | 07/2022 | | | | | | 180 | | | PEN | | | 698 | | | | 4 | | | | (1 | ) |
| | | 08/2022 | | | JPY | | | 49,600 | | | $ | | | 372 | | | | 6 | | | | 0 | |
| | | 08/2022 | | | $ | | | 169 | | | NOK | | | 1,608 | | | | 0 | | | | (6 | ) |
| | | 08/2022 | | | | | | 52 | | | PEN | | | 200 | | | | 0 | | | | 0 | |
| | | 08/2022 | | | | | | 6 | | | RUB | | | 904 | | | | 10 | | | | 0 | |
| | | 11/2022 | | | | | | 7 | | | ZAR | | | 108 | | | | 0 | | | | 0 | |
| | | | | | |
| 48 | | PIMCO CLOSED-END FUNDS | | | See Accompanying Notes | |
| | | | | | | | | | | | | | | | | | | | | | | | |
| Counterparty | | Settlement
Month | | | Currency to
be Delivered | | | Currency to
be Received | | | Unrealized Appreciation/ (Depreciation) | |
| | Asset | | | Liability | |
| | | 02/2023 | | | PEN | | | 200 | | | $ | | | 51 | | | $ | 0 | | | $ | 0 | |
| | | | | | | |
| | | 07/2022 | | | AUD | | | 182 | | | | | | 126 | | | | 1 | | | | 0 | |
| | | 07/2022 | | | EUR | | | 371 | | | | | | 396 | | | | 7 | | | | 0 | |
| | | 07/2022 | | | GBP | | | 232 | | | | | | 287 | | | | 5 | | | | (1 | ) |
| | | 07/2022 | | | MXN | | | 547 | | | | | | 26 | | | | 0 | | | | (1 | ) |
| | | 07/2022 | | | $ | | | 106 | | | AUD | | | 154 | | | | 0 | | | | 0 | |
| | | 07/2022 | | | | | | 5,309 | | | EUR | | | 5,041 | | | | 0 | | | | (27 | ) |
| | | 07/2022 | | | | | | 79 | | | MXN | | | 1,596 | | | | 0 | | | | 0 | |
| | | 08/2022 | | | EUR | | | 4,123 | | | $ | | | 4,345 | | | | 16 | | | | 0 | |
| | | 08/2022 | | | GBP | | | 123 | | | | | | 149 | | | | 0 | | | | 0 | |
| | | 08/2022 | | | $ | | | 106 | | | IDR | | | 1,563,059 | | | | 0 | | | | (1 | ) |
| | | 08/2022 | | | | | | 17 | | | ZAR | | | 279 | | | | 0 | | | | 0 | |
| | | 09/2022 | | | MXN | | | 1,596 | | | $ | | | 78 | | | | 0 | | | | 0 | |
| | | 10/2022 | | | $ | | | 125 | | | PEN | | | 509 | | | | 7 | | | | 0 | |
| | | 11/2022 | | | | | | 20 | | | ZAR | | | 315 | | | | 0 | | | | (1 | ) |
| | | | | | | |
| | | 08/2022 | | | | | | 116 | | | IDR | | | 1,719,727 | | | | 0 | | | | (1 | ) |
| | | 08/2022 | | | | | | 307 | | | JPY | | | 41,600 | | | | 1 | | | | 0 | |
| | | 08/2022 | | | | | | 116 | | | NOK | | | 1,139 | | | | 0 | | | | (1 | ) |
| | | | | | | |
| | | 07/2022 | | | BRL | | | 7,823 | | | $ | | | 1,517 | | | | 22 | | | | 0 | |
| | | 07/2022 | | | PEN | | | 332 | | | | | | 86 | | | | 0 | | | | 0 | |
| | | 07/2022 | | | $ | | | 1,610 | | | BRL | | | 7,823 | | | | 0 | | | | (115 | ) |
| | | 08/2022 | | | PEN | | | 200 | | | $ | | | 50 | | | | 0 | | | | (3 | ) |
| | | 08/2022 | | | $ | | | 1,505 | | | BRL | | | 7,823 | | | | 0 | | | | (23 | ) |
| | | 11/2022 | | | | | | 46 | | | PEN | | | 181 | | | | 1 | | | | 0 | |
| | | 12/2022 | | | PEN | | | 225 | | | $ | | | 58 | | | | 0 | | | | 0 | |
| | | 12/2022 | | | $ | | | 298 | | | PEN | | | 1,251 | | | | 24 | | | | 0 | |
| | | 04/2023 | | | | | | 84 | | | | | | 332 | | | | 1 | | | | 0 | |
| | | | | | | |
| | | 08/2022 | | | TWD | | | 453 | | | $ | | | 15 | | | | 0 | | | | 0 | |
| | | 08/2022 | | | | | | $0 | | | RUB | | | 1 | | | | 0 | | | | 0 | |
| | | 10/2022 | | | | | | 21 | | | | | | 1,994 | | | | 11 | | | | 0 | |
| | | | | | | |
| | | 07/2022 | | | MXN | | | 1,049 | | | $ | | | 51 | | | | 0 | | | | (1 | ) |
| | | 10/2022 | | | $ | | | 52 | | | RUB | | | 4,921 | | | | 27 | | | | 0 | |
| | | 11/2022 | | | | | | 7 | | | ZAR | | | 114 | | | | 0 | | | | 0 | |
| | | | | | | |
| | | 07/2022 | | | CAD | | | 178 | | | $ | | | 141 | | | | 3 | | | | 0 | |
| | | 07/2022 | | | EUR | | | 219 | | | | | | 230 | | | | 1 | | | | 0 | |
| | | 07/2022 | | | GBP | | | 55 | | | | | | 68 | | | | 1 | | | | 0 | |
| | | 07/2022 | | | $ | | | 19 | | | AUD | | | 28 | | | | 0 | | | | 0 | |
| | | 07/2022 | | | | | | 53 | | | EUR | | | 50 | | | | 0 | | | | (1 | ) |
| | | 07/2022 | | | | | | 201 | | | GBP | | | 164 | | | | 0 | | | | (1 | ) |
| | | 08/2022 | | | AUD | | | 28 | | | $ | | | 19 | | | | 0 | | | | 0 | |
| | | 08/2022 | | | MXN | | | 1,794 | | | | | | 88 | | | | 0 | | | | (1 | ) |
| | | 08/2022 | | | $ | | | 10 | | | CLP | | | 8,590 | | | | 0 | | | | (1 | ) |
| | | 08/2022 | | | | | | 69 | | | IDR | | | 1,005,095 | | | | 0 | | | | (1 | ) |
| | | | | | | |
| | | 08/2022 | | | JPY | | | 26,502 | | | $ | | | 203 | | | | 7 | | | | 0 | |
| | | 08/2022 | | | TWD | | | 5,274 | | | | | | 179 | | | | 1 | | | | 0 | |
| | | 08/2022 | �� | | $ | | | 155 | | | IDR | | | 2,284,754 | | | | 0 | | | | (2 | ) |
| | | | | | | |
| | | 08/2022 | | | TWD | | | 1,568 | | | $ | | | 53 | | | | 0 | | | | 0 | |
| | | 08/2022 | | | $ | | | 131 | | | IDR | | | 1,934,613 | | | | 0 | | | | (1 | ) |
| | | 08/2022 | | | | | | 106 | | | JPY | | | 13,400 | | | | 0 | | | | (7 | ) |
| | | | | | | |
| | | 08/2022 | | | | | | 114 | | | | | | 14,800 | | | | 0 | | | | (5 | ) |
| | | | | | | |
| | | 07/2022 | | | EUR | | | 4,309 | | | $ | | | 4,631 | | | | 116 | | | | 0 | |
| | | 08/2022 | | | $ | | | 179 | | | NOK | | | 1,754 | | | | 0 | | | | (1 | ) |
| | | | | | | |
| | | 07/2022 | | | MXN | | | 1,132 | | | $ | | | 55 | | | | 0 | | | | (2 | ) |
| | | 09/2022 | | | $ | | | 1,108 | | | MXN | | | 22,069 | | | | 0 | | | | (23 | ) |
| | | 11/2022 | | | | | | 16 | | | ZAR | | | 253 | | | | 0 | | | | (1 | ) |
| | | | | | | | | | | | | | | | | | | | | | | | |
Total Forward Foreign Currency Contracts | | | | | | | | | |
| | | | | | | | | |
SWAP AGREEMENTS:
CREDIT DEFAULT SWAPS ON ASSET-BACKED SECURITIES - SELL PROTECTION
(1)
| | | | | | | | | | | | | | | | | | | | | | | | | | | | | | | | | | | | |
| Counterparty | | Reference Obligation | | | | | Payment
Frequency | | Maturity
Date | | | | | | | | | Unrealized
Appreciation/
(Depreciation) | | | Swap Agreements, | |
| | | | | | |
| BOA | | Long Beach Mortgage Loan Trust | | | 6.250% | | | Monthly | | | 07/25/2033 | | | $ | | | | | 112 | | | $ | 0 | | | $ | 1 | | | $ | 1 | | | $ | 0 | |
| | | | | | | | | | | | | | | | | | | | | | | | | | | | | | | | | | |
| | | | | | | | | | | | |
| See Accompanying Notes | | | | | | | | | | JUNE 30, 2022 | | | |
| | | | | | |
| | PIMCO Global StocksPLUS & Income Fund | | | | |
CREDIT DEFAULT SWAPS ON CREDIT INDICES - SELL PROTECTION
(1)
| | | | | | | | | | | | | | | | | | | | | | | | | | | | | | | | | | | | |
| Counterparty | | Index/Tranches | | | | | Payment
Frequency | | Maturity
Date | | | | | | | | | Unrealized
Appreciation/
(Depreciation) | | | Swap Agreements, at Value (3) | |
| | | | | | |
| GST | | | | | 0.320 | % | | Monthly | | | 07/25/2045 | | | $ | | | | | 898 | | | $ | (179 | ) | | $ | 118 | | | $ | 0 | | | $ | (61 | ) |
| | | | | 0.090 | | | Monthly | | | 08/25/2037 | | | | | | | | 653 | | | | (251 | ) | | | 177 | | | | 0 | | | | (74 | ) |
| | | | | | | | | | | | | | | | | | | | | | | | | | | | | | | | | | | | |
| | | | | | | | | | | | | | | | | | | | $ | (430 | ) | | $ | 295 | | | $ | 0 | | | $ | (135 | ) |
| | | | | | | | | | | | | | | | | | | | | | | | | | | | | | | | | | |
TOTAL RETURN SWAPS ON EQUITY INDICES
| | | | | | | | | | | | | | | | | | | | | | | | | | | | | | | | | | | | | | |
| | | | | | | | | | | | | | | | | | | | | Unrealized
Appreciation/
(Depreciation) | | | | |
| | | | | | |
| | | | | | | 688 | | | 1.530% (1-Month USD-LIBOR less a specified spread) | | Monthly | | 05/10/2023 | | $ | | | | | 4,258 | | | $ | 0 | | | $ | (4 | ) | | $ | 0 | | | $ | (4 | ) |
| | | | | | | | | | | | |
| | | | | | | 5,867 | | | 0.916% (1-Month USD-LIBOR less a specified spread) | | Maturity | | 10/12/2022 | | | | | | | 43,157 | | | | 0 | | | | (6,959 | ) | | | 0 | | | | (6,959 | ) |
| | | | | | | | | | | | |
| | | | | | | 64 | | | 1.580% (1-Month USD-LIBOR plus a specified spread) | | Monthly | | 05/24/2023 | | | | | | | 396 | | | | 0 | | | | 0 | | | | 0 | | | | 0 | |
| | | | | | | | | | | | |
| | | | | | | 29 | | | 1.660% (1-Month USD-LIBOR plus a specified spread) | | Monthly | | 07/13/2022 | | | | | | | 180 | | | | 0 | | | | 0 | | | | 0 | | | | 0 | |
| | | | | | | | | | | | | | | | | | | | | | | | | | | | | | | | | | | | | | |
| | | | | | | | | | | | | | | | | | | | | | $ | 0 | | | $ | (6,963 | ) | | $ | 0 | | | $ | (6,963 | ) |
| | | | | | | | | | | | | | | | | | | | | | | | | | | | | | | | | | | | |
| | | | | | | | | | | | | | | | | |
| | | | | | | | | | | | | | | | | |
FINANCIAL DERIVATIVE INSTRUMENTS: OVER THE COUNTER SUMMARY
The following is a summary by counterparty of the market value of OTC financial derivative instruments and collateral pledged/(received) as of June 30, 2022:
| | | | | | | | | | | | | | | | | | | | | | | | | | | | | | | | | | | | | | | | | | | | | | | | |
| | | Financial Derivative Assets | | | | | | Financial Derivative Liabilities | | | | | | | | | | |
| | Forward
Foreign
Currency
Contracts | | | | | | | | | | | | | | | Forward
Foreign
Currency
Contracts | | | | | | | | | | | | Net Market
Value of OTC
Derivatives | | | Collateral
Pledged/ (Received) | | | | |
| | $ | 26 | | | $ | 0 | | | $ | 1 | | | $ | 27 | | | | | | | $ | (7 | ) | | $ | 0 | | | $ | 0 | | | $ | (7 | ) | | $ | 20 | | | $ | 0 | | | $ | 20 | |
| | | 36 | | | | 0 | | | | 0 | | | | 36 | | | | | | | | (31 | ) | | | 0 | | | | 0 | | | | (31 | ) | | | 5 | | | | 0 | | | | 5 | |
| | | 1 | | | | 0 | | | | 0 | | | | 1 | | | | | | | | (2 | ) | | | 0 | | | | 0 | | | | (2 | ) | | | (1 | ) | | | 0 | | | | (1 | ) |
| | | 48 | | | | 0 | | | | 0 | | | | 48 | | | | | | | | (141 | ) | | | 0 | | | | 0 | | | | (141 | ) | | | (93 | ) | | | 0 | | | | (93 | ) |
| | | 11 | | | | 0 | | | | 0 | | | | 11 | | | | | | | | 0 | | | | 0 | | | | 0 | | | | 0 | | | | 11 | | | | 0 | | | | 11 | |
| | | 27 | | | | 0 | | | | 0 | | | | 27 | | | | | | | | (1 | ) | | | 0 | | | | 0 | | | | (1 | ) | | | 26 | | | | 0 | | | | 26 | |
| | | 0 | | | | 0 | | | | 0 | | | | 0 | | | | | | | | 0 | | | | 0 | | | | (135 | ) | | | (135 | ) | | | (135 | ) | | | 215 | | | | 80 | |
| | | 5 | | | | 0 | | | | 0 | | | | 5 | | | | | | | | (5 | ) | | | 0 | | | | 0 | | | | (5 | ) | | | 0 | | | | 0 | | | | 0 | |
| | | 8 | | | | 0 | | | | 0 | | | | 8 | | | | | | | | (2 | ) | | | 0 | | | | (4 | ) | | | (6 | ) | | | 2 | | | | 370 | | | | 372 | |
| | | 0 | | | | 0 | | | | 0 | | | | 0 | | | | | | | | (8 | ) | | | 0 | | | | (6,959 | ) | | | (6,967 | ) | | | (6,967 | ) | | | 6,522 | | | | (445 | ) |
| | | 0 | | | | 0 | | | | 0 | | | | 0 | | | | | | | | (5 | ) | | | 0 | | | | 0 | | | | (5 | ) | | | (5 | ) | | | 0 | | | | (5 | ) |
| | | 116 | | | | 0 | | | | 0 | | | | 116 | | | | | | | | (1 | ) | | | 0 | | | | 0 | | | | (1 | ) | | | 115 | | | | 0 | | | | 115 | |
| | | 0 | | | | 0 | | | | 0 | | | | 0 | | | | | | | | (26 | ) | | | 0 | | | | 0 | | | | (26 | ) | | | (26 | ) | | | 0 | | | | (26 | ) |
| | | | | | | | | | | | | | | | | | | | | | | | | | | | | | | | | | | | | | | | | | | | | | | | |
| | | | | | | | | | | | | | | | | | | | | | | | | | | | | | | | | | | | | | | | | | | | | | | | |
| | | | | | | | | | | | | | | | | | | | | | | | | | | | | | | | | | | | | | | | | | | | | | | | |
| Securities with an aggregate market value of $7,107 have been pledged as collateral for financial derivative instruments as governed by International Swaps and Derivatives Association, Inc. master agreements as of June 30, 2022. |
| If the Fund is a seller of protection and a credit event occurs, as defined under the terms of that particular swap agreement, the Fund will either (i) pay to the buyer of protection an amount equal to the notional amount of the swap and take delivery of the referenced obligation or underlying securities comprising the referenced index or (ii) pay a net settlement amount in the form of cash, securities or other deliverable obligations equal to the notional amount of the swap less the recovery value of the referenced obligation or underlying securities comprising the referenced index. |
| The maximum potential amount the Fund could be required to pay as a seller of credit protection or receive as a buyer of credit protection if a credit event occurs as defined under the terms of that particular swap agreement. |
| The prices and resulting values for credit default swap agreements serve as indicators of the current status of the payment/performance risk and represent the likelihood of an expected liability (or profit) for the credit derivative should the notional amount of the swap agreement be closed/sold as of the period end. Increasing market values, in absolute terms when compared to the notional amount of the swap, represent a deterioration of the underlying referenced instrument’s credit soundness and a greater likelihood or risk of default or other credit event occurring as defined under the terms of the agreement. |
| | | | | | |
| 50 | | PIMCO CLOSED-END FUNDS | | | See Accompanying Notes | |
| Receive represents that the Fund receives payments for any positive net return on the underlying reference. The Fund makes payments for any negative net return on such underlying reference. Pay represents that the Fund receives payments for any negative net return on the underlying reference. The Fund makes payments for any positive net return on such underlying reference. |
| Net Exposure represents the net receivable/(payable) that would be due from/to the counterparty in the event of default. Exposure from OTC financial derivative instruments can only be netted across transactions governed under the same master agreement with the same legal entity. See Note 8, Master Netting Arrangements, in the Notes to Financial Statements for more information. |
FAIR VALUE OF FINANCIAL DERIVATIVE INSTRUMENTS
The following is a summary of the fair valuation of the Fund’s derivative instruments categorized by risk exposure. See Note 7, Principal and Other Risks, in the Notes to Financial Statements on risks of the Fund.
Fair Values of Financial Derivative Instruments on the Statements of Assets and Liabilities as of June 30, 2022:
| | | | | | | | | | | | | | | | | | | | | | | | |
| | | Derivatives not accounted for as hedging instruments | |
| | | | | | | | | | | | | | | | | | | |
Financial Derivative Instruments - Assets | |
Exchange-traded or centrally cleared | |
| | $ | 0 | | | $ | 0 | | | $ | 134 | | | $ | 0 | | | $ | 0 | | | $ | 134 | |
| | | 0 | | | | 0 | | | | 0 | | | | 0 | | | | 315 | | | | 315 | |
| | | | | | | | | | | | | | | | | | | | | | | | |
| | $ | 0 | | | $ | 0 | | | $ | 134 | | | $ | 0 | | | $ | 315 | | | $ | 449 | |
| | | | | | | | | | | | | | | | | | | | | | | | |
| |
Forward Foreign Currency Contracts | | $ | 0 | | | $ | 0 | | | $ | 0 | | | $ | 278 | | | $ | 0 | | | $ | 278 | |
| | | 0 | | | | 1 | | | | 0 | | | | 0 | | | | 0 | | | | 1 | |
| | | | | | | | | | | | | | | | | | | | | | | | |
| | $ | 0 | | | $ | 1 | | | $ | 0 | | | $ | 278 | | | $ | 0 | | | $ | 279 | |
| | | | | | | | | | | | | | | | | | | | | | | | |
| | $ | 0 | | | $ | 1 | | | $ | 134 | | | $ | 278 | | | $ | 315 | | | $ | 728 | |
| | | | | | | | | | | | | | | | | | | | | | | | |
|
Financial Derivative Instruments - Liabilities | |
Exchange-traded or centrally cleared | |
| | $ | 0 | | | $ | 0 | | | $ | 1,621 | | | $ | 0 | | | $ | 0 | | | $ | 1,621 | |
| | | 0 | | | | 0 | | | | 340 | | | | 0 | | | | 0 | | | | 340 | |
| | | 0 | | | | 25 | | | | 0 | | | | 0 | | | | 403 | | | | 428 | |
| | | | | | | | | | | | | | | | | | | | | | | | |
| | $ | 0 | | | $ | 25 | | | $ | 1,961 | | | $ | 0 | | | $ | 403 | | | $ | 2,389 | |
| | | | | | | | | | | | | | | | | | | | | | | | |
| |
Forward Foreign Currency Contracts | | $ | 0 | | | $ | 0 | | | $ | 0 | | | $ | 229 | | | $ | 0 | | | $ | 229 | |
| | | 0 | | | | 135 | | | | 6,963 | | | | 0 | | | | 0 | | | | 7,098 | |
| | | | | | | | | | | | | | | | | | | | | | | | |
| | $ | 0 | | | $ | 135 | | | $ | 6,963 | | | $ | 229 | | | $ | 0 | | | $ | 7,327 | |
| | | | | | | | | | | | | | | | | | | | | | | | |
| | $ | 0 | | | $ | 160 | | | $ | 8,924 | | | $ | 229 | | | $ | 403 | | | $ | 9,716 | |
| | | | | | | | | | | | | | | | | | | | | | | | |
The effect of Financial Derivative Instruments on the Statements of Operations for the period ended June 30, 2022:
| | | | | | | | | | | | | | | | | | | | | | | | |
| | | Derivatives not accounted for as hedging instruments | |
| | | | | | | | | | | | | | | | | | | |
Net Realized Gain (Loss) on Financial Derivative Instruments | |
Exchange-traded or centrally cleared | |
| | $ | 0 | | | $ | 0 | | | $ | (963 | ) | | $ | 0 | | | $ | 0 | | | $ | (963 | ) |
| | | 0 | | | | 0 | | | | 4,833 | | | | 0 | | | | 0 | | | | 4,833 | |
| | | 0 | | | | 0 | | | | (3,323 | ) | | | 0 | | | | 0 | | | | (3,323 | ) |
| | | 0 | | | | 121 | | | | 0 | | | | 0 | | | | (120 | ) | | | 1 | |
| | | | | | | | | | | | | | | | | | | | | | | | |
| | $ | 0 | | | $ | 121 | | | $ | 547 | | | $ | 0 | | | $ | (120 | ) | | $ | 548 | |
| | | | | | | | | | | | | | | | | | | | | | | | |
| |
Forward Foreign Currency Contracts | | $ | 0 | | | $ | 0 | | | $ | 0 | | | $ | 1,784 | | | $ | 0 | | | $ | 1,784 | |
| | | 0 | | | | 0 | | | | 0 | | | | 0 | | | | (1 | ) | | | (1 | ) |
| | | 0 | | | | (28 | ) | | | 4,940 | | | | 0 | | | | 0 | | | | 4,912 | |
| | | | | | | | | | | | | | | | | | | | | | | | |
| | $ | 0 | | | $ | (28 | ) | | $ | 4,940 | | | $ | 1,784 | | | $ | (1 | ) | | $ | 6,695 | |
| | | | | | | | | | | | | | | | | | | | | | | | |
| | $ | 0 | | | $ | 93 | | | $ | 5,487 | | | $ | 1,784 | | | $ | (121 | ) | | $ | 7,243 | |
| | | | | | | | | | | | | | | | | | | | | | | | |
|
Net Change in Unrealized Appreciation (Depreciation) on Financial Derivative Instruments | |
Exchange-traded or centrally cleared | |
| | $ | 0 | | | $ | 0 | | | $ | (310 | ) | | $ | 0 | | | $ | 0 | | | $ | (310 | ) |
| | | 0 | | | | 0 | | | | 51 | | | | 0 | | | | 0 | | | | 51 | |
| | | 0 | | | | 0 | | | | (1,637 | ) | | | 0 | | | | 0 | | | | (1,637 | ) |
| | | 0 | | | | (229 | ) | | | 0 | | | | 0 | | | | (273 | ) | | | (502 | ) |
| | | | | | | | | | | | | | | | | | | | | | | | |
| | $ | 0 | | | $ | (229 | ) | | $ | (1,896 | ) | | $ | 0 | | | $ | (273 | ) | | $ | (2,398 | ) |
| | | | | | | | | | | | | | | | | | | | | | | | |
| | | | | | | | | | | | |
| See Accompanying Notes | | | | | | | | | | JUNE 30, 2022 | | | |
| | | | | | |
| | PIMCO Global StocksPLUS & Income Fund | | | | |
| | | | | | | | | | | | | | | | | | | | | | | | |
| | | Derivatives not accounted for as hedging instruments | |
| | | Commodity
Contracts | | | Credit
Contracts | | | Equity
Contracts | | | Foreign
Exchange
Contracts | | | Interest
Rate Contracts | | | Total | |
| |
Forward Foreign Currency Contracts | | $ | 0 | | | $ | 0 | | | $ | 0 | | | $ | (376 | ) | | $ | 0 | | | $ | (376 | ) |
| | | 0 | | | | 43 | | | | (14,744 | ) | | | 0 | | | | 0 | | | | (14,701 | ) |
| | | | | | | | | | | | | | | | | | | | | | | | |
| | $ | 0 | | | $ | 43 | | | $ | (14,744 | ) | | $ | (376 | ) | | $ | 0 | | | $ | (15,077 | ) |
| | | | | | | | | | | | | | | | | | | | | | | | |
| | $ | 0 | | | $ | (186 | ) | | $ | (16,640 | ) | | $ | (376 | ) | | $ | (273 | ) | | $ | (17,475 | ) |
| | | | | | | | | | | | | | | | | | | | | | | | |
FAIR VALUE MEASUREMENTS
The following is a summary of the fair valuations according to the inputs used as of June 30, 2022 in valuing the Fund’s assets and liabilities:
| | | | | | | | | | | | | | | | |
| | | | | | | | | | | | |
Investments in Securities, at Value | |
Loan Participations and Assignments | | $ | 0 | | | $ | 14,869 | | | $ | 6,807 | | | $ | 21,676 | |
| |
| | | 0 | | | | 9,463 | | | | 1,226 | | | | 10,689 | |
| | | 0 | | | | 23,712 | | | | 5,751 | | | | 29,463 | |
| | | 0 | | | | 5,890 | | | | 0 | | | | 5,890 | |
Convertible Bonds & Notes | |
| | | 0 | | | | 27 | | | | 0 | | | | 27 | |
| | | 0 | | | | 1,367 | | | | 0 | | | | 1,367 | |
| |
| | | 0 | | | | 13 | | | | 0 | | | | 13 | |
| | | 0 | | | | 788 | | | | 0 | | | | 788 | |
| | | 0 | | | | 713 | | | | 0 | | | | 713 | |
| | | 0 | | | | 37,994 | | | | 0 | | | | 37,994 | |
Non-Agency Mortgage-Backed Securities | | | 0 | | | | 15,523 | | | | 0 | | | | 15,523 | |
| | | 0 | | | | 7,260 | | | | 3,532 | | | | 10,792 | |
| | | 0 | | | | 2,711 | | | | 0 | | | | 2,711 | |
| |
| | | 286 | | | | 0 | | | | 126 | | | | 412 | |
| | | 117 | | | | 0 | | | | 8 | | | | 125 | |
| | | 0 | | | | 0 | | | | 960 | | | | 960 | |
| | | 0 | | | | 0 | | | | 372 | | | | 372 | |
| | | 0 | | | | 0 | | | | 23 | | | | 23 | |
| |
| | | 0 | | | | 0 | | | | 17 | | | | 17 | |
| |
| | | 0 | | | | 0 | | | | 19 | | | | 19 | |
| | | 0 | | | | 0 | | | | 72 | | | | 72 | |
| | | 0 | | | | 0 | | | | 1,120 | | | | 1,120 | |
| |
| | | 0 | | | | 3,810 | | | | 0 | | | | 3,810 | |
| | | 0 | | | | 25 | | | | 5,079 | | | | 5,104 | |
| | | | | | | | | | | | | | | | |
| Category and Subcategory | | Level 1 | | | Level 2 | | | Level 3 | | | Fair
Value at
06/30/2022 | |
Real Estate Investment Trusts | |
| | $ | 482 | | | $ | 0 | | | $ | 0 | | | $ | 482 | |
| |
| | | 0 | | | | 7,304 | | | | 0 | | | | 7,304 | |
| | | 0 | | | | 82 | | | | 0 | | | | 82 | |
| | | 0 | | | | 10,371 | | | | 0 | | | | 10,371 | |
U.S. Treasury Cash Management Bills | | | 0 | | | | 3,592 | | | | 0 | | | | 3,592 | |
| | | | | | | | | | | | | | | | |
| | | | |
| | $ | 885 | | | $ | 145,514 | | | $ | 25,112 | | | $ | 171,511 | |
| | | | | | | | | | | | | | | | |
|
Short Sales, at Value - Liabilities | |
| | $ | 0 | | | $ | (694 | ) | | $ | 0 | | | $ | (694 | ) |
| | | | | | | | | | | | | | | | |
|
Financial Derivative Instruments - Assets | |
Exchange-traded or centrally cleared | | | 134 | | | | 315 | | | | 0 | | | | 449 | |
| | | 0 | | | | 279 | | | | 0 | | | | 279 | |
| | | | | | | | | | | | | | | | |
| | $ | 134 | | | $ | 594 | | | $ | 0 | | | $ | 728 | |
| | | | | | | | | | | | | | | | |
|
Financial Derivative Instruments - Liabilities | |
Exchange-traded or centrally cleared | | | (1,961 | ) | | | (428 | ) | | | 0 | | | | (2,389 | ) |
| | | 0 | | | | (7,327 | ) | | | 0 | | | | (7,327 | ) |
| | | | | | | | | | | | | | | | |
| | $ | (1,961 | ) | | $ | (7,755 | ) | | $ | 0 | | | $ | (9,716 | ) |
| | | | | | | | | | | | | | | | |
| | | | |
Total Financial Derivative Instruments | | $ | (1,827 | ) | | $ | (7,161 | ) | | $ | 0 | | | $ | (8,988 | ) |
| | | | | | | | | | | | | | | | |
| | | | |
| | $ | (942 | ) | | $ | 137,659 | | | $ | 25,112 | | | $ | 161,829 | |
| | | | | | | | | | | | | | | | |
The following is a reconciliation of the fair valuations using significant unobservable inputs (Level 3) for the Fund during the period ended June 30, 2022:
| | | | | | | | | | | | | | | | | | | | | | | | | | | | | | | | | | | | | | | | |
| | Beginning
Balance
at 06/30/2021 | | | | | | | | | Accrued
Discounts/
(Premiums) | | | | | | Net Change in Unrealized Appreciation/ (Depreciation) (1) | | | | | | | | | Ending
Balance
at 06/30/2022 | | | Net Change in Unrealized Appreciation/ (Depreciation) on Investments Held at 06/30/2022 (1) | |
Investments in Securities, at Value | |
Loan Participations and Assignments | | $ | 1,368 | | | $ | 8,806 | | | $ | (1,242 | ) | | $ | 52 | | | $ | (111 | ) | | $ | (1,347 | ) | | $ | 0 | | | $ | (719 | ) | | $ | 6,807 | | | $ | (1,891 | ) |
| |
| | | 1,405 | | | | 0 | | | | 0 | | | | 0 | | | | 0 | | | | (179 | ) | | | 0 | | | | 0 | | | | 1,226 | | | | (179 | ) |
| | | 0 | | | | 4,543 | | | | (30 | ) | | | 0 | | | | 0 | | | | (400 | ) | | | 1,638 | | | | 0 | | | | 5,751 | | | | (400 | ) |
| | | 3,011 | | | | 334 | | | | 0 | | | | 0 | | | | 0 | | | | 187 | | | | 0 | | | | 0 | | | | 3,532 | | | | 187 | |
| |
| | | 432 | | | | 0 | | | | 0 | | | | 0 | | | | 0 | | | | (306 | ) | | | 0 | | | | 0 | | | | 126 | | | | (306 | ) |
| | | 0 | | | | 8 | | | | 0 | | | | 0 | | | | 0 | | | | 0 | | | | 0 | | | | 0 | | | | 8 | | | | 0 | |
| | | 0 | | | | 2,403 | | | | 0 | | | | 0 | | | | 0 | | | | (1,443 | ) | | | 0 | | | | 0 | | | | 960 | | | | (1,443 | ) |
| | | 57 | | | | 283 | | | | 0 | | | | 0 | | | | 0 | | | | 32 | | | | 0 | | | | 0 | | | | 372 | | | | 32 | |
| | | 709 | | | | 0 | | | | (690 | ) | | | 0 | | | | 54 | | | | (50 | ) | | | 0 | | | | 0 | | | | 23 | | | | 23 | |
| | | | | | | | | | | | | | | | | | | | | | | | | | | | | | | | | | | | | | | | |
| | | | | | |
| 52 | | PIMCO CLOSED-END FUNDS | | | See Accompanying Notes | |
| | | | | | | | | | | | | | | | | | | | | | | | | | | | | | | | | | | | | | | | |
| Category and Subcategory | | Beginning
Balance
at 06/30/2021 | | | Net
Purchases | | | Net
Sales/
Settlements | | | Accrued
Discounts/
(Premiums) | | | Realized
Gain/(Loss) | | | Net Change in Unrealized Appreciation/ (Depreciation) (1) | | | Transfers into
Level 3 | | | Transfers out
of Level 3 | | | Ending
Balance
at 06/30/2022 | | | Net Change in Unrealized Appreciation/ (Depreciation) on Investments Held at 06/30/2022 (1) | |
| | $ | 0 | | | $ | 0 | | | $ | 0 | | | $ | 0 | | | $ | 0 | | | $ | 17 | | | $ | 0 | | | $ | 0 | | | $ | 17 | | | $ | 17 | |
| | | | | | | | | | | | | | | | | | | | | | | | | | | | | | | | | | | | | | | | |
| | | 0 | | | | 816 | | | | 0 | | | | 0 | | | | (53 | ) | | | (744 | ) | | | 0 | | | | 0 | | | | 19 | | | | (744 | ) |
| | | 82 | | | | 0 | | | | 0 | | | | 0 | | | | 0 | | | | (10 | ) | | | 0 | | | | 0 | | | | 72 | | | | (9 | ) |
| | | 1,172 | | | | 0 | | | | 0 | | | | 0 | | | | 0 | | | | (52 | ) | | | 0 | | | | 0 | | | | 1,120 | | | | (52 | ) |
| | | | | | | | | | | | | | | | | | | | | | | | | | | | | | | | | | | | | | | | |
| | | 4,291 | | | | 0 | | | | 0 | | | | 0 | | | | 0 | | | | 788 | | | | 0 | | | | 0 | | | | 5,079 | | | | 788 | |
| | | | | | | | | | | | | | | | | | | | | | | | | | | | | | | | | | | | | | | | |
| | | | | | | | | | |
| | $ | 12,527 | | | $ | 17,193 | | | $ | (1,962 | ) | | $ | 52 | | | $ | (110 | ) | | $ | (3,507 | ) | | $ | 1,638 | | | $ | (719 | ) | | $ | 25,112 | | | $ | (3,977 | ) |
| | | | | | | | | | | | | | | | | | | | | | | | | | | | | | | | | | | | | | | | |
The following is a summary of significant unobservable inputs used in the fair valuations of assets and liabilities categorized within Level 3 of the fair value hierarchy:
| | | | | | | | | | | | | | | | | | | | |
| Category and Subcategory | | Ending
Balance
at 06/30/2022 | | | Valuation
Technique | | Unobservable
Inputs | | | | | (% Unless Noted Otherwise) | |
| | | | | | |
Investments in Securities, at Value | |
Loan Participations and Assignments | | $ | 850 | | | Discounted Cash Flow | | Discount Rate | | | | | | | 5.136 | | | | — | |
| | | 3,360 | | | Proxy Pricing | | Base Price | | | | | | | 65.125-99.500 | | | | 84.249 | |
| | | 2,597 | | | Third Party Vendor | | Broker Quote | | | | | | | 62.500-98.875 | | | | 93.179 | |
| | | | | | | | | | | | | | | | | | | | |
| | | 1,226 | | | Discounted Cash Flow | | Discount Rate | | | | | | | 6.704 | | | | — | |
| | | 4,142 | | | Discounted Cash Flow | | Discount Rate | | | | | | | 12.080 | | | | — | |
| | | 1,609 | | | Reference Instrument | | Weighted Average | | | BRL | | | | 42.864 | | | | — | |
| | | 2,767 | | | Discounted Cash Flow | | Discount Rate | | | | | | | 7.500-10.000 | | | | 9.035 | |
| | | 765 | | | Proxy Pricing | | Base Price | | | | | | | | | | | 81,939.270 | |
| | | | | | | | | | | | | | | | | | | | |
| | | 126 | | | Reference Instrument | | Liquidity Discount | | | | | | | 10.000 | | | | — | |
| | | 8 | | | Other Valuation Techniques (3) | | — | | | | | | | — | | | | — | |
| | | 960 | | | Indicative Market Quotation | | EBITDA Multiple | | | X | | | | 7.000 | | | | — | |
| | | 89 | | | Discounted Cash Flow | | Discount Rate | | | | | | | 9.500-17.100 | | | | 9.500 | |
| | | 283 | | | Reference Instrument | | Purchase Price | | | $ | | | | 0.980 | | | | — | |
| | | 23 | | | Comparable Companies | | EBITDA Multiple | | | X | | | | 0.977 | | | | — | |
| | | | | | | | | | | | | | | | | | | | |
| | | 17 | | | Other Valuation Techniques (3) | | — | | | | | | | — | | | | — | |
| |
| | | 1 | | | Indicative Market Quotation | | EBITDA Multiple | | | X | | | | 7.000 | | | | — | |
| | | 18 | | | Other Valuation Techniques (3) | | — | | | | | | | — | | | | — | |
| | | 72 | | | Comparable Companies | | EBITDA Multiple | | | X | | | | 10.700/9.100 | | | | — | |
| | | 1,120 | | | Comparable Companies/
Discounted Cash Flow | | EBITDA Multiple | | | X | | | | 3.875 | | | | — | |
| | | | | | | | | | | | | | | | | | | | |
| | | 4,396 | | | Comparable Companies | | EBITDA Multiple | | | X | | | | 10.700/9.100 | | | | — | |
| | | 683 | | | Comparable Companies/
Discounted Cash Flow | | Book Value Multiple
/Discount Rate | | | X/% | | | | 0.260/21.660 | | | | — | |
| | | | | | | | | | | | | | | | | | | | |
| | $ | 25,112 | | | | | | | | | | | | | | | | | |
| | | | | | | | | | | | | | | | | | | | |
| Any difference between Net Change in Unrealized Appreciation/(Depreciation) and Net Change in Unrealized Appreciation/(Depreciation) on Investments Held at June 30, 2022 may be due to an investment no longer held or categorized as Level 3 at period end. |
| Sector type updated from Financials to Materials since prior fiscal year end. |
| Includes valuation techniques not defined in the Notes to Financial Statements as securities valued using such techniques are not considered significant to the Fund. |
| | | | | | | | | | | | |
| See Accompanying Notes | | | ANNUAL REPORT | | | | | | | JUNE 30, 2022 | | | 53 |
| | | | | | |
| | PIMCO Strategic Income Fund, Inc. | | | | |
(Amounts in thousands*, except number of shares, contracts, units and ounces, if any)
| | | | | | | | | | | | |
| | | | | PRINCIPAL
AMOUNT
(000S) | | | | | MARKET
VALUE
(000S) | |
INVESTMENTS IN SECURITIES 204.8% | |
| |
LOAN PARTICIPATIONS AND ASSIGNMENTS 17.3% | |
|
| |
7.355% (LIBOR03M + 5.600%) due 02/01/2030 ~ | | $ | | | 700 | | | $ | | | 636 | |
|
| |
| | | | | 6,488 | | | | | | 6,034 | |
| | | | |
Caesars Resort Collection LLC | | | | | | | | | | | | |
4.416% (LIBOR01M + 2.750%) due 12/23/2024 ~ | | | | | 99 | | | | | | 96 | |
| |
| | | | |
6.127% (LIBOR06M + 3.250%) due 10/18/2028 «~ | | | | | 463 | | | | | | 416 | |
| |
Envision Healthcare Corp. | | | | |
| | | | | 523 | | | | | | 517 | |
| | | | | 2,877 | | | | | | 2,841 | |
| |
Forbes Energy Services LLC (7.000% PIK) | | | | |
7.000% due 09/30/2022 «(b) | | | | | 65 | | | | | | 0 | |
| |
Gateway Casinos & Entertainment Ltd. | | | | |
9.590% (LIBOR03M + 8.000%) due 10/15/2027 ~ | | | | | 2,685 | | | | | | 2,653 | |
| | CAD | | | 586 | | | | | | 450 | |
| |
Instant Brands Holdings, Inc. | | | | |
6.400% - 7.076% (LIBOR03M + 5.000%) due 04/12/2028 ~ | | $ | | | 2,663 | | | | | | 2,139 | |
| |
Intelsat Jackson Holdings SA | | | | |
| | | | | 1,390 | | | | | | 1,275 | |
| |
| | | | |
4.666% (LIBOR01M + 3.000%) due 06/28/2024 «~ | | | | | 28 | | | | | | 17 | |
|
Lealand Finance Co. BV (2.666% Cash and 3.000% PIK) | |
5.666% (LIBOR01M + 1.000%) due 06/30/2025 ~(b) | | | | | 187 | | | | | | 96 | |
| |
| | | | |
| | | | | 1,000 | | | | | | 570 | |
| |
Promotora de Informaciones SA | | | | |
5.250% (EUR003M + 5.250%) due 12/31/2026 ~ | | EUR | | | 3,792 | | | | | | 3,566 | |
9.000% (EUR003M + 8.000%) due 06/30/2027 ~ | | | | | 1,222 | | | | | | 1,161 | |
| | |
| | | | | | | |
5.166% (LIBOR01M + 3.500%) due 02/12/2027 ~ | | $ | | | 16 | | | | | | 14 | |
| | |
Sequa Mezzanine Holdings LLC | | | | | | | |
8.303% (LIBOR03M + 6.750%) due 11/28/2023 ~ | | | | | 84 | | | | | | 83 | |
| | |
| | | | | | | |
| | | | | 1,793 | | | | | | 1,793 | |
| | |
Steenbok Lux Finco 1 SARL (10.000% PIK) | | | | | | | |
10.000% (LIBOR03M) due 12/31/2022 ~(b) | | EUR | | | 4,416 | | | | | | 2,800 | |
| | |
Steenbok Lux Finco 2 SARL (10.750% PIK) | | | | | | | |
10.750% (EUR003M) due 12/29/2022 «~(b) | | | | | 4,748 | | | | | | 3,060 | |
| | |
Steenbok Lux Finco 2 SARL (7.875% PIK) | | | | | | | |
7.875% (EUR003M) due 12/29/2022 ~(b) | | | | | 579 | | | | | | 604 | |
| | |
| | | | | | | |
| | $ | | | 3,713 | | | | | | 3,277 | |
| | |
Team Health Holdings, Inc. | | | | | | | |
4.416% (LIBOR01M + 2.750%) due 02/06/2024 ~ | | | | | 1,662 | | | | | | 1,484 | |
| | |
Univision Communications, Inc. | | | | | | | |
4.416% (LIBOR01M + 2.750%) due 03/15/2024 ~ | | | | | 745 | | | | | | 733 | |
|
Westmoreland Mining Holdings LLC (15.000% PIK) | |
15.000% due 03/15/2029 (b) | | | | | 6 | | | | | | 4 | |
| | |
| | | | | | | |
7.916% (LIBOR01M + 6.250%) due 09/21/2027 ~ | | | | | 17 | | | | | | 16 | |
| | | | | | | | | | | | |
Total Loan Participations and Assignments (Cost $45,505) | | | | | | | |
| | | | | | | | | | | | |
| | | | | | | | | | | | |
| | | | | | | | | | | |
CORPORATE BONDS & NOTES 60.5% | |
| |
| |
| | |
| | | | | | | |
| | EUR | | | 200 | | | $ | | | 109 | |
| | |
| | | | | | | |
| | $ | | | 1 | | | | | | 1 | |
| | |
| | | | | | | |
8.500% due 11/15/2029 (l) | | | | | 2,400 | | | | | | 1,987 | |
| | |
Banca Monte dei Paschi di Siena SpA | | | | | | | |
1.875% due 01/09/2026 (l) | | EUR | | | 400 | | | | | | 351 | |
2.625% due 04/28/2025 (l) | | | | | 2,100 | | | | | | 1,955 | |
3.625% due 09/24/2024 (l) | | | | | 1,300 | | | | | | 1,261 | |
5.375% due 01/18/2028 •(l) | | | | | 400 | | | | | | 249 | |
8.000% due 01/22/2030 •(l) | | | | | 1,304 | | | | | | 875 | |
8.500% due 09/10/2030 •(l) | | | | | 400 | | | | | | 278 | |
10.500% due 07/23/2029 (l) | | | | | 1,360 | | | | | | 997 | |
| | |
Banco de Credito del Peru SA | | | | | | | |
| | PEN | | | 400 | | | | | | 97 | |
|
| |
4.900% due 06/04/2025 •(h)(i)(l) | | $ | | | 1,811 | | | | | | 1,684 | |
|
| |
6.375% due 12/15/2025 •(h)(i)(l) | | GBP | | | 200 | | | | | | 225 | |
7.125% due 06/15/2025 •(h)(i)(l) | | | | | 900 | | | | | | 1,054 | |
|
Corestate Capital Holding SA | |
| | EUR | | | 600 | | | | | | 142 | |
|
Country Garden Holdings Co. Ltd. | |
5.400% due 05/27/2025 (l) | | $ | | | 1,000 | | | | | | 542 | |
6.150% due 09/17/2025 (l) | | | | | 200 | | | | | | 108 | |
|
| |
6.375% due 08/21/2026 •(h)(i)(l) | | | | | 600 | | | | | | 497 | |
7.500% due 07/17/2023 •(h)(i)(l) | | | | | 200 | | | | | | 185 | |
|
| |
2.950% due 07/15/2031 (l) | | | | | 100 | | | | | | 78 | |
|
Fairfax India Holdings Corp. | |
5.000% due 02/26/2028 (l) | | | | | 2,400 | | | | | | 2,336 | |
|
| |
4.250% due 09/22/2022 (l) | | | | | 200 | | | | | | 187 | |
|
| |
| | | | | 100 | | | | | | 80 | |
|
| |
3.625% due 09/30/2030 (l) | | | | | 1,000 | | | | | | 770 | |
4.500% due 05/29/2029 (l) | | | | | 2,000 | | | | | | 1,667 | |
| | | | | 200 | | | | | | 184 | |
| | | | | 200 | | | | | | 181 | |
|
| |
8.000% due 08/10/2025 •(h)(i)(l) | | | | | 300 | | | | | | 298 | |
|
| |
5.000% due 08/08/2022 (l) | | | | | 200 | | | | | | 196 | |
|
| |
8.625% due 06/25/2034 «(j) | | | | | 2,600 | | | | | | 2,899 | |
|
| |
7.375% due 10/04/2023 •(h)(i)(l) | | | | | 200 | | | | | | 193 | |
|
Tesco Property Finance PLC | |
| | GBP | | | 92 | | | | | | 114 | |
|
| |
7.830% due 12/04/2023 (l) | | $ | | | 2,240 | | | | | | 2,320 | |
|
| |
6.000% due 01/15/2030 (l) | | | | | 2,738 | | | | | | 1,898 | |
7.875% due 02/15/2025 (l) | | | | | 754 | | | | | | 730 | |
|
| |
| | | | | 100 | | | | | | 92 | |
| | | | | 100 | | | | | | 95 | |
| | | | | | | | | | | | |
| | | | | | | | | | | 26,915 | |
| | | | | | | | | | | | |
| |
| |
|
| |
5.500% due 07/31/2050 (l) | | GBP | | | 2,500 | | | | | | 2,975 | |
|
Air Canada Pass-Through Trust | |
| | $ | | | 1,946 | | | | | | 1,846 | |
|
American Airlines Pass-Through Trust | |
3.000% due 04/15/2030 (l) | | | | | 149 | | | | | | 136 | |
| | | | | | | | | | | | |
| | | | | PRINCIPAL
AMOUNT
(000S) | | | | | MARKET
VALUE
(000S) | |
3.350% due 04/15/2031 (l) | | $ | | | 940 | | | $ | | | 866 | |
3.700% due 04/01/2028 (l) | | | | | 900 | | | | | | 782 | |
| | | | |
| | | | | | | | | | | | |
5.705% due 05/01/2040 (l) | | | | | 586 | | | | | | 548 | |
5.805% due 05/01/2050 (l) | | | | | 557 | | | | | | 513 | |
5.930% due 05/01/2060 (l) | | | | | 878 | | | | | | 801 | |
6.125% due 02/15/2033 (l) | | | | | 716 | | | | | | 722 | |
| | | | |
| | | | | | | | | | | | |
7.125% due 06/15/2026 (l) | | | | | 1,500 | | | | | | 1,241 | |
| | | | |
| | | | | | | | | | | | |
3.137% due 11/15/2035 (l) | | | | | 200 | | | | | | 152 | |
3.187% due 11/15/2036 (l) | | | | | 1,110 | | | | | | 845 | |
| | | | | 100 | | | | | | 83 | |
3.469% due 04/15/2034 (l) | | | | | 200 | | | | | | 163 | |
3.500% due 02/15/2041 (l) | | | | | 800 | | | | | | 605 | |
3.750% due 02/15/2051 (l) | | | | | 300 | | | | | | 223 | |
4.150% due 11/15/2030 (l) | | | | | 82 | | | | | | 75 | |
4.926% due 05/15/2037 (l) | | | | | 106 | | | | | | 95 | |
| | | | |
| | | | | | | | | | | | |
10.250% due 05/01/2030 (l) | | | | | 900 | | | | | | 741 | |
| | | | |
| | | | | | | | | | | | |
3.569% due 12/01/2031 (l) | | | | | 700 | | | | | | 580 | |
| | | | |
| | | | | | | | | | | | |
3.875% due 07/07/2041 (l) | | | | | 1,400 | | | | | | 963 | |
| | | | |
| | | | | | | | | | | | |
7.750% due 04/01/2027 (l) | | EUR | | | 416 | | | | | | 373 | |
8.750% due 04/01/2027 (l) | | $ | | | 4,612 | | | | | | 3,930 | |
|
Charter Communications Operating LLC | |
3.500% due 06/01/2041 (l) | | | | | 500 | | | | | | 351 | |
3.850% due 04/01/2061 (l) | | | | | 300 | | | | | | 198 | |
3.900% due 06/01/2052 (l) | | | | | 2,900 | | | | | | 2,019 | |
4.400% due 12/01/2061 (l) | | | | | 4,700 | | | | | | 3,390 | |
4.800% due 03/01/2050 (l) | | | | | 105 | | | | | | 83 | |
|
Community Health Systems, Inc. | |
8.000% due 03/15/2026 (l) | | | | | 294 | | | | | | 269 | |
|
| |
7.507% due 01/10/2032 (l) | | | | | 618 | | | | | | 674 | |
|
| |
5.300% due 04/01/2044 (l) | | | | | 100 | | | | | | 87 | |
|
| |
| | | | | 48 | | | | | | 16 | |
|
Frontier Communications Holdings LLC | |
6.000% due 01/15/2030 (l) | | | | | 706 | | | | | | 545 | |
|
Gazprom PJSC Via Gaz Capital SA | |
| | | | | 1,710 | | | | | | 641 | |
|
| |
4.500% due 10/01/2030 (l) | | | | | 3,419 | | | | | | 3,116 | |
|
Intelsat Jackson Holdings SA | |
6.500% due 03/15/2030 (l) | | | | | 7,256 | | | | | | 6,004 | |
|
| |
3.200% due 08/08/2024 (l) | | | | | 100 | | | | | | 95 | |
3.500% due 08/18/2026 (l) | | | | | 200 | | | | | | 174 | |
3.900% due 08/08/2029 (l) | | | | | 300 | | | | | | 245 | |
|
| |
4.279% due 03/15/2032 (l) | | | | | 800 | | | | | | 716 | |
|
| |
4.810% due 09/17/2030 (l) | | | | | 6,000 | | | | | | 5,336 | |
|
Noble Corp. PLC (11.000% Cash or 15.000% PIK) | |
11.000% due 02/15/2028 (b) | | | | | 54 | | | | | | 59 | |
|
| |
3.850% due 04/01/2060 (l) | | | | | 200 | | | | | | 137 | |
4.100% due 03/25/2061 (j)(l) | | | | | 1,000 | | | | | | 710 | |
|
| |
| | EUR | | | 3,538 | | | | | | 2,790 | |
5.950% due 01/28/2031 (l) | | $ | | | 1,088 | | | | | | 799 | |
6.750% due 09/21/2047 (l) | | | | | 2,996 | | | | | | 1,860 | |
6.950% due 01/28/2060 (l) | | | | | 150 | | | | | | 93 | |
| | | | | 60 | | | | | | 41 | |
|
| |
1.985% due 07/13/2033 (l) | | EUR | | | 500 | | | | | | 352 | |
| | $ | | | 1,100 | | | | | | 811 | |
3.680% due 01/21/2030 (l) | | | | | 2,900 | | | | | | 2,313 | |
|
| |
| | EUR | | | 200 | | | | | | 197 | |
| | | | | | |
| 54 | | PIMCO CLOSED-END FUNDS | | | See Accompanying Notes | |
| | | | | | | | | | | | |
| | | | | PRINCIPAL
AMOUNT
(000S) | | | | | MARKET
VALUE
(000S) | |
|
| |
2.550% due 03/08/2027 (l) | | $ | | | 400 | | | $ | | | 292 | |
3.100% due 03/08/2029 (l) | | | | | 400 | | | | | | 284 | |
3.250% due 08/08/2031 (l) | | | | | 200 | | | | | | 132 | |
3.800% due 01/08/2026 (l) | | | | | 400 | | | | | | 321 | |
4.875% due 06/18/2030 (l) | | | | | 200 | | | | | | 146 | |
5.125% due 08/08/2025 (l) | | | | | 200 | | | | | | 168 | |
5.400% due 08/08/2028 (l) | | | | | 2,998 | | | | | | 2,316 | |
|
| |
3.649% due 04/29/2031 (l) | | | | | 500 | | | | | | 425 | |
|
Schenck Process Holding GmbH | |
6.875% due 06/15/2023 (l) | | EUR | | | 200 | | | | | | 206 | |
|
| |
3.950% due 06/15/2023 (l) | | $ | | | 1,360 | | | | | | 1,277 | |
|
| |
5.000% due 01/15/2029 (l) | | | | | 400 | | | | | | 207 | |
|
| |
5.182% due 04/24/2028 (l) | | | | | 200 | | | | | | 203 | |
5.676% due 04/24/2048 (l) | | | | | 3,209 | | | | | | 3,298 | |
|
| |
4.875% due 09/30/2039 (l) | | | | | 790 | | | | | | 685 | |
| | | | | 2,026 | | | | | | 1,843 | |
|
| |
6.125% due 08/01/2025 (l) | | | | | 49 | | | | | | 45 | |
|
| |
7.250% due 11/01/2025 (l) | | | | | 120 | | | | | | 89 | |
| | | | | 38 | | | | | | 25 | |
|
U.S. Airways Pass-Through Trust | |
3.950% due 05/15/2027 (l) | | | | | 95 | | | | | | 87 | |
|
| |
10.625% due 07/15/2027 (l) | | | | | 4,154 | | | | | | 1,568 | |
|
United Airlines Pass-Through Trust | |
| | | | | 80 | | | | | | 75 | |
|
Valaris Ltd. (8.250% Cash or 12.000% PIK) | |
8.250% due 04/30/2028 (b)(l) | | | | | 1,960 | | | | | | 1,904 | |
8.250% due 04/30/2028 (b) | | | | | 9 | | | | | | 9 | |
|
| |
0.000% due 12/29/2049 «~(h) | | BRL | | | 50,000 | | | | | | 4,020 | |
|
| |
13.000% due 05/15/2025 (l) | | $ | | | 100 | | | | | | 103 | |
|
Wesco Aircraft Holdings, Inc. (7.500% Cash and 3.000% PIK) | |
10.500% due 11/15/2026 «(b) | | | | | 10,641 | | | | | | 10,098 | |
| | | | | | | | | | | | |
| | | | | | | | | | | 83,205 | |
| | | | | | | | | | | | |
| |
| |
|
DTEK Finance PLC (3.500% Cash and 3.500% PIK) | |
7.000% due 12/31/2027 (b) | | | | | 2,335 | | | | | | 562 | |
|
| |
5.750% due 12/01/2040 (l) | | | | | 1,224 | | | | | | 891 | |
|
| |
6.750% due 12/31/2026 (l) | | | | | 1,479 | | | | | | 658 | |
|
Odebrecht Offshore Drilling Finance Ltd. | |
6.720% due 12/01/2022 ^(l) | | | | | 131 | | | | | | 126 | |
|
Oi SA (10.000% Cash or 12.000% PIK) | |
10.000% due 07/27/2025 (b)(l) | | | | | 3,220 | | | | | | 1,581 | |
|
Pacific Gas & Electric Co. | |
3.500% due 08/01/2050 (l) | | | | | 574 | | | | | | 384 | |
| | | | | 100 | | | | | | 68 | |
3.950% due 12/01/2047 (l) | | | | | 300 | | | | | | 208 | |
4.000% due 12/01/2046 (l) | | | | | 200 | | | | | | 141 | |
4.200% due 03/01/2029 (l) | | | | | 1,300 | | | | | | 1,162 | |
4.200% due 06/01/2041 (l) | | | | | 200 | | | | | | 147 | |
4.300% due 03/15/2045 (l) | | | | | 950 | | | | | | 692 | |
4.450% due 04/15/2042 (l) | | | | | 220 | | | | | | 165 | |
4.500% due 07/01/2040 (l) | | | | | 708 | | | | | | 550 | |
4.550% due 07/01/2030 (l) | | | | | 1,104 | | | | | | 982 | |
| | | | | 100 | | | | | | 76 | |
4.750% due 02/15/2044 (l) | | | | | 2,296 | | | | | | 1,764 | |
4.950% due 07/01/2050 (l) | | | | | 765 | | | | | | 612 | |
|
| |
5.375% due 03/22/2030 (l) | | | | | 2,800 | | | | | | 2,268 | |
| | | | | | | | | | | | |
| | | | | PRINCIPAL
AMOUNT
(000S) | | | | | MARKET
VALUE
(000S) | |
|
PG&E Wildfire Recovery Funding LLC | |
4.263% due 06/01/2038 (l) | | $ | | | 1,400 | | | $ | | | 1,410 | |
4.377% due 06/01/2041 (l) | | | | | 1,500 | | | | | | 1,483 | |
|
| |
9.250% due 07/06/2024 (l) | | | | | 291 | | | | | | 302 | |
9.750% due 01/06/2027 (l) | | | | | 530 | | | | | | 566 | |
|
Southern California Edison Co. | |
4.875% due 03/01/2049 (l) | | | | | 100 | | | | | | 91 | |
|
| |
| | | | | 56 | | | | | | 50 | |
| | | | | | | | | | | | |
| | | | | | | | | | | 16,939 | |
| | | | | | | | | | | | |
Total Corporate Bonds & Notes (Cost $160,052) | | | | | | | |
| | | | | | | | | | | | |
| |
CONVERTIBLE BONDS & NOTES 0.1% | |
| |
| |
|
Corestate Capital Holding SA | |
1.375% due 11/28/2022 (l) | | EUR | | | 700 | | | | | | 191 | |
| | | | | | | | | | | | |
Total Convertible Bonds & Notes (Cost $793) | | | | | | | |
| | | | | | | | | | | | |
| |
MUNICIPAL BONDS & NOTES 2.4% | |
| |
| |
|
Golden State, California Tobacco Securitization Corp. Revenue Bonds, Series 2021 | |
| | $ | | | 90 | | | | | | 79 | |
| | | | | 1,000 | | | | | | 843 | |
| | | | | 1,000 | | | | | | 903 | |
| | | | | | | | | | | | |
| | | | | | | | | | | 1,825 | |
| | | | | | | | | | | | |
| |
| |
|
Chicago, Illinois General Obligation Bonds, Series 2017 | |
| | | | | 50 | | | | | | 53 | |
|
Illinois State General Obligation Bonds, (BABs), Series 2010 | |
| | | | | 15 | | | | | | 16 | |
|
Illinois State General Obligation Bonds, Series 2003 | |
| | | | | 55 | | | | | | 55 | |
| | | | | | | | | | | | |
| | | | | | | | | | | 124 | |
| | | | | | | | | | | | |
| |
| |
|
Commonwealth of Puerto Rico Bonds, Series 2022 | |
0.000% due 11/01/2043 (f) | | | | | 1,151 | | | | | | 574 | |
|
Commonwealth of Puerto Rico General Obligation Bonds, Series 2021 | |
0.000% due 07/01/2033 (f) | | | | | 91 | | | | | | 51 | |
| | | | | 70 | | | | | | 65 | |
| | | | | 63 | | | | | | 57 | |
| | | | | 54 | | | | | | 48 | |
| | | | | 54 | | | | | | 47 | |
|
Commonwealth of Puerto Rico General Obligation Notes, Series 2021 | |
0.000% due 07/01/2024 (f) | | | | | 36 | | | | | | 33 | |
| | | | | 79 | | | | | | 80 | |
| | | | | | | | | | | | |
| | | | | | | | | | | 955 | |
| | | | | | | | | | | | |
| |
| |
|
Tobacco Settlement Finance Authority, West Virginia Revenue Bonds, Series 2007 | |
0.000% due 06/01/2047 (f) | | | | | 25,300 | | | | | | 2,049 | |
| | | | | | | | | | | | |
Total Municipal Bonds & Notes (Cost $5,625) | | | | |
| | | | | | | | | | | | |
| |
U.S. GOVERNMENT AGENCIES 63.1% | |
|
| |
1.124% due 12/25/2042 ~(a) | | | | | 3,286 | | | | | | 99 | |
1.291% due 08/25/2054 ~(a)(l) | | | | | 6,008 | | | | | | 250 | |
1.624% (SOFR30A + 2.550%) due 02/25/2052 ~(a)(l) | | | | | 134,952 | | | | | | 3,581 | |
| | | | | | | | | | | | |
| | | | | PRINCIPAL
AMOUNT
(000S) | | | | | MARKET
VALUE
(000S) | |
| | $ | | | 2 | | | $ | | | 2 | |
| | | | | 11 | | | | | | 11 | |
| | | | | 8 | | | | | | 8 | |
2.479% due 03/01/2032 •(l) | | | | | 55 | | | | | | 55 | |
2.500% due 12/25/2027 (a)(l) | | | | | 1,127 | | | | | | 50 | |
3.000% due 06/25/2050 (a)(l) | | | | | 1,236 | | | | | | 249 | |
3.500% due 07/25/2036 (a)(l) | | | | | 3,828 | | | | | | 459 | |
3.500% due 07/25/2042 -
12/25/2049 (a) | | | | | 461 | | | | | | 57 | |
4.000% due 06/25/2050 (a)(l) | | | | | 714 | | | | | | 133 | |
4.250% due 11/25/2024 (l) | | | | | 63 | | | | | | 62 | |
4.376% (US0001M + 6.000%) due 10/25/2049 ~(a)(l) | | | | | 6,497 | | | | | | 895 | |
4.426% due 02/25/2049 •(a) | | | | | 91 | | | | | | 10 | |
4.476% due 07/25/2050 •(a)(l) | | | | | 1,103 | | | | | | 146 | |
4.500% due 07/25/2040 (l) | | | | | 401 | | | | | | 398 | |
| | | | | 18 | | | | | | 18 | |
4.996% due 02/25/2042 ~(l) | | | | | 288 | | | | | | 291 | |
5.000% due 07/25/2037 (a) | | | | | 580 | | | | | | 89 | |
5.000% due 01/25/2038 -
07/25/2038 (l) | | | | | 2,967 | | | | | | 3,115 | |
5.126% due 07/25/2041 •(a)(l) | | | | | 495 | | | | | | 68 | |
| | | | | 8 | | | | | | 8 | |
5.500% due 07/25/2024 -
11/25/2032 | | | | | 1,767 | | | | | | 1,879 | |
5.500% due 12/25/2034 -
04/25/2035 (l) | | | | | 1,522 | | | | | | 1,576 | |
| | | | | 13 | | | | | | 13 | |
| | | | | 216 | | | | | | 229 | |
5.807% due 08/25/2043 (l) | | | | | 904 | | | | | | 934 | |
6.000% due 09/25/2031 (l) | | | | | 91 | | | | | | 96 | |
| | | | | 640 | | | | | | 675 | |
6.500% due 06/25/2023 -
11/01/2047 | | | | | 1,907 | | | | | | 2,042 | |
6.500% due 09/25/2031 -
04/01/2037 (l) | | | | | 478 | | | | | | 506 | |
| | | | | 4 | | | | | | 4 | |
7.000% due 06/18/2027 -
01/01/2047 | | | | | 253 | | | | | | 270 | |
7.000% due 02/25/2035 -
03/25/2045 (l) | | | | | 393 | | | | | | 419 | |
| | | | | 232 | | | | | | 236 | |
| | | | | 660 | | | | | | 706 | |
7.500% due 10/25/2022 -
03/25/2044 | | | | | 322 | | | | | | 334 | |
| | | | | 64 | | | | | | 68 | |
7.500% due 06/25/2044 (l) | | | | | 239 | | | | | | 256 | |
| | | | | 1 | | | | | | 1 | |
| | | | | 516 | | | | | | 567 | |
8.500% due 06/18/2027 -
06/25/2030 | | | | | 98 | | | | | | 103 | |
|
| |
1.256% due 08/15/2036 ~(a)(l) | | | | | 1,231 | | | | | | 31 | |
1.287% due 05/15/2038 ~(a)(l) | | | | | 2,557 | | | | | | 84 | |
1.316% due 11/15/2038 ~(a)(l) | | | | | 10,463 | | | | | | 410 | |
2.079% due 11/25/2045 ~(a) | | | | | 5,336 | | | | | | 492 | |
| | | | | 2 | | | | | | 2 | |
3.000% due 11/25/2050 -
01/25/2051 (a)(l) | | | | | 10,047 | | | | | | 1,619 | |
3.471% due 11/15/2048 •(a)(l) | | | | | 6,325 | | | | | | 313 | |
3.500% due 05/25/2050 (a)(l) | | | | | 567 | | | | | | 116 | |
4.376% (US0001M + 6.000%) due 04/25/2048 ~(a)(l) | | | | | 17,220 | | | | | | 2,715 | |
4.376% due 11/25/2049 •(a)(l) | | | | | 13,274 | | | | | | 2,146 | |
| | | | | 73 | | | | | | 74 | |
4.500% due 06/25/2050 (a)(l) | | | | | 769 | | | | | | 138 | |
4.526% due 05/25/2050 •(a)(l) | | | | | 751 | | | | | | 112 | |
| | | | | 1 | | | | | | 1 | |
| | | | | 1,077 | | | | | | 1,159 | |
5.500% due 06/15/2041 (l) | | | | | 1,351 | | | | | | 1,454 | |
6.000% due 12/15/2028 -
03/15/2035 (l) | | | | | 914 | | | | | | 975 | |
6.000% due 04/15/2031 -
02/01/2034 | | | | | 36 | | | | | | 38 | |
6.500% due 09/15/2023 -
09/01/2047 | | | | | 1,804 | | | | | | 1,880 | |
6.500% due 10/15/2023 -
07/01/2037 (l) | | | | | 1,633 | | | | | | 1,749 | |
| | | | | 37 | | | | | | 41 | |
| | | | | 650 | | | | | | 671 | |
| | | | | 21 | | | | | | 21 | |
7.000% due 05/15/2023 -
10/25/2043 | | | | | 663 | | | | | | 700 | |
| | | | | | | | | | | | |
| See Accompanying Notes | | | ANNUAL REPORT | | | | | | | JUNE 30, 2022 | | | 55 |
| | | | | | |
| | PIMCO Strategic Income Fund, Inc. | | | | |
| | | | | | | | | | | | |
| | | | | PRINCIPAL
AMOUNT
(000S) | | | | | MARKET
VALUE
(000S) | |
7.000% due 01/15/2024 - 01/01/2032 (l) | | $ | | | 972 | | | $ | | | 1,043 | |
7.500% due 05/15/2024 - 03/01/2037 (l) | | | | | 104 | | | | | | 105 | |
7.500% due 12/01/2025 -
02/25/2042 | | | | | 482 | | | | | | 511 | |
8.000% due 08/15/2022 -
04/15/2030 | | | | | 66 | | | | | | 70 | |
| | | | | 1,581 | | | | | | 1,548 | |
| | | | | 203 | | | | | | 205 | |
|
| |
4.455% (US0001M + 6.050%) due 08/20/2049 -
09/20/2049 ~(a)(l) | | | | | 43,302 | | | | | | 5,940 | |
4.455% due 09/20/2049 •(a)(l) | | | | | 15,027 | | | | | | 2,126 | |
4.605% (US0001M + 6.200%) due 06/20/2047 ~(a)(l) | | | | | 6,087 | | | | | | 788 | |
6.000% due 04/15/2029 -
12/15/2038 | | | | | 559 | | | | | | 593 | |
6.500% due 11/20/2024 -
10/20/2038 | | | | | 220 | | | | | | 229 | |
7.000% due 07/15/2025 -
06/15/2026 | | | | | 13 | | | | | | 13 | |
7.500% due 06/15/2023 -
03/15/2029 | | | | | 292 | | | | | | 296 | |
8.500% due 01/15/2023 -
02/15/2031 | | | | | 6 | | | | | | 6 | |
|
| |
| | | | | 12,000 | | | | | | 12,046 | |
|
U.S. Small Business Administration | |
| | | | | 24 | | | | | | 24 | |
| | | | | 88 | | | | | | 90 | |
| | | | | 6 | | | | | | 7 | |
| | | | | 9 | | | | | | 10 | |
|
Uniform Mortgage-Backed Security | |
4.000% due 06/01/2047 -
03/01/2048 | | | | | 432 | | | | | | 434 | |
4.000% due 09/01/2047 (l) | | | | | 5,725 | | | | | | 5,744 | |
4.500% due 09/01/2023 -
08/01/2041 | | | | | 137 | | | | | | 140 | |
6.000% due 12/01/2032 -
06/01/2040 | | | | | 1,992 | | | | | | 2,173 | |
6.000% due 04/01/2039 (l) | | | | | 357 | | | | | | 391 | |
6.500% due 09/01/2028 -
02/01/2038 | | | | | 797 | | | | | | 852 | |
8.000% due 12/01/2022 -
11/01/2031 | | | | | 78 | | | | | | 80 | |
|
Uniform Mortgage-Backed Security, TBA | |
| | | | | 60,400 | | | | | | 58,036 | |
|
| |
| | | | | 50 | | | | | | 51 | |
6.750% due 02/15/2026 -
06/15/2026 (l) | | | | | 31 | | | | | | 32 | |
| | | | | 984 | | | | | | 1,072 | |
| | | | | | | | | | | | |
Total U.S. Government Agencies
(Cost $145,229) | | | | |
| | | | | | | | | | | | |
| |
NON-AGENCY MORTGAGE-BACKED SECURITIES 27.0% | |
|
Adjustable Rate Mortgage Trust | |
| | | | | 222 | | | | | | 211 | |
| | | | | 120 | | | | | | 116 | |
|
Banc of America Mortgage Trust | |
| | | | | 5 | | | | | | 5 | |
|
Bancorp Commercial Mortgage Trust | |
5.074% due 08/15/2032 •(l) | | | | | 3,050 | | | | | | 3,029 | |
|
| |
| | | | | 191 | | | | | | 167 | |
|
| |
| | | | | 222 | | | | | | 128 | |
|
Bear Stearns Commercial Mortgage Securities Trust | |
| | | | | 167 | | | | | | 160 | |
| | | | | 635 | | | | | | 587 | |
|
Citigroup Commercial Mortgage Trust | |
| | | | | 1,213 | | | | | | 541 | |
|
Citigroup Mortgage Loan Trust, Inc. | |
| | | | | 1 | | | | | | 1 | |
| | | | | | | | | | | | |
| | | | | PRINCIPAL
AMOUNT
(000S) | | | | | MARKET
VALUE
(000S) | |
|
Commercial Mortgage Loan Trust | |
| | $ | | | 1,144 | | | $ | | | 196 | |
|
Commercial Mortgage Trust | |
7.325% (US0001M + 6.000%) due 12/15/2038 ~ | | | | | 1,380 | | | | | | 1,323 | |
|
Countrywide Alternative Loan Trust | |
| | | | | 1,014 | | | | | | 879 | |
|
Countrywide Home Loan Mortgage Pass-Through Trust | |
| | | | | 778 | | | | | | 676 | |
| | | | | 176 | | | | | | 167 | |
| | | | | 1,068 | | | | | | 721 | |
|
Countrywide Home Loan Reperforming REMIC Trust | |
| | | | | 325 | | | | | | 328 | |
| | | | | 62 | | | | | | 62 | |
|
Credit Suisse Commercial Mortgage Trust | |
| | | | | 2,175 | | | | | | 228 | |
|
Credit Suisse First Boston Mortgage-Backed Pass-Through Certificates | |
| | | | | 256 | | | | | | 259 | |
|
Credit Suisse Mortgage Capital Mortgage-Backed Trust | |
| | | | | 731 | | | | | | 155 | |
|
| |
3.190% (BP0003M + 1.600%) due 09/13/2045 ~ | | GBP | | | 1,582 | | | | | | 1,811 | |
| | | | | 1,130 | | | | | | 1,300 | |
| | | | | 960 | | | | | | 1,154 | |
|
| |
8.426% due 10/25/2041 •(l) | | $ | | | 2,800 | | | | | | 2,415 | |
8.726% (SOFR30A + 7.800%) due 11/25/2041 ~(l) | | | | | 2,800 | | | | | | 2,359 | |
|
GC Pastor Hipotecario FTA | |
0.001% (EUR003M + 0.170%) due 06/21/2046 ~ | | EUR | | | 913 | | | | | | 857 | |
|
GMAC Mortgage Corp. Loan Trust | |
| | $ | | | 20 | | | | | | 17 | |
|
GS Mortgage Securities Corp. Trust | |
| | | | | 2,600 | | | | | | 2,492 | |
|
| |
| | | | | 454 | | | | | | 443 | |
|
GSMPS Mortgage Loan Trust | |
| | | | | 1,370 | | | | | | 1,416 | |
| | | | | 14 | | | | | | 14 | |
| | | | | 330 | | | | | | 301 | |
|
| |
| | | | | 95 | | | | | | 87 | |
| | | | | 7 | | | | | | 7 | |
|
IM Pastor Fondo de Titluzacion Hipotecaria | |
| | EUR | | | 264 | | | | | | 242 | |
|
JP Morgan Chase Commercial Mortgage Securities Trust | |
7.715% (US0001M + 6.390%) due 11/15/2038 ~(l) | | $ | | | 2,200 | | | | | | 2,044 | |
|
| |
| | | | | 784 | | | | | | 682 | |
| | | | | 27 | | | | | | 27 | |
|
LUXE Commercial Mortgage Trust | |
4.074% (US0001M + 2.750%) due 10/15/2038 ~(l) | | | | | 3,016 | | | | | | 2,817 | |
|
MASTR Adjustable Rate Mortgages Trust | |
| | | | | 243 | | | | | | 227 | |
|
MASTR Alternative Loan Trust | |
| | | | | 233 | | | | | | 150 | |
| | | | | 488 | | | | | | 459 | |
| | | | | 20 | | | | | | 19 | |
|
MASTR Reperforming Loan Trust | |
| | | | | 2,568 | | | | | | 2,020 | |
| | | | | 1,302 | | | | | | 1,060 | |
|
| |
| | | | | 300 | | | | | | 288 | |
|
Morgan Stanley Resecuritization Trust | |
2.713% due 12/26/2046 ~(l) | | | | | 7,475 | | | | | | 6,616 | |
|
NAAC Reperforming Loan REMIC Trust | |
| | | | | 559 | | | | | | 509 | |
| | | | | 1,716 | | | | | | 1,566 | |
| | | | | 1,676 | | | | | | 1,537 | |
| | | | | | | | | | | | |
| | | | | PRINCIPAL
AMOUNT
(000S) | | | | | MARKET
VALUE
(000S) | |
|
| |
| | EUR | | | 1,366 | | | $ | | | 1,308 | |
| | | | | 1,366 | | | | | | 1,269 | |
|
RBSSP Resecuritization Trust | |
| | | | | 2,353 | | | | | | 1,487 | |
| | | | | 5,221 | | | | | | 2,272 | |
|
Residential Accredit Loans, Inc. Trust | |
| | | | | 848 | | | | | | 750 | |
|
Residential Asset Mortgage Products Trust | |
| | | | | 212 | | | | | | 218 | |
| | | | | 639 | | | | | | 388 | |
|
Structured Asset Securities Corp. Mortgage Loan Trust | |
| | | | | 2,271 | | | | | | 1,473 | |
|
WaMu Mortgage Pass-Through Certificates Trust | |
| | | | | 61 | | | | | | 60 | |
|
Washington Mutual Mortgage Pass-Through Certificates Trust | |
| | | | | 38 | | | | | | 37 | |
| | | | | 131 | | | | | | 127 | |
|
Wells Fargo Commercial Mortgage Trust | |
| | | | | 2,558 | | | | | | 2,380 | |
| | | | | | | | | | | | |
Total Non-Agency Mortgage-Backed Securities (Cost $61,922) | | | | |
| | | | | | | | | | | | |
| |
ASSET-BACKED SECURITIES 10.1% | |
|
Ameriquest Mortgage Securities, Inc. Asset-Backed Pass-Through Certificates | |
5.149% (US0001M + 3.525%) due 11/25/2032 ^~ | | | | | 39 | | | | | | 1 | |
|
Bear Stearns Asset-Backed Securities Trust | |
| | | | | 191 | | | | | | 183 | |
|
| |
| | | | | 67 | | | | | | 60 | |
|
Conseco Finance Securitizations Corp. | |
| | | | | 1,425 | | | | | | 512 | |
|
Countrywide Asset-Backed Certificates Trust | |
1.824% (US0001M + 0.200%) due 06/25/2037 ^~(l) | | | | | 1,568 | | | | | | 1,582 | |
1.884% due 12/25/2036 ^•(l) | | | | | 2,112 | | | | | | 1,919 | |
3.274% (US0001M + 1.650%) due 11/25/2034 ~(l) | | | | | 2,297 | | | | | | 1,881 | |
|
Credit-Based Asset Servicing & Securitization LLC | |
4.702% due 12/25/2037 þ(l) | | | | | 1 | | | | | | 1 | |
|
| |
| | | | | 1,424 | | | | | | 901 | |
|
| |
| | | | | 1,213 | | | | | | 897 | |
|
Encore Credit Receivables Trust | |
2.359% (US0001M + 0.735%) due 07/25/2035 ~ | | | | | 576 | | | | | | 548 | |
|
Exeter Automobile Receivables Trust | |
0.000% due 05/15/2031 «(f) | | | | | 7 | | | | | | 3,302 | |
|
Flagship Credit Auto Trust | |
0.000% due 12/15/2025 «(f) | | | | | 12 | | | | | | 1,140 | |
|
Madison Park Funding Ltd. | |
| | | | | 500 | | | | | | 291 | |
|
| |
0.000% due 12/15/2028 «(f) | | | | | 6 | | | | | | 428 | |
0.000% due 04/16/2029 «(f) | | | | | 10 | | | | | | 580 | |
0.000% due 07/16/2029 «(f) | | | | | 7 | | | | | | 511 | |
|
National Collegiate Commutation Trust | |
| | | | | 10,400 | | | | | | 3,171 | |
|
Oakwood Mortgage Investors, Inc. | |
| | | | | 3 | | | | | | 3 | |
|
Residential Asset Mortgage Products Trust | |
| | | | | 9 | | | | | | 5 | |
|
SMB Private Education Loan Trust | |
0.000% due 10/15/2048 «(f) | | | | | 5 | | | | | | 2,079 | |
0.000% due 02/16/2055 «(f) | | | | | 0 | | | | | | 787 | |
5.950% due 02/16/2055 (l) | | | | | 533 | | | | | | 524 | |
| | | | | | | | | | | | |
Total Asset-Backed Securities (Cost $37,892) | | | | |
| | | | | | | | | | | | |
| | | | | | | | | | | | |
| | | | | | |
| 56 | | PIMCO CLOSED-END FUNDS | | | See Accompanying Notes | |
| | | | | | | | | | | | |
| | | | | PRINCIPAL
AMOUNT
(000S) | | | | | MARKET
VALUE
(000S) | |
| |
|
Argentina Government International Bond | |
| | $ | | | 647 | | | $ | | | 137 | |
| | | | | 269 | | | | | | 64 | |
| | | | | 227 | | | | | | 48 | |
1.125% due 07/09/2035 þ(l) | | | | | 904 | | | | | | 187 | |
| | | | | 115 | | | | | | 27 | |
2.000% due 01/09/2038 þ(l) | | | | | 4,388 | | | | | | 1,284 | |
2.500% due 07/09/2041 þ(l) | | | | | 1,880 | | | | | | 489 | |
|
Ghana Government International Bond | |
| | | | | 323 | | | | | | 186 | |
7.875% due 02/11/2035 (l) | | | | | 388 | | | | | | 183 | |
|
Peru Government International Bond | |
6.900% due 08/12/2037 (l) | | PEN | | | 10,700 | | | | | | 2,533 | |
|
Romania Government International Bond | |
2.000% due 04/14/2033 (l) | | EUR | | | 7,500 | | | | | | 5,117 | |
|
Venezuela Government International Bond | |
| | $ | | | 135 | | | | | | 10 | |
8.250% due 10/13/2024 ^(c) | | | | | 13 | | | | | | 1 | |
9.250% due 09/15/2027 ^(c) | | | | | 171 | | | | | | 15 | |
| | | | | | | | | | | | |
Total Sovereign Issues (Cost $16,924) | | | | | | | |
| | | | | | | | | | | | |
| |
| | | | | SHARES | | | | | | |
| |
| |
COMMUNICATION SERVICES 0.6% | |
| | | | |
Clear Channel Outdoor Holdings, Inc. (d) | | | | | 291,816 | | | | | | 312 | |
| | | | |
iHeartMedia, Inc. ‘A’ (d) | | | | | 68,102 | | | | | | 537 | |
| | | | |
iHeartMedia, Inc. ‘B’ «(d) | | | | | 52,880 | | | | | | 376 | |
| | | | | | | | | | | | |
| | | | | | | | | | | 1,225 | |
| | | | | | | | | | | | |
| |
| |
| | | |
Axis Energy Services ‘A’ «(d)(j) | | | 422 | | | | | | 6 | |
| | | | |
| | | | | 19,079 | | | | | | 484 | |
| | | | |
| | | | | 1,412 | | | | | | 60 | |
| | | | | | | | | | | | |
| | | | | | | | | | | 550 | |
| | | | | | | | | | | | |
| |
| |
| | | | |
| | | | | 98,667 | | | | | | 2,763 | |
| | | | | | | | | | | | |
| |
| |
| | | |
Neiman Marcus Group Ltd. LLC «(d)(j) | | | 32,851 | | | | | | 5,678 | |
| | | |
Syniverse Holdings, Inc. «(d)(j) | | | 736,991 | | | | | | 722 | |
| | | | | | | | | | | | |
| | | | | SHARES | | | | | MARKET
VALUE
(000S) | |
| | | | |
Westmoreland Mining Holdings «(d)(j) | | | | | 70 | | | $ | | | 0 | |
| | | | | | | | | | | | |
| | | | | | | | | | | 6,400 | |
| | | | | | | | | | | | |
| |
| |
| | | | |
Associated Materials Group, Inc. «(d) | | | | | 397,884 | | | | | | 92 | |
| | | | | | | | | | | | |
Total Common Stocks (Cost $12,489) | | | | | | | |
| | | | | | | | | | | | |
| |
| |
| |
| |
| | | | |
Intelsat Jackson Holdings SA «(d) | | | | | 10,583 | | | | | | 50 | |
| | | | | | | | | | | | |
| | | | |
| | | | | | | | | | | | |
| |
| |
| |
| |
| | | | |
Intelsat Emergence SA - Exp. 02/17/2027 « | | | | | 711 | | | | | | 2 | |
| | | | |
Intelsat Jackson Holdings SA - Exp. 12/05/2025 « | | | | | 10,308 | | | | | | 52 | |
| | | | | | | | | | | | |
| | | | | | | | | | | 54 | |
| | | | | | | | | | | | |
| |
INFORMATION TECHNOLOGY 0.3% | |
| | | | |
Windstream Holdings LLC - Exp. 9/21/2055 « | | | | | 28,052 | | | | | | 598 | |
| | | | | | | | | | | | |
Total Warrants (Cost $2,791) | | | | |
| | | | | | | | | | | | |
| |
PREFERRED SECURITIES 6.8% | |
| |
| |
|
| |
5.000% due 03/15/2026 •(h) | | | | | 1,300,000 | | | | | | 1,167 | |
|
| |
4.000% due 12/01/2030 •(h) | | | | | 100,000 | | | | | | 77 | |
|
Farm Credit Bank of Texas | |
5.700% due 09/15/2025 •(h) | | | | | 1,000,000 | | | | | | 955 | |
|
Nationwide Building Society | |
| | | | | 36,190 | | | | | | 6,453 | |
|
Stichting AK Rabobank Certificaten | |
6.500% due 12/29/2049 þ(h)(l) | | | | | 5,317,100 | | | | | | 5,426 | |
| | | | | | | | | | | | |
| | | | | | | | | | | 14,078 | |
| | | | | | | | | | | | |
| | | | | | | | | | | | |
| | | | | | | | | | | |
| |
|
| |
5.159% (US0003M + 3.330%) due 09/15/2022 ~(h) | | | | | 139,000 | | | $ | | | 122 | |
| | | | | | | | | | | | |
Total Preferred Securities (Cost $17,266) | | | | |
| | | | | | | | | | | | |
| |
REAL ESTATE INVESTMENT TRUSTS 1.0% | |
| |
| |
| | | |
CBL & Associates Properties, Inc. | | | 2,011 | | | | | | 47 | |
| | | | |
| | | | | 73,539 | | | | | | 693 | |
| | | | |
| | | | | 44,227 | | | | | | 1,318 | |
| | | | | | | | | | | | |
Total Real Estate Investment Trusts
(Cost $1,161) | | | | | | | |
| | | | | | | | | | | | |
| |
| | | | | | | | | | | |
SHORT-TERM INSTRUMENTS 6.1% | |
| |
REPURCHASE AGREEMENTS (k) 1.3% | |
| | | | | | | | | | | 2,703 | |
| | | | | | | | | | | | |
| |
ARGENTINA TREASURY BILLS 0.0% | |
(34.940)% due 12/16/2022 (f)(g) | | ARS | | | 13,200 | | | | | | 61 | |
| | | | | | | | | | | | |
| |
| |
1.209% due 07/26/2022 - 09/29/2022 (e)(f)(l) | | $ | | | 10,127 | | | | | | 10,104 | |
| | | | | | | | | | | | |
Total Short-Term Instruments
(Cost $12,874) | | | | |
| | | | | | | | | | | | |
| | | | |
| | | | | | | | | | | | |
Total Investments in Securities
(Cost $520,523) | | | | |
| | | | |
| | | | | | | | | | | | |
Total Investments 204.8%
(Cost $520,523) | | | $ | | | | |
| |
Financial Derivative
Instruments (m)(n) (0.2)% (Cost or Premiums, net $9,555) | | | | |
| |
Other Assets and Liabilities, net (104.6)% | | | | |
| | | | | | | | | | | | |
| | | $ | | | | |
| | | | | | | | | | | | |
NOTES TO SCHEDULE OF INVESTMENTS:
| A zero balance may reflect actual amounts rounding to less than one thousand. |
| Security valued using significant unobservable inputs (Level 3). |
| All or a portion of this amount represents unfunded loan commitments. The interest rate for the unfunded portion will be determined at the time of funding. See Note 4, Securities and Other Investments, in the Notes to Financial Statements for more information regarding unfunded loan commitments. |
| Variable or Floating rate security. Rate shown is the rate in effect as of period end. Certain variable rate securities are not based on a published reference rate and spread, rather are determined by the issuer or agent and are based on current market conditions. Reference rate is as of reset date, which may vary by security. These securities may not indicate a reference rate and/or spread in their description. |
| Rate shown is the rate in effect as of period end. The rate may be based on a fixed rate, a capped rate or a floor rate and may convert to a variable or floating rate in the future. These securities do not indicate a reference rate and spread in their description. |
| Coupon represents a rate which changes periodically based on a predetermined schedule or event. Rate shown is the rate in effect as of period end. |
| Security is an Interest Only (“IO”) or IO Strip. |
| Security is not accruing income as of the date of this report. |
| Security did not produce income within the last twelve months. |
| Coupon represents a weighted average yield to maturity. |
| | | | | | | | | | | | |
| See Accompanying Notes | | | | | | | | | | JUNE 30, 2022 | | | |
| | | | | | |
| | PIMCO Strategic Income Fund, Inc. | | | | |
| Coupon represents a yield to maturity. |
| Perpetual maturity; date shown, if applicable, represents next contractual call date. |
| Contingent convertible security. |
(j) RESTRICTED SECURITIES:
| | | | | | | | | | | | | | | | | | | | | | | | |
| | | | | | | | | | | | | | | | | Market Value
as Percentage
of Net Assets | |
| | | | | | | | | | | 07/01/2021 | | | $ | 6 | | | $ | 6 | | | | 0.00 | % |
| | | | | | | | | | | | | | | 6,775 | | | | 2,763 | | | | 1.32 | |
Neiman Marcus Group Ltd. LLC | | | | | | | | | | | 09/25/2020 | | | | 1,058 | | | | 5,678 | | | | 2.70 | |
| | | | | | | | | | | | | | | 219 | | | | 484 | | | | 0.23 | |
Oracle Corp. 4.100% due 03/25/2061 | | | | | | | | | | | | | | | 1,111 | | | | 710 | | | | 0.34 | |
Pinnacol Assurance 8.625% due 06/25/2034 | | | | | | | | | | | 06/23/2014 | | | | 2,600 | | | | 2,899 | | | | 1.38 | |
| | | | | | | | | | | 05/12/2022 | | | | 722 | | | | 722 | | | | 0.34 | |
Westmoreland Mining Holdings | | | | | | | | | | | 03/26/2019 | | | | 0 | | | | 0 | | | | 0.00 | |
| | | | | | | | | | | | | | | | | | | | | | | | |
| | | $ | 12,491 | | | $ | 13,262 | | | | 6.31 | % |
| | | | | | | | | | | | | | | | | | | | | | | | |
BORROWINGS AND OTHER FINANCING TRANSACTIONS
(k) REPURCHASE AGREEMENTS:
| | | | | | | | | | | | | | | | | | | | | | | | | | | | | | |
| | | | | | | | | | | | | | | | | | | Repurchase
Agreements,
at Value | | | Repurchase Agreement Proceeds to be Received (1) | |
| FICC | | | 0.400 | % | | | 06/30/2022 | | | | 07/01/2022 | | | $ | 2,703 | | | U.S. Treasury Notes 3.000% due 06/30/2024 | | $ | (2,757 | ) | | $ | 2,703 | | | $ | 2,703 | |
| | | | | | | | | | | | | | | | | | | | | | | | | | | | | | |
Total Repurchase Agreements | | | | | | | | | | | | | | | |
| | | | | | | | | | | | | | | | | | | | | | | | | | | | | | |
REVERSE REPURCHASE AGREEMENTS:
| | | | | | | | | | | | | | | | | | | | | | |
| | | | | | | | | | | | | | Payable for
Reverse
Repurchase
Agreements | |
| | | 2.330 | % | | | 06/07/2022 | | | | 09/07/2022 | | | $ | | | (1,478 | ) | | $ | (1,481 | ) |
| | | 1.980 | | | | 06/10/2022 | | | | 09/08/2022 | | | | | | (1,648 | ) | | | (1,650 | ) |
| | | 1.880 | | | | 06/10/2022 | | | | 09/12/2022 | | | | | | (1,818 | ) | | | (1,820 | ) |
| | | 2.210 | | | | 06/27/2022 | | | | 09/15/2022 | | | | | | (265 | ) | | | (265 | ) |
| | | 2.370 | | | | 06/28/2022 | | | | 07/28/2022 | | | | | | (415 | ) | | | (416 | ) |
| | | 0.750 | | | | 01/10/2022 | | | | 10/11/2022 | | | | | | (12,554 | ) | | | (12,599 | ) |
| | | 1.060 | | | | 04/08/2022 | | | | 07/08/2022 | | | | | | (164 | ) | | | (165 | ) |
| | | 1.220 | | | | 03/22/2022 | | | | 09/23/2022 | | | | | | (6,267 | ) | | | (6,288 | ) |
| | | 1.250 | | | | 03/16/2022 | | | | 09/16/2022 | | | | | | (3,116 | ) | | | (3,128 | ) |
| | | 1.300 | | | | 05/26/2022 | | | | 07/26/2022 | | | | | | (7,215 | ) | | | (7,224 | ) |
| | | 1.330 | | | | 04/08/2022 | | | | 07/08/2022 | | | | | | (1,863 | ) | | | (1,869 | ) |
| | | 1.370 | | | | 05/31/2022 | | | | 07/08/2022 | | | | | | (1,810 | ) | | | (1,812 | ) |
| | | 1.430 | | | | 03/21/2022 | | | | 09/22/2022 | | | | | | (2,041 | ) | | | (2,049 | ) |
| | | 1.430 | | | | 03/22/2022 | | | | 09/23/2022 | | | | | | (1,154 | ) | | | (1,158 | ) |
| | | 1.520 | | | | 03/07/2022 | | | | 09/07/2022 | | | | | | (8,327 | ) | | | (8,368 | ) |
| | | 1.830 | | | | 05/13/2022 | | | | 08/12/2022 | | | | | | (270 | ) | | | (270 | ) |
| | | 1.850 | | | | 05/30/2022 | | | | TBD | | | GBP | | | (858 | ) | | | (1,045 | ) |
| | | 1.900 | | | | 04/29/2022 | | | | 10/31/2022 | | | $ | | | (1,613 | ) | | | (1,619 | ) |
| | | 1.920 | | | | 06/16/2022 | | | | 09/16/2022 | | | | | | (4,707 | ) | | | (4,710 | ) |
| | | 1.930 | | | | 05/13/2022 | | | | 08/12/2022 | | | | | | (5,590 | ) | | | (5,605 | ) |
| | | 1.970 | | | | 06/02/2022 | | | | 09/01/2022 | | | | | | (7,691 | ) | | | (7,703 | ) |
| | | 1.990 | | | | 04/27/2022 | | | | 10/27/2022 | | | | | | (441 | ) | | | (442 | ) |
| | | 2.070 | | | | 06/16/2022 | | | | 09/16/2022 | | | | | | (394 | ) | | | (394 | ) |
| | | 2.380 | | | | 06/23/2022 | | | | 09/26/2022 | | | | | | (3,187 | ) | | | (3,189 | ) |
| | | 2.530 | | | | 06/23/2022 | | | | 09/26/2022 | | | | | | (1,533 | ) | | | (1,534 | ) |
| | | (0.320 | ) | | | 11/05/2021 | | | | TBD | | | EUR | | | (1,178 | ) | | | (1,232 | ) |
| | | 1.850 | | | | 06/17/2022 | | | | TBD | | | $ | | | (103 | ) | | | (103 | ) |
| | | 2.100 | | | | 06/13/2022 | | | | 09/14/2022 | | | | | | (1,050 | ) | | | (1,051 | ) |
| | | 2.250 | | | | 05/31/2022 | | | | 08/31/2022 | | | | | | (7,518 | ) | | | (7,533 | ) |
| | | 2.440 | | | | 06/16/2022 | | | | 09/16/2022 | | | | | | (1,392 | ) | | | (1,393 | ) |
| | | 1.370 | | | | 05/25/2022 | | | | TBD | | | GBP | | | (2,477 | ) | | | (3,019 | ) |
| | | | | | | | | | | | | | | | | | | | | | |
| | | | | | | | | | | | | | Payable for
Reverse
Repurchase
Agreements | |
| | | 1.400 | % | | | 04/07/2022 | | | | 07/07/2022 | | | $ | | | (4,536 | ) | | $ | (4,551 | ) |
| | | 2.500 | | | | 06/16/2022 | | | | 09/16/2022 | | | | | | (6,822 | ) | | | (6,829 | ) |
| | | (0.250 | ) | | | 06/17/2022 | | | | TBD | | | | | | (602 | ) | | | (602 | ) |
| | | 1.120 | | | | 03/17/2022 | | | | 09/15/2022 | | | | | | (536 | ) | | | (538 | ) |
| | | 1.890 | | | | 06/09/2022 | | | | 09/12/2022 | | | | | | (1,060 | ) | | | (1,061 | ) |
| | | (4.000 | ) | | | 06/24/2022 | | | | TBD | | | EUR | | | (851 | ) | | | (891 | ) |
| | | (1.000 | ) | | | 02/18/2022 | | | | TBD | | | | | | (1,200 | ) | | | (1,253 | ) |
| | | (0.500 | ) | | | 05/11/2022 | | | | 08/17/2022 | | | | | | (345 | ) | | | (362 | ) |
| | | (0.450 | ) | | | 06/24/2022 | | | | TBD | | | | | | (1,955 | ) | | | (2,049 | ) |
| | | (0.250 | ) | | | 05/25/2022 | | | | 08/24/2022 | | | | | | (5,129 | ) | | | (5,374 | ) |
| | | 1.470 | | | | 04/14/2022 | | | | 07/14/2022 | | | $ | | | (2,576 | ) | | | (2,584 | ) |
| | | 1.900 | | | | 06/17/2022 | | | | 07/29/2022 | | | | | | (2,365 | ) | | | (2,367 | ) |
| | | 2.000 | | | | 06/17/2022 | | | | 07/29/2022 | | | | | | (1,874 | ) | | | (1,876 | ) |
| | | 2.050 | | | | 06/17/2022 | | | | 07/29/2022 | | | | | | (158 | ) | | | (158 | ) |
| | | (5.500 | ) | | | 04/06/2022 | | | | 07/08/2022 | | | EUR | | | (264 | ) | | | (273 | ) |
| | | (3.000 | ) | | | 04/06/2022 | | | | 07/08/2022 | | | | | | (296 | ) | | | (308 | ) |
| | | (0.300 | ) | | | 04/06/2022 | | | | 07/08/2022 | | | | | | (402 | ) | | | (421 | ) |
| | | 0.900 | | | | 04/06/2022 | | | | 07/08/2022 | | | GBP | | | (195 | ) | | | (238 | ) |
| | | 1.390 | | | | 04/19/2022 | | | | 07/20/2022 | | | $ | | | (646 | ) | | | (648 | ) |
| | | 1.000 | | | | 03/30/2022 | | | | 07/05/2022 | | | | | | (906 | ) | | | (908 | ) |
| | | 2.420 | | | | 06/24/2022 | | | | 09/26/2022 | | | | | | (9,697 | ) | | | (9,702 | ) |
| | | 2.620 | | | | 06/24/2022 | | | | 09/26/2022 | | | | | | (406 | ) | | | (407 | ) |
| | | (0.420 | ) | | | 05/02/2022 | | | | 07/29/2022 | | | EUR | | | (5,319 | ) | | | (5,570 | ) |
| | | (0.410 | ) | | | 02/09/2022 | | | | 08/08/2022 | | | | | | (423 | ) | | | (443 | ) |
| | | 2.390 | | | | 06/28/2022 | | | | 09/23/2022 | | | $ | | | (1,769 | ) | | | (1,769 | ) |
| | | 0.550 | | | | 04/11/2022 | | | | 07/05/2022 | | | | | | (2,032 | ) | | | (2,034 | ) |
| | | 0.670 | | | | 01/07/2022 | | | | 07/06/2022 | | | | | | (662 | ) | | | (664 | ) |
| | | 0.670 | | | | 04/07/2022 | | | | 07/06/2022 | | | | | | (3,017 | ) | | | (3,022 | ) |
| | | 0.670 | | | | 04/14/2022 | | | | 07/08/2022 | | | | | | (1,944 | ) | | | (1,947 | ) |
| | | 1.290 | | | | 06/03/2022 | | | | 07/05/2022 | | | | | | (884 | ) | | | (884 | ) |
| | | 1.580 | | | | 05/03/2022 | | | | 08/03/2022 | | | | | | (653 | ) | | | (655 | ) |
| | | 1.740 | | | | 06/17/2022 | | | | TBD | | | | | | (541 | ) | | | (541 | ) |
| | | 1.750 | | | | 06/17/2022 | | | | TBD | | | | | | (1,517 | ) | | | (1,518 | ) |
| | | 1.820 | | | | 06/17/2022 | | | | TBD | | | | | | (230 | ) | | | (230 | ) |
| | | 1.830 | | | | 06/17/2022 | | | | TBD | | | | | | (165 | ) | | | (165 | ) |
| | | 2.580 | | | | 07/05/2022 | | | | 10/06/2022 | | | | | | (820 | ) | | | (820 | ) |
| | | 2.620 | | | | 06/30/2022 | | | | 09/30/2022 | | | | | | (2,759 | ) | | | (2,759 | ) |
| | | 2.680 | | | | 07/05/2022 | | | | 10/06/2022 | | | | | | (1,726 | ) | | | (1,726 | ) |
| | | 1.720 | | | | 06/17/2022 | | | | TBD | | | | | | (1,371 | ) | | | (1,372 | ) |
| | | 1.740 | | | | 06/17/2022 | | | | TBD | | | | | | (2,761 | ) | | | (2,763 | ) |
| | | 1.530 | | | | 04/25/2022 | | | | 07/25/2022 | | | | | | (1,790 | ) | | | (1,795 | ) |
| | | 1.630 | | | | 05/02/2022 | | | | 08/02/2022 | | | | | | (161 | ) | | | (161 | ) |
| | | 1.690 | | | | 05/05/2022 | | | | 08/05/2022 | | | | | | (2,626 | ) | | | (2,633 | ) |
| | | 1.690 | | | | 06/03/2022 | | | | 08/05/2022 | | | | | | (1,492 | ) | | | (1,494 | ) |
| | | 2.350 | | | | 06/17/2022 | | | | 09/19/2022 | | | | | | (679 | ) | | | (679 | ) |
| | | 2.450 | | | | 06/17/2022 | | | | 09/19/2022 | | | | | | (1,124 | ) | | | (1,125 | ) |
| | | | | | | | | | | | | | | | | | | | | | |
Total Reverse Repurchase Agreements | | | | | | | | | | | |
| | | | | | | | | | | | | | | | | | | | | | |
| | | | | | | | | | | | | | | | | | | | |
| | | | | | | | | | | | | | | |
U.S. Government Agencies (1.3)% | |
Uniform Mortgage-Backed Security, TBA | | | 2.000 | % | | | 07/01/2037 | | | $ | 300 | | | $ | (281 | ) | | $ | (280 | ) |
Uniform Mortgage-Backed Security, TBA | | | 2.000 | | | | 08/01/2052 | | | | 1,950 | | | | (1,691 | ) | | | (1,691 | ) |
Uniform Mortgage-Backed Security, TBA | | | 2.500 | | | | 08/01/2052 | | | | 600 | | | | (539 | ) | | | (539 | ) |
Uniform Mortgage-Backed Security, TBA | | | 4.500 | | | | 08/11/2052 | | | | 100 | | | | (100 | ) | | | (100 | ) |
| | | | | | | | | | | | | | | | | | | | |
| | | | | | | | | | | | | | | | | | | | |
| | | | | | | | | | | | | | | | | | | | |
| | | | | | | | | | | | |
| See Accompanying Notes | | | | | | | | | | JUNE 30, 2022 | | | |
| | | | | | |
| | PIMCO Strategic Income Fund, Inc. | | | | |
BORROWINGS AND OTHER FINANCING TRANSACTIONS SUMMARY
The following is a summary by counterparty of the market value of Borrowings and Other Financing Transactions and collateral pledged/(received) as of June 30, 2022:
| | | | | | | | | | | | | | | | | | | | | | | | |
| | Repurchase Agreement Proceeds to be Received (1) | | | Payable for
Reverse
Repurchase
Agreements | | | Payable for Sale-Buyback Transactions | | | Total
Borrowings and
Other Financing
Transactions | | | Collateral
Pledged/(Received) | | | | |
Global/Master Repurchase Agreement | |
| | $ | 0 | | | $ | (1,481 | ) | | $ | 0 | | | $ | (1,481 | ) | | $ | 2,044 | | | $ | 563 | |
| | | 0 | | | | (1,650 | ) | | | 0 | | | | (1,650 | ) | | | 1.905 | | | | (1,648 | ) |
| | | 0 | | | | (2,501 | ) | | | 0 | | | | (2,501 | ) | | | 2,690 | | | | 189 | |
| | | 0 | | | | (71,171 | ) | | | 0 | | | | (71,171 | ) | | | 81,473 | | | | 10,302 | |
| | | 0 | | | | (11,312 | ) | | | 0 | | | | (11,312 | ) | | | 13,752 | | | | 2,440 | |
| | | 0 | | | | (3,019 | ) | | | 0 | | | | (3,019 | ) | | | 2,971 | | | | (48 | ) |
| | | 0 | | | | (11,380 | ) | | | 0 | | | | (11,380 | ) | | | 13,102 | | | | 1,722 | |
| | | 0 | | | | (602 | ) | | | 0 | | | | (602 | ) | | | 741 | | | | 139 | |
| | | 2,703 | | | | 0 | | | | 0 | | | | 2,703 | | | | (2,757 | ) | | | (54 | ) |
| | | 0 | | | | (1,599 | ) | | | 0 | | | | (1,599 | ) | | | 1,636 | | | | 37 | |
| | | 0 | | | | (16,914 | ) | | | 0 | | | | (16,914 | ) | | | 18,689 | | | | 1,775 | |
| | | 0 | | | | (1,888 | ) | | | 0 | | | | (1,888 | ) | | | 1,849 | | | | (39 | ) |
| | | 0 | | | | (908 | ) | | | 0 | | | | (908 | ) | | | 1,218 | | | | 310 | |
| | | 0 | | | | (10,109 | ) | | | 0 | | | | (10,109 | ) | | | 10,530 | | | | 421 | |
| | | 0 | | | | (7,782 | ) | | | 0 | | | | (7,782 | ) | | | 8,262 | | | | 480 | |
| | | 0 | | | | (16,965 | ) | | | 0 | | | | (16,965 | ) | | | 16,850 | | | | (115 | ) |
| | | 0 | | | | (4,135 | ) | | | 0 | | | | (4,135 | ) | | | 4332 | | | | 197 | |
| | | 0 | | | | (7,887 | ) | | | 0 | | | | (7,887 | ) | | | 8,911 | | | | 1,024 | |
| | | | | | | | | | | | | | | | | | | | | | | | |
Total Borrowings and Other Financing Transactions | | | | | | | | | | | | | | | | | | | | | | | | |
| | | | | | | | | | | | | | | | | | | | | | | | |
CERTAIN TRANSFERS ACCOUNTED FOR AS SECURED BORROWINGS
Remaining Contractual Maturity of the Agreements
| | | | | | | | | | | | | | | | | | | | |
| | | | | | | | | | | | | | | | |
Reverse Repurchase Agreements | |
| | $ | 0 | | | $ | (15,176 | ) | | $ | (60,029 | ) | | $ | (21,603 | ) | | $ | (96,808 | ) |
Convertible Bonds & Notes | | | 0 | | | | 0 | | | | (362 | ) | | | 0 | | | | (362 | ) |
| | | 0 | | | | (13,588 | ) | | | (9,872 | ) | | | (12,598 | ) | | | (36,058 | ) |
| | | 0 | | | | 0 | | | | (5,177 | ) | | | 0 | | | | (5,177 | ) |
Non-Agency Mortgage-Backed Securities | | | 0 | | | | (2,584 | ) | | | (12,506 | ) | | | 0 | | | | (15,090 | ) |
| | | 0 | | | | (415 | ) | | | (4,875 | ) | | | 0 | | | | (5,290 | ) |
| | | 0 | | | | (9,971 | ) | | | 0 | | | | 0 | | | | (9,971 | ) |
| | | | | | | | | | | | | | | | | | | | |
| | | | | | | | | | | | | | | | | | | | |
| | | | | | | | | | | | | | | | | | | | |
Payable for reverse repurchase agreements (5) | | | | | |
| | | | | | | | | | | | | | | | | | | | |
| Securities with an aggregate market value of $183,052 and cash of $7,907 have been pledged as collateral under the terms of the above master agreements as of June 30, 2022. |
| Includes accrued interest. |
| The average amount of borrowings outstanding during the period ended June 30, 2022 was $(215,320) at a weighted average interest rate of 0.551%. Average borrowings may include reverse repurchase agreements and sale-buyback transactions, if held during the period. |
| Open maturity reverse repurchase agreement. |
| Net Exposure represents the net receivable/(payable) that would be due from/to the counterparty in the event of default. Exposure from borrowings and other financing transactions can only be netted across transactions governed under the same master agreement with the same legal entity. See Note 8, Master Netting Arrangements, in the Notes to Financial Statements for more information. |
| Unsettled reverse repurchase agreements liability of $(2,547) is outstanding at period end. |
(m) FINANCIAL DERIVATIVE INSTRUMENTS: EXCHANGE-TRADED OR CENTRALLY CLEARED
CREDIT DEFAULT SWAPS ON CORPORATE ISSUES - SELL PROTECTION
(1)
| | | | | | | | | | | | | | | | | | | | | | | | | | | | | | | | | | | | | | | | | | |
| | | | | | | | | | Implied Credit Spread at June 30, 2022 (2) | | | | | | | | | Unrealized
Appreciation/
(Depreciation) | | | | | | | |
| | | | | | |
| | | 1.000 | % | | Quarterly | | | 12/20/2024 | | | | 2.015 | % | | | $ | | | | 300 | | | $ | (7 | ) | | $ | 0 | | | $ | (7 | ) | | $ | 0 | | | $ | 0 | |
| | | 1.000 | | | Quarterly | | | 06/20/2026 | | | | 2.327 | | | | | | | | 2,300 | | | | (42 | ) | | | (66 | ) | | | (108 | ) | | | 0 | | | | (2 | ) |
| | | 1.000 | | | Quarterly | | | 06/20/2027 | | | | 2.538 | | | | | | | | 400 | | | | (25 | ) | | | (1 | ) | | | (26 | ) | | | 0 | | | | (1 | ) |
| | | 1.000 | | | Quarterly | | | 06/20/2026 | | | | 4.096 | | | | EUR | | | | 300 | | | | (26 | ) | | | (8 | ) | | | (34 | ) | | | 0 | | | | (3 | ) |
| | | | | | | | | | | | | | | | | | | | | | | | | | | | | | | | | | | | | | | | | | |
| | | | | | | | | | | | | $ | (100 | ) | | $ | (75 | ) | | $ | (175 | ) | | $ | 0 | | | $ | (6 | ) |
| | | | | | | | | | | | | | | | | | | | | | | | | | | | | | | |
CREDIT DEFAULT SWAPS ON CREDIT INDICES - SELL PROTECTION
(1)
| | | | | | | | | | | | | | | | | | | | | | | | | | | | | | | | | | | | | | |
| | | | | | | | | | | | | | | | Unrealized
Appreciation/
(Depreciation) | | | | | | | |
| | | | | | |
iTraxx Asia Ex-Japan 37 5-Year Index | | | 1.000 | % | | Quarterly | | | 06/20/2027 | | | $ | | | | | 4,400 | | | $ | (22 | ) | | $ | (58 | ) | | $ | (80 | ) | | $ | 0 | | | $ | (11 | ) |
| | | | | | | | | | | | | | | | | | | | | | | | | | | | | | | | | | | |
INTEREST RATE SWAPS
| | | | | | | | | | | | | | | | | | | | | | | | | | | | | | | | | | | | | | |
| | | | | | | | | | | | | | | | | | Unrealized
Appreciation/
(Depreciation) | | | | | | | |
| | | | | | |
| | 1-Day GBP-SONIO Compounded-OIS | | | 0.750 | % | | Annual | | | 09/21/2052 | | | GBP | | | 6,100 | | | $ | 725 | | | $ | 1,622 | | | $ | 2,347 | | | $ | 0 | | | $ | (181 | ) |
| | 1-Day USD-SOFR Compounded-OIS | | | 1.000 | | | Annual | | | 06/15/2027 | | | $ | | | 11,200 | | | | (763 | ) | | | (163 | ) | | | (926 | ) | | | 61 | | | | 0 | |
| | 1-Day USD-SOFR Compounded-OIS | | | 1.750 | | | Annual | | | 06/15/2027 | | | | | | 28,200 | | | | (1,308 | ) | | | (37 | ) | | | (1,345 | ) | | | 158 | | | | 0 | |
| | 1-Day USD-SOFR Compounded-OIS | | | 1.000 | | | Annual | | | 06/15/2029 | | | | | | 2,810 | | | | (113 | ) | | | (202 | ) | | | (315 | ) | | | 18 | | | | 0 | |
| | 1-Day USD-SOFR Compounded-OIS | | | 1.750 | | | Annual | | | 06/15/2029 | | | | | | 57,700 | | | | (4,230 | ) | | | 631 | | | | (3,599 | ) | | | 495 | | | | 0 | |
| | 1-Day USD-SOFR Compounded-OIS | | | 1.250 | | | Annual | | | 06/15/2032 | | | | | | 112,370 | | | | 8,956 | | | | 5,914 | | | | 14,870 | | | | 0 | | | | (1,146 | ) |
| | 1-Day USD-SOFR Compounded-OIS | | | 1.750 | | | Annual | | | 06/15/2032 | | | | | | 46,980 | | | | 1,981 | | | | 2,157 | | | | 4,138 | | | | 0 | | | | (495 | ) |
| | 1-Day USD-SOFR Compounded-OIS | | | 1.750 | | | Annual | | | 06/15/2032 | | | | | | 880 | | | | (39 | ) | | | (42 | ) | | | (81 | ) | | | 7 | | | | 0 | |
| | 1-Day USD-SOFR Compounded-OIS | | | 1.500 | | | Annual | | | 06/15/2052 | | | | | | 17,900 | | | | (841 | ) | | | (3,207 | ) | | | (4,048 | ) | | | 272 | | | | 0 | |
| | 1-Day USD-SOFR Compounded-OIS | | | 1.750 | | | Annual | | | 06/15/2052 | | | | | | 6,900 | | | | 1,128 | | | | 86 | | | | 1,214 | | | | 0 | | | | (114 | ) |
| | | | | 12.015 | | | Maturity | | | 01/04/2027 | | | BRL | | | 39,700 | | | | 0 | | | | (101 | ) | | | (101 | ) | | | 23 | | | | 0 | |
| | | | | 3.300 | | | | | | 06/19/2024 | | | CAD | | | 11,200 | | | | 624 | | | | (655 | ) | | | (31 | ) | | | 11 | | | | 0 | |
| | | | | 3.500 | | | Semi-Annual | | | 06/20/2044 | | | | | | 1,300 | | | | (183 | ) | | | 221 | | | | 38 | | | | 0 | | | | (9 | ) |
| | | | | 0.250 | | | Semi-Annual | | | 12/18/2022 | | | $ | | | 101,000 | | | | 49 | | | | 1,168 | | | | 1,217 | | | | 0 | | | | (6 | ) |
| | | | | 1.000 | | | Semi-Annual | | | 06/17/2023 | | | | | | 3,400 | | | | (76 | ) | | | 150 | | | | 74 | | | | 0 | | | | (2 | ) |
| | | | | 0.500 | | | Semi-Annual | | | 12/15/2023 | | | | | | 85,300 | | | | (4 | ) | | | 3,370 | | | | 3,366 | | | | 0 | | | | (166 | ) |
| | | | | 3.000 | | | Semi-Annual | | | 06/19/2024 | | | | | | 32,500 | | | | (1,241 | ) | | | 1,400 | | | | 159 | | | | 0 | | | | (70 | ) |
| | | | | 1.500 | | | Semi-Annual | | | 12/18/2024 | | | | | | 14,000 | | | | 46 | | | | 518 | | | | 564 | | | | 0 | | | | (40 | ) |
| | | | | 2.000 | | | Semi-Annual | | | 06/20/2025 | | | | | | 8,400 | | | | 399 | | | | (128 | ) | | | 271 | | | | 0 | | | | (29 | ) |
| | | | | 1.350 | | | Semi-Annual | | | 01/20/2027 | | | | | | 3,200 | | | | 0 | | | | 220 | | | | 220 | | | | 0 | | | | (18 | ) |
| | | | | 1.360 | | | Semi-Annual | | | 02/15/2027 | | | | | | 2,130 | | | | 0 | | | | 149 | | | | 149 | | | | 0 | | | | (12 | ) |
| | | | | 1.450 | | | Semi-Annual | | | 02/17/2027 | | | | | | 3,500 | | | | 0 | | | | 230 | | | | 230 | | | | 0 | | | | (20 | ) |
| | | | | 1.420 | | | Semi-Annual | | | 02/24/2027 | | | | | | 1,000 | | | | 0 | | | | 67 | | | | 67 | | | | 0 | | | | (6 | ) |
| | | | | 1.650 | | | Semi-Annual | | | 02/24/2027 | | | | | | 3,400 | | | | (12 | ) | | | (180 | ) | | | (192 | ) | | | 20 | | | | 0 | |
| | | | | 1.420 | | | Semi-Annual | | | 08/17/2028 | | | | | | 3,800 | | | | 0 | | | | 332 | | | | 332 | | | | 0 | | | | (25 | ) |
| | | | | 1.370 | | | Semi-Annual | | | 08/25/2028 | | | | | | 11,363 | | | | 0 | | | | 1,031 | | | | 1,031 | | | | 0 | | | | (74 | ) |
| | | | | 1.500 | | | Semi-Annual | | | 12/15/2028 | | | | | | 7,141 | | | | 126 | | | | (776 | ) | | | (650 | ) | | | 46 | | | | 0 | |
| | | | | 1.500 | | | Semi-Annual | | | 01/12/2029 | | | | | | 2,365 | | | | 0 | | | | 207 | | | | 207 | | | | 0 | | | | (15 | ) |
| | | | | 1.700 | | | Semi-Annual | | | 01/12/2029 | | | | | | 8,600 | | | | (33 | ) | | | (609 | ) | | | (642 | ) | | | 57 | | | | 0 | |
| | | | | 3.000 | | | Semi-Annual | | | 06/19/2029 | | | | | | 44,200 | | | | 3,508 | | | | (3,659 | ) | | | (151 | ) | | | 309 | | | | 0 | |
| | | | | 1.500 | | | Semi-Annual | | | 12/18/2029 | | | | | | 4,500 | | | | (69 | ) | | | (401 | ) | | | (470 | ) | | | 31 | | | | 0 | |
| | | | | 1.000 | | | Semi-Annual | | | 12/16/2030 | | | | | | 4,805 | | | | 28 | | | | 715 | | | | 743 | | | | 0 | | | | (35 | ) |
| | | | | 1.750 | | | | | | 12/15/2031 | | | | | | 12,200 | | | | (187 | ) | | | 1,509 | | | | 1,322 | | | | 0 | | | | (88 | ) |
| | | | | 2.000 | | | Semi-Annual | | | 01/15/2050 | | | | | | 4,400 | | | | (32 | ) | | | 828 | | | | 796 | | | | 0 | | | | (37 | ) |
| | | | | 1.750 | | | Semi-Annual | | | 01/22/2050 | | | | | | 4,100 | | | | (10 | ) | | | 953 | | | | 943 | | | | 0 | | | | (33 | ) |
| | | | | 1.875 | | | Semi-Annual | | | 02/07/2050 | | | | | | 1,400 | | | | (5 | ) | | | 293 | | | | 288 | | | | 0 | | | | (12 | ) |
| | | | | | | | | | | | |
| See Accompanying Notes | | | ANNUAL REPORT | | | | | | | JUNE 30, 2022 | | | 61 |
| | | | | | |
| | PIMCO Strategic Income Fund, Inc. | | | | |
| | | | | | | | | | | | | | | | | | | | | | | | | | | | | | | | | | | | | | |
Pay/Receive
Floating Rate | | Floating Rate Index | | Fixed Rate | | | Payment
Frequency | | Maturity
Date | | | Notional
Amount | | | Premiums
Paid/(Received) | | | Unrealized
Appreciation/
(Depreciation) | | | Market
Value | | | Variation Margin | |
| | Asset | | | Liability | |
| | | | | 1.150 | % | | | | | 12/11/2050 | | | $ | | | 17,500 | | | $ | 36 | | | $ | 6,033 | | | $ | 6,069 | | | $ | 0 | | | $ | (242 | ) |
| | | | | 1.250 | | | Semi-Annual | | | 12/16/2050 | | | | | | 9,000 | | | | 909 | | | | 2,041 | | | | 2,950 | | | | 0 | | | | (127 | ) |
| | | | | 1.450 | | | Semi-Annual | | | 04/07/2051 | | | | | | 3,500 | | | | 0 | | | | 1,030 | | | | 1,030 | | | | 0 | | | | (23 | ) |
| | | | | 1.650 | | | Semi-Annual | | | 04/08/2051 | | | | | | 2,100 | | | | 0 | | | | (535 | ) | | | (535 | ) | | | 15 | | | | 0 | |
| | | | | 5.873 | | | Quarterly | | | 05/12/2026 | | | ZAR | | | 149,000 | | | | (3 | ) | | | (597 | ) | | | (600 | ) | | | 0 | | | | (3 | ) |
| | | | | 1.800 | | | Annual | | | 05/17/2026 | | | CZK | | | 146,800 | | | | 0 | | | | (848 | ) | | | (848 | ) | | | 70 | | | | 0 | |
| | | | | 0.260 | | | Annual | | | 09/06/2024 | | | EUR | | | 15,100 | | | | 2 | | | | 331 | | | | 333 | | | | 0 | | | | (71 | ) |
| | | | | 0.500 | | | Annual | | | 09/21/2052 | | | | | | 3,500 | | | | 303 | | | | 942 | | | | 1,245 | | | | 0 | | | | (91 | ) |
| | | | | 2.121 | | | Annual | | | 05/17/2026 | | | HUF | | | 2,037,400 | | | | 0 | | | | (1,169 | ) | | | (1,169 | ) | | | 50 | | | | 0 | |
| | | | | 4.550 | | | Lunar | | | 02/27/2023 | | | MXN | | | 59,400 | | | | 7 | | | | (99 | ) | | | (92 | ) | | | 0 | | | | 0 | |
| | | | | 4.500 | | | Lunar | | | 03/03/2023 | | | | | | 39,200 | | | | (1 | ) | | | (61 | ) | | | (62 | ) | | | 0 | | | | 0 | |
| | | | | 8.320 | | | Lunar | | | 03/30/2023 | | | | | | 99,300 | | | | 0 | | | | 36 | | | | 36 | | | | 0 | | | | (1 | ) |
| | | | | | | | | | | | | | | | | | | | | | | | | | | | | | | | | | | | | | |
| | | $ | 9,677 | | | $ | 20,715 | | | $ | 30,392 | | | $ | 1,643 | | | $ | (3,191 | ) |
| | | | | | | | | | | | | | | | | | | | | | | | | | | | | | | | | | | | | | |
| | | | | | | | | | | | | | | | | | | | | |
| | | | | | | | | | | | | | | | | | | | | | | | | | | | | | | | | | | | | | |
FINANCIAL DERIVATIVE INSTRUMENTS: EXCHANGE-TRADED OR CENTRALLY CLEARED SUMMARY
The following is a summary of the market value and variation margin of Exchange-Traded or Centrally Cleared Financial Derivative Instruments as of June 30, 2022:
| | | | | | | | | | | | | | | | | | | | | | | | | | | | | | | | | | | | |
| | | Financial Derivative Assets | | | | | | Financial Derivative Liabilities | |
| | | | | | | | | Total | | | | | | | | | Variation Margin
Liability | | | Total | |
| | | | | | | | | | | | | | | | | | | | | | |
Total Exchange-Traded or Centrally Cleared | | | | | | | | | | | | | | | | | | | | | | | | | | | | | | | | | | | | |
| | | | | | | | | | | | | | | | | | | | | | | | | | | | | | | | | | | | |
Cash of $10,751 has been pledged as collateral for exchange-traded and centrally cleared financial derivative instruments as of June 30, 2022. See Note 8, Master Netting Arrangements, in the Notes to Financial Statements for more information.
| If the Fund is a seller of protection and a credit event occurs, as defined under the terms of that particular swap agreement, the Fund will either (i) pay to the buyer of protection an amount equal to the notional amount of the swap and take delivery of the referenced obligation or underlying securities comprising the referenced index or (ii) pay a net settlement amount in the form of cash, securities or other deliverable obligations equal to the notional amount of the swap less the recovery value of the referenced obligation or underlying securities comprising the referenced index. |
| Implied credit spreads, represented in absolute terms, utilized in determining the market value of credit default swap agreements on issues as of period end serve as indicators of the current status of the payment/performance risk and represent the likelihood or risk of default for the credit derivative. The implied credit spread of a particular referenced entity reflects the cost of buying/selling protection and may include upfront payments required to be made to enter into the agreement. Wider credit spreads represent a deterioration of the referenced entity’s credit soundness and a greater likelihood or risk of default or other credit event occurring as defined under the terms of the agreement. |
| The maximum potential amount the Fund could be required to pay as a seller of credit protection or receive as a buyer of credit protection if a credit event occurs as defined under the terms of that particular swap agreement. |
| The prices and resulting values for credit default swap agreements serve as indicators of the current status of the payment/performance risk and represent the likelihood of an expected liability (or profit) for the credit derivative should the notional amount of the swap agreement be closed/sold as of the period end. Increasing market values, in absolute terms when compared to the notional amount of the swap, represent a deterioration of the underlying referenced instrument’s credit soundness and a greater likelihood or risk of default or other credit event occurring as defined under the terms of the agreement. |
| This instrument has a forward starting effective date. See Note 2, Securities Transactions and Investment Income, in the Notes to Financial Statements for further information. |
(n) FINANCIAL DERIVATIVE INSTRUMENTS: OVER THE COUNTER
FORWARD FOREIGN CURRENCY CONTRACTS:
| | | | | | | | | | | | | | | | | | | | | | | | |
| Counterparty | | Settlement
Month | | | Currency to
be Delivered | | | Currency to
be Received | | | Unrealized Appreciation/
(Depreciation) | |
| | | | | | |
| | | 07/2022 | | | GBP | | | 10,104 | | | $ | | | 12,775 | | | $ | 476 | | | $ | 0 | |
| | | 07/2022 | | | HUF | | | 65,933 | | | | | | 179 | | | | 5 | | | | 0 | |
| | | 07/2022 | | | $ | | | 83 | | | HUF | | | 31,752 | | | | 0 | | | | 0 | |
| | | 07/2022 | | | | | | 394 | | | PEN | | | 1,540 | | | | 10 | | | | (3 | ) |
| | | 08/2022 | | | | | | 173 | | | | | | 669 | | | | 1 | | | | 0 | |
| | | 02/2023 | | | PEN | | | 669 | | | $ | | | 170 | | | | 0 | | | | (1 | ) |
| | | | | | | |
| | | 07/2022 | | | CZK | | | 2,432 | | | | | | 103 | | | | 0 | | | | 0 | |
| | | 07/2022 | | | HUF | | | 30,457 | | | | | | 80 | | | | 0 | | | | (1 | ) |
| | | 07/2022 | | | $ | | | 21,548 | | | EUR | | | 20,486 | | | | 0 | | | | (80 | ) |
| | | 07/2022 | | | | | | 845 | | | GBP | | | 686 | | | | 0 | | | | (10 | ) |
| | | 07/2022 | | | | | | 29 | | | HUF | | | 10,744 | | | | 0 | | | | (1 | ) |
| | | 08/2022 | | | EUR | | | 18,125 | | | $ | | | 19,099 | | | | 70 | | | | 0 | |
| | | 08/2022 | | | GBP | | | 9,297 | | | | | | 11,296 | | | | 0 | | | | (27 | ) |
| | | 08/2022 | | | MXN | | | 2,567 | | | | | | 117 | | | | 0 | | | | (10 | ) |
| | | | | | |
| 62 | | PIMCO CLOSED-END FUNDS | | | See Accompanying Notes | |
| | | | | | | | | | | | | | | | | | | | | | | | |
| Counterparty | | Settlement
Month | | | Currency to
be Delivered | | | Currency to
be Received | | | Unrealized Appreciation/
(Depreciation) | |
| | Asset | | | Liability | |
| | | 08/2022 | | | ZAR | | | 1,063 | | | $ | | | 67 | | | $ | 2 | | | $ | 0 | |
| | | 11/2022 | | | | | | 961 | | | | | | 60 | | | | 1 | | | | 0 | |
| | | | | | | |
| | | 11/2022 | | | | | | 697 | | | | | | 43 | | | | 1 | | | | 0 | |
| | | | | | | |
| | | 07/2022 | | | BRL | | | 4,474 | | | | | | 854 | | | | 0 | | | | (1 | ) |
| | | 07/2022 | | | PEN | | | 825 | | | | | | 214 | | | | 0 | | | | (1 | ) |
| | | 07/2022 | | | $ | | | 921 | | | BRL | | | 4,474 | | | | 0 | | | | (66 | ) |
| | | 07/2022 | | | | | | 328 | | | EUR | | | 306 | | | | 0 | | | | (7 | ) |
| | | 07/2022 | | | | | | 4 | | | HUF | | | 1,325 | | | | 0 | | | | 0 | |
| | | 08/2022 | | | PEN | | | 12,084 | | | $ | | | 3,202 | | | | 65 | | | | (9 | ) |
| | | 11/2022 | | | $ | | | 110 | | | PEN | | | 435 | | | | 3 | | | | 0 | |
| | | 12/2022 | | | PEN | | | 705 | | | $ | | | 182 | | | | 1 | | | | 0 | |
| | | 12/2022 | | | $ | | | 886 | | | PEN | | | 3,716 | | | | 70 | | | | 0 | |
| | | 03/2023 | | | PEN | | | 562 | | | $ | | | 145 | | | | 2 | | | | 0 | |
| | | 04/2023 | | | $ | | | 209 | | | PEN | | | 825 | | | | 1 | | | | 0 | |
| | | | | | | |
| | | 07/2022 | | | HUF | | | 30,681 | | | $ | | | 83 | | | | 3 | | | | 0 | |
| | | 07/2022 | | | $ | | | 28 | | | HUF | | | 10,001 | | | | 0 | | | | (1 | ) |
| | | 07/2022 | | | ZAR | | | 1,247 | | | $ | | | 77 | | | | 1 | | | | 0 | |
| | | 08/2022 | | | | | | 1,374 | | | | | | 89 | | | | 4 | | | | 0 | |
| | | 05/2023 | | | | | | 295 | | | | | | 18 | | | | 0 | | | | 0 | |
| | | | | | | |
| | | 07/2022 | | | CAD | | | 366 | | | | | | 290 | | | | 6 | | | | 0 | |
| | | 07/2022 | | | EUR | | | 477 | | | | | | 501 | | | | 1 | | | | 0 | |
| | | 07/2022 | | | GBP | | | 305 | | | | | | 375 | | | | 4 | | | | 0 | |
| | | 07/2022 | | | HUF | | | 31,413 | | | | | | 82 | | | | 0 | | | | (1 | ) |
| | | 07/2022 | | | $ | | | 246 | | | GBP | | | 201 | | | | 0 | | | | (2 | ) |
| | | 07/2022 | | | | | | 23 | | | HUF | | | 8,698 | | | | 0 | | | | 0 | |
| | | | | | | |
| | | 07/2022 | | | CZK | | | 22,434 | | | $ | | | 957 | | | | 8 | | | | 0 | |
| | | | | | | |
| | | 07/2022 | | | BRL | | | 4,474 | | | | | | 868 | | | | 13 | | | | 0 | |
| | | 07/2022 | | | $ | | | 854 | | | BRL | | | 4,474 | | | | 1 | | | | 0 | |
| | | 07/2022 | | | | | | 272 | | | GBP | | | 225 | | | | 2 | | | | 0 | |
| | | 08/2022 | | | | | | 861 | | | BRL | | | 4,474 | | | | 0 | | | | (13 | ) |
| | | 08/2022 | | | | | | 16 | | | ZAR | | | 255 | | | | 0 | | | | 0 | |
| | | | | | | |
| | | 09/2022 | | | MXN | | | 740 | | | $ | | | 36 | | | | 0 | | | | 0 | |
| | | | | | | |
| | | 08/2022 | | | $ | | | 114 | | | ZAR | | | 1,884 | | | | 1 | | | | 0 | |
| | | | | | | |
| | | 11/2022 | | | PEN | | | 140 | | | $ | | | 34 | | | | 0 | | | | (2 | ) |
| | | | | | | |
| | | 07/2022 | | | EUR | | | 19,860 | | | | | | 21,346 | | | | 533 | | | | 0 | |
| | | 07/2022 | | | $ | | | 3 | | | HUF | | | 1,303 | | | | 0 | | | | 0 | |
| | | | | | | |
| | | 08/2022 | | | ZAR | | | 1,394 | | | $ | | | 85 | | | | 0 | | | | 0 | |
| | | | | | | |
| | | 07/2022 | | | HUF | | | 375,502 | | | | | | 1,071 | | | | 81 | | | | 0 | |
| | | 11/2022 | | | ZAR | | | 325 | | | | | | 20 | | | | 0 | | | | 0 | |
| | | | | | | | | | | | | | | | | | | | | | | | |
Total Forward Foreign Currency Contracts | | | | | | | | | |
| | | | | | | | | | | | | | | | | | | | | | | | |
FINANCIAL DERIVATIVE INSTRUMENTS: OVER THE COUNTER SUMMARY
The following is a summary by counterparty of the market value of OTC financial derivative instruments and collateral pledged/(received) as of June 30, 2022:
| | | | | | | | | | | | | | | | | | | | | | | | | | | | | | | | | | | | | | | | | | | | | | | | |
| | | Financial Derivative Assets | | | | | | Financial Derivative Liabilities | | | | | | | | | | |
| | Forward
Foreign
Currency
Contracts | | | | | | | | | | | | | | | Forward
Foreign
Currency
Contracts | | | | | | | | | | | | Net Market
Value of OTC
Derivatives | | | Collateral Pledged/
(Received) | | | | |
| | $ | 492 | | | $ | 0 | | | $ | 0 | | | $ | 492 | | | | | | | $ | (4 | ) | | $ | 0 | | | $ | 0 | | | $ | (4 | ) | | $ | 488 | | | $ | (300 | ) | | $ | 188 | |
| | | 73 | | | | 0 | | | | 0 | | | | 73 | | | | | | | | (129 | ) | | | 0 | | | | 0 | | | | (129 | ) | | | (56 | ) | | | 0 | | | | (56 | ) |
| | | 1 | | | | 0 | | | | 0 | | | | 1 | | | | | | | | 0 | | | | 0 | | | | 0 | | | | 0 | | | | 1 | | | | 0 | | | | 1 | |
| | | 142 | | | | 0 | | | | 0 | | | | 142 | | | | | | | | (84 | ) | | | 0 | | | | 0 | | | | (84 | ) | | | 58 | | | | 0 | | | | 58 | |
| | | 8 | | | | 0 | | | | 0 | | | | 8 | | | | | | | | (1 | ) | | | 0 | | | | 0 | | | | (1 | ) | | | 7 | | | | 0 | | | | 7 | |
| | | 11 | | | | 0 | | | | 0 | | | | 11 | | | | | | | | (3 | ) | | | 0 | | | | 0 | | | | (3 | ) | | | 8 | | | | 0 | | | | 8 | |
| | | 8 | | | | 0 | | | | 0 | | | | 8 | | | | | | | | 0 | | | | 0 | | | | 0 | | | | 0 | | | | 8 | | | | 0 | | | | 8 | |
| | | 16 | | | | 0 | | | | 0 | | | | 16 | | | | | | | | (13 | ) | | | 0 | | | | 0 | | | | (13 | ) | | | 3 | | | | 0 | | | | 3 | |
| | | 1 | | | | 0 | | | | 0 | | | | 1 | | | | | | | | 0 | | | | 0 | | | | 0 | | | | 0 | | | | 1 | | | | 0 | | | | 1 | |
| | | 0 | | | | 0 | | | | 0 | | | | 0 | | | | | | | | (2 | ) | | | 0 | | | | 0 | | | | (2 | ) | | | (2 | ) | | | 0 | | | | (2 | ) |
| | | 533 | | | | 0 | | | | 0 | | | | 533 | | | | | | | | 0 | | | | 0 | | | | 0 | | | | 0 | | | | 533 | | | | (420 | ) | | | 113 | |
| | | 81 | | | | 0 | | | | 0 | | | | 81 | | | | | | | | 0 | | | | 0 | | | | 0 | | | | 0 | | | | 81 | | | | 0 | | | | 81 | |
| | | | | | | | | | | | | | | | | | | | | | | | | | | | | | | | | | | | | | | | | | | | | | | | |
| | | | | | | | | | | | | | | | | | | | | | | | | | | | | | | | | | | | | | | | | | | | | | | | |
| | | | | | | | | | | | | | | | | | | | | | | | | | | | | | | | | | | | | | | | | | | | | | | | |
| Net Exposure represents the net receivable/(payable) that would be due from/to the counterparty in the event of default. Exposure from OTC financial derivative instruments can only be netted across transactions governed under the same master agreement with the same legal entity. See Note 8, Master Netting Arrangements, in the Notes to Financial Statements for more information. |
| | | | | | | | | | | | |
| See Accompanying Notes | | | ANNUAL REPORT | | | | | | | JUNE 30, 2022 | | | 63 |
| | | | | | |
| | PIMCO Strategic Income Fund, Inc. | | | | |
FAIR VALUE OF FINANCIAL DERIVATIVE INSTRUMENTS
The following is a summary of the fair valuation of the Fund’s derivative instruments categorized by risk exposure. See Note 7, Principal and Other Risks, in the Notes to Financial Statements on risks of the Fund.
Fair Values of Financial Derivative Instruments on the Statements of Assets and Liabilities as of June 30, 2022:
| | | | | | | | | | | | | | | | | | | | | | | | |
| | | Derivatives not accounted for as hedging instruments | |
| | | | | | | | | | | | | | | | | | | |
Financial Derivative Instruments - Assets | |
Exchange-traded or centrally cleared | |
| | $ | 0 | | | $ | 0 | | | $ | 0 | | | $ | 0 | | | $ | 1,643 | | | $ | 1,643 | |
| | | | | | | | | | | | | | | | | | | | | | | | |
| |
Forward Foreign Currency Contracts | | $ | 0 | | | $ | 0 | | | $ | 0 | | | $ | 1,366 | | | $ | 0 | | | $ | 1,366 | |
| | | | | | | | | | | | | | | | | | | | | | | | |
| | $ | 0 | | | $ | 0 | | | $ | 0 | | | $ | 1,366 | | | $ | 1,643 | | | $ | 3,009 | |
| | | | | | | | | | | | | | | | | | | | | | | | |
|
Financial Derivative Instruments - Liabilities | |
Exchange-traded or centrally cleared | |
| | $ | 0 | | | $ | 17 | | | $ | 0 | | | $ | 0 | | | $ | 3,191 | | | $ | 3,208 | |
| | | | | | | | | | | | | | | | | | | | | | | | |
| |
Forward Foreign Currency Contracts | | $ | 0 | | | $ | 0 | | | $ | 0 | | | $ | 236 | | | $ | 0 | | | $ | 236 | |
| | | | | | | | | | | | | | | | | | | | | | | | |
| | $ | 0 | | | $ | 17 | | | $ | 0 | | | $ | 236 | | | $ | 3,191 | | | $ | 3,444 | |
| | | | | | | | | | | | | | | | | | | | | | | | |
The effect of Financial Derivative Instruments on the Statements of Operations for the period ended June 30, 2022:
| | | | | | | | | | | | | | | | | | | | | | | | |
| | | Derivatives not accounted for as hedging instruments | |
| | | | | | | | | | | | | | | | | | | |
Net Realized Gain (Loss) on Financial Derivative Instruments | |
Exchange-traded or centrally cleared | |
| | $ | 0 | | | $ | 0 | | | $ | 0 | | | $ | 0 | | | $ | 951 | | | $ | 951 | |
| | | 0 | | | | 252 | | | | 0 | | | | 0 | | | | (2,475 | ) | | | (2,223 | ) |
| | | | | | | | | | | | | | | | | | | | | | | | |
| | $ | 0 | | | $ | 252 | | | $ | 0 | | | $ | 0 | | | $ | (1,524 | ) | | $ | (1,272 | ) |
| | | | | | | | | | | | | | | | | | | | | | | | |
| |
Forward Foreign Currency Contracts | | $ | 0 | | | $ | 0 | | | $ | 0 | | | $ | 4,525 | | | $ | 0 | | | $ | 4,525 | |
| | | 0 | | | | 0 | | | | 0 | | | | 0 | | | | (1 | ) | | | (1 | ) |
| | | 0 | | | | 0 | | | | 0 | | | | 0 | | | | 284 | | | | 284 | |
| | | | | | | | | | | | | | | | | | | | | | | | |
| | $ | 0 | | | $ | 0 | | | $ | 0 | | | $ | 4,525 | | | $ | 283 | | | $ | 4,808 | |
| | | | | | | | | | | | | | | | | | | | | | | | |
| | $ | 0 | | | $ | 252 | | | $ | 0 | | | $ | 4,525 | | | $ | (1,241 | ) | | $ | 3,536 | |
| | | | | | | | | | | | | | | | | | | | | | | | |
|
Net Change in Unrealized Appreciation (Depreciation) on Financial Derivative Instruments | |
Exchange-traded or centrally cleared | |
| | $ | 0 | | | $ | 0 | | | $ | 0 | | | $ | 0 | | | $ | (458 | ) | | $ | (458 | ) |
| | | 0 | | | | (337 | ) | | | 0 | | | | 0 | | | | 20,290 | | | | 19,953 | |
| | | | | | | | | | | | | | | | | | | | | | | | |
| | $ | 0 | | | $ | (337 | ) | | $ | 0 | | | $ | 0 | | | $ | 19,832 | | | $ | 19,495 | |
| | | | | | | | | | | | | | | | | | | | | | | | |
| |
Forward Foreign Currency Contracts | | $ | 0 | | | $ | 0 | | | $ | 0 | | | $ | (228 | ) | | $ | 0 | | | $ | (228 | ) |
| | | 0 | | | | 0 | | | | 0 | | | | 0 | | | | 1 | | | | 1 | |
| | | 0 | | | | 0 | | | | 0 | | | | 0 | | | | (210 | ) | | | (210 | ) |
| | | | | | | | | | | | | | | | | | | | | | | | |
| | $ | 0 | | | $ | 0 | | | $ | 0 | | | $ | (228 | ) | | $ | (209 | ) | | $ | (437 | ) |
| | | | | | | | | | | | | | | | | | | | | | | | |
| | $ | 0 | | | $ | (337 | ) | | $ | 0 | | | $ | (228 | ) | | $ | 19,623 | | | $ | 19,058 | |
| | | | | | | | | | | | | | | | | | | | | | | | |
FAIR VALUE MEASUREMENTS
The following is a summary of the fair valuations according to the inputs used as of June 30, 2022 in valuing the Fund’s assets and liabilities:
| | | | | | | | | | | | | | | | |
| | | | | | | | | | | | |
Investments in Securities, at Value | |
Loan Participations and Assignments | | $ | 0 | | | $ | 23,995 | | | $ | 12,340 | | | $ | 36,335 | |
| |
| | | 0 | | | | 24,016 | | | | 2,899 | | | | 26,915 | |
| | | 0 | | | | 69,087 | | | | 14,118 | | | | 83,205 | |
| | | 0 | | | | 16,939 | | | | 0 | | | | 16,939 | |
Convertible Bonds & Notes | |
| | | 0 | | | | 191 | | | | 0 | | | | 191 | |
| |
| | | 0 | | | | 1,825 | | | | 0 | | | | 1,825 | |
| | | 0 | | | | 124 | | | | 0 | | | | 124 | |
| | | 0 | | | | 955 | | | | 0 | | | | 955 | |
| | | 0 | | | | 2,049 | | | | 0 | | | | 2,049 | |
| | | 0 | | | | 132,564 | | | | 0 | | | | 132,564 | |
Non-Agency Mortgage-Backed Securities | | | 0 | | | | 56,644 | | | | 0 | | | | 56,644 | |
| | | 0 | | | | 12,479 | | | | 8,827 | | | | 21,306 | |
| | | 0 | | | | 10,281 | | | | 0 | | | | 10,281 | |
| |
| | | 849 | | | | 0 | | | | 376 | | | | 1,225 | |
| | | 544 | | | | 0 | | | | 6 | | | | 550 | |
| | | 0 | | | | 0 | | | | 2,763 | | | | 2,763 | |
| | | 0 | | | | 0 | | | | 6,400 | | | | 6,400 | |
| | | 0 | | | | 0 | | | | 92 | | | | 92 | |
| |
| | | 0 | | | | 0 | | | | 50 | | | | 50 | |
| |
| | | 0 | | | | 0 | | | | 54 | | | | 54 | |
| | | 0 | | | | 0 | | | | 598 | | | | 598 | |
| |
| | | 0 | | | | 14,078 | | | | 0 | | | | 14,078 | |
| | | | | | | | | | | | | | | | | |
| | | | | | | | | | | | |
| | $ | 0 | | | $ | 122 | | | $ | 0 | | | $ | 122 | |
Real Estate Investment Trusts | |
| | | 2,058 | | | | 0 | | | | 0 | | | | 2,058 | |
| |
| | | 0 | | | | 2,703 | | | | 0 | | | | 2,703 | |
| | | 0 | | | | 61 | | | | 0 | | | | 61 | |
| | | 0 | | | | 10,104 | | | | 0 | | | | 10,104 | |
| | | | | | | | | | | | | | | | | |
| | | | | |
| | $ | 3,451 | | | $ | 378,217 | | | $ | 48,523 | | | $ | 430,191 | |
| | | | | | | | | | | | | | | | | |
| |
Short Sales, at Value - Liabilities | |
| | $ | 0 | | | $ | (2,610 | ) | | $ | 0 | | | $ | (2,610 | ) |
| | | | | | | | | | | | | | | | | |
| |
Financial Derivative Instruments - Assets | |
Exchange-traded or centrally cleared | | | 0 | | | | 1,643 | | | | 0 | | | | 1,643 | |
| | | 0 | | | | 1,366 | | | | 0 | | | | 1,366 | |
| | | | | | | | | | | | | | | | | |
| | | $ | 0 | | | $ | 3,009 | | | $ | 0 | | | $ | 3,009 | |
| | | | | | | | | | | | | | | | | |
| |
Financial Derivative Instruments - Liabilities | |
Exchange-traded or centrally cleared | | | 0 | | | | (3,208 | ) | | | 0 | | | | (3,208 | ) |
| | | 0 | | | | (236 | ) | | | 0 | | | | (236 | ) |
| | | | | | | | | | | | | | | | | |
| | | $ | 0 | | | $ | (3,444 | ) | | $ | 0 | | | $ | (3,444 | ) |
| | | | | | | | | | | | | | | | | |
| | | | | |
Total Financial Derivative Instruments | | $ | 0 | | | $ | (435 | ) | | $ | 0 | | | $ | (435 | ) |
| | | | | | | | | | | | | | | | | |
| | | | | |
| | $ | 3,451 | | | $ | 375,172 | | | $ | 48,523 | | | $ | 427,146 | |
| | | | | | | | | | | | | | | | | |
The following is a reconciliation of the fair valuations using significant unobservable inputs (Level 3) for the Fund during the period ended June 30, 2022:
| | | | | | | | | | | | | | | | | | | | | | | | | | | | | | | | | | | | | | | | | |
| | Beginning
Balance
at 06/30/2021 | | | | | | | | | Accrued
Discounts/
(Premiums) | | | | | | Net Change in Unrealized Appreciation/ (Depreciation) (1) | | | | | | | | | Ending
Balance
at 06/30/2022 | | | Net Change in Unrealized Appreciation/ (Depreciation) on Investments Held at 06/30/2022 (1) | |
Investments in Securities, at Value | |
Loan Participations and Assignments | | $ | 2,996 | | | $ | 17,785 | | | $ | (432 | ) | | $ | 179 | | | $ | (72 | ) | | $ | (5,973 | ) | | $ | 0 | | | $ | (2,143 | ) | | $ | 12,340 | | | $ | (5,531 | ) |
| |
| | | 3,320 | | | | 0 | | | | 0 | | | | 0 | | | | 0 | | | | (421 | ) | | | 0 | | | | 0 | | | | 2,899 | | | | (421 | ) |
| | | 0 | | | | 11,071 | | | | (75 | ) | | | 0 | | | | 0 | | | | (973 | ) | | | 4,095 | | | | 0 | | | | 14,118 | | | | (973 | ) |
| | | 5,781 | | | | 4,994 | | | | 0 | | | | 0 | | | | 0 | | | | (1,948 | ) | | | 0 | | | | 0 | | | | 8,827 | | | | (1,948 | ) |
| |
| | | 1,282 | | | | 0 | | | | 0 | | | | 0 | | | | 0 | | | | (906 | ) | | | 0 | | | | 0 | | | | 376 | | | | (906 | ) |
| | | 0 | | | | 6 | | | | 0 | | | | 0 | | | | 0 | | | | 0 | | | | 0 | | | | 0 | | | | 6 | | | | 0 | |
| | | 0 | | | | 6,775 | | | | 0 | | | | 0 | | | | 0 | | | | (4,012 | ) | | | 0 | | | | 0 | | | | 2,763 | | | | (4,012 | ) |
| | | 3,630 | | | | 722 | | | | 0 | | | | 0 | | | | 0 | | | | 2,048 | | | | 0 | | | | 0 | | | | 6,400 | | | | 2,048 | |
| | | 2,817 | | | | 0 | | | | (2,740 | ) | | | 0 | | | | 213 | | | | (198 | ) | | | 0 | | | | 0 | | | | 92 | | | | 92 | |
| |
| | | 0 | | | | 0 | | | | 0 | | | | 0 | | | | 0 | | | | 50 | | | | 0 | | | | 0 | | | | 50 | | | | 50 | |
| |
| | | 0 | | | | 2,726 | | | | 0 | | | | 0 | | | | (64 | ) | | | (2,608 | ) | | | 0 | | | | 0 | | | | 54 | | | | (2,608 | ) |
| | | 626 | | | | 0 | | | | 0 | | | | 0 | | | | 0 | | | | (28 | ) | | | 0 | | | | 0 | | | | 598 | | | | (28 | ) |
| | | | | | | | | | | | | | | | | | | | | | | | | | | | | | | | | | | | | | | | | |
| | | | | | | | | | | |
| | $ | 20,452 | | | $ | 44,079 | | | $ | (3,247 | ) | | $ | 179 | | | $ | 77 | | | $ | (14,969 | ) | | $ | 4,095 | | | $ | (2,143 | ) | | $ | 48,523 | | | $ | (14,237 | ) |
| | | | | | | | | | | | | | | | | | | | | | | | | | | | | | | | | | | | | | | | | |
| | | | | | | | | | | | | |
| See Accompanying Notes | | | | | | | | | | JUNE 30, 2022 | | | |
| | | | | | | |
| | PIMCO Strategic Income Fund, Inc. | | | | June 30, 2022 |
The following is a summary of significant unobservable inputs used in the fair valuations of assets and liabilities categorized within Level 3 of the fair value hierarchy:
| | | | | | | | | | | | | | | | | | | | | |
| | Ending
Balance
at 06/30/2022 | | | | | | | | | | (% Unless Noted Otherwise) | |
| | | | | | |
Investments in Securities, at Value | |
Loan Participations and Assignments | | $ | 1,793 | | | | | Discount Rate | | | | | | | 5.136 | | | | — | |
| | | | 3,060 | | | | | Base Price | | | | | | | 65.125 | | | | — | |
| | | | 7,487 | | | | | Broker Quote | | | | | | | | | | | 90.376 | |
| |
| | | 2,899 | | | | | Discount Rate | | | | | | | 6.704 | | | | — | |
| | | 10,098 | | | | | Discount Rate | | | | | | | 12.080 | | | | — | |
| | | | 4,020 | | | | | Weighted Average | | | BRL | | | | 42.864 | | | | — | |
| | | 3,219 | | | | | Discount Rate | | | | | | | | | | | 8.385 | |
| | | | 5,608 | | | | | Base Price | | | | | | | | | | | 55,544.262 | |
| |
| | | 376 | | | | | Liquidity Discount | | | | | | | 10.000 | | | | — | |
| | | 6 | | | Other Valuation Techniques (3) | | — | | | | | | | — | | | | — | |
| | | 2,763 | | | Indicative Market Quotation | | EBITDA Multiple | | | X | | | | 7.000 | | | | — | |
| | | 5,678 | | | | | Discount Rate | | | | | | | | | | | 9.500 | |
| | | | 722 | | | | | Purchase Price | | | $ | | | | 0.980 | | | | — | |
| | | 92 | | | | | EBITDA Multiple | | | X | | | | 0.977 | | | | — | |
| |
| | | 50 | | | Other Valuation Techniques (3) | | — | | | | | | | — | | | | — | |
| |
| | | 2 | | | Indicative Market Quotation | | EBITDA Multiple | | | X | | | | 7.000 | | | | — | |
| | | | 52 | | | Other Valuation Techniques (3) | | — | | | | | | | — | | | | — | |
| | | 598 | | | | | EBITDA Multiple | | | X | | | | 3.875 | | | | — | |
| | | | | | | | | | | | | | | | | | | | | |
| | $ | 48,523 | | | | | | | | | | | | | | | | | |
| | | | | | | | | | | | | | | | | | | | | |
| Any difference between Net Change in Unrealized Appreciation/(Depreciation) and Net Change in Unrealized Appreciation/(Depreciation) on Investments Held at June 30, 2022 may be due to an investment no longer held or categorized as Level 3 at period end. |
| Sector type updated from Financials to Materials since prior fiscal year end. |
| Includes valuation techniques not defined in the Notes to Financial Statements as securities valued using such techniques are not considered significant to the Fund. |
| | | | | | |
| 66 | | PIMCO CLOSED-END FUNDS | | | See Accompanying Notes | |
| | | | | | |
Consolidated Schedule of Investments | | | | | | June 30, 2022 |
(Amounts in thousands*, except number of shares, contracts, units and ounces, if any)
| | | | | | | | | | | | |
| | | | | PRINCIPAL
AMOUNT
(000S) | | | | | MARKET
VALUE
(000S) | |
INVESTMENTS IN SECURITIES 165.1% | |
| |
LOAN PARTICIPATIONS AND ASSIGNMENTS 34.1% | |
|
| |
| | $ | | | 24,214 | | | $ | | | 22,519 | |
|
| |
7.166% (LIBOR01M + 5.500%) due 09/01/2027 ~ | | | | | 12,044 | | | | | | 11,376 | |
|
| |
3.750% - 3.975% (EUR003M + 3.750%) due 06/30/2025 ~ | | EUR | | | 9,566 | | | | | | 9,298 | |
|
| |
| | | | | 13,232 | | | | | | 11,457 | |
|
Clear Channel Outdoor Holdings, Inc. | |
4.739% (LIBOR03M + 3.500%) due 08/21/2026 ~ | | $ | | | 11,471 | | | | | | 9,875 | |
|
| |
| | EUR | | | 3,392 | | | | | | 2,853 | |
|
Commercial Mortgage Trust, Inc | |
| | | | | 5,476 | | | | | | 4,741 | |
|
| |
2.500% (EUR003M + 2.500%) due 04/07/2025 ~ | | | | | 12,144 | | | | | | 11,804 | |
|
| |
| | $ | | | 15,335 | | | | | | 15,143 | |
|
| |
4.000% - 5.000% (LIBOR03M + 2.750%) due 11/06/2023 ~ | | | | | 3,280 | | | | | | 2,784 | |
|
Envision Healthcare Corp. | |
| | | | | 1,862 | | | | | | 1,838 | |
| | | | | 10,238 | | | | | | 10,110 | |
|
| |
2.500% (EUR003M + 2.000%) due 04/01/2024 ~ | | EUR | | | 10,268 | | | | | | 10,299 | |
|
Instant Brands Holdings, Inc. | |
6.400% - 7.076% (LIBOR03M + 5.000%) due 04/12/2028 ~ | | $ | | | 9,311 | | | | | | 7,480 | |
|
| |
| | EUR | | | 6,160 | | | | | | 6,357 | |
| | GBP | | | 1,165 | | | | | | 1,397 | |
|
| |
| | $ | | | 2,000 | | | | | | 1,820 | |
|
Petco Health & Wellness Co., Inc. | |
5.500% (LIBOR03M + 3.250%) due 03/03/2028 ~ | | | | | 2,032 | | | | | | 1,918 | |
|
| |
| | | | | 8,394 | | | | | | 8,268 | |
|
Promotora de Informaciones SA | |
| | EUR | | | 16,000 | | | | | | 16,615 | |
| | | | | 3,208 | | | | | | 3,017 | |
|
Sequa Mezzanine Holdings LLC | |
8.303% (LIBOR03M + 6.750%) due 11/28/2023 ~ | | $ | | | 14,031 | | | | | | 13,973 | |
|
| |
3.500% (EUR003M + 3.500%) due 07/02/2025 ~ | | EUR | | | 7,500 | | | | | | 5,963 | |
|
Steenbok Lux Finco 1 SARL (10.000% PIK) | |
10.000% (LIBOR03M) due 12/31/2022 ~(b) | | | | | 4,000 | | | | | | 2,663 | |
|
Steenbok Lux Finco 2 SARL (10.750% PIK) | |
10.750% (EUR003M) due 12/29/2022 «~(b) | | | | | 16,865 | | | | | | 10,869 | |
|
Surgery Center Holdings, Inc. | |
4.950% (LIBOR01M + 3.750%) due 08/31/2026 ~ | | $ | | | 9,200 | | | | | | 8,599 | |
|
| |
| | | | | 14,690 | | | | | | 12,964 | |
|
Team Health Holdings, Inc. | |
4.416% (LIBOR01M + 2.750%) due 02/06/2024 ~ | | | | | 16,224 | | | | | | 14,494 | |
| | | | | 1,732 | | | | | | 1,466 | |
|
| |
| | | | | 13,943 | | | | | | 4,881 | |
| | | | | | | | | | | | |
| | | | | PRINCIPAL
AMOUNT
(000S) | | | | | MARKET
VALUE
(000S) | |
|
| |
6.688% (LIBOR01M + 5.000%) due 06/26/2026 ~ | | $ | | | 13,894 | | | $ | | | 9,568 | |
7.188% (LIBOR01M + 5.500%) due 06/26/2026 «~ | | | | | 499 | | | | | | 348 | |
|
| |
5.075% (LIBOR03M + 3.500%) due 04/04/2025 ~ | | | | | 1,094 | | | | | | 1,053 | |
| | | | | | | | | | | | |
Total Loan Participations and Assignments (Cost $280,521) | | | | |
| | | | | | | | | | | | |
| |
CORPORATE BONDS & NOTES 35.3% | |
| |
| |
|
| |
| | EUR | | | 900 | | | | | | 552 | |
| | | | | 4,000 | | | | | | 2,180 | |
| | | | | 5,100 | | | | | | 2,597 | |
| | | | | 1,200 | | | | | | 643 | |
| | | | | 1,900 | | | | | | 1,091 | |
|
| |
| | | | | 200 | | | | | | 165 | |
| | | | | 600 | | | | | | 460 | |
| | | | | 1,200 | | | | | | 839 | |
|
| |
8.500% due 11/15/2029 (j) | | $ | | | 8,000 | | | | | | 6,625 | |
|
Banca Monte dei Paschi di Siena SpA | |
2.625% due 04/28/2025 (j) | | EUR | | | 15,420 | | | | | | 14,356 | |
5.375% due 01/18/2028 •(j) | | | | | 2,200 | | | | | | 1,370 | |
| | | | | 1,500 | | | | | | 1,007 | |
| | | | | 7,804 | | | | | | 5,722 | |
|
| |
7.500% due 02/16/2027 (j) | | | | | 4,000 | | | | | | 3,396 | |
|
Corestate Capital Holding SA | |
| | | | | 2,000 | | | | | | 472 | |
|
| |
9.500% (T-BILL 3MO + 9.500%) due 04/22/2025 ~ | | $ | | | 939 | | | | | | 932 | |
|
| |
11.750% (T-BILL 3MO + 11.750%) due 04/09/2029 ~ | | | | | 1,815 | | | | | | 1,817 | |
|
| |
| | | | | 2,400 | | | | | | 2,323 | |
|
| |
6.000% due 01/15/2030 (j) | | | | | 8,300 | | | | | | 5,753 | |
7.875% due 02/15/2025 (j) | | | | | 8,000 | | | | | | 7,744 | |
|
| |
11.389% (T-BILL 3MO + 9.750%) due 06/06/2025 ~ | | | | | 980 | | | | | | 982 | |
| | | | | | | | | | | | |
| | | | | | | | | | | 61,026 | |
| | | | | | | | | | | | |
| |
| |
|
| |
10.500% due 05/15/2027 (j) | | | | | 17,400 | | | | | | 14,634 | |
|
| |
5.750% due 04/20/2029 (j) | | | | | 800 | | | | | | 686 | |
|
| |
4.250% due 06/01/2028 (j) | | | | | 2,000 | | | | | | 1,634 | |
|
| |
7.500% due 03/15/2025 (j) | | | | | 9,135 | | | | | | 8,281 | |
|
| |
10.250% due 05/01/2030 (j) | | | | | 3,200 | | | | | | 2,635 | |
|
Champion Path Holdings Ltd. | |
| | | | | 1,300 | | | | | | 825 | |
|
Charter Communications Operating LLC | |
3.850% due 04/01/2061 (j) | | | | | 100 | | | | | | 66 | |
3.950% due 06/30/2062 (j) | | | | | 100 | | | | | | 67 | |
|
| |
8.250% due 03/01/2027 (j) | | | | | 10,000 | | | | | | 7,930 | |
|
| |
7.375% due 02/15/2030 (j) | | | | | 1,900 | | | | | | 1,550 | |
|
| |
3.875% due 04/15/2026 (j) | | EUR | | | 2,494 | | | | | | 2,319 | |
| | | | | | | | | | | | |
| | | | | PRINCIPAL
AMOUNT
(000S) | | | | | MARKET
VALUE
(000S) | |
|
| |
5.250% due 12/01/2026 (j) | | $ | | | 3,400 | | | $ | | | 2,671 | |
5.750% due 12/01/2028 (j) | | | | | 14,100 | | | | | | 10,466 | |
|
| |
| | EUR | | | 5,000 | | | | | | 3,946 | |
|
| |
5.875% due 04/15/2030 (j) | | $ | | | 5,100 | | | | | | 4,598 | |
|
| |
8.250% due 02/15/2028 (j) | | | | | 1,420 | | | | | | 1,137 | |
|
| |
5.198% due 06/15/2034 (j) | | | | | 5,608 | | | | | | 4,559 | |
|
iHeartCommunications, Inc. | |
8.375% due 05/01/2027 (j) | | | | | 639 | | | | | | 509 | |
|
IHO Verwaltungs GmbH (3.750% Cash or 4.500% PIK) | |
3.750% due 09/15/2026 (b)(j) | | EUR | | | 7,400 | | | | | | 6,451 | |
|
IHO Verwaltungs GmbH (3.875% Cash or 4.625% PIK) | |
3.875% due 05/15/2027 (b)(j) | | | | | 1,300 | | | | | | 1,066 | |
|
| |
9.000% due 07/01/2028 (j) | | $ | | | 1,691 | | | | | | 1,338 | |
|
| |
3.200% due 08/08/2024 (j) | | | | | 100 | | | | | | 95 | |
|
| |
4.750% due 11/04/2027 (j) | | EUR | | | 1,000 | | | | | | 835 | |
|
Melco Resorts Finance Ltd. | |
| | $ | | | 1,600 | | | | | | 1,198 | |
|
| |
4.810% due 09/17/2030 (j) | | | | | 600 | | | | | | 534 | |
|
| |
6.350% due 02/12/2048 (j) | | | | | 10,000 | | | | | | 5,904 | |
6.500% due 06/02/2041 (j) | | | | | 10,000 | | | | | | 6,258 | |
6.750% due 09/21/2047 (j) | | | | | 10,000 | | | | | | 6,210 | |
|
Royal Caribbean Cruises Ltd. | |
| | | | | 5,877 | | | | | | 5,911 | |
| | | | | 1,669 | | | | | | 1,719 | |
|
| |
2.550% due 03/08/2027 (j) | | | | | 400 | | | | | | 292 | |
3.100% due 03/08/2029 (j) | | | | | 400 | | | | | | 284 | |
3.800% due 01/08/2026 (j) | | | | | 1,200 | | | | | | 963 | |
4.875% due 06/18/2030 (j) | | | | | 200 | | | | | | 147 | |
5.125% due 08/08/2025 (j) | | | | | 400 | | | | | | 336 | |
| | | | | 2,000 | | | | | | 1,545 | |
|
| |
7.000% due 02/15/2027 (j) | | | | | 4,000 | | | | | | 3,473 | |
|
| |
5.000% due 01/15/2029 (j) | | | | | 600 | | | | | | 311 | |
|
| |
| | | | | 9,370 | | | | | | 3,537 | |
|
| |
7.500% due 05/15/2025 (j) | | | | | 5,800 | | | | | | 5,759 | |
|
| |
4.625% due 04/15/2029 (j) | | | | | 200 | | | | | | 170 | |
|
Valaris Ltd. (8.250% Cash or 12.000% PIK) | |
8.250% due 04/30/2028 (b)(j) | | | | | 11,853 | | | | | | 11,515 | |
|
| |
0.000% due 12/29/2049 «~(g) | | BRL | | | 10,300 | | | | | | 828 | |
|
| |
13.000% due 05/15/2025 (j) | | $ | | | 500 | | | | | | 513 | |
|
| |
7.750% due 08/15/2028 (j) | | | | | 19,380 | | | | | | 15,655 | |
| | | | | | | | | | | | |
| | | | | | | | | | | | |
| | | | | | | | | | | 151,360 | |
| | | | | | | | | | | | |
| |
| |
|
| |
6.750% due 08/06/2023 (j) | | | | | 10,000 | | | | | | 9,225 | |
7.125% due 02/11/2025 (j) | | | | | 2,581 | | | | | | 2,183 | |
|
Oi SA (10.000% Cash or 12.000% PIK) | |
10.000% due 07/27/2025 (b)(j) | | | | | 21,255 | | | | | | 10,435 | |
|
Pacific Gas & Electric Co. | |
3.950% due 12/01/2047 (j) | | | | | 14,134 | | | | | | 9,815 | |
4.750% due 02/15/2044 (j) | | | | | 7,000 | | | | | | 5,378 | |
4.950% due 07/01/2050 (j) | | | | | 6,000 | | | | | | 4,799 | |
5.250% due 03/01/2052 (j) | | | | | 3,400 | | | | | | 2,807 | |
5.900% due 06/15/2032 (j) | | | | | 900 | | | | | | 871 | |
| | | | | | | | | | | | |
| See Accompanying Notes | | | ANNUAL REPORT | | | | | | | JUNE 30, 2022 | | | 67 |
| | | | | | |
Consolidated Schedule of Investments | | | | | | |
| | | | | | | | | | | | |
| | | | | PRINCIPAL
AMOUNT
(000S) | | | | | MARKET
VALUE
(000S) | |
|
| |
5.375% due 03/22/2030 (j) | | $ | | | 10,082 | | | $ | | | 8,167 | |
|
| |
6.250% due 12/01/2024 (j) | | | | | 1,148 | | | | | | 1,071 | |
| | | | | | | | | | | | |
| | | | | | | | | | | 54,751 | |
| | | | | | | | | | | | |
Total Corporate Bonds & Notes
(Cost $318,917) | | | | |
| | | | | | | | | | | | |
| |
MUNICIPAL BONDS & NOTES 2.6% | |
| |
| |
|
Commonwealth of Puerto Rico Bonds, Series 2022 | |
0.000% due 11/01/2043 (f) | | | | | 27,366 | | | | | | 13,649 | |
0.000% due 11/01/2051 (f) | | | | | 14,660 | | | | | | 6,322 | |
| | | | | | | | | | | | |
Total Municipal Bonds & Notes
(Cost $21,382) | | | | |
| | | | | | | | | | | | |
| |
NON-AGENCY MORTGAGE-BACKED SECURITIES 48.0% | |
|
| |
4.803% due 02/10/2036 ~(j) | | | | | 8,950 | | | | | | 8,145 | |
|
| |
3.779% due 06/05/2037 ~(j) | | | | | 2,680 | | | | | | 2,273 | |
|
Ashford Hospitality Trust | |
4.075% (US0001M + 2.750%) due 06/15/2035 ~(j) | | | | | 1,000 | | | | | | 939 | |
4.424% due 04/15/2035 •(j) | | | | | 14,536 | | | | | | 13,287 | |
|
Atrium Hotel Portfolio Trust | |
| | | | | 6,223 | | | | | | 5,691 | |
|
BAMLL Commercial Mortgage Securities Trust | |
| | | | | 2,000 | | | | | | 1,869 | |
| | | | | 3,000 | | | | | | 2,778 | |
|
Barclays Commercial Mortgage Securities Trust | |
| | | | | 4,785 | | | | | | 3,446 | |
|
Barclays Commercial Real Estate Trust | |
| | | | | 5,245 | | | | | | 4,767 | |
|
| |
1.156% (US0001M + 0.150%) due 11/27/2036 ~ | | | | | 38,346 | | | | | | 9,122 | |
|
| |
4.774% (US0001M + 3.450%) due 03/15/2036 ~(j) | | | | | 6,750 | | | | | | 6,465 | |
| | | | | 2,500 | | | | | | 2,398 | |
|
| |
| | | | | 7,500 | | | | | | 6,863 | |
|
Beneria Cowen & Pritzer Collateral Funding Corp. | |
4.962% due 06/15/2038 •(j) | | | | | 3,000 | | | | | | 2,793 | |
|
| |
3.378% due 02/15/2039 ~(j) | | | | | 9,615 | | | | | | 7,999 | |
| | | | | 11,000 | | | | | | 8,636 | |
|
Braemar Hotels & Resorts Trust | |
| | | | | 8,500 | | | | | | 7,850 | |
|
| |
6.779% due 02/15/2037 •(j) | | | | | 8,800 | | | | | | 8,330 | |
| | | | | 1,500 | | | | | | 1,422 | |
|
| |
| | | | | 3,750 | | | | | | 3,536 | |
| | | | | 4,000 | | | | | | 3,652 | |
4.244% (US0001M + 2.920%) due 05/15/2030 ~ | | | | | 3,754 | | | | | | 3,524 | |
4.474% (US0001M + 3.150%) due 07/15/2034 ~(j) | | | | | 99 | | | | | | 97 | |
|
Canada Square Funding PLC | |
| | GBP | | | 2,000 | | | | | | 2,322 | |
|
Citigroup Commercial Mortgage Trust | |
| | $ | | | 585 | | | | | | 552 | |
| | | | | 3,400 | | | | | | 3,191 | |
|
| |
4.570% due 03/25/2067 ~(j) | | | | | 7,200 | | | | | | 6,443 | |
|
Connecticut Avenue Securities Trust | |
| | | | | 2,000 | | | | | | 1,875 | |
10.426% (SOFR30A + 9.500%) due 03/25/2042 ~ | | | | | 5,200 | | | | | | 4,799 | |
|
Countrywide Home Loan Mortgage Pass-Through Trust | |
| | | | | 15,016 | | | | | | 8,255 | |
| | | | | | | | | | | | | |
| | | | | | | | | | | |
| |
Credit Suisse Mortgage Capital Trust | |
4.624% due 07/15/2032 •(j) | | $ | | | 7,000 | | | $ | | | 6,580 | |
| |
| |
3.374% due 06/15/2033 •(j) | | | | | 15,000 | | | | | | 14,068 | |
| |
| |
| | | | | 13,500 | | | | | | 9,788 | |
| |
Extended Stay America Trust | |
5.025% due 07/15/2038 •(j) | | | | | 11,599 | | | | | | 11,183 | |
| |
| |
3.564% due 11/25/2061 ~(a) | | | | | 6,744 | | | | | | 2,553 | |
| | | | | 620 | | | | | | 504 | |
3.926% due 12/25/2050 •(j) | | | | | 760 | | | | | | 639 | |
| | | | | 5,900 | | | | | | 5,090 | |
4.676% (SOFR30A + 3.750%) due 02/25/2042 ~(j) | | | | | 5,200 | | | | | | 4,690 | |
| | | | | 2,600 | | | | | | 2,301 | |
| | | | | 800 | | | | | | 693 | |
| |
GS Mortgage Securities Corp. Trust | |
3.924% (US0001M + 2.600%) due 08/15/2032 ~ | | | | | 5,000 | | | | | | 4,652 | |
| |
| |
| | | | | 2,000 | | | | | | 1,895 | |
| |
| |
| | | | | 3,551 | | | | | | 3,436 | |
| |
| |
| | | | | 7,847 | | | | | | 7,251 | |
5.224% due 11/15/2036 •(j) | | | | | 11,755 | | | | | | 10,819 | |
| |
InTown Hotel Portfolio Trust | |
4.825% (US0001M + 3.500%) due 01/15/2033 ~ | | | | | 5,000 | | | | | | 4,929 | |
| |
| |
| | | | | 3,500 | | | | | | 2,626 | |
| |
JP Morgan Chase Commercial Mortgage
Securities Trust | |
3.374% (US0001M + 2.050%) due 12/15/2031 ~(j) | | | | | 5,211 | | | | | | 5,124 | |
3.514% (US0001M + 2.190%) due 06/15/2038 ~ | | | | | 1,226 | | | | | | 1,122 | |
4.424% due 03/15/2036 •(j) | | | | | 2,000 | | | | | | 1,916 | |
4.714% due 06/15/2038 •(j) | | | | | 250 | | | | | | 228 | |
5.174% due 03/15/2036 •(j) | | | | | 9,256 | | | | | | 8,785 | |
| |
| |
| | | | | 745 | | | | | | 692 | |
| |
| |
4.123% due 11/15/2036 •(j) | | | | | 18,867 | | | | | | 17,608 | |
| |
Morgan Stanley Bank of America Merrill Lynch Trust | |
| | | | | 4,350 | | | | | | 3,984 | |
| |
Morgan Stanley Capital Trust | |
3.874% (US0001M + 2.550%) due 07/15/2035 ~(j) | | | | | 9,467 | | | | | | 8,935 | |
| |
| |
| | | | | 5,000 | | | | | | 4,427 | |
2.718% due 12/15/2036 (j) | | | | | 11,198 | | | | | | 9,693 | |
| |
Natixis Commercial Mortgage Securities Trust | |
| | | | | 3,000 | | | | | | 2,891 | |
4.065% due 02/15/2033 •(j) | | | | | 5,000 | | | | | | 4,952 | |
4.614% (TSFR1M + 3.335%) due 02/15/2033 ~ | | | | | 5,671 | | | | | | 5,572 | |
| |
| |
4.013% (US0001M + 2.689%) due 04/15/2032 ~ | | | | | 7,900 | | | | | | 7,285 | |
| |
New Residential Mortgage Loan Trust | |
| | | | | 15,500 | | | | | | 9,664 | |
| |
Preston Ridge Partners Mortgage | |
| | | | | 3,000 | | | | | | 2,882 | |
| |
Residential Mortgage Securities PLC | |
| | GBP | | | 2,500 | | | | | | 3,008 | |
| |
SFO Commercial Mortgage Trust | |
4.224% due 05/15/2038 •(j) | | $ | | | 6,500 | | | | | | 6,059 | |
| |
Tharaldson Hotel Portfolio Trust | |
4.600% (US0001M + 3.480%) due 11/11/2034 ~ | | | | | 4,050 | | | | | | 3,695 | |
| |
WaMu Mortgage Pass-Through Certificates Trust | |
| | | | | 7,904 | | | | | | 6,444 | |
| | | | | | | | | | | | | |
| | | | | | | | | | | |
| |
Wells Fargo Commercial Mortgage Trust | |
| | $ | | | 1,500 | | | $ | | | 1,319 | |
| | | | | 3,080 | | | | | | 2,881 | |
5.092% due 12/15/2039 ~(j) | | | | | 8,600 | | | | | | 7,713 | |
| | | | | | | | | | | | | |
Total Non-Agency Mortgage-Backed Securities (Cost $384,935) | | | | |
| | | | | |
| | |
ASSET-BACKED SECURITIES 31.1% | |
| |
ACE Securities Corp. Home Equity Loan Trust | |
| | | | | 22,026 | | | | | | 6,272 | |
2.044% due 04/25/2036 •(j) | | | | | 23,573 | | | | | | 17,697 | |
| | | | | 6,295 | | | | | | 5,388 | |
| |
Bear Stearns Asset-Backed Securities Trust | |
| | | | | 6,734 | | | | | | 6,431 | |
| |
| |
1.914% (US0001M + 0.290%) due 05/25/2037 ~(j) | | | | | 16,250 | | | | | | 13,058 | |
| |
Cologix Canadian Issuer LP | |
| | CAD | | | 5,400 | | | | | | 3,944 | |
| |
Countrywide Asset-Backed Certificates | |
| | $ | | | 9,109 | | | | | | 8,293 | |
| |
Countrywide Asset-Backed Certificates Trust | |
1.874% (US0001M + 0.250%) due 06/25/2047 ~ | | | | | 10,041 | | | | | | 7,551 | |
1.884% due 06/25/2047 •(j) | | | | | 14,465 | | | | | | 11,271 | |
2.359% (US0001M + 0.735%) due 04/25/2036 ~(j) | | | | | 17,000 | | | | | | 14,083 | |
| |
| |
| | EUR | | | 4,000 | | | | | | 2,725 | |
| |
First Franklin Mortgage Loan Trust | |
1.934% (US0001M + 0.310%) due 10/25/2036 ~(j) | | $ | | | 15,000 | | | | | | 12,025 | |
| |
Flagship Credit Auto Trust | |
0.000% due 06/15/2029 «(f) | | | | | 19 | | | | | | 6,936 | |
| |
| |
| | | | | 10,117 | | | | | | 7,478 | |
| | | | | 13,226 | | | | | | 10,523 | |
| |
Home Equity Mortgage Loan Asset-Backed Trust | |
| | | | | 11,200 | | | | | | 8,389 | |
| |
HSI Asset Securitization Corp. Trust | |
2.434% (US0001M + 0.810%) due 12/25/2035 ~ | | | | | 13,243 | | | | | | 10,236 | |
| |
LendingPoint Pass-Through Trust | |
0.000% due 04/15/2028 «(f) | | | | | 7,600 | | | | | | 7,163 | |
0.000% due 05/15/2028 «(f) | | | | | 7,554 | | | | | | 7,050 | |
| |
Long Beach Mortgage Loan Trust | |
3.199% (US0001M + 1.575%) due 02/25/2035 ~ | | | | | 10,058 | | | | | | 7,570 | |
| |
| |
| | | | | 6,600 | | | | | | 6,637 | |
| |
Pretium Mortgage Credit Partners LLC | |
| | | | | 11,600 | | | | | | 11,013 | |
| |
| |
| | | | | 3,200 | | | | | | 1,607 | |
| | | | | 14,600 | | | | | | 7,809 | |
| |
| |
| | | | | 4,000 | | | | | | 2,881 | |
| |
Securitized Asset-Backed Receivables LLC Trust | |
| | | | | 6,904 | | | | | | 5,800 | |
| |
SMB Private Education Loan Trust | |
0.000% due 11/16/2054 «(f) | | | | | 9 | | | | | | 8,956 | |
0.000% due 02/16/2055 «(f) | | | | | 5 | | | | | | 8,595 | |
5.950% due 02/16/2055 (j) | | | | | 8,762 | | | | | | 8,622 | |
| | | | | | | | | | | | | |
Total Asset-Backed Securities (Cost $248,719) | | | | |
| | | | | |
| | |
| |
| |
Romania Government International Bond | |
| | EUR | | | 5,650 | | | | | | 4,887 | |
| | | | | 5,500 | | | | | | 4,333 | |
| | | | | | |
| 68 | | PIMCO CLOSED-END FUNDS | | | See Accompanying Notes | |
| | | | | | | | | | | | |
| | | | | PRINCIPAL
AMOUNT
(000S) | | | | | MARKET
VALUE
(000S) | |
|
Russia Government International Bond | |
5.625% due 04/04/2042 ^(c) | | $ | | | 8,800 | | | $ | | | 2,596 | |
5.875% due 09/16/2043 ^(c) | | | | | 200 | | | | | | 59 | |
12.750% due 06/24/2028 ^(c) | | | | | 100 | | | | | | 27 | |
| | | | | | | | | | | | |
Total Sovereign Issues (Cost $15,347) | | | | |
| | | | | | | | | | | | |
| | | | | | | | | | | | |
| | | | | SHARES | | | | | | |
| |
| | | | | | | | | | | | |
| |
| | | | |
Syniverse Holdings, Inc. «(d)(h) | | | | | 8,319,613 | | | | | | 8,153 | |
| | | | | | | | | | | | |
Total Common Stocks (Cost $8,153) | | | | |
| | | | | | | | | | | | |
| | | | | | | | | | | | |
PREFERRED SECURITIES 2.3% | |
| | | | | | | | | | | | |
| |
| | |
Stichting AK Rabobank Certificaten | | | | | | | |
6.500% due 12/29/2049 (g)(j) | | | | | 16,950,000 | | | | | | 17,297 | |
| | | | | | | | | | | | |
Total Preferred Securities (Cost $24,434) | | | | |
| | | | | | | | | | | | |
| | | | | | | | | | | | |
REAL ESTATE INVESTMENT TRUSTS 1.4% | |
| | | | | | | | | | | | |
| |
| | | | |
KKR Real Estate Finance Trust, Inc. | | | | | 203,500 | | | | | | 3,551 | |
| | | | |
Starwood Property Trust, Inc. | | | | | 175,100 | | | | | | 3,658 | |
| | | | |
TPG RE Finance Trust, Inc. | | | | | 346,700 | | | | | | 3,124 | |
| | | | | | | | | | | | |
Total Real Estate Investment Trusts (Cost $12,894) | | | | |
| | | | | | | | | | | | |
| | | | | | | | | | | | |
| | | | | | | | | | | | |
| | | | | PRINCIPAL
AMOUNT
(000S) | | | | | MARKET
VALUE
(000S) | |
SHORT-TERM INSTRUMENTS 7.6% | |
| | | | | | | | | | | | |
REPURCHASE AGREEMENTS (i) 6.6% | |
| | | | | | | | $ | | | 50,200 | |
| | | | | | | | | | | | |
| | | | | | | | | | | | |
|
0.825% due 07/12/2022 - 09/15/2022 (e)(f)(j) | | $ | | | 7,187 | | | | | | 7,182 | |
| | | | | | | | | | | | |
Total Short-Term Instruments (Cost $57,383) | | | | | | | |
| | | | | | | | | | | | |
| | | | |
| | | | | | | | | | | | |
Total Investments in Securities (Cost $1,372,685) | | | | | | | |
| | | | |
| | | | | | | | | | | | |
Total Investments 165.1% (Cost $1,372,685) | | | $ | | | | |
| |
Financial Derivative
Instruments (k)(l) 0.3% (Cost or Premiums, net $(1,305)) | | | | | | | |
| |
Other Assets and Liabilities, net (65.4)% | | | | |
| | | | | | | | | | | | |
| | | $ | | | | |
| | | | | | | | | | | | |
NOTES TO CONSOLIDATED SCHEDULE OF INVESTMENTS:
| A zero balance may reflect actual amounts rounding to less than one thousand. |
| Security valued using significant unobservable inputs (Level 3). |
| All or a portion of this amount represents unfunded loan commitments. The interest rate for the unfunded portion will be determined at the time of funding. See Note 4, Securities and Other Investments, in the Notes to Financial Statements for more information regarding unfunded loan commitments. |
| Variable or Floating rate security. Rate shown is the rate in effect as of period end. Certain variable rate securities are not based on a published reference rate and spread, rather are determined by the issuer or agent and are based on current market conditions. Reference rate is as of reset date, which may vary by security. These securities may not indicate a reference rate and/or spread in their description. |
| Rate shown is the rate in effect as of period end. The rate may be based on a fixed rate, a capped rate or a floor rate and may convert to a variable or floating rate in the future. These securities do not indicate a reference rate and spread in their description. |
| Coupon represents a rate which changes periodically based on a predetermined schedule or event. Rate shown is the rate in effect as of period end. |
| Security is an Interest Only (“IO”) or IO Strip. |
| Security is not accruing income as of the date of this report. |
| Security did not produce income within the last twelve months. |
| Coupon represents a weighted average yield to maturity. |
| Perpetual maturity; date shown, if applicable, represents next contractual call date. |
(h) RESTRICTED SECURITIES:
| | | | | | | | | | | | | | | | | | | | | | | | |
| | | | | | | | | | | | | | | | | Market Value
as Percentage
of Net Assets | |
| | | | | | | | | | | 05/12/2022 | | | $ | 8,153 | | | $ | 8,153 | | | | 1.08% | |
| | | | | | | | | | | | | | | | | | | | | | | | |
| | | | | | | | | | | | |
| See Accompanying Notes | | | | | | | | | | JUNE 30, 2022 | | | |
| | | | | | |
Consolidated Schedule of Investments | | | | | | |
BORROWINGS AND OTHER FINANCING TRANSACTIONS
(i) REPURCHASE AGREEMENTS:
| | | | | | | | | | | | | | | | | | | | | | | | | | | | | | |
| | | | | | | | | | | | | | | | | | | Repurchase
Agreements,
at Value | | | Repurchase Agreement Proceeds to be Received (1) | |
| MBC | | | 1.490 | % | | | 06/30/2022 | | | | 07/01/2022 | | | $ | 50,200 | | | U.S. Treasury Notes 1.500% due 02/29/2024 | | $ | (51,808 | ) | | $ | 50,200 | | | $ | 50,202 | |
| | | | | | | | | | | | | | | | | | | | | | | | | | | | | | |
Total Repurchase Agreements | | | | | | | | | | | | | | | | | | | | | | | |
| | | | | | | | | | | | | | | | | | | | | | | | | | | | | | |
REVERSE REPURCHASE AGREEMENTS:
| | | | | | | | | | | | | | | | | | | | | | |
| | | | | | | | | | | | | | Payable for
Reverse
Repurchase
Agreements | |
| | | (0.750 | )% | | | 06/17/2022 | | | | TBD | | | $ | | | (2,007 | ) | | $ | (2,007 | ) |
| | | 2.210 | | | | 06/15/2022 | | | | 09/15/2022 | | | | | | (14,256 | ) | | | (14,270 | ) |
| | | 2.370 | | | | 06/28/2022 | | | | 07/28/2022 | | | | | | (6,829 | ) | | | (6,831 | ) |
| | | (0.340 | ) | | | 05/12/2022 | | | | 07/05/2022 | | | EUR | | | (15,910 | ) | | | (16,665 | ) |
| | | (0.300 | ) | | | 06/16/2022 | | | | TBD | | | | | | (13,258 | ) | | | (13,892 | ) |
| | | (0.120 | ) | | | 06/16/2022 | | | | 09/16/2022 | | | | | | (7,639 | ) | | | (8,005 | ) |
| | | 2.150 | | | | 05/06/2022 | | | | 08/08/2022 | | | | | | (4,113 | ) | | | (4,127 | ) |
| | | 2.480 | | | | 06/17/2022 | | | | 09/19/2022 | | | | | | (22,353 | ) | | | (22,375 | ) |
| | | 2.540 | | | | 06/17/2022 | | | | 09/19/2022 | | | | | | (21,495 | ) | | | (21,516 | ) |
| | | 2.900 | | | | 06/17/2022 | | | | 09/19/2022 | | | | | | (52,103 | ) | | | (52,162 | ) |
| | | 1.850 | | | | 06/17/2022 | | | | TBD | | | | | | (3,225 | ) | | | (3,227 | ) |
| | | 2.030 | | | | 05/23/2022 | | | | 08/23/2022 | | | | | | (22,861 | ) | | | (22,911 | ) |
| | | 2.250 | | | | 05/27/2022 | | | | 08/29/2022 | | | | | | (52,320 | ) | | | (52,434 | ) |
| | | (5.500 | ) | | | 05/11/2022 | | | | TBD | | | EUR | | | (1,371 | ) | | | (1,426 | ) |
| | | (0.600 | ) | | | 06/16/2022 | | | | TBD | | | | | | (2,253 | ) | | | (2,360 | ) |
| | | 1.870 | | | | 05/12/2022 | | | | 08/12/2022 | | | $ | | | (7,699 | ) | | | (7,719 | ) |
| | | 2.050 | | | | 05/16/2022 | | | | 08/16/2022 | | | | | | (20,721 | ) | | | (20,775 | ) |
| | | 1.650 | | | | 05/31/2022 | | | | 07/01/2022 | | | | | | (12,359 | ) | | | (12,377 | ) |
| | | 0.180 | | | | 06/16/2022 | | | | 09/16/2022 | | | EUR | | | (2,799 | ) | | | (2,933 | ) |
| | | 1.620 | | | | 05/02/2022 | | | | 08/02/2022 | | | | | | (30,215 | ) | | | (30,296 | ) |
| | | 1.670 | | | | 05/09/2022 | | | | 08/09/2022 | | | | | | (15,843 | ) | | | (15,882 | ) |
| | | 2.000 | | | | 05/06/2022 | | | | 08/05/2022 | | | | | | (26,341 | ) | | | (26,423 | ) |
| | | 2.060 | | | | 06/10/2022 | | | | 07/11/2022 | | | | | | (59 | ) | | | (59 | ) |
| | | 2.060 | | | | 06/10/2022 | | | | 07/12/2022 | | | | | | (62 | ) | | | (62 | ) |
| | | 2.060 | | | | 06/10/2022 | | | | 09/12/2022 | | | | | | (9,062 | ) | | | (9,072 | ) |
| | | 2.060 | | | | 06/13/2022 | | | | 09/12/2022 | | | | | | (4,284 | ) | | | (4,288 | ) |
| | | 2.060 | | | | 06/29/2022 | | | | 09/12/2022 | | | | | | (66 | ) | | | (66 | ) |
| | | 2.500 | | | | 06/22/2022 | | | | 09/22/2022 | | | | | | (891 | ) | | | (892 | ) |
| | | 1.740 | | | | 06/17/2022 | | | | TBD | | | | | | (6,038 | ) | | | (6,042 | ) |
| | | 1.750 | | | | 06/17/2022 | | | | TBD | | | | | | (2,762 | ) | | | (2,764 | ) |
| | | 1.870 | | | | 06/17/2022 | | | | 07/13/2022 | | | | | | (4,332 | ) | | | (4,335 | ) |
| | | 1.870 | | | | 06/17/2022 | | | | TBD | | | | | | (18,677 | ) | | | (18,691 | ) |
| | | 1.870 | | | | 06/22/2022 | | | | TBD | | | | | | (1,095 | ) | | | (1,095 | ) |
| | | 1.870 | | | | 06/30/2022 | | | | 07/01/2022 | | | | | | (1,867 | ) | | | (1,868 | ) |
| | | 1.870 | | | | 07/01/2022 | | | | TBD | | | | | | (1,419 | ) | | | (1,419 | ) |
| | | 2.750 | | | | 07/01/2022 | | | | 10/03/2022 | | | | | | (10,024 | ) | | | (10,024 | ) |
| | | | | | | | | | | | | | | | | | | | | | |
Total Reverse Repurchase Agreements | | | | | | | | | | | | | | | |
| | | | | | | | | | | | | | | | | | | | | | |
BORROWINGS AND OTHER FINANCING TRANSACTIONS SUMMARY
The following is a summary by counterparty of the market value of Borrowings and Other Financing Transactions and collateral pledged/(received) as of June 30, 2022:
| | | | | | | | | | | | | | | | | | | | | | | | |
| | Repurchase Agreement Proceeds to be Received (1) | | | Payable for
Reverse
Repurchase
Agreements | | | Payable for Sale-Buyback Transactions | | | Total
Borrowings and
Other Financing
Transactions | | | Collateral
Pledged/(Received) | | | | |
Global/Master Repurchase Agreement | |
| | $ | 0 | | | $ | (23,108 | ) | | $ | 0 | | | $ | (23,108 | ) | | $ | 26,404 | | | $ | 3,296 | |
| | | 0 | | | | (138,742 | ) | | | 0 | | | | (138,742 | ) | | | 164,389 | | | | 25,647 | |
| | | 0 | | | | (78,572 | ) | | | 0 | | | | (78,572 | ) | | | 99,232 | | | | 20,660 | |
| | | 0 | | | | (32,280 | ) | | | 0 | | | | (32,280 | ) | | | 40,230 | | | | 7,950 | |
| | | 50,202 | | | | 0 | | | | 0 | | | | 50,202 | | | | (51,808 | ) | | | (1,606 | ) |
| | | | | | |
| 70 | | PIMCO CLOSED-END FUNDS | | | See Accompanying Notes | |
| | | | | | | | | | | | | | | | | | | | | | | | |
| Counterparty | | Repurchase Agreement Proceeds to be Received (1) | | | Payable for
Reverse
Repurchase
Agreements | | | Payable for Sale-Buyback Transactions | | | Total
Borrowings and
Other Financing
Transactions | | | Collateral
Pledged/(Received) | | | | |
| | $ | 0 | | | $ | (12,377 | ) | | $ | 0 | | | $ | (12,377 | ) | | $ | 13,505 | | | $ | 1,128 | |
| | | 0 | | | | (2,933 | ) | | | 0 | | | | (2,933 | ) | | | 3,395 | | | | 462 | |
| | | 0 | | | | (87,040 | ) | | | 0 | | | | (87,040 | ) | | | 103,161 | | | | 16,121 | |
| | | 0 | | | | (36,214 | ) | | | 0 | | | | (36,214 | ) | | | 36,815 | | | | 601 | |
| | | 0 | | | | (10,024 | ) | | | 0 | | | | (10,024 | ) | | | 0 | | | | (10,024 | ) |
| | | | | | | | | | | | | | | | | | | | | | | | |
Total Borrowings and Other Financing Transactions | | | | | | | | | | | | | | | | | | | | | | | | |
| | | | | | | | | | | | | | | | | | | | | | | | |
CERTAIN TRANSFERS ACCOUNTED FOR AS SECURED BORROWINGS
Remaining Contractual Maturity of the Agreements
| | | | | | | | | | | | | | | | | | | | |
| | | | | | | | | | | | | | | | |
Reverse Repurchase Agreements | |
| | $ | 0 | | | $ | 0 | | | $ | 0 | | | $ | (3,227 | ) | | $ | (3,227 | ) |
| | | (14,244 | ) | | | (4,456 | ) | | | (129,596 | ) | | | (48,276 | ) | | | (196,572 | ) |
Non-Agency Mortgage-Backed Securities | | | 0 | | | | 0 | | | | (134,389 | ) | | | 0 | | | | (134,389 | ) |
| | | 0 | | | | (6,831 | ) | | | (52,162 | ) | | | 0 | | | | (58,993 | ) |
| | | 0 | | | | (16,665 | ) | | | 0 | | | | 0 | | | | (16,665 | ) |
| | | | | | | | | | | | | | | | | | | | |
| | | | | | | | | | | | | | | | | | | | |
| | | | | | | | | | | | | | | | | | | | |
Payable for reverse repurchase agreements (5) | | | | | |
| | | | | | | | | | | | | | | | | | | | |
| Securities with an aggregate market value of $477,888 and cash of $9,243 have been pledged as collateral under the terms of the above master agreements as of June 30, 2022. |
| Includes accrued interest. |
| The average amount of borrowings outstanding during the period ended June 30, 2022 was $(154,174) at a weighted average interest rate of 1.421%. Average borrowings may include reverse repurchase agreements and sale-buyback transactions, if held during the period. |
| Open maturity reverse repurchase agreement. |
| Net Exposure represents the net receivable/(payable) that would be due from/to the counterparty in the event of default. Exposure from borrowings and other financing transactions can only be netted across transactions governed under the same master agreement with the same legal entity. See Note 8, Master Netting Arrangements, in the Notes to Financial Statements for more information. |
| Unsettled reverse repurchase agreements liability of $(11,444) is outstanding at period end. |
(k) FINANCIAL DERIVATIVE INSTRUMENTS: EXCHANGE-TRADED OR CENTRALLY CLEARED
SWAP AGREEMENTS:
CREDIT DEFAULT SWAPS ON CORPORATE ISSUES - SELL PROTECTION
(1)
| | | | | | | | | | | | | | | | | | | | | | | | | | | | | | | | | | | | | | | | | | | | |
| | | | | | | | | | | Implied Credit Spread at June 30, 2022 (2) | | | | | | | | | Unrealized
Appreciation/
(Depreciation) | | | | | | | |
| | | | | | |
| | | 5.000 | % | | | Quarterly | | | | 06/20/2024 | | | | 7.828 | % | | | $ | | | | 400 | | | $ | (16 | ) | | $ | (3 | ) | | $ | (19 | ) | | $ | 1 | | | $ | 0 | |
| | | 5.000 | | | | Quarterly | | | | 06/20/2025 | | | | 8.463 | | | | | | | | 200 | | | | (15 | ) | | | (1 | ) | | | (16 | ) | | | 0 | | | | 0 | |
| | | 5.000 | | | | Quarterly | | | | 06/20/2027 | | | | 9.229 | | | | | | | | 10,400 | | | | (1,006 | ) | | | (471 | ) | | | (1,477 | ) | | | 0 | | | | (10 | ) |
Ford Motor Credit Co. LLC | | | 5.000 | | | | Quarterly | | | | 06/20/2027 | | | | 4.319 | | | | | | | | 11,400 | | | | 1,208 | | | | (879 | ) | | | 329 | | | | 0 | | | | (34 | ) |
| | | 1.000 | | | | Quarterly | | | | 12/20/2026 | | | | 4.270 | | | | EUR | | | | 17,900 | | | | (1,070 | ) | | | (1,311 | ) | | | (2,381 | ) | | | 0 | | | | (182 | ) |
| | | | | | | | | | | | | | | | | | | | | | | | | | | | | | | | | | | | | | | | | | | | |
| | | | | | | | | | | | | | | $ | (899 | ) | | $ | (2,665 | ) | | $ | (3,564 | ) | | $ | 1 | | | $ | (226 | ) |
| | | | | | | | | | | | | | | | | | | | | | | | | | | | | | | | | | | | | | | | | | | | |
INTEREST RATE SWAPS
| | | | | | | | | | | | | | | | | | | | | | | | | | | | | | | | | | | | | | | | | | |
| | | | | | | | | | | | | | | | | | | Unrealized
Appreciation/
(Depreciation) | | | | | | | |
| | | | | | |
| | | | | 1.000 | % | | | Annual | | | | 06/15/2027 | | | | $ | | | | 141,000 | | | $ | (4,906 | ) | | $ | (6,757 | ) | | $ | (11,663 | ) | | $ | 769 | | | $ | 0 | |
| | | | | 1.500 | | | | Annual | | | | 06/15/2052 | | | | | | | | 30,100 | | | | 2,038 | | | | 4,971 | | | | 7,009 | | | | 0 | | | | (256 | ) |
| | | | | 0.500 | | | | Annual | | | | 09/21/2052 | | | | EUR | | | | 7,800 | | | | 676 | | | | 2,099 | | | | 2,775 | | | | 0 | | | | (202 | ) |
| | | | | | | | | | | | | | | | | | | | | | | | | | | | | | | | | | | | | | | | | | |
| | | | | | | | | | | | | | | | | | | | | | | | $ | (2,192 | ) | | $ | 313 | | | $ | (1,879 | ) | | $ | 769 | | | $ | (458 | ) |
| | | | | | | | | | | | | | | | | | | | | | | | | |
| | | | | | | | | | | | | | | | | | | | | | | | | | | | | | | | | |
| | | | | | | | | | | | | | | | | | | | | | | | | |
| | | | | | | | | | | | |
| See Accompanying Notes | | | | | | | | | | JUNE 30, 2022 | | | |
| | | | | | |
Consolidated Schedule of Investments | | | | | | |
FINANCIAL DERIVATIVE INSTRUMENTS: EXCHANGE-TRADED OR CENTRALLY CLEARED SUMMARY
The following is a summary of the market value and variation margin of Exchange-Traded or Centrally Cleared Financial Derivative Instruments as of June 30, 2022:
| | | | | | | | | | | | | | | | | | | | | | | | | | | | | | | | | | | | |
| | | Financial Derivative Assets | | | | | | Financial Derivative Liabilities | |
| | | | | | | | | | | | | | | | | | Variation Margin
Liability | | | | |
| | | | | | | | | | | | | | | | | | | | | | | | | | | | |
Total Exchange-Traded or Centrally Cleared | | | | | | | | | | | | | | | | | | | | | | | | | | | | | | | | | | | | |
| | | | | | | | | | | | | | | | | | | | | | | | | | | | | | | | | | | | |
Cash of $19,540 has been pledged as collateral for exchange-traded and centrally cleared financial derivative instruments as of June 30, 2022.
| If the Fund is a seller of protection and a credit event occurs, as defined under the terms of that particular swap agreement, the Fund will either (i) pay to the buyer of protection an amount equal to the notional amount of the swap and take delivery of the referenced obligation or underlying securities comprising the referenced index or (ii) pay a net settlement amount in the form of cash, securities or other deliverable obligations equal to the notional amount of the swap less the recovery value of the referenced obligation or underlying securities comprising the referenced index. |
| Implied credit spreads, represented in absolute terms, utilized in determining the market value of credit default swap agreements on corporate issues as of period end serve as indicators of the current status of the payment/performance risk and represent the likelihood or risk of default for the credit derivative. The implied credit spread of a particular referenced entity reflects the cost of buying/selling protection and may include upfront payments required to be made to enter into the agreement. Wider credit spreads represent a deterioration of the referenced entity’s credit soundness and a greater likelihood or risk of default or other credit event occurring as defined under the terms of the agreement. |
| The maximum potential amount the Fund could be required to pay as a seller of credit protection or receive as a buyer of credit protection if a credit event occurs as defined under the terms of that particular swap agreement. |
| The prices and resulting values for credit default swap agreements serve as indicators of the current status of the payment/performance risk and represent the likelihood of an expected liability (or profit) for the credit derivative should the notional amount of the swap agreement be closed/sold as of the period end. Increasing market values, in absolute terms when compared to the notional amount of the swap, represent a deterioration of the underlying referenced instrument’s credit soundness and a greater likelihood or risk of default or other credit event occurring as defined under the terms of the agreement. |
| This instrument has a forward starting effective date. See Note 2, Securities Transactions and Investment Income, in the Notes to Financial Statements for further information. |
(l) FINANCIAL DERIVATIVE INSTRUMENTS: OVER THE COUNTER
FORWARD FOREIGN CURRENCY CONTRACTS:
| | | | | | | | | | | | | | | | | | | | | | | | |
| | | | | | | | | | | Unrealized Appreciation/ (Depreciation) | |
| | | | | | |
| | | 08/2022 | | | EUR | | | 21,456 | | | $ | | | 22,848 | | | $ | 308 | | | $ | (10 | ) |
| | | 08/2022 | | | $ | | | 24,508 | | | EUR | | | 23,314 | | | | 45 | | | | (51 | ) |
| | | 08/2022 | | | | | | 6,876 | | | JPY | | | 912,100 | | | | 0 | | | | (136 | ) |
| | | | | | | |
| | | 08/2022 | | | CAD | | | 1,129 | | | $ | | | 873 | | | | 0 | | | | (4 | ) |
| | | 08/2022 | | | EUR | | | 93,430 | | | | | | 98,742 | | | | 551 | | | | 0 | |
| | | | | | | |
| | | 08/2022 | | | $ | | | 1,951 | | | AUD | | | 2,796 | | | | 0 | | | | (20 | ) |
| | | | | | | |
| | | 08/2022 | | | CAD | | | 198 | | | $ | | | 154 | | | | 1 | | | | 0 | |
| | | 08/2022 | | | $ | | | 601 | | | EUR | | | 558 | | | | 0 | | | | (14 | ) |
| | | 08/2022 | | | | | | 962 | | | JPY | | | 129,300 | | | | 0 | | | | (7 | ) |
| | | | | | | |
| | | 08/2022 | | | EUR | | | 1,670 | | | $ | | | 1,775 | | | | 20 | | | | 0 | |
| | | 08/2022 | | | GBP | | | 4,382 | | | | | | 5,375 | | | | 37 | | | | 0 | |
| | | | | | | |
| | | 08/2022 | | | CAD | | | 3,992 | | | | | | 3,085 | | | | 0 | | | | (16 | ) |
| | | | | | | |
| | | 08/2022 | | | $ | | | 28,540 | | | EUR | | | 27,299 | | | | 150 | | | | 0 | |
| | | | | | | |
| | | 08/2022 | | | GBP | | | 1,148 | | | $ | | | 1,415 | | | | 16 | | | | 0 | |
| | | | | | | | | | | | | | | | | | | | | | | | |
Total Forward Foreign Currency Contracts | | | | | | | | | |
| | | | | | | | | | | | | | | | | | | | | | | | |
SWAP AGREEMENTS:
CREDIT DEFAULT SWAPS ON CORPORATE ISSUES - SELL PROTECTION
(1)
| | | | | | | | | | | | | | | | | | | | | | | | | | | | | | | | | | | | | | | | | | |
| Counterparty | | Reference Entity | | Fixed
Receive Rate | | | Payment
Frequency | | | Maturity
Date | | | Implied Credit Spread at June 30, 2022 (2) | | | | | | Premiums
Paid/(Received) | | | Unrealized
Appreciation/
(Depreciation) | | | Swap Agreements, at Value (4) | |
| | | | | | |
| CBK | | | | | 5.000 | % | | | Quarterly | | | | 12/20/2026 | | | | 2.377 | % | | $ | | | | | 5,000 | | | $ | 893 | | | $ | (366 | ) | | $ | 527 | | | $ | 0 | |
| MYC | | | | | 5.000 | | | | Quarterly | | | | 12/20/2026 | | | | 2.377 | | | | | | | | 5,000 | | | | 893 | | | | (366 | ) | | | 527 | | | | 0 | |
| | | | | | | | | | | | | | | | | | | | | | | | | | | | | | | | | | | | | | | | | | |
| | | | | | | | | | | $ | 1,786 | | | $ | (732 | ) | | $ | 1,054 | | | $ | 0 | |
| | | | | | | | | | | | | | | | | | | | | | | | | |
| | | | | | | | | | | | | | | | | |
| | | | | | | | | | | | | | | | | |
FINANCIAL DERIVATIVE INSTRUMENTS: OVER THE COUNTER SUMMARY
The following is a summary by counterparty of the market value of OTC financial derivative instruments and collateral pledged/(received) as of June 30, 2022:
| | | | | | | | | | | | | | | | | | | | | | | | | | | | | | | | | | | | | | | | | | | | | | | | |
| | | Financial Derivative Assets | | | | | | Financial Derivative Liabilities | | | | | | | | | | |
| | Forward
Foreign
Currency
Contracts | | | | | | | | | | | | | | | Forward
Foreign
Currency
Contracts | | | | | | | | | | | | Net Market
Value of OTC
Derivatives | | | Collateral
Pledged/ (Received) | | | | |
| | $ | 353 | | | $ | 0 | | | $ | 0 | | | $ | 353 | | | | | | | $ | (197 | ) | | $ | 0 | | | $ | 0 | | | $ | (197 | ) | | $ | 156 | | | $ | (350 | ) | | $ | (194 | ) |
| | | 551 | | | | 0 | | | | 0 | | | | 551 | | | | | | | | (4 | ) | | | 0 | | | | 0 | | | | (4 | ) | | | 547 | | | | (530 | ) | | | 17 | |
| | | 0 | | | | 0 | | | | 527 | | | | 527 | | | | | | | | (20 | ) | | | 0 | | | | 0 | | | | (20 | ) | | | 507 | | | | (690 | ) | | | (183 | ) |
| | | 1 | | | | 0 | | | | 0 | | | | 1 | | | | | | | | (21 | ) | | | 0 | | | | 0 | | | | (21 | ) | | | (20 | ) | | | 0 | | | | (20 | ) |
| | | 57 | | | | 0 | | | | 0 | | | | 57 | | | | | | | | 0 | | | | 0 | | | | 0 | | | | 0 | | | | 57 | | | | 0 | | | | 57 | |
| | | 0 | | | | 0 | | | | 527 | | | | 527 | | | | | | | | 0 | | | | 0 | | | | 0 | | | | 0 | | | | 527 | | | | (690 | ) | | | (163 | ) |
| | | 0 | | | | 0 | | | | 0 | | | | 0 | | | | | | | | (16 | ) | | | 0 | | | | 0 | | | | (16 | ) | | | (16 | ) | | | 0 | | | | (16 | ) |
| | | 150 | | | | 0 | | | | 0 | | | | 150 | | | | | | | | 0 | | | | 0 | | | | 0 | | | | 0 | | | | 150 | | | | (390 | ) | | | (240 | ) |
| | | 16 | | | | 0 | | | | 0 | | | | 16 | | | | | | | | 0 | | | | 0 | | | | 0 | | | | 0 | | | | 16 | | | | 0 | | | | 16 | |
| | | | | | | | | | | | | | | | | | | | | | | | | | | | | | | | | | | | | | | | | | | | | | | | |
| | | | | | | | | | | | | | | | | | | | | | | | | | | | | | | | | | | | | | | | | | | | | | | | |
| | | | | | | | | | | | | | | | | | | | | | | | | | | | | | | | | | | | | | | | | | | | | | | | |
| If the Fund is a seller of protection and a credit event occurs, as defined under the terms of that particular swap agreement, the Fund will either (i) pay to the buyer of protection an amount equal to the notional amount of the swap and take delivery of the referenced obligation or underlying securities comprising the referenced index or (ii) pay a net settlement amount in the form of cash, securities or other deliverable obligations equal to the notional amount of the swap less the recovery value of the referenced obligation or underlying securities comprising the referenced index. |
| Implied credit spreads, represented in absolute terms, utilized in determining the market value of credit default swap agreements on corporate issues as of period end serve as indicators of the current status of the payment/performance risk and represent the likelihood or risk of default for the credit derivative. The implied credit spread of a particular referenced entity reflects the cost of buying/selling protection and may include upfront payments required to be made to enter into the agreement. Wider credit spreads represent a deterioration of the referenced entity’s credit soundness and a greater likelihood or risk of default or other credit event occurring as defined under the terms of the agreement. |
| The maximum potential amount the Fund could be required to pay as a seller of credit protection or receive as a buyer of credit protection if a credit event occurs as defined under the terms of that particular swap agreement. |
| The prices and resulting values for credit default swap agreements serve as indicators of the current status of the payment/performance risk and represent the likelihood of an expected liability (or profit) for the credit derivative should the notional amount of the swap agreement be closed/sold as of the period end. Increasing market values, in absolute terms when compared to the notional amount of the swap, represent a deterioration of the underlying referenced instrument’s credit soundness and a greater likelihood or risk of default or other credit event occurring as defined under the terms of the agreement. |
| Net Exposure represents the net receivable/(payable) that would be due from/to the counterparty in the event of default. Exposure from OTC derivatives can only be netted across transactions governed under the same master agreement with the same legal entity. See Note 8, Master Netting Arrangements, in the Notes to Financial Statements for more information. |
FAIR VALUE OF FINANCIAL DERIVATIVE INSTRUMENTS
The following is a summary of the fair valuation of the Fund’s derivative instruments categorized by risk exposure. See Note 7, Principal and Other Risks, in the Notes to Financial Statements on risks of the Fund.
Fair Values of Financial Derivative Instruments on the Consolidated Statements of Assets and Liabilities as of June 30, 2022:
| | | | | | | | | | | | | | | | | | | | | | | | |
| | | Derivatives not accounted for as hedging instruments | |
| | | | | | | | | | | | | | | | | | | |
Financial Derivative Instruments - Assets | |
Exchange-traded or centrally cleared | |
| | $ | 0 | | | $ | 1 | | | $ | 0 | | | $ | 0 | | | $ | 769 | | | $ | 770 | |
| | | | | | | | | | | | | | | | | | | | | | | | |
| |
Forward Foreign Currency Contracts | | $ | 0 | | | $ | 0 | | | $ | 0 | | | $ | 1,128 | | | $ | 0 | | | $ | 1,128 | |
| | | 0 | | | | 1,054 | | | | 0 | | | | 0 | | | | 0 | | | | 1,054 | |
| | | | | | | | | | | | | | | | | | | | | | | | |
| | $ | 0 | | | $ | 1,054 | | | $ | 0 | | | $ | 1,128 | | | $ | 0 | | | $ | 2,182 | |
| | | | | | | | | | | | | | | | | | | | | | | | |
| | $ | 0 | | | $ | 1,055 | | | $ | 0 | | | $ | 1,128 | | | $ | 769 | | | $ | 2,952 | |
| | | | | | | | | | | | | | | | | | | | | | | | |
|
Financial Derivative Instruments - Liabilities | |
Exchange-traded or centrally cleared | |
| | $ | 0 | | | $ | 226 | | | $ | 0 | | | $ | 0 | | | $ | 458 | | | $ | 684 | |
| | | | | | | | | | | | | | | | | | | | | | | | |
| |
Forward Foreign Currency Contracts | | $ | 0 | | | $ | 0 | | | $ | 0 | | | $ | 258 | | | $ | 0 | | | $ | 258 | |
| | | | | | | | | | | | | | | | | | | | | | | | |
| | $ | 0 | | | $ | 226 | | | $ | 0 | | | $ | 258 | | | $ | 458 | | | $ | 942 | |
| | | | | | | | | | | | | | | | | | | | | | | | |
| | | | | | | | | | | | |
| See Accompanying Notes | | | | | | | | | | JUNE 30, 2022 | | | |
| | | | | | |
Consolidated Schedule of Investments | | | | | | |
The effect of Financial Derivative Instruments on the Consolidated Statements of Operations for the period ended June 30, 2022:
| | | | | | | | | | | | | | | | | | | | | | | | |
| | | Derivatives not accounted for as hedging instruments | |
| | | | | | | | | | | | | | | | | | | |
Net Realized Gain (Loss) on Financial Derivative Instruments | |
Exchange-traded or centrally cleared | |
| | $ | 0 | | | $ | (448 | ) | | $ | 0 | | | $ | 0 | | | $ | 12 | | | $ | (436 | ) |
| | | | | | | | | | | | | | | | | | | | | | | | |
| |
Forward Foreign Currency Contracts | | $ | 0 | | | $ | 0 | | | $ | 0 | | | $ | 7,156 | | | $ | 0 | | | $ | 7,156 | |
| | | 0 | | | | (4,374 | ) | | | 0 | | | | 0 | | | | 0 | | | | (4,374 | ) |
| | | | | | | | | | | | | | | | | | | | | | | | |
| | $ | 0 | | | $ | (4,374 | ) | | $ | 0 | | | $ | 7,156 | | | $ | 0 | | | $ | 2,782 | |
| | | | | | | | | | | | | | | | | | | | | | | | |
| | $ | 0 | | | $ | (4,822 | ) | | $ | 0 | | | $ | 7,156 | | | $ | 12 | | | $ | 2,346 | |
| | | | | | | | | | | | | | | | | | | | | | | | |
|
Net Change in Unrealized Appreciation (Depreciation) on Financial Derivative Instruments | |
Exchange-traded or centrally cleared | |
| | $ | 0 | | | $ | (2,665 | ) | | $ | 0 | | | $ | 0 | | | $ | 313 | | | $ | (2,352 | ) |
| | | | | | | | | | | | | | | | | | | | | | | | |
| |
Forward Foreign Currency Contracts | | $ | 0 | | | $ | 0 | | | $ | 0 | | | $ | 870 | | | $ | 0 | | | $ | 870 | |
| | | 0 | | | | (731 | ) | | | 0 | | | | 0 | | | | 0 | | | | (731 | ) |
| | | | | | | | | | | | | | | | | | | | | | | | |
| | $ | 0 | | | $ | (731 | ) | | $ | 0 | | | $ | 870 | | | $ | 0 | | | $ | 139 | |
| | | | | | | | | | | | | | | | | | | | | | | | |
| | $ | 0 | | | $ | (3,396 | ) | | $ | 0 | | | $ | 870 | | | $ | 313 | | | $ | (2,213 | ) |
| | | | | | | | | | | | | | | | | | | | | | | | |
FAIR VALUE MEASUREMENTS
The following is a summary of the fair valuations according to the inputs used as of June 30, 2022 in valuing the Fund’s assets and liabilities:
| | | | | | | | | | | | | | | | |
| | | | | | | | | | | Fair Value at
06/30/2022 | |
Investments in Securities, at Value | |
Loan Participations and Assignments | | $ | 0 | | | $ | 186,556 | | | $ | 71,254 | | | $ | 257,810 | |
| |
| | | 0 | | | | 61,026 | | | | 0 | | | | 61,026 | |
| | | 0 | | | | 150,532 | | | | 828 | | | | 151,360 | |
| | | 0 | | | | 54,751 | | | | 0 | | | | 54,751 | |
| |
| | | 0 | | | | 19,971 | | | | 0 | | | | 19,971 | |
Non-Agency Mortgage-Backed Securities | | | 0 | | | | 363,895 | | | | 0 | | | | 363,895 | |
| | | 0 | | | | 190,666 | | | | 45,337 | | | | 236,003 | |
| | | 0 | | | | 11,902 | | | | 0 | | | | 11,902 | |
| |
| | | 0 | | | | 0 | | | | 8,153 | | | | 8,153 | |
| |
| | | 0 | | | | 17,297 | | | | 0 | | | | 17,297 | |
Real Estate Investment Trusts | |
| | | 10,333 | | | | 0 | | | | 0 | | | | 10,333 | |
| |
| | | 0 | | | | 50,200 | | | | 0 | | | | 50,200 | |
| | | 0 | | | | 7,182 | | | | 0 | | | | 7,182 | |
| | | | | | | | | | | | | | | | |
| | | | |
| | $ | 10,333 | | | $ | 1,113,978 | | | $ | 125,572 | | | $ | 1,249,883 | |
| | | | | | | | | | | | | | | | |
| | | | | | | | | | | | | | | | |
| | | | | | | | | | | Fair Value at
06/30/2022 | |
Financial Derivative Instruments - Assets | |
Exchange-traded or centrally cleared | | $ | 0 | | | $ | 770 | | | $ | 0 | | | $ | 770 | |
| | | 0 | | | | 2,182 | | | | 0 | | | | 2,182 | |
| | | | | | | | | | | | | | | | |
| | $ | 0 | | | $ | 2,952 | | | $ | 0 | | | $ | 2,952 | |
| | | | | | | | | | | | | | | | |
|
Financial Derivative Instruments - Liabilities | |
Exchange-traded or centrally cleared | | | 0 | | | | (684 | ) | | | 0 | | | | (684 | ) |
| | | 0 | | | | (258 | ) | | | 0 | | | | (258 | ) |
| | | | | | | | | | | | | | | | |
| | $ | 0 | | | $ | (942 | ) | | $ | 0 | | | $ | (942 | ) |
| | | | | | | | | | | | | | | | |
| | | | |
Total Financial Derivative Instruments | | $ | 0 | | | $ | 2,010 | | | $ | 0 | | | $ | 2,010 | |
| | | | | | | | | | | | | | | | |
| | | | |
| | $ | 10,333 | | | $ | 1,115,988 | | | $ | 125,572 | | | $ | 1,251,893 | |
| | | | | | | | | | | | | | | | |
The following is a reconciliation of the fair valuations using significant unobservable inputs (Level 3) for the Fund during the period ended June 30, 2022:
| | | | | | | | | | | | | | | | | | | | | | | | | | | | | | | | | | | | | | | | |
| Category and Subcategory | | Beginning
Balance
at 06/30/2021 | | | | | | | | | Accrued
Discounts/
(Premiums) | | | | | | Net Change in Unrealized Appreciation/ (Depreciation) (1) | | | | | | | | | Ending
Balance
at 06/30/2022 | | | Net Change in Unrealized Appreciation/ (Depreciation) on Investments Held at 06/30/2022 (1) | |
Investments in Securities, at Value | |
Loan Participations and Assignments | | $ | 0 | | | $ | 82,669 | | | $ | (106 | ) | | $ | 297 | | | $ | 1 | | | $ | (11,607 | ) | | $ | 0 | | | $ | 0 | | | $ | 71,254 | | | $ | (11,607 | ) |
| |
| | | 0 | | | | 930 | | | | 0 | | | | 2 | | | | 0 | | | | (104 | ) | | | 0 | | | | 0 | | | | 828 | | | | (104 | ) |
| | | 0 | | | | 47,524 | | | | 0 | | | | 0 | | | | 0 | | | | (2,187 | ) | | | 0 | | | | 0 | | | | 45,337 | | | | (2,187 | ) |
| | | | | | | | | | | | | | | | | | | | | | | | | | | | | | | | | | | | | | | | |
| | | 0 | | | | 8,153 | | | | 0 | | | | 0 | | | | 0 | | | | 0 | | | | 0 | | | | 0 | | | | 8,153 | | | | 0 | |
| | | | | | | | | | | | | | | | | | | | | | | | | | | | | | | | | | | | | | | | |
| | | | | | | | | | |
| | $ | 0 | | | $ | 139,276 | | | $ | (106 | ) | | $ | 299 | | | $ | 1 | | | $ | (13,898 | ) | | $ | 0 | | | $ | 0 | | | $ | 125,572 | | | $ | (13,898 | ) |
| | | | | | | | | | | | | | | | | | | | | | | | | | | | | | | | | | | | | | | | |
The following is a summary of significant unobservable inputs used in the fair valuations of assets and liabilities categorized within Level 3 of the fair value hierarchy:
| | | | | | | | | | | | | | | | | | | | |
| Category and Subcategory | | Ending
Balance
at 06/30/2022 | | | Valuation Technique | | Unobservable
Inputs | | | | | (% Unless Noted Otherwise) | |
| | | | | | |
Investments in Securities, at Value | |
Loan Participations and Assignments | | $ | 40,119 | | | Proxy Pricing | | Base Price | | | | | | | 42.500-99.500 | | | | 83.060 | |
| | | 31,135 | | | Third Party Vendor | | Broker Quote | | | | | | | 69.750-98.500 | | | | 94.201 | |
| |
| | | 828 | | | Reference Instrument | | Weighted Average | | | BRL | | | | 42.864 | | | | — | |
| | | 14,213 | | | Discounted Cash Flow | | Discount Rate | | | | | | | 22.000-22.500 | | | | 22.252 | |
| | | 31,124 | | | Proxy Pricing | | Base Price | | | | | | | | | | | 87,631.058 | |
| | | | | | | | | | | | |
| | | 8,153 | | | Reference Instrument | | Purchase Price | | | $ | | | | 0.980 | | | | — | |
| | | | | | | | | | | | | | | | | | | | |
| | $ | 125,572 | | | | | | | | | | | | | | | | | |
| | | | | | | | | | | | | | | | | | | | |
| Any difference between Net Change in Unrealized Appreciation/(Depreciation) and Net Change in Unrealized Appreciation/(Depreciation) on Investments Held at June 30, 2022 may be due to an investment no longer held or categorized as Level 3 at period end. |
| | | | | | | | | | | | |
| See Accompanying Notes | | | ANNUAL REPORT | | | | | | | JUNE 30, 2022 | | | 75 |
| | | | | | |
Consolidated Schedule of Investments | | PIMCO Dynamic Income Fund | | | | |
(Amounts in thousands*, except number of shares, contracts, units and ounces, if any)
| | | | | | | | | | | | |
| | | | | PRINCIPAL
AMOUNT
(000S) | | | | | MARKET
VALUE
(000S) | |
INVESTMENTS IN SECURITIES 181.3% | |
| |
LOAN PARTICIPATIONS AND ASSIGNMENTS 30.7% | |
|
AAdvantage Loyalty IP Ltd. | |
5.813% (LIBOR03M + 4.750%) due 04/20/2028 ~ | | $ | | | 9,397 | | | $ | | | 9,002 | |
|
| |
4.250% (LIBOR03M + 3.500%) due 08/11/2028 «~ | | | | | 6,000 | | | | | | 5,535 | |
|
| |
| | | | | 118,497 | | | | | | 110,202 | |
|
| |
7.166% (LIBOR01M + 5.500%) due 09/01/2027 ~ | | | | | 8,949 | | | | | | 8,448 | |
|
Caesars Resort Collection LLC | |
4.416% (LIBOR01M + 2.750%) due 12/23/2024 ~ | | | | | 7,562 | | | | | | 7,301 | |
5.166% (LIBOR01M + 3.500%) due 07/21/2025 ~ | | | | | 198 | | | | | | 192 | |
|
| |
3.750% - 3.975% (EUR003M + 3.750%) due 06/30/2025 ~ | | EUR | | | 22,619 | | | | | | 21,985 | |
6.127% (LIBOR06M + 3.250%) due 10/18/2028 «~ | | $ | | | 8,427 | | | | | | 7,584 | |
|
Casino Guichard-Perrachon SA | |
4.000% (EUR003M + 4.000%) due 08/31/2025 ~ | | EUR | | | 3,200 | | | | | | 3,022 | |
|
| |
| | | | | 45,357 | | | | | | 39,273 | |
|
| |
5.750% (LIBOR03M + 4.750%) due 07/14/2026 ~ | | $ | | | 3,391 | | | | | | 3,071 | |
|
Clear Channel Outdoor Holdings, Inc. | |
4.739% (LIBOR03M + 3.500%) due 08/21/2026 ~ | | | | | 9,678 | | | | | | 8,332 | |
|
| |
| | EUR | | | 7,874 | | | | | | 6,622 | |
|
Commercial Mortgage Trust, Inc | |
| | | | | 18,770 | | | | | | 16,252 | |
|
| |
3.410% (LIBOR01M + 2.250%) due 04/07/2025 ~ | | $ | | | 17,866 | | | | | | 17,081 | |
|
Cromwell EREIT Lux Finco SARL | |
1.500% (EUR003M + 1.500%) due 11/21/2024 «~ | | EUR | | | 2,000 | | | | | | 1,897 | |
|
| |
6.666% (LIBOR01M + 5.000%) due 08/02/2027 ~ | | $ | | | 3,730 | | | | | | 3,450 | |
|
Encina Private Credit LLC | |
TBD% - 5.598% (LIBOR01M + 4.274%) due 11/30/2025 «~µ | | | | | 8,919 | | | | | | 8,699 | |
|
Envision Healthcare Corp. | |
| | | | | 9,477 | | | | | | 9,358 | |
| | | | | 52,123 | | | | | | 51,472 | |
|
| |
7.750% (LIBOR03M + 6.750%) due 10/08/2026 «~ | | | | | 60,819 | | | | | | 61,146 | |
|
| |
7.012% - 7.611% (LIBOR03M + 6.000%) due 10/08/2025 «~ | | | | | 631 | | | | | | 621 | |
|
Forbes Energy Services LLC | |
| | | | | 36 | | | | | | 36 | |
|
Forbes Energy Services LLC (7.000% PIK) | |
7.000% due 09/30/2022 «(c) | | | | | 2,629 | | | | | | 0 | |
|
Frontier Communications Corp. | |
5.150% - 6.063% (LIBOR03M + 3.750%) due 05/01/2028 ~ | | | | | 7,503 | | | | | | 7,048 | |
|
| |
6.000% (LIBOR03M + 3.750%) due 10/01/2026 ~ | | | | | 1 | | | | | | 1 | |
|
Gateway Casinos & Entertainment Ltd. | |
9.590% (LIBOR03M + 8.000%) due 10/15/2027 ~ | | | | | 89,920 | | | | | | 88,852 | |
| | CAD | | | 19,629 | | | | | | 15,078 | |
| | | | | | | | | | | | |
| | | | | | | | | | | |
|
| |
6.411% (LIBOR03M + 5.000%) due 08/11/2028 ~ | | $ | | | 3,383 | | | $ | | | 2,935 | |
|
| |
| | | | | 1,691 | | | | | | 1,584 | |
|
Instant Brands Holdings, Inc. | |
6.400% - 7.076% (LIBOR03M + 5.000%) due 04/12/2028 ~ | | | | | 3,957 | | | | | | 3,179 | |
|
Intelsat Jackson Holdings SA | |
| | | | | 36,404 | | | | | | 33,401 | |
|
| |
7.416% (LIBOR01M + 5.750%) due 09/21/2029 ~ | | | | | 1,225 | | | | | | 1,179 | |
|
Kronos Acquisition Holdings, Inc. | |
| | | | | 8,259 | | | | | | 8,093 | |
|
| |
4.666% (LIBOR01M + 3.000%) due 06/28/2024 «~ | | | | | 385 | | | | | | 241 | |
|
Lealand Finance Co. BV (2.666% Cash and 3.000% PIK) | |
5.666% (LIBOR01M + 1.000%) due 06/30/2025 ~(c) | | | | | 5,652 | | | | | | 2,897 | |
|
| |
6.825% (LIBOR03M + 5.250%) due 08/30/2026 ~ | | | | | 16,504 | | | | | | 15,524 | |
|
| |
| | | | | 14,600 | | | | | | 13,282 | |
|
MPH Acquisition Holdings LLC | |
5.825% (LIBOR03M + 4.250%) due 09/01/2028 ~ | | | | | 9,925 | | | | | | 9,174 | |
|
| |
| | | | | 1,300 | | | | | | 1,202 | |
|
| |
| | | | | 3,020 | | | | | | 1,057 | |
|
Otterham Property Finance Designated Activity Co. | |
3.000% (EUR003M + 3.000%) due 09/03/2026 «~(k) | | EUR | | | 4,534 | | | | | | 4,752 | |
|
Preylock Reitman Santa Cruz Mezz LLC | |
6.824% (LIBOR03M + 5.500%) due 11/09/2022 «~(k) | | $ | | | 37,100 | | | | | | 36,774 | |
|
| |
| | | | | 18,269 | | | | | | 17,995 | |
|
| |
2.750% (EUR003M + 2.750%) due 10/01/2026 «~(k) | | EUR | | | 36,091 | | | | | | 36,831 | |
|
Project Quasar Pledgco SLU | |
3.250% (EUR003M + 3.250%) due 03/15/2026 «~ | | | | | 21,590 | | | | | | 22,267 | |
|
Promotora de Informaciones SA | |
| | | | | 15,200 | | | | | | 15,784 | |
5.250% (EUR003M + 5.250%) due 12/31/2026 ~ | | | | | 78,496 | | | | | | 73,829 | |
9.000% (EUR003M + 8.000%) due 06/30/2027 ~ | | | | | 24,009 | | | | | | 22,802 | |
|
| |
5.166% (LIBOR01M + 3.500%) due 02/12/2027 ~ | | $ | | | 2,441 | | | | | | 2,237 | |
5.916% (LIBOR01M + 4.250%) due 02/12/2027 «~ | | | | | 1,489 | | | | | | 1,381 | |
|
| |
6.582% - 7.632% due 01/29/2028 | | GBP | | | 16,500 | | | | | | 16,721 | |
|
| |
8.975% (LIBOR03M + 7.750%) due 04/27/2029 ~ | | $ | | | 2,000 | | | | | | 1,733 | |
|
RegionalCare Hospital Partners Holdings, Inc. | |
5.416% (LIBOR01M + 3.750%) due 11/16/2025 ~ | | | | | 260 | | | | | | 243 | |
|
Republic of Cote d’lvoire | |
5.000% (EUR003M + 5.000%) due 03/19/2027 «~ | | EUR | | | 1,000 | | | | | | 1,008 | |
|
Rising Tide Holdings, Inc. | |
6.416% (LIBOR01M + 4.750%) due 06/01/2028 ~ | | $ | | | 17,028 | | | | | | 14,928 | |
|
Royal Caribbean Cruises Ltd. | |
0.500% - 2.809% (LIBOR01M + 1.300%) due 10/12/2022 ~ | | | | | 31,250 | | | | | | 30,625 | |
| | | | | | | | | | | | |
| | | | | | | | | | | |
|
| |
0.560% - 3.663% (LIBOR03M + 1.600%) due 11/23/2022 «~µ | | $ | | | 30,014 | | | $ | | | 29,728 | |
|
Sequa Mezzanine Holdings LLC | |
8.303% (LIBOR03M + 6.750%) due 11/28/2023 ~ | | | | | 7,933 | | | | | | 7,900 | |
|
| |
| | | | | 6 | | | | | | 6 | |
|
| |
3.500% (EUR003M + 3.500%) due 07/02/2025 ~ | | EUR | | | 690 | | | | | | 549 | |
6.320% (WIBOR03M + 3.500%) due 07/02/2025 ~ | | PLN | | | 85,527 | | | | | | 13,837 | |
|
| |
4.813% (LIBOR03M + 3.750%) due 10/20/2027 ~ | | $ | | | 1,400 | | | | | | 1,390 | |
|
| |
| | | | | 36,903 | | | | | | 36,903 | |
|
| |
5.416% (LIBOR01M + 3.750%) due 01/15/2025 ~ | | | | | 2,466 | | | | | | 2,406 | |
|
Steenbok Lux Finco 1 SARL (10.000% PIK) | |
10.000% (LIBOR03M) due 12/31/2022 ~(c) | | EUR | | | 44,086 | | | | | | 27,951 | |
|
Steenbok Lux Finco 2 SARL (10.750% PIK) | |
10.750% (EUR003M) due 12/29/2022 «~(c) | | | | | 115,351 | | | | | | 74,342 | |
|
Steenbok Lux Finco 2 SARL (7.875% PIK) | |
7.875% (EUR003M) due 12/29/2022 ~(c) | | | | | 14,346 | | | | | | 14,977 | |
|
Sunseeker International Ltd. | |
TBD% - 6.739% (LIBOR03M + 5.500%) due 10/31/2028 «~µ | | $ | | | 25,100 | | | | | | 24,815 | |
|
Surgery Center Holdings, Inc. | |
4.950% (LIBOR01M + 3.750%) due 08/31/2026 ~ | | | | | 790 | | | | | | 738 | |
|
| |
| | | | | 79,500 | | | | | | 70,159 | |
|
Team Health Holdings, Inc. | |
4.416% (LIBOR01M + 2.750%) due 02/06/2024 ~ | | | | | 88,415 | | | | | | 78,984 | |
|
| |
| | | | | 37,301 | | | | | | 13,056 | |
TBD% (LIBOR12M) due 02/26/2035 «~ | | | | | 8,577 | | | | | | 3,002 | |
4.000% (LIBOR03M + 1.750%) due 02/26/2035 «~ | | | | | 31,246 | | | | | | 10,936 | |
|
| |
6.688% (LIBOR01M + 5.000%) due 06/26/2026 ~ | | | | | 2,481 | | | | | | 1,708 | |
7.188% (LIBOR01M + 5.500%) due 06/26/2026 «~ | | | | | 10,024 | | | | | | 6,992 | |
|
| |
5.150% - 5.392% (LIBOR01M + 3.750%) due 04/21/2028 ~ | | | | | 6,617 | | | | | | 6,160 | |
|
Univision Communications, Inc. | |
4.416% (LIBOR01M + 2.750%) due 03/15/2024 ~ | | | | | 2,754 | | | | | | 2,709 | |
|
| |
7.250% (LIBOR03M + 5.000%) due 09/01/2025 ~ | | | | | 4,679 | | | | | | 3,858 | |
|
| |
6.666% (LIBOR01M + 5.000%) due 07/30/2028 «~ | | | | | 3,772 | | | | | | 3,545 | |
|
Westmoreland Mining Holdings LLC (15.000% PIK) | |
15.000% due 03/15/2029 (c) | | | | | 21,030 | | | | | | 12,618 | |
|
| |
7.916% (LIBOR01M + 6.250%) due 09/21/2027 ~ | | | | | 14,312 | | | | | | 13,453 | |
| | | | | | | | | | | | |
Total Loan Participations and Assignments (Cost $1,574,594) | | | | |
| | | | |
| |
| | | | | | | | | | | | |
| | | | | PRINCIPAL
AMOUNT
(000S) | | | | | MARKET
VALUE
(000S) | |
CORPORATE BONDS & NOTES 47.0% | |
| |
| |
|
| |
| | EUR | | | 600 | | | $ | | | 368 | |
| | | | | 3,000 | | | | | | 1,635 | |
| | | | | 4,900 | | | | | | 2,495 | |
| | | | | 1,100 | | | | | | 589 | |
| | | | | 1,300 | | | | | | 747 | |
|
| |
| | | | | 600 | | | | | | 495 | |
| | | | | 400 | | | | | | 307 | |
| | | | | 800 | | | | | | 559 | |
|
| |
| | $ | | | 478 | | | | | | 524 | |
|
| |
5.100% due 12/31/2099 (i) | | | | | 185 | | | | | | 169 | |
|
Apollo Commercial Real Estate Finance, Inc. | |
| | | | | 4,700 | | | | | | 3,508 | |
|
| |
| | | | | 5,100 | | | | | | 4,224 | |
|
Banca Monte dei Paschi di Siena SpA | |
| | EUR | | | 28,732 | | | | | | 25,218 | |
| | | | | 27,530 | | | | | | 25,630 | |
| | | | | 35,346 | | | | | | 34,274 | |
| | | | | 29,389 | | | | | | 18,304 | |
| | | | | 13,920 | | | | | | 9,343 | |
| | | | | 4,762 | | | | | | 3,304 | |
| | | | | 17,716 | | | | | | 12,988 | |
|
Banco de Credito del Peru SA | |
| | PEN | | | 6,500 | | | | | | 1,573 | |
|
| |
6.375% due 12/15/2025 •(i)(j) | | GBP | | | 1,250 | | | | | | 1,404 | |
7.125% due 06/15/2025 •(i)(j) | | | | | 6,200 | | | | | | 7,260 | |
7.250% due 03/15/2023 •(i)(j) | | | | | 2,055 | | | | | | 2,466 | |
7.750% due 09/15/2023 •(i)(j) | | $ | | | 4,800 | | | | | | 4,728 | |
7.875% due 09/15/2022 •(i)(j) | | GBP | | | 1,970 | | | | | | 2,394 | |
8.000% due 06/15/2024 •(i)(j) | | $ | | | 2,400 | | | | | | 2,364 | |
|
| |
| | EUR | | | 10,000 | | | | | | 8,489 | |
|
CIFI Holdings Group Co. Ltd. | |
| | $ | | | 400 | | | | | | 217 | |
| | | | | 300 | | | | | | 171 | |
| | | | | 200 | | | | | | 114 | |
|
| |
18.945% (T-BILL 3MO + 17.250%) due 07/08/2028 ~ | | | | | 8,500 | | | | | | 8,277 | |
|
Corestate Capital Holding SA | |
| | EUR | | | 1,300 | | | | | | 307 | |
|
Corsair International Ltd. | |
| | | | | 4,900 | | | | | | 4,847 | |
| | | | | 2,100 | | | | | | 2,055 | |
|
| |
10.948% (T-BILL 1MO + 9.250%) due 04/03/2028 ~ | | $ | | | 600 | | | | | | 590 | |
|
Country Garden Holdings Co. Ltd. | |
| | | | | 200 | | | | | | 94 | |
| | | | | 1,200 | | | | | | 591 | |
| | | | | 800 | | | | | | 338 | |
| | | | | 200 | | | | | | 85 | |
| | | | | 1,000 | | | | | | 541 | |
| | | | | 200 | | | | | | 133 | |
|
| |
7.875% due 01/23/2024 •(i)(j) | | | | | 300 | | | | | | 297 | |
|
| |
7.250% due 09/12/2025 •(i)(j) | | | | | 960 | | | | | | 834 | |
7.500% due 07/17/2023 •(i)(j) | | | | | 3,200 | | | | | | 2,960 | |
|
Doric Nimrod Air Alpha Pass-Through Trust | |
| | | | | 50 | | | | | | 50 | |
|
Doric Nimrod Air Finance Alpha Ltd. Pass-Through Trust | |
| | | | | 29 | | | | | | 29 | |
|
Fairfax India Holdings Corp. | |
| | | | | 12,350 | | | | | | 12,022 | |
| | | | | | | | | | | | |
| | | | | PRINCIPAL
AMOUNT
(000S) | | | | | MARKET
VALUE
(000S) | |
|
| |
15.273% (T-BILL 3MO + 13.580%) due 03/01/2024 ~ | | $ | | | 6,084 | | | $ | | | 5,614 | |
19.023% (T-BILL 3MO + 17.330%) due 03/01/2024 ~ | | | | | 1,737 | | | | | | 1,534 | |
|
Fortress Transportation & Infrastructure Investors LLC | |
| | | | | 1,183 | | | | | | 1,118 | |
|
| |
| | | | | 1,800 | | | | | | 1,357 | |
| | | | | 900 | | | | | | 693 | |
| | | | | 1,200 | | | | | | 959 | |
| | | | | 200 | | | | | | 175 | |
| | | | | 1,300 | | | | | | 1,084 | |
| | | | | 1,200 | | | | | | 1,084 | |
| | | | | 800 | | | | | | 564 | |
|
Jefferson Capital Holdings LLC | |
| | | | | 11,750 | | | | | | 10,302 | |
|
National Health Investors, Inc. | |
| | | | | 200 | | | | | | 154 | |
|
| |
8.000% due 08/10/2025 •(i)(j) | | | | | 10,802 | | | | | | 10,715 | |
|
| |
8.625% due 06/25/2034 «(k) | | | | | 36,300 | | | | | | 40,468 | |
|
Preferred Term Securities Ltd. | |
2.209% (US0003M + 0.380%) due 09/23/2035 ~ | | | | | 106 | | | | | | 106 | |
|
| |
11.750% (T-BILL 3MO + 11.750%) due 04/09/2029 ~ | | | | | 11,610 | | | | | | 11,620 | |
|
| |
| | | | | 200 | | | | | | 117 | |
| | | | | 200 | | | | | | 120 | |
| | | | | 200 | | | | | | 149 | |
|
Sunac China Holdings Ltd. | |
7.000% due 07/09/2025 ^(d) | | | | | 600 | | | | | | 90 | |
|
Toll Road Investors Partnership LP | |
0.000% due 02/15/2043 (g) | | | | | 28,416 | | | | | | 7,477 | |
|
Unique Pub Finance Co. PLC | |
| | GBP | | | 1,037 | | | | | | 1,332 | |
| | | | | 4,240 | | | | | | 5,312 | |
|
| |
| | $ | | | 51,751 | | | | | | 35,870 | |
| | | | | 9,015 | | | | | | 6,630 | |
7.875% due 02/15/2025 (m) | | | | | 76,481 | | | | | | 74,037 | |
|
| |
| | | | | 7,100 | | | | | | 6,120 | |
| | | | | 200 | | | | | | 184 | |
| | | | | 300 | | | | | | 274 | |
| | | | | 1,100 | | | | | | 1,046 | |
|
Voyager Aviation Holdings LLC | |
| | | | | 122,450 | | | | | | 109,593 | |
| | | | | | | | | | | | |
| | | | | | | | | | | 545,809 | |
| | | | | | | | | | | | |
| |
| |
|
Air Canada Pass-Through Trust | |
| | | | | 811 | | | | | | 812 | |
|
| |
| | | | | 15,830 | | | | | | 12,748 | |
|
American Airlines Pass-Through Trust | |
| | | | | 627 | | | | | | 577 | |
| | | | | 588 | | | | | | 529 | |
| | | | | 780 | | | | | | 677 | |
|
| |
5.500% due 04/20/2026 (m) | | | | | 4,600 | | | | | | 4,243 | |
| | | | | 700 | | | | | | 600 | |
|
| |
| | | | | 5,000 | | | | | | 4,085 | |
|
BCP Modular Services Finance PLC | |
| | GBP | | | 1,300 | | | | | | 1,242 | |
|
| |
| | $ | | | 7,234 | | | | | | 6,760 | |
| | | | | 6,065 | | | | | | 5,582 | |
| | | | | 8,393 | | | | | | 7,660 | |
| | | | | | | | | | | | |
| | | | | PRINCIPAL
AMOUNT
(000S) | | | | | MARKET
VALUE
(000S) | |
|
| |
| | $ | | | 24,600 | | | $ | | | 20,361 | |
| | | | | 20,871 | | | | | | 18,919 | |
|
British Airways Pass-Through Trust | |
| | | | | 56 | | | | | | 54 | |
|
Buffalo Thunder Development Authority | |
0.000% due 11/15/2029 «(k) | | | | | 2,483 | | | | | | 2 | |
11.000% due 12/09/2022 ^(d) | | | | | 5,598 | | | | | | 3,219 | |
|
| |
10.500% due 02/01/2026 (m) | | | | | 200 | | | | | | 199 | |
|
| |
| | | | | 18,300 | | | | | | 15,067 | |
|
| |
| | EUR | | | 38,535 | | | | | | 34,528 | |
| | $ | | | 56,461 | | | | | | 48,112 | |
|
Charter Communications Operating LLC | |
3.950% due 06/30/2062 (m) | | | | | 200 | | | | | | 134 | |
|
Community Health Systems, Inc. | |
| | | | | 3,400 | | | | | | 2,590 | |
| | | | | 4,179 | | | | | | 3,818 | |
|
| |
| | | | | 4,100 | | | | | | 3,344 | |
|
Constellation Oil Services Holding SA (3.000% Cash or 4.000% PIK) | |
3.000% due 12/31/2026 «(c) | | | | | 223 | | | | | | 165 | |
|
| |
| | | | | 200 | | | | | | 0 | |
|
| |
| | EUR | | | 9,600 | | | | | | 8,926 | |
| | $ | | | 2,100 | | | | | | 1,807 | |
|
| |
| | | | | 1,853 | | | | | | 2,021 | |
|
| |
8.000% due 06/01/2029 (m) | | | | | 7,036 | | | | | | 5,745 | |
|
| |
| | | | | 14,340 | | | | | | 11,267 | |
5.750% due 12/01/2028 (m) | | | | | 23,800 | | | | | | 17,666 | |
|
| |
| | EUR | | | 1,837 | | | | | | 1,450 | |
| | CHF | | | 3,000 | | | | | | 2,785 | |
|
Endurance International Group Holdings, Inc. | |
| | $ | | | 6,000 | | | | | | 4,339 | |
|
| |
| | | | | 697 | | | | | | 233 | |
|
| |
9.375% due 12/31/2025 (k) | | | | | 1,750 | | | | | | 1,767 | |
|
Fertitta Entertainment LLC | |
| | | | | 2,000 | | | | | | 1,541 | |
|
First Quantum Minerals Ltd. | |
| | | | | 6,456 | | | | | | 6,213 | |
| | | | | 3,270 | | | | | | 3,018 | |
|
| |
| | | | | 3,500 | | | | | | 3,156 | |
| | | | | 3,700 | | | | | | 3,337 | |
|
| |
| | EUR | | | 1,200 | | | | | | 954 | |
|
| |
| | $ | | | 33,556 | | | | | | 33,556 | |
|
Frontier Communications Holdings LLC | |
| | | | | 13,262 | | | | | | 10,241 | |
|
| |
| | | | | 1,427 | | | | | | 1,143 | |
|
Gazprom PJSC Via Gaz Capital SA | |
| | | | | 300 | | | | | | 105 | |
| | | | | 1,081 | | | | | | 405 | |
|
| |
| | EUR | | | 8,000 | | | | | | 6,944 | |
|
| |
| | $ | | | 9,762 | | | | | | 7,937 | |
|
Hawaiian Brand Intellectual Property Ltd. | |
| | | | | 1,200 | | | | | | 1,078 | |
|
IHO Verwaltungs GmbH (3.750% Cash or 4.500% PIK) | |
3.750% due 09/15/2026 (c) | | EUR | | | 500 | | | | | | 436 | |
| | | | | | | | | | | | |
| See Accompanying Notes | | | ANNUAL REPORT | | | | | | | JUNE 30, 2022 | | | 77 |
| | | | | | | | |
Consolidated Schedule of Investments | | PIMCO Dynamic Income Fund | | | | | | |
| | | | | | | | | | | | |
| | | | | PRINCIPAL
AMOUNT
(000S) | | | | | MARKET
VALUE
(000S) | |
|
IHO Verwaltungs GmbH (3.875% Cash or 4.625% PIK) | |
3.875% due 05/15/2027 (c) | | EUR | | | 700 | | | $ | | | 574 | |
|
Intelsat Jackson Holdings SA | |
| | $ | | | 129,139 | | | | | | 106,863 | |
|
Inter Media & Communication SpA | |
| | EUR | | | 10,250 | | | | | | 9,613 | |
|
Iris Holdings, Inc. (8.750% Cash or 9.500% PIK) | |
8.750% due 02/15/2026 (c) | | $ | | | 1,900 | | | | | | 1,523 | |
|
| |
| | | | | 100 | | | | | | 95 | |
|
| |
| | EUR | | | 6,600 | | | | | | 5,512 | |
|
Melco Resorts Finance Ltd. | |
| | $ | | | 2,600 | | | | | | 1,573 | |
| | | | | 37,128 | | | | | | 23,948 | |
|
| |
| | | | | 1,400 | | | | | | 992 | |
| | | | | 1,400 | | | | | | 1,076 | |
| | | | | 200 | | | | | | 171 | |
| | | | | 1,500 | | | | | | 1,136 | |
|
| |
5.875% due 02/15/2027 (m) | | | | | 14,122 | | | | | | 12,101 | |
|
| |
| | | | | 2,400 | | | | | | 2,134 | |
|
Noble Corp. PLC (11.000% Cash or 15.000% PIK) | |
11.000% due 02/15/2028 (c) | | | | | 5,327 | | | | | | 5,833 | |
|
| |
| | | | | 100 | | | | | | 75 | |
|
Odebrecht Oil & Gas Finance Ltd. | |
0.000% due 08/01/2022 (g)(i) | | | | | 5,220 | | | | | | 22 | |
|
Olympus Water U.S. Holding Corp. | |
| | EUR | | | 2,200 | | | | | | 1,665 | |
|
| |
| | $ | | | 14,145 | | | | | | 10,389 | |
| | | | | 13,250 | | | | | | 9,077 | |
| | | | | 69,042 | | | | | | 52,789 | |
6.750% due 09/21/2047 (m) | | | | | 25,819 | | | | | | 16,032 | |
| | | | | 1,000 | | | | | | 619 | |
| | | | | 18,477 | | | | | | 12,621 | |
|
Petrorio Luxembourg Trading SARL | |
| | | | | 5,480 | | | | | | 5,050 | |
|
| |
| | EUR | | | 500 | | | | | | 363 | |
| | | | | 1,100 | | | | | | 883 | |
| | | | | 900 | | | | | | 659 | |
| | $ | | | 25,600 | | | | | | 15,464 | |
| | | | | 7,800 | | | | | | 4,856 | |
| | | | | 1,500 | | | | | | 1,199 | |
| | | | | 1,300 | | | | | | 935 | |
|
| |
| | | | | 4,151 | | | | | | 2,807 | |
|
| |
| | EUR | | | 800 | | | | | | 790 | |
| | $ | | | 500 | | | | | | 452 | |
|
Royal Caribbean Cruises Ltd. | |
| | | | | 500 | | | | | | 496 | |
| | | | | 1,400 | | | | | | 1,408 | |
| | | | | 1,650 | | | | | | 1,699 | |
|
Russian Railways Via RZD Capital PLC | |
7.487% due 03/25/2031 ^(d) | | GBP | | | 200 | | | | | | 24 | |
|
| |
| | $ | | | 200 | | | | | | 161 | |
| | | | | 400 | | | | | | 293 | |
| | | | | 200 | | | | | | 168 | |
| | | | | 2,158 | | | | | | 1,667 | |
|
Schenck Process Holding GmbH | |
| | EUR | | | 6,970 | | | | | | 7,166 | |
|
| |
| | $ | | | 2,700 | | | | | | 2,327 | |
| | | | | 200 | | | | | | 164 | |
|
| |
| | | | | 13,764 | | | | | | 12,925 | |
|
Spirit Airlines Pass-Through Trust | |
| | | | | 318 | | | | | | 305 | |
| | | | | | | | | | | | |
| | | | | PRINCIPAL
AMOUNT
(000S) | | | | | MARKET
VALUE
(000S) | |
|
Standard Industries, Inc. | |
| | $ | | | 1,400 | | | $ | | | 1,107 | |
|
| |
| | | | | 700 | | | | | | 608 | |
|
| |
| | | | | 2,800 | | | | | | 1,450 | |
| | | | | 3,200 | | | | | | 2,031 | |
| | | | | 3,000 | | | | | | 1,687 | |
|
| |
8.528% due 08/01/2026 (m) | | | | | 2,436 | | | | | | 2,508 | |
|
| |
| | | | | 16,793 | | | | | | 14,565 | |
5.750% due 09/30/2039 (m) | | | | | 91,205 | | | | | | 82,947 | |
|
| |
| | | | | 813 | | | | | | 745 | |
|
| |
| | | | | 764 | | | | | | 566 | |
| | | | | 389 | | | | | | 279 | |
| | | | | 884 | | | | | | 593 | |
|
| |
| | | | | 21,168 | | | | | | 7,991 | |
|
| |
| | | | | 200 | | | | | | 199 | |
|
United Airlines Pass-Through Trust | |
| | | | | 834 | | | | | | 764 | |
|
| |
| | | | | 900 | | | | | | 767 | |
|
| |
| | EUR | | | 300 | | | | | | 287 | |
|
Valaris Ltd. (8.250% Cash or 12.000% PIK) | |
8.250% due 04/30/2028 (c) | | $ | | | 7,932 | | | | | | 7,706 | |
|
| |
0.000% due 12/29/2049 «~(i) | | BRL | | | 830,470 | | | | | | 66,765 | |
|
| |
| | $ | | | 21,985 | | | | | | 16,542 | |
|
| |
| | | | | 2,700 | | | | | | 1,651 | |
|
| |
| | | | | 48,033 | | | | | | 49,290 | |
|
Viking Ocean Cruises Ship Ltd. | |
| | | | | 12,300 | | | | | | 9,714 | |
|
| |
| | | | | 7,300 | | | | | | 5,876 | |
|
Wesco Aircraft Holdings, Inc. | |
| | | | | 2,265 | | | | | | 1,201 | |
|
Wesco Aircraft Holdings, Inc. (7.500% Cash and 3.000% PIK) | |
10.500% due 11/15/2026 «(c) | | | | | 199,746 | | | | | | 189,564 | |
|
| |
7.750% due 08/15/2028 (m) | | | | | 64,273 | | | | | | 51,918 | |
|
| |
5.250% due 05/15/2027 (m) | | | | | 9,610 | | | | | | 8,244 | |
| | | | | 6,100 | | | | | | 5,594 | |
|
| |
| | | | | 600 | | | | | | 447 | |
| | | | | 4,100 | | | | | | 2,551 | |
| | | | | 2,000 | | | | | | 1,388 | |
| | | | | 2,500 | | | | | | 1,621 | |
| | | | | 8,100 | | | | | | 5,012 | |
|
| |
| | | | | 2,325 | | | | | | 2,397 | |
| | | | | | | | | | | | |
| | | | | | | | | | | 1,219,366 | |
| | | | | | | | | | | | |
| |
| |
|
DTEK Finance PLC (3.500% Cash and 3.500% PIK) | |
7.000% due 12/31/2027 (c) | | | | | 46,559 | | | | | | 11,203 | |
|
| |
| | | | | 53,680 | | | | | | 49,520 | |
|
| |
| | | | | 16,671 | | | | | | 12,130 | |
|
Gazprom PJSC via Gaz Finance PLC | |
| | | | | 200 | | | | | | 60 | |
| | | | | | | | | | | | |
| | | | | PRINCIPAL
AMOUNT
(000S) | | | | | MARKET
VALUE
(000S) | |
|
| |
| | $ | | | 200 | | | $ | | | 185 | |
| | | | | 3,925 | | | | | | 3,485 | |
|
| |
| | | | | 6,185 | | | | | | 2,752 | |
|
Odebrecht Drilling Norbe Ltd. (6.350% Cash and 1.000% PIK) | |
7.350% due 12/01/2026 ^(c) | | | | | 4,915 | | | | | | 3,033 | |
|
Odebrecht Offshore Drilling Finance Ltd. | |
| | | | | 4,939 | | | | | | 4,766 | |
|
Odebrecht Offshore Drilling Finance Ltd. (6.720% Cash and 1.000% PIK) | |
7.720% due 12/01/2026 ^(c) | | | | | 24,320 | | | | | | 6,080 | |
|
Oi SA (10.000% Cash or 12.000% PIK) | |
10.000% due 07/27/2025 (c) | | | | | 48,943 | | | | | | 24,028 | |
|
Pacific Gas & Electric Co. | |
| | | | | 1,168 | | | | | | 1,099 | |
| | | | | 1,200 | | | | | | 804 | |
| | | | | 2,842 | | | | | | 1,928 | |
| | | | | 700 | | | | | | 486 | |
| | | | | 57 | | | | | | 40 | |
| | | | | 3,800 | | | | | | 3,396 | |
| | | | | 2,332 | | | | | | 1,708 | |
| | | | | 1,115 | | | | | | 812 | |
| | | | | 3,300 | | | | | | 2,868 | |
| | | | | 5,473 | | | | | | 4,119 | |
| | | | | 22,912 | | | | | | 17,792 | |
| | | | | 1,802 | | | | | | 1,328 | |
| | | | | 17,261 | | | | | | 15,354 | |
| | | | | 1,221 | | | | | | 934 | |
4.750% due 02/15/2044 (m) | | | | | 57,224 | | | | | | 43,961 | |
| | | | | 900 | | | | | | 883 | |
| | | | | 23,854 | | | | | | 19,079 | |
| | | | | 3,500 | | | | | | 2,890 | |
| | | | | 700 | | | | | | 678 | |
| | | | | 600 | | | | | | 581 | |
|
| |
| | | | | 42,051 | | | | | | 34,064 | |
|
Petrobras Global Finance BV | |
| | GBP | | | 932 | | | | | | 1,103 | |
| | | | | 11,917 | | | | | | 13,354 | |
6.750% due 06/03/2050 (m) | | $ | | | 18,890 | | | | | | 16,405 | |
| | | | | 9,413 | | | | | | 7,752 | |
|
PG&E Wildfire Recovery Funding LLC | |
| | | | | 6,950 | | | | | | 7,018 | |
| | | | | 1,750 | | | | | | 1,752 | |
|
| |
| | | | | 296 | | | | | | 307 | |
| | | | | 10,945 | | | | | | 11,352 | |
| | | | | 308 | | | | | | 329 | |
9.750% due 01/06/2027 (m) | | | | | 4,277 | | | | | | 4,561 | |
|
Southern California Edison Co. | |
| | | | | 11 | | | | | | 10 | |
|
| |
| | | | | 975 | | | | | | 859 | |
| | | | | | | | | | | | |
| | | | | | | | | | | 336,848 | |
| | | | | | | | | | | | |
Total Corporate Bonds & Notes (Cost $2,563,661) | | | | |
| | | | |
| |
CONVERTIBLE BONDS & NOTES 1.2% | |
| |
| |
| | | | |
Corestate Capital Holding SA | | | | | | | | | | | | |
| | EUR | | | 9,900 | | | | | | 2,699 | |
|
| |
| | $ | | | 7,700 | | | | | | 6,786 | |
| | | | | | | | | | | | |
| | | | | | | | | | | 9,485 | |
| | | | | | | | | | | | |
| |
| |
|
Multiplan Corp. (6.000% Cash or 7.000% PIK) | |
6.000% due 10/15/2027 (c) | | | | | 33,700 | | | | | | 27,853 | |
|
| |
0.000% due 02/01/2026 (g) | | | | | 21,000 | | | | | | 17,300 | |
| | | | | | | | | | | | |
| | | | | | | | | | | 45,153 | |
| | | | | | | | | | | | |
Total Convertible Bonds & Notes (Cost $69,818) | | | | |
| | | | |
| | | | | | | | | | | | |
| | | | | PRINCIPAL
AMOUNT
(000S) | | | | | MARKET
VALUE
(000S) | |
MUNICIPAL BONDS & NOTES 1.4% | |
| |
| |
|
Chicago, Illinois General Obligation Bonds, Series 2015 | |
| | $ | | | 165 | | | $ | | | 177 | |
|
Chicago, Illinois General Obligation Bonds, Series 2017 | |
| | | | | 480 | | | | | | 508 | |
| | | | | | | | | | | | |
| | | | | | | | | | | 685 | |
| | | | | | | | | | | | |
| |
| |
|
Commonwealth of Puerto Rico Bonds, Series 2022 | |
0.000% due 11/01/2043 (g) | | | | | 40,350 | | | | | | 20,124 | |
0.000% due 11/01/2051 (g) | | | | | 10,800 | | | | | | 4,658 | |
|
Commonwealth of Puerto Rico General Obligation Bonds, Series 2021 | |
0.000% due 07/01/2033 (g) | | | | | 2,397 | | | | | | 1,350 | |
| | | | | 1,863 | | | | | | 1,711 | |
| | | | | 1,674 | | | | | | 1,504 | |
| | | | | 1,437 | | | | | | 1,275 | |
| | | | | 1,300 | | | | | | 1,129 | |
|
Commonwealth of Puerto Rico General Obligation Notes, Series 2021 | |
0.000% due 07/01/2024 (g) | | | | | 958 | | | | | | 877 | |
| | | | | 2,080 | | | | | | 2,118 | |
| | | | | | | | | | | | |
| | | | | | | | | | | 34,746 | |
| | | | | | | | | | | | |
| |
| |
|
Tobacco Settlement Finance Authority, West Virginia Revenue Bonds, Series 2007 | |
0.000% due 06/01/2047 (g) | | | | | 355,485 | | | | | | 28,796 | |
| | | | | | | | | | | | |
Total Municipal Bonds & Notes (Cost $71,393) | | | | |
| | | | |
| |
U.S. GOVERNMENT AGENCIES 2.4% | |
|
| |
1.032% due 08/25/2043 ~(a) | | | | | 23,254 | | | | | | 766 | |
1.734% due 10/25/2060 ~(a) | | | | | 26,492 | | | | | | 1,639 | |
3.000% due 01/25/2042 (a) | | | | | 172 | | | | | | 12 | |
3.500% due 08/25/2032 - 06/25/2050 (a) | | | | | 19,411 | | | | | | 3,768 | |
4.000% due 06/25/2050 (a) | | | | | 11,578 | | | | | | 2,267 | |
4.296% due 07/25/2041 •(a) | | | | | 2,172 | | | | | | 236 | |
4.376% (US0001M + 6.000%) due 08/25/2038 ~(a) | | | | | 421 | | | | | | 41 | |
4.426% due 08/25/2049 •(a) | | | | | 200 | | | | | | 29 | |
4.426% (US0001M + 6.050%) due 07/25/2059 ~(a) | | | | | 7,606 | | | | | | 1,315 | |
4.446% due 10/25/2040 •(a) | | | | | 2,639 | | | | | | 207 | |
4.500% due 04/25/2042 (a) | | | | | 763 | | | | | | 112 | |
4.526% due 02/25/2043 •(a) | | | | | 1,714 | | | | | | 231 | |
4.726% (US0001M + 6.350%) due 12/25/2037 ~(a) | | | | | 64 | | | | | | 7 | |
4.896% due 09/25/2037 •(a) | | | | | 372 | | | | | | 38 | |
4.976% (US0001M + 6.600%) due 03/25/2040 ~(a) | | | | | 2,290 | | | | | | 162 | |
5.000% due 01/25/2048 - 06/25/2050 (a) | | | | | 5,926 | | | | | | 1,293 | |
5.016% (US0001M + 6.640%) due 12/25/2036 ~(a) | | | | | 1,539 | | | | | | 203 | |
5.026% due 11/25/2036 •(a) | | | | | 47 | | | | | | 4 | |
5.096% (US0001M + 6.720%) due 06/25/2037 ~(a) | | | | | 165 | | | | | | 16 | |
| | | | | 1,202 | | | | | | 1,041 | |
5.356% due 03/25/2038 •(a) | | | | | 946 | | | | | | 124 | |
5.376% due 02/25/2038 •(a) | | | | | 547 | | | | | | 79 | |
5.476% (US0001M + 7.100%) due 06/25/2023 ~(a) | | | | | 104 | | | | | | 2 | |
| | | | | 9,180 | | | | | | 9,816 | |
8.722% (US0001M + 12.375%) due 01/25/2041 ~ | | | | | 4,290 | | | | | | 4,506 | |
|
| |
0.700% due 11/25/2055 ~(a) | | | | | 266,425 | | | | | | 22,612 | |
2.079% due 11/25/2045 ~(a) | | | | | 75,137 | | | | | | 6,932 | |
3.000% due 06/25/2050 (a) | | | | | 12,447 | | | | | | 2,492 | |
3.471% due 11/15/2048 •(a) | | | | | 42,695 | | | | | | 2,111 | |
3.500% due 07/25/2050 (a) | | | | | 27,180 | | | | | | 5,737 | |
| | | | | | | | | | | | |
| | | | | PRINCIPAL
AMOUNT
(000S) | | | | | MARKET
VALUE
(000S) | |
4.000% due 03/15/2027 - 07/25/2050 (a) | | $ | | | 21,305 | | | $ | | | 4,644 | |
4.476% due 06/25/2050 •(a) | | | | | 1,224 | | | | | | 175 | |
4.500% due 06/25/2050 (a) | | | | | 2,538 | | | | | | 455 | |
4.526% due 05/25/2050 •(a) | | | | | 8,700 | | | | | | 1,298 | |
4.626% (US0001M + 5.950%) due 04/15/2039 ~(a) | | | | | 1,344 | | | | | | 217 | |
4.826% (US0001M + 6.150%) due 01/15/2047 ~(a) | | | | | 303 | | | | | | 48 | |
4.876% due 09/15/2042 •(a) | | | | | 685 | | | | | | 66 | |
4.976% due 05/15/2037 •(a) | | | | | 969 | | | | | | 128 | |
5.000% due 05/25/2048 (a) | | | | | 7,856 | | | | | | 1,313 | |
5.086% due 05/15/2037 •(a) | | | | | 80 | | | | | | 9 | |
5.146% due 07/15/2036 •(a) | | | | | 1,223 | | | | | | 152 | |
5.256% due 09/15/2036 •(a) | | | | | 383 | | | | | | 51 | |
5.276% due 05/15/2041 •(a) | | | | | 792 | | | | | | 135 | |
5.374% due 01/25/2051 •(a) | | | | | 9,757 | | | | | | 2,024 | |
5.376% due 04/15/2036 •(a) | | | | | 329 | | | | | | 29 | |
6.456% (US0001M + 7.780%) due 09/15/2036 ~(a) | | | | | 686 | | | | | | 113 | |
| | | | | 8,600 | | | | | | 8,880 | |
10.624% (US0001M + 9.000%) due 03/25/2029 ~ | | | | | 6,856 | | | | | | 6,923 | |
11.365% (US0001M + 14.550%) due 09/15/2041 ~ | | | | | 602 | | | | | | 610 | |
| | | | | 1,483 | | | | | | 1,560 | |
| | | | | 5,402 | | | | | | 5,446 | |
|
| |
2.500% due 09/20/2036 (a) | | | | | 56,661 | | | | | | 5,130 | |
3.500% due 06/20/2042 (a) | | | | | 224 | | | | | | 41 | |
4.505% due 12/20/2048 •(a) | | | | | 3,556 | | | | | | 396 | |
4.525% (US0001M + 6.120%) due 08/20/2042 ~(a) | | | | | 1,605 | | | | | | 230 | |
4.655% due 12/20/2040 •(a) | | | | | 1,261 | | | | | | 110 | |
5.191% due 08/16/2039 •(a) | | | | | 217 | | | | | | 3 | |
| | | | | | | | | | | | |
Total U.S. Government Agencies (Cost $108,816) | | | | |
| | | | |
| |
NON-AGENCY MORTGAGE-BACKED SECURITIES 37.3% | |
|
| |
| | | | | 3,826 | | | | | | 3,211 | |
|
280 Park Avenue Mortgage Trust | |
| | | | | 2,500 | | | | | | 2,323 | |
|
Adjustable Rate Mortgage Trust | |
| | | | | 3,632 | | | | | | 2,416 | |
1.924% (US0001M + 0.300%) due 03/25/2037 ~ | | | | | 840 | | | | | | 891 | |
| | | | | 1,454 | | | | | | 1,312 | |
| | | | | 898 | | | | | | 693 | |
|
American Home Mortgage Assets Trust | |
| | | | | 596 | | | | | | 557 | |
| | | | | 8,858 | | | | | | 8,221 | |
|
American Home Mortgage Investment Trust | |
| | | | | 2,674 | | | | | | 1,146 | |
| | | | | 3,116 | | | | | | 2,813 | |
| | | | | 9,739 | | | | | | 9,086 | |
| | | | | 4,653 | | | | | | 982 | |
|
| |
| | | | | 2,103 | | | | | | 101 | |
|
ASG Resecuritization Trust | |
| | | | | 9,853 | | | | | | 8,075 | |
| | | | | 26,908 | | | | | | 15,510 | |
|
Ashford Hospitality Trust | |
| | | | | 6,800 | | | | | | 6,216 | |
|
Austin Fairmont Hotel Trust | |
| | | | | 5,000 | | | | | | 4,595 | |
|
| |
0.000% due 09/20/2048 (b)(g) | | GBP | | | 28,441 | | | | | | 30,268 | |
| | | | | 10 | | | | | | 32,127 | |
| | | | | 20,316 | | | | | | 24,176 | |
| | | | | 8,126 | | | | | | 9,588 | |
|
BAMLL Commercial Mortgage Securities Trust | |
| | $ | | | 7,579 | | | | | | 7,419 | |
| | | | | 6,728 | | | | | | 6,427 | |
|
Banc of America Alternative Loan Trust | |
| | | | | 323 | | | | | | 242 | |
| | | | | | | | | | | | |
| | | | | PRINCIPAL
AMOUNT
(000S) | | | | | MARKET
VALUE
(000S) | |
5.016% due 06/25/2037 ^•(a) | | $ | | | 348 | | | $ | | | 41 | |
| | | | | 117 | | | | | | 102 | |
| | | | | 52 | | | | | | 47 | |
| | | | | 817 | | | | | | 714 | |
|
Banc of America Funding Corp. | |
| | | | | 5,941 | | | | | | 5,145 | |
|
Banc of America Funding Trust | |
| | | | | 2,097 | | | | | | 1,920 | |
| | | | | 27,297 | | | | | | 7,578 | |
| | | | | 2,685 | | | | | | 2,395 | |
| | | | | 491 | | | | | | 315 | |
| | | | | 5,226 | | | | | | 4,891 | |
2.044% (US0001M + 0.420%) due 04/25/2037 ^~ | | | | | 1,036 | | | | | | 984 | |
| | | | | 3,970 | | | | | | 3,920 | |
| | | | | 30 | | | | | | 30 | |
| | | | | 126 | | | | | | 125 | |
| | | | | 1,350 | | | | | | 1,249 | |
| | | | | 827 | | | | | | 804 | |
| | | | | 194 | | | | | | 164 | |
| | | | | 1,049 | | | | | | 970 | |
| | | | | 92 | | | | | | 83 | |
| | | | | 400 | | | | | | 300 | |
| | | | | 2,956 | | | | | | 2,408 | |
| | | | | 9,134 | | | | | | 3,478 | |
12.358% due 10/20/2046 ^~ | | | | | 317 | | | | | | 267 | |
|
Banc of America Mortgage Trust | |
| | | | | 128 | | | | | | 112 | |
| | | | | 174 | | | | | | 165 | |
| | | | | 715 | | | | | | 611 | |
| | | | | 667 | | | | | | 547 | |
| | | | | 87 | | | | | | 75 | |
|
Bancorp Commercial Mortgage Trust | |
| | | | | 6,720 | | | | | | 6,673 | |
|
Bayview Commercial Asset Trust | |
| | | | | 176 | | | | | | 161 | |
|
| |
| | | | | 12,662 | | | | | | 10,381 | |
| | | | | 4,364 | | | | | | 3,589 | |
| | | | | 9,368 | | | | | | 8,256 | |
| | | | | 5,818 | | | | | | 5,166 | |
| | | | | 2,622 | | | | | | 2,418 | |
| | | | | 4,215 | | | | | | 4,010 | |
| | | | | 7,021 | | | | | | 5,913 | |
| | | | | 3,621 | | | | | | 2,705 | |
| | | | | 1,749 | | | | | | 1,656 | |
| | | | | 887 | | | | | | 717 | |
| | | | | 836 | | | | | | 688 | |
| | | | | 2,321 | | | | | | 2,019 | |
| | | | | 5,354 | | | | | | 4,538 | |
| | | | | 445 | | | | | | 403 | |
| | | | | 10,515 | | | | | | 7,050 | |
| | | | | 1,929 | | | | | | 1,744 | |
| | | | | 2,335 | | | | | | 1,937 | |
| | | | | 1,767 | | | | | | 1,538 | |
| | | | | 18,776 | | | | | | 5,424 | |
|
Bear Stearns Adjustable Rate Mortgage Trust | |
| | | | | 13 | | | | | | 11 | |
| | | | | 38 | | | | | | 34 | |
| | | | | 147 | | | | | | 135 | |
| | | | | 181 | | | | | | 155 | |
| | | | | 354 | | | | | | 335 | |
| | | | | 1,474 | | | | | | 1,384 | |
|
| |
1.944% (US0001M + 0.320%) due 06/25/2046 ^~ | | | | | 1,364 | | | | | | 1,199 | |
1.964% (US0001M + 0.340%) due 08/25/2036 ^~ | | | | | 16,135 | | | | | | 14,051 | |
| | | | | 2,822 | | | | | | 2,622 | |
| | | | | 4,444 | | | | | | 6,000 | |
| | | | | 199 | | | | | | 196 | |
2.749% (US0001M + 1.125%) due 01/25/2035 ~ | | | | | 982 | | | | | | 1,022 | |
2.749% (US0001M + 1.125%) due 03/25/2035 ~ | | | | | 5,827 | | | | | | 6,782 | |
| | | | | 167 | | | | | | 160 | |
| | | | | 32 | | | | | | 25 | |
| | | | | 167 | | | | | | 146 | |
| | | | | 1,447 | | | | | | 924 | |
| | | | | | | | | | | | | |
| See Accompanying Notes | | | | | | | | | | JUNE 30, 2022 | | | |
| | | | | | | | | |
Consolidated Schedule of Investments | | PIMCO Dynamic Income Fund | | | | | | |
| | | | | | | | | | | | | |
| | | | | | | | | | | |
| | $ | | | 2,765 | | | $ | | | 2,041 | |
| | | | | 10,917 | | | | | | 7,678 | |
| | | | | 4,637 | | | | | | 3,636 | |
| | | | | 7,970 | | | | | | 3,683 | |
| | | | | 3,522 | | | | | | 2,205 | |
| | | | | 1,748 | | | | | | 1,072 | |
| | | | | 348 | | | | | | 323 | |
| | | | | 54,709 | | | | | | 30,428 | |
| | | | | 300 | | | | | | 173 | |
| | | | | 227 | | | | | | 174 | |
| |
Bear Stearns Mortgage Funding Trust | |
| | | | | 602 | | | | | | 602 | |
| |
| |
4.774% (US0001M + 3.450%) due 03/15/2036 ~ | | | | | 6,000 | | | | | | 5,746 | |
| |
Beneria Cowen & Pritzer Collateral Funding Corp. | |
| | | | | 11,100 | | | | | | 10,335 | |
| |
| |
| | | | | 7,850 | | | | | | 6,531 | |
| |
| |
| | | | | 1,010 | | | | | | 922 | |
| | | | | 7,993 | | | | | | 7,343 | |
4.244% (US0001M + 2.920%) due 05/15/2030 ~ | | | | | 5,500 | | | | | | 5,162 | |
4.474% (US0001M + 3.150%) due 07/15/2034 ~ | | | | | 15,090 | | | | | | 14,823 | |
| |
CBA Commercial Small Balance Commercial Mortgage | |
| | | | | 385 | | | | | | 353 | |
| |
| |
| | | | | 1,536 | | | | | | 1,399 | |
| |
Chase Mortgage Finance Trust | |
| | | | | 4,011 | | | | | | 3,499 | |
| | | | | 1,129 | | | | | | 1,079 | |
| | | | | 536 | | | | | | 316 | |
| |
Citigroup Commercial Mortgage Trust | |
| | | | | 10,762 | | | | | | 4,798 | |
| |
Citigroup Global Markets Mortgage Securities, Inc. | |
| | | | | 139 | | | | | | 134 | |
| |
Citigroup Mortgage Loan Trust | |
| | | | | 1,874 | | | | | | 966 | |
| | | | | 126 | | | | | | 118 | |
| | | | | 182 | | | | | | 174 | |
| | | | | 1,915 | | | | | | 1,188 | |
| | | | | 2,063 | | | | | | 1,792 | |
| | | | | 373 | | | | | | 320 | |
| | | | | 5,677 | | | | | | 5,278 | |
| | | | | 1,222 | | | | | | 1,171 | |
| | | | | 608 | | | | | | 583 | |
| | | | | 6,115 | | | | | | 5,862 | |
| | | | | 2,533 | | | | | | 2,307 | |
| | | | | 1,996 | | | | | | 1,203 | |
| | | | | 4,348 | | | | | | 2,723 | |
| | | | | 961 | | | | | | 629 | |
| |
Citigroup Mortgage Loan Trust, Inc. | |
| | | | | 246 | | | | | | 231 | |
| |
Colony Mortgage Capital Ltd. | |
4.741% (US0001M + 3.417%) due 11/15/2038 ~(m) | | | | | 14,200 | | | | | | 13,070 | |
| |
| |
| | | | | 4,900 | | | | | | 4,385 | |
| |
Commercial Mortgage Lease-Backed Certificates | |
| | | | | 6,007 | | | | | | 5,893 | |
| |
Commercial Mortgage Loan Trust | |
| | | | | 6,904 | | | | | | 1,183 | |
| |
Commercial Mortgage Trust | |
| | | | | 10,004 | | | | | | 9,573 | |
| | | | | 4,688 | | | | | | 3,753 | |
| | | | | 5,000 | | | | | | 4,825 | |
7.325% (US0001M + 6.000%) due 12/15/2038 ~ | | | | | 3,360 | | | | | | 3,221 | |
| |
Connecticut Avenue Securities Trust | |
| | | | | 2,600 | | | | | | 2,194 | |
| | | | | 1,400 | | | | | | 1,313 | |
6.426% (SOFR30A + 5.500%) due 12/25/2041 ~ | | | | | 1,200 | | | | | | 990 | |
| | | | | 3,600 | | | | | | 3,028 | |
| | | | | | | | | | | | | |
| | | | | | | | | | | |
| | $ | | | 550 | | | $ | | | 543 | |
10.426% (SOFR30A + 9.500%) due 03/25/2042 ~ | | | | | 3,400 | | | | | | 3,138 | |
| | | | | 600 | | | | | | 577 | |
| |
Countrywide Alternative Loan Resecuritization Trust | |
| | | | | 5,119 | | | | | | 1,265 | |
| |
Countrywide Alternative Loan Trust | |
0.802% due 12/25/2035 ~(a)(b) | | | | | 8,561 | | | | | | 308 | |
1.326% (12MTA + 0.850%) due 11/25/2046 ~ | | | | | 2,653 | | | | | | 2,284 | |
1.721% due 12/25/2035 ~(a)(b) | | | | | 3,608 | | | | | | 223 | |
1.786% (12MTA + 1.310%) due 07/20/2035 ^~ | | | | | 5,513 | | | | | | 4,628 | |
| | | | | 458 | | | | | | 371 | |
1.874% (US0001M + 0.250%) due 06/25/2037 ^~ | | | | | 569 | | | | | | 469 | |
| | | | | 1,199 | | | | | | 399 | |
1.974% (US0001M + 0.350%) due 08/25/2036 ^~ | | | | | 838 | | | | | | 435 | |
| | | | | 8,180 | | | | | | 7,661 | |
| | | | | 6,126 | | | | | | 5,501 | |
2.044% (US0001M + 0.420%) due 08/25/2047 ^~ | | | | | 908 | | | | | | 807 | |
| | | | | 5,506 | | | | | | 3,114 | |
| | | | | 8,711 | | | | | | 8,570 | |
| | | | | 6,155 | | | | | | 5,103 | |
| | | | | 8,566 | | | | | | 7,318 | |
| | | | | 101 | | | | | | 93 | |
| | | | | 2,528 | | | | | | 1,583 | |
| | | | | 113 | | | | | | 89 | |
| | | | | 518 | | | | | | 363 | |
| | | | | 91 | | | | | | 78 | |
3.084% (US0001M + 1.460%) due 11/25/2035 ~ | | | | | 8,746 | | | | | | 8,151 | |
| | | | | 2,941 | | | | | | 2,675 | |
| | | | | 759 | | | | | | 471 | |
| | | | | 127 | | | | | | 98 | |
| | | | | 341 | | | | | | 238 | |
| | | | | 1,502 | | | | | | 1,034 | |
| | | | | 734 | | | | | | 453 | |
| | | | | 68 | | | | | | 64 | |
| | | | | 936 | | | | | | 651 | |
| | | | | 877 | | | | | | 686 | |
| | | | | 2,850 | | | | | | 2,503 | |
| | | | | 925 | | | | | | 812 | |
| | | | | 1,592 | | | | | | 979 | |
5.526% due 07/25/2036 •(a) | | | | | 7,262 | | | | | | 1,386 | |
| | | | | 140 | | | | | | 91 | |
| | | | | 149 | | | | | | 77 | |
| | | | | 8,241 | | | | | | 5,293 | |
| | | | | 1,090 | | | | | | 980 | |
| | | | | 293 | | | | | | 164 | |
| | | | | 325 | | | | | | 77 | |
| | | | | 491 | | | | | | 267 | |
| | | | | 189 | | | | | | 115 | |
| | | | | 244 | | | | | | 160 | |
| | | | | 233 | | | | | | 155 | |
| | | | | 154 | | | | | | 79 | |
| | | | | 1,597 | | | | | | 1,317 | |
| | | | | 2,164 | | | | | | 980 | |
| | | | | 11,179 | | | | | | 5,450 | |
| | | | | 9,099 | | | | | | 4,829 | |
| | | | | 7,760 | | | | | | 3,355 | |
6.250% (US0001M + 0.650%) due 12/25/2036 ^~ | | | | | 507 | | | | | | 260 | |
| | | | | 76 | | | | | | 73 | |
| | | | | 320 | | | | | | 185 | |
| | | | | 8,333 | | | | | | 3,276 | |
| | | | | 66 | | | | | | 69 | |
29.259% due 05/25/2037 ^• | | | | | 667 | | | | | | 801 | |
| |
Countrywide Home Loan Mortgage Pass-Through Trust | |
2.224% (US0001M + 0.600%) due 03/25/2035 ~ | | | | | 146 | | | | | | 108 | |
| | | | | 567 | | | | | | 327 | |
| | | | | 859 | | | | | | 772 | |
| | | | | 950 | | | | | | 801 | |
| | | | | 5,708 | | | | | | 5,171 | |
| | | | | 20 | | | | | | 19 | |
| | | | | 33 | | | | | | 31 | |
| | | | | 2,633 | | | | | | 2,375 | |
| | | | | | | | | | | | |
| | | | | PRINCIPAL
AMOUNT
(000S) | | | | | MARKET
VALUE
(000S) | |
| | $ | | | 341 | | | $ | | | 285 | |
| | | | | 684 | | | | | | 544 | |
| | | | | 28,191 | | | | | | 19,028 | |
| | | | | 3 | | | | | | 3 | |
| | | | | 1,349 | | | | | | 1,361 | |
| | | | | 21 | | | | | | 13 | |
| | | | | 53 | | | | | | 52 | |
| | | | | 31 | | | | | | 20 | |
| | | | | 25 | | | | | | 16 | |
| | | | | 145 | | | | | | 83 | |
| | | | | 3,202 | | | | | | 1,792 | |
| | | | | 1 | | | | | | 1 | |
|
Credit Suisse Commercial Mortgage Trust | |
| | | | | 10,300 | | | | | | 12,329 | |
|
Credit Suisse First Boston Mortgage Securities Corp. | |
| | | | | 247 | | | | | | 175 | |
7.500% due 05/25/2032 (m) | | | | | 763 | | | | | | 779 | |
|
Credit Suisse Mortgage Capital Certificates | |
| | | | | 34,800 | | | | | | 15,133 | |
| | | | | 3,170 | | | | | | 2,267 | |
| | | | | 3,648 | | | | | | 3,536 | |
| | | | | 10,613 | | | | | | 10,078 | |
| | | | | 7,763 | | | | | | 7,361 | |
| | | | | 17,522 | | | | | | 9,578 | |
| | | | | 2,409 | | | | | | 2,348 | |
| | | | | 2,405 | | | | | | 1,806 | |
| | | | | 7,541 | | | | | | 7,016 | |
| | | | | 8,379 | | | | | | 7,418 | |
| | | | | 4,484 | | | | | | 3,761 | |
| | | | | 5,916 | | | | | | 5,287 | |
| | | | | 13,113 | | | | | | 9,960 | |
| | | | | 14,482 | | | | | | 3,819 | |
| | | | | 2,940 | | | | | | 1,436 | |
|
Credit Suisse Mortgage Capital Mortgage-Backed Trust | |
| | | | | 407 | | | | | | 61 | |
| | | | | 1,855 | | | | | | 1,114 | |
| | | | | 4,991 | | | | | | 2,951 | |
| | | | | 2,734 | | | | | | 1,219 | |
|
Credit Suisse Mortgage Capital Trust | |
| | | | | 15,850 | | | | | | 14,941 | |
| | | | | 13,700 | | | | | | 12,884 | |
| | | | | 11,226 | | | | | | 3,429 | |
|
| |
4.475% (US0001M + 3.150%) due 10/15/2036 ~ | | | | | 26,404 | | | | | | 25,232 | |
|
| |
| | | | | 9,980 | | | | | | 3,543 | |
|
| |
| | GBP | | | 15,000 | | | | | | 5,954 | |
|
Deutsche ALT-A Securities, Inc. Mortgage Loan Trust | |
| | $ | | | 4,296 | | | | | | 3,020 | |
|
Deutsche ALT-A Securities, Inc. Mortgage Loan Trust | |
1.774% (US0001M + 0.150%) due 02/25/2047 ~ | | | | | 338 | | | | | | 217 | |
| | | | | 384 | | | | | | 342 | |
|
Deutsche ALT-B Securities, Inc. Mortgage Loan Trust | |
| | | | | 42 | | | | | | 37 | |
|
Deutsche Mortgage Securities, Inc. Mortgage Loan Trust | |
| | | | | 70 | | | | | | 66 | |
|
| |
| | | | | 20,000 | | | | | | 15,061 | |
|
Downey Savings & Loan Association Mortgage Loan Trust | |
| | | | | 221 | | | | | | 249 | |
|
| |
| | EUR | | | 9,160 | | | | | | 9,526 | |
|
| |
| | GBP | | | 6 | | | | | | 5,160 | |
| | EUR | | | 7,067 | | | | | | 6,367 | |
2.840% (BP0003M + 1.250%) due 06/13/2045 ~ | | GBP | | | 16,377 | | | | | | 18,092 | |
3.190% (BP0003M + 1.600%) due 09/13/2045 ~ | | | | | 15,554 | | | | | | 17,804 | |
3.340% (BP0003M + 1.750%) due 06/13/2045 ~ | | | | | 10,086 | | | | | | 10,789 | |
| | | | | | |
| 80 | | PIMCO CLOSED-END FUNDS | | | See Accompanying Notes | |
| | | | | | | | | | | | |
| | | | | PRINCIPAL
AMOUNT
(000S) | | | | | MARKET
VALUE
(000S) | |
| | GBP | | | 11,113 | | | $ | | | 12,784 | |
5.090% (BP0003M + 3.500%) due 06/13/2045 ~ | | | | | 3,586 | | | | | | 4,128 | |
| | | | | 9,266 | | | | | | 11,134 | |
|
Extended Stay America Trust | |
| | $ | | | 45,619 | | | | | | 43,985 | |
|
| |
| | GBP | | | 1,000 | | | | | | 1,219 | |
|
First Horizon Alternative Mortgage Securities Trust | |
| | $ | | | 366 | | | | | | 56 | |
| | | | | 550 | | | | | | 484 | |
| | | | | 495 | | | | | | 376 | |
| | | | | 34 | | | | | | 27 | |
5.476% (US0001M + 7.100%) due 11/25/2036 ~(a) | | | | | 767 | | | | | | 142 | |
| | | | | 58 | | | | | | 24 | |
|
First Horizon Mortgage Pass-Through Trust | |
| | | | | 2,268 | | | | | | 1,036 | |
| | | | | 238 | | | | | | 168 | |
| | | | | 15 | | | | | | 10 | |
| | | | | 213 | | | | | | 93 | |
|
| |
3.564% due 11/25/2061 ~(a) | | | | | 4,499 | | | | | | 1,703 | |
4.276% due 09/25/2041 •(m) | | | | | 6,000 | | | | | | 5,062 | |
| | | | | 3,900 | | | | | | 3,365 | |
4.676% (SOFR30A + 3.750%) due 02/25/2042 ~ | | | | | 16,000 | | | | | | 14,431 | |
| | | | | 7,800 | | | | | | 6,902 | |
| | | | | 2,300 | | | | | | 1,803 | |
| | | | | 2,500 | | | | | | 2,534 | |
| | | | | 6,400 | | | | | | 5,134 | |
7.926% (SOFR30A + 7.000%) due 12/25/2041 ~ | | | | | 500 | | | | | | 407 | |
| | | | | 4,900 | | | | | | 4,226 | |
| | | | | 2,350 | | | | | | 2,036 | |
|
GC Pastor Hipotecario FTA | |
0.001% (EUR003M + 0.170%) due 06/21/2046 ~ | | EUR | | | 22,994 | | | | | | 21,571 | |
|
GMAC Mortgage Corp. Loan Trust | |
| | $ | | | 23 | | | | | | 21 | |
|
GreenPoint Mortgage Funding Trust | |
1.804% (US0001M + 0.180%) due 01/25/2037 ~ | | | | | 573 | | | | | | 506 | |
2.024% (US0001M + 0.400%) due 12/25/2046 ^~ | | | | | 2,801 | | | | | | 2,602 | |
|
GS Mortgage Securities Corp. Trust | |
| | | | | 39,357 | | | | | | 37,725 | |
|
GS Mortgage Securities Trust | |
0.583% due 08/10/2043 ~(a) | | | | | 1,037 | | | | | | 8 | |
|
GS Mortgage-Backed Securities Trust | |
0.000% due 07/25/2059 (b)(g) | | | | | 131 | | | | | | 126 | |
0.000% due 07/25/2059 ~(a) | | | | | 146,638 | | | | | | 1,416 | |
0.090% due 07/25/2059 ~(a) | | | | | 132,446 | | | | | | 471 | |
| | | | | 20,073 | | | | | | 15,477 | |
|
GSC Capital Corp. Mortgage Trust | |
| | | | | 1,364 | | | | | | 1,296 | |
|
| |
2.074% (US0001M + 0.450%) due 07/25/2037 ^~ | | | | | 235 | | | | | | 49 | |
| | | | | 128 | | | | | | 80 | |
| | | | | 9 | | | | | | 8 | |
| | | | | 328 | | | | | | 325 | |
| | | | | 269 | | | | | | 267 | |
| | | | | 610 | | | | | | 275 | |
|
HarborView Mortgage Loan Trust | |
| | | | | 841 | | | | | | 721 | |
| | | | | 1,236 | | | | | | 1,082 | |
| | | | | 947 | | | | | | 490 | |
| | | | | 7,668 | | | | | | 7,310 | |
2.112% (US0001M + 0.500%) due 01/19/2036 ~ | | | | | 4,508 | | | | | | 2,883 | |
| | | | | 89 | | | | | | 83 | |
| | | | | 118 | | | | | | 101 | |
| | | | | 4,588 | | | | | | 4,286 | |
2.962% (US0001M + 1.350%) due 06/20/2035 ~ | | | | | 1,059 | | | | | | 977 | |
| | | | | 72 | | | | | | 65 | |
| | | | | | | | | | | | |
| | | | | PRINCIPAL
AMOUNT
(000S) | | | | | MARKET
VALUE
(000S) | |
|
| |
| | $ | | | 97 | | | $ | | | 83 | |
| | | | | 2,929 | | | | | | 2,723 | |
|
HSI Asset Loan Obligation Trust | |
| | | | | 2,575 | | | | | | 2,288 | |
|
IM Pastor Fondo de Titluzacion Hipotecaria | |
| | EUR | | | 17,691 | | | | | | 16,235 | |
|
IM Pastor Fondo de Titulizacion de Activos | |
| | | | | 819 | | | | | | 771 | |
|
| |
| | $ | | | 122 | | | | | | 111 | |
| | | | | 81 | | | | | | 76 | |
|
Impac Secured Assets Trust | |
| | | | | 2 | | | | | | 2 | |
|
IndyMac IMSC Mortgage Loan Trust | |
| | | | | 2,913 | | | | | | 2,145 | |
|
IndyMac INDA Mortgage Loan Trust | |
| | | | | 19 | | | | | | 17 | |
| | | | | 469 | | | | | | 418 | |
|
IndyMac INDX Mortgage Loan Trust | |
| | | | | 118 | | | | | | 114 | |
| | | | | 2,302 | | | | | | 1,598 | |
2.024% (US0001M + 0.400%) due 11/25/2046 ~ | | | | | 3,738 | | | | | | 3,584 | |
2.084% (US0001M + 0.460%) due 04/25/2035 ~ | | | | | 42 | | | | | | 39 | |
| | | | | 342 | | | | | | 254 | |
| | | | | 121 | | | | | | 107 | |
| | | | | 213 | | | | | | 192 | |
| | | | | 149 | | | | | | 127 | |
| | | | | 216 | | | | | | 198 | |
| | | | | 2,578 | | | | | | 2,358 | |
| | | | | 1,782 | | | | | | 1,529 | |
| | | | | 615 | | | | | | 576 | |
| | | | | 642 | | | | | | 608 | |
|
| |
| | | | | 3,900 | | | | | | 2,926 | |
|
Jefferies Resecuritization Trust | |
| | | | | 3,568 | | | | | | 1,285 | |
|
JP Morgan Alternative Loan Trust | |
| | | | | 5,353 | | | | | | 4,172 | |
| | | | | 23,261 | | | | | | 10,688 | |
| | | | | 115 | | | | | | 111 | |
| | | | | 618 | | | | | | 404 | |
| | | | | 8 | | | | | | 4 | |
| | | | | 557 | | | | | | 440 | |
| | | | | 2,837 | | | | | | 2,743 | |
| | | | | 13,281 | | | | | | 6,738 | |
|
JP Morgan Chase Commercial Mortgage Securities Trust | |
| | | | | 2,500 | | | | | | 2,344 | |
| | | | | 11,300 | | | | | | 10,551 | |
| | | | | 720 | | | | | | 701 | |
| | | | | 19,700 | | | | | | 18,594 | |
|
| |
| | | | | 378 | | | | | | 296 | |
| | | | | 15 | | | | | | 12 | |
| | | | | 27 | | | | | | 26 | |
| | | | | 212 | | | | | | 182 | |
| | | | | 1,894 | | | | | | 1,592 | |
| | | | | 347 | | | | | | 213 | |
|
JP Morgan Resecuritization Trust | |
| | | | | 478 | | | | | | 443 | |
| | | | | 1,191 | | | | | | 927 | |
| | | | | 4,092 | | | | | | 1,675 | |
|
Lansdowne Mortgage Securities PLC | |
| | EUR | | | 7,231 | | | | | | 6,857 | |
| | | | | 800 | | | | | | 652 | |
|
| |
| | $ | | | 7,337 | | | | | | 6,858 | |
| | | | | 3,741 | | | | | | 2,271 | |
|
| |
| | | | | 202 | | | | | | 147 | |
| | | | | 518 | | | | | | 460 | |
| | | | | 341 | | | | | | 224 | |
| | | | | 103 | | | | | | 119 | |
| | | | | | | | | | | | |
| | | | | PRINCIPAL
AMOUNT
(000S) | | | | | MARKET
VALUE
(000S) | |
| | $ | | | 528 | | | $ | | | 522 | |
| | | | | 3,150 | | | | | | 1,276 | |
| | | | | 31,154 | | | | | | 10,162 | |
|
| |
1.906% (US0001M + 0.900%) due 08/25/2047 ^~ | | | | | 256 | | | | | | 232 | |
2.184% (US0001M + 0.560%) due 07/25/2037 ~ | | | | | 22,485 | | | | | | 15,807 | |
| | | | | 3,395 | | | | | | 2,900 | |
|
| |
| | | | | 2,705 | | | | | | 2,597 | |
|
LUXE Commercial Mortgage Trust | |
4.574% (US0001M + 3.250%) due 10/15/2038 ~ | | | | | 5,211 | | | | | | 4,837 | |
|
MASTR Adjustable Rate Mortgages Trust | |
1.216% (12MTA + 0.740%) due 01/25/2047 ^~ | | | | | 67 | | | | | | 65 | |
2.304% (US0001M + 0.680%) due 05/25/2047 ^~ | | | | | 6,765 | | | | | | 5,756 | |
| | | | | 194 | | | | | | 182 | |
|
MASTR Alternative Loan Trust | |
| | | | | 20,011 | | | | | | 1,824 | |
| | | | | 26,450 | | | | | | 2,457 | |
|
| |
| | | | | 9,308 | | | | | | 8,687 | |
|
Merrill Lynch Alternative Note Asset Trust | |
| | | | | 2,450 | | | | | | 2,098 | |
|
Merrill Lynch Mortgage Investors Trust | |
| | | | | 7,016 | | | | | | 4,088 | |
| | | | | 1,932 | | | | | | 1,849 | |
|
| |
| | | | | 14,456 | | | | | | 13,981 | |
|
Morgan Stanley Capital Trust | |
| | | | | 18,590 | | | | | | 17,608 | |
| | | | | 18,000 | | | | | | 17,281 | |
| | | | | 19,500 | | | | | | 18,765 | |
|
Morgan Stanley Mortgage Loan Trust | |
| | | | | 335 | | | | | | 308 | |
| | | | | 151 | | | | | | 40 | |
| | | | | 634 | | | | | | 558 | |
| | | | | 192 | | | | | | 162 | |
| | | | | 1,874 | | | | | | 1,065 | |
| | | | | 186 | | | | | | 147 | |
| | | | | 1,870 | | | | | | 651 | |
| | | | | 143 | | | | | | 70 | |
|
Morgan Stanley Re-REMIC Trust | |
0.648% (US0001M + 0.230%) due 02/26/2037 ~ | | | | | 2,281 | | | | | | 2,173 | |
| | | | | 1,431 | | | | | | 1,409 | |
| | | | | 896 | | | | | | 865 | |
| | | | | 8,395 | | | | | | 8,220 | |
| | | | | 7,969 | | | | | | 7,849 | |
|
Morgan Stanley Resecuritization Trust | |
| | | | | 10,890 | | | | | | 8,250 | |
|
Mortgage Equity Conversion Asset Trust | |
| | | | | 4,920 | | | | | | 4,615 | |
|
| |
| | GBP | | | 1,000 | | | | | | 1,179 | |
|
Natixis Commercial Mortgage Securities Trust | |
| | $ | | | 8,574 | | | | | | 8,123 | |
5.325% (US0001M + 4.000%) due 11/15/2034 ~ | | | | | 3,718 | | | | | | 3,528 | |
|
New Residential Mortgage Loan Trust | |
| | | | | 8,300 | | | | | | 5,175 | |
|
| |
| | | | | 1,000 | | | | | | 906 | |
|
| |
| | EUR | | | 1,231 | | | | | | 1,179 | |
| | | | | 2,351 | | | | | | 2,184 | |
|
Nomura Resecuritization Trust | |
| | $ | | | 3,968 | | | | | | 3,563 | |
|
NovaStar Mortgage Funding Trust | |
| | | | | 181 | | | | | | 175 | |
|
PMT Credit Risk Transfer Trust | |
| | | | | 4,918 | | | | | | 4,806 | |
| | | | | | | | | | | | |
| See Accompanying Notes | | | ANNUAL REPORT | | | | | | | JUNE 30, 2022 | | | 81 |
| | | | | | | | |
Consolidated Schedule of Investments | | PIMCO Dynamic Income Fund | | | | | | |
| | | | | | | | | | | | |
| | | | | PRINCIPAL
AMOUNT
(000S) | | | | | MARKET
VALUE
(000S) | |
|
Preston Ridge Partners Mortgage | |
| | $ | | | 1,000 | | | $ | | | 961 | |
|
| |
| | | | | 3,900 | | | | | | 3,606 | |
|
| |
| | | | | 1,690 | | | | | | 1,187 | |
| | | | | 59 | | | | | | 53 | |
|
RBSSP Resecuritization Trust | |
| | | | | 13,872 | | | | | | 13,507 | |
| | | | | 3,116 | | | | | | 2,175 | |
| | | | | 3,737 | | | | | | 2,376 | |
| | | | | 3,542 | | | | | | 2,209 | |
| | | | | 445 | | | | | | 395 | |
|
| |
| | | | | 1 | | | | | | 1 | |
|
Residential Accredit Loans, Inc. Trust | |
| | | | | 3,138 | | | | | | 2,776 | |
| | | | | 353 | | | | | | 324 | |
| | | | | 7,156 | | | | | | 3,402 | |
2.004% (US0001M + 0.380%) due 05/25/2037 ~ | | | | | 7,736 | | | | | | 6,999 | |
2.044% (US0001M + 0.420%) due 06/25/2037 ~ | | | | | 787 | | | | | | 756 | |
| | | | | 120 | | | | | | 115 | |
| | | | | 48 | | | | | | 41 | |
| | | | | 697 | | | | | | 616 | |
| | | | | 1,479 | | | | | | 1,331 | |
| | | | | 166 | | | | | | 143 | |
| | | | | 3,222 | | | | | | 1,675 | |
| | | | | 1,595 | | | | | | 1,364 | |
| | | | | 245 | | | | | | 211 | |
| | | | | 2,422 | | | | | | 2,034 | |
| | | | | 887 | | | | | | 763 | |
| | | | | 5,206 | | | | | | 4,409 | |
|
Residential Asset Mortgage Products Trust | |
| | | | | 428 | | | | | | 303 | |
|
Residential Asset Securitization Trust | |
| | | | | 625 | | | | | | 427 | |
| | | | | 168 | | | | | | 89 | |
| | | | | 2,805 | | | | | | 1,133 | |
| | | | | 6,189 | | | | | | 2,816 | |
| | | | | 4,069 | | | | | | 1,277 | |
|
Residential Funding Mortgage Securities, Inc. Trust | |
| | | | | 125 | | | | | | 101 | |
| | | | | 60 | | | | | | 59 | |
| | | | | 450 | | | | | | 391 | |
| | | | | 177 | | | | | | 154 | |
|
| |
| | | | | 11,085 | | | | | | 10,564 | |
|
Seasoned Credit Risk Transfer Trust | |
| | | | | 4,530 | | | | | | 4,073 | |
| | | | | 1,500 | | | | | | 1,360 | |
| | | | | 700 | | | | | | 604 | |
| | | | | 6,801 | | | | | | 3,209 | |
| | | | | 500 | | | | | | 294 | |
| | | | | 1,199 | | | | | | 983 | |
| | | | | 1,600 | | | | | | 1,308 | |
|
| |
| | | | | 203 | | | | | | 181 | |
| | | | | 238 | | | | | | 218 | |
| | | | | 159 | | | | | | 3 | |
2.795% (US0001M + 1.200%) due 10/20/2027 ~ | | | | | 352 | | | | | | 323 | |
| | | | | 93 | | | | | | 77 | |
|
SG Commercial Mortgage Securities Trust | |
| | | | | 9,000 | | | | | | 7,798 | |
|
Starwood Mortgage Residential Trust | |
| | | | | 500 | | | | | | 360 | |
|
| |
| | | | | 9,724 | | | | | | 9,291 | |
| | | | | 6,612 | | | | | | 6,334 | |
|
Structured Adjustable Rate Mortgage Loan Trust | |
| | | | | 6,459 | | | | | | 4,860 | |
| | | | | 2,292 | | | | | | 670 | |
| | | | | 598 | | | | | | 398 | |
| | | | | 1,147 | | | | | | 630 | |
| | | | | | | | | | | | |
| | | | | PRINCIPAL
AMOUNT
(000S) | | | | | MARKET
VALUE
(000S) | |
|
Structured Asset Mortgage Investments Trust | |
1.964% (US0001M + 0.340%) due 03/25/2037 ^~ | | $ | | | 980 | | | $ | | | 295 | |
| | | | | 9,521 | | | | | | 7,398 | |
| | | | | 1,130 | | | | | | 915 | |
| | | | | 1,155 | | | | | | 1,096 | |
2.084% (US0001M + 0.460%) due 05/25/2045 ~ | | | | | 64 | | | | | | 58 | |
| | | | | 3,140 | | | | | | 1,814 | |
|
Structured Asset Securities Corp. Mortgage Pass-Through Certificates | |
| | | | | 83 | | | | | | 80 | |
|
SunTrust Adjustable Rate Mortgage Loan Trust | |
| | | | | 1,299 | | | | | | 1,148 | |
|
SunTrust Alternative Loan Trust | |
5.526% due 04/25/2036 ^•(a) | | | | | 4,003 | | | | | | 772 | |
|
TBW Mortgage-Backed Trust | |
| | | | | 212 | | | | | | 100 | |
| | | | | 18,324 | | | | | | 5,315 | |
|
TDA Mixto Fondo de Titulizacion de Activos | |
| | EUR | | | 8,673 | | | | | | 5,244 | |
0.000% (EUR003M + 0.190%) due 12/28/2050 ~ | | | | | 3,102 | | | | | | 2,564 | |
|
Tharaldson Hotel Portfolio Trust | |
4.600% (US0001M + 3.480%) due 11/11/2034 ~ | | $ | | | 2,530 | | | | | | 2,308 | |
|
| |
| | | | | 4,814 | | | | | | 4,092 | |
|
WaMu Mortgage Pass-Through Certificates Trust | |
| | | | | 1,834 | | | | | | 1,397 | |
| | | | | 12,158 | | | | | | 10,251 | |
| | | | | 233 | | | | | | 205 | |
1.473% (COF 11 + 1.250%) due 07/25/2047 ^~ | | | | | 395 | | | | | | 352 | |
| | | | | 2,851 | | | | | | 2,565 | |
2.164% (US0001M + 0.540%) due 07/25/2045 ~ | | | | | 117 | | | | | | 112 | |
| | | | | 27 | | | | | | 26 | |
2.464% (US0001M + 0.840%) due 06/25/2044 ~(m) | | | | | 91 | | | | | | 86 | |
| | | | | 109 | | | | | | 100 | |
| | | | | 1,060 | | | | | | 1,009 | |
| | | | | 257 | | | | | | 212 | |
| | | | | 1,135 | | | | | | 887 | |
| | | | | 210 | | | | | | 198 | |
| | | | | 546 | | | | | | 522 | |
| | | | | 695 | | | | | | 631 | |
| | | | | 1,777 | | | | | | 1,690 | |
|
Warwick Finance Residential Mortgages PLC | |
0.000% due 12/21/2049 (g) | | GBP | | | 0 | | | | | | 497 | |
| | | | | 646 | | | | | | 782 | |
| | | | | 646 | | | | | | 781 | |
|
Washington Mutual Mortgage Pass-Through Certificates Trust | |
| | $ | | | 276 | | | | | | 235 | |
1.446% (12MTA + 0.970%) due 06/25/2046 ~ | | | | | 5,814 | | | | | | 3,439 | |
| | | | | 8,014 | | | | | | 7,556 | |
2.224% (US0001M + 0.600%) due 07/25/2036 ^~ | | | | | 3,566 | | | | | | 2,376 | |
| | | | | 67 | | | | | | 65 | |
| | | | | 908 | | | | | | 870 | |
| | | | | 1,537 | | | | | | 1,385 | |
| | | | | 3,891 | | | | | | 3,538 | |
|
Wells Fargo Alternative Loan Trust | |
| | | | | 1,472 | | | | | | 1,319 | |
| | | | | 197 | | | | | | 184 | |
|
Wells Fargo Mortgage Loan Trust | |
| | | | | 3,495 | | | | | | 2,441 | |
| | | | | 4,014 | | | | | | 3,681 | |
|
Wells Fargo Mortgage-Backed Securities Trust | |
| | | | | 6 | | | | | | 5 | |
| | | | | 5 | | | | | | 5 | |
| | | | | 68 | | | | | | 61 | |
|
| |
| | | | | 5,000 | | | | | | 4,053 | |
| | | | | | | | | | | | |
Total Non-Agency Mortgage-Backed Securities (Cost $1,733,325) | | | | |
| | | | |
| | | | | | | | | | | | |
| | | | | | | | | | | |
ASSET-BACKED SECURITIES 36.3% | |
|
510 Loan Acquisition Trust | |
| | $ | | | 19,772 | | | $ | | | 19,298 | |
|
| |
| | | | | 8,856 | | | | | | 3,073 | |
|
ACE Securities Corp. Home Equity Loan Trust | |
| | | | | 22,023 | | | | | | 6,640 | |
| | | | | 5,024 | | | | | | 3,585 | |
2.719% (US0001M + 1.095%) due 07/25/2035 ^~ | | | | | 17,938 | | | | | | 15,390 | |
|
| |
| | EUR | | | 1,800 | | | | | | 705 | |
|
Aegis Asset-Backed Securities Trust Mortgage Pass-Through Certificates | |
| | $ | | | 740 | | | | | | 711 | |
|
AIM Aviation Finance Ltd. | |
| | | | | 2,164 | | | | | | 1,771 | |
|
American Money Management Corp. CLO Ltd. | |
| | | | | 6,100 | | | | | | 5,595 | |
|
Ameriquest Mortgage Securities, Inc. Asset-Backed Pass-Through Certificates | |
| | | | | 154 | | | | | | 149 | |
| | | | | 1,148 | | | | | | 1,150 | |
4.474% (US0001M + 2.850%) due 08/25/2032 ~ | | | | | 362 | | | | | | 355 | |
|
| |
| | | | | 7,926 | | | | | | 2,900 | |
| | | | | 6,706 | | | | | | 2,115 | |
1.864% (US0001M + 0.240%) due 04/25/2036 ~ | | | | | 1,071 | | | | | | 384 | |
| | | | | 3,775 | | | | | | 1,191 | |
| | | | | 10,573 | | | | | | 6,153 | |
|
Argent Securities, Inc. Asset-Backed Pass-Through Certificates | |
| | | | | 29,851 | | | | | | 25,210 | |
| | | | | 22,741 | | | | | | 18,517 | |
|
Asset-Backed Funding Certificates Trust | |
| | | | | 2,015 | | | | | | 1,967 | |
| | | | | 167 | | | | | | 159 | |
| | | | | 516 | | | | | | 496 | |
|
Banco Bilbao Vizcaya Argentaria | |
| | EUR | | | 602 | | | | | | 387 | |
|
Bear Stearns Asset-Backed Securities Trust | |
| | $ | | | 169 | | | | | | 162 | |
1.011% (US0001M + 0.500%) due 09/25/2034 ~ | | | | | 58 | | | | | | 56 | |
| | | | | 10,505 | | | | | | 13,815 | |
| | | | | 91 | | | | | | 90 | |
| | | | | 233 | | | | | | 214 | |
| | | | | 2,670 | | | | | | 1,655 | |
| | | | | 1 | | | | | | 2 | |
| | | | | 18,123 | | | | | | 17,346 | |
| | | | | 359 | | | | | | 259 | |
|
Bombardier Capital Mortgage Securitization Corp. | |
| | | | | 3,549 | | | | | | 599 | |
|
California Republic Auto Receivables Trust | |
0.000% due 04/15/2025 «(g) | | | | | 10,100 | | | | | | 11,144 | |
|
Carlyle Global Market Strategies CLO Ltd. | |
| | | | | 2,900 | | | | | | 989 | |
|
Carrington Mortgage Loan Trust | |
1.704% (US0001M + 0.080%) due 03/25/2035 ~ | | | | | 657 | | | | | | 547 | |
2.044% (US0001M + 0.420%) due 12/26/2036 ~ | | | | | 13,201 | | | | | | 10,770 | |
|
Cavendish Square Funding PLC | |
| | EUR | | | 1,206 | | | | | | 1,266 | |
|
| |
| | $ | | | 3,390 | | | | | | 1,021 | |
|
Citigroup Mortgage Loan Trust | |
| | | | | 18,440 | | | | | | 7,725 | |
| | | | | 12,237 | | | | | | 7,049 | |
| | | | | 468 | | | | | | 346 | |
1.844% (US0001M + 0.220%) due 12/25/2036 ~ | | | | | 13,510 | | | | | | 5,701 | |
1.944% (US0001M + 0.320%) due 09/25/2036 ~ | | | | | 11,860 | | | | | | 9,082 | |
| | | | | | |
| 82 | | PIMCO CLOSED-END FUNDS | | | See Accompanying Notes | |
| | | | | | | | | | | | |
| | | | | PRINCIPAL
AMOUNT
(000S) | | | | | MARKET
VALUE
(000S) | |
| | $ | | | 4,267 | | | $ | | | 3,719 | |
| | | | | 1,532 | | | | | | 809 | |
| | | | | 388 | | | | | | 160 | |
| | | | | 2,255 | | | | | | 932 | |
|
Cologix Canadian Issuer LP | |
| | CAD | | | 2,000 | | | | | | 1,461 | |
|
| |
| | $ | | | 570 | | | | | | 513 | |
| | | | | 2,480 | | | | | | 2,274 | |
| | | | | 6,514 | | | | | | 3,007 | |
|
Conseco Finance Securitizations Corp. | |
| | | | | 402 | | | | | | 409 | |
| | | | | 1,466 | | | | | | 527 | |
| | | | | 2,914 | | | | | | 756 | |
| | | | | 4,607 | | | | | | 1,455 | |
| | | | | 5,630 | | | | | | 1,407 | |
| | | | | 9,710 | | | | | | 8,801 | |
| | | | | 6,480 | | | | | | 6,341 | |
|
Cork Street CLO Designated Activity Co. | |
| | EUR | | | 2,101 | | | | | | 471 | |
|
| |
| | $ | | | 24,839 | | | | | | 12,280 | |
| | | | | 3,936 | | | | | | 2,317 | |
|
Countrywide Asset-Backed Certificates | |
1.904% (US0001M + 0.280%) due 03/25/2037 ~ | | | | | 12,992 | | | | | | 12,750 | |
| | | | | 35,851 | | | | | | 29,682 | |
| | | | | 6,020 | | | | | | 4,729 | |
| | | | | 306 | | | | | | 236 | |
2.524% (US0001M + 0.900%) due 03/25/2047 ^~ | | | | | 1,059 | | | | | | 910 | |
|
Countrywide Asset-Backed Certificates Trust | |
1.824% (US0001M + 0.200%) due 06/25/2037 ^~ | | | | | 19,834 | | | | | | 20,017 | |
| | | | | 9,139 | | | | | | 8,307 | |
1.944% (US0001M + 0.320%) due 05/25/2036 ~ | | | | | 1,001 | | | | | | 1,137 | |
| | | | | 17,299 | | | | | | 16,632 | |
2.104% (US0001M + 0.480%) due 04/25/2036 ^~ | | | | | 423 | | | | | | 368 | |
| | | | | 7,655 | | | | | | 6,744 | |
| | | | | 8,762 | | | | | | 7,543 | |
2.359% (US0001M + 0.735%) due 04/25/2036 ~ | | | | | 15,850 | | | | | | 13,130 | |
| | | | | 3,132 | | | | | | 2,109 | |
| | | | | 4 | | | | | | 4 | |
| | | | | 6,374 | | | | | | 6,185 | |
| | | | | 767 | | | | | | 773 | |
|
Credit Suisse First Boston Mortgage Securities Corp. | |
| | | | | 610 | | | | | | 572 | |
|
Credit-Based Asset Servicing & Securitization CBO Corp. | |
| | | | | 98,373 | | | | | | 2,235 | |
|
CSAB Mortgage-Backed Trust | |
| | | | | 2,176 | | | | | | 1,866 | |
|
Diamond Infrastructure Funding LLC | |
| | | | | 1,000 | | | | | | 854 | |
|
| |
| | | | | 7,559 | | | | | | 771 | |
|
| |
| | | | | 1,253 | | | | | | 808 | |
| | | | | 8,297 | | | | | | 5,248 | |
|
| |
| | | | | 1,711 | | | | | | 1,640 | |
|
Encore Credit Receivables Trust | |
2.314% (US0001M + 0.690%) due 07/25/2035 ~ | | | | | 421 | | | | | | 411 | |
|
| |
| | EUR | | | 9,282 | | | | | | 9,398 | |
|
Exeter Automobile Receivables Trust | |
0.000% due 05/15/2031 «(g) | | $ | | | 22 | | | | | | 10,712 | |
0.000% due 08/15/2031 «(g) | | | | | 24 | | | | | | 15,993 | |
0.000% due 07/15/2033 «(g) | | | | | 27 | | | | | | 53,498 | |
0.000% due 12/15/2033 «(g) | | | | | 28 | | | | | | 23,812 | |
|
| |
| | GBP | | | 13,222 | | | | | | 4,791 | |
| | | | | | | | | | | | |
| | | | | PRINCIPAL
AMOUNT
(000S) | | | | | MARKET
VALUE
(000S) | |
|
| |
| | $ | | | 2 | | | $ | | | 2 | |
|
Fieldstone Mortgage Investment Trust | |
| | | | | 4,451 | | | | | | 2,449 | |
|
First Franklin Mortgage Loan Trust | |
| | | | | 5,500 | | | | | | 5,025 | |
2.569% (US0001M + 0.945%) due 09/25/2035 ~ | | | | | 5,831 | | | | | | 5,377 | |
| | | | | 13,702 | | | | | | 12,297 | |
|
Flagship Credit Auto Trust | |
0.000% due 12/15/2027 «(g) | | | | | 9 | | | | | | 1,538 | |
|
| |
0.000% due 09/20/2027 «(g) | | | | | 10 | | | | | | 2,152 | |
|
| |
| | | | | 3,040 | | | | | | 1,449 | |
| | | | | 1,187 | | | | | | 465 | |
|
| |
| | | | | 31,479 | | | | | | 4,684 | |
|
GMAC Mortgage Corp. Home Equity Loan Trust | |
| | | | | 870 | | | | | | 888 | |
|
Greenpoint Manufactured Housing | |
| | | | | 6,163 | | | | | | 5,469 | |
|
| |
| | | | | 2,782 | | | | | | 1,791 | |
1.714% (US0001M + 0.090%) due 01/25/2037 ~ | | | | | 830 | | | | | | 534 | |
1.764% (US0001M + 0.140%) due 12/25/2036 ~ | | | | | 858 | | | | | | 491 | |
1.824% (US0001M + 0.200%) due 11/25/2036 ~ | | | | | 3,581 | | | | | | 1,902 | |
| | | | | 4,007 | | | | | | 2,127 | |
1.944% (US0001M + 0.320%) due 04/25/2036 ~ | | | | | 470 | | | | | | 332 | |
2.164% (US0001M + 0.540%) due 04/25/2036 ~ | | | | | 16,756 | | | | | | 11,997 | |
3.274% (US0001M + 1.650%) due 10/25/2034 ~ | | | | | 114 | | | | | | 109 | |
| | | | | 1,253 | | | | | | 1,228 | |
|
| |
| | | | | 33,380 | | | | | | 8,152 | |
|
Home Equity Mortgage Loan Asset-Backed Trust | |
| | | | | 3,671 | | | | | | 3,214 | |
| | | | | 13,464 | | | | | | 9,356 | |
| | | | | 2,962 | | | | | | 2,587 | |
|
| |
| | | | | 109,564 | | | | | | 20,316 | |
0.525% (US0001M + 0.450%) due 07/05/2041 ~ | | | | | 4,871 | | | | | | 618 | |
| | | | | 1,690 | | | | | | 5 | |
|
HSI Asset Securitization Corp. Trust | |
1.764% (US0001M + 0.140%) due 12/25/2036 ~ | | | | | 9,566 | | | | | | 8,271 | |
| | | | | 30,659 | | | | | | 22,954 | |
| | | | | 20,517 | | | | | | 6,631 | |
| | | | | 6,845 | | | | | | 3,136 | |
| | | | | 12,567 | | | | | | 4,038 | |
|
IndyMac Home Equity Mortgage Loan Asset-Backed Trust | |
| | | | | 494 | | | | | | 194 | |
|
IXIS Real Estate Capital Trust | |
| | | | | 3,546 | | | | | | 3,432 | |
|
JP Morgan Mortgage Acquisition Trust | |
| | | | | 6 | | | | | | 3 | |
1.814% (US0001M + 0.190%) due 03/25/2047 ~ | | | | | 466 | | | | | | 462 | |
1.924% (US0001M + 0.300%) due 07/25/2036 ~ | | | | | 1,388 | | | | | | 703 | |
| | | | | 1,024 | | | | | | 334 | |
| | | | | 2,859 | | | | | | 1,941 | |
| | | | | 7,834 | | | | | | 5,316 | |
|
| |
1.012% due 04/25/2038 «~(a) | | | | | 1,107 | | | | | | 21 | |
|
Labrador Aviation Finance Ltd. | |
| | | | | 3,612 | | | | | | 3,238 | |
|
Lehman ABS Mortgage Loan Trust | |
1.714% (US0001M + 0.090%) due 06/25/2037 ~ | | | | | 3,681 | | | | | | 2,637 | |
| | | | | | | | | | | | |
| | | | | PRINCIPAL
AMOUNT
(000S) | | | | | MARKET
VALUE
(000S) | |
|
| |
| | $ | | | 7,699 | | | $ | | | 6,760 | |
| | | | | 545 | | | | | | 568 | |
|
LendingPoint Pass-Through Trust | |
0.000% due 03/15/2028 «(g) | | | | | 1,400 | | | | | | 1,341 | |
0.000% due 04/15/2028 «(g) | | | | | 1,700 | | | | | | 1,602 | |
|
Long Beach Mortgage Loan Trust | |
2.004% (US0001M + 0.380%) due 02/25/2036 ~ | | | | | 44,023 | | | | | | 37,385 | |
| | | | | 6,820 | | | | | | 2,443 | |
2.329% (US0001M + 0.705%) due 11/25/2035 ~ | | | | | 56,091 | | | | | | 53,158 | |
|
Madison Park Funding Ltd. | |
| | | | | 5,600 | | | | | | 3,257 | |
|
| |
| | | | | 17,561 | | | | | | 5,996 | |
|
| |
0.000% due 07/16/2029 «(g) | | | | | 16 | | | | | | 1,230 | |
0.000% due 09/17/2029 «(g) | | | | | 35 | | | | | | 2,909 | |
0.000% due 03/15/2030 «(g) | | | | | 33 | | | | | | 2,475 | |
0.000% due 09/16/2030 «(g) | | | | | 9 | | | | | | 1,031 | |
|
MASTR Asset-Backed Securities Trust | |
1.844% (US0001M + 0.220%) due 08/25/2036 ~ | | | | | 2,881 | | | | | | 1,233 | |
| | | | | 5,653 | | | | | | 4,130 | |
| | | | | 4,390 | | | | | | 3,941 | |
1.984% (US0001M + 0.360%) due 02/25/2036 ~ | | | | | 6,490 | | | | | | 2,839 | |
| | | | | 2,792 | | | | | | 1,238 | |
| | | | | 15,130 | | | | | | 12,603 | |
| | | | | 227 | | | | | | 222 | |
|
Mid-State Capital Corp. Trust | |
| | | | | 3,290 | | | | | | 3,322 | |
|
Morgan Stanley ABS Capital, Inc. Trust | |
1.694% (US0001M + 0.070%) due 10/25/2036 ~ | | | | | 1,479 | | | | | | 750 | |
1.724% (US0001M + 0.100%) due 11/25/2036 ~ | | | | | 1,282 | | | | | | 813 | |
| | | | | 3,365 | | | | | | 1,350 | |
| | | | | 7,692 | | | | | | 3,916 | |
| | | | | 13,974 | | | | | | 8,882 | |
1.844% (US0001M + 0.220%) due 10/25/2036 ~ | | | | | 3,707 | | | | | | 1,895 | |
1.924% (US0001M + 0.300%) due 06/25/2036 ~ | | | | | 5,459 | | | | | | 3,291 | |
| | | | | 6,760 | | | | | | 2,743 | |
| | | | | 4,774 | | | | | | 2,713 | |
| | | | | 6,376 | | | | | | 5,407 | |
3.574% (US0001M + 1.950%) due 05/25/2034 ~ | | | | | 646 | | | | | | 642 | |
|
Morgan Stanley Capital, Inc. Trust | |
1.984% (US0001M + 0.360%) due 03/25/2036 ~ | | | | | 12 | | | | | | 10 | |
|
Morgan Stanley Home Equity Loan Trust | |
| | | | | 23,374 | | | | | | 13,631 | |
|
National Collegiate Commutation Trust | |
| | | | | 135,200 | | | | | | 41,213 | |
|
New Century Home Equity Loan Trust | |
4.624% (US0001M + 3.000%) due 01/25/2033 ^~ | | | | | 282 | | | | | | 247 | |
|
Nomura Home Equity Loan, Inc. Home Equity Loan Trust | |
1.904% (US0001M + 0.280%) due 07/25/2036 ~ | | | | | 3,500 | | | | | | 2,976 | |
| | | | | 4,330 | | | | | | 1,034 | |
|
NovaStar Mortgage Funding Trust | |
| | | | | 1,138 | | | | | | 428 | |
|
Oakwood Mortgage Investors, Inc. | |
| | | | | 3 | | | | | | 3 | |
| | | | | 1,517 | | | | | | 1,604 | |
| | | | | 1,183 | | | | | | 1,147 | |
|
| |
| | | | | 11 | | | | | | 4,877 | |
|
Option One Mortgage Loan Trust | |
1.754% (US0001M + 0.130%) due 07/25/2037 ~ | | | | | 12,548 | | | | | | 9,644 | |
| | | | | | | | | | | | |
| See Accompanying Notes | | | ANNUAL REPORT | | | | | | | JUNE 30, 2022 | | | 83 |
| | | | | | | | |
Consolidated Schedule of Investments | | PIMCO Dynamic Income Fund | | | | | | |
| | | | | | | | | | | | |
| | | | | PRINCIPAL
AMOUNT
(000S) | | | | | MARKET
VALUE
(000S) | |
| | $ | | | 293 | | | $ | | | 203 | |
1.764% (US0001M + 0.140%) due 01/25/2037 ~ | | | | | 8,436 | | | | | | 5,265 | |
| | | | | 1,721 | | | | | | 1,074 | |
| | | | | 514 | | | | | | 293 | |
| | | | | 2,109 | | | | | | 1,088 | |
| | | | | 3 | | | | | | 2 | |
|
| |
1.232% (US0003M + 0.270%) due 10/03/2045 ~ | | | | | 198,594 | | | | | | 65,206 | |
| | | | | 199,483 | | | | | | 65,498 | |
|
Ownit Mortgage Loan Trust | |
| | | | | 1,688 | | | | | | 1,063 | |
|
| |
2.086% (US0003M + 0.950%) due 07/22/2039 ~ | | | | | 6,700 | | | | | | 3,199 | |
|
Park Place Securities, Inc. Asset-Backed Pass-Through Certificates | |
3.499% (US0001M + 1.875%) due 10/25/2034 ~ | | | | | 1,161 | | | | | | 1,117 | |
| | | | | 25,974 | | | | | | 24,624 | |
|
| |
| | | | | 1,200 | | | | | | 1,059 | |
| | | | | 2,900 | | | | | | 2,669 | |
| | | | | 3,500 | | | | | | 3,520 | |
|
Pretium Mortgage Credit Partners LLC | |
| | | | | 2,100 | | | | | | 1,994 | |
|
Putnam Structured Product Funding Ltd. | |
1.584% (US0001M + 1.400%) due 10/15/2038 ~ | | | | | 919 | | | | | | 658 | |
|
| |
| | | | | 17,151 | | | | | | 15,421 | |
|
Renaissance Home Equity Loan Trust | |
| | | | | 3,152 | | | | | | 1,062 | |
|
Residential Asset Mortgage Products Trust | |
2.374% (US0001M + 0.500%) due 04/25/2034 ~ | | | | | 1,746 | | | | | | 1,700 | |
| | | | | 744 | | | | | | 724 | |
| | | | | 35 | | | | | | 35 | |
| | | | | 471 | | | | | | 458 | |
| | | | | 1,041 | | | | | | 935 | |
| | | | | 1,738 | | | | | | 1,548 | |
|
Residential Asset Securities Corp. Trust | |
1.884% (US0001M + 0.130%) due 11/25/2036 ~ | | | | | 5,292 | | | | | | 4,819 | |
| | | | | 4,405 | | | | | | 4,112 | |
2.104% (US0001M + 0.240%) due 08/25/2036 ~ | | | | | 10,681 | | | | | | 9,606 | |
| | | | | 5,930 | | | | | | 5,179 | |
| | | | | 8,083 | | | | | | 7,254 | |
|
| |
| | | | | 11,667 | | | | | | 7,032 | |
| | | | | 4,967 | | | | | | 2,834 | |
| | | | | 4,967 | | | | | | 2,520 | |
| | | | | 22,000 | | | | | | 14,658 | |
|
Saxon Asset Securities Trust | |
1.489% (US0001M + 0.975%) due 11/25/2035 ~ | | | | | 5,547 | | | | | | 3,435 | |
| | | | | 5,380 | | | | | | 3,173 | |
|
Securitized Asset-Backed Receivables LLC Trust | |
| | | | | 236 | | | | | | 113 | |
| | | | | 14,111 | | | | | | 12,517 | |
| | | | | 2,275 | | | | | | 903 | |
| | | | | 16,484 | | | | | | 9,688 | |
| | | | | 11,424 | | | | | | 9,598 | |
2.284% (US0001M + 0.660%) due 08/25/2035 ^~ | | | | | 1,751 | | | | | | 1,328 | |
2.299% due 01/25/2035 •(m) | | | | | 7 | | | | | | 6 | |
|
| |
| | EUR | | | 1,400 | | | | | | 715 | |
|
SLM Student Loan EDC Repackaging Trust | |
0.000% due 10/28/2029 «(g) | | $ | | | 36 | | | | | | 30,399 | |
|
| |
0.000% due 01/25/2042 «(g) | | | | | 31 | | | | | | 11,138 | |
|
SMB Private Education Loan Trust | |
0.000% due 10/15/2048 «(g) | | | | | 8 | | | | | | 3,696 | |
| | | | | | | | | | | | |
| | | | | PRINCIPAL
AMOUNT
(000S) | | | | | MARKET
VALUE
(000S) | |
0.000% due 09/15/2054 «(g) | | $ | | | 67,301 | | | $ | | | 95,914 | |
0.000% due 11/16/2054 «(g) | | | | | 5 | | | | | | 5,353 | |
0.000% due 02/16/2055 «(g) | | | | | 9 | | | | | | 16,582 | |
| | | | | 11,206 | | | | | | 11,027 | |
|
SoFi Professional Loan Program LLC | |
0.000% due 01/25/2039 «(g) | | | | | 33,000 | | | | | | 3,091 | |
|
Sofi Professional Loan Program LLC | |
0.000% due 05/25/2040 (g) | | | | | 31,475 | | | | | | 4,218 | |
0.000% due 07/25/2040 «(g) | | | | | 157 | | | | | | 2,161 | |
|
SoFi Professional Loan Program LLC | |
0.000% due 09/25/2040 «(g) | | | | | 14,219 | | | | | | 2,292 | |
|
| |
| | | | | 17,418 | | | | | | 14,805 | |
|
Soundview Home Loan Trust | |
1.774% (US0001M + 0.150%) due 06/25/2037 ~ | | | | | 2,437 | | | | | | 1,761 | |
| | | | | 7,331 | | | | | | 2,249 | |
| | | | | 8,508 | | | | | | 2,647 | |
| | | | | 6,022 | | | | | | 4,353 | |
| | | | | 4,614 | | | | | | 3,705 | |
2.724% (US0001M + 1.100%) due 09/25/2037 ~ | | | | | 1,868 | | | | | | 1,585 | |
|
| |
0.454% (US0003M + 0.260%) due 01/06/2041 ~ | | | | | 10,074 | | | | | | 2,122 | |
| | | | | 159,227 | | | | | | 33,540 | |
|
Specialty Underwriting & Residential Finance Trust | |
| | | | | 3,138 | | | | | | 1,660 | |
| | | | | 308 | | | | | | 194 | |
| | | | | 2,658 | | | | | | 1,142 | |
|
| |
| | | | | 724 | | | | | | 664 | |
|
Structured Asset Securities Corp. | |
7.624% (US0001M + 6.000%) due 05/25/2032 ^~ | | | | | 5,600 | | | | | | 4,661 | |
|
Structured Asset Securities Corp. Mortgage Loan Trust | |
2.074% (US0001M + 0.450%) due 06/25/2035 ~ | | | | | 59 | | | | | | 59 | |
|
| |
| | | | | 15,100 | | | | | | 14,547 | |
|
Taberna Preferred Funding Ltd. | |
| | | | | 2,777 | | | | | | 2,638 | |
1.703% (US0003M + 0.340%) due 05/05/2038 ~ | | | | | 844 | | | | | | 802 | |
| | | | | 16,091 | | | | | | 14,441 | |
| | | | | 3,108 | | | | | | 2,766 | |
| | | | | 12,501 | | | | | | 11,126 | |
|
| |
| | | | | 676 | | | | | | 108 | |
|
| |
| | | | | 3,624 | | | | | | 3,429 | |
|
UCFC Home Equity Loan Trust | |
| | | | | 430 | | | | | | 414 | |
|
| |
| | | | | 242,568 | | | | | | 61,914 | |
| | | | | | | | | | | | |
Total Asset-Backed Securities (Cost $1,950,106) | | | | |
| | | | |
| |
| |
|
Argentina Government International Bond | |
| | | | | 36,860 | | | | | | 7,801 | |
| | | | | 5,302 | | | | | | 1,250 | |
| | | | | 36,256 | | | | | | 7,518 | |
| | | | | 230 | | | | | | 53 | |
| | ARS | | | 556,320 | | | | | | 2,041 | |
| | | | | 816,947 | | | | | | 2,793 | |
| | $ | | | 93,277 | | | | | | 27,284 | |
| | | | | 20,323 | | | | | | 5,284 | |
| | ARS | | | 555,410 | | | | | | 657 | |
47.331% (BADLARPP) due 10/04/2022 ~ | | | | | 1,476 | | | | | | 1 | |
|
Autonomous City of Buenos Aires | |
52.234% (BADLARPP + 3.750%) due 02/22/2028 ~ | | | | | 155,766 | | | | | | 559 | |
| | | | | | | | | | | | |
| | | | | PRINCIPAL
AMOUNT
(000S) | | | | | MARKET
VALUE
(000S) | |
|
Ecuador Government International Bond | |
| | $ | | | 2,960 | | | $ | | | 1,953 | |
|
Ghana Government International Bond | |
| | | | | 4,477 | | | | | | 2,580 | |
| | | | | 5,412 | | | | | | 2,552 | |
| | | | | 1,500 | | | | | | 712 | |
|
Ivory Coast Government International Bond | |
| | EUR | | | 14,700 | | | | | | 11,125 | |
| | | | | 8,000 | | | | | | 5,646 | |
|
Nigeria Government International Bond | |
| | $ | | | 7,300 | | | | | | 4,568 | |
|
Peru Government International Bond | |
| | PEN | | | 221 | | | | | | 44 | |
| | | | | 7 | | | | | | 1 | |
| | | | | 1,656 | | | | | | 395 | |
| | | | | 376 | | | | | | 87 | |
| | | | | 3,394 | | | | | | 836 | |
| | | | | 935 | | | | | | 221 | |
| | | | | 271 | | | | | | 67 | |
| | | | | 1,990 | | | | | | 543 | |
|
Provincia de Buenos Aires | |
| | ARS | | | 2,284,867 | | | | | | 7,671 | |
|
Romania Government International Bond | |
| | EUR | | | 20,200 | | | | | | 17,470 | |
| | | | | 8,600 | | | | | | 5,253 | |
| | | | | 2,500 | | | | | | 1,536 | |
| | | | | 8,600 | | | | | | 5,291 | |
| | | | | 2,330 | | | | | | 1,835 | |
|
Russia Government International Bond | |
5.100% due 03/28/2035 ^(d) | | $ | | | 600 | | | | | | 159 | |
5.625% due 04/04/2042 ^(d) | | | | | 10,200 | | | | | | 3,009 | |
5.875% due 09/16/2043 ^(d) | | | | | 200 | | | | | | 59 | |
|
Turkiye Ihracat Kredi Bankasi AS | |
| | | | | 1,400 | | | | | | 1,378 | |
|
Ukraine Government International Bond | |
| | EUR | | | 10,155 | | | | | | 2,660 | |
| | $ | | | 13,000 | | | | | | 3,218 | |
|
Venezuela Government International Bond | |
| | | | | 590 | | | | | | 46 | |
8.250% due 10/13/2024 ^(d) | | | | | 136 | | | | | | 12 | |
9.250% due 09/15/2027 ^(d) | | | | | 734 | | | | | | 64 | |
| | | | | | | | | | | | |
Total Sovereign Issues (Cost $268,341) | | | | |
| | | | |
| |
| | | | | SHARES | | | | | | |
| |
| |
COMMUNICATION SERVICES 0.5% | |
| | | | |
Clear Channel Outdoor Holdings, Inc. (e) | | | | | 4,853,248 | | | | | | 5,193 | |
| | | | |
iHeartMedia, Inc. ‘A’ (e) | | | | | 2,021,190 | | | | | | 15,947 | |
| | | | | | | | | | | | |
| | | | | | | | | | | 21,140 | |
| | | | | | | | | | | | |
| |
CONSUMER DISCRETIONARY 0.0% | |
| | | |
Caesars Entertainment, Inc. (e) | | | 2 | | | | | | 0 | |
| | | | |
Desarrolladora Homex SAB de CV (e) | | | | | 719,113 | | | | | | 2 | |
| | | |
Urbi Desarrollos Urbanos SAB de CV (e) | | | 4,776 | | | | | | 2 | |
| | | | | | | | | | | | |
| | | | | | | | | | | 4 | |
| | | | | | | | | | | | |
| |
| |
| | | |
Axis Energy Services ‘A’ «(e)(k) | | | 17,105 | | | | | | 252 | |
| | | |
Constellation Oil ‘B’ «(e)(k) | | | 252,651 | | | | | | 28 | |
| | | | |
| | | | | 193,054 | | | | | | 4,894 | |
| | | | |
| | | | | 10,960 | | | | | | 463 | |
| | | | | | | | | | | | |
| | | | |
| | | | | | | | | | | 5,637 | |
| | | | | | | | | | | | |
| |
| |
| | | | |
| | | | | 277,457 | | | | | | 1,575 | |
| | | | |
| | | | | 1,751,422 | | | | | | 49,040 | |
| | | | | | | | | | | | |
| | | | |
| | | | | | | | | | | 50,615 | |
| | | | | | | | | | | | |
| | | | | | | | | | | | |
| | | | | SHARES | | | | | MARKET
VALUE
(000S) | |
| |
| | | |
Mcdermott International Ltd. «(e) | | | 584,497 | | | $ | | | 333 | |
| | | |
Syniverse Holdings, Inc. «(e)(k) | | | 15,325,103 | | | | | | 15,019 | |
| | | | |
Voyager Aviation Holdings LLC «(e) | | | | | 16,278 | | | | | | 0 | |
| | | | |
Westmoreland Mining Holdings «(e)(k) | | | | | 240,900 | | | | | | 0 | |
| | | | | | | | | | | | |
| | | | |
| | | | | | | | | | | 15,352 | |
| | | | | | | | | | | | |
| |
| |
| | | | |
Associated Materials Group, Inc. «(e) | | | | | 11,411,610 | | | | | | 2,646 | |
| | | | | | | | | | | | |
| |
| |
| | | | |
Stearns Holding LLC ‘B’ «(e) | | | | | 59,964 | | | | | | 0 | |
| | | | | | | | | | | | |
| |
| |
| | | | |
| | | | | 450,094 | | | | | | 11,252 | |
| | | | | | | | | | | | |
Total Common Stocks (Cost $241,217) | | | | | | | |
| | | | | | | | | | | | |
| |
| |
| |
| |
| | | | |
Intelsat Jackson
Holdings SA «(e) | | | | | 188,308 | | | | | | 895 | |
| | | | | | | | | | | | |
| | | | | | | | | | | | |
| | | | | | | | | | | | |
| |
| |
| |
| |
| | | | |
Guranteed Rate, Inc. - Exp. 12/31/2060 « | | | | | 288 | | | | | | 0 | |
| | | | |
Intelsat Emergence SA - Exp. 02/17/2027 « | | | | | 13,833 | | | | | | 36 | |
| | | | |
Intelsat Jackson Holdings SA - Exp. 12/05/2025 « | | | | | 182,955 | | | | | | 915 | |
| | | | | | | | | | | | |
| | | | |
| | | | | | | | | | | 951 | |
| | | | | | | | | | | | |
| |
| |
| | | | |
Sequa Corp. -
Exp. 04/28/2024 « | | | | | 2,809,304 | | | | | | 1,682 | |
| | | | | | | | | | | | |
| | | | | | | | | | | | |
| | | | | | | | | | | |
INFORMATION TECHNOLOGY 1.5% | |
| | | | |
Windstream Holdings LLC - Exp. 9/21/2055 « | | | | | 3,155,914 | | | $ | | | 67,297 | |
| | | | | | | | | | | | |
Total Warrants (Cost $68,646) | | | | | | | |
| | | | | | | | | | | | |
| |
PREFERRED SECURITIES 7.4% | |
| |
| |
|
| |
2.794% (US0003M + 1.750%) due 01/15/2067 ~ | | | | | 35,500,000 | | | | | | 19,398 | |
|
| |
5.250% due 06/15/2026 •(i) | | | | | 10,000,000 | | | | | | 9,188 | |
|
| |
5.000% due 03/15/2026 •(i) | | | | | 4,300,000 | | | | | | 3,859 | |
|
| |
4.875% due 08/15/2026 •(i) | | | | | 1,900,000 | | | | | | 1,684 | |
|
Nationwide Building Society | |
| | | | | 113,976 | | | | | | 20,324 | |
|
| |
0.000% due 04/26/2028 (g) | | | | | 2,600 | | | | | | 1,748 | |
|
Stichting AK Rabobank Certificaten | |
6.500% due 12/29/2049 þ(i) | | | | | 103,752,850 | | | | | | 105,877 | |
| | | | | | | | | | | | |
| | | | | | | | | | | 162,078 | |
| | | | | | | | | | | | |
| |
| |
|
| |
5.159% (US0003M + 3.330%) due 09/15/2022 ~(i) | | | | | 2,372,000 | | | | | | 2,087 | |
|
Sequa Corp. (15.000% PIK) | |
| | | | | 90,397 | | | | | | 102,561 | |
|
Voyager Aviation Holdings LLC | |
| | | | | 97,668 | | | | | | 29,530 | |
| | | | | | | | | | | | |
| | | | | | | | | | | 134,178 | |
| | | | | | | | | | | | |
| |
| |
|
| |
7.000% due 10/20/2022 «(i)(k) | | | | | 1,336,067 | | | | | | 33,921 | |
| | | | | | | | | | | | |
Total Preferred Securities (Cost $329,182) | | | | | | | |
| | | | | | | | | | | | |
| |
REAL ESTATE INVESTMENT TRUSTS 1.1% | |
| |
| |
| | | | |
CBL & Associates Properties, Inc. | | | | | 17,153 | | | | | | 403 | |
| | | | |
| | | | | 2,146,174 | | | | | | 20,217 | |
| | | | | | | | | | | | |
| | | | | SHARES | | | | | MARKET
VALUE
(000S) | |
| | | | |
| | | | | 934,693 | | | $ | | | 27,844 | |
| | | | | | | | | | | | |
Total Real Estate Investment Trusts (Cost $26,261) | | | | | | | |
| | | | | | | | | | | | |
| |
| | | | | PRINCIPAL
AMOUNT
(000S) | | | | | | |
SHORT-TERM INSTRUMENTS 9.5% | |
| |
REPURCHASE AGREEMENTS (l) 5.7% | |
| | | | | | | | | | | 255,540 | |
| | | | | | | | | | | | |
| |
ARGENTINA TREASURY BILLS 0.1% | |
51.049% due 09/30/2022 (g)(h) | | ARS | | | 770,400 | | | | | | 2,581 | |
| | | | | | | | | | | | |
| |
| |
0.844% due 07/19/2022 - 07/28/2022 (f)(g)(m)(p) | | $ | | | 164,267 | | | | | | 164,140 | |
| | | | | | | | | | | | |
Total Short-Term Instruments (Cost $423,263) | | | | | | | |
| | | | | | | | | | | | |
| | | | |
| | | | | | | | | | | | |
Total Investments in Securities (Cost $9,428,623) | | | | | | | |
| | | | | | | | | | | | |
| |
| | | | | SHARES | | | | | | |
INVESTMENTS IN AFFLIATES 2.3% | |
| |
| |
| |
AFFILIATED INVESTMENTS 2.3% | |
| | | | |
Neiman Marcus Group Ltd. LLC «(e)(k) | | | | | 602,840 | | | | | | 104,200 | |
| | | |
Sierra Hamilton Holder LLC «(e)(k) | | | 30,337,712 | | | | | | 3 | |
| | | | | | | | | | | | |
Total Common Stocks (Cost $27,066) | | | | | | | |
| | | | | | | | | | | | |
| | | | |
| | | | | | | | | | | | |
Total Investments in Affiliates (Cost $27,066) | | | | | | | |
|
| |
Total Investments 183.6% (Cost $9,455,689) | | | $ | | | | |
| |
Financial Derivative
Instruments (n)(o) 0.2% (Cost or Premiums, net $(31,534)) | | | | | | | |
| |
Other Assets and Liabilities, net (83.8)% | | | | | | | |
| | | | | | | | | | | | |
| | | | | | | | $ | | | | |
| | | | | | | | | | | | |
NOTES TO CONSOLIDATED SCHEDULE OF INVESTMENTS:
| A zero balance may reflect actual amounts rounding to less than one thousand. |
| Security valued using significant unobservable inputs (Level 3). |
| All or a portion of this amount represents unfunded loan commitments. The interest rate for the unfunded portion will be determined at the time of funding. See Note 4, Securities and Other Investments, in the Notes to Financial Statements for more information regarding unfunded loan commitments. |
| Variable or Floating rate security. Rate shown is the rate in effect as of period end. Certain variable rate securities are not based on a published reference rate and spread, rather are determined by the issuer or agent and are based on current market conditions. Reference rate is as of reset date, which may vary by security. These securities may not indicate a reference rate and/or spread in their description. |
| Rate shown is the rate in effect as of period end. The rate may be based on a fixed rate, a capped rate or a floor rate and may convert to a variable or floating rate in the future. These securities do not indicate a reference rate and spread in their description. |
| Coupon represents a rate which changes periodically based on a predetermined schedule or event. Rate shown is the rate in effect as of period end. |
| Security is an Interest Only (“IO”) or IO Strip. |
| | | | | | | | | | | | |
| See Accompanying Notes | | | ANNUAL REPORT | | | | | | | JUNE 30, 2022 | | | 85 |
| | | | | | | | |
Consolidated Schedule of Investments | | PIMCO Dynamic Income Fund | | | | | | |
| Security is not accruing income as of the date of this report. |
| Security did not produce income within the last twelve months. |
| Coupon represents a weighted average yield to maturity. |
| Coupon represents a yield to maturity. |
| Perpetual maturity; date shown, if applicable, represents next contractual call date. |
| Contingent convertible security. |
(k) RESTRICTED SECURITIES:
| | | | | | | | | | | | | | | | | | | | | | | | |
| | | | | | | | | | | | | | | | | Market Value
as Percentage
of Net Assets | |
AT&T Mobility LLC 7.000% due 10/20/2022 | | | | | | | | | | | 09/24/2020 | | | $ | 36,138 | | | $ | 33,921 | | | | 0.76 | % |
| | | | | | | | | | | 07/01/2021 | | | | 252 | | | | 252 | | | | 0.01 | |
Buffalo Thunder Development Authority 0.000% due 11/15/2029 | | | | | | | | | | | 12/08/2014 | | | | 9 | | | | 2 | | | | 0.00 | |
| | | | | | | | | | | 06/10/2022 | | | | 27 | | | | 28 | | | | 0.00 | |
Ferroglobe PLC 9.375% due 12/31/2025 | | | | | | | | | | | | | | | 1,783 | | | | 1,767 | | | | 0.04 | |
| | | | | | | | | | | | | | | 114,056 | | | | 49,040 | | | | 1.10 | |
Neiman Marcus Group Ltd. LLC | | | | | | | | | | | 09/25/2020 | | | | 19,376 | | | | 104,200 | | | | 2.33 | |
| | | | | | | | | | | | | | | 2,389 | | | | 4,894 | | | | 0.11 | |
Otterham Property Finance Designated Activity Co. 3.000% due 09/03/2026 | | | | | | | | | | | 09/26/2019 | | | | 4,948 | | | | 4,752 | | | | 0.11 | |
Pinnacol Assurance 8.625% due 06/25/2034 | | | | | | | | | | | 06/23/2014 | | | | 36,300 | | | | 40,468 | | | | 0.90 | |
Preylock Reitman Santa Cruz Mezz LLC 6.824% due 11/09/2022 | | | | | | | | | | | 04/09/2018 | | | | 37,127 | | | | 36,774 | | | | 0.82 | |
Project Anfora Senior 2.750% due 10/01/2026 | | | | | | | | | | | 09/30/2019 | | | | 39,270 | | | | 36,831 | | | | 0.82 | |
Sierra Hamilton Holder LLC | | | | | | | | | | | 07/31/2017 | | | | 7,690 | | | | 3 | | | | 0.00 | |
| | | | | | | | | | | 05/12/2022 | | | | 15,019 | | | | 15,019 | | | | 0.33 | |
Westmoreland Mining Holdings | | | | | | | | | | | | | | | 7,008 | | | | 0 | | | | 0.00 | |
| | | | | | | | | | | | | | | | | | | | | | | | |
| | | $ | 321,392 | | | $ | 327,951 | | | | 7.33% | |
| | | | | | | | | | | | | |
BORROWINGS AND OTHER FINANCING TRANSACTIONS
(l) REPURCHASE AGREEMENTS:
| | | | | | | | | | | | | | | | | | | | | | | | | | | | | | |
| | | | | | | | | | | | | | | | | | | Repurchase
Agreements,
at Value | | | Repurchase Agreement Proceeds to be Received (1) | |
| FICC | | | 0.400 | % | | | 06/30/2022 | | | | 07/01/2022 | | | $ | 2,940 | | | U.S. Treasury Notes 3.000% due 06/30/2024 | | $ | (2,999 | ) | | $ | 2,940 | | | $ | 2,940 | |
| | | 1.450 | | | | 06/30/2022 | | | | 07/01/2022 | | | | 252,600 | | | U.S. Treasury Notes 2.375% - 2.750% due 05/15/2029 - 05/31/2029 | | | (257,652 | ) | | | 252,600 | | | | 252,610 | |
| | | | | | | | | | | | | | | | | | | | | | | | | | | | | | |
Total Repurchase Agreements | | | | | | | | | | | | | | | |
| | | | | | | | | | | | | | | |
REVERSE REPURCHASE AGREEMENTS:
| | | | | | | | | | | | | | | | | | | | | | |
| | | | | | | | | | | | | | Payable for
Reverse
Repurchase
Agreements | |
| | | 1.630 | % | | | 04/08/2022 | | | | 07/08/2022 | | | $ | | | (46,832 | ) | | $ | (47,011 | ) |
| | | 2.100 | | | | 05/16/2022 | | | | 08/16/2022 | | | | | | (81,519 | ) | | | (81,738 | ) |
| | | 2.100 | | | | 05/18/2022 | | | | 08/16/2022 | | | | | | (22,890 | ) | | | (22,949 | ) |
| | | 2.380 | | | | 06/03/2022 | | | | 09/06/2022 | | | | | | (54,606 | ) | | | (54,707 | ) |
| | | 2.400 | | | | 06/07/2022 | | | | 09/09/2022 | | | | | | (39,353 | ) | | | (39,416 | ) |
| | | 2.980 | | | | 07/08/2022 | | | | 10/06/2022 | | | | | | (42,157 | ) | | | (42,157 | ) |
| | | 1.530 | | | | 05/02/2022 | | | | 08/01/2022 | | | | | | (9,310 | ) | | | (9,334 | ) |
| | | 1.980 | | | | 06/10/2022 | | | | 09/08/2022 | | | | | | (4,419 | ) | | | (4,424 | ) |
| | | 1.830 | | | | 05/03/2022 | | | | 08/03/2022 | | | | | | (18,562 | ) | | | (18,618 | ) |
| | | 1.880 | | | | 06/10/2022 | | | | 09/12/2022 | | | | | | (30,775 | ) | | | (30,808 | ) |
| | | 2.120 | | | | 05/24/2022 | | | | 08/24/2022 | | | | | | (6,083 | ) | | | (6,097 | ) |
| | | 2.360 | | | | 06/14/2022 | | | | 10/12/2022 | | | | | | (6,615 | ) | | | (6,615 | ) |
| | | 2.370 | | | | 06/28/2022 | | | | 07/28/2022 | | | | | | (8,734 | ) | | | (8,736 | ) |
| | | (5.500 | ) | | | 05/20/2022 | | | | TBD | | | EUR | | | (2,465 | ) | | | (2,566 | ) |
| | | (4.000 | ) | | | 03/23/2022 | | | | TBD | | | | | | (3,753 | ) | | | (3,889 | ) |
| | | (0.400 | ) | | | 04/21/2022 | | | | 07/21/2022 | | | | | | (1,545 | ) | | | (1,618 | ) |
| | | (0.350 | ) | | | 04/19/2022 | | | | 07/19/2022 | | | | | | (1,156 | ) | | | (1,210 | ) |
| | | (0.350 | ) | | | 04/21/2022 | | | | 07/21/2022 | | | | | | (2,624 | ) | | | (2,747 | ) |
| | | (0.350 | ) | | | 05/30/2022 | | | | TBD | | | | | | (4,266 | ) | | | (4,469 | ) |
| | | | | | |
| 86 | | PIMCO CLOSED-END FUNDS | | | See Accompanying Notes | |
| | | | | | | | | | | | | | | | | | | | | | |
| Counterparty | | | | | Settlement
Date | | | Maturity
Date | | | | | | Payable for
Reverse
Repurchase
Agreements | |
| | | (0.340 | )% | | | 05/12/2022 | | | | 08/12/2022 | | | EUR | | | (2,856 | ) | | $ | (2,992 | ) |
| | | (0.300 | ) | | | 04/19/2022 | | | | 07/19/2022 | | | | | | (285 | ) | | | (299 | ) |
| | | (0.300 | ) | | | 04/28/2022 | | | | 07/28/2022 | | | | | | (11,931 | ) | | | (12,496 | ) |
| | | (0.300 | ) | | | 05/05/2022 | | | | 08/04/2022 | | | | | | (3,481 | ) | | | (3,646 | ) |
| | | (0.300 | ) | | | 05/30/2022 | | | | TBD | | | | | | (2,116 | ) | | | (2,217 | ) |
| | | (0.240 | ) | | | 05/12/2022 | | | | 08/10/2022 | | | | | | (3,239 | ) | | | (3,394 | ) |
| | | (0.120 | ) | | | 05/10/2022 | | | | 08/09/2022 | | | | | | (889 | ) | | | (931 | ) |
| | | 0.900 | | | | 04/19/2022 | | | | 07/19/2022 | | | GBP | | | (193 | ) | | | (236 | ) |
| | | 0.950 | | | | 04/19/2022 | | | | 07/19/2022 | | | | | | (198 | ) | | | (241 | ) |
| | | 1.150 | | | | 05/19/2022 | | | | TBD | | | | | | (942 | ) | | | (1,148 | ) |
| | | 1.170 | | | | 02/01/2022 | | | | 08/01/2022 | | | $ | | | (3,161 | ) | | | (3,176 | ) |
| | | 1.250 | | | | 03/15/2022 | | | | 09/16/2022 | | | | | | (1,754 | ) | | | (1,760 | ) |
| | | 1.250 | | | | 03/16/2022 | | | | 09/16/2022 | | | | | | (1,202 | ) | | | (1,206 | ) |
| | | 1.250 | | | | 03/18/2022 | | | | 09/16/2022 | | | | | | (25,315 | ) | | | (25,408 | ) |
| | | 1.330 | | | | 04/08/2022 | | | | 07/08/2022 | | | | | | (222 | ) | | | (223 | ) |
| | | 1.420 | | | | 03/23/2022 | | | | 09/23/2022 | | | | | | (19,121 | ) | | | (19,197 | ) |
| | | 1.420 | | | | 04/11/2022 | | | | 09/23/2022 | | | | | | (1,471 | ) | | | (1,476 | ) |
| | | 1.420 | | | | 05/06/2022 | | | | 09/23/2022 | | | | | | (877 | ) | | | (879 | ) |
| | | 1.420 | | | | 06/03/2022 | | | | 09/23/2022 | | | | | | (3,093 | ) | | | (3,097 | ) |
| | | 1.430 | | | | 03/21/2022 | | | | 09/22/2022 | | | | | | (4,779 | ) | | | (4,798 | ) |
| | | 1.430 | | | | 03/22/2022 | | | | 09/23/2022 | | | | | | (4,938 | ) | | | (4,957 | ) |
| | | 1.430 | | | | 04/12/2022 | | | | 09/22/2022 | | | | | | (1,003 | ) | | | (1,006 | ) |
| | | 1.600 | | | | 04/07/2022 | | | | 07/07/2022 | | | | | | (12,649 | ) | | | (12,697 | ) |
| | | 1.650 | | | | 04/12/2022 | | | | 10/14/2022 | | | | | | (939 | ) | | | (942 | ) |
| | | 1.650 | | | | 04/29/2022 | | | | 10/14/2022 | | | | | | (92 | ) | | | (92 | ) |
| | | 1.650 | | | | 05/02/2022 | | | | 08/02/2022 | | | | | | (2,312 | ) | | | (2,318 | ) |
| | | 1.650 | | | | 06/01/2022 | | | | 08/02/2022 | | | | | | (950 | ) | | | (951 | ) |
| | | 1.650 | | | | 06/29/2022 | | | | 08/02/2022 | | | | | | (10,451 | ) | | | (10,452 | ) |
| | | 1.690 | | | | 04/18/2022 | | | | 10/17/2022 | | | | | | (20,940 | ) | | | (21,013 | ) |
| | | 1.710 | | | | 05/03/2022 | | | | 08/03/2022 | | | GBP | | | (9,810 | ) | | | (11,975 | ) |
| | | 1.800 | | | | 05/03/2022 | | | | 08/03/2022 | | | $ | | | (23,058 | ) | | | (23,126 | ) |
| | | 1.820 | | | | 05/11/2022 | | | | 08/09/2022 | | | | | | (843 | ) | | | (845 | ) |
| | | 1.830 | | | | 05/12/2022 | | | | 08/12/2022 | | | | | | (21,178 | ) | | | (21,232 | ) |
| | | 1.830 | | | | 05/13/2022 | | | | 08/12/2022 | | | | | | (3,082 | ) | | | (3,090 | ) |
| | | 1.850 | | | | 05/11/2022 | | | | 08/09/2022 | | | | | | (1,778 | ) | | | (1,782 | ) |
| | | 1.900 | | | | 02/09/2022 | | | | TBD | | | GBP | | | (1,033 | ) | | | (1,261 | ) |
| | | 1.930 | | | | 05/13/2022 | | | | 08/12/2022 | | | $ | | | (38,520 | ) | | | (38,621 | ) |
| | | 1.950 | | | | 05/31/2022 | | | | 08/31/2022 | | | | | | (3,996 | ) | | | (4,002 | ) |
| | | 1.970 | | | | 06/02/2022 | | | | 09/01/2022 | | | | | | (21,484 | ) | | | (21,518 | ) |
| | | 1.990 | | | | 04/27/2022 | | | | 10/27/2022 | | | | | | (33,594 | ) | | | (33,715 | ) |
| | | 2.040 | | | | 04/29/2022 | | | | 10/31/2022 | | | | | | (14,047 | ) | | | (14,097 | ) |
| | | 2.270 | | | | 05/16/2022 | | | | 08/17/2022 | | | | | | (21,649 | ) | | | (21,712 | ) |
| | | 2.300 | | | | 05/24/2022 | | | | 08/24/2022 | | | | | | (24,872 | ) | | | (24,932 | ) |
| | | 2.380 | | | | 06/23/2022 | | | | 09/26/2022 | | | | | | (941 | ) | | | (942 | ) |
| | | 2.450 | | | | 06/09/2022 | | | | 12/09/2022 | | | | | | (255 | ) | | | (255 | ) |
| | | 2.480 | | | | 06/17/2022 | | | | 09/19/2022 | | | | | | (2,024 | ) | | | (2,026 | ) |
| | | 2.510 | | | | 06/23/2022 | | | | 12/19/2022 | | | | | | (4,877 | ) | | | (4,879 | ) |
| | | 2.530 | | | | 06/16/2022 | | | | 09/16/2022 | | | | | | (7,477 | ) | | | (7,485 | ) |
| | | 2.530 | | | | 06/23/2022 | | | | 09/26/2022 | | | | | | (912 | ) | | | (913 | ) |
| | | 2.610 | | | | 06/23/2022 | | | | 09/26/2022 | | | | | | (418 | ) | | | (418 | ) |
| | | 2.760 | | | | 06/02/2022 | | | | 12/02/2022 | | | | | | (18,568 | ) | | | (18,609 | ) |
| | | 2.810 | | | | 06/03/2022 | | | | 12/02/2022 | | | | | | (38,176 | ) | | | (38,259 | ) |
| | | 2.910 | | | | 06/10/2022 | | | | 12/09/2022 | | | | | | (39,306 | ) | | | (39,373 | ) |
| | | (5.500 | ) | | | 05/24/2022 | | | | TBD | | | EUR | | | (3,614 | ) | | | (3,765 | ) |
| | | (1.000 | ) | | | 05/24/2022 | | | | TBD | | | | | | (2,351 | ) | | | (2,462 | ) |
| | | (1.000 | ) | | | 06/17/2022 | | | | TBD | | | $ | | | (13,397 | ) | | | (13,391 | ) |
| | | (0.420 | ) | | | 12/17/2021 | | | | TBD | | | EUR | | | (8,533 | ) | | | (8,921 | ) |
| | | 0.250 | | | | 12/09/2021 | | | | 08/18/2022 | | | $ | | | (1,083 | ) | | | (1,084 | ) |
| | | 0.850 | | | | 06/17/2022 | | | | TBD | | | | | | (519 | ) | | | (519 | ) |
| | | 1.030 | | | | 01/27/2022 | | | | 08/04/2022 | | | | | | (2,461 | ) | | | (2,471 | ) |
| | | 1.100 | | | | 04/06/2022 | | | | 07/06/2022 | | | | | | (815 | ) | | | (817 | ) |
| | | 1.250 | | | | 04/25/2022 | | | | 07/25/2022 | | | GBP | | | (236 | ) | | | (288 | ) |
| | | 1.300 | | | | 06/17/2022 | | | | TBD | | | $ | | | (533 | ) | | | (533 | ) |
| | | 1.450 | | | | 06/17/2022 | | | | TBD | | | | | | (690 | ) | | | (690 | ) |
| | | 1.650 | | | | 04/07/2022 | | | | 07/07/2022 | | | | | | (20,650 | ) | | | (20,730 | ) |
| | | 1.650 | | | | 05/09/2022 | | | | 07/13/2022 | | | | | | (1,631 | ) | | | (1,635 | ) |
| | | 1.700 | | | | 05/09/2022 | | | | 07/13/2022 | | | | | | (10,975 | ) | | | (11,002 | ) |
| | | 1.750 | | | | 05/09/2022 | | | | 07/13/2022 | | | | | | (3,777 | ) | | | (3,787 | ) |
| | | 1.800 | | | | 03/17/2022 | | | | 09/19/2022 | | | | | | (2,703 | ) | | | (2,718 | ) |
| | | 1.830 | | | | 05/31/2022 | | | | 07/01/2022 | | | | | | (15,206 | ) | | | (15,230 | ) |
| | | | | | | | | | | | |
| See Accompanying Notes | | | ANNUAL REPORT | | | | | | | JUNE 30, 2022 | | | 87 |
| | | | | | | | |
Consolidated Schedule of Investments | | PIMCO Dynamic Income Fund | | | | | | |
| | | | | | | | | | | | | | | | | | | | | | |
| Counterparty | | | | | Settlement
Date | | | Maturity
Date | | | | | | Payable for
Reverse
Repurchase
Agreements | |
| | | 1.850 | % | | | 03/17/2022 | | | | 09/19/2022 | | | $ | | | (7,784 | ) | | $ | (7,827 | ) |
| | | 1.850 | | | | 06/17/2022 | | | | TBD | | | | | | (1,820 | ) | | | (1,821 | ) |
| | | 1.880 | | | | 05/31/2022 | | | | 07/01/2022 | | | | | | (85,396 | ) | | | (85,534 | ) |
| | | 1.900 | | | | 06/17/2022 | | | | TBD | | | | | | (6,844 | ) | | | (6,849 | ) |
| | | 1.920 | | | | 05/02/2022 | | | | 08/02/2022 | | | | | | (33,915 | ) | | | (34,024 | ) |
| | | 1.938 | | | | 05/10/2022 | | | | 08/08/2022 | | | | | | (1,600 | ) | | | (1,604 | ) |
| | | 1.950 | | | | 05/13/2022 | | | | 08/16/2022 | | | | | | (6,642 | ) | | | (6,660 | ) |
| | | 1.970 | | | | 05/02/2022 | | | | 08/02/2022 | | | | | | (3,233 | ) | | | (3,243 | ) |
| | | 2.000 | | | | 06/17/2022 | | | | TBD | | | | | | (2,005 | ) | | | (2,007 | ) |
| | | 2.020 | | | | 05/12/2022 | | | | 08/12/2022 | | | | | | (13,343 | ) | | | (13,381 | ) |
| | | 2.038 | | | | 05/11/2022 | | | | 08/15/2022 | | | | | | (35,582 | ) | | | (35,685 | ) |
| | | 2.100 | | | | 06/13/2022 | | | | 09/14/2022 | | | | | | (1,519 | ) | | | (1,521 | ) |
| | | 2.210 | | | | 05/26/2022 | | | | 08/26/2022 | | | | | | (31,135 | ) | | | (31,204 | ) |
| | | 2.250 | | | | 06/17/2022 | | | | TBD | | | | | | (57,678 | ) | | | (57,729 | ) |
| | | 2.260 | | | | 06/06/2022 | | | | 09/07/2022 | | | | | | (45,713 | ) | | | (45,785 | ) |
| | | 2.270 | | | | 06/10/2022 | | | | 09/14/2022 | | | | | | (768 | ) | | | (769 | ) |
| | | 2.280 | | | | 06/03/2022 | | | | 09/06/2022 | | | | | | (8,678 | ) | | | (8,694 | ) |
| | | 2.300 | | | | 06/14/2022 | | | | 09/14/2022 | | | | | | (2,741 | ) | | | (2,744 | ) |
| | | 2.310 | | | | 06/06/2022 | | | | 09/07/2022 | | | | | | (63,890 | ) | | | (63,993 | ) |
| | | 2.400 | | | | 07/01/2022 | | | | 08/01/2022 | | | | | | (14,999 | ) | | | (14,999 | ) |
| | | 2.420 | | | | 06/10/2022 | | | | 09/14/2022 | | | | | | (10,391 | ) | | | (10,406 | ) |
| | | 2.440 | | | | 06/16/2022 | | | | 09/16/2022 | | | | | | (8,846 | ) | | | (8,855 | ) |
| | | 2.450 | | | | 07/01/2022 | | | | 08/01/2022 | | | | | | (82,846 | ) | | | (82,846 | ) |
| | | 2.500 | | | | 05/31/2022 | | | | 08/31/2022 | | | | | | (15,093 | ) | | | (15,125 | ) |
| | | 2.500 | | | | 06/15/2022 | | | | 09/15/2022 | | | | | | (2,091 | ) | | | (2,093 | ) |
| | | 2.550 | | | | 05/31/2022 | | | | 08/31/2022 | | | | | | (17,715 | ) | | | (17,754 | ) |
| | | 2.550 | | | | 06/17/2022 | | | | 09/19/2022 | | | | | | (35,691 | ) | | | (35,727 | ) |
| | | 2.600 | | | | 05/31/2022 | | | | 08/31/2022 | | | | | | (7,041 | ) | | | (7,057 | ) |
| | | 2.610 | | | | 06/17/2022 | | | | 09/19/2022 | | | | | | (19,209 | ) | | | (19,229 | ) |
| | | 2.630 | | | | 06/15/2022 | | | | 09/15/2022 | | | | | | (2,628 | ) | | | (2,631 | ) |
| | | 2.713 | | | | 06/24/2022 | | | | 09/27/2022 | | | | | | (6,498 | ) | | | (6,501 | ) |
| | | 2.800 | | | | 06/21/2022 | | | | 09/21/2022 | | | | | | (18,910 | ) | | | (18,924 | ) |
| | | 2.800 | | | | 06/24/2022 | | | | 09/27/2022 | | | | | | (157 | ) | | | (157 | ) |
| | | 2.863 | | | | 06/24/2022 | | | | 09/27/2022 | | | | | | (26,852 | ) | | | (26,866 | ) |
| | | 2.890 | | | | 06/17/2022 | | | | 09/19/2022 | | | | | | (31,744 | ) | | | (31,779 | ) |
| | | 2.090 | | | | 07/01/2022 | | | | 07/06/2022 | | | | | | (3,257 | ) | | | (3,257 | ) |
| | | 2.100 | | | | 06/30/2022 | | | | 07/06/2022 | | | | | | (4,290 | ) | | | (4,303 | ) |
| | | 2.110 | | | | 04/13/2022 | | | | 09/26/2022 | | | | | | (2,139 | ) | | | (2,143 | ) |
| | | 2.110 | | | | 04/29/2022 | | | | 10/26/2022 | | | | | | (1,064 | ) | | | (1,066 | ) |
| | | 2.110 | | | | 05/10/2022 | | | | 08/10/2022 | | | | | | (437 | ) | | | (438 | ) |
| | | 2.110 | | | | 05/12/2022 | | | | 09/26/2022 | | | | | | (31,760 | ) | | | (31,821 | ) |
| | | 2.110 | | | | 07/01/2022 | | | | 09/26/2022 | | | | | | (6,856 | ) | | | (6,856 | ) |
| | | 2.120 | | | | 05/12/2022 | | | | 09/26/2022 | | | | | | (11,381 | ) | | | (11,406 | ) |
| | | 0.650 | | | | 01/13/2022 | | | | 07/14/2022 | | | | | | (1,454 | ) | | | (1,458 | ) |
| | | 0.800 | | | | 02/03/2022 | | | | 08/05/2022 | | | | | | (25,388 | ) | | | (25,472 | ) |
| | | 0.800 | | | | 03/30/2022 | | | | 08/05/2022 | | | | | | (6,286 | ) | | | (6,299 | ) |
| | | 0.800 | | | | 04/29/2022 | | | | 08/05/2022 | | | | | | (2,342 | ) | | | (2,345 | ) |
| | | 1.080 | | | | 04/06/2022 | | | | 07/06/2022 | | | | | | (1,435 | ) | | | (1,439 | ) |
| | | 1.080 | | | | 04/07/2022 | | | | 07/06/2022 | | | | | | (9,319 | ) | | | (9,343 | ) |
| | | 1.150 | | | | 03/30/2022 | | | | 09/06/2022 | | | | | | (4,008 | ) | | | (4,020 | ) |
| | | 1.150 | | | | 04/11/2022 | | | | 07/15/2022 | | | | | | (6,690 | ) | | | (6,708 | ) |
| | | 1.150 | | | | 04/13/2022 | | | | 07/13/2022 | | | | | | (12,863 | ) | | | (12,895 | ) |
| | | 1.150 | | | | 04/22/2022 | | | | 09/07/2022 | | | | | | (759 | ) | | | (761 | ) |
| | | 1.160 | | | | 04/21/2022 | | | | 07/22/2022 | | | | | | (2,085 | ) | | | (2,089 | ) |
| | | 1.350 | | | | 05/02/2022 | | | | 08/02/2022 | | | | | | (12,424 | ) | | | (12,452 | ) |
| | | 1.400 | | | | 03/21/2022 | | | | 09/16/2022 | | | | | | (363 | ) | | | (364 | ) |
| | | 1.480 | | | | 05/09/2022 | | | | 08/09/2022 | | | | | | (2,424 | ) | | | (2,429 | ) |
| | | 1.590 | | | | 04/01/2022 | | | | 09/30/2022 | | | | | | (1,006 | ) | | | (1,010 | ) |
| | | 1.590 | | | | 04/22/2022 | | | | 09/30/2022 | | | | | | (2,783 | ) | | | (2,791 | ) |
| | | 1.600 | | | | 05/06/2022 | | | | 08/05/2022 | | | | | | (6,223 | ) | | | (6,238 | ) |
| | | 1.710 | | | | 04/11/2022 | | | | 10/11/2022 | | | | | | (223 | ) | | | (224 | ) |
| | | 1.710 | | | | 04/12/2022 | | | | 10/11/2022 | | | | | | (1,642 | ) | | | (1,648 | ) |
| | | 1.740 | | | | 06/07/2022 | | | | 09/07/2022 | | | | | | (3,072 | ) | | | (3,076 | ) |
| | | 1.750 | | | | 06/10/2022 | | | | 09/12/2022 | | | | | | (14,757 | ) | | | (14,772 | ) |
| | | 1.780 | | | | 04/18/2022 | | | | 10/14/2022 | | | | | | (8,992 | ) | | | (9,025 | ) |
| | | 1.780 | | | | 07/01/2022 | | | | 10/14/2022 | | | | | | (1,895 | ) | | | (1,895 | ) |
| | | 1.850 | | | | 06/02/2022 | | | | 09/06/2022 | | | | | | (1,971 | ) | | | (1,974 | ) |
| | | 1.880 | | | | 06/06/2022 | | | | 09/06/2022 | | | | | | (16,282 | ) | | | (16,303 | ) |
| | | 1.920 | | | | 06/07/2022 | | | | 09/07/2022 | | | | | | (7,834 | ) | | | (7,844 | ) |
| | | 1.940 | | | | 06/08/2022 | | | | 09/07/2022 | | | | | | (719 | ) | | | (720 | ) |
| | | | | | |
| 88 | | PIMCO CLOSED-END FUNDS | | | See Accompanying Notes | |
| | | | | | | | | | | | | | | | | | | | | | |
| Counterparty | | | | | Settlement
Date | | | Maturity
Date | | | | | | Payable for
Reverse
Repurchase
Agreements | |
| | | 1.940 | % | | | 06/10/2022 | | | | 09/12/2022 | | | $ | | | (184 | ) | | $ | (184 | ) |
| | | 1.970 | | | | 06/14/2022 | | | | 09/14/2022 | | | | | | (2,040 | ) | | | (2,042 | ) |
| | | (0.300 | ) | | | 06/24/2022 | | | | 07/25/2022 | | | EUR | | | (5,354 | ) | | | (5,611 | ) |
| | | 0.880 | | | | 01/19/2022 | | | | 07/18/2022 | | | $ | | | (11,700 | ) | | | (11,747 | ) |
| | | 1.030 | | | | 01/21/2022 | | | | 07/20/2022 | | | | | | (2,982 | ) | | | (2,996 | ) |
| | | 1.400 | | | | 05/25/2022 | | | | TBD | | | GBP | | | (10,901 | ) | | | (13,286 | ) |
| | | 1.790 | | | | 04/25/2022 | | | | 07/29/2022 | | | $ | | | (2,203 | ) | | | (2,210 | ) |
| | | 1.790 | | | | 04/26/2022 | | | | 08/01/2022 | | | | | | (628 | ) | | | (630 | ) |
| | | 1.890 | | | | 04/25/2022 | | | | 07/29/2022 | | | | | | (12,965 | ) | | | (13,010 | ) |
| | | 1.890 | | | | 04/26/2022 | | | | 08/01/2022 | | | | | | (1,229 | ) | | | (1,233 | ) |
| | | 2.040 | | | | 04/26/2022 | | | | 08/01/2022 | | | | | | (5,288 | ) | | | (5,307 | ) |
| | | 2.500 | | | | 06/16/2022 | | | | 09/16/2022 | | | | | | (14,197 | ) | | | (14,212 | ) |
| | | (0.420 | ) | | | 05/03/2022 | | | | 08/03/2022 | | | EUR | | | (3,880 | ) | | | (4,063 | ) |
| | | (0.420 | ) | | | 05/11/2022 | | | | 08/17/2022 | | | | | | (341 | ) | | | (357 | ) |
| | | (0.350 | ) | | | 05/03/2022 | | | | 08/03/2022 | | | | | | (902 | ) | | | (945 | ) |
| | | (0.350 | ) | | | 05/09/2022 | | | | 08/08/2022 | | | | | | (13,070 | ) | | | (13,689 | ) |
| | | (0.340 | ) | | | 05/25/2022 | | | | TBD | | | | | | (817 | ) | | | (856 | ) |
| | | (0.330 | ) | | | 05/25/2022 | | | | TBD | | | | | | (405 | ) | | | (425 | ) |
| | | (0.320 | ) | | | 02/09/2022 | | | | 08/08/2022 | | | | | | (4,020 | ) | | | (4,207 | ) |
| | | (0.320 | ) | | | 05/25/2022 | | | | TBD | | | | | | (7,109 | ) | | | (7,447 | ) |
| | | (0.300 | ) | | | 03/18/2022 | | | | 09/19/2022 | | | | | | (8,962 | ) | | | (9,383 | ) |
| | | (0.300 | ) | | | 05/05/2022 | | | | 08/04/2022 | | | | | | (5,910 | ) | | | (6,191 | ) |
| | | 1.230 | | | | 04/27/2022 | | | | 07/27/2022 | | | GBP | | | (798 | ) | | | (973 | ) |
| | | 2.950 | | | | 05/27/2022 | | | | 08/29/2022 | | | $ | | | (95,021 | ) | | | (95,293 | ) |
| | | 3.000 | | | | 06/02/2022 | | | | 09/02/2022 | | | | | | (82,681 | ) | | | (82,881 | ) |
| | | (0.170 | ) | | | 04/25/2022 | | | | 07/25/2022 | | | EUR | | | (3,173 | ) | | | (3,324 | ) |
| | | 0.990 | | | | 04/01/2022 | | | | 07/01/2022 | | | $ | | | (6,608 | ) | | | (6,624 | ) |
| | | 1.010 | | | | 03/17/2022 | | | | 09/15/2022 | | | | | | (12,801 | ) | | | (12,839 | ) |
| | | 1.050 | | | | 04/06/2022 | | | | 07/06/2022 | | | | | | (13,127 | ) | | | (13,160 | ) |
| | | 1.120 | | | | 03/17/2022 | | | | 09/15/2022 | | | | | | (5,973 | ) | | | (5,993 | ) |
| | | 1.150 | | | | 03/17/2022 | | | | 09/15/2022 | | | | | | (1,481 | ) | | | (1,486 | ) |
| | | 1.550 | | | | 05/17/2022 | | | | 08/11/2022 | | | GBP | | | (857 | ) | | | (1,045 | ) |
| | | 1.610 | | | | 05/06/2022 | | | | 08/08/2022 | | | $ | | | (269 | ) | | | (269 | ) |
| | | 1.620 | | | | 05/05/2022 | | | | 08/05/2022 | | | | | | (7,034 | ) | | | (7,052 | ) |
| | | 1.620 | | | | 05/06/2022 | | | | 08/08/2022 | | | | | | (2,251 | ) | | | (2,257 | ) |
| | | 1.630 | | | | 05/06/2022 | | | | 08/08/2022 | | | | | | (1,662 | ) | | | (1,666 | ) |
| | | 1.670 | | | | 05/06/2022 | | | | 08/08/2022 | | | | | | (5,736 | ) | | | (5,751 | ) |
| | | 1.710 | | | | 06/02/2022 | | | | 09/02/2022 | | | | | | (20,445 | ) | | | (20,473 | ) |
| | | 1.770 | | | | 06/09/2022 | | | | 09/12/2022 | | | | | | (1,236 | ) | | | (1,237 | ) |
| | | 1.790 | | | | 06/10/2022 | | | | 09/13/2022 | | | | | | (4,940 | ) | | | (4,945 | ) |
| | | 1.810 | | | | 06/02/2022 | | | | 09/02/2022 | | | | | | (2,781 | ) | | | (2,785 | ) |
| | | 2.000 | | | | 05/09/2022 | | | | 11/07/2022 | | | | | | (455 | ) | | | (457 | ) |
| | | 2.100 | | | | 05/09/2022 | | | | 11/07/2022 | | | | | | (6,416 | ) | | | (6,436 | ) |
| | | 2.100 | | | | 06/23/2022 | | | | 11/07/2022 | | | | | | (9,167 | ) | | | (9,171 | ) |
| | | 2.100 | | | | 06/24/2022 | | | | 11/07/2022 | | | | | | (436 | ) | | | (436 | ) |
| | | 2.100 | | | | 06/28/2022 | | | | 11/07/2022 | | | | | | (597 | ) | | | (597 | ) |
| | | 2.110 | | | | 05/09/2022 | | | | 11/07/2022 | | | | | | (2,961 | ) | | | (2,971 | ) |
| | | 2.110 | | | | 06/23/2022 | | | | 11/07/2022 | | | | | | (1,510 | ) | | | (1,511 | ) |
| | | 2.260 | | | | 06/24/2022 | | | | 09/26/2022 | | | | | | (6,082 | ) | | | (6,085 | ) |
| | | 2.340 | | | | 06/30/2022 | | | | 09/30/2022 | | | | | | (1,800 | ) | | | (1,800 | ) |
| | | 2.340 | | | | 07/01/2022 | | | | 09/30/2022 | | | | | | (5,647 | ) | | | (5,647 | ) |
| | | 2.380 | | | | 06/24/2022 | | | | 09/26/2022 | | | | | | (18,705 | ) | | | (18,714 | ) |
| | | (5.500 | ) | | | 05/11/2022 | | | | TBD | | | EUR | | | (2,867 | ) | | | (2,981 | ) |
| | | (5.500 | ) | | | 05/19/2022 | | | | TBD | | | | | | (2,963 | ) | | | (3,084 | ) |
| | | (4.000 | ) | | | 05/19/2022 | | | | TBD | | | | | | (293 | ) | | | (306 | ) |
| | | (3.000 | ) | | | 05/19/2022 | | | | TBD | | | | | | (2,756 | ) | | | (2,878 | ) |
| | | (1.000 | ) | | | 02/18/2022 | | | | TBD | | | | | | (2,126 | ) | | | (2,220 | ) |
| | | (0.950 | ) | | | 05/10/2022 | | | | TBD | | | | | | (1,533 | ) | | | (1,604 | ) |
| | | (0.450 | ) | | | 06/24/2022 | | | | TBD | | | | | | (15,521 | ) | | | (16,263 | ) |
| | | (0.400 | ) | | | 10/08/2021 | | | | TBD | | | | | | (16,636 | ) | | | (17,379 | ) |
| | | (0.400 | ) | | | 11/02/2021 | | | | TBD | | | | | | (11,875 | ) | | | (12,409 | ) |
| | | (0.400 | ) | | | 05/10/2022 | | | | 08/09/2022 | | | | | | (1,469 | ) | | | (1,539 | ) |
| | | (0.380 | ) | | | 04/27/2022 | | | | 07/27/2022 | | | | | | (5,079 | ) | | | (5,319 | ) |
| | | (0.380 | ) | | | 05/05/2022 | | | | 08/04/2022 | | | | | | (31,506 | ) | | | (32,996 | ) |
| | | (0.380 | ) | | | 05/10/2022 | | | | 08/09/2022 | | | | | | (3,648 | ) | | | (3,821 | ) |
| | | (0.380 | ) | | | 05/17/2022 | | | | 08/17/2022 | | | | | | (8,596 | ) | | | (9,004 | ) |
| | | (0.360 | ) | | | 05/02/2022 | | | | 07/29/2022 | | | | | | (60,494 | ) | | | (63,357 | ) |
| | | (0.350 | ) | | | 05/05/2022 | | | | 08/04/2022 | | | | | | (1,625 | ) | | | (1,702 | ) |
| | | (0.350 | ) | | | 05/10/2022 | | | | 08/09/2022 | | | | | | (1,899 | ) | | | (1,989 | ) |
| | | 0.030 | | | | 05/11/2022 | | | | 08/17/2022 | | | | | | (2,038 | ) | | | (2,136 | ) |
| | | | | | | | | | | | |
| See Accompanying Notes | | | ANNUAL REPORT | | | | | | | JUNE 30, 2022 | | | 89 |
| | | | | | | | |
Consolidated Schedule of Investments | | PIMCO Dynamic Income Fund | | | | | | |
| | | | | | | | | | | | | | | | | | | | | | |
| Counterparty | | | | | Settlement
Date | | | Maturity
Date | | | | | | Payable for
Reverse
Repurchase
Agreements | |
| | | 1.250 | % | | | 04/19/2022 | | | | 07/19/2022 | | | GBP | | | (5,432 | ) | | $ | (6,630 | ) |
| | | 1.400 | | | | 05/06/2022 | | | | 08/04/2022 | | | | | | (1,832 | ) | | | (2,234 | ) |
| | | 1.520 | | | | 04/14/2022 | | | | 07/14/2022 | | | $ | | | (14,503 | ) | | | (14,551 | ) |
| | | 1.600 | | | | 06/09/2022 | | | | 09/08/2022 | | | GBP | | | (987 | ) | | | (1,203 | ) |
| | | 1.620 | | | | 04/14/2022 | | | | 07/14/2022 | | | $ | | | (18,824 | ) | | | (18,890 | ) |
| | | 1.700 | | | | 04/28/2022 | | | | 07/28/2022 | | | GBP | | | (5,459 | ) | | | (6,666 | ) |
| | | 1.750 | | | | 04/28/2022 | | | | 07/28/2022 | | | | | | (6,729 | ) | | | (8,217 | ) |
| | | 1.760 | | | | 05/02/2022 | | | | 08/02/2022 | | | $ | | | (25,851 | ) | | | (25,927 | ) |
| | | 1.800 | | | | 04/28/2022 | | | | 07/28/2022 | | | GBP | | | (1,991 | ) | | | (2,432 | ) |
| | | 1.800 | | | | 06/27/2022 | | | | 07/29/2022 | | | $ | | | (15,559 | ) | | | (15,562 | ) |
| | | 1.820 | | | | 05/12/2022 | | | | 08/12/2022 | | | | | | (134 | ) | | | (135 | ) |
| | | 1.870 | | | | 05/12/2022 | | | | 08/12/2022 | | | | | | (4,038 | ) | | | (4,048 | ) |
| | | 1.900 | | | | 06/17/2022 | | | | 07/29/2022 | | | | | | (2,914 | ) | | | (2,916 | ) |
| | | 1.950 | | | | 06/17/2022 | | | | 07/29/2022 | | | | | | (20,706 | ) | | | (20,721 | ) |
| | | 2.000 | | | | 06/17/2022 | | | | 07/29/2022 | | | | | | (40,314 | ) | | | (40,345 | ) |
| | | 2.050 | | | | 05/17/2022 | | | | 08/17/2022 | | | | | | (2,612 | ) | | | (2,619 | ) |
| | | 2.050 | | | | 06/17/2022 | | | | 07/29/2022 | | | | | | (440 | ) | | | (441 | ) |
| | | 1.590 | | | | 04/28/2022 | | | | 07/28/2022 | | | GBP | | | (11,285 | ) | | | (13,776 | ) |
| | | 1.640 | | | | 04/28/2022 | | | | 07/28/2022 | | | | | | (7,625 | ) | | | (9,310 | ) |
| | | 2.250 | | | | 05/24/2022 | | | | 08/24/2022 | | | $ | | | (8,158 | ) | | | (8,178 | ) |
| | | 1.370 | | | | 04/19/2022 | | | | 07/20/2022 | | | | | | (3,888 | ) | | | (3,899 | ) |
| | | 1.390 | | | | 04/19/2022 | | | | 07/20/2022 | | | | | | (22,594 | ) | | | (22,658 | ) |
| | | 1.450 | | | | 04/21/2022 | | | | 07/22/2022 | | | | | | (1,425 | ) | | | (1,429 | ) |
| | | 1.450 | | | | 04/25/2022 | | | | 07/26/2022 | | | | | | (1,608 | ) | | | (1,613 | ) |
| | | 1.850 | | | | 03/31/2022 | | | | TBD | | | | | | (2,692 | ) | | | (2,696 | ) |
| | | 2.190 | | | | 06/02/2022 | | | | 09/01/2022 | | | | | | (3,542 | ) | | | (3,548 | ) |
| | | 2.904 | | | | 06/24/2022 | | | | 09/23/2022 | | | | | | (23,765 | ) | | | (23,778 | ) |
| | | 1.000 | | | | 03/28/2022 | | | | 07/01/2022 | | | | | | (3,675 | ) | | | (3,685 | ) |
| | | 1.000 | | | | 03/29/2022 | | | | 07/01/2022 | | | | | | (11,453 | ) | | | (11,483 | ) |
| | | 1.000 | | | | 04/14/2022 | | | | 07/01/2022 | | | | | | (550 | ) | | | (551 | ) |
| | | 1.850 | | | | 06/17/2022 | | | | TBD | | | | | | (803 | ) | | | (803 | ) |
| | | 2.050 | | | | 06/13/2022 | | | | 09/13/2022 | | | | | | (4,601 | ) | | | (4,605 | ) |
| | | 2.200 | | | | 07/01/2022 | | | | 08/01/2022 | | | | | | (8,417 | ) | | | (8,417 | ) |
| | | 2.450 | | | | 06/17/2022 | | | | TBD | | | | | | (21,105 | ) | | | (21,125 | ) |
| | | 2.500 | | | | 06/09/2022 | | | | 07/05/2022 | | | | | | (14,236 | ) | | | (14,258 | ) |
| | | 2.700 | | | | 06/24/2022 | | | | 09/23/2022 | | | | | | (24,032 | ) | | | (24,045 | ) |
| | | 2.750 | | | | 06/24/2022 | | | | 09/23/2022 | | | | | | (5,249 | ) | | | (5,251 | ) |
| | | 0.940 | | | | 01/10/2022 | | | | 07/11/2022 | | | | | | (3,350 | ) | | | (3,365 | ) |
| | | 2.680 | | | | 06/01/2022 | | | | 07/01/2022 | | | | | | (23,520 | ) | | | (23,558 | ) |
| | | 2.710 | | | | 07/01/2022 | | | | 07/29/2022 | | | | | | (22,866 | ) | | | (22,866 | ) |
| | | (8.000 | ) | | | 06/30/2022 | | | | TBD | | | EUR | | | (724 | ) | | | (759 | ) |
| | | (2.000 | ) | | | 05/27/2022 | | | | TBD | | | | | | (2,974 | ) | | | (3,108 | ) |
| | | (2.000 | ) | | | 06/30/2022 | | | | TBD | | | | | | (2,182 | ) | | | (2,286 | ) |
| | | (1.000 | ) | | | 05/27/2022 | | | | TBD | | | | | | (6,096 | ) | | | (6,382 | ) |
| | | (1.000 | ) | | | 06/30/2022 | | | | TBD | | | | | | (9,549 | ) | | | (10,006 | ) |
| | | (0.450 | ) | | | 06/30/2022 | | | | TBD | | | | | | (19,413 | ) | | | (20,344 | ) |
| | | (0.400 | ) | | | 05/27/2022 | | | | TBD | | | | | | (477 | ) | | | (500 | ) |
| | | (0.300 | ) | | | 02/09/2022 | | | | 08/08/2022 | | | | | | (2,956 | ) | | | (3,094 | ) |
| | | (0.290 | ) | | | 05/09/2022 | | | | 08/08/2022 | | | | | | (6,482 | ) | | | (6,790 | ) |
| | | 0.050 | | | | 06/23/2022 | | | | 09/22/2022 | | | | | | (8,275 | ) | | | (8,672 | ) |
| | | 1.450 | | | | 05/04/2022 | | | | 08/04/2022 | | | $ | | | (9,472 | ) | | | (9,494 | ) |
| | | 1.800 | | | | 06/17/2022 | | | | 07/12/2022 | | | | | | (2,770 | ) | | | (2,772 | ) |
| | | 2.420 | | | | 06/24/2022 | | | | 09/26/2022 | | | | | | (25,055 | ) | | | (25,067 | ) |
| | | 2.420 | | | | 06/27/2022 | | | | 09/26/2022 | | | | | | (8,007 | ) | | | (8,009 | ) |
| | | 2.620 | | | | 06/24/2022 | | | | 09/26/2022 | | | | | | (983 | ) | | | (984 | ) |
| | | 2.320 | | | | 04/01/2022 | | | | 07/01/2022 | | | | | | (6,147 | ) | | | (6,164 | ) |
| | | 2.330 | | | | 06/17/2022 | | | | 09/01/2022 | | | | | | (4,340 | ) | | | (4,343 | ) |
| | | 2.510 | | | | 07/01/2022 | | | | 10/03/2022 | | | | | | (5,581 | ) | | | (5,581 | ) |
| | | (0.440 | ) | | | 05/09/2022 | | | | 08/08/2022 | | | EUR | | | (19,132 | ) | | | (20,036 | ) |
| | | (0.440 | ) | | | 05/11/2022 | | | | 08/17/2022 | | | | | | (1,449 | ) | | | (1,518 | ) |
| | | (0.420 | ) | | | 04/19/2022 | | | | 07/19/2022 | | | | | | (7,577 | ) | | | (7,933 | ) |
| | | (0.370 | ) | | | 05/11/2022 | | | | 08/17/2022 | | | | | | (7,174 | ) | | | (7,514 | ) |
| | | (0.320 | ) | | | 04/19/2022 | | | | 07/19/2022 | | | | | | (2,219 | ) | | | (2,324 | ) |
| | | 0.570 | | | | 01/07/2022 | | | | 07/06/2022 | | | | | | (1,681 | ) | | | (1,686 | ) |
| | | 0.570 | | | | 01/07/2022 | | | | 07/08/2022 | | | | | | (1,797 | ) | | | (1,802 | ) |
| | | 0.670 | | | | 01/07/2022 | | | | 07/06/2022 | | | | | | (19,316 | ) | | | (19,379 | ) |
| | | 0.670 | | | | 01/07/2022 | | | | 07/08/2022 | | | | | | (37,758 | ) | | | (37,881 | ) |
| | | 0.670 | | | | 01/31/2022 | | | | 07/08/2022 | | | | | | (1,567 | ) | | | (1,572 | ) |
| | | 0.670 | | | | 03/30/2022 | | | | 07/06/2022 | | | | | | (415 | ) | | | (416 | ) |
| | | 0.670 | | | | 04/07/2022 | | | | 07/06/2022 | | | | | | (10,240 | ) | | | (10,257 | ) |
| | | | | | |
| 90 | | PIMCO CLOSED-END FUNDS | | | See Accompanying Notes | |
| | | | | | | | | | | | | | | | | | | | | | |
| Counterparty | | | | | Settlement
Date | | | Maturity
Date | | | | | | Payable for
Reverse
Repurchase
Agreements | |
| | | 0.670 | % | | | 04/11/2022 | | | | 07/06/2022 | | | EUR | | | (4,972 | ) | | $ | (4,980 | ) |
| | | 0.670 | | | | 04/14/2022 | | | | 07/06/2022 | | | | | | (245 | ) | | | (245 | ) |
| | | 0.670 | | | | 04/29/2022 | | | | 07/06/2022 | | | | | | (687 | ) | | | (687 | ) |
| | | 0.670 | | | | 05/26/2022 | | | | 07/06/2022 | | | | | | (1,080 | ) | | | (1,080 | ) |
| | | 0.670 | | | | 06/17/2022 | | | | 07/08/2022 | | | | | | (716 | ) | | | (717 | ) |
| | | 1.070 | | | | 02/03/2022 | | | | 08/03/2022 | | | | | | (66,681 | ) | | | (66,974 | ) |
| | | 1.290 | | | | 06/03/2022 | | | | 07/05/2022 | | | | | | (3,581 | ) | | | (3,585 | ) |
| | | 1.420 | | | | 04/13/2022 | | | | 07/13/2022 | | | | | | (20,960 | ) | | | (21,025 | ) |
| | | 1.430 | | | | 04/19/2022 | | | | 07/25/2022 | | | | | | (2,321 | ) | | | (2,328 | ) |
| | | 1.480 | | | | 04/21/2022 | | | | 07/25/2022 | | | | | | (1,196 | ) | | | (1,199 | ) |
| | | 1.480 | | | | 04/25/2022 | | | | 07/29/2022 | | | | | | (2,317 | ) | | | (2,323 | ) |
| | | 1.500 | | | | 04/27/2022 | | | | 08/01/2022 | | | | | | (3,950 | ) | | | (3,960 | ) |
| | | 1.580 | | | | 05/03/2022 | | | | 08/03/2022 | | | | | | (10,794 | ) | | | (10,822 | ) |
| | | 1.580 | | | | 06/10/2022 | | | | 08/03/2022 | | | | | | (677 | ) | | | (678 | ) |
| | | 1.620 | | | | 05/04/2022 | | | | 08/04/2022 | | | | | | (41,549 | ) | | | (41,657 | ) |
| | | 1.620 | | | | 06/03/2022 | | | | 08/04/2022 | | | | | | (573 | ) | | | (574 | ) |
| | | 1.630 | | | | 05/05/2022 | | | | 08/05/2022 | | | | | | (7,841 | ) | | | (7,861 | ) |
| | | 1.640 | | | | 05/06/2022 | | | | 08/08/2022 | | | | | | (7,965 | ) | | | (7,986 | ) |
| | | 1.660 | | | | 05/09/2022 | | | | 08/12/2022 | | | | | | (8,224 | ) | | | (8,244 | ) |
| | | 1.670 | | | | 05/09/2022 | | | | 08/09/2022 | | | | | | (4,418 | ) | | | (4,429 | ) |
| | | 1.670 | | | | 06/06/2022 | | | | 08/09/2022 | | | | | | (2,955 | ) | | | (2,959 | ) |
| | | 1.720 | | | | 05/16/2022 | | | | 08/12/2022 | | | | | | (7,863 | ) | | | (7,881 | ) |
| | | 1.750 | | | | 03/28/2022 | | | | 09/27/2022 | | | | | | (2,489 | ) | | | (2,501 | ) |
| | | 1.900 | | | | 05/31/2022 | | | | 08/31/2022 | | | | | | (25,801 | ) | | | (25,843 | ) |
| | | 1.900 | | | | 06/02/2022 | | | | 08/31/2022 | | | | | | (18,313 | ) | | | (18,341 | ) |
| | | 1.900 | | | | 06/24/2022 | | | | 08/31/2022 | | | | | | (1,403 | ) | | | (1,403 | ) |
| | | 1.980 | | | | 07/05/2022 | | | | 08/04/2022 | | | | | | (1,663 | ) | | | (1,663 | ) |
| | | 2.000 | | | | 05/02/2022 | | | | 07/29/2022 | | | | | | (12,922 | ) | | | (12,965 | ) |
| | | 2.000 | | | | 05/11/2022 | | | | 08/09/2022 | | | | | | (13,601 | ) | | | (13,640 | ) |
| | | 2.050 | | | | 05/11/2022 | | | | 08/09/2022 | | | | | | (20,755 | ) | | | (20,815 | ) |
| | | 2.130 | | | | 06/16/2022 | | | | 09/19/2022 | | | | | | (21,603 | ) | | | (21,622 | ) |
| | | 2.181 | | | | 05/24/2022 | | | | 08/24/2022 | | | | | | (22,116 | ) | | | (22,167 | ) |
| | | 2.192 | | | | 05/25/2022 | | | | 08/25/2022 | | | | | | (9,815 | ) | | | (9,837 | ) |
| | | 2.520 | | | | 06/21/2022 | | | | 09/21/2022 | | | | | | (857 | ) | | | (858 | ) |
| | | 2.580 | | | | 07/05/2022 | | | | 10/06/2022 | | | | | | (3,119 | ) | | | (3,119 | ) |
| | | 2.620 | | | | 06/30/2022 | | | | 09/30/2022 | | | | | | (1,881 | ) | | | (1,881 | ) |
| | | 2.680 | | | | 07/05/2022 | | | | 10/06/2022 | | | | | | (144 | ) | | | (144 | ) |
| | | 2.706 | | | | 06/16/2022 | | | | 09/16/2022 | | | | | | (2,120 | ) | | | (2,122 | ) |
| | | 2.756 | | | | 06/16/2022 | | | | 09/16/2022 | | | | | | (12,662 | ) | | | (12,676 | ) |
| | | 2.889 | | | | 06/27/2022 | | | | 09/23/2022 | | | | | | (6,507 | ) | | | (6,509 | ) |
| | | (0.075 | ) | | | 04/26/2022 | | | | 07/26/2022 | | | EUR | | | (2,929 | ) | | | (3,069 | ) |
| | | (0.052 | ) | | | 05/11/2022 | | | | 08/17/2022 | | | | | | (9,742 | ) | | | (10,208 | ) |
| | | (0.040 | ) | | | 06/01/2022 | | | | 08/31/2022 | | | | | | (2,361 | ) | | | (2,474 | ) |
| | | 0.150 | | | | 05/18/2022 | | | | 08/16/2022 | | | EUR | | | (5,338 | ) | | | (5,595 | ) |
| | | 1.000 | | | | 01/20/2022 | | | | 07/19/2022 | | | $ | | �� | (58,611 | ) | | | (58,874 | ) |
| | | 1.050 | | | | 01/21/2022 | | | | 07/20/2022 | | | | | | (50,167 | ) | | | (50,403 | ) |
| | | 1.100 | | | | 01/21/2022 | | | | 07/20/2022 | | | | | | (5,211 | ) | | | (5,237 | ) |
| | | 1.300 | | | | 04/01/2022 | | | | 07/01/2022 | | | | | | (22,068 | ) | | | (22,141 | ) |
| | | 1.350 | | | | 04/11/2022 | | | | 07/12/2022 | | | | | | (177 | ) | | | (177 | ) |
| | | 1.350 | | | | 04/12/2022 | | | | 07/13/2022 | | | | | | (556 | ) | | | (558 | ) |
| | | 1.350 | | | | 04/14/2022 | | | | 07/14/2022 | | | | | | (25,660 | ) | | | (25,735 | ) |
| | | 1.350 | | | | 04/18/2022 | | | | 07/20/2022 | | | | | | (35,548 | ) | | | (35,646 | ) |
| | | 1.350 | | | | 06/29/2022 | | | | 07/13/2022 | | | | | | (299 | ) | | | (299 | ) |
| | | 1.500 | | | | 06/07/2022 | | | | TBD | | | GBP | | | (1,808 | ) | | | (2,202 | ) |
| | | 1.600 | | | | 04/08/2022 | | | | 07/08/2022 | | | $ | | | (12,326 | ) | | | (12,372 | ) |
| | | 1.630 | | | | 05/02/2022 | | | | 08/02/2022 | | | | | | (11,170 | ) | | | (11,201 | ) |
| | | 1.690 | | | | 05/05/2022 | | | | 08/05/2022 | | | | | | (5,109 | ) | | | (5,123 | ) |
| | | 1.690 | | | | 05/06/2022 | | | | 08/05/2022 | | | GBP | | | (2,447 | ) | | | (2,987 | ) |
| | | 1.690 | | | | 06/29/2022 | | | | 08/05/2022 | | | $ | | | (4,829 | ) | | | (4,829 | ) |
| | | 1.700 | | | | 05/09/2022 | | | | 08/09/2022 | | | | | | (3,562 | ) | | | (3,571 | ) |
| | | 1.700 | | | | 05/12/2022 | | | | 08/12/2022 | | | | | | (40,927 | ) | | | (41,024 | ) |
| | | 1.800 | | | | 03/17/2022 | | | | 09/16/2022 | | | | | | (18,886 | ) | | | (18,986 | ) |
| | | 1.900 | | | | 06/17/2022 | | | | TBD | | | | | | (12,080 | ) | | | (12,089 | ) |
| | | 1.950 | | | | 05/03/2022 | | | | 08/03/2022 | | | | | | (16,896 | ) | | | (16,950 | ) |
| | | 2.270 | | | | 06/01/2022 | | | | 09/02/2022 | | | | | | (12,258 | ) | | | (12,282 | ) |
| | | 2.280 | | | | 06/03/2022 | | | | 09/02/2022 | | | | | | (42,518 | ) | | | (42,593 | ) |
| | | 2.300 | | | | 06/02/2022 | | | | 09/02/2022 | | | | | | (2,588 | ) | | | (2,593 | ) |
| | | 2.350 | | | | 06/17/2022 | | | | 09/19/2022 | | | | | | (295 | ) | | | (296 | ) |
| | | 2.360 | | | | 06/06/2022 | | | | 09/07/2022 | | | | | | (28,807 | ) | | | (28,854 | ) |
| | | 2.370 | | | | 06/02/2022 | | | | 09/02/2022 | | | | | | (1,819 | ) | | | (1,822 | ) |
| | | | | | | | | | | | |
| See Accompanying Notes | | | ANNUAL REPORT | | | | | | | JUNE 30, 2022 | | | 91 |
| | | | | | | | |
Consolidated Schedule of Investments | | PIMCO Dynamic Income Fund | | | | | | |
| | | | | | | | | | | | | | | | | | | | | | |
| Counterparty | | | | | Settlement
Date | | | Maturity
Date | | | | | | Payable for
Reverse
Repurchase
Agreements | |
| | | 2.450 | % | | | 06/17/2022 | | | | 09/19/2022 | | | $ | | | (4,037 | ) | | $ | (4,041 | ) |
| | | 2.600 | | | | 06/17/2022 | | | | 09/19/2022 | | | | | | (40,701 | ) | | | (40,742 | ) |
| | | 2.700 | | | | 07/01/2022 | | | | 10/03/2022 | | | | | | (18,458 | ) | | | (18,458 | ) |
| | | 2.750 | | | | 07/01/2022 | | | | 10/03/2022 | | | | | | (42,714 | ) | | | (42,714 | ) |
| | | | | | | | | | | | | | | | | | | | | | |
Total Reverse Repurchase Agreements | | | | | | | | | | | | | | | |
| | | | | | | | | | | | | | | | | | | | | | |
SHORT SALES:
| | | | | | | | | | | | | | | | | | | | |
| | | | | | | | | | | | | | | |
Loan Participations and Assignments 0.0% | |
| | | 1.000% | | | | 09/29/2028 | | | $ | 1,929 | | | $ | (1,926 | ) | | $ | (1,872 | ) |
| | | | | | | | | | | | | | | | | | | | |
| | | | | | | | | | | | | | | | | | | | |
| | | | | | | | | | | | | | | | | | | | |
BORROWINGS AND OTHER FINANCING TRANSACTIONS SUMMARY
The following is a summary by counterparty of the market value of Borrowings and Other Financing Transactions and collateral pledged/(received) as of June 30, 2022:
| | | | | | | | | | | | | | | | | | | | | | | | |
| | Repurchase Agreement Proceeds to be Received (1) | | | Payable for
Reverse
Repurchase
Agreements | | | Payable for Sale-Buyback Transactions | | | Total
Borrowings and
Other Financing
Transactions | | | Collateral
Pledged/(Received) | | | | |
Global/Master Repurchase Agreement | |
| | $ | 0 | | | $ | (287,978 | ) | | $ | 0 | | | $ | (287,978 | ) | | $ | 307,288 | | | $ | 19,310 | |
| | | 0 | | | | (13,758 | ) | | | 0 | | | | (13,758 | ) | | | 16,882 | | | | 3,124 | |
| | | 0 | | | | (70,874 | ) | | | 0 | | | | (70,874 | ) | | | 83,875 | | | | 13,001 | |
| | | 0 | | | | (494,814 | ) | | | 0 | | | | (494,814 | ) | | | 581,712 | | | | 86,898 | |
| | | 0 | | | | (802,066 | ) | | | 0 | | | | (802,066 | ) | | | 893,442 | | | | 91,376 | |
| | | 0 | | | | (61,290 | ) | | | 0 | | | | (61,290 | ) | | | 60,450 | | | | (840 | ) |
| | | 0 | | | | (157,820 | ) | | | 0 | | | | (157,820 | ) | | | 171,909 | | | | 14,089 | |
| | | 0 | | | | (5,611 | ) | | | 0 | | | | (5,611 | ) | | | 5,512 | | | | (99 | ) |
| | | 0 | | | | (50,419 | ) | | | 0 | | | | (50,419 | ) | | | 59,901 | | | | 9,482 | |
| | | 0 | | | | (14,212 | ) | | | 0 | | | | (14,212 | ) | | | 17,311 | | | | 3,099 | |
| | | 0 | | | | (48,536 | ) | | | 0 | | | | (48,536 | ) | | | 48,021 | | | | (515 | ) |
| | | 255,550 | | | | 0 | | | | 0 | | | | 255,550 | | | | (260,651 | ) | | | (5,101 | ) |
| | | 0 | | | | (178,174 | ) | | | 0 | | | | (178,174 | ) | | | 249,467 | | | | 71,293 | |
| | | 0 | | | | (144,731 | ) | | | 0 | | | | (144,731 | ) | | | 153,684 | | | | 8,953 | |
| | | 0 | | | | (354,524 | ) | | | 0 | | | | (354,524 | ) | | | 401,915 | | | | 47,391 | |
| | | 0 | | | | (31,264 | ) | | | 0 | | | | (31,264 | ) | | | 38,354 | | | | 7,090 | |
| | | 0 | | | | (32,295 | ) | | | 0 | | | | (32,295 | ) | | | 36,794 | | | | 4,499 | |
| | | 0 | | | | (27,326 | ) | | | 0 | | | | (27,326 | ) | | | 36,104 | | | | 8,778 | |
| | | 0 | | | | (94,223 | ) | | | 0 | | | | (94,223 | ) | | | 100,299 | | | | 6,076 | |
| | | 0 | | | | (49,789 | ) | | | 0 | | | | (49,789 | ) | | | 37,830 | | | | (11,959 | ) |
| | | 0 | | | | (61,941 | ) | | | 0 | | | | (61,941 | ) | | | 63,060 | | | | 1,119 | |
| | | 0 | | | | (46,326 | ) | | | 0 | | | | (46,326 | ) | | | 48,527 | | | | 2,201 | |
| | | 0 | | | | (16,088 | ) | | | 0 | | | | (16,088 | ) | | | 12,534 | | | | (3,554 | ) |
| | | 0 | | | | (39,325 | ) | | | 0 | | | | (39,325 | ) | | | 40,902 | | | | 1,577 | |
| | | 0 | | | | (453,293 | ) | | | 0 | | | | (453,293 | ) | | | 531,858 | | | | 78,565 | |
| | | 0 | | | | (546,145 | ) | | | 0 | | | | (546,145 | ) | | | 566,539 | | | | 20,394 | |
| | | | | | | | | | | | | | | | | | | | | | | | |
Total Borrowings and Other Financing Transactions | | | | | | | | | | | | | | | | | | | | | | | | |
| | | | | | | | | | | | | | | | | | | | | | | | |
CERTAIN TRANSFERS ACCOUNTED FOR AS SECURED BORROWINGS
Remaining Contractual Maturity of the Agreements
| | | | | | | | | | | | | | | | | | | | |
| | | | | | | | | | | | | | | | |
Reverse Repurchase Agreements | |
| | $ | (68,042 | ) | | $ | (315,433 | ) | | $ | (975,823 | ) | | $ | (352,522 | ) | | $ | (1,711,820 | ) |
Convertible Bonds & Notes | | | (6,164 | ) | | | 0 | | | | (6,190 | ) | | | (21,125 | ) | | | (33,479 | ) |
| | | 0 | | | | (5,237 | ) | | | (42,720 | ) | | | (13,104 | ) | | | (61,061 | ) |
Non-Agency Mortgage-Backed Securities | | | (34,402 | ) | | | (226,302 | ) | | | (696,642 | ) | | | (42,564 | ) | | | (999,910 | ) |
| | | (66,361 | ) | | | (111,050 | ) | | | (522,580 | ) | | | (52,068 | ) | | | (752,059 | ) |
| | | 0 | | | | (90,301 | ) | | | (38,269 | ) | | | (8,630 | ) | | | (137,200 | ) |
| | | 0 | | | | (74,598 | ) | | | (45,542 | ) | | | (6,535 | ) | | | (126,675 | ) |
| | | | | | | | | | | | | | | | | | | | |
| | | | | | | | | | | | | | | | | | | | |
| | | | | | | | | | | | | | | | | | | | |
Payable for reverse repurchase agreements (5) | | | | | |
| | | | | |
| Securities with an aggregate market value of $4,492,641 and cash of $71,531 have been pledged as collateral under the terms of the above master agreements as of June 30, 2022. |
| Includes accrued interest. |
| The average amount of borrowings outstanding during the period ended June 30, 2022 was $(4,005,477) at a weighted average interest rate of 1.585%. Average borrowings may include reverse repurchase agreements and sale-buyback transactions, if held during the period. The amounts reflect the cumulative total activity of PIMCO Dynamic Income Fund, PIMCO Income Opportunity Fund, and PIMCO Dynamic Credit and Mortgage Income Fund during the period. |
| Open maturity reverse repurchase agreement. |
| Net Exposure represents the net receivable/(payable) that would be due from/to the counterparty in the event of default. Exposure from borrowings and other financing transactions can only be netted across transactions governed under the same master agreement with the same legal entity. See Note 8, Master Netting Arrangements, in the Notes to Financial Statements for more information. |
| Unsettled reverse repurchase agreements liability of $(260,618) is outstanding at period end. |
(n) FINANCIAL DERIVATIVE INSTRUMENTS: EXCHANGE-TRADED OR CENTRALLY CLEARED
SWAP AGREEMENTS:
CREDIT DEFAULT SWAPS ON CORPORATE ISSUES - SELL PROTECTION
(1)
| | | | | | | | | | | | | | | | | | | | | | | | | | | | | | | | | | | | | | | | |
| | | | | | | | | | | Implied Credit Spread at June 30, 2022 (2) | | | | | | | | | Unrealized
Appreciation/
(Depreciation) | | | | | | | |
| | | | | | |
| | | 1.000 | % | | | Quarterly | | | | 12/20/2025 | | | | 3.043 | % | | | EUR 100 | | | $ | (4 | ) | | $ | (3 | ) | | $ | (7 | ) | | $ | 0 | | | $ | (1 | ) |
| | | 5.000 | | | | Quarterly | | | | 06/20/2024 | | | | 7.828 | | | | $ 3,800 | | | | (38 | ) | | | (142 | ) | | | (180 | ) | | | 5 | | | | 0 | |
| | | 5.000 | | | | Quarterly | | | | 12/20/2024 | | | | 8.213 | | | | 2,100 | | | | (7 | ) | | | (130 | ) | | | (137 | ) | | | 0 | | | | (1 | ) |
| | | 5.000 | | | | Quarterly | | | | 06/20/2025 | | | | 8.463 | | | | 400 | | | | (30 | ) | | | (3 | ) | | | (33 | ) | | | 0 | | | | 0 | |
Jaguar Land Rover Automotive | | | 5.000 | | | | Quarterly | | | | 06/20/2026 | | | | 9.623 | | | | EUR 600 | | | | 38 | | | | (124 | ) | | | (86 | ) | | | 0 | | | | (11 | ) |
Jaguar Land Rover Automotive | | | 5.000 | | | | Quarterly | | | | 12/20/2026 | | | | 9.833 | | | | 12,613 | | | | 637 | | | | (2,680 | ) | | | (2,043 | ) | | | 0 | | | | (238 | ) |
| | | 1.000 | | | | Quarterly | | | | 06/20/2027 | | | | 4.406 | | | | 8,300 | | | | (723 | ) | | | (524 | ) | | | (1,247 | ) | | | 0 | | | | (78 | ) |
| | | 1.000 | | | | Quarterly | | | | 12/20/2025 | | | | 3.940 | | | | 15,000 | | | | (1,729 | ) | | | 266 | | | | (1,463 | ) | | | 0 | | | | (128 | ) |
| | | 1.000 | | | | Quarterly | | | | 06/20/2026 | | | | 4.096 | | | | 21,400 | | | | (1,566 | ) | | | (887 | ) | | | (2,453 | ) | | | 0 | | | | (204 | ) |
| | | 1.000 | | | | Quarterly | | | | 12/20/2026 | | | | 4.270 | | | | 35,000 | | | | (2,182 | ) | | | (2,473 | ) | | | (4,655 | ) | | | 0 | | | | (357 | ) |
| | | | | | | | | | | | | | | | | | | | | | | | | | | | | | | | | | | | | | | | |
| | | | | | | | | | | | | | | $ | (5,604 | ) | | $ | (6,700 | ) | | $ | (12,304 | ) | | $ | 5 | | | $ | (1,018 | ) |
| | | | | | | | | | | | | | | | | | | | | | | | | | | | | | | | | |
INTEREST RATE SWAPS
| | | | | | | | | | | | | | | | | | | | | | | | | | | | | | | | | | | | | | | | |
| | | | | | | | | | | | | | | | | | Unrealized
Appreciation/
(Depreciation) | | | | | | | |
| | | | | | |
| | | | | 0.500 | % | | Annual | | | 09/16/2030 | | | | GBP | | | | 27,000 | | | $ | 335 | | | $ | 4,241 | | | $ | 4,576 | | | $ | 0 | | | $ | (430 | ) |
| | | | | 0.750 | | | Annual | | | 09/21/2052 | | | | | | | | 47,600 | | | | (1,113 | ) | | | 19,431 | | | | 18,318 | | | | 0 | | | | (1,416 | ) |
| | 1-Day USD-SOFR Compounded-OIS | | | 1.000 | | | Annual | | | 12/15/2026 | | | | $ | | | | 11,200 | | | | 21 | | | | (823 | ) | | | (802 | ) | | | 59 | | | | 0 | |
| | | | | 1.500 | | | Annual | | | 12/15/2031 | | | | | | | | 98,500 | | | | (2,199 | ) | | | 12,200 | | | | 10,001 | | | | 0 | | | | (780 | ) |
| | | | | 1.750 | | | Annual | | | 12/15/2051 | | | | | | | | 25,100 | | | | (2,442 | ) | | | 6,860 | | | | 4,418 | | | | 0 | | | | (226 | ) |
| | | | | 6.170 | | | Maturity | | | 01/02/2023 | | | | BRL | | | | 599,300 | | | | (111 | ) | | | (5,403 | ) | | | (5,514 | ) | | | 23 | | | | 0 | |
| | | | | 12.670 | | | Maturity | | | 01/02/2023 | | | | | | | | 23,500 | | | | 0 | | | | 17 | | | | 17 | | | | 0 | | | | (1 | ) |
| | | | | 12.690 | | | Maturity | | | 01/02/2023 | | | | | | | | 15,600 | | | | 0 | | | | 11 | | | | 11 | | | | 0 | | | | (1 | ) |
| | | | | 12.740 | | | Maturity | | | 01/02/2023 | | | | | | | | 40,500 | | | | 0 | | | | 25 | | | | 25 | | | | 0 | | | | (1 | ) |
| | | | | 12.750 | | | Maturity | | | 01/02/2023 | | | | | | | | 19,400 | | | | 0 | | | | 12 | | | | 12 | | | | 0 | | | | (1 | ) |
| | | | | 12.760 | | | Maturity | | | 01/02/2023 | | | | | | | | 40,400 | | | | 0 | | | | 24 | | | | 24 | | | | 0 | | | | (1 | ) |
| | | | | 12.900 | | | Maturity | | | 01/02/2023 | | | | | | | | 82,600 | | | | 0 | | | | 33 | | | | 33 | | | | 0 | | | | (3 | ) |
| | | | | 12.930 | | | Maturity | | | 01/02/2023 | | | | | | | | 10,200 | | | | 0 | | | | 4 | | | | 4 | | | | 0 | | | | 0 | |
| | | | | 12.939 | | | Maturity | | | 01/02/2023 | | | | | | | | 41,300 | | | | 0 | | | | 14 | | | | 14 | | | | 0 | | | | (1 | ) |
| | | | | 12.946 | | | Maturity | | | 01/02/2023 | | | | | | | | 103,700 | | | | 0 | | | | 36 | | | | 36 | | | | 0 | | | | (4 | ) |
| | | | | 12.960 | | | Maturity | | | 01/02/2023 | | | | | | | | 82,600 | | | | 0 | | | | 27 | | | | 27 | | | | 0 | | | | (3 | ) |
| | | | | 12.970 | | | Maturity | | | 01/02/2023 | | | | | | | | 135,800 | | | | 0 | | | | 44 | | | | 44 | | | | 0 | | | | (5 | ) |
| | | | | 11.140 | | | Maturity | | | 01/02/2025 | | | | | | | | 7,800 | | | | 0 | | | | (43 | ) | | | (43 | ) | | | 4 | | | | 0 | |
| | | | | 11.160 | | | Maturity | | | 01/02/2025 | | | | | | | | 5,200 | | | | 0 | | | | (28 | ) | | | (28 | ) | | | 2 | | | | 0 | |
| | | | | 11.350 | | | Maturity | | | 01/02/2025 | | | | | | | | 6,400 | | | | 0 | | | | (30 | ) | | | (30 | ) | | | 3 | | | | 0 | |
| | | | | 12.000 | | | Maturity | | | 01/02/2025 | | | | | | | | 17,400 | | | | 0 | | | | (40 | ) | | | (40 | ) | | | 8 | | | | 0 | |
| | | | | 12.080 | | | Maturity | | | 01/02/2025 | | | | | | | | 28,900 | | | | 0 | | | | (58 | ) | | | (58 | ) | | | 13 | | | | 0 | |
| | | | | 12.140 | | | Maturity | | | 01/02/2025 | | | | | | | | 14,600 | | | | 0 | | | | (26 | ) | | | (26 | ) | | | 7 | | | | 0 | |
| | | | | 12.145 | | | Maturity | | | 01/02/2025 | | | | | | | | 14,300 | | | | 0 | | | | (25 | ) | | | (25 | ) | | | 7 | | | | 0 | |
| | | | | 12.160 | | | Maturity | | | 01/02/2025 | | | | | | | | 29,100 | | | | 0 | | | | (50 | ) | | | (50 | ) | | | 13 | | | | 0 | |
| | | | | 11.220 | | | Maturity | | | 01/04/2027 | | | | | | | | 9,400 | | | | 0 | | | | (63 | ) | | | (63 | ) | | | 6 | | | | 0 | |
| | | | | 11.245 | | | Maturity | | | 01/04/2027 | | | | | | | | 4,700 | | | | 0 | | | | (31 | ) | | | (31 | ) | | | 3 | | | | 0 | |
| | | | | 11.260 | | | Maturity | | | 01/04/2027 | | | | | | | | 4,700 | | | | 0 | | | | (30 | ) | | | (30 | ) | | | 3 | | | | 0 | |
| | | | | 11.700 | | | Maturity | | | 01/04/2027 | | | | | | | | 2,400 | | | | 0 | | | | (10 | ) | | | (10 | ) | | | 1 | | | | 0 | |
| | | | | | | | | | | | |
| See Accompanying Notes | | | ANNUAL REPORT | | | | | | | JUNE 30, 2022 | | | 93 |
| | | | | | | | |
Consolidated Schedule of Investments | | PIMCO Dynamic Income Fund | | | | | | |
| | | | | | | | | | | | | | | | | | | | | | | | | | | | | | | | | | | | | | | | | | |
Pay/Receive
Floating Rate | | Floating Rate Index | | Fixed Rate | | | Payment
Frequency | | | Maturity
Date | | | Notional
Amount | | | Premiums
Paid/(Received) | | | Unrealized
Appreciation/
(Depreciation) | | | Market
Value | | | Variation Margin | |
| | Asset | | | Liability | |
| | | | | 11.715 | % | | | Maturity | | | | 01/04/2027 | | | | BRL | | | | 10,500 | | | $ | 0 | | | $ | (43 | ) | | $ | (43 | ) | | $ | 6 | | | $ | 0 | |
| | | | | 11.870 | | | | Maturity | | | | 01/04/2027 | | | | | | | | 25,100 | | | | 0 | | | | (82 | ) | | | (82 | ) | | | 15 | | | | 0 | |
| | | | | 12.015 | | | | Maturity | | | | 01/04/2027 | | | | | | | | 437,000 | | | | 0 | | | | (1,108 | ) | | | (1,108 | ) | | | 254 | | | | 0 | |
| | | | | 2.860 | | | | | | | | 04/26/2023 | | | | $ | | | | 7,100 | | | | (19 | ) | | | 25 | | | | 6 | | | | 5 | | | | 0 | |
| | | | | 2.750 | | | | Semi-Annual | | | | 12/19/2023 | | | | | | | | 30,600 | | | | (284 | ) | | | 39 | | | | (245 | ) | | | 42 | | | | 0 | |
| | | | | 1.750 | | | | Semi-Annual | | | | 12/21/2023 | | | | | | | | 152,800 | | | | 2,868 | | | | (6,328 | ) | | | (3,460 | ) | | | 200 | | | | 0 | |
| | | | | 0.500 | | | | Semi-Annual | | | | 06/16/2026 | | | | | | | | 184,100 | | | | (3,836 | ) | | | (13,933 | ) | | | (17,769 | ) | | | 860 | | | | 0 | |
| | | | | 0.660 | | | | Semi-Annual | | | | 12/21/2026 | | | | | | | | 483,000 | | | | (86 | ) | | | (48,722 | ) | | | (48,808 | ) | | | 2,528 | | | | 0 | |
| | | | | 1.750 | | | | Semi-Annual | | | | 12/21/2026 | | | | | | | | 303,000 | | | | 7,433 | | | | (24,186 | ) | | | (16,753 | ) | | | 1,638 | | | | 0 | |
| | | | | 1.360 | | | | Semi-Annual | | | | 02/15/2027 | | | | | | | | 13,450 | | | | 0 | | | | 937 | | | | 937 | | | | 0 | | | | (78 | ) |
| | | | | 1.600 | | | | Semi-Annual | | | | 02/15/2027 | | | | | | | | 53,800 | | | | (185 | ) | | | (2,960 | ) | | | (3,145 | ) | | | 313 | | | | 0 | |
| | | | | 1.500 | | | | Semi-Annual | | | | 06/21/2027 | | | | | | | | 209,400 | | | | (15,186 | ) | | | 50 | | | | (15,136 | ) | | | 1,203 | | | | 0 | |
| | | | | 2.500 | | | | Semi-Annual | | | | 12/20/2027 | | | | | | | | 91,250 | | | | 1,072 | | | | (3,640 | ) | | | (2,568 | ) | | | 571 | | | | 0 | |
| | | | | 0.500 | | | | Semi-Annual | | | | 06/16/2028 | | | | | | | | 660 | | | | (33 | ) | | | (59 | ) | | | (92 | ) | | | 4 | | | | 0 | |
| | | | | 2.250 | | | | Semi-Annual | | | | 06/20/2028 | | | | | | | | 8,200 | | | | (489 | ) | | | 127 | | | | (362 | ) | | | 53 | | | | 0 | |
| | | | | 1.750 | | | | Semi-Annual | | | | 12/15/2031 | | | | | | | | 16,600 | | | | (254 | ) | | | 2,052 | | | | 1,798 | | | | 0 | | | | (120 | ) |
| | | | | 0.930 | | | | Semi-Annual | | | | 12/19/2038 | | | | | | | | 142,200 | | | | 381 | | | | 41,289 | | | | 41,670 | | | | 0 | | | | (939 | ) |
| | | | | 2.750 | | | | Semi-Annual | | | | 03/20/2043 | | | | | | | | 1,300 | | | | (4 | ) | | | 73 | | | | 69 | | | | 0 | | | | (10 | ) |
| | | | | 2.750 | | | | Semi-Annual | | | | 12/16/2045 | | | | | | | | 3,800 | | | | (52 | ) | | | 258 | | | | 206 | | | | 0 | | | | (32 | ) |
| | | | | 2.500 | | | | Semi-Annual | | | | 06/20/2048 | | | | | | | | 3,100 | | | | 287 | | | | 7 | | | | 294 | | | | 0 | | | | (29 | ) |
| | | | | 2.000 | | | | Semi-Annual | | | | 01/15/2050 | | | | | | | | 1,200 | | | | (9 | ) | | | 226 | | | | 217 | | | | 0 | | | | (10 | ) |
| | | | | 2.250 | | | | Semi-Annual | | | | 03/12/2050 | | | | | | | | 20,500 | | | | (33 | ) | | | 2,777 | | | | 2,744 | | | | 0 | | | | (180 | ) |
| | | | | 1.150 | | | | Semi-Annual | | | | 12/11/2050 | | | | | | | | 63,900 | | | | (3,148 | ) | | | 25,760 | | | | 22,612 | | | | 0 | | | | (430 | ) |
| | | | | 1.250 | | | | Semi-Annual | | | | 06/16/2051 | | | | | | | | 44,700 | | | | 8,405 | | | | 6,658 | | | | 15,063 | | | | 0 | | | | (305 | ) |
| | | | | 5.873 | | | | Quarterly | | | | 05/12/2026 | | | | ZAR | | | | 882,000 | | | | (16 | ) | | | (3,535 | ) | | | (3,551 | ) | | | 0 | | | | (17 | ) |
| | | | | 0.150 | | | | Annual | | | | 03/18/2030 | | | | EUR | | | | 20,400 | | | | 373 | | | | 2,977 | | | | 3,350 | | | | 0 | | | | (319 | ) |
| | | | | 0.150 | | | | Annual | | | | 06/17/2030 | | | | | | | | 1,200 | | | | (1 | ) | | | 179 | | | | 178 | | | | 0 | | | | (20 | ) |
| | | | | 0.250 | | | | Annual | | | | 03/18/2050 | | | | | | | | 2,500 | | | | 139 | | | | 857 | | | | 996 | | | | 0 | | | | (58 | ) |
| | | | | 0.500 | | | | Annual | | | | 06/17/2050 | | | | | | | | 500 | | | | (16 | ) | | | 189 | | | | 173 | | | | 0 | | | | (13 | ) |
| | | | | 0.500 | | | | Annual | | | | 09/21/2052 | | | | | | | | 52,900 | | | | 4,583 | | | | 14,240 | | | | 18,823 | | | | 0 | | | | (1,369 | ) |
| | | | | 4.550 | | | | Lunar | | | | 02/27/2023 | | | | MXN | | | | 292,200 | | | | 35 | | | | (489 | ) | | | (454 | ) | | | 0 | | | | (1 | ) |
| | | | | 4.500 | | | | Lunar | | | | 03/03/2023 | | | | | | | | 173,000 | | | | (3 | ) | | | (271 | ) | | | (274 | ) | | | 0 | | | | (1 | ) |
| | | | | 8.675 | | | | Lunar | | | | 04/03/2024 | | | | | | | | 63,800 | | | | 0 | | | | 45 | | | | 45 | | | | 0 | | | | (5 | ) |
| | | | | 8.660 | | | | Lunar | | | | 04/04/2024 | | | | | | | | 32,100 | | | | 0 | | | | 23 | | | | 23 | | | | 0 | | | | (2 | ) |
| | | | | 8.750 | | | | Lunar | | | | 04/05/2024 | | | | | | | | 11,300 | | | | 0 | | | | 7 | | | | 7 | | | | 0 | | | | (1 | ) |
| | | | | 8.410 | | | | Lunar | | | | 03/31/2027 | | | | | | | | 7,600 | | | | 0 | | | | 9 | | | | 9 | | | | 0 | | | | (2 | ) |
| | | | | 8.730 | | | | Lunar | | | | 04/06/2027 | | | | | | | | 4,700 | | | | 0 | | | | 2 | | | | 2 | | | | 0 | | | | (1 | ) |
| | | | | 7.495 | | | | Lunar | | | | 01/14/2032 | | | | | | | | 2,300 | | | | 9 | | | | 1 | | | | 10 | | | | 0 | | | | (1 | ) |
| | | | | 7.498 | | | | Lunar | | | | 01/15/2032 | | | | | | | | 9,500 | | | | 39 | | | | 3 | | | | 42 | | | | 0 | | | | (3 | ) |
| | | | | 8.732 | | | | Lunar | | | | 03/30/2032 | | | | | | | | 2,400 | | | | 0 | | | | 1 | | | | 1 | | | | 0 | | | | (1 | ) |
| | | | | 8.701 | | | | Lunar | | | | 03/31/2032 | | | | | | | | 5,600 | | | | 0 | | | | 3 | | | | 3 | | | | 0 | | | | (2 | ) |
| | | | | | | | | | | | | | | | | | | | | | | | | | | | | | | | | | | | | | | | | | |
| | | | | | | $ | (3,539 | ) | | $ | 29,777 | | | $ | 26,238 | | | $ | 7,844 | | | $ | (6,822 | ) |
| | | | | | | | | | | | | | | | | | | | | | | | | | | | | | | | | | | | | | | | | | |
| | | | | | | | | | | | | | | | | | | | | | | | | |
| | | | | | | | | | | | | | | | | | | | | | | | | | | | | | | | | | | | | | | | | | |
FINANCIAL DERIVATIVE INSTRUMENTS: EXCHANGE-TRADED OR CENTRALLY CLEARED SUMMARY
The following is a summary of the market value and variation margin of Exchange-Traded or Centrally Cleared Financial Derivative Instruments as of June 30, 2022:
| | | | | | | | | | | | | | | | | | | | | | | | | | | | | | | | | | | | |
| | | Financial Derivative Assets | | | | | | Financial Derivative Liabilities | |
| | | | | | | | | | | | | | | | | | Variation Margin
Liability | | | | |
| | | | | | | | | | | | | | | | | | | | | | | | | | | | |
Total Exchange-Traded or Centrally Cleared | | | | | | | | | | | | | | | | | | | | | | | | | | | | | | | | | | | | |
| | | | | | | | | | | | | | | | | | | | | | | | | | | | | | | | | | | | |
Cash of $108,929 have been pledged as collateral under the terms of the above master agreements as of June 30, 2022.
| If the Fund is a seller of protection and a credit event occurs, as defined under the terms of that particular swap agreement, the Fund will either (i) pay to the buyer of protection an amount equal to the notional amount of the swap and take delivery of the referenced obligation or underlying securities comprising the referenced index or (ii) pay a net settlement amount in the form of cash, securities or other deliverable obligations equal to the notional amount of the swap less the recovery value of the referenced obligation or underlying securities comprising the referenced index. |
| Implied credit spreads, represented in absolute terms, utilized in determining the market value of credit default swap agreements on corporate issues as of period end serve as indicators of the current status of the payment/performance risk and represent the likelihood or risk of default for the credit derivative. The implied credit spread of a particular referenced entity reflects the cost of buying/selling protection and may include upfront payments required to be made to enter into the agreement. Wider credit spreads represent a deterioration of the referenced entity’s credit soundness and a greater likelihood or risk of default or other credit event occurring as defined under the terms of the agreement. |
| The maximum potential amount the Fund could be required to pay as a seller of credit protection or receive as a buyer of credit protection if a credit event occurs as defined under the terms of that particular swap agreement. |
| | | | | | |
| 94 | | PIMCO CLOSED-END FUNDS | | | See Accompanying Notes | |
| The prices and resulting values for credit default swap agreements serve as indicators of the current status of the payment/performance risk and represent the likelihood of an expected liability (or profit) for the credit derivative should the notional amount of the swap agreement be closed/sold as of the period end. Increasing market values, in absolute terms when compared to the notional amount of the swap, represent a deterioration of the underlying referenced instrument’s credit soundness and a greater likelihood or risk of default or other credit event occurring as defined under the terms of the agreement. |
| This instrument has a forward starting effective date. See Note 2, Securities Transactions and Investment Income, in the Notes to Financial Statements for further information. |
(o) FINANCIAL DERIVATIVE INSTRUMENTS: OVER THE COUNTER
FORWARD FOREIGN CURRENCY CONTRACTS:
| | | | | | | | | | | | | | | | | | | | | | | | |
| | | | | | | | | | | Unrealized Appreciation/
(Depreciation) | |
| | | | | | |
| | | 07/2022 | | | EUR | | | 5,916 | | | $ | | | 6,224 | | | $ | 24 | | | $ | 0 | |
| | | 07/2022 | | | GBP | | | 160,610 | | | | | | 203,074 | | | | 7,563 | | | | 0 | |
| | | 07/2022 | | | $ | | | 2,373 | | | EUR | | | 2,248 | | | | 0 | | | | (17 | ) |
| | | 07/2022 | | | | | | 16,843 | | | PEN | | | 64,950 | | | | 257 | | | | (157 | ) |
| | | 07/2022 | | | | | | 6,158 | | | ZAR | | | 94,488 | | | | 0 | | | | (355 | ) |
| | | 08/2022 | | | IDR | | | 530,087 | | | $ | | | 36 | | | | 0 | | | | 0 | |
| | | 08/2022 | | | $ | | | 8,662 | | | NOK | | | 82,471 | | | | 0 | | | | (282 | ) |
| | | 08/2022 | | | | | | 287 | | | PEN | | | 1,100 | | | | 0 | | | | (1 | ) |
| | | 08/2022 | | | | | | 308 | | | RUB | | | 48,131 | | | | 539 | | | | 0 | |
| | | 11/2022 | | | | | | 1,755 | | | ZAR | | | 27,731 | | | | 0 | | | | (72 | ) |
| | | 05/2023 | | | PEN | | | 1,100 | | | $ | | | 280 | | | | 0 | | | | 0 | |
| | | | | | | |
| | | 07/2022 | | | GBP | | | 3,597 | | | | | | 4,354 | | | | 0 | | | | (25 | ) |
| | | 07/2022 | | | $ | | | 425,024 | | | EUR | | | 404,093 | | | | 0 | | | | (1,555 | ) |
| | | 07/2022 | | | | | | 14,540 | | | GBP | | | 11,833 | | | | 3 | | | | (139 | ) |
| | | 07/2022 | | | | | | 8,624 | | | MXN | | | 173,324 | | | | 0 | | | | (5 | ) |
| | | 07/2022 | | | | | | 18 | | | PLN | | | 80 | | | | 0 | | | | 0 | |
| | | 07/2022 | | | | | | 375 | | | ZAR | | | 5,865 | | | | 0 | | | | (14 | ) |
| | | 08/2022 | | | EUR | | | 370,123 | | | $ | | | 390,005 | | | | 1,422 | | | | 0 | |
| | | 08/2022 | | | $ | | | 1,440 | | | CAD | | | 1,862 | | | | 7 | | | | 0 | |
| | | 08/2022 | | | | | | 4,952 | | | IDR | | | 73,023,300 | | | | 0 | | | | (54 | ) |
| | | 08/2022 | | | | | | 18 | | | INR | | | 1,412 | | | | 0 | | | | 0 | |
| | | 08/2022 | | | | | | 34,056 | | | MXN | | | 748,084 | | | | 2,908 | | | | 0 | |
| | | 08/2022 | | | ZAR | | | 9,648 | | | $ | | | 606 | | | | 15 | | | | 0 | |
| | | 09/2022 | | | MXN | | | 173,324 | | | | | | 8,497 | | | | 0 | | | | (8 | ) |
| | | 10/2022 | | | PEN | | | 10,080 | | | | | | 2,469 | | | | 0 | | | | (138 | ) |
| | | 11/2022 | | | ZAR | | | 15,901 | | | | | | 985 | | | | 20 | | | | 0 | |
| | | | | | | |
| | | 07/2022 | | | $ | | | 4,227 | | | GBP | | | 3,454 | | | | 8 | | | | (30 | ) |
| | | 08/2022 | | | | | | 5,428 | | | IDR | | | 80,342,094 | | | | 0 | | | | (39 | ) |
| | | 08/2022 | | | | | | 5,970 | | | NOK | | | 58,421 | | | | 0 | | | | (34 | ) |
| | | 11/2022 | | | | | | 745 | | | ZAR | | | 11,119 | | | | 0 | | | | (71 | ) |
| | | 11/2022 | | | ZAR | | | 10,948 | | | $ | | | 682 | | | | 18 | | | | 0 | |
| | | 02/2023 | | | $ | | | 655 | | | ZAR | | | 10,843 | | | | 0 | | | | (3 | ) |
| | | | | | | |
| | | 07/2022 | | | BRL | | | 430,565 | | | $ | | | 82,200 | | | | 0 | | | | (72 | ) |
| | | 07/2022 | | | MXN | | | 173,324 | | | | | | 8,382 | | | | 0 | | | | (237 | ) |
| | | 07/2022 | | | PEN | | | 29,066 | | | | | | 7,363 | | | | 0 | | | | (213 | ) |
| | | 07/2022 | | | $ | | | 88,627 | | | BRL | | | 430,565 | | | | 0 | | | | (6,356 | ) |
| | | 07/2022 | | | | | | 99 | | | MXN | | | 2,008 | | | | 1 | | | | 0 | |
| | | 07/2022 | | | | | | 746 | | | PEN | | | 2,979 | | | | 33 | | | | (4 | ) |
| | | 08/2022 | | | AUD | | | 444 | | | $ | | | 313 | | | | 6 | | | | 0 | |
| | | 08/2022 | | | PEN | | | 1,100 | | | | | | 272 | | | | 0 | | | | (14 | ) |
| | | 08/2022 | | | $ | | | 481 | | | PEN | | | 1,813 | | | | 0 | | | | (9 | ) |
| | | 08/2022 | | | | | | 631 | | | ZAR | | | 9,863 | | | | 0 | | | | (27 | ) |
| | | 11/2022 | | | | | | 4,568 | | | PEN | | | 18,129 | | | | 110 | | | | 0 | |
| | | 12/2022 | | | PEN | | | 1,051 | | | $ | | | 271 | | | | 1 | | | | 0 | |
| | | 12/2022 | | | $ | | | 5,339 | | | PEN | | | 21,504 | | | | 219 | | | | (24 | ) |
| | | 04/2023 | | | | | | 3,864 | | | | | | 15,261 | | | | 26 | | | | 0 | |
| | | | | | | |
| | | 07/2022 | | | PLN | | | 79,582 | | | $ | | | 18,241 | | | | 507 | | | | 0 | |
| | | 07/2022 | | | $ | | | 24 | | | PEN | | | 88 | | | | 0 | | | | (1 | ) |
| | | 08/2022 | | | | | | 0 | | | RUB | | | 0 | | | | 0 | | | | 0 | |
| | | 10/2022 | | | | | | 1,052 | | | | | | 101,394 | | | | 554 | | | | 0 | |
| | | 12/2022 | | | | | | 8,304 | | | ZAR | | | 130,464 | | | | 0 | | | | (412 | ) |
| | | | | | | |
| | | 07/2022 | | | | | | 111 | | | PEN | | | 417 | | | | 0 | | | | (2 | ) |
| | | 07/2022 | | | ZAR | | | 11,439 | | | $ | | | 710 | | | | 8 | | | | 0 | |
| | | 08/2022 | | | PEN | | | 1,848 | | | | | | 493 | | | | 12 | | | | 0 | |
| | | 08/2022 | | | $ | | | 16 | | | PEN | | | 59 | | | | 0 | | | | 0 | |
| | | 10/2022 | | | | | | 11,191 | | | MXN | | | 229,074 | | | | 3 | | | | 0 | |
| | | 10/2022 | | | | | | 2,643 | | | RUB | | | 250,252 | | | | 1,399 | | | | 0 | |
| | | | | | | |
| | | 07/2022 | | | CZK | | | 12,961 | | | $ | | | 553 | | | | 5 | | | | 0 | |
| | | 08/2022 | | | $ | | | 14 | | | CNH | | | 94 | | | | 0 | | | | 0 | |
| | | 08/2022 | | | | | | 7,244 | | | IDR | | | 106,553,549 | | | | 0 | | | | (95 | ) |
| | | | | | | | | | | | |
| See Accompanying Notes | | | ANNUAL REPORT | | | | | | | JUNE 30, 2022 | | | 95 |
| | | | | | | | |
Consolidated Schedule of Investments | | PIMCO Dynamic Income Fund | | | | | | |
| | | | | | | | | | | | | | | | | | | | | | | | |
| Counterparty | | Settlement
Month | | | Currency to
be Delivered | | | Currency to
be Received | | | Unrealized Appreciation/
(Depreciation) | |
| | Asset | | | Liability | |
| | | 07/2022 | | | GBP | | | 2,480 | | | $ | | | 3,050 | | | $ | 31 | | | $ | 0 | |
| | | 07/2022 | | | $ | | | 12,152 | | | EUR | | | 11,301 | | | | 0 | | | | (309 | ) |
| | | 08/2022 | | | MXN | | | 260,873 | | | $ | | | 12,718 | | | | 0 | | | | (158 | ) |
| | | 08/2022 | | | $ | | | 73 | | | CLP | | | 61,098 | | | | 0 | | | | (7 | ) |
| | | 08/2022 | | | | | | 31 | | | CNH | | | 205 | | | | 0 | | | | 0 | |
| | | 08/2022 | | | | | | 3,197 | | | IDR | | | 46,874,238 | | | | 0 | | | | (52 | ) |
| | | | | | | |
| | | 07/2022 | | | | | | 1,173 | | | GBP | | | 971 | | | | 9 | | | | 0 | |
| | | 08/2022 | | | CNY | | | 18,635 | | | $ | | | 2,776 | | | | 0 | | | | (8 | ) |
| | | 08/2022 | | | $ | | | 6,130 | | | IDR | | | 90,426,452 | | | | 0 | | | | (65 | ) |
| | | 08/2022 | | | | | | 30 | | | INR | | | 2,372 | | | | 0 | | | | 0 | |
| | | | | | | |
| | | 08/2022 | | | | | | 5,089 | | | CAD | | | 6,585 | | | | 27 | | | | 0 | |
| | | 09/2022 | | | | | | 5,134 | | | MXN | | | 105,637 | | | | 57 | | | | 0 | |
| | | | | | | |
| | | 07/2022 | | | PEN | | | 19 | | | $ | | | 5 | | | | 0 | | | | 0 | |
| | | 07/2022 | | | $ | | | 1,117 | | | GBP | | | 915 | | | | 0 | | | | (4 | ) |
| | | 07/2022 | | | | | | 62 | | | PEN | | | 236 | | | | 0 | | | | (1 | ) |
| | | 08/2022 | | | CHF | | | 5,229 | | | $ | | | 5,233 | | | | 0 | | | | (259 | ) |
| | | 08/2022 | | | CNY | | | 29,829 | | | | | | 4,457 | | | | 1 | | | | 0 | |
| | | 08/2022 | | | $ | | | 54 | | | CNH | | | 364 | | | | 0 | | | | 0 | |
| | | 08/2022 | | | | | | 6,261 | | | EUR | | | 5,992 | | | | 30 | | | | 0 | |
| | | 09/2022 | | | | | | 7,696 | | | ZAR | | | 118,972 | | | | 0 | | | | (434 | ) |
| | | | | | | |
| | | 07/2022 | | | EUR | | | 405,734 | | | $ | | | 436,086 | | | | 10,897 | | | | 0 | |
| | | 07/2022 | | | $ | | | 191,718 | | | GBP | | | 157,533 | | | | 47 | | | | 0 | |
| | | 08/2022 | | | GBP | | | 157,533 | | | $ | | | 191,807 | | | | 0 | | | | (50 | ) |
| | | 08/2022 | | | $ | | | 9,174 | | | NOK | | | 89,969 | | | | 0 | | | | (32 | ) |
| | | | | | | |
| | | 07/2022 | | | BRL | | | 430,565 | | | $ | | | 83,257 | | | | 985 | | | | 0 | |
| | | 07/2022 | | | $ | | | 82,200 | | | BRL | | | 430,565 | | | | 71 | | | | 0 | |
| | | 08/2022 | | | | | | 82,601 | | | | | | 430,564 | | | | 0 | | | | (1,034 | ) |
| | | 08/2022 | | | | | | 9,732 | | | GBP | | | 8,019 | | | | 34 | | | | 0 | |
| | | | | | | |
| | | 07/2022 | | | HUF | | | 161,784 | | | $ | | | 461 | | | | 35 | | | | 0 | |
| | | 07/2022 | | | MXN | | | 166,053 | | | | | | 7,993 | | | | 0 | | | | (250 | ) |
| | | | | | | | | | | | | | | | | | | | | | | | |
Total Forward Foreign Currency Contracts | | | | | | | | | |
| | | | | | | | | |
SWAP AGREEMENTS:
CREDIT DEFAULT SWAPS ON CORPORATE ISSUES - SELL PROTECTION
(1)
| | | | | | | | | | | | | | | | | | | | | | | | | | | | | | | | | | | | |
| | | | | | | | | | | | Implied Credit Spread at June 30, 2022 (2) | | | | | | | | | Unrealized
Appreciation/
(Depreciation) | | | Swap Agreements, at Value (4) | |
| | | | | | |
| BYL | | Banca Monte Dei Paschi Di | | | 5.000% | | | Quarterly | | | 12/20/2022 | | | | 8.580% | | | | EUR 5,700 | | | $ | (182 | ) | | $ | 92 | | | $ | 0 | | | $ | (90 | ) |
| | | | | | | | | | | | | | | | | | | | | | | | | | | | | | | | | | | | |
CREDIT DEFAULT SWAPS ON CREDIT INDICES - SELL PROTECTION
(1)
| | | | | | | | | | | | | | | | | | | | | | | | | | | | | | | | |
| | | | | | | | | | | | | | | | | | Unrealized
Appreciation/
(Depreciation) | | | Swap Agreements, at Value (4) | |
| | | | | | |
| FBF | | | | | 0.170 | % | | Monthly | | | 05/25/2046 | | | $ | 23,075 | | | $ | (20,538 | ) | | $ | 15,100 | | | $ | 0 | | | $ | (5,438 | ) |
| | | | | | | | | |
| GST | | | | | 0.320 | | | Monthly | | | 07/25/2045 | | | | 5,778 | | | | (1,150 | ) | | | 757 | | | | 0 | | | | (393 | ) |
| | | | | 0.090 | | | Monthly | | | 08/25/2037 | | | | 1,898 | | | | (544 | ) | | | 329 | | | | 0 | | | | (215 | ) |
| | | | | | | | | | | | | | | | | | | | | | | | | | | | | | | | |
| | | | | | | | | | | | | | | | $ | (22,232 | ) | | $ | 16,186 | | | $ | 0 | | | $ | (6,046 | ) |
| | | | | | | | | | | | | | | | | | | | | | | | | | | | | | |
TOTAL RETURN SWAPS ON INTEREST RATE INDICES
| | | | | | | | | | | | | | | | | | | | | | | | | | | | | | | | | | | | | | |
| | | | | | | | | | | | | | | | | | | | | | | Unrealized
Appreciation/
(Depreciation) | | | | |
| | | | | | |
| | | | iBoxx USD Liquid High Yield Index | | | N/A | | | | 1.044% | | | | Maturity | | | 03/20/2023 | | $ | 200 | | | $ | 0 | | | $ | (1 | ) | | $ | 0 | | | $ | (1 | ) |
| | | | | | | | | | | |
| | | | iBoxx USD Liquid High Yield Index | | | N/A | | | | 1.044% | | | | Maturity | | | 09/20/2022 | | | 1,100 | | | | (1 | ) | | | (43 | ) | | | 0 | | | | (44 | ) |
| | | | | | | | | | | |
| | | | iBoxx USD Liquid High Yield Index | | | N/A | | | | 1.044% | | | | Maturity | | | 09/20/2022 | | | 800 | | | | (1 | ) | | | (27 | ) | | | 0 | | | | (28 | ) |
| | | | | | | | | | | | | | | | | | | | | | | | | | | | | | | | | | | | | | |
| | | | | | | | | | | | | | | | | | | | $ | (2 | ) | | $ | (71 | ) | | $ | 0 | | | $ | (73 | ) |
| | | | | | | | | | | | | | | | | |
TOTAL RETURN SWAPS ON SECURITIES
| | | | | | | | | | | | | | | | | | | | | | | | | | | | | | | | | | | | |
| | | | | | | | | | | | | | | | | | | | | | Unrealized
Appreciation/
(Depreciation) | | | | |
| | | | | | |
| | | | United States Treasury Inflation Indexed Bonds « | | | N/A | | | 0.000% | | | Maturity | | | 01/28/2036 | | | CNY 59,900 | | | $ | 25 | | | $ | 580 | | | $ | 605 | | | $ | 0 | |
| | | | | | | | | | | | | | | | | | | | | | | | | | | | | | | | | |
| | | | | | | | | | | | | | | | | |
| | | | | | | | | | | | | | | | | |
FINANCIAL DERIVATIVE INSTRUMENTS: OVER THE COUNTER SUMMARY
The following is a summary by counterparty of the market value of OTC financial derivative instruments and collateral pledged/(received) as of June 30, 2022:
| | | | | | | | | | | | | | | | | | | | | | | | | | | | | | | | | | | | | | | | | | | | | | | | |
| | | Financial Derivative Assets | | | | | | Financial Derivative Liabilities | | | | | | | | | | |
| | Forward
Foreign
Currency
Contracts | | | | | | | | | | | | | | | Forward
Foreign
Currency
Contracts | | | | | | | | | | | | Net Market
Value of OTC
Derivatives | | | Collateral
Pledged/ (Received) | | | | |
| | $ | 8,383 | | | $ | 0 | | | $ | 0 | | | $ | 8,383 | | | | | | | $ | (884 | ) | | $ | 0 | | | $ | (1 | ) | | $ | (885 | ) | | $ | 7,498 | | | $ | (8,300 | ) | | $ | (802 | ) |
| | | 4,375 | | | | 0 | | | | 0 | | | | 4,375 | | | | | | | | (1,938 | ) | | | 0 | | | | (44 | ) | | | (1,982 | ) | | | 2,393 | | | | (2,380 | ) | | | 13 | |
| | | 26 | | | | 0 | | | | 0 | | | | 26 | | | | | | | | (177 | ) | | | 0 | | | | 0 | | | | (177 | ) | | | (151 | ) | | | 0 | | | | (151 | ) |
| | | 0 | | | | 0 | | | | 0 | | | | 0 | | | | | | | | 0 | | | | 0 | | | | (90 | ) | | | (90 | ) | | | (90 | ) | | | 0 | | | | (90 | ) |
| | | 396 | | | | 0 | | | | 0 | | | | 396 | | | | | | | | (6,956 | ) | | | 0 | | | | 0 | | | | (6,956 | ) | | | (6,560 | ) | | | 6,396 | | | | (164 | ) |
| | | 1,061 | | | | 0 | | | | 0 | | | | 1,061 | | | | | | | | (413 | ) | | | 0 | | | | 0 | | | | (413 | ) | | | 648 | | | | (550 | ) | | | 98 | |
| | | 0 | | | | 0 | | | | 0 | | | | 0 | | | | | | | | 0 | | | | 0 | | | | (5,438 | ) | | | (5,438 | ) | | | (5,438 | ) | | | 5,627 | | | | 189 | |
| | | 1,422 | | | | 0 | | | | 0 | | | | 1,422 | | | | | | | | (2 | ) | | | 0 | | | | 0 | | | | (2 | ) | | | 1,420 | | | | (1,210 | ) | | | 210 | |
| | | 0 | | | | 0 | | | | 0 | | | | 0 | | | | | | | | 0 | | | | 0 | | | | (608 | ) | | | (608 | ) | | | (608 | ) | | | 749 | | | | 141 | |
| | | 5 | | | | 0 | | | | 0 | | | | 5 | | | | | | | | (95 | ) | | | 0 | | | | 0 | | | | (95 | ) | | | (90 | ) | | | 0 | | | | (90 | ) |
| | | 31 | | | | 0 | | | | 0 | | | | 31 | | | | | | | | (526 | ) | | | 0 | | | | 0 | | | | (526 | ) | | | (495 | ) | | | 341 | | | | (154 | ) |
| | | 0 | | | | 0 | | | | 605 | | | | 605 | | | | | | | | 0 | | | | 0 | | | | (28 | ) | | | (28 | ) | | | 577 | | | | (518 | ) | | | 59 | |
| | | 9 | | | | 0 | | | | 0 | | | | 9 | | | | | | | | (73 | ) | | | 0 | | | | 0 | | | | (73 | ) | | | (64 | ) | | | 0 | | | | (64 | ) |
| | | 84 | | | | 0 | | | | 0 | | | | 84 | | | | | | | | 0 | | | | 0 | | | | 0 | | | | 0 | | | | 84 | | | | 0 | | | | 84 | |
| | | 31 | | | | 0 | | | | 0 | | | | 31 | | | | | | | | (698 | ) | | | 0 | | | | 0 | | | | (698 | ) | | | (667 | ) | | | 702 | | | | 35 | |
| | | 10,944 | | | | 0 | | | | 0 | | | | 10,944 | | | | | | | | (82 | ) | | | 0 | | | | 0 | | | | (82 | ) | | | 10,862 | | | | (12,260 | ) | | | (1,398 | ) |
| | | 1,090 | | | | 0 | | | | 0 | | | | 1,090 | | | | | | | | (1,034 | ) | | | 0 | | | | 0 | | | | (1,034 | ) | | | 56 | | | | 0 | | | | 56 | |
| | | 35 | | | | 0 | | | | 0 | | | | 35 | | | | | | | | (250 | ) | | | 0 | | | | 0 | | | | (250 | ) | | | (215 | ) | | | 301 | | | | 86 | |
| | | | | | | | | | | | | | | | | | | | | | | | | | | | | | | | | | | | | | | | | | | | | | | | |
| | | | | | | | | | | | | | | | | | | | | | | | | | | | | | | | | | | | | | | | | | | | | | | | |
| | | | | | | | | | | | | | | | | | | | | | | | | | | | | | | | | | | | | | | | | | | | | | | | |
| Securities with an aggregate market value of $14,116 have been pledged as collateral for financial derivative instruments as governed by International Swaps and Derivatives Association, Inc. master agreements as of June 30, 2022. |
| If the Fund is a seller of protection and a credit event occurs, as defined under the terms of that particular swap agreement, the Fund will either (i) pay to the buyer of protection an amount equal to the notional amount of the swap and take delivery of the referenced obligation or underlying securities comprising the referenced index or (ii) pay a net settlement amount in the form of cash, securities or other deliverable obligations equal to the notional amount of the swap less the recovery value of the referenced obligation or underlying securities comprising the referenced index. |
| Implied credit spreads, represented in absolute terms, utilized in determining the market value of credit default swap agreements on corporate issues as of period end serve as indicators of the current status of the payment/performance risk and represent the likelihood or risk of default for the credit derivative. The implied credit spread of a particular referenced entity reflects the cost of buying/selling protection and may include upfront payments required to be made to enter into the agreement. Wider credit spreads represent a deterioration of the referenced entity’s credit soundness and a greater likelihood or risk of default or other credit event occurring as defined under the terms of the agreement. |
| The maximum potential amount the Fund could be required to pay as a seller of credit protection or receive as a buyer of credit protection if a credit event occurs as defined under the terms of that particular swap agreement. |
| The prices and resulting values for credit default swap agreements serve as indicators of the current status of the payment/performance risk and represent the likelihood of an expected liability (or profit) for the credit derivative should the notional amount of the swap agreement be closed/sold as of the period end. Increasing market values, in absolute terms when compared to the notional amount of the swap, represent a deterioration of the underlying referenced instrument’s credit soundness and a greater likelihood or risk of default or other credit event occurring as defined under the terms of the agreement. |
| Receive represents that the Fund receives payments for any positive net return on the underlying reference. The Fund makes payments for any negative net return on such underlying reference. Pay represents that the Fund receives payments for any negative net return on the underlying reference. The Fund makes payments for any positive net return on such underlying reference. |
| Net Exposure represents the net receivable/(payable) that would be due from/to the counterparty in the event of default. Exposure from OTC derivatives can only be netted across transactions governed under the same master agreement with the same legal entity. See Note 8, Master Netting Arrangements, in the Notes to Financial Statements for more information. |
| | | | | | | | | | | | | |
| See Accompanying Notes | | | | | | | | | | JUNE 30, 2022 | | | |
| | | | | | | | | |
Consolidated Schedule of Investments | | PIMCO Dynamic Income Fund | | | | | | |
FAIR VALUE OF FINANCIAL DERIVATIVE INSTRUMENTS
The following is a summary of the fair valuation of the Fund’s derivative instruments categorized by risk exposure. See Note 7, Principal and Other Risks, in the Notes to Financial Statements on risks of the Fund.
Fair Values of Financial Derivative Instruments on the Consolidated Statements of Assets and Liabilities as of June 30, 2022:
| | | | | | | | | | | | | | | | | | | | | | | | | |
| | | Derivatives not accounted for as hedging instruments | |
| | | | | | | | | | | | | | | | | | | |
Financial Derivative Instruments - Assets | |
Exchange-traded or centrally cleared | |
| | $ | 0 | | | $ | 5 | | | $ | 0 | | | $ | 0 | | | $ | 7,844 | | | $ | 7,849 | |
| | | | | | | | | | | | | | | | | | | | | | | | | |
| |
Forward Foreign Currency Contracts | | $ | 0 | | | $ | 0 | | | $ | 0 | | | $ | 27,892 | | | $ | 0 | | | $ | 27,892 | |
| | | 0 | | | | 0 | | | | 0 | | | | 0 | | | | 605 | | | | 605 | |
| | | | | | | | | | | | | | | | | | | | | | | | | |
| | | $ | 0 | | | $ | 0 | | | $ | 0 | | | $ | 27,892 | | | $ | 605 | | | $ | 28,497 | |
| | | | | | | | | | | | | | | | | | | | | | | | | |
| | | $ | 0 | | | $ | 5 | | | $ | 0 | | | $ | 27,892 | | | $ | 8,449 | | | $ | 36,346 | |
| | | | | | | | | | | | | | | | | | | | | | | | | |
| |
Financial Derivative Instruments - Liabilities | |
Exchange-traded or centrally cleared | |
| | $ | 0 | | | $ | 1,018 | | | $ | 0 | | | $ | 0 | | | $ | 6,822 | | | $ | 7,840 | |
| | | | | | | | | | | | | | | | | | | | | | | | | |
| |
Forward Foreign Currency Contracts | | $ | 0 | | | $ | 0 | | | $ | 0 | | | $ | 13,128 | | | $ | 0 | | | $ | 13,128 | |
| | | 0 | | | | 6,136 | | | | 0 | | | | 0 | | | | 73 | | | | 6,209 | |
| | | | | | | | | | | | | | | | | | | | | | | | | |
| | | $ | 0 | | | $ | 6,136 | | | $ | 0 | | | $ | 13,128 | | | $ | 73 | | | $ | 19,337 | |
| | | | | | | | | | | | | | | | | | | | | | | | | |
| | | $ | 0 | | | $ | 7,154 | | | $ | 0 | | | $ | 13,128 | | | $ | 6,895 | | | $ | 27,177 | |
| | | | | | | | | | | | | | | | | | | | | | | | | |
The effect of Financial Derivative Instruments on the Consolidated Statements of Operations for the period ended June 30, 2022:
| | | | | | | | | | | | | | | | | | | | | | | | | |
| | | Derivatives not accounted for as hedging instruments | |
| | | | | | | | | | | | | | | | | | | |
Net Realized Gain (Loss) on Financial Derivative Instruments | |
Exchange-traded or centrally cleared | |
| | $ | 0 | | | $ | 3,299 | | | $ | 0 | | | $ | 0 | | | $ | (8,443 | ) | | $ | (5,144 | ) |
| | | | | | | | | | | | | | | | | | | | | | | | | |
| |
Forward Foreign Currency Contracts | | $ | 0 | | | $ | 0 | | | $ | 0 | | | $ | 79,598 | | | $ | 0 | | | $ | 79,598 | |
| | | 0 | | | | (3,352 | ) | | | 0 | | | | 0 | | | | 2,406 | | | | (946 | ) |
| | | | | | | | | | | | | | | | | | | | | | | | | |
| | | $ | 0 | | | $ | (3,352 | ) | | $ | 0 | | | $ | 79,598 | | | $ | 2,406 | | | $ | 78,652 | |
| | | | | | | | | | | | | | | | | | | | | | | | | |
| | | $ | 0 | | | $ | (53 | ) | | $ | 0 | | | $ | 79,598 | | | $ | (6,037 | ) | | $ | 73,508 | |
| | | | | | | | | | | | | | | | | | | | | | | | | |
| |
Net Change in Unrealized Appreciation (Depreciation) on Financial Derivative Instruments | |
Exchange-traded or centrally cleared | |
| | $ | 0 | | | $ | (9,245 | ) | | $ | 0 | | | $ | 0 | | | $ | 10,956 | | | $ | 1,711 | |
| | | | | | | | | | | | | | | | | | | | | | | | | |
| |
Forward Foreign Currency Contracts | | $ | 0 | | | $ | 0 | | | $ | 0 | | | $ | 7,495 | | | $ | 0 | | | $ | 7,495 | |
| | | 0 | | | | 644 | | | | 0 | | | | 0 | | | | (1,407 | ) | | | (763 | ) |
| | | | | | | | | | | | | | | | | | | | | | | | | |
| | | $ | 0 | | | $ | 644 | | | $ | 0 | | | $ | 7,495 | | | $ | (1,407 | ) | | $ | 6,732 | |
| | | | | | | | | | | | | | | | | | | | | | | | | |
| | | $ | 0 | | | $ | (8,601 | ) | | $ | 0 | | | $ | 7,495 | | | $ | 9,549 | | | $ | 8,443 | |
| | | | | | | | | | | | | | | | | | | | | | | | | |
The following is a summary of the fair valuations according to the inputs used as of June 30, 2022 in valuing the Fund’s assets and
liabilities:
| | | | | | | | | | | | | | | | | |
| | | | | | | | | | | | |
Investments in Securities, at Value | |
Loan Participations and Assignments | | $ | 0 | | | $ | 807,634 | | | $ | 560,306 | | | $ | 1,367,940 | |
| |
| | | 0 | | | | 505,341 | | | | 40,468 | | | | 545,809 | |
| | | 0 | | | | 960,473 | | | | 258,893 | | | | 1,219,366 | |
| | | 0 | | | | 336,848 | | | | 0 | | | | 336,848 | |
| | | | | | | | | | | | | | | | | |
| | | | | | | | | | | | |
Convertible Bonds & Notes | |
| | $ | 0 | | | $ | 9,485 | | | $ | 0 | | | $ | 9,485 | |
| | | 0 | | | | 45,153 | | | | 0 | | | | 45,153 | |
| |
| | | 0 | | | | 685 | | | | 0 | | | | 685 | |
| | | 0 | | | | 34,746 | | | | 0 | | | | 34,746 | |
| | | 0 | | | | 28,796 | | | | 0 | | | | 28,796 | |
| | | | | | | | | | | | | | | | | |
| | | | | | | | | | | | |
| | $ | 0 | | | $ | 107,984 | | | $ | 0 | | | $ | 107,984 | |
Non-Agency Mortgage-Backed Securities | | | 0 | | | | 1,655,929 | | | | 9,526 | | | | 1,665,455 | |
| | | 0 | | | | 1,317,511 | | | | 303,604 | | | | 1,621,115 | |
| | | 0 | | | | 136,232 | | | | 0 | | | | 136,232 | |
| |
| | | 21,140 | | | | 0 | | | | 0 | | | | 21,140 | |
| | | 4 | | | | 0 | | | | 0 | | | | 4 | |
| | | 5,357 | | | | 0 | | | | 280 | | | | 5,637 | |
| | | 1,575 | | | | 0 | | | | 49,040 | | | | 50,615 | |
| | | 0 | | | | 0 | | | | 15,352 | | | | 15,352 | |
| | | 0 | | | | 0 | | | | 2,646 | | | | 2,646 | |
| | | 0 | | | | 0 | | | | 11,252 | | | | 11,252 | |
| |
| | | 0 | | | | 0 | | | | 895 | | | | 895 | |
| |
| | | 0 | | | | 0 | | | | 951 | | | | 951 | |
| | | 0 | | | | 0 | | | | 1,682 | | | | 1,682 | |
| | | 0 | | | | 0 | | | | 67,297 | | | | 67,297 | |
| |
| | | 0 | | | | 162,078 | | | | 0 | | | | 162,078 | |
| | | 0 | | | | 2,087 | | | | 132,091 | | | | 134,178 | |
| | | 0 | | | | 0 | | | | 33,921 | | | | 33,921 | |
Real Estate Investment Trusts | |
| | | 48,464 | | | | 0 | | | | 0 | | | | 48,464 | |
| |
| | | 0 | | | | 255,540 | | | | 0 | | | | 255,540 | |
| | | 0 | | | | 2,581 | | | | 0 | | | | 2,581 | |
| | | 0 | | | | 164,140 | | | | 0 | | | | 164,140 | |
| | | | | | | | | | | | | | | | | |
Total Investment in Securities | | $ | 76,540 | | | $ | 6,533,243 | | | $ | 1,488,204 | | | $ | 8,097,987 | |
| | | | | | | | | | | | | | | | | |
| | | | | | | | | | | | | | | | | |
| | | | | | | | | | | | |
Investments in Affiliates, at Value | |
| | $ | 0 | | | $ | 0 | | | $ | 104,203 | | | $ | 104,203 | |
| | | | | | | | | | | | | | | | | |
| | | | | |
| | $ | 76,540 | | | $ | 6,533,243 | | | $ | 1,592,407 | | | $ | 8,202,190 | |
| | | | | | | | | | | | | | | | | |
| |
Short Sales, at Value - Liabilities | |
Loan Participations and Assignments | | $ | 0 | | | $ | (1,872 | ) | | $ | 0 | | | $ | (1,872 | ) |
| | | | | | | | | | | | | | | | | |
| |
Financial Derivative Instruments - Assets | |
Exchange-traded or centrally cleared | | | 0 | | | | 7,849 | | | | 0 | | | | 7,849 | |
| | | 0 | | | | 27,892 | | | | 605 | | | | 28,497 | |
| | | | | | | | | | | | | | | | | |
| | | $ | 0 | | | $ | 35,741 | | | $ | 605 | | | $ | 36,346 | |
| | | | | | | | | | | | | | | | | |
| |
Financial Derivative Instruments - Liabilities | |
Exchange-traded or centrally cleared | | | 0 | | | | (7,840 | ) | | | 0 | | | | (7,840 | ) |
| | | 0 | | | | (19,337 | ) | | | 0 | | | | (19,337 | ) |
| | | | | | | | | | | | | | | | | |
| | | $ | 0 | | | $ | (27,177 | ) | | $ | 0 | | | $ | (27,177 | ) |
| | | | | | | | | | | | | | | | | |
| | | | | |
Total Financial Derivative Instruments | | $ | 0 | | | $ | 8,564 | | | $ | 605 | | | $ | 9,169 | |
| | | | | | | | | | | | | | | | | |
| | | | | |
| | $ | 76,540 | | | $ | 6,539,935 | | | $ | 1,593,012 | | | $ | 8,209,487 | |
| | | | | | | | | | | | | | | | | |
The following is a reconciliation of the fair valuations using significant unobservable inputs (Level 3) for the Fund during the period ended June 30, 2022:
| | | | | | | | | | | | | | | | | | | | | | | | | | | | | | | | | | | | | | | | |
| | Beginning
Balance
at 06/30/2021 | | | | | | | | | Accrued
Discounts/
(Premiums) | | | | | | Net Change in Unrealized Appreciation/ (Depreciation) (2) | | | | | | | | | Ending
Balance
at 06/30/2022 | | | Net Change in Unrealized Appreciation/ (Depreciation) on Investments Held at 06/30/2022 (2) | |
Investments in Securities, at Value | |
Loan Participations and Assignments | | $ | 57,628 | | | $ | 546,013 | | | $ | (32,298 | ) | | $ | 168 | | | $ | (556 | ) | | $ | (74,881 | ) | | $ | 82,964 | | | $ | (18,732 | ) | | $ | 560,306 | | | $ | (58,741 | ) |
| |
| | | 13,023 | | | | 26,100 | | | | 0 | | | | 0 | | | | 0 | | | | 1,345 | | | | 0 | | | | 0 | | | | 40,468 | | | | 1,345 | |
| | | 2 | | | | 210,873 | | | | (1,630 | ) | | | 5 | | | | 0 | | | | (18,376 | ) | | | 68,019 | | | | 0 | | | | 258,893 | | | | (18,216 | ) |
Convertible Bonds & Notes | |
| | | 1,211 | | | | 0 | | | | (1,095 | ) | | | 0 | | | | 0 | | | | (116 | ) | | | 0 | | | | 0 | | | | 0 | | | | 0 | |
Non-Agency Mortgage-Backed Securities | | | 14,836 | | | | 0 | | | | (4,037 | ) | | | 3 | | | | 129 | | | | (1,405 | ) | | | 0 | | | | 0 | | | | 9,526 | | | | (1,143 | ) |
| | | 63,838 | | | | 360,174 | | | | (11,446 | ) | | | 859 | | | | (466 | ) | | | (105,137 | ) | | | 0 | | | | (4,218 | ) | | | 303,604 | | | | (119,579 | ) |
| |
| | | 6,573 | | | | 0 | | | | (4,973 | ) | | | 0 | | | | 0 | | | | (1,600 | ) | | | 0 | | | | 0 | | | | 0 | | | | 0 | |
| | | 0 | | | | 280 | | | | 0 | | | | 0 | | | | 0 | | | | 0 | | | | 0 | | | | 0 | | | | 280 | | | | 0 | |
| | | 0 | | | | 114,057 | | | | 0 | | | | 0 | | | | 0 | | | | (65,017 | ) | | | 0 | | | | 0 | | | | 49,040 | | | | (65,017 | ) |
| | | 0 | | | | 22,026 | | | | 0 | | | | 0 | | | | 0 | | | | (7,007 | ) | | | 333 | | | | 0 | | | | 15,352 | | | | (7,007 | ) |
| | | 17,111 | | | | 57,117 | | | | (78,565 | ) | | | 0 | | | | 6,102 | | | | 881 | | | | 0 | | | | | | | | 2,646 | | | | 2,645 | |
| | | 5,431 | | | | 10,116 | | | | 0 | | | | 0 | | | | 0 | | | | (4,295 | ) | | | 0 | | | | 0 | | | | 11,252 | | | | (4,295 | ) |
| |
| | | 0 | | | | 0 | | | | 0 | | | | 0 | | | | 0 | | | | 895 | | | | 0 | | | | 0 | | | | 895 | | | | 895 | |
| |
| | | 0 | | | | 43,685 | | | | 0 | | | | 0 | | | | (148 | ) | | | (42,586 | ) | | | 0 | | | | 0 | | | | 951 | | | | (42,548 | ) |
| | | 0 | | | | 0 | | | | 0 | | | | 0 | | | | 0 | | | | 1,682 | | | | 0 | | | | 0 | | | | 1,682 | | | | 1,682 | |
| | | 18,870 | | | | 18,507 | | | | 0 | | | | 0 | | | | 0 | | | | 29,920 | | | | 0 | | | | 0 | | | | 67,297 | | | | 29,920 | |
| | | 0 | | | | 106 | | | | 0 | | | | 0 | | | | 0 | | | | (106 | ) | | | 0 | | | | 0 | | | | 0 | | | | (106 | ) |
| |
| | | 2,861 | | | | 81,116 | | | | 0 | | | | 0 | | | | 0 | | | | 48,114 | | | | 0 | | | | 0 | | | | 132,091 | | | | 48,114 | |
| | | 12,174 | | | | 23,884 | | | | (47 | ) | | | 0 | | | | 0 | | | | (2,090 | ) | | | 0 | | | | 0 | | | | 33,921 | | | | (2,090 | ) |
| | | | | | | | | | | | | | | | | | | | | | | | | | | | | | | | | | | | | | | | |
| | $ | 213,558 | | | $ | 1,514,054 | | | $ | (134,091 | ) | | $ | 1,035 | | | $ | 5,061 | | | $ | (239,779 | ) | | $ | 151,316 | | | $ | (22,950 | ) | | $ | 1,488,204 | | | $ | (234,141 | ) |
| | | | | | | | | | | | | | | | | | | | | | | | | | | | | | | | | | | | | | | | |
| | | | | | | | | | | | |
| See Accompanying Notes | | | | | | | | | | JUNE 30, 2022 | | | |
| | | | | | | | |
Consolidated Schedule of Investments | | PIMCO Dynamic Income Fund | | | | | | |
| | | | | | | | | | | | | | | | | | | | | | | | | | | | | | | | | | | | | | | | |
| Category and Subcategory | | Beginning
Balance
at 06/30/2021 | | | | | | | | | Accrued
Discounts/
(Premiums) | | | Realized
Gain/(Loss) | | | Net Change in Unrealized Appreciation/ (Depreciation) (2) | | | Transfers into
Level 3 | | | Transfers out
of Level 3 | | | Ending
Balance
at 06/30/2022 | | | Net Change in Unrealized Appreciation/ (Depreciation) on Investments Held at 06/30/2022 (2) | |
Investments in Affiliates | |
| |
| | $ | 20,120 | | | $ | 21,202 | | | $ | 0 | | | $ | 0 | | | $ | 0 | | | $ | 62,881 | | | $ | 0 | | | $ | 0 | | | $ | 104,203 | | | $ | 62,881 | |
| | | | | | | | | | | | | | | | | | | | | | | | | | | | | | | | | | | | | | | | |
|
Financial Derivative Instruments - Assets | |
| | $ | 0 | | | $ | 25 | | | $ | 0 | | | $ | 0 | | | $ | 0 | | | $ | 580 | | | $ | 0 | | | $ | 0 | | | $ | 605 | | | $ | 580 | |
| | | | | | | | | | | | | | | | | | | | | | | | | | | | | | | | | | | | | | | | |
| | | | | | | | | | |
| | $ | 233,678 | | | $ | 1,535,281 | | | $ | (134,091 | ) | | $ | 1,035 | | | $ | 5,061 | | | $ | (176,318 | ) | | $ | 151,316 | | | $ | (22,950 | ) | | $ | 1,593,012 | | | $ | (170,680 | ) |
| | | | | | | | | | | | | | | | | | | | | | | | | | | | | | | | | | | | | | | | |
The following is a summary of significant unobservable inputs used in the fair valuations of assets and liabilities categorized within Level 3 of the fair value hierarchy:
| | | | | | | | | | | | | | | | | | |
| Category and Subcategory | | Ending
Balance
at 06/30/2022 | | | Valuation
Technique | | Unobservable
Inputs | | | | (% Unless Noted Otherwise) | |
| | | | | | |
Investments in Securities, at Value | |
Loan Participations and Assignments | | $ | 172,048 | | | Discounted Cash Flow | | Discount Rate | | | | | | | | | 6.697 | |
| | | 1,903 | | | Other Valuation Techniques (4) | | — | | | | | — | | | | — | |
| | | 176,357 | | | Proxy Pricing | | Base Price | | | | | 42.500-100.500 | | | | 77.260 | |
| | | 29,728 | | | Reference Instrument | | Yield | | | | | 6.366 | | | | — | |
| | | 180,270 | | | Third Party Vendor | | Broker Quote | | | | | | | | | 92.244 | |
| |
| | | 40,468 | | | Discounted Cash Flow | | Discount Rate | | | | | 6.704 | | | | — | |
| | | 191,961 | | | Discounted Cash Flow | | Discount Rate | | | | | 4.093-12.080 | | | | 11.976 | |
| | | 164 | | | Other Valuation Techniques (4) | | — | | | | | — | | | | — | |
| | | 2 | | | Proxy Pricing | | Base Price | | | | | 0.066 | | | | — | |
| | | 66,766 | | | Reference Instrument | | Weighted Average | | BRL | | | 42.864 | | | | — | |
Non-Agency Mortgage-Backed Securities | | | 9,526 | | | Discounted Cash Flow | | Discount Rate | | | | | 5.900 | | | | — | |
| | | 159,863 | | | Discounted Cash Flow | | Discount Rate | | | | | 7.500-22.500 | | | | 12.115 | |
| | | 143,741 | | | Proxy Pricing | | Base Price | | | | | | | | | 124,553.514 | |
| |
| | | 280 | | | Other Valuation Techniques (4) | | — | | | | | — | | | | — | |
| | | 49,040 | | | Indicative Market Quotation | | EBITDA Multiple | | X | | | 7.000 | | | | — | |
| | | 333 | | | Other Valuation Techniques (4) | | — | | | | | — | | | | — | |
| | | 15,019 | | | Reference Instrument | | Purchase Price | | $ | | | 0.980 | | | | — | |
| | | 2,646 | | | Comparable Companies | | EBITDA Multiple | | X | | | 0.977 | | | | | |
| | | 11,252 | | | Other Valuation Techniques (4) | | — | | | | | — | | | | — | |
| |
| | | 895 | | | Other Valuation Techniques (4) | | — | | | | | — | | | | — | |
| |
| | | 36 | | | Indicative Market Quotation | | EBITDA Multiple | | X | | | 7.000 | | | | — | |
| | | 915 | | | Other Valuation Techniques (4) | | — | | | | | — | | | | — | |
| | | 1,682 | | | Comparable Companies | | EBITDA Multiple | | X | | | 10.700/9.100 | | | | — | |
| | | 67,297 | | | Comparable Companies/
Discounted Cash Flow | | EBITDA Multiple | | X | | | 3.875 | | | | — | |
| |
| | | 102,561 | | | Comparable Companies | | EBITDA Multiple | | X | | | 10.700/9.100 | | | | — | |
| | | 29,530 | | | Comparable Companies/
Discounted Cash Flow | | Book Value Multiple/
Discount Rate | | X/% | | | 0.260/21.660 | | | | — | |
| | | 33,921 | | | Discounted Cash Flow | | Discount Rate | | | | | 4.871 | | | | — | |
| |
Investments in Affiliates | | | | |
| | | | |
| | | 104,200 | | | Discounted Cash Flow | | Discount Rate | | | | | 9.500 | | | | — | |
| | | 3 | | | Other Valuation Techniques (4) | | — | | | | | — | | | | — | |
| | | | | | |
| 100 | | PIMCO CLOSED-END FUNDS | | | See Accompanying Notes | |
| | | | | | | | | | | | | | | | | | |
| Category and Subcategory | | Ending
Balance
at 06/30/2022 | | | Valuation
Technique | | Unobservable
Inputs | | | | (% Unless Noted Otherwise) | |
| | Input Value(s) | | | Weighted
Average | |
Financial Derivative Instruments - Assets | |
| | $ | 605 | | | Indicative Market Quotation | | Broker Quote | | | | | 6.759 | | | | — | |
| | | | | | | | | | | | | | | | | | |
| | $ | 1,593,012 | | | | | | | | | | | | | | | |
| | | | | | | | | | | | | | | | | | |
| Net Purchases and Settlements for Financial Derivative Instruments may include payments made or received upon entering into swap agreements to compensate for differences between the stated terms of the swap agreement and prevailing market conditions. |
| Any difference between Net Change in Unrealized Appreciation/(Depreciation) and Net Change in Unrealized Appreciation/(Depreciation) on Investments Held at June 30, 2022 may be due to an investment no longer held or categorized as Level 3 at period end. |
| Sector types updated from Affiliated Investments to Materials since prior fiscal year end. |
| Includes valuation techniques not defined in the Notes to Financial Statements as securities valued using such techniques are not considered significant to the Fund. |
| | | | | | | | | | | | |
| See Accompanying Notes | | | ANNUAL REPORT | | | | | | | JUNE 30, 2022 | | | 101 |
| | | | | | |
Consolidated Schedule of Investments | | PIMCO Dynamic Income Opportunities Fund | | | | |
(Amounts in thousands*, except number of shares, contracts, units and ounces, if any)
| | | | | | | | | | | | |
| | | | | PRINCIPAL
AMOUNT
(000S) | | | | | MARKET
VALUE
(000S) | |
INVESTMENTS IN SECURITIES 185.1% | |
| |
LOAN PARTICIPATIONS AND ASSIGNMENTS 41.3% | |
|
| |
4.250% (LIBOR03M + 3.500%) due 08/11/2028 «~ | | $ | | | 2,800 | | | $ | | | 2,583 | |
|
| |
8.250% (LIBOR03M + 6.000%) due 12/11/2025 «~ | | | | | 18,849 | | | | | | 18,104 | |
|
| |
| | | | | 52,957 | | | | | | 49,250 | |
|
| |
7.166% (LIBOR01M + 5.500%) due 09/01/2027 ~ | | | | | 13,955 | | | | | | 13,172 | |
|
Caesars Resort Collection LLC | |
4.416% (LIBOR01M + 2.750%) due 12/23/2024 ~ | | | | | 12,312 | | | | | | 11,887 | |
|
| |
3.750% - 3.975% (EUR003M + 3.750%) due 06/30/2025 ~ | | EUR | | | 29,623 | | | | | | 28,793 | |
6.127% (LIBOR06M + 3.250%) due 10/18/2028 «~ | | $ | | | 3,440 | | | | | | 3,096 | |
|
| |
5.750% (LIBOR03M + 4.750%) due 07/14/2026 ~ | | | | | 9,724 | | | | | | 8,805 | |
|
Clear Channel Outdoor Holdings, Inc. | |
4.739% (LIBOR03M + 3.500%) due 08/21/2026 ~ | | | | | 11,515 | | | | | | 9,914 | |
|
Commercial Mortgage Trust, Inc | |
| | EUR | | | 21,515 | | | | | | 18,629 | |
|
| |
2.500% (EUR003M + 2.500%) due 04/07/2025 ~ | | | | | 29,584 | | | | | | 28,755 | |
3.410% (LIBOR01M + 2.250%) due 04/07/2025 ~ | | $ | | | 1,067 | | | | | | 1,020 | |
|
Cromwell EREIT Lux Finco SARL | |
1.500% (EUR003M + 1.500%) due 11/21/2024 «~ | | EUR | | | 6,800 | | | | | | 6,449 | |
|
| |
6.666% (LIBOR01M + 5.000%) due 08/02/2027 ~ | | $ | | | 5,036 | | | | | | 4,657 | |
|
Envision Healthcare Corp. | |
| | | | | 4,415 | | | | | | 4,360 | |
| | | | | 24,285 | | | | | | 23,981 | |
|
Frontier Communications Corp. | |
5.150% - 6.063% (LIBOR03M + 3.750%) due 05/01/2028 ~ | | | | | 13,916 | | | | | | 13,072 | |
|
| |
6.000% (LIBOR03M + 3.750%) due 10/01/2026 ~ | | | | | 6 | | | | | | 6 | |
|
Gateway Casinos & Entertainment Ltd. | |
9.590% (LIBOR03M + 8.000%) due 10/15/2027 ~ | | | | | 46,521 | | | | | | 45,969 | |
| | CAD | | | 10,155 | | | | | | 7,801 | |
|
| |
6.411% (LIBOR03M + 5.000%) due 08/11/2028 ~ | | $ | | | 6,269 | | | | | | 5,438 | |
|
Instant Brands Holdings, Inc. | |
6.400% - 7.076% (LIBOR03M + 5.000%) due 04/12/2028 ~ | | | | | 19,809 | | | | | | 15,914 | |
|
Intelsat Jackson Holdings SA | |
| | | | | 13,762 | | | | | | 12,626 | |
|
| |
7.416% (LIBOR01M + 5.750%) due 09/21/2029 ~ | | | | | 1,700 | | | | | | 1,636 | |
|
| |
6.825% (LIBOR03M + 5.250%) due 08/30/2026 ~ | | | | | 6,792 | | | | | | 6,389 | |
|
| |
| | | | | 21,053 | | | | | | 17,689 | |
|
| |
| | | | | 22,555 | | | | | | 7,894 | |
1.750% (LIBOR03M) due 02/26/2035 «~ | | | | | 6,372 | | | | | | 2,230 | |
| | | | | | | | | | | | |
| | | | | PRINCIPAL
AMOUNT
(000S) | | | | | MARKET
VALUE
(000S) | |
|
Project Quasar Pledgco SLU | |
3.250% (EUR003M + 3.250%) due 03/15/2026 «~ | | EUR | | | 12,290 | | | $ | | | 12,676 | |
|
Promotora de Informaciones SA | |
5.250% (EUR003M + 5.250%) due 12/31/2026 ~ | | | | | 29,646 | | | | | | 27,883 | |
9.000% (EUR003M + 8.000%) due 06/30/2027 ~ | | | | | 9,555 | | | | | | 9,074 | |
|
| |
5.166% (LIBOR01M + 3.500%) due 02/12/2027 ~ | | $ | | | 10,838 | | | | | | 9,931 | |
|
| |
6.582% - 7.632% due 01/29/2028 | | GBP | | | 20,000 | | | | | | 20,268 | |
|
Republic of Cote d’lvoire | |
5.000% (EUR003M + 5.000%) due 03/19/2027 «~ | | EUR | | | 1,000 | | | | | | 1,008 | |
|
Royal Caribbean Cruises Ltd. | |
0.500% - 2.809% (LIBOR01M + 1.300%) due 10/12/2022 ~µ | | $ | | | 14,200 | | | | | | 13,916 | |
|
Sequa Mezzanine Holdings LLC | |
8.303% (LIBOR03M + 6.750%) due 11/28/2023 ~ | | | | | 11,014 | | | | | | 10,968 | |
|
| |
4.105% (BP0003M + 4.000%) due 07/02/2025 ~ | | GBP | | | 20,000 | | | | | | 18,259 | |
6.320% (WIBOR03M + 3.500%) due 07/02/2025 ~ | | PLN | | | 31,054 | | | | | | 5,024 | |
|
| |
| | $ | | | 26,332 | | | | | | 26,332 | |
|
Steenbok Lux Finco 1 SARL (10.000% PIK) | |
10.000% (LIBOR03M) due 12/31/2022 ~ | | EUR | | | 9,452 | | | | | | 5,993 | |
|
Steenbok Lux Finco 2 SARL (10.750% PIK) | |
10.750% (EUR003M) due 12/29/2022 «~(b) | | | | | 53,210 | | | | | | 34,293 | |
|
Steenbok Lux Finco 2 SARL (7.875% PIK) | |
7.875% (EUR003M)
due 12/29/2022 ~(b) | | | | | 1,736 | | | | | | 1,813 | |
|
Sunseeker International Ltd. | |
TBD% - 6.739% (LIBOR03M + 5.500%) due 10/31/2028 «~µ | | $ | | | 22,100 | | | | | | 21,849 | |
|
| |
| | | | | 39,453 | | | | | | 34,817 | |
|
Team Health Holdings, Inc. | |
4.416% (LIBOR01M + 2.750%) due 02/06/2024 ~ | | | | | 35,553 | | | | | | 31,761 | |
|
| |
| | | | | 2,281 | | | | | | 798 | |
1.750% (LIBOR12M + 1.750%) due 02/26/2035 «~ | | | | | 3,732 | | | | | | 1,288 | |
|
| |
3.916% (LIBOR01M + 2.250%) due 08/22/2024 ~ | | | | | 9,848 | | | | | | 9,507 | |
3.916% (LIBOR01M + 2.250%) due 12/09/2025 ~ | | | | | 9,848 | | | | | | 9,376 | |
|
| |
6.688% (LIBOR01M + 5.000%) due 06/26/2026 ~ | | | | | 5,077 | | | | | | 3,496 | |
|
| |
5.150% - 5.392% (LIBOR01M + 3.750%) due 04/21/2028 ~ | | | | | 2,370 | | | | | | 2,206 | |
|
| |
7.250% (LIBOR03M + 5.000%) due 09/01/2025 ~ | | | | | 8,261 | | | | | | 6,810 | |
|
| |
6.666% (LIBOR01M + 5.000%) due 07/30/2028 «~ | | | | | 6,154 | | | | | | 5,784 | |
| | | | | | | | | | | | |
Total Loan Participations and Assignments (Cost $806,406) | | | | |
| | | | |
| |
| | | | | | | | | | | | |
| | | | | | | | | | | |
CORPORATE BONDS & NOTES 48.2% | |
| |
| |
|
Banca Monte dei Paschi di Siena SpA | |
1.875% due 01/09/2026 (k) | | EUR | | | 20,927 | | | $ | | | 18,367 | |
2.625% due 04/28/2025 (k) | | | | | 7,000 | | | | | | 6,517 | |
3.625% due 09/24/2024 (k) | | | | | 7,800 | | | | | | 7,563 | |
5.375% due 01/18/2028 •(k) | | | | | 6,000 | | | | | | 3,737 | |
8.000% due 01/22/2030 •(k) | | | | | 2,514 | | | | | | 1,687 | |
10.500% due 07/23/2029 (k) | | | | | 15,855 | | | | | | 11,624 | |
|
| |
7.125% due 06/15/2025 •(g)(h)(k) | | GBP | | | 300 | | | | | | 351 | |
|
| |
18.945% (T-BILL 3MO + 17.250%) due 07/08/2028 ~(k) | | $ | | | 3,400 | | | | | | 3,311 | |
|
Corsair International Ltd. | |
| | EUR | | | 1,700 | | | | | | 1,682 | |
| | | | | 1,100 | | | | | | 1,077 | |
|
| |
6.375% due 08/21/2026 •(g)(h)(k) | | $ | | | 600 | | | | | | 497 | |
7.125% due 07/29/2022 •(g)(h)(k) | | | | | 200 | | | | | | 200 | |
7.250% due 09/12/2025 •(g)(h)(k) | | | | | 200 | | | | | | 174 | |
|
Fairfax India Holdings Corp. | |
5.000% due 02/26/2028 (k) | | | | | 18,350 | | | | | | 17,863 | |
|
| |
15.273% (T-BILL 3MO + 13.580%) due 03/01/2024 ~(k) | | | | | 3,920 | | | | | | 3,617 | |
19.023% (T-BILL 3MO + 17.330%) due 03/01/2024 ~(k) | | | | | 1,120 | | | | | | 989 | |
|
| |
9.500% (T-BILL 3MO + 9.500%) due 04/22/2025 ~ | | | | | 2,347 | | | | | | 2,330 | |
|
Jefferson Capital Holdings LLC | |
6.000% due 08/15/2026 (k) | | | �� | | 5,030 | | | | | | 4,410 | |
|
| |
11.750% (T-BILL 3MO + 11.750%) due 04/09/2029 ~ | | | | | 4,164 | | | | | | 4,168 | |
|
| |
6.000% due 01/15/2030 (k) | | | | | 21,202 | | | | | | 14,696 | |
6.500% due 02/15/2029 (k) | | | | | 26,904 | | | | | | 19,786 | |
7.875% due 02/15/2025 (k) | | | | | 19,000 | | | | | | 18,393 | |
|
| |
3.875% due 02/15/2029 (k) | | | | | 3,600 | | | | | | 3,103 | |
4.500% due 09/01/2026 (k) | | | | | 1,200 | | | | | | 1,106 | |
4.500% due 01/15/2028 (k) | | | | | 200 | | | | | | 183 | |
5.750% due 02/01/2027 (k) | | | | | 5,100 | | | | | | 4,849 | |
|
Voyager Aviation Holdings LLC | |
8.500% due 05/09/2026 (k) | | | | | 49,287 | | | | | | 44,112 | |
| | | | | | | | | | | | |
| | | | | | | | | | | 196,392 | |
| | | | | | | | | | | | |
| |
| |
|
| |
5.750% due 08/15/2029 (k) | | | | | 5,253 | | | | | | 4,230 | |
|
American Airlines Pass-Through Trust | |
3.350% due 04/15/2031 (k) | | | | | 784 | | | | | | 722 | |
3.700% due 04/01/2028 (k) | | | | | 2,101 | | | | | | 1,824 | |
|
| |
5.500% due 04/20/2026 (k) | | | | | 4,000 | | | | | | 3,689 | |
|
| |
7.125% due 06/15/2026 (k) | | | | | 17,600 | | | | | | 14,568 | |
7.500% due 03/15/2025 (k) | | | | | 5,138 | | | | | | 4,658 | |
|
| |
10.250% due 05/01/2030 (k) | | | | | 7,400 | | | | | | 6,092 | |
|
| |
7.750% due 04/01/2027 (k) | | EUR | | | 8,900 | | | | | | 7,974 | |
8.750% due 04/01/2027 (k) | | $ | | | 25,253 | | | | | | 21,519 | |
|
Community Health Systems, Inc. | |
8.000% due 03/15/2026 (k) | | | | | 28,000 | | | | | | 25,580 | |
|
| |
3.875% due 04/15/2026 (k) | | EUR | | | 7,300 | | | | | | 6,787 | |
|
| |
5.250% due 12/01/2026 (k) | | $ | | | 5,630 | | | | | | 4,424 | |
| | | | | | |
| 102 | | PIMCO CLOSED-END FUNDS | | | See Accompanying Notes | |
| | | | | | | | | | | | |
| | | | | PRINCIPAL
AMOUNT
(000S) | | | | | MARKET
VALUE
(000S) | |
|
Endurance International Group Holdings, Inc. | |
6.000% due 02/15/2029 (k) | | $ | | | 10,800 | | | $ | | | 7,810 | |
|
| |
6.250% due 05/15/2026 (k) | | EUR | | | 9,000 | | | | | | 7,156 | |
|
Frontier Communications Holdings LLC | |
6.000% due 01/15/2030 (k) | | $ | | | 5,398 | | | | | | 4,168 | |
|
| |
3.875% due 10/15/2028 (k) | | EUR | | | 3,600 | | | | | | 3,125 | |
|
| |
5.198% due 06/15/2034 (k) | | $ | | | 5,356 | | | | | | 4,354 | |
|
Intelsat Jackson Holdings SA | |
6.500% due 03/15/2030 (k) | | | | | 48,922 | | | | | | 40,483 | |
|
Iris Holdings, Inc. (8.750% Cash or 9.500% PIK) | |
8.750% due 02/15/2026 (b)(k) | | | | | 17,500 | | | | | | 14,027 | |
|
| |
4.750% due 11/04/2027 (k) | | EUR | | | 2,300 | | | | | | 1,921 | |
|
Melco Resorts Finance Ltd. | |
5.375% due 12/04/2029 (k) | | $ | | | 200 | | | | | | 121 | |
|
| |
4.750% due 02/01/2027 (k) | | | | | 1,300 | | | | | | 921 | |
5.375% due 05/15/2024 (k) | | | | | 2,600 | | | | | | 2,219 | |
|
| |
5.875% due 02/15/2027 (k) | | | | | 4,435 | | | | | | 3,800 | |
|
| |
4.810% due 09/17/2030 (k) | | | | | 200 | | | | | | 178 | |
|
| |
6.625% due 06/15/2035 (k) | | | | | 5,250 | | | | | | 3,597 | |
6.700% due 02/16/2032 (k) | | | | | 2,378 | | | | | | 1,818 | |
6.750% due 09/21/2047 (k) | | | | | 42,909 | | | | | | 26,645 | |
|
Petrorio Luxembourg Trading SARL | |
6.125% due 06/09/2026 (k) | | | | | 2,604 | | | | | | 2,399 | |
|
| |
1.625% due 05/09/2028 (k) | | EUR | | | 1,100 | | | | | | 863 | |
| | $ | | | 251 | | | | | | 224 | |
| | EUR | | | 100 | | | | | | 99 | |
5.750% due 10/15/2027 (k) | | $ | | | 4,008 | | | | | | 3,623 | |
|
| |
4.091% due 06/01/2029 (k) | | | | | 2,600 | | | | | | 2,241 | |
|
Spirit Airlines Pass-Through Trust | |
4.100% due 10/01/2029 (k) | | | | | 318 | | | | | | 305 | |
|
| |
5.625% due 08/15/2029 (k) | | | | | 1,500 | | | | | | 1,209 | |
|
Standard Industries, Inc. | |
4.375% due 07/15/2030 (k) | | | | | 3,200 | | | | | | 2,530 | |
|
| |
5.000% due 01/15/2029 (k) | | | | | 7,700 | | | | | | 3,987 | |
|
| |
| | | | | 508 | | | | | | 522 | |
|
| |
5.750% due 09/30/2039 (k) | | | | | 17,429 | | | | | | 15,851 | |
|
Turkish Airlines Pass-Through Trust | |
| | | | | 291 | | | | | | 242 | |
|
| |
10.625% due 07/15/2027 (k) | | | | | 20,402 | | | | | | 7,702 | |
|
| |
0.000% due 12/29/2049 «~(g) | | BRL | | | 340,000 | | | | | | 27,334 | |
|
| |
7.500% due 09/01/2025 (k) | | $ | | | 22,099 | | | | | | 16,627 | |
|
| |
6.375% due 05/15/2029 (k) | | | | | 1,200 | | | | | | 734 | |
|
| |
13.000% due 05/15/2025 (k) | | | | | 100 | | | | | | 103 | |
|
Viking Ocean Cruises Ship Ltd. | |
5.625% due 02/15/2029 (k) | | | | | 14,500 | | | | | | 11,452 | |
|
| |
5.000% due 02/15/2028 (k) | | | | | 14,000 | | | | | | 11,268 | |
|
Wesco Aircraft Holdings, Inc. (7.500% Cash and 3.000% PIK) | |
10.500% due 11/15/2026 «(b)(k) | | | | | 82,647 | | | | | | 78,434 | |
|
| |
7.750% due 08/15/2028 (k) | | | | | 51,680 | | | | | | 41,746 | |
| | | | | | | | | | | | |
| | | | | PRINCIPAL
AMOUNT
(000S) | | | | | MARKET
VALUE
(000S) | |
|
| |
5.500% due 03/01/2025 (k) | | $ | | | 20,406 | | | $ | | | 18,712 | |
|
| |
4.875% due 10/01/2024 (k) | | | | | 500 | | | | | | 373 | |
5.500% due 01/15/2026 (k) | | | | | 1,800 | | | | | | 1,249 | |
5.500% due 10/01/2027 (k) | | | | | 600 | | | | | | 389 | |
| | | | | | | | | | | | |
| | | | | | | | | | | 474,628 | |
| | | | | | | | | | | | |
| |
| |
|
DTEK Finance PLC (3.500% Cash and 3.500% PIK) | |
7.000% due 12/31/2027 (b) | | | | | 4,684 | | | | | | 1,127 | |
|
| |
6.750% due 08/06/2023 (k) | | | | | 48,000 | | | | | | 44,280 | |
|
| |
5.750% due 12/01/2040 (k) | | | | | 9,419 | | | | | | 6,853 | |
|
Gazprom PJSC via Gaz Finance PLC | |
| | | | | 200 | | | | | | 60 | |
|
| |
| | | | | 1,113 | | | | | | 495 | |
|
Oi SA (10.000% Cash or 12.000% PIK) | |
10.000% due 07/27/2025 (b)(k) | | | | | 28,500 | | | | | | 13,992 | |
|
Pacific Gas & Electric Co. | |
4.200% due 06/01/2041 (k) | | | | | 7,500 | | | | | | 5,504 | |
4.450% due 04/15/2042 (k) | | | | | 448 | | | | | | 337 | |
4.600% due 06/15/2043 (k) | | | | | 8,128 | | | | | | 6,215 | |
4.750% due 02/15/2044 (k) | | | | | 21,408 | | | | | | 16,446 | |
4.950% due 07/01/2050 (k) | | | | | 24,700 | | | | | | 19,756 | |
|
| |
5.375% due 03/22/2030 (k) | | | | | 12,625 | | | | | | 10,227 | |
|
Petrobras Global Finance BV | |
6.750% due 06/03/2050 (k) | | | | | 16,099 | | | | | | 13,982 | |
6.900% due 03/19/2049 (k) | | | | | 3,350 | | | | | | 3,000 | |
| | | | | | | | | | | | |
| | | | | | | | | | | 142,274 | |
| | | | | | | | | | | | |
Total Corporate Bonds & Notes
(Cost $1,022,636) | | | | |
| | | | |
| |
CONVERTIBLE BONDS & NOTES 2.5% | |
| |
| |
|
Corestate Capital Holding SA | |
1.375% due 11/28/2022 (k) | | EUR | | | 7,300 | | | | | | 1,990 | |
|
| |
5.500% due 03/15/2026 (k) | | $ | | | 24,225 | | | | | | 21,350 | |
| | | | | | | | | | | | |
| | | | | | | | | | | 23,340 | |
| | | | | | | | | | | | |
| |
| |
|
| |
3.375% due 08/15/2026 (k) | | | | | 3,700 | | | | | | 2,508 | |
|
| |
0.000% due 02/01/2026 (f)(k) | | | | | 20,000 | | | | | | 16,476 | |
| | | | | | | | | | | | |
| | | | | | | | | | | 18,984 | |
| | | | | | | | | | | | |
Total Convertible Bonds & Notes
(Cost $53,906) | | | | |
| | | | |
| |
MUNICIPAL BONDS & NOTES 1.8% | |
| |
| |
|
Commonwealth of Puerto Rico Bonds, Series 2022 | |
| | | | | 18,115 | | | | | | 9,035 | |
| | | | | 6,700 | | | | | | 2,889 | |
|
Commonwealth of Puerto Rico General Obligation Bonds, Series 2021 | |
0.000% due 07/01/2033 (f) | | | | | 3,793 | | | | | | 2,136 | |
| | | | | 2,947 | | | | | | 2,707 | |
| | | | | 2,649 | | | | | | 2,380 | |
| | | | | 2,274 | | | | | | 2,018 | |
| | | | | 2,069 | | | | | | 1,797 | |
|
Commonwealth of Puerto Rico General Obligation Notes, Series 2021 | |
0.000% due 07/01/2024 (f) | | | | | 1,516 | | | | | | 1,388 | |
| | | | | | | | | | | | |
| | | | | PRINCIPAL
AMOUNT
(000S) | | | | | MARKET
VALUE
(000S) | |
| | $ | | | 3,292 | | | $ | | | 3,352 | |
| | | | | | | | | | | | |
| | | | | | | | | | | 27,702 | |
| | | | | | | | | | | | |
| |
| |
|
Tobacco Settlement Finance Authority, West Virginia Revenue Bonds, Series 2007 | |
0.000% due 06/01/2047 (f) | | | | | 25,000 | | | | | | 2,025 | |
| | | | | | | | | | | | |
Total Municipal Bonds & Notes
(Cost $33,532) | | | | |
| | | | |
| |
U.S. GOVERNMENT AGENCIES 2.4% | |
|
| |
2.500% due 04/25/2049 - 02/25/2050 (a)(k) | | | | | 24,249 | | | | | | 3,154 | |
3.000% due 12/25/2032 - 01/25/2051 (a)(k) | | | | | 14,716 | | | | | | 2,271 | |
3.500% due 05/25/2030 - 04/25/2050 (a)(k) | | | | | 16,465 | | | | | | 2,464 | |
4.000% due 09/25/2051 (a)(k) | | | | | 27,919 | | | | | | 6,297 | |
4.500% due 07/25/2045 - 12/25/2047 (a)(k) | | | | | 4,269 | | | | | | 849 | |
5.000% due 08/25/2043 (a)(k) | | | | | 3,188 | | | | | | 628 | |
|
| |
2.000% due 11/25/2050 - 01/25/2051 (a)(k) | | | | | 20,554 | | | | | | 2,060 | |
2.500% due 03/25/2051 (a)(k) | | | | | 17,005 | | | | | | 2,602 | |
3.000% due 11/25/2050 - 09/25/2051 (a)(k) | | | | | 50,532 | | | | | | 7,863 | |
3.500% due 04/25/2041 - 08/25/2051 (a)(k) | | | | | 29,140 | | | | | | 4,727 | |
4.000% due 11/25/2048 - 06/25/2051 (a)(k) | | | | | 16,727 | | | | | | 3,265 | |
4.500% due 12/25/2050 - 07/25/2051 (a)(k) | | | | | 10,765 | | | | | | 1,961 | |
4.676% due 07/15/2042 •(a)(k) | | | | | 2,140 | | | | | | 284 | |
4.876% (US0001M + 6.200%) due 03/15/2043 ~(a)(k) | | | | | 10,316 | | | | | | 1,140 | |
4.876% due 11/15/2047 •(a)(k) | | | | | 290 | | | | | | 44 | |
| | | | | | | | | | | | |
Total U.S. Government Agencies (Cost $35,196) | | | | |
| | | | |
| |
NON-AGENCY MORTGAGE-BACKED SECURITIES 47.3% | |
|
280 Park Avenue Mortgage Trust | |
4.018% due 09/15/2034 •(k) | | | | | 4,750 | | | | | | 4,414 | |
|
Ashford Hospitality Trust | |
3.424% due 04/15/2035 •(k) | | | | | 2,500 | | | | | | 2,345 | |
4.424% due 04/15/2035 •(k) | | | | | 8,700 | | | | | | 7,952 | |
|
Atrium Hotel Portfolio Trust | |
4.374% (US0001M + 3.050%) due 12/15/2036 ~(k) | | | | | 1,111 | | | | | | 1,005 | |
4.724% due 06/15/2035 •(k) | | | | | 11,037 | | | | | | 10,093 | |
|
Austin Fairmont Hotel Trust | |
3.574% due 09/15/2032 •(k) | | | | | 6,000 | | | | | | 5,551 | �� |
|
Banc of America Funding Trust | |
| | | | | 4,521 | | | | | | 3,592 | |
1.864% due 06/26/2036 •(k) | | | | | 3,691 | | | | | | 3,074 | |
| | | | | 396 | | | | | | 305 | |
|
Barclays Commercial Mortgage Securities Trust | |
3.811% due 02/15/2053 ~(k) | | | | | 15,650 | | | | | | 12,869 | |
4.874% due 07/15/2037 •(k) | | | | | 4,278 | | | | | | 4,062 | |
|
Barclays Commercial Real Estate Trust | |
4.715% due 08/10/2033 ~(k) | | | | | 16,240 | | | | | | 14,760 | |
|
Bear Stearns Commercial Mortgage Securities Trust | |
| | | | | 50 | | | | | | 50 | |
|
| |
4.774% (US0001M + 3.450%) due 03/15/2036 ~(k) | | | | | 5,750 | | | | | | 5,507 | |
5.774% due 03/15/2036 •(k) | | | | | 7,125 | | | | | | 6,835 | |
|
Beneria Cowen & Pritzer Collateral Funding Corp. | |
4.962% due 06/15/2038 •(k) | | | | | 5,000 | | | | | | 4,655 | |
|
Braemar Hotels & Resorts Trust | |
3.724% due 06/15/2035 •(k) | | | | | 7,900 | | | | | | 7,296 | |
| | | | | | | | | | | | | |
| See Accompanying Notes | | | | | | | | | | JUNE 30, 2022 | | | |
| | | | | | | |
Consolidated Schedule of Investments | | PIMCO Dynamic Income Opportunities Fund | | | | |
| | | | | | | | | | | | | |
| | | | | | | | | | | |
| |
| |
4.474% (US0001M + 3.150%) due 07/15/2034 ~(k) | | $ | | | 8,560 | | | $ | | | 8,410 | |
5.574% due 07/15/2034 •(k) | | | | | 6,800 | | | | | | 6,601 | |
| |
Citigroup Commercial Mortgage Trust | |
3.635% due 05/10/2035 ~(k) | | | | | 1,300 | | | | | | 1,207 | |
3.917% due 12/15/2072 ~(k) | | | | | 4,600 | | | | | | 3,476 | |
4.124% due 12/15/2036 •(k) | | | | | 8,811 | | | | | | 8,319 | |
| |
Colony Mortgage Capital Ltd. | |
4.045% due 11/15/2038 •(k) | | | | | 15,000 | | | | | | 13,857 | |
| |
Commercial Mortgage Trust | |
2.874% due 06/15/2034 •(k) | | | | | 4,950 | | | | | | 4,674 | |
| | | | | 7,400 | | | | | | 6,868 | |
| |
Connecticut Avenue Securities Trust | |
3.676% due 12/25/2041 •(k) | | | | | 4,300 | | | | | | 3,629 | |
| |
CRSNT Commercial Mortgage Trust | |
4.830% due 04/15/2036 •(k) | | | | | 7,000 | | | | | | 6,595 | |
| |
| |
4.613% (US0001M + 3.018%) due 12/19/2030 ~(k) | | | | | 29,075 | | | | | | 27,156 | |
| |
Deutsche Mortgage & Asset Receiving Corp. | |
| | | | | 6,314 | | | | | | 5,544 | |
| |
| |
0.665% due 05/10/2041 ~(a)(k) | | | | | 309,500 | | | | | | 13,555 | |
3.704% due 05/10/2041 ~(k) | | | | | 29,000 | | | | | | 21,572 | |
| |
| |
4.070% due 10/15/2043 •(k) | | | | | 5,500 | | | | | | 5,133 | |
| |
Extended Stay America Trust | |
5.025% due 07/15/2038 •(k) | | | | | 18,685 | | | | | | 18,016 | |
| |
| |
4.676% (SOFR30A + 3.750%) due 02/25/2042 ~ | | | | | 8,400 | | | | | | 7,576 | |
5.676% due 02/25/2042 •(k) | | | | | 4,000 | | | | | | 3,540 | |
8.426% due 10/25/2041 •(k) | | | | | 22,000 | | | | | | 18,976 | |
9.426% due 02/25/2042 •(k) | | | | | 1,200 | | | | | | 1,040 | |
| |
GCT Commercial Mortgage Trust | |
4.674% (US0001M + 3.350%) due 02/15/2038 ~(k) | | | | | 49,700 | | | | | | 46,552 | |
| |
| |
| | | | | 13,000 | | | | | | 228 | |
| | | | | 27,000 | | | | | | 473 | |
| |
GS Mortgage Securities Corp. Trust | |
3.874% (US0001M + 2.550%) due 11/15/2032 ~(k) | | | | | 10,782 | | | | | | 10,227 | |
| |
GS Mortgage-Backed Securities Corp. Trust | |
| | | | | 216 | | | | | | 213 | |
0.000% due 12/25/2060 ~(a) | | | | | 191,379 | | | | | | 7,102 | |
0.165% due 12/25/2060 ~(a) | | | | | 168,490 | | | | | | 915 | |
3.596% due 12/25/2060 ~(k) | | | | | 34,468 | | | | | | 28,815 | |
| |
| |
4.074% due 05/15/2038 •(k) | | | | | 39,720 | | | | | | 36,787 | |
| |
| |
4.124% due 12/15/2034 •(k) | | | | | 10,953 | | | | | | 10,378 | |
| |
| |
6.155% due 11/05/2035 (k) | | | | | 6,017 | | | | | | 5,782 | |
| |
| |
4.474% due 11/15/2036 •(k) | | | | | 1,698 | | | | | | 1,569 | |
| |
InTown Hotel Portfolio Trust | |
5.575% due 01/15/2033 •(k) | | | | | 13,100 | | | | | | 12,882 | |
| |
JP Morgan Alternative Loan Trust | |
1.904% due 03/25/2037 •(k) | | | | | 16,272 | | | | | | 16,940 | |
| |
JP Morgan Chase Commercial Mortgage Securities Trust | |
3.524% due 02/15/2035 •(k) | | | | | 1,000 | | | | | | 956 | |
3.620% due 07/05/2033 •(k) | | | | | 5,012 | | | | | | 4,942 | |
3.970% due 07/05/2033 •(k) | | | | | 10,000 | | | | | | 9,781 | |
4.424% due 03/15/2036 •(k) | | | | | 25,550 | | | | | | 24,480 | |
5.174% due 03/15/2036 •(k) | | | | | 9,500 | | | | | | 9,016 | |
| |
JP Morgan Resecuritization Trust | |
| | | | | 9,047 | | | | | | 7,549 | |
| |
Morgan Stanley Capital Trust | |
3.524% (US0001M + 2.200%) due 11/15/2034 ~(k) | | | | | 5,370 | | | | | | 5,115 | |
| | | | | | | | | | | | | |
| | | | | | | | | | | |
3.744% due 12/15/2036 •(k) | | $ | | | 4,294 | | | $ | | | 4,067 | |
4.474% due 11/15/2034 •(k) | | | | | 3,357 | | | | | | 3,126 | |
| |
Morgan Stanley Re-REMIC Trust | |
1.781% due 03/26/2037 þ(k) | | | | | 3,578 | | | | | | 3,522 | |
| |
| |
2.718% due 12/15/2036 (k) | | | | | 28,715 | | | | | | 25,166 | |
| |
Natixis Commercial Mortgage Securities Trust | |
3.575% (US0001M + 2.250%) due 11/15/2034 ~(k) | | | | | 6,000 | | | | | | 5,683 | |
3.917% due 11/15/2032 ~(k) | | | | | 15,192 | | | | | | 14,577 | |
| |
| |
4.013% (US0001M + 2.689%) due 04/15/2032 ~(k) | | | | | 7,491 | | | | | | 6,907 | |
| |
New Residential Mortgage Loan Trust | |
3.528% due 07/25/2055 ~(k) | | | | | 1,242 | | | | | | 1,121 | |
3.990% due 07/25/2059 ~(k) | | | | | 5,000 | | | | | | 3,719 | |
| | | | | 1,000 | | | | | | 895 | |
| |
PMT Credit Risk Transfer Trust | |
4.524% due 02/27/2024 •(k) | | | | | 18,961 | | | | | | 18,530 | |
| |
| |
3.967% due 09/25/2051 þ(k) | | | | | 17,900 | | | | | | 16,551 | |
| |
Ready Capital Mortgage Financing LLC | |
5.374% (US0001M + 3.750%) due 04/25/2038 ~(k) | | | | | 7,000 | | | | | | 6,577 | |
| |
Residential Accredit Loans, Inc. Trust | |
2.044% (US0001M + 0.420%) due 06/25/2037 ~ | | | | | 917 | | | | | | 881 | |
| |
Seasoned Credit Risk Transfer Trust | |
| | | | | 17,929 | | | | | | 8,090 | |
4.250% due 09/25/2060 (k) | | | | | 6,220 | | | | | | 5,641 | |
| | | | | 3,263 | | | | | | 2,815 | |
4.750% due 10/25/2058 ~(k) | | | | | 2,360 | | | | | | 2,173 | |
| | | | | 5,547 | | | | | | 4,548 | |
| | | | | 4,250 | | | | | | 3,474 | |
| |
SFO Commercial Mortgage Trust | |
4.224% due 05/15/2038 •(k) | | | | | 18,000 | | | | | | 16,777 | |
4.974% (US0001M + 3.650%) due 05/15/2038 ~(k) | | | | | 6,000 | | | | | | 5,518 | |
| |
Tharaldson Hotel Portfolio Trust | |
4.600% (US0001M + 3.480%) due 11/11/2034 ~(k) | | | | | 5,025 | | | | | | 4,585 | |
| |
| |
0.000% due 07/15/2059 (f) | | GBP | | | 10,853 | | | | | | 37,867 | |
3.950% due 07/15/2059 •(k) | | | | | 10,843 | | | | | | 12,703 | |
4.950% (SONIO/N + 4.500%) due 07/15/2059 ~ | | | | | 5,421 | | | | | | 6,410 | |
5.450% (SONIO/N + 5.000%) due 07/15/2059 ~ | | | | | 10,844 | | | | | | 12,998 | |
6.450% (SONIO/N + 6.000%) due 07/15/2059 ~ | | | | | 3,212 | | | | | | 3,899 | |
| |
| |
4.474% (US0001M + 3.150%) due 07/15/2039 ~(k) | | $ | | | 10,000 | | | | | | 9,492 | |
5.224% (US0001M + 3.900%) due 07/15/2039 ~(k) | | | | | 7,000 | | | | | | 6,644 | |
| |
Verus Securitization Trust | |
3.195% due 10/25/2063 ~(k) | | | | | 1,800 | | | | | | 1,662 | |
| |
Waikiki Beach Hotel Trust | |
3.354% (US0001M + 2.030%) due 12/15/2033 ~(k) | | | | | 3,000 | | | | | | 2,841 | |
4.004% due 12/15/2033 •(k) | | | | | 5,000 | | | | | | 4,607 | |
| |
WaMu Mortgage Pass-Through Certificates Trust | |
1.286% due 07/25/2047 •(k) | | | | | 2,333 | | | | | | 1,967 | |
2.674% due 12/25/2045 •(k) | | | | | 11,447 | | | | | | 10,232 | |
| |
Wells Fargo Mortgage-Backed Securities Trust | |
| | | | | 295 | | | | | | 281 | |
| | | | | | | | | | | | | |
Total Non-Agency Mortgage-Backed Securities (Cost $858,230) | | | | |
| | | | | |
| | |
ASSET-BACKED SECURITIES 17.2% | |
| |
ACE Securities Corp. Home Equity Loan Trust | |
1.874% due 08/25/2036 •(k) | | | | | 23,884 | | | | | | 18,321 | |
2.209% due 02/25/2036 •(k) | | | | | 6,381 | | | | | | 5,462 | |
| | | | | | | | | | | | |
| | | | | PRINCIPAL
AMOUNT
(000S) | | | | | MARKET
VALUE
(000S) | |
|
Asset-Backed Securities Corp. Home Equity Loan Trust | |
1.854% (US0001M + 0.230%) due 05/25/2037 ~ | | $ | | | 5,980 | | | $ | | | 4,096 | |
|
| |
| | | | | 26,712 | | | | | | 10,200 | |
|
Bear Stearns Asset-Backed Securities Trust | |
| | | | | 6,305 | | | | | | 5,631 | |
|
| |
3.724% due 05/15/2029 •(k) | | | | | 5,000 | | | | | | 4,850 | |
|
Carvana Auto Receivables Trust | |
0.000% due 01/10/2028 «(f) | | | | | 10 | | | | | | 3,117 | |
|
College Avenue Student Loans LLC | |
| | | | | 1,750 | | | | | | 1,602 | |
|
Duke Funding High Grade Ltd. | |
0.090% due 08/02/2049 (a) | | | | | 840,370 | | | | | | 367 | |
0.940% (US0001M + 0.140%) due 08/02/2049 ~ | | | | | 29,910 | | | | | | 442 | |
|
Exeter Automobile Receivables Trust | |
0.000% due 05/15/2031 «(f) | | | | | 7 | | | | | | 3,302 | |
0.000% due 08/15/2031 «(f) | | | | | 12 | | | | | | 8,048 | |
0.000% due 12/15/2033 «(f) | | | | | 14 | | | | | | 11,983 | |
|
First Franklin Mortgage Loan Trust | |
1.934% (US0001M + 0.310%) due 10/25/2036 ~(k) | | | | | 4,000 | | | | | | 3,207 | |
|
| |
| | | | | 3,130 | | | | | | 2,919 | |
|
Flagship Credit Auto Trust | |
0.000% due 04/17/2028 «(f) | | | | | 10 | | | | | | 2,495 | |
|
| |
0.000% due 09/20/2027 «(f) | | | | | 4 | | | | | | 914 | |
|
| |
| | | | | 27,000 | | | | | | 15,460 | |
|
Home Equity Mortgage Loan Asset-Backed Trust | |
1.794% due 04/25/2037 •(k) | | | | | 7,572 | | | | | | 5,244 | |
|
| |
| | | | | 10,000 | | | | | | 7,771 | |
|
Long Beach Mortgage Loan Trust | |
2.329% (US0001M + 0.705%) due 11/25/2035 ~(k) | | | | | 10,014 | | | | | | 9,490 | |
|
Madison Park Funding Ltd. | |
| | | | | 5,600 | | | | | | 3,257 | |
|
| |
0.000% due 09/16/2030 «(f) | | | | | 38 | | | | | | 4,433 | |
|
Mill City Mortgage Loan Trust | |
| | | | | 327,854 | | | | | | 962 | |
| | | | | 275,414 | | | | | | 750 | |
3.554% due 11/25/2058 ~(k) | | | | | 16,205 | | | | | | 10,571 | |
3.597% due 04/25/2057 ~(k) | | | | | 19,586 | | | | | | 15,558 | |
|
| |
| | | | | 327,058 | | | | | | 8,175 | |
1.284% (US0003M + 0.315%) due 10/06/2042 ~ | | | | | 213,556 | | | | | | 16,464 | |
|
Morgan Stanley ABS Capital, Inc. Trust | |
2.734% (US0001M + 1.110%) due 07/25/2035 ~(k) | | | | | 6,910 | | | | | | 5,162 | |
|
Morgan Stanley Capital, Inc. Trust | |
1.984% (US0001M + 0.360%) due 03/25/2036 ~(k) | | | | | 2,558 | | | | | | 2,132 | |
|
| |
| | | | | 13,000 | | | | | | 8,279 | |
|
Option One Mortgage Loan Trust | |
1.864% due 04/25/2037 •(k) | | | | | 3,874 | | | | | | 2,366 | |
|
| |
| | | | | 2,600 | | | | | | 2,295 | |
|
Renaissance Home Equity Loan Trust | |
| | | | | 7,939 | | | | | | 3,314 | |
|
Securitized Asset-Backed Receivables LLC Trust | |
2.124% due 03/25/2036 •(k) | | | | | 1,555 | | | | | | 1,020 | |
|
Sierra Madre Funding Ltd. | |
| | | | | 1,232 | | | | | | 946 | |
|
SMB Private Education Loan Trust | |
0.000% due 02/16/2055 «(f) | | | | | 5 | | | | | | 8,913 | |
5.950% due 02/16/2055 (k) | | | | | 4,592 | | | | | | 4,519 | |
| | | | | | |
| 104 | | PIMCO CLOSED-END FUNDS | | | See Accompanying Notes | |
| | | | | | | | | | | | |
| | | | | PRINCIPAL
AMOUNT
(000S) | | | | | MARKET
VALUE
(000S) | |
|
Specialty Underwriting & Residential Finance Trust | |
1.924% due 09/25/2037 •(k) | | $ | | | 24,016 | | | $ | | | 10,574 | |
|
Structured Asset Investment Loan Trust | |
| | | | | 14,747 | | | | | | 6,696 | |
|
Structured Asset Securities Corp. Mortgage Loan Trust | |
1.824% due 06/25/2037 •(k) | | | | | 5,954 | | | | | | 4,212 | |
1.864% due 01/25/2037 •(k) | | | | | 10,000 | | | | | | 7,050 | |
1.924% (US0001M + 0.300%) due 04/25/2036 ~(k) | | | | | 20,334 | | | | | | 17,596 | |
|
Structured Finance Advisors ABS CDO Ltd. | |
| | | | | 42,077 | | | | | | 8,688 | |
|
| |
| | | | | 49,750 | | | | | | 11,459 | |
| | | | | | | | | | | | |
Total Asset-Backed Securities (Cost $368,415) | | | | |
| | | | |
| |
| |
|
Argentina Government International Bond | |
0.500% due 07/09/2030 þ(k) | | | | | 17,043 | | | | | | 3,766 | |
1.125% due 07/09/2035 þ(k) | | | | | 3,348 | | | | | | 708 | |
2.000% due 01/09/2038 þ(k) | | | | | 2,899 | | | | | | 848 | |
2.500% due 07/09/2041 þ(k) | | | | | 41,970 | | | | | | 10,912 | |
|
Ecuador Government International Bond | |
1.000% due 07/31/2035 þ(k) | | | | | 3,300 | | | | | | 1,646 | |
5.000% due 07/31/2030 þ(k) | | | | | 19,720 | | | | | | 13,009 | |
|
Nigeria Government International Bond | |
8.250% due 09/28/2051 (k) | | | | | 3,600 | | | | | | 2,253 | |
|
Romania Government International Bond | |
2.750% due 04/14/2041 (k) | | EUR | | | 5,800 | | | | | | 3,563 | |
2.875% due 04/13/2042 (k) | | | | | 4,000 | | | | | | 2,461 | |
|
Russia Government International Bond | |
5.100% due 03/28/2035 ^(c) | | $ | | | 200 | | | | | | 53 | |
5.625% due 04/04/2042 ^(c) | | | | | 4,200 | | | | | | 1,239 | |
|
South Africa Government International Bond | |
8.875% due 02/28/2035 (k) | | ZAR | | | 682,900 | | | | | | 35,201 | |
|
Ukraine Government International Bond | |
| | $ | | | 10,700 | | | | | | 2,648 | |
| | | | | | | | | | | | |
Total Sovereign Issues (Cost $108,666) | | | | |
| | | | |
| |
| | | | | SHARES | | | | | | |
| |
| |
| |
| | | | |
| | | | | 115,607 | | | | | | 656 | |
| | | | |
| | | | | 650,684 | | | | | | 18,219 | |
| | | | | | | | | | | | |
| | | | | | | | | | | 18,875 | |
| | | | | | | | | | | | |
| | | | | | | | | | | | |
| | | | | | | | | | | |
| |
| | | |
NAC Aviation Restricted «(d) | | | 382,916 | | | $ | | | 9,056 | |
| | | |
Syniverse Holdings, Inc. «(d)(i) | | | 5,921,230 | | | | | | 5,803 | |
| | | |
Voyager Aviation Holdings LLC «(d) | | | 6,860 | | | | | | 0 | |
| | | | | | | | | | | | |
| | | | | | | | | | | 14,859 | |
| | | | | | | | | | | | |
Total Common Stocks (Cost $54,634) | | | | |
| | | | |
| |
| |
| |
| |
| | | |
Intelsat Jackson Holdings SA «(d) | | | 68,143 | | | | | | 324 | |
| | | | | | | | | | | | |
| | | | |
| | | | |
| |
| |
| |
| |
| | | | |
Intelsat Jackson Holdings SA - Exp. 12/05/2025 « | | | | | 68,143 | | | | | | 341 | |
| | | | | | | | | | | | |
| | | | |
| | | | |
| |
PREFERRED SECURITIES 3.2% | |
| |
| |
|
Nationwide Building Society | |
| | | | | 4,600 | | | | | | 820 | |
|
Stichting AK Rabobank Certificaten | |
6.500% due 12/29/2049 þ(g)(k) | | | | | 40,671,275 | | | | | | 41,504 | |
| | | | | | | | | | | | |
| | | | | | | | | | | 42,324 | |
| | | | | | | | | | | | |
| |
| |
|
Voyager Aviation Holdings LLC | |
| | | | | 41,160 | | | | | | 12,445 | |
| | | | | | | | | | | | |
Total Preferred Securities (Cost $79,382) | | | | |
| | | | |
| | | | | | | | | | | | |
| | | | | | | | | | | |
REAL ESTATE INVESTMENT TRUSTS 3.3% | |
| |
| |
| | | | |
| | | | | 1,270,500 | | | $ | | | 14,064 | |
| | | |
Annaly Capital Management, Inc. | | | 2,438,000 | | | | | | 14,409 | |
| | | |
KKR Real Estate Finance Trust, Inc. | | | 1,082,100 | | | | | | 18,883 | |
| | | | |
PennyMac Mortgage Investment Trust | | | | | 556,200 | | | | | | 7,692 | |
| | | | | | | | | | | | |
Total Real Estate Investment Trusts (Cost $65,676) | | | | |
| | | | |
| |
| | | | | | | | | | | |
SHORT-TERM INSTRUMENTS 11.3% | |
| |
REPURCHASE AGREEMENTS (j) 6.3% | |
| | | | | | | | | | | 105,400 | |
| | | | | | | | | | | | |
| |
| |
0.715% due 07/19/2022 - 07/26/2022 (e)(f)(k)(n) | | $ | | | 84,100 | | | | | | 84,043 | |
| | | | | | | | | | | | |
Total Short-Term Instruments
(Cost $189,460) | | | | |
| | | | | | | | | | | | |
Total Investments in Securities
(Cost $3,676,139) | | | | |
| | | | |
| | | | | | | | | | | | |
Total Investments 185.1%
(Cost $3,676,139) | | | $ | | | | |
| | | | | | | | | | | | |
Financial Derivative
Instruments (l)(m) 0.0% (Cost or Premiums, net $(6,113)) | | | | | | | |
| |
Other Assets and Liabilities, net (85.1)% | | | | |
| | | | | | | | | | | | |
| | | $ | | | | |
| | | | | | | |
NOTES TO CONSOLIDATED SCHEDULE OF INVESTMENTS:
| A zero balance may reflect actual amounts rounding to less than one thousand. |
| Security valued using significant unobservable inputs (Level 3). |
| All or a portion of this amount represents unfunded loan commitments. The interest rate for the unfunded portion will be determined at the time of funding. See Note 4, Securities and Other Investments, in the Notes to Financial Statements for more information regarding unfunded loan commitments. |
| Variable or Floating rate security. Rate shown is the rate in effect as of period end. Certain variable rate securities are not based on a published reference rate and spread, rather are determined by the issuer or agent and are based on current market conditions. Reference rate is as of reset date, which may vary by security. These securities may not indicate a reference rate and/or spread in their description. |
| Rate shown is the rate in effect as of period end. The rate may be based on a fixed rate, a capped rate or a floor rate and may convert to a variable or floating rate in the future. These securities do not indicate a reference rate and spread in their description. |
| Coupon represents a rate which changes periodically based on a predetermined schedule or event. Rate shown is the rate in effect as of period end. |
| Security is an Interest Only (“IO”) or IO Strip. |
| Security is not accruing income as of the date of this report. |
| Security did not produce income within the last twelve months. |
| Coupon represents a weighted average yield to maturity. |
| Perpetual maturity; date shown, if applicable, represents next contractual call date. |
| Contingent convertible security. |
| | | | | | | | | | | | |
| See Accompanying Notes | | | ANNUAL REPORT | | | | | | | JUNE 30, 2022 | | | 105 |
| | | | | | |
Consolidated Schedule of Investments | | PIMCO Dynamic Income Opportunities Fund | | | | |
(i) RESTRICTED SECURITIES:
| | | | | | | | | | | | | | | | | | |
| | | | | | | | | | | | | | Market Value
as Percentage
of Net Assets | |
| | | | | | | | $ | 38,680 | | | $ | 18,219 | | | | 1.08 | % |
| | | | | | 05/12/2022 | | | 5,803 | | | | 5,803 | | | | 0.34 | |
| | | | | | | | | | | | | | | | | | |
| | $ | 44,483 | | | $ | 24,022 | | | | 1.42 | % |
| | | | | | | | | | | | | | | | | | |
BORROWINGS AND OTHER FINANCING TRANSACTIONS
(j) REPURCHASE AGREEMENTS:
| | | | | | | | | | | | | | | | | | | | | | | | | | | | | | |
| | | | | | | | | | | | | | | | | | | Repurchase
Agreements,
at Value | | | Repurchase Agreement Proceeds to be Received (1) | |
| MBC | | | 1.490 | % | | | 06/30/2022 | | | | 07/01/2022 | | | $ | 105,400 | | | U.S. Treasury Notes 0.875% - 1.500% due 01/31/2024 - 02/29/2024 | | $ | (108,779 | ) | | $ | 105,400 | | | $ | 105,404 | |
| | | | | | | | | | | | | | | | | | | | | | | | | | | | | | |
Total Repurchase Agreements | | | | | | | | | | | | | | | |
| | | | | | | | | | | | | | | | | | | | | | | | | | | | | | |
REVERSE REPURCHASE AGREEMENTS:
| | | | | | | | | | | | | | | | | | | | | | | | |
| | | | | | | | | | | | | | Payable for
Reverse
Repurchase
Agreements | |
| | | 1.980 | % | | | 06/10/2022 | | | | 09/08/2022 | | | | $ | | | | (16,480 | ) | | $ | (16,499 | ) |
| | | 1.880 | | | | 06/10/2022 | | | | 09/12/2022 | | | | | | | | (16,945 | ) | | | (16,964 | ) |
| | | 2.370 | | | | 06/28/2022 | | | | 07/28/2022 | | | | | | | | (3,579 | ) | | | (3,580 | ) |
| | | (4.000 | ) | | | 03/23/2022 | | | | TBD | | | | EUR | | | | (1,533 | ) | | | (1,588 | ) |
| | | (0.300 | ) | | | 04/28/2022 | | | | 07/28/2022 | | | | | | | | (3,188 | ) | | | (3,339 | ) |
| | | (0.300 | ) | | | 05/05/2022 | | | | 08/04/2022 | | | | | | | | (49,699 | ) | | | (52,058 | ) |
| | | (0.300 | ) | | | 05/09/2022 | | | | 08/08/2022 | | | | | | | | (2,790 | ) | | | (2,922 | ) |
| | | (0.300 | ) | | | 06/24/2022 | | | | 07/25/2022 | | | | | | | | (1,827 | ) | | | (1,914 | ) |
| | | (0.250 | ) | | | 05/11/2022 | | | | 08/17/2022 | | | | | | | | (3,244 | ) | | | (3,398 | ) |
| | | 1.170 | | | | 02/01/2022 | | | | 08/01/2022 | | | | $ | | | | (14,193 | ) | | | (14,262 | ) |
| | | 1.220 | | | | 03/14/2022 | | | | 09/14/2022 | | | | | | | | (1,271 | ) | | | (1,275 | ) |
| | | 1.250 | | | | 04/14/2022 | | | | 09/16/2022 | | | | | | | | (17,970 | ) | | | (18,019 | ) |
| | | 1.420 | | | | 03/23/2022 | | | | 09/23/2022 | | | | | | | | (837 | ) | | | (841 | ) |
| | | 1.420 | | | | 04/22/2022 | | | | 09/23/2022 | | | | | | | | (4,080 | ) | | | (4,092 | ) |
| | | 1.430 | | | | 03/21/2022 | | | | 09/22/2022 | | | | | | | | (4,626 | ) | | | (4,645 | ) |
| | | 1.430 | | | | 03/22/2022 | | | | 09/23/2022 | | | | | | | | (3,063 | ) | | | (3,076 | ) |
| | | 1.430 | | | | 04/29/2022 | | | | 09/23/2022 | | | | | | | | (469 | ) | | | (470 | ) |
| | | 1.450 | | | | 03/08/2022 | | | | 09/08/2022 | | | | | | | | (41,658 | ) | | | (41,851 | ) |
| | | 1.600 | | | | 04/07/2022 | | | | 07/07/2022 | | | | | | | | (7,500 | ) | | | (7,528 | ) |
| | | 1.650 | | | | 05/02/2022 | | | | 08/02/2022 | | | | | | | | (5,958 | ) | | | (5,974 | ) |
| | | 1.650 | | | | 06/17/2022 | | | | 08/02/2022 | | | | | | | | (1,697 | ) | | | (1,698 | ) |
| | | 1.670 | | | | 03/24/2022 | | | | 09/26/2022 | | | | | | | | (2,628 | ) | | | (2,640 | ) |
| | | 1.680 | | | | 04/18/2022 | | | | 07/22/2022 | | | | | | | | (21,721 | ) | | | (21,796 | ) |
| | | 1.750 | | | | 04/25/2022 | | | | 10/27/2022 | | | | | | | | (2,120 | ) | | | (2,127 | ) |
| | | 1.830 | | | | 05/12/2022 | | | | 08/12/2022 | | | | | | | | (17,793 | ) | | | (17,838 | ) |
| | | 1.920 | | | | 06/16/2022 | | | | 09/16/2022 | | | | | | | | (1,849 | ) | | | (1,850 | ) |
| | | 1.950 | | | | 05/31/2022 | | | | 08/31/2022 | | | | | | | | (1,532 | ) | | | (1,535 | ) |
| | | 1.970 | | | | 06/02/2022 | | | | 09/01/2022 | | | | | | | | (8,224 | ) | | | (8,237 | ) |
| | | 1.990 | | | | 06/10/2022 | | | | 10/27/2022 | | | | | | | | (2,464 | ) | | | (2,467 | ) |
| | | 2.000 | | | | 06/06/2022 | | | | 09/02/2022 | | | | | | | | (12,871 | ) | | | (12,889 | ) |
| | | 2.270 | | | | 05/16/2022 | | | | 08/17/2022 | | | | | | | | (2,621 | ) | | | (2,629 | ) |
| | | 2.300 | | | | 05/24/2022 | | | | 08/24/2022 | | | | | | | | (52,029 | ) | | | (52,155 | ) |
| | | 2.450 | | | | 06/09/2022 | | | | 12/09/2022 | | | | | | | | (36,837 | ) | | | (36,893 | ) |
| | | 2.480 | | | | 06/17/2022 | | | | 09/19/2022 | | | | | | | | (3,165 | ) | | | (3,168 | ) |
| | | 2.530 | | | | 06/16/2022 | | | | 09/16/2022 | | | | | | | | (13,684 | ) | | | (13,699 | ) |
| | | 2.540 | | | | 06/17/2022 | | | | 09/19/2022 | | | | | | | | (8,983 | ) | | | (8,992 | ) |
| | | 2.610 | | | | 06/24/2022 | | | | 09/26/2022 | | | | | | | | (5,106 | ) | | | (5,109 | ) |
| | | 2.760 | | | | 06/01/2022 | | | | 12/01/2022 | | | | | | | | (5,734 | ) | | | (5,747 | ) |
| | | (5.500 | ) | | | 05/23/2022 | | | | TBD | | | | EUR | | | | (1,931 | ) | | | (2,011 | ) |
| | | (1.000 | ) | | | 01/10/2022 | | | | TBD | | | | | | | | (1,252 | ) | | | (1,309 | ) |
| | | (1.000 | ) | | | 06/17/2022 | | | | TBD | | | | $ | | | | (5,417 | ) | | | (5,415 | ) |
| | | 0.780 | | | | 01/31/2022 | | | | 08/04/2022 | | | | | | | | (26,834 | ) | | | (26,922 | ) |
| | | 0.950 | | | | 01/06/2022 | | | | 07/06/2022 | | | | | | | | (8,454 | ) | | | (8,494 | ) |
| | | 1.027 | | | | 01/31/2022 | | | | 08/04/2022 | | | | | | | | (3,249 | ) | | | (3,263 | ) |
| | | | | | |
| 106 | | PIMCO CLOSED-END FUNDS | | | See Accompanying Notes | |
| | | | | | | | | | | | | | | | | | | | | | | | |
| Counterparty | | | | | Settlement
Date | | | Maturity
Date | | | | | | Payable for
Reverse
Repurchase
Agreements | |
| | | 1.610 | % | | | 04/06/2022 | | | | 07/06/2022 | | | | $ | | | | (14,029 | ) | | $ | (14,083 | ) |
| | | 1.875 | | | | 04/27/2022 | | | | 08/01/2022 | | | | | | | | (3,693 | ) | | | (3,706 | ) |
| | | 1.900 | | | | 05/06/2022 | | | | 08/08/2022 | | | | | | | | (22,913 | ) | | | (22,981 | ) |
| | | 1.900 | | | | 06/17/2022 | | | | TBD | | | | | | | | (121 | ) | | | (122 | ) |
| | | 2.030 | | | | 05/24/2022 | | | | 08/24/2022 | | | | | | | | (6,208 | ) | | | (6,221 | ) |
| | | 2.050 | | | | 05/06/2022 | | | | 08/08/2022 | | | | | | | | (15,710 | ) | | | (15,760 | ) |
| | | 2.100 | | | | 06/13/2022 | | | | 09/14/2022 | | | | | | | | (17,424 | ) | | | (17,443 | ) |
| | | 2.250 | | | | 06/21/2022 | | | | 07/22/2022 | | | | | | | | (14,459 | ) | | | (14,468 | ) |
| | | 2.440 | | | | 06/16/2022 | | | | 09/16/2022 | | | | | | | | (8,201 | ) | | | (8,209 | ) |
| | | 2.863 | | | | 06/24/2022 | | | | 09/27/2022 | | | | | | | | (822 | ) | | | (823 | ) |
| | | 2.963 | | | | 06/24/2022 | | | | 09/27/2022 | | | | | | | | (32,004 | ) | | | (32,022 | ) |
| | | 2.110 | | | | 04/29/2022 | | | | 10/26/2022 | | | | | | | | (74,348 | ) | | | (74,462 | ) |
| | | 2.110 | | | | 05/12/2022 | | | | 09/26/2022 | | | | | | | | (35,667 | ) | | | (35,736 | ) |
| | | 2.110 | | | | 06/03/2022 | | | | 10/26/2022 | | | | | | | | (15,348 | ) | | | (15,368 | ) |
| | | (0.400 | ) | | | 06/24/2022 | | | | 07/25/2022 | | | | EUR | | | | (892 | ) | | | (935 | ) |
| | | 0.930 | | | | 01/26/2022 | | | | 07/26/2022 | | | | $ | | | | (11,390 | ) | | | (11,436 | ) |
| | | 0.980 | | | | 01/12/2022 | | | | 07/12/2022 | | | | | | | | (73,552 | ) | | | (73,892 | ) |
| | | 1.250 | | | | 02/16/2022 | | | | 08/15/2022 | | | | | | | | (4,807 | ) | | | (4,829 | ) |
| | | 2.500 | | | | 06/16/2022 | | | | 09/16/2022 | | | | | | | | (6,760 | ) | | | (6,767 | ) |
| | | (0.850 | ) | | | 05/11/2022 | | | | TBD | | | | EUR | | | | (2,714 | ) | | | (2,840 | ) |
| | | 0.980 | | | | 03/14/2022 | | | | 09/14/2022 | | | | $ | | | | (6,126 | ) | | | (6,144 | ) |
| | | 1.610 | | | | 06/28/2022 | | | | 08/05/2022 | | | | | | | | (4,158 | ) | | | (4,159 | ) |
| | | 1.630 | | | | 05/06/2022 | | | | 08/08/2022 | | | | | | | | (588 | ) | | | (589 | ) |
| | | (5.500 | ) | | | 07/01/2021 | | | | TBD | | | | EUR | | | | (2,362 | ) | | | (2,442 | ) |
| | | (4.000 | ) | | | 05/19/2022 | | | | TBD | | | | | | | | (136 | ) | | | (142 | ) |
| | | (1.000 | ) | | | 02/18/2022 | | | | TBD | | | | | | | | (9,000 | ) | | | (9,395 | ) |
| | | (0.450 | ) | | | 06/24/2022 | | | | TBD | | | | | | | | (20,360 | ) | | | (21,334 | ) |
| | | (0.400 | ) | | | 10/01/2021 | | | | TBD | | | | | | | | (7,317 | ) | | | (7,643 | ) |
| | | (0.350 | ) | | | 04/19/2022 | | | | 07/19/2022 | | | | | | | | (7,173 | ) | | | (7,512 | ) |
| | | (0.350 | ) | | | 04/25/2022 | | | | 07/25/2022 | | | | | | | | (784 | ) | | | (821 | ) |
| | | (0.350 | ) | | | 05/10/2022 | | | | 08/09/2022 | | | | | | | | (1,007 | ) | | | (1,055 | ) |
| | | 1.250 | | | | 10/25/2021 | | | | TBD | | | | GBP | | | | (298 | ) | | | (364 | ) |
| | | 1.620 | | | | 04/14/2022 | | | | 07/14/2022 | | | | $ | | | | (11,159 | ) | | | (11,198 | ) |
| | | 1.830 | | | | 05/06/2022 | | | | 08/05/2022 | | | | | | | | (22,190 | ) | | | (22,253 | ) |
| | | 2.000 | | | | 06/17/2022 | | | | 07/29/2022 | | | | | | | | (16,877 | ) | | | (16,890 | ) |
| | | 2.050 | | | | 05/17/2022 | | | | 08/17/2022 | | | | | | | | (27,112 | ) | | | (27,181 | ) |
| | | 2.050 | | | | 06/17/2022 | | | | 07/29/2022 | | | | | | | | (14,922 | ) | | | (14,934 | ) |
| | | 2.140 | | | | 06/06/2022 | | | | 09/02/2022 | | | | | | | | (4,047 | ) | | | (4,053 | ) |
| | | 2.190 | | | | 06/06/2022 | | | | 09/02/2022 | | | | | | | | (55,260 | ) | | | (55,344 | ) |
| | | 5.300 | | | | 01/05/2022 | | | | TBD | | | | ZAR | | | | (584,110 | ) | | | (36,875 | ) |
| | | (5.500 | ) | | | 04/06/2022 | | | | 07/08/2022 | | | | EUR | | | | (166 | ) | | | (172 | ) |
| | | (1.000 | ) | | | 04/06/2022 | | | | 07/08/2022 | | | | | | | | (559 | ) | | | (584 | ) |
| | | 1.150 | | | | 03/08/2022 | | | | 09/08/2022 | | | | $ | | | | (28,143 | ) | | | (28,246 | ) |
| | | 1.630 | | | | 05/19/2022 | | | | 08/16/2022 | | | | GBP | | | | (9,158 | ) | | | (11,170 | ) |
| | | 1.800 | | | | 06/17/2022 | | | | TBD | | | | $ | | | | (3,045 | ) | | | (3,047 | ) |
| | | 1.900 | | | | 06/17/2022 | | | | TBD | | | | | | | | (1,214 | ) | | | (1,215 | ) |
| | | 2.340 | | | | 06/17/2022 | | | | TBD | | | | | | | | (14,268 | ) | | | (14,281 | ) |
| | | 2.500 | | | | 06/09/2022 | | | | 07/05/2022 | | | | | | | | (9,491 | ) | | | (9,505 | ) |
| | | 0.940 | | | | 01/10/2022 | | | | 07/11/2022 | | | | | | | | (14,997 | ) | | | (15,065 | ) |
| | | 2.300 | | | | 05/17/2022 | | | | 08/17/2022 | | | | | | | | (5,302 | ) | | | (5,312 | ) |
| | | 1.400 | | | | 06/06/2022 | | | | 07/11/2022 | | | | | | | | (20,339 | ) | | | (20,359 | ) |
| | | 1.800 | | | | 06/28/2022 | | | | 07/21/2022 | | | | | | | | (5,280 | ) | | | (5,280 | ) |
| | | 2.060 | | | | 01/07/2022 | | | | 01/05/2023 | | | | | | | | (10,505 | ) | | | (10,536 | ) |
| | | 2.320 | | | | 04/01/2022 | | | | 07/01/2022 | | | | | | | | (19,339 | ) | | | (19,391 | ) |
| | | 2.330 | | | | 06/21/2022 | | | | 09/01/2022 | | | | | | | | (4,655 | ) | | | (4,657 | ) |
| | | 2.450 | | | | 05/09/2022 | | | | 08/12/2022 | | | | | | | | (18,937 | ) | | | (18,971 | ) |
| | | 2.510 | | | | 07/01/2022 | | | | 10/03/2022 | | | | | | | | (17,557 | ) | | | (17,557 | ) |
| | | (0.420 | ) | | | 04/19/2022 | | | | 07/19/2022 | | | | EUR | | | | (2,730 | ) | | | (2,858 | ) |
| | | 1.180 | | | | 06/24/2022 | | | | 07/11/2022 | | | | $ | | | | (20,313 | ) | | | (20,318 | ) |
| | | 1.030 | | | | 01/26/2022 | | | | 07/28/2022 | | | | | | | | (33,372 | ) | | | (33,521 | ) |
| | | 1.720 | | | | 06/24/2022 | | | | 08/12/2022 | | | | | | | | (3,217 | ) | | | (3,218 | ) |
| | | 1.900 | | | | 06/02/2022 | | | | 08/31/2022 | | | | | | | | (11,538 | ) | | | (11,555 | ) |
| | | 2.020 | | | | 05/13/2022 | | | | 08/12/2022 | | | | | | | | (3,710 | ) | | | (3,721 | ) |
| | | 2.070 | | | | 05/13/2022 | | | | 08/12/2022 | | | | | | | | (18,084 | ) | | | (18,135 | ) |
| | | 2.098 | | | | 05/17/2022 | | | | 08/17/2022 | | | | | | | | (12,932 | ) | | | (12,966 | ) |
| | | 2.283 | | | | 06/03/2022 | | | | 09/07/2022 | | | | | | | | (7,169 | ) | | | (7,182 | ) |
| | | 2.500 | | | | 06/22/2022 | | | | 09/22/2022 | | | | | | | | (13,626 | ) | | | (13,634 | ) |
| | | 1.720 | | | | 06/17/2022 | | | | TBD | | | | | | | | (1,214 | ) | | | (1,215 | ) |
| | | 1.850 | | | | 06/17/2022 | | | | TBD | | | | | | | | (1,626 | ) | | | (1,627 | ) |
| | | | | | | | | | | | |
| See Accompanying Notes | | | ANNUAL REPORT | | | | | | | JUNE 30, 2022 | | | 107 |
| | | | | | |
Consolidated Schedule of Investments | | PIMCO Dynamic Income Opportunities Fund | | | | |
| | | | | | | | | | | | | | | | | | | | | | | | |
| Counterparty | | | | | Settlement
Date | | | Maturity
Date | | | | | | Payable for
Reverse
Repurchase
Agreements | |
| | | (0.430 | )% | | | 04/25/2022 | | | | TBD | | | | EUR | | | | (1,186 | ) | | $ | (1,242 | ) |
| | | 1.350 | | | | 06/29/2022 | | | | 07/14/2022 | | | | | | | | (4,108 | ) | | | (4,108 | ) |
| | | 1.700 | | | | 05/09/2022 | | | | 08/09/2022 | | | | | | | | (55,323 | ) | | | (55,462 | ) |
| | | 1.700 | | | | 05/12/2022 | | | | 08/12/2022 | | | | | | | | (40,045 | ) | | | (40,139 | ) |
| | | 1.750 | | | | 06/17/2022 | | | | TBD | | | | | | | | (4,589 | ) | | | (4,592 | ) |
| | | 1.850 | | | | 06/17/2022 | | | | TBD | | | | | | | | (899 | ) | | | (899 | ) |
| | | 1.850 | | | | 06/24/2022 | | | | TBD | | | | | | | | (715 | ) | | | (716 | ) |
| | | 1.900 | | | | 06/17/2022 | | | | TBD | | | | | | | | (19,888 | ) | | | (19,903 | ) |
| | | 2.300 | | | | 06/02/2022 | | | | 09/02/2022 | | | | | | | | (11,878 | ) | | | (11,900 | ) |
| | | | | | | | | | | | | | | | | | | | | | | | |
Total Reverse Repurchase Agreements | | | | | | | | | | | | | | | | | |
| | | | | | | | | | | | | | | | | | | | | | | | |
BORROWINGS AND OTHER FINANCING TRANSACTIONS SUMMARY
The following is a summary by counterparty of the market value of Borrowings and Other Financing Transactions and collateral pledged/(received) as of June 30, 2022:
| | | | | | | | | | | | | | | | | | | | | | | | |
| | Repurchase Agreement Proceeds to be Received (1) | | | Payable for
Reverse
Repurchase
Agreements | | | Payable for Sale-Buyback Transactions | | | Total
Borrowings and
Other Financing
Transactions | | | Collateral
Pledged/(Received) | | | | |
Global/Master Repurchase Agreement | |
| | $ | 0 | | | $ | (16,499 | ) | | $ | 0 | | | $ | (16,499 | ) | | $ | 20,428 | | | $ | 3,929 | |
| | | 0 | | | | (20,544 | ) | | | 0 | | | | (20,544 | ) | | | 22,757 | | | | 2,213 | |
| | | 0 | | | | (368,721 | ) | | | 0 | | | | (368,721 | ) | | | 433,159 | | | | 64,438 | |
| | | 0 | | | | (183,252 | ) | | | 0 | | | | (183,252 | ) | | | 218,434 | | | | 35,182 | |
| | | 0 | | | | (125,566 | ) | | | 0 | | | | (125,566 | ) | | | 142,492 | | | | 16,926 | |
| | | 0 | | | | (91,092 | ) | | | 0 | | | | (91,092 | ) | | | 111,713 | | | | 20,621 | |
| | | 0 | | | | (6,767 | ) | | | 0 | | | | (6,767 | ) | | | 7,075 | | | | 308 | |
| | | 0 | | | | (2,840 | ) | | | 0 | | | | (2,840 | ) | | | 2,957 | | | | 117 | |
| | | 0 | | | | (10,892 | ) | | | 0 | | | | (10,892 | ) | | | 12,101 | | | | 1,209 | |
| | | 0 | | | | (202,561 | ) | | | 0 | | | | (202,561 | ) | | | 243,559 | | | | 40,998 | |
| | | 105,404 | | | | (36,875 | ) | | | 0 | | | | 68,529 | | | | (70,738 | ) | | | (2,209 | ) |
| | | 0 | | | | (40,172 | ) | | | 0 | | | | (40,172 | ) | | | 46,383 | | | | 6,211 | |
| | | 0 | | | | (28,048 | ) | | | 0 | | | | (28,048 | ) | | | 32,927 | | | | 4,879 | |
| | | 0 | | | | (20,377 | ) | | | 0 | | | | (20,377 | ) | | | 25,483 | | | | 5,106 | |
| | | 0 | | | | (25,639 | ) | | | 0 | | | | (25,639 | ) | | | 26,530 | | | | 891 | |
| | | 0 | | | | (71,112 | ) | | | 0 | | | | (71,112 | ) | | | 63,246 | | | | (7,866 | ) |
| | | 0 | | | | (23,176 | ) | | | 0 | | | | (23,176 | ) | | | 25,671 | | | | 2,495 | |
| | | 0 | | | | (103,932 | ) | | | 0 | | | | (103,932 | ) | | | 130,663 | | | | 26,731 | |
| | | 0 | | | | (2,842 | ) | | | 0 | | | | (2,842 | ) | | | 3,102 | | | | 260 | |
| | | 0 | | | | (138,961 | ) | | | 0 | | | | (138,961 | ) | | | 154,288 | | | | 15,327 | |
| | | | | | | | | | | | | | | | | | | | | | | | |
Total Borrowings and Other Financing Transactions | | | | | | | | | | | | | | | | | | | | | | | | |
| | | | | | | | | | | | | | | | | | | | | | | | |
CERTAIN TRANSFERS ACCOUNTED FOR AS SECURED BORROWINGS
Remaining Contractual Maturity of the Agreements
| | | | | | | | | | | | | | | | | | | | |
| | | | | | | | | | | | | | | | |
Reverse Repurchase Agreements | |
| | $ | 0 | | | $ | (74,847 | ) | | $ | (355,016 | ) | | $ | (229,700 | ) | | $ | (659,563 | ) |
Convertible Bonds & Notes | | | (19,391 | ) | | | 0 | | | | (6,969 | ) | | | (14,281 | ) | | | (40,641 | ) |
| | | 0 | | | | 0 | | | | (31,476 | ) | | | 0 | | | | (31,476 | ) |
| | | 0 | | | | 0 | | | | (40,745 | ) | | | 0 | | | | (40,745 | ) |
Non-Agency Mortgage-Backed Securities | | | 0 | | | | (199,575 | ) | | | (348,059 | ) | | | 0 | | | | (547,634 | ) |
| | | 0 | | | | (15,485 | ) | | | (84,850 | ) | | | (5,747 | ) | | | (106,082 | ) |
| | | 0 | | | | (34,682 | ) | | | (3,398 | ) | | | (38,090 | ) | | | (76,170 | ) |
| | | | | | | | | | | | | | | | | | | | |
| | | | | | | | | | | | | | | | | | | | |
| | | | | | | | | | | | | | | | | | | | |
Payable for reverse repurchase agreements (5) | | | | | |
| | | | | | | | | | | | | | | | | | | | |
| Securities with an aggregate market value of $1,740,501 and cash of $22,121 have been pledged as collateral under the terms of the above master agreements as of June 30, 2022. |
| Includes accrued interest. |
| The average amount of borrowings outstanding during the period ended June 30, 2022 was $(1,696,224) at a weighted average interest rate of 0.773%. Average borrowings may include reverse repurchase agreements and sale-buyback transactions, if held during the period. |
| | | | | | |
| 108 | | PIMCO CLOSED-END FUNDS | | | See Accompanying Notes | |
| Open maturity reverse repurchase agreement. |
| Net Exposure represents the net receivable/(payable) that would be due from/to the counterparty in the event of default. Exposure from borrowings and other financing transactions can only be netted across transactions governed under the same master agreement with the same legal entity. See Note 8, Master Netting Arrangements, in the Notes to Financial Statements for more information. |
| Unsettled reverse repurchase agreements liability of $(17,557) is outstanding at period end. |
(l) FINANCIAL DERIVATIVE INSTRUMENTS: EXCHANGE-TRADED OR CENTRALLY CLEARED
SWAP AGREEMENTS:
CREDIT DEFAULT SWAPS ON CORPORATE ISSUES - SELL PROTECTION
(1)
| | | | | | | | | | | | | | | | | | | | | | | | | | | | | | | | | | | | | | | | | | | | |
| | | | | | | | | | | Implied Credit Spread at June 30, 2022 (2) | | | | | | | | | Unrealized
Appreciation/
(Depreciation) | | | | | | | |
| | | | | | |
| | | 5.000 | % | | | Quarterly | | | | 06/20/2024 | | | | 7.828 | % | | | $ | | | | 200 | | | $ | (8 | ) | | $ | (1 | ) | | $ | (9 | ) | | $ | 0 | | | $ | 0 | |
| | | 5.000 | | | | Quarterly | | | | 06/20/2025 | | | | 8.463 | | | | | | | | 100 | | | | (8 | ) | | | 0 | | | | (8 | ) | | | 0 | | | | 0 | |
Ford Motor Credit Co. LLC | | | 5.000 | | | | Quarterly | | | | 06/20/2027 | | | | 4.319 | | | | | | | | 15,400 | | | | 1,608 | | | | (1,164 | ) | | | 444 | | | | 0 | | | | (46 | ) |
Jaguar Land Rover Automotive | | | 5.000 | | | | Quarterly | | | | 06/20/2026 | | | | 9.623 | | | | EUR | | | | 1,000 | | | | 64 | | | | (207 | ) | | | (143 | ) | | | 0 | | | | (18 | ) |
Jaguar Land Rover Automotive | | | 5.000 | | | | Quarterly | | | | 12/20/2026 | | | | 9.833 | | | | | | | | 13,300 | | | | 739 | | | | (2,893 | ) | | | (2,154 | ) | | | 0 | | | | (251 | ) |
| | | 1.000 | | | | Quarterly | | | | 06/20/2027 | | | | 4.406 | | | | | | | | 3,100 | | | | (325 | ) | | | (141 | ) | | | (466 | ) | | | 0 | | | | (29 | ) |
| | | 1.000 | | | | Quarterly | | | | 12/20/2025 | | | | 3.940 | | | | | | | | 3,700 | | | | (380 | ) | | | 19 | | | | (361 | ) | | | 0 | | | | (32 | ) |
| | | 1.000 | | | | Quarterly | | | | 06/20/2026 | | | | 4.096 | | | | | | | | 18,300 | | | | (1,384 | ) | | | (714 | ) | | | (2,098 | ) | | | 0 | | | | (174 | ) |
| | | | | | | | | | | | | | | | | | | | | | | | | | | | | | | | | | | | | | | | | | | | |
| | | | | | | | | | | | | | | $ | 306 | | | $ | (5,101 | ) | | $ | (4,795 | ) | | $ | 0 | | | $ | (550 | ) |
| | | | | | | | | | | | | | | | | | | | | | | | | | | | | | | | | | | | | | | | | | | | |
INTEREST RATE SWAPS
| | | | | | | | | | | | | | | | | | | | | | | | | | | | | | | | | | | | | | |
Pay/ Receive
Floating Rate | | | | | | | | | | | | | | | | | | Unrealized
Appreciation/
(Depreciation) | | | | | | | |
| | | | | | |
| | 1-Day GBP-SONIO Compounded-OIS | | | 0.750 | % | | Annual | | | 09/21/2052 | | | GBP | | | 18,400 | | | $ | 674 | | | $ | 6,407 | | | $ | 7,081 | | | $ | 0 | | | $ | (547 | ) |
| | 1-Day USD-SOFR Compounded-OIS | | | 1.250 | | | Annual | | | 09/21/2026 | | | $ | | | 91,700 | | | | (6,758 | ) | | | 1,259 | | | | (5,499 | ) | | | 465 | | | | 0 | |
| | | | | 6.170 | | | Maturity | | | 01/02/2023 | | | BRL | | | 77,400 | | | | (14 | ) | | | (698 | ) | | | (712 | ) | | | 3 | | | | 0 | |
| | | | | 12.670 | | | Maturity | | | 01/02/2023 | | | | | | 3,100 | | | | 0 | | | | 2 | | | | 2 | | | | 0 | | | | 0 | |
| | | | | 12.690 | | | Maturity | | | 01/02/2023 | | | | | | 2,000 | | | | 0 | | | | 1 | | | | 1 | | | | 0 | | | | 0 | |
| | | | | 12.740 | | | Maturity | | | 01/02/2023 | | | | | | 5,200 | | | | 0 | | | | 3 | | | | 3 | | | | 0 | | | | 0 | |
| | | | | 12.750 | | | Maturity | | | 01/02/2023 | | | | | | 2,500 | | | | 0 | | | | 2 | | | | 2 | | | | 0 | | | | 0 | |
| | | | | 12.760 | | | Maturity | | | 01/02/2023 | | | | | | 5,200 | | | | 0 | | | | 3 | | | | 3 | | | | 0 | | | | 0 | |
| | | | | 12.900 | | | Maturity | | | 01/02/2023 | | | | | | 10,700 | | | | 0 | | | | 4 | | | | 4 | | | | 0 | | | | 0 | |
| | | | | 12.930 | | | Maturity | | | 01/02/2023 | | | | | | 1,300 | | | | 0 | | | | 1 | | | | 1 | | | | 0 | | | | 0 | |
| | | | | 12.939 | | | Maturity | | | 01/02/2023 | | | | | | 5,300 | | | | 0 | | | | 2 | | | | 2 | | | | 0 | | | | 0 | |
| | | | | 12.946 | | | Maturity | | | 01/02/2023 | | | | | | 13,400 | | | | 0 | | | | 5 | | | | 5 | | | | 0 | | | | (1 | ) |
| | | | | 12.960 | | | Maturity | | | 01/02/2023 | | | | | | 10,700 | | | | 0 | | | | 3 | | | | 3 | | | | 0 | | | | 0 | |
| | | | | 12.970 | | | Maturity | | | 01/02/2023 | | | | | | 17,500 | | | | 0 | | | | 6 | | | | 6 | | | | 0 | | | | (1 | ) |
| | | | | 11.140 | | | Maturity | | | 01/02/2025 | | | | | | 1,000 | | | | 0 | | | | (5 | ) | | | (5 | ) | | | 1 | | | | 0 | |
| | | | | 11.160 | | | Maturity | | | 01/02/2025 | | | | | | 700 | | | | 0 | | | | (4 | ) | | | (4 | ) | | | 0 | | | | 0 | |
| | | | | 11.350 | | | Maturity | | | 01/02/2025 | | | | | | 800 | | | | 0 | | | | (4 | ) | | | (4 | ) | | | 1 | | | | 0 | |
| | | | | 12.000 | | | Maturity | | | 01/02/2025 | | | | | | 2,200 | | | | 0 | | | | (5 | ) | | | (5 | ) | | | 1 | | | | 0 | |
| | | | | 12.080 | | | Maturity | | | 01/02/2025 | | | | | | 3,700 | | | | 0 | | | | (7 | ) | | | (7 | ) | | | 2 | | | | 0 | |
| | | | | 12.140 | | | Maturity | | | 01/02/2025 | | | | | | 1,900 | | | | 0 | | | | (3 | ) | | | (3 | ) | | | 1 | | | | 0 | |
| | | | | 12.145 | | | Maturity | | | 01/02/2025 | | | | | | 1,800 | | | | 0 | | | | (3 | ) | | | (3 | ) | | | 1 | | | | 0 | |
| | | | | 12.160 | | | Maturity | | | 01/02/2025 | | | | | | 3,800 | | | | 0 | | | | (7 | ) | | | (7 | ) | | | 2 | | | | 0 | |
| | | | | 6.990 | | | Maturity | | | 01/04/2027 | | | | | | 318,400 | | | | 2,522 | | | | (9,698 | ) | | | (7,176 | ) | | | 220 | | | | 0 | |
| | | | | 11.220 | | | Maturity | | | 01/04/2027 | | | | | | 1,200 | | | | 0 | | | | (8 | ) | | | (8 | ) | | | 1 | | | | 0 | |
| | | | | 11.245 | | | Maturity | | | 01/04/2027 | | | | | | 600 | | | | 0 | | | | (4 | ) | | | (4 | ) | | | 0 | | | | 0 | |
| | | | | 11.260 | | | Maturity | | | 01/04/2027 | | | | | | 600 | | | | 0 | | | | (4 | ) | | | (4 | ) | | | 0 | | | | 0 | |
| | | | | 11.700 | | | Maturity | | | 01/04/2027 | | | | | | 300 | | | | 0 | | | | (1 | ) | | | (1 | ) | | | 0 | | | | 0 | |
| | | | | 11.715 | | | Maturity | | | 01/04/2027 | | | | | | 1,400 | | | | 0 | | | | (6 | ) | | | (6 | ) | | | 1 | | | | 0 | |
| | | | | 11.870 | | | Maturity | | | 01/04/2027 | | | | | | 3,200 | | | | 0 | | | | (11 | ) | | | (11 | ) | | | 2 | | | | 0 | |
| | | | | 12.015 | | | Maturity | | | 01/04/2027 | | | | | | 124,200 | | | | 0 | | | | (315 | ) | | | (315 | ) | | | 72 | | | | 0 | |
| | | | | 0.250 | | | | | | 06/16/2023 | | | $ | | | 40,100 | | | | (57 | ) | | | (1,099 | ) | | | (1,156 | ) | | | 25 | | | | 0 | |
| | | | | 0.500 | | | Semi-Annual | | | 06/16/2026 | | | | | | 474,100 | | | | (8,044 | ) | | | (37,716 | ) | | | (45,760 | ) | | | 2,214 | | | | 0 | |
| | | | | 0.500 | | | Semi-Annual | | | 06/16/2028 | | | | | | 6,300 | | | | (352 | ) | | | (529 | ) | | | (881 | ) | | | 38 | | | | 0 | |
| | | | | 1.420 | | | Semi-Annual | | | 08/17/2028 | | | | | | 76,800 | | | | 0 | | | | 6,712 | | | | 6,712 | | | | 0 | | | | (502 | ) |
| | | | | 1.500 | | | Semi-Annual | | | 12/15/2028 | | | | | | 43,200 | | | | (62 | ) | | | (3,869 | ) | | | (3,931 | ) | | | 277 | | | | 0 | |
| | | | | 0.750 | | | Semi-Annual | | | 06/16/2031 | | | | | | 25,450 | | | | 2,132 | | | | 2,525 | | | | 4,657 | | | | 0 | | | | (188 | ) |
| | | | | 1.750 | | | Semi-Annual | | | 12/15/2031 | | | | | | 10,500 | | | | 297 | | | | (1,444 | ) | | | (1,147 | ) | | | 83 | | | | 0 | |
| | | | | 1.700 | | | Semi-Annual | | | 02/01/2052 | | | | | | 114,200 | | | | (2,037 | ) | | | 29,003 | | | | 26,966 | | | | 0 | | | | (1,766 | ) |
| | | | | | | | | | | | |
| See Accompanying Notes | | | ANNUAL REPORT | | | | | | | JUNE 30, 2022 | | | 109 |
| | | | | | |
Consolidated Schedule of Investments | | PIMCO Dynamic Income Opportunities Fund | | | | |
| | | | | | | | | | | | | | | | | | | | | | | | | | | | | | | | | | | | | | |
Pay/ Receive
Floating Rate | | Floating Rate Index | | Fixed Rate | | | Payment
Frequency | | Maturity
Date | | | Notional
Amount | | | Premiums
Paid/(Received) | | | Unrealized
Appreciation/
(Depreciation) | | | Market
Value | | | Variation Margin | |
| | Asset | | | Liability | |
| | | | | 0.250 | % | | Annual | | | 09/21/2032 | | | EUR | | | 56,300 | | | $ | 5,293 | | | $ | 5,552 | | | $ | 10,845 | | | $ | 0 | | | $ | (975 | ) |
| | | | | 4.550 | | | Lunar | | | 02/27/2023 | | | MXN | | | 109,600 | | | | 12 | | | | (182 | ) | | | (170 | ) | | | 0 | | | | 0 | |
| | | | | 4.500 | | | Lunar | | | 03/03/2023 | | | | | | 238,900 | | | | (10 | ) | | | (369 | ) | | | (379 | ) | | | 0 | | | | (1 | ) |
| | | | | 8.675 | | | Lunar | | | 04/03/2024 | | | | | | 41,000 | | | | 0 | | | | 29 | | | | 29 | | | | 0 | | | | (3 | ) |
| | | | | 8.660 | | | Lunar | | | 04/04/2024 | | | | | | 17,100 | | | | 0 | | | | 12 | | | | 12 | | | | 0 | | | | (1 | ) |
| | | | | 8.750 | | | Lunar | | | 04/05/2024 | | | | | | 10,200 | | | | 0 | | | | 6 | | | | 6 | | | | 0 | | | | (1 | ) |
| | | | | 8.410 | | | Lunar | | | 03/31/2027 | | | | | | 4,900 | | | | 0 | | | | 6 | | | | 6 | | | | 0 | | | | (1 | ) |
| | | | | 8.730 | | | Lunar | | | 04/06/2027 | | | | | | 4,300 | | | | 0 | | | | 2 | | | | 2 | | | | 0 | | | | (1 | ) |
| | | | | 7.495 | | | Lunar | | | 01/14/2032 | | | | | | 2,100 | | | | 9 | | | | 0 | | | | 9 | | | | 0 | | | | (1 | ) |
| | | | | 7.498 | | | Lunar | | | 01/15/2032 | | | | | | 8,700 | | | | 36 | | | | 3 | | | | 39 | | | | 0 | | | | (3 | ) |
| | | | | 8.732 | | | Lunar | | | 03/30/2032 | | | | | | 2,100 | | | | 0 | | | | 1 | | | | 1 | | | | 0 | | | | (1 | ) |
| | | | | 8.701 | | | Lunar | | | 03/31/2032 | | | | | | 5,000 | | | | 0 | | | | 3 | | | | 3 | | | | 0 | | | | (2 | ) |
| | | | | | | | | | | | | | | | | | | | | | | | | | | | | | | | | | | | | | |
| | | $ | (6,359 | ) | | $ | (4,439 | ) | | $ | (10,798 | ) | | $ | 3,410 | | | $ | (3,995 | ) |
| | | | | | | | | | | | | | | | | | | | | | | | | | | | | | | | | | | | | | |
| | | | | | | | | | | | | | | | | | | | | |
| | | | | | | | | | | | | | | | | | | | | | | | | | | | | | | | | | | | | | |
FINANCIAL DERIVATIVE INSTRUMENTS: EXCHANGE-TRADED OR CENTRALLY CLEARED SUMMARY
The following is a summary of the market value and variation margin of Exchange-Traded or Centrally Cleared Financial Derivative Instruments as of June 30, 2022:
| | | | | | | | | | | | | | | | | | | | | | | | | | | | | | | | | | | | |
| | | Financial Derivative Assets | | | | | | Financial Derivative Liabilities | |
| | | | | | | | | Total | | | | | | | | | Variation Margin
Liability | | | Total | |
| | | | | | | | | | | | | | | | | | | | | | |
Total Exchange-Traded or Centrally Cleared | | | | | | | | | | | | | | | | | | | | | | | | | | | | | | | | | | | | |
| | | | | | | | | | | | | | | | | | | | | | | | | | | | | | | | | | | | |
Cash of $42,012 has been pledged as collateral for exchange-traded and centrally cleared financial derivative instruments as of June 30, 2022.
| If the Fund is a seller of protection and a credit event occurs, as defined under the terms of that particular swap agreement, the Fund will either (i) pay to the buyer of protection an amount equal to the notional amount of the swap and take delivery of the referenced obligation or underlying securities comprising the referenced index or (ii) pay a net settlement amount in the form of cash, securities or other deliverable obligations equal to the notional amount of the swap less the recovery value of the referenced obligation or underlying securities comprising the referenced index. |
| Implied credit spreads, represented in absolute terms, utilized in determining the market value of credit default swap agreements on corporate issues as of period end serve as indicators of the current status of the payment/performance risk and represent the likelihood or risk of default for the credit derivative. The implied credit spread of a particular referenced entity reflects the cost of buying/selling protection and may include upfront payments required to be made to enter into the agreement. Wider credit spreads represent a deterioration of the referenced entity’s credit soundness and a greater likelihood or risk of default or other credit event occurring as defined under the terms of the agreement. |
| The maximum potential amount the Fund could be required to pay as a seller of credit protection or receive as a buyer of credit protection if a credit event occurs as defined under the terms of that particular swap agreement. |
| The prices and resulting values for credit default swap agreements serve as indicators of the current status of the payment/performance risk and represent the likelihood of an expected liability (or profit) for the credit derivative should the notional amount of the swap agreement be closed/sold as of the period end. Increasing market values, in absolute terms when compared to the notional amount of the swap, represent a deterioration of the underlying referenced instrument’s credit soundness and a greater likelihood or risk of default or other credit event occurring as defined under the terms of the agreement. |
| This instrument has a forward starting effective date. See Note 2, Securities Transactions and Investment Income, in the Notes to Financial Statements for further information. |
(m) FINANCIAL DERIVATIVE INSTRUMENTS: OVER THE COUNTER
FORWARD FOREIGN CURRENCY CONTRACTS:
| | | | | | | | | | | | | | | | | | | | | | | | |
| Counterparty | | Settlement
Month | | | Currency to
be Delivered | | | Currency to
be Received | | | Unrealized Appreciation/
(Depreciation) | |
| | | | | | |
| | | 07/2022 | | | $ | | | 2,185 | | | PEN | | | 8,779 | | | $ | 104 | | | $ | 0 | |
| | | 07/2022 | | | | | | 1,808 | | | ZAR | | | 27,737 | | | | 0 | | | | (104 | ) |
| | | 08/2022 | | | EUR | | | 1,615 | | | $ | | | 1,736 | | | | 38 | | | | 0 | |
| | | 08/2022 | | | GBP | | | 40,796 | | | | | | 50,239 | | | | 540 | | | | 0 | |
| | | 08/2022 | | | $ | | | 23,411 | | | EUR | | | 22,173 | | | | 12 | | | | (120 | ) |
| | | 08/2022 | | | | | | 4,553 | | | GBP | | | 3,739 | | | | 2 | | | | 0 | |
| | | 08/2022 | | | | | | 10,149 | | | IDR | | | 149,460,618 | | | | 0 | | | | (162 | ) |
| | | 08/2022 | | | | | | 20,351 | | | MXN | | | 413,124 | | | | 63 | | | | 0 | |
| | | 08/2022 | | | | | | 154 | | | RUB | | | 24,038 | | | | 269 | | | | 0 | |
| | | | | | | |
| | | 07/2022 | | | MXN | | | 60,753 | | | $ | | | 2,936 | | | | 0 | | | | (85 | ) |
| | | 07/2022 | | | $ | | | 3,011 | | | MXN | | | 60,503 | | | | 0 | | | | (2 | ) |
| | | 07/2022 | | | | | | 110 | | | ZAR | | | 1,722 | | | | 0 | | | | (4 | ) |
| | | 08/2022 | | | CAD | | | 7,897 | | | $ | | | 6,106 | | | | 0 | | | | (30 | ) |
| | | 08/2022 | | | IDR | | | 5,292,924 | | | | | | 359 | | | | 5 | | | | 0 | |
| | | 08/2022 | | | MXN | | | 14,113 | | | | | | 643 | | | | 0 | | | | (55 | ) |
| | | | | | |
| 110 | | PIMCO CLOSED-END FUNDS | | | See Accompanying Notes | |
| | | | | | | | | | | | | | | | | | | | | | | | |
| Counterparty | | Settlement
Month | | | Currency to
be Delivered | | | Currency to
be Received | | | Unrealized Appreciation/
(Depreciation) | |
| | Asset | | | Liability | |
| | | 08/2022 | | | $ | | | 5,112 | | | EUR | | | 4,817 | | | $ | 0 | | | $ | (49 | ) |
| | | 08/2022 | | | | | | 1,398 | | | ZAR | | | 22,377 | | | | 0 | | | | (28 | ) |
| | | 09/2022 | | | MXN | | | 60,503 | | | $ | | | 2,966 | | | | 0 | | | | (3 | ) |
| | | 11/2022 | | | $ | | | 4,054 | | | ZAR | | | 65,421 | | | | 0 | | | | (83 | ) |
| | | | | | | |
| | | 08/2022 | | | IDR | | | 5,823,420 | | | $ | | | 393 | | | | 5 | | | | 0 | |
| | | 08/2022 | | | $ | | | 7,551 | | | EUR | | | 7,014 | | | | 0 | | | | (179 | ) |
| | | 08/2022 | | | | | | 2,125 | | | IDR | | | 31,258,448 | | | | 0 | | | | (36 | ) |
| | | 02/2023 | | | | | | 483 | | | ZAR | | | 8,008 | | | | 0 | | | | (2 | ) |
| | | | | | | |
| | | 07/2022 | | | BRL | | | 116,788 | | | $ | | | 22,296 | | | | 0 | | | | (19 | ) |
| | | 07/2022 | | | PEN | | | 80,364 | | | | | | 19,921 | | | | 0 | | | | (1,021 | ) |
| | | 07/2022 | | | $ | | | 23,684 | | | BRL | | | 116,788 | | | | 0 | | | | (1,369 | ) |
| | | 07/2022 | | | | | | 1,479 | | | PEN | | | 5,809 | | | | 35 | | | | 0 | |
| | | 08/2022 | | | MXN | | | 93,490 | | | $ | | | 4,487 | | | | 0 | | | | (132 | ) |
| | | 08/2022 | | | $ | | | 4,617 | | | PEN | | | 17,358 | | | | 0 | | | | (100 | ) |
| | | 10/2022 | | | | | | 100 | | | MXN | | | 2,095 | | | | 3 | | | | 0 | |
| | | 10/2022 | | | | | | 956 | | | PEN | | | 3,781 | | | | 20 | | | | 0 | |
| | | 11/2022 | | | | | | 2,495 | | | | | | 9,902 | | | | 60 | | | | 0 | |
| | | 12/2022 | | | | | | 18,563 | | | | | | 77,853 | | | | 1,476 | | | | 0 | |
| | | 04/2023 | | | | | | 2,223 | | | | | | 8,779 | | | | 15 | | | | 0 | |
| | | | | | | |
| | | 08/2022 | | | CAD | | | 1,502 | | | $ | | | 1,172 | | | | 6 | | | | 0 | |
| | | 08/2022 | | | EUR | | | 72,025 | | | | | | 76,191 | | | | 496 | | | | 0 | |
| | | 08/2022 | | | IDR | | | 11,347,741 | | | | | | 769 | | | | 11 | | | | 0 | |
| | | 08/2022 | | | | | | $1,395 | | | EUR | | | 1,318 | | | | 0 | | | | (10 | ) |
| | | 08/2022 | | | | | | 1,195 | | | GBP | | | 971 | | | | 0 | | | | (12 | ) |
| | | | | | | |
| | | 08/2022 | | | CHF | | | 964 | | | $ | | | 965 | | | | 0 | | | | (48 | ) |
| | | 08/2022 | | | | | | $1,063 | | | GBP | | | 854 | | | | 0 | | | | (22 | ) |
| | | 09/2022 | | | | | | 2,257 | | | ZAR | | | 34,890 | | | | 0 | | | | (127 | ) |
| | | | | | | |
| | | 07/2022 | | | BRL | | | 116,788 | | | $ | | | 22,583 | | | | 267 | | | | 0 | |
| | | 07/2022 | | | | | | $22,296 | | | BRL | | | 116,788 | | | | 19 | | | | 0 | |
| | | 08/2022 | | | EUR | | | 119,361 | | | $ | | | 126,095 | | | | 652 | | | | 0 | |
| | | 08/2022 | | | GBP | | | 51,703 | | | | | | 64,534 | | | | 1,548 | | | | 0 | |
| | | 08/2022 | | | | | | $22,405 | | | BRL | | | 116,788 | | | | 0 | | | | (281 | ) |
| | | | | | | |
| | | 07/2022 | | | MXN | | | 61,789 | | | $ | | | 2,979 | | | | 1 | | | | (90 | ) |
| | | 07/2022 | | | PLN | | | 28,916 | | | | | | 6,448 | | | | 4 | | | | 0 | |
| | | 08/2022 | | | MXN | | | 177 | | | | | | 9 | | | | 0 | | | | 0 | |
| | | 08/2022 | | | | | | $5,086 | | | EUR | | | 4,821 | | | | 0 | | | | (19 | ) |
| | | 08/2022 | | | | | | 1,133 | | | GBP | | | 899 | | | | 0 | | | | (38 | ) |
| | | 09/2022 | | | MXN | | | 747 | | | $ | | | 37 | | | | 0 | | | | 0 | |
| | | 10/2022 | | | | | | 1,256 | | | | | | 61 | | | | 0 | | | | 0 | |
| | | 11/2022 | | | | | | $932 | | | ZAR | | | 15,226 | | | | 0 | | | | (9 | ) |
| | | | | | | | | | | | | | | | | | | | | | | | |
Total Forward Foreign Currency Contracts | | | | | | | | | |
| | | | | | | | | | | | | | | | | | | | | | | | |
SWAP AGREEMENTS:
CREDIT DEFAULT SWAPS ON CORPORATE ISSUES - SELL PROTECTION
(1)
| | | | | | | | | | | | | | | | | | | | | | | | | | | | | | | | | | | | | | | | |
| | | | | | | | | | | | Implied Credit Spread at June 30, 2022 (2) | | | | | | | | | Unrealized
Appreciation/
(Depreciation) | | | Swap Agreements, at Value (4) | |
| | | | | | |
| BYL | | Banca Monte Dei Paschi Di | | | 5.000% | | | Quarterly | | | 06/20/2024 | | | | 7.198% | | | | EUR | | | | 2,000 | | | $ | (55 | ) | | $ | (23 | ) | | $ | 0 | | | $ | (78 | ) |
| | | | | | | | | | | | | | | | | | | | | | | | | | | | | | | | | | | | | | | | |
TOTAL RETURN SWAPS ON INTEREST RATE INDICES
| | | | | | | | | | | | | | | | | | | | | | | | | | | | | | | | | | | | | | | | |
| | | | | | | | | | | | | | | | Notional
Amount | | | | | | Unrealized
Appreciation/
(Depreciation) | | | | |
| | | | | | |
| | | | iBoxx USD Liquid High Yield Index | | | N/A | | | | | | Maturity | | | 03/20/2023 | | $ | | | | | 300 | | | $ | (1 | ) | | $ | (1 | ) | | $ | 0 | | | $ | (2 | ) |
| | | | | | | | | | | | |
| | | | iBoxx USD Liquid High Yield Index | | | N/A | | | | | | Maturity | | | 09/20/2022 | | | | | | | 2,000 | | | | (2 | ) | | | (82 | ) | | | 0 | | | | (84 | ) |
| | | | | | | | | | | | |
| | | | iBoxx USD Liquid High Yield Index | | | N/A | | | | | | Maturity | | | 09/20/2022 | | | | | | | 1,900 | | | | (2 | ) | | | (75 | ) | | | 0 | | | | (77 | ) |
| | | | | | | | | | | | | | | | | | | | | | | | | | $ | (5 | ) | | $ | (158 | ) | | $ | 0 | | | $ | (163 | ) |
| | | | | | | | | | | | | | | | | | | | | | | | | | | | | | | | | | | | | |
| | | | | | | | | | | | | | | | | |
| | | | | | | | | | | | | | | | | | | | | | | | | | | | | | | | | | | | | | | | |
| | | | | | | | | | | | |
| See Accompanying Notes | | | | | | | | | | JUNE 30, 2022 | | | |
| | | | | | |
Consolidated Schedule of Investments | | PIMCO Dynamic Income Opportunities Fund | | | | |
FINANCIAL DERIVATIVE INSTRUMENTS: OVER THE COUNTER SUMMARY
The following is a summary by counterparty of the market value of OTC financial derivative instruments and collateral pledged/(received) as of June 30, 2022:
| | | | | | | | | | | | | | | | | | | | | | | | | | | | | | | | | | | | | | | | | | | | | | | | |
| | | Financial Derivative Assets | | | | | | Financial Derivative Liabilities | | | | | | | | | | |
| | Forward
Foreign
Currency
Contracts | | | | | | | | | | | | | | | Forward
Foreign
Currency
Contracts | | | | | | | | | | | | Net Market
Value of OTC
Derivatives | | | Collateral
Pledged/
(Received) | | | | |
| | $ | 1,028 | | | $ | 0 | | | $ | 0 | | | $ | 1,028 | | | | | | | $ | (386 | ) | | $ | 0 | | | $ | (2 | ) | | $ | (388 | ) | | $ | 640 | | | $ | (630 | ) | | $ | 10 | |
| | | 5 | | | | 0 | | | | 0 | | | | 5 | | | | | | | | (339 | ) | | | 0 | | | | (84 | ) | | | (423 | ) | | | (418 | ) | | | 343 | | | | (75 | ) |
| | | 5 | | | | 0 | | | | 0 | | | | 5 | | | | | | | | (217 | ) | | | 0 | | | | 0 | | | | (217 | ) | | | (212 | ) | | | 254 | | | | 42 | |
| | | 0 | | | | 0 | | | | 0 | | | | 0 | | | | | | | | 0 | | | | 0 | | | | (78 | ) | | | (78 | ) | | | (78 | ) | | | 0 | | | | (78 | ) |
| | | 1,609 | | | | 0 | | | | 0 | | | | 1,609 | | | | | | | | (2,641 | ) | | | 0 | | | | 0 | | | | (2,641 | ) | | | (1,032 | ) | | | 969 | | | | (63 | ) |
| | | 0 | | | | 0 | | | | 0 | | | | 0 | | | | | | | | 0 | | | | 0 | | | | (77 | ) | | | (77 | ) | | | (77 | ) | | | 271 | | | | 194 | |
| | | 513 | | | | 0 | | | | 0 | | | | 513 | | | | | | | | (22 | ) | | | 0 | | | | 0 | | | | (22 | ) | | | 491 | | | | (470 | ) | | | 21 | |
| | | 0 | | | | 0 | | | | 0 | | | | 0 | | | | | | | | (197 | ) | | | 0 | | | | 0 | | | | (197 | ) | | | (197 | ) | | | 17 | | | | (180 | ) |
| | | 2,486 | | | | 0 | | | | 0 | | | | 2,486 | | | | | | | | (281 | ) | | | 0 | | | | 0 | | | | (281 | ) | | | 2,205 | | | | (2,430 | ) | | | (225 | ) |
| | | 5 | | | | 0 | | | | 0 | | | | 5 | | | | | | | | (156 | ) | | | 0 | | | | 0 | | | | (156 | ) | | | (151 | ) | | | 0 | | | | (151 | ) |
| | | | | | | | | | | | | | | | | | | | | | | | | | | | | | | | | | | | | | | | | | | | | | | | |
| | | | | | | | | | | | | | | | | | | | | | | | | | | | | | | | | | | | | | | | | | | | | | | | |
| | | | | | | | | | | | | | | | | | | | | | | | | | | | | | | | | | | | | | | | | | | | | | | | |
| Securities with an aggregate market value of $1,854 have been pledged as collateral for financial derivative instruments as governed by International Swaps and Derivatives Association, Inc. master agreements as of June 30, 2022. |
| If the Fund is a seller of protection and a credit event occurs, as defined under the terms of that particular swap agreement, the Fund will either (i) pay to the buyer of protection an amount equal to the notional amount of the swap and take delivery of the referenced obligation or underlying securities comprising the referenced index or (ii) pay a net settlement amount in the form of cash, securities or other deliverable obligations equal to the notional amount of the swap less the recovery value of the referenced obligation or underlying securities comprising the referenced index. |
| Implied credit spreads, represented in absolute terms, utilized in determining the market value of credit default swap agreements on corporate issues as of period end serve as indicators of the current status of the payment/performance risk and represent the likelihood or risk of default for the credit derivative. The implied credit spread of a particular referenced entity reflects the cost of buying/selling protection and may include upfront payments required to be made to enter into the agreement. Wider credit spreads represent a deterioration of the referenced entity’s credit soundness and a greater likelihood or risk of default or other credit event occurring as defined under the terms of the agreement. |
| The maximum potential amount the Fund could be required to pay as a seller of credit protection or receive as a buyer of credit protection if a credit event occurs as defined under the terms of that particular swap agreement. |
| The prices and resulting values for credit default swap agreements serve as indicators of the current status of the payment/performance risk and represent the likelihood of an expected liability (or profit) for the credit derivative should the notional amount of the swap agreement be closed/sold as of the period end. Increasing market values, in absolute terms when compared to the notional amount of the swap, represent a deterioration of the underlying referenced instrument’s credit soundness and a greater likelihood or risk of default or other credit event occurring as defined under the terms of the agreement. |
| Receive represents that the Fund receives payments for any positive net return on the underlying reference. The Fund makes payments for any negative net return on such underlying reference. Pay represents that the Fund receives payments for any negative net return on the underlying reference. The Fund makes payments for any positive net return on such underlying reference. |
| Net Exposure represents the net receivable/(payable) that would be due from/to the counterparty in the event of default. Exposure from OTC derivatives can only be netted across transactions governed under the same master agreement with the same legal entity. See Note 8, Master Netting Arrangements, in the Notes to Financial Statements for more information. |
FAIR VALUE OF FINANCIAL DERIVATIVE INSTRUMENTS
The following is a summary of the fair valuation of the Fund’s derivative instruments categorized by risk exposure. See Note 7, Principal and Other Risks, in the Notes to Financial Statements on risks of the Fund.
Fair Values of Financial Derivative Instruments on the Consolidated Statements of Assets and Liabilities as of June 30, 2022:
| | | | | | | | | | | | | | | | | | | | | | | | |
| | | Derivatives not accounted for as hedging instruments | |
| | | | | | | | | | | | | | | | | | | |
Financial Derivative Instruments - Assets | |
Exchange-traded or centrally cleared | |
| | $ | 0 | | | $ | 0 | | | $ | 0 | | | $ | 0 | | | $ | 3,410 | | | $ | 3,410 | |
| | | | | | | | | | | | | | | | | | | | | | | | |
| |
Forward Foreign Currency Contracts | | $ | 0 | | | $ | 0 | | | $ | 0 | | | $ | 5,651 | | | $ | 0 | | | $ | 5,651 | |
| | | 0 | | | | 0 | | | | 0 | | | | 0 | | | | 0 | | | | 0 | |
| | | | | | | | | | | | | | | | | | | | | | | | |
| | $ | 0 | | | $ | 0 | | | $ | 0 | | | $ | 5,651 | | | $ | 0 | | | $ | 5,651 | |
| | | | | | | | | | | | | | | | | | | | | | | | |
| | $ | 0 | | | $ | 0 | | | $ | 0 | | | $ | 5,651 | | | $ | 3,410 | | | $ | 9,061 | |
| | | | | | | | | | | | | | | | | | | | | | | | |
| | | | | | | | | | | | | | | | | | | | | | | | |
| | | Derivatives not accounted for as hedging instruments | |
| | | Commodity
Contracts | | | Credit
Contracts | | | Equity
Contracts | | | Foreign
Exchange
Contracts | | | Interest
Rate Contracts | | | Total | |
Financial Derivative Instruments - Liabilities | |
Exchange-traded or centrally cleared | |
| | $ | 0 | | | $ | 550 | | | $ | 0 | | | $ | 0 | | | $ | 3,995 | | | $ | 4,545 | |
| | | | | | | | | | | | | | | | | | | | | | | | |
| |
Forward Foreign Currency Contracts | | $ | 0 | | | $ | 0 | | | $ | 0 | | | $ | 4,239 | | | $ | 0 | | | $ | 4,239 | |
| | | 0 | | | | 78 | | | | 0 | | | | 0 | | | | 163 | | | | 241 | |
| | | | | | | | | | | | | | | | | | | | | | | | |
| | $ | 0 | | | $ | 78 | | | $ | 0 | | | $ | 4,239 | | | $ | 163 | | | $ | 4,480 | |
| | | | | | | | | | | | | | | | | | | | | | | | |
| | $ | 0 | | | $ | 628 | | | $ | 0 | | | $ | 4,239 | | | $ | 4,158 | | | $ | 9,025 | |
| | | | | | | | | | | | | | | | | | | | | | | | |
The effect of Financial Derivative Instruments on the Consolidated Statements of Operations for the period ended June 30, 2022:
| | | | | | | | | | | | | | | | | | | | | | | | |
| | | Derivatives not accounted for as hedging instruments | |
| | | | | | | | | | | | | | | | | | | |
Net Realized Gain (Loss) on Financial Derivative Instruments | |
Exchange-traded or centrally cleared | |
| | $ | 0 | | | $ | 0 | | | $ | 0 | | | $ | 0 | | | $ | 50 | | | $ | 50 | |
| | | 0 | | | | 5,116 | | | | 0 | | | | 0 | | | | (18,569 | ) | | | (13,453 | ) |
| | | | | | | | | | | | | | | | | | | | | | | | |
| | $ | 0 | | | $ | 5,116 | | | $ | 0 | | | $ | 0 | | | $ | (18,519 | ) | | $ | (13,403 | ) |
| | | | | | | | | | | | | | | | | | | | | | | | |
| |
Forward Foreign Currency Contracts | | $ | 0 | | | $ | 0 | | | $ | 0 | | | $ | 56,286 | | | $ | 0 | | | $ | 56,286 | |
| | | 0 | | | | (1,800 | ) | | | 0 | | | | 0 | | | | 1,031 | | | | (769 | ) |
| | | | | | | | | | | | | | | | | | | | | | | | |
| | $ | 0 | | | $ | (1,800 | ) | | $ | 0 | | | $ | 56,286 | | | $ | 1,031 | | | $ | 55,517 | |
| | | | | | | | | | | | | | | | | | | | | | | | |
| | $ | 0 | | | $ | 3,316 | | | $ | 0 | | | $ | 56,286 | | | $ | (17,488 | ) | | $ | 42,114 | |
| | | | | | | | | | | | | | | | | | | | | | | | |
|
Net Change in Unrealized Appreciation (Depreciation) on Financial Derivative Instruments | |
Exchange-traded or centrally cleared | |
| | $ | 0 | | | $ | 0 | | | $ | 0 | | | $ | 0 | | | $ | (7 | ) | | $ | (7 | ) |
| | | 0 | | | | (8,054 | ) | | | 0 | | | | 0 | | | | 9,181 | | | | 1,127 | |
| | | | | | | | | | | | | | | | | | | | | | | | |
| | $ | 0 | | | $ | (8,054 | ) | | $ | 0 | | | $ | 0 | | | $ | 9,174 | | | $ | 1,120 | |
| | | | | | | | | | | | | | | | | | | | | | | | |
| |
Forward Foreign Currency Contracts | | $ | 0 | | | $ | 0 | | | $ | 0 | | | $ | (9,533 | ) | | $ | 0 | | | $ | (9,533 | ) |
| | | 0 | | | | (22 | ) | | | 0 | | | | 0 | | | | (1,377 | ) | | | (1,399 | ) |
| | | | | | | | | | | | | | | | | | | | | | | | |
| | $ | 0 | | | $ | (22 | ) | | $ | 0 | | | $ | (9,533 | ) | | $ | (1,377 | ) | | $ | (10,932 | ) |
| | | | | | | | | | | | | | | | | | | | | | | | |
| | $ | 0 | | | $ | (8,076 | ) | | $ | 0 | | | $ | (9,533 | ) | | $ | 7,797 | | | $ | (9,812 | ) |
| | | | | | | | | | | | | | | | | | | | | | | | |
The following is a summary of the fair valuations according to the inputs used as of June
30, 2022 in valuing the Fund’s assets and liabilities:
| | | | | | | | | | | | | | | | |
| | | | | | | | | | | | |
Investments in Securities, at Value | |
Loan Participations and Assignments | | $ | 0 | | | $ | 476,125 | | | $ | 219,124 | | | $ | 695,249 | |
| |
| | | 0 | | | | 196,392 | | | | 0 | | | | 196,392 | |
| | | 0 | | | | 368,860 | | | | 105,768 | | | | 474,628 | |
| | | 0 | | | | 142,274 | | | | 0 | | | | 142,274 | |
Convertible Bonds & Notes | |
| | | 0 | | | | 23,340 | | | | 0 | | | | 23,340 | |
| | | 0 | | | | 18,984 | | | | 0 | | | | 18,984 | |
| |
| | | 0 | | | | 27,702 | | | | 0 | | | | 27,702 | |
| | | 0 | | | | 2,025 | | | | 0 | | | | 2,025 | |
| | | 0 | | | | 39,609 | | | | 0 | | | | 39,609 | |
Non-Agency Mortgage-Backed Securities | | | 0 | | | | 796,656 | | | | 701 | | | | 797,357 | |
| | | 0 | | | | 238,828 | | | | 51,484 | | | | 290,312 | |
| | | 0 | | | | 78,307 | | | | 0 | | | | 78,307 | |
| | | | | | | | | | | | | | | | |
| | | | | | | | | | | | |
| |
| | $ | 656 | | | $ | 0 | | | $ | 18,219 | | | $ | 18,875 | |
| | | 0 | | | | 0 | | | | 14,859 | | | | 14,859 | |
| |
| | | 0 | | | | 0 | | | | 324 | | | | 324 | |
| |
| | | 0 | | | | 0 | | | | 341 | | | | 341 | |
| |
| | | 0 | | | | 42,324 | | | | 0 | | | | 42,324 | |
| | | 0 | | | | 0 | | | | 12,445 | | | | 12,445 | |
Real Estate Investment Trusts | |
| | | 55,048 | | | | 0 | | | | 0 | | | | 55,048 | |
| |
| | | 0 | | | | 105,400 | | | | 0 | | | | 105,400 | |
| | | 0 | | | | 84,043 | | | | 0 | | | | 84,043 | |
| | | | | | | | | | | | | | | | |
| | | | |
| | $ | 55,704 | | | $ | 2,640,869 | | | $ | 423,265 | | | $ | 3,119,838 | |
| | | | | | | | | | | | | | | | |
| | | | | | | | | | | | |
| See Accompanying Notes | | | | | | | | | | JUNE 30, 2022 | | | |
| | | | | | |
Consolidated Schedule of Investments | | PIMCO Dynamic Income Opportunities Fund | | | | |
| | | | | | | | | | | | | | | | |
| | | | | | | | | | | | |
Financial Derivative Instruments - Assets | |
Exchange-traded or centrally cleared | | $ | 0 | | | $ | 3,410 | | | $ | 0 | | | $ | 3,410 | |
| | | 0 | | | | 5,651 | | | | 0 | | | | 5,651 | |
| | | | | | | | | | | | | | | | |
| | $ | 0 | | | $ | 9,061 | | | $ | 0 | | | $ | 9,061 | |
| | | | | | | | | | | | | | | | |
|
Financial Derivative Instruments - Liabilities | |
Exchange-traded or centrally cleared | | | 0 | | | | (4,545 | ) | | | 0 | | | | (4,545 | ) |
| | | | | | | | | | | | | | | | |
| | | | | | | | | | | | |
| | $ | 0 | | | $ | (4,480 | ) | | $ | 0 | | | $ | (4,480 | ) |
| | | | | | | | | | | | | | | | |
| | $ | 0 | | | $ | (9,025 | ) | | $ | 0 | | | $ | (9,025 | ) |
| | | | | | | | | | | | | | | | |
| | | | |
Total Financial Derivative Instruments | | $ | 0 | | | $ | 36 | | | $ | 0 | | | $ | 36 | |
| | | | | | | | | | | | | | | | |
| | | | |
| | $ | 55,704 | | | $ | 2,640,905 | | | $ | 423,265 | | | $ | 3,119,874 | |
| | | | | | | | | | | | | | | | |
The following is a reconciliation of the fair valuations using significant unobservable inputs (Level 3) for the Fund during the period ended June 30, 2022:
| | | | | | | | | | | | | | | | | | | | | | | | | | | | | | | | | | | | | | | | |
| | Beginning
Balance
at 06/30/2021 | | | | | | | | | Accrued
Discounts/
(Premiums) | | | | | | Net Change in Unrealized Appreciation/ (Depreciation) (1) | | | | | | | | | Ending
Balance
at 06/30/2022 | | | Net Change in Unrealized Appreciation/ (Depreciation) on Investments Held at 06/30/2022 (1) | |
Investments in Securities, at Value | |
Loan Participations and Assignments | | $ | 98,710 | | | $ | 209,023 | | | $ | (63,968 | ) | | $ | 7,098 | | | $ | (10,960 | ) | | $ | (34,729 | ) | | $ | 35,302 | | | $ | (21,352 | ) | | $ | 219,124 | | | $ | (28,313 | ) |
| |
| | | 0 | | | | 5,171 | | | | (4,134 | ) | | | 192 | | | | (1,229 | ) | | | 0 | | | | 0 | | | | 0 | | | | 0 | | | | 0 | |
| | | 0 | | | | 85,998 | | | | (513 | ) | | | 0 | | | | 0 | | | | (7,564 | ) | | | 27,847 | | | | 0 | | | | 105,768 | | | | (7,564 | ) |
Convertible Bonds & Notes | |
| | | 1,211 | | | | 0 | | | | (1,095 | ) | | | 0 | | | | 0 | | | | (116 | ) | | | 0 | | | | 0 | | | | 0 | | | | 0 | |
Non-Agency Mortgage-Backed Securities | | | 1,000 | | | | 0 | | | | 0 | | | | 0 | | | | 0 | | | | (299 | ) | | | 0 | | | | 0 | | | | 701 | | | | (301 | ) |
| | | 22,057 | | | | 41,877 | | | | 0 | | | | 0 | | | | 0 | | | | (20,729 | ) | | | 8,279 | | | | 0 | | | | 51,484 | | | | (20,729 | ) |
| |
| | | 0 | | | | 38,680 | | | | 0 | | | | 0 | | | | 0 | | | | (20,461 | ) | | | 0 | | | | 0 | | | | 18,219 | | | | (20,461 | ) |
| | | 0 | | | | 14,859 | | | | 0 | | | | 0 | | | | 0 | | | | 0 | | | | 0 | | | | 0 | | | | 14,859 | | | | 0 | |
| |
| | | 0 | | | | 0 | | | | 0 | | | | 0 | | | | 0 | | | | 324 | | | | 0 | | | | 0 | | | | 324 | | | | 324 | |
| |
| | | 0 | | | | 0 | | | | 0 | | | | 0 | | | | 0 | | | | 341 | | | | 0 | | | | 0 | | | | 341 | | | | 341 | |
| |
| | | 12,789 | | | | 0 | | | | 0 | | | | 0 | | | | 0 | | | | (344 | ) | | | 0 | | | | 0 | | | | 12,445 | | | | (344 | ) |
| | | | | | | | | | | | | | | | | | | | | | | | | | | | | | | | | | | | | | | | |
| | | | | | | | | | |
| | $ | 135,767 | | | $ | 395,608 | | | $ | (69,710 | ) | | $ | 7,290 | | | $ | (12,189 | ) | | $ | (83,577 | ) | | $ | 71,428 | | | $ | (21,352 | ) | | $ | 423,265 | | | $ | (77,047 | ) |
| | | | | | | | | | | | | | | | | | | | | | | | | | | | | | | | | | | | | | | | |
The following is a summary of significant unobservable inputs used in the fair valuations of assets and liabilities categorized within Level 3 of the fair value hierarchy:
| | | | | | | | | | | | | | | | | | | | |
| | Ending
Balance
at 06/30/2022 | | | | | | | (% Unless Noted Otherwise) | |
| | | | | | |
Investments in Securities, at Value | |
Loan Participations and Assignments | | $ | 79,969 | | | Discounted Cash Flow | | Discount Rate | | | | | | | | | | | 5.800 | |
| | | | 18,977 | | | Indicative Market Quotation | | Broker Quote | | | | | | | 34.500-84.025 | | | | 80.665 | |
| | | | 6,449 | | | Other Valuation Techniques (2) | | — | | | | | | | — | | | | — | |
| | | | 42,187 | | | Proxy Pricing | | Base Price | | | | | | | | | | | 60.891 | |
| | | | 71,542 | | | Third Party Vendor | | Broker Quote | | | | | | | | | | | 91.109 | |
| |
| | | 78,434 | | | Discounted Cash Flow | | Discount Rate | | | | | | | 12.080 | | | | — | |
| | | | 27,334 | | | Reference Instrument | | Weighted Average | | | BRL | | | | 42.864 | | | | — | |
Non-Agency Mortgage-Backed Securities | | | 701 | | | Other Valuation Techniques (2) | | — | | | | | | | — | | | | — | |
| | | 5,613 | | | Discounted Cash Flow | | Discount Rate | | | | | | | | | | | 13.111 | |
| | | | 45,871 | | | Proxy Pricing | | Base Price | | | | | | | | | | | 73,652.299 | |
| |
| | | 18,219 | | | Indicative Market Quotation | | EBITDA Multiple | | | X | | | | 7.000 | | | | — | |
| | | | 9,056 | | | Indicative Market Quotation | | Broker Quote | | | $ | | | | 23.650 | | | | — | |
| | | 5,803 | | | Reference Instrument | | Purchase Price | | | $ | | | | 0.980 | | | | — | |
| |
| | | 324 | | | Other Valuation Techniques (2) | | — | | | | | | | — | | | | — | |
| |
| | | 341 | | | Other Valuation Techniques (2) | | — | | | | | | | — | | | | — | |
| | | | | | | | | | | | | | | | | | | | |
| | Ending
Balance
at 06/30/2022 | | | | | | | (% Unless Noted Otherwise) | |
| | | | | | |
| |
| | $ | 12,445 | | | Comparable Companies/
Discounted Cash Flow | | Book Value Multiple/
Discount Rate | | | X/ | % | | | 0.260/21.660 | | | | — | |
| | | | | | | | | | | | | | | | | | | | | |
| | $ | 423,265 | | | | | | | | | | | | | | | | | |
| | | | | | | | | | | | | | | | | | | | | |
| Any difference between Net Change in Unrealized Appreciation/(Depreciation) and Net Change in Unrealized Appreciation/(Depreciation) on Investments Held at June 30, 2022 may be due to an investment no longer held or categorized as Level 3 at period end. |
| Includes valuation techniques not defined in the Notes to Financial Statements as securities valued using such techniques are not considered significant to the Fund. |
| | | | | | | | | | | | |
| See Accompanying Notes | | | | | | | | | | JUNE 30, 2022 | | | |
| | | | |
Notes to Financial Statements | | | | |
1. ORGANIZATION
PCM Fund, Inc., PIMCO Global StocksPLUS
& Income Fund, PIMCO Strategic Income Fund, Inc., PIMCO Access Income Fund, PIMCO Dynamic Income Fund, and PIMCO Dynamic Income Opportunities Fund (each a “Fund” and collectively the “Funds”) are organized as
closed-end
management investment companies registered under the Investment Company Act of 1940, as amended, and the rules and regulations thereunder (the “Act”). PIMCO Global StocksPLUS
& Income Fund, PIMCO Access Income Fund, PIMCO Dynamic Income Fund, and PIMCO Dynamic Income Opportunities Fund were organized as Massachusetts business trusts on the dates shown in the table below. PCM Fund, Inc. and PIMCO Strategic Income Fund, Inc. were organized as Maryland corporations on the dates shown in the table below. Pacific Investment Management Company LLC (“PIMCO” or the “Manager”) serves as the Funds’ investment manager.
| | | | | | | | |
| | | | | | |
| | | |
| PCM Fund, Inc. | | | | | | | June 23, 1993 | |
| | | |
PIMCO Global StocksPLUS & Income Fund | | | | | | | February 16, 2005 | |
| | | |
| PIMCO Strategic Income Fund, Inc. | | | | | | | December 9, 1993 | |
| | | |
| PIMCO Access Income Fund | | | | | | | October 8, 2021 | |
| | | |
| PIMCO Dynamic Income Fund | | | | | | | January 19, 2011 | |
| | | |
| PIMCO Dynamic Income Opportunities Fund | | | | | | | December 23, 2019 | |
PIMCO Access Income Fund (the “Fund”) is a newly organized, non-diversified, limited term, closed-end management investment company with limited operating history registered under the Act. The Fund sold 43,300,000 common shares in its initial public offering at $20.00 per share. An additional 6,491,061 shares were issued in connection with the underwriter’s over-allotment option. PIMCO, and not the Fund, agreed to pay, from its own assets, compensation to the underwriters and certain dealers in connection with the initial public offering, as well as all of the Fund’s organizational expenses and offering costs associated with the initial public offering. The Fund is not obligated to repay any such compensation, organizational expenses or offering costs paid by PIMCO. The Fund has a limited term and intends to terminate as of the first business day following the twelfth anniversary of the effective date of the Fund’s initial registration statement, which the Fund currently expects to occur on or about January 27, 2034 (the “Dissolution Date”); provided that the Fund’s board of trustees (the “Board”) may, by a vote of a majority of the Board and seventy-five percent (75%) of the Continuing Trustees, as defined below (a “Board Action Vote”), without shareholder approval, extend the Dissolution Date (i) once for up to one year, and (ii) once for up to an additional six months, to a date up to and including eighteen months after the initial Dissolution Date, which date shall then become the Dissolution Date. Each holder of common shares (“Common Shareholder”) would be paid a pro rata portion of the Fund’s net assets upon termination of the Fund.
The Board may, by a Board Action Vote, cause the Fund to conduct a tender offer, as of a date within twelve months preceding the Dissolution Date (as may be extended as described above), to all Common Shareholders to purchase 100% of the then outstanding common shares of the Fund at a price equal to the net asset value per common share on the expiration date of the tender offer (an “Eligible Tender Offer”). The Board has established that the Fund must have at least $200 million of net assets immediately following the completion of an Eligible Tender Offer to ensure the continued viability of the Fund.
The Fund seeks to achieve its investment objectives by utilizing a dynamic asset allocation strategy among multiple sectors in the global public and private credit markets, including corporate debt, mortgage-related and other asset-backed instruments, government and sovereign debt, taxable municipal bonds and other fixed-, variable- and floating-rate income-producing securities of U.S. and foreign issuers, including emerging market issuers and real estate-related investments (such real estate-related investments, collectively, “real estate investments”). The Fund may invest without limitation in investment grade debt securities and below investment grade debt securities (commonly referred to as “high yield” securities or “junk bonds”), including securities of stressed, distressed or defaulted issuers.
Hereinafter, the terms “Trustee” or “Trustees” shall refer to a Director or Directors of applicable Funds.
2. SIGNIFICANT ACCOUNTING POLICIES
The following is a summary of significant accounting policies consistently followed by each Fund in the preparation of its financial statements in conformity with accounting principles generally accepted in the United States of America (“U.S. GAAP”). Each Fund is treated as an investment company under the reporting requirements of U.S. GAAP. The functional and reporting currency for the Funds is the U.S. dollar. The preparation of financial statements in accordance with U.S. GAAP requires management to make estimates and assumptions that affect the reported amounts of assets and liabilities and disclosure of contingent assets and liabilities at the date of the financial statements and the reported amounts of increases and decreases in net assets from operations during the reporting period. Actual results could differ from those estimates.
(a) Securities Transactions and Investment Income
Securities transactions are recorded as of the trade date for financial reporting purposes. Securities purchased or sold on a when-issued or delayed-delivery basis may be settled beyond a standard settlement period for the security after the trade date. Realized gains (losses) from securities sold are recorded on the identified cost basis. Dividend income is recorded on the
ex-dividend
date, except certain dividends from foreign securities where the
ex-dividend
date may have passed, which are
recorded as soon as a Fund is informed of the
ex-dividend
date. Interest income, adjusted for the accretion of discounts and amortization of premiums, is recorded on the accrual basis from settlement date, with the exception of securities with a forward starting effective date, where interest income is recorded on the accrual basis from effective date. For convertible securities, premiums attributable to the conversion feature are not amortized. Estimated tax liabilities on certain foreign securities are recorded on an accrual basis and are reflected as components of interest income or net change in unrealized appreciation (depreciation) on investments on the Statements of Operations, as appropriate. Tax liabilities realized as a result of such security sales are reflected as a component of net realized gain (loss) on investments on the Statements of Operations. Paydown gains (losses) on mortgage-related and other asset-backed securities, if any, are recorded as components of interest income on the Statements of Operations. Income or short-term capital gain distributions received from registered investment companies, if any, are recorded as dividend income. Long-term capital gain distributions received from registered investment companies, if any, are recorded as realized gains.
Debt obligations may be placed on
non-accrual
status and related interest income may be reduced by ceasing current accruals and writing off interest receivable when the collection of all or a portion of interest has become doubtful based on consistently applied procedures. A debt obligation is removed from
non-accrual
status when the issuer resumes interest payments or when collectability of interest is probable.
(b) Foreign Currency Translation
The market values of foreign securities, currency holdings and other assets and liabilities denominated in foreign currencies are translated into U.S. dollars based on the current exchange rates each business day. Purchases and sales of securities and income and expense items denominated in foreign currencies, if any, are translated into U.S. dollars at the exchange rate in effect on the transaction date. The Funds do not separately report the effects of changes in foreign exchange rates from changes in market prices on securities held. Such changes are included in net realized gain (loss) and net change in unrealized appreciation (depreciation) from investments on the Statements of Operations. The Funds may invest in foreign currency-denominated securities and may engage in foreign currency transactions either on a spot (cash) basis at the rate prevailing in the currency exchange market at the time or through a forward foreign currency contract. Realized foreign exchange gains (losses) arising from sales of spot foreign currencies, currency gains (losses) realized between the trade and settlement dates on securities transactions and the difference between the recorded amounts of dividends, interest, and foreign withholding taxes and the U.S. dollar equivalent of the amounts actually received or paid are included in net realized gain (loss) on foreign currency transactions on
the Statements of Operations. Net unrealized foreign exchange gains (losses) arising from changes in foreign exchange rates on foreign denominated assets and liabilities other than investments in securities held at the end of the reporting period are included in net change in unrealized appreciation (depreciation) on foreign currency assets and liabilities on the Statements of Operations.
(c) Distributions — Common Shares
The following table shows the anticipated frequency of distributions from net investment income to common shareholders.
| | | | | | | | | | | | |
| | | | | | | |
| | | | |
| | | | | | | | | |
| | | | |
| PCM Fund, Inc. | | | | | | | Monthly | | | | Monthly | |
| | | | |
PIMCO Global StocksPLUS & Income Fund | | | | | | | Monthly | | | | Monthly | |
| | | | |
| PIMCO Strategic Income Fund, Inc. | | | | | | | Monthly | | | | Monthly | |
| | | | |
| PIMCO Access Income Fund | | | | | | | Monthly | | | | Monthly | |
| | | | |
| PIMCO Dynamic Income Fund | | | | | | | Monthly | | | | Monthly | |
| | | | |
| PIMCO Dynamic Income Opportunities Fund | | | | | | | Monthly | | | | Monthly | |
Each Fund other than the PIMCO Global StocksPLUS
& Income Fund and PIMCO Strategic Income Fund, Inc. generally distributes each year all of its net investment income and net short-term capital gains. The PIMCO Global StocksPLUS
& Income Fund and PIMCO Strategic Income Fund, Inc. intend to distribute all or substantially all of their net investment income and net short-term capital gains over time. In addition, at least annually, each Fund generally distributes net realized long-term capital gains not previously distributed, if any.
Certain funds may invest in one or more Subsidiaries that are treated as disregarded entities for U.S. federal income tax purposes. In the case of a Subsidiary that is so treated, for U.S. federal income tax purposes, (i) the Fund is treated as owning the Subsidiary’s assets directly; (ii) any income, gain, loss, deduction or other tax items arising in respect of the Subsidiary’s assets will be treated as if they are realized or incurred, as applicable, directly by the Fund; and (iii) distributions, if any, the Fund receives from the Subsidiary will have no effect on the Fund’s U.S. federal income tax liability.
As of the end of the fiscal year, none of the Funds were in default on long-term debt or had any accumulated dividend in arrears.
A Fund may engage in investment strategies, including those that employ the use of derivatives, to, among other things, seek to generate current, distributable income without regard to possible declines in the Fund’s net asset value (“NAV”). A Fund’s income and gain generating strategies, including certain derivatives strategies, may generate current, distributable income, even if such strategies could potentially result in declines in the Fund’s NAV. A Fund’s income and gain generating strategies, including certain derivatives strategies, may generate current income and gains taxable as ordinary income
| | | | |
Notes to Financial Statements | | | | |
sufficient to support monthly distributions even in situations when the Fund has experienced a decline in net assets due to, for example, adverse changes in the broad U.S. or
non-U.S.
equity markets or the Fund’s debt investments, or arising from its use of derivatives. A Fund may enter into opposite sides of interest rate swap and other derivatives for the principal purpose of generating distributable gains on the one side (characterized as ordinary income for tax purposes) that are not part of the Fund’s duration or yield curve management strategies and with a substantial possibility that the Fund will experience a corresponding capital loss and decline in NAV with respect to the opposite side transaction (to the extent it does not have corresponding offsetting capital gains). Consequently, common shareholders may receive distributions and owe tax on amounts that are effectively a taxable return of the shareholder’s investment in the Fund at a time when their investment in a Fund has declined in value, which may be taxed at ordinary income rates. The tax treatment of certain derivatives in which a Fund invests may be unclear and thus subject to recharacterization. Any recharacterization of
payments made or received by a Fund pursuant to derivatives potentially could affect the amount, timing or character of Fund distributions. In addition, the tax treatment of such investment strategies may be changed by regulation or otherwise.
For tax years ending before July 1, 2018, PIMCO Strategic Income Fund, Inc. (“RCS”) accounted for mortgage dollar rolls as financing transactions. On July 18, 2019, the Internal Revenue Service (“IRS”) granted RCS’ application for a change in accounting method for mortgage dollar rolls. Accordingly, for tax years ending after June 30, 2018, RCS accounts for mortgage dollar rolls as sales or exchanges. Please see “Federal Income Tax Matters” in the Notes to Financial Statements for information regarding RCS’ treatment of mortgage dollar rolls and its impact on the Fund’s distributions and related consequences. For comparability purposes, certain prior year figures reported in the Financial Highlights have been retrospectively adjusted to conform to current year presentation in the following table.
RCS Financial Highlights (as adjusted)
| | | | | | | | | | | | | | | | | | | | | | | | | | | | | | | | |
Selected Per Share Data
for the Year or Period Ended: | | | | | | | | | | | | | | | | | Net Assets
End of Year
or Period
(000s) | | | Income (Loss)
Ratio to Average
Net Assets | | | | |
| | | | | | | | | |
| 6/30/2018 | | | | | | $ | 7.77 | | | $ | 0.49 | | | $ | (0.06 | ) | | $ | 7.34 | | | $ | 315,577 | | | | 6.39 | % | | | 755 | % |
Income distributions and capital gain distributions are determined in accordance with income tax regulations which may differ from U.S. GAAP. Differences between tax regulations and U.S. GAAP may cause timing differences between income and capital gain recognition. Further, the character of investment income and capital gains may be different for certain transactions under the two methods of accounting. As a result, income distributions and capital gain distributions declared during a fiscal period may differ significantly from the net investment income (loss) and realized gains (losses) reported on each Fund’s annual financial statements presented under U.S. GAAP.
Separately, if a Fund determines or estimates, as applicable, that a portion of a distribution may be comprised of amounts from sources other than net investment income in accordance with its policies, accounting records (if applicable), and accounting practices, the Fund will notify shareholders of the estimated composition of such distribution through a Section 19 Notice. For these purposes, a Fund determines or estimates, as applicable, the source or sources from which a distribution is paid, to the close of the period as of which it is paid, in reference to its internal accounting records and related accounting practices. If, based on such accounting records and practices, it is determined or estimated, as applicable, that a particular distribution does not include capital gains or
paid-in
surplus or other capital sources, a Section 19 Notice generally would not be issued. It is important to note that differences exist between a Fund’s daily
internal accounting records and practices, a Fund’s financial statements presented in accordance with U.S. GAAP, and recordkeeping practices under income tax regulations. For instance, a Fund’s internal accounting records and practices may take into account, among other factors,
tax-related
characteristics of certain sources of distributions that differ from treatment under U.S. GAAP. Examples of such differences may include, but are not limited to, for certain Funds, the treatment of periodic payments under interest rate swap contracts. Accordingly, among other consequences, it is possible that a Fund may not issue a Section 19 Notice in situations where a Fund’s financial statements prepared later and in accordance with U.S. GAAP and/or the final tax character of those distributions might later report that the sources of those distributions included capital gains and/or a return of capital. Please visit www.pimco.com for the most recent Section 19 Notice, if applicable, for additional information regarding the estimated composition of distributions. Final determination of a distribution’s tax character will be provided to shareholders when such information is available.
Distributions classified as a tax basis return of capital at a Fund’s fiscal year end, if any, are reflected on the Statements of Changes in Net Assets and have been recorded to paid in capital on the Statements of Assets and Liabilities. In addition, other amounts have been reclassified between distributable earnings (accumulated loss) and paid in capital
on the Statements of Assets and Liabilities to more appropriately conform U.S. GAAP to tax characterizations of distributions.
(d) New Accounting Pronouncements and Regulatory Updates
In March 2020, the Financial Accounting Standards Board issued an Accounting Standards Update (“ASU”), ASU
2020-04,
which provides optional guidance to ease the potential accounting burden associated with transitioning away from the London Interbank Offered Rate and other reference rates that are expected to be discontinued. ASU
2020-04
is effective for certain reference rate-related contract modifications that occur during the period March 12, 2020 through December 31, 2022. In March 2021, the administrator for LIBOR announced the extension of the publication of a majority of the USD LIBOR settings to June 30, 2023. Management is continuously evaluating the potential effect a discontinuation of LIBOR could have on the Funds’ investments and has determined that it is unlikely the ASU’s adoption will have a material impact on the Funds’ financial statements.
In October 2020, the U.S. Securities and Exchange Commission (“SEC”) adopted a rule related to the use of derivatives, short sales, reverse repurchase agreements and certain other transactions by registered investment companies that rescinds and withdraws the guidance of the SEC and its staff regarding asset segregation and cover transactions that was applicable to the Funds as of the date of this report. Subject to certain exceptions, the rule requires funds that trade derivatives and other transactions that create future payment or delivery obligations to comply with a
leverage limit and certain derivatives risk management program and reporting requirements. The rule went into effect on February 19, 2021. The compliance date for the new rule and the associated recordkeeping requirements is August 19, 2022. At this time, management is evaluating the implications of these changes on the financial statements.
In October 2020, the SEC adopted a rule regarding the ability of a fund to invest in other funds. The rule allows a fund to acquire shares of another fund in excess of certain limitations currently imposed by the Act without obtaining individual exemptive relief from the SEC, subject to certain conditions. The rule also includes the rescission of certain exemptive relief from the SEC and guidance from the SEC staff for funds to invest in other funds. The effective date for the rule was January 19, 2021, and the compliance date for the rule was January 19, 2022. Management has implemented changes in connection with the rule and has determined that there is no material impact to the Funds’ financial statements.
In December 2020, the SEC adopted a rule addressing fair valuation of fund investments. The new rule sets forth requirements for good faith determinations of fair value as well as for the performance of fair value determinations, including related oversight and reporting obligations. The new rule also defines “readily available market quotations” for
purposes of the definition of “value” under the Act, and the SEC noted that this definition would apply in all contexts under the Act. The effective date for the rule was March 8, 2021. The compliance date for the new rule and the associated recordkeeping requirements is September 8, 2022. At this time, management is evaluating the implications of these changes on the financial statements.
3. INVESTMENT VALUATION AND FAIR VALUE MEASUREMENTS
(a) Investment Valuation Policies
The NAV of a Fund, or each of its share classes as applicable, is determined by dividing the total value of portfolio investments and other assets, less any liabilities, attributable to that Fund or class by the total number of shares outstanding of that Fund or class.
On each day that the New York Stock Exchange (“NYSE”) is open, Fund shares are ordinarily valued as of the close of regular trading (normally 4:00 p.m., Eastern time) (“NYSE Close”). Information that becomes known to the Funds or their agents after the time as of which NAV has been calculated on a particular day will not generally be used to retroactively adjust the price of a security or the NAV determined earlier that day. If regular trading on the NYSE closes earlier than scheduled, each Fund reserves the right to either (i) calculate its NAV as of the earlier closing time or (ii) calculate its NAV as of the normally scheduled close of regular trading on the NYSE for that day. Each Fund generally does not calculate its NAV on days during which the NYSE is closed. However, if the NYSE is closed on a day it would normally be open for business, each Fund reserves the right to calculate its NAV as of the normally scheduled close of regular trading on the NYSE for that day or such other time that the Fund may determine.
For purposes of calculating NAV, portfolio securities and other assets for which market quotes are readily available are valued at market value. Market value is generally determined on the basis of official closing prices or the last reported sales prices, or if no sales are reported, based on quotes obtained from established market makers or prices (including evaluated prices) supplied by the Funds’ approved pricing services, quotation reporting systems and other third-party sources (together, “Pricing Services”). The Funds will normally use pricing data for domestic equity securities received shortly after the NYSE Close and do not normally take into account trading, clearances or settlements that take place after the NYSE Close. If market value pricing is used, a foreign
(non-U.S.)
equity security traded on a foreign exchange or on more than one exchange is typically valued using pricing information from the exchange considered by PIMCO to be the primary exchange. A foreign
(non-U.S.)
equity security will be valued as of the close of trading on the foreign exchange, or the NYSE Close, if the NYSE Close occurs before the end of trading on the foreign exchange. Domestic and foreign
(non-U.S.)
fixed income securities,
| | | | | |
Notes to Financial Statements | | | | |
non-exchange
traded derivatives, and equity options are normally valued on the basis of quotes obtained from brokers and dealers or Pricing Services using such data reflecting the principal markets for those securities. Prices obtained from Pricing Services may be based on, among other things, information provided by market makers or estimates of market values obtained from yield data relating to investments or securities with similar characteristics. Certain fixed income securities purchased on a delayed-delivery basis are marked to market daily until settlement at the forward settlement date. Exchange-traded options, except equity options, futures and options on futures are valued at the settlement price determined by the relevant exchange, quotes obtained from a quotation reporting system, established market makers or pricing services. Swap agreements are valued on the basis of market-based prices supplied by Pricing Services or quotes obtained from brokers and dealers. A Fund’s investments in
open-end
management investment companies, other than exchange-traded funds (“ETFs”), are valued at the NAVs of such investments.
If a foreign
(non-U.S.)
equity security’s value has materially changed after the close of the security’s primary exchange or principal market but before the NYSE Close, the security may be valued at fair value based on procedures established and approved by the Board. Foreign
(non-U.S.)
equity securities that do not trade when the NYSE is open are also valued at fair value. With respect to foreign
(non-U.S.)
equity securities, a Fund may determine the fair value of investments based on information provided by Pricing Services and other third-party vendors, which may recommend fair value or adjustments with reference to other securities, indices or assets. In considering whether fair valuation is required and in determining fair values, a Fund may, among other things, consider significant events (which may be considered to include changes in the value of U.S. securities or securities indices) that occur after the close of the relevant market and before the NYSE Close. A Fund may utilize modeling tools provided by third-party vendors to determine fair values of
non-U.S.
securities. For these purposes, any movement in the applicable reference index or instrument (“zero trigger”) between the earlier close of the applicable foreign market and the NYSE Close may be deemed to be a significant event, prompting the application of the pricing model (effectively resulting in daily fair valuations). Foreign exchanges may permit trading in foreign
(non-U.S.)
equity securities on days when a Fund is not open for business, which may result in a Fund’s portfolio investments being affected when shareholders are unable to buy or sell shares.
Senior secured floating rate loans for which an active secondary market exists to a reliable degree are valued at the mean of the last available bid/ask prices in the market for such loans, as provided by a Pricing Service. Senior secured floating rate loans for which an active secondary market does not exist to a reliable degree are valued at fair
value, which is intended to approximate market value. In valuing a senior secured floating rate loan at fair value, the factors considered may include, but are not limited to, the following: (a) the creditworthiness of the borrower and any intermediate participants, (b) the terms of the loan, (c) recent prices in the market for similar loans, if any, and (d) recent prices in the market for instruments of similar quality, rate, period until next interest rate reset and maturity.
Investments valued in currencies other than the U.S. dollar are converted to the U.S. dollar using exchange rates obtained from Pricing Services. As a result, the value of such investments and, in turn, the NAV of a Fund’s shares may be affected by changes in the value of currencies in relation to the U.S. dollar. The value of investments traded in markets outside the United States or denominated in currencies other than the U.S. dollar may be affected significantly on a day that a Fund is not open for business. As a result, to the extent that a Fund holds foreign
(non-U.S.)
investments, the value of those investments may change at times when shareholders are unable to buy or sell shares and the value of such investments will be reflected in the Fund’s next calculated NAV.
Investments for which market quotes or market based valuations are not readily available are valued at fair value as determined in good faith by the Board or persons acting at their direction. The Board has adopted methods for valuing securities and other assets in circumstances where market quotes are not readily available, and has delegated to PIMCO the responsibility for applying the fair valuation methods. In the event that market quotes or market based valuations are not readily available, and the security or asset cannot be valued pursuant to a Board approved valuation method, the value of the security or asset will be determined in good faith by the Board. Market quotes are considered not readily available in circumstances where there is an absence of current or reliable market-based data (e.g., trade information, bid/ask information, indicative market quotations (“Broker Quotes”), Pricing Services’ prices), including where events occur after the close of the relevant market, but prior to the NYSE Close, that materially affect the values of a Fund’s securities or assets. In addition, market quotes are considered not readily available when, due to extraordinary circumstances, the exchanges or markets on which the securities trade do not open for trading for the entire day and no other market prices are available. The Board has delegated, to the Manager, the responsibility for monitoring significant events that may materially affect the values of a Fund’s securities or assets and for determining whether the value of the applicable securities or assets should be reevaluated in light of such significant events.
When a Fund uses fair valuation to determine the value of a portfolio security or other asset for purposes of calculating its NAV, such investments will not be priced on the basis of quotes from the primary
market in which they are traded, but rather may be priced by another method that the Board or persons acting at their direction believe reflects fair value. Fair valuation may require subjective determinations about the value of a security. While the Funds’ policy is intended to result in a calculation of a Fund’s NAV that fairly reflects security values as of the time of pricing, a Fund cannot ensure that fair values determined by the Board or persons acting at their direction would accurately reflect the price that a Fund could obtain for a security if it were to dispose of that security as of the time of pricing (for instance, in a forced or distressed sale). The prices used by a Fund may differ from the value that would be realized if the securities were sold.
(b) Fair Value Hierarchy
U.S. GAAP describes fair value as the price that a Fund would receive to sell an asset or pay to transfer a liability in an orderly transaction between market participants at the measurement date. It establishes a fair value hierarchy that prioritizes inputs to valuation methods and requires disclosure of the fair value hierarchy, separately for each major category of assets and liabilities, that segregates fair value measurements into levels (Level 1, 2, or 3). The inputs or methodology used for valuing securities are not necessarily an indication of the risks associated with investing in those securities. Levels 1, 2, and 3 of the fair value hierarchy are defined as follows:
| | Level 1 — Quoted prices in active markets or exchanges for identical assets and liabilities. |
| | Level 2 — Significant other observable inputs, which may include, but are not limited to, quoted prices for similar assets or liabilities in markets that are active, quoted prices for identical or similar assets or liabilities in markets that are not active, inputs other than quoted prices that are observable for the assets or liabilities (such as interest rates, yield curves, volatilities, prepayment speeds, loss severities, credit risks and default rates) or other market corroborated inputs. |
| | Level 3 — Significant unobservable inputs based on the best information available in the circumstances, to the extent observable inputs are not available, which may include assumptions made by the Board or persons acting at their direction that are used in determining the fair value of investments. |
Transfers from Level 1 to Level 3 are a result of a change from the use of an exchange traded price or a trade price on the initial purchase date (Level 1) to the use of a valuation technique which utilizes significant unobservable inputs due to an absence of current or reliable market based data (Level 3). Assets or liabilities categorized as Level 2 or 3 as of period end have been transferred between Levels 2 and 3 since the prior period due to changes in the method utilized in valuing the investments. Transfers from Level 2 to Level 3 are a result of a change, in the normal course of business, from the use of methods used by Pricing Services (Level 2) to the use of a Broker Quote or
valuation technique which utilizes significant unobservable inputs due to an absence of current or reliable market-based data (Level 3). Transfers from Level 3 to Level 2 are a result of the availability of current and reliable market-based data provided by Pricing Services or other valuation techniques which utilize significant observable inputs. In accordance with the requirements of U.S. GAAP, the amounts of transfers into and out of Level 3, if material, are disclosed in the Notes to Schedule of Investments for each respective Fund.
For fair valuations using significant unobservable inputs, U.S. GAAP requires a reconciliation of the beginning to ending balances for reported fair values that presents changes attributable to realized gain (loss), unrealized appreciation (depreciation), purchases and sales, accrued discounts (premiums), and transfers into and out of the Level 3 category during the period. The end of period value is used for the transfers between Levels of a Fund’s assets and liabilities. Additionally, U.S. GAAP requires quantitative information regarding the significant unobservable inputs used in the determination of fair value of assets or liabilities categorized as Level 3 in the fair value hierarchy. In accordance with the requirements of U.S. GAAP, a fair value hierarchy, and if material, a Level 3 reconciliation and details of significant unobservable inputs, have been included in the Notes to Schedule of Investments for each respective Fund.
(c) Valuation Techniques and the Fair Value Hierarchy
Level 1, Level 2 and Level 3 trading assets and trading liabilities, at fair value
The valuation methods (or “techniques”) and significant inputs used in determining the fair values of portfolio securities or other assets and liabilities categorized as Level 1, Level 2 and Level 3 of the fair value hierarchy are as follows:
Fixed income securities including corporate, convertible and municipal bonds and notes, U.S. government agencies, U.S. treasury obligations, sovereign issues, bank loans, convertible preferred securities and
non-U.S.
bonds are normally valued on the basis of quotes obtained from brokers and dealers or Pricing Services that use broker-dealer quotations, reported trades or valuation estimates from their internal pricing models. The Pricing Services’ internal models use inputs that are observable such as issuer details, interest rates, yield curves, prepayment speeds, credit risks/spreads, default rates and quoted prices for similar assets. Securities that use similar valuation techniques and inputs as described above are categorized as Level 2 of the fair value hierarchy.
Fixed income securities purchased on a delayed-delivery basis or as a repurchase commitment in a sale-buyback transaction are marked to market daily until settlement at the forward settlement date and are categorized as Level 2 of the fair value hierarchy.
| | | | | |
Notes to Financial Statements | | | | |
Mortgage-related and asset-backed securities are usually issued as separate tranches, or classes, of securities within each deal. These securities are also normally valued by Pricing Services that use broker-dealer quotations, reported trades or valuation estimates from their internal pricing models. The pricing models for these securities usually consider tranche-level attributes, current market data, estimated cash flows and market-based yield spreads for each tranche, and incorporate deal collateral performance, as available. Mortgage-related and asset-backed securities that use similar valuation techniques and inputs as described above are categorized as Level 2 of the fair value hierarchy.
Common stocks, ETFs, exchange-traded notes and financial derivative instruments, such as futures contracts, rights and warrants, or options on futures that are traded on a national securities exchange, are stated at the last reported sale or settlement price on the day of valuation. To the extent these securities are actively traded and valuation adjustments are not applied, they are categorized as Level 1 of the fair value hierarchy.
Valuation adjustments may be applied to certain securities that are solely traded on a foreign exchange to account for the market movement between the close of the foreign market and the NYSE Close. These securities are valued using Pricing Services that consider the correlation of the trading patterns of the foreign security to the intraday trading in the U.S. markets for investments. Securities using these valuation adjustments are categorized as Level 2 of the fair value hierarchy. Preferred securities and other equities traded on inactive markets or valued by reference to similar instruments are also categorized as Level 2 of the fair value hierarchy.
Valuation adjustments may be applied to certain exchange traded futures and options to account for market movement between the exchange settlement and the NYSE close. These securities are valued using quotes obtained from a quotation reporting system, established market makers or pricing services. Financial derivatives using these valuation adjustments are categorized as Level 2 of the fair value hierarchy.
Equity exchange-traded options and over the counter financial derivative instruments, such as forward foreign currency contracts and options contracts derive their value from underlying asset prices, indices, reference rates, and other inputs or a combination of these factors. These contracts are normally valued on the basis of quotes obtained from a quotation reporting system, established market makers or Pricing Services (normally determined as of the NYSE Close). Depending on the product and the terms of the transaction, financial derivative instruments can be valued by Pricing Services using a series of techniques, including simulation pricing models. The pricing models use inputs that are observed from actively quoted markets such as quoted prices, issuer details, indices, bid/ask spreads, interest rates,
implied volatilities, yield curves, dividends and exchange rates. Financial derivative instruments that use similar valuation techniques and inputs as described above are categorized as Level 2 of the fair value hierarchy.
Centrally cleared swaps and over the counter swaps derive their value from underlying asset prices, indices, reference rates, and other inputs or a combination of these factors. They are valued using a broker-dealer bid quotation or on market-based prices provided by Pricing Services (normally determined as of the NYSE Close). Centrally cleared swaps and over the counter swaps can be valued by Pricing Services using a series of techniques, including simulation pricing models. The pricing models may use inputs that are observed from actively quoted markets such as the overnight index swap rate, LIBOR forward rate, interest rates, yield curves and credit spreads. These securities are categorized as Level 2 of the fair value hierarchy.
When a fair valuation method is applied by PIMCO that uses significant unobservable inputs, investments will be priced by a method that the Board or persons acting at their direction believe reflects fair value and are categorized as Level 3 of the fair value hierarchy.
Proxy pricing procedures set the base price of a fixed income security and subsequently adjust the price proportionally to market value changes of a
pre-determined
security deemed to be comparable in duration, generally a U.S. Treasury or sovereign note based on country of issuance. The base price may be a broker-dealer quote, transaction price, or an internal value as derived by analysis of market data. The base price of the security may be reset on a periodic basis based on the availability of market data and procedures approved by the Valuation Oversight Committee. Significant changes in the unobservable inputs of the proxy pricing process (the base price) would result in direct and proportional changes in the fair value of the security. These securities are categorized as Level 3 of the fair value hierarchy.
If third-party evaluated vendor pricing is not available or not deemed to be indicative of fair value, the Manager may elect to obtain Broker Quotes directly from the broker-dealer or passed through from a third-party vendor. In the event that fair value is based upon a single sourced Broker Quote, these securities are categorized as Level 3 of the fair value hierarchy. Broker Quotes are typically received from established market participants. Although independently received, the Manager does not have the transparency to view the underlying inputs which support the market quotation. Significant changes in the Broker Quote would have direct and proportional changes in the fair value of the security.
Reference instrument valuation estimates fair value by utilizing the correlation of the security to one or more broad-based securities, market indices, and/or other financial instruments, whose pricing
information is readily available. Unobservable inputs may include those used in algorithms based on percentage change in the reference instruments and/or weights of each reference instrument. Significant changes in the unobservable inputs would result in direct and proportional changes in the fair value of the security. These securities are categorized as Level 2 or Level 3 of the fair value hierarchy depending on the source or input of the reference instrument.
The Discounted Cash Flow model is based on future cash flows generated by the investment and may be normalized based on expected investment performance. Future cash flows are discounted to present value using an appropriate rate of return, typically calibrated to the initial transaction date and adjusted based on Capital Asset Pricing Model and/or other market-based inputs. Significant changes in the unobservable inputs would result in direct and proportional changes in the fair value of the security. These securities are categorized as Level 3 of the fair value hierarchy.
The Comparable Companies model is based on application of valuation multiples from publicly traded comparable companies to the financials of the subject company. Adjustments may be made to the market-derived valuation multiples based on differences between the comparable companies and the subject company. Significant changes in the unobservable inputs would result in direct and proportional changes in the fair value of the security. These securities are categorized as Level 3 of the fair value hierarchy.
Short-term debt instruments (such as commercial paper) having a remaining maturity of 60 days or less may be valued at amortized cost, so long as the amortized cost value of such short-term debt instruments is approximately the same as the fair value of the instrument as determined without the use of amortized cost valuation. These securities are categorized as Level 2 or Level 3 of the fair value hierarchy depending on the source of the base price.
4. SECURITIES AND OTHER INVESTMENTS
(a) Investments in Affiliates
An affiliate includes any company in which a Fund owns 5% or more of the company’s outstanding voting shares. The table below represents transactions in and earnings from these affiliated issuers for the period ended June 30, 2022 (amounts in thousands
, except number of shares).
PIMCO Dynamic Income Fund
| | | | | | | | | | | | | | | | | | | | | | | | | | | | | | | | | | | | | |
| | | | | Market Value
at 06/30/2021 | | | | | | | | | | | | Change in
Unrealized
Appreciation
(Depreciation) | | | Market Value
at 06/30/2022 | | | | | | | |
| | | | | | | | | | |
| Associated Materials Group, Inc.* | | | | | | $ | 17,111 | | | $ | 57,117 | | | $ | (78,566 | ) | | $ | 6,102 | | | $ | (1,764 | ) | | $ | 0 | | | $ | 0 | | | | 0 | |
| | | | | | | | | | |
| Neiman Marcus Group Ltd. LLC** | | | | | | | 20,120 | | | | 13,512 | | | | 0 | | | | 0 | | | | 70,568 | | | | 104,200 | | | | 0 | | | | 602,840 | |
| | | | | | | | | | |
| Sierra Hamilton Holder LLC | | | | | | | 0 | | | | 7,690 | | | | 0 | | | | 0 | | | | (7,687 | ) | | | 3 | | | | 0 | | | | 30,337,712 | |
| * | Not affiliated at June 30, 2022. |
| ** | Not affiliated at June 30, 2021. |
| A zero balance may reflect actual amounts rounding to less than one thousand. |
(b) Investments in Securities
The Funds may utilize the investments and strategies described below to the extent permitted by each Fund’s respective investment policies.
Inflation-Indexed Bonds
are fixed income securities whose principal value is periodically adjusted by the rate of inflation. The interest rate on these bonds is generally fixed at issuance at a rate lower than typical bonds. Over the life of an inflation-indexed bond, however, interest will be paid based on a principal value which is adjusted for inflation. Any increase or decrease in the principal amount of an inflation-indexed bond will be included as interest income on the Statements of Operations, even though investors do not receive their principal until maturity. Repayment of the original bond principal upon maturity (as adjusted for inflation) is guaranteed in the case of U.S. Treasury Inflation-Protected Securities. For bonds that do not provide a
similar guarantee, the adjusted principal value of the bond repaid at maturity may be less than the original principal.
Loans and Other Indebtedness, Loan Participations and Assignments
are direct debt instruments which are interests in amounts owed to lenders or lending syndicates by corporate, governmental, or other borrowers. A Fund’s investments in loans may be in the form of direct investments, participations in loans or assignments of all or a portion of loans from third parties or exposure to investments in loans through investments in a mutual fund or other pooled investment vehicle. A loan is often administered by a bank or other financial institution (the “agent”) that acts as agent for all holders. The agent administers the terms of the loan, as specified in the loan agreement. A Fund may invest in multiple series or tranches of a loan, which may have varying terms and carry different associated risks.
| | | | | |
Notes to Financial Statements | | | | |
A Fund generally has no right to enforce compliance with the terms of the loan agreement with the borrower. As a result, a Fund may be subject to the credit risk of both the borrower and the agent that is selling the loan agreement.
In the event of the insolvency of the agent selling a participation, a Fund may be treated as a general creditor of the agent and may not benefit from any
set-off
between the agent and the borrower. When a Fund purchases assignments from agents it acquires direct rights against the borrowers of the loans. These loans may include participations in bridge loans, which are loans taken out by borrowers for a short period (typically less than one year) pending arrangement of more permanent financing through, for example, the issuance of bonds, frequently high yield bonds issued for the purpose of acquisitions.
Investments in loans are generally subject to risks similar to those of investments in other types of debt obligations, including, among others, credit risk, interest rate risk, variable and floating rate securities risk, and risks associated with mortgage-related securities. In addition, in many cases loans are subject to the risks associated with below investment grade securities. The Funds may be subject to heightened or additional risks and potential liabilities and costs by investing in mezzanine and other subordinated loans, including those arising under bankruptcy, fraudulent conveyance, equitable subordination, environmental and other laws and regulations, and risks and costs associated with debt servicing and taking foreclosure actions associated with the loans.
Additionally, because loans are not ordinarily registered with the SEC or any state securities commission or listed on any securities exchange, there is usually less publicly available information about such instruments. In addition, loans may not be considered “securities” for purposes of the anti-fraud provisions under the federal securities laws and, as a result, as a purchaser of these instruments, a Fund may not be entitled to the anti-fraud protections of the federal securities laws. In the course of investing in such instruments, a Fund may come into possession of material nonpublic information and, because of prohibitions on trading in securities of issuers while in possession of such information, the Fund may be unable to enter into a transaction in a publicly-traded security of that issuer when it would otherwise be advantageous for the Fund to do so. Alternatively, a Fund may choose not to receive material nonpublic information about an issuer of such loans, with the result that the Fund may have less information about such issuers than other investors who transact in such assets.
The types of loans and related investments in which the Funds may invest include, among others, senior loans, subordinated loans (including second lien loans,
B-Notes
and mezzanine loans), whole loans, commercial real estate and other commercial loans and
structured loans. The Funds may acquire direct interests in loans through primary loan distributions and/or in private transactions. In the case of subordinated loans, there may be significant indebtedness ranking ahead of the borrower’s obligation to the holder of such a loan, including in the event of the borrower’s insolvency. Mezzanine loans are typically secured by a pledge of an equity interest in the mortgage borrower that owns the real estate rather than an interest in a mortgage.
Investments in loans may include unfunded loan commitments, which are contractual obligations for future funding. Unfunded loan commitments may include revolving credit facilities, which may obligate a Fund to supply additional cash to the borrower on demand. Unfunded loan commitments represent a future obligation in full, even though a percentage of the committed amount may not be utilized by the borrower. When investing in a loan participation, a Fund has the right to receive payments of principal, interest and any fees to which it is entitled only from the agent selling the loan agreement and only upon receipt of payments by the agent from the borrower. Because investing in unfunded loan commitments creates a future obligation for a Fund to provide funding to a borrower upon demand in exchange for a fee, the Fund will segregate or earmark liquid assets with the Fund’s custodian in amounts sufficient to satisfy any such future obligations. A Fund may receive a commitment fee based on the undrawn portion of the underlying line of credit portion of a loan. In certain circumstances, a Fund may receive a penalty fee upon the prepayment of a loan by a borrower. Fees earned or paid are recorded as a component of interest income or interest expense, respectively, on the Statements of Operations. Unfunded loan commitments, if any, are reflected as a liability on the Statements of Assets and Liabilities.
Mortgage-Related and Other Asset-Backed Securities
directly or indirectly represent a participation in, or are secured by and payable from, loans on real property. Mortgage-related securities are created from pools of residential or commercial mortgage loans, including mortgage loans made by savings and loan institutions, mortgage bankers, commercial banks and others. These securities typically provide a monthly payment which consists of both principal and interest. Interest may be determined by fixed or adjustable rates. In times of declining interest rates, there is a greater likelihood that a Fund’s higher yielding securities will be
pre-paid
with the Fund being unable to reinvest the proceeds in an investment with as great a yield. The rate of prepayments on underlying mortgages will affect the price and volatility of a mortgage-related security, and may have the effect of shortening or extending the effective duration of the security relative to what was anticipated at the time of purchase. Interest-only and principal-only securities are especially sensitive to interest rate changes, which can affect not only their prices but can also change the income
flows and repayment assumptions about those investments. The timely payment of principal and interest of certain mortgage-related securities is guaranteed with the full faith and credit of the U.S. Government. Pools created and guaranteed by
non-governmental
issuers, including government-sponsored corporations, may be supported by various forms of insurance or guarantees, but there can be no assurance that private insurers or guarantors can meet their obligations under the insurance policies or guarantee arrangements. Many of the risks of investing in mortgage-related securities secured by commercial mortgage loans (“CMBS”) reflect the effects of local and other economic conditions on real estate markets, the ability of tenants to make lease payments, and the ability of a property to attract and retain tenants. These securities may be less liquid and may exhibit greater price volatility than other types of mortgage-related or other asset-backed securities. Other asset-backed securities are created from many types of assets, including, but not limited to, auto loans, accounts receivable such as credit card receivables and hospital account receivables, home equity loans, student loans, boat loans, mobile home loans, recreational vehicle loans, manufactured housing loans, aircraft leases, computer leases and syndicated bank loans. The Funds may invest in any level of the capital structure of an issuer of mortgage-backed or asset-backed securities, including the equity or “first loss” tranche.
Collateralized Debt Obligations
(“CDOs”) include Collateralized Bond Obligations (“CBOs”), Collateralized Loan Obligations (“CLOs”) and other similarly structured securities. CBOs and CLOs are types of asset-backed securities. A CBO is a trust which is typically backed by a diversified pool of high risk, below investment grade fixed income securities. A CLO is a trust typically collateralized by a pool of loans, which may include, among others, domestic and foreign senior secured loans, senior unsecured loans, and subordinate corporate loans, including loans that may be rated below investment grade or equivalent unrated loans. For both CBOs and CLOs, the cash flows from the trust are split into two or more portions, called tranches, varying in risk and yield. The riskiest portion is the “equity” tranche which bears the bulk of defaults from the bonds or loans in the trust and serves to protect the other, more senior tranches from default in all but the most severe circumstances. Since it is partially protected from defaults, a senior tranche from a CBO trust or CLO trust typically has higher ratings and lower yields than the underlying securities, and can be rated investment grade. Despite the protection from the equity tranche, CBO or CLO tranches can experience substantial losses due to actual defaults, increased sensitivity to defaults due to collateral default and disappearance of protecting tranches, market anticipation of defaults and aversion to CBO or CLO securities as a class. The risks of an investment in a CDO depend largely on the type of the collateral securities and the class of the CDO in which a Fund invests. CDOs carry
additional risks including, but not limited to, (i) the possibility that distributions from collateral securities will not be adequate to make interest or other payments, (ii) the collateral may decline in value or default, (iii) the risk that a Fund may invest in CDOs that are subordinate to other classes, and (iv) the complex structure of the security may not be fully understood at the time of investment and may produce disputes with the issuer or unexpected investment results.
Collateralized Mortgage Obligations
(“CMOs”) are debt obligations of a legal entity that are collateralized by whole mortgage loans or private mortgage bonds and divided into classes. CMOs are structured into multiple classes, often referred to as “tranches”, with each class bearing a different stated maturity and entitled to a different schedule for payments of principal and interest, including prepayments. CMOs may be less liquid and may exhibit greater price volatility than other types of mortgage-related or asset-backed securities.
As CMOs have evolved, some classes of CMO bonds have become more common. For example, a Fund may invest in
parallel-pay
and planned amortization class (“PAC”) CMOs and multi-class pass-through certificates.
Parallel-pay
CMOs and multi-class pass-through certificates are structured to provide payments of principal on each payment date to more than one class. These simultaneous payments are taken into account in calculating the stated maturity date or final distribution date of each class, which, as with other CMO and multi-class pass-through structures, must be retired by its stated maturity date or final distribution date but may be retired earlier. PACs generally require payments of a specified amount of principal on each payment date. PACs are
parallel-pay
CMOs with the required principal amount on such securities having the highest priority after interest has been paid to all classes. Any CMO or multi-class pass-through structure that includes PAC securities must also have support tranches — known as support bonds, companion bonds or
non-PAC
bonds — which lend or absorb principal cash flows to allow the PAC securities to maintain their stated maturities and final distribution dates within a range of actual prepayment experience. These support tranches are subject to a higher level of maturity risk compared to other mortgage-related securities, and usually provide a higher yield to compensate investors. If principal cash flows are received in amounts outside a
pre-determined
range such that the support bonds cannot lend or absorb sufficient cash flows to the PAC securities as intended, the PAC securities are subject to heightened maturity risk. A Fund may invest in various tranches of CMO bonds, including support bonds and equity or “first loss” tranches (see “Collateralized Debt Obligations” above).
Stripped Mortgage-Backed Securities
(“SMBS”) are derivative multi-class mortgage securities. SMBS are usually structured with two classes that receive different proportions of the interest and principal distributions on a pool of mortgage assets. An SMBS will have one
| | | | | | | | | | | | |
| | | | ANNUAL REPORT | | | | | | | JUNE 30, 2022 | | | 125 |
| | | | |
Notes to Financial Statements | | | | |
class that will receive all of the interest (the interest-only or “IO” class), while the other class will receive the entire principal (the principal-only or “PO” class). IOs and POs can be extremely volatile in response to changes in interest rates. As interest rates rise and fall, the value of IOs tends to move in the same direction as interest rates. POs perform best when prepayments on the underlying mortgages rise since this increases the rate at which the principal is returned and the yield to maturity on the PO. When payments on mortgages underlying a PO are slower than anticipated, the life of the PO is lengthened and the yield to maturity is reduced. The yield to maturity on an IO class is extremely sensitive to the rate of principal payments (including prepayments) on the related underlying mortgage assets, and a rapid rate of principal payments may have a material adverse effect on a Fund’s yield to maturity from these securities. If the underlying mortgage assets experience greater than anticipated prepayments of principal, the Funds may fail to recoup some or all of its initial investment in these securities even if the security is in one of the highest rating categories.
Payments received for IOs are included in interest income on the Statements of Operations. Because no principal will be received at the maturity of an IO, adjustments are made to the cost of the security on a monthly basis until maturity. These adjustments are included in interest income on the Statements of Operations. Payments received for POs are treated as reductions to the cost and par value of the securities.
may give the issuer the option at each interest payment date of making interest payments in either cash and/or additional debt securities. Those additional debt securities usually have the same terms, including maturity dates and interest rates, and associated risks as the original bonds. The daily market quotations of the original bonds may include the accrued interest (referred to as a dirty price) and require a pro rata adjustment from the unrealized appreciation (depreciation) on investments to interest receivable on the Statements of Assets and Liabilities.
Perpetual Bonds
are fixed income securities with no maturity date but pay a coupon in perpetuity (with no specified ending or maturity date). Unlike typical fixed income securities, there is no obligation for perpetual bonds to repay principal. The coupon payments, however, are mandatory. While perpetual bonds have no maturity date, they may have a callable date in which the perpetuity is eliminated and the issuer may return the principal received on the specified call date. Additionally, a perpetual bond may have additional features, such as interest rate increases at periodic dates or an increase as of a predetermined point in the future.
Real Estate Investment Trusts
(“REITs”)
are pooled investment vehicles that own, and typically operate, income-producing real estate. If a REIT meets certain requirements, including distributing to
shareholders substantially all of its taxable income (other than net capital gains), then it is not taxed on the income distributed to shareholders. Distributions received from REITs may be characterized as income, capital gain or a return of capital. A return of capital is recorded by a Fund as a reduction to the cost basis of its investment in the REIT. REITs are subject to management fees and other expenses, and so the Funds that invest in REITs will bear their proportionate share of the costs of the REITs’ operations.
Restricted Investments
are subject to legal or contractual restrictions on resale and may generally be sold privately, but may be required to be registered or exempted from such registration before being sold to the public. Private placement securities are generally considered to be restricted except for those securities traded between qualified institutional investors under the provisions of Rule 144A of the Securities Act of 1933. Disposal of restricted investments may involve time-consuming negotiations and expenses, and prompt sale at an acceptable price may be difficult to achieve. Restricted investments held by the Funds as of June 30, 2022, as applicable, are disclosed in the Notes to Schedules of Investments.
Securities Issued by U.S. Government Agencies or Government-Sponsored Enterprises
are obligations of and, in certain cases, guaranteed by, the U.S. Government, its agencies or instrumentalities. Some U.S. Government securities, such as Treasury bills, notes and bonds, and securities guaranteed by the Government National Mortgage Association, are supported by the full faith and credit of the U.S. Government; others, such as those of the Federal Home Loan Banks, are supported by the right of the issuer to borrow from the U.S. Department of the Treasury (the “U.S. Treasury”); and others, such as those of the Federal National Mortgage Association (“FNMA” or “Fannie Mae”), are supported by the discretionary authority of the U.S. Government to purchase the agency’s obligations. U.S. Government securities may include zero coupon securities which do not distribute interest on a current basis and tend to be subject to a greater risk than interest-paying securities of similar maturities.
Government-related guarantors (i.e., not backed by the full faith and credit of the U.S. Government) include FNMA and the Federal Home Loan Mortgage Corporation (“FHLMC” or “Freddie Mac”). FNMA is a government-sponsored corporation. FNMA purchases conventional (i.e., not insured or guaranteed by any government agency) residential mortgages from a list of approved seller/servicers which include state and federally chartered savings and loan associations, mutual savings banks, commercial banks and credit unions and mortgage bankers. Pass-through securities issued by FNMA are guaranteed as to timely payment of principal and interest by FNMA, but are not backed by the full faith and credit of the U.S. Government. FHLMC issues Participation Certificates (“PCs”), which are pass-through securities, each
| | | | | | |
| 126 | | PIMCO CLOSED-END FUNDS | | | | |
representing an undivided interest in a pool of residential mortgages. FHLMC guarantees the timely payment of interest and ultimate collection of principal, but PCs are not backed by the full faith and credit of the U.S. Government. Instead, they are supported only by the discretionary authority of the U.S. Government to purchase the agency’s obligations.
In June 2019, FNMA and FHLMC started issuing Uniform Mortgage Backed Securities in place of their current offerings of
TBA-eligible
securities (the “Single Security Initiative”). The Single Security Initiative seeks to support the overall liquidity of the TBA market and aligns the characteristics of FNMA and FHLMC certificates. The effects that the Single Security Initiative may have on the market for TBA and other mortgage-backed securities are uncertain.
Roll-timing strategies can be used where a Fund seeks to extend the expiration or maturity of a position, such as a TBA security on an underlying asset, by closing out the position before expiration and opening a new position with respect to substantially the same underlying asset with a later expiration date. TBA securities purchased or sold are reflected on the Statements of Assets and Liabilities as an asset or liability, respectively. Recently finalized FINRA rules include mandatory margin requirements for the TBA market that require the Funds to post collateral in connection with their TBA transactions. There is no similar requirement applicable to the Funds’ TBA counterparties. The required collateralization of TBA trades could increase the cost of TBA transactions to the Funds and impose added operational complexity.
Warrants
are securities that are usually issued together with a debt security or preferred security and that give the holder the right to buy a proportionate amount of common stock at a specified price. Warrants normally have a life that is measured in years and entitle the holder to buy common stock of a company at a price that is usually higher than the market price at the time the warrant is issued. Warrants may entail greater risks than certain other types of investments. Generally, warrants do not carry the right to receive dividends or exercise voting rights with respect to the underlying securities, and they do not represent any rights in the assets of the issuer. In addition, their value does not necessarily change with the value of the underlying securities, and they cease to have value if they are not exercised on or before their expiration date. If the market price of the underlying stock does not exceed the exercise price during the life of the warrant, the warrant will expire worthless. Warrants may increase the potential profit or loss to be realized from the investment as compared with investing the same amount in the underlying securities. Similarly, the percentage increase or decrease in the value of an equity security warrant may be greater than the percentage increase or decrease in the value of the underlying common stock. Warrants may relate to the purchase of equity or debt
securities. Debt obligations with warrants attached to purchase equity securities have many characteristics of convertible securities and their prices may, to some degree, reflect the performance of the underlying stock. Debt obligations also may be issued with warrants attached to purchase additional debt securities at the same coupon rate. A decline in interest rates would permit a Fund to sell such warrants at a profit. If interest rates rise, these warrants would generally expire with no value.
When-Issued Transactions
are purchases or sales made on a when-issued basis. These transactions are made conditionally because a security, although authorized, has not yet been issued in the market. Transactions to purchase or sell securities on a when-issued basis involve a commitment by a Fund to purchase or sell these securities for a predetermined price or yield, with payment and delivery taking place beyond the customary settlement period. A Fund may sell when-issued securities before they are delivered, which may result in a realized gain (loss).
5. BORROWINGS AND OTHER FINANCING TRANSACTIONS
The Funds may enter into the borrowings and other financing transactions described below to the extent permitted by each Fund’s respective investment policies.
The following disclosures contain information on a Fund’s ability to lend or borrow cash or securities to the extent permitted under the Act, which may be viewed as borrowing or financing transactions by a Fund. The location of these instruments in each Fund’s financial statements is described below.
(a) Repurchase Agreements
Under the terms of a typical repurchase agreement, a Fund purchases an underlying debt obligation (collateral) subject to an obligation of the seller to repurchase, and a Fund to resell, the obligation at an agreed-upon price and time. In an open maturity repurchase agreement, there is no
pre-determined
repurchase date and the agreement can be terminated by the Fund or counterparty at any time. The underlying securities for all repurchase agreements are held by a Fund’s custodian or designated subcustodians under
tri-party
repurchase agreements and in certain instances will remain in custody with the counterparty. The market value of the collateral must be equal to or exceed the total amount of the repurchase obligations, including interest. Repurchase agreements, if any, including accrued interest, are included on the Statements of Assets and Liabilities. Interest earned is recorded as a component of interest income on the Statements of Operations. In periods of increased demand for collateral, a Fund may pay a fee for the receipt of collateral, which may result in interest expense to the Fund.
| | | | | | | | | | | | |
| | | | ANNUAL REPORT | | | | | | | JUNE 30, 2022 | | | 127 |
| | | | |
Notes to Financial Statements | | | | |
(b) Reverse Repurchase Agreements
In a reverse repurchase agreement, a Fund delivers a security in exchange for cash to a financial institution, the counterparty, with a simultaneous agreement to repurchase the same or substantially the same security at an agreed upon price and date. In an open maturity reverse repurchase agreement, there is no
pre-determined
repurchase date and the agreement can be terminated by the Fund or counterparty at any time. A Fund is entitled to receive principal and interest payments, if any, made on the security delivered to the counterparty during the term of the agreement. Cash received in exchange for securities delivered plus accrued interest payments to be made by a Fund to counterparties are reflected as a liability on the Statements of Assets and Liabilities. Interest payments made by a Fund to counterparties are recorded as a component of interest expense on the Statements of Operations. In periods of increased demand for the security, a Fund may receive a fee for use of the security by the counterparty, which may result in interest income to the Fund. In the event the buyer of securities under a reverse repurchase agreement files for bankruptcy or becomes insolvent, a Fund’s use of the proceeds of the agreement may be restricted pending a determination by the other party, or its trustee or receiver, whether to enforce a Fund’s obligation to repurchase the securities. Reverse repurchase agreements involve leverage risk and also the risk that the market value of the securities to be repurchased may decline below the repurchase price.
(c) Sale-Buybacks
A sale-buyback financing transaction consists of a sale of a security by a Fund to a financial institution, the counterparty, with a simultaneous agreement to repurchase the same or substantially the same security at an agreed-upon price and date. A Fund is not entitled to receive principal and interest payments, if any, made on the security sold to the counterparty during the term of the agreement. The agreed-upon proceeds for securities to be repurchased by a Fund are reflected as a liability on the Statements of Assets and Liabilities. A Fund will recognize net income represented by the price differential between the price received for the transferred security and the agreed-upon repurchase price. This is commonly referred to as the ‘price drop.’ A price drop consists of (i) the foregone interest and inflationary income adjustments, if any, a Fund would have otherwise received had the security not been sold and (ii) the negotiated financing terms between a Fund and counterparty. Foregone interest and inflationary income adjustments, if any, are recorded as components of interest income on the Statements of Operations. Interest payments based upon negotiated financing terms made by a Fund to counterparties are recorded as a component of interest expense on the Statements of Operations. In periods of increased demand for the security, a Fund may receive a fee for use of the security by the counterparty, which may result in interest income to the Fund. Sale-buybacks involve leverage
risk and also the risk that the market value of the securities to be repurchased may decline below the repurchase price.
(d) Short Sales
Short sales are transactions in which a Fund sells a security that it may not own. A Fund may make short sales of securities to (i) offset potential declines in long positions in similar securities, (ii) to increase the flexibility of the Fund, (iii) for investment return, (iv) as part of a risk arbitrage strategy, and (v) as part of its overall portfolio management strategies involving the use of derivative instruments. When a Fund engages in a short sale, it may borrow the security sold short and deliver it to the counterparty. A Fund will ordinarily have to pay a fee or premium to borrow a security and be obligated to repay the lender of the security any dividend or interest that accrues on the security during the period of the loan. Securities sold in short sale transactions and the dividend or interest payable on such securities, if any, are reflected as payable for short sales on the Statements of Assets and Liabilities. Short sales expose a Fund to the risk that it will be required to cover its short position at a time when the security or other asset has appreciated in value, thus resulting in losses to a Fund. A short sale is “against the box” if a Fund holds in its portfolio or has the right to acquire the security sold short, or securities identical to the security sold short, at no additional cost. A Fund will be subject to additional risks to the extent that it engages in short sales that are not “against the box.” A Fund’s loss on a short sale could theoretically be unlimited in cases where a Fund is unable, for whatever reason, to close out its short position.
6. FINANCIAL DERIVATIVE INSTRUMENTS
The Funds may enter into the financial derivative instruments described below to the extent permitted by each Fund’s respective investment policies.
The following disclosures contain information on how and why the Funds use financial derivative instruments, and how financial derivative instruments affect the Funds’ financial position, results of operations and cash flows. The location and fair value amounts of these instruments on the Statements of Assets and Liabilities and the net realized gain (loss) and net change in unrealized appreciation (depreciation) on the Statements of Operations, each categorized by type of financial derivative contract and related risk exposure, are included in a table in the Notes to Schedules of Investments. The financial derivative instruments outstanding as of period end and the amounts of net realized gain (loss) and net change in unrealized appreciation (depreciation) on financial derivative instruments during the period, as disclosed in the Notes to Schedules of Investments, serve as indicators of the volume of financial derivative activity for the Funds.
| | | | | | |
| 128 | | PIMCO CLOSED-END FUNDS | | | | |
PIMCO Global StocksPLUS
& Income Fund is subject to regulation as a commodity pool under the Commodity Exchange Act pursuant to recent rule changes by the Commodity Futures Trading Commission (the “CFTC”). The Manager has registered with the CFTC as a Commodity Pool Operator and a Commodity Trading Adviser with respect to the Fund, and is a member of the National Futures Association. As a result, additional CFTC-mandated disclosure, reporting and recordkeeping obligations apply to PIMCO Global StocksPLUS
& Income Fund.
(a) Forward Foreign Currency Contracts
may be engaged, in connection with settling planned purchases or sales of securities, to hedge the currency exposure associated with some or all of a Fund’s securities or as part of an investment strategy. A forward foreign currency contract is an agreement between two parties to buy and sell a currency at a set price on a future date. The market value of a forward foreign currency contract fluctuates with changes in foreign currency exchange rates. Forward foreign currency contracts are marked to market daily, and the change in value is recorded by a Fund as an unrealized gain (loss). Realized gains (losses) are equal to the difference between the value of the contract at the time it was opened and the value at the time it was closed and are recorded upon delivery or receipt of the currency. The contractual obligations of a buyer or seller of a forward foreign currency contract may generally be satisfied by taking or making physical delivery of the underlying currency, establishing an opposite position in the contract and recognizing the profit or loss on both positions simultaneously on the delivery date or, in some instances, paying a cash settlement before the designated date of delivery. These contracts may involve market risk in excess of the unrealized gain (loss) reflected on the Statements of Assets and Liabilities. Although forwards may be intended to minimize the risk of loss due to a decline in the value of the hedged currencies, at the same time, they tend to limit any potential gain which might result should the value of such currencies increase. In addition, a Fund could be exposed to risk if the counterparties are unable to meet the terms of the contracts or if the value of the currency changes unfavorably to the U.S. dollar. To mitigate such risk, cash or securities may be exchanged as collateral pursuant to the terms of the underlying contracts.
(b) Futures Contracts
are agreements to buy or sell a security or other asset for a set price on a future date and are traded on an exchange. A Fund may use futures contracts to manage its exposure to the securities markets or to movements in interest rates and currency values or for other investment purposes. Generally, a futures contract provides for the future sale by one party and purchase by another party of a specified quantity of the security or other financial instrument at a specified price and time. The primary risks associated with the use of futures contracts are the imperfect correlation between the change in
market value of the securities held by a Fund and the prices of futures contracts and the possibility of an illiquid market. Futures contracts are valued based upon their quoted daily settlement prices. Upon entering into a futures contract, a Fund is required to deposit with its futures broker an amount of cash, U.S. Government and Agency Obligations, or select sovereign debt, in accordance with the initial margin requirements of the broker or exchange. Futures contracts are marked to market daily and based on changes in the price of the contracts, a Fund pays or receives cash or other eligible assets equal to the daily change in the value of the contract (“variation margin”). Futures Variation Margins, if any, are disclosed within centrally cleared financial derivative instruments on the Statements of Assets and Liabilities. Gains (losses) are recognized but not considered realized until the contracts expire or close. Futures contracts involve, to varying degrees, risk of loss in excess of the variation margin included within exchange traded or centrally cleared financial derivative instruments on the Statements of Assets and Liabilities.
(c) Options Contracts
An option on an instrument (or an index) is a contract that gives the holder of the option, in return for a premium, the right to buy from (in the case of a call) or sell to (in the case of a put) the writer of the option the instrument underlying the option (or the cash value of the index) at a specified exercise price at any time during the term of the option. Writing put options tends to increase a Fund’s exposure to the underlying instrument. Writing call options tends to decrease a Fund’s exposure to the underlying instrument. When a Fund writes a call or put, an amount equal to the premium received is recorded and subsequently marked to market to reflect the current value of the option written. These amounts are included on the Statements of Assets and Liabilities. Premiums received from writing options which expire are treated as realized gains. Premiums received from writing options which are exercised or closed are added to the proceeds or offset against amounts paid on the underlying futures, swap, security or currency transaction to determine the realized gain (loss). Certain options may be written with premiums to be determined on a future date. The premiums for these options are based upon implied volatility parameters at specified terms. A Fund as a writer of an option has no control over whether the underlying instrument may be sold (“call”) or purchased (“put”) and as a result bears the market risk of an unfavorable change in the price of the instrument underlying the written option. There is the risk a Fund may not be able to enter into a closing transaction because of an illiquid market.
Purchasing call options tends to increase a Fund’s exposure to the underlying instrument. Purchasing put options tends to decrease a Fund’s exposure to the underlying instrument. A Fund pays a premium which is included as an asset on the Statements of Assets and Liabilities and subsequently marked to market to reflect the current
| | | | | | | | | | | | |
| | | | ANNUAL REPORT | | | | | | | JUNE 30, 2022 | | | 129 |
| | | | |
Notes to Financial Statements | | | | |
value of the option. Premiums paid for purchasing options which expire are treated as realized losses. Certain options may be purchased with premiums to be determined on a future date. The premiums for these options are based upon implied volatility parameters at specified terms. The risk associated with purchasing put and call options is limited to the premium paid. Premiums paid for purchasing options which are exercised or closed are added to the amounts paid or offset against the proceeds on the underlying investment transaction to determine the realized gain (loss) when the underlying transaction is executed.
Interest Rate Swaptions
may be written or purchased to enter into a
pre-defined
swap agreement or to shorten, extend, cancel or otherwise modify an existing swap agreement, by some specified date in the future. The writer of the swaption becomes the counterparty to the swap if the buyer exercises. The interest rate swaption agreement will specify whether the buyer of the swaption will be a fixed-rate receiver or a fixed-rate payer upon exercise.
Options on Exchange-Traded Funds
use a specified exchange-traded fund as the underlying instrument for the option contract. A Fund may write or purchase options to enhance returns or to hedge an existing position or future investment.
Options on Exchange-Traded Futures Contracts
(“Futures Option”) may be written or purchased to hedge an existing position or future investment, for speculative purposes or to manage exposure to market movements. A Futures Option is an option contract in which the underlying instrument is a single futures contract.
Options on Securities
may be written or purchased to enhance returns or to hedge an existing position or future investment. An option on a security uses a specified security as the underlying instrument for the option contract.
(d) Swap Agreements
are bilaterally negotiated agreements between a Fund and a counterparty to exchange or swap investment cash flows, assets, foreign currencies or market-linked returns at specified, future intervals. Swap agreements may be privately negotiated in the over the counter market (“OTC swaps”) or may be cleared through a third party, known as a central counterparty or derivatives clearing organization (“Centrally Cleared Swaps”). A Fund may enter into asset, credit default, cross-currency, interest rate, total return, variance and other forms of swap agreements to manage its exposure to credit, currency, interest rate, commodity, equity and inflation risk. In connection with these agreements, securities or cash may be identified as collateral or margin in accordance with the terms of the respective swap agreements to provide assets of value and recourse in the event of default or bankruptcy/insolvency.
Centrally Cleared Swaps are marked to market daily based upon valuations as determined from the underlying contract or in accordance with the requirements of the central counterparty or derivatives clearing organization. Changes in market value, if any, are reflected as a component of net change in unrealized appreciation (depreciation) on the Statements of Operations. Daily changes in valuation of centrally cleared swaps, if any, are recorded as variation margin on the Statements of Assets and Liabilities. Centrally Cleared and OTC swap payments received or paid at the beginning of the measurement period are included on the Statements of Assets and Liabilities and represent premiums paid or received upon entering into the swap agreement to compensate for differences between the stated terms of the swap agreement and prevailing market conditions (credit spreads, currency exchange rates, interest rates, and other relevant factors). Upfront premiums received (paid) are initially recorded as liabilities (assets) and subsequently marked to market to reflect the current value of the swap. These upfront premiums are recorded as realized gain (loss) on the Statements of Operations upon termination or maturity of the swap. A liquidation payment received or made at the termination of the swap is recorded as realized gain (loss) on the Statements of Operations. Net periodic payments received or paid by a Fund are included as part of realized gain (loss) on the Statements of Operations.
For purposes of a Fund’s investment policy adopted pursuant to Rule
35d-1
under the Act (if any), the Fund will account for derivative instruments at market value. For purposes of applying a Fund’s other investment policies and restrictions, swap agreements, like other derivative instruments, may be valued by a Fund at market value, notional value or full exposure value (i.e., the sum of the notional amount for the contract plus the market value) or any combination of the foregoing (e.g., notional value for purposes of calculating the numerator and market value for purposes of calculating the denominator for compliance with a particular policy or restriction). See Note 6 — Asset Segregation below. In the case of a credit default swap, in applying certain of a Fund’s investment policies and restrictions, the Funds will value the credit default swap at its notional value or its full exposure value (i.e., the sum of the notional amount for the contract plus the market value), but may value the credit default swap at market value for purposes of applying certain of a Fund’s other investment policies and restrictions. For example, a Fund may value credit default swaps at full exposure value for purposes of a Fund’s credit quality guidelines (if any) because such value in general better reflects a Fund’s actual economic exposure during the term of the credit default swap agreement. As a result, a Fund may, at times, have notional exposure to an asset class (before netting) that is greater or lesser than the stated limit or restriction noted in a Fund’s prospectus. In this context, both the notional amount and the market value may be positive or negative depending on whether a Fund is selling or buying
| | | | | | |
| 130 | | PIMCO CLOSED-END FUNDS | | | | |
protection through the credit default swap. The manner in which certain securities or other instruments are valued by a Fund for purposes of applying investment policies and restrictions may differ from the manner in which those investments are valued by other types of investors.
Entering into swap agreements involves, to varying degrees, elements of interest, credit, market and documentation risk in excess of the amounts recognized on the Statements of Assets and Liabilities. Such risks involve the possibility that there will be no liquid market for these agreements, that the counterparty to the agreements may default on its obligation to perform or disagree as to the meaning of contractual terms in the agreements and that there may be unfavorable changes in interest rates or the values of the asset upon which the swap is based.
A Fund’s maximum risk of loss from counterparty credit risk is the discounted net value of the cash flows to be received from the counterparty over the contract’s remaining life, to the extent that amount is positive. The risk may be mitigated by having a master netting arrangement between a Fund and the counterparty and by the posting of collateral to a Fund to cover a Fund’s exposure to the counterparty.
To the extent a Fund has a policy to limit the net amount owed to or to be received from a single counterparty under existing swap agreements, such limitation only applies to counterparties to OTC swaps and does not apply to centrally cleared swaps where the counterparty is a central counterparty or derivatives clearing organization.
Credit Default Swap Agreements
on corporate, loan, sovereign, U.S. municipal or U.S. Treasury issues are entered into to provide a measure of protection against defaults of the issuers (
i.e.,
to reduce risk where a Fund owns or has exposure to the referenced obligation) or to take an active long or short position with respect to the likelihood of a particular issuer’s default. Credit default swap agreements involve one party making a stream of payments (referred to as the buyer of protection) to another party (the seller of protection) in exchange for the right to receive a specified return in the event that the referenced entity, obligation or index, as specified in the swap agreement, undergoes a certain credit event. As a seller of protection on credit default swap agreements, a Fund will generally receive from the buyer of protection a fixed rate of income throughout the term of the swap provided that there is no credit event. As the seller, a Fund would effectively add leverage to its portfolio because, in addition to its total net assets, a Fund would be subject to investment exposure on the notional amount of the swap.
If a Fund is a seller of protection and a credit event occurs, as defined under the terms of that particular swap agreement, a Fund will either (i) pay to the buyer of protection an amount equal to the notional
amount of the swap and take delivery of the referenced obligation, other deliverable obligations or underlying securities comprising the referenced index or (ii) pay a net settlement amount in the form of cash or securities equal to the notional amount of the swap less the recovery value of the referenced obligation or underlying securities comprising the referenced index. If a Fund is a buyer of protection and a credit event occurs, as defined under the terms of that particular swap agreement, a Fund will either (i) receive from the seller of protection an amount equal to the notional amount of the swap and deliver the referenced obligation, other deliverable obligations or underlying securities comprising the referenced index or (ii) receive a net settlement amount in the form of cash or securities equal to the notional amount of the swap less the recovery value of the referenced obligation or underlying securities comprising the referenced index. Recovery values are estimated by market makers considering either industry standard recovery rates or entity specific factors and considerations until a credit event occurs. If a credit event has occurred, the recovery value is determined by a facilitated auction whereby a minimum number of allowable broker bids, together with a specified valuation method, are used to calculate the settlement value. The ability to deliver other obligations may result in a
option (the buyer of protection’s right to choose the deliverable obligation with the lowest value following a credit event).
Credit default swap agreements on corporate or sovereign issues involve one party making a stream of payments to another party in exchange for the right to receive a specified return in the event of a default or other credit event. If a credit event occurs and cash settlement is not elected, a variety of other deliverable obligations may be delivered in lieu of the specific referenced obligation. The ability to deliver other obligations may result in a
option (the buyer of protection’s right to choose the deliverable obligation with the lowest value following a credit event).
Credit default swap agreements on asset-backed securities involve one party making a stream of payments to another party in exchange for the right to receive a specified return in the event that the referenced entity, obligation or index, as specified in the agreement, undergoes a certain credit event. Unlike credit default swaps on corporate, loan, sovereign, U.S. municipal or U.S. Treasury issues, deliverable obligations in most instances would be limited to the specific referenced obligation, or in some cases, specific tranches of the specified reference obligation, as performance for asset-backed securities can vary across deals. Prepayments, principal paydowns, and other writedown or loss events on the underlying mortgage loans will reduce the outstanding principal balance of the referenced obligation. These reductions may be temporary or permanent as defined under the terms of the swap agreement and the notional amount for the swap
| | | | | | | | | | | | |
| | | | ANNUAL REPORT | | | | | | | JUNE 30, 2022 | | | 131 |
| | | | |
Notes to Financial Statements | | | | |
agreement will be adjusted by corresponding amounts. A Fund may use credit default swaps on asset-backed securities to provide a measure of protection against defaults of the referenced obligation or to take an active long or short position with respect to the likelihood of a particular referenced obligation’s default.
Credit default swap agreements on credit indices involve one party making a stream of payments to another party in exchange for the right to receive a specified return in the event of a write-down, principal shortfall, interest shortfall or default of all or part of the referenced entities comprising the credit index. A credit index is a basket of credit instruments or exposures designed to be representative of some part of the credit market as a whole. These indices are made up of reference credits that are judged by a poll of dealers to be the most liquid entities in the credit default swap market based on the sector of the index. Components of the indices may include, but are not limited to, investment grade securities, high yield securities, asset-backed securities, emerging markets, and/or various credit ratings within each sector. Credit indices are traded using credit default swaps with standardized terms including a fixed spread and standard maturity dates. An index credit default swap references all the names in the index, and if there is a default, the credit event is settled based on that name’s weight in the index. The composition of the indices changes periodically, usually every six months, and for most indices, each name has an equal weight in the index. Credit default swaps on credit indices may be used to hedge a portfolio of credit default swaps or bonds, which is less expensive than it would be to buy many credit default swaps to achieve a similar effect. Credit default swaps on indices are instruments for protecting investors owning bonds against default, and traders use them to speculate on changes in credit quality.
Implied credit spreads, represented in absolute terms, utilized in determining the market value of credit default swap agreements on corporate, loan, sovereign, U.S. municipal or U.S. Treasury issues as of period end, if any, are disclosed in the Notes to Schedules of Investments. They serve as an indicator of the current status of payment/performance risk and represent the likelihood or risk of default for the reference entity. The implied credit spread of a particular referenced entity reflects the cost of buying/selling protection and may include upfront payments required to be made to enter into the agreement. Wider credit spreads represent a deterioration of the referenced entity’s credit soundness and a greater likelihood or risk of default or other credit event occurring as defined under the terms of the agreement. For credit default swap agreements on asset-backed securities and credit indices, the quoted market prices and resulting values serve as the indicator of the current status of the payment/performance risk. Increasing market values, in absolute terms when compared to the notional amount of the swap, represent a
deterioration of the referenced entity’s credit soundness and a greater likelihood or risk of default or other credit event occurring as defined under the terms of the agreement.
The maximum potential amount of future payments (undiscounted) that a Fund as a seller of protection could be required to make under a credit default swap agreement equals the notional amount of the agreement. Notional amounts of each individual credit default swap agreement outstanding as of period end for which a Fund is the seller of protection are disclosed in the Notes to Schedules of Investments. These potential amounts would be partially offset by any recovery values of the respective referenced obligations, upfront payments received upon entering into the agreement, or net amounts received from the settlement of buy protection credit default swap agreements entered into by a Fund for the same referenced entity or entities.
Interest Rate Swap Agreements
may be entered into to help hedge against interest rate risk exposure and to maintain a Fund’s ability to generate income at prevailing market rates. The value of the fixed rate bonds that the Funds hold may decrease if interest rates rise. To help hedge against this risk and to maintain its ability to generate income at prevailing market rates, a Fund may enter into interest rate swap agreements. Interest rate swap agreements involve the exchange by a Fund with another party for their respective commitment to pay or receive interest on the notional amount of principal. Certain forms of interest rate swap agreements may include: (i) interest rate caps, under which, in return for a premium, one party agrees to make payments to the other to the extent that interest rates exceed a specified rate, or “cap”, (ii) interest rate floors, under which, in return for a premium, one party agrees to make payments to the other to the extent that interest rates fall below a specified rate, or “floor”, (iii) interest rate collars, under which a party sells a cap and purchases a floor or vice versa in an attempt to protect itself against interest rate movements exceeding given minimum or maximum levels, (iv) callable interest rate swaps, under which the buyer pays an upfront fee in consideration for the right to early terminate the swap transaction in whole, at zero cost and at a predetermined date and time prior to the maturity date, (v) spreadlocks, which allow the interest rate swap users to lock in the forward differential (or spread) between the interest rate swap rate and a specified benchmark, or (vi) basis swaps, under which two parties can exchange variable interest rates based on different segments of money markets.
Total Return Swap Agreements
are entered into to gain or mitigate exposure to the underlying reference asset. Total return swap agreements involve commitments where single or multiple cash flows are exchanged based on the price of an underlying reference asset and on a fixed or variable interest rate. Total return swap agreements may involve commitments to pay interest in exchange for a market-linked
| | | | | | |
| 132 | | PIMCO CLOSED-END FUNDS | | | | |
return. One counterparty pays out the total return of a specific underlying reference asset, which may include a single security, a basket of securities, or an index, and in return receives a fixed or variable rate. At the maturity date, a net cash flow is exchanged where the total return is equivalent to the return of the underlying reference asset less a financing rate, if any. As a receiver, a Fund would receive payments based on any net positive total return and would owe payments in the event of a net negative total return. As the payer, a Fund would owe payments on any net positive total return, and would receive payments in the event of a net negative total return. A Fund’s use of a total return swap exposes the Fund to credit loss in the event of nonperformance by the swap counterparty. Risk may also arise from the unanticipated movements in value of exchange rates, interest rates, securities, or the index.
(e) Asset Segregation
Certain transactions described above can be viewed as constituting a form of borrowing or financing transaction by a Fund. In such event, a Fund will cover its obligation under such transactions by segregating or “earmarking” assets in accordance with procedures adopted by the Board, in which case such transactions will not be considered “senior securities” by a Fund. With respect to forwards, futures contracts, options and swaps that are contractually required to cash settle (i.e., where physical delivery of the underlying reference asset is not
permitted), a Fund (other than PIMCO Dynamic Income Fund and PIMCO Dynamic Income Opportunities Fund) is permitted to segregate or earmark liquid assets equal to a Fund’s daily
net obligation under the derivative instrument, if any, rather than the derivative’s full notional value. For PIMCO Dynamic Income Fund and PIMCO Dynamic Income Opportunities Fund, with respect to forwards and futures contracts and interest rate swaps that are contractually required to cash settle (i.e., where physical delivery of the underlying reference asset is not permitted), the Fund is permitted to segregate or earmark liquid assets equal to the Fund’s daily
net obligation under the derivative instrument, if any, rather than the derivative’s full notional value, but may segregate full notional value, as applicable, with respect to certain other derivative instruments (including written credit default swaps and written options) that contractually require or permit physical delivery of securities or other underlying assets. By segregating or earmarking liquid assets equal to only its net
obligation under certain derivatives that are required to cash settle, a Fund will have the ability to employ leverage to a greater extent than if a Fund were to segregate or earmark liquid assets equal to the full notional value of the derivative. Except as otherwise described in the principal investment strategies for the Fund, the Fund will no longer be required to engage in asset segregation or cover techniques as of August 19, 2022.
7. PRINCIPAL AND OTHER RISKS
In the normal course of business, the Funds trade financial instruments and enter into financial transactions where risk of potential loss exists due to such things as changes in the market (market risk) or failure or inability of the other party to a transaction to perform (credit and counterparty risk). See below for a detailed description of select principal risks. For a complete list of the principal risks the Funds may be subject to, please see the Principal Risks of the Funds section of this report.
| | | | | | | | | | | | | | | | | | | | | | | | | | | | |
| | | | | | | | | PIMCO
Access
Income
Fund (PAXS) | | | PIMCO
Dynamic
Income
Fund (PDI) | | | PIMCO
Dynamic
Income
Opportunities
Fund (PDO) | | | PIMCO Global StocksPLUS & Income Fund (PGP) | | | PIMCO
Strategic
Income Fund,
Inc. (RCS) | |
| | | | | | | |
| Asset Allocation Risk | | | | | | | — | | | | X | | | | X | | | | X | | | | — | | | | — | |
| | | | | | | |
| Call Risk | | | | | | | X | | | | X | | | | X | | | | X | | | | X | | | | X | |
| | | | | | | |
| Collateralized Bond Obligations, Collateralized Loan Obligations and Collateralized Debt Obligations Risk | | | | | | | — | | | | X | | | | X | | | | — | | | | — | | | | — | |
| | | | | | | |
| Collateralized Loan Obligations Risk | | | | | | | X | | | | — | | | | — | | | | X | | | | X | | | | X | |
| | | | | | | |
| Confidential Information Access Risk | | | | | | | — | | | | X | | | | X | | | | X | | | | — | | | | — | |
| | | | | | | |
| Contingent Convertible Securities Risk | | | | | | | X | | | | X | | | | X | | | | X | | | | X | | | | X | |
| | | | | | | |
| Convertible Securities Risk | | | | | | | — | | | | X | | | | X | | | | X | | | | — | | | | — | |
| | | | | | | |
| Counterparty Risk | | | | | | | X | | | | X | | | | X | | | | X | | | | X | | | | X | |
| | | | | | | |
| “Covenant-lite” Obligations Risk | | | | | | | — | | | | X | | | | X | | | | X | | | | — | | | | — | |
| | | | | | | |
| Credit Default Swaps Risk | | | | | | | X | | | | X | | | | X | | | | X | | | | X | | | | X | |
| | | | | | | |
| Credit Risk | | | | | | | X | | | | X | | | | X | | | | X | | | | X | | | | X | |
| | | | | | | |
| Currency Risk | | | | | | | — | | | | X | | | | X | | | | X | | | | — | | | | — | |
| | | | | | | |
| Cyber Security Risk | | | | | | | X | | | | X | | | | X | | | | X | | | | X | | | | X | |
| | | | | | | |
| Derivatives Risk | | | | | | | X | | | | X | | | | X | | | | X | | | | X | | | | X | |
| | | | | | | |
| Distressed and Defaulted Securities Risk | | | | | | | — | | | | X | | | | X | | | | X | | | | — | | | | — | |
| | | | | | | |
| Distribution Risk | | | | | | | X | | | | — | | | | X | | | | X | | | | X | | | | X | |
| | | | | | | |
| Emerging Markets Risk | | | | | | | X | | | | X | | | | X | | | | X | | | | X | | | | X | |
| | | | | | | | | | | | |
| | | | ANNUAL REPORT | | | | | | | JUNE 30, 2022 | | | 133 |
| | | | |
Notes to Financial Statements | | | | |
| | | | | | | | | | | | | | | | | | | | | | | | | | | | |
| | | | | | PCM
Fund,
Inc. (PCM) | | | PIMCO
Access
Income
Fund (PAXS) | | | PIMCO
Dynamic
Income
Fund (PDI) | | | PIMCO
Dynamic
Income
Opportunities
Fund (PDO) | | | PIMCO Global StocksPLUS & Income Fund (PGP) | | | PIMCO
Strategic
Income Fund,
Inc. (RCS) | |
| | | | | | | |
| Equity Securities and Related Market Risk | | | | | | | X | | | | X | | | | X | | | | X | | | | X | | | | X | |
| | | | | | | |
| Focused Investment Risk | | | | | | | — | | | | X | | | | X | | | | X | | | | — | | | | — | |
| | | | | | | |
Foreign (Non-U.S.) Investment Risk | | | | | | | X | | | | X | | | | X | | | | X | | | | X | | | | X | |
| | | | | | | |
| Foreign Loan Originations Risk | | | | | | | — | | | | X | | | | X | | | | — | | | | — | | | | — | |
| | | | | | | |
| High Yield Securities Risk | | | | | | | X | | | | X | | | | X | | | | X | | | | X | | | | X | |
| | | | | | | |
| Inflation/Deflation Risk | | | | | | | X | | | | X | | | | X | | | | X | | | | X | | | | X | |
| | | | | | | |
| Inflation-Indexed Security Risk | | | | | | | X | | | | X | | | | X | | | | X | | | | X | | | | X | |
| | | | | | | |
| Interest Rate Risk | | | | | | | X | | | | X | | | | X | | | | X | | | | X | | | | X | |
| | | | | | | |
| Issuer Risk | | | | | | | X | | | | X | | | | X | | | | X | | | | X | | | | X | |
| | | | | | | |
Issuer Non-Diversification Risk | | | | | | | — | | | | X | | | | — | | | | X | | | | — | | | | — | |
| | | | | | | |
| Leverage Risk | | | | | | | X | | | | X | | | | X | | | | X | | | | X | | | | X | |
| | | | | | | |
| Limited Term Risk | | | | | | | — | | | | X | | | | — | | | | X | | | | — | | | | — | |
| | | | | | | |
| Liquidity Risk | | | | | | | X | | | | X | | | | X | | | | X | | | | X | | | | X | |
| | | | | | | |
| Loan Origination Risk | | | | | | | — | | | | X | | | | X | | | | — | | | | — | | | | — | |
| | | | | | | |
| Loans and Other Indebtedness; Loan Participations and Assignments Risk | | | | | | | X | | | | X | | | | X | | | | X | | | | X | | | | — | |
| | | | | | | |
| Management Risk | | | | | | | X | | | | X | | | | X | | | | X | | | | X | | | | X | |
| | | | | | | |
| Market Discount Risk | | | | | | | — | | | | X | | | | X | | | | X | | | | — | | | | — | |
| | | | | | | |
| Market Disruptions Risk | | | | | | | X | | | | X | | | | X | | | | X | | | | X | | | | X | |
| | | | | | | |
| Market Risk | | | | | | | X | | | | X | | | | X | | | | X | | | | X | | | | X | |
| | | | | | | |
| Mortgage-Related and Other Asset-Backed Securities Risk | | | | | | | X | | | | X | | | | X | | | | X | | | | X | | | | X | |
| | | | | | | |
| Mortgage-Related Derivative Instruments Risk | | | | | | | — | | | | X | | | | X | | | | X | | | | — | | | | — | |
| | | | | | | |
| New/Small Fund Risk | | | | | | | — | | | | X | | | | — | | | | X | | | | — | | | | — | |
| | | | | | | |
| Operational Risk | | | | | | | X | | | | X | | | | X | | | | X | | | | X | | | | X | |
| | | | | | | |
| Other Investment Companies Risk | | | | | | | X | | | | X | | | | X | | | | X | | | | X | | | | X | |
| | | | | | | |
| Platform Risk | | | | | | | — | | | | X | | | | X | | | | X | | | | — | | | | — | |
| | | | | | | |
| Potential Conflicts of Interest Risk—Allocation of Investment Opportunities | | | | | | | — | | | | X | | | | X | | | | X | | | | — | | | | — | |
| | | | | | | |
| Portfolio Turnover Risk | | | | | | | X | | | | X | | | | X | | | | X | | | | X | | | | X | |
| | | | | | | |
| Preferred Securities Risk | | | | | | | X | | | | X | | | | X | | | | X | | | | X | | | | X | |
| | | | | | | |
| Privacy and Data Security Risk | | | | | | | — | | | | X | | | | X | | | | X | | | | — | | | | — | |
| | | | | | | |
| Private Placements Risk | | | | | | | X | | | | X | | | | X | | | | X | | | | X | | | | X | |
| | | | | | | |
| Privately-Issued Mortgage-Related Securities Risk | | | | | | | X | | | | X | | | | X | | | | X | | | | X | | | | X | |
| | | | | | | |
| Real Estate Risk | | | | | | | — | | | | X | | | | X | | | | X | | | | — | | | | — | |
| | | | | | | |
| Regulatory Changes Risk | | | | | | | X | | | | X | | | | X | | | | X | | | | X | | | | X | |
| | | | | | | |
| Regulatory Risk—Commodity Pool Operator | | | | | | | X | | | | X | | | | X | | | | X | | | | — | | | | — | |
| | | | | | | |
| Regulatory Risk—LIBOR | | | | | | | X | | | | X | | | | X | | | | X | | | | X | | | | X | |
| | | | | | | |
| Regulation S Securities Risk | | | | | | | — | | | | X | | | | — | | | | — | | | | — | | | | — | |
| | | | | | | |
| Reinvestment Risk | | | | | | | X | | | | X | | | | X | | | | X | | | | X | | | | X | |
| | | | | | | |
| REIT Risk | | | | | | | — | | | | X | | | | X | | | | — | | | | — | | | | — | |
| | | | | | | |
| Repurchase Agreements Risk | | | | | | | X | | | | X | | | | X | | | | X | | | | X | | | | X | |
| | | | | | | |
| Restricted Securities Risk | | | | | | | X | | | | X | | | | X | | | | X | | | | X | | | | X | |
| | | | | | | |
| Risk Retention Investment Risk | | | | | | | — | | | | X | | | | X | | | | — | | | | — | | | | — | |
| | | | | | | |
| Securities Lending Risk | | | | | | | — | | | | — | | | | X | | | | — | | | | — | | | | — | |
| | | | | | | |
| Segregation and Coverage Risk | | | | | | | X | | | | X | | | | X | | | | X | | | | X | | | | X | |
| | | | | | | |
| Senior Debt Risk | | | | | | | X | | | | X | | | | X | | | | X | | | | X | | | | X | |
| | | | | | | |
| Short Exposure Risk | | | | | | | — | | | | — | | | | X | | | | — | | | | — | | | | — | |
| | | | | | | |
| Smaller Company Risk | | | | | | | — | | | | — | | | | X | | | | — | | | | — | | | | — | |
| | | | | | | |
| Sovereign Debt Risk | | | | | | | X | | | | X | | | | X | | | | X | | | | X | | | | X | |
| | | | | | | |
| Special Purpose Acquisition Companies (“SPACs”) Risk | | | | | | | — | | | | — | | | | X | | | | — | | | | — | | | | — | |
| | | | | | | |
| Structured Investments Risk | | | | | | | X | | | | X | | | | X | | | | X | | | | X | | | | X | |
| | | | | | | |
| Subprime Risk | | | | | | | — | | | | X | | | | X | | | | X | | | | — | | | | — | |
| | | | | | | |
| Subsidiary Risk | | | | | | | — | | | | X | | | | X | | | | X | | | | — | | | | — | |
| | | | | | | |
| Synthetic Convertible Securities Risk | | | | | | | — | | | | X | | | | X | | | | X | | | | — | | | | — | |
| | | | | | | |
| Tax Risk | | | | | | | X | | | | X | | | | X | | | | X | | | | X | | | | X | |
| | | | | | | |
| U.S. Government Securities Risk | | | | | | | X | | | | X | | | | X | | | | X | | | | X | | | | X | |
| | | | | | | |
| Valuation Risk | | | | | | | X | | | | X | | | | X | | | | X | | | | X | | | | X | |
| | | | | | | |
Zero-Coupon Bond, Step-Ups and Securities Risk | | | | | | | — | | | | X | | | | X | | | | X | | | | — | | | | — | |
Asset Allocation Risk
is the risk that a Fund could lose money as a result of less than optimal or poor asset allocation decisions. A Fund could miss attractive investment opportunities by underweighting markets that subsequently experience significant returns and could lose value by overweighting markets that subsequently experience significant declines.
Call Risk
is the risk that an issuer may exercise its right to redeem a fixed income security earlier than expected (a call). Issuers may call outstanding securities prior to their maturity for a number of reasons (
declining interest rates, changes in credit spreads and improvements in the issuer’s credit quality). If an issuer calls a security that the Fund has invested in, the Fund may not recoup the full amount of its initial investment and may be forced to reinvest in lower-yielding securities, securities with greater credit risks or securities with other, less favorable features.
Collateralized Bond Obligations, Collateralized Loan Obligations and Collateralized Debt Obligations Risk
is the risk that an investment in a CLO, CBO or other CDO depends largely on the type of the collateral securities and the class/tranche of the instrument in which the Fund invests. In addition to the normal risks associated with debt instruments (e.g., interest rate risk and credit risk), CLOs, CBOs and CDOs carry additional risks including, but not limited to: (i) the possibility that distributions from the collateral will not be adequate to make interest or other payments; (ii) the risk that the quality of the collateral may decline in value or default; (iii) the risk that the Fund may invest in CBOs, CLOs or other CDOs that are subordinate to other classes; and (iv) the risk that the complex structure of the security may not be fully understood at the time of investment and may produce disputes with the issuer or others and may produce unexpected investment results.
Collateralized Loan Obligations Risk
is the risk of investing in a trust typically collateralized by a pool of loans issued by banks, corporations or any other public or private entity or person, which may include, among others, domestic and foreign senior secured loans, senior unsecured loans and subordinate or mezzanine loans, including loans that may be rated below investment grade or equivalent unrated loans (“Collateralized Loan Obligations Risk”) or (“CLOs”). In addition to the normal risks associated with debt instruments (e.g., interest rate risk and credit risk), CLOs carry additional risks including, but not limited to:
(i) the possibility that distributions from the collateral will not be adequate to make interest or other payments; (ii) the risk that the quality of the collateral may decline in value or default; (iii) the risk that the Fund may invest in CBOs, CLOs or other CDOs that are subordinate to other classes; and (iv) the complex structure of the security may not be fully understood at the time of investment and may produce disputes with the issuer or others and may produce unexpected investment results.
Confidential Information Access Risk
is the risk that, in managing the Fund (and other PIMCO clients), PIMCO may from time to time have the opportunity to receive material,
non-public
information (“Confidential Information”) about the issuers of certain investments, including, without limitation, senior floating rate loans, other loans and related investments being considered for acquisition by the Fund or held in the Fund’s portfolio. If PIMCO intentionally or unintentionally comes into possession of Confidential Information, it may be unable, potentially for a substantial period of time, to purchase or sell investments to which such Confidential Information relates.
Contingent Convertible Securities Risk
is the risk of investing in contingent convertible securities, including the risk that interest payments will be cancelled by the issuer or a regulatory authority, the risk of ranking junior to other creditors in the event of a liquidation or other bankruptcy-related event as a result of holding subordinated debt, the risk of the Fund’s investment becoming further subordinated as a result of conversion from debt to equity, the risk that the principal amount due can be written down to a lesser amount, and the general risks applicable to fixed income investments, including interest rate risk, credit risk, market risk and liquidity risk, any of which could result in losses to the Fund.
Convertible Securities Risk
is the risk that the market values of convertible securities may decline as interest rates increase and, conversely, may increase as interest rates decline. A convertible security’s market value, however, tends to reflect the market price of the common stock of the issuing company when that stock price approaches or is greater than the convertible security’s “conversion price.” The conversion price is defined as the predetermined price at which the convertible security could be exchanged for the associated stock. As the market price of the underlying common stock declines, the price of the convertible security tends to be influenced more by the yield of the convertible security. Thus, it may not decline in price to the same extent as the underlying common stock. In the event of a liquidation of the issuing company, holders of convertible securities may be paid before the company’s common stockholders but after holders of any senior debt obligations of the company. Consequently, the issuer’s convertible securities generally entail less risk than its common stock but more risk than its debt obligations. Convertible securities are often rated below investment grade or not rated.
Counterparty Risk
is the risk that the Fund will be subject to credit risk with respect to the counterparties to the derivative contracts and other instruments entered into by the Fund or held by special purpose or structured vehicles in which the Fund invests. If a counterparty becomes bankrupt or otherwise fails to perform its obligations under a derivative contract due to financial difficulties, the Fund may experience significant delays in obtaining any recovery (including recovery of any
| | | | | |
Notes to Financial Statements | | | | |
collateral it has provided to the counterparty) in a dissolution, assignment for the benefit of creditors, liquidation,
winding-up,
bankruptcy, or other analogous proceeding.
“Covenant-Lite” Obligations Risk
is the risk that covenant-lite obligations contain fewer maintenance covenants than other obligations, or no maintenance covenants, and may not include terms that allow the lender to monitor the performance of the borrower and declare a default if certain criteria are breached. Covenant-lite loans may carry more risk than traditional loans as they allow individuals and corporations to engage in activities that would otherwise be difficult or impossible under a covenant-heavy loan agreement. In the event of default, covenant-lite loans may exhibit diminished recovery values as the lender may not have the opportunity to negotiate with the borrower prior to default.
Credit Default Swaps Risk
is the risk of investing in credit default swaps, including illiquidity risk, counterparty risk, leverage risk and credit risk. A buyer generally also will lose its investment and recover nothing should no credit event occur and the swap is held to its termination date. When the Fund acts as a seller of a credit default swap, it is exposed to many of the same risks of leverage described herein since if an event of default occurs, the seller must pay the buyer the full notional value of the reference obligation. In addition, selling credit default swaps may not be profitable for the Fund if no secondary market exists or the Fund is otherwise unable to close out these transactions at advantageous times.
Credit Risk
is the risk that the Fund could lose money if the issuer or guarantor of a fixed-income security, or the counterparty to a derivatives contract, repurchase agreement or a loan of portfolio securities, is unable or unwilling, or is perceived (whether by market participants, rating agencies, pricing services or otherwise) as unable or unwilling, to meet its financial obligations. Measures such as average credit quality may not accurately reflect the true credit risk of the Fund. This is especially the case if the Fund consists of securities with widely varying credit ratings.
Currency Risk
is the risk that investments denominated in foreign
(non-U.S.)
currencies or that trade in and receive revenues in, foreign
(non-U.S.)
currencies, or derivatives or other instruments that provide exposure to foreign
(non-U.S.)
currencies may decline in value, due to the risk that those currencies will decline in value relative to the U.S. dollar, or, in the case of hedging positions, that the U.S. dollar will decline in value relative to the currency being hedged.
Cyber Security Risk
As the use of technology has become more prevalent in the course of business, the Funds have become potentially more susceptible to operational and information security risks resulting from breaches in cyber security. A breach in cyber security refers to
both intentional and unintentional cyber events that may, among other things, cause a Fund to lose proprietary information, suffer data corruption and/or destruction or lose operational capacity, result in the unauthorized release or other misuse of confidential information, or otherwise disrupt normal business operations. Cyber security failures or breaches may result in financial losses to a Fund and its shareholders. These failures or breaches may also result in disruptions to business operations, potentially resulting in financial losses; interference with a Fund’s ability to calculate its net asset value, process shareholder transactions or otherwise transact business with shareholders; impediments to trading; violations of applicable privacy and other laws; regulatory fines; penalties; reputational damage; reimbursement or other compensation costs; additional compliance and cyber security risk management costs and other adverse consequences. In addition, substantial costs may be incurred in order to prevent any cyber incidents in the future.
Derivatives Risk
is the risk of investing in derivative instruments (such as futures, swaps and structured securities), including leverage, liquidity, interest rate, market, credit, management, counterparty, operational and legal risks and valuation complexity. Changes in the value of a derivative may not correlate perfectly with, and may be more sensitive to market events than, the underlying asset, rate or index, and the Fund could lose more than the initial amount invested. The Fund’s use of derivatives may result in losses to the Fund, a reduction in the Fund’s returns and/or increased volatility.
(“OTC”) derivatives are also subject to the risk that a counterparty to the transaction will not fulfill its contractual obligations to the other party, as many of the protections afforded to centrally-cleared derivative transactions might not be available for OTC derivatives. The primary credit risk on derivatives that are exchange-traded or traded through a central clearing counterparty resides with the Fund’s clearing broker, or the clearinghouse itself.
Distressed and Defaulted Securities Risk
is the risk of investing in the securities of financially distressed issuers, including the risk of default. These securities may fluctuate more in price and are typically less liquid. The Fund also will be subject to significant uncertainty as to when, and in what manner, and for what value obligations evidenced by securities of financially distressed issuers will eventually be satisfied.
Distribution Risk
is the risk that, to the extent the Fund seeks to maintain a level distribution rate, the Fund’s distribution rate may be affected by numerous factors, including but not limited to changes in realized and projected market returns, fluctuations in market interest rates, Fund performance, and other factors. For instance, during periods of low or declining interest rates, the Fund’s distributable income and dividend levels may decline for many reasons. There can be
no assurance that a change in market conditions or other factors will not result in a change in the Fund’s distribution rate or that the rate will be sustainable in the future.
Emerging Markets Risk
is the risk of investing in emerging market securities, primarily increased foreign
(non-U.S.)
investment risk.
Equity Securities and Related Market Risk
is the risk that the value of equity securities, such as common stocks and preferred securities, may decline due to general market conditions which are not specifically related to a particular company or to factors affecting a particular industry or industries. Equity securities generally have greater price volatility than fixed income securities.
Focused Investment Risk
is the risk that, to the extent that the Fund focuses its investments in a particular industry, country or geographic region, the NAV of the Common Shares will be more susceptible to events or factors affecting companies in that industry, country or geographic region.
Foreign
(Non-U.S.)
Investment Risk
is the risk that investing in foreign
(non-U.S.)
securities may result in the Fund experiencing more rapid and extreme changes in value than a fund that invests exclusively in securities of U.S. companies. due to smaller markets, differing reporting, accounting and auditing standards, increased risk of delayed settlement of portfolio transactions or loss of certificates of portfolio securities, and the risk of unfavorable foreign government actions, including nationalization, expropriation or confiscatory taxation, currency blockage, political changes, diplomatic developments or the imposition of sanctions and other similar measures. Foreign securities may also be less liquid and more difficult to value than securities of U.S. issuers.
Foreign Loan Originations Risk
is the risk that Fund may originate loans to foreign entities and individuals, including foreign (non-U.S.) and emerging market entities and individuals, which may involve risks not ordinarily associated with exposure to loans to U.S. entities and individuals due to more or less governmental supervision and regulation than exists in the U.S. Due to difference in legal systems, there may be difficulty in obtaining or enforcing a court judgment outside the U.S. In addition, to the extent that investments are made in a limited number of countries, events in those countries will have a more significant impact on the Fund. The Fund’s loans to foreign entities and individuals may be subject to risks of increased transaction costs, potential delays in settlement or unfavorable differences between the U.S. economy and foreign economies.
High Yield Securities Risk
is the risk that high yield securities and unrated securities of similar credit quality (commonly known as “junk bonds”) are subject to greater levels of credit, call and liquidity risks.
High yield securities are considered primarily speculative with respect to the issuer’s continuing ability to make principal and interest payments and may be more volatile than higher-rated securities of similar maturity.
Inflation/Deflation Risk
is the risk that the value of assets or income from the Fund’s investments will be worth less in the future as inflation decreases the value of payments at future dates. As inflation increases, the real value of the Fund’s portfolio could decline. Deflation Risk is the risk that prices throughout the economy decline over time. Deflation may have an adverse effect on the creditworthiness of issuers and may make issuer default more likely, which may result in a decline in the value of the Fund’s portfolio and common shares.
Inflation-Indexed Security Risk
is the risk that inflation-indexed debt securities are subject to the effects of changes in market interest rates caused by factors other than inflation (real interest rates). In general, the value of an inflation-indexed security, including TIPS, tends to decrease when real interest rates increase and can increase when real interest rates decrease. Interest payments on inflation-indexed securities are unpredictable and will fluctuate as the principal and interest are adjusted for inflation. There can be no assurance that the inflation index used will accurately measure the real rate of inflation in the prices of goods and services. Any increase in the principal amount of an inflation-indexed debt security will be considered taxable ordinary income, even though the Fund will not receive the principal until maturity.
Interest Rate Risk
is the risk that fixed income securities and other instruments in the Fund’s portfolio will decline in value because of an increase in interest rates; a fund with a longer average portfolio duration will be more sensitive to changes in interest rates than a fund with a short average portfolio duration.
Issuer Risk
is the risk that the value of a security may decline for a reason directly related to the issuer, such as management performance, financial leverage and reduced demand for the issuer’s goods or services.
Issuer
Non-Diversification
Risk
is the risk of focusing investments in a small number of issuers, including being more susceptible to risks associated with a single economic, political or regulatory occurrence than a more diversified portfolio might be. Funds that are “nondiversified” may invest a greater percentage of their assets in the securities of a single issuer (such as bonds issued by a particular state) than funds that are “diversified.”
Leverage Risk
is the risk that certain transactions of the Fund, such as reverse repurchase agreements, dollar rolls and/or borrowings (as well
| | | | | |
Notes to Financial Statements | | | | |
as from any future issuance of preferred shares), delayed delivery or forward commitment transactions, or derivative instruments, may give rise to leverage, magnifying gains and losses and causing the Fund to be more volatile than if it had not been leveraged. This means that leverage entails a heightened risk of loss.
Limited Term Risk
Unless the limited term provision of the Fund’s Declaration of Trust is amended by shareholders in accordance with the Declaration of Trust, or unless the Fund completes an Eligible Tender Offer and converts to perpetual existence, the Fund will terminate on or about a date specified in the Fund’s Prospectus.
Liquidity Risk
is the risk that a particular investment may be difficult to purchase or sell and that the Fund may be unable to sell illiquid investments at an advantageous time or price or possibly require the Fund to dispose of other investments at unfavorable times or prices in order to satisfy its obligations, which could prevent the Fund from taking advantage of other investment opportunities. Additionally, the market for certain investments may become illiquid under adverse market or economic conditions independent of any specific adverse changes in the conditions of a particular issuer.
Loan Origination Risk
is the risk associated with the fact that the may also seek to originate loans, including, without limitation, residential and/or commercial real estate or mortgage-related loans, consumer loans or other types of loans, which may be in the form of whole loans, secured and unsecured notes, senior and second lien loans, mezzanine loans or similar investments. The Fund may originate loans to corporations and/or other legal entities and individuals, including foreign
(non-U.S.)
entities and individuals. Such borrowers may have credit ratings that are determined by one or more NRSROs or PIMCO to be below investment grade. The Fund may subsequently offer such investments for sale to third parties; provided, that there is no assurance that the Fund will complete the sale of such an investment. If the Fund is unable to sell, assign or successfully close transactions for the loans that it originates, the Fund will be forced to hold its interest in such loans for an indeterminate period of time. This could result in the Fund’s investments being over-concentrated in certain borrowers. The Fund will be responsible for the expenses associated with originating a loan (whether or not consummated). This may include significant legal and due diligence expenses, which will be indirectly borne by the Fund and Common Shareholders.
Loans and Other Indebtedness; Loan Participations and Assignments Risk
is the risk that scheduled interest or principal payments will not be made in a timely manner or at all, either of which may adversely affect the values of a loan. Additionally, there is a risk that the collateral underlying a loan may be unavailable or insufficient to satisfy a borrower’s obligation, and the Fund could become part owner of any
collateral if a loan is foreclosed, subjecting the Fund to costs associated with owning and disposing of the collateral.
In the event of the insolvency of the lender selling a participation, there is a risk that the Fund may be treated as a general creditor of the lender and may not benefit from any
set-off
between the lender and the borrower.
There is the risk that the Fund may have difficulty disposing of loans and loan participations due to the lack of a liquid secondary market for loans and loan participations.
To the extent the Fund acquires loans, including bank loans, the Fund may be subject to greater levels of credit risk, call risk, settlement risk and liquidity risk than funds that do not acquire such instruments.
Management Risk
is the risk that the investment techniques and risk analyses applied by PIMCO will not produce the desired results and that actual or potential conflicts of interest, legislative, regulatory, or tax restrictions, policies or developments may affect the investment techniques available to PIMCO and the individual portfolio manager in connection with managing the Fund and may cause PIMCO to restrict or prohibit participation in certain investments. There is no guarantee that the investment objective of the Fund will be achieved.
Market Discount Risk
is the risk that the price of the Fund’s common shares of beneficial interest will fluctuate with market conditions and other factors. Shares of closed-end management investment companies frequently trade at a discount from their net asset value.
Market Disruption Risk
is the risk of investment and operational risks associated with financial, economic and other global market developments and disruptions, including those arising from war, terrorism, market manipulation, government interventions, defaults and shutdowns, political changes or diplomatic developments, public health emergencies (such as the spread of infectious diseases, pandemics and epidemics) and natural/environmental disasters, which can all negatively impact the securities markets, and cause a Fund to lose value. These events can also impair the technology and other operational systems upon which a Fund’s service providers, including PIMCO as a Fund’s investment adviser, rely, and could otherwise disrupt a Fund’s service providers’ ability to fulfill their obligations to a Fund. For example, the recent spread of an infectious respiratory illness caused by a novel strain of coronavirus (known as
COVID-19)
has caused volatility, severe market dislocations and liquidity constraints in many markets, including markets for the securities the Fund holds, and may adversely affect the Fund’s investments and operations. Please see the Important Information section for additional discussion of the
COVID-19
pandemic.
Market Risk
is the risk that the value of securities owned by the Fund may go up or down, sometimes rapidly or unpredictably, due to factors affecting securities markets generally or particular industries.
Mortgage-Related and Other Asset-Backed Securities Risk
is the risk of investing in mortgage-related and other asset-backed securities, including interest rate risk, extension risk, prepayment risk and credit risk.
Mortgage-Related Derivative Instruments Risk
is the risk associated with mortgage-related and other asset-backed instruments, privately-issued mortgage-related securities, the mortgage market, the real estate industry, derivatives and credit default swaps. See “Mortgage-Related and Other Asset-Backed Instruments Risk,” “Privately-Issued Mortgage-Related Securities Risk,” “Derivatives Risk,” and “Credit Default Swaps Risk.”
New/Small Fund Risk
is the risk that a new or smaller fund’s performance may not represent how a Fund is expected to or may perform in the long term. In addition, new funds have limited operating histories for investors to evaluate and new and smaller funds may not attract sufficient assets to achieve investment and trading efficiencies.
Operational Risk
An investment in a Fund, like any fund, can involve operational risks arising from factors such as processing errors, human errors, inadequate or failed internal or external processes, failures in systems and technology, changes in personnel and errors caused by third-party service providers. The occurrence of any of these failures, errors or breaches could result in a loss of information, regulatory scrutiny, reputational damage or other events, any of which could have a material adverse effect on a Fund. While a Fund seeks to minimize such events through controls and oversight, there may still be failures that could cause losses to the Fund.
Other Investment Companies Risk
is the risk that Common Shareholders may be subject to duplicative expenses to the extent the Fund invests in other investment companies. In addition, these other investment companies may utilize leverage, in which case an investment would subject the Fund to additional risks associated with leverage.
Platform Risk
is the risk resulting from the fact that the Alt Lending ABS in which the Fund invests are typically not listed on any securities exchange and not registered under the Securities Act. In addition, the Fund anticipates that these instruments may only be sold to a limited number of investors and may have a limited or
non-existent
secondary market. Accordingly, the Fund currently expects that certain of the investments in Alt Lending ABS will face heightened levels of liquidity risk. Although currently, there is generally no active reliable, secondary market for certain Alt Lending ABS, a secondary market for these Alt
Lending ABS may develop. If the Fund purchases Alt Lending ABS on an alternative lending platform, the Fund will have the right to receive principal and interest payments due on loans underlying the Alt Lending ABS only if the platform servicing the loans receives the borrower’s payments on such loans and passes such payments through to the Fund. If a borrower is unable or fails to make payments on a loan for any reason, the Fund may be greatly limited in its ability to recover any outstanding principal or interest due, as (among other reasons) the Fund may not have direct recourse against the borrower or may otherwise be limited in its ability to directly enforce its rights under the loan, whether through the borrower or the platform through which such loan was originated, the loan may be unsecured or under-collateralized and/or it may be impracticable to commence a legal proceeding against the defaulting borrower.
Potential Conflicts of Interest Risk — Allocation of Investment Opportunities
is the risk that PIMCO’s interests or the interests of its clients may conflict with those of the Funds and the results of the Fund’s investment activities may differ from those of the Fund’s affiliates, or another account managed by the Fund’s affiliates, and it is possible that the Fund could sustain losses during periods in which one or more of the Fund’s affiliates and/or other accounts managed by PIMCO or its affiliates, including proprietary accounts, achieve profits on their trading.
Portfolio Turnover Risk
is the risk that a high portfolio turnover will result in greater expenses to the Fund, including brokerage commissions or dealer
mark-ups
and other transaction costs on the sale of securities and reinvestments in other securities. Such sales may result in realization of taxable capital gains (including short-term capital gains, which are generally taxed to shareholders at ordinary income tax rates when distributed net of short-term capital losses and net
long-term
capital losses) and may adversely affect the Fund’s
after-tax returns.
Preferred Securities Risk
is the risk that certain preferred securities contain provisions that allow an issuer under certain conditions to skip or defer distributions which may require the Fund to include the amount of the deferred distribution in its taxable income for tax purposes although it does not currently receive such amount in cash. Additionally, preferred securities are subordinated to bonds and other debt securities in an issuer’s capital structure in terms of priority for corporate income and liquidation payments, and therefore will be subject to greater credit risk than those debt securities. Preferred securities may trade less frequently and in a more limited volume and may be subject to more abrupt or erratic price movements than many other securities, such as common stocks, corporate debt securities and U.S. Government securities.
| | | | | |
Notes to Financial Statements | | | | |
Privacy and Data Security Risk
is the risk resulting from the fact that the Gramm-Leach-Bliley Act (“GLBA”) and other laws limit the disclosure of certain
non-public
personal information about a consumer to
non-affiliated
third parties and require financial institutions to disclose certain privacy policies and practices with respect to information sharing with both affiliates and
non-affiliated
third parties. Many states and a number of
non-U.S.
jurisdictions have enacted privacy and data security laws requiring safeguards on the privacy and security of consumers’ personally identifiable information. Other laws deal with obligations to safeguard and dispose of private information in a manner designed to avoid its dissemination. Privacy rules adopted by the U.S. Federal Trade Commission and SEC implement GLBA and other requirements and govern the disclosure of consumer financial information by certain financial institutions, ranging from banks to private investment funds. U.S. platforms following certain models generally are required to have privacy policies that conform to these GLBA and other requirements. In addition, such platforms typically have policies and procedures intended to maintain platform participants’ personal information securely and dispose of it properly.
Private Placements Risk
is the risk that securities received in a private placement may be subject to strict restrictions on resale, and there may be no liquid secondary market or ready purchaser for such securities. Therefore, the Fund may be unable to dispose of such securities when it desires to do so, or at the most favorable time or price. Private placements may also raise valuation risks.
Privately-Issued Mortgage-Related Securities Risk
is the risk of nonpayment because there are no direct or indirect government or agency guarantees of payments in the pools created by
non-governmental
issuers.
Real Estate Risk
is the risk associated with investing in real estate investments, including investments in equity or debt securities issued by private and public REITs, real estate operating companies (‘REOCs”), private or public real estate-related loans and real estate-linked derivative instruments. The Fund will be subject to the risks associated with owning real estate and with the real estate industry generally.
Reinvestment Risk
is the risk that income from the Fund’s portfolio will decline if and when the Fund invests the proceeds from matured, traded or called debt obligations at market interest rates that are below the portfolio’s current earnings rate. The Fund also may choose to sell higher yielding portfolio securities and to purchase lower yielding securities to achieve greater portfolio diversification, because the portfolio managers believe the current holdings are overvalued or for other investment-related reasons.
REIT Risk
is the risk associated with investing in REITs, which are pooled investment vehicles that own, and usually operate, income-producing real estate. Some REITs also finance real estate. If a REIT meets certain requirements, including distributing to shareholders substantially all of its taxable income (other than net capital gains), then it is not typically taxed on the income distributed to shareholders. Therefore, REITs may pay higher dividends than other issuers.
Regulatory Changes Risk
is the risk that is associated with the fact that financial entities, such as investment companies and investment advisers, are generally subject to extensive government regulation and intervention. Government regulation and/or intervention may change the way the Fund is regulated, affect the expenses incurred directly by the Fund and the value of its investments, and limit and /or preclude the Fund’s ability to achieve its investment objectives. Government regulation may change frequently and may have significant adverse consequences. The Fund and the Investment Manager have historically been eligible for exemptions from certain regulations. However, there is no assurance that the Fund and the Investment Manager will continue to be eligible for such exemptions.
Regulatory Risk — Commodity Pool Operato
r The CFTC has adopted regulations that subject registered investment companies and their investment advisers to regulation by the CFTC if the registered investment company invests more than a prescribed level of its liquidation value in futures, options on futures or commodities, swaps, or other financial instruments regulated under the Commodity Exchange Act (“CEA”) and the rules thereunder (“commodity interests”), or if the Fund markets itself as providing investment exposure to such instruments. The Investment Manager is registered with the CFTC as a CPO.
Regulatory Risk — LIBOR
is the risk related to the anticipated discontinuation of the London Interbank Offered Rate (“LIBOR”). Certain instruments held by the Fund rely in some fashion upon LIBOR. Although the transition process away from LIBOR has become increasingly well-defined in advance of the anticipated discontinuation date, there remains uncertainty regarding the nature of any replacement rate, and any potential effects of the transition away from LIBOR on the Fund or on certain instruments in which the Fund invests can be difficult to ascertain. The transition process may involve, among other things, increased volatility or illiquidity in markets for instruments that currently rely on LIBOR and may result in a reduction in the value of certain instruments held by the Fund.
Regulation S Securities Risk
Regulation S securities are offered through
off-shore
(non-U.S.)
offerings without registration with the SEC pursuant to Regulation S of the Securities Act. Regulation S securities may be relatively less liquid as a result of legal or contractual
restrictions on resale. Although Regulation S securities may be resold in privately negotiated transactions, the price realized from these sales could be less than
off-shore
transactions or in those originally paid by the Fund. Further, companies whose securities are not publicly traded may not be subject to the disclosure and other investor protection requirements that would be applicable if their securities were publicly traded. Accordingly, Regulation S securities may involve a high degree of business and financial risk and may result in substantial losses.
Repurchase Agreements Risk
is the risk that, if the party agreeing to repurchase a security should default, the Fund will seek to sell the securities which it holds, which could involve procedural costs or delays in addition to a loss on the securities if their value should fall below their repurchase price.
Restricted Securities Risk
is the risk that the Fund’s investment in securities that have not been registered for public sale, but that are eligible for purchase and sale pursuant to Rule 144A under the Securities Act, may be relatively less liquid than registered securities traded on established securities markets.
Risk Retention Investment Risk
is the risk associated with the Fund’s investments in risk retention tranches of commercial mortgage-backed securities (“CMBS”) or other eligible securitizations, if any (“risk retention tranches”), which are eligible residual interests typically held by the sponsors of such securitizations pursuant to the final rules implementing the credit risk retention requirements of Section 941 of the Dodd-Frank Act (the “U.S. Risk Retention Rules”). There can be no assurance that the applicable federal agencies charged with the implementation of the final U.S. Risk Retention Rules (the Federal Deposit Insurance Corporation, the Comptroller of the Currency, the Federal Reserve Board, the SEC, the Department of Housing and Urban Development, and the Federal Housing Finance Agency) could not take positions in the future that differ from the interpretation of such rules taken or embodied in such securitizations, or that the final U.S. Risk Retention Rules will not change. Furthermore, if the Fund breaches any undertakings in any Risk Retention Agreement, it will be exposed to claims by the other parties thereto, including for any losses incurred as a result of such breach, which could be significant and exceed the value of the Fund’s investments.
Securities Lending Risk
is the risk that, when a Fund lends portfolio securities, its investment performance will continue to reflect changes in the value of the securities loaned and lose rights in the collateral or delay in recovery of the collateral if the borrower fails to return the security loaned or becomes insolvent. The Fund may pay lending fees to a party, which may be an affiliate of the Fund, arranging the loan.
Segregation and Coverage Risk
is the risk that certain portfolio management techniques may be considered senior securities unless steps are taken to segregate the Fund’s assets or otherwise cover its obligations. To avoid having these instruments considered senior securities, the Fund may segregate liquid assets with a value equal (on a daily
basis) to its obligations under these types of leveraged transactions, enter into offsetting transactions or otherwise cover such transactions. The Fund may be unable to use such segregated assets for certain other purposes, which could result in the Fund earning a lower return on its portfolio than it might otherwise earn if it did not have to segregate those assets in respect of, or otherwise cover, such portfolio positions. To the extent the Fund’s assets are segregated or committed as cover, it could limit the Fund’s investment flexibility. Except as otherwise described in the principal investment strategies for the Fund, the Fund will no longer be required to engage in asset segregation or cover techniques as of August 19, 2022.
Senior Debt Risk
is the risk that the Fund may be subject to greater levels of credit risk than funds that do not invest in below investment grade senior debt. The Fund may also be subject to greater levels of liquidity risk than funds that do not invest in senior debt. Restrictions on transfers in loan agreements, a lack of publicly available information and other factors may, in certain instances, make senior debt more difficult to sell at an advantageous time or price than other types of securities or instruments.
Short Exposure Risk
is the risk of entering into short sales, including the potential loss of more money than the actual cost of the investment, and the risk that the third party to the short sale will not fulfill its contractual obligations, causing a loss to the Fund.
Smaller Company Risk
is the risk that the value of securities issued by a smaller company may go up or down, sometimes rapidly and unpredictably as compared to more widely held securities, due to narrow markets and limited resources of smaller companies. A Fund’s investments in smaller companies subject it to greater levels of credit, market and issuer risk.
Sovereign Debt Risk
is the risk that investments in fixed income instruments issued by sovereign entities may decline in value as a result of default or other adverse credit event resulting from an issuer’s inability or unwillingness to make principal or interest payments in a timely fashion.
Special Purpose Acquisition Companies (“SPACs”) Risk
is the risk that, because SPACs and similar entities are in essence blank check companies without operating history or ongoing business other than seeking acquisitions, the value of their securities is particularly
| | | | | |
Notes to Financial Statements | | | | |
dependent on the ability of the entity’s management to identify and complete a profitable acquisition. A SPAC’s structure may result in significant dilution of a stockholder’s share value immediately upon the completion of a business combination due to, among other reasons, interests held by the SPAC sponsor, conversion of warrants into additional shares, shares issued in connection with a business combination and/or certain embedded costs. There is no guarantee that the SPACs in which the Fund invests will complete an acquisition or that any acquisitions that are completed will be profitable. Some SPACs may pursue acquisitions only within certain industries or regions, which may increase the volatility of their prices. In addition, these securities, which are typically traded in the over-the-counter market, may be considered illiquid and/or be subject to restrictions on resale.
Structured Investments Risk
is the risk that the Fund’s investment in structured products, including, structured notes, credit-linked notes and other types of structured products bear the risks of the underlying investments, index or reference obligation and are subject to counterparty risk. The Fund may have the right to receive payments only from the structured product, and generally does not have direct rights against the issuer or the entity that sold the assets to be securitized. Structured products generally entail risks associated with derivative instruments.
Subprime Risk
is the risk that loans, and debt instruments collateralized by loans (including Alt Lending ABS), acquired by the Fund may be subprime in quality, or may become subprime in quality. Although there is no specific legal or market definition of “subprime,” subprime loans are generally understood to refer to loans made to borrowers that display poor credit histories and other characteristics that correlate with a higher default risk. Accordingly, subprime loans, and debt instruments secured by such loans, have speculative characteristics and are subject to heightened risks, including the risk of nonpayment of interest or repayment of principal, and the risks associated with investments in high yield securities. In addition, these instruments could be subject to increased regulatory scrutiny. The Fund is not restricted by any particular borrower credit criteria when acquiring loans or debt instruments collateralized by loans.
Subsidiary Risk
is the risk that, by investing in a Fund’s Subsidiary, the Fund would be exposed to the risks associated with the Subsidiaries’ investments. The Subsidiaries are not registered under the Act and may not be subject to all the investor protections of the Act. There is no guarantee that the investment objective of a subsidiary will be achieved.
Synthetic Convertible Securities Risk
is the risk that the values of synthetic convertible securities will respond differently to market fluctuations than a traditional convertible security because a synthetic
convertible is composed of two or more separate securities or instruments, (such as a debt security and a warrant or option to purchase another security), each with its own market value. Synthetic convertible securities are also subject to the risks associated with derivatives. In addition, if the value of the underlying common stock or the level of the index involved in the convertible element falls below the strike price of the warrant or option, the warrant or option may lose all value.
Tax Risk
is the risk that if, in any year, the Fund were to fail to qualify for treatment as a regulated investment company under the Tax Code, and were ineligible to or did not otherwise cure such failure, the Fund would be subject to tax on its taxable income at corporate rates and, when such income is distributed, shareholders would be subject to a further tax to the extent of the Fund’s current or accumulated earnings and profits.
U.S. Government Securities Risk
is the risk that the obligations supported by (i) the full faith and credit of the United States, (ii) the right of the issuer to borrow from the U.S. Treasury, (iii) the discretionary authority of the U.S. Government to purchase the agency’s obligations (iv) or only by the credit of the agency, instrumentality or corporation will be satisfied in full, or that such obligations will not decrease in value or default.
Valuation Risk
is the risk that fair value pricing used when market quotations are not readily available may not result in adjustments to the prices of securities or other assets, or that fair value pricing may not reflect actual market value. It is possible that the fair value determined in good faith for a security or other asset will be materially different from quoted or published prices, from the prices used by others for the same security or other asset and/or from the value that actually could be or is realized upon the sale of that security or other asset.
Zero-Coupon Bond,
Step-Ups
and
Securities Risk
is the risk presented by the market prices of
zero-coupon,
step ups and
securities generally being more volatile than the prices of securities that pay interest periodically and in cash and being likely to respond to changes in interest rates to a greater degree than other types of debt securities with similar maturities and credit quality. In addition, as these securities may not pay cash interest, the Fund’s investment exposure to these securities and their risks, including credit risk, will increase during the time these securities are held in the Fund’s portfolio.
In general, a Fund may be subject to additional risks, including, but not limited to, risks related to government regulation and intervention in financial markets, operational risks, risks associated with financial,
economic and global market disruptions, and cybersecurity risks. Please see the Important Information section of this report for additional discussion of certain regulatory and market developments that may impact a Fund’s performance.
8. MASTER NETTING ARRANGEMENTS
A Fund may be subject to various netting arrangements (“Master Agreements”) with select counterparties. Master Agreements govern the terms of certain transactions, and are intended to reduce the counterparty risk associated with relevant transactions by specifying credit protection mechanisms and providing standardization that is intended to improve legal certainty. Each type of Master Agreement governs certain types of transactions. Different types of transactions may be traded out of different legal entities or affiliates of a particular organization, resulting in the need for multiple agreements with a single counterparty. As the Master Agreements are specific to unique operations of different asset types, they allow a Fund to close out and net its total exposure to a counterparty in the event of a default with respect to all the transactions governed under a single Master Agreement with a counterparty. For financial reporting purposes the Statements of Assets and Liabilities generally present derivative assets and liabilities on a gross basis, which reflects the full risks and exposures prior to netting.
Master Agreements can also help limit counterparty risk by specifying collateral posting arrangements at
pre-arranged
exposure levels. Under most Master Agreements, collateral is routinely transferred if the total net exposure to certain transactions (net of existing collateral already in place) governed under the relevant Master Agreement with a counterparty in a given account exceeds a specified threshold, which typically ranges from zero to $250,000 depending on the counterparty and the type of Master Agreement. United States Treasury Bills and U.S. dollar cash are generally the preferred forms of collateral, although other securities may be used depending on the terms outlined in the applicable Master Agreement. Securities and cash pledged as collateral are reflected as assets on the Statements of Assets and Liabilities as either a component of Investments at value (securities) or Deposits with counterparty. Cash collateral received is not typically held in a segregated account and as such is reflected as a liability on the Statements of Assets and Liabilities as Deposits from counterparty. The market value of any securities received as collateral is not reflected as a component of NAV. A Fund’s overall exposure to counterparty risk can change substantially within a short period, as it is affected by each transaction subject to the relevant Master Agreement.
Master Repurchase Agreements and Global Master Repurchase Agreements (individually and collectively “Master Repo Agreements”) govern repurchase, reverse repurchase, and certain sale-buyback
transactions between a Fund and select counterparties. Master Repo Agreements maintain provisions for, among other things, initiation, income payments, events of default, and maintenance of collateral. The market value of transactions under the Master Repo Agreement, collateral pledged or received, and the net exposure by counterparty as of period end are disclosed in the Notes to Schedules of Investments.
Master Securities Forward Transaction Agreements (“Master Forward Agreements”) govern certain forward settling transactions, such as TBA securities, delayed-delivery or certain sale-buyback transactions by and between a Fund and select counterparties. The Master Forward Agreements maintain provisions for, among other things, transaction initiation and confirmation, payment and transfer, events of default, termination, and maintenance of collateral. The market value of forward settling transactions, collateral pledged or received, and the net exposure by counterparty as of period end is disclosed in the Notes to Schedules of Investments.
Customer Account Agreements and related addenda govern cleared derivatives transactions such as futures, options on futures, and cleared OTC derivatives. Such transactions require posting of initial margin as determined by each relevant clearing agency which is segregated in an account at a futures commission merchant (“FCM”) registered with the CFTC. In the United States, counterparty risk may be reduced as creditors of an FCM cannot have a claim to Fund assets in the segregated account. Portability of exposure reduces risk to the Funds. Variation margin, which reflects changes in market value, is generally exchanged daily, but may not be netted between futures and cleared OTC derivatives unless the parties have agreed to a separate arrangement in respect of portfolio margining. The market value or accumulated unrealized appreciation (depreciation), initial margin posted, and any unsettled variation margin as of period end are disclosed in the Notes to Schedules of Investments.
Prime Broker Arrangements may be entered into to facilitate execution and/or clearing of listed equity option transactions or short sales of equity securities between a Fund and selected counterparties. The arrangements provide guidelines surrounding the rights, obligations, and other events, including, but not limited to, margin, execution, and settlement. These agreements maintain provisions for, among other things, payments, maintenance of collateral, events of default, and termination. Margin and other assets delivered as collateral are typically in the possession of the prime broker and would offset any obligations due to the prime broker. The market values of listed options and securities sold short and related collateral are disclosed in the Notes to Schedules of Investments.
International Swaps and Derivatives Association, Inc. Master Agreements and Credit Support Annexes (“ISDA Master Agreements”)
| | | | | | | | | | | | |
| | | | ANNUAL REPORT | | | | | | | JUNE 30, 2022 | | | 143 |
| | | | |
Notes to Financial Statements | | | | |
govern bilateral OTC derivative transactions entered into by a Fund with select counterparties. ISDA Master Agreements maintain provisions for general obligations, representations, agreements, collateral posting and events of default or termination. Events of termination include conditions that may entitle counterparties to elect to terminate early and cause settlement of all outstanding transactions under the applicable ISDA Master Agreement. Any election to terminate early could be material to the financial statements. The ISDA Master Agreement may contain additional provisions that add counterparty protection beyond coverage of existing daily exposure if the counterparty has a decline in credit quality below a predefined level or as required by regulation. Similarly, if required by regulation, the Funds may be required to post additional collateral beyond coverage of daily exposure. These amounts, if any, may (or if required by law, will) be segregated with a third-party custodian. To the extent the Funds are required by regulation to post additional collateral beyond coverage of daily exposure, they could potentially incur costs, including in procuring eligible assets to meet collateral requirements, associated with such posting. The market value of OTC financial derivative instruments, collateral received or pledged, and net exposure by counterparty as of period end are disclosed in the Notes to Schedules of Investments.
9. FEES AND EXPENSES
(a) Management Fee
Pursuant to the Investment Management Agreements with PIMCO (the “Agreement”), and subject to the supervision of the Board, PIMCO is responsible for providing to each Fund investment guidance and policy direction in connection with the management of the Fund, including oral and written research, analysis, advice, and statistical and economic data and information. In addition, pursuant to the Agreement and subject to the general supervision of the Board, PIMCO, at its expense, provides or causes to be furnished most other supervisory and administrative services the Funds require, including but not limited to, expenses of most third-party service providers (e.g., audit, custodial, legal, transfer agency, printing) and other expenses, such as those associated with insurance, proxy solicitations and mailings for shareholder meetings, NYSE listing and related fees, tax services, valuation services and other services the Funds require for their daily operations. Pursuant to the Agreements, PIMCO receives an annual fee, payable monthly, at the annual rates shown in the table below:
| | | | | | | | |
| | | | | | |
| | |
| PCM Fund, Inc. | | | | | | | 0.900% | |
| | |
PIMCO Global StocksPLUS & Income Fund | | | | | | | 1.105% | |
| | |
| PIMCO Strategic Income Fund, Inc. | | | | | | | 0.955% | |
| | |
| PIMCO Access Income Fund | | | | | | | 1.250% | |
| | |
| PIMCO Dynamic Income Fund | | | | | | | 1.100% | |
| | |
| PIMCO Dynamic Income Opportunities Fund | | | | | | | 1.150% | |
| Management fees calculated based on the Fund’s average daily “total managed assets”. Total managed assets refer to the total assets of the Fund (including assets |
| | attributable to any reverse repurchase agreements, borrowings and preferred shares that may be outstanding) minus accrued liabilities (other than liabilities representing reverse repurchase agreements and borrowings). |
| Management fees calculated based on the Fund’s average daily “total managed assets”. Total managed assets refer to the total assets of the Fund (including assets attributable to any preferred shares and borrowings that may be outstanding) minus accrued liabilities (other than liabilities representing borrowings). |
| Management fees calculated based on the Fund’s average daily net asset value (including daily net assets attributable to any preferred shares of the Fund that may be outstanding). |
| Management fees calculated based on the Fund’s average daily “total managed assets”. Total managed assets refer to the total assets of the Fund (including any assets attributable to any reverse repurchase agreements, dollar rolls/buy backs, borrowings and preferred shares that may be outstanding) minus accrued liabilities (other than liabilities representing reverse repurchase agreements, dollar rolls/buy backs, and borrowings). |
| Management fees calculated based on the Fund’s average daily “total managed assets”. Total managed assets includes total assets of the Fund (including assets attributable to any reverse repurchase agreements, dollar rolls, borrowings and preferred shares that may be outstanding) minus accrued liabilities (other than liabilities representing reverse repurchase agreements, dollar rolls and borrowings). |
| Effective December 13, 2021, the annual management fee was reduced from 1.15% to 1.10%. |
(b) Fund Expenses
With respect to each Fund other than PIMCO Dynamic Income Opportunities Fund, each Fund bears other expenses, which may vary and affect the total level of expenses paid by shareholders, such as (i) salaries and other compensation or expenses, including travel expenses of any of the Fund’s executive officers and employees, if any, who are not officers, directors, shareholders, members, partners or employees of PIMCO or its subsidiaries or affiliates; (ii) taxes and governmental fees, if any, levied against the Fund; (iii) brokerage fees and commissions and other portfolio transaction expenses incurred by or for the Fund (including, without limitation, fees and expenses of outside legal counsel or third-party consultants retained in connection with reviewing, negotiating and structuring specialized loans and other investments made by the Fund, subject to specific or general authorization by the Fund’s Board (for example, so-called “broken-deal costs” (e.g., fees, costs, expenses and liabilities, including, for example, due diligence-related fees, costs, expenses and liabilities, with respect to unconsummated investments))); (iv) expenses of the Fund’s securities lending (if any), including any securities lending agent fees, as governed by a separate securities lending agreement; (v) costs, including interest expenses, of borrowing money or engaging in other types of leverage financing, including, without limitation, through the use by the Fund of reverse repurchase agreements, tender option bonds, bank borrowings and credit facilities; (vi) costs, including dividend and/or interest expenses and other costs (including, without limitation, offering and related legal costs, fees to brokers, fees to auction agents, fees to transfer agents, fees to ratings agencies and fees to auditors associated with satisfying ratings agency requirements for preferred shares or other securities issued by the Fund and other related requirements in the Fund’s organizational documents) associated with the Fund’s issuance, offering, redemption and maintenance of preferred shares, commercial paper or other senior
| | | | | | |
| 144 | | PIMCO CLOSED-END FUNDS | | | | |
securities for the purpose of incurring leverage; (vii) fees and expenses of any underlying funds or other pooled vehicles in which the Fund invests; (viii) dividend and interest expenses on short positions taken by the Fund; (ix) fees and expenses, including travel expenses, and fees and expenses of legal counsel retained for their benefit, of Trustees who are not officers, employees, partners, shareholders or members of PIMCO or its subsidiaries or affiliates; (x) extraordinary expenses, including extraordinary legal expenses, that may arise, including expenses incurred in connection with litigation, proceedings, other claims, and the legal obligations of the Fund to indemnify its Trustees, officers, employees, shareholders, distributors, and agents with respect thereto; (xi) organizational and offering expenses of the Fund, including with respect to share offerings, such as rights offerings and shelf offerings, following the Fund’s initial offering, and expenses associated with tender offers and other share repurchases and redemptions; and (xii) expenses of the Fund which are capitalized in accordance with U.S. GAAP.
With respect to PIMCO Dynamic Income Opportunities Fund, the Fund bears other expenses, which may vary and affect the total level of expenses paid by shareholders, such as (i) salaries and other compensation or expenses, including travel expenses, of any of the Fund’s executive officers and employees, if any, who are not officers, directors, shareholders, members, partners or employees of PIMCO or its subsidiaries or affiliates; (ii) taxes and governmental fees, if any, levied against the Fund; (iii) brokerage fees and commissions, and other portfolio transaction expenses incurred by or for the Fund (including, without limitation, fees and expenses of outside legal counsel or third-party consultants retained in connection with reviewing, negotiating and structuring specialized loans and other investments made by the Fund, and any costs associated with originating loans, asset securitizations, alternative lending-related strategies and
so-called
“broken-deal costs” (e.g., fees, costs, expenses and liabilities, including, for example, due diligence-related fees, costs, expenses and liabilities, with respect to unconsummated investments)); (iv) expenses of the Fund’s securities lending (if any), including any securities lending agent fees, as governed by a separate securities lending agreement; (v) costs, including interest expenses, of borrowing money or engaging in other types of leverage financing including, without limitation, through the use by the Fund of reverse repurchase agreements, dollar rolls, tender option bonds, bank borrowings and credit facilities; (vi) costs, including dividend and/or interest expenses and other costs (including, without limitation, offering and related legal costs, fees to brokers, fees to auction agents, fees to transfer agents, fees to ratings agencies and fees to auditors associated with satisfying ratings agency requirements for preferred shares or other securities issued by the Fund and other related requirements in the Fund’s organizational documents) associated with the Fund’s issuance,
offering, redemption and maintenance of preferred shares, commercial paper or other instruments (such as the use of reverse repurchase agreements, dollar rolls, bank borrowings, credit facilities and tender option bonds) for the purpose of incurring leverage; (vii) fees and expenses of any underlying funds or other pooled vehicles in which the Fund invests; (viii) dividend and interest expenses on short positions taken by the Fund; (ix) fees and expenses, including travel expenses, and fees and expenses of legal counsel retained for their benefit, of Trustees who are not officers, employees, partners, shareholders or members of PIMCO or its subsidiaries or affiliates; (x) extraordinary expenses, including extraordinary legal expenses, as may arise, including, without limitation, expenses incurred in connection with litigation, proceedings, other claims, and the legal obligations of the Fund to indemnify its trustees, officers, employees, shareholders, distributors, and agents with respect thereto; (xi) fees and expenses, including legal, printing and mailing, solicitation and other fees and expenses associated with and incident to shareholder meetings and proxy solicitations involving contested elections of trustees, shareholder proposals or other
non-routine
matters that are not initiated or proposed by Fund management; (xii) organizational and offering expenses of the Fund, including registration (including registration fees), legal, marketing, printing, accounting and other expenses, associated with organizing the Fund in its state of jurisdiction and in connection with the initial registration of the Fund under the Act, and the rules and regulations thereunder, and the initial registration of its Shares under the Securities Act of 1933, as amended, and with respect to Share offerings, such as rights offerings and shelf offerings, following the Fund’s initial offering, expenses associated with tender offers and other repurchases and redemptions, and fees and expenses associated with seeking, applying for and obtaining formal exemptive,
no-action
and/or other relief from the SEC in connection with the operation of a managed distribution plan; and (xiii) expenses of the Fund which are capitalized in accordance with U.S. GAAP.
Each of the Trustees of the Funds who is not an interested person under Section 2(a)(19) of the Act, (the “Independent Trustees”), also serves as a trustee of a number of other
closed-end
funds for which PIMCO serves as investment manager (together with the Funds, the “PIMCO
Closed-End
Funds”), as well as PIMCO California Flexible Municipal Income Fund, PIMCO Flexible Emerging Markets Income Fund, PIMCO Flexible Credit Income Fund and PIMCO Flexible Municipal Income Fund, each a closed end management investment company managed by PIMCO that is operated as an “interval fund” (the ”PIMCO Interval Funds”), and PIMCO Managed Accounts Trust, an
open-end
management investment company with multiple series for which PIMCO serves as investment adviser and administrator (“PMAT” and, together with the PIMCO
Closed-End
Funds and the PIMCO Interval Funds, the “PIMCO-Managed Funds”). In addition, during the reporting period,
| | | | | | | | | | | | |
| | | | ANNUAL REPORT | | | | | | | JUNE 30, 2022 | | | 145 |
| | | | |
Notes to Financial Statements | | | | |
each of the Independent Trustees (other than Mr. Kittredge and Ms. Vandecruze) also served as a trustee of certain funds for which Allianz Global Investors U.S. LLC (“AGI U.S.”), an affiliate of PIMCO, served as investment manager.
On May 17, 2022, AGI U.S. pleaded guilty in connection with the proceeding United States of America v. Allianz Global Investors U.S. LLC. AGI U.S. is an indirect subsidiary of Allianz SE. The conduct resulting in the matter described above occurred entirely within AGI U.S. and did not involve PIMCO or any personnel of PIMCO. Nevertheless, because of the disqualifying conduct of AGI U.S., their affiliate, PIMCO would have been disqualified from serving as the investment adviser to the Funds in the absence of SEC exemptive relief. PIMCO has received exemptive relief from the SEC to permit PIMCO to continue serving as investment adviser for U.S.- registered investment companies, including the Funds.
The Funds pay no compensation directly to any Trustee or any other officer who is affiliated with the Manager, all of whom receive remuneration for their services to the Funds from the Manager or its affiliates.
10. RELATED PARTY TRANSACTIONS
The Manager is a related party. Fees payable to this party are disclosed in Note 9, Fees and Expenses, and the accrued related party fee amounts are disclosed on the Statements of Assets and Liabilities.
Certain Funds are permitted to purchase or sell securities from or to certain related affiliated funds under specified conditions outlined in procedures adopted by the Board. The procedures have been designed to ensure that any purchase or sale of securities by the Funds from or to another fund or portfolio that are, or could be, considered an affiliate, or an affiliate of an affiliate, by virtue of having a common investment adviser (or affiliated investment advisers), common Trustees and/or common officers complies with Rule
17a-7
under the Act. Further, as defined under the procedures, each transaction is effected at the current market price. Purchases and sales of securities pursuant to Rule
17a-7
under the Act for the period ended June 30, 2022, were as follows (amounts in thousands
):
| | | | | | | | | | | | |
| | | | | | | | | |
| | | |
| PCM Fund, Inc. | | | | | | $ | 2,040 | | | $ | 16,631 | |
| | | |
PIMCO Global StocksPLUS & Income Fund | | | | | | | 2,103 | | | | 18,333 | |
| | | |
| PIMCO Strategic Income Fund, Inc. | | | | | | | 16,394 | | | | 49,391 | |
| | | |
| PIMCO Access Income Fund | | | | | | | 33,931 | | | | 1,062 | |
| | | |
| PIMCO Dynamic Income Fund | | | | | | | 56,728 | | | | 238,649 | |
| | | |
| PIMCO Dynamic Income Opportunities Fund | | | | | | | 10,146 | | | | 483,546 | |
| A zero balance may reflect actual amounts rounding to less than one thousand. |
11. GUARANTEES AND INDEMNIFICATIONS
Under the organizational documents of PIMCO Global StocksPLUS
& Income Fund, PIMCO Access Income Fund, PIMCO Dynamic Income Fund and PIMCO Dynamic Income Opportunities Fund, each Trustee and officer is indemnified, to the extent permitted by the Act, against certain liabilities that may arise out of performance of their duties to the Funds. Under the organizational documents of PCM Fund, Inc., and PIMCO Strategic Income Fund, Inc., each Director and officer is indemnified to the fullest extent permitted by Maryland law and the Act. For PCM Fund, Inc., employees and agents of the Fund are indemnified to the maximum extent permitted by Maryland Law and the Act. For PIMCO Strategic Income Fund, Inc., employees and agents of the Fund may be indemnified to the extent determined by the Board and subject to the limitations of the Act. Additionally, in the normal course of business, the Funds enter into contracts that contain a variety of indemnification clauses. The Funds’ maximum exposure under these arrangements is unknown as this would involve future claims that may be made against the Funds that have not yet occurred. However, the Funds have not had prior claims or losses pursuant to these contracts.
12. PURCHASES AND SALES OF SECURITIES
The length of time a Fund has held a particular security is not generally a consideration in investment decisions. A change in the securities held by a Fund is known as “portfolio turnover.” Each Fund may engage in frequent and active trading of portfolio securities to achieve its investment objective, particularly during periods of volatile market movements. High portfolio turnover may involve correspondingly greater transaction costs, including brokerage commissions or dealer
mark-ups
and other transaction costs on the sale of securities and reinvestments in other securities, which are borne by the Fund. Such sales may also result in realization of taxable capital gains, including short-term capital gains (which are generally taxed at ordinary income tax rates when distributed to shareholders). The transaction costs associated with portfolio turnover may adversely affect a Fund’s performance. The portfolio turnover rates are reported in the Financial Highlights.
| | | | | | |
| 146 | | PIMCO CLOSED-END FUNDS | | | | |
Purchases and sales of securities (excluding short-term investments) for the period ended June 30, 2022, were as follows (amounts in thousands
):
| | | | | | | | | | | | | | | | | | | | |
| | | | | | | | |
| | | | |
| | | | | | | | | | | | | |
| | | | | |
| PCM Fund, Inc. | | | | | | $ | 26,888 | | | $ | 25,327 | | | $ | 106,790 | | | $ | 94,022 | |
| | | | | |
PIMCO Global StocksPLUS & Income Fund | | | | | | | 583,033 | | | | 579,621 | | | | 101,771 | | | | 106,835 | |
| | | | | |
| PIMCO Strategic Income Fund, Inc. | | | | | | | 4,349,899 | | | | 4,502,344 | | | | 176,405 | | | | 200,766 | |
| | | | | |
| PIMCO Access Income Fund | | | | | | | 25,014 | | | | 0 | | | | 1,392,474 | | | | 120,008 | |
| | | | | |
| PIMCO Dynamic Income Fund | | | | | | | 55,788 | | | | 8,819 | | | | 3,014,130 | | | | 1,623,120 | |
| | | | | |
| PIMCO Dynamic Income Opportunities Fund | | | | | | | 379,716 | | | | 321,967 | | | | 1,324,280 | | | | 1,664,242 | |
| A zero balance may reflect actual amounts rounding to less than one thousand. |
13. COMMON SHARES OFFERING
PCM Fund, Inc. has the authority to issue 300 million shares of $0.001 par value common stock. PIMCO Strategic Income Fund, Inc. has the authority to issue 500 million shares of $0.00001 par value common stock. PIMCO Access Income Fund (“PAXS”) has the authority to issue 43.3 million shares of $0.00001 par value common stock. Each of PIMCO Global StocksPLUS
& Income Fund, PIMCO Dynamic Income Fund (“PDI”) and PIMCO Dynamic Income Opportunities Fund (“PDO”) has been authorized to issue an unlimited number of Common Shares at a par value of $0.00001 per share (each of the foregoing Fund’s shares as the context requires, “Common Shares”).
In January 2022, PAXS conducted an initial public offering of 43,300,000 Common Shares representing proceeds to PAXS of $866,000,000. Total proceeds were $995,821,220 after the underwriters of such offering exercised their over-allotment option for a total of 6,491,061 shares. PIMCO, and not the Fund, paid all offering and underwriting expenses in connection with the offering.
As of the end of the reporting period, PDI had an effective registration statement on file with the SEC authorizing the Fund to issue shares through the “shelf” registration process pursuant to Rule 415 under the Securities Act (each, a “Shelf Registration Statement”). Pursuant to such Shelf Registration Statement, PDI may offer and sell Common Shares having an aggregate offering value of up to $1,000,000,000. PDI may have had one or more prior Shelf Registration Statements in effect during this and/or previous fiscal periods authorizing the sale of additional Common Shares.
PDI has entered into a sales agreement (a “Sales Agreement”) with JonesTrading Institutional Services LLC (“JonesTrading”), pursuant to the Fund may offer and sell its Common Shares offered by an applicable prospectus supplement through JonesTrading as its agent in negotiated transactions or transactions that are deemed to be “at the market” as defined in Rule 415 under the Securities Act, including sales made directly on the NYSE or sales made to or through a market maker other than on an exchange, at prices related to the prevailing market
prices or at negotiated prices. The Fund will pay JonesTrading compensation of up to 1.00% of the gross proceeds with respect to sales of the Common Shares actually effected by JonesTrading under the Sales Agreement.
The aggregate dollar amount of Common Shares registered under PDI’s Shelf Registration Statement as of the end of the periods described below, as well as the number of Common Shares sold and the total amount of offering proceeds (net of offering costs, if any) received by each Fund under one or more Shelf Registration Statements during the Fund’s most recent and prior fiscal periods were as follows:
| | | | | | | | | | | | |
| | | | | | | |
| | | |
| | | | | | Year Ended 06/30/2022 | | | Year Ended 06/30/2021 | |
| | | |
| Common Shares registered (aggregate $) | | | | | | $ | 1,000,000,000 | | | $ | 600,000,000 | |
| | | |
| Common Shares sold | | | | | | | 7,210,365 | | | | 8,847,510 | |
| | | |
| Common Shares sold in Reorganization | | | | | | | 147,078,552 | | | | 0 | |
| | | |
| Offering proceeds (net of offering costs) | | | | | | | 181,490,778 | | | | 226,915,535 | |
| | | |
| Offering proceeds (net of offering costs) in Reorganization | | | | | | | 3,562,154,298 | | | | 0 | |
A Fund may not sell any Common Shares at a price below the NAV of such Common Shares, exclusive of any distributing commission or discount. Sales of the Common Shares, if any, may be made in negotiated transactions or transactions that are deemed to be “at the market”, including sales made directly on the NYSE or sales made to or through a market maker other than on an exchange, at prices related to the prevailing market prices or at negotiated prices.
| | | | | | | | | | | | |
| | | | ANNUAL REPORT | | | | | | | JUNE 30, 2022 | | | 147 |
| | | | |
Notes to Financial Statements | | | | |
14. BASIS FOR CONSOLIDATION
PCILS I LLC, PDILS I LLC, PDOLS I LLC, RLM 4365 LLC, PAXSLS I LLC, and RLM 4355 LLC (each a “Subsidiary” and, collectively, the “Subsidiaries”), each a Delaware LLC exempted company, were formed as wholly owned subsidiaries acting as investment vehicles for PIMCO Access Income Fund, PIMCO Dynamic Income Fund and PIMCO Dynamic Income Opportunities Fund (for purposes of this section, each a “Fund” and, collectively, the “Funds”), as applicable, in order to effect certain investments consistent with each Fund’s objectives and policies in effect from time to time. PIMCO Access Income Fund’s, PIMCO Dynamic Income Fund’s and PIMCO Dynamic Income Opportunities Fund’s investment portfolios have been consolidated and include the portfolio holdings of each Fund’s respective Subsidiary. Accordingly, the consolidated financial statements for each Fund include the accounts of each Fund’s respective subsidiary. All inter-company transactions and balances have been eliminated. This structure was established so that certain loans could be held by a separate legal entity from the Funds. See the table below for details regarding the structure, incorporation and relationship as of June 30, 2022 of the Subsidiaries.
| | | | | | | | | | | | | | |
| | | | | | | | | | Subsidiary %
of Consolidated
Fund Net Assets | |
| | | | |
| PIMCO Access Income Fund | | | | | | PAXSLS I LLC | | | 01/31/2022 | | | | 1.1% | |
| | | | |
| PIMCO Access Income Fund | | | | | | RLM 4355 LLC | | | 01/31/2022 | | | | 0.0% | |
| | | | |
| PIMCO Dynamic Income Fund | | | | | | | | | 03/07/2013 | | | | 0.7% | |
| | | | |
| PIMCO Dynamic Income Fund | | | | | | | | | 03/12/2013 | | | | 0.5% | |
| | | | |
| PIMCO Dynamic Income Opportunities Fund | | | | | | PDOLS I LLC | | | 01/15/2021 | | | | 0.0% | |
| | | | |
| PIMCO Dynamic Income Opportunities Fund | | | | | | RLM 4365 LLC | | | 01/15/2021 | | | | 0.0% | |
15. REGULATORY AND LITIGATION MATTERS
The Funds are not named as defendants in any material litigation or arbitration proceedings and are not aware of any material litigation or claim pending or threatened against them.
The foregoing speaks only as of the date of this report.
16. REORGANIZATION
The Board approved the reorganization (the “Reorganization”) of PIMCO Income Opportunity Fund and PIMCO Dynamic Credit and Mortgage Income Fund (each an “Acquired Fund”) with and into PIMCO Dynamic Income Fund (the “Acquiring Fund”). Pursuant to the Reorganization, shareholders of the Acquired Funds became shareholders of the Acquiring Fund. The Reorganization was completed upon the close of business on December 10, 2021. The transaction was structured to qualify as a
tax-free
reorganization under Section 368(a) of the Internal Revenue Code (the “Code”). In the Reorganization, the Acquiring Fund acquired all of the assets and assumed of all the liabilities of each of the Acquired Funds in exchange for newly-issued common shares of the Acquiring Fund (“Merger Shares”). Shareholders of the Acquired Funds received Merger Shares (and cash in lieu of fractional Merger Shares, if any), equal to the aggregate net asset value of their holdings of each Acquired Fund, as applicable. The exchange was based on the net asset value per common share (“NAV”) of the Acquiring Fund and each of the Acquired Funds as of the close of business on December 10, 2021. The investment portfolios of the Acquired Funds, with an aggregate fair value of approximately $6,239,358,055 and aggregate identified cost of approximately $6,269,110,151 as of the date of the Reorganization, was the principal asset acquired by the Acquiring Fund. For financial statement purposes, assets received and shares issued by the Acquiring Fund were recorded at fair value; however, the cost basis of the investments received from each Acquired Fund was carried forward to align ongoing reporting of the Acquiring Fund’s realized and unrealized gains and losses with amounts distributable to shareholders for tax purposes. The following is a summary of Shares Outstanding, Net Assets, Net Asset Value Per Share and Net Unrealized Appreciation (Depreciation) immediately before and after the Reorganization (amounts in thousands):
| | | | | | | | | | | | | | | | | | | | |
| | | | | | | | | | | | | | | Net Unrealized
Appreciation
(Depreciation) | |
| Acquired Fund | | | | | | | | | | | | | | | | | | | | |
| | | | | |
| PIMCO Income Opportunity Fund | | | | | | | 21,513 | | | | 494,490 | | | | 22.99 | | | | 2,056 | |
| | | | | |
| PIMCO Dynamic Credit and Mortgage Income Fund | | | | | | | 154,747 | | | | 3,067,680 | | | | 19.82 | | | | (31,809 | ) |
| Acquiring Fund | | | | | | | | | | | | | | | | | | | | |
| | | | | |
| PIMCO Dynamic Income Fund | | | | | | | 73,058 | | | | 1,769,430 | | | | 24.22 | | | | 1,387 | |
| Post Reorganization | | | | | | | | | | | | | | | | | | | | |
| | | | | |
| Acquiring Fund | | | | | | | | | | | | | | | | | | | | |
| | | | | |
| PIMCO Dynamic Income Fund | | | | | | | 220,137 | | | | 5,331,584 | | | | 24.22 | | | | (28,366 | ) |
| | | | | | |
| 148 | | PIMCO CLOSED-END FUNDS | | | | |
PIMCO paid all fees and expenses, including legal and accounting expenses, printing and mailing expenses, or other similar expenses incurred in connection with the Reorganization transaction, excluding transaction costs in connection with the purchase or sale of portfolio securities, if any. Assuming the Reorganization had been completed on July 1, 2021, the beginning of the annual reporting period, the pro forma results of operations for the period ended June 30, 2022, are as follows (amounts in thousands):
| | | | | | | | |
| | |
| Net Income | | | | | | $ | 603,000 | |
| | |
| Net realized and unrealized gain/loss | | | | | | | (1,013,276 | ) |
| | |
| Total increase in net assets from investments operations | | | | | | $ | (410,276 | ) |
Because the combined investment portfolios have been managed as a single integrated portfolio since the Reorganization was completed, it is not practicable to separate the amounts of revenue and earnings of the Acquired Funds that have been included in the Consolidated Statements of Operations since December 10, 2021.
17. FEDERAL INCOME TAX MATTERS
Each Fund intends to qualify as a regulated investment company under Subchapter M of the Code and distribute all of its taxable income and
net realized gains, if applicable, to shareholders. Accordingly, no provision for Federal income taxes has been made.
A Fund may be subject to local withholding taxes, including those imposed on realized capital gains. Any applicable foreign capital gains tax is accrued daily based upon net unrealized gains, and may be payable following the sale of any applicable investments.
In accordance with U.S. GAAP, the Manager has reviewed the Funds’ tax positions for all open tax years. As of June 30, 2022, the Funds have recorded no liability for net unrecognized tax benefits relating to uncertain income tax positions they have taken or expect to take in future tax returns.
The Funds file U.S. federal, state, and local tax returns as required. The Funds’ tax returns are subject to examination by relevant tax authorities until expiration of the applicable statute of limitations, which is generally three years after the filing of the tax return but which can be extended to six years in certain circumstances. Tax returns for open years have incorporated no uncertain tax positions that require a provision for income taxes.
As of June 30, 2022, the components of distributable taxable earnings are as follows (amounts in thousands
):
| | | | | | | | | | | | | | | | | | | | | | | | | | | | | | | | | | | | |
| | | | | | Undistributed Ordinary Income (1) | | | Undistributed
Long-Term
Capital Gains | | | Net Tax Basis Unrealized Appreciation/ (Depreciation) (2) | | | Other Accounting Differences (3) | | | Accumulated Capital Losses (4) | | | Qualified Late-Year Loss Deferral - Capital (5) | | | Qualified Late-Year Loss Deferral - Ordinary (6) | | | Total
Components of
Distributable
Earnings | |
| | | | | | | | | |
| PCM Fund, Inc. | | | | | | $ | 0 | | | $ | 0 | | | $ | (9,189 | ) | | $ | (943 | ) | | $ | (11,752 | ) | | $ | 0 | | | $ | 0 | | | $ | (21,884 | ) |
| | | | | | | | | |
PIMCO Global StocksPLUS & Income Fund | | | | | | | 1,402 | | | | 0 | | | | (31,480 | ) | | | (773 | ) | | | (22,550 | ) | | | 0 | | | | 0 | | | | (53,401 | ) |
| | | | | | | | | |
| PIMCO Strategic Income Fund, Inc. | | | | | | | 0 | | | | 0 | | | | (58,493 | ) | | | (2,289 | ) | | | (70,547 | ) | | | 0 | | | | 0 | | | | (131,329 | ) |
| | | | | | | | | |
| PIMCO Access Income Fund | | | | | | | 14,937 | | | | 0 | | | | (124,301 | ) | | | (5,133 | ) | | | (8,512 | ) | | | 0 | | | | 0 | | | | (123,009 | ) |
| | | | | | | | | |
| PIMCO Dynamic Income Fund | | | | | | | 186,091 | | | | 0 | | | | (1,251,335 | ) | | | (49,913 | ) | | | (517,228 | ) | | | 0 | | | | 0 | | | | (1,632,385 | ) |
| | | | | | | | | |
| PIMCO Dynamic Income Opportunities Fund | | | | | | | 88,095 | | | | 0 | | | | (562,298 | ) | | | (13,030 | ) | | | 0 | | | | (29,250 | ) | | | 0 | | | | (516,483 | ) |
| A zero balance may reflect actual amounts rounding to less than one thousand. |
| Includes undistributed short-term capital gains, if any. |
| Adjusted for open wash sale loss deferrals and the accelerated recognition of unrealized gain or loss on certain futures, options and forward contracts for federal income tax purposes. Also adjusted for differences between book and tax realized and unrealized gain (loss) on: hyperinflationary investments, swap contracts, straddle loss deferrals, passive foreign investment companies (PFICs), interest accrued on defaulted securities, return of capital distributions from REITs, grantor trusts and partnerships. |
| Represents differences in income tax regulations and financial accounting principles generally accepted in the United States of America, mainly for distributions payable at fiscal year-end. |
| Capital losses available to offset future net capital gains as shown below. |
| Capital losses realized during the period November 1, 2021 through June 30, 2022 which the Funds elected to defer to the following taxable year pursuant to income tax regulations. |
| Specified losses realized during the period November 1, 2021 through June 30, 2022 and Ordinary losses realized during the period January 1, 2022 through June 30, 2022 which the Funds elected to defer to the following taxable year pursuant to income tax regulations. |
Under the Regulated Investment Company Modernization Act of 2010, a fund is permitted to carry forward any new capital losses for an unlimited period. Additionally, such capital losses that are carried forward will retain their character as either short-term or long-term capital losses rather than being considered all short-term under previous law.
| | | | | | | | | | | | |
| | | | ANNUAL REPORT | | | | | | | JUNE 30, 2022 | | | 149 |
| | | | | | |
Notes to Financial Statements | | | | | | |
As of June 30, 2022, the Funds had the following post-effective capital losses with no expiration (amounts in thousands
):
| | | | | | | | | | | | |
| | | | | | | | | | |
| | | |
| PCM Fund, Inc. | | | | | | $ | 658 | | | $ | 11,094 | |
| | | |
PIMCO Global StocksPLUS & Income Fund | | | | | | | 22,550 | | | | 0 | |
| | | |
| PIMCO Strategic Income Fund, Inc. | | | | | | | 22,558 | | | | 47,989 | |
| | | |
| PIMCO Access Income Fund | | | | | | | 8,512 | | | | 0 | |
| | | |
| PIMCO Dynamic Income Fund* | | | | | | | 270,855 | | | | 246,373 | |
| | | |
| PIMCO Dynamic Income Opportunities Fund | | | | | | | 0 | | | | 0 | |
| A zero balance may reflect actual amounts rounding to less than one thousand. |
| * | Portion of amount represents realized loss and recognized built-in loss under IRC sections 382-83, which is carried forward to future years to offset future realized gain subject to certain limitations. |
As of June 30, 2022, the aggregate cost and the net unrealized appreciation/(depreciation) of investments for federal income tax purposes are as follows (amounts in thousands
):
| | | | | | | | | | | | | | | | | | | | |
| | | | | | | | | | | | | | | Net Unrealized Appreciation/ (Depreciation) (7) | |
| | | | | |
| PCM Fund, Inc. | | | | | | $ | 180,794 | | | $ | 16,664 | | | $ | (25,854 | ) | | $ | (9,190 | ) |
| | | | | |
PIMCO Global StocksPLUS & Income Fund | | | | | | | 193,723 | | | | 11,034 | | | | (42,611 | ) | | | (31,577 | ) |
| | | | | |
| PIMCO Strategic Income Fund, Inc. | | | | | | | 518,026 | | | | 47,479 | | | | (106,657 | ) | | | (59,178 | ) |
| | | | | |
| PIMCO Access Income Fund | | | | | | | 1,372,378 | | | | 8,823 | | | | (134,837 | ) | | | (126,014 | ) |
| | | | | |
| PIMCO Dynamic Income Fund | | | | | | | 9,487,944 | | | | 658,653 | | | | (1,923,186 | ) | | | (1,264,533 | ) |
| | | | | |
| PIMCO Dynamic Income Opportunities Fund | | | | | | | 3,672,156 | | | | 67,216 | | | | (633,955 | ) | | | (566,739 | ) |
| A zero balance may reflect actual amounts rounding to less than one thousand. |
| Adjusted for open wash sale loss deferrals and the accelerated recognition of unrealized gain or loss on certain futures, options and forward contracts for federal income tax purposes. Also adjusted for differences between book and tax realized and unrealized gain (loss) on: hyperinflationary investments, swap contracts, straddle loss deferrals, passive foreign investment companies (PFICs), interest accrued on defaulted securities, return of capital distributions from REITs, grantor trusts and partnerships. |
For the fiscal years ended June 30, 2022 and June 30, 2021, respectively, the Funds made the following tax basis distributions (amounts in thousands
):
| | | | | | | | | | | | | | | | | | | | | | | | | | | | |
| | | | | | | | | | |
| | | | | | | |
| | | | | | Ordinary Income Distributions (8) | | | Long-Term
Capital Gain
Distributions | | | | | | Ordinary Income Distributions (8) | | | Long-Term
Capital Gain
Distributions | | | | |
| | | | | | | |
| PCM Fund, Inc. | | | | | | $ | 10,961 | | | $ | 0 | | | $ | 303 | | | $ | 11,184 | | | $ | 0 | | | $ | 0 | |
| | | | | | | |
PIMCO Global StocksPLUS & Income Fund | | | | | | | 9,228 | | | | 0 | | | | 0 | | | | 9,146 | | | | 0 | | | | 0 | |
| | | | | | | |
| PIMCO Strategic Income Fund, Inc. | | | | | | | 26,999 | | | | 0 | | | | 320 | | | | 18,313 | | | | 0 | | | | 8,736 | |
| | | | | | | |
| PIMCO Access Income Fund | | | | | | | 20,531 | | | | 0 | | | | 0 | | | | 0 | | | | 0 | | | | 0 | |
| | | | | | | |
| PIMCO Dynamic Income Fund | | | | | | | 391,635 | | | | 0 | | | | 0 | | | | 167,415 | | | | 0 | | | | 8,919 | |
| | | | | | | |
| PIMCO Dynamic Income Opportunities Fund | | | | | | | 208,371 | | | | 904 | | | | 0 | | | | 51,375 | | | | 0 | | | | 0 | |
| A zero balance may reflect actual amounts rounding to less than one thousand. |
| Includes short-term capital gains distributed, if any. |
| A portion of the distributions made represents a tax return of capital. Return of capital distributions have been reclassified from undistributed net investment income to paid-in capital to more appropriately conform financial accounting to tax accounting. |
| | | | | | |
| 150 | | PIMCO CLOSED-END FUNDS | | | | |
18. SUBSEQUENT EVENTS
In preparing these financial statements, the Funds’ management has evaluated events and transactions for potential recognition or disclosure through the date the financial statements were issued.
On July 1, 2022, the following distributions were declared to common shareholders payable August 1, 2022 to shareholders of record on July 8, 2022:
| | | | | | | | |
| | |
| PCM Fund, Inc. | | | | | | $ | 0.080000 per common share | |
| | |
PIMCO Global StocksPLUS & Income Fund | | | | | | $ | 0.069000 per common share | |
| | |
| PIMCO Strategic Income Fund, Inc. | | | | | | $ | 0.051000 per common share | |
| | |
| PIMCO Access Income Fund | | | | | | $ | 0.116700 per common share | |
| | |
| PIMCO Dynamic Income Fund | | | | | | $ | 0.220500 per common share | |
| | |
| PIMCO Dynamic Income Opportunities Fund | | | | | | $ | 0.127900 per common share | |
On August 1, 2022, the following distributions were declared to common shareholders payable September 1, 2022 to shareholders of record on August 10, 2022:
| | | | | | | | |
| | |
| PCM Fund, Inc. | | | | | | $ | 0.080000 per common share | |
| | |
PIMCO Global StocksPLUS & Income Fund | | | | | | $ | 0.069000 per common share | |
| | |
| PIMCO Strategic Income Fund, Inc. | | | | | | $ | 0.051000 per common share | |
| | |
| PIMCO Access Income Fund | | | | | | $ | 0.116700 per common share | |
| | |
| PIMCO Dynamic Income Fund | | | | | | $ | 0.220500 per common share | |
| | |
| PIMCO Dynamic Income Opportunities Fund | | | | | | $ | 0.127900 per common share | |
There were no other subsequent events identified that require recognition or disclosure.
| | | | | | | | | | | | |
| | | | ANNUAL REPORT | | | | | | | JUNE 30, 2022 | | | 151 |
| | | | |
Report of Independent Registered Public Accounting Firm | | | | |
To the Board of Directors and Shareholders of PCM Fund, Inc. and PIMCO Strategic Income Fund, Inc. and the Board of Trustees and Shareholders of PIMCO Global StocksPLUS
& Income Fund, PIMCO Access Income Fund, PIMCO Dynamic Income Fund and PIMCO Dynamic Income Opportunities Fund
Opinions on the Financial Statements
We have audited the accompanying statements of assets and liabilities, including the schedules of investments, of each of the funds
indicated in the table below (hereafter collectively referred to as the “Funds”) as of June 30, 2022, the related statements of operations, of cash flows, and of changes in net assets for each of the periods indicated in the table below, including the related notes, and the financial highlights for each of the periods indicated in the table below (collectively referred to as the “financial statements”). In our opinion, the financial statements present fairly, in all material respects, the financial position of each of the Funds as of June 30, 2022, the results of each of their operations and each of their cash flows, the changes in each of their net assets and each of the financial highlights for each of the periods indicated in the table below in conformity with accounting principles generally accepted in the United States of America.
PIMCO Global StocksPLUS
& Income Fund (1)
PIMCO Strategic Income Fund, Inc. (1)
PIMCO Access Income Fund (2)
PIMCO Dynamic Income Fund (3)
PIMCO Dynamic Income Opportunities Fund (4)
(1) Statement of assets and liabilities, including the schedule of investments as of June 30, 2022 and the related statements of operations and cash flows for the year ended June 30, 2022, statement of changes in net assets for the years ended June 30, 2022 and 2021 and the financial highlights for the years ended June 30, 2022, 2021, 2020, 2019 and 2018
(2) Consolidated statement of assets and liabilities, including the consolidated schedule of investments as of June 30, 2022 and the related consolidated statements of operations, of cash flows, and of changes in net assets and the financial highlights (consolidated) for the period January 31, 2022 (inception date) through June 30, 2022
(3) Consolidated statement of assets and liabilities, including the consolidated schedule of investments as of June 30, 2022 and the related consolidated statements of operations and cash flows for the year ended June 30, 2022, consolidated statement of changes in net assets for the years ended June 30, 2022 and 2021 and the financial highlights (consolidated) for the years ended June 30, 2022, 2021, 2020, 2019 and 2018
(4) Consolidated statement of assets and liabilities, including the consolidated schedule of investments as of June 30, 2022 and the related consolidated statements of operations and cash flows for the year ended June 30, 2022 and consolidated statement of changes in net assets and the financial highlights (consolidated) for the year ended June 30, 2022 and for the period January 29, 2021 (inception date) through June 30, 2021
Basis for Opinions
These financial statements are the responsibility of the Funds’ management. Our responsibility is to express an opinion on the Funds’ financial statements based on our audits. We are a public accounting firm registered with the Public Company Accounting Oversight Board (United States) (PCAOB) and are required to be independent with respect to the Funds in accordance with the U.S. federal securities laws and the applicable rules and regulations of the Securities and Exchange Commission and the PCAOB.
We conducted our audits of these financial statements in accordance with the standards of the PCAOB. Those standards require that we plan and perform the audit to obtain reasonable assurance about whether the financial statements are free of material misstatement, whether due to error or fraud.
Our audits included performing procedures to assess the risks of material misstatement of the financial statements, whether due to error or fraud, and performing procedures that respond to those risks. Such procedures included examining, on a test basis, evidence regarding the amounts and disclosures in the financial statements. Our audits also included evaluating the accounting principles used and significant estimates made by management, as well as evaluating the overall presentation of the financial statements. Our procedures included confirmation of securities owned as of June 30, 2022 by correspondence with the custodian, brokers and agent banks; when replies were not received from brokers or agent banks, we performed other auditing procedures. We believe that our audits provide a reasonable basis for our opinions.
/s/ PricewaterhouseCoopers LLP
We have served as the auditor of one or more investment companies in PIMCO Taxable Closed-End Funds since 1995.
| | | | | | |
| 152 | | PIMCO CLOSED-END FUNDS | | | | |
| | | | | | |
| | (abbreviations that may be used in the preceding statements) | | | | (Unaudited) |
| | | | | | | | | | |
|
Counterparty Abbreviations: |
| | | | | |
| | | | | | | | | | Morgan Stanley & Co. International PLC |
| | | | | |
| | | | | | Credit Suisse International | | | | Mizuho Securities USA LLC |
| | | | | |
| | | | | | Fixed Income Clearing Corporation | | | | Nomura Securities International Inc. |
| | | | | |
| | | | | | | | | | |
| | | | | |
| | | | | | Goldman Sachs International | | | | Royal Bank of Canada Europe Limited |
| | | | | |
| | | | | | | | | | |
| | | | | |
| | | | | | Crédit Agricole Corporate and Investment Bank S.A. | | | | RBC (Barbados) Trading Bank Corp. |
| | | | | |
| | Barclays Bank PLC London Branch | | | | | | | | |
| | | | | |
| | The Bank of Nova Scotia - Toronto | | | | JP Morgan Chase Bank N.A. | | | | Standard Chartered Bank, London |
| | | | | |
| | | | | | J.P. Morgan Securities LLC | | | | |
| | | | | |
| | Natixis Securities Americas LLC | | | | | | | | |
| | | | | |
| | | | | | Merrill Lynch International | | | | The Toronto-Dominion Bank |
| | | | | |
| | Canadian Imperial Bank of Commerce World Markets | | | | | | | | |
| | | | | |
| | Canadian Imperial Bank of Commerce | | | | Morgan Stanley Capital Services LLC | | | | |
| | | | | |
| | | | | | | | | | |
| | | | |
| | | | | | | | |
| | | | | |
| | | | | | | | | | |
| | | | | |
| | | | | | | | | | |
| | | | | |
| | | | | | | | | | |
| | | | | |
| | | | | | | | | | |
| | | | | |
| | | | | | | | | | |
| | | | | |
| | | | | | | | | | |
| | | | | |
| | Chinese Renminbi (Offshore) | | | | | | | | |
| | | | | |
| | Chinese Renminbi (Mainland) | | | | | | | | |
| | | | |
| | | | | | | | |
| | | | | |
| | Chicago Mercantile Exchange | | | | | | | | |
| | | | |
Index/Spread Abbreviations: | | | | | | | | |
| | | | | |
| | 12 Month Treasury Average | | | | | | | | Sterling Overnight Interbank Average Rate |
| | | | | |
| | Asset-Backed Securities Index - Home Equity | | | | | | | | |
| | | | | |
| | Argentina Badlar Floating Rate Notes | | | | Standard & Poor’s 500 Index | | | | |
| | | | | |
| | | | | | Secured Overnight Financing Rate | | | | |
| | | | | |
| | Brazil Interbank Deposit Rate | | | | 30-day Secured Overnight Financing Rate Average | | | | 3 Month Warsaw Inter Bank Offering Rate |
| | | | | |
| | Cost of Funds - 11th District of San Francisco | | | | | | | | |
| | | | | |
| | | | | | | | | | |
| | | | |
Municipal Bond or Agency Abbreviations: | | | | | | | | |
| | | | | |
| | American Capital Access Holding Ltd. | | | | | | | | |
| | | | |
| | | | | | | | |
| | | | | |
| | | | | | Earnings before Interest, Taxes, Depreciation and Amoritization | | | | Real Estate Mortgage Investment Conduit |
| | | | | |
| | | | | | Euro Interbank Offered Rate | | | | |
| | | | | |
| | | | | | Johannesburg Interbank Agreed Rate | | | | |
| | | | | |
| | | | | | London Interbank Offered Rate | | | | Interest rate to be determined when loan settles or at the time of funding |
| | | | | |
| | Collateralized Bond Obligation | | | | Monthly payment based on 28-day periods. One year consists of 13 periods. | | | | Tasa de Interés Interbancaria de Equilibrio “Equilibrium Interbank Interest Rate” |
| | | | | |
| | Collateralized Debt Obligation | | | | | | | | Warsaw Interbank Offered Rate |
| | | | | |
| | Collateralized Loan Obligation | | | | | | | | |
| | | | | |
| | Designated Activity Company | | | | Prague Interbank Offered Rate | | | | |
| | | | | | | | | | | | |
| | | | ANNUAL REPORT | | | | | | | JUNE 30, 2022 | | | 153 |
| | | | |
Federal Income Tax Information | | | | (Unaudited) |
As required by the Internal Revenue Code (“Code”) and Treasury Regulations, if applicable, shareholders must be notified within 60 days of the Funds’ fiscal year end regarding the status of qualified dividend income and the dividend received deduction.
Dividend Received Deduction.
Corporate shareholders are generally entitled to take the dividend received deduction on the portion of a fund’s dividend distribution that qualifies under tax law. The percentage of the following Funds’ fiscal 2022 ordinary income dividend that qualifies for the corporate dividend corporate dividend received deduction is set forth below:
Qualified Dividend Income.
Under the Jobs and Growth Tax Relief Reconciliation Act of 2003, the following percentage of ordinary dividends paid during the fiscal year ended June 30, 2022 was designated as “qualified dividend income” as defined in the Jobs and Growth Tax Relief Reconciliation Act of 2003 subject to reduced tax rates in 2022:
Qualified Interest Income and Qualified Short-Term Capital Gain (for
non-U.S.
resident shareholders only).
Under the American Jobs Creation Act of 2004, the following amounts of ordinary dividends paid during the fiscal year ended June 30, 2022 are considered to be derived from “qualified interest income,” as defined in Section 871(k)(1)(E) of the Code, and therefore are designated as interest-related dividends, as defined in Section 871(k)(1)(C) of the Code. Further, the following amounts of ordinary dividends paid during the fiscal year ended June 30, 2022 are considered to be derived from “qualified short-term capital gain,” as defined in Section 871(k)(2)(D) of the Code, and therefore are designated as qualified short-term gain dividends, as defined by Section 871(k)(2)(C) of the Code.
Section 163(j) Interest Dividends.
The Funds intend to pass through the maximum amount allowable as Section 163(j) Interest defined in Proposed Treasury
Section 1.163(j)-1(b).
The 163(j) percentage of ordinary income distributions are as follows:
| | | | | | | | | | | | | | | | | | | | | | | | |
| | | | | | Dividend
Received
Deduction
% | | | | | | Qualified Interest Income (000s ) | | | Qualified Short-Term Capital Gains (000s ) | | | 163(j) Interest Dividends (000s ) | |
| | | | | | |
| PCM Fund, Inc. | | | | | | | 2% | | | | 2% | | | $ | 11,264 | | | $ | 0 | | | $ | 9,161 | |
| | | | | | |
PIMCO Global StocksPLUS & Income Fund | | | | | | | 0% | | | | 0% | | | | 9,228 | | | | 0 | | | | 8,441 | |
| | | | | | |
| PIMCO Strategic Income Fund, Inc. | | | | | | | 0% | | | | 0% | | | | 27,319 | | | | 0 | | | | 12,099 | |
| | | | | | |
| PIMCO Access Income Fund | | | | | | | 0% | | | | 0% | | | | 0 | | | | 0 | | | | 0 | |
| | | | | | |
| PIMCO Dynamic Income Fund | | | | | | | 0% | | | | 1% | | | | 244,223 | | | | 0 | | | | 179,265 | |
| | | | | | |
| PIMCO Dynamic Income Opportunities Fund | | | | | | | 0% | | | | 0% | | | | 196,148 | | | | 10,940 | | | | 115,545 | |
| A zero balance may reflect actual amounts rounding to less than one thousand. |
Shareholders are advised to consult their own tax advisor with respect to the tax consequences of their investment in the Trust. In January 2023, you will be advised on IRS Form
1099-DIV
as to the federal tax status of the dividends and distributions received by you in calendar year 2022.
Section 199A Dividends.
Non-corporate
fund shareholders of the funds below meeting certain holding period requirements may be able to deduct up to 20 percent of qualified REIT dividends passed through and reported to the shareholders by the funds as IRC section 199A dividends. The IRC section 199A percentage of ordinary dividends are as follows:
| | | | | | | | |
| | | | | | | |
| | |
| PCM Fund, Inc. | | | | | | | 30% | |
| | |
PIMCO Global StocksPLUS & Income Fund | | | | | | | 11% | |
| | |
| PIMCO Strategic Income Fund, Inc. | | | | | | | 12% | |
| | |
| PIMCO Access Income Fund | | | | | | | 83% | |
| | |
| PIMCO Dynamic Income Fund | | | | | | | 16% | |
| | |
| PIMCO Dynamic Income Opportunities Fund | | | | | | | 43% | |
| | | | | | |
| 154 | | PIMCO CLOSED-END FUNDS | | | | |
For purposes of Section 19 of the Investment Company Act of 1940 (the “Act”), the Funds estimated the periodic sources of any dividends paid during the period covered by this report in accordance with good accounting practice. Pursuant to Rule 19a-1(e) under the Act, the table below sets forth the actual source information for dividends paid during the six month period ended June 30, 2022 calculated as of each distribution period pursuant to Section 19 of the Act. The information below is not provided for U.S. federal income tax reporting purposes. The tax character of all dividends and distributions is reported on Form 1099-DIV (for shareholders who receive U.S. federal tax reporting) at the end of each calendar year. See the Financial Highlights section of this report for the tax characterization of distributions determined in accordance with federal income tax regulations for the fiscal year.
| | | | | | | | | | | | | | | | | | | | |
| | | | | | | | Net Realized
Capital Gains* | | | Paid-in Surplus or Other Capital Sources** | | | | |
| | | | | |
| January 2022 | | | | | | $ | 0.0800 | | | $ | 0.0000 | | | $ | 0.0000 | | | $ | 0.0800 | |
| | | | | |
| February 2022 | | | | | | $ | 0.0800 | | | $ | 0.0000 | | | $ | 0.0000 | | | $ | 0.0800 | |
| | | | | |
| March 2022 | | | | | | $ | 0.0800 | | | $ | 0.0000 | | | $ | 0.0000 | | | $ | 0.0800 | |
| | | | | |
| April 2022 | | | | | | $ | 0.0800 | | | $ | 0.0000 | | | $ | 0.0000 | | | $ | 0.0800 | |
| | | | | |
| May 2022 | | | | | | $ | 0.0800 | | | $ | 0.0000 | | | $ | 0.0000 | | | $ | 0.0800 | |
| | | | | |
| June 2022 | | | | | | $ | 0.0800 | | | $ | 0.0000 | | | $ | 0.0000 | | | $ | 0.0800 | |
| | | | | |
PIMCO Global StocksPLUS & Income Fund | | | | | | | | Net Realized
Capital Gains* | | | Paid-in Surplus or
Other Capital
Sources** | | | | |
| | | | | |
| January 2022 | | | | | | $ | 0.0690 | | | $ | 0.0000 | | | $ | 0.0000 | | | $ | 0.0690 | |
| | | | | |
| February 2022 | | | | | | $ | 0.0690 | | | $ | 0.0000 | | | $ | 0.0000 | | | $ | 0.0690 | |
| | | | | |
| March 2022 | | | | | | $ | 0.0690 | | | $ | 0.0000 | | | $ | 0.0000 | | | $ | 0.0690 | |
| | | | | |
| April 2022 | | | | | | $ | 0.0690 | | | $ | 0.0000 | | | $ | 0.0000 | | | $ | 0.0690 | |
| | | | | |
| May 2022 | | | | | | $ | 0.0690 | | | $ | 0.0000 | | | $ | 0.0000 | | | $ | 0.0690 | |
| | | | | |
| June 2022 | | | | | | $ | 0.0690 | | | $ | 0.0000 | | | $ | 0.0000 | | | $ | 0.0690 | |
| | | | | |
PIMCO Strategic Income Fund, Inc. | | | | | | | | Net Realized
Capital Gains* | | | Paid-in Surplus or
Other Capital
Sources** | | | | |
| | | | | |
| January 2022 | | | | | | $ | 0.0427 | | | $ | 0.0000 | | | $ | 0.0083 | | | $ | 0.0510 | |
| | | | | |
| February 2022 | | | | | | $ | 0.0510 | | | $ | 0.0000 | | | $ | 0.0000 | | | $ | 0.0510 | |
| | | | | |
| March 2022 | | | | | | $ | 0.0510 | | | $ | 0.0000 | | | $ | 0.0000 | | | $ | 0.0510 | |
| | | | | |
| April 2022 | | | | | | $ | 0.0510 | | | $ | 0.0000 | | | $ | 0.0000 | | | $ | 0.0510 | |
| | | | | |
| May 2022 | | | | | | $ | 0.0510 | | | $ | 0.0000 | | | $ | 0.0000 | | | $ | 0.0510 | |
| | | | | |
| June 2022 | | | | | | $ | 0.0510 | | | $ | 0.0000 | | | $ | 0.0000 | | | $ | 0.0510 | |
| | | | | |
PIMCO Dynamic Income Fund | | | | | | | | Net Realized
Capital Gains* | | | Paid-in Surplus or
Other Capital
Sources** | | | | |
| | | | | |
| January 2022 | | | | | | $ | 0.2205 | | | $ | 0.0000 | | | $ | 0.0000 | | | $ | 0.2205 | |
| | | | | |
| February 2022 | | | | | | $ | 0.2205 | | | $ | 0.0000 | | | $ | 0.0000 | | | $ | 0.2205 | |
| | | | | |
| March 2022 | | | | | | $ | 0.2205 | | | $ | 0.0000 | | | $ | 0.0000 | | | $ | 0.2205 | |
| | | | | |
| April 2022 | | | | | | $ | 0.2205 | | | $ | 0.0000 | | | $ | 0.0000 | | | $ | 0.2205 | |
| | | | | |
| May 2022 | | | | | | $ | 0.2205 | | | $ | 0.0000 | | | $ | 0.0000 | | | $ | 0.2205 | |
| | | | | |
| June 2022 | | | | | | $ | 0.2205 | | | $ | 0.0000 | | | $ | 0.0000 | | | $ | 0.2205 | |
| | | | | |
PIMCO Dynamic Income Opportunities Fund | | | | | | | | Net Realized
Capital Gains* | | | Paid-in Surplus or
Other Capital
Sources** | | | | |
| | | | | |
| January 2022 | | | | | | $ | 0.1184 | | | $ | 0.0000 | | | $ | 0.0000 | | | $ | 0.1184 | |
| | | | | |
| February 2022 | | | | | | $ | 0.1184 | | | $ | 0.0000 | | | $ | 0.0000 | | | $ | 0.1184 | |
| | | | | |
| March 2022 | | | | | | $ | 0.1184 | | | $ | 0.0000 | | | $ | 0.0000 | | | $ | 0.1184 | |
| | | | | |
| April 2022 | | | | | | $ | 0.1184 | | | $ | 0.0000 | | | $ | 0.0000 | | | $ | 0.1184 | |
| | | | | |
| May 2022 | | | | | | $ | 0.1184 | | | $ | 0.0000 | | | $ | 0.0000 | | | $ | 0.1184 | |
| | | | | |
| June 2022 | | | | | | $ | 0.1184 | | | $ | 0.0000 | | | $ | 0.0000 | | | $ | 0.1184 | |
| | | | | | | | | | | | | | | | | | | | |
| | | | | | | | Net Realized
Capital Gains* | | | | | | | |
| | | | | | |
| April 2022 | | | | | | $ | 0.0992 | | | $ | 0.0000 | | | $ | 0.0175 | | | $ | 0.1167 | |
| | | | | | |
| May 2022 | | | | | | $ | 0.1167 | | | $ | 0.0000 | | | $ | 0.0000 | | | $ | 0.1167 | |
| | | | | | |
| June 2022 | | | | | | $ | 0.1167 | | | $ | 0.0000 | | | $ | 0.0000 | | | $ | 0.1167 | |
| * | The source of dividends provided in the table differs, in some respects, from information presented in this report prepared in accordance with generally accepted accounting principles, or U.S. GAAP. For example, net earnings from certain interest rate swap contracts are included as a source of net investment income for purposes of Section 19(a). Accordingly, the information in the table may differ from information in the accompanying financial statements that are presented on the basis of U.S. GAAP and may differ from tax information presented in the footnotes. Amounts shown may include accumulated, as well as fiscal period net income and net profits. |
| ** | Occurs when a fund distributes an amount greater than its accumulated net income and net profits. Amounts are not reflective of a fund’s net income, yield, earnings or investment performance. |
| | | | |
Shareholder Meeting Results | | | | (Unaudited) |
PCM Fund, Inc. and PIMCO Dynamic Income Opportunities Fund held their annual meetings of shareholders on April 26, 2022. Shareholders voted as indicated below:
PCM Fund, Inc.
Common shareholders voted as indicated below:
| | | | | | | | | | | | |
| | | | | | | | | | |
| | | | |
| Election of E. Grace Vandecruze — Class I to serve until the annual meeting held during the 2024-2025 fiscal year | | | | | | | 7,805,071 | | | | 597,101 | |
| | | | |
Re-election of Sarah E. Cogan — Class I to serve until the annual meeting held during the 2024-2025 fiscal year | | | | | | | 7,805,071 | | | | 597,101 | |
| | | | |
Re-election of John C. Maney — Class I to serve until the annual meeting held during the 2024-2025 fiscal year | | | | | | | 7,805,221 | | | | 596,951 | |
The other members of the Board of Directors at the time of the meeting, namely, Ms. Deborah A. DeCotis and Messrs. Joseph B. Kittredge, Jr., William B. Ogden, IV, Alan Rappaport and David N. Fisher continue to serve as Directors of the Fund.
PIMCO Dynamic Income Opportunities Fund
Common shareholders voted as indicated below:
| | | | | | | | | | | | |
| | | | | | | | | | |
| | | | |
| Election of Deborah A. DeCotis — Class I to serve until the annual meeting held during the 2024-2025 fiscal year | | | | | | | 89,635,684 | | | | 2,667,766 | |
| | | | |
Election of David N. Fisher — Class I to serve until the annual meeting held during the 2024-2025 fiscal year | | | | | | | 89,635,084 | | | | 2,668,366 | |
| | | | |
| Election of Joseph B. Kittredge, Jr. — Class I to serve until the annual meeting held during the 2024-2025 fiscal year | | | | | | | 89,635,084 | | | | 2,668,366 | |
| | | | |
| Election of E. Grace Vandecruze — Class II to serve until the annual meeting held during the 2022-2023 fiscal year | | | | | | | 89,635,684 | | | | 2,667,766 | |
The other members of the Board of Trustees at the time of the meeting, namely, Ms. Sarah E. Cogan and Messrs. William B. Ogden, IV, Alan Rappaport and John C. Maney continue to serve as Trustees of the Fund.
PIMCO Strategic Income Fund, Inc., PIMCO Global StocksPLUS & Income Fund and PIMCO Dynamic Income Fund held their annual meetings of shareholders on June 28, 2022.
PIMCO Strategic Income Fund, Inc.
Common shareholders voted as indicated below:
| | | | | | | | | | | | |
| | | | | | | | | | |
| | | | |
| Election of E. Grace Vandecruze — Class II to serve until the annual meeting held during the 2022-2023 fiscal year | | | | | | | 29,177,809 | | | | 1,450,736 | |
| | | | |
Re-election of Sarah E. Cogan — Class I to serve until the annual meeting held during the 2024-2025 fiscal year | | | | | | | 29,177,809 | | | | 1,450,736 | |
| | | | |
Re-election of John C. Maney — Class I to serve until the annual meeting held during the 2024-2025 fiscal year | | | | | | | 29,177,809 | | | | 1,450,736 | |
| | | | |
Re-election of William B. Ogden, IV — Class I to serve until the annual meeting held during the 2024-2025 fiscal year | | | | | | | 29,177,809 | | | | 1,450,736 | |
The other members of the Board of Directors at the time of the meeting, namely, Ms. Deborah A. DeCotis and Messrs. Joseph B. Kittredge, Jr., Alan Rappaport and David N. Fisher and continue to serve as Directors of the Fund.
PIMCO Global StocksPLUS & Income Fund
Common shareholders voted as indicated below:
| | | | | | | | | | | | |
| | | | | | | | | | |
| | | | |
| Election of E. Grace Vandecruze — Class II to serve until the annual meeting held during the 2024-2025 fiscal year | | | | | | | 7,282,822 | | | | 545,750 | |
| | | | |
Re-election of Joseph B. Kittredge, Jr. — Class II to serve until the annual meeting held during the 2024-2025 fiscal year | | | | | | | 7,282,822 | | | | 545,750 | |
| | | | |
Re-election of John C. Maney — Class II to serve until the annual meeting held during the 2024-2025 fiscal year | | | | | | | 7,282,822 | | | | 545,750 | |
The other members of the Board of Trustees at the time of the meeting, Mses. Deborah A. DeCotis and Sarah E. Cogan and Messrs. William B. Ogden, IV, Alan Rappaport and David N. Fisher continue to serve as Trustees of the Fund.
| | | | |
Shareholder Meeting Results | | | | (Unaudited) |
PIMCO Dynamic Income Fund
Common shareholders voted as indicated below:
| | | | | | | | | | | | |
| | | | | | | | | | |
| | | | |
| Election of E. Grace Vandecruze — Class II to serve until the annual meeting held during the 2022-2023 fiscal year | | | | | | | 160,613,253 | | | | 5,446,910 | |
| | | | |
Election of John C. Maney — Class I to serve until the annual meeting held during the 2024-2025 fiscal year | | | | | | | 160,612,729 | | | | 5,447,434 | |
| | | | |
| Election of William B. Ogden, IV — Class I to serve until the annual meeting held during the 2024-2025 fiscal year | | | | | | | 160,608,867 | | | | 5,451,296 | |
| | | | |
| Election of Alan Rappaport — Class I to serve until the annual meeting held during the 2024-2025 fiscal year | | | | | | | 160,610,542 | | | | 5,449,621 | |
The other members of the Board of Trustees at the time of the meeting, Mses. Deborah A. DeCotis and Sarah E. Cogan and Messrs. Joseph B. Kittredge, Jr. and David N. Fisher continue to serve as Trustees of the Fund.
| | | | |
Changes to Boards of Trustees | | | | (Unaudited) |
Effective July 1, 2022, the Board of Trustees appointed Ms. Kathleen McCartney as a Class I Trustee of PIMCO Global StocksPLUS & Income Fund, a Class II Trustee of PIMCO Dynamic Income Opportunities Fund and a Class III Trustee of PIMCO Dynamic Income Fund and PIMCO Access Income Fund.
Effective July 1, 2022, the Board of Directors appointed Ms. E. Grace Vandecruze as a Class II Director of PCM Fund, Inc. and PIMCO Strategic Income Fund, Inc.
| | | | |
Dividend Reinvestment Plan | | | | |
Each Fund has adopted a Dividend Reinvestment Plan (the “Plan”) which allows common shareholders to reinvest Fund distributions in additional common shares of the Fund. American Stock Transfer & Trust Company, LLC (the “Plan Agent”) serves as agent for common shareholders in administering the Plan. It is important to note that participation in the Plan and automatic reinvestment of Fund distributions does not ensure a profit, nor does it protect against losses in a declining market.
Automatic enrollment/voluntary participation
Under the Plan, common shareholders whose shares are registered with the Plan Agent (“registered shareholders”) are automatically enrolled as participants in the Plan and will have all Fund distributions of income, capital gains and returns of capital (together, “distributions”) reinvested by the Plan Agent in additional common shares of a Fund, unless the shareholder elects to receive cash. Registered shareholders who elect not to participate in the Plan will receive all distributions in cash paid by check and mailed directly to the shareholder of record (or if the shares are held in street or other nominee name, to the nominee) by the Plan Agent. Participation in the Plan is voluntary. Participants may terminate or resume their enrollment in the Plan at any time without penalty by notifying the Plan Agent online at www.astfinancial.com, by calling (844) 33-PIMCO, by writing to the Plan Agent, American Stock Transfer & Trust Company, LLC, at P.O. Box 922, Wall Street Station, New York, NY 10269-0560, or, as applicable, by completing and returning the transaction form attached to a Plan statement. A proper notification will be effective immediately and apply to each Fund’s next distribution if received by the Plan Agent at least three (3) days prior to the record date for the distribution; otherwise, a notification will be effective shortly following the Fund’s next distribution and will apply to the Fund’s next succeeding distribution thereafter. If you withdraw from the Plan and so request, the Plan Agent will arrange for the sale of your shares and send you the proceeds, minus a transaction fee and brokerage commissions.
How shares are purchased under the Plan
For each Fund distribution, the Plan Agent will acquire common shares for participants either (i) through receipt of newly issued common shares from each Fund (“newly issued shares”) or (ii) by purchasing common shares of the Fund on the open market (“open market purchases”). If, on a distribution payment date, the net asset value per common share of a Fund (“NAV”) is equal to or less than the market price per common share plus estimated brokerage commissions (often referred to as a “market premium”), the Plan Agent will invest the distribution amount on behalf of participants in newly issued shares at a price equal to the greater of (i) NAV or (ii) 95% of the market price per common share on the payment date. If the NAV is greater than the
market price per common shares plus estimated brokerage commissions (often referred to as a “market discount”) on a distribution payment date, the Plan agent will instead attempt to invest the distribution amount through open market purchases. If the Plan Agent is unable to invest the full distribution amount in open market purchases, or if the market discount shifts to a market premium during the purchase period, the Plan Agent will invest any un-invested portion of the distribution in newly issued shares at a price equal to the greater of (i) NAV or (ii) 95% of the market price per share as of the last business day immediately prior to the purchase date (which, in either case, may be a price greater or lesser than the NAV per common shares on the distribution payment date). No interest will be paid on distributions awaiting reinvestment. Under the Plan, the market price of common shares on a particular date is the last sales price on the exchange where the shares are listed on that date or, if there is no sale on the exchange on that date, the mean between the closing bid and asked quotations for the shares on the exchange on that date.
The NAV per common share on a particular date is the amount calculated on that date (normally at the close of regular trading on the New York Stock Exchange) in accordance with each Fund’s then current policies.
Fees and expenses
No brokerage charges are imposed on reinvestments in newly issued shares under the Plan. However, all participants will pay a pro rata share of brokerage commissions incurred by the Plan Agent when it makes open market purchases. There are currently no direct service charges imposed on participants in the Plan, although each Fund reserves the right to amend the Plan to include such charges. The Plan Agent imposes a transaction fee (in addition to brokerage commissions that are incurred) if it arranges for the sale of your common shares held under the Plan.
Shares held through nominees
In the case of a registered shareholder such as a broker, bank or other nominee (together, a “nominee”) that holds common shares for others who are the beneficial owners, the Plan Agent will administer the Plan on the basis of the number of common shares certified by the nominee/record shareholder as representing the total amount registered in such shareholder’s name and held for the account of beneficial owners who are to participate in the Plan. If your common shares are held through a nominee and are not registered with the Plan Agent, neither you nor the nominee will be participants in or have distributions reinvested under the Plan. If you are a beneficial owner of common shares and wish to participate in the Plan, and your nominee is unable or unwilling to become a registered shareholder and a Plan participant on your behalf, you may request that your nominee arrange to have all or a portion of your shares re-registered with the Plan Agent in your
name so that you may be enrolled as a participant in the Plan. Please contact your nominee for details or for other possible alternatives. Participants whose shares are registered with the Plan Agent in the name of one nominee firm may not be able to transfer the shares to another firm and continue to participate in the Plan.
Tax consequences
Automatically reinvested dividends and distributions are taxed in the same manner as cash dividends and distributions — i.e., automatic reinvestment in additional shares does not relieve shareholders of, or defer the need to pay, any income tax that may be payable (or that is required to be withheld) on Fund dividends and distributions. The Funds and the Plan Agent reserve the right to amend or terminate the Plan. Additional information about the Plan, as well as a copy of the full Plan itself, may be obtained from the Plan Agent, American Stock Transfer & Trust Company, LLC, at P.O. Box 922, Wall Street Station, New York, NY 10269-0560; telephone number:
(844) 33-PIMCO;
www.astfinancial.com.
| | | | |
Additional Information Regarding the Funds | | | | (Unaudited) |
CHANGES OCCURRING DURING THE REPORTING PERIOD
The following information in this annual report is a summary of certain changes during the period since the Funds’ last annual reports to shareholders were filed. This information may not reflect all of the changes that have occurred since you purchased shares of a Fund.
| 1. | The PIMCO Income Opportunity Fund and PIMCO Dynamic Credit and Mortgage Income Fund reorganized with and into PIMCO Dynamic Income Fund as of the close of business on December 10, 2021. |
| 2. | On March 25, 2022, each of the Funds added the below language to its Principal Investment Strategies: |
The Fund may invest in securities of other open- or
closed-end
investment companies (including those advised by PIMCO), including, without limitation, ETFs, to the extent that such investments are consistent with the Fund’s investment objectives, strategies and policies and permissible under the 1940 Act. The Fund may invest in other investment companies to gain broad market or sector exposure or for cash management purposes, including during periods when it has large amounts of uninvested cash or when PIMCO believes share prices of other investment companies offer attractive values. The Fund may invest in certain money market funds and/or short-term bond funds (“Central Funds”), to the extent permitted by the 1940 Act, the rules thereunder or exemptive relief therefrom. The Central Funds are registered investment companies created for use by certain registered investment companies advised by PIMCO in connection with their cash management activities. The Fund treats its investments in other investment companies that invest primarily in types of securities in which the Fund may invest directly as investments in such types of securities for purposes of the Fund’s investment policies (e.g., the Fund’s investment in an investment company that invests primarily in debt securities will be treated by the Fund as an investment in a debt security). As a shareholder in an investment company, the Fund would bear its ratable share of that investment company’s expenses and would remain subject to payment of the Fund’s management fees and other expenses with respect to assets so invested. Common Shareholders would therefore be subject to duplicative expenses to the extent the Fund invests in other investment companies. The securities of other investment companies may be leveraged, in which case the NAV and/or market value of the investment company’s shares will be more volatile than unleveraged investments.
The Funds do not believe that there are any material unresolved written comments, received 180 days or more before June 30, 2022 from the Staff of the SEC regarding any of the Funds’ periodic or current reports under the Securities Exchange Act or the Investment Company Act, or their registration statements.
The aggregate amounts of brokerage commissions paid by the Funds during the fiscal year ended June 30, 2022 were as follows (amounts in thousands
):
| | | | | | | | | | | | |
| | | | | | | | | |
| | | | |
| PCM Fund, Inc. | | | | | | | 295 | | | $ | 0 | |
| | | | |
PIMCO Global StocksPLUS & Income Fund | | | | | | | 19,145 | | | | 0 | |
| | | | |
| PIMCO Strategic Income Fund, Inc. | | | | | | | 731 | | | | 0 | |
| | | | |
| PIMCO Dynamic Income Fund | | | | | | | 0 | | | | 0 | |
| | | | |
| PIMCO Dynamic Income Opportunities Fund | | | | | | | 41,400 | | | | 0 | |
| | | | |
| PIMCO Access Income Fund | | | | | | | 9,786 | | | | 0 | |
| | | | |
| PIMCO Income Opportunity Fund* | | | | | | | 28 | | | | 0 | |
| | | | |
| PIMCO Dynamic Credit and Mortgage Income Fund* | | | | | | | 0 | | | | 0 | |
| * | Fund has merged with PX5J. |
| † | A zero balance may reflect actual amounts rounding to less than one thousand. |
| | | | |
Principal Investment Strategies | | | | (Unaudited) |
The term “invest” includes both direct investing and indirect investing and the term “investments” includes both direct investments and indirect investments. For example, a Fund may invest indirectly by investing in derivatives or through its wholly-owned subsidiaries (“Subsidiaries”), if applicable. The allocation of a Fund’s assets to a Subsidiary, if applicable, will vary over time and will likely not include all of the different types of investments described herein at any given time.
PCM Fund, Inc. (“PCM”)
The Fund seeks to achieve its investment objectives by utilizing a dynamic asset allocation strategy among multiple fixed income sectors in the global credit markets, including corporate debt (including, among other things, fixed-, variable- and floating-rate bonds, bank loans, convertible securities and stressed debt securities issued by U.S. or foreign
(non-U.S.)
corporations or other business entities, including emerging market issuers), mortgage-related and other asset-backed securities, government and sovereign debt, taxable municipal bonds and other fixed-, variable- and floating-rate income-producing securities of U.S. and foreign issuers, including emerging market issuers. The Fund may invest in investment grade debt securities and below investment grade debt securities (commonly referred to as “high yield” securities or “junk bonds”), including securities of stressed, distressed and defaulted issuers. The Fund cannot assure you that it will achieve its investment objectives, and you could lose all of your investment in the Fund.
Portfolio Management Strategies
Dynamic Allocation Strategy.
On behalf of the Fund, the Fund’s investment manager, Pacific Investment Management Company LLC (“PIMCO” or the “Investment Manager”), employs an active approach to allocation among multiple fixed income sectors based on, among other things, market conditions, valuation assessments, economic outlook, credit market trends and other economic factors. With PIMCO’s macroeconomic analysis as the basis for
top-down
investment decisions, including geographic and credit sector emphasis, the Fund focuses on seeking income generating investment ideas across multiple fixed income sectors, with an emphasis on seeking opportunities in developed and emerging global credit markets. PIMCO may choose to focus on particular countries/regions (e.g., U.S. vs. foreign), asset classes, industries and sectors to the exclusion of others at any time and from time to time based on market conditions and other factors. The relative value assessment within fixed income sectors draws on PIMCO’s regional and sector specialist insights. As a matter of fundamental policy, the Fund will normally invest at least 25% of its total assets (i.e., concentrate) in privately-issued (commonly known as
“non-agency”)
mortgage-related securities. The Fund will observe other investment guidelines as summarized below.
Investment Selection Strategies.
Once the Fund’s
top-down,
portfolio positioning decisions have been made as described above, PIMCO selects particular investments for the Fund by employing a
bottom-up,
disciplined credit approach which is driven by fundamental, independent research within each sector/asset class represented in the Fund, with a focus on identifying securities and other instruments with solid and/or improving fundamentals. PIMCO utilizes strategies that focus on credit quality analysis, duration management and other risk management techniques. PIMCO attempts to identify, through fundamental research driven by independent credit analysis and proprietary analytical tools, debt obligations and other income-producing securities that provide current income and/or opportunities for capital appreciation based on its analysis of the issuer’s credit characteristics and the position of the security in the issuer’s capital structure.
Consideration of yield is only one component of the portfolio managers’ approach in managing the Fund. PIMCO also attempts to identify investments that may appreciate in value based on PIMCO’s assessment of the issuer’s credit characteristics, forecast for interest rates and outlook for particular countries/regions, currencies, industries, sectors and the global economy and bond markets generally.
The Fund may invest without limitation in debt instruments that are, at the time of purchase, rated below investment grade (below Baa3 by Moody’s Investors Service, Inc. (“Moody’s”) or below
BBB-
by either S&P Global Ratings (“S&P”) or Fitch, Inc. (“Fitch”)), or unrated but determined by PIMCO to be of comparable quality, and may invest without limit in securities of any rating. Debt instruments of below investment grade quality are regarded as having predominantly speculative characteristics with respect to capacity to pay interest and to repay principal, and are commonly referred to as “high yield” securities or “junk bonds.” Debt instruments in the lowest investment grade category also may be considered to possess some speculative characteristics. The Fund may, for hedging, investment or leveraging purposes, make use of credit default swaps, which are contracts whereby one party makes periodic payments to a counterparty in exchange for the right to receive from the counterparty a payment equal to the par (or other agreed-upon) value of a referenced debt obligation in the event of a default or other credit event by the issuer of the debt obligation.
Independent Credit Analysis.
PIMCO relies primarily on its own analysis of the credit quality and risks associated with individual debt instruments considered for the Fund, rather than relying exclusively on rating agencies or third-party research. The Fund’s portfolio managers utilize this information in an attempt to manage credit risk and to identify issuers, industries or sectors that are undervalued or that offer
| | | | |
Principal Investment Strategies | | | | |
attractive yields relative to PIMCO’s assessment of their credit characteristics. This aspect of PIMCO’s capabilities will be particularly important to the extent that the Fund invests in high yield securities and in securities of emerging market issuers.
The Fund normally invests in a portfolio of debt obligations and other income-producing securities of any type and credit quality with varying maturities, including, among other investments, mortgage-related and other asset-backed securities, as well as related derivative instruments. The Fund expects to invest in mortgage-related and other asset-backed securities issued or sponsored by various public and private entities, which may include securities issued or guaranteed by the U.S. Government, its agencies or instrumentalities (“U.S. Government securities”), residential and commercial mortgage-backed securities (some of which may be U.S. Government securities), privately-issued mortgage-related securities and any other type of mortgage-related or asset-backed securities issued on a public or private basis, including collateralized mortgage obligations (“CMOs”), adjustable rate mortgage-backed securities, stripped mortgage-backed securities, CMO residuals and mortgage pass-through securities. The Fund may invest in various levels of the capital structure of an issuer of mortgage-backed or asset-backed securities, including the equity or “first loss” tranche. For the avoidance of doubt, equity or “first loss” tranches of mortgage-backed or asset-backed securities do not constitute equity interests for purposes of the Fund’s 20% limit on investments in equity interests described below. The Fund may also invest, as a third party purchaser, in risk retention tranches of CMBS or other eligible securitizations, which are eligible residual interests held by the sponsors of such securitizations pursuant to the final rules implementing the credit risk retention requirements of Section 941 of the Dodd-Frank Act.
The Fund’s portfolio of income-producing securities may also include, without limitation, bonds, debentures, notes, and other debt securities of U.S. and foreign
(non-U.S.)
corporate and other issuers, including commercial paper; asset-backed securities issued on a public or private basis; U.S. Government securities; obligations of foreign governments or their
sub-divisions,
agencies and government sponsored enterprises and obligations of international agencies and supranational entities; municipal securities and other debt securities issued by states or local governments and their agencies, authorities and other government-sponsored enterprises, including taxable municipal securities (such as Build America Bonds);
securities;
zero-coupon
bonds; covenant-lite obligations; inflation-indexed bonds issued by both governments and corporations; structured notes, including hybrid or indexed securities; catastrophe bonds and other event-linked bonds; credit-linked notes; credit-linked trust instruments; structured credit
products; bank loans (including, among others, senior loans, delayed funding loans, revolving credit facilities and loan participations and assignments); preferred securities; convertible debt securities (i.e., debt securities that may be converted at either a stated price or stated rate into underlying shares of common stock), including synthetic convertible debt securities (i.e., instruments created through a combination of separate securities that possess the two principal characteristics of a traditional convertible security, such as an income-producing security and the right to acquire an equity security and contingent convertible securities); collateralized bond obligations, collateralized loan obligations and other collateralized debt obligations; bank capital securities; and bank certificates of deposit, fixed time deposits and bankers’ acceptances. The rate of interest on an income-producing security may be fixed, floating or variable, and may move in the opposite direction to interest rates generally or the interest rate on another security or index (i.e., inverse floaters). At any given time and from time to time substantially all of the Fund’s portfolio may consist of below investment grade securities. The Fund may invest in debt securities of stressed issuers.
The Fund may invest without limitation in securities of U.S. issuers and without limitation in securities of foreign
(non-U.S.)
issuers, including in securities of issuers economically tied to “emerging market” countries, securities traded principally outside of the United States, and securities denominated in currencies other than the U.S. dollar. The Fund may also invest directly in foreign currencies, including local emerging market currencies, including local emerging market currencies.
As a matter of fundamental policy, the Fund normally invests at least 25% of its total assets (i.e., concentrates) in privately-issued (commonly known as
“non-agency”)
mortgage-related securities.
The Fund may, but is not required to, utilize various derivative strategies (both long and short positions) involving the purchase or sale of futures and forward contracts (including foreign currency exchange contracts), call and put options, credit default swaps, total return swaps, basis swaps and other swap agreements and other derivative instruments for investment purposes, leveraging purposes or in an attempt to hedge against market, credit, interest rate, currency and other risks in the portfolio. The Fund may purchase and sell securities on a when-issued, delayed delivery or forward commitment basis and may engage in short sales to the extent that short positions do not represent more than 25% of the Fund’s total assets.
The Fund may invest up to 20% of its total assets in common stocks and other equity securities from time to time, including those it has received through the conversion of a convertible security held by the Fund or in connection with the restructuring of a debt security. The Fund may invest in securities that have not been registered for public sale in the U.S. or relevant
non-U.S.
jurisdiction, including without
limitation securities eligible for purchase and sale pursuant to Rule 144A under the Securities Act of 1933, as amended (the “Securities Act”), or relevant provisions of applicable
non-U.S.
law, and other securities issued in private placements. The Fund may invest in securities of other open- or
closed-end
investment companies (including those advised by PIMCO), including, without limitation, ETFs, to the extent that such investments are consistent with the Fund’s investment objectives, strategies and policies and permissible under the 1940 Act. The Fund may invest in other investment companies to gain broad market or sector exposure or for cash management purposes, including during periods when it has large amounts of uninvested cash or when PIMCO believes share prices of other investment companies offer attractive values. The Fund may invest in certain money market funds and/or short-term bond funds (“Central Funds”), to the extent permitted by the 1940 Act, the rules thereunder or exemptive relief therefrom. The Central Funds are registered investment companies created for use by certain registered investment companies advised by PIMCO in connection with their cash management activities. The Fund treats its investments in other investment companies that invest primarily in types of securities in which the Fund may invest directly as investments in such types of securities for purposes of the Fund’s investment policies (e.g., the Fund’s investment in an investment company that invests primarily in debt securities will be treated by the Fund as an investment in a debt security). As a shareholder in an investment company, the Fund would bear its ratable share of that investment company’s expenses and would remain subject to payment of the Fund’s management fees and other expenses with respect to assets so invested. Common Shareholders would therefore be subject to duplicative expenses to the extent the Fund invests in other investment companies. The securities of other investment companies may be leveraged, in which case the NAV and/or market value of the investment company’s shares will be more volatile than unleveraged investments. The Fund may invest in real estate investment trusts (“REITs”). The Fund may invest in securities of companies with any market capitalization, including small and medium capitalizations.
The Fund may invest without limitation in illiquid investments (i.e., investments that the Fund reasonably expects cannot be sold or disposed of in current market conditions in seven calendar days or less without the sale or disposition significantly changing the market value of the securities).
The Fund may enter into repurchase agreements, in which the Fund purchases a security from a bank or broker-dealer and the bank or broker-dealer agrees to repurchase the security at the Fund’s cost plus interest within a specified time.
For the purpose of achieving income, the Fund may lend its portfolio securities to brokers, dealers or other financial institutions provided a number of conditions are satisfied, including that the loan is fully collateralized.
The length of time the Fund has held a particular security is not generally a consideration in investment decisions. A change in the securities held by the Fund is known as “portfolio turnover.” The Fund may engage in frequent and active trading of portfolio securities to achieve its investment objectives, particularly during periods of volatile market movements.
Temporary Defensive Investments.
Upon PIMCO’s recommendation, for temporary defensive purposes or in order to keep its cash fully invested, the Fund may deviate from its investment strategy by investing some or all of its total assets in investments such as high grade debt securities, including high quality, short-term debt securities, and cash and cash equivalents. The Fund may not achieve its investment objectives when it does so.
The Fund may obtain leverage through reverse repurchase agreements, dollar rolls or borrowings, such as through bank loans or commercial paper or other credit facilities.
The Fund may also enter into transactions other than those noted above that may give rise to a form of leverage including, among others futures and forward contracts (including foreign currency exchange contracts), total return swaps and other derivative transactions, loans of portfolio securities, short sales, when-issued, delayed delivery and forward commitment transactions, and selling credit default swaps.
The Fund may also determine to issue preferred shares or other types of senior securities to add leverage to its portfolio.
The Fund utilizes certain kinds of leverage, such as reverse repurchase agreements and selling credit default swaps, opportunistically and may choose to increase or decrease, or eliminate entirely, its use of such leverage over time and from time to time based on PIMCO’s assessment of the yield curve environment, interest rate trends, market conditions and other factors.
The Fund also may borrow money in order to repurchase its shares or as a temporary measure for extraordinary or emergency purposes, including for the payment of dividends or the settlement of securities transactions which otherwise might require untimely dispositions of portfolio securities held by the Fund.
PIMCO Global StocksPLUS
®
& Income Fund (“PGP”)
The portfolio managers build a global equity and debt portfolio by investing, under normal circumstances, at least 80% of the Fund’s net assets (plus any borrowings for investment purposes) in a combination
| | | | |
Principal Investment Strategies | | | | |
of securities and instruments that provide exposure to stocks and/or produce income (the “80% policy”). The 80% policy is not considered to be fundamental by the Fund, and can be changed without a vote of the Fund’s shareholders. The 80% policy may be changed by the Fund’s Board of Trustees following the provision of 60 days’ prior written notice to the Fund’s shareholders.
The Fund’s stock exposure (including for purposes of the 80% policy) may be obtained through stock holdings and/or through index and other derivative instruments that have economic characteristics similar to U.S. and
non-U.S.
stocks. Exposure to income-producing instruments may be obtained through the use of fixed income and other derivative instruments. The Fund cannot assure you that it will achieve its investment objective, and you could lose all of your investment in the Fund.
Asset Allocation and Periodic Rebalancing
The Fund’s equity index exposure generally is expected to equal 100% of its net assets (generally approximately 50% U.S. and 50%
non-U.S.).
The Fund’s equity index exposure will be rebalanced on a periodic basis (so that the U.S. and
non-U.S.
equity index exposure each will represent approximately 50% at the time of rebalance). It is anticipated that each periodic rebalancing will coincide with the settlement of relevant derivatives. These periodic rebalancings may result in additional transaction costs for the Fund and may increase the amount of capital gains (including short-term capital gains) realized by the Fund on which shareholders pay tax. Although the portfolio will be rebalanced periodically, it is expected that the relative percentage of the Fund’s equity derivatives exposure represented by U.S. and
non-U.S.
equity index exposure will vary during interim periods in relation to market fluctuations and other factors. Therefore, the Fund’s assets attributable to U.S. and
non-U.S.
equity exposure may be materially higher or lower than the initial 50%/50% allocation described above, and the risk/return profile of the Fund (taken as a whole) will vary accordingly.
Portfolio Management Strategies
Equity Derivatives Strategies.
The Fund generally expects to gain substantially all of its equity index exposure by investing in equity index derivatives based on the S&P 500 Index (i.e., the U.S. equity exposure) and the MSCI EAFE Index (i.e., the
non-U.S.
equity exposure). In the case of equity index swaps and futures contracts, the Fund seeks to receive a return that approximates total return (price appreciation or depreciation plus any dividends) of the relevant index while bearing implicit or explicit interest and transactional costs, including certain tax withholdings, if applicable. Any increase in return attributable to dividends will not be eligible for treatment to holders of the Fund’s common shares of beneficial interest as “qualified dividend income” and the Fund will not be able to recover any withholding
taxes on foreign dividends. The Fund also may invest directly in common stocks, other equity instruments and other types of derivative instruments, such as options contracts and options on futures contracts, to gain equity exposure. In implementing the Fund’s derivatives strategies, PIMCO may use a variety of techniques designed to minimize transaction costs and to provide greater investment flexibility, such as utilizing multiple derivative counterparties, negotiating the terms of derivative instruments in which the Fund invests and analyzing the costs associated with different derivative instruments. The Fund is neither sponsored by nor affiliated with either index.
The Fund may hedge the foreign currency risk associated with its exposure to
non-U.S.
equities depending upon market conditions and other factors. The Fund reserves the flexibility to change its U.S. and
non-U.S.
benchmark indexes and related derivatives strategies.
Global Debt Securities Selection / Dynamic Allocation Strategy.
The Fund’s actively managed collateral portfolio (the “Debt Portfolio”) will back the Fund’s equity index positions and will consist of income-producing debt securities having varying maturities and debt-related derivatives securities, including but not limited to interest rate swaps (including swaps that are paired) and other interest rate derivatives. In managing the Debt Portfolio, PIMCO employs an active approach to allocation among multiple fixed income sectors based on, among other things, market conditions, valuation assessments, economic outlook, credit market trends and other economic factors. With PIMCO’s macroeconomic analysis as the basis for
top-down
investment decisions, including geographic and credit sector emphasis, PIMCO manages the Debt Portfolio with a focus on seeking income generating investment ideas across multiple fixed income sectors, with an emphasis on seeking opportunities in developed and emerging global credit markets. PIMCO may choose to focus on particular countries/regions, asset classes, industries and sectors to the exclusion of others at any time and from time to time based on market conditions and other factors. The relative value assessment within fixed income sectors draws on PIMCO’s regional and sector specialist insights.
Fund Current Distribution Strategies.
The Fund’s monthly distributions are expected to include, among other possible sources, interest income from the Debt Portfolio and payments and premiums (characterized as capital for financial accounting purposes and as ordinary income for tax purposes) generated by certain types of interest rate derivatives. Strategies involving interest rate derivatives (including swaps that are paired) may attempt to capitalize on differences between short-term and long-term interest rates as part of the Fund’s duration and yield curve active management strategies. For instance, in the event that long-term interest rates are higher than short-term interest rates, the Fund may elect to pay a floating short-
term interest rate and to receive a long-term fixed interest rate for a stipulated period of time, thereby generating payments as a function of the difference between current short-term interest rates and long-term interest rates, so long as the floating short-term interest rate (which may rise) is lower than the fixed long-term interest rate.
The Fund may enter into opposite sides of multiple interest rate swaps or other derivatives with respect to the same underlying reference instrument (e.g., a
10-year
U.S. treasury) that have different effective dates with respect to interest accrual time periods also for the principal purpose of generating distributable gains (characterized as ordinary income for tax purposes) that are not part of the Fund’s duration or yield curve management strategies. In such a “paired swap transaction”, the Fund would generally enter into one or more interest rate swap agreements whereby the Fund agrees to make regular payments starting at the time the Fund enters into the agreements equal to a floating interest rate in return for payments equal to a fixed interest rate (the “initial leg”). The Fund would also enter into one or more interest rate swap agreements on the same underlying instrument, but take the opposite position (i.e., in this example, the Fund would make regular payments equal to a fixed interest rate in return for receiving payments equal to a floating interest rate) with respect to a contract whereby the payment obligations do not commence until a date following the commencement of the initial leg (the “forward leg”).
The Fund may engage in investment strategies, including those investment strategies that employ the use of paired swaps transactions, the use of interest rate swaps to seek to capitalize on differences between short-term and long-term interest rates and other derivatives transactions, to, among other things, seek to generate current, distributable income, even if such strategies could potentially result in declines in the Fund’s net asset value (“NAV”). The Fund’s income and gain-generating strategies, including certain derivatives strategies, may seek to generate current income and gains taxable as ordinary income sufficient to support monthly distributions even in situations when the Fund has experienced a decline in net assets due to, for example, adverse changes in the broad U.S. or
non-U.S.
equity markets or the Fund’s debt investments, or arising from its use of derivatives. For instance, a significant portion of the Fund’s monthly distributions may be sourced from paired swap transactions utilized to produce current distributable ordinary income for tax purposes on the initial leg, with a substantial possibility that the Fund will later realize a corresponding capital loss and potential decline in its NAV with respect to the forward leg (to the extent there are not corresponding offsetting capital gains being generated from other sources). Because some or all of these transactions may generate capital losses without corresponding offsetting capital gains, portions of the Fund’s distributions recognized as ordinary income for tax purposes (such as from paired swap
transactions) may be economically similar to a taxable return of capital when considered together with such capital losses.
The Fund’s index option strategy, to the extent utilized, seeks to generate payments and premiums from writing options that may offset some or all of the capital losses incurred as a result of paired swaps transactions. However, the Fund may use paired swap transactions to support monthly distributions where the index option strategy does not produce an equivalent amount of offsetting gains, including without limitation when such strategy is not being used to a significant extent. In addition, gains (if any) generated from the index option strategy may be offset by the Fund’s realized capital losses, including any available capital loss carryforwards.
The Fund generally will not include in its monthly distributions any gain that is derived from gains that are characterized as long-term capital gain for tax purposes (and is limited in its ability to do so by the Investment Company Act of 1940, as amended (the “Act”)). The notional exposure of the interest rate derivatives in the Debt Portfolio may vary widely as a function of market conditions, including differences between short-term and longer-term interest rates and the Fund’s current investment strategies. (The notional amount of a derivative is the hypothetical underlying quantity upon which interest rate or other payment obligations are computed.) While the yield curve (a graph of bond yields available at a given moment in time) generally slopes upward (indicating that long-term interest rates are higher than short-term interest rates), there can be no assurance that this always will be the case and has not always recently been the case, and it is anticipated that the slope of the yield curve will vary to a significant degree across different market environments. In market environments in which the differences between short- term, intermediate-term and long-term interest rates are smaller than is typically the case (a flatter yield curve environment), the Fund may increase the notional exposure of its interest rate derivative positions. In certain market conditions, it is anticipated that the notional exposure of interest rate derivatives in the Debt Portfolio could be a multiple of the Fund’s total net assets. The Fund is required to identify any portion of its monthly distributions that are characterized as gains (for financial accounting purposes) or that otherwise are derived from any sources other than net income. The Fund cannot assure you as to any level of distributions that will be treated as ordinary income, cannot assure you as to any level of capital gains distributions and cannot assure you as to any ratio of monthly distributions to capital gain distributions.
In implementing the Fund’s index option strategy, PIMCO may sell (“write”) call options on the S&P 500 Index and on futures on the S&P 500 Index. PIMCO does not intend to write index call options when the underlying notional value of the index call option positions exceeds the Fund’s net U.S. equity exposure — generally approximately 50% of the Fund’s net assets (i.e., the Fund
| | | | |
Principal Investment Strategies | | | | |
does not intend to write “naked” positions) at each rebalance. The index option writing strategy is designed to produce gains from index option premiums.
The Fund expects that it normally will write call options whose terms to expiration range from one month to one year, although the Fund may write call options with both longer and shorter terms. PIMCO ordinarily will not write call options on individual equity securities but may write call options on exchange-traded funds and other similar instruments designed to correlate with the performance of the underlying equity index. PIMCO will actively manage the Fund’s index option positions using quantitative and statistical analysis that focuses on relative value and a weighing of risk versus return.
The Fund generally will write equity index call options that are
or
at the time of sale. The Fund generally will write
equity index call options with strike prices no more than 10% higher than the cash value of the index at the time of sale. The Fund reserves the flexibility to write equity index call options that are more or less
as it deems appropriate depending upon market conditions and other factors. The Fund also reserves the flexibility to write equity index call options that are
In addition to writing call options, the Fund also may purchase put options on the S&P 500 Index and on futures on the S&P 500 Index in an effort to protect against significant market declines affecting the U.S. equity markets as measured by the S&P 500 Index. However, because the Fund generally will purchase put options that are
the Fund will not be fully covered against any market decline.
In addition to listed options, the Fund may write and purchase
over-the
counter options, which are not originated and standardized by the Office of the Comptroller of the Currency or listed and traded on an options exchange (such as the Chicago Board Options Exchange or the International Securities Exchange).
The Fund may invest without limitation in debt instruments that are, at the time of purchase, rated below investment grade (below Baa3 by Moody’s or below
BBB-
by either S&P or Fitch) or that are unrated but determined by PIMCO to be of comparable quality. The Fund normally will attempt to maintain in its Debt Portfolio debt securities with what PIMCO believes have an average credit quality that is at least investment grade. The Fund may invest in securities of stressed, distressed and defaulted issuers, which include securities at risk of being in default as to the repayment of principal and/or interest at the time of acquisition by the Fund or that are rated in the lower rating categories by one or more nationally recognized statistical rating organizations or, if unrated, are determined by PIMCO to be of comparable quality. Debt instruments of below investment grade quality are regarded as having predominantly speculative
characteristics with respect to capacity to pay interest and to repay principal and are commonly referred to as “high yield” securities or “junk bonds.” Debt instruments in the lowest investment grade category also may be considered to possess some speculative characteristics. The Fund may, for hedging, investment or leveraging purposes, make use of credit default swaps, which are contracts whereby one party makes periodic payments to a counterparty in exchange for the right to receive from the counterparty a payment equal to the par (or other agreed-upon) value of a referenced debt obligation in the event of a default or other credit event by the issuer of the debt obligation.
Independent Credit Analysis.
PIMCO relies primarily on its own analysis of the credit quality and risks associated with individual debt instruments considered for the Fund, rather than relying exclusively on rating agencies or third-party research. The Fund’s portfolio managers utilize this information in an attempt to manage credit risk and to identify issuers, industries or sectors that are undervalued or that offer attractive yields relative to PIMCO’s assessment of their credit characteristics. This aspect of PIMCO’s capabilities will be particularly important to the extent that the Fund invests in high yield securities and in securities of emerging market issuers.
The Debt Portfolio’s debt securities will generally have a
low-
to intermediate- average portfolio duration, ranging from one year to a duration that is two years above the duration of the Bloomberg Capital U.S. Aggregate Index, although it may be shorter or longer at any time or from time to time depending on market conditions and other factors. While the Fund seeks to maintain a
low-
to intermediate- average portfolio duration, there is no limit on the maturity or duration of any individual security in which the Fund may invest. Duration is a measure used to determine the sensitivity of a security’s price to changes in interest rates. The Fund’s duration strategy may entail maintaining a negative average portfolio duration from time to time, which would potentially benefit the portfolio in an environment of rising market interest rates but would generally adversely impact the portfolio in an environment of falling or neutral market interest rates. PIMCO may also utilize certain strategies, including without limitation investments in structured notes or interest rate futures contracts or swap, cap, floor or collar transactions, for the purpose of reducing the interest rate sensitivity of the Fund’s portfolio, although there is no assurance that it will do so or that such strategies will be successful.
Substantially all of the Fund’s assets ordinarily will be invested in the Debt Portfolio to back the Fund’s equity index positions. The types of debt securities (and related instruments) in which the Fund may invest include mortgage-related and other types of asset-backed securities (including collateralized loan obligations, collateralized debt
obligations, and collateralized mortgage obligations) issued on a public or private basis; government securities, including U.S. Government securities, sovereign debt and other obligations of
non-U.S.
governments or their
sub-divisions,
agencies and government sponsored enterprises, and obligations of international agencies and supranational entities, as well as municipal securities; bonds, debentures, notes, and other debt securities of U.S. and
non-U.S.
corporations and other issuers, issued publicly or through private placements, including convertible securities, covenant-lite obligations, contingent convertible securities, synthetic convertible securities and commercial paper, event-linked securities, inflation-indexed bonds,
securities,
step-ups
zero-coupon
bonds, senior floating-rate loans (“Senior Loans”) and other bank loans (secured or unsecured) and loan assignments and participations, bank capital securities, bank certificates of deposit, fixed time deposits and bankers’ acceptances. The Fund also may invest in preferred stock, structured notes and other hybrid instruments, credit-linked trust certificates, delayed funding loans, revolving credit facilities and REITs, and may use credit default swaps, other debt-related derivatives, interest rate swaps, forwards, futures and other interest rate derivatives. The rate of interest on the Fund’s debt security investments may be fixed, floating or variable. The Fund may invest in debt securities issued by companies with small and medium market capitalizations. The Fund may invest in various levels of the capital structure of an issuer of mortgage-backed or asset-backed securities, including the equity or “first loss” tranche. The Fund may also invest, as a third party purchaser, in risk retention tranches of CMBS or other eligible securitizations, which are eligible residual interests held by the sponsors of such securitizations pursuant to the final rules implementing the credit risk retention requirements of Section 941 of the Dodd-Frank Act.
The Fund will actively manage the duration and yield curve exposure of the Debt Portfolio, in part through the use of a variety of interest rate derivatives, including but not limited to interest rate swaps, forwards and futures. These interest rate derivatives also may be used for other investment or risk management purposes, including to provide synthetic exposure to fixed or floating rate debt instruments, and to attempt to generate current income and gains. It currently is anticipated that the duration and yield curve active management strategies using interest rate derivatives will result in the generation of payments arising primarily from differences between short-term and long-term interest rates. As that difference gets smaller, the Fund would need to increase its notional exposure to interest rate derivatives in order to generate the same income for the Fund. These payments will be characterized as gain for financial accounting purposes and as ordinary income for tax purposes. In the event that long-term interest rates are higher than short-term interest rates, for
example, the Fund may elect to pay a floating short-term interest rate and to receive a long-term fixed interest rate for a stipulated period of time, thereby generating return as a function of the difference between current short-term interest rates and long-term interest rates, so long as the floating short-term interest rate (which may rise) is lower than the fixed long-term interest rate. The notional exposure of the interest rate derivatives in the Debt Portfolio may vary widely as a function of market conditions, including differences between short-term and longer-term interest rates, and the Fund’s current investment strategies.
The Fund may invest without limitation in securities of U.S. issuers and without limitation in securities of foreign
(non-U.S.)
issuers, securities traded principally outside of the United States, and securities denominated in currencies other than the U.S. dollar. The Fund normally will have exposure to investments that are tied economically to at least three countries other than the United States. The Fund may invest without limit in investment grade sovereign debt denominated in the relevant country’s local currency with less than 1 year remaining to maturity (“short-term investment grade sovereign debt”), including short-term investment grade sovereign debt issued by emerging market issuers. The Fund may invest up to 40% of its total assets in securities and instruments that are economically tied to emerging market countries (this limitation does not apply to investment grade sovereign debt denominated in the relevant country’s local currency with less than 1 year remaining to maturity).
The Fund may invest up to 30% of its total assets in Senior Loans made to corporations, partnerships and other business entities. Senior Loans typically pay interest at rates that are
re-determined
periodically on the basis of a floating base lending rate plus a premium. Senior Loans generally hold the most senior position in the capital structure of a borrower and often are secured with collateral but may be of below investment grade quality and may involve significant credit risk.
The Fund may invest without limitation in illiquid investments (i.e., investments that the Fund reasonably expects cannot be sold or disposed of in current market conditions in seven calendar days or less without the sale or disposition significantly changing the market value of the securities).
The Fund may purchase securities that it is eligible to purchase on a when-issued basis, may purchase and sell such securities for delayed delivery, may make contracts to purchase such securities for a fixed price at a future date beyond normal settlement time (forward commitments) and may engage in short sales.
The Fund may invest in securities that have not been registered for public sale in the U.S. or relevant
non-U.S.
jurisdiction, including without limitation securities eligible for purchase and sale pursuant to Rule 144A under the Securities Act, or relevant provisions of
| | | | |
Principal Investment Strategies | | | | |
applicable
non-U.S.
law, and other securities issued in private placements. The Fund may invest in securities of other open- or
closed-end
investment companies (including those advised by PIMCO), including, without limitation, ETFs, to the extent that such investments are consistent with the Fund’s investment objectives, strategies and policies and permissible under the 1940 Act. The Fund may invest in other investment companies to gain broad market or sector exposure or for cash management purposes, including during periods when it has large amounts of uninvested cash or when PIMCO believes share prices of other investment companies offer attractive values. The Fund may invest in certain money market funds and/or short-term bond funds (“Central Funds”), to the extent permitted by the 1940 Act, the rules thereunder or exemptive relief therefrom. The Central Funds are registered investment companies created for use by certain registered investment companies advised by PIMCO in connection with their cash management activities. The Fund treats its investments in other investment companies that invest primarily in types of securities in which the Fund may invest directly as investments in such types of securities for purposes of the Fund’s investment policies (e.g., the Fund’s investment in an investment company that invests primarily in debt securities will be treated by the Fund as an investment in a debt security). As a shareholder in an investment company, the Fund would bear its ratable share of that investment company’s expenses and would remain subject to payment of the Fund’s management fees and other expenses with respect to assets so invested. Common Shareholders would therefore be subject to duplicative expenses to the extent the Fund invests in other investment companies. The securities of other investment companies may be leveraged, in which case the NAV and/or market value of the investment company’s shares will be more volatile than unleveraged investments. The Fund may invest in REITs. The Fund may invest in securities of companies with any market capitalization, including small and medium capitalizations.
The Fund may enter into repurchase agreements, in which the Fund purchases a security from a bank or broker-dealer and the bank or broker-dealer agrees to repurchase the security at the Fund’s cost plus interest within a specified time.
For the purpose of achieving income, the Fund may lend its portfolio securities to brokers, dealers or other financial institutions provided a number of conditions are satisfied, including that the loan is fully collateralized.
The length of time the Fund has held a particular security is not generally a consideration in investment decisions. A change in the securities held by the Fund is known as “portfolio turnover.” The Fund may engage in frequent and active trading of portfolio securities to achieve its investment objectives, particularly during periods of volatile market movements.
Temporary Defensive Investments.
Upon PIMCO’s recommendation, for temporary defensive purposes or in order to keep its cash fully invested, the Fund may deviate from its investment strategy by investing some or all of its total assets in investments such as high grade debt securities, including high quality, short-term debt securities, and cash and cash equivalents. The Fund may not achieve its investment objective when it does so.
The Fund may obtain leverage through reverse repurchase agreements, dollar rolls or borrowings, such as through bank loans or commercial paper or other credit facilities. The Fund may also enter into transactions other than those noted above that may give rise to a form of leverage including, among others, futures and forward contracts (including foreign currency exchange contracts), total return swaps and other derivative transactions, loans of portfolio securities, short sales, when-issued, delayed delivery and forward commitment transactions and selling credit default swaps. The Fund may also determine to issue preferred shares or other types of senior securities to add leverage to its portfolio.
The Fund utilizes certain kinds of leverage, such as reverse repurchase agreements and credit default swaps, opportunistically and may choose to increase or decrease, or eliminate entirely, its use of such leverage over time and from time to time based on PIMCO’s assessment of the yield curve environment, interest rate trends, market conditions and other factors.
The Fund also may borrow money in order to repurchase its shares or as a temporary measure for extraordinary or emergency purposes, including for the payment of dividends or the settlement of securities transactions which otherwise might require untimely dispositions of portfolio securities held by the Fund.
Any leverage used by the Fund obtained through the issuance of preferred shares or debt securities or the use of borrowings or similar transactions will be limited to 38% of the Fund’s total assets (including the proceeds of the leverage) except as noted below (the “38% Policy”). The Fund also may enter into transactions that may give rise to a form of financial leverage, such as, among others, reverse repurchase agreements, loans of portfolio securities, selling credit default swap contracts and engaging in other derivatives transactions, as well as when-issued, delayed delivery or forward commitment transactions. To the extent the Fund covers its positions in such transactions (by segregating liquid assets at least equal in amount to the Fund’s future commitment thereunder, entering into offsetting transactions or owning positions covering such future commitment), its obligations under such transactions will not be subject to the 38% Policy.
PIMCO Strategic Income Fund, Inc. (“RCS”)
Leveraging PIMCO’s core analytical and risk management capabilities, the Fund’s portfolio managers can select what they believe to be attractive issues across the full range of fixed income sectors including corporate debt, government and sovereign debt, mortgage-related and other asset-backed securities and other income-producing securities of varying maturities.
The Fund normally invests at least 80% of its net assets (plus any borrowings for investment purposes) in a combination of income-producing securities of
non-corporate
issuers, such as securities issued or guaranteed by the U.S. or foreign governments, mortgage-related and other asset-backed securities issued on a public or private basis, corporate debt obligations and other income-producing securities of varying maturities issued by U.S. or foreign (non U.S.) corporations or other business entities, including emerging market issuers, and municipal securities (the “80% policy”).
Portfolio Management Strategies
Dynamic Allocation Strategy.
On behalf of the Fund, the Fund’s investment manager, PIMCO, employs an active approach to allocation among multiple fixed income sectors based on, among other things, market conditions, valuation assessments, economic outlook, credit market trends and other economic factors. With PIMCO’s macroeconomic analysis as the basis for
top-down
investment decisions, including geographic and credit sector emphasis, the Fund focuses on seeking income generating investment ideas across multiple fixed income sectors, with an emphasis on seeking opportunities in developed and emerging global credit markets. PIMCO may choose to focus on particular countries/regions (e.g., U.S. vs. foreign), asset classes, industries and sectors to the exclusion of others at any time and from time to time based on market conditions and other factors. The relative value assessment within fixed income sectors draws on PIMCO’s regional and sector specialist insights.
Investment Selection Strategies.
Once the Fund’s
top-down,
portfolio positioning decisions have been made as described above, PIMCO selects particular investments for the Fund by employing a
bottom-up,
disciplined credit approach which is driven by fundamental, independent research within each sector/asset class represented in the Fund, with a focus on identifying securities and other instruments with solid and/or improving fundamentals.
PIMCO utilizes strategies that focus on credit quality analysis, duration management and other risk management techniques. PIMCO attempts to identify, through fundamental research driven by independent credit analysis and proprietary analytical tools, debt obligations and other income-producing securities that provide current income and/or
opportunities for capital appreciation based on its analysis of the issuer’s credit characteristics and the position of the security in the issuer’s capital structure.
Consideration of yield is only one component of the portfolio managers’ approach in managing the Fund. PIMCO also attempts to identify investments that may appreciate in value based on PIMCO’s assessment of the issuer’s credit characteristics, forecast for interest rates and outlook for particular countries/regions, currencies, industries, sectors and the global economy and bond markets generally.
The Fund may invest up to 20% of its total assets in debt instruments that are, at the time of purchase, rated below investment grade (below Baa3 by Moody’s or below
BBB-
by either S&P or Fitch), or unrated but determined by PIMCO to be of comparable quality. Debt instruments of below investment grade quality are regarded as having predominantly speculative characteristics with respect to capacity to pay interest and to repay principal, and are commonly referred to as “high yield” securities or “junk bonds.” Debt instruments in the lowest investment grade category also may be considered to possess some speculative characteristics. The Fund may, for hedging, investment or leveraging purposes, make use of credit default swaps, which are contracts whereby one party makes periodic payments to a counterparty in exchange for the right to receive from the counterparty a payment equal to the par (or other agreed-upon) value of a referenced debt obligation in the event of a default or other credit event by the issuer of the debt obligation.
Independent Credit Analysis.
PIMCO relies primarily on its own analysis of the credit quality and risks associated with individual debt instruments considered for the Fund, rather than relying exclusively on rating agencies or third-party research. The Fund’s portfolio managers utilize this information in an attempt to manage credit risk and to identify issuers, industries or sectors that are undervalued or that offer attractive yields relative to PIMCO’s assessment of their credit characteristics. This aspect of PIMCO’s capabilities will be particularly important to the extent that the Fund invests in high yield securities and in securities of emerging market issuers.
For purposes of the Fund’s 80% policy, income-producing securities may include, without limitation, bonds, debentures, notes, and other debt securities of U.S. and foreign
(non-U.S.)
corporate and other issuers, including commercial paper; asset-backed securities issued on a public or private basis; U.S. Government securities; obligations of foreign governments or their
sub-divisions,
agencies and government sponsored enterprises and obligations of international agencies and supranational entities; municipal securities and other debt securities
| | | | |
Principal Investment Strategies | | | | |
issued by states or local governments and their agencies, authorities and other government-sponsored enterprises, including taxable municipal securities (such as Build America Bonds);
securities;
zero-coupon
bonds; inflation-indexed bonds issued by both governments and corporations; structured notes, including hybrid or indexed securities; credit-linked notes; covenant-lite obligations; credit-linked trust instruments; structured credit products; preferred securities; convertible debt securities (i.e., debt securities that may be converted at either a stated price or stated rate into underlying shares of common stock), including synthetic convertible debt securities (i.e., instruments created through a combination of separate securities that possess the two principal characteristics of a traditional convertible security, such as an income-producing security and the right to acquire an equity security and contingent convertible securities); collateralized mortgage obligations; bank capital securities; and bank certificates of deposit, fixed time deposits and bankers’ acceptances. The rate of interest on an income-producing security may be fixed, floating or variable, and may move in the opposite direction to interest rates generally or the interest rate on another security or index (i.e., inverse floaters). At any given time and from time to time substantially all of the Fund’s portfolio may consist of below investment grade securities. The Fund may invest in debt securities of stressed issuers. The Fund may invest in various levels of the capital structure of an issuer of mortgage-backed or asset-backed securities, including the equity or “first loss” tranche. For the avoidance of doubt, equity or “first loss” tranches of mortgage-backed or asset-backed securities do not constitute equity interests for purposes of the Fund’s 20% limit on investments in equity interests described below. The Fund may also invest, as a third party purchaser, in risk retention tranches of CMBS or other eligible securitizations, which are eligible residual interests held by the sponsors of such securitizations pursuant to the final rules implementing the credit risk retention requirements of Section 941 of the Dodd-Frank Act.
In addition, the Fund will invest a minimum of 33% of its net assets in U.S. debt securities and may not invest more than 67% of its total assets in foreign debt instruments, including a maximum of 40% of its total assets in securities and instruments that are economically tied to emerging market countries (this limitation does not apply to investment grade sovereign debt denominated in the relevant country’s local currency with less than 1 year remaining to maturity). Further, the Fund may invest up to 45% of its total assets in the securities of governmental or corporate issuers located in a single foreign country, subject to the 67% of total assets limitation on foreign securities holdings. The Fund may invest without limitation in investment grade sovereign debt denominated in the relevant country’s local currency with less than 1 year remaining to maturity, subject to applicable law and any other restrictions.
The Fund may, but is not required to, utilize various derivative strategies (both long and short positions) involving the purchase or sale of futures and forward contracts (including foreign currency exchange contracts), call and put options, credit default swaps, total return swaps, basis swaps and other swap agreements and other derivative instruments for investment purposes, leveraging purposes or in an attempt to hedge against market, credit, interest rate, currency and other risks in the portfolio. The Fund may purchase and sell securities on a when-issued, delayed delivery or forward commitment basis and may engage in short sales to the extent that short sales do not represent more than 25% of the Fund’s total assets.
The Fund may invest up to 20% of its total assets in common stocks and other equity securities from time to time, including those it has received through the conversion of a convertible security held by the Fund or in connection with the restructuring of a debt security. The Fund may invest up to 15% of its total assets in any combination of interest-only or inverse floating rate obligations and residual interests of real estate mortgage investment conduits. The weighted average life of the Fund’s investments, under normal market conditions, is expected to be less than 10 years. The Fund may invest up to 20% of its total assets in commercial mortgage-related securities.
The Fund may invest in securities that have not been registered for public sale in the U.S. or relevant
non-U.S.
jurisdiction, including without limitation securities eligible for purchase and sale pursuant to Rule 144A under the Securities Act, or relevant provisions of applicable
non-U.S.
law, and other securities issued in private placements. The Fund may invest in securities of other open- or
closed-end
investment companies (including those advised by PIMCO), including, without limitation, ETFs, to the extent that such investments are consistent with the Fund’s investment objectives, strategies and policies and permissible under the 1940 Act. The Fund may invest in other investment companies to gain broad market or sector exposure or for cash management purposes, including during periods when it has large amounts of uninvested cash or when PIMCO believes share prices of other investment companies offer attractive values. The Fund may invest in certain money market funds and/or short-term bond funds (“Central Funds”), to the extent permitted by the 1940 Act, the rules thereunder or exemptive relief therefrom. The Central Funds are registered investment companies created for use by certain registered investment companies advised by PIMCO in connection with their cash management activities. The Fund treats its investments in other investment companies that invest primarily in types of securities in which the Fund may invest directly as investments in such types of securities for purposes of the Fund’s investment policies (e.g., the Fund’s investment in an investment company that invests primarily in debt securities will be treated by the Fund as an investment in a debt security). As a shareholder in an investment company, the Fund would
bear its ratable share of that investment company’s expenses and would remain subject to payment of the Fund’s management fees and other expenses with respect to assets so invested. Common Shareholders would therefore be subject to duplicative expenses to the extent the Fund invests in other investment companies. The securities of other investment companies may be leveraged, in which case the NAV and/or market value of the investment company’s shares will be more volatile than unleveraged investments. The Fund may invest in securities of companies with any market capitalization, including small and medium capitalizations.
The Fund may invest without limitation in illiquid investments (i.e., investments that the Fund reasonably expects cannot be sold or disposed of in current market conditions in seven calendar days or less without the sale or disposition significantly changing the market value of the securities).
The Fund may enter into repurchase agreements, in which the Fund purchases a security from a bank or broker-dealer and the bank or broker-dealer agrees to repurchase the security at the Fund’s cost plus interest within a specified time.
For the purpose of achieving income, the Fund may lend its portfolio securities to brokers, dealers or other financial institutions provided a number of conditions are satisfied, including that the loan is fully collateralized.
The length of time the Fund has held a particular security is not generally a consideration in investment decisions. A change in the securities held by the Fund is known as “portfolio turnover.” The Fund may engage in frequent and active trading of portfolio securities to achieve its investment objectives, particularly during periods of volatile market movements.
Temporary Defensive Investments.
Upon PIMCO’s recommendation, for temporary defensive purposes or in order to keep its cash fully invested, the Fund may deviate from its investment strategy by investing some or all of its total assets in investments such as high grade debt securities, including high-quality, short-term debt instruments, and cash and cash equivalents. The Fund may not achieve its investment objectives when it does so.
The Fund may obtain leverage through reverse repurchase agreements, dollar rolls or borrowings, such as through bank loans or commercial paper or other credit facilities. The Fund may also enter into transactions other than those noted above that may give rise to a form of leverage including, among others, futures and forward contracts (including foreign currency exchange contracts), total return swaps and other derivative transactions, loans of portfolio securities, short sales, when-issued, delayed delivery and forward commitment
transactions and selling credit default swaps. The Fund may also determine to issue preferred shares or other types of senior securities to add leverage to its portfolio.
The Fund utilizes certain kinds of leverage, such as reverse repurchase agreements and selling credit default swaps, opportunistically and may choose to increase or decrease, or eliminate entirely, its use of such leverage over time and from time to time based on PIMCO’s assessment of the yield curve environment, interest rate trends, market conditions and other factors.
The Fund also may borrow money in order to repurchase its shares or as a temporary measure for extraordinary or emergency purposes, including for the payment of dividends or the settlement securities transactions which otherwise might require untimely dispositions of portfolio securities held by the Fund.
PIMCO Dynamic Income Fund (“PDI”)
The Fund seeks to achieve its investment objectives by utilizing a dynamic asset allocation strategy among multiple fixed income sectors in the global credit markets, including corporate debt (including, among other things, fixed-, variable- and floating-rate bonds, bank loans, convertible securities and stressed debt securities issued by U.S. or foreign
(non-U.S.
and emerging market) corporations or other business entities), mortgage-related and other asset-backed securities, government and sovereign debt, taxable municipal bonds and other fixed-, variable- and floating-rate income-producing securities of U.S. and foreign issuers, including emerging market issuers. The Fund may invest in investment grade debt securities and below investment grade debt securities (commonly referred to as “high yield” securities or “junk bonds”), including securities of defaulted, distressed and stressed issuers. The Fund cannot assure you that it will achieve its investment objectives, and you could lose all of your investment in the Fund.
Portfolio Management Strategies
Dynamic Allocation Strategy.
In managing the Fund, PIMCO employs an active approach to allocation among multiple fixed income sectors based on, among other things, market conditions, valuation assessments, economic outlook, credit market trends and other economic factors. With PIMCO’s macroeconomic analysis as the basis for
top-down
investment decisions, including geographic and credit sector emphasis, PIMCO manages the Fund with a focus on seeking income generating investment ideas across multiple fixed income sectors, with an emphasis on seeking opportunities in developed and emerging global credit markets. PIMCO may choose to focus on particular countries/regions, asset classes, industries and sectors to the exclusion of others at any time and from time to time based on market conditions and other factors. The relative value assessment within
| | | | |
Principal Investment Strategies | | | | |
fixed income sectors draws on PIMCO’s regional and sector specialist insights. As a matter of fundamental policy, the Fund will normally invest at least 25% of its total assets in privately-issued (commonly known as
“non-agency”)
mortgage-related securities. The Fund will observe various investment guidelines as summarized below.
Investment Selection Strategies.
Once the Fund’s
top-down,
portfolio positioning decisions have been made as described above, PIMCO selects particular investments for the Fund by employing a
bottom-up,
disciplined credit approach which is driven by fundamental, independent research within each sector/asset class represented in the Fund, with a focus on identifying securities and other instruments with solid and/or improving fundamentals.
PIMCO utilizes strategies that focus on credit quality analysis, duration management and other risk management techniques. PIMCO attempts to identify, through fundamental research driven by independent credit analysis and proprietary analytical tools, debt obligations and other income-producing securities that provide current income and/or opportunities for capital appreciation based on its analysis of the issuer’s credit characteristics and the position of the security in the issuer’s capital structure.
Consideration of yield is only one component of the portfolio managers’ approach in managing the Fund. PIMCO also attempts to identify investments that may appreciate in value based on PIMCO’s assessment of the issuer’s credit characteristics, forecast for interest rates and outlook for particular countries/regions, currencies, industries, sectors and the global economy and bond markets generally.
The Fund may invest in debt instruments that are, at the time of purchase, rated below investment grade, or unrated but determined by PIMCO to be of comparable quality. However, the Fund will not normally invest more than 20% of its total assets in debt instruments, other than mortgage-related and other asset-backed securities, that are, at the time of purchase, rated CCC+ or lower by S&P, and Fitch and Caa1 or lower by Moody’s, or that are unrated but determined by PIMCO to be of comparable quality to securities so rated. The Fund may invest without limitation in mortgage-related and other asset-backed securities regardless of rating —
of any credit quality. For purposes of applying the foregoing policies, in the case of securities with split ratings (
a security receiving two different ratings from two different rating agencies), the Fund will apply the higher of the applicable ratings. Subject to the aforementioned investment restrictions, the Fund may invest in securities of stressed issuers, which include securities at risk of being in default as to the repayment of principal and/or interest at the time of acquisition by the Fund or that are rated in the lower rating categories by one or more nationally recognized statistical rating organizations (for example, Ca
or lower by Moody’s or CC or lower by S&P or Fitch) or, if unrated, are determined by PIMCO to be of comparable quality. Debt instruments of below investment grade quality are regarded as having predominantly speculative characteristics with respect to capacity to pay interest and to repay principal, and are commonly referred to as “high yield” securities or “junk bonds.” Debt instruments in the lowest investment grade category also may be considered to possess some speculative characteristics. The Fund may, for hedging, investment or leveraging purposes, make use of credit default swaps, which are contracts whereby one party makes periodic payments to a counterparty in exchange for the right to receive from the counterparty a payment equal to the par (or other agreed-upon) value of a referenced debt obligation in the event of a default or other credit event by the issuer of the debt obligation.
Independent Credit Analysis.
PIMCO relies primarily on its own analysis of the credit quality and risks associated with individual debt instruments considered for the Fund, rather than relying exclusively on rating agencies or third-party research. The Fund’s portfolio managers utilize this information in an attempt to manage credit risk and to identify issuers, industries or sectors that are undervalued or that offer attractive yields relative to PIMCO’s assessment of their credit characteristics. This aspect of PIMCO’s capabilities will be particularly important to the extent that the Fund invests in high yield securities and in securities of emerging market issuers.
It is expected that the Fund normally will have a short to intermediate average portfolio duration (i.e., within a zero to eight year range), as calculated by PIMCO, although it may be shorter or longer at any time or from time to time depending on market conditions and other factors. While the Fund seeks to maintain a short to intermediate average portfolio duration, there is no limit on the maturity or duration of any individual security in which the Fund may invest Duration is a measure used to determine the sensitivity of a security’s price to changes in interest rates. The Fund’s duration strategy may entail maintaining a negative average portfolio duration from time to time, which would potentially benefit the portfolio in an environment of rising market interest rates, but would generally adversely impact the portfolio in an environment of falling or neutral market interest rates. PIMCO may also utilize certain strategies, including without limitation investments in structured notes or interest rate futures contracts or swap, cap, floor or collar transactions, for the purpose of reducing the interest rate sensitivity of the Fund’s portfolio, although there is no assurance that it will do so or that such strategies will be successful.
The Fund normally invests worldwide in a portfolio of debt obligations and other income-producing securities of any type and credit quality,
with varying maturities and related derivative instruments. The Fund’s portfolio of debt obligations and income-producing securities may include, without limitation, bonds, debentures, notes, and other debt securities of U.S. and foreign
(non-U.S.)
corporate and other issuers, including commercial paper; mortgage-related and other asset-backed securities issued by governmental agencies or other governmental
entities or by private originators or issuers (including mortgage pass-through securities, collateralized mortgage obligations, adjustable rate mortgage-backed securities, stripped mortgage-backed securities, collateralized bond obligations, collateralized loan obligations and other collateralized debt obligations); U.S. Government securities; obligations of foreign governments or their
sub-divisions,
agencies and government sponsored enterprises and obligations of international agencies and supranational entities; municipal securities and other debt securities issued by states or local governments and their agencies, authorities and other government-sponsored enterprises, including taxable municipal securities (such as Build America Bonds);
securities;
step-ups;
zero-coupon
bonds; inflation-indexed bonds issued by both governments and corporations; structured notes, including hybrid or indexed securities; catastrophe bonds and other event-linked bonds; credit-linked notes; credit-linked trust instruments; structured credit products; bank loans (including, among others, senior loans, delayed funding loans, covenant-lite obligations, revolving credit facilities and loan participations and assignments); preferred securities; convertible debt securities (i.e., debt securities that may be converted at either a stated price or stated rate into underlying shares of common stock), including synthetic convertible debt securities (i.e., instruments created through a combination of separate securities that possess the two principal characteristics of a traditional convertible security, such as an income-producing security and the right to acquire an equity security) and contingent convertible securities; and bank certificates of deposit, fixed time deposits and bankers’ acceptances. The rate of interest on an income-producing security may be fixed, floating or variable, and may move in the opposite direction to interest rates generally or the interest rate on another security or index (i.e., inverse floaters). Certain corporate income-producing securities, such as convertible bonds, also may include the right to participate in equity appreciation. The Fund may invest in debt securities of stressed issuers. Subject to the investment limitations described under “Credit Quality” above, at any given time and from time to time, substantially all of the Fund’s portfolio may consist of below investment grade securities and/or mortgage-related or other types of asset-backed securities. The Fund may invest in various levels of the capital structure of an issuer of mortgage-backed or asset-backed securities, including the equity or “first loss” tranche. The Fund may also invest, as a third party purchaser, in risk retention tranches of CMBS or other eligible securitizations, which are eligible residual interests held by the
sponsors of such securitizations pursuant to the final rules implementing the credit risk retention requirements of Section 941 of the Dodd-Frank Act.
The Fund may invest without limitation in securities of U.S. issuers and without limitation in securities of foreign
(non-U.S.)
issuers, securities traded principally outside of the United States, and securities denominated in currencies other than the U.S. dollar. The Fund may invest without limit in investment grade sovereign debt denominated in the relevant country’s local currency with less than one year remaining to maturity (“short-term investment grade sovereign debt”), including short-term investment grade sovereign debt issued by emerging market issuers. The Fund may invest up to 40% of its total assets in securities and instruments that are economically tied to “emerging market” countries other than investments in short-term investment grade sovereign debt issued by emerging market issuers, where as noted above there is no limit. The Fund may also invest directly in foreign currencies, including local emerging market currencies.
The Fund may normally invest up to 40% of its total assets in bank loans (including, among others, senior loans, delayed funding loans, covenant-lite obligations, revolving credit facilities and loan participations and assignments). The Fund will not normally invest more than 10% of its total assets in convertible debt securities (i.e., debt securities that may be converted at either a stated price or stated rate into underlying shares of common stock), including synthetic convertible debt securities (i.e., instruments created through a combination of separate securities that possess the two principal characteristics of a traditional convertible security, i.e., an income-producing security and the right to acquire an equity security). The Fund may also invest in preferred securities.
As a matter of fundamental policy, the Fund normally invests at least 25% of its total assets in privately-issued (commonly known as
“non-agency”)
mortgage-related securities.
The Fund may, but is not required to, utilize various derivative strategies (both long and short positions) involving the purchase or sale of futures and forward contracts (including foreign currency exchange contracts), call and put options, credit default swaps, total return swaps, basis swaps and other swap agreements and other derivative instruments for investment purposes, leveraging purposes or in an attempt to hedge against market, credit, interest rate, currency and other risks in the portfolio. The Fund may purchase and sell securities on a when-issued, delayed delivery or forward commitment basis and may engage in short sales.
The Fund will not normally invest directly in common stocks of operating companies. However, the Fund may own and hold common stocks of operating companies in its portfolio from time to time in
| | | | |
Principal Investment Strategies | | | | |
connection with a corporate action or the restructuring of a debt instrument, or through the conversion of a convertible security held by the Fund. Common stocks include common shares and other common equity interest issued by public or private issuers.
The Fund may invest in securities that have not been registered for public sale in the U.S. or relevant
non-U.S.
jurisdictions, including without limitation securities eligible for purchase and sale pursuant to Rule 144A under the Securities Act, or relevant provisions of applicable
non-U.S.
law, and other securities issued in private placements. The Fund may invest in securities of other open- or
closed-end
investment companies (including those advised by PIMCO), including, without limitation, ETFs, to the extent that such investments are consistent with the Fund’s investment objectives, strategies and policies and permissible under the 1940 Act. The Fund may invest in other investment companies to gain broad market or sector exposure or for cash management purposes, including during periods when it has large amounts of uninvested cash or when PIMCO believes share prices of other investment companies offer attractive values. The Fund may invest in certain money market funds and/or short-term bond funds (“Central Funds”), to the extent permitted by the 1940 Act, the rules thereunder or exemptive relief therefrom. The Central Funds are registered investment companies created for use by certain registered investment companies advised by PIMCO in connection with their cash management activities. The Fund treats its investments in other investment companies that invest primarily in types of securities in which the Fund may invest directly as investments in such types of securities for purposes of the Fund’s investment policies (e.g., the Fund’s investment in an investment company that invests primarily in debt securities will be treated by the Fund as an investment in a debt security). As a shareholder in an investment company, the Fund would bear its ratable share of that investment company’s expenses and would remain subject to payment of the Fund’s management fees and other expenses with respect to assets so invested. Common Shareholders would therefore be subject to duplicative expenses to the extent the Fund invests in other investment companies. The securities of other investment companies may be leveraged, in which case the NAV and/or market value of the investment company’s shares will be more volatile than unleveraged investments. The Fund may invest in REITs. The Fund may invest in securities of companies of any market capitalization, including small and medium capitalizations.
The Fund may invest without limitation in illiquid investments (i.e., investments that the Fund reasonably expects cannot be sold or disposed of in current market conditions in seven calendar days or less without the sale or disposition significantly changing the market value of the investment).
The Fund may make investments in debt instruments and other securities or instruments directly or through one or more Subsidiaries. Each Subsidiary, for example, may invest in or originate whole loans or in shares, certificates, notes or other securities representing the right to receive principal and interest payments due on fractions of whole loans or pools of whole loans, risk retention investments or any other security or other instrument that the Fund may hold directly. References herein to the Fund include references to a Subsidiary in respect of the Fund’s investment exposure. The allocation of the Fund’s portfolio in a Subsidiary will vary over time and might not always include all of the different types of investments described herein.
The Fund may seek to originate loans, including, without limitation, residential and/or commercial real estate or mortgage-related loans, consumer loans or other types of loans, which may be in the form of whole loans, secured and unsecured notes, senior and second lien loans, mezzanine loans or similar investments. The Fund may invest in and/or originate loans to corporations and/or other legal entities and individuals, including foreign
(non-U.S.
and emerging market) entities and individuals. Such borrowers may have credit ratings that are determined by one or more nationally recognized statistical rating organizations or PIMCO to be below investment grade. The loans the Fund invests in and/or originates may vary in maturity and/or duration. The Fund is not limited in the amount, size or type of loans it may invest in and/or originate, including with respect to a single borrower or with respect to borrowers that are determined to be below investment grade, other than pursuant to any applicable law. The Fund’s investments in and/or origination of loans may also be limited by the Fund’s intention to qualify as a regulated investment company.
The Fund may invest, either directly or indirectly through its Subsidiaries, in Alt Lending ABS backed by consumer, residential or other loans, issued by an SPE sponsored by an online or alternative lending platform or an affiliate thereof.
When acquiring loans or purchasing Alt Lending ABS, the Fund is not restricted by any particular borrower credit criteria. Accordingly, certain loans acquired by the Fund or underlying any Alt Lending ABS purchased by the Fund may be subprime in quality, or may become subprime in quality.
When acquiring and/or originating loans, or purchasing Alt Lending ABS, the Fund is not restricted by any particular borrower credit criteria. Accordingly, certain loans acquired or originated by the Fund or underlying any Alt Lending ABS purchased by the Fund may be subprime in quality, or may become subprime in quality.
The Fund may enter into repurchase agreements, in which the Fund purchases a security from a bank or broker-dealer and the bank or broker-dealer agrees to repurchase the security at the Fund’s cost plus interest within a specified time.
For the purpose of achieving income, the Fund may lend its portfolio securities to brokers, dealers or other financial institutions provided a number of conditions are satisfied, including that the loan is fully collateralized.
The length of time the Fund has held a particular security is not generally a consideration in investment decisions. A change in the securities held by the Fund is known as “portfolio turnover.” The Fund may engage in frequent and active trading of portfolio securities to achieve its investment objectives, particularly during periods of volatile market movements.
There have been no significant changes in the Fund’s portfolio turnover rates over the last two fiscal years, and no significant change to the portfolio turnover rates of the Fund described in the Financial Highlights can currently be predicted.
Temporary Defensive Investments.
Upon PIMCO’s recommendation, for temporary defensive purposes or in order to keep its cash fully invested, the Fund may deviate from its investment strategy by investing some or all of its total assets in investments such as high grade debt securities, including high quality, short-term debt securities, and cash and cash equivalents. The Fund may not achieve its investment objectives when it does so.
The Fund may obtain leverage through reverse repurchase agreements, dollar rolls or borrowings, such as through bank loans or commercial paper or other credit facilities. The Fund may also enter into transactions other than those noted above that may give rise to a form of leverage including, among others, futures and forward contracts (including foreign currency exchange contracts), total return swaps and other derivative transactions, loans of portfolio securities, short sales, when-issued, delayed delivery and forward commitment
transactions and selling credit default swaps. The Fund may also determine to issue preferred shares or other types of senior securities to add leverage to its portfolio.
Under normal market conditions, the Fund will limit its use of leverage from any combination of (i) reverse repurchase agreements or dollar roll transactions (whether or not these instruments are covered as discussed below), (ii), borrowings (i.e., loans or lines of credit from banks or other credit facilities), (iii) any future issuance of preferred shares, and (iv) to the extent described below, credit default swaps, other swap agreements and futures contracts (whether or not these instruments are covered with segregated assets as discussed below)
such that the assets attributable to the use of such leverage will not exceed 50% of the Fund’s total assets (including, for purposes of the 50% limit, the amounts of leverage obtained through the use of such instruments).
The Fund utilizes certain kinds of leverage, such as reverse repurchase agreements and selling credit default swaps, opportunistically and may choose to increase or decrease, or eliminate entirely, its use of such leverage over time and from time to time based on PIMCO’s assessment of the yield curve environment, interest rate trends, market conditions and other factors.
The Fund also may borrow money in order to repurchase its shares or as a temporary measure for extraordinary or emergency purposes, including for the payment of dividends or the settlement of securities transactions which otherwise might require untimely dispositions of portfolio securities held by the Fund.
PIMCO Dynamic Income Opportunities Fund (“PDO”)
The Fund seeks to achieve its investment objectives by utilizing a dynamic asset allocation strategy among multiple fixed income sectors in the global credit markets, including corporate debt (including, among other things, fixed-, variable- and floating-rate bonds, loans, convertible securities and stressed, distressed and defaulted debt securities issued by U.S. or foreign
(non-U.S.)
corporations or other business entities, including emerging market issuers), mortgage-related and other asset-backed instruments, government and sovereign debt, taxable municipal bonds, and other fixed-, variable- and floating-rate income-producing securities of U.S. and foreign issuers, including emerging market issuers. The Fund may invest without limitation in investment grade debt obligations and below investment grade debt obligations (commonly referred to as “high yield” securities or “junk bonds”), including securities of stressed, distressed or defaulted issuers. The Fund cannot assure you that it will achieve its investment objectives or that the Fund’s investment program will be successful, and you could lose all of your investment in the Fund.
Portfolio Management Strategies
Dynamic Allocation Strategy.
In managing the Fund, the Fund’s investment manager, PIMCO, will employ an active approach to allocation among multiple fixed income sectors based on, among other things, market conditions, valuation assessments, economic outlook, credit market trends and other economic factors. With PIMCO’s macroeconomic analysis as the basis for
top-down
investment decisions, including geographic and credit sector emphasis, PIMCO will manage the Fund with a focus on seeking income generating investment ideas across multiple fixed income sectors, with an emphasis on seeking opportunities in developed and emerging
| | | | |
Principal Investment Strategies | | | | |
global credit markets. PIMCO may choose to focus on particular countries/regions, asset classes, industries and sectors to the exclusion of others at any time and from time to time based on market conditions and other factors. The relative value assessment within fixed income sectors will draw on PIMCO’s regional and sector specialist insights.
As a matter of fundamental policy, the Fund will normally invest at least 25% of its total assets (i.e., concentrate) in mortgage-related assets issued by government agencies or other governmental entities or by private originators or issuers. The Fund will observe various other investment guidelines as summarized below.
Investment Selection Strategies.
Once the Fund’s
top-down,
portfolio positioning decisions have been made as described above, PIMCO will select particular investments for the Fund by employing a
bottom-up,
disciplined credit approach which is driven by fundamental, independent research within each sector/asset class represented in the Fund, with a focus on identifying securities and other instruments with solid and/or improving fundamentals.
PIMCO will utilize strategies that focus on credit quality analysis, duration management and other risk management techniques. PIMCO will attempt to identify, through fundamental research driven by independent credit analysis and proprietary analytical tools, debt obligations and other income-producing securities that provide current income and/or opportunities for capital appreciation based on its analysis of the issuer’s credit characteristics and the position of the security in the issuer’s capital structure.
Consideration of yield is only one component of the portfolio managers’ approach in managing the Fund. PIMCO will also attempt to identify investments that may appreciate in value based on PIMCO’s assessment of the issuer’s credit characteristics, forecast for interest rates and outlook for particular countries/regions, currencies, industries, sectors and the global economy and bond markets generally.
The Fund may invest without limitation in debt instruments that are, at the time of purchase, rated below investment grade (below Baa3 by Moody’s or below
BBB-
by either S&P or Fitch), or that are unrated but determined by PIMCO to be of comparable quality. However, the Fund will not normally invest more than 20% of its total assets in debt instruments, other than mortgage-related and other asset-backed securities, that are, at the time of purchase, rated CCC+ or lower by S&P and Fitch and Caa1 or lower by Moody’s, or that are unrated but determined by PIMCO to be of comparable quality to securities so rated. The Fund may invest without limitation in mortgage-related and other asset-backed securities regardless of rating (i.e., of any credit quality). For purposes of applying the
foregoing policies, in the case of securities with split ratings (i.e., a security receiving two different ratings from two different rating agencies), the Fund will apply the higher of the applicable ratings. Subject to the aforementioned investment guidelines, the Fund may invest in securities of stressed, distressed and defaulted issuers, which include securities in default or at risk of being in default as to the repayment of principal and/or interest at the time of acquisition by the Fund or that are rated in the lower rating categories by one or more nationally recognized statistical rating organizations (for example, Ca or lower by Moody’s or CC or lower by S&P or Fitch) or, if unrated, are determined by PIMCO to be of comparable quality. Debt instruments of below investment grade quality are regarded as having predominantly speculative characteristics with respect to capacity to pay interest and to repay principal, and are commonly referred to as “high yield” securities or “junk bonds.” Debt instruments in the lowest investment grade category also may be considered to possess some speculative characteristics. The Fund may, for hedging, investment or leveraging purposes, make use of credit default swaps, which are contracts whereby one party makes periodic payments to a counterparty in exchange for the right to receive from the counterparty a payment equal to the par (or other agreed-upon) value of a referenced debt obligation in the event of a default or other credit event by the issuer of the debt obligation.
Independent Credit Analysis.
PIMCO relies primarily on its own analysis of the credit quality and risks associated with individual debt instruments considered for the Fund, rather than relying exclusively on rating agencies or third-party research. The Fund’s portfolio managers utilize this information in an attempt to manage credit risk and to identify issuers, industries or sectors that are undervalued or that offer attractive yields relative to PIMCO’s assessment of their credit characteristics. This aspect of PIMCO’s capabilities will be particularly important to the extent that the Fund invests in high yield securities and in securities of emerging market issuers.
It is expected that the Fund normally will have a short to intermediate average portfolio duration (i.e., within a zero to eight year range), as calculated by PIMCO, although it may be shorter or longer at any time depending on market conditions and other factors. For example, if the Fund has an average portfolio duration of eight years, a 1% increase in interest rates would tend to correspond to an 8% decrease in the value of the Fund’s debt portfolio. While the Fund seeks to maintain a short to intermediate average portfolio duration, there is no limit on the maturity or duration of any individual security in which the Fund may invest. Duration is a measure used to determine the sensitivity of a security’s price to changes in interest rates. The Fund’s duration strategy may entail maintaining a negative average portfolio duration from time to time, meaning the portfolio would tend to increase in value in response to
an increase in interest rates. If the Fund has a negative average portfolio duration, a 1% increase in interest rates would tend to correspond to a 1% increase in the value of the Fund’s debt portfolio for every year of negative duration. A negative average portfolio duration would potentially benefit the Fund’s portfolio in an environment of rising market interest rates, but would generally adversely impact the portfolio in an environment of falling or neutral market interest rates. PIMCO may also utilize certain strategies, including without limitation investments in structured notes or interest rate futures contracts or swap, cap, floor or collar transactions, for the purpose of reducing the interest rate sensitivity of the Fund’s portfolio, although there is no assurance that it will do so or that such strategies will be successful.
The Fund will normally invest worldwide in a portfolio of debt obligations and other income-producing securities and instruments of any type and credit quality and with varying maturities and related derivative instruments. The Fund’s portfolio of debt obligations and other income producing securities and instruments may include, without limitation, bonds, debentures, notes, and other debt securities and similar instruments of varying maturities issued by various U.S. and foreign
(non-U.S.)
corporate and other issuers, including corporate debt securities; commercial paper; securitizations and mortgage-related and other asset-backed instruments issued by government agencies or other governmental entities or by private originators or issuers (including agency and
non-agency
RMBS, CMBS, CBOs, CMOs, CLOs, other CDOs and other similarly structured securities, including the residual or equity tranches thereof); derivatives on mortgage-related instruments; U.S. Government securities; obligations of foreign governments or their
sub-divisions,
agencies and government sponsored enterprises and obligations of international agencies and supranational entities; municipal securities and other debt securities issued by states or local governments and their agencies, authorities and other government-sponsored enterprises, including taxable municipal securities (such as Build America Bonds); PIKs;
zero-coupon
bonds; inflation-indexed bonds issued by both governments and corporations; structured notes, including hybrid or indexed securities; catastrophe bonds and other event-linked bonds; credit-linked notes; credit-linked trust instruments; structured credit products; loans (including, among others, bank loans, whole loans, senior loans, mezzanine loans, delayed funding loans, covenant-lite obligations, revolving credit facilities and loan participations and assignments, loans held and/or originated by private financial institutions, including commercial and residential mortgage loans, corporate loans and consumer loans (such as credit card receivables, automobile loans and student loans)); preferred securities; convertible debt securities (i.e., debt securities that may be converted at either a stated price or stated
rate into underlying shares of common stock), including synthetic convertible debt securities (i.e., instruments created through a combination of separate securities that possess the two principal characteristics of a traditional convertible security, such as an income-producing security and the right to acquire an equity security) and CoCos; bank capital securities; and bank certificates of deposit, fixed time deposits and bankers’ acceptances. The rate of interest on an income-producing security may be fixed, floating or variable, and may move in the opposite direction to interest rates generally or the interest rate on another security or index. Certain corporate income-producing securities, such as convertible bonds, also may include the right to participate in equity appreciation, and PIMCO will generally evaluate those instruments based primarily on their debt characteristics.
The Fund may invest in debt securities of stressed or distressed issuers as well as in defaulted securities and
financings. At any given time and from time to time, all of the Fund’s portfolio may consist of below investment grade securities and/or mortgage-related or other types of asset-backed securities. The Fund may invest in various levels of the capital structure of an issuer of mortgage-backed or asset-backed securities, including the equity or “first loss” tranche. For the avoidance of doubt, equity or “first loss” tranches of mortgage-backed or asset-backed securities do not constitute equity interests for purposes of the Fund’s 20% limit on investments in equity interests described below. The Fund may invest without limitation in investment grade debt securities and below investment grade debt securities (commonly referred to as “high yield” securities or “junk bonds”), including securities of stressed, distressed or defaulted issuers.
The Fund may invest without limitation in securities of U.S. issuers. Subject to the limit described below on investments in securities and instruments that are economically tied to “emerging market” countries, the Fund may invest without limitation in securities of foreign
(non-U.S.)
issuers, securities traded principally outside of the United States and securities denominated in currencies other than the U.S. dollar. The Fund may invest without limitation in investment grade sovereign debt denominated in the relevant country’s local currency with less than one year remaining to maturity (“short-term investment grade sovereign debt”), including short-term investment grade sovereign debt issued by emerging market issuers. The Fund may invest up to 30% of its total assets in securities and instruments that are economically tied to “emerging market” countries other than investments in short-term investment grade sovereign debt issued by emerging market issuers, where, as noted above, there is no limit. The Fund may also invest directly in foreign currencies, including local emerging market currencies.
| | | | |
Principal Investment Strategies | | | | |
The Fund may normally invest up to 40% of its total assets in bank loans (including, among others, senior loans, delayed funding loans, covenant-lite obligations, revolving credit facilities and loan participations and assignments). The Fund will not normally invest more than 10% of its total assets in convertible debt securities (i.e., debt securities that may be converted at either a stated price or stated rate into underlying shares of common stock).
As a matter of fundamental policy, the Fund will normally invest at least 25% of its total assets (i.e., concentrate) in mortgage-related assets issued by government agencies or other governmental entities or by private originators or issuers.
The Fund may, but is not required to, utilize various derivative strategies (both long and short positions) involving the purchase or sale of futures and forward contracts (including foreign currency exchange contracts), call and put options, credit default swaps, total return swaps, basis swaps and other swap agreements and other derivative instruments for investment purposes, leveraging purposes or in an attempt to hedge against market, credit, interest rate, currency and other risks in the portfolio. The Fund may purchase and sell securities on a when-issued, delayed delivery or forward commitment basis and may engage in short sales.
The Fund may invest to a limited degree (typically no more than 20% of its total assets) in equity interests, such as shares of other investment companies, including
open-end
or
closed-end
management investment companies and ETFs, and REITs, except that the Fund may invest without limitation in preferred securities. Such equity interests may be issued by public or private issuers. For these purposes, common stocks or other equity interests the Fund has received through the conversion of a convertible security held by the Fund or in connection with the restructuring of a debt security will not count towards this 20% limit.
The Fund may invest in securities that have not been registered for public sale in the U.S. or relevant
non-U.S.
jurisdictions, including without limitation securities eligible for purchase and sale pursuant to Rule 144A under the Securities Act, or relevant provisions of applicable
non-U.S.
law, and other securities issued in private placements. The Fund may invest in securities of other open- or
closed-end
investment companies (including those advised by PIMCO), including, without limitation, ETFs, to the extent that such investments are consistent with the Fund’s investment objectives, strategies and policies and permissible under the 1940 Act. The Fund may invest in other investment companies to gain broad market or sector exposure or for cash management purposes, including during periods when it has large amounts of uninvested cash or when PIMCO believes share prices of other investment companies offer attractive values. The Fund may invest in certain money market funds and/or short-term bond
funds (“Central Funds”), to the extent permitted by the 1940 Act, the rules thereunder or exemptive relief therefrom. The Central Funds are registered investment companies created for use by certain registered investment companies advised by PIMCO in connection with their cash management activities. The Fund treats its investments in other investment companies that invest primarily in types of securities in which the Fund may invest directly as investments in such types of securities for purposes of the Fund’s investment policies (e.g., the Fund’s investment in an investment company that invests primarily in debt securities will be treated by the Fund as an investment in a debt security). As a shareholder in an investment company, the Fund would bear its ratable share of that investment company’s expenses and would remain subject to payment of the Fund’s management fees and other expenses with respect to assets so invested. Common Shareholders would therefore be subject to duplicative expenses to the extent the Fund invests in other investment companies. The securities of other investment companies may be leveraged, in which case the NAV and/or market value of the investment company’s shares will be more volatile than unleveraged investments. The Fund may invest in securities of companies of any market capitalization, including small, medium and large capitalizations.
The Fund may invest without limitation in illiquid investments (i.e., investments that the Fund reasonably expects cannot be sold or disposed of in current market conditions in seven calendar days or less without the sale or disposition significantly changing the market value of the investment).
The Fund may make investments in debt instruments and other securities or instruments directly or through one or more Subsidiaries. Each Subsidiary may invest, for example, in whole loans or in shares, certificates, notes or other securities representing the right to receive principal and interest payments due on fractions of whole loans or pools of whole loans, risk retention investments or any other security or other instrument that the Fund may hold directly. References herein to the Fund include references to a Subsidiary in respect of the Fund’s investment exposure. The allocation of the Fund’s assets to a Subsidiary will vary over time and will likely not include all of the different types of investments described herein at any given time. The Fund will treat a Subsidiary’s assets as assets of the Fund for purposes of determining compliance with various provisions of the 1940 Act applicable to the Fund, including those relating to investment policies (Section 8), affiliated transactions and custody (Section 17) and capital structure and leverage (Section 18). In addition, PIMCO and the Fund’s Board of Trustees will comply with the provisions of Section 15 of the 1940 Act with respect to a Subsidiary’s investment advisory contract.
The Fund may invest, either directly or indirectly through its Subsidiaries, in Alt Lending ABS. Any such Alt Lending ABS may be
backed by consumer, commercial, residential or other loans, including those issued by an SPE sponsored by an online or alternative lending platform or an affiliate thereof.
When acquiring loans or purchasing Alt Lending ABS, the Fund is not restricted by any particular borrower credit criteria. Accordingly, certain loans acquired by the Fund or underlying any Alt Lending ABS purchased by the Fund may be subprime in quality, or may become subprime in quality.
The Fund may enter into repurchase agreements, in which the Fund purchases a security from a bank or broker-dealer and the bank or broker-dealer agrees to repurchase the security at the Fund’s cost plus interest within a specified time.
For the purpose of achieving income, the Fund may lend its portfolio securities to brokers, dealers or other financial institutions provided a number of conditions are satisfied, including that the loan is fully collateralized.
The length of time the Fund has held a particular security is not generally a consideration in investment decisions. A change in the securities held by the Fund is known as “portfolio turnover.” The Fund may engage in frequent and active trading of portfolio securities to achieve its investment objectives, particularly during periods of volatile market movements.
Temporary Defensive Investments.
In attempting to respond to adverse market, economic, political, or other conditions, as determined by PIMCO, when PIMCO deems it appropriate to do so, the Fund may, for temporary defensive purposes, deviate from its investment strategy by investing some or all of its total assets in investments such as high grade debt securities, including high quality, short-term debt securities, and cash and cash equivalents. The Fund may not achieve its investment objectives when it does so.
The Fund may, and currently does, leverage its portfolio by utilizing reverse repurchase agreements. The Fund may also enter into other transactions that may give rise to a form of leverage including, among others, (i) selling credit default swaps, (ii) dollar rolls, (iii) borrowings, such as through bank loans or commercial paper and/or other credit facilities, (iv) futures and forward contracts (including foreign currency exchange contracts), (v) total return swaps, (vi) other derivative transactions, (vii) loans of portfolio securities, (viii) short sales and (ix) when-issued, delayed delivery and forward commitment transactions. The Fund may also determine to issue preferred shares or other types of senior securities to add leverage to its portfolio. The Fund’s Board may authorize the issuance of preferred shares without the approval of Common Shareholders. If the Fund issues preferred shares in the
future, all costs and expenses relating to the issuance and ongoing maintenance of the preferred shares will be borne by the Common Shareholders, and these costs and expenses may be significant.
Under normal market conditions, the Fund will limit its use of leverage, subject to the limitations set forth in the 1940 Act, from any combination of (i) reverse repurchase agreements or dollar roll transactions (whether or not these instruments are covered as discussed below), (ii) borrowings (i.e., loans or lines of credit from banks or other credit facilities), (iii) any future issuance of preferred shares, and (iv) to the extent described below, credit default swaps, other swap agreements and futures contracts (whether or not these instruments are covered with segregated assets as discussed below), subject to the 50% policy. For these purposes, assets attributable to the use of leverage from credit default swaps, other swap agreements and futures contracts will be determined based on the current market value of the instrument if it is cash settled or based on the notional value of the instrument if it is not cash settled. In addition, assets attributable to credit default swaps, other swap agreements or futures contracts will not be counted towards the 50% policy to the extent that the Fund owns offsetting positions or enters into offsetting transactions.
The Fund intends to utilize certain kinds of leverage, such as reverse repurchase agreements and selling credit default swaps, opportunistically and may choose to increase or decrease, or eliminate entirely, its use of such leverage over time and from time to time based on PIMCO’s assessment of the yield curve environment, interest rate trends, market conditions and other factors.
The Fund also may borrow money in order to repurchase its shares or as a temporary measure for extraordinary or emergency purposes, including for the payment of dividends or the settlement of securities transactions which otherwise might require untimely dispositions of portfolio securities held by the Fund.
PIMCO Access Income Fund (“PAXS”)
The Fund seeks to achieve its investment objectives by utilizing a dynamic asset allocation strategy among multiple sectors in the global public and private credit markets, including corporate debt (including, among other things, fixed-, variable- and floating-rate bonds, loans, convertible securities and stressed, distressed and defaulted debt securities issued by U.S. or foreign
(non-U.S.)
corporations or other business entities, including emerging market issuers), mortgage-related and other asset-backed instruments, government and sovereign debt, taxable municipal bonds and other fixed-, variable- and floating-rate income-producing securities of U.S. and foreign issuers, including emerging market issuers and real estate-related investments (such real estate-related investments, collectively, “real
| | | | |
Principal Investment Strategies | | | | |
estate investments”). The Fund may invest without limitation in investment grade debt securities and below investment grade debt securities (commonly referred to as “high yield” securities or “junk bonds”), including securities of stressed, distressed or defaulted issuers. The Fund cannot assure you that it will achieve its investment objectives or that the Fund’s investment program will be successful, and you could lose all of your investment in the Fund.
Portfolio Management Strategies
Dynamic Allocation Strategy.
In managing the Fund, the Fund’s investment manager, PIMCO, will employ an active approach to allocation among multiple fixed income sectors based on, among other things, market conditions, valuation assessments, economic outlook, credit market trends and other economic factors. With PIMCO’s macroeconomic analysis as the basis for
top-down
investment decisions, including geographic and credit sector emphasis, PIMCO will manage the Fund with a focus on seeking income generating investment ideas across multiple fixed income sectors, including opportunities in developed and emerging global credit markets. PIMCO may choose to focus on particular countries/regions, asset classes, industries and sectors to the exclusion of others at any time and from time to time based on market conditions and other factors. The relative value assessment within fixed income sectors will draw on PIMCO’s regional and sector specialist insights.
As a matter of fundamental policy, the Fund will normally invest at least 25% of its total assets (i.e., concentrate) in real estate investments and mortgage-related assets issued by government agencies or other governmental entities or by private originators or issuers. The Fund will observe various other investment guidelines as summarized below.
Investment Selection Strategies.
Once the Fund’s
top-down,
portfolio positioning decisions have been made as described above, PIMCO will select particular investments for the Fund by employing a
bottom-up,
disciplined credit approach which is driven by fundamental, independent research within each sector/asset class represented in the Fund, with a focus on identifying securities and other instruments with solid and/or improving fundamentals.
PIMCO will utilize strategies that focus on credit quality analysis, duration management and other risk management techniques. PIMCO will attempt to identify, through fundamental research driven by independent credit analysis and proprietary analytical tools, debt obligations and other income-producing securities that provide current income and/or opportunities for capital appreciation based on its analysis of the issuer’s credit characteristics and the position of the security in the issuer’s capital structure.
Consideration of yield is only one component of the portfolio managers’ approach in managing the Fund. PIMCO will also attempt to identify investments that may appreciate in value based on PIMCO’s assessment of the issuer’s credit characteristics, forecast for interest rates and outlook for particular countries/regions, currencies, industries, sectors and the global economy and bond markets generally.
The Fund may invest without limitation in debt instruments that are, at the time of purchase, rated below investment grade (below Baa3 by Moody’s Investors Service, Inc. (“Moody’s”) or below
BBB-
by either S&P Global Ratings (“S&P”) or Fitch, Inc. (“Fitch”)), or that are unrated but determined by PIMCO to be of comparable quality. However, the Fund will not normally invest more than 20% of its total assets in debt instruments, other than mortgage-related and other asset-backed securities (“ABS”), that are, at the time of purchase, rated CCC+ or lower by S&P and Fitch and Caa1 or lower by Moody’s, or that are unrated but determined by PIMCO to be of comparable quality to securities so rated. The Fund may invest without limitation in mortgage-related and other ABS regardless of rating (i.e., of any credit quality). For purposes of applying the foregoing policies, in the case of securities with split ratings (i.e., a security receiving two different ratings from two different rating agencies), the Fund will apply the higher of the applicable ratings. Subject to the aforementioned investment guidelines, the Fund may invest in securities of stressed, distressed or defaulted issuers, which include securities in default or at risk of being in default as to the repayment of principal and/or interest at the time of acquisition by the Fund or that are rated in the lower rating categories by one or more nationally recognized statistical rating organizations (“NRSROs”) (for example, Ca or lower by Moody’s or CC or lower by S&P or Fitch) or, if unrated, are determined by PIMCO to be of comparable quality. Debt instruments of below investment grade quality are regarded as having predominantly speculative characteristics with respect to capacity to pay interest and to repay principal, and are commonly referred to as “high yield” securities or “junk bonds.” Debt instruments in the lowest investment grade category also may be considered to possess some speculative characteristics. The Fund may, for hedging, investment or leveraging purposes, make use of credit default swaps, which are contracts whereby one party makes periodic payments to a counterparty in exchange for the right to receive from the counterparty a payment equal to the par (or other agreed-upon) value of a referenced debt obligation in the event of a default or other credit event by the issuer of the debt obligation.
Independent Credit Analysis.
PIMCO will rely primarily on its own analysis of the credit quality and risks associated with individual debt instruments considered for the Fund, rather than relying exclusively on rating agencies or third-party research. The Fund’s portfolio managers will utilize this information in an attempt to manage credit risk and/or
to identify issuers, industries or sectors that are undervalued and/or offer attractive yields relative to PIMCO’s assessment of their credit characteristics. This aspect of PIMCO’s capabilities will be particularly important to the extent that the Fund invests in high yield securities and in securities of emerging market issuers.
It is expected that the Fund normally will have a short to intermediate average portfolio duration (i.e., within a zero to eight year range), as calculated by PIMCO, although it may be shorter or longer at any time depending on market conditions and other factors. For example, if the Fund has an average portfolio duration of eight years, a 1% increase in interest rates would tend to correspond to an 8% decrease in the value of the Fund’s debt portfolio. While the Fund seeks to maintain a short to intermediate average portfolio duration, there is no limit on the maturity or duration of any individual security in which the Fund may invest. Duration is a measure used to determine the sensitivity of a security’s price to changes in interest rates. The Fund’s duration strategy may entail maintaining a negative average portfolio duration from time to time, meaning the portfolio would tend to increase in value in response to an increase in interest rates. If the Fund has a negative average portfolio duration, a 1% increase in interest rates would tend to correspond to a 1% increase in the value of the Fund’s debt portfolio for every year of negative duration. A negative average portfolio duration would potentially benefit the Fund’s portfolio in an environment of rising market interest rates, but would generally adversely impact the portfolio in an environment of falling or neutral market interest rates. PIMCO may also utilize certain strategies, including without limitation investments in structured notes or interest rate futures contracts or swap, cap, floor or collar transactions, for the purpose of reducing the interest rate sensitivity of the Fund’s portfolio, although there is no assurance that it will do so or that such strategies will be successful.
The Fund will normally invest worldwide in a portfolio of debt obligations and other income-producing securities and instruments of any type and credit quality and with varying maturities and related derivative instruments.
The Fund’s portfolio of debt obligations and other income producing securities and instruments may include, without limitation, bonds, debentures, notes, and other debt securities and similar instruments of varying maturities issued by various U.S. and foreign
(non-U.S.)
corporate and other issuers, including corporate debt securities; commercial paper; securitizations and mortgage-related and other asset-backed instruments issued by government agencies or other governmental entities or by private originators or issuers (including agency and
non-agency
residential mortgage-backed securities and
commercial mortgage-backed securities (“CMOs”), collateralized bond obligations (“CBOs”), collateralized mortgage obligations, collateralized loan obligations (“CLOs”), other collateralized debt obligations (“CDOs”) and other similarly structured securities, including the residual or equity tranches thereof); derivatives on mortgage-related instruments; U.S. government securities; obligations of foreign governments or their
sub-divisions,
agencies and government sponsored enterprises and obligations of international agencies and supranational entities; municipal securities and other debt securities issued by states or local governments and their agencies, authorities and other government-sponsored enterprises, including taxable municipal securities (such as Build America Bonds);
securities;
zero-coupon
bonds; inflation-indexed bonds issued by both governments and corporations; structured notes, including hybrid or indexed securities; catastrophe bonds and other event-linked bonds; credit-linked notes; credit-linked trust instruments; structured credit products; loans (including, among others, bank loans, whole loans, senior loans, mezzanine loans, delayed funding loans, covenant-lite obligations, revolving credit facilities and loan participations and assignments, loans held and/or originated by private financial institutions, including commercial and residential mortgage loans, corporate loans and consumer loans (such as credit card receivables, automobile loans and student loans)); preferred securities; convertible debt securities (i.e., debt securities that may be converted at either a stated price or stated rate into shares of common stock of the issuer of the securities), including synthetic convertible debt securities (i.e., instruments created through a combination of separate securities that possess the two principal characteristics of a traditional convertible security, such as an income-producing security and the right to acquire an equity security); preferred securities; convertible debt securities, including synthetic convertible debt securities and contingent convertible securities (“CoCos”); bank capital securities; and bank certificates of deposit, fixed time deposits and bankers’ acceptances. The rate of interest on an income-producing security may be fixed, floating or variable, and may move in the opposite direction to interest rates generally or the interest rate on another security or index. Certain corporate income-producing securities, such as convertible bonds, also may include the right to participate in equity appreciation, and PIMCO will generally evaluate those instruments based primarily on their debt characteristics.
The Fund may invest in debt securities of stressed or distressed issuers as well as in defaulted securities and
financings. At any given time and from time to time, all of the Fund’s portfolio may consist of below investment grade securities and/or mortgage-related or other types of ABS. The Fund may invest in any level of the capital structure of an issuer of mortgage-backed or ABS, including the equity or “first loss” tranche. The Fund may invest in securitization risk retention tranches in the capacity of a third-party purchaser with
| | | | |
Principal Investment Strategies | | | | |
respect to securitizations sponsored by others. The Fund may invest without limitation in investment grade debt securities and below investment grade debt securities (commonly referred to as “high yield” securities or “junk bonds”), including securities of stressed, distressed or defaulted issuers. The Fund may invest in any level of the capital structure of an issuer of mortgage-backed or asset-backed instruments, including the equity or “first loss” tranche.
The Fund may invest in U.S. and
non-U.S.
(including emerging markets) real estate investments, including equity or debt securities issued by private and public real estate investment trusts (“REITs”) or real estate operating companies (“REOCs”), private or public real estate-related loans and real estate-linked derivative instruments.
The Fund may invest in and/or originate loans, including, without limitation, to corporations and/or other legal entities and individuals (including foreign
(non-U.S.)
and emerging market entities and individuals) and/or residential and/or commercial real estate or mortgage-related loans, consumer loans or other types of loans, which may be in the form of whole loans, secured and unsecured notes, senior and second lien loans, mezzanine loans or similar investments. Such borrowers may have credit ratings that are determined by one or more NRSROs or PIMCO to be below investment grade. The loans the Fund invests in or originates may vary in maturity and/or duration. The Fund will not normally invest more than 25% of its total assets in whole loans that the Fund has directly originated; however, otherwise, the Fund is not limited in the amount, size or type of loans it may invest in and/or originate, including with respect to a single borrower or with respect to borrowers that are determined to be below investment grade, other than pursuant to any applicable law. The Fund’s investment in or origination of loans may also be limited by the requirements the Fund intends to observe under Subchapter M of the Internal Revenue Code of 1986, as amended (the “Code”), in order to qualify as a regulated investment company (“RIC”). The Fund may invest in securitization risk retention tranches in the capacity of a third-party purchaser with respect to securitizations sponsored by others.
The Fund may invest either directly or indirectly through its Subsidiaries in shares, certificates, notes or other securities issued by a special purpose entity (“SPE”) sponsored by an alternative lending platform (i.e., an online lending marketplace or lender that is not a traditional banker, such as a bank) or its affiliates (the “Sponsor”) that represent the right to receive principal and interest payments due on pools of whole loans or fractions of whole loans, which may (but may not) be issued by the Sponsor, held by the SPE (“Alt Lending ABS”). Any such Alt Lending ABS may be backed by consumer, commercial, residential or other loans, including those issued by an SPE sponsored by an online or alternative lending platform or an affiliate thereof.
When acquiring loans or purchasing Alt Lending ABS, the Fund is not restricted by any particular borrower credit criteria. Accordingly, certain loans acquired by the Fund or underlying any Alt Lending ABS purchased by the Fund may be subprime in quality, or may become subprime in quality.
The Fund may normally invest up to 40% of its total assets in bank loans (including, among others, senior loans, delayed funding loans, covenant-lite obligations, revolving credit facilities and loan participations and assignments). The Fund will not normally invest more than 10% of its total assets in convertible debt securities (i.e., debt securities that may be converted at either a stated price or stated rate into shares of common stock of the issuer of the securities).
The Fund may invest without limitation in securities of U.S. issuers. Subject to the limit described below on investments in securities and instruments that are economically tied to “emerging market” countries, the Fund may invest without limitation in securities of foreign
(non-U.S.)
issuers, securities traded principally outside of the United States and securities denominated in currencies other than the U.S. dollar. The Fund may invest without limitation in investment grade sovereign debt denominated in the relevant country’s local currency with less than one year remaining to maturity (“short-term investment grade sovereign debt”), including short-term investment grade sovereign debt issued by emerging market issuers. The Fund may invest up to 30% of its total assets in securities and instruments that are economically tied to “emerging market” countries other than investments in short-term investment grade sovereign debt issued by emerging market issuers, where, as noted above, there is no limit. The Fund may also invest directly in foreign currencies, including local emerging market currencies.
As a matter of fundamental policy, the Fund will normally invest at least 25% of its total assets (i.e., concentrate) in real estate investments and mortgage-related assets issued by government agencies or other governmental entities or by private originators or issuers.
The Fund may, but is not required to, utilize various derivative strategies (both long and short positions) involving the purchase or sale of futures and forward contracts (including foreign currency exchange contracts), call and put options, credit default swaps, total return swaps, basis swaps and other swap agreements and other derivative instruments for investment purposes, leveraging purposes or in an attempt to hedge against market, credit, interest rate, currency and other risks in the portfolio. The Fund may purchase and sell securities on a when-issued, delayed delivery or forward commitment basis and may engage in short sales.
The Fund may invest in equity interests, such as shares of other investment companies, including
open-end
or
closed-end
management
investment companies and exchange-traded funds (“ETFs”), and exchange-traded REITs. The Fund may invest in pooled investment vehicles other than registered investment companies that rely on exemptions from registration pursuant to Section 3(c) of the 1940 Act, including, for example, real estate-related companies relying on Section 3(c)(5). The Fund will not invest more than 15% of its net assets in pooled investment vehicles that would be investment companies, as defined in Section 3 of the 1940 Act, but for Section 3(c)(1) or 3(c)(7) of the 1940 Act, provided, however, that such limitation does not apply to REITs and asset-backed issuers, including, without limitation, CLOs, CBOs and other CDOs, residential mortgage-backed securities (“RMBS”), CMBS, CMOs and tender option bonds. The Fund may also invest without limitation in preferred securities. Equity interests may be issued by public or private issuers. The Fund may invest in securities of companies with any market capitalization, including small, medium and large capitalizations.
The Fund may invest in securities that have not been registered for public sale in the United States or relevant
non-U.S.
jurisdictions, including without limitation securities eligible for purchase and sale pursuant to Rule 144A under the Securities Act, or relevant provisions of applicable
non-U.S.
law, and other securities issued in private placements. The Fund may invest in securities of other open- or
closed-end
investment companies (including those advised by PIMCO), including, without limitation, ETFs, to the extent that such investments are consistent with the Fund’s investment objectives, strategies and policies and permissible under the 1940 Act. The Fund may invest in other investment companies to gain broad market or sector exposure or for cash management purposes, including during periods when it has large amounts of uninvested cash or when PIMCO believes share prices of other investment companies offer attractive values. The Fund may invest in certain money market funds and/or short-term bond funds (“Central Funds”), to the extent permitted by the 1940 Act, the rules thereunder or exemptive relief therefrom. The Central Funds are registered investment companies created for use by certain registered investment companies advised by PIMCO in connection with their cash management activities. The Fund treats its investments in other investment companies that invest primarily in types of securities in which the Fund may invest directly as investments in such types of securities for purposes of the Fund’s investment policies (e.g., the Fund’s investment in an investment company that invests primarily in debt securities will be treated by the Fund as an investment in a debt security). As a shareholder in an investment company, the Fund would bear its ratable share of that investment company’s expenses and would remain subject to payment of the Fund’s management fees and other expenses with respect to assets so invested. Common Shareholders would therefore be subject to duplicative expenses to the extent the Fund invests in other investment companies. The securities
of other investment companies may be leveraged, in which case the NAV and/or market value of the investment company’s shares will be more volatile than unleveraged investments.
The Fund may seek to gain exposure to, among other types of investments, certain newly-issued Regulation S securities through investments in a Cayman Subsidiary. Regulation S securities are securities of U.S. and
non-U.S.
issuers that are issued through
off-shore
(non-U.S.)
offerings without registration with the SEC pursuant to Regulation S under the Securities Act. Offerings of Regulation S securities may be conducted outside of the United States. A Cayman Subsidiary (unlike the Fund) may invest without limitation in Regulation S securities. While a Cayman Subsidiary may be considered similar to an investment company, it is not registered under the 1940 Act and is not subject to all of the investor protections of the 1940 Act. In addition, changes in the laws of the United States and/or the Cayman Islands could result in the inability of the Fund and/or a Cayman Subsidiary to operate as described in this prospectus and the Statement of Additional Information and could adversely affect the Fund. Changes in the laws of the United States and/or the Cayman Islands could adversely affect the performance of the Fund and/or a Cayman Subsidiary.
The Fund may invest without limitation in illiquid investments (i.e., investments that the Fund reasonably expects cannot be sold or disposed of in current market conditions in seven calendar days or less without the sale or disposition significantly changing the market value of the investment).
The Fund may make investments in debt instruments and other securities or instruments directly or through one or more Subsidiaries. Each Subsidiary may invest, for example, in whole loans or in shares, certificates, notes or other securities representing the right to receive principal and interest payments due on fractions of whole loans or pools of whole loans, risk retention investments or any other security or other instrument that the Fund may hold directly. The Fund does not currently intend to create, form or sponsor, or invest in securities that would result in the Fund having more than 25% of the voting securities of, any entity for investment purposes other than wholly-owned subsidiaries.
The Fund will treat the assets of its Subsidiaries as assets of the Fund for purposes of determining compliance with various provisions of the 1940 Act applicable to the Fund, including those relating to investment policies (Section 8), affiliated transactions and custody (Section 17) and capital structure and leverage (Section 18). In addition, PIMCO and the Fund’s Board of Trustees will comply with the provisions of Section 15 of the 1940 Act with respect to such a Subsidiary’s investment advisory contracts. To the extent that any Subsidiary of the Fund directly incurs leverage in the form of debt or
| | | | |
Principal Investment Strategies | | | | (Unaudited) |
preferred shares, the amount of such leverage used by a Fund and such Subsidiaries will be consolidated and treated as senior securities for purposes of complying with the 1940 Act’s limitations on leverage by a Fund.
The Fund may enter into repurchase agreements, in which the Fund purchases a security from a bank or broker-dealer and the bank or broker-dealer agrees to repurchase the security at the Fund’s cost plus interest within a specified time.
For the purpose of achieving income, the Fund may lend its portfolio securities to brokers, dealers or other financial institutions provided a number of conditions are satisfied, including that the loan is fully collateralized.
The length of time the Fund has held a particular security is not generally a consideration in investment decisions. A change in the securities held by the Fund is known as “portfolio turnover.” The Fund may engage in frequent and active trading of portfolio securities to achieve its investment objectives, particularly during periods of volatile market movements.
Temporary Defensive Investments.
In attempting to respond to adverse market, economic, political, or other conditions, as determined by PIMCO, when PIMCO deems it appropriate to do so, the Fund may, for temporary defensive purposes, deviate from its investment strategy by investing some or all of its total assets in investments such as high grade debt securities, including high quality, short-term debt securities, and cash and cash equivalents. The Fund may not achieve its investment objectives when it does so.
The Fund currently intends, subject to favorable market conditions, to add leverage to its portfolio by utilizing reverse repurchase agreements. The Fund may also enter into transactions other than through reverse repurchase agreements that may give rise to a form of leverage including, among others, (i) selling credit default swaps, (ii) dollar rolls/buy backs, (iii) borrowings, such as through bank loans or commercial paper and/or other credit facilities, (iv) futures and forward contracts (including foreign currency exchange contracts), (v) total return swaps, (vi) other derivative transactions, (vii) loans of portfolio securities, (viii) short sales and (ix) when-issued, delayed delivery and forward commitment transactions. The Fund may also determine to issue preferred shares or other types of senior securities to add leverage to its portfolio. The Fund’s Board may authorize the issuance of preferred shares without the approval of Common Shareholders. If the Fund issues preferred shares in the future, all costs and expenses relating to the issuance and ongoing maintenance of the preferred shares will be borne by the Common Shareholders, and these costs and expenses may be significant.
Under normal market conditions, the Fund will limit its use of leverage, subject to the limitations set forth in the Investment Company Act of 1940, as amended (the “1940 Act”), from any combination of (i) reverse repurchase agreements (whether or not these instruments are covered as discussed in the Fund’s Prospectus), (ii) borrowings (i.e., loans or lines of credit from banks or other credit facilities), (iii) any future issuance of preferred shares, and (iv) to the extent described below, credit default swaps, other swap agreements and futures contracts (whether or not these instruments are covered as discussed below) such that the assets attributable to the use of such leverage will not exceed 50% of the Fund’s total assets (including, for purposes of the 50% limit, the amount of assets obtained through the use of such instruments) (the “50% policy”).
The Fund intends to utilize certain kinds of leverage, such as reverse repurchase agreements and selling credit default swaps, opportunistically and may choose to increase or decrease, or eliminate entirely, its use of such leverage over time and from time to time based on PIMCO’s assessment of the yield curve environment, interest rate trends, market conditions and other factors.
The Fund also may borrow money in order to repurchase its shares or as a temporary measure for extraordinary or emergency purposes, including for the payment of dividends or the settlement of securities transactions which otherwise might require untimely dispositions of portfolio securities held by the Fund.
| | | | |
Principal Risks of the Funds | | | | (Unaudited) |
The factors that are most likely to have a material effect on a particular Fund’s portfolio as a whole are called “principal risks.” Unless otherwise indicated, each Fund is subject to the principal risks indicated below, whether through direct investments, investments by a subsidiary (if applicable) or derivative positions. Each Fund may be subject to additional risks other than those described below because the types of investments made by a Fund can change over time.
The Fund’s Amended and Restated Agreement and Declaration of Trust or Articles of Incorporation (collectively, the “Organizational Documents”), as applicable, includes provisions that could limit the ability of other entities or persons to acquire control of the Fund or to convert the Fund to
open-end
status. These provisions in the Organizational Documents could have the effect of depriving the holders (“Common Shareholders”) of the Fund’s common shares of beneficial interest (“Common Shares”) of opportunities to sell their Common Shares at a premium over the then-current market price of the Common Shares or at NAV.
The Fund’s investment performance depends upon how its assets are allocated and reallocated. A principal risk of investing in the Fund is that PIMCO may make less than optimal or poor asset allocation decisions. PIMCO employs an active approach to allocation among multiple fixed-income sectors, but there is no guarantee that such allocation techniques will produce the desired results. It is possible that PIMCO will focus on an investment that performs poorly or underperforms other investments under various market conditions. You could lose money on your investment in the Fund as a result of these allocation decisions.
Call risk refers to the possibility that an issuer may exercise its right to redeem a fixed income security earlier than expected (a call). Issuers may call outstanding securities prior to their maturity for a number of reasons (e.g., declining interest rates, changes in credit spreads and improvements in the issuer’s credit quality). If an issuer calls a security in which the Fund has invested, the Fund may not recoup the full amount of its initial investment and may be forced to reinvest in lower-yielding securities, securities with greater credit risks or securities with other, less favorable features.
Certain broker-dealers may be considered to be affiliated persons of the Fund and/or the Investment Manager due to their possible affiliations with Allianz SE, the ultimate parent of the Investment Manager. Absent an exemption from the SEC or other regulatory relief, the Fund is generally precluded from effecting certain principal transactions with affiliated brokers, and its ability to purchase
securities being underwritten by an affiliated broker or a syndicate including an affiliated broker, or to utilize affiliated brokers for agency transactions, is subject to restrictions. This could limit the Fund’s ability to engage in securities transactions and take advantage of market opportunities.
PIMCO has applied for exemptive relief from the SEC that, if granted, would permit the Fund to, among other things,
co-invest
with certain other persons, including certain affiliates of PIMCO and certain public or private funds managed by PIMCO and its affiliates, subject to certain terms and conditions. However, there is no assurance that such relief will be granted.
Risk of Investing in China
Investments in securities of companies domiciled in the People’s Republic of China (“China” or the “PRC”) involve a high degree of risk and special considerations not typically associated with investing in the U.S. securities markets. Such heightened risks include, among others, an authoritarian government, popular unrest associated with demands for improved political, economic and social conditions, the impact of regional conflict on the economy and hostile relations with neighboring countries.
Military conflicts, either in response to internal social unrest or conflicts with other countries, could disrupt economic development. The Chinese economy is vulnerable to the long-running disagreements with Hong Kong related to integration. China has a complex territorial dispute regarding the sovereignty of Taiwan; Taiwan-based companies and individuals are significant investors in China. Potential military conflict between China and Taiwan may adversely affect securities of Chinese and Taiwan issuers. In addition, China has strained international relations with Japan, India, Russia and other neighbors due to territorial disputes, historical animosities and other defense concerns. China could be affected by military events on the Korean peninsula or internal instability within North Korea. These situations may cause uncertainty in the Chinese market and may adversely affect the performance of the Chinese economy.
The Chinese government has implemented significant economic reforms in order to liberalize trade policy, promote foreign investment in the economy, reduce government control of the economy and develop market mechanisms. But there can be no assurance that these reforms will continue or that they will be effective. Despite reforms and privatizations of companies in certain sectors, the Chinese government still exercises substantial influence over many aspects of the private sector and may own or control many companies. The Chinese government continues to maintain a major role in economic policy making and investing in China involves risks of losses due to expropriation, nationalization, confiscation of assets and property, and
| | | | |
Principal Risks of the Funds | | | | |
the imposition of restrictions on foreign investments and on repatriation of capital invested.
The Chinese government may intervene in the Chinese financial markets, such as by the imposition of trading restrictions, a ban on “naked” short selling or the suspension of short selling for certain stocks. This may affect market price and liquidity of these stocks, and may have an unpredictable impact on the investment activities of the Fund. Furthermore, such market interventions may have a negative impact on market sentiment which may in turn affect the performance of the securities markets and as a result the performance of the Fund.
In addition, there is less regulation and monitoring of the securities markets and the activities of investors, brokers and other participants in China than in the United States. Accordingly, issuers of securities in China are not subject to the same degree of regulation as those in the United States with respect to such matters as insider trading rules, tender offer regulation, stockholder proxy requirements and the requirements mandating timely and accurate disclosure of information. Stock markets in China are in the process of change and further development. This may lead to trading volatility, and difficulties in the settlement and recording of transactions and interpretation and application of the relevant regulations. Custodians may not be able to offer the level of service and safe-keeping in relation to the settlement and administration of securities in China that is customary in more developed markets. In particular, there is a risk that the Fund may not be recognized as the owner of securities that are held on behalf of the Fund by a
sub-custodian.
The Renminbi (“RMB”) is currently not a freely convertible currency and is subject to foreign exchange control policies and repatriation restrictions imposed by the Chinese government. The imposition of currency controls may negatively impact performance and liquidity of the Fund as capital may become trapped in the PRC. The Fund could be adversely affected by delays in, or a refusal to grant, any required governmental approval for repatriation of capital, as well as by the application to the Fund of any restrictions on investments. Investing in entities either in, or which have a substantial portion of their operations in, the PRC may require the Fund to adopt special procedures, seek local government approvals or take other actions, each of which may involve additional costs and delays to the Fund.
While the Chinese economy has grown rapidly in recent years, there is no assurance that this growth rate will be maintained. China may experience substantial rates of inflation or economic recessions, causing a negative effect on the economy and securities market. China’s economy is heavily dependent on export growth. Reduction in spending on Chinese products and services, institution of tariffs or
other trade barriers or a downturn in any of the economies of China’s key trading partners may have an adverse impact on the securities of Chinese issuers.
The tax laws and regulations in the PRC are subject to change, including the issuance of authoritative guidance or enforcement, possibly with retroactive effect. The interpretation, applicability and enforcement of such laws by the PRC tax authorities are not as consistent and transparent as those of more developed nations, and may vary over time and from region to region. The application and enforcement of the PRC tax rules could have a significant adverse effect on the Fund and its investors, particularly in relation to capital gains withholding tax imposed upon
non-residents.
In addition, the accounting, auditing and financial reporting standards and practices applicable to Chinese companies may be less rigorous, and may result in significant differences between financial statements prepared in accordance with PRC accounting standards and practices and those prepared in accordance with international accounting standards.
From time to time and as recently as January 2020, China has experienced outbreaks of infectious illnesses, and the country may be subject to other public health threats, infectious illnesses, diseases or similar issues in the future. Any spread of an infectious illness, public health threat or similar issue could reduce consumer demand or economic output, result in market closures, travel restrictions or quarantines, and generally have a significant impact on the Chinese economy, which in turn could adversely affect the Fund’s investments and could result in increased premiums or discounts to the Fund’s NAV.
Collateralized Bond Obligations, Collateralized Loan Obligations and Collateralized Debt Obligations Risk
CBOs, CLOs and CDOs may charge management fees and administrative expenses. For CBOs, CLOs, and CDOs, the cash flows from the trust are split into two or more portions, called tranches, varying in risk and yield. The riskiest portion is the equity tranche which generally bears losses in connection with the first defaults, if any, on the bonds or loans in the trust. A senior tranche from a CLO, CBO and CDO trust typically has higher credit ratings and lower yields than the underlying securities. CLO, CBO and CDO tranches, even senior ones, can experience substantial losses due to actual defaults, increased sensitivity to defaults due to collateral default and disappearance of protecting tranches, market anticipation of defaults and aversion to CLO, CBO or other CDO securities. The risks of an investment in a CLO, CBO or other CDO depend largely on the type of the collateral securities and the class/tranche of the instrument in which the Fund invests. Normally, CLOs, CBOs and other CDOs are privately offered and sold, and thus are not registered under the securities laws. Investments in CLOs, CBOs and CDOs may be or
become illiquid. In addition to the normal risks associated with debt instruments (
interest rate risk and credit risk), CLOs, CBOs and CDOs carry additional risks including, but not limited to: (i) the possibility that distributions from the collateral will not be adequate to make interest or other payments; (ii) the risk that the quality of the collateral may decline in value or default; (iii) the risk that the Fund may invest in CBOs, CLOs or other CDOs that are subordinate to other classes; and (iv) the risk that the complex structure of the security may not be fully understood at the time of investment and may produce disputes with the issuer or others and may produce unexpected investment results.
Confidential Information Access Risk
In managing the Fund (and other PIMCO clients), PIMCO may from time to time have the opportunity to receive material,
non-public
information (“Confidential Information”) about the issuers of certain investments, including, without limitation, senior floating rate loans, other loans and related investments being considered for acquisition by the Fund or held in the Fund’s portfolio. For example, an issuer of privately placed loans considered by the Fund may offer to provide PIMCO with financial information and related documentation regarding the issuer that is not publicly available. Pursuant to applicable policies and procedures, PIMCO may (but is not required to) seek to avoid receipt of Confidential Information from the issuer so as to avoid possible restrictions on its ability to purchase and sell investments on behalf of the Fund and other clients to which such Confidential Information relates. In such circumstances, the Fund (and other PIMCO clients) may be disadvantaged in comparison to other investors, including with respect to the price the Fund pays or receives when it buys or sells an investment. Further, PIMCO’s and the Fund’s abilities to assess the desirability of proposed consents, waivers or amendments with respect to certain investments may be compromised if they are not privy to available Confidential Information. PIMCO may also determine to receive such Confidential Information in certain circumstances under its applicable policies and procedures. If PIMCO intentionally or unintentionally comes into possession of Confidential Information, it may be unable, potentially for a substantial period of time, to purchase or sell investments to which such Confidential Information relates.
Contingent Convertible Securities Risk
The risks of investing in CoCos include, without limitation, the risk that interest payments will be cancelled by the issuer or a regulatory authority, the risk of ranking junior to other creditors in the event of a liquidation or other bankruptcy-related event as a result of holding subordinated debt, the risk of the Fund’s investment becoming further subordinated as a result of conversion from debt to equity, the risk that the principal amount due can be written down to a lesser amount, and the general risks applicable to fixed income investments,
including interest rate risk, credit risk, market risk and liquidity risk, any of which could result in losses to the Fund. CoCos may experience a loss absorption mechanism trigger event, which would likely be the result of, or related to, the deterioration of the issuer’s financial condition (e.g., a decrease in the issuer’s capital ratio) and status as a going concern. In such a case, with respect to contingent convertible securities that provide for conversion into common stock upon the occurrence of the trigger event, the market price of the issuer’s common stock received by the Fund will have likely declined, perhaps substantially, and may continue to decline, which may adversely affect the Fund’s NAV.
Convertible Securities Risk
The market values of convertible securities may decline as interest rates increase and, conversely, may increase as interest rates decline. A convertible security’s market value, however, tends to reflect the market price of the common stock of the issuing company when that stock price approaches or is greater than the convertible security’s “conversion price.” The conversion price is defined as the predetermined price at which the convertible security could be exchanged for the associated stock. As the market price of the underlying common stock declines, the price of the convertible security tends to be influenced more by the yield of the convertible security. Thus, it may not decline in price to the same extent as the underlying common stock. In the event of a liquidation of the issuing company, holders of convertible securities may be paid before the company’s common stockholders but after holders of any senior debt obligations of the company. Consequently, the issuer’s convertible securities generally entail less risk than its common stock but more risk than its other debt obligations. Convertible securities are often rated below investment grade or not rated.
The Fund will be subject to credit risk with respect to the counterparties to the derivative contracts and other instruments entered into by the Fund or held by special purpose or structured vehicles in which the Fund invests. In the event that the Fund enters into a derivative transaction with a counterparty that subsequently becomes insolvent or becomes the subject of a bankruptcy case, the derivative transaction may be terminated in accordance with its terms and the Fund’s ability to realize its rights under the derivative instrument and its ability to distribute the proceeds could be adversely affected. If a counterparty becomes bankrupt or otherwise fails to perform its obligations under a derivative contract due to financial difficulties, the Fund may experience significant delays in obtaining any recovery (including recovery of any collateral it has provided to the counterparty) in a dissolution, assignment for the benefit of creditors, liquidation,
winding-up,
bankruptcy or other analogous proceeding. In addition, in the event of the insolvency of a counterparty to a
| | | | |
Principal Risks of the Funds | | | | |
derivative transaction, the derivative transaction would typically be terminated at its fair market value. If the Fund is owed this fair market value in the termination of the derivative transaction and its claim is unsecured, the Fund will be treated as a general creditor of such counterparty and will not have any claim with respect to any underlying security or asset. The Fund may obtain only a limited recovery or may obtain no recovery in such circumstances. While the Fund may seek to manage its counterparty risk by transacting with a number of counterparties, concerns about the solvency of, or a default by, one large market participant could lead to significant impairment of liquidity and other adverse consequences for other counterparties.
“Covenant-Lite” Obligations Risk
Covenant-lite obligations contain fewer maintenance covenants than other obligations, or no maintenance covenants, and may not include terms that allow the lender to monitor the performance of the borrower and declare a default if certain criteria are breached. Covenant-lite loans may carry more risk than traditional loans as they allow individuals and corporations to engage in activities that would otherwise be difficult or impossible under a covenant-heavy loan agreement. In the event of default, covenant-lite loans may exhibit diminished recovery values as the lender may not have the opportunity to negotiate with the borrower prior to default.
Credit Default Swaps Risk
Credit default swap agreements may involve greater risks than if the Fund had invested in the reference obligation directly since, in addition to general market risks, credit default swaps are subject to illiquidity risk, counterparty risk and credit risk. A buyer generally also will lose its investment and recover nothing should no credit event occur and the swap is held to its termination date. If a credit event were to occur, the value of any deliverable obligation received by the seller (if any), coupled with the upfront or periodic payments previously received, may be less than the full notional value it pays to the buyer, resulting in a loss of value to the seller. When the Fund acts as a seller of a credit default swap, it is exposed to many of the same risks of leverage described herein since if an event of default occurs, the seller must pay the buyer the full notional value of the reference obligation.
Although the Fund may seek to realize gains by selling credit default swaps that increase in value, to realize gains on selling credit default swaps, an active secondary market for such instruments must exist or the Fund must otherwise be able to close out these transactions at advantageous times. In addition to the risk of losses described above, if no such secondary market exists or the Fund is otherwise unable to close out these transactions at advantageous times, selling credit default swaps may not be profitable for the Fund.
The market for credit default swaps has become more volatile as the creditworthiness of certain counterparties has been questioned and/or
downgraded. The Fund will be subject to credit risk with respect to the counterparties to the credit default swap contract (whether a clearing corporation or another third party). If a counterparty’s credit becomes significantly impaired, multiple requests for collateral posting in a short period of time could increase the risk that the Fund may not receive adequate collateral. The Fund may exit its obligations under a credit default swap only by terminating the contract and paying applicable breakage fees, or by entering into an offsetting credit default swap position, which may cause the Fund to incur more losses.
Credit Risk
The Fund could lose money if the issuer or guarantor of a fixed income security (including a security purchased with securities lending collateral), or the counterparty to a derivatives contract, repurchase agreement or a loan of portfolio securities is unable or unwilling, or is perceived (whether by market participants, rating agencies, pricing services or otherwise) as unable or unwilling, to make timely principal and/or interest payments or to otherwise honor its obligations. The risk that such issuer, guarantor or counterparty is less willing or able to do so is heightened in market environments where interest rates are rising. The downgrade of the credit of a security held by the Fund may decrease its value. Measures such as average credit quality may not accurately reflect the true credit risk of the Fund. This is especially the case if the Fund consists of securities with widely varying credit ratings. Securities are subject to varying degrees of credit risk, which are often reflected in credit ratings. This risk is greater to the extent the Fund uses leverage or derivatives in connection with the management of the Fund.
CSDR Related Risk
The European Union has adopted a settlement discipline regime under Regulation (EU) No 909/2014 and the Settlement Discipline RTS as they may be modified from time to time (“CSDR”), which will have phased compliance dates. It aims to reduce the number of settlement fails that occur in EEA central securities depositories (“CSDs”) and address settlement fails where they occur. The key elements of the regime are: (i) mandatory
buy-ins
— if a settlement fail continues for a specified period of time after the intended settlement date, a
buy-in
process must be initiated to effect the settlement; (ii) cash penalties — EEA CSDs are required to impose cash penalties on participants that cause settlement fails and distribute these to receiving participants; and (iii) allocations and confirmations — EEA investment firms are required to take measures to prevent settlement fails, including putting in place arrangements with their professional clients to communicate securities allocations and transaction confirmations. These requirements apply to transactions in transferable securities (e.g., shares and bonds), money market instruments, units in funds and emission allowances that are to be settled via an EEA CSD and, in the case of cash penalties and
| | | | | | |
| 190 | | PIMCO CLOSED-END FUNDS | | | | |
buy-in
requirements only, are admitted to trading or traded on an EEA trading venue or cleared by an EEA central counterparty. If the Fund enters into
in-scope
transactions, the CSDR settlement discipline regime may result in increased operational and compliance costs being borne directly or indirectly by the Fund. CSDR may also affect liquidity and increase trading costs associated with relevant securities. If
in-scope
transactions are subject to additional expenses and penalties as a consequence of the CSDR settlement discipline regime, such expenses and penalties may be charged to the relevant Fund depending upon their characterization under the Fund’s Investment Management Agreement.
Currency Risk
Currency risk may be particularly high because the Fund may, at times or in general, have substantial exposure to emerging market currencies, and engage in foreign currency transactions that are economically tied to emerging market countries. These currency transactions may present market, credit, currency, liquidity, legal, political and other risks different from, or greater than, the risks of investing in developed foreign
(non-U.S.)
currencies or engaging in foreign currency transactions that are economically tied to developed foreign countries.
Investments denominated in foreign
(non-U.S.)
currencies or that trade in and receive revenues in, foreign
(non-U.S.)
currencies, derivatives or other instruments that provide exposure to foreign
(non-U.S.)
currencies, are subject to the risk that those currencies will decline in value relative to the U.S. dollar, or, in the case of hedging positions, that the U.S. dollar will decline in value relative to the currency being hedged.
Currency rates in foreign
(non-U.S.)
countries may fluctuate significantly over short periods of time for a number of reasons, including changes in interest rates, rates of inflation, balance of payments and governmental surpluses or deficits, intervention (or the failure to intervene) by U.S. or foreign
(non-U.S.)
governments, central banks or supranational entities such as the International Monetary Fund, or by the imposition of currency controls or other political developments in the United States or abroad. These fluctuations may have a significant adverse impact on the value of the Fund’s portfolio and/or the level of Fund distributions made to Common Shareholders. There is no assurance that a hedging strategy, if used, will be successful. Moreover, currency hedging techniques may be unavailable with respect to emerging market currencies. As a result, the Fund’s investments in foreign currency-denominated, and especially emerging market-currency denominated, securities may reduce the returns of the Fund.
The local emerging market currencies in which the Fund may be invested from time to time may experience substantially greater
volatility against the U.S. dollar than the major convertible currencies of developed countries. Some of the local currencies in which the Fund may invest are neither freely convertible into one of the major currencies nor internationally traded. The local currencies may be convertible into other currencies only inside the relevant emerging market where the limited availability of such other currencies may tend to inflate their values relative to the local currency in question. Such internal exchange markets can therefore be said to be neither liquid nor competitive. In addition, many of the currencies of emerging market countries in which the Fund may invest have experienced steady devaluation relative to freely convertible currencies.
Continuing uncertainty as to the status of the euro and the European Monetary Union (“EMU”) has created significant volatility in currency and financial markets generally. Any partial or complete dissolution of the EMU could have significant adverse effects on currency and financial markets, and on the values of the Fund’s portfolio investments. If one or more EMU countries were to stop using the euro as its primary currency, the Fund’s investments in such countries may be redenominated into a different or newly adopted currency. As a result, the value of those investments could decline significantly and unpredictably. In addition, securities or other investments that are redenominated may be subject to foreign currency risk, liquidity risk and valuation risk to a greater extent than similar investments currently denominated in euros. To the extent a currency used for redenomination purposes is not specified in respect of certain
EMU-related
investments, or should the euro cease to be used entirely, the currency in which such investments are denominated may be unclear, making such investments particularly difficult to value or dispose of. The Fund may incur additional expenses to the extent it is required to seek judicial or other clarification of the denomination or value of such securities.
There can be no assurance that if the Fund earns income or capital gains in a
non-U.S.
country or PIMCO otherwise seeks to withdraw the Fund’s investments from a given country, capital controls imposed by such country will not prevent, or cause significant expense in, doing so.
Cybersecurity Risk
As the use of technology has become more prevalent in the course of business, the Fund is potentially more susceptible to operational and information security risks resulting from breaches in cyber security. A breach in cyber security refers to both intentional and unintentional cyber events from outside threat actors or internal resources that may, among other things, cause the Fund to lose proprietary information, suffer data corruption and/or destruction, lose operational capacity, result in the unauthorized release or other misuse of confidential information, or otherwise disrupt normal business operations. Cyber security breaches may involve unauthorized access to the Fund’s
| | | | | | | | | | | | |
| | | | ANNUAL REPORT | | | | | | | JUNE 30, 2022 | | | 191 |
| | | | |
Principal Risks of the Funds | | | | |
digital information systems (e.g., through “hacking” or malicious software coding), and may come from multiple sources, including outside attacks such as
attacks (i.e., efforts to make network services unavailable to intended users) or cyber extortion, including exfiltration of data held for ransom and/or “ransomware” attacks that renders systems inoperable until ransom is paid, or insider actions. In addition, cyber security breaches involving the Fund’s third party service providers (including but not limited to advisers,
sub-advisers,
administrators, transfer agents, custodians, vendors, suppliers, distributors and other third parties), trading counterparties or issuers in which the Fund invests can also subject the Fund to many of the same risks associated with direct cyber security breaches or extortion of company data. Moreover, cyber security breaches involving trading counterparties or issuers in which the Fund invests could adversely impact such counterparties or issuers and cause the Fund’s investment to lose value.
Cyber security failures or breaches may result in financial losses to the Fund and its shareholders. These failures or breaches may also result in disruptions to business operations, potentially resulting in financial losses; interference with the Fund’s ability to calculate its NAV, process shareholder transactions or otherwise transact business with shareholders; impediments to trading; violations of applicable privacy and other laws; regulatory fines; penalties; third party claims in litigation; reputational damage; reimbursement or other compensation costs; additional compliance and cyber security risk management costs and other adverse consequences. In addition, substantial costs may be incurred in order to prevent any cyber incidents in the future.
Like with operational risk in general, the Fund has established business continuity plans and risk management systems designed to reduce the risks associated with cyber security. However, there are inherent limitations in these plans and systems, including that certain risks may not have been identified, in large part because different or unknown threats may emerge in the future. As such, there is no guarantee that such efforts will succeed, especially because the Fund does not directly control the cyber security systems of issuers in which the Fund may invest, trading counterparties or third party service providers to the Fund. Such entities have experienced cyber attacks and other attempts to gain unauthorized access to systems from time to time, and there is no guarantee that efforts to prevent or mitigate the effects of such attacks or other attempts to gain unauthorized access will be successful. There is also a risk that cyber security breaches may not be detected. The Fund and its shareholders may suffer losses as a result of a cyber security breach related to the Fund, its service providers, trading counterparties or the issuers in which the Fund invests.
Debt Securities Risk
Debt securities are generally subject to the risks described below and further herein:
The value of debt securities may decline for a number of reasons that directly relate to the issuer, such as management performance, financial leverage, reduced demand for the issuer’s goods and services, historical and prospective earnings of the issuer and the value of the assets of the issuer.
The market value of debt securities changes in response to interest rate changes and other factors. Interest rate risk is the risk that prices of debt securities will increase as interest rates fall and decrease as interest rates rise, which would be reflected in the Fund’s NAV. The Fund may lose money if short-term or long-term interest rates rise sharply in a manner not anticipated by the Fund’s management. Moreover, because rates on certain floating rate debt securities typically reset only periodically, changes in prevailing interest rates (and particularly sudden and significant changes) can be expected to cause some fluctuations in the NAV of the Fund to the extent that it invests in floating rate debt securities.
During periods of declining interest rates, borrowers may prepay principal. This may force the Fund to reinvest in lower yielding securities, resulting in a possible decline in the Fund’s income and distributions.
Credit risk is the risk that one or more debt securities in the Fund’s portfolio will decline in price or fail to pay interest or principal when due because the issuer of the security experiences a decline in its financial status. Credit risk is increased when a portfolio security is downgraded or the perceived creditworthiness of the issuer deteriorates.
Reinvestment risk is the risk that income from the Fund’s portfolio will decline if the Fund invests the proceeds from matured, traded or called fixed income securities at market interest rates that are below the portfolio’s current earnings rate.
Duration and maturity risk.
The Fund may seek to adjust the duration or maturity of its investments in debt securities based on its assessment of current and projected market conditions. The Fund may incur costs in seeking to adjust the average duration or maturity of its portfolio of debt securities. There can be no assurances that the Fund’s assessment of current and projected market conditions will be correct or that any strategy to adjust duration or maturity will be successful.
Derivatives Risk
The use of derivative instruments involves risks different from, or possibly greater than, the risks associated with investing directly in securities and other traditional investments. Derivatives are subject to
| | | | | | |
| 192 | | PIMCO CLOSED-END FUNDS | | | | |
a number of risks, including leverage risk, liquidity risk (which may be heightened for highly- customized derivatives), interest rate risk, market risk, credit risk, counterparty risk, tax risk, management risk, operational risk and legal risk as well as risks arising from changes in applicable requirements. They also involve the risk of mispricing, the risk of unfavorable or ambiguous documentation and the risk that changes in the value of a derivative instrument may not correlate perfectly with the underlying asset, rate or index. If the Fund invests in a derivative instrument, the Fund could lose more than the initial amount invested and derivatives may increase the volatility of the Fund, especially in unusual or extreme market conditions. Also, suitable derivative transactions may not be available in all circumstances and there can be no assurance that the Fund will engage in these transactions to reduce exposure to other risks when that would be beneficial or that, if used, such strategies will be successful. The Fund’s use of derivatives may increase or accelerate the amount of taxes payable by Common Shareholders.
(“OTC”) derivatives are also subject to the risk that a counterparty to the transaction will not fulfill its contractual obligations to the other party, as many of the protections afforded to centrally-cleared derivative transactions might not be available for OTC derivative transactions. For derivatives traded on an exchange or through a central counterparty, credit risk resides with the Fund’s clearing broker, or the clearinghouse itself, rather than with a counterparty in an OTC derivative transaction. The primary credit risk on derivatives that are exchange-traded or traded through a central clearing counterparty resides with the Fund’s clearing broker or the clearinghouse itself.
Participation in the markets for derivative instruments involves investment risks and transaction costs to which the Fund may not be subject absent the use of these strategies. The skills needed to successfully execute derivative strategies may be different from those needed for other types of transactions. If the Fund incorrectly forecasts the value and/or creditworthiness of securities, currencies, interest rates, counterparties or other economic factors involved in a derivative transaction, the Fund might have been in a better position if the Fund had not entered into such derivative transaction. In evaluating the risks and contractual obligations associated with particular derivative instruments, it is important to consider that certain derivative transactions may be modified or terminated only by mutual consent of the Fund and its counterparty. Therefore, it may not be possible for the Fund to modify, terminate, or offset the Fund’s obligations or the Fund’s exposure to the risks associated with a derivative transaction prior to its scheduled termination or maturity date, which may create a possibility of increased volatility and/or decreased liquidity to the Fund. Hedges are sometimes subject to imperfect matching between the derivative and the underlying instrument, and there can be no
assurance that the Fund’s hedging transactions will be effective. In such case, the Fund may lose money.
Because the markets for certain derivative instruments (including markets located in foreign countries) are relatively new and still developing, appropriate derivative transactions may not be available in all circumstances for risk management or other purposes. Upon the expiration of a particular contract, the Fund may wish to retain the Fund’s position in the derivative instrument by entering into a similar contract, but may be unable to do so if the counterparty to the original contract is unwilling to enter into the new contract and no other appropriate counterparty can be found. When such markets are unavailable, the Fund will be subject to increased liquidity and investment risk.
The Fund may enter into opposite sides of interest rate swap and other derivatives for the principal purpose of generating distributable gains on the one side (characterized as ordinary income for tax purposes) that are not part of the Fund’s duration or yield curve management strategies (“paired swap transactions”), and with a substantial possibility that the Fund will experience a corresponding capital loss and decline in NAV with respect to the opposite side transaction (to the extent it does not have corresponding offsetting capital gains). Consequently, Common Shareholders may receive distributions and owe tax on amounts that are effectively a taxable return of the shareholder’s investment in the Fund, at a time when their investment in the Fund has declined in value, which tax may be at ordinary income rates. The tax treatment of certain derivatives in which the Fund invests may be unclear and thus subject to recharacterization. Any recharacterization of payments made or received by the Fund pursuant to derivatives potentially could affect the amount, timing or character of Fund distributions. In addition, the tax treatment of such investment strategies may be changed by regulation or otherwise.
When a derivative is used as a hedge against a position that the Fund holds, any loss generated by the derivative generally should be substantially offset by gains on the hedged investment, and vice versa. Although hedging can reduce or eliminate losses, it can also reduce or eliminate gains. Hedges are sometimes subject to imperfect matching between the derivative and the underlying instrument, and there can be no assurance that the Fund’s hedging transactions will be effective. In such case, the Fund may lose money.
The regulation of the derivatives markets has increased over the past several years, and additional future regulation of the derivatives markets may make derivatives more costly, may limit the availability or reduce the liquidity of derivatives, or may otherwise adversely affect the value or performance of derivatives. Any such adverse future developments could impair the effectiveness or raise the costs of the
| | | | | | | | | | | | |
| | | | ANNUAL REPORT | | | | | | | JUNE 30, 2022 | | | 193 |
| | | | |
Principal Risks of the Funds | | | | |
Fund’s derivative transactions, impede the employment of the Fund’s derivatives strategies, or adversely affect the Fund’s performance and cause the Fund to lose value. For instance, on October 28, 2020, the SEC adopted Rule
18f-4
under the 1940 Act providing for the regulation of a registered investment company’s use of derivatives and certain related instruments. Among other things, Rule
18f-4
limits a fund’s derivatives exposure through a
test and requires the adoption and implementation of a derivatives risk management program for certain derivatives users. Subject to certain conditions, limited derivatives users (as defined in Rule
18f-4),
however, would not be subject to the full requirements of Rule
18f-4.
In connection with the adoption of Rule
18f-4,
the SEC also eliminated the asset segregation framework arising from prior SEC guidance for covering derivatives and certain financial instruments that was applicable to the Fund as of the date of this report. Compliance with Rule
18f-4
is not required until August 19, 2022.
As the Fund comes into compliance, the Fund’s approach to asset segregation and coverage requirements will be impacted. In addition, Rule
18f-4
could restrict the Fund’s ability to engage in certain derivatives transactions and/or increase the costs of such derivatives transactions, which could adversely affect the value or performance of the Fund and the Common Shares and/or the Fund’s distribution rate.
Distressed and Defaulted Securities Risk
Investments in the securities of financially distressed issuers involve substantial risks, including the risk of default. Such investments may be in default at the time of investment. In addition, these securities may fluctuate more in price, and are typically less liquid. The Fund also will be subject to significant uncertainty as to when, and in what manner, and for what value obligations evidenced by securities of financially distressed issuers will eventually be satisfied. Defaulted obligations might be repaid only after lengthy workout or bankruptcy proceedings, during which the issuer might not make any interest or other payments. In any such proceeding relating to a defaulted obligation, the Fund may lose its entire investment or may be required to accept cash or securities with a value substantially less than its original investment. Moreover, any securities received by the Fund upon completion of a workout or bankruptcy proceeding may be less liquid, speculative or restricted as to resale. Similarly, if the Fund participates in negotiations with respect to any exchange offer or plan of reorganization with respect to the securities of a distressed issuer, the Fund may be restricted from disposing of such securities. To the extent that the Fund becomes involved in such proceedings, the Fund may have a more active participation in the affairs of the issuer than that assumed generally by an investor. The Fund may incur additional expenses to the extent it is required to seek recovery upon a default in the payment of principal or interest on its portfolio holdings.
Also among the risks inherent in investments in a troubled issuer is that it frequently may be difficult to obtain information as to the true financial condition of such issuer. PIMCO’s judgments about the credit quality of a financially distressed issuer and the relative value of its securities may prove to be wrong.
Distribution Rate Risk
Although the Fund may seek to maintain level distributions, the Fund’s distribution rates may be affected by numerous factors, including but not limited to changes in realized and projected market returns, fluctuations in market interest rates, Fund performance, and other factors. There can be no assurance that a change in market conditions or other factors will not result in a change in the Fund’s distribution rate or that the rate will be sustainable in the future.
For instance, during periods of low or declining interest rates, the Fund’s distributable income and dividend levels may decline for many reasons. For example, the Fund may have to deploy uninvested assets (whether from purchases of Fund shares, proceeds from matured, traded or called debt obligations or other sources) in new, lower yielding instruments. Additionally, payments from certain instruments that may be held by the Fund (such as variable and floating rate securities) may be negatively impacted by declining interest rates, which may also lead to a decline in the Fund’s distributable income and dividend levels.
Emerging Markets Risk
Foreign investment risk may be particularly high to the extent that the Fund invests in securities of issuers based in or doing business in emerging market countries or invests in securities denominated in the currencies of emerging market countries. Investing in securities of issuers based in or doing business in emerging markets entails all of the risks of investing in foreign securities noted above, but to a heightened degree.
Investments in emerging market countries pose a greater degree of systemic risk (i.e., the risk of a cascading collapse of multiple institutions within a country, and even multiple national economies). The inter-relatedness of economic and financial institutions within and among emerging market economies has deepened over the years, with the effect that institutional failures and/or economic difficulties that are of initially limited scope may spread throughout a country, a region or all or most emerging market countries. This may undermine any attempt by the Fund to reduce risk through geographic diversification of its portfolio.
There is a heightened possibility of imposition of withholding taxes on interest or dividend income generated from emerging market securities. Governments of emerging market countries may engage in confiscatory taxation or expropriation of income and/or assets to raise
| | | | | | |
| 194 | | PIMCO CLOSED-END FUNDS | | | | |
revenues or to pursue a domestic political agenda. In the past, emerging market countries have nationalized assets, companies and even entire sectors, including the assets of foreign investors, with inadequate or no compensation to the prior owners. There can be no assurance that the Fund will not suffer a loss of any or all of its investments, or interest or dividends thereon, due to adverse fiscal or other policy changes in emerging market countries.
There is also a greater risk that an emerging market government may take action that impedes or prevents the Fund from taking income and/or capital gains earned in the local currency and converting into U.S. dollars (i.e., “repatriating” local currency investments or profits). Certain emerging market countries have sought to maintain foreign exchange reserves and/or address the economic volatility and dislocations caused by the large international capital flows by controlling or restricting the conversion of the local currency into other currencies. This risk tends to become more acute when economic conditions otherwise worsen. There can be no assurance that if the Fund earns income or capital gains in an emerging market currency or PIMCO otherwise seeks to withdraw the Fund’s investments from a given emerging market country, capital controls imposed by such country will not prevent, or cause significant expense in, doing so.
Bankruptcy law and creditor reorganization processes may differ substantially from those in the United States, resulting in greater uncertainty as to the rights of creditors, the enforceability of such rights, reorganization timing and the classification, seniority and treatment of claims. In certain emerging market countries, although bankruptcy laws have been enacted, the process for reorganization remains highly uncertain. In addition, it may be impossible to seek legal redress against an issuer that is a sovereign state.
Emerging market countries typically have less established legal, accounting and financial reporting systems than those in more developed markets, which may reduce the scope or quality of financial information available to investors. Governments in emerging market countries are often less stable and more likely to take extra-legal action with respect to companies, industries, assets, or foreign ownership than those in more developed markets. Moreover, it can be more difficult for investors to bring litigation or enforce judgments against issuers in emerging markets or for U.S. regulators to bring enforcement actions against such issuers. The Fund may also be subject to Emerging Markets Risk if it invests in derivatives or other securities or instruments whose value or return are related to the value or returns of emerging markets securities.
Other heightened risks associated with emerging markets investments include without limitation (i) risks due to less social, political and economic stability; (ii) the smaller size of the market for such securities
and a lower volume of trading, resulting in a lack of liquidity and in price volatility; (iii) certain national policies which may restrict the Fund’s investment opportunities, including restrictions on investing in issuers or industries deemed sensitive to relevant national interests and requirements that government approval be obtained prior to investment by foreign persons; (iv) certain national policies that may restrict the Fund’s repatriation of investment income, capital or the proceeds of sales of securities, including temporary restrictions on foreign capital remittances; (v) the lack of uniform accounting and auditing standards and/or standards that may be significantly different from the standards required in the United States; (vi) less publicly available financial and other information regarding issuers; (vii) potential difficulties in enforcing contractual obligations; and (viii) higher rates of inflation, higher interest rates and other economic concerns. The Fund may invest to a substantial extent in emerging market securities that are denominated in local currencies, subjecting the Fund to a greater degree of foreign currency risk. Also, investing in emerging market countries may entail purchases of securities of issuers that are insolvent, bankrupt or otherwise of questionable ability to satisfy their payment obligations as they become due, subjecting the Fund to a greater amount of credit risk and/or high yield risk. The economy of some emerging markets may be particularly exposed to or affected by a certain industry or sector, and therefore issuers and/or securities of such emerging markets may be more affected by the performance of such industries or sectors.
Equity Securities and Related Market Risk
The market price of common stocks and other equity securities may go up or down, sometimes rapidly or unpredictably. Equity securities may decline in value due to factors affecting equity securities markets generally, particular industries represented in those markets, or the issuer itself. The values of equity securities may decline due to real or perceived adverse economic conditions, changes in the general outlook for corporate earnings, changes in interest or currency rates, adverse changes to credit markets or adverse investor sentiment generally. They may also decline due to labor shortages or increased production costs and competitive conditions within an industry. Equity securities generally have greater price volatility than bonds and other debt securities.
Different types of equity securities provide different voting and dividend rights and priority in the event of the bankruptcy and/or insolvency of the issuer. In addition to common stock, equity securities may include preferred securities, convertible securities and warrants. Equity securities other than common stock are subject to many of the same risks as common stock, although possibly to different degrees. The risks of equity securities are generally magnified in the case of equity investments in distressed companies.
| | | | | | | | | | | | |
| | | | ANNUAL REPORT | | | | | | | JUNE 30, 2022 | | | 195 |
| | | | |
Principal Risks of the Funds | | | | |
Focused Investment Risk
To the extent that the Fund focuses its investments in a particular sector, it may be susceptible to loss due to adverse developments affecting that sector, including (but not limited to): governmental regulation; inflation; rising interest rates; cost increases in raw materials, fuel and other operating expenses; technological innovations that may render existing products and equipment obsolete; competition from new entrants; high research and development costs; increased costs associated with compliance with environmental or other governmental regulations; and other economic, business or political developments specific to that sector. Furthermore, the Fund may invest a substantial portion of its assets in companies in related sectors that may share common characteristics, are often subject to similar business risks and regulatory burdens, and whose securities may react similarly to the types of developments described above, which will subject the Fund to greater risk. The Fund also will be subject to focused investment risk to the extent that it invests a substantial portion of its assets in a particular issuer, market, asset class, country or geographic region.
Foreign
(Non-U.S.)
Investment Risk
Foreign
(non-U.S.)
securities may experience more rapid and extreme changes in value than securities of U.S. companies. The securities markets of many foreign countries are relatively small, with a limited number of companies representing a small number of industries. Additionally, issuers of foreign
(non-U.S.)
securities are usually not subject to the same degree of regulation as U.S. issuers. Reporting, accounting, auditing and custody standards of foreign countries differ, in some cases significantly, from U.S. standards. Global economies and financial markets are becoming increasingly interconnected, and conditions and events in one country, region or financial market may adversely impact issuers in a different country, region or financial market. Also, nationalization, expropriation or confiscatory taxation, currency blockage, market disruptions, political changes, security suspensions or diplomatic developments or the imposition of sanctions or other similar measures could adversely affect the Fund’s investments in a foreign country. In the event of nationalization, expropriation or other confiscation, the Fund could lose its entire investment in foreign
(non-U.S.)
securities. The type and severity of sanctions and other similar measures, including counter sanctions and other retaliatory actions, that may be imposed could vary broadly in scope, and their impact is difficult to ascertain. These types of measures may include, but are not limited to, banning a sanctioned country or certain persons or entities associated with such country from global payment systems that facilitate cross-border payments, restricting the settlement of securities transactions by certain investors, and freezing the assets of particular countries, entities or persons. The imposition of sanctions and other similar measures could, among other things, result in a decline in the value and/or liquidity of
securities issued by the sanctioned country or companies located in or economically tied to the sanctioned country, downgrades in the credit ratings of the sanctioned country’s securities or those of companies located in or economically tied to the sanctioned country, currency devaluation or volatility, and increased market volatility and disruption in the sanctioned country and throughout the world. Sanctions and other similar measures could directly or indirectly limit or prevent a Fund from buying and selling securities (in the sanctioned country and other markets), significantly delay or prevent the settlement of securities transactions, and adversely impact a Fund’s liquidity and performance. Adverse conditions in a certain region can adversely affect securities of other countries whose economies appear to be unrelated. To the extent that the Fund invests a significant portion of its assets in a specific geographic region or in securities denominated in a particular foreign
(non-U.S.)
currency, the Fund will generally have more exposure to regional economic risks, including weather emergencies and natural disasters, associated with foreign
(non-U.S.)
investments. Foreign
(non-U.S.)
securities may also be less liquid (particularly during market closures due to local holidays or other reasons) and more difficult to value than securities of U.S. issuers.
The Fund may face potential risks associated with the United Kingdom’s departure from the European Union (“EU”). The departure may result in substantial volatility in financial and foreign exchange markets and a sustained weakness in the British pound, the euro and other currencies, which may impact Fund returns. It may also destabilize some or all of the other EU member countries and/or the Eurozone. These developments could result in losses to the Fund, as there may be negative effects on the value of the Fund’s investments and/or on the Fund’s ability to enter into certain transactions or value certain investments, and these developments may make it more difficult for the Fund to exit certain investments at an advantageous time or price. Adverse events triggered by the departure, as well as an exit or expulsion of an EU member state other than the United Kingdom from the EU, could negatively impact Fund returns.
The Fund may invest in securities and instruments that are economically tied to Russia. Investments in Russia are subject to various risks such as, but not limited to political, economic, legal, market and currency risks. The risks include uncertain political and economic policies, short term market volatility, poor accounting standards, corruption and crime, an inadequate regulatory system, regional armed conflict and unpredictable taxation. Investments in Russia are particularly subject to the risk that further economic sanctions and other similar measures may be imposed by the United States and/or other countries. Other similar measures may include, but are not limited to, banning Russia or certain persons or entities associated with Russia from global payment systems that facilitate cross-border payments, restricting the settlement of securities
| | | | | | |
| 196 | | PIMCO CLOSED-END FUNDS | | | | |
transactions by certain investors, and freezing Russian assets or those of particular countries, entities or persons with ties to Russia. Such sanctions and other similar measures — which may impact companies in many sectors, including energy, financial services and defense, among others — may negatively impact the Fund’s performance and/or ability to achieve its investment objectives. For example, certain investments may be prohibited and/or existing investments may become illiquid (e.g., in the event that transacting in certain existing investments is prohibited, securities markets close, or market participants cease transacting in certain investments in light of geopolitical events, sanctions or related considerations), which could render any such securities held by the Fund unmarketable for an indefinite period of time. In addition, such sanctions or other similar measures, and the Russian government’s response, could result in a downgrade of Russia’s credit rating or of securities of issuers located in or economically tied to Russia, devaluation of Russia’s currency and/or increased volatility with respect to Russian securities and the ruble. Moreover, disruptions caused by Russian military action or other actions (including cyberattacks, espionage or other asymmetric measures) or resulting actual or threatened responses to such activity may impact Russia’s economy and Russian issuers of securities in which the Fund invests. Such resulting actual or threatened responses may include, but are not limited to, purchasing and financing restrictions, withdrawal of financial intermediaries, boycotts or changes in consumer or purchaser preferences, sanctions, tariffs or cyberattacks on the Russian government, Russian companies or Russian individuals, including politicians. The Russian securities market is characterized by limited volume of trading, resulting in difficulty in obtaining accurate prices and trading. These issues can be magnified as a result of sanctions and other similar measures that may be imposed and the Russian government’s response. The Russian securities market, as compared to U.S. markets, has significant price volatility, less liquidity, a smaller market capitalization and a smaller number of traded securities. There may be little publicly available information about issuers. Settlement, clearing and registration of securities transactions are subject to risks. Prior to the implementation of the National Settlement Depository (“NSD”), a recognized central securities depository, there was no central registration system for equity share registration in Russia, and registration was carried out by either the issuers themselves or by registrars located throughout Russia. Title to Russian equities held through the NSD is now based on the records of the NSD and not the registrars. Although the implementation of the NSD has enhanced the efficiency and transparency of the Russian securities market, issues resulting in loss can still occur. Ownership of securities issued by Russian companies that are not held through depositories such as the NSD may be recorded by companies themselves and by registrars. In such cases, the risk is increased that the Fund could lose ownership rights through
fraud, negligence or oversight. While applicable Russian regulations impose liability on registrars for losses resulting from their errors, it may be difficult for the Fund to enforce any rights it may have against the registrar or issuer of the securities in the event of loss of share registration. In addition, issuers and registrars are still prominent in the validation and approval of documentation requirements for corporate action processing in Russia. Because the documentation requirements and approval criteria vary between registrars and issuers, there remain unclear and inconsistent market standards in the Russian market with respect to the completion and submission of corporate action elections. To the extent that the Fund suffers a loss relating to title or corporate actions relating to its portfolio securities, it may be difficult for the Fund to enforce its rights or otherwise remedy the loss. Russian securities laws may not recognize foreign nominee accounts held with a custodian bank, and therefore the custodian may be considered the ultimate owner of securities they hold for their clients. Adverse currency exchange rates are a risk and there may be a lack of available currency hedging instruments. Investments in Russia may be subject to the risk of nationalization or expropriation of assets. Oil, natural gas, metals and timber account for a significant portion of Russia’s exports, leaving the country vulnerable to swings in world prices and to sanctions or other actions that may be directed at the Russian economy as a whole or at Russian oil, natural gas, metals or timber industries.
Foreign Loan Originations Risk
PDI and PAXS may originate loans to foreign entities and individuals, including foreign
(non-U.S.)
and emerging market entities and individuals. Such loans may involve risks not ordinarily associated with exposure to loans to U.S. entities and individuals. The foreign lending industry may be subject to less governmental supervision and regulation than exists in the U.S.; conversely, foreign regulatory regimes applicable to the lending industry may be more complex and more restrictive than those in the U.S., resulting in higher costs associated with such investments, and such regulatory regimes may be subject to interpretation or change without prior notice to investors, such as the Fund. Foreign lending may not be subject to accounting, auditing, and financial reporting standards and practices comparable to those in the U.S. Due to difference in legal systems, there may be difficulty in obtaining or enforcing a court judgment outside the U.S. In addition, to the extent that investments are made in a limited number of countries, events in those countries will have a more significant impact on the Fund. The Fund’s loans to foreign entities and individuals may be subject to risks of increased transaction costs, potential delays in settlement or unfavorable differences between the U.S. economy and foreign economies.
The Fund’s exposure to loans to foreign entities and individuals may be subject to withholding and other foreign taxes, which may
| | | | | | | | | | | | |
| | | | ANNUAL REPORT | | | | | | | JUNE 30, 2022 | | | 197 |
| | | | |
Principal Risks of the Funds | | | | |
adversely affect the net return on such investments. In addition, fluctuations in foreign currency exchange rates and exchange controls may adversely affect the market value of the Fund’s exposure to loans to foreign entities and individuals. The Fund is unlikely to be able to pass through to its shareholders foreign income tax credits in respect of any foreign income taxes it pays.
High Yield Securities Risk
To the extent that the Fund invests in high yield securities and unrated securities of similar credit quality (commonly known as “high yield securities” or “junk bonds”), the Fund may be subject to greater levels of credit risk, call risk and liquidity risk than funds that do not invest in such securities, which could have a negative effect on the NAV and market price of the Fund’s Common Shares or Common Share dividends. These securities are considered predominantly speculative with respect to an issuer’s continuing ability to make principal and interest payments, and may be more volatile than other types of securities. An economic downturn or individual corporate developments could adversely affect the market for these securities and reduce the Fund’s ability to sell these securities at an advantageous time or price. The Fund may purchase distressed securities that are in default or the issuers of which are in bankruptcy, which involve heightened risks.
Issuers of high yield securities may have the right to “call” or redeem the issue prior to maturity, which may result in the Fund having to reinvest the proceeds in other high yield securities or similar instruments that may pay lower interest rates. The Fund may also be subject to greater levels of liquidity risk than funds that do not invest in high yield securities. Consequently, transactions in high yield securities may involve greater costs than transactions in more actively traded securities. These factors may result in the Fund being unable to realize full value for these securities and/or may result in the Fund not receiving the proceeds from a sale of a high yield security for an extended period after such sale, each of which could result in losses to the Fund. Because of the risks involved in investing in high yield securities, an investment in the Fund should be considered speculative. To the extent that the Fund invests in high yield securities and unrated securities of similar credit quality (commonly known as “high yield securities” or “junk bonds”), the Fund may be subject to greater levels of credit risk, call risk and liquidity risk than funds that do not invest in such securities, which could have a negative effect on the NAV and market price of the Fund’s Common Shares or Common Share dividends. These securities are considered predominantly speculative with respect to an issuer’s continuing ability to make principal and interest payments, and may be more volatile than other types of securities. An economic downturn or individual corporate developments could adversely affect the market for these securities and reduce the Fund’s ability to sell these securities at an
advantageous time or price. The Fund may purchase distressed securities that are in default or the issuers of which are in bankruptcy, which involve heightened risks.
Issuers of high yield securities may have the right to “call” or redeem the issue prior to maturity, which may result in the Fund having to reinvest the proceeds in other high yield securities or similar instruments that may pay lower interest rates. The Fund may also be subject to greater levels of liquidity risk than funds that do not invest in high yield securities. Consequently, transactions in high yield securities may involve greater costs than transactions in more actively traded securities. These factors may result in the Fund being unable to realize full value for these securities and/or may result in the Fund not receiving the proceeds from a sale of a high yield security for an extended period after such sale, each of which could result in losses to the Fund. Because of the risks involved in investing in high yield securities, an investment in the Fund should be considered speculative.
In general, lower rated debt securities carry a greater degree of risk that the issuer will lose its ability to make interest and principal payments, which could have a negative effect on the Fund. Securities of below investment grade quality are regarded as having predominantly speculative characteristics with respect to capacity to pay interest and repay principal and are commonly referred to as “high yield” securities or “junk bonds.” High yield securities involve a greater risk of default, and their prices are generally more volatile and sensitive to actual or perceived negative developments. Debt securities in the lowest investment grade category also may be considered to possess some speculative characteristics by certain rating agencies. The Fund may purchase stressed or distressed securities that are in default or the issuers of which are in bankruptcy, which involve heightened risks. An economic downturn could severely affect the ability of issuers (particularly those that are highly leveraged) to service or repay their debt obligations. Lower-rated securities are generally less liquid than higher-rated securities, which may have an adverse effect on the Fund’s ability to dispose of them. For example, under adverse market or economic conditions, the secondary market for below investment grade securities could contract further, independent of any specific adverse changes in the condition of a particular issuer, and certain securities in the Fund’s portfolio may become illiquid or less liquid. As a result, the Fund could find it more difficult to sell these securities or may be able to sell these securities only at prices lower than if such securities were widely traded. To the extent the Fund focuses on below investment grade debt obligations, PIMCO’s capabilities in analyzing credit quality and associated risks will be particularly important, and there can be no assurance that PIMCO will be successful in this regard. Due to the risks involved in investing in high yield securities, an investment in the Fund should be considered speculative. The Fund’s credit quality policies apply only at the time a
| | | | | | |
| 198 | | PIMCO CLOSED-END FUNDS | | | | |
security is purchased, and the Fund is not required to dispose of a security in the event that a rating agency or PIMCO downgrades its assessment of the credit characteristics of a particular issue. Analysis of creditworthiness may be more complex for issuers of high yield securities than for issuers of higher quality debt securities. Analysis of creditworthiness may be more complex for issuers of high yield securities than for issuers of higher quality debt securities.
Inflation/Deflation Risk
Inflation risk is the risk that the value of assets or income from the Fund’s investments will be worth less in the future as inflation decreases the value of payments at future dates. As inflation increases, the real value of the Fund’s portfolio could decline. Inflation has recently increased and it cannot be predicted whether it may decline. Deflation risk is the risk that prices throughout the economy decline over time. Deflation may have an adverse effect on the creditworthiness of issuers and may make issuer default more likely, which may result in a decline in the value of the Fund’s portfolio and Common Shares.
Inflation-Indexed Security Risk
Inflation-indexed debt securities are subject to the effects of changes in market interest rates caused by factors other than inflation (real interest rates). In general, the value of an inflation-indexed security, including Treasury Inflation-Protected Securities (“TIPS”), tends to decrease when real interest rates increase and can increase when real interest rates decrease. Thus generally, during periods of rising inflation, the value of inflation-indexed securities will tend to increase and during periods of deflation, their value will tend to decrease. Interest payments on inflation-indexed securities are unpredictable and will fluctuate as the principal and interest are adjusted for inflation. There can be no assurance that the inflation index used (i.e., the
Consumer Price Index (“CPI”)), which is calculated and published by a third-party, will accurately measure the real rate of inflation. Increases in the principal value of TIPS due to inflation are considered taxable ordinary income. Any increase in the principal amount of an inflation-indexed debt security will be considered taxable ordinary income, even though the Fund will not receive the principal until maturity. Additionally, a CPI swap can potentially lose value if the realized rate of inflation over the life of the swap is less than the fixed market implied inflation rate (fixed breakeven rate) that the investor agrees to pay at the initiation of the swap. With municipal inflation-indexed securities, the inflation adjustment is integrated into the coupon payment, which is federally tax exempt (and may be state tax exempt). For municipal inflation-indexed securities, there is no adjustment to the principal value. Because municipal inflation-indexed securities are a small component of the municipal bond market, they may be less liquid than conventional municipal bonds.
Interest Rate Risk
Interest rate risk is the risk that fixed income securities and other instruments in the Fund’s portfolio will fluctuate in value because of a change in interest rates. For example, as nominal interest rates rise, the value of certain fixed income securities held by the Fund is likely to decrease. A nominal interest rate can be described as the sum of a real interest rate and an expected inflation rate. Interest rate changes can be sudden and unpredictable, and the Fund may lose money as a result of movements in interest rates. The Fund may not be able to effectively hedge against changes in interest rates or may choose not to do so for cost or other reasons.
A wide variety of factors can cause interest rates or yields of U.S. Treasury securities (or yields of other types of bonds) to rise, including but not limited to central bank monetary policies, changing inflation or real growth rates, general economic conditions, increasing bond issuances or reduced market demand for low yielding investments. Risks associated with rising interest rates are heightened under current market conditions given that the U.S. Federal Reserve (the “Federal Reserve”) has begun to raise interest rates from historically low levels and has signaled an intention to continue to do so. Further, in market environments where interest rates are rising, issuers may be less willing or able to make principal and interest payments on fixed-income investments when due.
Fixed income securities with longer durations tend to be more sensitive to changes in interest rates, usually making them more volatile. Duration is a measure used to determine the sensitivity of a security’s price to changes in interest rates that incorporates a security’s yield, coupon, final maturity and call features, among other characteristics. Duration is useful primarily as a measure of the sensitivity of a fixed income security’s market price to interest rate (i.e., yield) movements. All other things remaining equal, for each one percentage point increase in interest rates, the value of a portfolio of fixed income investments would generally be expected to decline by one percent for every year of the portfolio’s average duration above zero. For example, the value of a portfolio of fixed income securities with an average duration of eight years would generally be expected to decline by approximately 8% if interest rates rose by one percentage point.
Variable and floating rate securities may decline in value if their interest rates do not rise as much, or as quickly, as interest rates in general. Conversely, floating rate securities will not generally increase in value if interest rates decline. Inverse floating rate securities may decrease in value if interest rates increase. Inverse floating rate securities may also exhibit greater price volatility than a fixed rate obligation with similar credit quality. When the Fund holds variable or floating rate securities, a decrease (or, in the case of inverse floating
| | | | |
Principal Risks of the Funds | | | | |
rate securities, an increase) in market interest rates will adversely affect the income received from such securities and the NAV of the Fund’s shares.
During periods of very low or negative interest rates, the Fund may be unable to maintain positive returns. Very low or negative interest rates may magnify interest rate risk. Changing interest rates, including rates that fall below zero, may have unpredictable effects on markets, may result in heightened market volatility and may detract from Fund performance to the extent the Fund is exposed to such interest rates.
Measures such as average duration may not accurately reflect the true interest rate sensitivity of the Fund. This is especially the case if the Fund consists of securities with widely varying durations. Therefore, if the Fund has an average duration that suggests a certain level of interest rate risk, the Fund may in fact be subject to greater interest rate risk than the average would suggest. This risk is greater to the extent the Fund uses leverage or derivatives in connection with the management of the Fund.
Convexity is an additional measure used to understand a security’s or Fund’s interest rate sensitivity. Convexity measures the rate of change of duration in response to changes in interest rates. With respect to a security’s price, a larger convexity (positive or negative) may imply more dramatic price changes in response to changing interest rates. Convexity may be positive or negative. Negative convexity implies that interest rate increases result in increased duration, meaning increased sensitivity in prices in response to rising interest rates. Thus, securities with negative convexity, which may include bonds with traditional call features and certain mortgage-backed securities, may experience greater losses in periods of rising interest rates. Accordingly, if the Fund holds such securities, the Fund may be subject to a greater risk of losses in periods of rising interest rates.
Rising interest rates may result in a decline in value of the Fund’s fixed income investments and in periods of volatility. Further, while U.S. bond markets have steadily grown over the past three decades, dealer “market making” ability has remained relatively stagnant. As a result, dealer inventories of certain types of bonds and similar instruments, which provide a core indication of the ability of financial intermediaries to “make markets,” are at or near historic lows in relation to market size. Because market makers provide stability to a market through their intermediary services, a significant reduction in dealer inventories could potentially lead to decreased liquidity and increased volatility in the fixed income markets. Such issues may be exacerbated during periods of economic uncertainty. All of these factors, collectively and/or individually, could cause the Fund to lose value.
The value of a security may decline for a number of reasons that directly relate to the issuer, such as management performance, financial leverage and reduced demand for the issuer’s goods or services, as well as the historical and prospective earnings of the issuer and the value of its assets. A change in the financial condition of a single issuer may affect securities markets as a whole. These risks can apply to the Common Shares issued by the Fund and to the issuers of securities and other instruments in which the Fund invests.
The Fund’s use of leverage, if any, creates the opportunity for increased Common Share net income, but also creates special risks for Common Shareholders. To the extent used, there is no assurance that the Fund’s leveraging strategies will be successful. Leverage is a speculative technique that may expose the Fund to greater risk and increased costs. The Fund’s assets attributable to leverage, if any, will be invested in accordance with the Fund’s investment objectives and policies. Interest expense payable by the Fund with respect to derivatives and other forms of leverage, and dividends payable with respect to preferred shares outstanding, if any, will generally be based on shorter-term interest rates that would be periodically reset. So long as the Fund’s portfolio investments provide a higher rate of return (net of applicable Fund expenses) than the interest expenses and other costs to the Fund of such leverage, the investment of the proceeds thereof will generate more income than will be needed to pay the costs of the leverage. If so, and all other things being equal, the excess may be used to pay higher dividends to Common Shareholders than if the Fund were not so leveraged. If, however, shorter-term interest rates rise relative to the rate of return on the Fund’s portfolio, the interest and other costs to the Fund of leverage could exceed the rate of return on the debt obligations and other investments held by the Fund, thereby reducing return to Common Shareholders. In addition, fees and expenses of any form of leverage used by the Fund will be borne entirely by the Common Shareholders (and not by preferred shareholders, if any) and will reduce the investment return of the Common Shares. Therefore, there can be no assurance that the Fund’s use of leverage will result in a higher yield on the Common Shares, and it may result in losses. In addition, any preferred shares issued by the Fund are expected to pay cumulative dividends, which may tend to increase leverage risk. Leverage creates several major types of risks for Common Shareholders, including:
| | the likelihood of greater volatility of NAV and market price of Common Shares, and of the investment return to Common Shareholders, than a comparable portfolio without leverage; |
| | the possibility either that Common Share dividends will fall if the interest and other costs of leverage rise, or that dividends paid on Common Shares will fluctuate because such costs vary over time; and |
| | the effects of leverage in a declining market or a rising interest rate environment, as leverage is likely to cause a greater decline in the NAV of the Common Shares than if the Fund were not leveraged and may result in a greater decline in the market value of the Common Shares. |
In addition, the counterparties to the Fund’s leveraging transactions and any preferred shareholders of the Fund will have priority of payment over the Fund’s Common Shareholders.
Reverse repurchase agreements involve the risks that the interest income earned on the investment of the proceeds will be less than the interest expense and Fund expenses associated with the repurchase agreement, that the market value of the securities sold by the Fund may decline below the price at which the Fund is obligated to repurchase such securities and that the securities may not be returned to the Fund. There is no assurance that reverse repurchase agreements can be successfully employed. Dollar roll transactions involve the risk that the market value of the securities the Fund is required to purchase may decline below the agreed upon repurchase price of those securities. Successful use of dollar rolls may depend upon the Investment Manager’s ability to correctly predict interest rates and prepayments. There is no assurance that dollar rolls can be successfully employed. In connection with reverse repurchase agreements and dollar rolls, the Fund will also be subject to counterparty risk with respect to the purchaser of the securities. If the broker/dealer to whom the Fund sells securities becomes insolvent, the Fund’s right to purchase or repurchase securities may be restricted.
The Fund may engage in total return swaps, reverse repurchases, loans of portfolio securities, short sales and when-issued, delayed delivery and forward commitment transactions, credit default swaps, basis swaps and other swap agreements, purchases or sales of futures and forward contracts (including foreign currency exchange contracts), call and put options or other derivatives. The Fund’s use of such transactions gives rise to associated leverage risks described above, and may adversely affect the Fund’s income, distributions and total returns to Common Shareholders. To the extent that any offsetting positions do not behave in relation to one another as expected, the Fund may perform as if it is leveraged through use of these derivative strategies.
Any total return swaps, reverse repurchases, loans of portfolio securities, short sales and when-issued, delayed delivery and forward commitment transactions, credit default swaps, basis swaps and other swap agreements, purchases or sales of futures and forward contracts (including foreign currency exchange contracts), call and put options or other derivatives by the Fund or counterparties to the Fund’s other leveraging transactions, if any, would have seniority over the Fund’s Common Shares.
On October 28, 2020, the SEC adopted Rule
18f-4
under the Act providing for the regulation of a registered investment company’s use of derivatives and certain related instruments. Among other things, Rule
18f-4
limits a fund’s derivatives exposure through a
test and requires the adoption and implementation of a derivatives risk management program for certain derivatives users. Subject to certain conditions, limited derivatives users (as defined in Rule
18f-4),
however, would not be subject to the full requirements of Rule
18f-4.
In connection with the adoption of Rule
18f-4,
the SEC also eliminated the asset segregation framework arising from prior SEC guidance for covering derivatives and certain financial instruments that was applicable to the Fund as of the date of this report. Compliance with Rule
18f-4
is not required until August 19, 2022. As the Fund comes into compliance, the Fund’s approach to asset segregation and coverage requirements will be impacted. In addition, Rule
18f-4
could restrict the Fund’s ability to engage in certain derivatives transactions and/or increase the costs of such derivatives transactions, which could adversely affect the value or performance of the Fund and the Common Shares and/or the Fund’s distribution rate.
Because the fees received by the Investment Manager may increase depending on the types of leverage utilized by the Fund, the Investment Manager has a financial incentive for the Fund to use certain forms of leverage, which may create a conflict of interest between the Investment Manager, on the one hand, and the Common Shareholders, on the other hand.
To the extent that any Subsidiary of PAXS directly incurs leverage in the form of debt or preferred shares, the amount of such leverage used by a Fund and such Subsidiaries will be consolidated and treated as senior securities for purposes of complying with the 1940 Act’s limitations on leverage by a Fund.
With respect to each of PDO and PAXS, unless the limited term provision of the Fund’s Restated Agreement and Declaration of Trust (the “Declaration”) is amended by shareholders in accordance with the Declaration, or unless the Fund completes a tender offer, as of a date within twelve months preceding the fund’s dissolution date, to all Common Shareholders to purchase 100% of the then outstanding Common Shares of the Fund at a price equal to the net asset value per Common Share on the expiration date of the tender offer (an “Eligible Tender Offer”) and converts to perpetual existence, the Fund will terminate on or about January 27, 2033, with respect to PIMCO Dynamic Income Opportunities Fund, and January 27, 2034, with respect to PIMCO Access Income Fund (the “Dissolution Date”). The Fund is not a
so-called
“target date” or “life cycle” fund whose asset allocation becomes more conservative over time as its target date, often associated with retirement, approaches. In addition, the Fund is
| | | | |
Principal Risks of the Funds | | | | |
not a “target term” fund whose investment objective is to return its original NAV on the Dissolution Date or in an Eligible Tender Offer. The Fund’s investment objectives and policies are not designed to seek to return to investors that purchase shares in this offering their initial investment on the Dissolution Date or in an Eligible Tender Offer, and such investors and investors that purchase shares after the completion of this offering may receive more or less than their original investment upon dissolution or in an Eligible Tender Offer.
Because the assets of the Fund will be liquidated in connection with the dissolution, the Fund will incur transaction costs in connection with dispositions of portfolio securities. The Fund does not limit its investments to securities having a maturity date prior to the Dissolution Date and may be required to sell portfolio securities when it otherwise would not, including at times when market conditions are not favorable, which may cause the Fund to lose money. In particular, the Fund’s portfolio may still have large exposures to illiquid securities as the Dissolution Date approaches, and losses due to portfolio liquidation may be significant. Beginning one year before the Dissolution Date (the “Wind-Down Period”), the Fund may begin liquidating all or a portion of the Fund’s portfolio, and the Fund may deviate from its investment strategy and may not achieve its investment objectives. As a result, during the Wind-Down Period, the Fund’s distributions may decrease, and such distributions may include a return of capital. It is expected that Common Shareholders will receive cash in any liquidating distribution from the Fund, regardless of their participation in the Fund’s automatic dividend reinvestment plan. However, if on the Dissolution Date the Fund owns securities for which no market exists or securities that are trading at depressed prices, such securities may be placed in a liquidating trust. Any such liquidating trust or other similar vehicle is not expected to be a registered investment company. The Fund cannot predict the amount, if any, of securities that will be required to be placed in a liquidating trust. The Fund’s investment objectives and policies are not designed to seek to return investors’ original investment upon termination of the Fund, and investors may receive more or less than their original investment upon termination of the Fund. As the assets of the Fund will be liquidated in connection with its termination, the Fund may be required to sell portfolio securities when it otherwise would not, including at times when market conditions are not favorable, which may cause the Fund to lose money. The Fund may receive proceeds from the disposition of portfolio investments that are less than the valuations of such investments by the Fund and, in particular, losses from the disposition of illiquid securities may be significant. The disposition of portfolio investments by the Fund could also cause market prices of such instruments, and hence the NAV and market price of the Common Shares, to decline. In addition, disposition of portfolio investments will cause the Fund to incur increased brokerage and related transaction expenses.
Moreover, in conducting such portfolio transactions, the Fund may need to deviate from its investment policies and may not achieve its investment objectives. The Fund’s portfolio composition may change as its portfolio holdings mature or are called or sold in anticipation of an Eligible Tender Offer or the Dissolution Date. During such period(s), it is possible that the Fund will hold a greater percentage of its total assets in shorter term and lower yielding securities and cash and cash equivalents than it would otherwise, which may impede the Fund’s ability to achieve its investment objectives and adversely impact the Fund’s performance and distributions to Common Shareholders, which may in turn adversely impact the market value of the Common Shares. In addition, the Fund may be required to reduce its leverage, which could also adversely impact its performance. The additional cash or cash equivalents held by the Fund could be obtained through reducing the Fund’s distributions to Common Shareholders and/or holding cash in lieu of reinvesting, which could limit the ability of the Fund to participate in new investment opportunities. The Fund does not limit its investments to securities having a maturity date prior to or around the Dissolution Date, which may exacerbate the foregoing risks and considerations. A Common Shareholder may be subject to the foregoing risks over an extended period of time, particularly if the Fund conducts an Eligible Tender Offer and is also subsequently terminated by or around the Dissolution Date.
If the Fund conducts an Eligible Tender Offer, the Fund anticipates that funds to pay the aggregate purchase price of shares accepted for purchase pursuant to the tender offer will be first derived from any cash on hand and then from the proceeds from the sale of portfolio investments held by the Fund. In addition, the Fund may be required to dispose of portfolio investments in connection with any reduction in the Fund’s outstanding leverage necessary in order to maintain the Fund’s desired leverage ratios following a tender offer. The risks related to the disposition of securities in connection with the Fund’s dissolution also would be present in connection with the disposition of securities in connection with an Eligible Tender Offer. It is likely that during the pendency of a tender offer, and possibly for a time thereafter, the Fund will hold a greater than normal percentage of its total assets in cash and cash equivalents, which may impede the Fund’s ability to achieve its investment objectives and decrease returns to shareholders. The tax effect of any such dispositions of portfolio investments will depend on the difference between the price at which the investments are sold and the tax basis of the Fund in the investments. Any capital gains recognized on such dispositions, as reduced by any capital losses the Fund realizes in the year of such dispositions and by any available capital loss carryforwards, will be distributed to shareholders as capital gain dividends (to the extent of net long-term capital gains over net short-term capital losses) or ordinary dividends (to the extent of net short-term capital gains over net long-term capital losses) during or
with respect to such year, and such distributions will generally be taxable to Common Shareholders. If the Fund’s tax basis for the investments sold is less than the sale proceeds, the Fund will recognize capital gains, which the Fund will be required to distribute to Common Shareholders. In addition, the Fund’s purchase of tendered Common Shares pursuant to a tender offer would have tax consequences for tendering Common Shareholders and may have tax consequences for
non-tendering
Common Shareholders.
The purchase of Common Shares by the Fund pursuant to a tender offer will have the effect of increasing the proportionate interest in the Fund of
non-tendering
Common Shareholders. All Common Shareholders remaining after a tender offer may be subject to proportionately higher expenses due to the reduction in the Fund’s total assets resulting from payment for the tendered Common Shares. Such reduction in the Fund’s total assets may result in less investment flexibility, reduced diversification and greater volatility for the Fund, and may have an adverse effect on the Fund’s investment performance. Such reduction in the Fund’s total assets may also cause Common Shares to become thinly traded or otherwise negatively impact secondary trading of Common Shares. A reduction in net assets, and the corresponding increase in the Fund’s expense ratio, could result in lower returns and put the Fund at a disadvantage relative to its peers and potentially cause the Fund’s Common Shares to trade at a wider discount to NAV than it otherwise would. Furthermore, the portfolio of the Fund following an Eligible Tender Offer could be significantly different and, therefore, Common Shareholders retaining an investment in the Fund could be subject to greater risk. For example, the Fund may be required to sell its more liquid, higher quality portfolio investments to purchase Common Shares that are tendered in an Eligible Tender Offer, which would leave a less liquid, lower quality portfolio for remaining shareholders. The prospects of an Eligible Tender Offer may attract arbitrageurs who would purchase the Common Shares prior to the tender offer for the sole purpose of tendering those shares which could have the effect of exacerbating the risks described herein for shareholders retaining an investment in the Fund following an Eligible Tender Offer.
The Fund is not required to conduct an Eligible Tender Offer. If the Fund conducts an Eligible Tender Offer, there can be no assurance that the number of tendered Common Shares would not result in the Fund having aggregate net assets below the Dissolution Threshold, in which case the Eligible Tender Offer would be canceled, no Common Shares would be repurchased pursuant to the Eligible Tender Offer and the Fund will dissolve on the Dissolution Date (subject to possible extensions). Following the completion of an Eligible Tender Offer in which the number of tendered Common Shares would result in the Fund having aggregate net assets greater than or equal to the
Dissolution Threshold, the Board may, by a Board Action Vote, eliminate the Dissolution Date without shareholder approval. Thereafter, the Fund will have a perpetual existence. The Investment Manager may have a conflict of interest in recommending to the Board that the Dissolution Date be eliminated and the Fund have a perpetual existence. The Fund is not required to conduct additional tender offers following an Eligible Tender Offer and conversion to perpetual existence. Therefore, remaining Common Shareholders may not have another opportunity to participate in a tender offer. Shares of
closed-end
management investment companies frequently trade at a discount from their NAV, and as a result remaining Common Shareholders may only be able to sell their Shares at a discount to NAV.
Liquidity risk exists when particular investments are difficult to purchase or sell. Illiquid investments are investments that the Fund reasonably expects cannot be sold or disposed of in current market conditions in seven calendar days or less without the sale or disposition significantly changing the market value of the investment. Illiquid investments may become harder to value, especially in changing markets. The Fund’s investments in illiquid investments may reduce the returns of the Fund because it may be unable to sell the illiquid investments at an advantageous time or price or possibly require the Fund to dispose of other investments at unfavorable times or prices in order to satisfy its obligations, which could prevent the Fund from taking advantage of other investment opportunities. Additionally, the market for certain investments may become illiquid under adverse market or economic conditions independent of any specific adverse changes in the conditions of a particular issuer. Bond markets have consistently grown over the past three decades while the capacity for traditional dealer counterparties to engage in fixed income trading has not kept pace and in some cases has decreased. As a result, dealer inventories of corporate bonds, which provide a core indication of the ability of financial intermediaries to “make markets,” are at or near historic lows in relation to market size. Because market makers seek to provide stability to a market through their intermediary services, the significant reduction in dealer inventories could potentially lead to decreased liquidity and increased volatility in the fixed income markets. Such issues may be exacerbated during periods of economic uncertainty. In such cases, the Fund, due to limitations on investments in illiquid investments and the difficulty in purchasing and selling such securities or instruments, may be unable to achieve its desired level of exposure to a certain sector. To the extent that the Fund invests in securities of companies with smaller market capitalizations, foreign
(non-U.S.)
securities, Rule 144A securities, illiquid sectors of fixed income securities, derivatives or securities with substantial market and/or credit risk, the Fund will tend to have greater exposure to liquidity risk.
| | | | |
Principal Risks of the Funds | | | | |
Further, fixed income securities with longer durations until maturity face heightened levels of liquidity risk as compared to fixed income securities with shorter durations until maturity. The risks associated with illiquid instruments may be particularly acute in situations in which the Fund’s operations require cash (such as in connection with repurchase offers) and could result in the Fund borrowing to meet its short-term needs or incurring losses on the sale of illiquid instruments. It may also be the case that other market participants may be attempting to liquidate fixed income holdings at the same time as the Fund, causing increased supply in the market and contributing to liquidity risk and downward pricing pressure.
To the extent the Fund invests in Alt Lending ABS, the Alt Lending ABS in which the Fund invests are typically not listed on any securities exchange and not registered under the Securities Act. In addition, the Fund anticipates that these instruments may only be sold to a limited number of investors and may have a limited or
non-existent
secondary market. Accordingly, the Fund currently expects that certain of its investments in Alt Lending ABS will face heightened levels of liquidity risk. Although currently, there is generally no active reliable, secondary market for certain Alt Lending ABS, a secondary market for these alternative lending-related instruments may develop.
PDI and PAXS may seek to originate loans, including, without limitation, residential and/or commercial real estate or mortgage-related loans, consumer loans or other types of loans, which may be in the form of whole loans, secured and unsecured notes, senior and second lien loans, mezzanine loans or similar investments. The Funds may originate loans to corporations and/or other legal entities and individuals, including foreign
(non-U.S.
and emerging market) entities and individuals. Such borrowers may have credit ratings that are determined by one or more NRSROs or PIMCO to be below investment grade. The Fund may subsequently offer such investments for sale to third parties; provided, that there is no assurance that the Fund will complete the sale of such an investment. If the Fund is unable to sell, assign or successfully close transactions for the loans that it originates, the Fund will be forced to hold its interest in such loans for an indeterminate period of time. This could result in the Fund’s investments being over-concentrated in certain borrowers. The Fund will be responsible for the expenses associated with originating a loan (whether or not consummated). This may include significant legal and due diligence expenses, which will be indirectly borne by the Fund and Common Shareholders.
Loan origination and servicing companies are routinely involved in legal proceedings concerning matters that arise in the ordinary course of their business. In addition, a number of participants in the loan origination and servicing industry (including control persons of industry
participants) have been the subject of regulatory actions by state regulators, including state Attorneys General, and by the federal government. Governmental investigations, examinations or regulatory actions, or private lawsuits, including purported class action lawsuits, may adversely affect such companies’ financial results. To the extent the Fund engages in origination and/or servicing directly, or has a financial interest in, or is otherwise affiliated with, an origination or servicing company, the Fund will be subject to enhanced risks of litigation, regulatory actions and other proceedings. As a result, the Fund may be required to pay legal fees, settlement costs, damages, penalties or other charges, any or all of which could materially adversely affect the Fund and its holdings.
Loans and Other Indebtedness; Loan Participations and Assignments Risk
Loan interests may take the form of direct interests acquired during a primary distribution and may also take the form of assignments of, novations of or participations in all or a portion of a loan acquired in secondary markets. It may also take the form of loan originations in the case of PCI and PDI. In addition to credit risk and interest rate risk, the Fund’s exposure to loan interests may be subject to additional risks. For example, purchasers of loans and other forms of direct indebtedness depend primarily upon the creditworthiness of the borrower for payment of principal and interest. Loans are subject to the risk that scheduled interest or principal payments will not be made in a timely manner or at all, either of which may adversely affect the values of the loan. If the Fund does not receive scheduled interest or principal payments on such indebtedness, the Fund’s share price and yield could be adversely affected. Loans that are fully secured offer the Fund more protection than an unsecured loan in the event of
non-payment
of scheduled interest or principal. However, the collateral underlying a loan may be unavailable or insufficient to satisfy a borrower’s obligation, and the Fund could become part owner of any collateral if a loan is foreclosed, subjecting the Fund to costs associated with owning and disposing of the collateral.
Investments in loans through a purchase of a loan, loan origination or a direct assignment of a financial institution’s interests with respect to a loan may involve additional risks to the Fund. For example, if a loan is foreclosed, the Fund could become owner, in whole or in part, of any collateral, which could include, among other assets, real estate or other real or personal property, and would bear the costs and liabilities associated with owning and holding or disposing of the collateral. The purchaser of an assignment typically succeeds to all the rights and obligations under the loan agreement with the same rights and obligations as the assigning lender. Assignments may, however, be arranged through private negotiations between potential assignees and potential assignors, and the rights and obligations acquired by the
purchaser of an assignment may differ from, and be more limited than, those held by the assigning lender.
In connection with purchasing loan participations, the Fund generally will have no right to enforce compliance by the borrower with the terms of the loan agreement relating to the loan, nor any rights of
set-off
against the borrower, and the Fund may not directly benefit from any collateral supporting the loan in which it has purchased the loan participation. As a result, the Fund may be subject to the credit risk of both the borrower and the lender that is selling the participation. In the event of the insolvency of the lender selling a participation, the Fund may be treated as a general creditor of the lender and may not benefit from any
set-off
between the lender and the borrower. Certain loan participations may be structured in a manner designed to prevent purchasers of participations from being subject to the credit risk of the lender, but even under such a structure, in the event of the lender’s insolvency, the lender’s servicing of the participation may be delayed and the assignability of the participation impaired.
The Fund may have difficulty disposing of loans and loan participations because to do so it will have to assign or sell such securities to a third party. Because there is no liquid market for many such securities, the Fund anticipates that such securities could be sold only to a limited number of institutional investors. The lack of a liquid secondary market may have an adverse impact on the value of such securities and the Fund’s ability to dispose of particular loans and loan participations when that would be desirable, including in response to a specific economic event such as a deterioration in the creditworthiness of the borrower. The lack of a liquid secondary market for loans and loan participations also may make it more difficult for the Fund to assign a value to these securities for purposes of valuing the Fund’s portfolio.
Investments in loans may include participations in bridge loans, which are loans taken out by borrowers for a short period (typically less than one year) pending arrangement of more permanent financing through, for example, the issuance of bonds, frequently high yield bonds issued for the purpose of acquisitions.
To the extent the Fund invests in loans, including bank loans, or originates loans, the Fund may be subject to greater levels of credit risk, call risk, settlement risk and liquidity risk. These instruments are considered predominantly speculative with respect to an issuer’s continuing ability to make principal and interest payments and may be more volatile than other types of securities. The Fund may also be subject to greater levels of liquidity risk than funds that do not invest in loans. In addition, the loans in which the Fund invests may not be listed on any exchange and a secondary market for such loans may be comparatively illiquid relative to markets for other more liquid fixed
income securities. Consequently, transactions in loans may involve greater costs than transactions in more actively traded securities. In connection with certain loan transactions, transaction costs that are borne by the Fund may include the expenses of third parties that are retained to assist with reviewing and conducting diligence, negotiating, structuring and servicing a loan transaction, and/or providing other services in connection therewith. Furthermore, the Fund may incur such costs in connection with loan transactions that are pursued by the Fund but not ultimately consummated
(so-called
“broken deal costs”).
Restrictions on transfers in loan agreements, a lack of publicly-available information, irregular trading activity and wide bid/ask spreads, among other factors, may, in certain circumstances, make loans more difficult to sell at an advantageous time or price than other types of securities or instruments. These factors may result in the Fund being unable to realize full value for the loans and/or may result in the Fund not receiving the proceeds from a sale of a loan for an extended period after such sale, each of which could result in losses to the Fund. Some loans may have extended trade settlement periods, including settlement periods of greater than seven days, which may result in cash not being immediately available to the Fund. If an issuer of a loan prepays or redeems the loan prior to maturity, the Fund may have to reinvest the proceeds in other loans or similar instruments that may pay lower interest rates. Because of the risks involved in investing in loans, an investment in the Fund should be considered speculative.
The Fund’s investments in subordinated and unsecured loans generally are subject to similar risks as those associated with investments in secured loans. Subordinated or unsecured loans are lower in priority of payment to secured loans and are subject to the additional risk that the cash flow of the borrower and property securing the loan or debt, if any, may be insufficient to meet scheduled payments after giving effect to the senior secured obligations of the borrower. This risk is generally higher for subordinated unsecured loans or debt, which are not backed by a security interest in any specific collateral. Subordinated and unsecured loans generally have greater price volatility than secured loans and may be less liquid. There is also a possibility that originators will not be able to sell participations in subordinated or unsecured loans, which would create greater credit risk exposure for the holders of such loans. Subordinate and unsecured loans share the same risks as other below investment grade securities.
There may be less readily available information about most loans and the underlying borrowers than is the case for many other types of securities. Loans may be issued by companies that are not subject to SEC reporting requirements and therefore may not be required to file reports with the SEC or may file reports that are not required to comply with SEC form requirements. In addition, such companies may
| | | | |
Principal Risks of the Funds | | | | |
be subject to a less stringent liability disclosure regime than companies subject to SEC reporting requirements. Loans may not be considered “securities,” and purchasers, such as the Fund, therefore may not be entitled to rely on the anti-fraud protections of the federal securities laws. Because there is limited public information available regarding loan investments, the Fund is particularly dependent on the analytical abilities of the Fund’s portfolio managers.
Economic exposure to loan interests through the use of derivative transactions may involve greater risks than if the Fund had invested in the loan interest directly during a primary distribution or through assignments of, novations of or participations in a loan acquired in secondary markets since, in addition to the risks described above, certain derivative transactions may be subject to leverage risk and greater illiquidity risk, counterparty risk, valuation risk and other risks.
The risks described in the principal risk titled “Loans and Other Indebtedness; Loan Participations and Assignments Risk” also apply to loans originated by PIMCO Dynamic Income Fund.
The Fund is subject to management risk because it is an actively managed investment portfolio. PIMCO and each individual portfolio manager will apply investment techniques and risk analysis in making investment decisions for the Fund, but there can be no guarantee that these decisions will produce the desired results. Certain securities or other instruments in which the Fund seeks to invest may not be available in the quantities desired. In addition, regulatory restrictions, actual or potential conflicts of interest or other considerations may cause PIMCO to restrict or prohibit participation in certain investments. In such circumstances, PIMCO or the individual portfolio managers may determine to purchase other securities or instruments as substitutes. Such substitute securities or instruments may not perform as intended, which could result in losses to the Fund. To the extent the Fund employs strategies targeting perceived pricing inefficiencies, arbitrage strategies or similar strategies, it is subject to the risk that the pricing or valuation of the securities and instruments involved in such strategies may change unexpectedly, which may result in reduced returns or losses to the Fund. The Fund is also subject to the risk that deficiencies in the internal systems or controls of PIMCO or another service provider will cause losses for the Fund or hinder Fund operations. For example, trading delays or errors (both human and systemic) could prevent the Fund from purchasing a security expected to appreciate in value. Additionally, actual or potential conflicts of interest, legislative, regulatory, or tax restrictions, policies or developments may affect the investment techniques available to PIMCO and each individual portfolio manager in connection with managing the Fund and may also adversely affect the ability of the Fund to achieve its investment objectives. There also can be no
assurance that all of the personnel of PIMCO will continue to be associated with PIMCO for any length of time. The loss of the services of one or more key employees of PIMCO could have an adverse impact on the Fund’s ability to realize its investment objectives.
In addition, the Fund may rely on various third-party sources to calculate its NAV. As a result, the Fund is subject to certain operational risks associated with reliance on service providers and service providers’ data sources. In particular, errors or systems failures and other technological issues may adversely impact the Fund’s calculations of its NAV, and such NAV calculation issues may result in inaccurately calculated NAVs, delays in NAV calculation and/or the inability to calculate NAVs over extended periods. The Fund may be unable to recover any losses associated with such failures.
The price of the Fund’s Common Shares will fluctuate with market conditions and other factors. If you sell your Common Shares, the price received may be more or less than your original investment. The Common Shares are designed for long-term investors and should not be treated as trading vehicles. Shares of
closed-end
management investment companies frequently trade at a discount from their NAV.
The Fund is subject to investment and operational risks associated with financial, economic and other global market developments and disruptions, including those arising from war, terrorism, market manipulation, government interventions, defaults and shutdowns, political changes or diplomatic developments, public health emergencies (such as the spread of infectious diseases, pandemics and epidemics) and natural/environmental disasters, which can all negatively impact the securities markets, interest rates, secondary trading, ratings, credit risk, inflation, deflation, other factors relating to the Fund’s investments or the Investment Manager’s operations and the value of an investment in the Fund, its distributions and its returns. These events can also impair the technology and other operational systems upon which the Fund’s service providers, including PIMCO as the Fund’s investment adviser, rely, and could otherwise disrupt the Fund’s service providers’ ability to fulfill their obligations to the Fund. For example, the spread of an infectious respiratory illness caused by a novel strain of coronavirus (known as
COVID-19)
has caused volatility, severe market dislocations and liquidity constraints in many markets, including markets for the securities the Fund holds, and may adversely affect the Fund’s investments and operations.
The market price of securities owned by the Fund may go up or down, sometimes rapidly or unpredictably. Securities may decline in value due to factors affecting securities markets generally or particular industries represented in the securities markets. The value of a security may
decline due to general market conditions that are not specifically related to a particular company, such as real or perceived adverse economic conditions, changes in the general outlook for corporate earnings, changes in interest or currency rates, adverse changes to credit markets or adverse investor sentiment generally. The value of a security may also decline due to factors that affect a particular industry or industries, such as labor shortages or increased production costs and competitive conditions within an industry. During a general downturn in the securities markets, multiple asset classes may decline in value simultaneously. Equity securities generally have greater price volatility than fixed income securities. Credit ratings downgrades may also negatively affect securities held by the Fund. Even when markets perform well, there is no assurance that the investments held by the Fund will increase in value along with the broader market.
In addition, market risk includes the risk that geopolitical and other events will disrupt the economy on a national or global level. For instance, war, terrorism, market manipulation, government defaults, government shutdowns, political changes, diplomatic developments or the imposition of sanctions and other similar measures, public health emergencies (such as the spread of infectious diseases, pandemics and epidemics) and natural/environmental disasters can all negatively impact the securities markets, which could cause the Fund to lose value. These events could reduce consumer demand or economic output, result in market closures, travel restrictions or quarantines, and significantly adversely impact the economy.
The current contentious domestic political environment, as well as political and diplomatic events within the United States and abroad, such as presidential elections in the U.S. or abroad or the U.S. government’s inability at times to agree on a long-term budget and deficit reduction plan, has in the past resulted, and may in the future result, in a government shutdown or otherwise adversely affect the U.S. regulatory landscape, the general market environment and/or investor sentiment, which could have an adverse impact on the Fund’s investments and operations. Additional and/or prolonged U.S. federal government shutdowns may affect investor and consumer confidence and may adversely impact financial markets and the broader economy, perhaps suddenly and to a significant degree. Governmental and quasi-governmental authorities and regulators throughout the world have previously responded to serious economic disruptions with a variety of significant fiscal and monetary policy changes, including but not limited to, direct capital infusions into companies, new monetary programs and dramatically lower interest rates. An unexpected or sudden reversal of these policies, or the ineffectiveness of these policies, could increase volatility in securities markets, which could adversely affect the Fund’s investments. Any market disruptions could also prevent the Fund from executing advantageous investment decisions in a timely manner. Funds that have focused their
investments in a region enduring geopolitical market disruption will face higher risks of loss. Thus, investors should closely monitor current market conditions to determine whether the Fund meets their individual financial needs and tolerance for risk.
Recently, there have been inflationary price movements. As such, fixed income securities markets may experience heightened levels of interest rate, volatility and liquidity risk. As discussed more under “Interest Rate Risk,” the Federal Reserve has begun to raise interest rates from historically low levels and has signaled an intention to continue to do so. Any additional interest rate increases in the future could cause the value of any Fund, such as the Fund, that invests in fixed income securities to decrease.
Exchanges and securities markets may close early, close late or issue trading halts on specific securities, which may result in, among other things, the Fund being unable to buy or sell certain securities or financial instruments at an advantageous time or accurately price its portfolio investments.
Mortgage-Related and Other Asset-Backed Instruments Risk
The mortgage-related assets in which the Fund may invest include, but are not limited to, any security, instrument or other asset that is related to U.S. or
non-U.S.
mortgages, including those issued by private originators or issuers, or issued or guaranteed as to principal or interest by the U.S. government or its agencies or instrumentalities or by
non-U.S.
governments or authorities, such as, without limitation, assets representing interests in, collateralized or backed by, or whose values are determined in whole or in part by reference to any number of mortgages or pools of mortgages or the payment experience of such mortgages or pools of mortgages, including REMICs, which could include
Re-REMICs,
mortgage pass-through securities, inverse floaters, CMOs, CLOs, multiclass pass-through securities, private mortgage pass-through securities, stripped mortgage securities (generally interest-only and principal-only securities), mortgage-related asset backed securities and mortgage-related loans (including through participations, assignments, originations and whole loans), including commercial and residential mortgage loans. Exposures to mortgage-related assets through derivatives or other financial instruments will be considered investments in mortgage-related assets.
The Fund may also invest in other types of ABS, including CDOs, CBOs and CLOs and other similarly structured securities.
Mortgage-related and other asset-backed instruments represent interests in “pools” of mortgages or other assets such as consumer loans or receivables held in trust and often involve risks that are different from or possibly more acute than risks associated with other types of debt instruments.
| | | | |
Principal Risks of the Funds | | | | |
Generally, rising interest rates tend to extend the duration of fixed rate mortgage-related assets, making them more sensitive to changes in interest rates. As a result, in a period of rising interest rates, the Fund may exhibit additional volatility since individual mortgage holders are less likely to exercise prepayment options, thereby putting additional downward pressure on the value of these securities and potentially causing the Fund to lose money. This is known as extension risk. Mortgage-backed securities can be highly sensitive to rising interest rates, such that even small movements can cause the Fund to lose value. Mortgage-backed securities, and in particular those not backed by a government guarantee, are subject to credit risk. When interest rates decline, borrowers may pay off their mortgages sooner than expected. This can reduce the returns of the Fund because the Fund may have to reinvest that money at the lower prevailing interest rates. The Fund’s investments in other asset-backed instruments are subject to risks similar to those associated with mortgage-related assets, as well as additional risks associated with the nature of the assets and the servicing of those assets. Payment of principal and interest on asset-backed instruments may be largely dependent upon the cash flows generated by the assets backing the instruments, and asset-backed instruments may not have the benefit of any security interest in the related assets.
Subordinate mortgage-backed or asset-backed instruments are paid interest only to the extent that there are funds available to make payments. To the extent the collateral pool includes a large percentage of delinquent loans, there is a risk that interest payments on subordinate mortgage-backed or asset-backed instruments will not be fully paid.
There are multiple tranches of mortgage-backed and asset-backed instruments, offering investors various maturity and credit risk characteristics. Tranches are categorized as senior, mezzanine, and subordinated/equity or “first loss,” according to their degree of risk. The most senior tranche of a mortgage-backed or asset-backed instrument has the greatest collateralization and pays the lowest interest rate. If there are defaults or the collateral otherwise underperforms, scheduled payments to senior tranches take precedence over those of mezzanine tranches, and scheduled payments to mezzanine tranches take precedence over those to subordinated/equity tranches. Lower tranches represent lower degrees of credit quality and pay higher interest rates intended to compensate for the attendant risks. The return on the lower tranches is especially sensitive to the rate of defaults in the collateral pool. The lowest tranche (i.e., the “equity” or “residual” tranche) specifically receives the residual interest payments (i.e., money that is left over after the higher tranches have been paid and expenses of the issuing entities have been paid) rather than a fixed interest rate. The Fund expects that investments in the
lowest tranche of or subordinate mortgage-backed and other asset-backed instruments will be subject to the greatest risks of losing part or all of their values, which could arise from delinquencies and foreclosures, thereby exposing the Fund’s investment portfolio to potential losses. Subordinate securities of mortgage-backed and other asset-backed instruments are also subject to greater credit risk than those mortgage-backed or other asset-backed instruments that are more highly rated.
The mortgage markets in the United States and in various foreign countries have experienced extreme difficulties in the past that adversely affected the performance and market value of certain of the Fund’s mortgage-related investments. Delinquencies and losses on residential and commercial mortgage loans (especially subprime and second-lien mortgage loans) may increase, and a decline in or flattening of housing and other real property values may exacerbate such delinquencies and losses. In addition, reduced investor demand for mortgage loans and mortgage-related securities and increased investor yield requirements have caused limited liquidity in the secondary market for mortgage-related securities, which can adversely affect the market value of mortgage-related securities. It is possible that such limited liquidity in such secondary markets could continue or worsen.
With respect to risk retention tranches (i.e., eligible residual interests initially held by the sponsors of CMBS and other eligible securitizations pursuant to the U.S. Risk Retention Rules), a third-party purchaser, such as the Fund, must hold its retained interest, unhedged, for at least five year following the closing of the CMBS transaction, after which it is entitled to transfer its interest in the securitization to another person that meets the requirements for a third-party purchaser. Even after the required holding period has expired, due to the generally illiquid nature of such investments, no assurance can be given as to what, if any, exit strategies will ultimately be available for any given position.
In addition, there is limited guidance on the application of the Final U.S. Risk Retention Rules to specific securitization structures. There can be no assurance that the applicable federal agencies charged with the implementation of the Final U.S. Risk Retention Rules (the FDIC, the Comptroller of the Currency, the Federal Reserve Board, the SEC, the Department of Housing and Urban Development, and the Federal Housing Finance Agency) could not take positions in the future that differ from the interpretation of such rules taken or embodied in such securitizations, or that the Final U.S. Risk Retention Rules will not change.
Furthermore, in situations where the Fund invests in risk retention tranches of securitizations structured by third parties, the Fund may be required to execute one or more letters or other agreements, the exact
form and nature of which will vary (each, a “Risk Retention Agreement”) under which it will make certain undertakings designed to ensure such securitization complies with the Final U.S. Risk Retention Rules. Such Risk Retention Agreements may include a variety of representations, warranties, covenants and other indemnities, each of which may run to various transaction parties. If the Fund breaches any undertakings in any Risk Retention Agreement, it will be exposed to claims by the other parties thereto, including for any losses incurred as a result of such breach.
Mortgage-Related Derivative Instruments Risk
The Fund may engage in derivative transactions related to mortgage-backed securities, including purchasing and selling exchange-listed and OTC put and call options, futures and forwards on mortgages and mortgage-backed securities. The Fund may also invest in mortgage-backed securities credit default swaps, which include swaps the reference obligation for which is a mortgage-backed security or related index, such as the CMBX Index (a tradeable index referencing a basket of commercial mortgage-backed securities), the TRX Index (a tradeable index referencing total return swaps based on commercial mortgage-backed securities) or the ABX (a tradeable index referencing a basket of
sub-prime
mortgage-backed securities). The Fund may invest in newly developed mortgage related derivatives that may hereafter become available.
Derivative mortgage-backed securities (such as principal-only (“POs”), interest-only (“IOs”) or inverse floating rate securities) are particularly exposed to call and extension risks. Small changes in mortgage prepayments can significantly impact the cash flows and the market value of these derivative instruments. In general, the risk of faster than anticipated prepayments adversely affects IOs, super floaters and premium priced mortgage-backed securities. The risk of slower than anticipated prepayments generally affects POs, floating-rate securities subject to interest rate caps, support tranches and discount priced mortgage-backed securities. In addition, particular derivative instruments may be leveraged such that their exposure (i.e., price sensitivity) to interest rate and/or prepayment risk is magnified.
Mortgage-related derivative instruments involve risks associated with mortgage-related and other asset-backed instruments, privately-issued mortgage-related securities, the mortgage market, the real estate industry, derivatives and credit default swaps.
With respect to the PIMCO Access Income Fund, a new or smaller fund’s performance may not represent how the fund is expected to or may perform in the long term if and when it has fully implemented its investment strategies. Investment positions may have a disproportionate impact (negative or positive) on performance in a new fund, such as the Fund. New funds may also require a period of
time before they are invested in securities that meet their investment objectives and policies and achieve a representative portfolio composition. Fund performance may be lower or higher during this
“ramp-up”
period, and may also be more volatile, than would be the case after the fund is fully invested. Similarly, a new fund’s investment strategy may require a longer period of time to show returns that are representative of the strategy. New funds have limited performance histories for investors to evaluate and new funds may not attract sufficient assets to achieve investment and trading efficiencies. If a new fund were to fail to successfully implement its investment strategies or achieve its investment objectives, performance may be negatively impacted, and any resulting liquidation could create negative transaction costs for the fund and tax consequences for investors.
With respect to PAXS, the Fund is a newly organized,
non-diversified,
limited term,
closed-end
management investment company with no history of operations and is designed for long-term investors and not as a trading vehicle.
Each of PDO and PAXS is
“non-diversified,”
which means that the Fund may invest a significant portion of its assets in the securities of a smaller number of issuers than a diversified fund. Focusing investments in a small number of issuers increases risk. A fund that invests in a relatively smaller number of issuers is more susceptible to risks associated with a single economic, political or regulatory occurrence than a diversified fund might be. Some of those issuers also may present substantial credit or other risks. Similarly, the Fund may be subject to increased economic, business or political risk to the extent that it invests a substantial portion of its assets in a particular currency, in a group of related industries, in a particular issuer, in the bonds of similar projects or in a narrowly defined geographic area outside the U.S. Notwithstanding the Fund’s status as a
“non-diversified”
investment company under the Act, the Fund intends to qualify as a regulated investment company accorded special tax treatment under the Code, which imposes its own diversification requirements.
An investment in the Fund, like any fund, can involve operational risks arising from factors such as processing errors, human errors, inadequate or failed internal or external processes, failures in systems and technology, changes in personnel and errors caused by third-party service providers. The occurrence of any of these failures, errors or breaches could result in a loss of information, regulatory scrutiny, reputational damage or other events, any of which could have a material adverse effect on the Fund. While the Fund seeks to minimize such events through controls and oversight, there may still be failures that could cause losses to the Fund.
| | | | |
Principal Risks of the Funds | | | | |
Other Investment Companies Risk
When investing in an investment company, the Fund will bear its ratable share of that investment company’s expenses and would remain subject to payment of the Fund’s management fees and other expenses with respect to assets so invested. Common Shareholders would therefore be subject to duplicative expenses to the extent the Fund invests in other investment companies. In addition, the securities of other investment companies may also be leveraged and will therefore be subject to same leverage risks.
The Alt Lending ABS in which the Fund may invest are typically not listed on any securities exchange and not registered under the Securities Act. In addition, the Fund anticipates that these instruments may only be sold to a limited number of investors and may have a limited or
non-existent
secondary market. Accordingly, the Fund currently expects that certain of the investments it may make in Alt Lending ABS will face heightened levels of liquidity risk. Although currently there is generally no reliable, active secondary market for certain Alt Lending ABS, a secondary market for these Alt Lending ABS may develop. If the Fund purchases Alt Lending ABS on an alternative lending platform, the Fund will have the right to receive principal and interest payments due on loans underlying the Alt Lending ABS only if the platform servicing the loans receives the borrower’s payments on such loans and passes such payments through to the Fund. If a borrower is unable or fails to make payments on a loan for any reason, the Fund may be greatly limited in its ability to recover any outstanding principal or interest due, as (among other reasons) the Fund may not have direct recourse against the borrower or may otherwise be limited in its ability to directly enforce its rights under the loan, whether through the borrower or the platform through which such loan was originated, the loan may be unsecured or under-collateralized and/or it may be impracticable to commence a legal proceeding against the defaulting borrower.
The Fund may have limited knowledge about the underlying loans and is dependent upon the platform for information regarding underlying loans. Although PIMCO may conduct diligence on the platforms, the Fund generally does not have the ability to independently verify the information provided by the platforms, other than payment information regarding loans underlying the Alt Lending ABS owned by the Fund, which the Fund observes directly as payments are received. With respect to Alt Lending ABS that the Fund purchases in the secondary market (i.e., not directly from an alternative lending platform), the Fund may not perform the same level of diligence on such platform or at all. The Fund may not review the particular characteristics of the loans collateralizing an Alt Lending ABS, but rather negotiate in advance with platforms the general criteria of the
underlying loans. As a result, the Fund is dependent on the platforms’ ability to collect, verify and provide information to the Fund about each loan and borrower.
The Fund relies on the borrower’s credit information, which is provided by the platforms. However, such information may be out of date, incomplete or inaccurate and may, therefore, not accurately reflect the borrower’s actual creditworthiness. Platforms may not have an obligation to update borrower information, and, therefore, the Fund may not be aware of any impairment in a borrower’s creditworthiness subsequent to the making of a particular loan. The platforms’ credit decisions and scoring models may be based on algorithms that could potentially contain programming or other errors or prove to be ineffective or otherwise flawed. This could adversely affect loan pricing data and approval processes and could cause loans to be mispriced or misclassified, which could ultimately have a negative impact on the Fund’s performance.
In addition, the underlying loans, in some cases, may be affected by the success of the platforms through which they are facilitated. Therefore, disruptions in the businesses of such platforms may also negatively impact the value of the Fund’s investments. In addition, disruption in the business of a platform could limit or eliminate the ability of the Fund to invest in loans originated by that platform, and therefore the Fund could lose some or all of the benefit of its diligence effort with respect to that platform.
Platforms are
for-profit
businesses that, as a general matter, generate revenue by collecting fees on funded loans from borrowers and by assessing a loan servicing fee on investors, which may be a fixed annual amount or a percentage of the loan or amounts collected. This business could be disrupted in multiple ways; for example, a platform could file for bankruptcy or a platform might suffer reputational harm from negative publicity about the platform or alternative lending more generally and the loss of investor confidence in the event that a loan facilitated through the platform is not repaid and the investor loses money on its investment. Many platforms and/or their affiliates have incurred operating losses since their inception and may continue to incur net losses in the future, particularly as their businesses grow and they incur additional operating expenses. Platforms may also be forced to defend legal action taken by regulators or governmental bodies. Alternative lending is a newer industry operating in an evolving legal environment. Platforms may be subject to risk of litigation alleging violations of law and/or regulations, including, for example, consumer protection laws, whether in the U.S. or in foreign jurisdictions. Platforms may be unsuccessful in defending against such lawsuits or other actions and, in addition to the costs incurred in fighting any such actions, platforms may be required to pay money in connection with the judgments, settlements or fines or may be forced to modify the
terms of its borrower loans, which could cause the platform to realize a loss or receive a lower return on a loan than originally anticipated. Platforms may also be parties to litigation or other legal action in an attempt to protect or enforce their rights or those of affiliates, including intellectual property rights, and may incur similar costs in connection with any such efforts.
The Fund’s investments in Alt Lending ABS may expose the Fund to the credit risk of the issuer. Generally, such instruments are unsecured obligations of the issuer; an issuer that becomes subject to bankruptcy proceedings may be unable to make full and timely payments on its obligations to the Fund, even if the payments on the underlying loan or loans continue to be made timely and in full. In addition, when the Fund owns Alt Lending ABS, the Fund and its custodian generally does not have a contractual relationship with, or personally identifiable information regarding, individual borrowers, so the Fund will not be able to enforce underlying loans directly against borrowers and may not be able to appoint an alternative servicing agent in the event that a platform or third-party servicer, as applicable, ceases to service the underlying loans. Therefore, the Fund is more dependent on the platform for servicing than if the Fund had owned whole loans through the platform. Where such interests are secured, the Fund relies on the platform to perfect the Fund’s security interest. In addition, there may be a delay between the time the Fund commits to purchase an instrument issued by a platform, its affiliate or a special purpose entity sponsored by the platform or its affiliate and the issuance of such instrument and, during such delay, the funds committed to such an investment will not earn interest on the investment nor will they be available for investment in other alternative lending-related instruments, which will reduce the effective rate of return on the investment. The Fund’s investments in Alt Lending ABS may be illiquid.
The Investment Manager manages the Fund without regard generally to restrictions on portfolio turnover. The use of futures contracts and other derivative instruments with relatively short maturities may tend to exaggerate the portfolio turnover rate for the Fund. Trading in fixed income securities does not generally involve the payment of brokerage commissions, but does involve indirect transaction costs. The use of futures contracts and other derivative instruments may involve the payment of commissions to futures commission merchants or other intermediaries. Higher portfolio turnover involves correspondingly greater expenses to the Fund, including brokerage commissions or dealer
mark-ups
and other transaction costs on the sale of securities and reinvestments in other securities. The higher the rate of portfolio turnover of the Fund, the higher these transaction costs borne by the Fund generally will be. Such sales may result in realization of taxable capital gains (including short-term capital gains, which are generally
taxed to shareholders at ordinary income tax rates when distributed net of short-term capital losses and net long-term capital losses), and may adversely impact the Fund’s
after-tax
returns.
Potential Conflicts of Interest Risk — Allocation of Investment Opportunities
The Investment Manager is involved worldwide with a broad spectrum of financial services and asset management activities and may engage in the ordinary course of business in activities in which their interests or the interests of their clients may conflict with those of the Fund. The Investment Manager may provide investment management services to other funds and discretionary managed accounts that follow an investment program similar to that of the Fund. Subject to the requirements of the Act, the Investment Manager intends to engage in such activities and may receive compensation from third parties for its services. The results of the Fund’s investment activities may differ from those of the Fund’s affiliates, or another account managed by the Fund’s affiliates, and it is possible that the Fund could sustain losses during periods in which one or more of the Fund’s affiliates and/or other accounts managed by the Investment Manager or its affiliates, including proprietary accounts, achieve profits on their trading.
Preferred Securities Risk
In addition to equity securities risk, credit risk and possibly high yield risk, investment in preferred securities involves certain other risks. Certain preferred securities contain provisions that allow an issuer under certain conditions to skip or defer distributions. If the Fund owns a preferred security that is deferring its distribution, the Fund may be required to include the amount of the deferred distribution in its taxable income for tax purposes although it does not currently receive such amount in cash. In order to receive the special treatment accorded to regulated investment companies and their shareholders under the Internal Revenue Code of 1986, as amended (the “Code”), and to avoid U.S. federal income and/or excise taxes at the Fund level, the Fund may be required to distribute this income to shareholders in the tax year in which the income is recognized (without a corresponding receipt of cash). Therefore, the Fund may be required to pay out as an income distribution in any such tax year an amount greater than the total amount of cash income the Fund actually received and to sell portfolio securities, including at potentially disadvantageous times or prices, to obtain cash needed for these income distributions. Preferred securities often are subject to legal provisions that allow for redemption in the event of certain tax or legal changes or at the issuer’s call. In the event of redemption, the Fund may not be able to reinvest the proceeds at comparable rates of return. Preferred securities are subordinated to bonds and other debt securities in an issuer’s capital structure in terms of priority for corporate income and liquidation payments, and therefore will be subject to greater credit risk than those debt securities. Preferred
| | | | |
Principal Risks of the Funds | | | | |
securities may trade less frequently and in a more limited volume and may be subject to more abrupt or erratic price movements than many other securities.
Privacy and Data Security Risk
The Gramm-Leach-Bliley Act (“GLBA”) and other laws limit the disclosure of certain
non-public
personal information about a consumer to
non-
affiliated third parties and require financial institutions to disclose certain privacy policies and practices with respect to information sharing with both affiliates and
non-
affiliated third parties. Many states and a number of
non-U.S.
jurisdictions have enacted privacy and data security laws requiring safeguards on the privacy and security of consumers’ personally identifiable information. Other laws deal with obligations to safeguard and dispose of private information in a manner designed to avoid its dissemination. Privacy rules adopted by the U.S. Federal Trade Commission and SEC implement GLBA and other requirements and govern the disclosure of consumer financial information by certain financial institutions, ranging from banks to private investment funds. U.S. platforms following certain models generally are required to have privacy policies that conform to these GLBA and other requirements. In addition, such platforms typically have policies and procedures intended to maintain platform participants’ personal information securely and dispose of it properly.
The Fund generally does not intend to obtain or hold borrowers’
non-public
personal information, and the Fund has implemented procedures designed to prevent the disclosure of borrowers’
non-public
personal information to the Fund. However, service providers to the Fund or its direct or indirect fully-owned subsidiaries, including their custodians and the platforms acting as loan servicers for the Fund or its direct or indirect fully-owned subsidiaries, may obtain, hold or process such information. The Fund cannot guarantee the security of
non-public
personal information in the possession of such a service provider and cannot guarantee that service providers have been and will continue to comply with GLBA, other data security and privacy laws and any other related regulatory requirements. Violations of GLBA and other laws could subject the Fund to litigation and/or fines, penalties or other regulatory action, which, individually or in the aggregate, could have an adverse effect on the Fund. The Fund may also face regulations related to privacy and data security in the other jurisdictions in which the Fund invests.
Private Placements and Restricted Securities Risk
A private placement involves the sale of securities that have not been registered under the 1933 Act, or relevant provisions of applicable
non-U.S.
law, to certain institutional and qualified individual purchasers, such as the Fund. In addition to the general risks to which all securities are subject, securities received in a private placement
generally are subject to strict restrictions on resale, and there may be no liquid secondary market or ready purchaser for such securities. Therefore, the Fund may be unable to dispose of such securities when it desires to do so, or at the most favorable time or price. Private placements may also raise valuation risks. Restricted securities are often purchased at a discount from the market price of unrestricted securities of the same issuer reflecting the fact that such securities may not be readily marketable without some time delay. Such securities are often more difficult to value and the sale of such securities often requires more time and results in higher brokerage charges or dealer discounts and other selling expenses than does the sale of securities trading on national securities exchanges or in the
markets. Until the Fund can sell such securities into the public markets, its holdings may be less liquid and any sales will need to be made pursuant to an exemption under the Securities Act.
Privately-Issued Mortgage-Related Securities Risk
There are no direct or indirect government or agency guarantees of payments in pools created by
non-governmental
issuers. Privately-issued mortgage-related securities are also not subject to the same underwriting requirements for the underlying mortgages that are applicable to those mortgage-related securities that have a government or government-sponsored entity guarantee.
Privately-issued mortgage-related securities are not traded on an exchange and there may be a limited market for the securities, especially when there is a perceived weakness in the mortgage and real estate market sectors. Without an active trading market, mortgage-related securities held in the Fund’s portfolio may be particularly difficult to value because of the complexities involved in assessing the value of the underlying mortgage loans.
To the extent that the Fund invests in real estate investments, including investments in equity or debt securities issued by private and public REITs, real estate operating companies (‘REOCs”), private or public real estate-related loans and real estate-linked derivative instruments, it will be subject to the risks associated with owning real estate and with the real estate industry generally. These risks include, but are not limited to: the burdens of ownership of real property; general and local economic conditions(such as an oversupply of space or a reduction in demand for space); the supply and demand for properties (including competition based on rental rates); energy and supply shortages; fluctuations in average occupancy and room rates; the attractiveness, type and location of the properties and changes in the relative popularity of commercial properties as an investment; the financial condition and resources of tenants, buyers and sellers of properties; increased mortgage defaults; the quality of maintenance, insurance and management services; changes in the availability of debt financing which may render the sale or refinancing of properties
difficult or impracticable; changes in building, environmental and other laws and/or regulations (including those governing usage and improvements), fiscal policies and zoning laws; changes in real property tax rates; changes in interest rates and the availability of mortgage funds which may render the sale or refinancing of properties difficult or impracticable; changes in operating costs and expenses; energy and supply shortages; uninsured losses or delays from casualties or condemnation; negative developments in the economy that depress travel or leasing activity; environmental liabilities; contingent liabilities on disposition of assets; uninsured or uninsurable casualties; acts of God, including earthquakes, hurricanes and other natural disasters; social unrest and civil disturbances, epidemics, pandemics or other public crises; terrorist attacks and war; risks and operating problems arising out of the presence of certain construction materials, structural or property level latent defects, work stoppages, shortages of labor, strikes, union relations and contracts, fluctuating prices and supply of labor and/or other labor-related factor; and other factors which are beyond the control of PIMCO and its affiliates. In addition, the Fund’s investments will be subject to various risks which could cause fluctuations in occupancy, rental rates, operating income and expenses or which could render the sale or financing of its properties difficult or unattractive. For example, following the termination or expiration of a tenant’s lease, there may be a period of time before receiving rental payments under a replacement lease. During that period, the Fund would continue to bear fixed expenses such as interest, real estate taxes, maintenance and other operating expenses. In addition, declining economic conditions may impair the ability to attract replacement tenants and achieve rental rates equal to or greater than the rents paid under previous leases. Increased competition for tenants may require capital improvements to properties which would not have otherwise been planned.
Ultimately, to the extent it is not possible to renew leases or
re-let
space as leases expire, decreased cash flow from tenants will result, which could adversely impact the Fund’s operating results.
Real estate values have been historically cyclical. As the general economy grows, demand for real estate increases and occupancies and rents may increase. As occupancies and rents increase, property values increase, and new development occurs. As development may occur, occupancies, rents and property values may decline. Because leases are usually entered into for long periods and development activities often require extended times to complete, the real estate value cycle often lags the general business cycle. Because of this cycle, real estate companies may incur large swings in their profits and the prices of their securities.
The total returns available from investments in real estate generally depend on the amount of income and capital appreciation generated
by the related properties. The performance of real estate, and thereby the Fund, will be reduced by any related expenses, such as expenses paid directly at the property level and other expenses that are capitalized or otherwise embedded into the cost basis of the real estate.
Regulation S Securities Risk
Regulation S securities are offered through
off-shore
(non-U.S.)
offerings without registration with the SEC pursuant to Regulation S of the Securities Act. Because Regulation S securities are subject to legal or contractual restrictions on resale, Regulation S securities may be considered illiquid. Furthermore, because Regulation S securities are generally less liquid than registered securities, a Fund may take longer to liquidate these positions than would be the case for publicly traded securities. Although Regulation S securities may be resold in privately negotiated transactions, the price realized from these sales could be less than
off-shore
transactions or in those originally paid by the Fund. Further, companies whose securities are not publicly traded may not be subject to the disclosure and other investor protection requirements that would be applicable if their securities were publicly traded. Accordingly, Regulation S securities may involve a high degree of business and financial risk and may result in substantial losses.
Financial entities, such as investment companies and investment advisers, are generally subject to extensive government regulation and intervention. Government regulation and/or intervention may change the way the Fund is regulated, affect the expenses incurred directly by the Fund and the value of its investments, and limit and /or preclude the Fund’s ability to achieve its investment objective. Government regulation may change frequently and may have significant adverse consequences. The Fund and the Investment Manager have historically been eligible for exemptions from certain regulations. However, there is no assurance that the Fund and the Investment Manager will continue to be eligible for such exemptions. Actions by governmental entities may also impact certain instruments in which the Fund invests.
Moreover, government regulation may have unpredictable and unintended effects. Legislative or regulatory actions to address perceived liquidity or other issues in fixed income markets generally, or in particular markets such as the municipal securities market, may alter or impair the Fund’s ability to pursue its investment objectives or utilize certain investment strategies and techniques.
Current rules related to credit risk retention requirements for asset-backed securities may increase the cost to originators, securitizers and, in certain cases, asset managers of securitization vehicles in which the Fund may invest. The impact of the risk retention rules on the securitization markets is uncertain. These requirements may increase the costs to originators, securitizers, and, in certain cases, collateral
| | | | |
Principal Risks of the Funds | | | | |
managers of securitization vehicles in which the Fund may invest, which costs could be passed along to such Fund as an investor in such vehicles. In addition, the costs imposed by the risk retention rules on originators, securitizers and/or collateral managers may result in a reduction of the number of new offerings of asset-backed securities and thus in fewer investment opportunities for the Fund. A reduction in the number of new securitizations could also reduce liquidity in the markets for certain types of financial assets, which in turn could negatively affect the returns on the Fund’s investment.
Regulatory Risk — Commodity Pool Operator
The CFTC has adopted regulations that subject registered investment companies and their investment advisers to regulation by the CFTC if the registered investment company invests more than a prescribed level of its liquidation value in futures, options on futures or commodities, swaps, or other financial instruments regulated under the CEA and the rules thereunder (“commodity interests”), or if the Fund markets itself as providing investment exposure to such instruments.
The Fund’s investments (including, but not limited to, repurchase agreements, collateralized loan obligations and mortgage-backed securities), payment obligations and financing terms may rely in some fashion on LIBOR. LIBOR is an average interest rate, determined by the ICE Benchmark Administration, that banks charge one another for the use of short-term money. On July 27, 2017, the Chief Executive of the Financial Conduct Authority (“FCA”), the United Kingdom’s financial regulatory body and regulator of LIBOR, announced that after 2021 it will cease its active encouragement of banks to provide the quotations needed to sustain LIBOR due to the absence of an active market for interbank unsecured lending and other reasons. On March 5, 2021, the FCA publicly announced that all U.S. Dollar LIBOR settings will either cease to be provided by any administrator or will no longer be representative (i) immediately after December 31, 2021 for
one-week
and
two-month
U.S. Dollar LIBOR settings and (ii) immediately after June 30, 2023 for the remaining U.S. Dollar LIBOR settings. As of January 1, 2022, as a result of supervisory guidance from U.S. regulators, some U.S. regulated entities have ceased entering into new LIBOR contracts with limited exceptions. While publication of the
one-,
three- and
six-
month Sterling and Japanese yen LIBOR settings will continue at least through calendar year 2022 on the basis of a changed methodology (known as “synthetic LIBOR”), these rates have been designated by the FCA as unrepresentative of the underlying market they seek to measure and are solely available for use in legacy transactions. Certain bank-sponsored committees in other jurisdictions, including Europe, the United Kingdom, Japan and Switzerland, have selected alternative reference rates denominated in other currencies. Although the transition process away from LIBOR has
become increasingly well-defined in advance of the anticipated discontinuation date, there remains uncertainty regarding the future utilization of LIBOR and the nature of any replacement rate. Any potential effects of the transition away from LIBOR on the Fund or on certain instruments in which the Fund invests can be difficult to ascertain, and they may vary depending on factors that include, but are not limited to: (i) existing fallback or termination provisions in individual contracts and (ii) whether, how, and when industry participants develop and adopt new reference rates and fallbacks for both legacy and new products and instruments. For example, certain of the Fund’s investments may involve individual contracts that have (i) no existing fallback provision or language that contemplates the discontinuation of LIBOR or (ii) inadequate fallback provisions or language that does not contemplate a permanent discontinuation of LIBOR, and those investments could experience increased volatility or reduced liquidity as a result of the transition process. In addition, interest rate provisions included in such contracts may need to be renegotiated in contemplation of the transition away from LIBOR. On March 15, 2022, the Adjustable Interest Rate (LIBOR) Act was signed into law. This law provides a statutory fallback mechanism on a nationwide basis to replace LIBOR with a benchmark rate that is selected by the Board of Governors of the Federal Reserve System and based on the Secured Overnight Financing Rate (“SOFR”) for certain contracts that reference LIBOR and contain no, or insufficient, fallback provisions. It is expected that implementing regulations in respect of the law will follow. The transition of investments from LIBOR to a replacement rate as a result of amendment, application of existing fallbacks, statutory requirements or otherwise may also result in a reduction in the value of certain instruments held by the Fund or a reduction in the effectiveness of related Fund transactions such as hedges. In addition, an instrument’s transition to a replacement rate could result in variations in the reported yields of the Fund that holds such instrument. Any such effects of the transition away from LIBOR, as well as other unforeseen effects, could result in losses to the Fund.
Income from the Fund’s portfolio will decline if and when the Fund invests the proceeds from matured, traded or called debt obligations at market interest rates that are below the portfolio’s current earnings rate. For instance, during periods of declining interest rates, an issuer of debt obligations may exercise an option to redeem securities prior to maturity, forcing the Fund to invest in lower-yielding securities. The Fund also may choose to sell higher yielding portfolio securities and to purchase lower yielding securities to achieve greater portfolio diversification, because the portfolio managers believe the current holdings are overvalued or for other investment-related reasons. A decline in income received by the Fund from its investments is likely to
have a negative effect on dividend levels and the market price, NAV and/or overall return of the Common Shares.
REITs are pooled investment vehicles that own, and usually operate, income-producing real estate. Some REITs also finance real estate. If a REIT meets certain requirements, including distributing to shareholders substantially all of its taxable income (other than net capital gains), then it is not typically taxed on the income distributed to shareholders. Therefore, REITs may pay higher dividends than other issuers.
REITs can be divided into three basic types: Equity REITs, Mortgage REITs and Hybrid REITs. Equity REITs invest the majority of their assets directly in real property. They derive their income primarily from rents received and any profits on the sale of their properties. Mortgage REITs invest the majority of their assets in real estate mortgages and derive most of their income from mortgage interest payments. As its name suggests, Hybrid REITs combine characteristics of both Equity REITs and Mortgage REITs.
An investment in a REIT, or in a real estate linked derivative instrument linked to the value of a REIT, is subject to the risks that impact the value of the underlying properties of the REIT. These risks include loss to casualty or condemnation, and changes in supply and demand, interest rates, zoning laws, regulatory limitations on rents, property taxes and operating expenses. Other factors that may adversely affect REITs include poor performance by management of the REIT, changes to the tax laws, or failure by the REIT to qualify for favorable tax treatment. REITs are also subject to default by borrowers and self-liquidation, and are heavily dependent on cash flow. Some REITs lack diversification because they invest in a limited number of properties, a narrow geographic area, or a single type of property. Mortgage REITs may be impacted by the quality of the credit extended.
Repurchase Agreements Risk
The Fund may enter into repurchase agreements, in which the Fund purchases a security from a bank or broker-dealer, which agrees to repurchase the security at the Fund’s cost plus interest within a specified time. If the party agreeing to repurchase should default, the Fund would seek to sell the securities which it holds. This could involve procedural costs or delays in addition to a loss on the securities if their value should fall below their repurchase price. Repurchase agreements may be or become illiquid. These events could also trigger adverse tax consequences for the Fund.
Risk Retention Investment Risk
The Fund may invest in risk retention tranches of commercial mortgage-backed securities (“CMBS”) or other eligible securitizations, if any (“risk retention tranches”), which are eligible residual interests
held by the sponsors of such securitizations pursuant to the final rules implementing the credit risk retention requirements of Section 941 of the Dodd-Frank Act (the “U.S. Risk Retention Rules”). In the case of CMBS transactions, for example, the U.S. Risk Retention Rules permit all or a portion of the retained credit risk associated with certain securitizations (i.e., retained risk) to be held by an unaffiliated “third party purchaser,” such as the Fund, if, among other requirements, the third-party purchaser holds its retained interest, unhedged, for at least five years following the closing of the CMBS transaction, after which it is entitled to transfer its interest in the securitization to another person that meets the requirements for a third-party purchaser. Even after the required holding period has expired, due to the generally illiquid nature of such investments, no assurance can be given as to what, if any, exit strategies will ultimately be available for any given position.
In addition, there is limited guidance on the application of the final U.S. Risk Retention Rules to specific securitization structures. There can be no assurance that the applicable federal agencies charged with the implementation of the final U.S. Risk Retention Rules (the Federal Deposit Insurance Corporation, the Comptroller of the Currency, the Federal Reserve Board, the SEC, the Department of Housing and Urban Development, and the Federal Housing Finance Agency) could not take positions in the future that differ from the interpretation of such rules taken or embodied in such securitizations, or that the final U.S. Risk Retention Rules will not change.
Furthermore, in situations where the Fund invests in risk retention tranches of securitizations structured by third parties, the Fund may be required to execute one or more letters or other agreements, the exact form and nature of which will vary (each, a “Risk Retention Agreement”) under which it will make certain undertakings designed to ensure such securitization complies with the final U.S. Risk Retention Rules. Such Risk Retention Agreements may include a variety of representations, warranties, covenants and other indemnities, each of which may run to various transaction parties. If the Fund breaches any undertakings in any Risk Retention Agreement, it will be exposed to claims by the other parties thereto, including for any losses incurred as a result of such breach, which could be significant and exceed the value of the Fund’s investments.
For the purpose of achieving income, the Fund may lend its portfolio securities to brokers, dealers, and other financial institutions provided a number of conditions are satisfied, including that the loan is fully collateralized. When the Fund lends portfolio securities, its investment performance will continue to reflect changes in the value of the securities loaned, and the Fund will also receive a fee or interest on the collateral. Securities lending involves the risk of loss of rights in the collateral or delay in recovery of the collateral if the borrower fails to
| | | | |
Principal Risks of the Funds | | | | |
return the security loaned or becomes insolvent. The Fund may pay lending fees to a party arranging the loan. Cash collateral received by the Fund in securities lending transactions may be invested in short-term liquid fixed income instruments or in money market or short-term mutual funds, or similar investment vehicles, including affiliated money market or short-term mutual funds. The Fund bears the risk of such investments.
Segregation and Coverage Risk
Certain portfolio management techniques, such as, among other things, entering into reverse repurchase agreement transactions, swap agreements, futures contracts or other derivative transactions, purchasing securities on a when-issued or delayed delivery basis or engaging in short sales may be considered senior securities unless steps are taken to segregate the Fund’s assets or otherwise cover its obligations. To avoid having these instruments considered senior securities, the Fund may segregate liquid assets with a value equal (on a daily
basis) to its obligations under these types of leveraged transactions, enter into offsetting transactions or otherwise cover such transactions. At times, all or a substantial portion of the Fund’s liquid assets may be segregated for purposes of various portfolio transactions. The Fund may be unable to use such segregated assets for certain other purposes, which could result in the Fund earning a lower return on its portfolio than it might otherwise earn if it did not have to segregate those assets in respect of, or otherwise cover, such portfolio positions. To the extent the Fund’s assets are segregated or committed as cover, it could limit the Fund’s investment flexibility. Segregating assets and covering positions will not limit or offset losses on related positions. Except as otherwise described in the principal investment strategies for the Fund, the Fund will no longer be required to engage in asset segregation or cover techniques as of August 19, 2022.
The Fund may be subject to greater levels of credit risk than funds that do not invest in below investment grade senior debt. The Fund may also be subject to greater levels of liquidity risk than funds that do not invest in senior debt. Restrictions on transfers in loan agreements, a lack of publicly available information and other factors may, in certain instances, make senior debt more difficult to sell at an advantageous time or price than other types of securities or instruments. Additionally, if the issuer of senior debt prepays, the Fund will have to consider reinvesting the proceeds in other senior debt or similar instruments that may pay lower interest rates.
The Fund’s short sales, if any, are subject to special risks. A short sale involves the sale by the Fund of a security that it does not own with the hope of purchasing the same security at a later date at a lower price. The Fund may also enter into a short position through a forward
commitment or a short derivative position through a futures contract or swap agreement. If the price of the security or derivative has increased during this time, then the Fund will incur a loss equal to the increase in price from the time that the short sale was entered into plus any transaction costs (i.e., premiums and interest) paid to the broker-dealer to borrow securities. Therefore, short sales involve the risk that losses may be exaggerated, potentially losing more money than the actual cost of the investment. By contrast, a loss on a long position arises from decreases in the value of the security and is limited by the fact that a security’s value cannot decrease below zero.
By investing the proceeds received from selling securities short, the Fund could be deemed to be employing a form of leverage, which creates special risks. The use of leverage may increase the Fund’s exposure to long security positions and make any change in the Fund’s NAV greater than it would be without the use of leverage. This could result in increased volatility of returns. There is no guarantee that any leveraging strategy the Fund employs will be successful during any period in which it is employed.
In times of unusual or adverse market, economic, regulatory or political conditions, the Fund may not be able, fully or partially, to implement its short selling strategy. Periods of unusual or adverse market, economic, regulatory or political conditions generally may exist for long periods of time. Also, there is the risk that the third party to the short sale will not fulfill its contractual obligations, causing a loss to the Fund.
Special Purpose Acquisition Companies (“SPACs”) Risk
The Fund may invest in securities of SPACs or similar special purpose entities that pool funds to seek potential acquisition opportunities. Unless and until an acquisition is completed, a SPAC generally invests its assets (less a portion retained to cover expenses) in US government securities, money market securities or holds cash; if an acquisition that meets the requirements for the SPAC is not completed within a
pre-established
period of time, the invested funds are returned to the entity’s shareholders. Because SPACs and similar entities are in essence blank check companies without operating history or ongoing business other than seeking acquisitions, the value of their securities is particularly dependent on the ability of the entity’s management to identify and complete a profitable acquisition. A SPAC’s structure may result in significant dilution of a stockholder’s share value immediately upon the completion of a business combination due to, among other reasons, interests held by the SPAC sponsor, conversion of warrants into additional shares, shares issued in connection with a business combination and/or certain embedded costs. There is no guarantee that the SPACs in which the Fund invests will complete an acquisition or that any acquisitions that are completed will be profitable. Some SPACs may pursue acquisitions only within certain industries or regions, which may increase the volatility of their prices. In addition,
these securities, which are typically traded in the
market, may be considered illiquid and/or be subject to restrictions on resale.
The general risks associated with debt instruments or equity securities are particularly pronounced for securities issued by companies with small market capitalizations. Small capitalization companies involve certain special risks. They are more likely than larger companies to have limited product lines, markets or financial resources, or to depend on a small, inexperienced management group. Securities of smaller companies may trade less frequently and in lesser volume than more widely held securities and their values may fluctuate more sharply than other securities. They may also have limited liquidity. These securities may therefore be more vulnerable to adverse developments than securities of larger companies, and the Fund may have difficulty purchasing or selling securities positions in smaller companies at prevailing market prices. Also, there may be less publicly available information about smaller companies or less market interest in their securities as compared to larger companies. Companies with
medium-sized
market capitalizations may have risks similar to those of smaller companies.
In addition to the other risks applicable to debt investments, sovereign debt may decline in value as a result of default or other adverse credit event resulting from an issuer’s inability or unwillingness to make principal or interest payments in a timely fashion. A sovereign entity’s failure to make timely payments on its debt can result from many factors, including, without limitation, insufficient foreign
(non-U.S.)
currency reserves or an inability to sufficiently manage fluctuations in relative currency valuations, an inability or unwillingness to satisfy the demands of creditors and/or relevant supranational entities regarding debt service or economic reforms, the size of the debt burden relative to economic output and tax revenues, cash flow difficulties, and other political and social considerations. The risk of loss to the Fund in the event of a sovereign debt default or other adverse credit event is heightened by the unlikelihood of any formal recourse or means to enforce its rights as a holder of the sovereign debt. In addition, sovereign debt restructurings, which may be shaped by entities and factors beyond the Fund’s control, may result in a loss in value of the Fund’s sovereign debt holdings.
Structured Investments Risk
Holders of structured products, including structured notes, credit-linked notes and other types of structured products, bear the risks of the underlying investments, index or reference obligation and are subject to counterparty risk. The Fund may have the right to receive payments only from the structured product, and generally does not
have direct rights against the issuer or the entity that sold the assets to be securitized. While certain structured products enable the investor to acquire interests in a pool of securities without the brokerage and other expenses associated with directly holding the same securities, investors in structured products generally pay their share of the structured product’s administrative and other expenses. Although it is difficult to predict whether the prices of indices and securities underlying structured products will rise or fall, these prices (and, therefore, the prices of structured products) are generally influenced by the same types of political and economic events that affect issuers of securities and capital markets generally. If the issuer of a structured product uses shorter term financing to purchase longer term securities, the issuer may be forced to sell its securities at below market prices if it experiences difficulty in obtaining such financing, which may adversely affect the value of the structured products owned by the Fund. Structured products generally entail risks associated with derivative instruments.
Loans, and debt instruments collateralized by loans (including Alt Lending ABS), acquired by the Fund may be subprime in quality, or may become subprime in quality. Although there is no specific legal or market definition of “subprime,” subprime loans are generally understood to refer to loans made to borrowers that display poor credit histories and other characteristics that correlate with a higher default risk. Accordingly, subprime loans, and debt instruments secured by such loans (including Alt Lending ABS), have speculative characteristics and are subject to heightened risks, including the risk of nonpayment of interest or repayment of principal, and the risks associated with investments in high yield securities. In addition, these instruments could be subject to increased regulatory scrutiny. The Fund is not restricted by any particular borrower credit criteria when acquiring loans or debt instruments collateralized by loans.
To the extent the Fund invests through one or more of its subsidiaries, the Fund would be exposed to the risks associated with such subsidiary’s investments. Such subsidiaries would likely not be registered as investment companies under the Act and therefore would not be subject to all of the investor protections of the Act. Changes in the laws of the United States and/or the jurisdiction in which a subsidiary is organized could result in the inability of the Fund and/or the subsidiary to operate as intended and could adversely affect the Fund.
Synthetic Convertible Securities Risk
The values of synthetic convertible securities will respond differently to market fluctuations than a traditional convertible security because a synthetic convertible is composed of two or more separate securities or
| | | | |
Principal Risks of the Funds | | | | |
instruments, each with its own market value. Synthetic convertible securities are also subject to the risks associated with derivatives. In addition, if the value of the underlying common stock or the level of the index involved in the convertible element falls below the strike price of the warrant or option, the warrant or option may lose all value.
The Fund has elected to be treated as a “regulated investment company” (a “RIC”) under the Code and intends each year to qualify and be eligible to be treated as such, so that it generally will not be subject to U.S. federal income tax on its net investment income or net short-term or long-term capital gains, that are distributed (or deemed distributed, as described below) to shareholders. In order to qualify and be eligible for such treatment, the Fund must meet certain asset diversification tests, derive at least 90% of its gross income for such year from certain types of qualifying income, and distribute to its shareholders at least 90% of its “investment company taxable income” as that term is defined in the Code (which includes, among other things, dividends, taxable interest and the excess of any net short-term capital gains over net long-term capital losses, as reduced by certain deductible expenses).
The Fund’s investment strategy will potentially be limited by its intention to continue qualifying for treatment as a RIC and can limit the Fund’s ability to continue qualifying as such. The tax treatment of certain of the Fund’s investments under one or more of the qualification or distribution tests applicable to regulated investment companies is uncertain. An adverse determination or future guidance by the IRS or a change in law might affect the Fund’s ability to qualify or be eligible for such treatment.
If, in any year, the Fund were to fail to qualify for treatment as a RIC under the Code and were ineligible to or did not otherwise cure such failure, the Fund would be subject to tax on its taxable income at corporate rates and, when such income is distributed, shareholders would be subject to further tax on such distributions to the extent of the Fund’s current or accumulated earnings and profits.
U.S. Government Securities Risk
Certain U.S. Government Securities such as U.S. Treasury bills, notes and bonds and mortgage-related securities guaranteed by the GNMA, are supported by the full faith and credit of the United States; others, such as those of Federal Home Loan Banks (“FHLBs”) or the Federal Home Loan Mortgage Corporation (“FHLMC”), are supported by the right of the issuer to borrow from the U.S. Treasury; others, such as those of the FNMA, are supported by the discretionary authority of the U.S. Government to purchase the agency’s obligations; and still others are supported only by the credit of the agency, instrumentality or corporation. Although legislation has been enacted to support certain government sponsored entities, including the FHLBs, FHLMC and
FNMA, there is no assurance that the obligations of such entities will be satisfied in full, or that such obligations will not decrease in value or default. It is difficult, if not impossible, to predict the future political, regulatory or economic changes that could impact the government sponsored entities and the values of their related securities or obligations. In addition, certain governmental entities, including FNMA and FHLMC, have been subject to regulatory scrutiny regarding their accounting policies and practices and other concerns that may result in legislation, changes in regulatory oversight and/or other consequences that could adversely affect the credit quality, availability or investment character of securities issued by these entities. Yields available from U.S. Government debt securities are generally lower than the yields available from such other securities. The values of U.S. Government Securities change as interest rates fluctuate.
Certain securities in which the Fund invests may be less liquid and more difficult to value than other types of securities. When market quotations or pricing service prices are not readily available or are deemed to be unreliable, the Fund values its investments at fair value as determined in good faith pursuant to policies and procedures approved by the Board. Fair value pricing may require subjective determinations about the value of a security or other asset. As a result, there can be no assurance that fair value pricing will result in adjustments to the prices of securities or other assets or that fair value pricing will reflect actual market value, and it is possible that the fair value determined for a security or other asset will be materially different from quoted or published prices, from the prices used by others for the same security or other asset and/or from the value that actually could be or is realized upon the sale of that security or other asset.
Zero-Coupon Bond,
Step-Ups
and
Securities Risk
The market prices of
zero-coupon,
step-ups
and
securities are generally more volatile than the prices of securities that pay interest periodically and in cash, and are likely to respond to changes in interest rates to a greater degree than other types of debt securities with similar maturities and credit quality. Because
zero-coupon
securities bear no interest, their prices are especially volatile. And because
zero-coupon
bondholders do not receive interest payments, the prices of
zero-coupon
securities generally fall more dramatically than those of bonds that pay interest on a current basis when interest rates rise. The market for
zero-coupon
and
securities may suffer decreased liquidity. In addition, as these securities may not pay cash interest, the Fund’s investment exposure to these securities and their risks, including credit risk, will increase during the time these securities are held in the Fund’s
portfolio. Further, to maintain its qualification for treatment as a RIC and to avoid Fund-level U.S. federal income and/or excise taxes, the Fund is required to distribute to its shareholders any income it is deemed to have received in respect of such investments, notwithstanding that cash has not been received currently, and the value of
interest. Consequently, the Fund may have to dispose of portfolio securities under disadvantageous circumstances to generate the cash, or may have to leverage itself by borrowing the cash to satisfy this distribution requirement. The required distributions, if any, would result in an increase in the Fund’s exposure to these securities. Zero coupon bonds,
step-ups
and
securities allow an issuer to avoid or delay the need to generate cash to meet current interest payments and, as a result, may involve greater credit risk than bonds that pay interest currently or in cash. The Fund would be required to distribute the income on these instruments as it accrues, even though the Fund will not receive the income on a current basis or in cash. Thus, the Fund may sell other investments, including when it may not be advisable to do so, to make income distributions to its shareholders.
| | | | |
Risk Management Strategies 1 | | | | (Unaudited) |
A Fund may (but is not required to) use various investment strategies to attempt to hedge exposure to reduce the risk of price fluctuations of its portfolio securities, the risk of loss, and to preserve capital. Derivatives strategies and instruments that a Fund may use include, among others, reverse repurchase agreements; interest rate swaps; total return swaps; credit default swaps; basis swaps; other types of swap agreements or options thereon; dollar rolls; futures and forward contracts (including foreign currency exchange contracts); short sales; options on financial futures; options based on either an index of municipal securities or taxable debt securities whose prices, PIMCO believes, correlate with the prices of the Fund’s investments; other derivative transactions; loans of portfolio securities and when-issued, delayed delivery and forward commitment transactions. Income earned by a Fund from its hedging and related transactions may be subject to one or more special U.S. federal income tax rules that can affect the amount, timing and/or character of distributions to holders of the Fund’s Common Shares. For instance, many hedging activities will be treated as capital gain and, if not offset by net realized capital loss, will be distributed to shareholders in taxable distributions. If effectively used, hedging strategies will offset in varying percentages losses incurred on a Fund’s investments due to adverse interest rate changes. There is no assurance that these hedging strategies will be available at any time or that PIMCO will determine to use them for a Fund or, if used, that the strategies will be successful. PIMCO may determine not to engage in hedging strategies or to do so only in unusual circumstances or market conditions. In addition, a Fund may be subject to certain restrictions on its use of hedging strategies imposed by guidelines of one or more ratings agencies that may issue ratings on any preferred shares issued by the Fund. A Fund may take certain actions if short-term interest rates increase or market conditions otherwise change (or the Fund anticipates such an increase or change) and the Fund’s leverage begins (or is expected) to adversely affect holders of its Common Shares. In order to attempt to offset such a negative impact of leverage on holders of Common Shares, a Fund may shorten the average maturity or duration of its investment portfolio (by investing in short-term, high quality securities or implementing certain hedging strategies). Should a Fund issue preferred shares, the Fund also may attempt to reduce leverage by redeeming or otherwise purchasing preferred shares or by reducing any holdings in other instruments that create leverage. The success of any such attempt to limit leverage risk depends on PIMCO’s ability to accurately predict interest rate or other market changes. Because of the difficulty of making such predictions, a Fund may not be successful in managing its interest rate exposure in the manner described above. In addition, each Fund has adopted certain investment limitations
designed to limit investment risk. See “Fundamental Investment Restrictions” below for a description of these limitations.
1
Defined terms used and not otherwise defined in this section have the meanings set forth in the Principal Investment Strategies and Principal Risks of the Funds sections.
The following table is furnished in response to requirements of the SEC. It is designed to, among other things, illustrate the effects of leverage through the use of senior securities, as that term is defined under Section 18 of the 1940 Act, on Common Share total return, assuming investment portfolio total returns (consisting of income and changes in the value of investments held in a Fund’s portfolio) of -10%, -5%, 0%, 5% and 10%. Although not senior securities under the 1940 Act, the table below reflects each Fund’s continued use of reverse repurchase agreements averaged over the fiscal year ended June 30, 2022 as a percentage of total average managed assets (including assets attributable to such leverage), the estimated annual effective interest expense rate payable by the Fund on such instruments (based on market conditions as of June 30, 2022, and the annual return that the Fund’s portfolio must experience (net of expenses) in order to cover such costs of the reverse repurchase agreements based on such
estimated annual effective interest expense rate. The information below does not reflect any Fund’s use of certain other forms of economic leverage achieved through the use of other instruments or transactions not considered to be senior securities under the 1940 Act, such as covered credit default swaps or other derivative instruments.
The assumed investment portfolio returns in the table below are hypothetical figures and are not necessarily indicative of the investment portfolio returns experienced or expected to be experienced by the Fund. Your actual returns may be greater or less than those appearing below. In addition, actual borrowing expenses associated with reverse repurchase agreements (or dollar rolls or borrowings, if any) used by the Fund may vary frequently and may be significantly higher or lower than the rate used for the example below.
| | | | | | | | | | | | | | | | | | | | | | | | | | | | |
| | | | | | | | | Global StocksPLUS ® & Income Fund (PGP) | | | PIMCO
Strategic
Income Fund,
Inc. (RCS) | | | PIMCO
Dynamic
Income
Fund (PDI) | | | PIMCO
Dynamic Income
Opportunities
Fund (PDO) | | | PIMCO
Access
Income
Fund (PAXS) | |
| | | | | | | | |
| Reverse Repurchase Agreements as a Percentage of Total average Managed Assets (Including Assets Attributable to Reverse Repurchase Agreements) | | | | | | | 43.66 | % | | | 35.50 | % | | | 44.86 | % | | | 54.93 | % | | | 44.92 | % | | | 15.66 | % |
| | | | | | | | |
| Estimated Annual Effective Interest Expense Rate Payable by Fund on Reverse Repurchase Agreements | | | | | | | 0.84 | % | | | 0.50 | % | | | 0.55 | % | | | 1.64 | % | | | 0.77 | % | | | 1.42 | % |
| | | | | | | | |
| Annual Return Fund Portfolio Must Experience (net of expenses) to Cover Estimated Annual Effective Interest Expense Rate on Reverse Repurchase Agreements | | | | | | | 0.37 | % | | | 0.18 | % | | | 0.25 | % | | | | % | | | 0.35 | % | | | 0.22 | % |
| | | | | | | | |
| Common Share Total Return for (10.00)% Assumed Portfolio Total Return | | | | | | | (18.40 | )% | | | (15.78 | )% | | | (18.58 | )% | | | (24.19 | )% | | | (18.79 | )% | | | (12.12 | )% |
| | | | | | | | |
| Common Share Total Return for (5.00)% Assumed Portfolio Total Return | | | | | | | (9.53 | )% | | | (8.03 | )% | | | (9.52 | )% | | | (13.09 | )% | | | (9.71 | )% | | | (6.19 | )% |
| | | | | | | | |
| Common Share Total Return for 0.00% Assumed Portfolio Total Return | | | | | | | (0.65 | )% | | | (0.27 | )% | | | (0.45 | )% | | | (2.00 | )% | | | (0.63 | )% | | | (0.26 | )% |
| | | | | | | | |
| Common Share Total Return for 5.00% Assumed Portfolio Total Return | | | | | | | 8.22 | % | | | 7.48 | % | | | 8.62 | % | | | 9.10 | % | | | 8.45 | % | | | 5.66 | % |
| | | | | | | | |
| Common Share Total Return for 10.00% Assumed Portfolio Total Return | | | | | | | 17.10 | % | | | 15.23 | % | | | 17.69 | % | | | 20.19 | % | | | 17.53 | % | | | 11.59 | % |
Common Share total return is composed of two elements — the distributions paid by a Fund to holders of Common Shares (the amount of which is largely determined by the net investment income of the Fund after paying dividend payments on any preferred shares issued by the Fund and expenses on any forms of leverage outstanding) and gains or losses on the value of the securities and other instruments the Fund owns. As required by SEC rules, the table assumes that a Fund is more likely to suffer capital losses than to enjoy capital appreciation. For example, to assume a total return of 0%, a Fund must assume that the income it receives on its investments is entirely offset by losses in the value of those investments. This table reflects hypothetical performance of a Fund’s portfolio and not the actual performance of the Fund’s Common Shares, the value of which is determined by market forces and other factors.
Should a Fund elect to add additional leverage to its portfolio, any benefits of such additional leverage cannot be fully achieved until the proceeds resulting from the use of such leverage have been received by the Fund and invested in accordance with the Fund’s investment objectives and policies. As noted above, a Fund’s willingness to use additional leverage, and the extent to which leverage is used at any time, will depend on many factors, including, among other things, PIMCO’s assessment of the yield curve environment, interest rate trends, market conditions and other factors.
1
Defined terms used and not otherwise defined in this section have the meanings set forth in the Principal Investment Strategies and Principal Risks of the Funds sections.
Fundamental Investment Restrictions 1 | | | | |
The Fund’s investment objectives and the following investment restrictions are fundamental policies, and, except as described below, the Fund may not, without the approval of the holders of a majority of the Fund’s outstanding Common Shares and, if issued, preferred shares voting together as a single class, and of the holders of a majority of the outstanding preferred shares voting as a separate class, change its investment objectives or:
| Issue senior securities (including borrowing money for other than temporary purposes) in excess of the limits set forth in the 1940 Act; or pledge its assets other than to secure such issuances or borrowings or in connection with permitted transactions involving derivative instruments, when-issued and forward commitment transactions and other permitted investment strategies. |
| Make investments for the purpose of exercising control or management. |
| Purchase or sell real estate, commodities or commodity contracts; provided that the Fund may invest in securities secured by real estate or interests therein or issued by companies that invest in real estate or interests therein, and the Fund may purchase and sell financial futures contracts and options thereon and other derivative instruments. |
| Underwrite securities of other issuers except insofar as the Fund may be deemed an underwriter under the Securities Act of 1933 in selling portfolio securities. |
| Make loans to other persons, except (i) to the extent that the Fund may be deemed to be making loans by purchasing debt securities and entering into repurchase agreements in accordance with its investment objectives, policies and limitations and (ii) the Fund may lend its portfolio securities. |
| Purchase any securities on margin, except that the Fund may obtain such short-term credit as may be necessary for the clearance of purchases and sales of portfolio securities, and may make margin deposits in connection with the entry into of positions in financial future contracts and options thereon and other derivative instruments. |
| Make short sales of securities in a manner inconsistent with the 1940 Act, as it may be interpreted from time to time, or in excess of 25% of the value of the Fund’s total assets. |
In addition, as a matter of fundamental policy:
| The Fund, under normal circumstances, will invest at least 25% of its total assets (i.e. concentrate) in privately-issued mortgage-related securities not issued or guaranteed as to principal or interest by the U.S. Government or its agencies or instrumentalities. The Fund may not purchase any security if as a result 25% or more of |
| | the Fund’s total assets (taken at current value at the time of investment) (i.e. concentrate) would be invested in a single industry (for purposes of this restriction, investment companies are not considered to be part of any industry). |
In addition, the Fund will not, with respect to 75% of its total assets, purchase the securities of any issuer, except securities issued or guaranteed by the U.S. Government or any of its agencies or instrumentalities or securities issued by other investment companies, if, as a result, (i) more than 5% of the Fund’s total assets would be invested in the securities of that issuer, or (ii) the Fund would hold more than 10% of the outstanding voting securities of that issuer.
PIMCO Global StocksPLUS
& Income Fund
Except as described below, the Fund, as a fundamental policy, may not, without the approval of the holders of a majority of the outstanding Common Shares, voting together as a single class:
| Concentrate its investments in a particular “industry,” as that term is used in the 1940 Act, as interpreted, modified or otherwise permitted from time to time by regulatory authority having jurisdiction. |
| Purchase or sell real estate, although it may purchase securities secured by real estate or interests therein, or securities issued by companies that invest in real estate, or interests therein. |
| Purchase or sell commodities or commodities contracts or oil, gas or mineral programs. This restriction shall not prohibit the Fund, subject to certain restrictions, from purchasing, selling or entering into futures contracts, options on futures contracts, forward contracts, or any interest rate, securities-related or other derivative instrument, including swap agreements and other derivative instruments, subject to compliance with any applicable provisions of the federal securities or commodities laws. |
| Borrow money or issue any senior security, except to the extent permitted under the 1940 Act, as interpreted, modified or otherwise permitted from time to time by regulatory authority having jurisdiction. |
| Make loans, except to the extent permitted under the 1940 Act, as interpreted, modified or otherwise permitted from time to time by regulatory authority having jurisdiction. |
| Act as an underwriter of securities of other issuers, except to the extent that in connection with the disposition of portfolio securities, it may be deemed to be an underwriter under the federal securities laws. |
In addition, the Fund will not, with respect to 75% of its total assets, purchase the securities of any issuer, except securities issued or guaranteed by the U.S. Government or any of its agencies or
instrumentalities or securities issued by other investment companies, if, as a result, (i) more than 5% of the Fund’s total assets would be invested in the securities of that issuer, or (ii) the Fund would hold more than 10% of the outstanding voting securities of that issuer.
PIMCO Strategic Income Fund, Inc.
Except as described below, the Fund, as a fundamental policy, may not, without the approval of the holders of a majority of the outstanding Common Shares, voting together as a single class:
| (1) | Purchase securities on margin, except that the Fund may obtain any short-term credits necessary for the clearance of purchases and sales of securities. For purposes of this restriction, the deposit or payment of initial or variation margin in connection with futures contracts or related options will not be deemed to be a purchase of securities on margin. |
| (2) | Borrow money, except that the Fund may engage in reverse repurchase agreements and dollar roll transactions and may borrow in an amount not exceeding 33 1/3% of the value of the Fund’s total assets (including the amount borrowed) valued at market, less liabilities (not including the amount borrowed) at the time the borrowing is made, and may use the proceeds of such borrowing for investment purposes. In addition, the Fund may borrow money for temporary or emergency purposes in an amount not exceeding 5% of the value of the Fund’s total assets (not including the amount borrowed) provided that the total amount borrowed by the Fund for any purpose does not exceed 33 1/3% of its total assets. |
| (3) | Pledge, hypothecate, mortgage, or otherwise encumber its assets except to secure borrowings and as margin or collateral for financial futures, swaps and other negotiable transactions in the market. |
| (4) | Underwrite the securities of other issuers, except insofar as the Fund may be deemed an underwriter in the course of disposing of portfolio securities. |
| (5) | Purchase or sell real estate or interests in real estate, except that the Fund may purchase and sell securities that are secured by real estate or interests in real estate and may purchase securities by companies that invest or deal in real estate. |
| (6) | Invest in commodities, except that the Fund may invest in futures contracts and options thereon, and options on currencies. |
| (7) | Make loans to others, except through the purchase of qualified debt obligations, the entry into repurchase agreements and loans of portfolio securities consistent with the Fund’s investment objectives and policies. |
| (8) | Invest in securities of other investment companies registered or required to be registered under the Investment Company Act of |
| | 1940, as amended (the “1940 Act”), except as they may be acquired as part of a merger, consolidation, reorganization, acquisition of assets or an offer of exchange, or to the extent permitted by the 1940 Act. |
| (9) | Purchase any securities which would cause more than 25% of the value of the Fund’s total assets at the time of purchase to be invested in the securities of issuers conducting their principal securities business activities in the same industry; provided that there shall be no limit on the purchase of U.S. government securities, including securities issued by any agency or instrumentality of the U.S. government, and related repurchase agreements. |
In addition, the Fund will not, with respect to 75% of its total assets, purchase the securities of any issuer, except securities issued or guaranteed by the U.S. Government or any of its agencies or instrumentalities or securities issued by other investment companies, if, as a result, (i) more than 5% of the Fund’s total assets would be invested in the securities of that issuer, or (ii) the Fund would hold more than 10% of the outstanding voting securities of that issuer.
PIMCO Dynamic Income Fund
The investment restrictions set forth below are each a fundamental policy of the Fund that may not be changed without the approval of the holders of a majority of the outstanding Common Shares and any outstanding preferred shares of beneficial interest voting together as a single class, and of the holders of a majority of any outstanding preferred shares of beneficial interest voting as a separate class. The Fund may not:
| (1) | Purchase any security if as a result 25% or more of the Fund’s total assets (taken at current value at the time of investment) would be invested in a single industry (for purposes of this restriction, investment companies are not considered to be part of any industry). As a fundamental policy, the Fund, under normal circumstances, will invest at least 25% of its total assets in mortgage-related securities not issued or guaranteed as to principal or interest by the U.S. Government or its agencies or instrumentalities and other investments that the Fund’s investment adviser or sub-adviser determines have the same primary economic characteristics. |
| (2) | Purchase or sell real estate, although it may purchase securities secured by real estate or interests therein, or securities issued by companies that invest in real estate, or interests therein. |
| (3) | Purchase or sell commodities or commodities contracts or oil, gas or mineral programs. This restriction shall not prohibit the Fund, subject to certain restrictions, from purchasing, selling or entering into futures contracts, options on futures contracts, |
| | | | |
Fundamental Investment Restrictions 1 | | | | |
| | forward contracts, or any interest rate, securities-related or other derivative instrument, including swap agreements and other derivative instruments, subject to compliance with any applicable provisions of the federal securities or commodities laws. |
| (4) | Borrow money or issue any senior security, except to the extent permitted under the 1940 Act and as interpreted, modified, or otherwise permitted from time to time by regulatory authority having jurisdiction. |
| (5) | Make loans, except to the extent permitted under the Investment Company Act of 1940, as amended, and as interpreted, modified, or otherwise permitted by regulatory authority having jurisdiction. |
| (6) | Act as an underwriter of securities of other issuers, except to the extent that in connection with the disposition of portfolio securities, it may be deemed to be an underwriter under the federal securities laws. |
In addition, the Fund will not, with respect to 75% of its total assets, purchase the securities of any issuer, except securities issued or guaranteed by the U.S. Government or any of its agencies or instrumentalities or securities issued by other investment companies, if, as a result, (i) more than 5% of the Fund’s total assets would be invested in the securities of that issuer, or (ii) the Fund would hold more than 10% of the outstanding voting securities of that issuer.
PIMCO Dynamic Income Opportunities Fund
The investment restrictions set forth below are each a fundamental policy of the Fund that may not, be changed without the approval of the holders of a majority of the Fund’s outstanding Common Shares and, if issued, preferred shares voting together as a single class, and of the holders of a majority of the outstanding preferred shares voting as a separate class. The Fund may not:
| (1) | Except for mortgage-related assets as described in the next sentence, purchase any security if as a result 25% or more of the Fund’s total assets (taken at current value at the time of investment) would be invested in a single industry (for purposes of this restriction, investment companies are not considered to be part of any industry). As a fundamental policy, the Fund will normally invest at least 25% of its total assets (i.e., concentrate) in mortgage-related assets issued by government agencies or other governmental entities or by private originators or issuers, which for purposes of this investment restriction the Fund treats collectively as an industry or group of related industries. |
| (2) | Purchase or sell real estate, except to the extent permitted under the 1940 Act, as interpreted, modified, or otherwise permitted from time to time by regulatory authority having jurisdiction. |
| (3) | Purchase or sell commodities or commodities contracts or oil, gas or mineral programs, except to the extent permitted under the 1940 Act, as interpreted, modified, or otherwise permitted from time to time by regulatory authority having jurisdiction. This restriction shall not prohibit the Fund from purchasing, selling or entering into futures contracts, options on futures contracts, forward contracts, or any interest rate, securities-related or other derivative instrument, including swap agreements and other derivative instruments, subject to compliance with any applicable provisions of the federal securities or commodities laws. |
| (4) | Borrow money or issue any senior security, except to the extent permitted under the 1940 Act, as interpreted, modified, or otherwise permitted from time to time by regulatory authority having jurisdiction. |
| (5) | Make loans, except to the extent permitted under the 1940 Act, as interpreted, modified, or otherwise permitted from time to time by regulatory authority having jurisdiction. |
| (6) | Act as an underwriter of securities of other issuers, except to the extent that in connection with the disposition of portfolio securities, it may be deemed to be an underwriter under the federal securities laws. |
PIMCO Access Income Fund
The investment restrictions set forth below are each a fundamental policy of the Fund that may not be changed without the approval of the holders of a majority of the Fund’s outstanding Common Shares and, if issued, preferred shares voting together as a single class, and of the holders of a majority of any outstanding preferred shares voting as a separate class. The Fund may not:
| (1) | Except for real estate investments and mortgage-related assets as described in the next sentence, purchase any security if as a result 25% or more of the Fund’s total assets (taken at current value at the time of investment) would be invested in a single industry (for purposes of this restriction, investment companies are not considered to be part of any industry). As a fundamental policy, the Fund will normally invest at least 25% of its total assets ( , concentrate) in real estate investments and mortgage-related assets issued by government agencies or other governmental entities or by private originators or issuers, which for purposes of this investment restriction the Fund treats collectively as an industry or group of related industries. |
| (2) | Purchase or sell real estate, except to the extent permitted under the 1940 Act, as interpreted, modified, or otherwise permitted from time to time by regulatory authority having jurisdiction. |
| (3) | Purchase or sell commodities or commodities contracts or oil, gas or mineral programs, except to the extent permitted under the |
| | 1940 Act, as interpreted, modified, or otherwise permitted from time to time by regulatory authority having jurisdiction. This restriction shall not prohibit the Fund, subject to restrictions described in the Prospectus and elsewhere in this Statement of Additional Information, from purchasing, selling or entering into futures contracts, options on futures contracts, forward contracts, or any interest rate, securities-related or other derivative instrument, including swap agreements and other derivative instruments, subject to compliance with any applicable provisions of the federal securities or commodities laws. |
| (4) | Borrow money or issue any senior security, except to the extent permitted under the 1940 Act, as interpreted, modified, or otherwise permitted from time to time by regulatory authority having jurisdiction. |
| (5) | Make loans, except to the extent permitted under the 1940 Act, as interpreted, modified, or otherwise permitted from time to time by regulatory authority having jurisdiction. |
| (6) | Act as an underwriter of securities of other issuers, except to the extent that in connection with the disposition of portfolio securities, it may be deemed to be an underwriter under the federal securities laws. |
1
References herein to “majority of the outstanding,” when used with respect to particular shares of a Fund (whether voting together as a single class or voting as separate classes), has the meaning set forth in the Investment Company Act of 1940, as amended. Defined terms used and not otherwise defined in this section have the meanings set forth in the Principal Investment Strategies and Principal Risks of the Funds sections.
The chart below identifies Trustees/Directors and Officers of the Funds. Unless otherwise indicated, the address of all persons below is c/o Pacific Investment Management Company LLC, 1633 Broadway, New York, New York 10019.
A list of officers and trustees of PIMCO containing information as to any business, profession, vocation, or employment of a substantial nature engaged in by such officers and directors during the past two years is included in the most recent Form ADV filed by PIMCO pursuant to the Investment Advisers Act of 1940.
A Fund’s Statement of Additional Information, if available, includes more information about the Trustees/Directors and Officers. To request a free copy, call PIMCO at (844)
33-PIMCO.
| | | | | | | | | | |
| | Position(s)
Held
with the
Funds | | Term of
Office and
Length of
Time Served | | Principal Occupation(s)
During the Past 5 Years | | Number
of Portfolios
in Fund
Complex
Overseen by
Trustee/
Director | | Other
Directorships
Held by
Trustee/
Director
During the
Past 5 Years |
|
|
| | | | | |
| | Chair of the Board, Trustee/ Director | | Trustee/Director of PCM, PGP and RCS since 2011, Trustee of PDI since 2012,Trustee of PDO since 2021 and Trustee of PAXS since 2022, expected to stand for re-election at the annual meeting of shareholders held during the 2022-2023 fiscal year for PGP, the 2023-2024 fiscal year for PCM, PDI and RCS and the 2024-2025 fiscal year for PDO. | | Advisory Director, Morgan Stanley & Co., Inc. (since 1996); Member, Circle Financial Group (since 2009); Member, Council on Foreign Relations (since 2013); Trustee, Smith College (since 2017); and Director, Watford Re (since 2017). Formerly, Co-Chair Special Projects Committee, Memorial Sloan Kettering (2005-2015); Trustee, Stanford University (2010- 2015); Principal, LaLoop LLC, a retail accessories company (1999-2014); Director, Helena Rubenstein Foundation (1997-2010); and Director, Armor Holdings (2002-2010). | | 29 | | Trustee, Allianz Funds (2011- 2021); Trustee, Virtus Funds (2021-Present). |
| | | | | |
| | Trustee/Director | | Trustee/Director of PCM, PDI, PGP and RCS since 2019, Trustee of PDO since 2021 and Trustee of PAXS since 2022, expected to stand for re-election at the annual meeting of shareholders held during the 2022-2023 fiscal year for PDO and PGP, the 2023-2024 fiscal year for PDI and the 2024-2025 fiscal year for PCM and RCS. | | Retired Partner, Simpson Thacher & Bartlett LLP (law firm) (1989-2018); Director, Girl Scouts of Greater New York, Inc. (since 2016); and Trustee, Natural Resources Defense Council, Inc. (since 2013). | | 29 | | Trustee, Allianz Funds (2019- 2021); Trustee, Virtus Funds (2021-Present). |
| | | | | |
| | Trustee/Director | | Trustee/Director of PCM, RCS, PGP, and PDI since 2020, Trustee of PDO since 2021 and Trustee of PAXS since 2022, expected to stand for re-election at the annual meeting of shareholders held during the 2022-2023 fiscal year for PDI and RCS, the 2023-2024 fiscal year for PCM and the 2024-2025 fiscal year for PDO and PGP. | | Trustee (since 2019) and Governance Committee Chair (since 2020), Vermont Law School; Director and Treasurer, Center for Reproductive Rights (since 2015). Formerly, Director (2013-2020) and Chair (2018-2020), ACLU of Massachusetts; General Counsel, Grantham, Mayo, Van Otterloo & Co. LLC (2005-2018) and Partner (2007-2018); President, GMO Trust (institutional mutual funds) (2009-2018); Chief Executive Officer, GMO Trust (2009-2015); President and Chief Executive Officer, GMO Series Trust (platform based mutual funds) (2011-2013). | | 29 | | Trustee, GMO Trust (2010-2018); Chairman of the Board of Trustees, GMO Series Trust (2011-2018). |
| | | | | | | | | | |
| | Position(s)
Held
with the
Funds | | Term of
Office and
Length of
Time Served | | Principal Occupation(s)
During the Past 5 Years | | Number
of Portfolios
in Fund
Complex
Overseen by
Trustee/
Director | | Other
Directorships
Held by
Trustee/
Director
During the
Past 5 Years |
| | | | | |
| | Trustee | | Trustee since July 2022, expected to stand for election at the annual meeting of the shareholders held during the 2022-2023 fiscal year. | | President, Smith College (since 2013); Director, Five Colleges, Inc., consortium of liberal arts colleges and universities (since 2013); President, Five Colleges, Inc., (since 2020); Formerly, Director, American Council on Education Board of Directors, (2015-2019); Director, Consortium on Financing Higher Education Board of Directors (2015-2019); Director, edX Board of Directors, online course provider (2012-2013); Director, Bellwether Education Partners Board, national nonprofit organization (2010-2013); Dean, Harvard Graduate School of Education (2006-2013); Trustee, Tufts University (2007-2013). | | 29 | | None |
| | | | | |
| | Trustee/Director | | Trustee/Director of PCM and RCS since 2008, Trustee of PGP since 2006, Trustee of PDI since 2012, Trustee of PDO since 2021 and Trustee of PAXS since 2022, expected to stand for re-election at the annual meeting of shareholders held during the 2022-2023 fiscal year for PCM, the 2023-2024 fiscal year for PDO and PGP and the 2024-2025 fiscal year for PDI and RCS. | | Retired. Formerly, Asset Management Industry Consultant; and Managing Director, Investment Banking Division of Citigroup Global Markets Inc. | | 29 | | Trustee, Allianz Funds (2006- 2021); Trustee, Virtus AllianzGI Closed-End Funds (2021-Present). |
| | | | | |
| | Trustee/Director | | Trustee/Director of RCS, PCM and PGP since 2012, Trustee of PDI since 2012, Trustee of PDO since 2021 and Trustee of PAXS since 2022, expected to stand for re-election at the annual meeting of shareholders held during the 2022-2023 fiscal year for PGP, the 2023-2024 fiscal year for PCM, PDO and RCS and the 2024-2025 fiscal year for PDI. | | Director, Victory Capital Holdings, Inc., an asset management firm (since 2013). Formerly, Adjunct Professor, New York University Stern School of Business (2011-2020); Lecturer, Stanford University Graduate School of Business (2013-2020); Advisory Director (formerly Vice Chairman), Roundtable Investment Partners (2009-2018); Member of Board of Overseers, NYU Langone Medical Center (2015-2016); Trustee, American Museum of Natural History (2005-2015); Trustee, NYU Langone Medical Center (2007-2015); and Vice Chairman (formerly, Chairman and President), U.S. Trust (formerly, Private Bank of Bank of America, the predecessor entity of U.S. Trust) (2001-2008). | | 29 | | Trustee, Allianz Funds (2010- 2021); Trustee, Virtus AllianzGI Closed-End Funds (2021-Present). |
| | | | | |
| | Trustee/Director | | Trustee/Director of PCM, PDI, PDO, PGP and RCS since 2021 and Trustee of PAXS since 2022, expected to stand for re-election at the annual meeting of shareholders held during the 2022-2023 fiscal year for PDI, PDO and RCS and the 2024-2025 fiscal year for PCM and PGP. | | Founder and Managing Director, Grace Global Capital LLC, a strategic advisory firm to the insurance industry (since 2006); Director, The Doctors Company, a medical malpractice insurance company (since 2020); Chief Financial Officer, Athena Technology Acquisition Corp, a special purpose acquisition company (since 2021); Director, Link Logistic REIT, a real estate company (since 2021); Director and Member of the Investment & Risk Committee, Resolution Life Group Holdings, a global life insurance group (since 2021); and Director, Wharton Graduate Executive Board. Formerly, Director, Resolution Holdings (2015-2019). Formerly, Director and Member of the Audit Committee and the Wealth Solutions Advisory Committee, M Financial Group, a life insurance company (2015-2021); Director, SBLI USA, a life insurance company (2015-2018). | | 29 | | None |
| | | | | | | | | | |
| | Position(s)
Held
with the
Funds | | Term of
Office and
Length of
Time Served | | Principal Occupation(s)
During the Past 5 Years | | Number
of Portfolios
in Fund
Complex
Overseen by
Trustee/
Director | | Other
Directorships
Held by
Trustee/
Director
During the
Past 5 Years |
|
|
| | | | | |
| | Trustee/Director | | Trustee/Director of PCM, PDI, PGP and RCS since 2019, Trustee of PDO since 2021 and Trustee of PAXS since 2022, expected to stand for re-election at the annual meeting of shareholders held during the 2022-2023 fiscal year for PCM and PDI, the 2023-2024 fiscal year for PGP and RCS and the 2024-2025 fiscal year for PDO. | | Managing Director and Co-Head of U.S. Global Wealth Management Strategic Accounts, PIMCO (since 2021); Managing Director and Head of Traditional Product Strategies, PIMCO (2015-2021); and Director, Court Appointed Special Advocates (CASA) of Orange County, a non-profit organization (since 2015). Formerly, Global Bond Strategist, PIMCO (2008-2015); and Managing Director and Head of Global Fixed Income, HSBC Global Asset Management (2005-2008). | | 29 | | None |
| | | | | |
| | Trustee/Director | | Trustee of PGP since 2006, Director of RCS and PCM since 2008, Trustee of PDI since 2012, Trustee of PDO since 2021 and Trustee of PAXS since 2022, expected to stand for re-election at the annual meeting of shareholders held during the 2023-2024 fiscal year for PDO and the 2024-2025 fiscal year for PCM, PDI, PGP and RCS. | | Senior Advisor to PIMCO (since June 2021); Non-Executive Director and a member of the Compensation Committee of PIMCO Europe Ltd (since December 2017). Formerly, Consultant to PIMCO (January 2020-June 2021); Managing Director of Allianz Asset Management of America L.P. (2005-2019); member of the Management Board and Chief Operating Officer of Allianz Asset Management of America L.P (2006-2019); Member of the Management Board of Allianz Global Investors Fund Management LLC (2007-2014) and Managing Director of Allianz Global Investors Fund Management LLC (2011-2014). | | 29 | | None |
| * | The Trustee/Director is an “interested person” of the Fund, as defined in Section 2(a)(19) of the 1940 Act, due to their affiliations with PIMCO and its affiliates. |
| ** | Messrs. Fisher’s and Maney’s address is 650 Newport Center Drive, Newport Beach, California 92660. |
| | | | | | |
Name, Address and Year
of Birth | | Position(s) Held with Funds | | Term of
Office and
Length of | | Principal Occupation(s) During the Past 5 Years |
| | | |
| | President | | Since 2019 | | Executive Vice President and Head of Funds Business Group Americas, PIMCO. President, PIMCO-Managed Funds, PIMCO Funds, PIMCO Variable Insurance Trust, PIMCO ETF Trust, PIMCO Equity Series and PIMCO Equity Series VIT. |
| | | |
| | Chief Compliance Officer | | Since 2018 | | Executive Vice President and Deputy Chief Compliance Officer, PIMCO. Chief Compliance Officer, PIMCO-Managed Funds, PIMCO Funds, PIMCO Variable Insurance Trust, PIMCO ETF Trust, PIMCO Equity Series and PIMCO Equity Series VIT. |
| | | |
| | Chief Legal Officer | | Since 2019 | | Executive Vice President and Senior Counsel, PIMCO. Chief Legal Officer, PIMCO-Managed Funds. Chief Legal Officer and Secretary, PIMCO Funds, PIMCO Variable Insurance Trust, PIMCO ETF Trust, PIMCO Equity Series and PIMCO Equity Series VIT. Formerly, Associate, Willkie Farr & Gallagher LLP. |
| | | |
| | Senior Vice President | | Since 2019 | | Executive Vice President and Head of Americas Operations, PIMCO. Senior Vice President, PIMCO-Managed Funds, PIMCO Funds, PIMCO Variable Insurance Trust, PIMCO ETF Trust, PIMCO Equity Series and PIMCO Equity Series VIT. |
| | | |
| | Senior Vice President | | Since 2019 | | Managing Director and Co-Chief Operating Officer, PIMCO. Senior Vice President, PIMCO-Managed Funds, PIMCO Funds, PIMCO Variable Insurance Trust, PIMCO ETF Trust, PIMCO Equity Series and PIMCO Equity Series VIT. Formerly, Chief Administrative Officer, PIMCO. |
| | | |
| | Vice President, Senior Counsel and Secretary | | Since 2018 | | Senior Vice President and Senior Counsel, PIMCO. Vice President, Senior Counsel and Secretary, PIMCO-Managed Funds. Assistant Secretary, PIMCO Funds, PIMCO Variable Insurance Trust, PIMCO ETF Trust, PIMCO Equity Series and PIMCO Equity Series VIT. Formerly, Assistant General Counsel, VanEck Associates Corp. |
| | | | | | |
Name, Address and Year
of Birth | | Position(s) Held with Funds | | Term of
Office and
Length of | | Principal Occupation(s) During the Past 5 Years |
| | | |
| | Vice President | | Since August 2022 | | Senior Vice President, PIMCO. Vice President, PIMCO-Managed Funds, PIMCO Funds, PIMCO Variable Insurance Trust, PIMCO ETF Trust, PIMCO Equity Series and PIMCO Equity Series VIT. |
| | | |
| | Vice President | | Since 2020 | | Executive Vice President, PIMCO. Vice President, PIMCO-Managed Funds, PIMCO Funds, PIMCO Variable Insurance Trust, PIMCO ETF Trust, PIMCO Equity Series and PIMCO Equity Series VIT. |
| | | |
| | Vice President | | Since March 2021 | | Executive Vice President, PIMCO. Vice President, PIMCO-Managed Funds, PIMCO Funds, PIMCO Variable Insurance Trust, PIMCO ETF Trust, PIMCO Equity Series and PIMCO Equity Series VIT. |
| | | |
| | Vice President | | Since 2021 | | Senior Vice President, PIMCO. Vice President, PIMCO-Managed Funds, PIMCO Funds, PIMCO Variable Insurance Trust, PIMCO ETF Trust, PIMCO Equity Series and PIMCO Equity Series VIT. |
| | | |
| | Vice President | | Since August 2022 | | Senior Vice President, PIMCO. Vice President, PIMCO-Managed Funds, PIMCO Funds, PIMCO Variable Insurance Trust, PIMCO ETF Trust, PIMCO Equity Series and PIMCO Equity Series VIT. |
| | | |
| | Vice President | | Since 2020 | | Senior Vice President, PIMCO. Vice President, PIMCO-Managed Funds, PIMCO Funds, PIMCO Variable Insurance Trust, PIMCO ETF Trust, PIMCO Equity Series and PIMCO Equity Series VIT. |
| | | |
| | Vice President | | Since June 2022 | | Executive Vice President, PIMCO. Vice President, PIMCO-Managed Funds, PIMCO Funds, PIMCO Variable Insurance Trust, PIMCO ETF Trust, PIMCO Equity Series and PIMCO Equity Series VIT. |
| | | |
| | Treasurer | | Since 2021 | | Executive Vice President, PIMCO. Treasurer, PIMCO-Managed Funds, PIMCO Funds, PIMCO Variable Insurance Trust, PIMCO ETF Trust, PIMCO Equity Series and PIMCO Equity Series VIT. |
| | | |
| | Deputy Treasurer | | Since March 2022 | | Senior Vice President, PIMCO. Deputy Treasurer, PIMCO-Managed Funds. Assistant Treasurer, PIMCO Funds, PIMCO Variable Insurance Trust, PIMCO ETF Trust, PIMCO Equity Series and PIMCO Equity Series VIT. |
| | | |
| | Assistant Treasurer | | Since 2015 | | Executive Vice President, PIMCO. Assistant Treasurer, PIMCO-Managed Funds, PIMCO Funds, PIMCO Variable Insurance Trust, PIMCO ETF Trust, PIMCO Equity Series and PIMCO Equity Series VIT. |
| The address of these officers is Pacific Investment Management Company LLC, 650 Newport Center Drive, Newport Beach, California 92660. |
| The address of these officers is Pacific Investment Management Company LLC, 401 Congress Ave., Austin, Texas 78701. |
| | | | |
Approval of Investment Management Agreement | | | | |
PCM, PGP, RCS, PDI, PDO
The Investment Company Act of 1940, as amended (the “1940 Act”), requires that the Board of Trustees/Directors (the “Board” or the “Trustees”), including a majority of the Trustees who are not “interested persons,” as that term is defined in the 1940 Act (the “Independent Trustees”), of each of PCM Fund, Inc. (“PCM”), PIMCO Global StocksPLUS & Income Fund (“PGP”), PIMCO Strategic Income Fund, Inc. (“RCS”), PIMCO Dynamic Income Fund (“PDI”) and PIMCO Dynamic Income Opportunities Fund (“PDO”) (each, a “Fund” and, collectively, the “Funds”), voting separately, annually approve the continuation of the Investment Management Agreement between each Fund and Pacific Investment Management Company LLC (“PIMCO”) (each, an “Investment Management Agreement”). At an
in-person
meeting held on June
15-16,
2022 (the “Approval Meeting”), the Board, including the Independent Trustees, considered and unanimously approved the continuation of each Investment Management Agreement for an additional
one-year
period commencing on August 1, 2022. In addition, the Board considered and unanimously approved the continuation of the Investment Management Agreements between PIMCO and each wholly-owned subsidiary of PDI and PDO (each a “Subsidiary” and, together, the “Subsidiaries”) (the “Subsidiary Agreements” and together with each Investment Management Agreement, the “Agreements”), for the same additional
one-year
period.
In addition to the Approval Meeting, the Contracts Committee (the “Committee”) and the Performance Committee of the Board held a joint meeting on May 16, 2022 to discuss materials provided by PIMCO in connection with the Trustees’ review of the Agreements. The annual contract review process also involved multiple discussions and meetings with members of the Committee and the full Committee (the Approval Meeting, together with such discussions and meetings, the “Contract Renewal Meetings”). Throughout the process, the Independent Trustees received legal advice from independent legal counsel that is experienced in 1940 Act matters and independent of PIMCO (“Independent Counsel”), and with whom they met separately from PIMCO during the Contract Renewal Meetings. Representatives from PIMCO attended portions of the Contract Renewal Meetings and responded to questions from the Independent Trustees. The Committee also received and reviewed a memorandum from Independent Counsel regarding the Trustees’ responsibilities in considering each Agreement and the fees paid thereunder.
In connection with their deliberations regarding the proposed continuation of the Agreements, the Board, including the Independent Trustees, considered such information and factors as they believed, in light of the legal advice furnished to them and their own business judgment, to reasonably be necessary to evaluate the terms of the Agreements. The Trustees also considered the nature, quality and
extent of the various investment management, administrative and other services performed by PIMCO under the Agreements.
In evaluating each Agreement, the Board, including the Independent Trustees, reviewed extensive materials provided by PIMCO in response to questions, inclusive of
follow-up
inquiries, submitted by the Independent Trustees and Independent Counsel. The Board also met with senior representatives of PIMCO regarding its personnel, operations, and estimated profitability as they relate to the Funds. The Trustees also considered the broad range of information relevant to the annual contract review that is provided to the Board (including its various standing committees) at meetings throughout the year, including reports on investment performance based on net asset value (“NAV”), market value (both absolute and compared against its Broadridge Performance Universe (as defined below)) and distribution yield, use of leverage (if applicable), information regarding share price premiums and/or discounts, risks, and other portfolio information, including any use of derivatives, as well as periodic reports on, among other matters, pricing and valuation, quality and cost of portfolio trade execution, compliance, and shareholder and other services provided by PIMCO and its affiliates. To assist with their review, the Trustees reviewed summaries prepared by PIMCO that analyzed each Fund based on a number of factors, including fees/expenses, performance, distribution yield, and risk-based factors, as of December 31, 2021. Additionally, the Trustees considered the impact of significant market volatility that occurred before, during, and/or after the period for which information was requested in conducting its evaluation of PIMCO. They also considered, among other information, performance based on NAV and market value, investment objective and strategy, portfolio managers, assets under management, outstanding leverage, share price premium and/or discount information, annual fund operating expenses, total expense ratio and management fee comparisons between each Fund and its Broadridge Expense Group (as defined below), and estimated profitability to PIMCO from its relationship with each Fund. In considering the Broadridge Performance Universe and Broadridge Expense Group (both as defined below), the Trustees requested that PIMCO comment on whether the peer funds selected for each Fund by Broadridge Financial Solutions, Inc. (“Broadridge”) provided an appropriate comparison, and if not, whether PIMCO believes another peer group would provide a more appropriate comparison.
With respect to the Subsidiary Agreements, the Trustees considered that PDI and PDO utilize their Subsidiaries to execute their investment strategies, and that PIMCO provides investment advisory and administrative services to the Subsidiaries pursuant to the Subsidiary Agreements in the same manner as it does for PDI and PDO under their Investment Management Agreements. The Trustees also considered that, with respect to each Subsidiary, PIMCO does not collect or retain a separate advisory or other fee from the Subsidiary, and that PIMCO’s profitability with respect to PDI and PDO is not impacted as a result of
the Subsidiary Agreements. The Trustees determined, therefore, that it was appropriate to consider the approval of the Subsidiary Agreements collectively with their consideration of the Investment Management Agreement.
In addition to approving the continuation of each Agreement at the Approval Meeting, the Board noted that it had also approved, at a separate meeting of the Board on March
24-25,
2022, an immaterial amendment to each Investment Management Agreement to provide that, by investing in PIMCO Funds: Private Account Portfolio Series — PIMCO Short-Term Floating NAV Portfolio III and/or PIMCO Funds: Private Account Portfolio Series — PIMCO Short Asset Portfolio, each a series of PIMCO Funds (the “Central Funds”), 0.005% of each Fund’s management fee will be designated as compensation for the investment advisory services PIMCO provides to the Central Funds, as applicable. The Trustees considered that the Central Funds are offered as cash management vehicles available only to the Funds and other registered investment companies (or series thereof) for which PIMCO serves as investment adviser and that the Central Funds do not pay an investment advisory fee to PIMCO. The Trustees considered that the fees payable by each Fund pursuant to the amendments will not increase or otherwise change, PIMCO’s level of services to the Funds under the Investment Management Agreements will not be reduced in any way and that the amendments will have no effect on PIMCO’s profitability with respect to the Funds.
The Trustees’ conclusions as to the continuation of each Agreement were based on a comprehensive consideration of all information provided to the Trustees during the Contract Renewal Meetings and throughout the year and were not the result of any single factor. Some of the factors that figured particularly in the Trustees’ deliberations are described below, although individual Trustees may have evaluated the information presented differently from one another, attributing different weights to various factors. The Trustees evaluated information available to them on a
basis, and their determinations were made separately in respect of each Fund.
Nature, Extent and Quality of Services
As part of their review, the Trustees received and considered descriptions of various functions performed by PIMCO for the Funds, such as portfolio management, compliance monitoring, portfolio trading practices, and oversight of third-party service providers. They also considered information regarding the overall organization and business functions of PIMCO, including, without limitation, information regarding senior management, portfolio managers and other personnel providing or proposed to provide investment management, administrative, and/or other services, and general corporate ownership and business operations unrelated to the Funds. The Trustees examined PIMCO’s abilities to provide high-quality investment management and
other services to the Funds, noting PIMCO’s long history and experience in managing
closed-end
funds, such as the Funds, including experience monitoring discounts and premiums and complying with New York Stock Exchange (NYSE) requirements. Among other information, the Trustees considered the investment philosophy and research and decision-making processes of PIMCO; the breadth of each Fund’s investment universe; the experience of key advisory personnel of PIMCO responsible for portfolio management of the Funds; information regarding the Funds’ use of leverage; the ability of PIMCO to attract and retain capable personnel; the background and capabilities of the senior management and staff of PIMCO; the general process or philosophy for determining employee compensation; and the operational infrastructure, including technology and systems and cybersecurity measures, of PIMCO. The Trustees also considered actions taken by PIMCO to manage the impact on each Fund and its portfolio holdings of market volatility during the time periods for which information was provided.
In addition, the Trustees noted the extensive range of services that PIMCO provides to the Funds beyond investment management services. In this regard, the Trustees reviewed the extent and quality of PIMCO’s services with respect to regulatory compliance and its ability to comply with the investment policies of the Funds; the compliance programs and risk controls of PIMCO (including the implementation of new policies and programs); the specific contractual obligations of PIMCO pursuant to the Agreements; the nature, extent, and quality of the supervisory and administrative services PIMCO is responsible for providing to the Funds; PIMCO’s risk management function; the time and resources PIMCO expends monitoring the leverage employed by the Funds; and conditions that might affect PIMCO’s ability to provide high-quality services to the Funds in the future under the Agreements, including, but not limited to, PIMCO’s financial condition and operational stability. The Trustees also took into account the entrepreneurial and business risk that PIMCO has undertaken as investment manager and sponsor of the Funds. Specifically, the Trustees considered that PIMCO’s responsibilities include continual management of investment, operational, enterprise, legal, regulatory, and compliance risks as they relate to the Funds. The Trustees also noted PIMCO’s activities under its contractual obligation to coordinate, oversee and supervise the Funds’ various outside service providers, including its negotiation of certain service providers’ fees and its due diligence and evaluation of service providers’ infrastructure, cybersecurity programs, compliance programs, and business continuity programs, among other matters. The Trustees also considered PIMCO’s ongoing development of its own infrastructure and information technology, including its proprietary software and applications, to support the Funds through, among other things, cybersecurity, business continuity planning, and risk management.
| | | | |
Approval of Investment Management Agreement | | | | |
The Trustees concluded that PIMCO’s investment process, research capabilities and philosophy were well suited to each Fund given its investment objective and policies, that PIMCO would be able to continue to meet any reasonably foreseeable obligations under each Agreement, and that PIMCO would otherwise be able to continue to provide investment and
non-investment
services to each Fund of an appropriate extent and quality.
Fee and Expense Information
In assessing the reasonableness of each Fund’s fees and expenses under its Investment Management Agreement, the Trustees requested and considered, among other information, the Fund’s management fee and its total expenses as a percentage of average net assets attributable to common shares and as a percentage of average total managed assets (including assets attributable both to common shares and specified leverage outstanding), in comparison to the management fees and other expenses of a group of industry peer funds identified by Broadridge as pursuing investment strategies with classifications/objectives similar to the Fund (for each Fund, its “Broadridge Expense Group”) as well as of a broader universe of peer funds identified by Broadridge (for each Fund, its “Broadridge Expense Universe”). In each case, the total expense ratio information was provided both inclusive and exclusive of interest and borrowing expenses. The Fund-specific fee and expense results discussed below were prepared and provided by Broadridge and were not independently verified by the Trustees. The Trustees noted that only leveraged
closed-end
funds were considered for inclusion in the Broadridge Expense Groups and Broadridge Expense Universes.
The Trustees considered information regarding the investment performance and fees for other funds and accounts managed by PIMCO, if any, including funds and accounts with comparable investment programs and/or principal investment strategies to those of the Funds, as well as certain other funds requested by the Trustees with broadly similar strategies and/or investment types. The Trustees considered information provided by PIMCO indicating that, in comparison to certain other products managed by PIMCO, including any
open-end
funds and exchange-traded funds with broadly similar strategies and/or investment types, there are additional portfolio management challenges in managing
closed-end
funds such as the Funds. For example, the challenges associated with managing
closed-end
funds may include investing in
non-traditional
and less liquid holdings, a greater use of leverage, issues relating to trading on a national securities exchange and managing a fund’s dividend practices. In addition, the Independent Trustees considered information provided by PIMCO as to the generally broader and more extensive services provided to the Funds in comparison to those provided to private funds or institutional or separate accounts; the higher demands
placed on PIMCO to provide considerable shareholder services due to the volume of investors; the greater entrepreneurial, enterprise, and reputational risk in managing registered
closed-end
funds; and the expenses, and impact on PIMCO, associated with the more extensive regulatory and compliance requirements to which the Funds are subject in comparison to private funds or institutional or separate accounts. The Trustees were advised by PIMCO that, in light of these additional challenges and additional services, different pricing structures between
closed-end
funds and other products managed by PIMCO are to be expected, and that comparisons of pricing structures across these products may not always be apt comparisons, even where other products have comparable investment objectives and strategies to those of the Funds.
The Trustees also took into account that the Funds, with the exception of RCS, pay management fees on assets attributable to types of leverage that they use (such as reverse repurchase agreements), which increases the amount of management fees payable by each Fund under its Investment Management Agreement (because each Fund’s fees, except those of RCS, are calculated based on total managed assets, including assets attributable to reverse repurchase agreements and/or certain other forms of leverage outstanding). They noted that RCS’s management fees are based on daily net assets, including net assets attributable to any preferred shares that may be outstanding, but that RCS does not have any preferred shares outstanding. In this regard, the Trustees took into account that PIMCO has a financial incentive for the Funds to use or continue to use leverage on which management fees are charged, which may create a conflict of interest between PIMCO, on one hand, and the Funds’ common shareholders, on the other. Therefore, the Trustees noted that the total fees paid by each Fund to PIMCO under the Fund’s unified fee arrangement would therefore vary more with increases and decreases in leverage (only with respect to any preferred shares issued by RCS) than under a
non-unified
fee arrangement, all other things being equal. The Trustees considered information provided by PIMCO and related presentations as to why each Fund’s use of leverage continues to be appropriate and in the best interests of the respective Fund under current market conditions. The Trustees noted that each quarter they receive information from PIMCO regarding the Funds’ use of leverage. The Trustees also considered PIMCO’s representation that it will use leverage for the Funds solely as it determines to be in the best interests of the Funds from an investment perspective and without regard to the level of compensation PIMCO receives. The Trustees noted that RCS does not pay fees on assets attributable to the types of leverage that the Fund currently employs.
The Trustees noted that, for each of PGP, PDI, and PDO, the contractual and actual management fee rates for the Fund under its unified fee arrangement were above the median contractual and actual
management fees of the other funds in their Broadridge Expense Groups, calculated both on average net assets and on average total managed assets. For RCS, the contractual management fee rate for the Fund under its unified fee arrangement was above the median contractual management fees of the other funds in its Broadridge Expense Group calculated both on average net assets and on average total managed assets, while the actual management fee rate for the Fund under its unified fee arrangement was above the median actual management fees of the other funds in its Broadridge Expense Group calculated on average total managed assets and below the median actual management fees of the other funds in its Broadridge Expense Group calculated on average net assets. For PCM, the contractual management fee rate for the Fund under its unified fee arrangement was at the median contractual management fees of the other funds in its Broadridge Expense Group calculated both on average net assets and on average total managed assets, while the actual management fee rate for the Fund under its unified fee arrangement was above the median actual management fees of the other funds in its Broadridge Expense Group calculated both on average net assets and on average total managed assets. In this regard, the Trustees took into account that each Fund’s unified fee arrangement covers substantially all of the Fund’s operating fees and expenses (“Operating Expenses”), and therefore, all other things being equal, would tend to be higher than the contractual management fee rates of other funds in the Broadridge Expense Group, which generally do not have a unified fee structure and instead incur Operating Expenses directly and in addition to the management fee. The Trustees determined that a comparison of each Fund’s total expense ratio with the total expense ratios of its Broadridge Expense Group would generally provide more meaningful comparisons than comparing contractual and actual management fee rates in isolation.
In this regard, the Trustees noted PIMCO’s view that the unified fee arrangements have benefited and will continue to benefit common shareholders because they provide an expense structure (including Operating Expenses) that is essentially fixed for the duration of the contractual period as a percentage of either total managed assets (including assets attributable to preferred shares and certain other forms of leverage) or net assets (including assets attributable to preferred shares), as applicable, making it more predictable under ordinary circumstances in comparison to other fee and expense structures, under which the Funds’ Operating Expenses (including certain third-party fees and expenses) could vary significantly over time. The Trustees also considered that the unified fee arrangements generally insulate the Funds and common shareholders from increases in applicable third-party and certain other expenses because PIMCO, rather than the Funds, would bear the risk of such increases (though the Trustees also noted that PIMCO would benefit from any reductions in such expenses).
In addition, the Trustees noted the Board approved the reorganization (the “Reorganization”) of PIMCO Income Opportunity Fund and PIMCO Dynamic Credit and Mortgage Income Fund with and into PDI, effective as of the close of business on December 10, 2021. The Board considered that, in connection with and contingent upon the Reorganization, it had approved a reduction in the annual management fee rate paid by PDI from 1.15% to 1.10% of PDI’s average daily total managed assets, effective December 13, 2021.
Performance Information
Fund-specific comparative performance results for the Funds reviewed by the Trustees are discussed below. With respect to investment performance, the Trustees considered information regarding each Fund’s performance based on NAV and market value, as applicable, net of the Fund’s fees and expenses, both on an absolute basis and relative to the performance of its Broadridge Performance Universe (as defined below). The Trustees requested information provided by Broadridge regarding the investment performance of a broad universe of funds within the same investment classification/category that Broadridge determined are comparable to those of each Fund (for each Fund, its “Broadridge Performance Universe”). The comparative performance information was prepared and provided by Broadridge and was not independently verified by the Trustees. The Trustees also considered information regarding the Funds’ comparative yields and risk-adjusted returns. The Trustees recognized that the performance data reflects a snapshot of a period as of a particular date and that selecting a different performance period could produce significantly different results. They further acknowledged that long-term performance could be impacted by even one period of significant outperformance or underperformance. The Trustees considered information from PIMCO regarding the risks undertaken by each Fund, including the use of leverage, and PIMCO’s management and oversight of the Fund’s risk profile, including in instances where the Fund outperformed its Broadridge Performance Universe.
In addition, the Trustees considered matters bearing on the Funds and their advisory arrangements at their meetings throughout the year, including a review of performance data at each regular meeting (by both the Board and its Performance Committee).
Profitability, Economies of Scale, and
Fall-out
Benefits
The Trustees considered estimated profitability analyses provided by PIMCO, which included, among other information, (i) PIMCO’s estimated
pre-
and post-distribution operating margin for each Fund, as well as PIMCO’s estimated
pre-
and post-distribution operating margin for all of the
closed-end
funds advised by PIMCO, including the Funds (collectively, the “Estimated Margins”), in each case for the
one-year
period ended December 31, 2021; and (ii) a year-over-year
| | | | |
Approval of Investment Management Agreement | | | | |
comparison of PIMCO’s Estimated Margins for the
one-year
periods ended December 31, 2021 and December 31, 2020. The Trustees also took into account explanations from PIMCO regarding how certain of PIMCO’s corporate and shared expenses were allocated among the Funds and other funds and accounts managed by PIMCO for purposes of developing profitability estimates. Based on the profitability analyses provided by PIMCO, the Trustees determined, taking into account the various assumptions made, that such profitability did not appear to be excessive.
The Trustees also considered information regarding possible economies of scale in the operation of the Funds, including in connection with
offerings conducted by certain Funds. The Trustees noted that the Funds do not currently have any breakpoints in their management fees. The Trustees considered that, as
closed-end
investment companies, the Funds do not continually offer new shares to raise additional assets (as does a typical
open-end
investment company), but may raise additional assets through
follow-on
offerings (including
offerings with respect to PDI) and dividend reinvestments and may also experience asset growth through investment performance and/or the increased use of leverage. The Trustees noted PIMCO’s assertion that it may share the benefits of potential economies of scale, if any, with the Funds and their shareholders in a number of ways, including investing in portfolio and trade operations management, firm technology and cybersecurity measures, middle and back office support, legal and compliance, and fund administration logistics; senior management supervision and governance of those services; and the enhancement of services provided to the Funds in return for fees paid. The Trustees also considered that the unified fee arrangements provide inherent economies of scale because a Fund maintains competitive fixed unified fees even if the particular Fund’s assets decline and/or operating costs increase. The Trustees further considered that, in contrast, breakpoints may be used as a proxy for charging higher fees on lower asset levels and that when a fund’s assets decline, breakpoints may reverse, which causes expense ratios to increase. The Trustees also considered that, unlike the Funds’ unified fee arrangements, funds with “pass through” administrative fee structures may experience increased expense ratios when fixed dollar fees are charged against declining fund assets. The Trustees also considered that the unified fee arrangements protect shareholders, during the contractual period, from a rise in operating costs that may result from, among other things, PIMCO’s investments in various business enhancements and infrastructure. The Trustees noted that PIMCO has made extensive investments in these areas.
Additionally, the Trustees considered
so-called
“fall-out
benefits” to PIMCO, such as reputational value derived from serving as investment manager to the Funds and research, statistical and quotation services that PIMCO may receive from broker-dealers executing the Funds’ portfolio transactions on an agency basis.
With regard to the investment performance of each Fund and the fees charged to each Fund, the Board considered the following information. With respect to performance quintile rankings for a Fund compared to its Broadridge Performance Universe, the first quintile represents the highest (best) performance and the fifth quintile represents the lowest performance. The Board considered each Fund’s performance and fees in light of the limitations inherent in the methodology for determining such comparative groups.
PGP
With respect to the Fund’s common share total return performance (based on NAV) relative to its respective Broadridge Performance Universe, the Trustees noted that the Fund had third quintile performance for the
one-year
period, second quintile performance for the three- and five-year periods and first quintile performance for the
ten-year
period ended December 31, 2021.
The Trustees noted that the Fund’s total expense ratio (including interest and borrowing expenses) was below the median total expense ratio (including interest and borrowing expenses) calculated on average total managed assets and at the median total expense ratio (including interest and borrowing expenses) calculated on average net assets of the funds in its Broadridge Expense Group. The Trustees noted that the Fund’s total expense ratio (including interest and borrowing expenses) was below the median total expense ratio (including interest and borrowing expenses) calculated on average total managed assets and above the median total expense ratio (including interest and borrowing expenses) calculated on average net assets of the funds in its Broadridge Expense Universe. The Trustees noted that the Fund’s total expense ratio (excluding interest and borrowing expenses) calculated on both average total managed assets and average net assets was below the median total expense ratio (excluding interest and borrowing expenses) of the funds in its Broadridge Expense Group and Broadridge Expense Universe.
PCM
With respect to the Fund’s common share total return performance (based on NAV) relative to its respective Broadridge Performance Universe, the Trustees noted that the Fund had third quintile performance for the
one-
and three-year periods and second quintile performance for the five- and
ten-year
periods ended December 31, 2021.
The Trustees noted that the Fund’s total expense ratio (including interest and borrowing expenses) calculated on both average total managed assets and average net assets was above the median total expense ratio (including interest and borrowing expenses) of the funds in its Broadridge Expense Group and Broadridge Expense Universe. The Trustees noted that the Fund’s total expense ratio (excluding interest
and borrowing expenses) was below the median total expense ratio (excluding interest and borrowing expenses) calculated on average total managed assets and above the median total expense ratio (excluding interest and borrowing expenses) calculated on average net assets of the funds in its Broadridge Expense Group. The Trustees noted that the Fund’s total expense ratio (excluding interest and borrowing expenses) calculated on both average total managed assets and average net assets was above the median total expense ratio (excluding interest and borrowing expenses) of the funds in its Broadridge Expense Universe.
RCS
With respect to the Fund’s common share total return performance (based on NAV) relative to its respective Broadridge Performance Universe, the Trustees noted that the Fund had second quintile performance for the
one-year
period, third quintile performance for the three-year period and first quintile performance for the five- and
ten-year
periods ended December 31, 2021.
The Trustees noted that the Fund’s total expense ratio (including interest and borrowing expenses) calculated on both average total managed assets and average net assets was below the median total expense ratio (including interest and borrowing expenses) of the funds in its Broadridge Expense Group and Broadridge Expense Universe. The Trustees noted that the Fund’s total expense ratio (excluding interest and borrowing expenses) was at the median total expense ratio (excluding interest and borrowing expenses) calculated on average total managed assets and below the median total expense ratio (excluding interest and borrowing expenses) calculated on average net assets of the funds in its Broadridge Expense Group and Broadridge Expense Universe.
PDI
With respect to the Fund’s common share total return performance (based on NAV) relative to its respective Broadridge Performance Universe, the Trustees noted that the Fund had first quintile performance for the
one-year
period, second quintile performance for the three-year period and first quintile performance for the five-year period ended December 31, 2021.
The Trustees noted that the Fund’s total expense ratio (including interest and borrowing expenses) was at the median total expense ratio (including interest and borrowing expenses) calculated on average total managed assets and above the median total expense ratio (including interest and borrowing expenses) calculated on average net assets of the funds in its Broadridge Expense Group. The Trustees noted that the Fund’s total expense ratio (including interest and borrowing expenses) calculated on both average total managed assets and average net assets was above the median total expense ratio
(including interest and borrowing expenses) of the funds in its Broadridge Expense Universe. The Trustees noted that the Fund’s total expense ratio (excluding interest and borrowing expenses) was at the median total expense ratio (excluding interest and borrowing expenses) calculated on average total managed assets and above the median total expense ratio (excluding interest and borrowing expenses) calculated on average net assets of the funds in its Broadridge Expense Group. The Trustees noted that the Fund’s total expense ratio (excluding interest and borrowing expenses) calculated on both average total managed assets and average net assets was above the median total expense ratio (excluding interest and borrowing expenses) of the funds in its Broadridge Expense Universe.
PDO
With respect to the Fund’s common share total return performance (based on NAV) relative to its respective Broadridge Performance Universe, the Trustees noted that the Fund had first quintile performance for the period since inception ended December 31, 2021.
The Trustees noted that the Fund’s total expense ratio (including interest and borrowing expenses) was below the median total expense ratio (including interest and borrowing expenses) calculated on average total managed assets and above the median total expense ratio (including interest and borrowing expenses) calculated on average net assets of the funds in its Broadridge Expense Group. The Trustees noted that the Fund’s total expense ratio (including interest and borrowing expenses) was below the median total expense ratio (including interest and borrowing expenses) calculated on average total managed assets and above the median total expense ratio (including interest and borrowing expenses) calculated on average net assets of the funds in its Broadridge Expense Universe. The Trustees noted that the Fund’s total expense ratio (excluding interest and borrowing expenses) was at the median total expense ratio (excluding interest and borrowing expenses) calculated on average total managed assets and above the median total expense ratio (excluding interest and borrowing expenses) calculated on average net assets of the funds in its Broadridge Expense Group. The Trustees noted that the Fund’s total expense ratio (excluding interest and borrowing expenses) calculated on both average total managed assets and average net assets was above the median total expense ratio (excluding interest and borrowing expenses) of the funds in its Broadridge Expense Universe.
Conclusion
After reviewing these and other factors described herein, the Trustees concluded, with respect to each Fund, within the context of their overall conclusions regarding the Agreements, and based on the information provided and related representations made by management, and in their business judgment, that they were satisfied with PIMCO’s responses and efforts relating to the investment
| | | | |
Approval of Investment Management Agreement | | | | |
performance of the Funds. The Trustees also concluded that the fees payable under the Agreements represent reasonable compensation in light of the nature, extent, and quality of the services provided by PIMCO. Based on their evaluation of factors that they deemed to be material, including, but not limited to, those factors described above, the Board, including the Independent Trustees, unanimously concluded that the continuation of the Agreements was in the interests of each Fund and its shareholders, and should be approved.
PAXS
At a meeting held on December 9, 2021 (the “Approval Meeting”), the Board of Trustees (the “Board” or “Trustees”) of PIMCO Access Income Fund (the “Fund”), including the Trustees who are not interested persons (as that term is defined in the Investment Company Act of 1940, as amended) of Pacific Investment Management Company LLC (“PIMCO”) or the Fund (the “Independent Trustees”), formally considered and unanimously approved a proposed Investment Management Agreement between the Fund and PIMCO (the “Investment Management Agreement”) for an initial term of two years commencing upon the effective date of the Investment Management Agreement.
1
In connection with their consideration of the Investment Management Agreement, the Independent Trustees also formally considered and unanimously approved a proposed form of Investment Management Agreement between PIMCO and wholly-owned and/or controlled subsidiaries of the Fund that may be formed by the Fund (the “Subsidiary Agreement” and together with the Investment Management Agreement, the “Agreements”).
On the day of the Approval Meeting, the Contracts Committee (the “Committee”) of the Board held a separate meeting (the “Committee Meeting”) and formally considered and recommended to the Board the approval of the Agreements. In advance of the Committee Meeting, PIMCO provided materials to the Committee for its consideration of the Agreements in response to a request from counsel to the Independent Trustees (“Independent Counsel”), as well as other materials and information PIMCO believed would be useful in evaluating the approval of the Agreements. At the Committee Meeting, members of the Committee, all of whom are Independent Trustees, considered the materials and information provided by PIMCO bearing on the approval of the Agreements. The Committee also received and reviewed a memorandum from Independent Counsel regarding the Trustees’ responsibilities in evaluating the Agreements, which they discussed with Independent Counsel.
Following the Committee Meeting, the Independent Trustees met separately in executive session with Independent Counsel to review and discuss all relevant information, including, but not limited to, information provided in response to the request from Independent Counsel. In connection with their deliberations regarding the proposed approval of the Agreements, the Trustees, including the Independent Trustees, considered such information and factors as they believed, in light of the legal advice furnished to them and their own business judgment, to be relevant. The Trustees also considered the nature, quality and extent of the various investment management, administrative, and other services to be performed by PIMCO under the Agreements.
It was noted that, in connection with the Committee Meeting, the Trustees relied upon materials provided by PIMCO, which included, among other items, a memorandum provided by PIMCO and numerous exhibits regarding, among other things, (i) the terms of the Agreements; (ii) comparative fee and expense information and performance information of comparable PIMCO funds, comparable competitor
closed-end
funds and a composite universe of global income funds developed by Broadridge Financial Solutions, Inc./Lipper Inc. (“Lipper”); (iii) descriptions of various functions proposed to be performed by PIMCO for the Fund, such as portfolio management, compliance monitoring, risk management, internal audit services, pricing, bookkeeping and monitoring trading activity; (iv) information regarding PIMCO’s compliance policies applicable to the Fund; (v) the estimated costs to PIMCO of providing these services; (vi) information regarding the organization of certain departments within PIMCO, including information regarding senior management, portfolio managers and other personnel proposed to provide investment management, administrative, compliance and other services to the Fund; (vii) the estimated profitability of the Agreements to PIMCO; (viii) information regarding potential economies of scale, (ix) information on potential
“fall-out”
benefits to PIMCO; and (x) information regarding the organizational complexities associated with limited term
closed-end
funds in comparison to other investment products, including traditional
closed-end
and
open-end
funds.
With respect to the Subsidiary Agreement, the Trustees considered that the Fund may utilize one or more subsidiaries (each, a “Subsidiary” and, collectively, the “Subsidiaries”) to execute its investment strategy, and that PIMCO would provide both investment advisory and administrative services to the Subsidiaries pursuant to the Subsidiary Agreement. The Trustees noted that, if PIMCO were to charge a
| The Board, including a majority of the Independent Trustees, determined to rely on the relief granted by an exemptive order issued by the U.S. Securities and Exchange Commission (the “ SEC ”) that permits fund boards to make certain required approvals involving advisory contracts at meetings held by telephone, video conference, or other similar methods instead of in-person in response to the impact of COVID-19 on investment advisers and funds. The Board, including a majority of the Independent Trustees, determined that reliance on the exemptive order was necessary and appropriate due to circumstances related to current or potential effects of COVID-19, and prior to commencing the Approval Meeting, the Board confirmed that all Board members could hear each other simultaneously during the meeting. The Board subsequently ratified the actions taken at the Approval Meeting pursuant to the SEC relief at its in-person meeting on June 15-16, 2022. |
management fee to a Subsidiary for tax or other reasons in the future, PIMCO expects that it would waive the full amount of such management fee. The Trustees determined, therefore, that it was appropriate to consider the approval of the Subsidiary Agreement collectively with their consideration of the Investment Management Agreement.
In addition to approving the Agreements at the Approval Meeting, the Board also approved, at a subsequent meeting of the Board on March
24-25,
2022, an immaterial amendment to the Investment Management Agreement to provide that, by investing in PIMCO Funds: Private Account Portfolio Series – PIMCO Short-Term Floating NAV Portfolio III and/or PIMCO Funds: Private Account Portfolio Series – PIMCO Short Asset Portfolio, each a series of PIMCO Funds (the “Central Funds”), 0.005% of the Fund’s management fee will be designated as compensation for the investment advisory services PIMCO provides to the Central Funds, as applicable. The Trustees considered that the Central Funds are offered as cash management vehicles available only to the Fund and other registered investment companies (or series thereof) for which PIMCO serves as investment adviser and that the Central Funds do not pay an investment advisory fee to PIMCO. The Trustees considered that the fees payable by the Fund pursuant to the amendment will not increase or otherwise change, PIMCO’s level of services to the Fund under the Investment Management Agreement will not be reduced in any way and that the amendment will have no effect on PIMCO’s profitability with respect to the Fund.
The Trustees’ conclusions as to the approval of the Agreements were based on a comprehensive consideration of all information provided to the Trustees and were not the result of any single factor. Some of the factors that figured particularly in the Trustees’ deliberations are described below, although individual Trustees may have evaluated the information presented differently from one another, attributing different weights to various factors.
Nature, Extent and Quality of Services
As part of their review, the Trustees examined PIMCO’s abilities to provide high-quality investment management and other services to the Fund. Among other information, the Trustees considered the investment philosophy and research and decision-making processes to be employed by PIMCO; the experience of key advisory personnel of PIMCO who would be responsible for portfolio management of the Fund; information regarding the Fund’s anticipated use of leverage; the ability of PIMCO to attract and retain capable personnel; the background and capabilities of the senior management and staff of PIMCO; employee compensation within PIMCO; and the operational structure, including technology and systems, of PIMCO.
In addition, the Trustees noted the extensive range of services that PIMCO will provide to the Fund under the Agreements beyond
investment management services. In this regard, the Trustees reviewed the extent and quality of PIMCO’s services to be provided with respect to regulatory compliance and ability to comply with the investment policies of the Fund; the compliance programs and risk controls of PIMCO; the specific contractual obligations of PIMCO pursuant to the Agreements; the nature, extent, and quality of the supervisory and administrative services that PIMCO will be responsible for providing to or providing for the Fund; PIMCO’s risk management function; and conditions that might affect PIMCO’s ability to provide high-quality services to the Fund in the future under the Agreements, including, but not limited to, PIMCO’s financial condition and operational stability. The Trustees also took into account the entrepreneurial, business and other risks PIMCO has undertaken as investment manager and sponsor of the Fund for which it is entitled to reasonable compensation. The Trustees also noted PIMCO’s anticipated activities under its contractual obligation under the Agreements to coordinate, oversee and supervise the Fund’s various outside service providers. They also considered PIMCO’s ongoing development of its infrastructure and information technology and its ability to support the Fund through, among other things, cybersecurity, business continuity planning, and risk management. Based on the foregoing, the Trustees concluded that PIMCO’s investment process, research capabilities and philosophy were well suited to the Fund given its investment objectives and policies, and that PIMCO would be able to meet any reasonably foreseeable obligations under the Agreements.
As part of its considerations, the Trustees noted any complexities associated with the Fund being an exchange-traded
closed-end
fund with a twelve-year term that could be extended by the Board under certain circumstances. The Trustees noted that, as set forth more fully in the Fund’s offering documents, prior to the end of the twelve-year term (as may be extended by the Board in certain circumstances), the Board could authorize the Fund to conduct a tender offer for all of the Fund’s outstanding common shares at net asset value on the expiration date of the tender offer, with PIMCO bearing the expenses of making such a tender offer, and that, if the Fund has at least $200 million of net assets thereafter, the Board could eliminate the Fund’s limited term feature without shareholder approval. The Trustees also noted that PIMCO proposed entering into an Organizational and Offering Expenses Agreement with the Fund, pursuant to which PIMCO would pay all organizational costs of the Fund and all offering costs of the Fund’s initial public offering (“IPO”), including, without limitation, underwriting and structuring fees, financial advisor commissions, marketing costs and the costs of legal and audit services incurred by the Fund in connection with the IPO. The Trustees noted PIMCO’s representation that the compensation proposed to be paid to PIMCO under the Investment Management Agreement is not based on the offering and organizational expenses to be borne by PIMCO. The
| | | | |
Approval of Investment Management Agreement | | | | |
Trustees noted that the Board had received information relating to the advisory fees and total expense ratios of comparable funds against which they were able to review the Fund’s proposed fees.
The Trustees also took into account the proposed Support Services Agreements between the Fund and PIMCO Investments LLC (“PI”), under which PI would provide shareholder and financial intermediary support, marketing and communications support, support for the Board and its Committees, as well as provide support (but not underwriting services) for initial public and secondary offerings of the Fund, subject to and in accordance with the terms and conditions of the proposed Support Services Agreement. Under the proposed Support Services Agreement, PI would provide these services at its own expense, except that the Support Services Agreement authorizes the Fund to reimburse reasonable and documented
expenses related to the offering of its common shares incurred by certain affiliates, or associated persons thereof, and employees of PIMCO, including in connection with participation in the road show and related activities (“affiliate expenses”). PIMCO clarified that PI will not act as an underwriter in connection with the Fund’s IPO, but that it will provide, pursuant to the Support Services Agreements, certain marketing support and shareholder services for the Fund, including in connection with the Fund’s IPO. The Trustees also received information from PIMCO and Fund counsel on the structuring fee arrangements that PIMCO expects to enter into with various underwriters of the Fund’s IPO, which will set forth various fees to be paid by PIMCO (and not the Fund) to certain underwriters in the IPO, in consideration of certain financial advisory services that the underwriters will provide in connection with the structuring, designing and organizing of the Fund as well as services related to the sale and distribution of the Fund’s shares.
Fee and Expense Information
In assessing the reasonableness of the Fund’s proposed fees under the proposed Investment Management Agreement, the Trustees considered, among other information, the Fund’s management fee as a percentage of total managed assets (including any assets attributable to any reverse repurchase agreements, dollar rolls/buy backs, borrowings and preferred shares that may be outstanding) minus accrued liabilities (other than liabilities representing reverse repurchase agreements, dollar rolls/buy backs, and borrowings) and its estimated total expense ratio (calculated as a percentage of common share net assets and excluding interest expense) to those of certain comparable funds.
The Trustees noted that PIMCO manages other funds with investment strategies that are similar, but not identical, to the Fund for comparative purposes. The Trustees noted that PIMCO also identified
closed-end
funds managed by PIMCO and other fund sponsors that have launched since 2019 and comparable competitor
closed-end
funds. In addition, the Trustees noted that the comparable information also included a universe
of comparable
closed-end
funds, the Lipper Global Income Funds universe, which is the group of funds in which most of the comparable
closed-end
funds are included by Lipper. The Trustees specifically considered how the Fund was expected to compare to the comparable funds as to management fee rates and total expense ratios.
The fund-specific fee and expense results discussed below were compiled by PIMCO based on information from Lipper, and were not independently verified by the Trustees.
The Trustees considered the contractual management fee rates (based on total managed assets) charged by PIMCO to other funds it manages with investment strategies that are similar, but not identical, to the Fund in comparison to the proposed unified management fee of the Fund. The Trustees noted that the proposed contractual management fee rate for the Fund is higher than the contractual management fee rates charged by the funds PIMCO identified as the most similar to the Fund. In this regard, the Trustees considered PIMCO’s representation that this is to account for the complexity of the Fund’s investable universe, including its proposed emphasis on private credit and real estate-related investments. The Trustees also considered the required resources and processes at PIMCO from a risk management perspective associated with those investments, including for increased regulatory and compliance risk monitoring and investment risk management. The Trustees also noted that the proposed contractual and effective management fee rate for the Fund is lower than the contractual and effective management fee rate charged by an interval fund managed by PIMCO pursuant to a similar investment strategy due to that fund’s interval fund structure, which requires more complex liquidity management. The Trustees also considered the contractual and effective management fee rates charged by advisers to other competitor
closed-end
funds. The Trustees noted that the Fund’s proposed contractual and effective management fee rate is higher than the average contractual and effective management fee rate charged to the comparable competitor
closed-end
funds. They considered PIMCO’s explanation of how such funds differed from the Fund, noting the Fund’s broader and more diversified approach of investing across the global credit landscape, compared to other funds that focus on one particular part of the market. They noted also PIMCO’s representations regarding the Fund’s increased focus on more complex, less liquid, and/or private securities, whereas most peers tend to focus on more generic, liquid, and/or public parts of the market.
The Trustees took into account that the Fund’s proposed unified management fee arrangement covers substantially all of the Fund’s other supervisory and administrative services required by the Fund that are typically paid for or incurred by
closed-end
funds directly in addition to a fund’s management fee (such fees and expenses, “Operating Expenses”). They noted also that the Fund’s proposed unified effective
management fee rate was higher than the effective management fee rate of the Lipper Global Income Funds universe, which includes peer funds that generally do not have a unified fee structure and bear Operating Expenses directly and in addition to the management fee. They recognized, however, that the comparable PIMCO-sponsored funds also have a unified management fee.
In this regard, the Trustees considered PIMCO’s view that the proposed unified management fee arrangement for the Fund will benefit common shareholders because it will provide a management fee expense structure (including Operating Expenses) that is essentially fixed for the duration of the contractual period as a percentage of managed assets, including assets attributable to leverage, making it more predictable under ordinary circumstances in comparison to other fee and expense structures, under which a fund’s Operating Expenses (including certain third-party fees and expenses) could vary significantly over time. The Trustees also considered that the proposed unified fee arrangement would generally insulate the Fund and common shareholders from increases in applicable third-party and certain other expenses because PIMCO, rather than the Fund, would bear the risk of such increases (though the Trustees also noted that PIMCO would benefit from any reductions in such expenses).
The Trustees noted that, while the Fund would not be charged a separate administration fee (recognizing that the proposed management fees include a component for supervisory and administrative services under the unified fee arrangement), it was not clear in all cases whether the peer funds in the Lipper Global Income Funds universe or the comparable funds managed by other advisers were separately charged such a fee by their investment managers, so that the total expense ratio, as opposed to any individual expense component, represented the most relevant comparison. As such, the Trustees considered that the total expense ratio seems to provide a more apt comparison than management fee expense because the Fund’s proposed unified fee arrangement would cover Operating Expenses that are typically paid for or incurred by competitor funds directly in addition to their management fees as discussed below.
Among other information, the Trustees considered the estimated gross total expense ratio (calculated as a percentage of common share net assets and excluding interest expense) of the Fund compared to the gross total expense ratios of the PIMCO-sponsored funds, recognizing that fees for management and administrative services would be included within the total expense ratios. It was noted that the Fund’s estimated gross total expense ratio is higher than those of the PIMCO-sponsored funds PIMCO identified as most similar to the Fund and the Lipper Global Income Funds universe. The Trustees also noted that the Fund’s estimated net total expense ratio is higher than the comparable competitor
closed-end
funds. In this regard, the Board considered
Management’s representation that this is generally due to Management’s intended and historically greater use of leverage within certain investment strategies that it manages. The Board noted PIMCO’s representations that this approach allows a fund to increase yield and return potential while still focusing on higher quality securities and not having to take increased credit risk.
The Trustees also took into account that the Fund would pay management fees on assets attributable to certain types of leverage that it will use (such as reverse repurchase agreements) under the Investment Management Agreement because the Fund’s fees are calculated based on total managed assets (including any assets attributable to any reverse repurchase agreements, dollar rolls/buy backs, borrowings and preferred shares that may be outstanding, if any) minus accrued liabilities (other than liabilities representing reverse repurchase agreements, dollar rolls/buy backs and borrowings). In this regard, the Trustees took into account that PIMCO has a financial incentive for the Fund to utilize reverse repurchase agreements, dollar rolls/buy backs, borrowings, preferred shares and/or certain other forms of leverage on which management fees would be paid, which may create a conflict of interest between PIMCO, on one hand, and the Fund’s common shareholders, on the other. The Trustees further noted that this incentive may be greater under the proposed unitary management fee arrangement because the Fund’s contractual management fee rate under the unitary fee arrangement is higher than it otherwise would be if it did not cover the Fund’s Operating Expenses. Therefore, the total fees paid by the Fund to PIMCO under the proposed unitary fee arrangement would vary more with increases and decreases in applicable leverage incurred by the Fund than under a
non-unitary
fee arrangement, all other things being equal. In this regard, the Trustees took into account assurances from PIMCO that it will use leverage for the Fund solely as it determines such use to be in the best interest of the Fund from an investment perspective and without regard to the level of compensation PIMCO receives.
Profitability, Economies of Scale, Performance Information and
Fall-out
Benefits
The Trustees also considered estimated profitability analyses provided by PIMCO for the Fund’s first two years of operations, which included, among other information, PIMCO’s estimated
pre-distribution
advisory profit margin for the Fund and PIMCO’s estimated
pre-
and post-distribution profitability analyses under various scenarios depending on the size of the Fund’s IPO. The Trustees considered that estimated profitability was based, in part, on average managed assets, which reflect the estimated assets upon which management fees will be assessed, including forms of leverage expected to be utilized by the Fund. The Trustees also took into account explanations from PIMCO regarding how certain corporate and shared expenses had been
| | | | |
Approval of Investment Management Agreement | | | | (Unaudited) |
allocated among the Fund and other funds and accounts managed by PIMCO for purposes of developing profitability estimates. The Trustees noted that the profitability estimates had taken into account organizational and offering costs payable by PIMCO (exclusive of upfront structuring fees and other compensation to be paid by PIMCO to underwriters in the IPO), in estimating PIMCO’s
pre-distribution
profitability, based on advice from counsel to the Fund that such an approach is reasonable. The Trustees also took into account PIMCO’s estimated post-distribution profitability from the Fund, which, among other distribution expenses, factored in the amortization of estimated upfront structuring fees to be paid by PIMCO over the expected twelve-year term of the Fund. Based on the profitability analyses provided by PIMCO, the Trustees determined, taking into account the various assumptions made, that such projected profitability did not appear to be excessive.
The Trustees also took into account that PIMCO is not proposing that the Fund have any breakpoints in its management fees. The Trustees considered that, as a
closed-end
investment company, the Fund likely would not continually offer new shares to raise additional assets (as does a typical
open-end
investment company), but may experience asset growth through investment performance and/or the increased use of leverage. The Trustees also considered that the proposed unified fee arrangement provides investors with additional stability and increased fee certainty during the contractual period. The Trustees noted that, to the extent PIMCO may achieve economies of scale relating to the Fund, it may share the benefits of such economies of scale with the Fund through, for example, enhancements to investment practices and operations and increasing levels of services to the Fund and its shareholders. The Trustees also considered that PIMCO’s proposed management fee rate for the Fund permits shareholders to immediately benefit from future economies of scale (if any are achieved, especially in light of the fact that Fund assets likely will not grow following the Fund’s IPO except for any growth resulting from positive performance by nature of the Fund being a
closed-end
fund or by a
follow-on
offering) by paying lower fees based on future, expected assets and that expenses related to operating a registered fund generally increase over time.
The Trustees also considered that the proposed unified fee arrangement protects shareholders from a rise in Operating Expenses that may result from, including, among other things, PIMCO’s investments in various business enhancements and infrastructure. The Trustees noted that PIMCO has made extensive investments in these areas.
The Trustees also reviewed, among other information, information showing historical performance (based on net asset value and net of fees) of the comparable funds for the
one-year,
three-year, five-year
and
ten-year
periods ended September 30, 2021, where applicable, and noted that, because it is newly organized, the Fund did not have any performance history of its own.
Additionally, the Trustees considered
so-called
“fall-out
benefits” to PIMCO, such as reputational value derived from serving as investment manager to the Fund, leverage when negotiating with service providers, and research, statistical and quotation services, if any, PIMCO may receive from broker-dealers executing the Fund’s portfolio transactions on an agency basis.
Conclusion
After reviewing and considering these and other factors described herein, the Trustees concluded, in their business judgment, within the context of their overall conclusions regarding the Agreements and based on information provided and related representations made by PIMCO, that they were satisfied that fees payable under the Agreements represent reasonable compensation in light of the nature, extent and quality of services to be provided by PIMCO, as the case may be, and that, based on the information provided by PIMCO and taking into account the various assumptions made, the profitability of PIMCO did not appear to be excessive under the Agreements. Based on their evaluation of factors that they deemed to be material, including, but not limited to, those factors described above, the Trustees, including the Independent Trustees, unanimously concluded that the terms of the Agreements are fair and reasonable to the Fund, that the approval of the Agreements was in the interest of the Fund and its prospective shareholders, and that the Agreements should be approved for an initial term of two years commencing upon their respective effective dates.
The Funds
2,3
consider customer privacy to be a fundamental aspect of their relationships with shareholders and are committed to maintaining the confidentiality, integrity and security of their current, prospective and former shareholders’
non-public
personal information. The Funds have developed policies that are designed to protect this confidentiality, while allowing shareholder needs to be served.
OBTAINING
NON-PUBLIC
PERSONAL INFORMATION
In the course of providing shareholders with products and services, the Funds and certain service providers to the Funds, such as the Funds’ investment advisers or
sub-advisers
(“Advisers”), may obtain
non-public
personal information about shareholders, which may come from sources such as account applications and other forms, from other written, electronic or verbal correspondence, from shareholder transactions, from a shareholder’s brokerage or financial advisory firm, financial professional or consultant, and/or from information captured on applicable websites.
As a matter of policy, the Funds do not disclose any
non-public
personal information provided by shareholders or gathered by the Funds to
non-affiliated
third parties, except as required or permitted by law or as necessary for such third parties to perform their agreements with respect to the Funds. As is common in the industry,
non-affiliated
companies may from time to time be used to provide certain services, such as preparing and mailing prospectuses, reports, account statements and other information, conducting research on shareholder satisfaction and gathering shareholder proxies. The Funds or their affiliates may also retain
non-affiliated
companies to market Fund shares or products which use Fund shares and enter into joint marketing arrangements with them and other companies. These companies may have access to a shareholder’s personal and account information, but are permitted to use this information solely to provide the specific service or as otherwise permitted by law. In most cases, the shareholders will be clients of a third party, but the Funds may also provide a shareholder’s personal and account information to the shareholder’s respective brokerage or financial advisory firm and/or financial professional or consultant.
SHARING INFORMATION WITH THIRD PARTIES
The Funds reserve the right to disclose or report personal or account information to
non-affiliated
third parties in limited circumstances where the Funds believe in good faith that disclosure is required under law, to cooperate with regulators or law enforcement authorities, to protect their rights or property, or upon reasonable request by any Fund in which a shareholder has invested. In addition, the Funds may
disclose information about a shareholder or a shareholder’s accounts to a
non-affiliated
third party at the shareholder’s request or with the consent of the shareholder.
SHARING INFORMATION WITH AFFILIATES
The Funds may share shareholder information with their affiliates in connection with servicing shareholders’ accounts, and subject to applicable law may provide shareholders with information about products and services that the Funds or their Advisers, distributors or their affiliates (“Service Affiliates”) believe may be of interest to such shareholders. The information that the Funds may share may include, for example, a shareholder’s participation in the Funds or in other investment programs sponsored by a Service Affiliate, a shareholder’s ownership of certain types of accounts (such as IRAs), information about the Funds’ experiences or transactions with a shareholder, information captured on applicable websites, or other data about a shareholder’s accounts, subject to applicable law. The Funds’ Service Affiliates, in turn, are not permitted to share shareholder information with
non-affiliated
entities, except as required or permitted by law.
PROCEDURES TO SAFEGUARD PRIVATE INFORMATION
The Funds take seriously the obligation to safeguard shareholder
non-public
personal information. In addition to this policy, the Funds have implemented procedures that are designed to restrict access to a shareholder’s
non-public
personal information to internal personnel who need to know that information to perform their jobs, such as servicing shareholder accounts or notifying shareholders of new products or services. Physical, electronic and procedural safeguards are in place to guard a shareholder’s
non-public
personal information.
INFORMATION COLLECTED FROM WEBSITES
The Funds or their service providers and partners may collect information from shareholders via websites they maintain. The information collected via websites maintained by the Funds or their service providers includes client
non-public
personal information.
CHANGES TO THE PRIVACY POLICY
From time to time, the Funds may update or revise this privacy policy. If there are changes to the terms of this privacy policy, documents containing the revised policy on the relevant website will be updated.
1
Amended as of June 25, 2020.
2
PIMCO Investments LLC (“PI”) serves as the Funds’ distributor and does not provide brokerage services or any financial advice to investors in the Funds solely because it distributes the Funds. This Privacy Policy applies to the activities of PI to the extent that PI regularly effects or engages in transactions with or for a shareholder of a series of a Trust who is the record owner of such shares. For purposes of this Privacy Policy, references to “the Funds” shall include PI when acting in this capacity.
3
When distributing this Policy, a Fund may combine the distribution with any similar distribution of its investment adviser’s privacy policy. The distributed, combined, policy may be written in the first person (
by using “we” instead of “the Funds”).
Pacific Investment Management Company LLC
650 Newport Center Drive,
State Street Bank and Trust Company
Transfer Agent, Dividend Paying Agent and Registrar
American Stock Transfer & Trust Company, LLC
Independent Registered Public Accounting Firm
PricewaterhouseCoopers LLP
1100 Walnut Street, Suite 1300
This report is submitted for the general information of the shareholders of the Funds listed on the Report cover.
CEF3010AR_063022
As of the end of the period covered by this report, the Registrant has adopted a code of ethics (the “Code”) that applies to the Registrant’s principal executive officer and principal financial officer. The Registrant did not grant any waivers, including implicit waivers, from any provisions of the Code to the principal executive officer or principal financial officer during the period covered by this report.
A copy of the Code is included as an exhibit to this report.
| Item 3. | Audit Committee Financial Expert. |
The Board of Trustees has determined that Joseph B. Kittredge, Jr., who serves on the Board’s Audit Oversight Committee, qualifies as an “audit committee financial expert” as such term is defined in the instructions to this Item 3. The Board has also determined that Mr. Kittredge is “independent” as such term is interpreted under this Item 3.
| Item 4. | Principal Accountant Fees and Services. |
| | | | | | |
(a) | | Fiscal Year Ended | | Audit Fees | | |
| | June 30, 2022 | | $ 294,718 |
| | June 30, 2021 | | $ 190,993 |
(b) | | Fiscal Year Ended | | Audit-Related Fees |
| | June 30, 2022 | | $ 365,950 |
| | June 30, 2021 | | $ 130,000 |
(c) | | Fiscal Year Ended | | Tax Fees (1) |
| | June 30, 2022 | | $ — |
| | June 30, 2021 | | $ — |
(d) | | Fiscal Year Ended | | All Other Fees (2) |
| | June 30, 2022 | | $ — |
| | June 30, 2021 | | $ — |
“Audit Fees” represents fees billed for each of the last two fiscal years for professional services rendered for the audit and review of the Registrant’s annual financial statements for those fiscal years or services that are normally provided by the accountant in connection with statutory or regulatory filings or engagements for those fiscal years.
“Audit-Related Fees” represents fees billed for each of the last two fiscal years for assurance and related services that are reasonably related to the performance of the audit or review of the Registrant’s financial statements, but not reported under “Audit Fees” above, and that include accounting consultations, agreed-upon procedure reports (inclusive of annual review of basic maintenance testing associated with the Preferred Shares), attestation reports and comfort letters for those fiscal years.
“Tax Fees” represents fees billed for each of the last two fiscal years for professional services related to tax compliance, tax advice and tax planning, including services relating to the filing or amendment of federal, state or local income tax returns, regulated investment company qualification reviews, and tax distribution and analysis reviews.
“All Other Fees” represents fees, if any, billed for other products and services rendered by the principal accountant to the Registrant other than those reported above under “Audit Fees,” “Audit-Related Fees” and “Tax Fees” for the last two fiscal years.
| | (1) | There were no “Tax Fees” for the last two fiscal years. |
| | (2) | There were no “All Other Fees” for the last two fiscal years. |
| | (e) | Pre-approval policies and procedures |
(1) The Registrant’s Audit Oversight Committee has adopted pre-approval policies and procedures (the “Procedures”) to govern the Audit Oversight Committee’s pre-approval of (i) all audit services and permissible non-audit services to be provided to the Registrant by its independent accountant, and (ii) all permissible non-audit services to be provided by such independent accountant to the Registrant’s investment adviser and to any entity controlling, controlled by, or under common control with the investment adviser that provides ongoing services to the Registrant (collectively, the “Service Affiliates”) if the services provided directly relate to the Registrant’s operations and financial reporting. In accordance with the Procedures, the Audit Oversight Committee is responsible for the engagement of the independent accountant to certify the Registrant’s financial statements for each fiscal year. With respect to the pre-approval of non-audit services provided to the Registrant and its Service Affiliates, the Procedures provide that the Audit Oversight Committee may annually pre-approve a list of types or categories of non-audit services that may be provided to the Registrant or its Service Affiliates, or the Audit Oversight Committee may pre-approve such services on a project-by-project basis as they arise. Unless a type of service has received general pre-approval, it will require specific pre-approval by the Audit Oversight Committee if it is to be provided by the independent accountant. The Procedures also permit the Audit Oversight Committee to delegate authority to one or more of its members to pre-approve any proposed non-audit services that have not been previously pre-approved by the Audit Oversight Committee, subject to the ratification by the full Audit Oversight Committee no later than its next scheduled meeting.
(2) With respect to the services described in paragraphs (b) through (d) of this Item 4, no amount was approved by the Audit Oversight Committee pursuant to paragraph (c)(7)(i)(C) of Rule 2-01 of Regulation S-X.
| | | | | | | | | | | | | | |
| | | | | Aggregate Non-Audit Fees Billed to Entity | |
| | Entity | | June 30, 2022 | | | | | | June 30, 2021 | |
| | | | | | | | | | | |
| | PIMCO Dynamic Income Fund | | $ | 365,950 | | | | | | | $ | 130,000 | |
| | Pacific Investment Management Company LLC (“PIMCO”) | | | 13,128,802 | | | | | | | | 15,411,504 | |
| | | | | | |
| | Totals | | $ | 13,494,752 | | | | | | | $ | 15,541,504 | |
| | | | | | | | | | | | | | |
| | (h) | The Registrant’s Audit Oversight Committee has considered whether the provision of non-audit services that were rendered to the Registrant’s investment adviser, and any entity controlling, controlled by, or under common control with the investment adviser that provides ongoing services to the Registrant which were not pre-approved (not requiring pre-approval) is compatible with maintaining the principal accountant’s independence. |
| Item 5. | Audit Committee of Listed Registrants. |
The Registrant has a separately-designated standing audit committee (known as the Audit Oversight Committee) established in accordance with Section 3(a)(58)(A) of the Securities Exchange Act of 1934, as amended. The Audit Oversight Committee is comprised of:
Sarah E. Cogan
Deborah A. DeCotis
Joseph B. Kittredge, Jr.
William B. Ogden, IV
Alan Rappaport
E. Grace Vandecruze
| Item 6. | Schedule of Investments. |
The information required by this Item 6 is included as part of the annual report to shareholders filed under Item 1 of this Form N-CSR.
| Item 7. | Disclosure of Proxy Voting Policies and Procedures for Closed-End Management Investment Companies. |
Policy Statement: PIMCO adopted a written proxy voting policy (“Proxy Policy”) as required by Rule 206(4)-6 under the Advisers Act. The Proxy Policy is intended to foster PIMCO’s compliance with its fiduciary obligations and applicable law.
The Proxy Policy applies to any voting or consent rights with respect to securities held in accounts over which PIMCO has discretionary voting authority. The Proxy Policy is designed in a manner reasonably expected to ensure that voting and consent rights are exercised in the best interests of PIMCO’s clients.
Overview: As a general matter, PIMCO will adhere to its fiduciary obligations for any proxies it has the authority to vote on behalf of its clients. Each proxy is voted on a case-by-case basis, taking into account relevant facts and circumstances. When considering client proxies1, PIMCO may determine not to vote a proxy in limited circumstances.
Equity Securities. 2 PIMCO has retained an Industry Service Provider (“ISP”) 3 to provide research and voting recommendations for proxies relating to Equity Securities in accordance with the ISP’s guidelines. By following the guidelines of an independent third party, PIMCO seeks to mitigate potential conflicts of interest PIMCO may have with respect to proxies covered by the ISP. PIMCO will follow the recommendations of the ISP unless: (i) the ISP does not provide a voting recommendation; or (ii) a PM/Analyst decides to override the ISP’s voting recommendation. In each case as described above, the Legal and Compliance department will review the proxy to determine whether an actual or potential conflict of interest exists. When the ISP does not provide a voting recommendation, the relevant PM/Analyst will make a determination regarding how, or if, the proxy will be voted by completing required documentation.
Fixed Income Securities. Fixed income securities can be processed as proxy ballots or corporate action-consents4 at the discretion of the issuer/ custodian. When processed as proxy ballots, the ISP generally does not provide a voting recommendation and their role is limited to election processing and recordkeeping. In such instances, any elections would follow the standard process discussed above for Equity Securities. When processed as corporate action-consents, the Legal and Compliance department will review all election forms to determine whether an actual or potential conflict of interest exists with respect to the PM’s consent election. PIMCO’s Credit Research and Portfolio Management Groups are responsible for issuing recommendations on how to vote proxy ballots and corporation action-consents with respect to fixed income securities.
Resolution of potential/identified conflicts of interest. The Proxy Policy permits PIMCO to seek to resolve material conflicts of interest by pursuing any one of several courses of action. With respect to material conflicts of interest between PIMCO and a client account, the Proxy Policy permits PIMCO to either: (i) convene a working group to assess and resolve the conflict (the “Proxy Working Group”); or (ii) vote in accordance with protocols previously established by the Proxy Policy, the Proxy Working Group and/or other relevant procedures approved by PIMCO’s Legal and Compliance department or PIMCO’s Conflict Committee with respect to specific types of conflicts.
PIMCO will supervise and periodically review its proxy voting activities and the implementation of the Proxy Policy. PIMCO’s Proxy Policy, and information about how PIMCO voted a client’s proxies, is available upon request.
ISP Oversight: Consistent with its fiduciary obligations, PIMCO will perform periodic due diligence and oversight of ISP’s engaged to provide PIMCO with proxy voting research and recommendations. PIMCO’s due diligence and oversight process includes, but is not limited to, the evaluation of: the ISP’s capacity and competency to provide proxy voting research and recommendations5 and the ISP’s compliance program.
Sub-Adviser Engagement: As an investment manager, PIMCO may exercise its discretion to engage a Sub-Adviser to provide portfolio management services to certain PIMCO-affiliated Funds. Consistent with its management responsibilities, the Sub-Adviser will assume the authority for voting proxies on behalf of PIMCO for these Funds. Sub-Advisers may utilize third parties to perform certain services related to their portfolio management responsibilities. As a fiduciary, PIMCO will maintain oversight of the investment management responsibilities (which may include proxy voting) performed by the Sub-Adviser and contracted third parties.
1 Proxies generally describe corporate action consent rights (relative to fixed income securities) and proxy voting ballots (relative to fixed income or equity securities) as determined by the issuer or custodian.
2 The term “Equity Securities” means common and preferred stock, including common and preferred shares issued by investment companies; it does not include debt securities convertible into equity securities.
3 The ISP for Equity Securities proxy voting is Institutional Shareholder Services (“ISS”), Inc., 1177 Avenue of the Americas 2nd Floor, New York NY 10036.
4 Voting or consent rights shall not include matters which are primarily decisions to buy or sell investments, such as tender offers, exchange offers, conversions, put options, redemptions, and Dutch auctions.
5 This includes the adequacy and quality of the ISP’s operational infrastructure as it relates to its process for seeking timely input from issuers and its voting methodologies.
| Item 8. | Portfolio Managers of Closed-End Management Investment Companies. |
(a)(1)
As of September 1, 2022, the following individuals have primary responsibility for the day-to-day management of the PIMCO Dynamic Income Fund (the “Fund”):
Daniel J. Ivascyn - Mr. Ivascyn has been the lead portfolio manager of the Fund since its inception in May 2012. Mr. Ivascyn is Group Chief Investment Officer and a managing director in the Newport Beach office. Prior to joining PIMCO in 1998, he worked at Bear Stearns in the asset-backed securities group, as well as T. Rowe Price and Fidelity Investments.
Joshua Anderson - Mr. Anderson has been a portfolio manager of the Fund since its inception in May 2012. Mr. Anderson is a managing director and portfolio manager in the London office, where he leads the European structured product group. He also oversees global structured credit investments. Previously, he was a structured product portfolio manager in the Newport Beach office. Prior to joining PIMCO in 2003, he was an analyst at Merrill Lynch covering both the residential ABS and collateralized debt obligation sectors and was ranked as one of the top analysts by Institutional Investor magazine. He was previously a portfolio manager at Merrill Lynch Investment Managers.
Alfred T. Murata - Mr. Murata has been a portfolio manager of the Fund since its inception in May 2012. Mr. Murata is a managing director in the Newport Beach office and a portfolio manager on the mortgage credit team. Prior to joining PIMCO in 2001, he researched and implemented exotic equity and interest rate derivatives at Nikko Financial Technologies.
(a)(2)
The following summarizes information regarding each of the accounts, excluding the Fund, managed by the Portfolio Managers as of June 30, 2021, including accounts managed by a team, committee, or other group that includes a Portfolio Manager. Unless mentioned otherwise, the advisory fee charged for managing each of the accounts listed below is not based on performance.
| | | | | | | | | | | | |
| | | Registered Investment
Companies | | Other Pooled Investment
Vehicles | | Other Accounts |
Portfolio Manager | | # | | AUM($million) | | # | | AUM($million) | | # | | AUM($million) |
Daniel J. Ivascyn1 | | 19 | | $159,182.37 | | 20 | | $83,564.87 | | 8 | | $2,604.04 |
Joshua Anderson2 | | 7 | | $129,492.45 | | 15 | | $18,979.79 | | 1 | | $0.11 |
Alfred T. Murata3 | | 20 | | $160,833.89 | | 19 | | $41,791.98 | | 4 | | $566.96 |
1 Of these Other Pooled Investment Vehicles, 9 accounts totaling $17,222.64 million in assets pay an advisory fee that is based in part on the performance of the accounts. Of these Other Accounts, 1 account totaling $286.90 million in assets pays an advisory fee that is based in part on the performance of the accounts.
2 Of these Other Pooled Investment Vehicles, 9 accounts totaling $12,954.03 million in assets pay an advisory fee that is based in part on the performance of the accounts.
3 Of these Other Pooled Investment Vehicles, 5 accounts totaling $9,877.10 million in assets pay an advisory fee that is based in part on the performance of the accounts.
From time to time, potential and actual conflicts of interest may arise between a portfolio manager’s management of the investments of the Fund, on the one hand, and the management of other accounts, on the other. Potential and actual conflicts of interest may also arise as a result of PIMCO’s other business activities and PIMCO’s possession of material non-public information about an issuer. Other accounts managed by a portfolio manager might have similar investment objectives or strategies as the Fund, track the same index as the Fund or otherwise hold, purchase, or sell securities that are eligible to be held, purchased or sold by the Fund. The other accounts might also have different investment objectives or strategies than the Fund. Potential and actual conflicts of interest may also arise as a result of PIMCO serving as investment adviser to accounts that invest in the Fund. In this case, such conflicts of interest could in theory give rise to incentives for PIMCO to, among other things, vote proxies of the Fund in a manner beneficial to the investing account but detrimental to the Fund. Conversely, PIMCO’s duties to the Fund, as well as regulatory or other limitations applicable to the Fund, may affect the courses of action available to PIMCO-advised accounts (including certain funds) that invest in the Fund in a manner that is detrimental to such investing accounts. In addition, regulatory restrictions, actual or potential conflicts of interest or other considerations may cause PIMCO to restrict or prohibit participation in certain investments.
Because PIMCO is affiliated with Allianz SE, a large multi-national financial institution, conflicts similar to those described below may occur between the Fund and other accounts managed by PIMCO and PIMCO’s affiliates or accounts managed by those affiliates. Those affiliates (or their clients), which generally operate autonomously from PIMCO, may take actions that are adverse to the Fund or other accounts managed by PIMCO. In many cases, PIMCO will not be in a position to mitigate those actions or address those conflicts, which could adversely affect the performance of the Fund or other accounts managed by PIMCO. In addition, because certain Clients (as defined below) are affiliates of PIMCO or have investors who are affiliates or employees of PIMCO, PIMCO may have incentives to resolve conflicts of interest in favor of these Clients over other Clients.
Knowledge and Timing of Fund Trades. A potential conflict of interest may arise as a result of the portfolio manager’s day-to-day management of the Fund. Because of their positions with the Fund, the portfolio managers know the size, timing and possible market impact of the Fund’s trades. It is theoretically possible that the portfolio managers could use this information to the advantage of other accounts they manage and to the possible detriment of the Fund.
Investment Opportunities. A potential conflict of interest may arise as a result of the portfolio manager’s management of a number of accounts with varying investment guidelines. Often, an investment opportunity may be suitable for both the Fund and other accounts managed by PIMCO (each, a “Client,” and collectively, the “Clients”), but may not be available in sufficient quantities for both the Fund and other Clients to participate fully. In addition, regulatory issues applicable to PIMCO or the Fund or other accounts may result in the Fund not receiving securities that may otherwise be appropriate for it. In addition, regulatory issues applicable to PIMCO or the Fund or other accounts may result in the Fund not receiving securities that may otherwise be appropriate for it. Similarly, there may be limited opportunity to sell an investment held by the Fund and another account. PIMCO has adopted policies and procedures reasonably designed to allocate investment opportunities on a fair and equitable basis over time.
Under PIMCO’s allocation procedures, investment opportunities are allocated among various investment strategies based on individual account investment guidelines and PIMCO’s investment outlook. PIMCO has also adopted additional procedures to complement the general trade allocation policy that are designed to address potential conflicts of interest due to the side-by-side management of the Fund and certain pooled investment vehicles, including investment opportunity allocation issues.
From time to time, PIMCO may take an investment position or action for a Client that may be different from, or inconsistent with, an action or position taken for one or more other Clients having similar or differing investment objectives. These positions and actions may adversely impact, or in some instances may benefit, one or more affected Clients, including Clients that are PIMCO affiliates, in which PIMCO has an interest, or which pays PIMCO higher fees or a performance fee. For example, a Client may buy a security and another Client may establish a short position in that same security. The subsequent short sale may result in a decrease in the price of the security that the other Client holds. Similarly, transactions or investments by one or more Clients may have the effect of diluting or otherwise disadvantaging the values, prices or investment strategies of another Client.
When PIMCO implements for one Client a portfolio decision or strategy ahead of, or contemporaneously with, similar portfolio decisions or strategies of another Client, market impact, liquidity constraints or other factors could result in one or more Clients receiving less favorable trading results, the costs of implementing such portfolio decisions or strategies could be increased or such Clients could otherwise be disadvantaged. On the other hand, potential conflicts may also arise because
portfolio decisions regarding a Client may benefit other Clients. For example, the sale of a long position or establishment of a short position for a Client may decrease the price of the same security sold short by (and therefore benefit) other Clients, and the purchase of a security or covering of a short position in a security for a Client may increase the price of the same security held by (and therefore benefit) other Clients.
Under certain circumstances, a Client may invest in a transaction in which one or more other Clients are expected to participate, or already have made or will seek to make, an investment. In addition, to the extent permitted by applicable law, a Client may also engage in investment transactions that may result in other Clients being relieved of obligations, or that may cause other Clients to divest certain investments (e.g., a Client may make a loan to, or directly or indirectly acquire securities or indebtedness of, a company that uses the proceeds to refinance or reorganize its capital structure, which could result in repayment of debt held by another Client). Such Clients (or groups of Clients) may have conflicting interests and objectives in connection with such investments, including with respect to views on the operations or activities of the issuer involved, the targeted returns from the investment and the timeframe for, and method of, exiting the investment. When making such investments, PIMCO may do so in a way that favors one Client over another Client, even if both Clients are investing in the same security at the same time. Certain Clients may invest on a “parallel” basis (i.e., proportionately in all transactions at substantially the same time and on substantially the same terms and conditions). In addition, other accounts may expect to invest in many of the same types of investments as another account. However, there may be investments in which one or more of such accounts does not invest (or invests on different terms or on a non-pro rata basis) due to factors such as legal, tax, regulatory, business, contractual or other similar considerations or due to the provisions of a Client’s governing documents. Decisions as to the allocation of investment opportunities among such Clients present numerous conflicts of interest, which may not be resolved in a manner that is favorable to a Client’s interests. To the extent an investment is not allocated pro rata among such entities, a Client could incur a disproportionate amount of income or loss related to such investment relative to such other Client.
In addition, Clients may invest alongside one another in the same underlying investments or otherwise pursuant to a substantially similar investment strategy as one or more other Clients. In such cases, certain Clients may have preferential liquidity and information rights relative to other Clients holding the same investments, with the result that such Clients will be able to withdraw/redeem their interests in underlying investments in priority to Clients who may have more limited access to information or more restrictive withdrawal/redemption rights. Clients with more limited information rights or more restrictive liquidity may therefore be adversely affected in the event of a downturn in the markets.
Further, potential conflicts may be inherent in PIMCO’s use of multiple strategies. For example, conflicts will arise in cases where different Clients invest in different parts of an issuer’s capital structure, including circumstances in which one or more Clients may own private securities or obligations of an issuer and other Clients may own or seek to acquire private securities of the same issuer. For example, a Client may acquire a loan, loan participation or a loan assignment of a particular borrower in which one or more other Clients have an equity investment, or may invest in senior debt obligations of an issuer for one Client and junior debt obligations or equity of the same issuer for another Client.
Conflicts potentially limiting the Fund’s investment opportunities may also arise when the Fund and other Clients invest in different parts of an issuer’s capital structure, such as when the Fund owns senior debt obligations of an issuer and other Clients own junior tranches of the same issuer. In such circumstances, decisions over whether to trigger an event of default, over the terms of any workout, or how to exit an investment may result in conflicts of interest. In order to minimize such conflicts, a portfolio manager may avoid certain investment opportunities that would potentially give rise to conflicts with other Clients or PIMCO may enact internal procedures designed to minimize such conflicts, which could have the effect of limiting the Fund’s investment opportunities. Additionally, if PIMCO acquires material non-public confidential information in connection with its business activities for other Clients, a portfolio manager may be restricted from purchasing securities or selling securities for the Fund. Moreover, the Fund or other accounts managed by PIMCO may invest in a transaction in which one or more other funds or accounts managed by PIMCO are expected to participate, or already have made or will seek to make, an investment. Such funds or accounts may have conflicting interests and objectives in connection with such investments, including, for example and without limitation, with respect to views on the operations or activities of the issuer involved, the targeted returns from the investment, and the timeframe for, and method of, exiting the investment. Additionally, a fund or other account managed by PIMCO may take an investment position or action that may be different from, or inconsistent with, an investment position or action taken by another fund or other account managed by PIMCO having similar or differing investment objectives. These positions and actions may adversely impact the Fund. For example, the Fund may buy a security and another fund or other account managed by PIMCO may establish a short position in that same security or in another security issued by the same issuer. The subsequent short sale may result in a decrease in the price of the security that the first fund holds. When making investment decisions where a conflict of interest may arise, PIMCO will endeavor to act in a fair and equitable manner as between the Fund and other Clients; however, in certain instances the resolution of the conflict may result in PIMCO acting on behalf of another Client in a manner that may not be in the best interest, or may be opposed to the best interest, of the Fund.
In each of the situations described above, PIMCO may take actions with respect to the assets held by one Client that are adverse to the other Clients, for example, by foreclosing on loans, by putting an issuer into default, or by exercising rights to purchase or sell to an issuer, causing an issuer to take actions adverse to certain classes of securities, or otherwise. In negotiating the terms and conditions of any such investments, or any subsequent amendments or waivers or taking any other actions, PIMCO may find that the interests of a Client and the interests of one or more other Clients could conflict. In these situations, decisions over items such as whether to make the investment or take an action, proxy voting, corporate reorganization, how to exit an investment, or bankruptcy or similar matters (including, for example, whether to trigger an event of default or the terms of any workout) may result in conflicts of interest. Similarly, if an issuer in which a Client and one or more other Clients directly or indirectly hold different classes of securities (or other assets, instruments or obligations issued by such issuer or underlying investments of such issuer) encounters financial problems, decisions over the terms of any workout will raise conflicts of interests (including, for example, conflicts over proposed waivers and amendments to debt covenants). For example, a debt holder may be better served by a liquidation of the issuer in which it may be paid in full, whereas an equity or junior bond holder might prefer a reorganization that holds the potential to create value for the equity holders. In some cases PIMCO may refrain from taking certain actions or making certain investments on behalf of Clients in order to avoid or mitigate certain conflicts of interest or to prevent adverse regulatory or other effects on PIMCO, or may sell investments for certain Clients (in each case potentially disadvantaging the Clients on whose behalf the actions are not taken, investments not made, or investments sold). In other cases, PIMCO may not refrain from taking actions or making investments on behalf of certain Clients that have the potential to disadvantage other Clients. In addition, PIMCO may take actions or refrain from taking actions in order to mitigate legal risks to PIMCO or its affiliates or its Clients even if disadvantageous to a Client’s account. Moreover, a Client may invest in a transaction in which one or more other Clients are expected to participate, or already have made or will seek to make, an investment.
Additionally, certain conflicts may exist with respect to portfolio managers who make investment decisions on behalf of several different types of Clients. Such portfolio managers may have an incentive to allocate trades, time or resources to certain Clients, including those Clients who pay higher investment management fees or that pay incentive fees or allocations, over other Clients. These conflicts may be heightened with respect to portfolio managers who are eligible to receive a performance allocation under certain circumstances as part of their compensation.
From time to time, PIMCO personnel may come into possession of material non-public information (“MNPI”) which, if disclosed, might affect an investor’s decision to buy, sell or hold a security. Should a PIMCO employee come into possession of MNPI with respect to an issuer, he or she generally will be prohibited from communicating such information to, or using such information for the benefit of, Clients, which could limit the ability of Clients to buy, sell or hold certain investments, thereby limiting the investment opportunities or exit strategies available to Clients. In addition, holdings in the securities or other instruments of an issuer by PIMCO or its affiliates may affect the ability of a Client to make certain acquisitions of or enter into certain transactions with such issuer. PIMCO has no obligation or responsibility to disclose such information to, or use such information for the benefit of, any person (including Clients).
PIMCO maintains one or more restricted lists of companies whose securities are subject to certain trading prohibitions due to PIMCO’s business activities. PIMCO may restrict trading in an issuer’s securities if the issuer is on a restricted list or if PIMCO has MNPI about that issuer. In some situations, PIMCO may restrict Clients from trading in a particular issuer’s securities in order to allow PIMCO to receive MNPI on behalf of other Clients. A Client may be unable to buy or sell certain securities until the restriction is lifted, which could disadvantage the Client. PIMCO may also be restricted from making (or divesting of) investments in respect of some Clients but not others. In some cases PIMCO may not initiate or recommend certain types of transactions, or may otherwise restrict or limit its advice relating to certain securities if a security is restricted due to MNPI or if PIMCO is seeking to limit receipt of MNPI.
PIMCO may conduct litigation or engage in other legal actions on behalf of one or more Clients. In such cases, Clients may be required to bear certain fees, costs, expenses and liabilities associated with the litigation. Other Clients that are or were investors in, or otherwise involved with, the subject investments may or may not (depending on the circumstances) be parties to such litigation actions, with the result that certain Clients may participate in litigation actions in which not all Clients with similar investments may participate, and such nonparticipating Clients may benefit from the results of such litigation actions without bearing or otherwise being subject to the associated fees, costs, expenses and liabilities. PIMCO, for example, typically does not pursue legal claims on behalf of its separate accounts. Furthermore, in certain situations, litigation or other legal actions pursued by PIMCO on behalf of a Client may be brought against or be otherwise adverse to a portfolio company or other investment held by a Client.
The foregoing is not a complete list of conflicts to which PIMCO or Clients may be subject. PIMCO seeks to review conflicts on a case-by-case basis as they arise. Any review will take into consideration the interests of the relevant Clients, the circumstances giving rise to the conflict, applicable PIMCO policies and procedures, and applicable laws. Clients (and
investors in the Fund) should be aware that conflicts will not necessarily be resolved in favor of their interests and may in fact be resolved in a manner adverse to their interests. PIMCO will attempt to resolve such matters fairly, but even so, matters may be resolved in favor of other Clients which pay PIMCO higher fees or performance fees or in which PIMCO or its affiliates have a significant proprietary interest. There can be no assurance that any actual or potential conflicts of interest will not result in a particular Client or group of Clients receiving less favorable investment terms in or returns from certain investments than if such conflicts of interest did not exist.
Certain service providers to the Fund are expected to be owned by or otherwise related to or affiliated with a Client, and in certain cases, such service providers are expected to be, or are owned by, employed by, or otherwise related to, PIMCO, Allianz SE, their affiliates and/or their respective employees, consultants and other personnel. PIMCO may, in its sole discretion, determine to provide, or engage or recommend an affiliate of PIMCO to provide, certain services to the Fund, instead of engaging or recommending one or more third parties to provide such services. Subject to the governance requirements of a particular fund and applicable law, PIMCO or its affiliates, as applicable, will receive compensation in connection with the provision of such services. As a result, PIMCO faces a conflict of interest when selecting or recommending service providers for the Fund. Fees paid to an affiliated service provider will be determined in PIMCO’s commercially reasonable discretion, taking into account the relevant facts and circumstances, and consistent with PIMCO’s responsibilities. Although PIMCO has adopted various policies and procedures intended to mitigate or otherwise manage conflicts of interest with respect to affiliated service providers, there can be no guarantee that such policies and procedures (which may be modified or terminated at any time in PIMCO’s sole discretion) will be successful.
Performance Fees. A portfolio manager may advise certain accounts with respect to which the management fee is based entirely or partially on performance. Performance fee arrangements may create a conflict of interest for the portfolio manager in that the portfolio manager may have an incentive to allocate the investment opportunities that he or she believes might be the most profitable to such other accounts instead of allocating them to the Fund. PIMCO has adopted policies and procedures reasonably designed to allocate investment opportunities between the Fund and such other accounts on a fair and equitable basis over time.
(a)(3)
As of June 30, 2022, the following explains the compensation structure of the individuals who have primary responsibility for day-to-day portfolio management of the Fund:
Portfolio Manager Compensation
PIMCO’s approach to compensation seeks to provide professionals with a Total Compensation Plan and process that is driven by PIMCO’s mission and CORE values of collaboration, openness, responsibility and excellence. Key Principles on Compensation Philosophy include:
| | • | | PIMCO’s compensation practices are designed to attract and retain high performers; |
| | • | | PIMCO’s compensation philosophy embraces a corporate culture of rewarding behaviors aligned to our CORE values; |
| | • | | PIMCO’s goal is to ensure key professionals are aligned to PIMCO’s long-term success through awards linked to firm performance; and |
| | • | | PIMCO’s “Discern and Differentiate” discipline incorporates individual performance rating to guide total compensation. |
The Total Compensation Plan consists of three components. The compensation program for portfolio managers is designed to align with clients’ interests, emphasizing each portfolio manager’s ability to generate long-term investment success for PIMCO’s clients. A portfolio manager’s compensation is not based solely on the performance of any Fund or any other account managed by that portfolio manager:
Base Salary – Base salary is determined based on core job responsibilities, positions/levels and market factors. Base salary levels are reviewed annually, when there is a significant change in job responsibilities or position, or a significant change in market levels.
Performance Bonus – Performance bonuses are designed to reward risk-adjusted performance and contributions to PIMCO’s broader investment process. The compensation process is not formulaic and the following non-exhaustive list of qualitative and quantitative criteria are considered when determining the total compensation for portfolio managers:
| | • | | Performance measured over a variety of longer- and shorter-term periods, including 5-year, 4-year, 3-year, 2-year and 1-year dollar-weighted and account-weighted, pre-tax total and risk-adjusted investment performance as judged against the applicable benchmarks (which may include internal investment performance-related benchmarks) for each account managed by a portfolio manager (including the Fund) and relative to applicable industry peer groups; |
| | greatest emphasis is placed on 5-year and 3-year performance, followed by 1-year performance; |
| | • | | Consistency of investment performance across portfolios of similar mandate and guidelines, rewarding low dispersion and consistency of outperformance; |
| | • | | Appropriate risk positioning and risk management mindset which includes consistency with PIMCO’s investment philosophy, the Investment Committee’s positioning guidance, absence of defaults, and appropriate alignment with client objectives; |
| | • | | Contributions to mentoring, coaching and/or supervising members of team; |
| | • | | Collaboration, idea generation, and contribution of investment ideas in the context of PIMCO’s investment process, Investment Committee meetings, and day-to-day management of portfolios; |
| | • | | With much lesser importance than the aforementioned factors: amount and nature of assets managed by the portfolio manager, contributions to asset retention, and client satisfaction. |
PIMCO’s partnership culture further rewards strong long term risk adjusted returns with promotion decisions almost entirely tied to long term contributions to the investment process. 10-year performance can also be considered, though not explicitly as part of the compensation process.
Deferred Compensation – The Long Term Incentive Plan (“LTIP”) is awarded to key professionals. Employees who reach a total compensation threshold are delivered their annual compensation in a mix of cash and/or deferred compensation. PIMCO incorporates a progressive allocation of deferred compensation as a percentage of total compensation, which is in line with market practices.
| | • | | The LTIP provides participants with deferred cash awards that appreciate or depreciate based on PIMCO’s operating earnings over a rolling three-year period. The plan provides a link between longer term company performance and participant pay, further motivating participants to make a long term commitment to PIMCO’s success. |
Prior to March 2020, M Options were awarded to key professionals. The M Unit program provided mid-to-senior level employees with the potential to acquire an equity stake in PIMCO over their careers to better align employee incentives with the Firm’s long-term results. Options awarded under the program vest over a number of years and may be converted into non-voting PIMCO equity which shares in the profit distributions of the Firm.
Eligibility to participate in the LTIP is contingent upon continued employment at PIMCO and all other applicable eligibility requirements.
Profit Sharing Plan. Portfolio managers who are Managing Directors of PIMCO receive compensation from a non-qualified profit sharing plan consisting of a portion of PIMCO’s net profits. Portfolio managers who are Managing Directors receive an amount determined by the Compensation Committee, based upon an individual’s overall contribution to the firm.
(a)(4)
The following summarizes the dollar range of securities of the Fund the Portfolio Managers beneficially owned as of June 30, 2022:
| | |
| Portfolio Manager | | Dollar Range of Equity Securities of the Fund Owned
as of June 30, 2022 |
| Daniel J. Ivascyn | | over $1,000,000 |
| Joshua Anderson | | $100,001-$500,000 |
| Alfred T. Murata | | $100,001-$500,000 |
| Item 9. | Purchases of Equity Securities by Closed-End Management Investment Company and Affiliated Purchasers. |
None.
| Item 10. | Submission of Matters to a Vote of Security Holders. |
There have been no material changes to the procedures by which shareholders may recommend nominees to the Fund’s Board of Trustees since the Fund last provided disclosure in response to this item.
| Item 11. | Controls and Procedures. |
| | (a) | The principal executive officer and principal financial & accounting officer have concluded as of a date within 90 days of the filing date of this report, based on their evaluation of the Registrant’s disclosure controls and procedures (as defined in Rule 30a-3(c) under the 1940 Act), that the design of such procedures is effective to provide reasonable assurance that material information required to be disclosed by the Registrant on Form N-CSR is recorded, processed, summarized and reported within the time periods specified in the Commission’s rules and forms. |
| | (b) | There were no changes in the Registrant’s internal control over financial reporting (as defined in Rule 30a-3(d) under the 1940 Act (17 CFR 270.30a-3(d))) that occurred during the last fiscal quarter of the period covered by this report that have materially affected, or are reasonably likely to materially affect, the Registrant’s internal control over financial reporting. |
| Item 12. | Disclosure of Securities Lending Activities for Closed-End Management Investment Companies. |
None.
Signatures
Pursuant to the requirements of the Securities Exchange Act of 1934 and the Investment Company Act of 1940, the registrant has duly caused this report to be signed on its behalf by the undersigned, thereunto duly authorized.
| | | | |
| PIMCO Dynamic Income Fund |
| |
| By: | | /s/ Eric D. Johnson |
| | Eric D. Johnson |
| | President (Principal Executive Officer) |
| |
| Date: | | September 1, 2022 |
Pursuant to the requirements of the Securities Exchange Act of 1934 and the Investment Company Act of 1940, this report has been signed below by the following persons on behalf of the registrant and in the capacities and on the dates indicated.
| | | | |
| By: | | /s/ Eric D. Johnson |
| | Eric D. Johnson |
| | President (Principal Executive Officer) |
| |
| Date: | | September 1, 2022 |
| |
| By: | | /s/ Bijal Y. Parikh |
| | Bijal Y. Parikh |
| | Treasurer (Principal Financial & Accounting Officer) |
| |
| Date: | | September 1, 2022 |