Item 1. | Reports to Shareholders. |

| Page | ||||||||
| 2 | ||||||||
| 3 | ||||||||
| 18 | ||||||||
| 20 | ||||||||
| 22 | ||||||||
| 23 | ||||||||
| 24 | ||||||||
| 25 | ||||||||
| 26 | ||||||||
| 28 | ||||||||
| 30 | ||||||||
| 31 | ||||||||
| 112 | ||||||||
| 147 | ||||||||
| 148 | ||||||||
| 149 | ||||||||
| 150 | ||||||||
| 152 | ||||||||
| 154 | ||||||||
| 155 | ||||||||
| 157 | ||||||||
| 160 | ||||||||
| 188 | ||||||||
| 221 | ||||||||
| 222 | ||||||||
| 223 | ||||||||
| 227 | ||||||||
| 231 | ||||||||
| 237 | ||||||||
| Fund | Fund Summary | Schedule of Investments | ||||||
| 8 | 32 | |||||||
| 9 | 41 | |||||||
| �� | 10 | 54 | ||||||
| 11 | 66 | |||||||
| 12 | 75 | |||||||
| 15 | 99 | |||||||
(1) | Consolidated Schedule of Investments |
Market Insights |
 |  | |
 |  | |
| Deborah A. DeCotis | Eric D. Johnson | |
| Chair of the Board of Trustees | President | |
Total Returns of Certain Asset Classes for the Period Ended June 30, 2023 | ||
| Asset Class (as measured by, currency) | 12-Month | |
| U.S. large cap equities (S&P 500 Index, USD) | 19.59% | |
| Global equities (MSCI World Index, USD) | 18.51% | |
| European equities (MSCI Europe Index, EUR) | 16.72% | |
| Emerging market equities (MSCI Emerging Markets Index, EUR) | 1.75% | |
| Japanese equities (Nikkei 225 Index, JPY) | 28.61% | |
| Emerging market local bonds (JPMorgan Government Bond Index-Emerging Markets Global Diversified Index, USD Unhedged) | 11.38% | |
| Emerging market external debt (JPMorgan Emerging Markets Bond Index (EMBI) Global, USD Hedged) | 6.85% | |
Below investment grade bonds (ICE BofAML Developed Markets High Yield Constrained Index, USD Hedged) | 9.48% | |
| Global investment grade credit bonds (Bloomberg Global Aggregate Credit Index, USD Hedged) | 1.36% | |
| Fixed-rate, local currency government debt of investment grade countries (Bloomberg Global Treasury Index, USD Hedged) | 0.07% | |
2 | PIMCO CLOSED-END FUNDS |
Important Information About the Funds |
ANNUAL REPORT | | | JUNE 30, 2023 | 3 |
Important Information About the Funds | (Cont.) |
4 | PIMCO CLOSED-END FUNDS |
Fund Name | Inception Date | Diversification Status | ||||||||||
| PCM Fund, Inc. | 09/02/93 | Diversified | ||||||||||
PIMCO Global StocksPLUS ® | 05/31/05 | Diversified | ||||||||||
| PIMCO Strategic Income Fund, Inc. | 02/24/94 | Diversified | ||||||||||
| PIMCO Access Income Fund | 01/31/22 | Non-Diversified | ||||||||||
| PIMCO Dynamic Income Fund | 05/30/12 | Diversified | ||||||||||
| PIMCO Dynamic Income Opportunities Fund | 01/29/21 | Non-Diversified | ||||||||||
1 | Hereinafter, the terms “Trustee” or “Trustees” used herein shall refer to a Director or Directors of applicable Funds. |
ANNUAL REPORT | | | JUNE 30, 2023 | 5 |
Important Information About the Funds | (Cont.) |
6 | PIMCO CLOSED-END FUNDS |
ANNUAL REPORT | | | JUNE 30, 2023 | 7 |
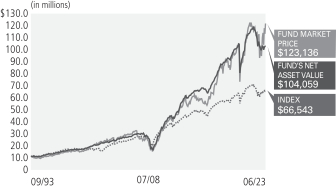
Symbol on NYSE - PCM |
| Asset-Backed Securities | 34.8% | |||
Non-Agency Mortgage-Backed Securities | 26.4% | |||
| Loan Participations and Assignments | 14.1% | |||
| Corporate Bonds & Notes | 12.3% | |||
| Short-Term Instruments | 5.4% | |||
| U.S. Government Agencies | 2.5% | |||
| Common Stocks | 2.2% | |||
| Other | 2.3% | |||
† | % of Investments, at value. |
§ | Allocation Breakdown and % of investments exclude securities sold short and financial derivative instruments, if any. |
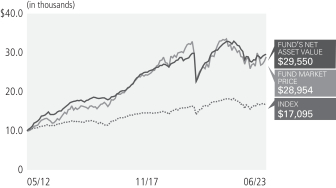
Average Annual Total Return (1) for the period ended June 30, 2023 | ||||||||||||||||||
| 1 Year | 5 Year | 10 Year | Commencement of Operations (09/02/93) | |||||||||||||||
 | Market Price | 16.30% | 6.42% | 8.50% | 8.78% | |||||||||||||
 | NAV | 0.45% | 2.57% | 5.76% | 8.17% | |||||||||||||
 | ICE BofAML US High Yield Index | 8.87% | 3.18% | 4.34% | 6.57% ¨ | |||||||||||||
¨ | Average Annual Return since 08/31/1993. |
(1) | Performance quoted represents past performance. Past performance is not a guarantee or a reliable indicator of future results. Current performance may be lower or higher than performance shown. Investment return and the principal value of an investment will fluctuate. Returns shown do not reflect the deduction of taxes that a shareholder would pay on Fund distributions or the sale of Fund shares. Total return, market price, NAV, market price distribution rate, and NAV distribution rate will fluctuate with changes in market conditions. The NAV presented may differ from the NAV reported for the same period in other Fund materials. Performance current to the most recent month-end is available at www.pimco.com or via (844)33-PIMCO. Performance is calculated assuming all dividends and distributions are reinvested at prices obtained under the Fund’s dividend reinvestment plan. Performance does not reflect any brokerage commissions in connection with the purchase or sale of Fund shares. |
Performance of an index is shown in light of a requirement by the Securities and Exchange Commission that the performance of an appropriate broad-based securities market index be disclosed. However, the Fund is not managed to an index nor should the index be viewed as a “benchmark” for the Fund’s performance. The index is not intended to be indicative of the Fund’s investment strategies, portfolio components or past or future performance. Please see Additional Information Regarding the Funds for a description of the Fund’s principal investment strategies. |
(2) | Distribution rates are not performance and are calculated by annualizing the most recent distribution per share and dividing by the NAV or Market Price, as applicable, as of the reported date. Distributions may be comprised of ordinary income, net capital gains, and/or a return of capital (ROC) of your investment in the Fund. Because the distribution rate may include a ROC, it should not be confused with yield or income. If the Fund estimates that a portion of its distribution may be comprised of amounts from sources other than net investment income in accordance with its policies and good accounting practices, the Fund will notify shareholders of the estimated composition of such distribution through a Section 19 Notice. Please refer to the most recent Section 19 Notice, if applicable, for additional information regarding the estimated composition of distributions. Please visit www.pimco.com for most recent Section 19 Notice, if applicable. Final determination of a distribution’s tax character will be provided to shareholders when such information is available. |
(3) | Represents total effective leverage outstanding, as a percentage of total managed assets. Total effective leverage consists of preferred shares, reverse repurchase agreements and other borrowings, credit default swap notional and floating rate notes issued in tender option bond transactions, as applicable (collectively “Total Effective Leverage”). The Fund may engage in other transactions not included in Total Effective Leverage disclosed above that may give rise to a form of leverage, including certain derivative transactions. For the purpose of calculating Total Effective Leverage outstanding as a percentage of total managed assets, total managed assets refer to total assets (including assets attributable to Total Effective Leverage that may be outstanding) minus accrued liabilities (other than liabilities representing Total Effective Leverage). |
| Market Price | $9.63 | |||
| NAV | $6.76 | |||
| Premium/(Discount) to NAV | 42.46% | |||
Market Price Distribution Rate (2) | 9.97% | |||
NAV Distribution Rate (2) | 14.20% | |||
Total Effective Leverage (3) | 46.37% | |||
| » | Exposure to the corporate credit sector contributed to absolute performance, as the sector posted positive performance. |
| » | Security selection within agency and non-agency mortgage-backed securities contributed to absolute performance, as the securities posted positive returns. |
| » | Exposure to holdings related to special situation investments, which may include companies undergoing stress, distress, challenges, or significant transition, contributed to absolute performance, as the securities posted positive returns. |
| » | Security selection within asset-backed securities detracted from absolute performance, as the securities posted negative returns. |
| » | Long interest rate positioning at the short to intermediate portion of the curve detracted from performance, as rates rose. |
| » | Exposure to re-performing residential mortgage loans detracted from performance, as the sector posted negative performance. |
8 | PIMCO CLOSED-END FUNDS |
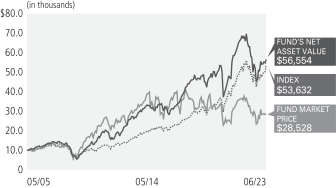
Symbol on NYSE - PGP |
| U.S. Government Agencies | 29.6% | |||
| Corporate Bonds & Notes | 21.0% | |||
| Loan Participations and Assignments | 14.9% | |||
| Short-Term Instruments | 12.4% | |||
Non-Agency Mortgage-Backed Securities | 10.2% | |||
| Asset-Backed Securities | 4.2% | |||
| Preferred Securities | 2.7% | |||
| Common Stocks | 1.7% | |||
| Sovereign Issues | 1.5% | |||
| Other | 1.8% | |||
† | % of Investments, at value. |
§ | Allocation Breakdown and % of investments exclude securities sold short and financial derivative instruments, if any. |
Average Annual Total Return (1) for the period ended June 30, 2023 | ||||||||||||||||||
| 1 Year | 5 Year | 10 Year | Commencement of Operations (05/31/05) | |||||||||||||||
| Market Price | 2.32% | (4.39)% | (0.31)% | 5.97% | |||||||||||||
| NAV | 13.15% | 4.04% | 8.06% | 10.06% | |||||||||||||
| S&P 500 Index | 19.59% | 12.31% | 12.86% | 9.73% | |||||||||||||
(1) | Performance quoted represents past performance. Past performance is not a guarantee or a reliable indicator of future results. Current performance may be lower or higher than performance shown. Investment return and the principal value of an investment will fluctuate. Returns shown do not reflect the deduction of taxes that a shareholder would pay on Fund distributions or the sale of Fund shares. Total return, market price, NAV, market price distribution rate, and NAV distribution rate will fluctuate with changes in market conditions. The NAV presented may differ from the NAV reported for the same period in other Fund materials. Performance current to the most recent month-end is available at www.pimco.com or via (844)33-PIMCO. Performance is calculated assuming all dividends and distributions are reinvested at prices obtained under the Fund’s dividend reinvestment plan. Performance does not reflect any brokerage commissions in connection with the purchase or sale of Fund shares. |
Performance of an index is shown in light of a requirement by the Securities and Exchange Commission that the performance of an appropriate broad-based securities market index be disclosed. However, the Fund is not managed to an index nor should the index be viewed as a “benchmark” for the Fund’s performance. The index is not intended to be indicative of the Fund’s investment strategies, portfolio components or past or future performance. Please see Additional Information Regarding the Funds for a description of the Fund’s principal investment strategies. |
(2) | Distribution rates are not performance and are calculated by annualizing the most recent distribution per share and dividing by the NAV or Market Price, as applicable, as of the reported date. Distributions may be comprised of ordinary income, net capital gains, and/or a return of capital (ROC) of your investment in the Fund. Because the distribution rate may include a ROC, it should not be confused with yield or income. If the Fund estimates that a portion of its distribution may be comprised of amounts from sources other than net investment income in accordance with its policies and good accounting practices, the Fund will notify shareholders of the estimated composition of such distribution through a Section 19 Notice. Please refer to the most recent Section 19 Notice, if applicable, for additional information regarding the estimated composition of distributions. Please visit www.pimco.com for most recent Section 19 Notice, if applicable. Final determination of a distribution’s tax character will be provided to shareholders when such information is available. |
(3) | Represents total effective leverage outstanding, as a percentage of total managed assets. Total effective leverage consists of preferred shares, reverse repurchase agreements and other borrowings, credit default swap notional and floating rate notes issued in tender option bond transactions, as applicable (collectively “Total Effective Leverage”). The Fund may engage in other transactions not included in Total Effective Leverage disclosed above that may give rise to a form of leverage, including certain derivative transactions. For the purpose of calculating Total Effective Leverage outstanding as a percentage of total managed assets, total managed assets refer to total assets (including assets attributable to Total Effective Leverage that may be outstanding) minus accrued liabilities (other than liabilities representing Total Effective Leverage). |
| Market Price | $7.20 | |||
| NAV | $7.32 | |||
| Premium/(Discount) to NAV | (1.64)% | |||
Market Price Distribution Rate (2) | 11.50% | |||
NAV Distribution Rate (2) | 11.31% | |||
Total Effective Leverage (3) | 23.16% | |||
| » | Exposure to equity index derivatives linked to the S&P 500 Index contributed to absolute performance, as the index posted positive performance. |
| » | Exposure to equity index derivatives linked to the MSCI EAFE Index contributed to absolute performance, as the index posted positive performance. |
| » | Exposure to holdings related to corporate special situation investments, which include companies undergoing stress, distress, challenges, or significant transition, contributed to absolute performance, as the securities posted positive returns. |
| » | Security selection within residential mortgage securities detracted from absolute performance, as the securities posted negative returns. |
| » | Exposure to holdings related to emerging market special situation investments, which include companies undergoing stress, distress, challenges, or significant transition in emerging markets, detracted from absolute performance, as the securities posted negative returns. |
| » | Security selection within asset-backed securities detracted from absolute performance, as the securities posted negative returns. |
ANNUAL REPORT | | | JUNE 30, 2023 | 9 |
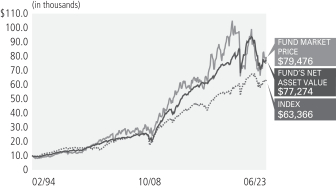
Symbol on NYSE - RCS |
| U.S. Government Agencies | 55.1% | |||
| Corporate Bonds & Notes | 16.5% | |||
Non-Agency Mortgage-Backed Securities | 10.6% | |||
| Loan Participations and Assignments | 8.0% | |||
| Asset-Backed Securities | 2.7% | |||
| Short-Term Instruments | 2.3% | |||
| Common Stocks | 1.8% | |||
| Preferred Securities | 1.2% | |||
| Other | 1.8% | |||
† | % of Investments, at value. |
§ | Allocation Breakdown and % of investments exclude securities sold short and financial derivative instruments, if any. |
Average Annual Total Return (1) for the period ended June 30, 2023 | ||||||||||||||||||
| 1 Year | 5 Year | 10 Year | Commencement of Operations (02/24/94) | |||||||||||||||
| Market Price | 14.43% | (2.48)% | 3.30% | 7.32% | |||||||||||||
| NAV | 5.55% | 0.73% | 3.92% | 7.21% | |||||||||||||
| ICE BofAML US High Yield Index | 8.87% | 3.18% | 4.34% | 6.49% ¨ | |||||||||||||
¨ | Average Annual Return since 2/28/1994. |
(1) | Performance quoted represents past performance. Past performance is not a guarantee or a reliable indicator of future results. Current performance may be lower or higher than performance shown. Investment return and the principal value of an investment will fluctuate. Returns shown do not reflect the deduction of taxes that a shareholder would pay on Fund distributions or the sale of Fund shares. Total return, market price, NAV, market price distribution rate, and NAV distribution rate will fluctuate with changes in market conditions. Performance current to the most recent month-end is available at www.pimco.com or via (844)33-PIMCO. Performance is calculated assuming all dividends and distributions are reinvested at prices obtained under the Fund’s dividend reinvestment plan. Performance does not reflect any brokerage commissions in connection with the purchase or sale of Fund shares. |
The performance information shown for the Fund includes historical performance information for the periods prior to February 8, 2002, during which the Fund had a different investment manager. As of February 8, 2002, PIMCO became the Fund’s investment manager. The Fund’s performance prior to that time may have been different if the Fund were advised by PIMCO. |
Performance of an index is shown in light of a requirement by the Securities and Exchange Commission that the performance of an appropriate broad-based securities market index be disclosed. However, the Fund is not managed to an index nor should the index be viewed as a “benchmark” for the Fund’s performance. The index is not intended to be indicative of the Fund’s investment strategies, portfolio components or past or future performance. Please see Additional Information Regarding the Funds for a description of the Fund’s principal investment strategies. |
(2) | Distribution rates are not performance and are calculated by annualizing the most recent distribution per share and dividing by the NAV or Market Price, as applicable, as of the reported date. Distributions may be comprised of ordinary income, net capital gains, and/or a return of capital (ROC) of your investment in the Fund. Because the distribution rate may include a ROC, it should not be confused with yield or income. If the Fund estimates that a portion of its distribution may be comprised of amounts from sources other than net investment income in accordance with its policies and good accounting practices, the Fund will notify shareholders of the estimated composition of such distribution through a Section 19 Notice. Please refer to the most recent Section 19 Notice, if applicable, for additional information regarding the estimated composition of distributions. Please visit www.pimco.com for most recent Section 19 Notice, if applicable. Final determination of a distribution’s tax character will be provided to shareholders when such information is available. |
(3) | Represents total effective leverage outstanding, as a percentage of total managed assets. Total effective leverage consists of preferred shares, reverse repurchase agreements and other borrowings, credit default swap notional and floating rate notes issued in tender option bond transactions, as applicable (collectively “Total Effective Leverage”). The Fund may engage in other transactions not included in Total Effective Leverage disclosed above that may give rise to a form of leverage, including certain derivative transactions. For the purpose of calculating Total Effective Leverage outstanding as a percentage of total managed assets, total managed assets refer to total assets (including assets attributable to Total Effective Leverage that may be outstanding) minus accrued liabilities (other than liabilities representing Total Effective Leverage). |
| Market Price | $5.20 | |||
| NAV | $4.32 | |||
| Premium/(Discount) to NAV | 20.37% | |||
Market Price Distribution Rate (2) | 11.77% | |||
NAV Distribution Rate (2) | 14.17% | |||
Total Effective Leverage (3) | 33.74% | |||
| » | Interest rate exposure, most notably short exposure focused in the intermediate and long portions of the curve, contributed to absolute performance, as rates rose. |
| » | Exposure to emerging market debt contributed to absolute performance, as the sector posted positive performance. |
| » | Exposure to holdings related to corporate special situation investments, which may include companies undergoing stress, distress, challenges, or significant transition, contributed to absolute performance, as the securities posted positive returns. |
| » | Exposure to agency residential mortgage-backed securities detracted from absolute performance, as the sector posted negative performance. |
| » | Exposure to holdings related to emerging market special situation investments, which may include companies undergoing stress, distress, challenges, or significant transition in emerging markets, detracted from absolute performance, as the securities posted negative returns. |
| » | Security selection within bank capital detracted from absolute performance, as the securities posted negative returns. |
10 | PIMCO CLOSED-END FUNDS |
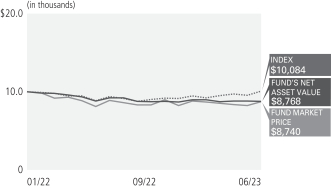
Symbol on NYSE - PAXS |
Non-Agency Mortgage-Backed Securities | 31.0% | |||
| Loan Participations and Assignments | 18.7% | |||
| Asset-Backed Securities | 18.6% | |||
| Short-Term Instruments | 13.9% | |||
| Corporate Bonds & Notes | 13.6% | |||
| Municipal Bonds & Notes | 1.6% | |||
| Other | 2.6% | |||
† | % of Investments, at value. |
§ | Allocation Breakdown and % of investments exclude securities sold short and financial derivative instruments, if any. |
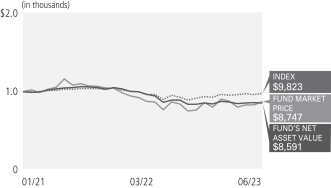
| Average Annual Total Return (1) for the period ended June 30, 2023 | ||||||||||
| 1 Year | Commencement of Operations (01/31/22) | |||||||||
| Market Price | 7.53% | (9.10)% | |||||||
| NAV | (0.78)% | (8.90)% | |||||||
| ICE BofAML US High Yield Index | 8.87% | (2.68)% | |||||||
(1) | Performance quoted represents past performance. Past performance is not a guarantee or a reliable indicator of future results. Current performance may be lower or higher than performance shown. Investment return and the principal value of an investment will fluctuate. Returns shown do not reflect the deduction of taxes that a shareholder would pay on Fund distributions or the sale of Fund shares. Total return, market price, NAV, market price distribution rate, and NAV distribution rate will fluctuate with changes in market conditions. Performance current to the most recent month-end is available at www.pimco.com or via (844)33-PIMCO. Performance is calculated assuming all dividends and distributions are reinvested at prices obtained under the Fund’s dividend reinvestment plan. Performance does not reflect any brokerage commissions in connection with the purchase or sale of Fund shares. |
Performance of an index is shown in light of a requirement by the Securities and Exchange Commission that the performance of an appropriate broad-based securities market index be disclosed. However, the Fund is not managed to an index nor should the index be viewed as a “benchmark” for the Fund’s performance. The index is not intended to be indicative of the Fund’s investment strategies, portfolio components or past or future performance. Please see Additional Information Regarding the Funds for a description of the Fund’s principal investment strategies. |
(2) | Distribution rates are not performance and are calculated by annualizing the most recent distribution per share and dividing by the NAV or Market Price, as applicable, as of the reported date. Distributions may be comprised of ordinary income, net capital gains, and/or a return of capital (ROC) of your investment in the Fund. Because the distribution rate may include a ROC, it should not be confused with yield or income. If the Fund estimates that a portion of its distribution may be comprised of amounts from sources other than net investment income in accordance with its policies and good accounting practices, the Fund will notify shareholders of the estimated composition of such distribution through a Section 19 Notice. Please refer to the most recent Section 19 Notice, if applicable, for additional information regarding the estimated composition of distributions. Please visit www.pimco.com for most recent Section 19 Notice, if applicable. Final determination of a distribution’s tax character will be provided to shareholders when such information is available. |
(3) | Represents total effective leverage outstanding, as a percentage of total managed assets. Total effective leverage consists of preferred shares, reverse repurchase agreements and other borrowings, credit default swap notional and floating rate notes issued in tender option bond transactions, as applicable (collectively “Total Effective Leverage”). The Fund may engage in other transactions not included in Total Effective Leverage disclosed above that may give rise to a form of leverage, including certain derivative transactions. For the purpose of calculating Total Effective Leverage outstanding as a percentage of total managed assets, total managed assets refer to total assets (including assets attributable to Total Effective Leverage that may be outstanding) minus accrued liabilities (other than liabilities representing Total Effective Leverage). |
| Market Price | $14.75 | |||
| NAV | $14.89 | |||
| Premium/(Discount) to NAV | (0.94)% | |||
Market Price Distribution Rate (2) | 12.15% | |||
NAV Distribution Rate (2) | 12.04% | |||
Total Effective Leverage (3) | 43.74% | |||
| » | Holdings related to corporate special situation investments, which may include companies undergoing stress, distress, challenges, or significant transition, contributed to absolute performance, as select securities posted positive returns. |
| » | Exposure to corporate credit, notably bank loans and high yield, contributed to absolute performance, as the asset classes posted positive returns. |
| » | Exposure to residential mortgage credit, contributed to absolute performance, as spreads tightened. |
| » | Security selection within asset-backed securities detracted from absolute performance, as select securities posted negative returns. |
| » | Holdings related to emerging market special situation investments, which may include companies undergoing stress, distress, challenges, or significant transition, detracted from absolute performance, as select securities posted negative returns. |
| » | Exposure to the commercial mortgage credit sector detracted from absolute performance, as the sector posted negative performance. |
ANNUAL REPORT | | | JUNE 30, 2023 | 11 |
Symbol on NYSE - PDI |
Non-Agency Mortgage-Backed Securities | 27.4% | |||
| Loan Participations and Assignments | 22.5% | |||
| Corporate Bonds & Notes | 17.6% | |||
| Asset-Backed Securities | 17.3% | |||
| Short-Term Instruments | 5.9% | |||
| Common Stocks | 2.6% | |||
| Preferred Securities | 1.9% | |||
| Municipal Bonds & Notes | 1.3% | |||
| U.S. Government Agencies | 1.1% | |||
| Sovereign Issues | 1.0% | |||
| Other | 1.4% | |||
† | % of Investments, at value. |
§ | Allocation Breakdown and % of investments exclude securities sold short and financial derivative instruments, if any. |
| Average Annual Total Return (1) for the period ended June 30, 2023 | ||||||||||||||||||
| 1 Year | 5 Year | 10 Year | Commencement of Operations (05/30/12) | |||||||||||||||
| Market Price | 7.22% | 1.52% | 8.76% | 10.29% | |||||||||||||
| NAV | 4.85% | 2.33% | 7.65% | 10.29% | |||||||||||||
| ICE BofAML US High Yield Index | 8.87% | 3.18% | 4.34% | 4.95% | |||||||||||||
(1) | Performance quoted represents past performance. Past performance is not a guarantee or a reliable indicator of future results. Current performance may be lower or higher than performance shown. Investment return and the principal value of an investment will fluctuate. Returns shown do not reflect the deduction of taxes that a shareholder would pay on Fund distributions or the sale of Fund shares. Total return, market price, NAV, market price distribution rate, and NAV distribution rate will fluctuate with changes in market conditions. The NAV presented may differ from the NAV reported for the same period in other Fund materials. Performance current to the most recent month-end is available at www.pimco.com or via (844)33-PIMCO. Performance is calculated assuming all dividends and distributions are reinvested at prices obtained under the Fund’s dividend reinvestment plan. Performance does not reflect any brokerage commissions in connection with the purchase or sale of Fund shares. |
Performance of an index is shown in light of a requirement by the Securities and Exchange Commission that the performance of an appropriate broad-based securities market index be disclosed. However, the Fund is not managed to an index nor should the index be viewed as a “benchmark” for the Fund’s performance. The index is not intended to be indicative of the Fund’s investment strategies, portfolio components or past or future performance. Please see Additional Information Regarding the Funds for a description of the Fund’s principal investment strategies. |
(2) | Distribution rates are not performance and are calculated by annualizing the most recent distribution per share and dividing by the NAV or Market Price, as applicable, as of the reported date. Distributions may be comprised of ordinary income, net capital gains, and/or a return of capital (ROC) of your investment in the Fund. Because the distribution rate may include a ROC, it should not be confused with yield or income. If the Fund estimates that a portion of its distribution may be comprised of amounts from sources other than net investment income in accordance with its policies and good accounting practices, the Fund will notify shareholders of the estimated composition of such distribution through a Section 19 Notice. Please refer to the most recent Section 19 Notice, if applicable, for additional information regarding the estimated composition of distributions. Please visit www.pimco.com for most recent Section 19 Notice, if applicable. Final determination of a distribution’s tax character will be provided to shareholders when such information is available. |
(3) | Represents total effective leverage outstanding, as a percentage of total managed assets. Total effective leverage consists of preferred shares, reverse repurchase agreements and other borrowings, credit default swap notional and floating rate notes issued in tender option bond transactions, as applicable (collectively “Total Effective Leverage”). The Fund may engage in other transactions not included in Total Effective Leverage disclosed above that may give rise to a form of leverage, including certain derivative transactions. For the purpose of calculating Total Effective Leverage outstanding as a percentage of total managed assets, total managed assets refer to total assets (including assets attributable to Total Effective Leverage that may be outstanding) minus accrued liabilities (other than liabilities representing Total Effective Leverage). |
| Market Price | $18.75 | |||
| NAV | $17.29 | |||
| Premium/(Discount) to NAV | 8.44% | |||
Market Price Distribution Rate (2) | 14.11% | |||
NAV Distribution Rate (2) | 15.30% | |||
Total Effective Leverage (3) | 43.96% | |||
| » | Holdings related to corporate special situation investments, which may include companies undergoing stress, distress, challenges, or significant transition, contributed to absolute performance, as select securities posted positive returns. |
| » | Exposure to corporate credit, notably high yield and bank loans, contributed to absolute performance, as the asset classes posted positive returns. |
| » | At-the-market shelf offerings contributed to performance, as the capital raised was accretive to net asset value. |
| » | Long interest rate positioning at the intermediate portion of the curve detracted from absolute performance, as rates rose. |
| » | Security selection within asset-backed securities detracted from absolute performance, as select securities posted negative returns. |
| » | Holdings related to emerging market special situation investments, which may include companies undergoing stress, distress, challenges, or significant transition, detracted from absolute performance, as select securities posted negative returns. |
12 | PIMCO CLOSED-END FUNDS |
Market and Net Asset Value Information |
PIMCO Dynamic Income Fund | Common share market price (1) | Common share net asset value | Premium (discount) as a % of net asset value | |||||||||||||||||||||
Quarter | High | Low | High | Low | High | Low | ||||||||||||||||||
| Quarter ended June 30, 2023 | $ | 18.75 | $ | 17.36 | $ | 17.61 | $ | 17.20 | 8.44% | 0.46% | ||||||||||||||
| Quarter ended March 31, 2023 | $ | 21.10 | $ | 17.85 | $ | 18.42 | $ | 17.25 | 14.91% | 2.94% | ||||||||||||||
| Quarter ended December 31, 2022 | $ | 20.73 | $ | 18.29 | $ | 18.92 | $ | 17.71 | 10.23% | 2.12% | ||||||||||||||
| Quarter ended September 30, 2022 | $ | 22.28 | $ | 18.85 | $ | 20.23 | $ | 18.78 | 10.61% | (1.21) % | ||||||||||||||
| Quarter ended June 30, 2022 | $ | 24.11 | $ | 19.73 | $ | 22.90 | $ | 19.73 | 7.44% | (2.33 )% | ||||||||||||||
| Quarter ended March 31, 2022 | $ | 26.52 | $ | 22.11 | $ | 24.44 | $ | 22.28 | 9.03% | (0.99)% | ||||||||||||||
| Quarter ended December 31, 2021 | $ | 27.21 | $ | 24.75 | $ | 25.09 | $ | 24.14 | 9.67% | 2.32% | ||||||||||||||
| Quarter ended September 30, 2021 | $ | 29.09 | $ | 25.96 | $ | 25.37 | $ | 24.97 | 15.73% | 3.59% | ||||||||||||||
1 | Such prices reflect inter-dealer prices, without retail mark-up, mark-down or commission and may not represent actual transactions. |
ANNUAL REPORT | | | JUNE 30, 2023 | 13 |
Sales load (as a percentage of offering price) (1) | [ ]% | |||||||
Offering Expenses Borne by Common Shareholders (as a percentage of offering price) (2) | [ ]% | |||||||
Dividend Reinvestment Plan Fees (3) | None | |||||||
1 | In the event that the Common Shares to which this relates are sold to or through underwriters or dealer managers, a corresponding supplement will disclose the applicable sale load and/or commission. |
2 | The related supplement will disclose the estimated amount of offering expense, the offering price and the offering expenses borne by the Fund and indirectly by all of its Common Shareholders as a percentage of the offering price. |
3 | You will pay broker chargers if you direct your broker or the plan agent to sell your Common Shares that you acquired pursuant to a dividend reinvestment plan. You may also pay a pro rata share of brokerage commissions incurred in connection with open market purchase pursuant to the Fund’s Dividend Reinvestment Plan. |
Percentage of Net Assets Attributable to Common Shares (reflecting leverage attributable to reverse repurchase agreements) | ||||||||
Management Fees (1) | 1.91% | |||||||
Interest Payments on Borrowed Funds (2) | 3.20% | |||||||
Other Expenses (3) | 0.01% | |||||||
Total Annual Fund Operating Expenses (4) | 5.12% | |||||||
1. | Management fees include fees payable to the Investment Manager for advisory services and for supervisory, administrative and other services. The Fund pays for the advisory, supervisory and administrative services it requires under what is essentially an all-in fee structure (the “unified management fee”). Pursuant to an investment management agreement, PIMCO is paid a Management Fee of 1.10% of the Fund’s average daily total managed assets. The Fund (and not PIMCO) will be responsible for certain fees and expenses which are, reflected in the table above, that are not covered by the unified management fee under the investment management agreement. Please see Note 9, Fees and Expenses in the Notes to Financial Statements for an explanation of the unified management fee. |
2. | Reflects the Fund’s use of leverage in the form of reverse repurchase agreements averaged over the fiscal year ended June 30, 2023, which represented 42.06% of the Fund’s total managed assets (including assets attributable to reverse repurchase agreements) as of that date, at an annual interest rate cost to the Fund of 4.21%, which is the weighted average interest rate cost during the fiscal year ended June 30, 2023. See “Effects of Leverage.” The actual amount of interest expense borne by the Fund will vary over time in accordance with the level of the Fund’s use of reverse repurchase agreements, dollar rolls and/or borrowings and variations in market interest rates. Borrowing expense is required to be treated as an expense of the Fund for accounting purposes. Any associated income or gains (or losses) realized from leverage obtained through such instruments is not reflected in the Annual Fund Operating Expenses table above, but would be reflected in the Fund’s performance results. |
3. | Other expenses are estimated for the Fund’s fiscal year ending June 30, 2024. |
4. | “Interest Payments on Borrowed Funds” is borne by the Fund separately from the management fees paid to PIMCO. Excluding such expense, Total Annual Fund Operating Expenses are 1.92%. |
1 Year | 3 Years | 5 Years | 10 Years | |||||||||||||||||
| Total Expenses Incurred: | $ | 51 | $ | 153 | $ | 255 | $ | 509 | ||||||||||||
(1) | The example above should not be considered a representation of future expenses. Actual expenses may be higher or lower than those shown. The example assumes that the estimated Interest Payments on Borrowed Funds and Other Expenses set forth in the Annual Fund Operating Expenses table are accurate, that the rate listed under Total Annual Fund Operating Expenses remains the same each year and that all dividends and distributions are reinvested at NAV. Actual expenses may be greater or less than those assumed. Moreover, the Fund’s actual rate of return may be greater or less than the hypothetical 5% annual return shown in the example. The example does not include commissions or estimated offering expenses, which would cause the expenses shown in the example to increase. |
14 | PIMCO CLOSED-END FUNDS |
Symbol on NYSE - PDO |
Non-Agency Mortgage-Backed Securities | 31.3% | |||
| Loan Participations and Assignments | 24.0% | |||
| Corporate Bonds & Notes | 21.1% | |||
| Asset-Backed Securities | 12.2% | |||
| Short-Term Instruments | 4.2% | |||
| Common Stocks | 1.4% | |||
| Real Estate Investment Trusts | 1.4% | |||
| U.S. Government Agencies | 1.1% | |||
| Municipal Bonds & Notes | 1.0% | |||
| Convertible Bonds & Notes | 1.0% | |||
| Other | 1.3% | |||
† | % of Investments, at value. |
§ | Allocation Breakdown and % of investments exclude securities sold short and financial derivative instruments, if any. |
Average Annual Total Return (1) for the period ended June 30, 2023 | ||||||||||
| 1 Year | Commencement of Operations (01/29/21) | |||||||||
| Market Price | 13.17% | (5.39)% | |||||||
| NAV | (1.07)% | (6.09)% | |||||||
| ICE BofAML US High Yield Index | 8.87% | (0.73)% | |||||||
(1) | Performance quoted represents past performance. Past performance is not a guarantee or a reliable indicator of future results. Current performance may be lower or higher than performance shown. Investment return and the principal value of an investment will fluctuate. Returns shown do not reflect the deduction of taxes that a shareholder would pay on Fund distributions or the sale of Fund shares. Total return, market price, NAV, market price distribution rate, and NAV distribution rate will fluctuate with changes in market conditions. The NAV presented may differ from the NAV reported for the same period in other Fund materials. Performance current to the most recent month-end is available at www.pimco.com or via (844)33-PIMCO. Performance is calculated assuming all dividends and distributions are reinvested at prices obtained under the Fund’s dividend reinvestment plan. Performance does not reflect any brokerage commissions in connection with the purchase or sale of Fund shares. |
Performance of an index is shown in light of a requirement by the Securities and Exchange Commission that the performance of an appropriate broad-based securities market index be disclosed. However, the Fund is not managed to an index nor should the index be viewed as a “benchmark” for the Fund’s performance. The index is not intended to be indicative of the Fund’s investment strategies, portfolio components or past or future performance. Please see Additional Information Regarding the Funds for a description of the Fund’s principal investment strategies. |
(2) | Distribution rates are not performance and are calculated by annualizing the most recent distribution per share and dividing by the NAV or Market Price, as applicable, as of the reported date. Distributions may be comprised of ordinary income, net capital gains, and/or a return of capital (ROC) of your investment in the Fund. Because the distribution rate may include a ROC, it should not be confused with yield or income. If the Fund estimates that a portion of its distribution may be comprised of amounts from sources other than net investment income in accordance with its policies and good accounting practices, the Fund will notify shareholders of the estimated composition of such distribution through a Section 19 Notice. Please refer to the most recent Section 19 Notice, if applicable, for additional information regarding the estimated composition of distributions. Please visit www.pimco.com for most recent Section 19 Notice, if applicable. Final determination of a distribution’s tax character will be provided to shareholders when such information is available. |
(3) | Represents total effective leverage outstanding, as a percentage of total managed assets. Total effective leverage consists of preferred shares, reverse repurchase agreements and other borrowings, credit default swap notional and floating rate notes issued in tender option bond transactions, as applicable (collectively “Total Effective Leverage”). The Fund may engage in other transactions not included in Total Effective Leverage disclosed above that may give rise to a form of leverage, including certain derivative transactions. For the purpose of calculating Total Effective Leverage outstanding as a percentage of total managed assets, total managed assets refer to total assets (including assets attributable to Total Effective Leverage that may be outstanding) minus accrued liabilities (other than liabilities representing Total Effective Leverage). |
| Market Price | $13.06 | |||
| NAV | $12.71 | |||
| Premium/(Discount) to NAV | 2.75% | |||
Market Price Distribution Rate (2) | 11.75% | |||
NAV Distribution Rate (2) | 12.08% | |||
Total Effective Leverage (3) | 46.32% | |||
| » | Holdings related to corporate special situation investments, which may include companies undergoing stress, distress, challenges, or significant transition, contributed to absolute performance, as select securities posted positive returns. |
| » | Exposure to corporate credit, notably bank loans and high yield, contributed to absolute performance, as the asset classes posted positive returns. |
| » | Exposure to emerging market debt contributed to absolute performance, as the sector posted positive performance. |
| » | Exposure to commercial mortgage credit detracted from absolute performance, as the sector posted negative performance. |
| » | Long interest rate positioning at the intermediate portion of the curve detracted from absolute performance, as rates rose. |
| » | Holdings related to emerging market special situation investments, detracted from absolute performance, as select securities posted negative returns. |
ANNUAL REPORT | | | JUNE 30, 2023 | 15 |
Market and Net Asset Value Information |
PIMCO Dynamic Income Opportunities Fund | Common share market price (1) | Common share net asset value | Premium (discount) as a % of net asset value | |||||||||||||||||||||
Quarter | High | Low | High | Low | High | Low | ||||||||||||||||||
| Quarter ended June 30, 2023 | $ | 13.18 | $ | 12.38 | $ | 13.09 | $ | 12.70 | 2.75% | (3.63)% | ||||||||||||||
| Quarter ended March 31, 2023 | $ | 14.42 | $ | 12.27 | $ | 13.85 | $ | 12.82 | 4.74% | (5.80)% | ||||||||||||||
| Quarter ended December 31, 2022 | $ | 15.38 | $ | 12.77 | $ | 14.71 | $ | 13.29 | 6.39% | (9.39)% | ||||||||||||||
| Quarter ended September 30, 2022 | $ | 15.72 | $ | 13.19 | $ | 15.87 | $ | 14.55 | 0.58% | (9.64)% | ||||||||||||||
| Quarter ended June 30, 2022 | $ | 17.35 | $ | 13.67 | $ | 18.12 | $ | 15.35 | (3.79)% | (13.59)% | ||||||||||||||
| Quarter ended March 31, 2022 | $ | 19.78 | $ | 15.97 | $ | 19.42 | $ | 17.60 | 1.91% | (9.42)% | ||||||||||||||
| Quarter ended December 31, 2021 | $ | 21.66 | $ | 19.32 | $ | 20.43 | $ | 19.24 | 6.49% | (0.16)% | ||||||||||||||
| Quarter ended September 30, 2021 | $ | 22.25 | $ | 20.45 | $ | 20.66 | $ | 20.29 | 8.49% | 0.34% | ||||||||||||||
1 | Such prices reflect inter-dealer prices, without retail mark-up, mark-down or commission and may not represent actual transactions. |
16 | PIMCO CLOSED-END FUNDS |
Sales load (as a percentage of offering price) (1) | [ ]% | |||||||
Offering Expenses Borne by Common Shareholders (as a percentage of offering price) (2) | [ }% | |||||||
Dividend Reinvestment Plan Fees (3) | None | |||||||
1 | In the event that the Common Shares to which this relates are sold to or through underwriters or dealer managers, a corresponding supplement will disclose the applicable sale load and/or commission. |
2 | The related supplement will disclose the estimated amount of offering expense, the offering price and the offering expenses borne by the Fund and indirectly by all of its Common Shareholders as a percentage of the offering price. |
3 | You will pay broker chargers if you direct your broker or the plan agent to sell your Common Shares that you acquired pursuant to a dividend reinvestment plan. You may also pay a pro rata share of brokerage commissions incurred in connection with open market purchase pursuant to the Fund’s Dividend Reinvestment Plan. |
Percentage of Net Assets Attributable to Common Shares (reflecting leverage attributable to reverse repurchase agreements) | ||||||||
Management Fees (1) | 2.10% | |||||||
Interest Payments on Borrowed Funds (2) | 3.64% | |||||||
Other Expenses (3) | 0.01% | |||||||
Total Annual Fund Operating Expenses (4) | 5.75% | |||||||
1. | Management fees include fees payable to the Investment Manager for advisory services and for supervisory, administrative and other services. The Fund pays for the advisory, supervisory and administrative services it requires under what is essentially an all-in fee structure (the “unified management fee”). Pursuant to an investment management agreement, PIMCO is paid a Management Fee of 1.15% of the Fund’s average daily total managed assets. The Fund (and not PIMCO) will be responsible for certain fees and expenses which are, reflected in the table above, that are not covered by the unified management fee under the investment management agreement. Please see Note 9, Fees and Expenses in the Notes to Financial Statements for an explanation of the unified management fee. |
2. | Reflects the Fund’s use of leverage in the form of reverse repurchase agreements averaged over the fiscal year ended June 30, 2023, which represented 44.94% of the Fund’s total managed assets (including assets attributable to reverse repurchase agreements) as of that date, at an annual interest rate cost to the Fund of 4.22%, which is the weighted average interest rate cost during the fiscal year ended June 30, 2023. See “Effects of Leverage.” The actual amount of interest expense borne by the Fund will vary over time in accordance with the level of the Fund’s use of reverse repurchase agreements, dollar rolls and/or borrowings and variations in market interest rates. Borrowing expense is required to be treated as an expense of the Fund for accounting purposes. Any associated income or gains (or losses) realized from leverage obtained through such instruments is not reflected in the Annual Fund Operating Expenses table above, but would be reflected in the Fund’s performance results. |
3. | Other expenses are estimated for the Fund’s fiscal year ending June 30, 2024. |
4. | “Interest Payments on Borrowed Funds” is borne by the Fund separately from the management fees paid to PIMCO. Excluding such expense, Total Annual Fund Operating Expenses are 2.11%. |
1 Year | 3 Years | 5 Years | 10 Years | |||||||||||||||||
| Total Expenses Incurred | $ | 57 | $ | 171 | $ | 282 | $ | 554 | ||||||||||||
(1) | The example above should not be considered a representation of future expenses. Actual expenses may be higher or lower than those shown. The example assumes that the estimated Interest Payments on Borrowed Funds and Other Expenses set forth in the Annual Fund Operating Expenses table are accurate, that the rate listed under Total Annual Fund Operating Expenses remains the same each year and that all dividends and distributions are reinvested at NAV. Actual expenses may be greater or less than those assumed. Moreover, the Fund’s actual rate of return may be greater or less than the hypothetical 5% annual return shown in the example. The example does not include commissions or estimated offering expenses, which would cause the expenses shown in the example to increase. |
ANNUAL REPORT | | | JUNE 30, 2023 | 17 |
Index Descriptions |
Index* | Index Description | |
| ICE BofAML U.S. High Yield Index | ICE BofAML U.S. High Yield Index tracks the performance of below investment grade U.S. dollar-denominated corporate bonds publicly issued in the U.S. domestic market. Qualifying bonds must have at least one year remaining term to maturity, a fixed coupon schedule and a minimum amount outstanding of USD 100 million. Bonds must be rated below investment grade based on a composite of Moody’s and S&P. | |
| S&P 500 Index | S&P 500 Index is an unmanaged market index generally considered representative of the stock market as a whole. The Index focuses on the large-cap segment of the U.S. equities market. | |
18 | PIMCO CLOSED-END FUNDS |
ANNUAL REPORT | | | JUNE 30, 2023 | 19 |
Financial Highlights |
Investment Operations | Less Distributions (c) | |||||||||||||||||||||||||||||||
| Selected Per Share Data for the Year or Period Ended ^: | Net Asset Value Beginning of Year or Period (a) | Net Investment Income (Loss) (b) | Net Realized/ Unrealized Gain (Loss) | Total | From Net Investment Income | From Net Realized Capital Gains | Tax Basis Return of Capital | Total | ||||||||||||||||||||||||
PCM Fund, Inc. | ||||||||||||||||||||||||||||||||
| 06/30/2023 | $ | 7.69 | $ | 0.82 | $ | (0.81 | ) | $ | 0.01 | $ | (0.73 | ) | $ | 0.00 | $ | (0.23 | ) | $ | (0.96 | ) | ||||||||||||
| 06/30/2022 | 9.52 | 0.79 | (1.66 | ) | (0.87 | ) | (0.93 | ) | 0.00 | (0.03 | ) | (0.96 | ) | |||||||||||||||||||
| 06/30/2021 | 8.47 | 0.97 | 1.04 | 2.01 | (0.96 | ) | 0.00 | 0.00 | (0.96 | ) | ||||||||||||||||||||||
| 06/30/2020 | 10.19 | 0.86 | (1.62 | ) | (0.76 | ) | (0.95 | ) | 0.00 | (0.01 | ) | (0.96 | ) | |||||||||||||||||||
| 06/30/2019 | 10.23 | 0.69 | 0.23 | 0.92 | (0.96 | ) | 0.00 | 0.00 | (0.96 | ) | ||||||||||||||||||||||
PIMCO Global StocksPLUS ® | ||||||||||||||||||||||||||||||||
| 06/30/2023 | $ | 7.27 | $ | 0.77 | $ | 0.08 | $ | 0.85 | $ | (0.83 | ) | $ | 0.00 | $ | 0.00 | $ | (0.83 | ) | ||||||||||||||
| 06/30/2022 | 10.44 | 0.87 | (3.21 | ) | (2.34 | ) | (0.83 | ) | 0.00 | 0.00 | (0.83 | ) | ||||||||||||||||||||
| 06/30/2021 | 7.47 | 0.95 | 2.85 | 3.80 | (0.83 | ) | 0.00 | 0.00 | (0.83 | ) | ||||||||||||||||||||||
| 06/30/2020 | 9.89 | 1.10 | (2.42 | ) | (1.32 | ) | (0.85 | ) | 0.00 | (0.25 | ) | (1.10 | ) | |||||||||||||||||||
| 06/30/2019 | 10.50 | 1.11 | (0.34 | ) | 0.77 | (1.20 | ) | 0.00 | (0.18 | ) | (1.38 | ) | ||||||||||||||||||||
PIMCO Strategic Income Fund, Inc. | ||||||||||||||||||||||||||||||||
| 06/30/2023 | $ | 4.68 | $ | 0.39 | $ | (0.14 | ) | $ | 0.25 | $ | (0.61 | ) | $ | 0.00 | $ | (0.00 | ) | $ | (0.61 | ) | ||||||||||||
| 06/30/2022 | 6.55 | 0.61 | (1.87 | ) | (1.26 | ) | (0.60 | ) | 0.00 | (0.01 | ) | (0.61 | ) | |||||||||||||||||||
| 06/30/2021 | 5.94 | 0.58 | 0.64 | 1.22 | (0.41 | ) | 0.00 | (0.20 | ) | (0.61 | ) | |||||||||||||||||||||
| 06/30/2020 | 7.12 | 0.74 | (1.20 | ) | (0.46 | ) | (0.49 | ) | 0.00 | (0.23 | ) | (0.72 | ) | |||||||||||||||||||
| 06/30/2019 | 7.32 | 0.60 | 0.03 | 0.63 | (0.61 | ) | 0.00 | (0.22 | ) | (0.83 | ) | |||||||||||||||||||||
PIMCO Access Income Fund (Consolidated) | ||||||||||||||||||||||||||||||||
| 06/30/2023 | $ | 17.20 | $ | 1.81 | $ | (1.90 | ) | $ | (0.09 | ) | $ | (2.25 | ) | $ | 0.00 | $ | 0.00 | $ | (2.25 | ) | ||||||||||||
| 01/31/2022 - 06/30/2022 | 20.00 | 0.45 | (2.78 | ) | (2.33 | ) | (0.47 | ) | 0.00 | 0.00 | (0.47 | ) | ||||||||||||||||||||
PIMCO Dynamic Income Fund (Consolidated) | ||||||||||||||||||||||||||||||||
| 06/30/2023 | $ | 19.72 | $ | 2.23 | $ | (1.56 | ) | $ | 0.67 | $ | (3.30 | ) | $ | 0.00 | $ | 0.00 | $ | (3.30 | ) | |||||||||||||
| 06/30/2022 | 25.23 | 2.84 | (5.77 | ) | (2.93 | ) | (2.65 | ) | 0.00 | 0.00 | (2.65 | ) | ||||||||||||||||||||
| 06/30/2021 | 22.59 | 2.51 | 2.57 | 5.08 | (2.52 | ) | 0.00 | (0.13 | ) | (2.65 | ) | |||||||||||||||||||||
| 06/30/2020 | 28.29 | 2.92 | (5.80 | ) | (2.88 | ) | (3.07 | ) | 0.00 | 0.00 | (3.07 | ) | ||||||||||||||||||||
| 06/30/2019 | 28.98 | 2.73 | (0.37 | ) | 2.36 | (3.15 | ) | 0.00 | 0.00 | (3.15 | ) | |||||||||||||||||||||
| 06/30/2018 | 28.32 | 2.95 | 0.18 | 3.13 | (2.65 | ) | 0.00 | 0.00 | (2.65 | ) | ||||||||||||||||||||||
| 06/30/2017 | 26.56 | 2.60 | 3.18 | 5.78 | (4.10 | ) | 0.00 | 0.00 | (4.10 | ) | ||||||||||||||||||||||
| 06/30/2016 | 31.38 | 3.87 | (3.45 | ) | 0.42 | (4.25 | ) | (0.99 | ) | 0.00 | (5.24 | ) | ||||||||||||||||||||
04/01/2015 - 06/30/2015 (g) | 30.74 | 0.80 | 0.47 | 1.27 | (0.63 | ) | 0.00 | 0.00 | (0.63 | ) | ||||||||||||||||||||||
| 03/31/2015 | 32.11 | 3.25 | (0.49 | ) | 2.76 | (4.13 | ) | 0.00 | 0.00 | (4.13 | ) | |||||||||||||||||||||
| 03/31/2014 | 30.69 | 3.70 | 1.24 | 4.94 | (3.29 | ) | (0.23 | ) | 0.00 | (3.52 | ) | |||||||||||||||||||||
PIMCO Dynamic Income Opportunities Fund (Consolidated) | ||||||||||||||||||||||||||||||||
| 06/30/2023 | $ | 15.31 | $ | 1.50 | $ | (1.63 | ) | $ | (0.13 | ) | $ | (2.49 | ) | $ | 0.00 | $ | 0.00 | $ | (2.49 | ) | ||||||||||||
| 06/30/2022 | 20.50 | 1.73 | (5.01 | ) | (3.28 | ) | (1.79 | ) | (0.12 | ) | 0.00 | (1.91 | ) | |||||||||||||||||||
| 01/29/2021 - 06/30/2021 | 20.00 | 0.49 | 0.47 | 0.96 | (0.47 | ) | 0.00 | 0.00 | (0.47 | ) | ||||||||||||||||||||||
| * | Annualized, except for organizational expense, if any. |
| ^ | A zero balance may reflect actual amounts rounding to less than $0.01 or 0.01%. |
(a) | Includes adjustments required by U.S. GAAP and may differ from net asset values and performance reported elsewhere by the Funds. |
(b) | Per share amounts based on average number of shares outstanding during the year or period. |
(c) | The tax characterization of distributions is determined in accordance with Federal income tax regulations. See Note 2, Distributions — Common Shares, in the Notes to Financial Statements for more information. |
(d) | Total investment return is calculated assuming a purchase of a share at the market price on the first day and a sale of a share at the market price on the last day of each year reported. Dividends and distributions, if any, are assumed, for purposes of this calculation, to be reinvested at prices obtained under the Fund’s dividend reinvestment plan. Total investment return does not reflect brokerage commissions in connection with the purchase or sale of Fund shares. |
(e) | Ratio includes interest expense which primarily relates to participation in borrowing and financing transactions. See Note 5, Borrowings and Other Financing Transactions, in the Notes to Financial Statements for more information. |
(f) | Effective December 13, 2021, the Fund’s Management fee was decreased by 0.05% to an annual rate of 1.10%. |
(g) | Fiscal year end changed from March 31st to June 30th. |
20 | PIMCO CLOSED-END FUNDS | See Accompanying Notes |
Common Share | Ratios/Supplemental Data | |||||||||||||||||||||||||||||||||||||||||||||
Ratios to Average Net Assets | ||||||||||||||||||||||||||||||||||||||||||||||
Increase resulting from Common Share Offering | Offering Cost Charged to Paid in Capital | Net Asset Value End of Year or Period (a) | Market Price End of Year or Period | Total Investment Return (d) | Net Assets Applicable to Common Shareholders End of Year or Period (000s) | Expenses (e) | Expenses Excluding Waivers (e) | Expenses Excluding Interest Expense | Expenses Excluding Interest Expense and Waivers | Net Investment Income (Loss) | Portfolio Turnover Rate | |||||||||||||||||||||||||||||||||||
| $ | N/A | $ | N/A | $ | 6.74 | $ | 9.63 | 16.30 | % | $ | 80,318 | 5.68 | % | 5.68 | % | 1.68 | % | 1.68 | % | 11.29 | % | 20 | % | |||||||||||||||||||||||
| N/A | N/A | 7.69 | 9.25 | (14.44 | ) | 90,639 | 2.30 | 2.30 | 1.63 | 1.63 | 8.71 | 65 | ||||||||||||||||||||||||||||||||||
| N/A | N/A | 9.52 | 11.87 | 38.25 | 111,154 | 2.49 | 2.49 | 1.60 | 1.60 | 10.56 | 127 | |||||||||||||||||||||||||||||||||||
| N/A | N/A | 8.47 | 9.42 | (8.33 | ) | 98,539 | 3.39 | 3.39 | 1.54 | 1.54 | 9.09 | 15 | ||||||||||||||||||||||||||||||||||
| N/A | N/A | 10.19 | 11.32 | 8.26 | 118,181 | 3.35 | 3.35 | 1.41 | 1.41 | 6.89 | 8 | |||||||||||||||||||||||||||||||||||
| $ | N/A | $ | N/A | $ | 7.29 | $ | 7.20 | 2.32 | % | $ | 82,667 | 3.79 | % | 3.79 | % | 1.65 | % | 1.65 | % | 10.69 | % | 483 | % | |||||||||||||||||||||||
| N/A | N/A | 7.27 | 7.89 | (22.51 | ) | 81,353 | 2.09 | 2.09 | 1.76 | 1.76 | 8.96 | 373 | ||||||||||||||||||||||||||||||||||
| N/A | N/A | 10.44 | 11.10 | 48.12 | 115,748 | 2.03 | 2.03 | 1.66 | 1.66 | 10.35 | 503 | |||||||||||||||||||||||||||||||||||
| N/A | N/A | 7.47 | 8.19 | (26.51 | ) | 82,109 | 2.78 | 2.78 | 1.65 | 1.65 | 12.56 | 395 | ||||||||||||||||||||||||||||||||||
| N/A | N/A | 9.89 | 12.47 | (7.41 | ) | 107,562 | 2.64 | 2.64 | 1.53 | 1.53 | 11.37 | 381 | ||||||||||||||||||||||||||||||||||
| $ | N/A | $ | N/A | $ | 4.32 | $ | 5.20 | 14.43 | % | $ | 196,497 | 3.87 | % | 3.87 | % | 0.97 | % | 0.97 | % | 8.73 | % | 639 | % | |||||||||||||||||||||||
| N/A | N/A | 4.68 | 5.13 | (25.44 | ) | 210,018 | 1.44 | 1.44 | 0.98 | 0.98 | 10.29 | 678 | ||||||||||||||||||||||||||||||||||
| N/A | N/A | 6.55 | 7.61 | 30.90 | 290,989 | 1.36 | 1.36 | 0.96 | 0.96 | 8.97 | 774 | |||||||||||||||||||||||||||||||||||
| N/A | N/A | 5.94 | 6.37 | (27.94 | ) | 261,163 | 2.61 | 2.61 | 0.98 | 0.98 | 11.28 | 679 | ||||||||||||||||||||||||||||||||||
| N/A | N/A | 7.12 | 9.71 | 9.57 | 309,287 | 3.20 | 3.20 | 0.97 | 0.97 | 8.52 | 655 | |||||||||||||||||||||||||||||||||||
| $ | N/A | $ | N/A | $ | 14.86 | $ | 14.75 | 7.53 | % | $ | 653,891 | 5.92 | % | 5.92 | % | 2.24 | % | 2.24 | % | 11.10 | % | 28 | % | |||||||||||||||||||||||
| N/A | N/A | 17.20 | 15.83 | (18.72 | ) | 756,653 | 1.79 | * | 1.79 | * | 1.51 | * | 1.51 | * | 5.81 | * | 16 | |||||||||||||||||||||||||||||
| $ | 0.18 | $ | 0.00 | $ | 17.27 | $ | 18.75 | 7.22 | % | $ | 4,578,482 | 5.12 | % | 5.12 | % | 1.92 | % | 1.92 | % | 12.10 | % | 20 | % | |||||||||||||||||||||||
| 0.07 | 0.00 | 19.72 | 20.87 | (19.10 | ) | 4,466,886 | 2.64 | (f) | 2.64 | (f) | 2.00 | (f) | 2.00 | (f) | 12.28 | 27 | ||||||||||||||||||||||||||||||
| 0.21 | 0.00 | 25.23 | 28.81 | 29.29 | 1,781,435 | 2.78 | 2.78 | 2.04 | 2.04 | 10.36 | 38 | |||||||||||||||||||||||||||||||||||
| 0.25 | 0.00 | 22.59 | 24.72 | (14.18 | ) | 1,375,107 | 3.72 | 3.72 | 1.99 | 1.99 | 11.44 | 21 | ||||||||||||||||||||||||||||||||||
| 0.10 | (0.00 | ) | 28.29 | 32.15 | 12.03 | 1,603,368 | 3.96 | 3.96 | 1.89 | 1.89 | 9.70 | 12 | ||||||||||||||||||||||||||||||||||
| 0.18 | (0.00 | ) | 28.98 | 31.87 | 15.54 | 1,575,523 | 4.07 | 4.07 | 2.01 | 2.01 | 10.26 | 9 | ||||||||||||||||||||||||||||||||||
| 0.08 | 0.00 | 28.32 | 30.18 | 27.07 | 1,372,674 | 4.08 | 4.08 | 2.14 | 2.14 | 9.58 | 20 | |||||||||||||||||||||||||||||||||||
| N/A | N/A | 26.56 | 27.57 | 13.75 | 1,222,499 | 3.60 | 3.60 | 2.12 | 2.12 | 13.67 | 13 | |||||||||||||||||||||||||||||||||||
| N/A | N/A | 31.38 | 29.21 | 2.87 | 1,426,891 | 2.83 | 2.83 | 2.01 | 2.01 | 10.23 | 5 | |||||||||||||||||||||||||||||||||||
| N/A | N/A | 30.74 | 29.00 | 9.04 | 1,397,987 | 3.12 | 3.12 | 2.12 | 2.12 | 9.98 | 10 | |||||||||||||||||||||||||||||||||||
| N/A | N/A | 32.11 | 30.32 | 9.62 | 1,458,961 | 3.15 | 3.15 | 2.17 | 2.17 | 11.90 | 18 | |||||||||||||||||||||||||||||||||||
| $ | 0.00 | $ | 0.00 | $ | 12.69 | $ | 13.06 | 13.17 | % | $ | 1,406,536 | 5.75 | % | 5.75 | % | 2.11 | % | 2.11 | % | 10.67 | % | 17 | % | |||||||||||||||||||||||
| N/A | N/A | 15.31 | 13.85 | (33.77 | ) | 1,684,507 | 2.79 | 2.79 | 2.12 | 2.12 | 9.11 | 47 | ||||||||||||||||||||||||||||||||||
| 0.01 | N/A | 20.50 | 23.18 | 16.70 | 2,227,301 | 2.10 | * | 2.10 | * | 1.78 | * | 1.78 | * | 5.93 | * | 49 | ||||||||||||||||||||||||||||||
ANNUAL REPORT | | | JUNE 30, 2023 | 21 |
Statements of Assets and Liabilities | June 30, 2023 |
(Amounts in thousands † | PCM Fund, Inc. | PIMCO Global StocksPLUS ® Income Fund | PIMCO Strategic Income Fund, Inc. | |||||||||
Assets: | ||||||||||||
Investments, at value | ||||||||||||
| Investments in securities* | $ | 147,040 | $ | 140,335 | $ | 543,112 | ||||||
Financial Derivative Instruments | ||||||||||||
| Exchange-traded or centrally cleared | 27 | 608 | 322 | |||||||||
| Over the counter | 0 | 8,936 | 137 | |||||||||
| Cash | 7 | 9 | 0 | |||||||||
| Deposits with counterparty | 1,678 | 3,167 | 9,116 | |||||||||
| Foreign currency, at value | 5 | 0 | 0 | |||||||||
| Receivable for investments sold | 553 | 1,096 | 3,165 | |||||||||
| Receivable for TBA investments sold | 0 | 44,885 | 419,924 | |||||||||
| Interest and/or dividends receivable | 1,345 | 2,081 | 3,546 | |||||||||
| Other assets | 72 | 65 | 0 | |||||||||
Total Assets | 150,727 | 201,182 | 979,322 | |||||||||
Liabilities: | ||||||||||||
Borrowings & Other Financing Transactions | ||||||||||||
| Payable for reverse repurchase agreements | $ | 67,291 | $ | 23,161 | $ | 99,555 | ||||||
| Payable for short sales | 0 | 653 | 2,368 | |||||||||
Financial Derivative Instruments | ||||||||||||
| Exchange-traded or centrally cleared | 124 | 735 | 548 | |||||||||
| Over the counter | 189 | 418 | 730 | |||||||||
| Payable for investments purchased | 537 | 741 | 2,110 | |||||||||
| Payable for TBA investments purchased | 0 | 82,536 | 672,680 | |||||||||
| Payable for unfunded loan commitments | 1,198 | 771 | 1,703 | |||||||||
| Deposits from counterparty | 0 | 8,573 | 590 | |||||||||
| Distributions payable to common shareholders | 953 | 782 | 2,322 | |||||||||
| Overdraft due to custodian | 0 | 38 | 40 | |||||||||
| Accrued management fees | 117 | 102 | 166 | |||||||||
| Foreign capital gains tax payable | 0 | 5 | 12 | |||||||||
| Other liabilities | 0 | 0 | 1 | |||||||||
Total Liabilities | 70,409 | 118,515 | 782,825 | |||||||||
Net Assets Applicable to Common Shareholders | $ | 80,318 | $ | 82,667 | $ | 196,497 | ||||||
Net Assets Applicable to Common Shareholders Consist of: | ||||||||||||
Par value ^ | $ | 12 | $ | 0 | $ | 0 | ||||||
| Paid in capital in excess of par | 110,935 | 135,763 | 344,436 | |||||||||
| Distributable earnings (accumulated loss) | (30,629 | ) | (53,096 | ) | (147,939 | ) | ||||||
Net Assets Applicable to Common Shareholders | $ | 80,318 | $ | 82,667 | $ | 196,497 | ||||||
Common Shares Outstanding | 11,913 | 11,337 | 45,522 | |||||||||
Net Asset Value Per Common Share (a) | $ | 6.74 | $ | 7.29 | $ | 4.32 | ||||||
| Cost of investments in securities | $ | 166,308 | $ | 170,004 | $ | 624,173 | ||||||
| Cost of foreign currency held | $ | 4 | $ | 0 | $ | 0 | ||||||
| Proceeds received on short sales | $ | 0 | $ | 659 | $ | 2,378 | ||||||
| Cost or premiums of financial derivative instruments, net | $ | 1,490 | $ | (419 | ) | $ | 7,198 | |||||
| * Includes repurchase agreements of: | $ | 7,628 | $ | 16,277 | $ | 9,084 | ||||||
† | A zero balance may reflect actual amounts rounding to less than one thousand. |
^ | ($0.001 per share), ($0.00001 per share), ($0.00001 per share). |
(a) | Includes adjustments required by U.S. GAAP and may differ from net asset values and performance reported elsewhere by the Funds. |
22 | PIMCO CLOSED-END FUNDS | See Accompanying Notes |
Consolidated Statements of Assets and Liabilities | June 30, 2023 |
(Amounts in thousands † | PIMCO Access Income Fund | PIMCO Dynamic Income Fund | PIMCO Dynamic Income Opportunities Fund | |||||||||
Assets: | ||||||||||||
Investments, at value | ||||||||||||
| Investments in securities* | $ | 1,197,085 | $ | 7,895,676 | $ | 2,412,417 | ||||||
| Investments in affiliates | 0 | 91,594 | 0 | |||||||||
Financial Derivative Instruments | ||||||||||||
| Exchange-traded or centrally cleared | 202 | 2,586 | 1,288 | |||||||||
| Over the counter | 1,621 | 6,775 | 2,077 | |||||||||
| Cash | 6,870 | 4,328 | 1,647 | |||||||||
| Deposits with counterparty | 14,124 | 109,694 | 59,777 | |||||||||
| Foreign currency, at value | 0 | 0 | 3,225 | |||||||||
| Receivable for investments sold | 31,899 | 326,761 | 142,226 | |||||||||
| Receivable for Fund shares sold | 0 | 7,600 | 0 | |||||||||
| Interest and/or dividends receivable | 14,791 | 111,343 | 42,854 | |||||||||
| Other assets | 0 | 3,398 | 324 | |||||||||
Total Assets | 1,266,592 | 8,559,755 | 2,665,835 | |||||||||
Liabilities: | ||||||||||||
Borrowings & Other Financing Transactions | ||||||||||||
| Payable for reverse repurchase agreements | $ | 508,387 | $ | 3,526,365 | $ | 1,195,974 | ||||||
Financial Derivative Instruments | ||||||||||||
| Exchange-traded or centrally cleared | 624 | 3,956 | 1,852 | |||||||||
| Over the counter | 385 | 28,565 | 1,671 | |||||||||
| Payable for investments purchased | 86,373 | 294,746 | 18,580 | |||||||||
| Payable for unfunded loan commitments | 2,851 | 40,600 | 15,882 | |||||||||
| Deposits from counterparty | 2,324 | 13,705 | 8,440 | |||||||||
| Distributions payable to common shareholders | 6,574 | 57,942 | 14,181 | |||||||||
| Overdraft due to custodian | 3,874 | 7,367 | 0 | |||||||||
| Accrued management fees | 1,307 | 7,509 | 2,555 | |||||||||
| Foreign capital gains tax payable | 2 | 305 | 162 | |||||||||
| Other liabilities | 0 | 213 | 2 | |||||||||
Total Liabilities | 612,701 | 3,981,273 | 1,259,299 | |||||||||
Net Assets Applicable to Common Shareholders | $ | 653,891 | $ | 4,578,482 | $ | 1,406,536 | ||||||
Net Assets Applicable to Common Shareholders Consist of: | ||||||||||||
Par value ^ | $ | 0 | $ | 3 | $ | 1 | ||||||
| Paid in capital in excess of par | 879,954 | 6,845,940 | 2,212,471 | |||||||||
| Distributable earnings (accumulated loss) | (226,063 | ) | (2,267,461 | ) | (805,936 | ) | ||||||
Net Assets Applicable to Common Shareholders | $ | 653,891 | $ | 4,578,482 | $ | 1,406,536 | ||||||
Common Shares Outstanding | 44,001 | 265,130 | 110,877 | |||||||||
Net Asset Value Per Common Share (a) | $ | 14.86 | $ | 17.27 | $ | 12.69 | ||||||
| Cost of investments in securities | $ | 1,361,909 | $ | 9,252,566 | $ | 2,968,734 | ||||||
| Cost of investments in Affiliates | $ | 0 | $ | 27,066 | $ | 0 | ||||||
| Cost of foreign currency held | $ | 0 | $ | 0 | $ | 2,754 | ||||||
| Cost or premiums of financial derivative instruments, net | $ | 12,173 | $ | (10,550 | ) | $ | (15,675 | ) | ||||
| * Includes repurchase agreements of: | $ | 156,900 | $ | 391,856 | $ | 85,700 | ||||||
† | A zero balance may reflect actual amounts rounding to less than one thousand. |
^ | ($0.00001 par share). |
(a) | Includes adjustments required by U.S. GAAP and may differ from net asset values and performance reported elsewhere by the Funds. |
ANNUAL REPORT | | | JUNE 30, 2023 | 23 |
Statements of Operations |
| Year Ended June 30, 2023 | ||||||||||||
(Amounts in thousands † | PCM Fund, Inc. | PIMCO Global StocksPLUS ® Income Fund | PIMCO Strategic Income Fund, Inc. | |||||||||
Investment Income: | ||||||||||||
| Interest, net of foreign taxes* | $ | 14,405 | $ | 11,546 | $ | 25,382 | ||||||
| Dividends net of foreign taxes | 146 | 200 | 208 | |||||||||
| Miscellaneous income | 0 | 3 | 16 | |||||||||
| Total Income | 14,551 | 11,749 | 25,606 | |||||||||
Expenses: | ||||||||||||
| Management fees | 1,429 | 1,304 | 1,944 | |||||||||
| Trustee fees and related expenses | 5 | 5 | 9 | |||||||||
| Interest expense | 3,432 | 1,733 | 5,895 | |||||||||
| Miscellaneous expense | 5 | 28 | 4 | |||||||||
| Total Expenses | 4,871 | 3,070 | 7,852 | |||||||||
Net Investment Income (Loss) | 9,680 | 8,679 | 17,754 | |||||||||
Net Realized Gain (Loss): | ||||||||||||
| Investments in securities | 643 | (4,542 | ) | (27,220 | ) | |||||||
| Exchange-traded or centrally cleared financial derivative instruments | (4,140 | ) | (1,705 | ) | 13,668 | |||||||
| Over the counter financial derivative instruments | 27 | (10,484 | ) | 1,608 | ||||||||
| Foreign currency | 1 | (370 | ) | (1,170 | ) | |||||||
Net Realized Gain (Loss) | (3,469 | ) | (17,101 | ) | (13,114 | ) | ||||||
Net Change in Unrealized Appreciation (Depreciation): | ||||||||||||
| Investments in securities | (9,392 | ) | (1,054 | ) | 9,281 | |||||||
| Exchange-traded or centrally cleared financial derivative instruments | 3,186 | 3,775 | (571 | ) | ||||||||
| Over the counter financial derivative instruments | (75 | ) | 15,508 | (1,793 | ) | |||||||
| Foreign currency assets and liabilities | 0 | (168 | ) | (625 | ) | |||||||
Net Change in Unrealized Appreciation (Depreciation) | (6,281 | ) | 18,061 | 6,292 | ||||||||
Net Increase (Decrease) in Net Assets Resulting from Operations | $ | (70 | ) | $ | 9,639 | $ | 10,932 | |||||
| * Foreign tax withholdings | $ | 0 | $ | 20 | $ | 46 | ||||||
† | A zero balance may reflect actual amounts rounding to less than one thousand. |
24 | PIMCO CLOSED-END FUNDS | See Accompanying Notes |
Consolidated Statements of Operations |
| Year Ended June 30, 2023 | ||||||||||||
(Amounts in thousands † | PIMCO Access Income Fund | PIMCO Dynamic Income Fund | PIMCO Dynamic Income Opportunities Fund | |||||||||
Investment Income: | ||||||||||||
| Interest, net of foreign taxes* | $ | 119,969 | $ | 769,236 | $ | 248,158 | ||||||
| Dividends, net of foreign taxes** | 2,252 | 5,939 | 7,016 | |||||||||
| Miscellaneous income | 0 | 31 | 0 | |||||||||
| Total Income | 122,221 | 775,206 | 255,174 | |||||||||
Expenses: | ||||||||||||
| Management fees | 16,034 | 85,961 | 32,664 | |||||||||
| Trustee fees and related expenses | 90 | 362 | 196 | |||||||||
| Interest expense | 26,416 | 144,003 | 56,545 | |||||||||
| Auction agent fees and commissions | 0 | 1 | 0 | |||||||||
| Miscellaneous expense | 2 | 140 | 4 | |||||||||
| Total Expenses | 42,542 | 230,467 | 89,409 | |||||||||
Net Investment Income (Loss) | 79,679 | 544,739 | 165,765 | |||||||||
Net Realized Gain (Loss): | ||||||||||||
| Investments in securities | (43,500 | ) | (298,858 | ) | (165,942 | ) | ||||||
| Exchange-traded or centrally cleared financial derivative instruments | (4,557 | ) | 78,889 | 4,195 | ||||||||
| Over the counter financial derivative instruments | (5,037 | ) | 14,612 | (5,705 | ) | |||||||
| Foreign currency | 3,040 | (9,929 | ) | (7,992 | ) | |||||||
Net Realized Gain (Loss) | (50,054 | ) | (215,286 | ) | (175,444 | ) | ||||||
Net Change in Unrealized Appreciation (Depreciation): | ||||||||||||
| Investments in securities | (42,022 | ) | (26,307 | ) | (16 | ) | ||||||
| Investments in Affiliates | 0 | (12,609 | ) | 0 | ||||||||
| Exchange-traded or centrally cleared financial derivative instruments | 8,334 | (75,532 | ) | 1,127 | ||||||||
| Over the counter financial derivative instruments | 1,097 | (31,730 | ) | (770 | ) | |||||||
| Foreign currency assets and liabilities | (1,213 | ) | (18,869 | ) | (4,732 | ) | ||||||
Net Change in Unrealized Appreciation (Depreciation) | (33,804 | ) | (165,047 | ) | (4,391 | ) | ||||||
Net Increase (Decrease) in Net Assets Resulting from Operations | $ | (4,179 | ) | $ | 164,406 | $ | (14,070 | ) | ||||
| * Foreign tax withholdings - Interest | $ | 9 | $ | 766 | $ | 391 | ||||||
| ** Foreign tax withholdings - Dividends | $ | 0 | $ | 40 | $ | 0 | ||||||
† | A zero balance may reflect actual amounts rounding to less than one thousand. |
ANNUAL REPORT | | | JUNE 30, 2023 | 25 |
Statements of Changes in Net Assets |
PCM Fund, Inc. | PIMCO Global StocksPLUS ® Income Fund | |||||||||||||||
(Amounts in thousands † | Year Ended June 30, 2023 | Year Ended June 30, 2022 | Year Ended June 30, 2023 | Year Ended June 30, 2022 | ||||||||||||
Increase (Decrease) in Net Assets from: | ||||||||||||||||
Operations: | ||||||||||||||||
| Net investment income (loss) | $ | 9,680 | $ | 9,275 | $ | 8,679 | $ | 9,748 | ||||||||
| Net realized gain (loss) | (3,469 | ) | 2,298 | (17,101 | ) | 6,619 | ||||||||||
| Net change in unrealized appreciation (depreciation) | (6,281 | ) | (21,880 | ) | 18,061 | (42,591 | ) | |||||||||
Net Increase (Decrease) in Net Assets Applicable to Common Shareholders Resulting from Operations | (70 | ) | (10,307 | ) | 9,639 | (26,224 | ) | |||||||||
Distributions to Common Shareholders: | ||||||||||||||||
| From net investment income and/or net realized capital gains | (8,675 | ) | (10,961 | ) | (9,334 | ) | (9,228 | ) | ||||||||
| Tax basis return of capital | (2,703 | ) | (303 | ) | 0 | 0 | ||||||||||
Total Distributions to Common Shareholders (a) | (11,378 | ) | (11,264 | ) | (9,334 | ) | (9,228 | ) | ||||||||
Common Share Transactions*: | ||||||||||||||||
| Issued as reinvestment of distributions | 1,127 | 1,056 | 1,009 | 1,057 | ||||||||||||
Net increase (decrease) resulting from common share transactions | 1,127 | 1,056 | 1,009 | 1,057 | ||||||||||||
Total increase (decrease) in net assets applicable to common shareholders | (10,321 | ) | (20,515 | ) | 1,314 | (34,395 | ) | |||||||||
Net Assets Applicable to Common Shareholders: | ||||||||||||||||
| Beginning of year | 90,639 | 111,154 | 81,353 | 115,748 | ||||||||||||
| End of year | $ | 80,318 | $ | 90,639 | $ | 82,667 | $ | 81,353 | ||||||||
*Common Share Transactions: | ||||||||||||||||
| Shares issued as reinvestment of distributions | 131 | 101 | 140 | 107 | ||||||||||||
| Net increase (decrease) in common shares outstanding | 131 | 101 | 140 | 107 | ||||||||||||
† | A zero balance may reflect actual amounts rounding to less than one thousand. |
(a) | The tax characterization of distributions is determined in accordance with Federal income tax regulations. See Note 2, Distributions—Common Shares, in the Notes to Financial Statements for more information. |
26 | PIMCO CLOSED-END FUNDS | See Accompanying Notes |
PIMCO Strategic Income Fund, Inc. | ||||||
Year Ended June 30, 2023 | Year Ended June 30, 2022 | |||||
| $ | 17,754 | $ | 27,235 | |||
| (13,114 | ) | (4,309 | ) | |||
| 6,292 | (79,586 | ) | ||||
| | 10,932 | (56,660 | ) | |||
| (27,542 | ) | (26,999 | ) | |||
| (135 | ) | (320 | ) | |||
| (27,677 | ) | (27,319 | ) | |||
| 3,224 | 3,008 | |||||
| 3,224 | 3,008 | |||||
| (13,521 | ) | (80,971 | ) | |||
| 210,018 | 290,989 | |||||
| $ | 196,497 | $ | 210,018 | |||
| 644 | 481 | |||||
| 644 | 481 | |||||
ANNUAL REPORT | | | JUNE 30, 2023 | 27 |
Consolidated Statements of Changes in Net Assets |
PIMCO Access Income Fund | PIMCO Dynamic Income Fund | |||||||||||||||
(Amounts in thousands † | Year Ended June 30, 2023 | Inception Date through June 30, 2022 (a) | Year Ended June 30, 2023 | Year Ended June 30, 2022 | ||||||||||||
Increase (Decrease) in Net Assets from: | ||||||||||||||||
Operations: | ||||||||||||||||
| Net investment income (loss) | $ | 79,679 | $ | 19,821 | $ | 544,739 | $ | 439,598 | ||||||||
| Net realized gain (loss) | (50,054 | ) | 1,003 | (215,286 | ) | 173,171 | ||||||||||
| Net change in unrealized appreciation (depreciation) | (33,804 | ) | (123,302 | ) | (165,047 | ) | (1,319,388 | ) | ||||||||
Net Increase (Decrease) in Net Assets Applicable to Common Shareholders Resulting from Operations | (4,179 | ) | (102,478 | ) | 164,406 | (706,619 | ) | |||||||||
Distributions to Common Shareholders: | ||||||||||||||||
| From net investment income and/or net realized capital gains | (98,875 | ) | (20,531 | ) | (803,703 | ) | (391,635 | ) | ||||||||
Total Distributions to Common Shareholders (b) | (98,875 | ) | (20,531 | ) | (803,703 | ) | (391,635 | ) | ||||||||
Common Share Transactions*: | ||||||||||||||||
Net proceeds from at-the-market | 0 | 866,100 | 659,397 | 181,491 | ||||||||||||
| Net proceeds from equity offering | 0 | 13,562 | 0 | 0 | ||||||||||||
| Net proceeds from reorganization | 0 | 0 | 0 | 3,562,154 | ||||||||||||
At-the-market | 0 | 0 | 0 | 429 | ||||||||||||
| Issued as reinvestment of distributions | 292 | 0 | 91,496 | 39,631 | ||||||||||||
Net increase (decrease) resulting from common share transactions | 292 | 879,662 | 750,893 | 3,783,705 | ||||||||||||
Total increase (decrease) in net assets applicable to common shareholders | (102,762 | ) | 756,653 | 111,596 | 2,685,451 | |||||||||||
Net Assets Applicable to Common Shareholders: | ||||||||||||||||
| Beginning of year | 756,653 | 0 | 4,466,886 | 1,781,435 | ||||||||||||
| End of year | $ | 653,891 | $ | 756,653 | $ | 4,578,482 | $ | 4,466,886 | ||||||||
* Common Share Transactions: | ||||||||||||||||
| Shares sold | 0 | 43,983 | 33,641 | 7,210 | ||||||||||||
| Shares issued in reorganization | 0 | 0 | 0 | 147,079 | ||||||||||||
| Shares issued as reinvestment of distributions | 18 | 0 | 4,931 | 1,671 | ||||||||||||
| Net increase (decrease) in common shares outstanding | 18 | 43,983 | 38,572 | 155,960 | ||||||||||||
† | A zero balance may reflect actual amounts rounding to less than one thousand. |
(a) | Inception date of the Fund was January 31, 2022. |
(b) | The tax characterization of distributions is determined in accordance with Federal income tax regulations. See Note 2, Distributions—Common Shares, in the Notes to Financial Statements for more information. |
28 | PIMCO CLOSED-END FUNDS | See Accompanying Notes |
PIMCO Dynamic Income Opportunities Fund | ||||||
Year Ended June 30, 2023 | Year Ended June 30, 2022 | |||||
| $ | 165,765 | $ | 189,536 | |||
| (175,444 | ) | 55,882 | ||||
| (4,391 | ) | (606,887 | ) | |||
| | (14,070 | ) | (361,469 | ) | ||
| (275,384 | ) | (209,275 | ) | |||
| (275,384 | ) | (209,275 | ) | |||
| 527 | 0 | |||||
| 0 | 0 | |||||
| 0 | 0 | |||||
| 0 | 0 | |||||
| 10,956 | 27,950 | |||||
| 11,483 | 27,950 | |||||
| (277,971 | ) | (542,794 | ) | |||
| 1,684,507 | 2,227,301 | |||||
| $ | 1,406,536 | $ | 1,684,507 | |||
| 37 | 0 | |||||
| 0 | 0 | |||||
| 787 | 1,401 | |||||
| 824 | 1,401 | |||||
ANNUAL REPORT | | | JUNE 30, 2023 | 29 |
Statements of Cash Flows |
| Year Ended June 30, 2023 | ||||||||||||
(Amounts in thousands † | PCM Fund, Inc. | PIMCO Global StocksPLUS ® Income Fund | PIMCO Strategic Income Fund, Inc. | |||||||||
Cash Flows Provided by (Used for) Operating Activities: | ||||||||||||
| Net increase (decrease) in net assets resulting from operations | $ | (70 | ) | $ | 9,639 | $ | 10,932 | |||||
Adjustments to Reconcile Net Increase (Decrease) in Net Assets from Operations to Net Cash Provided by (Used for) Operating Activities: | ||||||||||||
| Purchases of long-term securities | (29,181 | ) | (629,220 | ) | (3,169,731 | ) | ||||||
| Proceeds from sales of long-term securities | 45,144 | 652,694 | 3,040,242 | |||||||||
| (Purchases) Proceeds from sales of short-term portfolio investments, net | 1,873 | 3,072 | (2,583 | ) | ||||||||
| (Increase) decrease in deposits with counterparty | 1,971 | 2,953 | 9,804 | |||||||||
| (Increase) decrease in receivable for investments sold | 61 | (11,381 | ) | (35,862 | ) | |||||||
| (Increase) decrease in interest and/or dividends receivable | (132 | ) | (395 | ) | 863 | |||||||
| Proceeds from (Payments on) exchange-traded or centrally cleared financial derivative instruments | (706 | ) | 257 | 11,758 | ||||||||
| Proceeds from (Payments on) over the counter financial derivative instruments | (66 | ) | (10,542 | ) | 1,538 | |||||||
| (Increase) decrease in other assets | (62 | ) | (64 | ) | 1 | |||||||
| Increase (decrease) in payable for investments purchased | 88 | 14,529 | 220,708 | |||||||||
| Increase (decrease) in payable for unfunded loan commitments | (534 | ) | 588 | 1,184 | ||||||||
| Increase (decrease) in deposits from counterparty | (45 | ) | 8,350 | (881 | ) | |||||||
| Increase (decrease) in accrued management fees | (15 | ) | (29 | ) | (9 | ) | ||||||
| Proceeds from (Payments on) short sales transactions, net | 0 | (34 | ) | (233 | ) | |||||||
| Proceeds from (Payments on) foreign currency transactions | 1 | (383 | ) | (1,083 | ) | |||||||
| Increase (decrease) in other liabilities | (5 | ) | (17 | ) | (14 | ) | ||||||
Net Realized (Gain) Loss | ||||||||||||
| Investments in securities | (643 | ) | 4,542 | 27,220 | ||||||||
| Exchange-traded or centrally cleared financial derivative instruments | 4,140 | 1,705 | (13,668 | ) | ||||||||
| Over the counter financial derivative instruments | (27 | ) | 10,484 | (1,608 | ) | |||||||
| Foreign currency | (1 | ) | 370 | 1,170 | ||||||||
Net Change in Unrealized (Appreciation) Depreciation | ||||||||||||
| Investments in securities | 9,392 | 1,054 | (9,281 | ) | ||||||||
| Exchange-traded or centrally cleared financial derivative instruments | (3,186 | ) | (3,775 | ) | 571 | |||||||
| Over the counter financial derivative instruments | 75 | (15,508 | ) | 1,793 | ||||||||
| Foreign currency assets and liabilities | 0 | 168 | 625 | |||||||||
| Net amortization (accretion) on investments | (616 | ) | (973 | ) | 1,203 | |||||||
Net Cash Provided by (Used for) Operating Activities | 27,456 | 38,084 | 94,659 | |||||||||
Cash Flows Received from (Used for) Financing Activities: | ||||||||||||
| Increase (decrease) in overdraft due to custodian | (3 | ) | 33 | 40 | ||||||||
| Cash distributions paid to common shareholders* | (10,240 | ) | (8,316 | ) | (24,420 | ) | ||||||
| Proceeds from reverse repurchase agreements | 340,640 | 175,003 | 690,894 | |||||||||
| Payments on reverse repurchase agreements | (357,841 | ) | (205,279 | ) | (763,354 | ) | ||||||
Net Cash Received from (Used for) Financing Activities | (27,444 | ) | (38,559 | ) | (96,840 | ) | ||||||
Net Increase (Decrease) in Cash and Foreign Currency | 12 | (475 | ) | (2,181 | ) | |||||||
Cash and Foreign Currency: | ||||||||||||
| Beginning of year | 0 | 484 | 2,181 | |||||||||
| End of year | $ | 12 | $ | 9 | $ | 0 | ||||||
| * Reinvestment of distributions | $ | 1,127 | $ | 1,009 | $ | 3,224 | ||||||
Supplemental Disclosure of Cash Flow Information: | ||||||||||||
| Interest expense paid during the year | $ | 2,735 | $ | 1,477 | $ | 5,218 | ||||||
| Non Cash Payment in Kind | $ | 449 | $ | 807 | $ | 1,859 | ||||||
† | A zero balance may reflect actual amounts rounding to less than one thousand. |
30 | PIMCO CLOSED-END FUNDS | See Accompanying Notes |
Consolidated Statements of Cash Flows |
| Year Ended June 30, 2023 | ||||||||||||
(Amounts in thousands † | PIMCO Access Income Fund | PIMCO Dynamic Income Fund | PIMCO Dynamic Income Opportunities Fund | |||||||||
Cash Flows Provided by (Used for) Operating Activities: | ||||||||||||
| Net increase (decrease) in net assets resulting from operations | $ | (4,179 | ) | $ | 164,406 | $ | (14,070 | ) | ||||
Adjustments to Reconcile Net Increase (Decrease) in Net Assets from Operations to Net Cash Provided by (Used for) Operating Activities: | ||||||||||||
| Purchases of long-term securities | (329,125 | ) | (1,907,777 | ) | (455,985 | ) | ||||||
| Proceeds from sales of long-term securities | 425,785 | 1,988,247 | 949,549 | |||||||||
| (Purchases) Proceeds from sales of short-term portfolio investments, net | (110,788 | ) | (117,485 | ) | 61,541 | |||||||
| (Increase) decrease in deposits with counterparty | 13,419 | 98,808 | 23,008 | |||||||||
| (Increase) decrease in receivable for investments sold | (5,545 | ) | 55,296 | (82,523 | ) | |||||||
| (Increase) decrease in interest and/or dividends receivable | (3,763 | ) | (18,463 | ) | (1,758 | ) | ||||||
| Proceeds from (Payments on) exchange-traded or centrally cleared financial derivative instruments | 4,285 | 4,736 | 4,751 | |||||||||
| Proceeds from (Payments on) over the counter financial derivative instruments | (3,252 | ) | 13,832 | (5,710 | ) | |||||||
| (Increase) decrease in other assets | 0 | (1,899 | ) | (308 | ) | |||||||
| Increase (decrease) in payable for investments purchased | (40,233 | ) | 102,358 | (29,884 | ) | |||||||
| Increase (decrease) in payable for unfunded loan commitments | (1,863 | ) | (20,552 | ) | 4,311 | |||||||
| Increase (decrease) in deposits from counterparty | (2,831 | ) | (27,186 | ) | 2,458 | |||||||
| Increase (decrease) in accrued management fees | 91 | (308 | ) | (596 | ) | |||||||
| Increase (decrease) in foreign capital gains taxes payable | 0 | 4 | 80 | |||||||||
| Proceeds from (Payments on) short sales transactions, net | 0 | (1,926 | ) | 0 | ||||||||
| Proceeds from (Payments on) foreign currency transactions | 1,585 | (13,780 | ) | (7,412 | ) | |||||||
| Increase (decrease) in other liabilities | 0 | (222 | ) | 6 | ||||||||
Net Realized (Gain) Loss | ||||||||||||
| Investments in securities | 43,500 | 298,858 | 165,942 | |||||||||
| Exchange-traded or centrally cleared financial derivative instruments | 4,557 | (78,889 | ) | (4,195 | ) | |||||||
| Over the counter financial derivative instruments | 5,037 | (14,612 | ) | 5,705 | ||||||||
| Foreign currency | (3,040 | ) | 9,929 | 7,992 | ||||||||
Net Change in Unrealized (Appreciation) Depreciation | ||||||||||||
| Investments in securities | 42,022 | 26,307 | 16 | |||||||||
| Investments in Affiliates | 0 | 12,609 | 0 | |||||||||
| Exchange-traded or centrally cleared financial derivative instruments | (8,334 | ) | 75,532 | (1,127 | ) | |||||||
| Over the counter financial derivative instruments | (1,097 | ) | 31,730 | 770 | ||||||||
| Foreign currency assets and liabilities | 1,213 | 18,869 | 4,732 | |||||||||
| Net amortization (accretion) on investments | (18,596 | ) | (85,785 | ) | (13,642 | ) | ||||||
Net Cash Provided by (Used for) Operating Activities | 8,848 | 612,637 | 613,651 | |||||||||
Cash Flows Received from (Used for) Financing Activities: | ||||||||||||
Net proceeds from at-the-market | 0 | 652,133 | 527 | |||||||||
| Increase (decrease) in overdraft due to custodian | 3,874 | 7,367 | (21,614 | ) | ||||||||
| Cash distributions paid to common shareholders* | (97,142 | ) | (704,178 | ) | (263,277 | ) | ||||||
| Proceeds from reverse repurchase agreements | 3,294,602 | 16,945,742 | 6,802,335 | |||||||||
| Payments on reverse repurchase agreements | (3,207,263 | ) | (17,517,217 | ) | (7,131,541 | ) | ||||||
Net Cash Received from (Used for) Financing Activities | (5,929 | ) | (616,153 | ) | (613,570 | ) | ||||||
Net Increase (Decrease) in Cash and Foreign Currency | 2,919 | (3,516 | ) | 81 | ||||||||
Cash and Foreign Currency: | ||||||||||||
| Beginning of year | 3,951 | 7,844 | 4,791 | |||||||||
| End of year | $ | 6,870 | $ | 4,328 | $ | 4,872 | ||||||
| * Reinvestment of distributions | $ | 292 | $ | 91,496 | $ | 10,956 | ||||||
Supplemental Disclosure of Cash Flow Information: | ||||||||||||
| Interest expense paid during the year | $ | 22,018 | $ | 114,779 | $ | 48,554 | ||||||
| Non Cash Payment in Kind | $ | 6,964 | $ | 44,161 | $ | 14,598 | ||||||
† | A zero balance may reflect actual amounts rounding to less than one thousand. |
ANNUAL REPORT | | | JUNE 30, 2023 | 31 |
Schedule of Investments | PCM Fund, Inc. |
PRINCIPAL AMOUNT (000S) | MARKET VALUE (000S) | |||||||||||
INVESTMENTS IN SECURITIES 183.0% | ||||||||||||
LOAN PARTICIPATIONS AND ASSIGNMENTS 25.8% | ||||||||||||
AmSurg LLC | ||||||||||||
0.500% - 11.000% (PRIME + 2.750%) due 07/20/2026 «~ | $ | 71 | $ | 71 | ||||||||
Diamond Sports Group LLC | ||||||||||||
13.064% due 05/25/2026 | 1,284 | 994 | ||||||||||
Encina Private Credit LLC | ||||||||||||
TBD% - 9.867% (LIBOR01M + 4.674%) due 11/30/2025 «~µ | 1,139 | 1,101 | ||||||||||
Envision Healthcare Corp. | ||||||||||||
16.070% due 04/29/2027 | 1,371 | 1,636 | ||||||||||
16.695% due 04/28/2028 « | 2,929 | 2,216 | ||||||||||
Exgen Texas Power LLC | ||||||||||||
11.948% (LIBOR03M + 6.750%) due 10/08/2026 «~ | 924 | 929 | ||||||||||
Forbes Energy Services LLC | ||||||||||||
TBD% due 12/31/2023 « | 521 | 0 | ||||||||||
Incora | ||||||||||||
TBD% - 13.725% due 03/01/2024 «µ | 1,025 | 1,025 | ||||||||||
Ivanti Software, Inc. | ||||||||||||
9.420% (LIBOR01M + 4.250%) due 12/01/2027 ~ | 1,664 | 1,410 | ||||||||||
Lealand Finance Co. BV | ||||||||||||
8.217% due 06/28/2024 | 27 | 22 | ||||||||||
Lealand Finance Co. BV (6.193% Cash and 3.000% PIK) | ||||||||||||
9.193% (LIBOR01M + 1.000%) due 06/30/2025 ~(c) | 201 | 117 | ||||||||||
Profrac Services LLC | ||||||||||||
12.753% due 03/04/2025 | 1,038 | 1,042 | ||||||||||
PUG LLC | ||||||||||||
8.717% (LIBOR01M + 3.500%) due 02/12/2027 ~ | 693 | 620 | ||||||||||
9.452% (LIBOR01M + 4.250%) due 02/12/2027 «~ | 282 | 256 | ||||||||||
Radiate Holdco LLC | ||||||||||||
8.477% due 09/25/2026 | 995 | 833 | ||||||||||
Redstone Holdco 2 LP | ||||||||||||
10.005% (LIBOR03M + 4.750%) due 04/27/2028 ~ | 1,227 | 1,027 | ||||||||||
Rising Tide Holdings, Inc. | ||||||||||||
10.264% due 06/01/2028 | 1,104 | 673 | ||||||||||
13.466% due 06/01/2029 « | 83 | 7 | ||||||||||
13.966% due 06/01/2029 « | 85 | 37 | ||||||||||
14.091% due 06/01/2026 « | 86 | 84 | ||||||||||
Softbank Vision Fund | ||||||||||||
5.000% due 12/21/2025 « | 741 | 694 | ||||||||||
Syniverse Holdings, Inc. | ||||||||||||
12.242% due 05/13/2027 | 2,009 | 1,847 | ||||||||||
Team Health Holdings, Inc. | ||||||||||||
7.943% (LIBOR01M + 2.750%) due 02/06/2024 ~ | 1,762 | 1,568 | ||||||||||
U.S. Renal Care, Inc. | ||||||||||||
TBD% (LIBOR01M + 5.500%) due 06/26/2026 ~ | 1,462 | 686 | ||||||||||
TBD% (LIBOR01M + 5.000%) due 06/26/2026 ~ | 989 | 464 | ||||||||||
Veritas U.S., Inc. | ||||||||||||
10.217% (LIBOR01M + 5.000%) due 09/01/2025 ~ | 1,194 | 979 | ||||||||||
Westmoreland Mining Holdings LLC | ||||||||||||
8.000% due 03/15/2029 | 369 | 272 | ||||||||||
Windstream Services LLC | ||||||||||||
11.452% due 09/21/2027 | 165 | 154 | ||||||||||
Total Loan Participations and Assignments (Cost $23,707) | 20,764 | |||||||||||
CORPORATE BONDS & NOTES 22.6% | ||||||||||||
BANKING & FINANCE 7.1% | ||||||||||||
CBRE Services, Inc. | ||||||||||||
5.950% due 08/15/2034 | 1,100 | 1,087 | ||||||||||
PRINCIPAL AMOUNT (000S) | MARKET VALUE (000S) | |||||||||||
Navient Corp. | ||||||||||||
5.625% due 01/25/2025 | $ | 51 | $ | 46 | ||||||||
Piper Sandler Cos. | ||||||||||||
5.200% due 10/15/2023 | 900 | 898 | ||||||||||
SVB Financial Group | ||||||||||||
1.800% due 02/02/2031 ^(d) | 284 | 181 | ||||||||||
4.345% due 04/29/2028 ^(d) | 100 | 70 | ||||||||||
4.570% due 04/29/2033 ^(d) | 200 | 134 | ||||||||||
Uniti Group LP | ||||||||||||
6.000% due 01/15/2030 (k) | 1,065 | 723 | ||||||||||
10.500% due 02/15/2028 (k) | 807 | 801 | ||||||||||
Voyager Aviation Holdings LLC | ||||||||||||
8.500% due 05/09/2026 (k) | 2,205 | 1,742 | ||||||||||
| 5,682 | ||||||||||||
INDUSTRIALS 15.1% | ||||||||||||
Carvana Co. | ||||||||||||
10.250% due 05/01/2030 | 400 | 316 | ||||||||||
CVS Pass-Through Trust | ||||||||||||
5.880% due 01/10/2028 (k) | 650 | 637 | ||||||||||
DISH DBS Corp. | ||||||||||||
5.250% due 12/01/2026 (k) | 660 | 531 | ||||||||||
5.750% due 12/01/2028 (k) | 400 | 298 | ||||||||||
DISH Network Corp. | ||||||||||||
11.750% due 11/15/2027 (k) | 800 | 782 | ||||||||||
Exela Intermediate LLC | ||||||||||||
11.500% due 07/15/2026 | 17 | 2 | ||||||||||
Topaz Solar Farms LLC | ||||||||||||
4.875% due 09/30/2039 (k) | 273 | 251 | ||||||||||
5.750% due 09/30/2039 (k) | 1,867 | 1,833 | ||||||||||
U.S. Renal Care, Inc. | ||||||||||||
10.625% due 07/15/2027 | 712 | 181 | ||||||||||
Veritas US, Inc. | ||||||||||||
7.500% due 09/01/2025 (k) | 1,200 | 975 | ||||||||||
Viking Cruises Ltd. | ||||||||||||
13.000% due 05/15/2025 (k) | 965 | 1,014 | ||||||||||
Wesco Aircraft Holdings, Inc. (7.500% Cash and 3.000% PIK) | ||||||||||||
10.500% due 11/15/2026 ^(c)(d) | 4,180 | 3,804 | ||||||||||
Windstream Escrow LLC | ||||||||||||
7.750% due 08/15/2028 (k) | 1,752 | 1,456 | ||||||||||
| 12,080 | ||||||||||||
UTILITIES 0.4% | ||||||||||||
Pacific Gas & Electric Co. | ||||||||||||
3.750% due 08/15/2042 | 2 | 1 | ||||||||||
4.000% due 12/01/2046 | 2 | 1 | ||||||||||
4.300% due 03/15/2045 (k) | 463 | 331 | ||||||||||
4.450% due 04/15/2042 | 22 | 17 | ||||||||||
| 350 | ||||||||||||
Total Corporate Bonds & Notes (Cost $20,314) | 18,112 | |||||||||||
CONVERTIBLE BONDS & NOTES 0.6% | ||||||||||||
INDUSTRIALS 0.6% | ||||||||||||
Multiplan Corp. (6.000% Cash or 7.000% PIK) | ||||||||||||
6.000% due 10/15/2027 (c)(k) | 700 | 475 | ||||||||||
Total Convertible Bonds & Notes (Cost $688) | 475 | |||||||||||
MUNICIPAL BONDS & NOTES 1.6% | ||||||||||||
PUERTO RICO 1.6% | ||||||||||||
Commonwealth of Puerto Rico Bonds, Series 2022 | ||||||||||||
0.000% due 11/01/2043 | 1,418 | 717 | ||||||||||
0.000% due 11/01/2051 | 1,234 | 565 | ||||||||||
Total Municipal Bonds & Notes (Cost $1,286) | 1,282 | |||||||||||
PRINCIPAL AMOUNT (000S) | MARKET VALUE (000S) | |||||||||||
U.S. GOVERNMENT AGENCIES 4.5% | ||||||||||||
Fannie Mae | ||||||||||||
4.000% due 06/25/2050 (a)(k) | $ | 3,016 | $ | 574 | ||||||||
10.900% due 07/25/2029 •(k) | 230 | 258 | ||||||||||
Freddie Mac | ||||||||||||
0.700% due 11/25/2055 ~(a) | 6,000 | 398 | ||||||||||
1.000% due 05/25/2050 •(a)(k) | 1,597 | 178 | ||||||||||
2.079% due 11/25/2045 ~(a) | 1,027 | 79 | ||||||||||
3.500% due 02/25/2041 (a)(k) | 1,825 | 229 | ||||||||||
4.000% due 07/25/2050 (a)(k) | 5,682 | 1,239 | ||||||||||
5.000% due 03/15/2040 (a)(k) | 303 | 13 | ||||||||||
10.300% due 10/25/2029 •(k) | 250 | 273 | ||||||||||
12.700% due 12/25/2027 • | 401 | 409 | ||||||||||
Total U.S. Government Agencies (Cost $3,801) | 3,650 | |||||||||||
NON-AGENCY MORTGAGE-BACKED SECURITIES 48.2% | ||||||||||||
245 Park Avenue Trust | ||||||||||||
3.779% due 06/05/2037 ~(k) | 1,065 | 742 | ||||||||||
Adjustable Rate Mortgage Trust | ||||||||||||
4.521% due 01/25/2036 ^«~ | 49 | 44 | ||||||||||
Ashford Hospitality Trust | ||||||||||||
6.719% due 04/15/2035 •(k) | 900 | 868 | ||||||||||
Banc of America Alternative Loan Trust | ||||||||||||
5.370% due 04/25/2037 ^«~ | 68 | 57 | ||||||||||
Banc of America Funding Trust | ||||||||||||
3.111% due 12/20/2034 ~ | 187 | 135 | ||||||||||
3.633% due 03/20/2036 «~ | 39 | 32 | ||||||||||
5.806% due 03/25/2037 ^«~ | 38 | 37 | ||||||||||
7.000% due 10/25/2037 ^« | 329 | 225 | ||||||||||
Banc of America Mortgage Trust | ||||||||||||
4.744% due 06/25/2035 «~ | 38 | 32 | ||||||||||
4.883% due 06/20/2031 «~ | 132 | 126 | ||||||||||
Bancorp Commercial Mortgage Trust | ||||||||||||
8.943% due 08/15/2032 •(k) | 1,580 | 1,570 | ||||||||||
Barclays Commercial Mortgage Securities Trust | ||||||||||||
3.811% due 02/15/2053 ~(k) | 1,000 | 740 | ||||||||||
8.143% due 10/15/2037 •(k) | 900 | 838 | ||||||||||
BCAP LLC Trust | ||||||||||||
5.548% due 07/26/2036 ~ | 62 | 52 | ||||||||||
Bear Stearns ALT-A Trust | ||||||||||||
3.674% due 05/25/2036 ~ | 23 | 18 | ||||||||||
3.695% due 05/25/2036 ^~ | 88 | 64 | ||||||||||
3.817% due 11/25/2036 ^~ | 470 | 248 | ||||||||||
3.877% due 01/25/2047 ~ | 21 | 10 | ||||||||||
4.116% due 08/25/2036 ^~ | 183 | 96 | ||||||||||
4.125% due 09/25/2034 «~ | 62 | 58 | ||||||||||
4.433% due 07/25/2035 ^~ | 104 | 76 | ||||||||||
5.490% due 04/25/2037 • | 396 | 346 | ||||||||||
Bear Stearns Asset-Backed Securities Trust | ||||||||||||
5.500% due 12/25/2035 « | 24 | 15 | ||||||||||
Bear Stearns Commercial Mortgage Securities Trust | ||||||||||||
5.657% due 10/12/2041 ~ | 38 | 35 | ||||||||||
BHP Trust | ||||||||||||
8.131% due 08/15/2036 •(k) | 588 | 553 | ||||||||||
CBA Commercial Small Balance Commercial Mortgage | ||||||||||||
6.040% due 01/25/2039 ^þ | 109 | 101 | ||||||||||
CD Mortgage Trust | ||||||||||||
5.688% due 10/15/2048 | 60 | 53 | ||||||||||
Chase Mortgage Finance Trust | ||||||||||||
6.000% due 03/25/2037 ^ | 159 | 86 | ||||||||||
Citigroup Commercial Mortgage Trust | ||||||||||||
5.617% due 12/10/2049 ~ | 345 | 233 | ||||||||||
Citigroup Mortgage Loan Trust | ||||||||||||
4.222% due 10/25/2035 ~ | 250 | 203 | ||||||||||
4.343% due 11/25/2035 ~(k) | 1,102 | 630 | ||||||||||
6.250% due 11/25/2037 ~ | 648 | 311 | ||||||||||
Citigroup Mortgage Loan Trust, Inc. Mortgage Pass-Through Certificates | ||||||||||||
3.618% due 09/25/2035 ^«~ | 60 | 42 | ||||||||||
Commercial Mortgage Lease-Backed Certificates | ||||||||||||
6.250% due 06/20/2031 ~(k) | 1,217 | 1,192 | ||||||||||
Commercial Mortgage Loan Trust | ||||||||||||
6.809% due 12/10/2049 ~ | 133 | 32 | ||||||||||
32 | PIMCO CLOSED-END FUNDS | See Accompanying Notes |
| June 30, 2023 |
PRINCIPAL AMOUNT (000S) | MARKET VALUE (000S) | |||||||||||
Connecticut Avenue Securities Trust | ||||||||||||
8.167% due 10/25/2041 •(k) | $ | 800 | $ | 790 | ||||||||
Countrywide Alternative Loan Trust | ||||||||||||
4.976% due 12/25/2035 •(k) | 558 | 470 | ||||||||||
5.500% due 03/25/2035 | 375 | 168 | ||||||||||
5.700% due 10/25/2037 •(k) | 3,505 | 789 | ||||||||||
5.710% due 02/25/2037 • | 123 | 102 | ||||||||||
5.730% due 02/25/2036 ^• | 368 | 326 | ||||||||||
6.000% due 11/25/2035 ^« | 160 | 27 | ||||||||||
6.000% due 04/25/2036 ^(k) | 2,130 | 1,050 | ||||||||||
Countrywide Home Loan Mortgage Pass-Through Trust | ||||||||||||
3.611% due 09/25/2047 ^~ | 165 | 145 | ||||||||||
3.680% due 09/20/2036 ^~ | 61 | 53 | ||||||||||
5.790% due 03/25/2035 • | 66 | 57 | ||||||||||
5.910% due 02/20/2036 ^• | 2 | 2 | ||||||||||
6.000% due 05/25/2037 ^ | 180 | 86 | ||||||||||
7.020% due 03/25/2046 ^• | 327 | 215 | ||||||||||
Credit Suisse First Boston Mortgage Securities Corp. | ||||||||||||
7.000% due 02/25/2033 « | 31 | 30 | ||||||||||
Credit Suisse Mortgage Capital Mortgage-Backed Trust | ||||||||||||
6.000% due 07/25/2036 (k) | 863 | 454 | ||||||||||
6.396% due 04/25/2036 þ | 145 | 78 | ||||||||||
6.500% due 05/25/2036 ^« | 144 | 57 | ||||||||||
DBGS Mortgage Trust | ||||||||||||
0.201% due 10/15/2036 ~(a) | 147,870 | 357 | ||||||||||
7.293% due 06/15/2033 •(k) | 900 | 713 | ||||||||||
7.843% due 06/15/2033 • | 200 | 153 | ||||||||||
Extended Stay America Trust | ||||||||||||
8.894% due 07/15/2038 •(k) | 867 | 827 | ||||||||||
First Horizon Alternative Mortgage Securities Trust | ||||||||||||
5.373% due 08/25/2035 ^«~ | 3 | 0 | ||||||||||
Freddie Mac | ||||||||||||
12.567% due 10/25/2041 •(k) | 1,100 | 1,099 | ||||||||||
12.867% due 11/25/2041 •(k) | 1,100 | 1,085 | ||||||||||
GS Mortgage Securities Corp. Trust | ||||||||||||
4.744% due 10/10/2032 ~(k) | 800 | 735 | ||||||||||
4.744% due 10/10/2032 ~ | 100 | 90 | ||||||||||
GS Mortgage Securities Trust | ||||||||||||
0.568% due 08/10/2043 ~(a) | 1,790 | 14 | ||||||||||
GSR Mortgage Loan Trust | ||||||||||||
3.575% due 03/25/2047 ^~ | 578 | 377 | ||||||||||
HarborView Mortgage Loan Trust | ||||||||||||
5.657% due 01/19/2036 • | 399 | 248 | ||||||||||
IndyMac INDA Mortgage Loan Trust | ||||||||||||
3.839% due 06/25/2037 ~ | 94 | 72 | ||||||||||
IndyMac INDX Mortgage Loan Trust | ||||||||||||
3.238% due 05/25/2036 «~ | 90 | 46 | ||||||||||
5.950% due 11/25/2034 • | 56 | 50 | ||||||||||
JP Morgan Alternative Loan Trust | ||||||||||||
6.500% due 03/25/2036 ^(k) | 746 | 434 | ||||||||||
JP Morgan Chase Commercial Mortgage Securities Trust | ||||||||||||
0.504% due 02/15/2046 «~(a)(k) | 53,241 | 74 | ||||||||||
6.241% due 02/12/2051 ~ | 30 | 245 | ||||||||||
6.663% due 07/05/2033 •(k) | 843 | 764 | ||||||||||
9.443% due 02/15/2035 •(k) | 786 | 735 | ||||||||||
11.584% due 11/15/2038 •(k) | 900 | 808 | ||||||||||
JP Morgan Mortgage Trust | ||||||||||||
4.730% due 07/25/2035 «~ | 15 | 15 | ||||||||||
Lehman Mortgage Trust | ||||||||||||
5.890% due 04/25/2036 ^~ | 160 | 106 | ||||||||||
6.000% due 05/25/2037 ^« | 5 | 5 | ||||||||||
MASTR Adjustable Rate Mortgages Trust | ||||||||||||
4.318% due 11/25/2035 ^«~ | 185 | 92 | ||||||||||
MASTR Asset Securitization Trust | ||||||||||||
6.000% due 06/25/2036 ^• | 154 | 101 | ||||||||||
Merrill Lynch Mortgage Investors Trust | ||||||||||||
4.059% due 02/25/2034 ~ | 3 | 3 | ||||||||||
4.120% due 11/25/2035 • | 38 | 37 | ||||||||||
4.969% due 05/25/2033 «~ | 8 | 7 | ||||||||||
5.570% due 07/25/2030 «• | 18 | 16 | ||||||||||
5.810% due 11/25/2029 • | 44 | 40 | ||||||||||
MFA Trust | ||||||||||||
3.910% due 08/25/2061 ~(k) | 1,000 | 851 | ||||||||||
4.265% due 12/25/2066 ~(k) | 1,000 | 714 | ||||||||||
PRINCIPAL AMOUNT (000S) | MARKET VALUE (000S) | |||||||||||
Morgan Stanley Capital Trust | ||||||||||||
0.268% due 11/12/2049 ~(a) | $ | 133 | $ | 0 | ||||||||
9.668% due 11/15/2034 • | 400 | 374 | ||||||||||
Morgan Stanley Mortgage Loan Trust | ||||||||||||
4.806% due 01/25/2035 ^~ | 164 | 134 | ||||||||||
6.000% due 08/25/2037 ^ | 136 | 57 | ||||||||||
Morgan Stanley Re-REMIC Trust | ||||||||||||
4.001% due 03/26/2037 ~(k) | 1,753 | 1,523 | ||||||||||
Mortgage Equity Conversion Asset Trust | ||||||||||||
4.000% due 07/25/2060 | 81 | 72 | ||||||||||
Natixis Commercial Mortgage Securities Trust | ||||||||||||
4.193% due 04/10/2037 ~(k) | 1,197 | 805 | ||||||||||
9.092% due 03/15/2035 •(k) | 301 | 295 | ||||||||||
10.340% due 03/15/2035 •(k) | 601 | 582 | ||||||||||
New Residential Mortgage Loan Trust | ||||||||||||
3.885% due 11/25/2059 ~(k) | 2,900 | 1,401 | ||||||||||
Nomura Asset Acceptance Corp. Alternative Loan Trust | ||||||||||||
6.220% due 02/25/2035 •(k) | 200 | 196 | ||||||||||
Regal Trust | ||||||||||||
3.910% due 09/29/2031 «• | 11 | 9 | ||||||||||
Residential Accredit Loans, Inc. Trust | ||||||||||||
4.951% due 01/25/2036 ^~ | 167 | 120 | ||||||||||
6.000% due 08/25/2035 ^ | 117 | 99 | ||||||||||
6.000% due 06/25/2036 ^ | 64 | 51 | ||||||||||
6.500% due 09/25/2037 ^ | 118 | 94 | ||||||||||
Residential Asset Securitization Trust | ||||||||||||
6.000% due 03/25/2037 ^ | 181 | 62 | ||||||||||
Residential Funding Mortgage Securities, Inc. Trust | ||||||||||||
6.000% due 06/25/2036 ^« | 88 | 71 | ||||||||||
Structured Adjustable Rate Mortgage Loan Trust | ||||||||||||
3.853% due 04/25/2036 ^~ | 156 | 95 | ||||||||||
3.986% due 09/25/2036 ^« | 20 | 18 | ||||||||||
4.378% due 01/25/2036 ^~ | 174 | 108 | ||||||||||
Structured Asset Mortgage Investments Trust | ||||||||||||
5.570% due 08/25/2036 ^•(k) | 303 | 249 | ||||||||||
TBW Mortgage-Backed Trust | ||||||||||||
6.000% due 07/25/2036 ^« | 102 | 39 | ||||||||||
Tharaldson Hotel Portfolio Trust | ||||||||||||
8.671% due 11/11/2034 •(k) | 1,126 | 1,084 | ||||||||||
Wachovia Bank Commercial Mortgage Trust | ||||||||||||
0.735% due 10/15/2041 ~(a) | 14 | 0 | ||||||||||
WaMu Mortgage Pass-Through Certificates Trust | ||||||||||||
3.768% due 12/25/2036 ^~(k) | 156 | 140 | ||||||||||
5.476% due 10/25/2046 • | 696 | 629 | ||||||||||
5.476% due 11/25/2046 •(k) | 443 | 391 | ||||||||||
6.050% due 10/25/2045 •(k) | 2,450 | 2,039 | ||||||||||
6.130% due 06/25/2044 «• | 162 | 146 | ||||||||||
Washington Mutual Mortgage Pass-Through Certificates Trust | ||||||||||||
6.500% due 08/25/2036 ^(k) | 647 | 527 | ||||||||||
Wells Fargo Commercial Mortgage Trust | ||||||||||||
5.092% due 12/15/2039 ~(k) | 1,042 | 900 | ||||||||||
Worldwide Plaza Trust | ||||||||||||
3.715% due 11/10/2036 ~(k) | 2,400 | 719 | ||||||||||
Total Non-Agency Mortgage-Backed Securities (Cost $44,478) | 38,741 | |||||||||||
ASSET-BACKED SECURITIES 63.7% | ||||||||||||
AIM Aviation Finance Ltd. | ||||||||||||
6.213% due 02/15/2040 þ(k) | 969 | 591 | ||||||||||
Asset-Backed Securities Corp. Home Equity Loan Trust | ||||||||||||
6.245% due 02/25/2035 •(k) | 1,369 | 1,382 | ||||||||||
8.413% due 06/21/2029 «• | 58 | 56 | ||||||||||
Bear Stearns Asset-Backed Securities Trust | ||||||||||||
4.037% due 07/25/2036 «~ | 45 | 43 | ||||||||||
5.085% due 04/25/2036 •(k) | 1,982 | 2,725 | ||||||||||
Bombardier Capital Mortgage Securitization Corp. | ||||||||||||
7.830% due 06/15/2030 ~ | 1,185 | 157 | ||||||||||
Citigroup Mortgage Loan Trust | ||||||||||||
5.470% due 12/25/2036 •(k) | 1,056 | 593 | ||||||||||
5.590% due 12/25/2036 •(k) | 646 | 262 | ||||||||||
5.850% due 11/25/2046 •(k) | 1,100 | 898 | ||||||||||
8.675% due 12/25/2033 •(k) | 917 | 936 | ||||||||||
PRINCIPAL AMOUNT (000S) | MARKET VALUE (000S) | |||||||||||
Conseco Finance Securitizations Corp. | ||||||||||||
7.960% due 05/01/2031 | $ | 324 | $ | 97 | ||||||||
9.163% due 03/01/2033 ~ | 743 | 681 | ||||||||||
Countrywide Asset-Backed Certificates Trust | ||||||||||||
5.300% due 04/25/2047 ^«• | 5 | 5 | ||||||||||
5.350% due 06/25/2037 ^•(k) | 496 | 487 | ||||||||||
5.410% due 12/25/2036 ^•(k) | 730 | 654 | ||||||||||
5.555% due 09/25/2046 •(k) | 4,144 | 3,341 | ||||||||||
5.630% due 05/25/2036 •(k) | 7,575 | 6,160 | ||||||||||
6.800% due 06/25/2035 •(k) | 4,000 | 3,912 | ||||||||||
7.025% due 10/25/2035 •(k) | 2,212 | 1,741 | ||||||||||
Crown City CLO | ||||||||||||
0.000% due 04/20/2035 ~ | 600 | 416 | ||||||||||
EMC Mortgage Loan Trust | ||||||||||||
6.200% due 05/25/2040 «• | 87 | 86 | ||||||||||
6.450% due 02/25/2041 «• | 184 | 174 | ||||||||||
Flagship Credit Auto Trust | ||||||||||||
0.000% due 06/15/2026 «(f) | 2 | 88 | ||||||||||
0.000% due 06/15/2029 «(f) | 14 | 2,277 | ||||||||||
GE Capital Mortgage Services, Inc. Trust | ||||||||||||
6.705% due 04/25/2029 «~ | 26 | 21 | ||||||||||
GSAMP Trust | ||||||||||||
6.950% due 06/25/2035 •(k) | 2,200 | 2,105 | ||||||||||
7.775% due 12/25/2034 •(k) | 2,151 | 1,665 | ||||||||||
Home Equity Mortgage Loan Asset-Backed Trust | ||||||||||||
5.390% due 04/25/2037 •(k) | 3,289 | 2,147 | ||||||||||
5.900% due 10/25/2035 • | 123 | 119 | ||||||||||
HSI Asset Securitization Corp. Trust | ||||||||||||
5.260% due 04/25/2037 •(k) | 2,807 | 1,424 | ||||||||||
5.490% due 12/25/2036 •(k) | 4,313 | 1,160 | ||||||||||
Lehman XS Trust | ||||||||||||
6.260% due 11/25/2035 þ | 728 | 338 | ||||||||||
Marlette Funding Trust | ||||||||||||
0.000% due 07/16/2029 «(f) | 5 | 377 | ||||||||||
0.000% due 03/15/2030 «(f) | 8 | 297 | ||||||||||
MASTR Asset-Backed Securities Trust | ||||||||||||
5.370% due 08/25/2036 •(k) | 2,499 | 978 | ||||||||||
Morgan Stanley ABS Capital, Inc. Trust | ||||||||||||
5.290% due 10/25/2036 •(k) | 8,031 | 3,494 | ||||||||||
5.930% due 12/25/2034 «• | 95 | 85 | ||||||||||
Morgan Stanley Home Equity Loan Trust | ||||||||||||
6.215% due 05/25/2035 •(k) | 1,917 | 1,616 | ||||||||||
National Collegiate Commutation Trust | ||||||||||||
0.000% due 03/25/2038 • | 3,500 | 1,066 | ||||||||||
People’s Financial Realty Mortgage Securities Trust | ||||||||||||
5.280% due 09/25/2036 • | 5,728 | 1,128 | ||||||||||
Renaissance Home Equity Loan Trust | ||||||||||||
7.238% due 09/25/2037 ^þ(k) | 3,328 | 1,450 | ||||||||||
Securitized Asset-Backed Receivables LLC Trust | ||||||||||||
5.795% due 01/25/2035 • | 194 | 195 | ||||||||||
SMB Private Education Loan Trust | ||||||||||||
0.000% due 02/16/2055 «(f) | 0 | 250 | ||||||||||
SoFi Professional Loan Program LLC | ||||||||||||
0.000% due 05/25/2040 (f) | 1,000 | 96 | ||||||||||
0.000% due 09/25/2040 «(f) | 339 | 41 | ||||||||||
Soundview Home Loan Trust | ||||||||||||
6.100% due 10/25/2037 •(k) | 1,665 | 1,234 | ||||||||||
Structured Asset Investment Loan Trust | ||||||||||||
6.875% due 10/25/2034 •(k) | 1,986 | 1,972 | ||||||||||
9.650% due 10/25/2033 «• | 68 | 74 | ||||||||||
UCFC Manufactured Housing Contract | ||||||||||||
7.900% due 01/15/2028 ^~ | 66 | 58 | ||||||||||
Total Asset-Backed Securities (Cost $59,592) | 51,152 | |||||||||||
SHARES | ||||||||||||
COMMON STOCKS 4.0% | ||||||||||||
COMMUNICATION SERVICES 0.4% | ||||||||||||
Clear Channel Outdoor Holdings, Inc. (e) | 108,013 | 148 | ||||||||||
iHeartMedia, Inc. ‘A’ (e) | 25,745 | 94 | ||||||||||
iHeartMedia, Inc. ‘B’ «(e) | 20,009 | 65 | ||||||||||
| 307 | ||||||||||||
| See Accompanying Notes | ANNUAL REPORT | | | JUNE 30, 2023 | 33 |
Schedule of Investments | PCM Fund, Inc. | (Cont.) |
SHARES | MARKET VALUE (000S) | |||||||||||
ENERGY 0.1% | ||||||||||||
Axis Energy Services ‘A’ «(i) | 3,344 | $ | 100 | |||||||||
INDUSTRIALS 3.1% | ||||||||||||
Mcdermott International Ltd. (e) | 7,216 | 1 | ||||||||||
Neiman Marcus Group Ltd. LLC «(e)(i) | 13,191 | 2,004 | ||||||||||
Syniverse Holdings, Inc. «(i) | 351,847 | 324 | ||||||||||
Voyager Aviation Holdings LLC «(e) | 307 | 0 | ||||||||||
Westmoreland Mining Holdings «(e)(i) | 9,154 | 115 | ||||||||||
Westmoreland Mining Holdings «(e) | 9,234 | 61 | ||||||||||
| 2,505 | ||||||||||||
UTILITIES 0.4% | ||||||||||||
TexGen Power LLC «(e)(i) | 9,914 | 278 | ||||||||||
Total Common Stocks (Cost $3,323) | 3,190 | |||||||||||
WARRANTS 0.8% | ||||||||||||
INFORMATION TECHNOLOGY 0.8% | ||||||||||||
Windstream Holdings LLC - Exp. 9/21/2055 « | 43,518 | 666 | ||||||||||
Total Warrants (Cost $316) | 666 | |||||||||||
SHARES | MARKET VALUE (000S) | |||||||||||
PREFERRED SECURITIES 0.6% | ||||||||||||
FINANCIALS 0.0% | ||||||||||||
SVB Financial Group | ||||||||||||
4.700% due 11/15/2031 ^(d)(h) | 11,000 | $ | 1 | |||||||||
INDUSTRIALS 0.6% | ||||||||||||
Voyager Aviation Holdings LLC « | 1,842 | 444 | ||||||||||
Total Preferred Securities (Cost $605) | 445 | |||||||||||
REAL ESTATE INVESTMENT TRUSTS 0.8% | ||||||||||||
REAL ESTATE 0.8% | ||||||||||||
CBL & Associates Properties, Inc. | 4,345 | 96 | ||||||||||
Uniti Group, Inc. | 34,736 | 161 | ||||||||||
VICI Properties, Inc. | 13,531 | 425 | ||||||||||
Total Real Estate Investment Trusts (Cost $317) | 682 | |||||||||||
PRINCIPAL AMOUNT (000S) | MARKET VALUE (000S) | |||||||||||
SHORT-TERM INSTRUMENTS 9.8% | ||||||||||||
REPURCHASE AGREEMENTS (j) 9.5% | ||||||||||||
| $ | 7,628 | |||||||||||
U.S. TREASURY BILLS 0.3% | ||||||||||||
5.239% due 08/17/2023 (b)(f)(g)(n) | $ | 255 | 253 | |||||||||
Total Short-Term Instruments (Cost $7,881) | 7,881 | |||||||||||
Total Investments in Securities (Cost $166,308) | 147,040 | |||||||||||
Total Investments 183.0% (Cost $166,308) | $ | 147,040 | ||||||||||
Financial Derivative Instruments (l)(m) (0.4)% (Cost or Premiums, net $1,490) | (286 | ) | ||||||||||
Other Assets and Liabilities, net (82.6)% | (66,436 | ) | ||||||||||
Net Assets 100.0% | $ | 80,318 | ||||||||||
* | A zero balance may reflect actual amounts rounding to less than one thousand. |
^ | Security is in default. |
« | Security valued using significant unobservable inputs (Level 3). |
µ | All or a portion of this amount represents unfunded loan commitments. The interest rate for the unfunded portion will be determined at the time of funding. See Note 4, Securities and Other Investments, in the Notes to Financial Statements for more information regarding unfunded loan commitments. |
~ | Variable or Floating rate security. Rate shown is the rate in effect as of period end. Certain variable rate securities are not based on a published reference rate and spread, rather are determined by the issuer or agent and are based on current market conditions. Reference rate is as of reset date, which may vary by security. These securities may not indicate a reference rate and/or spread in their description. |
• | Rate shown is the rate in effect as of period end. The rate may be based on a fixed rate, a capped rate or a floor rate and may convert to a variable or floating rate in the future. These securities do not indicate a reference rate and spread in their description. |
þ | Coupon represents a rate which changes periodically based on a predetermined schedule or event. Rate shown is the rate in effect as of period end. |
(a) | Security is an Interest Only (“IO”) or IO Strip. |
(b) | When-issued security. |
(c) | Payment in-kind security. |
(d) | Security is not accruing income as of the date of this report. |
(e) | Security did not produce income within the last twelve months. |
(f) | Zero coupon security. |
(g) | Coupon represents a yield to maturity. |
(h) | Perpetual maturity; date shown, if applicable, represents next contractual call date. |
Issuer Description | Acquisition Date | Cost | Market Value | Market Value as Percentage of Net Assets | ||||||||||||||||||||
Axis Energy Services ‘A’ | 07/01/2021 | $ | 49 | $ | 100 | 0.12 | % | |||||||||||||||||
Neiman Marcus Group Ltd. LLC | 09/25/2020 | 425 | 2,004 | 2.50 | ||||||||||||||||||||
Syniverse Holdings, Inc. | 05/12/2022 - 05/31/2023 | 346 | 324 | 0.40 | ||||||||||||||||||||
TexGen Power LLC | 07/20/2018 | 314 | 278 | 0.35 | ||||||||||||||||||||
Westmoreland Mining Holdings | 12/08/2014 | 267 | 115 | 0.14 | ||||||||||||||||||||
| $ | 1,401 | $ | 2,821 | 3.51 | % | |||||||||||||||||||
34 | PIMCO CLOSED-END FUNDS | See Accompanying Notes |
| June 30, 2023 |
Counterparty | Lending Rate | Settlement Date | Maturity Date | Principal Amount | Collateralized By | Collateral (Received) | Repurchase Agreements, at Value | Repurchase Agreement Proceeds to be Received (1) | ||||||||||||||||||||||
| FICC | 2.400 | % | 06/30/2023 | 07/03/2023 | $ | 328 | U.S. Treasury Bonds 4.625% due 06/30/2025 | $ | (335 | ) | $ | 328 | $ | 328 | ||||||||||||||||
| SAL | 5.100 | 06/30/2023 | 07/03/2023 | 7,300 | U.S. Treasury Notes 0.250% due 10/31/2025 | (7,447 | ) | 7,300 | 7,303 | |||||||||||||||||||||
Total Repurchase Agreements | $ | (7,782 | ) | $ | 7,628 | $ | 7,631 | |||||||||||||||||||||||
Counterparty | Borrowing Rate (2) | Settlement Date | Maturity Date | Amount Borrowed (2) | Payable for Reverse Repurchase Agreements | |||||||||||||||
BNY | 6.171 | % | 04/20/2023 | 10/20/2023 | $ | (4,434 | ) | $ | (4,490 | ) | ||||||||||
BOS | 5.320 | 04/12/2023 | 07/11/2023 | (299 | ) | (303 | ) | |||||||||||||
| 6.160 | 06/13/2023 | 10/12/2023 | (1,457 | ) | (1,462 | ) | ||||||||||||||
| 6.310 | 06/13/2023 | 10/12/2023 | (1,560 | ) | (1,566 | ) | ||||||||||||||
BPS | 5.550 | 01/09/2023 | 07/10/2023 | (449 | ) | (461 | ) | |||||||||||||
| 5.740 | 03/14/2023 | 07/14/2023 | (977 | ) | (994 | ) | ||||||||||||||
| 5.790 | 03/02/2023 | 07/31/2023 | (2,031 | ) | (2,068 | ) | ||||||||||||||
| 5.790 | 03/30/2023 | 07/31/2023 | (212 | ) | (215 | ) | ||||||||||||||
| 6.160 | 05/10/2023 | 11/02/2023 | (207 | ) | (209 | ) | ||||||||||||||
| 6.310 | 04/13/2023 | 10/10/2023 | (2,214 | ) | (2,244 | ) | ||||||||||||||
| 6.310 | 05/10/2023 | 11/02/2023 | (289 | ) | (291 | ) | ||||||||||||||
| 6.310 | 06/15/2023 | 10/10/2023 | (5,565 | ) | (5,583 | ) | ||||||||||||||
| 6.410 | 05/10/2023 | 11/02/2023 | (613 | ) | (618 | ) | ||||||||||||||
| 6.610 | 04/13/2023 | 10/10/2023 | (1,322 | ) | (1,341 | ) | ||||||||||||||
BRC | 5.450 | 06/22/2023 | TBD | (3) | (598 | ) | (599 | ) | ||||||||||||
| 6.000 | 01/17/2023 | 07/19/2023 | (188 | ) | (193 | ) | ||||||||||||||
| 6.050 | 01/17/2023 | 07/19/2023 | (3,190 | ) | (3,279 | ) | ||||||||||||||
| 6.090 | 02/10/2023 | 08/10/2023 | (1,590 | ) | (1,628 | ) | ||||||||||||||
| 6.100 | 01/17/2023 | 07/19/2023 | (609 | ) | (626 | ) | ||||||||||||||
| 6.310 | 02/24/2023 | 08/24/2023 | (2,094 | ) | (2,141 | ) | ||||||||||||||
| 6.350 | 03/07/2023 | 09/07/2023 | (2,366 | ) | (2,415 | ) | ||||||||||||||
| 6.360 | 06/06/2023 | 10/04/2023 | (1,029 | ) | (1,034 | ) | ||||||||||||||
BYR | 5.780 | 04/13/2023 | 10/10/2023 | (794 | ) | (804 | ) | |||||||||||||
CIB | 5.390 | 01/17/2023 | 07/17/2023 | (18 | ) | (19 | ) | |||||||||||||
IND | 5.480 | 06/13/2023 | 07/07/2023 | (963 | ) | (966 | ) | |||||||||||||
| 5.720 | 06/09/2023 | 09/11/2023 | (1,444 | ) | (1,450 | ) | ||||||||||||||
| 5.970 | 06/09/2023 | 09/11/2023 | (1,345 | ) | (1,350 | ) | ||||||||||||||
| 6.020 | 06/09/2023 | 09/11/2023 | (1,210 | ) | (1,214 | ) | ||||||||||||||
JPS | 6.170 | 05/05/2023 | 11/01/2023 | (518 | ) | (523 | ) | |||||||||||||
| 6.220 | 05/05/2023 | 11/01/2023 | (409 | ) | (414 | ) | ||||||||||||||
MSB | 6.360 | 02/03/2023 | 07/31/2023 | (762 | ) | (781 | ) | |||||||||||||
MZF | 6.340 | 05/24/2023 | 11/22/2023 | (900 | ) | (907 | ) | |||||||||||||
| 6.490 | 06/21/2023 | 12/21/2023 | (4,245 | ) | (4,254 | ) | ||||||||||||||
RBC | 6.110 | 06/12/2023 | 10/12/2023 | (665 | ) | (668 | ) | |||||||||||||
RCY | 5.400 | 01/17/2023 | 07/17/2023 | (1,999 | ) | (2,049 | ) | |||||||||||||
RTA | 6.360 | 04/12/2023 | 07/12/2023 | (1,986 | ) | (2,013 | ) | |||||||||||||
SOG | 5.520 | 02/02/2023 | 08/02/2023 | (1,421 | ) | (1,453 | ) | |||||||||||||
| 6.210 | 03/07/2023 | 08/04/2023 | (540 | ) | (551 | ) | ||||||||||||||
TDM | 5.250 | 05/05/2023 | TBD | (3) | (654 | ) | (655 | ) | ||||||||||||
UBS | 5.750 | 04/19/2023 | 10/19/2023 | (134 | ) | (136 | ) | |||||||||||||
| 6.280 | 04/13/2023 | 10/10/2023 | (5,501 | ) | (5,579 | ) | ||||||||||||||
| 6.350 | 04/13/2023 | 10/10/2023 | (3,357 | ) | (3,405 | ) | ||||||||||||||
| 6.540 | 03/10/2023 | 09/11/2023 | (4,251 | ) | (4,340 | ) | ||||||||||||||
Total Reverse Repurchase Agreements | $ | (67,291 | ) | |||||||||||||||||
| See Accompanying Notes | ANNUAL REPORT | | | JUNE 30, 2023 | 35 |
Schedule of Investments | PCM Fund, Inc. | (Cont.) |
Counterparty | Repurchase Agreement Proceeds to be Received (1) | Payable for Reverse Repurchase Agreements | Payable for Sale-Buyback Transactions | Total Borrowings and Other Financing Transactions | Collateral Pledged/(Received) | Net Exposure (4) | ||||||||||||||||||
Global/Master Repurchase Agreement | ||||||||||||||||||||||||
BNY | $ | 0 | $ | (4,490 | ) | $ | 0 | $ | (4,490 | ) | $ | 5,945 | $ | 1,455 | ||||||||||
BOS | 0 | (3,331 | ) | 0 | (3,331 | ) | 4,391 | 1,060 | ||||||||||||||||
BPS | 0 | (14,024 | ) | 0 | (14,024 | ) | 18,718 | 4,694 | ||||||||||||||||
BRC | 0 | (11,915 | ) | 0 | (11,915 | ) | 15,537 | 3,622 | ||||||||||||||||
BYR | 0 | (804 | ) | 0 | (804 | ) | 968 | 164 | ||||||||||||||||
CIB | 0 | (19 | ) | 0 | (19 | ) | 13 | (6 | ) | |||||||||||||||
FICC | 328 | 0 | 0 | 328 | (335 | ) | (7 | ) | ||||||||||||||||
IND | 0 | (4,980 | ) | 0 | (4,980 | ) | 6,022 | 1,042 | ||||||||||||||||
JPS | 0 | (937 | ) | 0 | (937 | ) | 1,272 | 335 | ||||||||||||||||
MSB | 0 | (781 | ) | 0 | (781 | ) | 1,084 | 303 | ||||||||||||||||
MZF | 0 | (5,161 | ) | 0 | (5,161 | ) | 7,258 | 2,097 | ||||||||||||||||
RBC | 0 | (668 | ) | 0 | (668 | ) | 827 | 159 | ||||||||||||||||
RCY | 0 | (2,049 | ) | 0 | (2,049 | ) | 2,220 | 171 | ||||||||||||||||
RTA | 0 | (2,013 | ) | 0 | (2,013 | ) | 2,556 | 543 | ||||||||||||||||
SAL | 7,303 | 0 | 0 | 7,303 | (7,447 | ) | (144 | ) | ||||||||||||||||
SOG | 0 | (2,004 | ) | 0 | (2,004 | ) | 2,438 | 434 | ||||||||||||||||
TDM | 0 | (655 | ) | 0 | (655 | ) | 654 | (1 | ) | |||||||||||||||
UBS | 0 | (13,460 | ) | 0 | (13,460 | ) | 17,960 | 4,500 | ||||||||||||||||
Total Borrowings and Other Financing Transactions | $ | 7,631 | $ | (67,291 | ) | $ | 0 | |||||||||||||||||
Overnight and Continuous | Up to 30 days | 31-90 days | Greater Than 90 days | Total | ||||||||||||||||
Reverse Repurchase Agreements | ||||||||||||||||||||
Corporate Bonds & Notes | $ | 0 | $ | (2,724 | ) | $ | (4,806 | ) | $ | (2,194 | ) | $ | (9,724 | ) | ||||||
Convertible Bonds & Notes | 0 | 0 | (380 | ) | 0 | (380 | ) | |||||||||||||
U.S. Government Agencies | 0 | (2,067 | ) | 0 | (400 | ) | (2,467 | ) | ||||||||||||
Non-Agency Mortgage-Backed Securities | 0 | (5,365 | ) | (10,080 | ) | (7,758 | ) | (23,203 | ) | |||||||||||
Asset-Backed Securities | 0 | (747 | ) | (4,340 | ) | (26,430 | ) | (31,517 | ) | |||||||||||
Total Borrowings | $ | 0 | $ | (10,903 | ) | $ | (19,606 | ) | $ | (36,782 | ) | $ | (67,291 | ) | ||||||
Payable for reverse repurchase agreements | $ | (67,291 | ) | |||||||||||||||||
(k) | Securities with an aggregate market value of $87,320 and cash of $543 have been pledged as collateral under the terms of the above master agreements as of June 30, 2023. |
(1) | Includes accrued interest. |
(2) | The average amount of borrowings outstanding during the period ended June 30, 2023 was $(71,856) at a weighted average interest rate of 4.593%. Average borrowings may include reverse repurchase agreements and sale-buyback transactions, if held during the period. |
(3) | Open maturity reverse repurchase agreement. |
(4) | Net Exposure represents the net receivable/(payable) that would be due from/to the counterparty in the event of default. Exposure from borrowings and other financing transactions can only be netted across transactions governed under the same master agreement with the same legal entity. See Note 8, Master Netting Arrangements, in the Notes to Financial Statements for more information. |
Description | Expiration Month | # of Contracts | Notional Amount | Unrealized Appreciation/ (Depreciation) | Variation Margin | |||||||||||||||||||||||
Asset | Liability | |||||||||||||||||||||||||||
3-Month SOFR Active Contract December Futures | 03/2024 | 5 | $ | (1,183 | ) | $ | 33 | $ | 0 | $ | (1 | ) | ||||||||||||||||
3-Month SOFR Active Contract December Futures | 03/2025 | 1 | (240 | ) | 5 | 0 | 0 | |||||||||||||||||||||
3-Month SOFR Active Contract December Futures | 03/2026 | 1 | (241 | ) | 3 | 0 | 0 | |||||||||||||||||||||
3-Month SOFR Active Contract June Futures | 09/2024 | 2 | (476 | ) | 12 | 0 | 0 | |||||||||||||||||||||
3-Month SOFR Active Contract June Futures | 09/2025 | 2 | (482 | ) | 7 | 0 | 0 | |||||||||||||||||||||
36 | PIMCO CLOSED-END FUNDS | See Accompanying Notes |
| June 30, 2023 |
Description | Expiration Month | # of Contracts | Notional Amount | Unrealized Appreciation/ (Depreciation) | Variation Margin | |||||||||||||||||||||||
Asset | Liability | |||||||||||||||||||||||||||
3-Month SOFR Active Contract March Futures | 06/2024 | 4 | $ | (949 | ) | $ | 26 | $ | 0 | $ | 0 | |||||||||||||||||
3-Month SOFR Active Contract March Futures | 06/2025 | 2 | (481 | ) | 8 | 1 | 0 | |||||||||||||||||||||
3-Month SOFR Active Contract March Futures | 06/2026 | 1 | (241 | ) | 3 | 0 | 0 | |||||||||||||||||||||
3-Month SOFR Active Contract September Futures | 12/2024 | 2 | (478 | ) | 10 | 0 | 0 | |||||||||||||||||||||
3-Month SOFR Active Contract September Futures | 12/2025 | 1 | (241 | ) | 4 | 0 | 0 | |||||||||||||||||||||
Total Futures Contracts | $ | 111 | $ | 1 | $ | (1 | ) | |||||||||||||||||||||
Pay/Receive Floating Rate | Floating Rate Index | Fixed Rate | Payment Frequency | Maturity Date | Notional Amount | Premiums Paid/(Received) | Unrealized Appreciation/ (Depreciation) | Market Value | Variation Margin | |||||||||||||||||||||||||||
Asset | Liability | |||||||||||||||||||||||||||||||||||
Pay | 1-Day USD-SOFR Compounded-OIS | 0.000 | % | Quarterly | 07/07/2023 | $ | 1,300 | $ | 0 | $ | (17 | ) | $ | (17 | ) | $ | 0 | $ | (1 | ) | ||||||||||||||||
Pay | 1-Day USD-SOFR Compounded-OIS | 4.875 | Annual | 12/21/2023 | 38,500 | (54 | ) | (35 | ) | (89 | ) | 2 | 0 | |||||||||||||||||||||||
Receive (1) | 1-Day USD-SOFR Compounded-OIS | 2.450 | Annual | 12/20/2024 | 3,800 | 0 | 90 | 90 | 0 | (1 | ) | |||||||||||||||||||||||||
Receive (1) | 1-Day USD-SOFR Compounded-OIS | 2.350 | Annual | 01/17/2025 | 1,900 | 0 | 45 | 45 | 0 | (1 | ) | |||||||||||||||||||||||||
Receive (1) | 1-Day USD-SOFR Compounded-OIS | 2.300 | Annual | 01/17/2026 | 300 | 0 | 11 | 11 | 0 | 0 | ||||||||||||||||||||||||||
Pay (1) | 1-Day USD-SOFR Compounded-OIS | 1.250 | Semi-Annual | 12/15/2026 | 200 | (1 | ) | (18 | ) | (19 | ) | 0 | 0 | |||||||||||||||||||||||
Pay (1) | 1-Day USD-SOFR Compounded-OIS | 1.550 | Semi-Annual | 01/20/2027 | 1,900 | (4 | ) | (173 | ) | (177 | ) | 1 | 0 | |||||||||||||||||||||||
Pay (1) | 1-Day USD-SOFR Compounded-OIS | 0.500 | Semi-Annual | 06/16/2028 | 140 | (5 | ) | (16 | ) | (21 | ) | 0 | 0 | |||||||||||||||||||||||
Pay (1) | 1-Day USD-SOFR Compounded-OIS | 3.750 | Annual | 12/20/2028 | 4,900 | 45 | (30 | ) | 15 | 3 | 0 | |||||||||||||||||||||||||
Pay (1) | 1-Day USD-SOFR Compounded-OIS | 1.700 | Semi-Annual | 01/12/2029 | 2,000 | (6 | ) | (228 | ) | (234 | ) | 1 | 0 | |||||||||||||||||||||||
Pay (1) | 1-Day USD-SOFR Compounded-OIS | 3.000 | Semi-Annual | 06/19/2029 | 7,800 | 410 | (803 | ) | (393 | ) | 6 | 0 | ||||||||||||||||||||||||
Pay (1) | 1-Day USD-SOFR Compounded-OIS | 1.250 | Semi-Annual | 06/17/2030 | 3,450 | 111 | (646 | ) | (535 | ) | 4 | 0 | ||||||||||||||||||||||||
Pay | 1-Day USD-SOFR Compounded-OIS | 3.000 | Annual | 06/21/2030 | 6,900 | (134 | ) | (162 | ) | (296 | ) | 8 | 0 | |||||||||||||||||||||||
Receive (1) | 1-Day USD-SOFR Compounded-OIS | 1.370 | Semi-Annual | 07/19/2031 | 100 | 0 | 17 | 17 | 0 | 0 | ||||||||||||||||||||||||||
Receive (1) | 1-Day USD-SOFR Compounded-OIS | 1.360 | Semi-Annual | 07/20/2031 | 100 | 0 | 17 | 17 | 0 | 0 | ||||||||||||||||||||||||||
Receive (1) | 1-Day USD-SOFR Compounded-OIS | 3.000 | Semi-Annual | 12/19/2038 | 5,200 | 13 | 424 | 437 | 0 | (24 | ) | |||||||||||||||||||||||||
Receive (1) | 1-Day USD-SOFR Compounded-OIS | 2.000 | Semi-Annual | 01/15/2050 | 100 | (1 | ) | 27 | 26 | 0 | (1 | ) | ||||||||||||||||||||||||
Receive (1) | 1-Day USD-SOFR Compounded-OIS | 1.625 | Semi-Annual | 01/16/2050 | 400 | 0 | 131 | 131 | 0 | (2 | ) | |||||||||||||||||||||||||
Receive (1) | 1-Day USD-SOFR Compounded-OIS | 1.750 | Semi-Annual | 01/22/2050 | 700 | (4 | ) | 219 | 215 | 0 | (5 | ) | ||||||||||||||||||||||||
Receive (1) | 1-Day USD-SOFR Compounded-OIS | 1.625 | Semi-Annual | 02/03/2050 | 400 | (2 | ) | 133 | 131 | 0 | (3 | ) | ||||||||||||||||||||||||
Receive | 1-Day USD-SOFR Compounded-OIS | 1.450 | Semi-Annual | 04/07/2051 | 1,300 | (1 | ) | 491 | 490 | 0 | (9 | ) | ||||||||||||||||||||||||
Receive | 1-Day USD-SOFR Compounded-OIS | 1.750 | Annual | 06/15/2052 | 5,700 | 994 | 536 | 1,530 | 0 | (48 | ) | |||||||||||||||||||||||||
Receive | 1-Day USD-SOFR Compounded-OIS | 1.750 | Annual | 12/21/2052 | 2,800 | 674 | 119 | 793 | 0 | (24 | ) | |||||||||||||||||||||||||
Receive | 3-Month USD-LIBOR | 0.000 | Quarterly | 07/07/2023 | 1,300 | 0 | 17 | 17 | 1 | 0 | ||||||||||||||||||||||||||
Pay | 3-Month USD-LIBOR | 1.700 | Semi-Annual | 07/12/2023 | 2,000 | 0 | (10 | ) | (10 | ) | 0 | (1 | ) | |||||||||||||||||||||||
Receive | 3-Month USD-LIBOR | 2.000 | Semi-Annual | 07/15/2023 | 100 | 0 | 0 | 0 | 0 | 0 | ||||||||||||||||||||||||||
Receive | 3-Month USD-LIBOR | 1.625 | Semi-Annual | 07/16/2023 | 400 | 0 | 2 | 2 | 0 | 0 | ||||||||||||||||||||||||||
Receive | 3-Month USD-LIBOR | 1.370 | Semi-Annual | 07/19/2023 | 100 | 0 | 1 | 1 | 0 | 0 | ||||||||||||||||||||||||||
Receive | 3-Month USD-LIBOR | 1.360 | Semi-Annual | 07/20/2023 | 100 | 0 | 1 | 1 | 0 | 0 | ||||||||||||||||||||||||||
Pay | 3-Month USD-LIBOR | 1.550 | Semi-Annual | 07/20/2023 | 1,900 | 0 | (11 | ) | (11 | ) | 0 | (1 | ) | |||||||||||||||||||||||
Receive | 3-Month USD-LIBOR | 1.750 | Semi-Annual | 07/22/2023 | 700 | 0 | 3 | 3 | 0 | 0 | ||||||||||||||||||||||||||
Receive | 3-Month USD-LIBOR | 1.625 | Semi-Annual | 08/03/2023 | 400 | 0 | 2 | 2 | 0 | 0 | ||||||||||||||||||||||||||
Pay | 3-Month USD-LIBOR | 1.250 | Semi-Annual | 09/15/2023 | 200 | 0 | (2 | ) | (2 | ) | 0 | 0 | ||||||||||||||||||||||||
Pay | 3-Month USD-LIBOR | 0.500 | Semi-Annual | 09/16/2023 | 140 | 0 | (2 | ) | (2 | ) | 0 | 0 | ||||||||||||||||||||||||
Pay | 3-Month USD-LIBOR | 1.250 | Semi-Annual | 09/17/2023 | 3,450 | 0 | (38 | ) | (38 | ) | 0 | (1 | ) | |||||||||||||||||||||||
Pay | 3-Month USD-LIBOR | 3.000 | Semi-Annual | 09/19/2023 | 2,600 | 0 | (17 | ) | (17 | ) | 0 | (1 | ) | |||||||||||||||||||||||
Total Swap Agreements | $ | 2,035 | $ | 78 | $ | 2,113 | $ | 26 | $ | (123 | ) | |||||||||||||||||||||||||
Financial Derivative Assets | Financial Derivative Liabilities | |||||||||||||||||||||||||||||||||||
Market Value | Variation Margin Asset | Market Value | Variation Margin Liability | |||||||||||||||||||||||||||||||||
Purchased Options | Futures | Swap Agreements | Total | Written Options | Futures | Swap Agreements | Total | |||||||||||||||||||||||||||||
Total Exchange-Traded or Centrally Cleared | $ | 0 | $ | 1 | $ | 26 | $ | 27 | $ | 0 | $ | (1) | $ | (123) | $ | (124) | ||||||||||||||||||||
(1) | This instrument has a forward starting effective date. See Note 2, Securities Transactions and Investment Income, in the Notes to Financial Statements for further information. |
| See Accompanying Notes | ANNUAL REPORT | | | JUNE 30, 2023 | 37 |
Schedule of Investments | PCM Fund, Inc. | (Cont.) |
Counterparty | Index/Tranches | Fixed Receive Rate | Payment Frequency | Maturity Date | Notional Amount (2) | Premiums Paid/(Received) | Unrealized Appreciation/ (Depreciation) | Swap Agreements, at Value (3) | ||||||||||||||||||||||||
Asset | Liability | |||||||||||||||||||||||||||||||
| GST | ABX.HE.AA.6-1 Index « | 0.320 | % | Monthly | 07/25/2045 | $ | 1,689 | $ | (336 | ) | $ | 218 | $ | 0 | $ | (118 | ) | |||||||||||||||
ABX.HE.PENAAA.7-1 Index « | 0.090 | Monthly | 08/25/2037 | 474 | (209 | ) | 138 | 0 | (71 | ) | ||||||||||||||||||||||
Total Swap Agreements | $ | (545 | ) | $ | 356 | $ | 0 | $ | (189 | ) | ||||||||||||||||||||||
Financial Derivative Assets | Financial Derivative Liabilities | |||||||||||||||||||||||||||||||||||||||||||||||
Counterparty | Forward Foreign Currency Contracts | Purchased Options | Swap Agreements | Total Over the Counter | Forward Foreign Currency Contracts | Written Options | Swap Agreements | Total Over the Counter | Net Market Value of OTC Derivatives | Collateral Pledged/(Received) | Net Exposure (4) | |||||||||||||||||||||||||||||||||||||
GST | $ | 0 | $ | 0 | $ | 0 | $ | 0 | $ | 0 | $ | 0 | $ | (189 | ) | $ | (189 | ) | $ | (189 | ) | $ | 253 | $ | 64 | |||||||||||||||||||||||
(n) | Securities with an aggregate market value of $253 have been pledged as collateral for financial derivative instruments as governed by International Swaps and Derivatives Association, Inc. master agreements as of June 30, 2023. |
(1) | If the Fund is a seller of protection and a credit event occurs, as defined under the terms of that particular swap agreement, the Fund will either (i) pay to the buyer of protection an amount equal to the notional amount of the swap and take delivery of the referenced obligation or underlying securities comprising the referenced index or (ii) pay a net settlement amount in the form of cash, securities or other deliverable obligations equal to the notional amount of the swap less the recovery value of the referenced obligation or underlying securities comprising the referenced index. |
(2) | The maximum potential amount the Fund could be required to pay as a seller of credit protection or receive as a buyer of credit protection if a credit event occurs as defined under the terms of that particular swap agreement. |
(3) | The prices and resulting values for credit default swap agreements serve as indicators of the current status of the payment/performance risk and represent the likelihood of an expected liability (or profit) for the credit derivative should the notional amount of the swap agreement be closed/sold as of the period end. Increasing market values, in absolute terms when compared to the notional amount of the swap, represent a deterioration of the underlying referenced instrument’s credit soundness and a greater likelihood or risk of default or other credit event occurring as defined under the terms of the agreement. |
(4) | Net Exposure represents the net receivable/(payable) that would be due from/to the counterparty in the event of default. Exposure from OTC financial derivative instruments can only be netted across transactions governed under the same master agreement with the same legal entity. See Note 8, Master Netting Arrangements, in the Notes to Financial Statements for more information. |
Derivatives not accounted for as hedging instruments | ||||||||||||||||||||||||
Commodity Contracts | Credit Contracts | Equity Contracts | Foreign Exchange Contracts | Interest Rate Contracts | Total | |||||||||||||||||||
Financial Derivative Instruments - Assets | ||||||||||||||||||||||||
Exchange-traded or centrally cleared | ||||||||||||||||||||||||
Futures | $ | 0 | $ | 0 | $ | 0 | $ | 0 | $ | 1 | $ | 1 | ||||||||||||
Swap Agreements | 0 | 0 | 0 | 0 | 26 | 26 | ||||||||||||||||||
| $ | 0 | $ | 0 | $ | 0 | $ | 0 | $ | 27 | $ | 27 | |||||||||||||
Financial Derivative Instruments - Liabilities | ||||||||||||||||||||||||
Exchange-traded or centrally cleared | ||||||||||||||||||||||||
Futures | $ | 0 | $ | 0 | $ | 0 | $ | 0 | $ | 1 | $ | 1 | ||||||||||||
Swap Agreements | 0 | 0 | 0 | 0 | 123 | 123 | ||||||||||||||||||
| $ | 0 | $ | 0 | $ | 0 | $ | 0 | $ | 124 | $ | 124 | |||||||||||||
Over the counter | ||||||||||||||||||||||||
Swap Agreements | $ | 0 | $ | 189 | $ | 0 | $ | 0 | $ | 0 | $ | 189 | ||||||||||||
| $ | 0 | $ | 189 | $ | 0 | $ | 0 | $ | 124 | $ | 313 | |||||||||||||
38 | PIMCO CLOSED-END FUNDS | See Accompanying Notes |
| June 30, 2023 |
Derivatives not accounted for as hedging instruments | ||||||||||||||||||||||||
Commodity Contracts | Credit Contracts | Equity Contracts | Foreign Exchange Contracts | Interest Rate Contracts | Total | |||||||||||||||||||
Net Realized Gain (Loss) on Financial Derivative Instruments | ||||||||||||||||||||||||
Exchange-traded or centrally cleared | ||||||||||||||||||||||||
Swap Agreements | $ | 0 | $ | 13 | $ | 0 | $ | 0 | $ | (4,153 | ) | $ | (4,140 | ) | ||||||||||
Over the counter | ||||||||||||||||||||||||
Swap Agreements | $ | 0 | $ | 27 | $ | 0 | $ | 0 | $ | 0 | $ | 27 | ||||||||||||
| $ | 0 | $ | 40 | $ | 0 | $ | 0 | $ | (4,153 | ) | $ | (4,113 | ) | |||||||||||
Net Change in Unrealized Appreciation (Depreciation) on Financial Derivative Instruments | ||||||||||||||||||||||||
Exchange-traded or centrally cleared | ||||||||||||||||||||||||
Futures | $ | 0 | $ | 0 | $ | 0 | $ | 0 | $ | 111 | $ | 111 | ||||||||||||
Swap Agreements | 0 | 62 | 0 | 0 | 3,013 | 3,075 | ||||||||||||||||||
| $ | 0 | $ | 62 | $ | 0 | $ | 0 | $ | 3,124 | $ | 3,186 | |||||||||||||
Over the counter | ||||||||||||||||||||||||
Swap Agreements | $ | 0 | $ | (75 | ) | $ | 0 | $ | 0 | $ | 0 | $ | (75 | ) | ||||||||||
| $ | 0 | $ | (13 | ) | $ | 0 | $ | 0 | $ | 3,124 | $ | 3,111 | ||||||||||||
Category and Subcategory | Level 1 | Level 2 | Level 3 | Fair Value at 06/30/2023 | ||||||||||||
Investments in Securities, at Value | ||||||||||||||||
Loan Participations and Assignments | $ | 0 | $ | 14,344 | $ | 6,420 | $ | 20,764 | ||||||||
Corporate Bonds & Notes | ||||||||||||||||
Banking & Finance | 0 | 5,682 | 0 | 5,682 | ||||||||||||
Industrials | 0 | 12,080 | 0 | 12,080 | ||||||||||||
Utilities | 0 | 350 | 0 | 350 | ||||||||||||
Convertible Bonds & Notes | ||||||||||||||||
Industrials | 0 | 475 | 0 | 475 | ||||||||||||
Municipal Bonds & Notes | ||||||||||||||||
Puerto Rico | 0 | 1,282 | 0 | 1,282 | ||||||||||||
U.S. Government Agencies | 0 | 3,650 | 0 | 3,650 | ||||||||||||
Non-Agency Mortgage-Backed Securities | 0 | 37,421 | 1,320 | 38,741 | ||||||||||||
Asset-Backed Securities | 0 | 47,278 | 3,874 | 51,152 | ||||||||||||
Common Stocks | ||||||||||||||||
Communication Services | 242 | 0 | 65 | 307 | ||||||||||||
Energy | 0 | 0 | 100 | 100 | ||||||||||||
Industrials | 0 | 1 | 2,504 | 2,505 | ||||||||||||
Utilities | 0 | 0 | 278 | 278 | ||||||||||||
Warrants | ||||||||||||||||
Information Technology | 0 | 0 | 666 | 666 | ||||||||||||
Preferred Securities | ||||||||||||||||
Financials | 0 | 1 | 0 | 1 | ||||||||||||
Industrials | 0 | 0 | 444 | 444 | ||||||||||||
Category and Subcategory | Level 1 | Level 2 | Level 3 | Fair Value at 06/30/2023 | ||||||||||||
Real Estate Investment Trusts | ||||||||||||||||
Real Estate | $ | 682 | $ | 0 | $ | 0 | $ | 682 | ||||||||
Short-Term Instruments | ||||||||||||||||
Repurchase Agreements | 0 | 7,628 | 0 | 7,628 | ||||||||||||
U.S. Treasury Bills | 0 | 253 | 0 | 253 | ||||||||||||
Total Investments | $ | 924 | $ | 130,445 | $ | 15,671 | $ | 147,040 | ||||||||
Financial Derivative Instruments - Assets | ||||||||||||||||
Exchange-traded or centrally cleared | $ | 0 | $ | 27 | $ | 0 | $ | 27 | ||||||||
Financial Derivative Instruments - Liabilities | ||||||||||||||||
Exchange-traded or centrally cleared | 0 | (124 | ) | 0 | (124 | ) | ||||||||||
Over the counter | 0 | 0 | (189 | ) | (189 | ) | ||||||||||
| $ | 0 | $ | (124 | ) | $ | (189 | ) | $ | (313 | ) | ||||||
Total Financial Derivative Instruments | $ | 0 | $ | (97 | ) | $ | (189 | ) | $ | (286 | ) | |||||
Totals | $ | 924 | $ | 130,348 | $ | 15,482 | $ | 146,754 | ||||||||
Category and Subcategory | Beginning Balance at 06/30/2022 | Net Purchases (1) | Net Sales/ Settlements (1) | Accrued Discounts/ (Premiums) | Realized Gain/(Loss) | Net Change in Unrealized Appreciation/ (Depreciation) (2) | Transfers into Level 3 | Transfers out of Level 3 | Ending Balance at 06/30/2023 | Net Change in Unrealized Appreciation/ (Depreciation) on Investments Held at 06/30/2023 (2) | ||||||||||||||||||||||||||||||
Investments in Securities, at Value | ||||||||||||||||||||||||||||||||||||||||
Loan Participations and Assignments | $ | 8,086 | $ | 1,911 | $ | (2,038 | ) | $ | (112 | ) | $ | (3 | ) | $ | (716 | ) | $ | 0 | $ | (708 | ) | $ | 6,420 | $ | (389 | ) | ||||||||||||||
Corporate Bonds & Notes | ||||||||||||||||||||||||||||||||||||||||
Industrials | 3,908 | 63 | 0 | 0 | 0 | (167 | ) | 0 | (3,804 | ) | 0 | 0 | ||||||||||||||||||||||||||||
Non-Agency Mortgage-Backed Securities | 0 | 0 | 0 | 0 | 0 | 0 | 1,320 | 0 | 1,320 | 0 | ||||||||||||||||||||||||||||||
Asset-Backed Securities | 6,695 | 0 | (10 | ) | 18 | (672 | ) | (2,701 | ) | 544 | 0 | 3,874 | (3,276 | ) | ||||||||||||||||||||||||||
| See Accompanying Notes | ANNUAL REPORT | | | JUNE 30, 2023 | 39 |
Schedule of Investments | PCM Fund, Inc. | (Cont.) | June 30, 2023 |
Category and Subcategory | Beginning Balance at 06/30/2022 | Net Purchases (1) | Net Sales/ Settlements (1) | Accrued Discounts/ (Premiums) | Realized Gain/(Loss) | Net Change in Unrealized Appreciation/ (Depreciation) (2) | Transfers into Level 3 | Transfers out of Level 3 | Ending Balance at 06/30/2023 | Net Change in Unrealized Appreciation/ (Depreciation) on Investments Held at 06/30/2023 (2) | ||||||||||||||||||||||||||||||
Common Stocks | ||||||||||||||||||||||||||||||||||||||||
Communication Services | $ | 142 | $ | 0 | $ | 0 | $ | 0 | $ | 0 | $ | (77 | ) | $ | 0 | $ | 0 | $ | 65 | $ | (76 | ) | ||||||||||||||||||
Energy | 49 | 0 | 0 | 0 | 0 | 51 | 0 | 0 | 100 | 51 | ||||||||||||||||||||||||||||||
Industrials | 2,588 | 102 | 0 | 0 | (2 | ) | (183 | ) | 0 | (1 | ) | 2,504 | (181 | ) | ||||||||||||||||||||||||||
Materials | 68 | 0 | (75 | ) | 0 | 75 | (68 | ) | 0 | 0 | 0 | 0 | ||||||||||||||||||||||||||||
Utilities | 248 | 0 | 0 | 0 | 0 | 30 | 0 | 0 | 278 | 30 | ||||||||||||||||||||||||||||||
Warrants | ||||||||||||||||||||||||||||||||||||||||
Industrials | 71 | 0 | (14 | ) | 0 | 14 | (71 | ) | 0 | 0 | 0 | 0 | ||||||||||||||||||||||||||||
Information Technology | 928 | 0 | 0 | 0 | 0 | (262 | ) | 0 | 0 | 666 | (262 | ) | ||||||||||||||||||||||||||||
Preferred Securities | ||||||||||||||||||||||||||||||||||||||||
Industrials | 4,854 | 0 | (5,112 | ) | 0 | 2,927 | (2,225 | ) | 0 | 0 | 444 | (113 | ) | |||||||||||||||||||||||||||
| $ | 27,637 | $ | 2,076 | $ | (7,249 | ) | $ | (94 | ) | $ | 2,339 | $ | (6,389 | ) | $ | 1,864 | $ | (4,513 | ) | $ | 15,671 | $ | (4,216 | ) | ||||||||||||||||
Financial Derivative Instruments- Liabilities | ||||||||||||||||||||||||||||||||||||||||
Over the counter | $ | 0 | $ | (91 | ) | $ | 0 | $ | 0 | $ | 0 | $ | 91 | $ | (189 | ) | $ | 0 | $ | (189 | ) | $ | 91 | |||||||||||||||||
Totals | $ | 27,637 | $ | 1,985 | $ | (7,249 | ) | $ | (94 | ) | $ | 2,339 | $ | (6,298 | ) | $ | 1,675 | $ | (4,513 | ) | $ | 15,482 | $ | (4,125 | ) | |||||||||||||||
Category and Subcategory | Ending Balance at 06/30/2023 | Valuation Technique | Unobservable Inputs | (% Unless Noted Otherwise) | ||||||||||||||
Input Value(s) | Weighted Average | |||||||||||||||||
Investments in Securities, at Value | ||||||||||||||||||
Loan Participations and Assignments | $ | 2,216 | Comparable Multiple | EBITDA Multiple | X | 11.000 | — | |||||||||||
| 45 | Comparable Multiple | Revenue Multiple | X | 0.675 | — | |||||||||||||
| 1,795 | Discounted Cash Flow | Discounted Rate | 9.000-10.530 | 9.939 | ||||||||||||||
| 928 | Discounted Cash Flow | Discounted Spread | 8.250 | — | ||||||||||||||
| 84 | Discounted Cash Flow | Discounted Cash Flow | 15.420 | — | ||||||||||||||
| 71 | Proxy Pricing | Base Price | 100.000 | — | ||||||||||||||
| 1,025 | Recent Transaction | Purchase Price | 100.000 | — | ||||||||||||||
| 256 | Third Party Vendor | Broker Quote | 90.750 | — | ||||||||||||||
Non-Agency Mortgage-Backed Securities | 74 | Discounted Cash Flow | Discount Rate | 11.000 | — | |||||||||||||
| 1,246 | Fair Valuation of Odd Lot Positions | Adjustment Factor | 2.500 | — | ||||||||||||||
Asset-Backed Securities | 3,330 | Discounted Cash Flow | Discount Rate | 10.000-22.000 | 17.479 | |||||||||||||
| 544 | Fair Valuation of Odd Lot Positions | Adjustment Factor | 2.500 | — | ||||||||||||||
Common Stocks | ||||||||||||||||||
Communication Services | 65 | Adjusted Market Price | Adjustment Factor | 10.000 | — | |||||||||||||
Energy | 100 | Comparable Multiple | LTM EBITDA Multiple | X | 3.300 | — | ||||||||||||
Industrials | 2,004 | Comparable Multiple/Discounted Cash Flow | LTM Revenue Forward EBITDA/Discount Rate | X/X/% | 0.550/6.010/9.750 | — | ||||||||||||
| 324 | Discounted Cash Flow | Discount Rate | 14.975 | — | ||||||||||||||
| 115 | Indicative Market Quotation | Broker Quote | $ | 19.500 | — | |||||||||||||
| 61 | Recent Transaction | Purchase Price | $ | 6.625 | — | |||||||||||||
Utilities | 278 | Indicative Market Quotation | Broker Quote | $ | 28.000 | — | ||||||||||||
Warrants | ||||||||||||||||||
Information Technology | 666 | Comparable Multiple | EBITDA Multiple | X | 4.590 | — | ||||||||||||
Preferred Securities | ||||||||||||||||||
Industrials | 444 | Comparable Multiple/Discounted Cash Flow | Book Value Multiple/Discount Rate | X/% | 0.350/27.749 | — | ||||||||||||
Financial Derivative Instruments- Liabilities | ||||||||||||||||||
Over the counter | (189 | ) | Other Valuation Techniques (3) | — | — | — | ||||||||||||
Total | $ | 15,482 | ||||||||||||||||
(1) | Net Purchases and Settlements for Financial Derivative Instruments may include payments made or received upon entering into swap agreements to compensate for differences between the stated terms of the swap agreement and prevailing market conditions. |
(2) | Any difference between Net Change in Unrealized Appreciation/(Depreciation) and Net Change in Unrealized Appreciation/(Depreciation) on Investments Held at June 30, 2023 may be due to an investment no longer held or categorized as Level 3 at period end. |
(3) | Includes valuation techniques not defined in the Notes to Financial Statements as securities valued using such techniques are not considered significant to the Fund. |
40 | PIMCO CLOSED-END FUNDS | See Accompanying Notes |
Schedule of Investments | PIMCO Global StocksPLUS ® | June 30, 2023 |
PRINCIPAL AMOUNT (000S) | MARKET VALUE (000S) | |||||||||||
INVESTMENTS IN SECURITIES 169.7% | ||||||||||||
LOAN PARTICIPATIONS AND ASSIGNMENTS 25.3% | ||||||||||||
AmSurg LLC | ||||||||||||
0.500% - 11.000% (PRIME + 2.750%) due 07/20/2026 «~ | $ | 197 | $ | 197 | ||||||||
Carnival Corp. | ||||||||||||
8.217% due 06/30/2025 | 393 | 393 | ||||||||||
Diamond Sports Group LLC | ||||||||||||
13.064% due 05/25/2026 | 1,293 | 1,001 | ||||||||||
Envision Healthcare Corp. | ||||||||||||
16.070% due 04/29/2027 | 1,535 | 1,831 | ||||||||||
16.695% due 04/28/2028 « | 2,581 | 1,952 | ||||||||||
Forbes Energy Services LLC | ||||||||||||
TBD% due 12/31/2023 « | 80 | 0 | ||||||||||
Gateway Casinos & Entertainment Ltd. | ||||||||||||
13.050% due 10/18/2027 | CAD | 240 | 182 | |||||||||
13.221% due 10/15/2027 | $ | 1,105 | 1,106 | |||||||||
Incora | ||||||||||||
TBD% - 13.725% due 03/01/2024 «µ | 1,086 | 1,086 | ||||||||||
Intelsat Jackson Holdings SA | ||||||||||||
9.443% due 02/01/2029 | 625 | 623 | ||||||||||
Lealand Finance Co. BV | ||||||||||||
8.217% due 06/28/2024 | 7 | 6 | ||||||||||
Lealand Finance Co. BV (6.193% Cash and 3.000% PIK) | ||||||||||||
9.193% (LIBOR01M + 1.000%) due 06/30/2025 ~(b) | 66 | 39 | ||||||||||
Market Bidco Ltd. | ||||||||||||
8.991% due 11/04/2027 | GBP | 1,039 | 1,159 | |||||||||
Oi SA | ||||||||||||
TBD% - 14.000% due 09/07/2024 µ | $ | 438 | 438 | |||||||||
Poseidon Bidco SASU | ||||||||||||
8.848% (EUR003M + 5.250%) due 07/14/2028 «~ | EUR | 1,000 | 1,069 | |||||||||
Promotora de Informaciones SA | ||||||||||||
8.189% (EUR003M + 5.000%) due 06/30/2026 «~ | 1,800 | 1,977 | ||||||||||
PUG LLC | ||||||||||||
8.717% (LIBOR01M + 3.500%) due 02/12/2027 ~ | $ | 6 | 5 | |||||||||
Redstone Holdco 2 LP | ||||||||||||
10.005% (LIBOR03M + 4.750%) due 04/27/2028 ~ | 1,227 | 1,027 | ||||||||||
Softbank Vision Fund | ||||||||||||
5.000% due 12/21/2025 « | 834 | 781 | ||||||||||
Steenbok Lux Finco 2 SARL | ||||||||||||
10.000% due 06/30/2026 « | EUR | 2,537 | 1,661 | |||||||||
Syniverse Holdings, Inc. | ||||||||||||
12.242% due 05/13/2027 | $ | 2,082 | 1,914 | |||||||||
Team Health Holdings, Inc. | ||||||||||||
7.943% (LIBOR01M + 2.750%) due 02/06/2024 ~ | 1,077 | 958 | ||||||||||
U.S. Renal Care, Inc. | ||||||||||||
10.193% (LIBOR01M + 5.000%) due 06/26/2026 ~ | 1,087 | 510 | ||||||||||
10.193% (LIBOR01M + 5.500%) due 06/26/2026 ~ | 797 | 374 | ||||||||||
Westmoreland Mining Holdings LLC | ||||||||||||
8.000% due 03/15/2029 | 529 | 390 | ||||||||||
Windstream Services LLC | ||||||||||||
11.452% due 09/21/2027 | 233 | 218 | ||||||||||
Total Loan Participations and Assignments (Cost $22,857) | 20,897 | |||||||||||
CORPORATE BONDS & NOTES 35.7% | ||||||||||||
BANKING & FINANCE 12.2% | ||||||||||||
ADLER Real Estate AG | ||||||||||||
3.000% due 04/27/2026 | EUR | 1,300 | 1,104 | |||||||||
Agps Bondco PLC | ||||||||||||
4.625% due 01/14/2026 ^(c) | 800 | 341 | ||||||||||
5.000% due 04/27/2027 ^(c) | 100 | 39 | ||||||||||
PRINCIPAL AMOUNT (000S) | MARKET VALUE (000S) | |||||||||||
Ambac Assurance Corp. | ||||||||||||
5.100% due 12/31/2099 (g) | $ | 13 | $ | 18 | ||||||||
Banca Monte dei Paschi di Siena SpA | ||||||||||||
1.875% due 01/09/2026 | EUR | 300 | 292 | |||||||||
2.625% due 04/28/2025 | 739 | 757 | ||||||||||
7.677% due 01/18/2028 • | 100 | 92 | ||||||||||
8.000% due 01/22/2030 • | 390 | 383 | ||||||||||
8.500% due 09/10/2030 • | 200 | 197 | ||||||||||
10.500% due 07/23/2029 | 634 | 688 | ||||||||||
Banco de Credito del Peru SA | ||||||||||||
4.650% due 09/17/2024 | PEN | 100 | 26 | |||||||||
CBRE Services, Inc. | ||||||||||||
5.950% due 08/15/2034 | $ | 1,200 | 1,186 | |||||||||
Corestate Capital Holding SA | ||||||||||||
3.500% due 07/31/2023 ^(c) | EUR | 600 | 92 | |||||||||
Credit Suisse AG AT1 Claim ^ | $ | 200 | 8 | |||||||||
FORESEA Holding SA | ||||||||||||
7.500% due 06/15/2030 « | 239 | 213 | ||||||||||
Hestia Re Ltd. | ||||||||||||
14.768% (T-BILL 1MO + 9.500%) due 04/22/2025 ~ | 250 | 216 | ||||||||||
Sanders Re Ltd. | ||||||||||||
17.018% (T-BILL 3MO + 11.750%) due 04/09/2029 ~ | 250 | 235 | ||||||||||
SVB Financial Group | ||||||||||||
1.800% due 02/02/2031 ^(c) | 280 | 178 | ||||||||||
4.345% due 04/29/2028 ^(c) | 100 | 70 | ||||||||||
4.570% due 04/29/2033 ^(c) | 200 | 134 | ||||||||||
UBS Group AG | ||||||||||||
7.750% due 03/01/2029 • | EUR | 400 | 484 | |||||||||
Uniti Group LP | ||||||||||||
6.000% due 01/15/2030 (j) | $ | 1,127 | 765 | |||||||||
10.500% due 02/15/2028 | 440 | 437 | ||||||||||
Voyager Aviation Holdings LLC | ||||||||||||
8.500% due 05/09/2026 | 2,706 | 2,138 | ||||||||||
| 10,093 | ||||||||||||
INDUSTRIALS 20.5% | ||||||||||||
Altice Financing SA | ||||||||||||
5.750% due 08/15/2029 (j) | 900 | 698 | ||||||||||
Carvana Co. | ||||||||||||
10.250% due 05/01/2030 | 400 | 316 | ||||||||||
CGG SA | ||||||||||||
7.750% due 04/01/2027 | EUR | 132 | 121 | |||||||||
8.750% due 04/01/2027 (j) | $ | 1,887 | 1,582 | |||||||||
DISH DBS Corp. | ||||||||||||
5.250% due 12/01/2026 (j) | 1,800 | 1,447 | ||||||||||
DTEK Energy BV (3.500% Cash and 3.500% PIK) | ||||||||||||
7.000% due 12/31/2027 (b) | 1 | 1 | ||||||||||
Exela Intermediate LLC | ||||||||||||
11.500% due 07/15/2026 | 17 | 2 | ||||||||||
HCA, Inc. | ||||||||||||
7.500% due 11/15/2095 | 300 | 338 | ||||||||||
Intelsat Jackson Holdings SA | ||||||||||||
6.500% due 03/15/2030 (j) | 2,525 | 2,305 | ||||||||||
Market Bidco Finco PLC | ||||||||||||
4.750% due 11/04/2027 | EUR | 100 | 88 | |||||||||
Nissan Motor Co. Ltd. | ||||||||||||
4.810% due 09/17/2030 (j) | $ | 1,200 | 1,054 | |||||||||
Odebrecht Oil & Gas Finance Ltd. | ||||||||||||
0.000% due 07/31/2023 (f)(g) | 322 | 1 | ||||||||||
Topaz Solar Farms LLC | ||||||||||||
4.875% due 09/30/2039 (j) | 149 | 137 | ||||||||||
5.750% due 09/30/2039 (j) | 1,648 | 1,618 | ||||||||||
U.S. Renal Care, Inc. | ||||||||||||
10.625% due 07/15/2027 | 2,161 | 551 | ||||||||||
Valaris Ltd. | ||||||||||||
8.375% due 04/30/2030 | 2 | 2 | ||||||||||
Vale SA | ||||||||||||
3.202% due 12/29/2049 ~(g) | BRL | 20,000 | 1,284 | |||||||||
Viking Cruises Ltd. | ||||||||||||
13.000% due 05/15/2025 (j) | $ | 1,301 | 1,367 | |||||||||
PRINCIPAL AMOUNT (000S) | MARKET VALUE (000S) | |||||||||||
Wesco Aircraft Holdings, Inc. (7.500% Cash and 3.000% PIK) | ||||||||||||
10.500% due 11/15/2026 ^(b)(c) | $ | 4,431 | $ | 4,032 | ||||||||
| 16,944 | ||||||||||||
UTILITIES 3.0% | ||||||||||||
Adler Financing SARL | ||||||||||||
12.500% due 06/30/2025 | EUR | 107 | 120 | |||||||||
Oi SA | ||||||||||||
10.000% due 07/27/2025 ^(c) | $ | 6,513 | 471 | |||||||||
Pacific Gas & Electric Co. | ||||||||||||
4.300% due 03/15/2045 (j) | 827 | 591 | ||||||||||
4.450% due 04/15/2042 (j) | 34 | 26 | ||||||||||
Peru LNG SRL | ||||||||||||
5.375% due 03/22/2030 | 1,000 | 806 | ||||||||||
Rio Oil Finance Trust | ||||||||||||
9.250% due 07/06/2024 (j) | 325 | 328 | ||||||||||
9.250% due 07/06/2024 | 102 | 103 | ||||||||||
| 2,445 | ||||||||||||
Total Corporate Bonds & Notes (Cost $34,975) | 29,482 | |||||||||||
CONVERTIBLE BONDS & NOTES 0.4% | ||||||||||||
BANKING & FINANCE 0.0% | ||||||||||||
Corestate Capital Holding SA | ||||||||||||
1.375% due 07/31/2023 ^(c) | EUR | 100 | 16 | |||||||||
INDUSTRIALS 0.4% | ||||||||||||
DISH Network Corp. | ||||||||||||
3.375% due 08/15/2026 (j) | $ | 600 | 307 | |||||||||
Total Convertible Bonds & Notes (Cost $715) | 323 | |||||||||||
MUNICIPAL BONDS & NOTES 1.4% | ||||||||||||
PUERTO RICO 0.4% | ||||||||||||
Commonwealth of Puerto Rico Bonds, Series 2022 | ||||||||||||
0.000% due 11/01/2043 | 421 | 212 | ||||||||||
0.000% due 11/01/2051 | 192 | 81 | ||||||||||
| 293 | ||||||||||||
WEST VIRGINIA 1.0% | ||||||||||||
Tobacco Settlement Finance Authority, West Virginia Revenue Bonds, Series 2007 | ||||||||||||
0.000% due 06/01/2047 (f) | 8,800 | 832 | ||||||||||
Total Municipal Bonds & Notes (Cost $1,274) | 1,125 | |||||||||||
U.S. GOVERNMENT AGENCIES 50.2% | ||||||||||||
Fannie Mae | ||||||||||||
0.000% due 06/25/2044 • | 224 | 138 | ||||||||||
0.850% due 11/25/2049 •(a) | 109 | 14 | ||||||||||
0.900% due 03/25/2037 •(a) | 112 | 8 | ||||||||||
1.000% due 11/25/2039 •(a) | 111 | 8 | ||||||||||
1.150% due 01/25/2038 •(a) | 174 | 12 | ||||||||||
1.230% due 03/25/2037 •(a) | 134 | 9 | ||||||||||
1.250% due 12/25/2037 •(a) | 170 | 10 | ||||||||||
1.260% due 06/25/2037 •(a) | 65 | 3 | ||||||||||
1.300% due 04/25/2037 •(a) | 350 | 28 | ||||||||||
1.450% due 11/25/2035 •(a) | 26 | 0 | ||||||||||
1.650% due 11/25/2036 •(a) | 632 | 60 | ||||||||||
2.050% due 02/25/2037 •(a) | 115 | 12 | ||||||||||
3.000% due 04/25/2050 (a) | 11,709 | 1,668 | ||||||||||
7.000% due 12/25/2023 | 2 | 2 | ||||||||||
7.910% due 12/25/2042 ~ | 30 | 30 | ||||||||||
10.900% due 07/25/2029 •(j) | 220 | 247 | ||||||||||
Fannie Mae, TBA | ||||||||||||
5.500% due 09/01/2053 | 5,900 | 5,871 | ||||||||||
6.000% due 08/01/2053 | 3,300 | 3,329 | ||||||||||
6.500% due 08/01/2053 | 400 | 408 | ||||||||||
Freddie Mac | ||||||||||||
0.700% due 11/25/2055 ~(a) | 5,455 | 361 | ||||||||||
1.000% due 05/25/2050 •(a) | 1,102 | 123 | ||||||||||
| See Accompanying Notes | ANNUAL REPORT | | | JUNE 30, 2023 | 41 |
Schedule of Investments | PIMCO Global StocksPLUS ® | (Cont.) |
PRINCIPAL AMOUNT (000S) | MARKET VALUE (000S) | |||||||||||
1.247% due 03/15/2037 •(a) | $ | 291 | $ | 22 | ||||||||
1.377% due 09/15/2036 •(a) | 162 | 12 | ||||||||||
1.387% due 09/15/2036 •(a) | 333 | 27 | ||||||||||
10.300% due 10/25/2029 •(j) | 250 | 273 | ||||||||||
Ginnie Mae | ||||||||||||
0.943% due 12/20/2048 •(a) | 879 | 71 | ||||||||||
Ginnie Mae, TBA | ||||||||||||
3.500% due 08/01/2053 | 3,300 | 3,050 | ||||||||||
4.500% due 08/01/2053 | 1,600 | 1,545 | ||||||||||
Uniform Mortgage-Backed Security | ||||||||||||
3.500% due 03/01/2048 - 04/01/2048 | 370 | 342 | ||||||||||
Uniform Mortgage-Backed Security, TBA | ||||||||||||
2.500% due 08/01/2053 | 150 | 127 | ||||||||||
3.000% due 08/01/2053 | 1,650 | 1,455 | ||||||||||
3.500% due 08/01/2053 | 20,800 | 18,976 | ||||||||||
4.000% due 08/01/2053 | 1,650 | 1,550 | ||||||||||
4.500% due 08/01/2053 | 1,800 | 1,732 | ||||||||||
Total U.S. Government Agencies (Cost $42,079) | 41,523 | |||||||||||
NON-AGENCY MORTGAGE-BACKED SECURITIES 17.4% | ||||||||||||
Banc of America Funding Trust | ||||||||||||
2.372% due 03/20/2036 «~ | 74 | 64 | ||||||||||
3.111% due 12/20/2034 ~ | 187 | 135 | ||||||||||
5.846% due 01/25/2037 ^«~ | 94 | 81 | ||||||||||
Banc of America Mortgage Trust | ||||||||||||
6.000% due 07/25/2046 ^« | 1 | 1 | ||||||||||
Bear Stearns Adjustable Rate Mortgage Trust | ||||||||||||
4.222% due 07/25/2036 ^~ | 80 | 71 | ||||||||||
Bear Stearns ALT-A Trust | ||||||||||||
3.142% due 04/25/2035 «~ | 77 | 59 | ||||||||||
3.990% due 11/25/2035 ^~ | 56 | 44 | ||||||||||
4.202% due 09/25/2035 ^~ | 65 | 40 | ||||||||||
Bear Stearns Asset-Backed Securities Trust | ||||||||||||
6.570% due 03/25/2036 ^•(j) | 1,632 | 592 | ||||||||||
Bear Stearns Commercial Mortgage Securities Trust | ||||||||||||
5.046% due 02/11/2041 ~ | 134 | 134 | ||||||||||
Bear Stearns Structured Products, Inc. Trust | ||||||||||||
3.484% due 12/26/2046 ^~ | 152 | 115 | ||||||||||
4.098% due 01/26/2036 ^~ | 250 | 200 | ||||||||||
CBA Commercial Small Balance Commercial Mortgage | ||||||||||||
6.040% due 01/25/2039 ^þ | 109 | 101 | ||||||||||
CD Mortgage Trust | ||||||||||||
5.688% due 10/15/2048 | 64 | 57 | ||||||||||
Chevy Chase Funding LLC Mortgage-Backed Certificates | ||||||||||||
5.450% due 08/25/2035 «• | 30 | 27 | ||||||||||
5.830% due 10/25/2034 «• | 2 | 2 | ||||||||||
Citigroup Commercial Mortgage Trust | ||||||||||||
5.617% due 12/10/2049 ~(j) | 466 | 314 | ||||||||||
Citigroup Mortgage Loan Trust | ||||||||||||
4.343% due 11/25/2035 ~(j) | 1,049 | 600 | ||||||||||
4.524% due 03/25/2037 ^«~ | 52 | 50 | ||||||||||
Commercial Mortgage Loan Trust | ||||||||||||
6.809% due 12/10/2049 ~ | 266 | 64 | ||||||||||
Connecticut Avenue Securities Trust | ||||||||||||
8.167% due 10/25/2041 •(j) | 900 | 889 | ||||||||||
Countrywide Alternative Loan Trust | ||||||||||||
2.000% due 07/25/2036 •(a) | 752 | 114 | ||||||||||
3.167% due 10/25/2035 ^«~ | 75 | 61 | ||||||||||
3.940% due 02/25/2037 ^~ | 63 | 54 | ||||||||||
5.500% due 08/25/2034 « | 178 | 164 | ||||||||||
5.500% due 02/25/2036 ^« | 12 | 7 | ||||||||||
5.500% due 05/25/2036 ^•(j) | 1,184 | 344 | ||||||||||
5.630% due 12/25/2046 ^• | 47 | 30 | ||||||||||
5.636% due 07/25/2035 •(j) | 401 | 363 | ||||||||||
5.810% due 10/25/2035 • | 419 | 300 | ||||||||||
6.250% due 09/25/2034 « | 28 | 27 | ||||||||||
6.500% due 08/25/2036 ^(j) | 991 | 346 | ||||||||||
Countrywide Home Loan Mortgage Pass-Through Trust | ||||||||||||
2.948% due 10/20/2035 «~ | 8 | 8 | ||||||||||
3.594% due 03/25/2037 ^~ | 219 | 174 | ||||||||||
3.833% due 10/20/2035 ^«~ | 30 | 28 | ||||||||||
3.932% due 10/20/2035 ^~ | 67 | 62 | ||||||||||
PRINCIPAL AMOUNT (000S) | MARKET VALUE (000S) | |||||||||||
5.500% due 08/25/2035 ^« | $ | 11 | $ | 6 | ||||||||
5.630% due 03/25/2036 • | 99 | 91 | ||||||||||
5.930% due 02/25/2035 • | 48 | 42 | ||||||||||
Credit Suisse Mortgage Capital Mortgage-Backed Trust | ||||||||||||
6.000% due 11/25/2036 « | 95 | 79 | ||||||||||
Extended Stay America Trust | ||||||||||||
8.894% due 07/15/2038 •(j) | 964 | 919 | ||||||||||
First Horizon Alternative Mortgage Securities Trust | ||||||||||||
5.139% due 11/25/2036 ^~ | 151 | 109 | ||||||||||
First Horizon Mortgage Pass-Through Trust | ||||||||||||
4.186% due 01/25/2037 ^~ | 179 | 109 | ||||||||||
Freddie Mac | ||||||||||||
12.567% due 10/25/2041 •(j) | 1,200 | 1,199 | ||||||||||
GSR Mortgage Loan Trust | ||||||||||||
3.818% due 04/25/2035 «~ | 63 | 56 | ||||||||||
HarborView Mortgage Loan Trust | ||||||||||||
3.350% due 11/19/2034 «~ | 38 | 28 | ||||||||||
4.688% due 08/19/2036 ^«~ | 2 | 2 | ||||||||||
4.720% due 02/25/2036 ^«~ | 15 | 5 | ||||||||||
5.746% due 04/19/2034 «• | 3 | 3 | ||||||||||
HSI Asset Loan Obligation Trust | ||||||||||||
4.083% due 01/25/2037 ^~ | 106 | 74 | ||||||||||
IndyMac INDX Mortgage Loan Trust | ||||||||||||
3.102% due 06/25/2037 ^~ | 277 | 251 | ||||||||||
5.690% due 06/25/2037 ^• | 458 | 527 | ||||||||||
5.710% due 03/25/2035 «• | 3 | 3 | ||||||||||
JP Morgan Mortgage Trust | ||||||||||||
4.292% due 04/25/2037 ^«~ | 154 | 121 | ||||||||||
5.500% due 01/25/2036 ^ | 25 | 13 | ||||||||||
MASTR Adjustable Rate Mortgages Trust | ||||||||||||
3.912% due 10/25/2034 ~ | 57 | 51 | ||||||||||
4.318% due 11/25/2035 ^«~ | 263 | 130 | ||||||||||
Merrill Lynch Alternative Note Asset Trust | ||||||||||||
5.290% due 01/25/2037 • | 626 | 195 | ||||||||||
Opteum Mortgage Acceptance Corp. Asset-Backed Pass-Through Certificates | ||||||||||||
5.690% due 07/25/2036 «• | 169 | 66 | ||||||||||
RBSSP Resecuritization Trust | ||||||||||||
5.000% due 09/26/2036 ~(j) | 884 | 648 | ||||||||||
Residential Accredit Loans, Inc. Trust | ||||||||||||
3.303% due 12/26/2034 ^«~ | 67 | 58 | ||||||||||
4.951% due 01/25/2036 ^~ | 342 | 246 | ||||||||||
6.000% due 09/25/2035 ^« | 255 | 89 | ||||||||||
6.000% due 08/25/2036 ^ | 106 | 86 | ||||||||||
Structured Adjustable Rate Mortgage Loan Trust | ||||||||||||
3.625% due 09/25/2036 ^~ | 129 | 91 | ||||||||||
3.665% due 09/25/2035 «~ | 35 | 25 | ||||||||||
3.853% due 04/25/2036 ^~ | 156 | 95 | ||||||||||
4.378% due 01/25/2036 ^~ | 194 | 120 | ||||||||||
5.376% due 05/25/2035 ^•(j) | 729 | 572 | ||||||||||
Structured Asset Mortgage Investments Trust | ||||||||||||
5.610% due 02/25/2036 •(j) | 149 | 125 | ||||||||||
5.710% due 02/25/2036 ^• | 103 | 87 | ||||||||||
SunTrust Adjustable Rate Mortgage Loan Trust | ||||||||||||
4.894% due 01/25/2037 ^~ | 32 | 24 | ||||||||||
Tharaldson Hotel Portfolio Trust | ||||||||||||
8.671% due 11/11/2034 •(j) | 1,205 | 1,159 | ||||||||||
WaMu Mortgage Pass-Through Certificates Trust | ||||||||||||
3.768% due 12/25/2036 ^~(j) | 174 | 156 | ||||||||||
4.081% due 07/25/2037 ^~ | 47 | 44 | ||||||||||
Wells Fargo Commercial Mortgage Trust | ||||||||||||
5.092% due 12/15/2039 ~ | 1,065 | 919 | ||||||||||
Wells Fargo-RBS Commercial Mortgage Trust | ||||||||||||
0.392% due 12/15/2046 ~(a)(j) | 30,000 | 25 | ||||||||||
Total Non-Agency Mortgage-Backed Securities (Cost $16,418) | 14,370 | |||||||||||
ASSET-BACKED SECURITIES 7.1% | ||||||||||||
Adagio CLO DAC | ||||||||||||
0.000% due 04/30/2031 ~ | EUR | 250 | 88 | |||||||||
Apidos CLO | ||||||||||||
0.000% due 07/22/2026 ~ | $ | 500 | 1 | |||||||||
PRINCIPAL AMOUNT (000S) | MARKET VALUE (000S) | |||||||||||
Avoca CLO DAC | ||||||||||||
0.000% due 07/15/2032 ~ | EUR | 1,000 | $ | 632 | ||||||||
Bear Stearns Asset-Backed Securities Trust | ||||||||||||
6.500% due 08/25/2036 ^ | $ | 518 | 195 | |||||||||
Belle Haven ABS CDO Ltd. | ||||||||||||
5.473% due 07/05/2046 • | 34,966 | 3 | ||||||||||
Bombardier Capital Mortgage Securitization Corp. | ||||||||||||
7.830% due 06/15/2030 ~ | 1,421 | 189 | ||||||||||
Carlyle Global Market Strategies CLO Ltd. | ||||||||||||
0.000% due 04/17/2031 ~ | 1,700 | 391 | ||||||||||
Carlyle Global Market Strategies Euro CLO DAC | ||||||||||||
0.000% due 04/15/2027 ~ | EUR | 900 | 265 | |||||||||
0.000% due 01/25/2032 ~ | 300 | 103 | ||||||||||
Carlyle U.S. CLO Ltd. | ||||||||||||
0.000% due 10/15/2031 ~ | $ | 600 | 169 | |||||||||
Carrington Mortgage Loan Trust | ||||||||||||
5.300% due 08/25/2036 • | 36 | 34 | ||||||||||
Citigroup Mortgage Loan Trust | ||||||||||||
5.310% due 01/25/2037 • | 126 | 43 | ||||||||||
Conseco Finance Securitizations Corp. | ||||||||||||
7.960% due 05/01/2031 | 365 | 109 | ||||||||||
Countrywide Asset-Backed Certificates Trust | ||||||||||||
6.250% due 09/25/2034 «• | 26 | 23 | ||||||||||
Lehman XS Trust | ||||||||||||
4.285% due 05/25/2037 ^«þ | 23 | 21 | ||||||||||
Marlette Funding Trust | ||||||||||||
0.000% due 12/15/2028 «(f) | 2 | 63 | ||||||||||
0.000% due 04/16/2029 «(f) | 2 | 75 | ||||||||||
0.000% due 07/16/2029 «(f) | 2 | 181 | ||||||||||
Morgan Stanley ABS Capital, Inc. Trust | ||||||||||||
5.210% due 05/25/2037 • | 50 | 44 | ||||||||||
SMB Private Education Loan Trust | ||||||||||||
0.000% due 09/18/2046 «(f) | 1 | 317 | ||||||||||
0.000% due 10/15/2048 «(f) | 2 | 467 | ||||||||||
0.000% due 02/16/2055 «(f) | 0 | 249 | ||||||||||
Soundview Home Loan Trust | ||||||||||||
5.270% due 11/25/2036 • | 154 | 45 | ||||||||||
South Coast Funding Ltd. | ||||||||||||
0.476% due 01/06/2041 • | 393 | 74 | ||||||||||
0.476% due 01/06/2041 •(j) | 11,064 | 2,081 | ||||||||||
Washington Mutual Asset-Backed Certificates Trust | ||||||||||||
3.911% due 10/25/2036 • | 79 | 29 | ||||||||||
Total Asset-Backed Securities (Cost $18,213) | 5,891 | |||||||||||
SOVEREIGN ISSUES 2.5% | ||||||||||||
Argentina Government International Bond | ||||||||||||
0.500% due 07/09/2030 þ | 512 | 141 | ||||||||||
1.000% due 07/09/2029 | 97 | 32 | ||||||||||
1.500% due 07/09/2035 þ | 563 | 162 | ||||||||||
3.500% due 07/09/2041 þ(j) | 905 | 291 | ||||||||||
3.875% due 01/09/2038 þ(j) | 1,597 | 564 | ||||||||||
15.500% due 10/17/2026 | ARS | 8,480 | 3 | |||||||||
Autonomous City of Buenos Aires | ||||||||||||
95.645% (BADLARPP + 3.750%) due 02/22/2028 ~ | 449 | 1 | ||||||||||
Provincia de Buenos Aires | ||||||||||||
88.734% due 04/12/2025 | 79,631 | 148 | ||||||||||
Republic of Greece Government International Bond | ||||||||||||
2.000% due 04/22/2027 | EUR | 73 | 76 | |||||||||
3.900% due 01/30/2033 | 162 | 182 | ||||||||||
4.000% due 01/30/2037 | 127 | 141 | ||||||||||
4.200% due 01/30/2042 | 159 | 179 | ||||||||||
Russia Government International Bond | ||||||||||||
5.625% due 04/04/2042 ^(c) | $ | 200 | 136 | |||||||||
Ukraine Government International Bond | ||||||||||||
4.375% due 01/27/2032 ^(c) | EUR | 89 | 21 | |||||||||
Venezuela Government International Bond | ||||||||||||
8.250% due 10/13/2024 ^(c) | $ | 4 | 0 | |||||||||
9.250% due 09/15/2027 ^(c) | 62 | 6 | ||||||||||
Total Sovereign Issues (Cost $4,205) | 2,083 | |||||||||||
42 | PIMCO CLOSED-END FUNDS | See Accompanying Notes |
| June 30, 2023 |
SHARES | MARKET VALUE (000S) | |||||||||||
COMMON STOCKS 2.8% | ||||||||||||
COMMUNICATION SERVICES 0.3% | ||||||||||||
Clear Channel Outdoor Holdings, Inc. (d) | 97,913 | $ | 134 | |||||||||
iHeartMedia, Inc. ‘A’ (d) | 22,927 | 84 | ||||||||||
iHeartMedia, Inc. ‘B’ «(d) | 17,837 | 58 | ||||||||||
| 276 | ||||||||||||
CONSUMER DISCRETIONARY 0.0% | ||||||||||||
Steinhoff CVR «(d) | 4,155,237 | 0 | ||||||||||
ENERGY 0.0% | ||||||||||||
Axis Energy Services ‘A’ «(h) | 514 | 15 | ||||||||||
FINANCIALS 1.3% | ||||||||||||
ADLER Group SA «(d) | 1,206 | 1 | ||||||||||
Banca Monte dei Paschi di Siena SpA (d) | 123,500 | 310 | ||||||||||
Intelsat Emergence SA «(d)(h) | 34,279 | 788 | ||||||||||
| 1,099 | ||||||||||||
INDUSTRIALS 1.2% | ||||||||||||
Drillco Holding Lux SA «(d) | 13,431 | 258 | ||||||||||
Drillco Holding Lux SA «(d)(h) | 5,770 | 111 | ||||||||||
Neiman Marcus Group Ltd. LLC «(d)(h) | 516 | 78 | ||||||||||
Sierra Hamilton Holder LLC «(d)(h) | 100,456 | 0 | ||||||||||
Syniverse Holdings, Inc. «(h) | 327,258 | 301 | ||||||||||
Voyager Aviation Holdings LLC «(d) | 377 | 0 | ||||||||||
Westmoreland Mining Holdings «(d)(h) | 13,114 | 164 | ||||||||||
Westmoreland Mining Holdings «(d) | 13,229 | 88 | ||||||||||
| 1,000 | ||||||||||||
REAL ESTATE 0.0% | ||||||||||||
ADLER Group SA | 2,671 | 2 | ||||||||||
Total Common Stocks (Cost $5,187) | 2,392 | |||||||||||
SHARES | MARKET VALUE (000S) | |||||||||||
RIGHTS 0.0% | ||||||||||||
FINANCIALS 0.0% | ||||||||||||
Intelsat Jackson Holdings SA «(d) | 3,671 | $ | 18 | |||||||||
Total Rights (Cost $0) | 18 | |||||||||||
WARRANTS 1.0% | ||||||||||||
FINANCIALS 0.0% | ||||||||||||
Intelsat Emergence SA - Exp. 02/17/2027 « | 236 | 0 | ||||||||||
Intelsat Jackson Holdings SA - Exp. 12/05/2025 « | 3,580 | 26 | ||||||||||
| 26 | ||||||||||||
INFORMATION TECHNOLOGY 1.0% | ||||||||||||
Windstream Holdings LLC - Exp. 9/21/2055 « | 52,536 | 805 | ||||||||||
Total Warrants (Cost $1,166) | 831 | |||||||||||
PREFERRED SECURITIES 4.6% | ||||||||||||
FINANCIALS 3.9% | ||||||||||||
AGFC Capital Trust | ||||||||||||
7.010% (US0003M + 1.750%) due 01/15/2067 ~(j) | 1,000,000 | 539 | ||||||||||
Charles Schwab Corp. | ||||||||||||
4.000% due 12/01/2030 •(g) | 200,000 | 147 | ||||||||||
OCP CLO Ltd. | ||||||||||||
0.000% due 04/26/2028 (f) | 1,400 | 667 | ||||||||||
Stichting AK Rabobank Certificaten | ||||||||||||
6.500% due 12/29/2049 þ(g) | 1,890,000 | 1,917 | ||||||||||
SVB Financial Group | ||||||||||||
4.700% due 11/15/2031 ^(c)(g) | 11,000 | 1 | ||||||||||
| 3,271 | ||||||||||||
INDUSTRIALS 0.7% | ||||||||||||
Voyager Aviation Holdings LLC « | 2,260 | 545 | ||||||||||
Total Preferred Securities (Cost $5,289) | 3,816 | |||||||||||
SHARES | MARKET VALUE (000S) | |||||||||||
REAL ESTATE INVESTMENT TRUSTS 0.3% | ||||||||||||
REAL ESTATE 0.3% | ||||||||||||
CBL & Associates Properties, Inc. | 2,842 | $ | 63 | |||||||||
Uniti Group, Inc. | 32,667 | 151 | ||||||||||
Total Real Estate Investment Trusts (Cost $246) | 214 | |||||||||||
PRINCIPAL AMOUNT (000S) | ||||||||||||
SHORT-TERM INSTRUMENTS 21.0% | ||||||||||||
REPURCHASE AGREEMENTS (i) 19.7% | ||||||||||||
| 16,277 | ||||||||||||
ARGENTINA TREASURY BILLS 0.2% | ||||||||||||
(21.738)% due 09/18/2023 - 11/23/2023 (e)(f) | ARS | 69,394 | 173 | |||||||||
U.S. TREASURY BILLS 1.1% | ||||||||||||
5.240% due 08/24/2023 - 09/12/2023 (e)(f)(m) | $ | 929 | 920 | |||||||||
Total Short-Term Instruments (Cost $17,380) | 17,370 | |||||||||||
Total Investments in Securities (Cost $170,004) | 140,335 | |||||||||||
Total Investments 169.7% (Cost $170,004) | $ | 140,335 | ||||||||||
Financial Derivative Instruments (k)(l) 10.2% (Cost or Premiums, net $(419)) | 8,391 | |||||||||||
Other Assets and Liabilities, net (79.9)% | (66,059 | ) | ||||||||||
Net Assets 100.0% | $ | 82,667 | ||||||||||
* | A zero balance may reflect actual amounts rounding to less than one thousand. |
^ | Security is in default. |
« | Security valued using significant unobservable inputs (Level 3). |
µ | All or a portion of this amount represents unfunded loan commitments. The interest rate for the unfunded portion will be determined at the time of funding. See Note 4, Securities and Other Investments, in the Notes to Financial Statements for more information regarding unfunded loan commitments. |
~ | Variable or Floating rate security. Rate shown is the rate in effect as of period end. Certain variable rate securities are not based on a published reference rate and spread, rather are determined by the issuer or agent and are based on current market conditions. Reference rate is as of reset date, which may vary by security. These securities may not indicate a reference rate and/or spread in their description. |
• | Rate shown is the rate in effect as of period end. The rate may be based on a fixed rate, a capped rate or a floor rate and may convert to a variable or floating rate in the future. These securities do not indicate a reference rate and spread in their description. |
þ | Coupon represents a rate which changes periodically based on a predetermined schedule or event. Rate shown is the rate in effect as of period end. |
(a) | Security is an Interest Only (“IO”) or IO Strip. |
(b) | Payment in-kind security. |
(c) | Security is not accruing income as of the date of this report. |
(d) | Security did not produce income within the last twelve months. |
(e) | Coupon represents a weighted average yield to maturity. |
(f) | Zero coupon security. |
(g) | Perpetual maturity; date shown, if applicable, represents next contractual call date. |
| See Accompanying Notes | ANNUAL REPORT | | | JUNE 30, 2023 | 43 |
Schedule of Investments | PIMCO Global StocksPLUS ® | (Cont.) |
Issuer Description | Acquisition Date | Cost | Market Value | Market Value as Percentage of Net Assets | ||||||||||||||||||||
Axis Energy Services ‘A’ | 07/01/2021 | $ | 8 | $ | 15 | 0.02 | % | |||||||||||||||||
Drillco Holding Lux SA | 06/08/2023 | 116 | 111 | 0.14 | ||||||||||||||||||||
Intelsat Emergence SA | 06/19/2017 - 02/23/2022 | 2,403 | 788 | 0.95 | ||||||||||||||||||||
Neiman Marcus Group Ltd. LLC | 09/25/2020 | 0 | 78 | 0.09 | ||||||||||||||||||||
Sierra Hamilton Holder LLC | 07/31/2017 | 25 | 0 | 0.00 | ||||||||||||||||||||
Syniverse Holdings, Inc. | 05/12/2022 - 05/31/2023 | 321 | 301 | 0.36 | ||||||||||||||||||||
Westmoreland Mining Holdings | 12/08/2014 - 08/05/2016 | 367 | 164 | 0.20 | ||||||||||||||||||||
| $ | 3,240 | $ | 1,457 | 1.76 | % | |||||||||||||||||||
Counterparty | Lending Rate | Settlement Date | Maturity Date | Principal Amount | Collateralized By | Collateral (Received) | Repurchase Agreements, at Value | Repurchase Agreement Proceeds to be Received (1) | ||||||||||||||||||||||
| BPS | 5.110 | % | 06/30/2023 | 07/03/2023 | $ | 15,200 | U.S. Treasury Notes 2.375% due 03/31/2029 | $ | (15,502 | ) | $ | 15,200 | $ | 15,207 | ||||||||||||||||
| FICC | 2.400 | 06/30/2023 | 07/03/2023 | 1,077 | U.S. Treasury Notes 4.625% due 06/30/2025 | (1,098 | ) | 1,077 | 1,077 | |||||||||||||||||||||
Total Repurchase Agreements | $ | (16,600 | ) | $ | 16,277 | $ | 16,284 | |||||||||||||||||||||||
Counterparty | Borrowing Rate (2) | Settlement Date | Maturity Date | Amount Borrowed (2) | Payable for Reverse Repurchase Agreements | |||||||||||||||||||
BPS | 5.550 | % | 01/09/2023 | 07/10/2023 | $ | (140 | ) | $ | (144 | ) | ||||||||||||||
| 5.740 | 03/14/2023 | 07/14/2023 | (1,921 | ) | (1,954 | ) | ||||||||||||||||||
| 5.760 | 03/23/2023 | 07/21/2023 | (480 | ) | (487 | ) | ||||||||||||||||||
| 5.790 | 03/01/2023 | 07/31/2023 | (431 | ) | (440 | ) | ||||||||||||||||||
| 6.160 | 05/10/2023 | 11/02/2023 | (198 | ) | (200 | ) | ||||||||||||||||||
| 6.310 | 04/13/2023 | 10/10/2023 | (309 | ) | (314 | ) | ||||||||||||||||||
| 6.310 | 05/10/2023 | 11/02/2023 | (220 | ) | (222 | ) | ||||||||||||||||||
| 6.410 | 05/08/2023 | 11/02/2023 | (611 | ) | (617 | ) | ||||||||||||||||||
| 6.410 | 05/10/2023 | 11/02/2023 | (189 | ) | (191 | ) | ||||||||||||||||||
| 6.610 | 04/13/2023 | 10/10/2023 | (721 | ) | (731 | ) | ||||||||||||||||||
BRC | 5.450 | 06/22/2023 | TBD | (3) | (633 | ) | (634 | ) | ||||||||||||||||
| 6.040 | 04/14/2023 | 07/14/2023 | (531 | ) | (538 | ) | ||||||||||||||||||
| 6.050 | 01/17/2023 | 07/19/2023 | (186 | ) | (191 | ) | ||||||||||||||||||
| 6.140 | 01/30/2023 | 08/30/2023 | (2,257 | ) | (2,317 | ) | ||||||||||||||||||
BYR | 5.760 | 03/30/2023 | 10/19/2023 | (111 | ) | (113 | ) | |||||||||||||||||
| 5.770 | 03/23/2023 | 09/20/2023 | (230 | ) | (234 | ) | ||||||||||||||||||
CDC | 5.370 | 02/13/2023 | 08/11/2023 | (647 | ) | (660 | ) | |||||||||||||||||
| 5.550 | 04/12/2023 | 07/11/2023 | (137 | ) | (138 | ) | ||||||||||||||||||
| 5.560 | 03/30/2023 | 07/28/2023 | (1,451 | ) | (1,472 | ) | ||||||||||||||||||
DBL | 3.630 | 05/10/2023 | TBD | (3) | EUR | (105 | ) | (115 | ) | |||||||||||||||
| 6.688 | 06/09/2023 | 08/10/2023 | $ | (1,460 | ) | (1,466 | ) | |||||||||||||||||
JML | 3.650 | 05/10/2023 | 08/10/2023 | EUR | (1,499 | ) | (1,645 | ) | ||||||||||||||||
| 5.250 | 05/05/2023 | 07/28/2023 | $ | (281 | ) | (283 | ) | |||||||||||||||||
| 5.450 | 05/05/2023 | 07/28/2023 | (257 | ) | (260 | ) | ||||||||||||||||||
| 5.500 | 05/05/2023 | 07/28/2023 | (764 | ) | (771 | ) | ||||||||||||||||||
JPS | 6.220 | 05/05/2023 | 11/01/2023 | (859 | ) | (868 | ) | |||||||||||||||||
MEI | 3.914 | 05/18/2023 | 09/18/2023 | EUR | (298 | ) | (327 | ) | ||||||||||||||||
| 5.890 | 05/19/2023 | 09/18/2023 | $ | (588 | ) | (592 | ) | |||||||||||||||||
NOM | 5.750 | 05/05/2023 | TBD | (3) | (254 | ) | (257 | ) | ||||||||||||||||
RBC | 6.110 | 06/12/2023 | 10/12/2023 | (739 | ) | (742 | ) | |||||||||||||||||
SOG | 5.770 | 05/12/2023 | 11/13/2023 | (89 | ) | (89 | ) | |||||||||||||||||
TDM | 5.400 | 06/28/2023 | TBD | (3) | (983 | ) | (983 | ) | ||||||||||||||||
UBS | 3.600 | 06/08/2023 | TBD | (3) | EUR | (837 | ) | (916 | ) | |||||||||||||||
| 5.550 | 02/03/2023 | 08/03/2023 | $ | (1,475 | ) | (1,509 | ) | |||||||||||||||||
| 5.700 | 04/17/2023 | 10/16/2023 | (732 | ) | (741 | ) | ||||||||||||||||||
Total Reverse Repurchase Agreements | $ | (23,161 | ) | |||||||||||||||||||||
44 | PIMCO CLOSED-END FUNDS | See Accompanying Notes |
| June 30, 2023 |
Description | Coupon | Maturity Date | Principal Amount | Proceeds | Payable for Short Sales | |||||||||||||||
U.S. Government Agencies (0.8)% | ||||||||||||||||||||
Uniform Mortgage-Backed Security, TBA | 2.000 | % | 07/01/2053 | $ | 800 | $ | (659 | ) | $ | (653 | ) | |||||||||
Total Short Sales (0.8)% | $ | (659 | ) | $ | (653 | ) | ||||||||||||||
Counterparty | Repurchase Agreement Proceeds to be Received (1) | Payable for Reverse Repurchase Agreements | Payable for Sale-Buyback Transactions | Total Borrowings and Other Financing Transactions | Collateral Pledged/(Received) | Net Exposure (4) | ||||||||||||||||||
Global/Master Repurchase Agreement | ||||||||||||||||||||||||
BPS | $ | 15,207 | $ | (5,300 | ) | $ | 0 | $ | 9,907 | $ | (8,761 | ) | $ | 1,146 | ||||||||||
BRC | 0 | (3,680 | ) | 0 | (3,680 | ) | 4,206 | 526 | ||||||||||||||||
BYR | 0 | (347 | ) | 0 | (347 | ) | 399 | 52 | ||||||||||||||||
CDC | 0 | (2,270 | ) | 0 | (2,270 | ) | 2,391 | 121 | ||||||||||||||||
CIB | 0 | 0 | 0 | 0 | (10 | ) | (10 | ) | ||||||||||||||||
DBL | 0 | (1,581 | ) | 0 | (1,581 | ) | 2,200 | 619 | ||||||||||||||||
FICC | 1,077 | 0 | 0 | 1,077 | (1,098 | ) | (21 | ) | ||||||||||||||||
JML | 0 | (2,959 | ) | 0 | (2,959 | ) | 3,501 | 542 | ||||||||||||||||
JPS | 0 | (868 | ) | 0 | (868 | ) | 1,159 | 291 | ||||||||||||||||
MEI | 0 | (919 | ) | 0 | (919 | ) | 1,118 | 199 | ||||||||||||||||
NOM | 0 | (257 | ) | 0 | (257 | ) | 308 | 51 | ||||||||||||||||
RBC | 0 | (742 | ) | 0 | (742 | ) | 919 | 177 | ||||||||||||||||
RDR | 0 | 0 | 0 | 0 | (59 | ) | (59 | ) | ||||||||||||||||
SOG | 0 | (89 | ) | 0 | (89 | ) | 103 | 14 | ||||||||||||||||
TDM | 0 | (983 | ) | 0 | (983 | ) | 1,054 | 71 | ||||||||||||||||
UBS | 0 | (3,166 | ) | 0 | (3,166 | ) | 3,530 | 364 | ||||||||||||||||
Total Borrowings and Other Financing Transactions | $ | 16,284 | $ | (23,161 | ) | $ | 0 | |||||||||||||||||
Overnight and Continuous | Up to 30 days | 31-90 days | Greater Than 90 days | Total | ||||||||||||||||
Reverse Repurchase Agreements | ||||||||||||||||||||
Corporate Bonds & Notes | $ | 0 | $ | (4,478 | ) | $ | (3,264 | ) | $ | (3,591 | ) | $ | (11,333 | ) | ||||||
Convertible Bonds & Notes | 0 | 0 | 0 | (257 | ) | (257 | ) | |||||||||||||
U.S. Government Agencies | 0 | 0 | 0 | (391 | ) | (391 | ) | |||||||||||||
Non-Agency Mortgage-Backed Securities | 0 | (729 | ) | (2,317 | ) | (3,494 | ) | (6,540 | ) | |||||||||||
Asset-Backed Securities | 0 | 0 | (1,466 | ) | 0 | (1,466 | ) | |||||||||||||
Sovereign Issues | 0 | (1,031 | ) | 0 | 0 | (1,031 | ) | |||||||||||||
Preferred Securities | 0 | 0 | (2,143 | ) | 0 | (2,143 | ) | |||||||||||||
Total Borrowings | $ | 0 | $ | (6,238 | ) | $ | (9,190 | ) | $ | (7,733 | ) | $ | (23,161 | ) | ||||||
Payable for reverse repurchase agreements | $ | (23,161 | ) | |||||||||||||||||
(j) | Securities with an aggregate market value of $27,629 have been pledged as collateral under the terms of the above master agreements as of June 30, 2023. |
(1) | Includes accrued interest. |
(2) | The average amount of borrowings outstanding during the period ended June 30, 2023 was $(36,042) at a weighted average interest rate of 3.778%. Average borrowings may include reverse repurchase agreements and sale-buyback transactions, if held during the period. |
(3) | Open maturity reverse repurchase agreement. |
(4) | Net Exposure represents the net receivable/(payable) that would be due from/to the counterparty in the event of default. Exposure from borrowings and other financing transactions can only be netted across transactions governed under the same master agreement with the same legal entity. See Note 8, Master Netting Arrangements, in the Notes to Financial Statements for more information. |
| See Accompanying Notes | ANNUAL REPORT | | | JUNE 30, 2023 | 45 |
Schedule of Investments | PIMCO Global StocksPLUS ® | (Cont.) |
Description | Strike Price | Expiration Date | # of Contracts | Notional Amount | Cost | Market Value | ||||||||||||||||||
Put - CME E-mini S&P 500 July 2023 Futures | $ | 4,230.000 | 07/21/2023 | 178 | $ | 9 | $ | 143 | $ | 38 | ||||||||||||||
Total Purchased Options | $ | 143 | $ | 38 | ||||||||||||||||||||
Description | Strike Price | Expiration Date | # of Contracts | Notional Amount | Premiums (Received) | Market Value | ||||||||||||||||||
Call - CME E-mini S&P 500 July 2023 Futures | $ | 4,450.000 | 07/21/2023 | 178 | $ | 9 | $ | (592 | ) | $ | (583 | ) | ||||||||||||
Total Written Options | $ | (592 | ) | $ | (583 | ) | ||||||||||||||||||
Description | Expiration Month | # of Contracts | Notional Amount | Unrealized Appreciation/ (Depreciation) | Variation Margin | |||||||||||||||||||
Asset | Liability | |||||||||||||||||||||||
E-Mini S&P 500 Index September Futures | 09/2023 | 188 | $ | 42,190 | $ | 1,217 | $ | 493 | $ | 0 | ||||||||||||||
Description | Expiration Month | # of Contracts | Notional Amount | Unrealized Appreciation/ (Depreciation) | Variation Margin | |||||||||||||||||||
Asset | Liability | |||||||||||||||||||||||
3-Month SOFR Active Contract December Futures | 03/2024 | 5 | $ | (1,183 | ) | $ | 33 | $ | 0 | $ | (1 | ) | ||||||||||||
3-Month SOFR Active Contract December Futures | 03/2025 | 1 | (240 | ) | 5 | 0 | 0 | |||||||||||||||||
3-Month SOFR Active Contract December Futures | 03/2026 | 1 | (241 | ) | 3 | 0 | 0 | |||||||||||||||||
3-Month SOFR Active Contract June Futures | 09/2024 | 2 | (476 | ) | 12 | 0 | 0 | |||||||||||||||||
3-Month SOFR Active Contract June Futures | 09/2025 | 2 | (482 | ) | 7 | 0 | 0 | |||||||||||||||||
3-Month SOFR Active Contract March Futures | 06/2024 | 4 | (949 | ) | 26 | 0 | 0 | |||||||||||||||||
3-Month SOFR Active Contract March Futures | 06/2025 | 2 | (481 | ) | 8 | 1 | 0 | |||||||||||||||||
3-Month SOFR Active Contract March Futures | 06/2026 | 1 | (241 | ) | 3 | 0 | 0 | |||||||||||||||||
3-Month SOFR Active Contract September Futures | 12/2024 | 2 | (478 | ) | 10 | 0 | 0 | |||||||||||||||||
3-Month SOFR Active Contract September Futures | 12/2025 | 1 | (241 | ) | 4 | 0 | 0 | |||||||||||||||||
| $ | 111 | $ | 1 | $ | (1 | ) | ||||||||||||||||||
Total Futures Contracts | $ | 1,328 | $ | 494 | $ | (1 | ) | |||||||||||||||||
Pay/Receive Floating Rate | Floating Rate Index | Fixed Rate | Payment Frequency | Maturity Date | Notional Amount | Premiums Paid/(Received) | Unrealized Appreciation/ (Depreciation) | Market Value | Variation Margin | |||||||||||||||||||||||||||||
Asset | Liability | |||||||||||||||||||||||||||||||||||||
Receive | 1-Day GBP-SONIO Compounded-OIS | 0.750 | % | Annual | 09/21/2052 | GBP | 600 | $ | 123 | $ | 294 | $ | 417 | $ | 4 | $ | 0 | |||||||||||||||||||||
Receive (1) | 1-Day USD-SOFR Compounded-OIS | 0.250 | Semi-Annual | 06/16/2024 | $ | 3,000 | 3 | 113 | 116 | 0 | (1 | ) | ||||||||||||||||||||||||||
Receive (1) | 1-Day USD-SOFR Compounded-OIS | 3.000 | Semi-Annual | 06/19/2024 | 4,400 | (19 | ) | 103 | 84 | 0 | (1 | ) | ||||||||||||||||||||||||||
Receive (1) | 1-Day USD-SOFR Compounded-OIS | 2.450 | Annual | 12/20/2024 | 3,700 | 0 | 87 | 87 | 0 | (1 | ) | |||||||||||||||||||||||||||
Receive (1) | 1-Day USD-SOFR Compounded-OIS | 2.350 | Annual | 01/17/2025 | 1,900 | 0 | 45 | 45 | 0 | (1 | ) | |||||||||||||||||||||||||||
Receive (1) | 1-Day USD-SOFR Compounded-OIS | 2.300 | Annual | 01/17/2026 | 300 | 0 | 11 | 11 | 0 | 0 | ||||||||||||||||||||||||||||
Pay | 1-Day USD-SOFR Compounded-OIS | 1.000 | Annual | 06/15/2027 | 25,500 | (1,032 | ) | (1,870 | ) | (2,902 | ) | 0 | (2 | ) | ||||||||||||||||||||||||
Receive (1) | 1-Day USD-SOFR Compounded-OIS | 1.500 | Semi-Annual | 12/15/2028 | 1,250 | (12 | ) | 160 | 148 | 0 | (1 | ) | ||||||||||||||||||||||||||
Pay | 1-Day USD-SOFR Compounded-OIS | 1.750 | Annual | 06/15/2029 | 340 | (37 | ) | 0 | (37 | ) | 0 | 0 | ||||||||||||||||||||||||||
Receive (1) | 1-Day USD-SOFR Compounded-OIS | 1.750 | Semi-Annual | 01/15/2030 | 600 | (5 | ) | 81 | 76 | 0 | (1 | ) | ||||||||||||||||||||||||||
Receive (1) | 1-Day USD-SOFR Compounded-OIS | 2.000 | Semi-Annual | 02/12/2030 | 4,400 | (56 | ) | 546 | 490 | 0 | (4 | ) | ||||||||||||||||||||||||||
Receive (1) | 1-Day USD-SOFR Compounded-OIS | 2.000 | Semi-Annual | 03/10/2030 | 500 | 0 | 55 | 55 | 0 | (1 | ) | |||||||||||||||||||||||||||
Receive (1) | 1-Day USD-SOFR Compounded-OIS | 1.000 | Semi-Annual | 12/16/2030 | 400 | (12 | ) | 83 | 71 | 0 | (1 | ) | ||||||||||||||||||||||||||
Pay (1) | 1-Day USD-SOFR Compounded-OIS | 0.750 | Semi-Annual | 06/16/2031 | 2,229 | (174 | ) | (281 | ) | (455 | ) | 4 | 0 | |||||||||||||||||||||||||
Pay | 1-Day USD-SOFR Compounded-OIS | 1.750 | Annual | 06/15/2032 | 220 | (9 | ) | (22 | ) | (31 | ) | 0 | 0 | |||||||||||||||||||||||||
46 | PIMCO CLOSED-END FUNDS | See Accompanying Notes |
| June 30, 2023 |
Pay/Receive Floating Rate | Floating Rate Index | Fixed Rate | Payment Frequency | Maturity Date | Notional Amount | Premiums Paid/(Received) | Unrealized Appreciation/ (Depreciation) | Market Value | Variation Margin | |||||||||||||||||||||||||||||
Asset | Liability | |||||||||||||||||||||||||||||||||||||
Pay | 1-Day USD-SOFR Compounded-OIS | 3.000 | % | Annual | 06/21/2033 | $ | 40 | $ | 0 | $ | (2 | ) | $ | (2 | ) | $ | 0 | $ | 0 | |||||||||||||||||||
Pay (1) | 1-Day USD-SOFR Compounded-OIS | 3.500 | Annual | 12/20/2033 | 1,500 | 21 | (13 | ) | 8 | 4 | 0 | |||||||||||||||||||||||||||
Pay (1) | 1-Day USD-SOFR Compounded-OIS | 3.000 | Semi-Annual | 12/19/2048 | 1,900 | (5 | ) | (164 | ) | (169 | ) | 16 | 0 | |||||||||||||||||||||||||
Receive | 1-Day USD-SOFR Compounded-OIS | 1.500 | Annual | 06/15/2052 | 5,400 | 468 | 1,236 | 1,704 | 0 | (44 | ) | |||||||||||||||||||||||||||
Receive | 1-Day USD-SOFR Compounded-OIS | 1.750 | Annual | 06/15/2052 | 6,000 | 713 | 902 | 1,615 | 0 | (51 | ) | |||||||||||||||||||||||||||
Pay | 1-Year BRL-CDI | 11.140 | Maturity | 01/02/2025 | BRL | 300 | 0 | (1 | ) | (1 | ) | 0 | 0 | |||||||||||||||||||||||||
Pay | 1-Year BRL-CDI | 11.160 | Maturity | 01/02/2025 | 200 | 0 | (1 | ) | (1 | ) | 0 | 0 | ||||||||||||||||||||||||||
Pay | 1-Year BRL-CDI | 11.350 | Maturity | 01/02/2025 | 200 | 0 | (1 | ) | (1 | ) | 0 | 0 | ||||||||||||||||||||||||||
Pay | 1-Year BRL-CDI | 12.000 | Maturity | 01/02/2025 | 600 | 0 | 0 | 0 | 0 | 0 | ||||||||||||||||||||||||||||
Pay | 1-Year BRL-CDI | 12.080 | Maturity | 01/02/2025 | 1,000 | 0 | 1 | 1 | 0 | 0 | ||||||||||||||||||||||||||||
Pay | 1-Year BRL-CDI | 12.140 | Maturity | 01/02/2025 | 500 | 0 | 0 | 0 | 0 | 0 | ||||||||||||||||||||||||||||
Pay | 1-Year BRL-CDI | 12.145 | Maturity | 01/02/2025 | 500 | 0 | 1 | 1 | 0 | 0 | ||||||||||||||||||||||||||||
Pay | 1-Year BRL-CDI | 12.160 | Maturity | 01/02/2025 | 1,000 | 0 | 1 | 1 | 0 | 0 | ||||||||||||||||||||||||||||
Pay | 1-Year BRL-CDI | 11.220 | Maturity | 01/04/2027 | 300 | 0 | 1 | 1 | 0 | 0 | ||||||||||||||||||||||||||||
Pay | 1-Year BRL-CDI | 11.245 | Maturity | 01/04/2027 | 100 | 0 | 0 | 0 | 0 | 0 | ||||||||||||||||||||||||||||
Pay | 1-Year BRL-CDI | 11.260 | Maturity | 01/04/2027 | 100 | 0 | 0 | 0 | 0 | 0 | ||||||||||||||||||||||||||||
Pay | 1-Year BRL-CDI | 11.700 | Maturity | 01/04/2027 | 100 | 0 | 1 | 1 | 0 | 0 | ||||||||||||||||||||||||||||
Pay | 1-Year BRL-CDI | 11.715 | Maturity | 01/04/2027 | 300 | 0 | 2 | 2 | 0 | 0 | ||||||||||||||||||||||||||||
Pay | 1-Year BRL-CDI | 11.870 | Maturity | 01/04/2027 | 800 | 0 | 5 | 5 | 1 | 0 | ||||||||||||||||||||||||||||
Pay | 3-Month CAD-Bank Bill | 3.300 | Semi-Annual | 06/19/2024 | CAD | 4,900 | 369 | (447 | ) | (78 | ) | 1 | 0 | |||||||||||||||||||||||||
Receive | 3-Month CAD-Bank Bill | 3.500 | Semi-Annual | 06/20/2044 | 600 | (107 | ) | 126 | 19 | 0 | (6 | ) | ||||||||||||||||||||||||||
Receive | 3-Month USD-LIBOR | 1.750 | Semi-Annual | 07/15/2023 | $ | 600 | 0 | 3 | 3 | 0 | 0 | |||||||||||||||||||||||||||
Receive | 3-Month USD-LIBOR | 2.000 | Semi-Annual | 08/12/2023 | 4,400 | 0 | 18 | 18 | 1 | 0 | ||||||||||||||||||||||||||||
Receive | 3-Month USD-LIBOR | 2.000 | Semi-Annual | 09/10/2023 | 500 | 0 | 2 | 2 | 0 | 0 | ||||||||||||||||||||||||||||
Receive | 3-Month USD-LIBOR | 1.500 | Semi-Annual | 09/15/2023 | 1,250 | 0 | 13 | 13 | 1 | 0 | ||||||||||||||||||||||||||||
Receive | 3-Month USD-LIBOR | 0.250 | Semi-Annual | 09/16/2023 | 3,000 | 0 | 42 | 42 | 1 | 0 | ||||||||||||||||||||||||||||
Pay | 3-Month USD-LIBOR | 0.750 | Semi-Annual | 09/16/2023 | 2,229 | 0 | (28 | ) | (28 | ) | 0 | (1 | ) | |||||||||||||||||||||||||
Receive | 3-Month USD-LIBOR | 1.000 | Semi-Annual | 09/16/2023 | 400 | 0 | 5 | 5 | 0 | 0 | ||||||||||||||||||||||||||||
Receive | 3-Month USD-LIBOR | 3.000 | Semi-Annual | 09/19/2023 | 2,500 | 0 | 17 | 17 | 1 | 0 | ||||||||||||||||||||||||||||
Pay | 6-Month EUR-EURIBOR | 0.650 | Annual | 02/26/2029 | EUR | 6,100 | 6 | (923 | ) | (917 | ) | 0 | (28 | ) | ||||||||||||||||||||||||
Receive | 6-Month EUR-EURIBOR | 0.150 | Annual | 03/18/2030 | 1,300 | (18 | ) | 305 | 287 | 7 | 0 | |||||||||||||||||||||||||||
Receive | 6-Month EUR-EURIBOR | 0.150 | Annual | 06/17/2030 | 3,000 | (132 | ) | 732 | 600 | 15 | 0 | |||||||||||||||||||||||||||
Receive | 6-Month EUR-EURIBOR | 0.250 | Annual | 09/21/2032 | 800 | 72 | 125 | 197 | 5 | 0 | ||||||||||||||||||||||||||||
Receive | 6-Month EUR-EURIBOR | 1.250 | Annual | 08/19/2049 | 2,700 | 11 | 740 | 751 | 15 | 0 | ||||||||||||||||||||||||||||
Pay | 6-Month EUR-EURIBOR | 0.250 | Annual | 03/18/2050 | 400 | 48 | (244 | ) | (196 | ) | 0 | (2 | ) | |||||||||||||||||||||||||
Pay | 6-Month EUR-EURIBOR | 0.500 | Annual | 06/17/2050 | 1,000 | 171 | (606 | ) | (435 | ) | 0 | (5 | ) | |||||||||||||||||||||||||
Receive (1) | 6-Month EUR-EURIBOR | 0.830 | Annual | 12/09/2052 | 1,600 | 11 | 76 | 87 | 0 | 0 | ||||||||||||||||||||||||||||
Receive | 28-Day MXN-TIIE | 8.675 | Lunar | 04/03/2024 | MXN | 2,700 | 0 | 3 | 3 | 0 | 0 | |||||||||||||||||||||||||||
Receive | 28-Day MXN-TIIE | 8.660 | Lunar | 04/04/2024 | 1,100 | 0 | 1 | 1 | 0 | 0 | ||||||||||||||||||||||||||||
Receive | 28-Day MXN-TIIE | 8.750 | Lunar | 04/05/2024 | 1,000 | 0 | 1 | 1 | 0 | 0 | ||||||||||||||||||||||||||||
Receive | 28-Day MXN-TIIE | 8.410 | Lunar | 03/31/2027 | 300 | 0 | 0 | 0 | 0 | 0 | ||||||||||||||||||||||||||||
Receive | 28-Day MXN-TIIE | 8.730 | Lunar | 04/06/2027 | 400 | 0 | 0 | 0 | 0 | 0 | ||||||||||||||||||||||||||||
Receive | 28-Day MXN-TIIE | 7.495 | Lunar | 01/14/2032 | 200 | 1 | (1 | ) | 0 | 0 | 0 | |||||||||||||||||||||||||||
Receive | 28-Day MXN-TIIE | 7.498 | Lunar | 01/15/2032 | 800 | 3 | (1 | ) | 2 | 0 | 0 | |||||||||||||||||||||||||||
Receive | 28-Day MXN-TIIE | 8.732 | Lunar | 03/30/2032 | 200 | 0 | 0 | 0 | 0 | 0 | ||||||||||||||||||||||||||||
Receive | 28-Day MXN-TIIE | 8.701 | Lunar | 03/31/2032 | 500 | 0 | (1 | ) | (1 | ) | 0 | 0 | ||||||||||||||||||||||||||
Total Swap Agreements | $ | 402 | $ | 1,331 | $ | 1,733 | $ | 76 | $ | (151 | ) | |||||||||||||||||||||||||||
Financial Derivative Assets | Financial Derivative Liabilities | |||||||||||||||||||||||||||||||||||
Market Value | Variation Margin Asset | Total | Market Value | Variation Margin Liability | Total | |||||||||||||||||||||||||||||||
Purchased Options | Futures | Swap Agreements | Written Options | Futures | Swap Agreements | |||||||||||||||||||||||||||||||
Total Exchange-Traded or Centrally Cleared | $ | 38 | $ | 494 | $ | 76 | $ | 608 | $ | (583) | $ | (1) | $ | (151) | $ | (735) | ||||||||||||||||||||
(1) | This instrument has a forward starting effective date. See Note 2, Securities Transactions and Investment Income, in the Notes to Financial Statements for further information. |
| See Accompanying Notes | ANNUAL REPORT | | | JUNE 30, 2023 | 47 |
Schedule of Investments | PIMCO Global StocksPLUS ® | (Cont.) |
Counterparty | Settlement Month | Currency to be Delivered | Currency to be Received | Unrealized Appreciation/ (Depreciation) | ||||||||||||||||||||
Asset | Liability | |||||||||||||||||||||||
AZD | 07/2023 | AUD | 15 | $ | 10 | $ | 0 | $ | 0 | |||||||||||||||
| 08/2023 | $ | 10 | AUD | 15 | 0 | 0 | ||||||||||||||||||
BOA | 07/2023 | GBP | 73 | $ | 92 | 0 | (1 | ) | ||||||||||||||||
| 09/2023 | TWD | 3,244 | 107 | 2 | 0 | |||||||||||||||||||
BPS | 07/2023 | $ | 12,131 | EUR | 11,073 | 0 | (48 | ) | ||||||||||||||||
| 08/2023 | EUR | 10,636 | $ | 11,670 | 48 | 0 | ||||||||||||||||||
| 08/2023 | TWD | 1,752 | 57 | 1 | 0 | |||||||||||||||||||
| 08/2023 | $ | 47 | EUR | 43 | 0 | 0 | ||||||||||||||||||
| 09/2023 | 109 | IDR | 1,634,742 | 0 | 0 | |||||||||||||||||||
BRC | 09/2023 | IDR | 2,924 | $ | 0 | 0 | 0 | |||||||||||||||||
CBK | 07/2023 | CAD | 173 | 127 | 0 | (4 | ) | |||||||||||||||||
| 07/2023 | $ | 158 | EUR | 147 | 3 | 0 | ||||||||||||||||||
| 08/2023 | TWD | 1,563 | $ | 51 | 1 | 0 | ||||||||||||||||||
| 08/2023 | $ | 8 | AUD | 12 | 0 | 0 | ||||||||||||||||||
DUB | 07/2023 | BRL | 307 | $ | 64 | 0 | 0 | |||||||||||||||||
| 07/2023 | $ | 57 | BRL | 307 | 8 | 0 | ||||||||||||||||||
GLM | 07/2023 | BRL | 2,136 | $ | 443 | 0 | (3 | ) | ||||||||||||||||
| 07/2023 | $ | 442 | BRL | 2,136 | 4 | 0 | ||||||||||||||||||
| 08/2023 | CHF | 20 | $ | 23 | 0 | 0 | ||||||||||||||||||
| 09/2023 | BRL | 2,159 | 442 | 0 | (4 | ) | ||||||||||||||||||
| 09/2023 | $ | 353 | TWD | 10,739 | 0 | (5 | ) | |||||||||||||||||
JPM | 08/2023 | CHF | 30 | $ | 34 | 1 | 0 | |||||||||||||||||
| 09/2023 | IDR | 5,229 | 0 | 0 | 0 | |||||||||||||||||||
MBC | 07/2023 | EUR | 189 | 204 | 0 | (3 | ) | |||||||||||||||||
| 07/2023 | GBP | 948 | 1,173 | 0 | (30 | ) | ||||||||||||||||||
| 07/2023 | $ | 782 | EUR | 713 | 0 | (4 | ) | |||||||||||||||||
| 07/2023 | 133 | GBP | 107 | 3 | 0 | |||||||||||||||||||
MYI | 07/2023 | IDR | 44,964 | $ | 3 | 0 | 0 | |||||||||||||||||
| 07/2023 | $ | 3 | IDR | 44,964 | 0 | 0 | ||||||||||||||||||
| 08/2023 | JPY | 13,900 | $ | 99 | 2 | 0 | ||||||||||||||||||
| 08/2023 | TWD | 1,747 | 58 | 1 | 0 | |||||||||||||||||||
| 08/2023 | $ | 1 | TWD | 28 | 0 | 0 | ||||||||||||||||||
| 09/2023 | 63 | IDR | 944,478 | 0 | 0 | |||||||||||||||||||
SCX | 07/2023 | AUD | 22 | $ | 14 | 0 | 0 | |||||||||||||||||
| 07/2023 | $ | 83 | AUD | 124 | 0 | 0 | ||||||||||||||||||
| 08/2023 | 14 | 22 | 0 | 0 | ||||||||||||||||||||
| 08/2023 | 108 | JPY | 15,000 | 0 | (4 | ) | ||||||||||||||||||
| 09/2023 | IDR | 5,177,842 | $ | 348 | 3 | 0 | ||||||||||||||||||
| 09/2023 | TWD | 2,711 | 89 | 1 | 0 | |||||||||||||||||||
| 09/2023 | $ | 185 | IDR | 2,777,279 | 0 | 0 | ||||||||||||||||||
SOG | 07/2023 | AUD | 18 | $ | 12 | 0 | 0 | |||||||||||||||||
| 07/2023 | EUR | 11,031 | 11,866 | 0 | (171 | ) | ||||||||||||||||||
SSB | 09/2023 | $ | 428 | BRL | 2,172 | 20 | 0 | |||||||||||||||||
TOR | 07/2023 | AUD | 27 | $ | 18 | 0 | 0 | |||||||||||||||||
| 07/2023 | BRL | 2,436 | 500 | 0 | (9 | ) | ||||||||||||||||||
| 07/2023 | $ | 505 | BRL | 2,436 | 3 | 0 | ||||||||||||||||||
| 07/2023 | 131 | CAD | 173 | 0 | 0 | |||||||||||||||||||
| 07/2023 | 1,161 | GBP | 914 | 0 | (1 | ) | ||||||||||||||||||
| 08/2023 | CAD | 173 | $ | 131 | 0 | 0 | ||||||||||||||||||
| 08/2023 | GBP | 914 | 1,162 | 1 | 0 | |||||||||||||||||||
| 08/2023 | $ | 18 | AUD | 27 | 0 | 0 | ||||||||||||||||||
UAG | 07/2023 | AUD | 31 | $ | 20 | 0 | 0 | |||||||||||||||||
| 08/2023 | $ | 8 | AUD | 13 | 0 | 0 | ||||||||||||||||||
Total Forward Foreign Currency Contracts | $ | 102 | $ | (287 | ) | |||||||||||||||||||
48 | PIMCO CLOSED-END FUNDS | See Accompanying Notes |
| June 30, 2023 |
Counterparty | Reference Obligation | Fixed Receive Rate | Payment Frequency | Maturity Date | Notional Amount (3) | Premiums Paid/(Received) | Unrealized Appreciation/ (Depreciation) | Swap Agreements, at Value (4) | ||||||||||||||||||||||||||||
Asset | Liability | |||||||||||||||||||||||||||||||||||
| BOA | Long Beach Mortgage Loan Trust 6.584% due 07/25/2033 | 6.250% | Monthly | 07/25/2033 | $ | 100 | $ | 0 | $ | 1 | $ | 1 | $ | 0 | ||||||||||||||||||||||
Counterparty | Reference Entity | Fixed Receive Rate | Payment Frequency | Maturity Date | Implied Credit Spread at June 30, 2023 (2) | Notional Amount (3) | Premiums Paid/(Received) | Unrealized Appreciation/ (Depreciation) | Swap Agreements, at Value (4) | |||||||||||||||||||||||||||||||
Asset | Liability | |||||||||||||||||||||||||||||||||||||||
| DUB | Eskom « | 4.650% | Quarterly | 06/30/2029 | 0.031% | $ | 400 | $ | 0 | $ | 17 | $ | 17 | $ | 0 | |||||||||||||||||||||||||
Counterparty | Index/Tranches | Fixed Receive Rate | Payment Frequency | Maturity Date | Notional Amount (3) | Premiums Paid/(Received) | Unrealized Appreciation/ (Depreciation) | Swap Agreements, at Value (4) | ||||||||||||||||||||||||||||
Asset | Liability | |||||||||||||||||||||||||||||||||||
| GST | ABX.HE.AA.6-1 Index « | 0.320 | % | Monthly | 07/25/2045 | $ | 751 | $ | (150 | ) | $ | 98 | $ | 0 | $ | (52 | ) | |||||||||||||||||||
ABX.HE.PENAAA.7-1 Index « | 0.090 | Monthly | 08/25/2037 | 505 | (222 | ) | 146 | 0 | (76 | ) | ||||||||||||||||||||||||||
| $ | (372 | ) | $ | 244 | $ | 0 | $ | (128 | ) | |||||||||||||||||||||||||||
Counterparty | Pay/Receive (5) | Underlying Reference | # of Units | Financing Rate | Payment Frequency | Maturity Date | Notional Amount | Premiums Paid/(Received) | Unrealized Appreciation/ (Depreciation) | Swap Agreements, at Value | ||||||||||||||||||||||||||||||
Asset | Liability | |||||||||||||||||||||||||||||||||||||||
| JPM | Receive | NDDUEAFE Index | 79 | 5.040% (1-Month USD-LIBOR less a specified spread) | Monthly | 05/08/2024 | $ | 581 | $ | 0 | $ | (2 | ) | $ | 0 | $ | (2 | ) | ||||||||||||||||||||||
| MYI | Receive | NDDUEAFE Index | 5,530 | 5.050% (1-Month USD-LIBOR less a specified spread) | Maturity | 11/15/2023 | 30,860 | 0 | 8,816 | 8,816 | 0 | |||||||||||||||||||||||||||||
Receive | NDDUEAFE Index | 32 | 5.090% (1-Month USD-LIBOR plus a specified spread) | Monthly | 04/24/2024 | 235 | 0 | (1 | ) | 0 | (1 | ) | ||||||||||||||||||||||||||||
| $ | 0 | $ | 8,813 | $ | 8,816 | $ | (3 | ) | ||||||||||||||||||||||||||||||||
Total Swap Agreements | $ | (372 | ) | $ | 9,075 | $ | 8,834 | $ | (131 | ) | ||||||||||||||||||||||||||||||
Financial Derivative Assets | Financial Derivative Liabilities | |||||||||||||||||||||||||||||||||||||||||||||||
Counterparty | Forward Foreign Currency Contracts | Purchased Options | Swap Agreements | Total Over the Counter | Forward Foreign Currency Contracts | Written Options | Swap Agreements | Total Over the Counter | Net Market Value of OTC Derivatives | Collateral Pledged/ (Received) | Net Exposure (6) | |||||||||||||||||||||||||||||||||||||
BOA | $ | 2 | $ | 0 | $ | 1 | $ | 3 | $ | (1 | ) | $ | 0 | $ | 0 | $ | (1 | ) | $ | 2 | $ | 0 | $ | 2 | ||||||||||||||||||||||||
BPS | 49 | 0 | 0 | 49 | (48 | ) | 0 | 0 | (48 | ) | 1 | 0 | 1 | |||||||||||||||||||||||||||||||||||
CBK | 4 | 0 | 0 | 4 | (4 | ) | 0 | 0 | (4 | ) | 0 | 0 | 0 | |||||||||||||||||||||||||||||||||||
DUB | 8 | 0 | 17 | 25 | 0 | 0 | 0 | 0 | 25 | 0 | 25 | |||||||||||||||||||||||||||||||||||||
GLM | 4 | 0 | 0 | 4 | (12 | ) | 0 | 0 | (12 | ) | (8 | ) | 0 | (8 | ) | |||||||||||||||||||||||||||||||||
GST | 0 | 0 | 0 | 0 | 0 | 0 | (128 | ) | (128 | ) | (128 | ) | 226 | 98 | ||||||||||||||||||||||||||||||||||
JPM | 1 | 0 | 0 | 1 | 0 | 0 | (2 | ) | (2 | ) | (1 | ) | 0 | (1 | ) | |||||||||||||||||||||||||||||||||
MBC | 3 | 0 | 0 | 3 | (37 | ) | 0 | 0 | (37 | ) | (34 | ) | 0 | (34 | ) | |||||||||||||||||||||||||||||||||
MYI | 3 | 0 | 8,816 | 8,819 | 0 | 0 | (1 | ) | (1 | ) | 8,818 | (8,480 | ) | 338 | ||||||||||||||||||||||||||||||||||
SCX | 4 | 0 | 0 | 4 | (4 | ) | 0 | 0 | (4 | ) | 0 | 0 | 0 | |||||||||||||||||||||||||||||||||||
SOG | 0 | 0 | 0 | 0 | (171 | ) | 0 | 0 | (171 | ) | (171 | ) | 261 | 90 | ||||||||||||||||||||||||||||||||||
SSB | 20 | 0 | 0 | 20 | 0 | 0 | 0 | 0 | 20 | 0 | 20 | |||||||||||||||||||||||||||||||||||||
TOR | 4 | 0 | 0 | 4 | (10 | ) | 0 | 0 | (10 | ) | (6 | ) | 0 | (6 | ) | |||||||||||||||||||||||||||||||||
Total Over the Counter | $ | 102 | $ | 0 | $ | 8,834 | $ | 8,936 | $ | (287 | ) | $ | 0 | $ | (131 | ) | $ | (418 | ) | |||||||||||||||||||||||||||||
| See Accompanying Notes | ANNUAL REPORT | | | JUNE 30, 2023 | 49 |
Schedule of Investments | PIMCO Global StocksPLUS ® | (Cont.) |
(m) | Securities with an aggregate market value of $487 have been pledged as collateral for financial derivative instruments as governed by International Swaps and Derivatives Association, Inc. master agreements as of June 30, 2023. |
(1) | If the Fund is a seller of protection and a credit event occurs, as defined under the terms of that particular swap agreement, the Fund will either (i) pay to the buyer of protection an amount equal to the notional amount of the swap and take delivery of the referenced obligation or underlying securities comprising the referenced index or (ii) pay a net settlement amount in the form of cash, securities or other deliverable obligations equal to the notional amount of the swap less the recovery value of the referenced obligation or underlying securities comprising the referenced index. |
(2) | Implied credit spreads, represented in absolute terms, utilized in determining the market value of credit default swap agreements on corporate issues as of period end serve as indicators of the current status of the payment/performance risk and represent the likelihood or risk of default for the credit derivative. The implied credit spread of a particular referenced entity reflects the cost of buying/selling protection and may include upfront payments required to be made to enter into the agreement. Wider credit spreads represent a deterioration of the referenced entity’s credit soundness and a greater likelihood or risk of default or other credit event occurring as defined under the terms of the agreement. |
(3) | The maximum potential amount the Fund could be required to pay as a seller of credit protection or receive as a buyer of credit protection if a credit event occurs as defined under the terms of that particular swap agreement. |
(4) | The prices and resulting values for credit default swap agreements serve as indicators of the current status of the payment/performance risk and represent the likelihood of an expected liability (or profit) for the credit derivative should the notional amount of the swap agreement be closed/sold as of the period end. Increasing market values, in absolute terms when compared to the notional amount of the swap, represent a deterioration of the underlying referenced instrument’s credit soundness and a greater likelihood or risk of default or other credit event occurring as defined under the terms of the agreement. |
(5) | Receive represents that the Fund receives payments for any positive net return on the underlying reference. The Fund makes payments for any negative net return on such underlying reference. Pay represents that the Fund receives payments for any negative net return on the underlying reference. The Fund makes payments for any positive net return on such underlying reference. |
(6) | Net Exposure represents the net receivable/(payable) that would be due from/to the counterparty in the event of default. Exposure from OTC financial derivative instruments can only be netted across transactions governed under the same master agreement with the same legal entity. See Note 8, Master Netting Arrangements, in the Notes to Financial Statements for more information. |
Derivatives not accounted for as hedging instruments | ||||||||||||||||||||||||
Commodity Contracts | Credit Contracts | Equity Contracts | Foreign Exchange Contracts | Interest Rate Contracts | Total | |||||||||||||||||||
Financial Derivative Instruments - Assets | ||||||||||||||||||||||||
Exchange-traded or centrally cleared | ||||||||||||||||||||||||
Purchased Options | $ | 0 | $ | 0 | $ | 38 | $ | 0 | $ | 0 | $ | 38 | ||||||||||||
Futures | 0 | 0 | 493 | 0 | 1 | 494 | ||||||||||||||||||
Swap Agreements | 0 | 0 | 0 | 0 | 76 | 76 | ||||||||||||||||||
| $ | 0 | $ | 0 | $ | 531 | $ | 0 | $ | 77 | $ | 608 | |||||||||||||
Over the counter | ||||||||||||||||||||||||
Forward Foreign Currency Contracts | $ | 0 | $ | 0 | $ | 0 | $ | 102 | $ | 0 | $ | 102 | ||||||||||||
Swap Agreements | 0 | 18 | 8,816 | 0 | 0 | 8,834 | ||||||||||||||||||
| $ | 0 | $ | 18 | $ | 8,816 | $ | 102 | $ | 0 | $ | 8,936 | |||||||||||||
| $ | 0 | $ | 18 | $ | 9,347 | $ | 102 | $ | 77 | $ | 9,544 | |||||||||||||
Financial Derivative Instruments - Liabilities | ||||||||||||||||||||||||
Exchange-traded or centrally cleared | ||||||||||||||||||||||||
Written Options | $ | 0 | $ | 0 | $ | 583 | $ | 0 | $ | 0 | $ | 583 | ||||||||||||
Futures | 0 | 0 | 0 | 0 | 1 | 1 | ||||||||||||||||||
Swap Agreements | 0 | 0 | 0 | 0 | 151 | 151 | ||||||||||||||||||
| $ | 0 | $ | 0 | $ | 583 | $ | 0 | $ | 152 | $ | 735 | |||||||||||||
Over the counter | ||||||||||||||||||||||||
Forward Foreign Currency Contracts | $ | 0 | $ | 0 | $ | 0 | $ | 287 | $ | 0 | $ | 287 | ||||||||||||
Swap Agreements | 0 | 128 | 3 | 0 | 0 | 131 | ||||||||||||||||||
| $ | 0 | $ | 128 | $ | 3 | $ | 287 | $ | 0 | $ | 418 | |||||||||||||
| $ | 0 | $ | 128 | $ | 586 | $ | 287 | $ | 152 | $ | 1,153 | |||||||||||||
50 | PIMCO CLOSED-END FUNDS | See Accompanying Notes |
| June 30, 2023 |
Derivatives not accounted for as hedging instruments | ||||||||||||||||||||||||
Commodity Contracts | Credit Contracts | Equity Contracts | Foreign Exchange Contracts | Interest Rate Contracts | Total | |||||||||||||||||||
Net Realized Gain (Loss) on Financial Derivative Instruments | ||||||||||||||||||||||||
Exchange-traded or centrally cleared | ||||||||||||||||||||||||
Purchased Options | $ | 0 | $ | 0 | $ | (3,144 | ) | $ | 0 | $ | 0 | $ | (3,144 | ) | ||||||||||
Written Options | 0 | 0 | (2,344 | ) | 0 | 0 | (2,344 | ) | ||||||||||||||||
Futures | 0 | 0 | 3,647 | 0 | 0 | 3,647 | ||||||||||||||||||
Swap Agreements | 0 | 254 | 0 | 0 | (118 | ) | 136 | |||||||||||||||||
| $ | 0 | $ | 254 | $ | (1,841 | ) | $ | 0 | $ | (118 | ) | $ | (1,705 | ) | ||||||||||
Over the counter | ||||||||||||||||||||||||
Forward Foreign Currency Contracts | $ | 0 | $ | 0 | $ | 0 | $ | 125 | $ | 0 | $ | 125 | ||||||||||||
Swap Agreements | 0 | (11 | ) | (10,598 | ) | 0 | 0 | (10,609 | ) | |||||||||||||||
| $ | 0 | $ | (11 | ) | $ | (10,598 | ) | $ | 125 | $ | 0 | $ | (10,484 | ) | ||||||||||
| $ | 0 | $ | 243 | $ | (12,439 | ) | $ | 125 | $ | (118 | ) | $ | (12,189 | ) | ||||||||||
Net Change in Unrealized Appreciation (Depreciation) on Financial Derivative Instruments | ||||||||||||||||||||||||
Exchange-traded or centrally cleared | ||||||||||||||||||||||||
Purchased Options | $ | 0 | $ | 0 | $ | 419 | $ | 0 | $ | 0 | $ | 419 | ||||||||||||
Written Options | 0 | 0 | 375 | 0 | 0 | 375 | ||||||||||||||||||
Futures | 0 | 0 | 2,098 | 0 | 111 | 2,209 | ||||||||||||||||||
Swap Agreements | 0 | 77 | 0 | 0 | 695 | 772 | ||||||||||||||||||
| $ | 0 | $ | 77 | $ | 2,892 | $ | 0 | $ | 806 | $ | 3,775 | |||||||||||||
Over the counter | ||||||||||||||||||||||||
Forward Foreign Currency Contracts | $ | 0 | $ | 0 | $ | 0 | $ | (233 | ) | $ | 0 | $ | (233 | ) | ||||||||||
Swap Agreements | 0 | (34 | ) | 15,775 | 0 | 0 | 15,741 | |||||||||||||||||
| $ | 0 | $ | (34 | ) | $ | 15,775 | $ | (233 | ) | $ | 0 | $ | 15,508 | |||||||||||
| $ | 0 | $ | 43 | $ | 18,667 | $ | (233 | ) | $ | 806 | $ | 19,283 | ||||||||||||
Category and Subcategory | Level 1 | Level 2 | Level 3 | Fair Value at 06/30/2023 | ||||||||||||
Investments in Securities, at Value | ||||||||||||||||
Loan Participations and Assignments | $ | 0 | $ | 12,174 | $ | 8,723 | $ | 20,897 | ||||||||
Corporate Bonds & Notes | ||||||||||||||||
Banking & Finance | 0 | 9,880 | 213 | 10,093 | ||||||||||||
Industrials | 0 | 16,944 | 0 | 16,944 | ||||||||||||
Utilities | 0 | 2,445 | 0 | 2,445 | ||||||||||||
Convertible Bonds & Notes | ||||||||||||||||
Banking & Finance | 0 | 16 | 0 | 16 | ||||||||||||
Industrials | 0 | 307 | 0 | 307 | ||||||||||||
Municipal Bonds & Notes | ||||||||||||||||
Puerto Rico | 0 | 293 | 0 | 293 | ||||||||||||
West Virginia | 0 | 832 | 0 | 832 | ||||||||||||
U.S. Government Agencies | 0 | 41,523 | 0 | 41,523 | ||||||||||||
Non-Agency Mortgage-Backed Securities | 0 | 13,120 | 1,250 | 14,370 | ||||||||||||
Asset-Backed Securities | 0 | 4,495 | 1,396 | 5,891 | ||||||||||||
Sovereign Issues | 0 | 2,083 | 0 | 2,083 | ||||||||||||
Common Stocks | ||||||||||||||||
Communication Services | 218 | 0 | 58 | 276 | ||||||||||||
Energy | 0 | 0 | 15 | 15 | ||||||||||||
Financials | 310 | 0 | 789 | 1,099 | ||||||||||||
Industrials | 0 | 0 | 1,000 | 1,000 | ||||||||||||
Real Estate | 2 | 0 | 0 | 2 | ||||||||||||
Rights | ||||||||||||||||
Financials | 0 | 0 | 18 | 18 | ||||||||||||
Warrants | ||||||||||||||||
Financials | 0 | 0 | 26 | 26 | ||||||||||||
Information Technology | 0 | 0 | 805 | 805 | ||||||||||||
Preferred Securities | ||||||||||||||||
Financials | 0 | 3,271 | 0 | 3,271 | ||||||||||||
Industrials | 0 | 0 | 545 | 545 | ||||||||||||
Category and Subcategory | Level 1 | Level 2 | Level 3 | Fair Value at 06/30/2023 | ||||||||||||
Real Estate Investment Trusts | ||||||||||||||||
Real Estate | $ | 214 | $ | 0 | $ | 0 | $ | 214 | ||||||||
Short-Term Instruments | ||||||||||||||||
Repurchase Agreements | 0 | 16,277 | 0 | 16,277 | ||||||||||||
Argentina Treasury Bills | 0 | 173 | 0 | 173 | ||||||||||||
U.S. Treasury Bills | 0 | 920 | 0 | 920 | ||||||||||||
Total Investments | $ | 744 | $ | 124,753 | $ | 14,838 | $ | 140,335 | ||||||||
Short Sales, at Value - Liabilities | ||||||||||||||||
U.S. Government Agencies | $ | 0 | $ | (653 | ) | $ | 0 | $ | (653 | ) | ||||||
Financial Derivative Instruments - Assets | ||||||||||||||||
Exchange-traded or centrally cleared | 531 | 77 | 0 | 608 | ||||||||||||
Over the counter | 0 | 8,919 | 17 | 8,936 | ||||||||||||
| $ | 531 | $ | 8,996 | $ | 17 | $ | 9,544 | |||||||||
Financial Derivative Instruments - Liabilities | ||||||||||||||||
Exchange-traded or centrally cleared | (583 | ) | (152 | ) | 0 | (735 | ) | |||||||||
Over the counter | 0 | (290 | ) | (128 | ) | (418 | ) | |||||||||
| $ | (583 | ) | $ | (442 | ) | $ | (128 | ) | $ | (1,153 | ) | |||||
Total Financial Derivative Instruments | $ | (52 | ) | $ | 8,554 | $ | (111 | ) | $ | 8,391 | ||||||
Totals | $ | 692 | $ | 132,654 | $ | 14,727 | $ | 148,073 | ||||||||
| See Accompanying Notes | ANNUAL REPORT | | | JUNE 30, 2023 | 51 |
Schedule of Investments | PIMCO Global StocksPLUS ® | (Cont.) |
Category and Subcategory | Beginning Balance at 06/30/2022 | Net Purchases (1) | Net Sales/ Settlements (1) | Accrued Discounts/ (Premiums) | Realized Gain/(Loss) | Net Change in Unrealized Appreciation/ (Depreciation) (2) | Transfers into Level 3 | Transfers out of Level 3 | Ending Balance at 06/30/2023 | Net Change in Unrealized Appreciation/ (Depreciation) on Investments Held at 06/30/2023 (2) | ||||||||||||||||||||||||||||||
Investments in Securities, at Value | ||||||||||||||||||||||||||||||||||||||||
Loan Participations and Assignments | $ | 6,807 | $ | 4,263 | $ | (1,905 | ) | $ | 37 | $ | (1,221 | ) | $ | 930 | $ | 0 | $ | (188 | ) | $ | 8,723 | $ | (109 | ) | ||||||||||||||||
Corporate Bonds & Notes | ||||||||||||||||||||||||||||||||||||||||
Banking & Finance | 1,226 | 157 | (1,188 | ) | 0 | 88 | (70 | ) | 0 | 0 | 213 | 56 | ||||||||||||||||||||||||||||
Industrials | 5,751 | 95 | 0 | 23 | 0 | (519 | ) | 0 | (5,350 | ) | 0 | 0 | ||||||||||||||||||||||||||||
Non-Agency Mortgage-Backed Securities | 0 | 0 | 0 | 0 | 0 | 0 | 1,250 | 0 | 1,250 | 0 | ||||||||||||||||||||||||||||||
Asset-Backed Securities | 3,532 | 0 | (1,629 | ) | 0 | (60 | ) | (491 | ) | 44 | 0 | 1,396 | (575 | ) | ||||||||||||||||||||||||||
Common Stocks | ||||||||||||||||||||||||||||||||||||||||
Communication Services | 126 | 0 | 0 | 0 | 0 | (68 | ) | 0 | 0 | 58 | (68 | ) | ||||||||||||||||||||||||||||
Energy | 8 | 0 | 0 | 0 | 0 | 7 | 0 | 0 | 15 | 8 | ||||||||||||||||||||||||||||||
Financials | 960 | 0 | 0 | 0 | 0 | (171 | ) | 0 | 0 | 789 | (171 | ) | ||||||||||||||||||||||||||||
Industrials | 372 | 400 | 0 | 0 | (3 | ) | 231 | 0 | 0 | 1,000 | 231 | |||||||||||||||||||||||||||||
Materials | 23 | 0 | (25 | ) | 0 | 25 | (23 | ) | 0 | 0 | 0 | 0 | ||||||||||||||||||||||||||||
Rights | ||||||||||||||||||||||||||||||||||||||||
Financials | 17 | 1 | 0 | 0 | 0 | 0 | 0 | 0 | 18 | 0 | ||||||||||||||||||||||||||||||
Warrants | ||||||||||||||||||||||||||||||||||||||||
Financials | 19 | 0 | 0 | 0 | 0 | 7 | 0 | 0 | 26 | 8 | ||||||||||||||||||||||||||||||
Industrials | 72 | 0 | (15 | ) | 0 | 15 | (72 | ) | 0 | 0 | 0 | 0 | ||||||||||||||||||||||||||||
Information Technology | 1,120 | 0 | 0 | 0 | 0 | (315 | ) | 0 | 0 | 805 | (316 | ) | ||||||||||||||||||||||||||||
Preferred Securities | ||||||||||||||||||||||||||||||||||||||||
Industrials | 5,079 | 0 | (5,229 | ) | 0 | 2,994 | (2,299 | ) | 0 | 0 | 545 | (138 | ) | |||||||||||||||||||||||||||
| $ | 25,112 | $ | 4,916 | $ | (9,991 | ) | $ | 60 | $ | 1,838 | $ | (2,853 | ) | $ | 1,294 | $ | (5,538 | ) | $ | 14,838 | $ | (1,074 | ) | |||||||||||||||||
Financial Derivative Instruments- Assets | ||||||||||||||||||||||||||||||||||||||||
Over the counter | $ | 0 | $ | 0 | $ | 0 | $ | 0 | $ | 0 | $ | 17 | $ | 0 | $ | 0 | $ | 17 | $ | 17 | ||||||||||||||||||||
Financial Derivative Instruments- Liabilities | ||||||||||||||||||||||||||||||||||||||||
Over the counter | $ | 0 | $ | (27 | ) | $ | (32 | ) | $ | 0 | $ | 0 | $ | 59 | $ | (128 | ) | $ | 0 | $ | (128 | ) | $ | 27 | ||||||||||||||||
Totals | $ | 25,112 | $ | 4,889 | $ | (10,023 | ) | $ | 60 | $ | 1,838 | $ | (2,777 | ) | $ | 1,166 | $ | (5,538 | ) | $ | 14,727 | $ | (1,030 | ) | ||||||||||||||||
Category and Subcategory | Ending Balance at 06/30/2023 | Valuation Technique | Unobservable Inputs | (% Unless Noted Otherwise) | ||||||||||||||||
Input Value(s) | Weighted Average | |||||||||||||||||||
Investments in Securities, at Value | ||||||||||||||||||||
Loan Participations and Assignments | $ | 1,952 | Comparable Multiple | EBITDA Multiple | X | 11.000 | — | |||||||||||||
| 781 | Discounted Cash Flow | Discount Rate | 9.000 | — | ||||||||||||||||
| 1,445 | Expect Recovery Valuation | Comparable Bond Price | 60.000 | — | ||||||||||||||||
| 216 | Other Valuation Techniques (3) | — | — | — | ||||||||||||||||
| 2,174 | Proxy Pricing | Base Price | 100.000-100.523 | 100.476 | ||||||||||||||||
| 1,069 | Recent Transaction | Price | 98.000 | — | ||||||||||||||||
| 1,086 | Recent Transaction | Purchase Price | 100.000 | — | ||||||||||||||||
Corporate Bonds & Notes | ||||||||||||||||||||
Banking & Finance | 213 | Other Valuation Techniques (3) | — | — | — | |||||||||||||||
Non-Agency Mortgage-Backed Securities | 1,250 | Fair Valuation of Odd Lot Positions | Adjustment Factor | 2.500 | — | |||||||||||||||
Asset-Backed Securities | 1,352 | Discounted Cash Flow | Discount Rate | 10.000-14.000 | 11.897 | |||||||||||||||
| 44 | Fair Valuation of Odd Lot Positions | Adjustment Factor | 2.500 | — | ||||||||||||||||
Common Stocks | ||||||||||||||||||||
Communication Services | 58 | Adjusted Market Price | Adjustment Factor | 10.000 | — | |||||||||||||||
Energy | 15 | Comparable Multiple | LTM EBITDA Multiple | X | 3.300 | — | ||||||||||||||
Financials | 1 | Option Pricing Model | Volatility | 56.314 | — | |||||||||||||||
| 788 | Indicative Market Quotation | Broker Quote | $ | 23.000 | — | |||||||||||||||
Industrials | 78 | Comparable Multiple/ Discounted Cash Flow | LTM Revenue Forward EBITDA/Discount Rate | X/X/% | 0.550/6.010/9.750 | — | ||||||||||||||
| 301 | Discounted Cash Flow | Discount Rate | 14.975 | — | ||||||||||||||||
| 100 | Expect Recovery Valuation | Breakeven Price | $ | 19.199 | — | |||||||||||||||
| 164 | Indicative Market Quotation | Broker Quote | $ | 19.500 | — | |||||||||||||||
| 269 | Other Valuation Techniques (3) | — | — | — | ||||||||||||||||
| 88 | Recent Transaction | Purchase Price | $ | 6.625 | — | |||||||||||||||
52 | PIMCO CLOSED-END FUNDS | See Accompanying Notes |
| June 30, 2023 |
Category and Subcategory | Ending Balance at 06/30/2023 | Valuation Technique | Unobservable Inputs | (% Unless Noted Otherwise) | ||||||||||||||||
Input Value(s) | Weighted Average | |||||||||||||||||||
Rights | ||||||||||||||||||||
Financials | 18 | Indicative Market Quotation | Broker Quote | $ | 4.750 | — | ||||||||||||||
Warrants | ||||||||||||||||||||
Financials | 26 | Indicative Market Quotation | Broker Quote | $ | 0.750-7.250 | 7.173 | ||||||||||||||
Information Technology | 805 | Comparable Multiple | EBITDA Multiple | X | 4.590 | — | ||||||||||||||
Preferred Securities | ||||||||||||||||||||
Industrials | 545 | Comparable Multiple/ Discounted Cash Flow | Book Value Multiple/ Discount Rate | X/% | 0.350/27.749 | — | ||||||||||||||
Financial Derivative Instruments- Assets | ||||||||||||||||||||
Over the counter | 17 | Indicative Market Quotation | Broker Quote | 3.092 | — | |||||||||||||||
Financial Derivative Instruments- Liabilities | ||||||||||||||||||||
Over the counter | (128 | ) | Other Valuation Techniques (3) | — | — | — | ||||||||||||||
Total | $ | 14,727 | ||||||||||||||||||
(1) | Net Purchases and Settlements for Financial Derivative Instruments may include payments made or received upon entering into swap agreements to compensate for differences between the stated terms of the swap agreement and prevailing market conditions. |
(2) | Any difference between Net Change in Unrealized Appreciation/(Depreciation) and Net Change in Unrealized Appreciation/(Depreciation) on Investments Held at June 30, 2023 may be due to an investment no longer held or categorized as Level 3 at period end. |
(3) | Includes valuation techniques not defined in the Notes to Financial Statements as securities valued using such techniques are not considered significant to the Fund. |
| See Accompanying Notes | ANNUAL REPORT | | | JUNE 30, 2023 | 53 |
Schedule of Investments | PIMCO Strategic Income Fund, Inc. |
PRINCIPAL AMOUNT (000S) | MARKET VALUE (000S) | |||||||||||
INVESTMENTS IN SECURITIES 276.3% | ||||||||||||
LOAN PARTICIPATIONS AND ASSIGNMENTS 21.9% | ||||||||||||
Altar Bidco, Inc. | ||||||||||||
10.493% due 02/01/2030 | $ | 700 | $ | 623 | ||||||||
Diamond Sports Group LLC | ||||||||||||
13.064% due 05/25/2026 | 3,121 | 2,416 | ||||||||||
Envision Healthcare Corp. | ||||||||||||
16.070% due 04/29/2027 | 2,877 | 3,431 | ||||||||||
16.695% due 04/28/2028 « | 6,960 | 5,265 | ||||||||||
Forbes Energy Services LLC | ||||||||||||
TBD% due 12/31/2023 « | 66 | 0 | ||||||||||
Gateway Casinos & Entertainment Ltd. | ||||||||||||
13.050% due 10/18/2027 | CAD | 578 | 436 | |||||||||
13.221% due 10/15/2027 | $ | 2,655 | 2,656 | |||||||||
Incora | ||||||||||||
TBD% - 13.725% due 03/01/2024 «µ | 2,647 | 2,647 | ||||||||||
Instant Brands Holdings, Inc. | ||||||||||||
TBD% (LIBOR03M + 0.000%) due 04/12/2028 ^~(c) | 2,401 | 523 | ||||||||||
15.217% due 12/12/2023 « | 933 | 863 | ||||||||||
Intelsat Jackson Holdings SA | ||||||||||||
9.443% due 02/01/2029 | 1,221 | 1,217 | ||||||||||
Lealand Finance Co. BV | ||||||||||||
8.217% due 06/28/2024 | 28 | 22 | ||||||||||
Lealand Finance Co. BV (6.193% Cash and 3.000% PIK) | ||||||||||||
9.193% (LIBOR01M + 1.000%) due 06/30/2025 ~(b) | 193 | 112 | ||||||||||
Market Bidco Ltd. | ||||||||||||
8.991% due 11/04/2027 | GBP | 2,749 | 3,068 | |||||||||
NAC Aviation 29 DAC | ||||||||||||
7.501% due 06/30/2026 | $ | 453 | 403 | |||||||||
Oi SA | ||||||||||||
TBD% - 14.000% due 09/07/2024 µ | 401 | 401 | ||||||||||
Poseidon Bidco SASU | ||||||||||||
8.848% (EUR003M + 5.250%) due 07/14/2028 «~ | EUR | 2,400 | 2,567 | |||||||||
Promotora de Informaciones SA | ||||||||||||
8.439% (EUR003M + 5.220%) due 12/31/2026 ~ | 3,792 | 3,897 | ||||||||||
Promotora de Informaciones SA (6.189% Cash and 5.000% PIK) | ||||||||||||
11.189% (EUR003M + 2.970%) due 06/30/2027 «~(b) | 553 | 550 | ||||||||||
PUG LLC | ||||||||||||
8.717% (LIBOR01M + 3.500%) due 02/12/2027 ~ | $ | 15 | 14 | |||||||||
Softbank Vision Fund | ||||||||||||
5.000% due 12/21/2025 « | 1,761 | 1,648 | ||||||||||
Steenbok Lux Finco 2 SARL | ||||||||||||
10.000% due 06/30/2026 « | EUR | 10,083 | 5,537 | |||||||||
Syniverse Holdings, Inc. | ||||||||||||
12.242% due 05/13/2027 | $ | 3,685 | 3,390 | |||||||||
Team Health Holdings, Inc. | ||||||||||||
7.943% (LIBOR01M + 2.750%) due 02/06/2024 ~ | 1,644 | 1,462 | ||||||||||
U.S. Renal Care, Inc. | ||||||||||||
10.193% (LIBOR01M + 5.000%) due 06/26/2026 ~ | 54 | 25 | ||||||||||
Westmoreland Mining Holdings LLC | ||||||||||||
8.000% due 03/15/2029 | 6 | 5 | ||||||||||
Windstream Services LLC | ||||||||||||
11.452% due 09/21/2027 | 16 | 15 | ||||||||||
Total Loan Participations and Assignments (Cost $49,133) | 43,193 | |||||||||||
CORPORATE BONDS & NOTES 45.5% | ||||||||||||
BANKING & FINANCE 21.9% | ||||||||||||
Agps Bondco PLC | ||||||||||||
4.625% due 01/14/2026 ^(c) | EUR | 2,200 | 937 | |||||||||
PRINCIPAL AMOUNT (000S) | MARKET VALUE (000S) | |||||||||||
Armor Holdco, Inc. | ||||||||||||
8.500% due 11/15/2029 (j) | $ | 2,400 | $ | 1,994 | ||||||||
Banca Monte dei Paschi di Siena SpA | ||||||||||||
1.875% due 01/09/2026 | EUR | 400 | 389 | |||||||||
2.625% due 04/28/2025 | 2,100 | 2,151 | ||||||||||
7.677% due 01/18/2028 • | 400 | 368 | ||||||||||
8.000% due 01/22/2030 • | 1,304 | 1,279 | ||||||||||
8.500% due 09/10/2030 • | 400 | 395 | ||||||||||
10.500% due 07/23/2029 | 1,360 | 1,476 | ||||||||||
Banco de Credito del Peru SA | ||||||||||||
4.650% due 09/17/2024 | PEN | 400 | 106 | |||||||||
Barclays PLC | ||||||||||||
2.894% due 11/24/2032 • | $ | 200 | 158 | |||||||||
6.224% due 05/09/2034 •(j) | 2,800 | 2,791 | ||||||||||
7.437% due 11/02/2033 •(j) | 800 | 866 | ||||||||||
CaixaBank SA | ||||||||||||
6.208% due 01/18/2029 •(j) | 1,200 | 1,198 | ||||||||||
CBRE Services, Inc. | ||||||||||||
5.950% due 08/15/2034 | 2,700 | 2,668 | ||||||||||
Corestate Capital Holding SA | ||||||||||||
3.500% due 07/31/2023 ^(c) | EUR | 600 | 93 | |||||||||
Country Garden Holdings Co. Ltd. | ||||||||||||
5.400% due 05/27/2025 | $ | 1,000 | 370 | |||||||||
6.150% due 09/17/2025 | 200 | 66 | ||||||||||
Credit Suisse AG AT1 Claim ^ | 600 | 24 | ||||||||||
Deutsche Bank AG | ||||||||||||
3.547% due 09/18/2031 • | 300 | 249 | ||||||||||
6.720% due 01/18/2029 •(j) | 600 | 601 | ||||||||||
Essential Properties LP | ||||||||||||
2.950% due 07/15/2031 | 100 | 75 | ||||||||||
Fairfax India Holdings Corp. | ||||||||||||
5.000% due 02/26/2028 | 2,400 | 2,076 | ||||||||||
HSBC Holdings PLC | ||||||||||||
2.804% due 05/24/2032 • | 200 | 162 | ||||||||||
6.254% due 03/09/2034 •(j) | 3,000 | 3,077 | ||||||||||
Hudson Pacific Properties LP | ||||||||||||
4.650% due 04/01/2029 | 100 | 71 | ||||||||||
5.950% due 02/15/2028 | 100 | 80 | ||||||||||
NatWest Group PLC | ||||||||||||
6.016% due 03/02/2034 •(j) | 1,700 | 1,710 | ||||||||||
Societe Generale SA | ||||||||||||
6.446% due 01/10/2029 •(j) | 2,000 | 2,005 | ||||||||||
6.691% due 01/10/2034 •(j) | 3,500 | 3,566 | ||||||||||
SVB Financial Group | ||||||||||||
1.800% due 02/02/2031 ^(c) | 502 | 319 | ||||||||||
2.100% due 05/15/2028 ^(c) | 100 | 68 | ||||||||||
4.570% due 04/29/2033 ^(c) | 600 | 403 | ||||||||||
UBS Group AG | ||||||||||||
6.373% due 07/15/2026 •(j) | 1,500 | 1,491 | ||||||||||
6.442% due 08/11/2028 •(j) | 3,050 | 3,064 | ||||||||||
UniCredit SpA | ||||||||||||
7.830% due 12/04/2023 (j) | 2,240 | 2,253 | ||||||||||
Uniti Group LP | ||||||||||||
6.000% due 01/15/2030 (j) | 2,738 | 1,858 | ||||||||||
10.500% due 02/15/2028 | 251 | 249 | ||||||||||
VICI Properties LP | ||||||||||||
4.500% due 09/01/2026 (j) | 350 | 331 | ||||||||||
5.750% due 02/01/2027 (j) | 2,000 | 1,959 | ||||||||||
| 42,996 | ||||||||||||
INDUSTRIALS 19.4% | ||||||||||||
Air Canada Pass-Through Trust | ||||||||||||
3.600% due 09/15/2028 (j) | 1,811 | 1,683 | ||||||||||
American Airlines Pass-Through Trust | ||||||||||||
3.000% due 04/15/2030 (j) | 139 | 124 | ||||||||||
3.350% due 04/15/2031 (j) | 875 | 779 | ||||||||||
3.700% due 04/01/2028 (j) | 1,324 | 1,192 | ||||||||||
Carvana Co. | ||||||||||||
10.250% due 05/01/2030 | 900 | 710 | ||||||||||
CDW LLC | ||||||||||||
3.569% due 12/01/2031 (j) | 700 | 592 | ||||||||||
CGG SA | ||||||||||||
7.750% due 04/01/2027 | EUR | 416 | 382 | |||||||||
8.750% due 04/01/2027 (j) | $ | 4,612 | 3,868 | |||||||||
PRINCIPAL AMOUNT (000S) | MARKET VALUE (000S) | |||||||||||
CVS Pass-Through Trust | ||||||||||||
7.507% due 01/10/2032 (j) | $ | 570 | $ | 595 | ||||||||
Exela Intermediate LLC | ||||||||||||
11.500% due 07/15/2026 | 48 | 5 | ||||||||||
Gazprom PJSC Via Gaz Capital SA | ||||||||||||
8.625% due 04/28/2034 ^(c) | 1,710 | 1,529 | ||||||||||
Intelsat Jackson Holdings SA | ||||||||||||
6.500% due 03/15/2030 (j) | 7,256 | 6,624 | ||||||||||
Nissan Motor Co. Ltd. | ||||||||||||
4.810% due 09/17/2030 (j) | 6,000 | 5,267 | ||||||||||
Topaz Solar Farms LLC | ||||||||||||
4.875% due 09/30/2039 | 742 | 683 | ||||||||||
U.S. Renal Care, Inc. | ||||||||||||
10.625% due 07/15/2027 | 4,154 | 1,059 | ||||||||||
United Airlines Pass-Through Trust | ||||||||||||
4.150% due 02/25/2033 | 75 | 69 | ||||||||||
Vale SA | ||||||||||||
3.202% due 12/29/2049 ~(g) | BRL | 50,000 | 3,209 | |||||||||
Wesco Aircraft Holdings, Inc. (7.500% Cash and 3.000% PIK) | ||||||||||||
10.500% due 11/15/2026 ^(b)(c) | $ | 10,800 | 9,828 | |||||||||
| 38,198 | ||||||||||||
UTILITIES 4.2% | ||||||||||||
NGD Holdings BV | ||||||||||||
6.750% due 12/31/2026 | 1,479 | 1,087 | ||||||||||
Oi SA | ||||||||||||
10.000% due 07/27/2025 ^(c) | 3,220 | 233 | ||||||||||
Pacific Gas & Electric Co. | ||||||||||||
3.750% due 08/15/2042 | 100 | 69 | ||||||||||
4.000% due 12/01/2046 (j) | 200 | 134 | ||||||||||
4.200% due 03/01/2029 (j) | 1,300 | 1,170 | ||||||||||
4.200% due 06/01/2041 (j) | 200 | 149 | ||||||||||
4.300% due 03/15/2045 (j) | 950 | 679 | ||||||||||
4.450% due 04/15/2042 | 220 | 167 | ||||||||||
4.750% due 02/15/2044 (j) | 1,492 | 1,160 | ||||||||||
Peru LNG SRL | ||||||||||||
5.375% due 03/22/2030 | 2,800 | 2,256 | ||||||||||
Rio Oil Finance Trust | ||||||||||||
9.250% due 07/06/2024 (j) | 167 | 169 | ||||||||||
Tierra Mojada Luxembourg SARL | ||||||||||||
5.750% due 12/01/2040 (j) | 1,188 | 1,018 | ||||||||||
| 8,291 | ||||||||||||
Total Corporate Bonds & Notes (Cost $107,510) | 89,485 | |||||||||||
CONVERTIBLE BONDS & NOTES 0.1% | ||||||||||||
BANKING & FINANCE 0.1% | ||||||||||||
Corestate Capital Holding SA | ||||||||||||
1.375% due 07/31/2023 ^(c) | EUR | 700 | 111 | |||||||||
Total Convertible Bonds & Notes (Cost $819) | 111 | |||||||||||
MUNICIPAL BONDS & NOTES 2.4% | ||||||||||||
CALIFORNIA 0.9% | ||||||||||||
Golden State, California Tobacco Securitization Corp. Revenue Bonds, Series 2021 | ||||||||||||
3.000% due 06/01/2046 | $ | 80 | 74 | |||||||||
3.487% due 06/01/2036 | 1,000 | 818 | ||||||||||
3.850% due 06/01/2050 | 905 | 821 | ||||||||||
| 1,713 | ||||||||||||
ILLINOIS 0.0% | ||||||||||||
Illinois State General Obligation Bonds, (BABs), Series 2010 | ||||||||||||
6.725% due 04/01/2035 | 14 | 15 | ||||||||||
PUERTO RICO 0.3% | ||||||||||||
Commonwealth of Puerto Rico Bonds, Series 2022 | ||||||||||||
0.000% due 11/01/2043 | 1,092 | 551 | ||||||||||
54 | PIMCO CLOSED-END FUNDS | See Accompanying Notes |
| June 30, 2023 |
PRINCIPAL AMOUNT (000S) | MARKET VALUE (000S) | |||||||||||
WEST VIRGINIA 1.2% | ||||||||||||
Tobacco Settlement Finance Authority, West Virginia Revenue Bonds, Series 2007 | ||||||||||||
0.000% due 06/01/2047 (f) | $ | 25,300 | $ | 2,392 | ||||||||
Total Municipal Bonds & Notes (Cost $5,287) | 4,671 | |||||||||||
U.S. GOVERNMENT AGENCIES 152.4% | ||||||||||||
Fannie Mae | ||||||||||||
0.000% due 02/25/2052 •(a)(j) | 126,067 | 1,423 | ||||||||||
0.000% due 08/25/2054 ~(a)(j) | 4,796 | 192 | ||||||||||
0.850% due 10/25/2049 •(a)(j) | 6,380 | 645 | ||||||||||
0.900% due 02/25/2049 •(a) | 70 | 6 | ||||||||||
0.950% due 07/25/2050 •(a)(j) | 962 | 92 | ||||||||||
1.164% due 12/25/2042 ~(a) | 2,772 | 68 | ||||||||||
1.600% due 07/25/2041 •(a)(j) | 369 | 27 | ||||||||||
2.500% due 12/25/2027 (a)(j) | 747 | 27 | ||||||||||
3.000% due 06/25/2050 (a)(j) | 1,157 | 230 | ||||||||||
3.500% due 07/25/2036 (a)(j) | 3,123 | 347 | ||||||||||
3.500% due 07/25/2042 - 12/25/2049 (a) | 390 | 47 | ||||||||||
4.000% due 06/25/2050 (a)(j) | 615 | 110 | ||||||||||
4.135% due 09/01/2028 • | 2 | 2 | ||||||||||
4.250% due 11/25/2024 (j) | 23 | 23 | ||||||||||
4.320% due 12/01/2028 • | 9 | 9 | ||||||||||
4.325% due 11/01/2027 • | 7 | 6 | ||||||||||
4.500% due 07/25/2040 (j) | 381 | 368 | ||||||||||
4.782% due 02/25/2042 ~ | 249 | 240 | ||||||||||
4.812% due 12/25/2042 ~ | 16 | 15 | ||||||||||
5.000% due 07/25/2037 (a) | 492 | 76 | ||||||||||
5.000% due 01/25/2038 - 07/25/2038 (j) | 2,494 | 2,466 | ||||||||||
5.013% due 09/25/2041 ~ | 181 | 175 | ||||||||||
5.195% due 10/25/2042 ~ | 7 | 7 | ||||||||||
5.500% due 11/25/2032 - 04/25/2035 (j) | 2,597 | 2,587 | ||||||||||
5.637% due 10/25/2042 ~ | 182 | 183 | ||||||||||
5.750% due 06/25/2033 | 11 | 11 | ||||||||||
5.807% due 08/25/2043 | 795 | 778 | ||||||||||
6.000% due 09/25/2031 (j) | 73 | 73 | ||||||||||
6.000% due 01/25/2044 | 553 | 556 | ||||||||||
6.500% due 02/01/2028 - 11/01/2047 | 1,756 | 1,780 | ||||||||||
6.500% due 09/25/2031 - 03/25/2032 (j) | 281 | 284 | ||||||||||
6.850% due 12/18/2027 | 3 | 3 | ||||||||||
7.000% due 06/18/2027 - 01/01/2047 | 445 | 454 | ||||||||||
7.000% due 02/25/2035 (j) | 43 | 44 | ||||||||||
7.500% due 11/25/2026 - 06/25/2044 | 460 | 465 | ||||||||||
7.500% due 06/19/2041 ~ | 59 | 60 | ||||||||||
7.987% due 06/19/2041 ~ | 486 | 516 | ||||||||||
8.500% due 06/18/2027 - 06/25/2030 | 58 | 59 | ||||||||||
10.900% due 07/25/2029 • | 660 | 741 | ||||||||||
Fannie Mae, TBA | ||||||||||||
6.000% due 08/01/2053 | 139,220 | 140,427 | ||||||||||
6.500% due 08/01/2053 | 47,400 | 48,370 | ||||||||||
Freddie Mac | ||||||||||||
0.000% due 08/15/2036 - 11/15/2038 ~(a)(j) | 11,338 | 448 | ||||||||||
0.000% due 11/15/2048 •(a)(j) | 5,342 | 148 | ||||||||||
0.850% due 04/25/2048 - 11/25/2049 •(a)(j) | 27,706 | 3,205 | ||||||||||
1.000% due 05/25/2050 •(a)(j) | 661 | 74 | ||||||||||
2.079% due 11/25/2045 ~(a) | 5,336 | 408 | ||||||||||
3.000% due 11/25/2050 - 01/25/2051 (a)(j) | 9,133 | 1,395 | ||||||||||
3.500% due 05/25/2050 (a) | 520 | 104 | ||||||||||
4.262% due 12/01/2026 • | 2 | 2 | ||||||||||
4.317% due 07/25/2032 ~ | 65 | 61 | ||||||||||
5.500% due 04/01/2039 - 06/15/2041 (j) | 2,167 | 2,215 | ||||||||||
6.000% due 12/15/2028 - 03/15/2035 (j) | 667 | 676 | ||||||||||
6.000% due 04/15/2031 - 02/01/2034 | 67 | 66 | ||||||||||
PRINCIPAL AMOUNT (000S) | MARKET VALUE (000S) | |||||||||||
6.500% due 09/15/2023 - 09/01/2047 | $ | 1,648 | $ | 1,698 | ||||||||
6.500% due 10/15/2023 - 07/15/2032 (j) | 1,203 | 1,225 | ||||||||||
6.500% due 09/25/2043 ~ | 34 | 34 | ||||||||||
6.900% due 09/15/2023 | 1 | 1 | ||||||||||
7.000% due 01/15/2024 - 06/15/2031 (j) | 636 | 650 | ||||||||||
7.000% due 03/15/2024 - 10/25/2043 | 482 | 496 | ||||||||||
7.500% due 05/15/2024 (j) | 11 | 11 | ||||||||||
7.500% due 12/01/2025 - 02/25/2042 | 379 | 382 | ||||||||||
8.000% due 07/01/2024 - 04/15/2030 | 47 | 48 | ||||||||||
10.300% due 10/25/2029 • | 650 | 709 | ||||||||||
12.700% due 12/25/2027 • | 1,426 | 1,455 | ||||||||||
Ginnie Mae | ||||||||||||
0.893% due 08/20/2049 - 09/20/2049 •(a)(j) | 50,638 | 4,912 | ||||||||||
1.054% due 06/20/2047 •(a)(j) | 5,331 | 479 | ||||||||||
6.000% due 04/15/2029 - 12/15/2038 | 524 | 534 | ||||||||||
6.500% due 11/20/2024 - 10/20/2038 | 178 | 182 | ||||||||||
7.000% due 07/15/2025 - 06/15/2026 | 6 | 6 | ||||||||||
7.500% due 10/15/2025 - 03/15/2029 | 220 | 217 | ||||||||||
8.500% due 02/15/2031 | 6 | 6 | ||||||||||
Ginnie Mae, TBA | ||||||||||||
4.000% due 07/01/2053 - 08/01/2053 | 12,000 | 11,443 | ||||||||||
4.500% due 08/01/2053 | 100 | 97 | ||||||||||
U.S. Small Business Administration | ||||||||||||
4.625% due 02/01/2025 | 15 | 14 | ||||||||||
5.510% due 11/01/2027 | 66 | 65 | ||||||||||
5.780% due 08/01/2027 | 4 | 4 | ||||||||||
5.820% due 07/01/2027 | 7 | 6 | ||||||||||
Uniform Mortgage-Backed Security | ||||||||||||
4.000% due 06/01/2047 - 03/01/2048 | 365 | 348 | ||||||||||
4.000% due 09/01/2047 (j) | 5,189 | 4,951 | ||||||||||
4.500% due 09/01/2023 - 08/01/2041 | 124 | 122 | ||||||||||
6.000% due 12/01/2032 - 10/01/2036 | 152 | 155 | ||||||||||
6.000% due 04/01/2035 - 06/01/2040 (j) | 1,755 | 1,820 | ||||||||||
6.500% due 09/01/2028 - 02/01/2038 | 684 | 707 | ||||||||||
8.000% due 12/01/2024 - 11/01/2031 | 63 | 64 | ||||||||||
Uniform Mortgage-Backed Security, TBA | ||||||||||||
6.000% due 09/01/2053 | 52,480 | 52,911 | ||||||||||
Vendee Mortgage Trust | ||||||||||||
6.500% due 03/15/2029 | 38 | 37 | ||||||||||
6.750% due 02/15/2026 - 06/15/2026 | 21 | 21 | ||||||||||
7.500% due 09/15/2030 | 766 | 797 | ||||||||||
Total U.S. Government Agencies (Cost $320,080) | 299,401 | |||||||||||
NON-AGENCY MORTGAGE-BACKED SECURITIES 29.3% | ||||||||||||
Adjustable Rate Mortgage Trust | ||||||||||||
4.650% due 07/25/2035 ~ | 167 | 150 | ||||||||||
4.803% due 08/25/2035 «~ | 111 | 106 | ||||||||||
Ashford Hospitality Trust | ||||||||||||
6.719% due 04/15/2035 • | 2,200 | 2,121 | ||||||||||
Banc of America Mortgage Trust | ||||||||||||
3.893% due 02/25/2035 «~ | 4 | 4 | ||||||||||
Bancorp Commercial Mortgage Trust | ||||||||||||
8.943% due 08/15/2032 • | 2,267 | 2,253 | ||||||||||
BCAP LLC Trust | ||||||||||||
5.548% due 07/26/2036 ~ | 150 | 126 | ||||||||||
Bear Stearns ALT-A Trust | ||||||||||||
4.116% due 08/25/2036 ^~ | 208 | 109 | ||||||||||
PRINCIPAL AMOUNT (000S) | MARKET VALUE (000S) | |||||||||||
Bear Stearns Commercial Mortgage Securities Trust | ||||||||||||
5.657% due 10/12/2041 ~ | $ | 134 | $ | 126 | ||||||||
5.935% due 12/11/2040 ~ | 476 | 437 | ||||||||||
CALI Mortgage Trust | ||||||||||||
3.957% due 03/10/2039 | 1,100 | 864 | ||||||||||
Citigroup Commercial Mortgage Trust | ||||||||||||
5.617% due 12/10/2049 ~ | 984 | 664 | ||||||||||
Citigroup Mortgage Loan Trust | ||||||||||||
7.000% due 09/25/2033 « | 1 | 1 | ||||||||||
Commercial Mortgage Loan Trust | ||||||||||||
6.809% due 12/10/2049 ~ | 777 | 188 | ||||||||||
Commercial Mortgage Trust | ||||||||||||
11.194% due 12/15/2038 • | 1,380 | 1,040 | ||||||||||
Countrywide Alternative Loan Trust | ||||||||||||
5.570% due 07/25/2046 ^• | 952 | 790 | ||||||||||
Countrywide Home Loan Mortgage Pass-Through Trust | ||||||||||||
4.824% due 08/25/2034 «~ | 145 | 134 | ||||||||||
5.790% due 03/25/2035 • | 688 | 599 | ||||||||||
7.020% due 03/25/2046 ^• | 938 | 617 | ||||||||||
Countrywide Home Loan Reperforming REMIC Trust | ||||||||||||
7.500% due 11/25/2034 « | 224 | 219 | ||||||||||
7.500% due 06/25/2035 ^ | 45 | 44 | ||||||||||
Credit Suisse First Boston Mortgage-Backed Pass-Through Certificates | ||||||||||||
7.000% due 02/25/2034 « | 198 | 191 | ||||||||||
Credit Suisse Mortgage Capital Mortgage-Backed Trust | ||||||||||||
6.500% due 03/25/2036 ^ | 731 | 130 | ||||||||||
Eurosail PLC | ||||||||||||
6.590% due 09/13/2045 • | GBP | 1,582 | 1,805 | |||||||||
7.240% due 09/13/2045 • | 1,130 | 1,257 | ||||||||||
8.840% due 09/13/2045 • | 960 | 1,204 | ||||||||||
Freddie Mac | ||||||||||||
12.567% due 10/25/2041 •(j) | $ | 2,800 | 2,797 | |||||||||
12.867% due 11/25/2041 •(j) | 2,800 | 2,763 | ||||||||||
GC Pastor Hipotecario FTA | ||||||||||||
3.721% due 06/21/2046 • | EUR | 765 | 721 | |||||||||
GMAC Mortgage Corp. Loan Trust | ||||||||||||
3.415% due 08/19/2034 «~ | $ | 16 | 13 | |||||||||
GS Mortgage Securities Corp. Trust | ||||||||||||
4.744% due 10/10/2032 ~ | 2,600 | 2,382 | ||||||||||
8.547% due 08/15/2039 • | 3,400 | 3,403 | ||||||||||
GSAA Home Equity Trust | ||||||||||||
6.000% due 04/01/2034 | 397 | 384 | ||||||||||
GSMPS Mortgage Loan Trust | ||||||||||||
7.000% due 06/25/2043 | 1,332 | 1,354 | ||||||||||
7.500% due 06/19/2027 «~ | 13 | 12 | ||||||||||
8.000% due 09/19/2027 «~ | 291 | 266 | ||||||||||
GSR Mortgage Loan Trust | ||||||||||||
5.480% due 12/25/2034 «• | 41 | 35 | ||||||||||
6.500% due 01/25/2034 « | 3 | 3 | ||||||||||
IM Pastor Fondo de Titluzacion Hipotecaria | ||||||||||||
3.727% due 03/22/2043 • | EUR | 215 | 203 | |||||||||
JP Morgan Chase Commercial Mortgage Securities Trust | ||||||||||||
11.584% due 11/15/2038 •(j) | $ | 2,200 | 1,976 | |||||||||
JP Morgan Mortgage Trust | ||||||||||||
4.381% due 10/25/2036 ^~ | 662 | 545 | ||||||||||
5.500% due 06/25/2037 ^« | 19 | 18 | ||||||||||
LUXE Commercial Mortgage Trust | ||||||||||||
7.943% due 10/15/2038 • | 3,016 | 2,906 | ||||||||||
MASTR Adjustable Rate Mortgages Trust | ||||||||||||
3.912% due 10/25/2034 ~ | 228 | 205 | ||||||||||
MASTR Alternative Loan Trust | ||||||||||||
6.250% due 07/25/2036 | 233 | 139 | ||||||||||
7.000% due 04/25/2034 « | 19 | 18 | ||||||||||
MASTR Reperforming Loan Trust | ||||||||||||
7.000% due 05/25/2035 | 2,261 | 1,632 | ||||||||||
7.500% due 07/25/2035 | 1,183 | 879 | ||||||||||
MFA Trust | ||||||||||||
3.661% due 01/26/2065 ~ | 300 | 238 | ||||||||||
Morgan Stanley Re-REMIC Trust | ||||||||||||
3.528% due 12/26/2046 ~ | 7,037 | 6,128 | ||||||||||
NAAC Reperforming Loan REMIC Trust | ||||||||||||
7.000% due 10/25/2034 ^ | 498 | 444 | ||||||||||
| See Accompanying Notes | ANNUAL REPORT | | | JUNE 30, 2023 | 55 |
Schedule of Investments | PIMCO Strategic Income Fund, Inc. | (Cont.) |
PRINCIPAL AMOUNT (000S) | MARKET VALUE (000S) | |||||||||||
7.500% due 03/25/2034 ^ | $ | 1,502 | $ | 1,318 | ||||||||
7.500% due 10/25/2034 ^ | 1,495 | 1,338 | ||||||||||
Newgate Funding PLC | ||||||||||||
4.776% due 12/15/2050 • | EUR | 1,167 | 1,168 | |||||||||
5.026% due 12/15/2050 • | 1,167 | 1,135 | ||||||||||
RBSSP Resecuritization Trust | ||||||||||||
6.000% due 02/26/2037 ~ | $ | 2,268 | 1,292 | |||||||||
6.250% due 12/26/2036 ~ | 5,224 | 1,885 | ||||||||||
Residential Accredit Loans, Inc. Trust | ||||||||||||
6.000% due 08/25/2035 ^ | 737 | 626 | ||||||||||
Residential Asset Mortgage Products Trust | ||||||||||||
8.500% due 10/25/2031 | 178 | 179 | ||||||||||
8.500% due 11/25/2031 | 616 | 307 | ||||||||||
8.500% due 12/25/2031 « | 7 | 3 | ||||||||||
Structured Asset Securities Corp. Mortgage Loan Trust | ||||||||||||
7.500% due 10/25/2036 ^ | 2,132 | 1,283 | ||||||||||
WaMu Mortgage Pass-Through Certificates Trust | ||||||||||||
4.628% due 05/25/2035 ~ | 52 | 51 | ||||||||||
Washington Mutual Mortgage Pass-Through Certificates Trust | ||||||||||||
7.000% due 03/25/2034 « | 31 | 29 | ||||||||||
7.500% due 04/25/2033 « | 103 | 99 | ||||||||||
Wells Fargo Commercial Mortgage Trust | ||||||||||||
5.092% due 12/15/2039 ~(j) | 2,558 | 2,208 | ||||||||||
Total Non-Agency Mortgage-Backed Securities (Cost $63,090) | 57,564 | |||||||||||
ASSET-BACKED SECURITIES 7.5% | ||||||||||||
Access Financial Manufactured Housing Contract Trust | ||||||||||||
7.650% due 05/15/2049 | 200 | 3 | ||||||||||
Ameriquest Mortgage Securities, Inc. Asset-Backed Pass-Through Certificates | ||||||||||||
8.675% due 11/25/2032 ^«• | 39 | 1 | ||||||||||
Bear Stearns Asset-Backed Securities Trust | ||||||||||||
3.534% due 09/25/2034 «• | 143 | 135 | ||||||||||
Conseco Finance Corp. | ||||||||||||
6.530% due 02/01/2031 ~ | 54 | 47 | ||||||||||
Conseco Finance Securitizations Corp. | ||||||||||||
7.960% due 05/01/2031 | 1,418 | 426 | ||||||||||
Countrywide Asset-Backed Certificates Trust | ||||||||||||
3.962% due 11/25/2034 •(j) | 2,297 | 1,705 | ||||||||||
5.350% due 06/25/2037 ^•(j) | 1,455 | 1,428 | ||||||||||
ECAF Ltd. | ||||||||||||
4.947% due 06/15/2040 | 1,325 | 803 | ||||||||||
Elmwood CLO Ltd. | ||||||||||||
4.243% due 04/20/2034 ~ | 1,213 | 888 | ||||||||||
Exeter Automobile Receivables Trust | ||||||||||||
0.000% due 05/15/2031 «(f) | 7 | 1,897 | ||||||||||
Flagship Credit Auto Trust | ||||||||||||
0.000% due 12/15/2025 «(f) | 12 | 848 | ||||||||||
Madison Park Funding Ltd. | ||||||||||||
0.000% due 07/27/2047 ~ | 500 | 232 | ||||||||||
Marlette Funding Trust | ||||||||||||
0.000% due 12/15/2028 «(f) | 6 | 174 | ||||||||||
0.000% due 04/16/2029 «(f) | 10 | 437 | ||||||||||
0.000% due 07/16/2029 «(f) | 7 | 525 | ||||||||||
National Collegiate Commutation Trust | ||||||||||||
0.000% due 03/25/2038 • | 10,400 | 3,162 | ||||||||||
Oakwood Mortgage Investors, Inc. | ||||||||||||
5.423% due 06/15/2032 • | 1 | 1 | ||||||||||
SMB Private Education Loan Trust | ||||||||||||
0.000% due 10/15/2048 «(f) | 5 | 1,401 | ||||||||||
0.000% due 02/16/2055 «(f) | 0 | 588 | ||||||||||
Total Asset-Backed Securities (Cost $35,169) | 14,701 | |||||||||||
SOVEREIGN ISSUES 1.5% | ||||||||||||
Argentina Government International Bond | ||||||||||||
0.500% due 07/09/2030 þ | 515 | 142 | ||||||||||
1.000% due 07/09/2029 | 269 | 88 | ||||||||||
1.500% due 07/09/2035 þ | 904 | 260 | ||||||||||
1.500% due 07/09/2046 þ | 115 | 35 | ||||||||||
3.500% due 07/09/2041 þ(j) | 1,880 | 605 | ||||||||||
3.875% due 01/09/2038 þ(j) | 4,388 | 1,551 | ||||||||||
PRINCIPAL AMOUNT (000S) | MARKET VALUE (000S) | |||||||||||
Ghana Government International Bond | ||||||||||||
6.375% due 02/11/2027 ^(c) | $ | 323 | $ | 140 | ||||||||
7.875% due 02/11/2035 ^(c)(j) | 388 | 170 | ||||||||||
Venezuela Government International Bond | ||||||||||||
8.250% due 10/13/2024 ^(c) | 13 | 1 | ||||||||||
9.250% due 09/15/2027 ^(c) | 171 | 15 | ||||||||||
Total Sovereign Issues (Cost $5,118) | 3,007 | |||||||||||
SHARES | ||||||||||||
COMMON STOCKS 5.0% | ||||||||||||
COMMUNICATION SERVICES 0.5% | ||||||||||||
Clear Channel Outdoor Holdings, Inc. (d) | 291,816 | 400 | ||||||||||
iHeartMedia, Inc. ‘A’ (d) | 68,102 | 248 | ||||||||||
iHeartMedia, Inc. ‘B’ «(d) | 52,880 | 173 | ||||||||||
Promotora de Informaciones SA (d) | 207,627 | 86 | ||||||||||
| 907 | ||||||||||||
CONSUMER DISCRETIONARY 0.0% | ||||||||||||
Steinhoff CVR «(d) | 17,707,899 | 0 | ||||||||||
ENERGY 0.0% | ||||||||||||
Axis Energy Services ‘A’ «(h) | 422 | 13 | ||||||||||
FINANCIALS 1.6% | ||||||||||||
Banca Monte dei Paschi di Siena SpA (d) | 323,500 | 813 | ||||||||||
Intelsat Emergence SA «(d)(h) | 98,667 | 2,269 | ||||||||||
| 3,082 | ||||||||||||
INDUSTRIALS 2.9% | ||||||||||||
Neiman Marcus Group Ltd. LLC «(d)(h) | 32,851 | 4,991 | ||||||||||
Syniverse Holdings, Inc. «(h) | 836,616 | 770 | ||||||||||
Westmoreland Mining Holdings «(d)(h) | 69 | 1 | ||||||||||
Westmoreland Mining Holdings «(d) | 70 | 0 | ||||||||||
| 5,762 | ||||||||||||
Total Common Stocks (Cost $12,986) | 9,764 | |||||||||||
RIGHTS 0.0% | ||||||||||||
FINANCIALS 0.0% | ||||||||||||
Intelsat Jackson Holdings SA «(d) | 10,583 | 50 | ||||||||||
Total Rights (Cost $0) | 50 | |||||||||||
WARRANTS 0.3% | ||||||||||||
FINANCIALS 0.1% | ||||||||||||
Intelsat Emergence SA - Exp. 02/17/2027 « | 711 | 1 | ||||||||||
Intelsat Jackson Holdings SA - Exp. 12/05/2025 « | 10,308 | 75 | ||||||||||
| 76 | ||||||||||||
INFORMATION TECHNOLOGY 0.2% | ||||||||||||
Windstream Holdings LLC - Exp. 9/21/2055 « | 28,052 | 429 | ||||||||||
Total Warrants (Cost $2,791) | 505 | |||||||||||
SHARES | MARKET VALUE (000S) | |||||||||||
PREFERRED SECURITIES 3.4% | ||||||||||||
BANKING & FINANCE 0.0% | ||||||||||||
SVB Financial Group | ||||||||||||
4.000% due 05/15/2026 ^(c)(g) | 100,000 | $ | 7 | |||||||||
FINANCIALS 3.4% | ||||||||||||
Capital Farm Credit ACA | ||||||||||||
5.000% due 03/15/2026 •(g) | 1,300,000 | 1,207 | ||||||||||
Charles Schwab Corp. | ||||||||||||
4.000% due 12/01/2030 •(g) | 100,000 | 74 | ||||||||||
Farm Credit Bank of Texas | ||||||||||||
5.700% due 09/15/2025 •(g) | 1,000,000 | 845 | ||||||||||
Stichting AK Rabobank Certificaten | ||||||||||||
6.500% due 12/29/2049 þ(g) | 4,536,000 | 4,602 | ||||||||||
SVB Financial Group | ||||||||||||
4.700% due 11/15/2031 ^(c)(g) | 26,000 | 2 | ||||||||||
| 6,730 | ||||||||||||
Total Preferred Securities (Cost $8,756) | 6,737 | |||||||||||
REAL ESTATE INVESTMENT TRUSTS 0.7% | ||||||||||||
REAL ESTATE 0.7% | ||||||||||||
CBL & Associates Properties, Inc. | 2,011 | 44 | ||||||||||
Uniti Group, Inc. | 54,523 | 252 | ||||||||||
VICI Properties, Inc. | 33,427 | 1,051 | ||||||||||
Total Real Estate Investment Trusts (Cost $850) | 1,347 | |||||||||||
PRINCIPAL AMOUNT (000S) | ||||||||||||
SHORT-TERM INSTRUMENTS 6.3% | ||||||||||||
REPURCHASE AGREEMENTS (i) 4.6% | ||||||||||||
| 9,084 | ||||||||||||
ARGENTINA TREASURY BILLS 0.0% | ||||||||||||
(36.056)% due 09/18/2023 - 11/23/2023 (e)(f) | ARS | 25,204 | 69 | |||||||||
U.S. TREASURY BILLS 1.7% | ||||||||||||
5.271% due 08/10/2023 - 09/12/2023 (e)(f)(j)(m) | $ | 3,450 | 3,423 | |||||||||
Total Short-Term Instruments (Cost $12,584) | 12,576 | |||||||||||
Total Investments in Securities (Cost $624,173) | 543,112 | |||||||||||
Total Investments 276.3% (Cost $624,173) | $ | 543,112 | ||||||||||
Financial Derivative Instruments (k)(l) (0.4)% (Cost or Premiums, net $7,198) | (819 | ) | ||||||||||
Other Assets and Liabilities, net (175.9)% | (345,796 | ) | ||||||||||
Net Assets 100.0% | $ | 196,497 | ||||||||||
56 | PIMCO CLOSED-END FUNDS | See Accompanying Notes |
| June 30, 2023 |
* | A zero balance may reflect actual amounts rounding to less than one thousand. |
^ | Security is in default. |
« | Security valued using significant unobservable inputs (Level 3). |
µ | All or a portion of this amount represents unfunded loan commitments. The interest rate for the unfunded portion will be determined at the time of funding. See Note 4, Securities and Other Investments, in the Notes to Financial Statements for more information regarding unfunded loan commitments. |
~ | Variable or Floating rate security. Rate shown is the rate in effect as of period end. Certain variable rate securities are not based on a published reference rate and spread, rather are determined by the issuer or agent and are based on current market conditions. Reference rate is as of reset date, which may vary by security. These securities may not indicate a reference rate and/or spread in their description. |
• | Rate shown is the rate in effect as of period end. The rate may be based on a fixed rate, a capped rate or a floor rate and may convert to a variable or floating rate in the future. These securities do not indicate a reference rate and spread in their description. |
þ | Coupon represents a rate which changes periodically based on a predetermined schedule or event. Rate shown is the rate in effect as of period end. |
(a) | Security is an Interest Only (“IO”) or IO Strip. |
(b) | Payment in-kind security. |
(c) | Security is not accruing income as of the date of this report. |
(d) | Security did not produce income within the last twelve months. |
(e) | Coupon represents a weighted average yield to maturity. |
(f) | Zero coupon security. |
(g) | Perpetual maturity; date shown, if applicable, represents next contractual call date. |
Issuer Description | Acquisition Date | Cost | Market Value | Market Value as Percentage of Net Assets | ||||||||||||||||||||
Axis Energy Services ‘A’ | 07/01/2021 | $ | 6 | $ | 13 | 0.01 | % | |||||||||||||||||
Intelsat Emergence SA | 06/19/2017 - 02/23/2022 | 6,774 | 2,269 | 1.15 | ||||||||||||||||||||
Neiman Marcus Group Ltd. LLC | 09/25/2020 | 1,058 | 4,991 | 2.54 | ||||||||||||||||||||
Syniverse Holdings, Inc. | 05/12/2022 - 05/31/2023 | 822 | 770 | 0.39 | ||||||||||||||||||||
Westmoreland Mining Holdings | 03/26/2019 | 1 | 1 | 0.00 | ||||||||||||||||||||
| $ | 8,661 | $ | 8,044 | 4.09 | % | |||||||||||||||||||
Counterparty | Lending Rate | Settlement Date | Maturity Date | Principal Amount | Collateralized By | Collateral (Received) | Repurchase Agreements, at Value | Repurchase Agreement Proceeds to be Received (1) | ||||||||||||||||||||||
| FICC | 2.400 | % | 06/30/2023 | 07/03/2023 | $ | 1,784 | U.S. Treasury Notes 4.625% due 06/30/2025 | $ | (1,820 | ) | $ | 1,784 | $ | 1,784 | ||||||||||||||||
| JPS | 5.160 | 06/30/2023 | 07/03/2023 | 7,300 | U.S. Treasury Notes 2.375% due 03/31/2029 | (7,470 | ) | 7,300 | 7,303 | |||||||||||||||||||||
Total Repurchase Agreements | $ | (9,290 | ) | $ | 9,084 | $ | 9,087 | |||||||||||||||||||||||
Counterparty | Borrowing Rate (2) | Settlement Date | Maturity Date | Amount Borrowed (2) | Payable for Reverse Repurchase Agreements | |||||||||||||||||||
BOM | 5.820 | % | 06/01/2023 | 09/01/2023 | $ | (1,053 | ) | $ | (1,058 | ) | ||||||||||||||
BOS | 5.320 | 04/12/2023 | 07/11/2023 | (1,933 | ) | (1,956 | ) | |||||||||||||||||
| 5.320 | 06/15/2023 | 07/11/2023 | (397 | ) | (398 | ) | ||||||||||||||||||
| 5.520 | 05/05/2023 | 07/11/2023 | (1,113 | ) | (1,123 | ) | ||||||||||||||||||
BPS | 5.610 | 04/06/2023 | 08/03/2023 | (5,197 | ) | (5,267 | ) | |||||||||||||||||
| 5.740 | 03/14/2023 | 07/14/2023 | (6,003 | ) | (6,107 | ) | ||||||||||||||||||
| 5.790 | 03/01/2023 | 07/31/2023 | (4,072 | ) | (4,146 | ) | ||||||||||||||||||
| 5.810 | 05/18/2023 | 11/17/2023 | (6,438 | ) | (6,486 | ) | ||||||||||||||||||
| 6.310 | 04/13/2023 | 10/10/2023 | (2,477 | ) | (2,512 | ) | ||||||||||||||||||
| 6.610 | 04/13/2023 | 10/10/2023 | (3,365 | ) | (3,412 | ) | ||||||||||||||||||
BRC | 6.360 | 06/06/2023 | 10/04/2023 | (1,377 | ) | (1,383 | ) | |||||||||||||||||
BYR | 5.560 | 03/30/2023 | 09/27/2023 | (508 | ) | (515 | ) | |||||||||||||||||
| 5.760 | 03/17/2023 | 09/08/2023 | (5,668 | ) | (5,763 | ) | ||||||||||||||||||
| 5.770 | 03/23/2023 | 09/20/2023 | (679 | ) | (690 | ) | ||||||||||||||||||
CIB | 5.390 | 01/17/2023 | 07/17/2023 | (786 | ) | (805 | ) | |||||||||||||||||
| See Accompanying Notes | ANNUAL REPORT | | | JUNE 30, 2023 | 57 |
Schedule of Investments | PIMCO Strategic Income Fund, Inc. | (Cont.) |
Counterparty | Borrowing Rate (2) | Settlement Date | Maturity Date | Amount Borrowed (2) | Payable for Reverse Repurchase Agreements | |||||||||||||||||||
IND | 5.370 | % | 04/03/2023 | 08/03/2023 | $ | (448 | ) | $ | (454 | ) | ||||||||||||||
JML | 5.500 | 05/05/2023 | 07/28/2023 | (1,736 | ) | (1,752 | ) | |||||||||||||||||
JPS | 6.050 | 04/03/2023 | 07/03/2023 | (1,770 | ) | (1,796 | ) | |||||||||||||||||
| 6.430 | 07/03/2023 | 01/02/2024 | (1,766 | ) | (1,766 | ) | ||||||||||||||||||
| 6.480 | 05/31/2023 | 08/28/2023 | (1,195 | ) | (1,202 | ) | ||||||||||||||||||
MEI | 2.950 | 05/10/2023 | TBD | (3) | EUR | (352 | ) | (386 | ) | |||||||||||||||
RCY | 5.240 | 05/18/2023 | 08/16/2023 | $ | (1,527 | ) | (1,537 | ) | ||||||||||||||||
| 5.400 | 01/17/2023 | 07/17/2023 | (2,399 | ) | (2,459 | ) | ||||||||||||||||||
| 5.400 | 05/26/2023 | 07/25/2023 | (5,730 | ) | (5,763 | ) | ||||||||||||||||||
| 5.600 | 02/14/2023 | 08/14/2023 | (1,675 | ) | (1,711 | ) | ||||||||||||||||||
| 5.660 | 02/17/2023 | 09/18/2023 | (1,580 | ) | (1,614 | ) | ||||||||||||||||||
SAL | 5.180 | 06/15/2023 | 07/17/2023 | (1,422 | ) | (1,425 | ) | |||||||||||||||||
| 5.260 | 06/13/2023 | 07/13/2023 | (6,943 | ) | (6,963 | ) | ||||||||||||||||||
SCX | 5.270 | 04/10/2023 | 07/10/2023 | (2,618 | ) | (2,650 | ) | |||||||||||||||||
SOG | 5.250 | 05/05/2023 | TBD | (3) | (399 | ) | (403 | ) | ||||||||||||||||
| 5.320 | 05/05/2023 | TBD | (3) | (211 | ) | (213 | ) | |||||||||||||||||
| 5.520 | 02/02/2023 | 08/02/2023 | (623 | ) | (638 | ) | ||||||||||||||||||
| 5.620 | 04/12/2023 | 10/12/2023 | (1,701 | ) | (1,723 | ) | ||||||||||||||||||
TDM | 5.220 | 05/05/2023 | TBD | (3) | (1,564 | ) | (1,578 | ) | ||||||||||||||||
| 5.240 | 05/05/2023 | TBD | (3) | (3,255 | ) | (3,283 | ) | |||||||||||||||||
| 5.360 | 06/28/2023 | 07/27/2023 | (5,838 | ) | (5,843 | ) | ||||||||||||||||||
| 5.400 | 06/28/2023 | TBD | (3) | (3,886 | ) | (3,889 | ) | |||||||||||||||||
UBS | 3.600 | 06/08/2023 | TBD | (3) | EUR | (2,045 | ) | (2,237 | ) | |||||||||||||||
| 4.050 | 06/22/2023 | 09/22/2023 | (3,665 | ) | (4,004 | ) | ||||||||||||||||||
| 5.690 | 06/02/2023 | 08/31/2023 | $ | (2,632 | ) | (2,645 | ) | |||||||||||||||||
Total Reverse Repurchase Agreements | $ | (99,555 | ) | |||||||||||||||||||||
Description | Coupon | Maturity Date | Principal Amount | Proceeds | Payable for Short Sales | |||||||||||||||
U.S. Government Agencies (1.2)% | ||||||||||||||||||||
Fannie Mae, TBA | 2.000 | % | 07/01/2038 | $ | 300 | $ | (266 | ) | $ | (266 | ) | |||||||||
Uniform Mortgage-Backed Security, TBA | 2.000 | 08/01/2053 | 1,950 | (1,600 | ) | (1,593 | ) | |||||||||||||
Uniform Mortgage-Backed Security, TBA | 2.500 | 08/01/2053 | 600 | (512 | ) | (509 | ) | |||||||||||||
Total Short Sales (1.2)% | $ | (2,378 | ) | $ | (2,368 | ) | ||||||||||||||
Counterparty | Repurchase Agreement Proceeds to be Received (1) | Payable for Reverse Repurchase Agreements | Payable for Sale-Buyback Transactions | Total Borrowings and Other Financing Transactions | Collateral Pledged/(Received) | Net Exposure (4) | ||||||||||||||||||
Global/Master Repurchase Agreement | ||||||||||||||||||||||||
BOM | $ | 0 | $ | (1,058 | ) | $ | 0 | $ | (1,058 | ) | $ | 1,205 | $ | 147 | ||||||||||
BOS | 0 | (3,477 | ) | 0 | (3,477 | ) | 3,601 | 124 | ||||||||||||||||
BPS | 0 | (27,930 | ) | 0 | (27,930 | ) | 34,260 | 6,330 | ||||||||||||||||
BRC | 0 | (1,383 | ) | 0 | (1,383 | ) | 1,976 | 593 | ||||||||||||||||
BYR | 0 | (6,968 | ) | 0 | (6,968 | ) | 8,354 | 1,386 | ||||||||||||||||
CIB | 0 | (805 | ) | 0 | (805 | ) | 1,099 | 294 | ||||||||||||||||
FICC | 1,784 | 0 | 0 | 1,784 | (1,820 | ) | (36 | ) | ||||||||||||||||
IND | 0 | (454 | ) | 0 | (454 | ) | 497 | 43 | ||||||||||||||||
JML | 0 | (1,752 | ) | 0 | (1,752 | ) | 2,283 | 531 | ||||||||||||||||
JPS | 7,303 | (4,764 | ) | 0 | 2,539 | (3,404 | ) | (865 | ) | |||||||||||||||
MEI | 0 | (386 | ) | 0 | (386 | ) | 376 | (10 | ) | |||||||||||||||
RCY | 0 | (13,084 | ) | 0 | (13,084 | ) | 13,666 | 582 | ||||||||||||||||
SAL | 0 | (8,388 | ) | 0 | (8,388 | ) | 8,872 | 484 | ||||||||||||||||
SCX | 0 | (2,650 | ) | 0 | (2,650 | ) | 2,853 | 203 | ||||||||||||||||
SOG | 0 | (2,977 | ) | 0 | (2,977 | ) | 3,333 | 356 | ||||||||||||||||
TDM | 0 | (14,593 | ) | 0 | (14,593 | ) | 15,283 | 690 | ||||||||||||||||
UBS | 0 | (8,886 | ) | 0 | (8,886 | ) | 10,156 | 1,270 | ||||||||||||||||
Total Borrowings and Other Financing Transactions | $ | 9,087 | $ | (99,555 | ) | $ | 0 | |||||||||||||||||
58 | PIMCO CLOSED-END FUNDS | See Accompanying Notes |
| June 30, 2023 |
Overnight and Continuous | Up to 30 days | 31-90 days | Greater Than 90 days | Total | ||||||||||||||||
Reverse Repurchase Agreements | ||||||||||||||||||||
Corporate Bonds & Notes | $ | 0 | $ | (18,077 | ) | $ | (21,320 | ) | $ | (13,712 | ) | $ | (53,109 | ) | ||||||
U.S. Government Agencies | 0 | (17,415 | ) | (5,920 | ) | (6,486 | ) | (29,821 | ) | |||||||||||
Non-Agency Mortgage-Backed Securities | 0 | (1,796 | ) | 0 | (4,795 | ) | (6,591 | ) | ||||||||||||
Asset-Backed Securities | 0 | 0 | 0 | (2,512 | ) | (2,512 | ) | |||||||||||||
Sovereign Issues | 0 | (1,752 | ) | 0 | 0 | (1,752 | ) | |||||||||||||
Preferred Securities | 0 | 0 | (4,004 | ) | 0 | (4,004 | ) | |||||||||||||
Total Borrowings | $ | 0 | $ | (39,040 | ) | $ | (31,244 | ) | $ | (27,505 | ) | $ | (97,789 | ) | ||||||
Payable for reverse repurchase agreements (5) | $ | (97,789 | ) | |||||||||||||||||
(j) | Securities with an aggregate market value of $110,424 and cash of $1,760 have been pledged as collateral under the terms of the above master agreements as of June 30, 2023. |
(1) | Includes accrued interest. |
(2) | The average amount of borrowings outstanding during the period ended June 30, 2023 was $(124,173) at a weighted average interest rate of 3.673%. Average borrowings may include reverse repurchase agreements and sale-buyback transactions, if held during the period. |
(3) | Open maturity reverse repurchase agreement. |
(4) | Net Exposure represents the net receivable/(payable) that would be due from/to the counterparty in the event of default. Exposure from borrowings and other financing transactions can only be netted across transactions governed under the same master agreement with the same legal entity. See Note 8, Master Netting Arrangements, in the Notes to Financial Statements for more information. |
(5) | Unsettled reverse repurchase agreements liability of $(1,766) is outstanding at period end. |
Description | Expiration Month | # of Contracts | Notional Amount | Unrealized Appreciation/ (Depreciation) | Variation Margin | |||||||||||||||||||
Asset | Liability | |||||||||||||||||||||||
3-Month SOFR Active Contract December Futures | 03/2024 | 10 | $ | (2,366 | ) | $ | 67 | $ | 0 | $ | (1 | ) | ||||||||||||
3-Month SOFR Active Contract December Futures | 03/2025 | 4 | (960 | ) | 18 | 1 | 0 | |||||||||||||||||
3-Month SOFR Active Contract December Futures | 03/2026 | 5 | (1,207 | ) | 16 | 0 | 0 | |||||||||||||||||
3-Month SOFR Active Contract June Futures | 09/2024 | 6 | (1,429 | ) | 35 | 0 | 0 | |||||||||||||||||
3-Month SOFR Active Contract June Futures | 09/2025 | 4 | (964 | ) | 15 | 0 | 0 | |||||||||||||||||
3-Month SOFR Active Contract March Futures | 06/2024 | 7 | (1,660 | ) | 45 | 0 | 0 | |||||||||||||||||
3-Month SOFR Active Contract March Futures | 06/2025 | 4 | (962 | ) | 16 | 0 | 0 | |||||||||||||||||
3-Month SOFR Active Contract March Futures | 06/2026 | 4 | (966 | ) | 13 | 0 | 0 | |||||||||||||||||
3-Month SOFR Active Contract September Futures | 12/2024 | 6 | (1,434 | ) | 31 | 1 | 0 | |||||||||||||||||
3-Month SOFR Active Contract September Futures | 12/2025 | 4 | (965 | ) | 14 | 0 | 0 | |||||||||||||||||
Total Futures Contracts | $ | 270 | $ | 2 | $ | (1 | ) | |||||||||||||||||
Pay/Receive Floating Rate | Floating Rate Index | Fixed Rate | Payment Frequency | Maturity Date | Notional Amount | Premiums Paid/(Received) | Unrealized Appreciation/ (Depreciation) | Market Value | Variation Margin | |||||||||||||||||||||||||||||||
Asset | Liability | |||||||||||||||||||||||||||||||||||||||
Receive | 1-Day GBP-SONIO Compounded-OIS | 0.750 | % | Annual | 09/21/2052 | GBP | 5,900 | $ | 680 | $ | 3,416 | $ | 4,096 | $ | 39 | $ | 0 | |||||||||||||||||||||||
Pay | 1-Day USD-SOFR Compounded-OIS | 0.000 | Quarterly | 07/07/2023 | $ | 3,500 | 0 | (46 | ) | (46 | ) | 0 | (2 | ) | ||||||||||||||||||||||||||
Receive | 1-Day USD-SOFR Compounded-OIS | 0.000 | Quarterly | 07/08/2023 | 2,100 | 0 | 29 | 29 | 1 | 0 | ||||||||||||||||||||||||||||||
Pay | 1-Day USD-SOFR Compounded-OIS | 0.000 | Quarterly | 09/15/2023 | 12,200 | 0 | (174 | ) | (174 | ) | 0 | (5 | ) | |||||||||||||||||||||||||||
Receive (1) | 1-Day USD-SOFR Compounded-OIS | 0.500 | Maturity | 12/15/2023 | 85,300 | (4 | ) | 1,088 | 1,084 | 0 | (6 | ) | ||||||||||||||||||||||||||||
Receive (1) | 1-Day USD-SOFR Compounded-OIS | 3.000 | Semi-Annual | 06/19/2024 | 32,500 | (307 | ) | 926 | 619 | 0 | (10 | ) | ||||||||||||||||||||||||||||
Receive (1) | 1-Day USD-SOFR Compounded-OIS | 1.500 | Semi-Annual | 12/18/2024 | 14,000 | 12 | 625 | 637 | 0 | (5 | ) | |||||||||||||||||||||||||||||
Receive (1) | 1-Day USD-SOFR Compounded-OIS | 2.450 | Annual | 12/20/2024 | 8,800 | (1 | ) | 209 | 208 | 0 | (2 | ) | ||||||||||||||||||||||||||||
Receive (1) | 1-Day USD-SOFR Compounded-OIS | 2.350 | Annual | 01/17/2025 | 4,400 | 0 | 103 | 103 | 0 | (1 | ) | |||||||||||||||||||||||||||||
Receive (1) | 1-Day USD-SOFR Compounded-OIS | 2.000 | Semi-Annual | 06/20/2025 | 8,400 | 130 | 284 | 414 | 0 | (3 | ) | |||||||||||||||||||||||||||||
Receive | 1-Day USD-SOFR Compounded-OIS | 3.750 | Annual | 06/21/2025 | 142,900 | (321 | ) | 3,214 | 2,893 | 0 | (12 | ) | ||||||||||||||||||||||||||||
Receive (1) | 1-Day USD-SOFR Compounded-OIS | 2.300 | Annual | 01/17/2026 | 700 | 0 | 26 | 26 | 0 | 0 | ||||||||||||||||||||||||||||||
Receive (1) | 1-Day USD-SOFR Compounded-OIS | 1.350 | Semi-Annual | 01/20/2027 | 3,200 | (1 | ) | 319 | 318 | 0 | (2 | ) | ||||||||||||||||||||||||||||
Receive (1) | 1-Day USD-SOFR Compounded-OIS | 1.360 | Semi-Annual | 02/15/2027 | 2,130 | 0 | 208 | 208 | 0 | (1 | ) | |||||||||||||||||||||||||||||
| See Accompanying Notes | ANNUAL REPORT | | | JUNE 30, 2023 | 59 |
Schedule of Investments | PIMCO Strategic Income Fund, Inc. | (Cont.) |
Pay/Receive Floating Rate | Floating Rate Index | Fixed Rate | Payment Frequency | Maturity Date | Notional Amount | Premiums Paid/(Received) | Unrealized Appreciation/ (Depreciation) | Market Value | Variation Margin | |||||||||||||||||||||||||||||||||
Asset | Liability | |||||||||||||||||||||||||||||||||||||||||
Receive (1) | 1-Day USD-SOFR Compounded-OIS | 1.450 | % | Semi-Annual | 02/17/2027 | $ | 3,500 | $ | (1 | ) | $ | 332 | $ | 331 | $ | 0 | $ | (2 | ) | |||||||||||||||||||||||
Receive (1) | 1-Day USD-SOFR Compounded-OIS | 1.420 | Semi-Annual | 02/24/2027 | 1,000 | 0 | 95 | 95 | 0 | 0 | ||||||||||||||||||||||||||||||||
Pay (1) | 1-Day USD-SOFR Compounded-OIS | 1.650 | Semi-Annual | 02/24/2027 | 3,400 | (9 | ) | (289 | ) | (298 | ) | 2 | 0 | |||||||||||||||||||||||||||||
Pay | 1-Day USD-SOFR Compounded-OIS | 1.000 | Annual | 06/15/2027 | 11,200 | (763 | ) | (511 | ) | (1,274 | ) | 0 | (1 | ) | ||||||||||||||||||||||||||||
Pay | 1-Day USD-SOFR Compounded-OIS | 1.750 | Annual | 06/15/2027 | 28,200 | (1,308 | ) | (1,128 | ) | (2,436 | ) | 0 | (1 | ) | ||||||||||||||||||||||||||||
Receive | 1-Day USD-SOFR Compounded-OIS | 2.000 | Annual | 12/21/2027 | 47,200 | 3,512 | 992 | 4,504 | 0 | (1 | ) | |||||||||||||||||||||||||||||||
Receive (1) | 1-Day USD-SOFR Compounded-OIS | 1.420 | Semi-Annual | 08/17/2028 | 3,800 | (1 | ) | 458 | 457 | 0 | (2 | ) | ||||||||||||||||||||||||||||||
Receive (1) | 1-Day USD-SOFR Compounded-OIS | 1.370 | Semi-Annual | 08/25/2028 | 11,363 | (3 | ) | 1,388 | 1,385 | 0 | (6 | ) | ||||||||||||||||||||||||||||||
Pay (1) | 1-Day USD-SOFR Compounded-OIS | 1.500 | Semi-Annual | 12/15/2028 | 7,141 | 97 | (943 | ) | (846 | ) | 4 | 0 | ||||||||||||||||||||||||||||||
Receive (1) | 1-Day USD-SOFR Compounded-OIS | 1.500 | Semi-Annual | 01/12/2029 | 2,365 | 0 | 300 | 300 | 0 | (2 | ) | |||||||||||||||||||||||||||||||
Pay (1) | 1-Day USD-SOFR Compounded-OIS | 1.700 | Semi-Annual | 01/12/2029 | 8,600 | (26 | ) | (982 | ) | (1,008 | ) | 6 | 0 | |||||||||||||||||||||||||||||
Pay | 1-Day USD-SOFR Compounded-OIS | 1.000 | Annual | 06/15/2029 | 2,810 | (113 | ) | (305 | ) | (418 | ) | 1 | 0 | |||||||||||||||||||||||||||||
Pay | 1-Day USD-SOFR Compounded-OIS | 1.750 | Annual | 06/15/2029 | 73,390 | (5,265 | ) | (2,736 | ) | (8,001 | ) | 42 | 0 | |||||||||||||||||||||||||||||
Pay (1) | 1-Day USD-SOFR Compounded-OIS | 3.000 | Semi-Annual | 06/19/2029 | 44,200 | 2,283 | (4,512 | ) | (2,229 | ) | 35 | 0 | ||||||||||||||||||||||||||||||
Pay (1) | 1-Day USD-SOFR Compounded-OIS | 1.500 | Semi-Annual | 12/18/2029 | 4,500 | (46 | ) | (554 | ) | (600 | ) | 4 | 0 | |||||||||||||||||||||||||||||
Pay | 1-Day USD-SOFR Compounded-OIS | 2.000 | Annual | 12/21/2029 | 13,700 | (1,410 | ) | (145 | ) | (1,555 | ) | 10 | 0 | |||||||||||||||||||||||||||||
Receive | 1-Day USD-SOFR Compounded-OIS | 3.000 | Annual | 06/21/2030 | 6,800 | 179 | 115 | 294 | 0 | (7 | ) | |||||||||||||||||||||||||||||||
Receive (1) | 1-Day USD-SOFR Compounded-OIS | 1.000 | Semi-Annual | 12/16/2030 | 4,805 | 21 | 837 | 858 | 0 | (7 | ) | |||||||||||||||||||||||||||||||
Receive | 1-Day USD-SOFR Compounded-OIS | 1.750 | Semi-Annual | 12/15/2031 | 12,200 | (165 | ) | 2,059 | 1,894 | 0 | (19 | ) | ||||||||||||||||||||||||||||||
Receive | 1-Day USD-SOFR Compounded-OIS | 1.250 | Annual | 06/15/2032 | 38,250 | 4,949 | 1,867 | 6,816 | 0 | (63 | ) | |||||||||||||||||||||||||||||||
Receive | 1-Day USD-SOFR Compounded-OIS | 1.750 | Annual | 06/15/2032 | 46,980 | 1,980 | 4,629 | 6,609 | 0 | (84 | ) | |||||||||||||||||||||||||||||||
Receive | 1-Day USD-SOFR Compounded-OIS | 3.000 | Annual | 06/21/2033 | 17,505 | 747 | 66 | 813 | 0 | (43 | ) | |||||||||||||||||||||||||||||||
Receive (1) | 1-Day USD-SOFR Compounded-OIS | 2.000 | Semi-Annual | 01/15/2050 | 4,400 | (31 | ) | 1,193 | 1,162 | 0 | (34 | ) | ||||||||||||||||||||||||||||||
Receive (1) | 1-Day USD-SOFR Compounded-OIS | 1.750 | Semi-Annual | 01/22/2050 | 4,100 | (10 | ) | 1,267 | 1,257 | 0 | (31 | ) | ||||||||||||||||||||||||||||||
Receive (1) | 1-Day USD-SOFR Compounded-OIS | 1.875 | Semi-Annual | 02/07/2050 | 1,400 | (5 | ) | 402 | 397 | 0 | (11 | ) | ||||||||||||||||||||||||||||||
Receive (1) | 1-Day USD-SOFR Compounded-OIS | 1.250 | Semi-Annual | 12/16/2050 | 5,700 | 537 | 1,690 | 2,227 | 0 | (43 | ) | |||||||||||||||||||||||||||||||
Receive | 1-Day USD-SOFR Compounded-OIS | 1.450 | Semi-Annual | 04/07/2051 | 3,500 | (1 | ) | 1,321 | 1,320 | 0 | (26 | ) | ||||||||||||||||||||||||||||||
Pay | 1-Day USD-SOFR Compounded-OIS | 1.650 | Semi-Annual | 04/08/2051 | 2,100 | 1 | (717 | ) | (716 | ) | 16 | 0 | ||||||||||||||||||||||||||||||
Pay | 1-Day USD-SOFR Compounded-OIS | 1.500 | Annual | 06/15/2052 | 2,800 | (106 | ) | (778 | ) | (884 | ) | 23 | 0 | |||||||||||||||||||||||||||||
Receive | 1-Day USD-SOFR Compounded-OIS | 1.750 | Annual | 06/15/2052 | 6,900 | 1,128 | 717 | 1,845 | 0 | (58 | ) | |||||||||||||||||||||||||||||||
Receive | 1-Year BRL-CDI | 11.788 | Maturity | 01/04/2027 | BRL | 40,300 | 0 | (251 | ) | (251 | ) | 0 | (34 | ) | ||||||||||||||||||||||||||||
Pay | 1-Year BRL-CDI | 12.015 | Maturity | 01/04/2027 | 39,700 | 0 | 283 | 283 | 34 | 0 | ||||||||||||||||||||||||||||||||
Pay | 3-Month CAD-Bank Bill | 3.300 | Semi-Annual | 06/19/2024 | CAD | 11,200 | 624 | (803 | ) | (179 | ) | 2 | 0 | |||||||||||||||||||||||||||||
Receive | 3-Month CAD-Bank Bill | 3.500 | Semi-Annual | 06/20/2044 | 1,300 | (183 | ) | 223 | 40 | 0 | (14 | ) | ||||||||||||||||||||||||||||||
Receive | 3-Month USD-LIBOR | 0.000 | Quarterly | 07/07/2023 | $ | 3,500 | 0 | 46 | 46 | 2 | 0 | |||||||||||||||||||||||||||||||
Pay | 3-Month USD-LIBOR | 0.000 | Quarterly | 07/08/2023 | 2,100 | 0 | (28 | ) | (28 | ) | 0 | (1 | ) | |||||||||||||||||||||||||||||
Receive | 3-Month USD-LIBOR | 1.500 | Semi-Annual | 07/12/2023 | 2,365 | 0 | 14 | 14 | 1 | 0 | ||||||||||||||||||||||||||||||||
Pay | 3-Month USD-LIBOR | 1.700 | Semi-Annual | 07/12/2023 | 8,600 | 0 | (45 | ) | (45 | ) | 0 | (3 | ) | |||||||||||||||||||||||||||||
Receive | 3-Month USD-LIBOR | 2.000 | Semi-Annual | 07/15/2023 | 4,400 | 0 | 16 | 16 | 1 | 0 | ||||||||||||||||||||||||||||||||
Receive | 3-Month USD-LIBOR | 1.350 | Semi-Annual | 07/20/2023 | 3,200 | 0 | 22 | 22 | 1 | 0 | ||||||||||||||||||||||||||||||||
Receive | 3-Month USD-LIBOR | 1.750 | Semi-Annual | 07/22/2023 | 4,100 | 0 | 15 | 15 | 1 | 0 | ||||||||||||||||||||||||||||||||
Receive | 3-Month USD-LIBOR | 1.875 | Semi-Annual | 08/07/2023 | 1,400 | 0 | 6 | 6 | 0 | 0 | ||||||||||||||||||||||||||||||||
Receive | 3-Month USD-LIBOR | 1.360 | Semi-Annual | 08/15/2023 | 2,130 | 0 | 15 | 15 | 1 | 0 | ||||||||||||||||||||||||||||||||
Receive | 3-Month USD-LIBOR | 1.420 | Semi-Annual | 08/17/2023 | 3,800 | 0 | 26 | 26 | 1 | 0 | ||||||||||||||||||||||||||||||||
Receive | 3-Month USD-LIBOR | 1.450 | Semi-Annual | 08/17/2023 | 3,500 | 0 | 23 | 23 | 1 | 0 | ||||||||||||||||||||||||||||||||
Receive | 3-Month USD-LIBOR | 1.420 | Semi-Annual | 08/24/2023 | 1,000 | 0 | 7 | 7 | 0 | 0 | ||||||||||||||||||||||||||||||||
Pay | 3-Month USD-LIBOR | 1.650 | Semi-Annual | 08/24/2023 | 3,400 | 0 | (20 | ) | (20 | ) | 0 | (1 | ) | |||||||||||||||||||||||||||||
Receive | 3-Month USD-LIBOR | 1.370 | Semi-Annual | 08/25/2023 | 11,363 | 0 | 83 | 83 | 4 | 0 | ||||||||||||||||||||||||||||||||
Receive | 3-Month USD-LIBOR | 0.000 | Quarterly | 09/15/2023 | 12,200 | 0 | 177 | 177 | 6 | 0 | ||||||||||||||||||||||||||||||||
Receive | 3-Month USD-LIBOR | 0.500 | Semi-Annual | 09/15/2023 | 85,300 | 0 | 1,127 | 1,127 | 36 | 0 | ||||||||||||||||||||||||||||||||
Pay | 3-Month USD-LIBOR | 1.500 | Semi-Annual | 09/15/2023 | 7,141 | 0 | (76 | ) | (76 | ) | 0 | (2 | ) | |||||||||||||||||||||||||||||
Receive | 3-Month USD-LIBOR | 1.000 | Semi-Annual | 09/16/2023 | 4,805 | 0 | 58 | 58 | 2 | 0 | ||||||||||||||||||||||||||||||||
Receive | 3-Month USD-LIBOR | 1.250 | Semi-Annual | 09/16/2023 | 5,700 | 0 | 65 | 65 | 2 | 0 | ||||||||||||||||||||||||||||||||
Receive | 3-Month USD-LIBOR | 1.500 | Semi-Annual | 09/18/2023 | 9,500 | 0 | 98 | 98 | 3 | 0 | ||||||||||||||||||||||||||||||||
Pay | 3-Month USD-LIBOR | 3.000 | Semi-Annual | 09/19/2023 | 11,700 | 0 | (78 | ) | (78 | ) | 0 | (2 | ) | |||||||||||||||||||||||||||||
Receive | 3-Month USD-LIBOR | 2.000 | Semi-Annual | 09/20/2023 | 8,400 | 0 | 78 | 78 | 2 | 0 | ||||||||||||||||||||||||||||||||
Receive | 6-Month EUR-EURIBOR | 0.260 | Annual | 09/06/2024 | EUR | 15,100 | 2 | 849 | 851 | 18 | 0 | |||||||||||||||||||||||||||||||
Receive | 6-Month EUR-EURIBOR | 0.500 | Annual | 09/21/2052 | 3,500 | 303 | 1,277 | 1,580 | 18 | 0 | ||||||||||||||||||||||||||||||||
Receive (1) | 6-Month EUR-EURIBOR | 0.830 | Annual | 12/09/2052 | 3,700 | 23 | 179 | 202 | 1 | 0 | ||||||||||||||||||||||||||||||||
Total Swap Agreements | $ | 7,128 | $ | 19,741 | $ | 26,869 | $ | 320 | $ | (547 | ) | |||||||||||||||||||||||||||||||
60 | PIMCO CLOSED-END FUNDS | See Accompanying Notes |
| June 30, 2023 |
Financial Derivative Assets | Financial Derivative Liabilities | |||||||||||||||||||||||||||||||||||
Market Value | Variation Margin Asset | Total | Market Value | Variation Margin Liability | Total | |||||||||||||||||||||||||||||||
Purchased Options | Futures | Swap Agreements | Written Options | Futures | Swap Agreements | |||||||||||||||||||||||||||||||
Total Exchange-Traded or Centrally Cleared | $ | 0 | $ | 2 | $ | 320 | $ | 322 | $ | 0 | $ | (1) | $ | (547) | $ | (548) | ||||||||||||||||||||
(1) | This instrument has a forward starting effective date. See Note 2, Securities Transactions and Investment Income, in the Notes to Financial Statements for further information. |
Counterparty | Settlement Month | Currency to be Delivered | Currency to be Received | Unrealized Appreciation/ (Depreciation) | ||||||||||||||||||||
Asset | Liability | |||||||||||||||||||||||
BPS | 08/2023 | $ | 357 | EUR | 329 | $ | 2 | $ | 0 | |||||||||||||||
| 08/2023 | ZAR | 297 | $ | 16 | 1 | 0 | ||||||||||||||||||
CBK | 07/2023 | CAD | 593 | 435 | 0 | (12 | ) | |||||||||||||||||
| 07/2023 | PEN | 1,240 | 341 | 0 | 0 | |||||||||||||||||||
| 07/2023 | $ | 334 | PEN | 1,240 | 8 | 0 | ||||||||||||||||||
| 08/2023 | PEN | 562 | $ | 144 | 0 | (11 | ) | |||||||||||||||||
DUB | 07/2023 | BRL | 2,757 | 509 | 0 | (67 | ) | |||||||||||||||||
| 07/2023 | PEN | 1,240 | 339 | 0 | (3 | ) | ||||||||||||||||||
| 07/2023 | $ | 572 | BRL | 2,757 | 4 | 0 | ||||||||||||||||||
| 07/2023 | 680 | PEN | 2,480 | 3 | 0 | |||||||||||||||||||
GLM | 07/2023 | BRL | 2,766 | $ | 574 | 0 | (4 | ) | ||||||||||||||||
| 07/2023 | $ | 573 | BRL | 2,766 | 5 | 0 | ||||||||||||||||||
| 09/2023 | BRL | 4,269 | $ | 865 | 0 | (17 | ) | |||||||||||||||||
JPM | 10/2023 | MXN | 3,564 | 203 | 0 | (1 | ) | |||||||||||||||||
MBC | 07/2023 | EUR | 199 | 215 | 0 | (2 | ) | |||||||||||||||||
| 07/2023 | GBP | 6,099 | 7,551 | 0 | (195 | ) | ||||||||||||||||||
| 07/2023 | $ | 1,913 | EUR | 1,755 | 5 | (2 | ) | |||||||||||||||||
RBC | 07/2023 | 1 | MXN | 12 | 0 | 0 | ||||||||||||||||||
SSB | 07/2023 | PEN | 1,240 | $ | 340 | 0 | (2 | ) | ||||||||||||||||
| 08/2023 | $ | 339 | PEN | 1,240 | 2 | 0 | ||||||||||||||||||
| 09/2023 | 817 | BRL | 4,142 | 38 | 0 | |||||||||||||||||||
TOR | 07/2023 | EUR | 11,243 | $ | 12,063 | 0 | (205 | ) | ||||||||||||||||
| 07/2023 | $ | 448 | CAD | 593 | 0 | (1 | ) | |||||||||||||||||
| 07/2023 | 7,750 | GBP | 6,099 | 0 | (4 | ) | ||||||||||||||||||
| 08/2023 | CAD | 593 | $ | 448 | 1 | 0 | ||||||||||||||||||
| 08/2023 | GBP | 6,099 | 7,752 | 4 | 0 | |||||||||||||||||||
UAG | 07/2023 | EUR | 11,243 | 12,064 | 0 | (204 | ) | |||||||||||||||||
Total Forward Foreign Currency Contracts | $ | 73 | $ | (730 | ) | |||||||||||||||||||
Counterparty | Reference Entity | Fixed Receive Rate | Payment Frequency | Maturity Date | Implied Credit Spread at June 30, 2023 (2) | Notional Amount (3) | Premiums Paid/(Received) | Unrealized Appreciation/ (Depreciation) | Swap Agreements, at Value (4) | |||||||||||||||||||||||||||
Asset | Liability | |||||||||||||||||||||||||||||||||||
| GST | Equinix, Inc. | 5.000% | Quarterly | 06/20/2027 | 1.431% | $ | 500 | $ | 70 | $ | (6 | ) | $ | 64 | $ | 0 | ||||||||||||||||||||
Total Swap Agreements | $ | 70 | $ | (6 | ) | $ | 64 | $ | 0 | |||||||||||||||||||||||||||
| See Accompanying Notes | ANNUAL REPORT | | | JUNE 30, 2023 | 61 |
Schedule of Investments | PIMCO Strategic Income Fund, Inc. | (Cont.) |
Financial Derivative Assets | Financial Derivative Liabilities | |||||||||||||||||||||||||||||||||||||||||||||||
Counterparty | Forward Foreign Currency Contracts | Purchased Options | Swap Agreements | Total Over the Counter | Forward Foreign Currency Contracts | Written Options | Swap Agreements | Total Over the Counter | Net Market Value of OTC Derivatives | Collateral Pledged/ (Received) | Net Exposure (5) | |||||||||||||||||||||||||||||||||||||
BPS | $ | 3 | $ | 0 | $ | 0 | $ | 3 | $ | 0 | $ | 0 | $ | 0 | $ | 0 | $ | 3 | $ | 0 | $ | 3 | ||||||||||||||||||||||||||
CBK | 8 | 0 | 0 | 8 | (23 | ) | 0 | 0 | (23 | ) | (15 | ) | 0 | (15 | ) | |||||||||||||||||||||||||||||||||
DUB | 7 | 0 | 0 | 7 | (70 | ) | 0 | 0 | (70 | ) | (63 | ) | 0 | (63 | ) | |||||||||||||||||||||||||||||||||
GLM | 5 | 0 | 0 | 5 | (21 | ) | 0 | 0 | (21 | ) | (16 | ) | 0 | (16 | ) | |||||||||||||||||||||||||||||||||
GST | 0 | 0 | 64 | 64 | 0 | 0 | 0 | 0 | 64 | 0 | 64 | |||||||||||||||||||||||||||||||||||||
JPM | 0 | 0 | 0 | 0 | (1 | ) | 0 | 0 | (1 | ) | (1 | ) | 0 | (1 | ) | |||||||||||||||||||||||||||||||||
MBC | 5 | 0 | 0 | 5 | (199 | ) | 0 | 0 | (199 | ) | (194 | ) | 261 | 67 | ||||||||||||||||||||||||||||||||||
SSB | 40 | 0 | 0 | 40 | (2 | ) | 0 | 0 | (2 | ) | 38 | 0 | 38 | |||||||||||||||||||||||||||||||||||
TOR | 5 | 0 | 0 | 5 | (210 | ) | 0 | 0 | (210 | ) | (205 | ) | 271 | 66 | ||||||||||||||||||||||||||||||||||
UAG | 0 | 0 | 0 | 0 | (204 | ) | 0 | 0 | (204 | ) | (204 | ) | 271 | 67 | ||||||||||||||||||||||||||||||||||
Total Over the Counter | $ | 73 | $ | 0 | $ | 64 | $ | 137 | $ | (730 | ) | $ | 0 | $ | 0 | $ | (730 | ) | ||||||||||||||||||||||||||||||
(m) | Securities with an aggregate market value of $803 have been pledged as collateral for financial derivative instruments as governed by International Swaps and Derivatives Association, Inc. master agreements as of June 30, 2023. |
(1) | If the Fund is a seller of protection and a credit event occurs, as defined under the terms of that particular swap agreement, the Fund will either (i) pay to the buyer of protection an amount equal to the notional amount of the swap and take delivery of the referenced obligation or underlying securities comprising the referenced index or (ii) pay a net settlement amount in the form of cash, securities or other deliverable obligations equal to the notional amount of the swap less the recovery value of the referenced obligation or underlying securities comprising the referenced index. |
(2) | Implied credit spreads, represented in absolute terms, utilized in determining the market value of credit default swap agreements on corporate issues as of period end serve as indicators of the current status of the payment/performance risk and represent the likelihood or risk of default for the credit derivative. The implied credit spread of a particular referenced entity reflects the cost of buying/selling protection and may include upfront payments required to be made to enter into the agreement. Wider credit spreads represent a deterioration of the referenced entity’s credit soundness and a greater likelihood or risk of default or other credit event occurring as defined under the terms of the agreement. |
(3) | The maximum potential amount the Fund could be required to pay as a seller of credit protection or receive as a buyer of credit protection if a credit event occurs as defined under the terms of that particular swap agreement. |
(4) | The prices and resulting values for credit default swap agreements serve as indicators of the current status of the payment/performance risk and represent the likelihood of an expected liability (or profit) for the credit derivative should the notional amount of the swap agreement be closed/sold as of the period end. Increasing market values, in absolute terms when compared to the notional amount of the swap, represent a deterioration of the underlying referenced instrument’s credit soundness and a greater likelihood or risk of default or other credit event occurring as defined under the terms of the agreement. |
(5) | Net Exposure represents the net receivable/(payable) that would be due from/to the counterparty in the event of default. Exposure from OTC financial derivative instruments can only be netted across transactions governed under the same master agreement with the same legal entity. See Note 8, Master Netting Arrangements, in the Notes to Financial Statements for more information. |
Derivatives not accounted for as hedging instruments | ||||||||||||||||||||||||
Commodity Contracts | Credit Contracts | Equity Contracts | Foreign Exchange Contracts | Interest Rate Contracts | Total | |||||||||||||||||||
Financial Derivative Instruments - Assets | ||||||||||||||||||||||||
Exchange-traded or centrally cleared | ||||||||||||||||||||||||
Futures | $ | 0 | $ | 0 | $ | 0 | $ | 0 | $ | 2 | $ | 2 | ||||||||||||
Swap Agreements | 0 | 0 | 0 | 0 | 320 | 320 | ||||||||||||||||||
| $ | 0 | $ | 0 | $ | 0 | $ | 0 | $ | 322 | $ | 322 | |||||||||||||
Over the counter | ||||||||||||||||||||||||
Forward Foreign Currency Contracts | $ | 0 | $ | 0 | $ | 0 | $ | 73 | $ | 0 | $ | 73 | ||||||||||||
Swap Agreements | 0 | 64 | 0 | 0 | 0 | 64 | ||||||||||||||||||
| $ | 0 | $ | 64 | $ | 0 | $ | 73 | $ | 0 | $ | 137 | |||||||||||||
| $ | 0 | $ | 64 | $ | 0 | $ | 73 | $ | 322 | $ | 459 | |||||||||||||
62 | PIMCO CLOSED-END FUNDS | See Accompanying Notes |
| June 30, 2023 |
Derivatives not accounted for as hedging instruments | ||||||||||||||||||||||||
Commodity Contracts | Credit Contracts | Equity Contracts | Foreign Exchange Contracts | Interest Rate Contracts | Total | |||||||||||||||||||
Financial Derivative Instruments - Liabilities | ||||||||||||||||||||||||
Exchange-traded or centrally cleared | ||||||||||||||||||||||||
Futures | $ | 0 | $ | 0 | $ | 0 | $ | 0 | $ | 1 | $ | 1 | ||||||||||||
Swap Agreements | 0 | 0 | 0 | 0 | 547 | 547 | ||||||||||||||||||
| $ | 0 | $ | 0 | $ | 0 | $ | 0 | $ | 548 | $ | 548 | |||||||||||||
Over the counter | ||||||||||||||||||||||||
Forward Foreign Currency Contracts | $ | 0 | $ | 0 | $ | 0 | $ | 730 | $ | 0 | $ | 730 | ||||||||||||
| $ | 0 | $ | 0 | $ | 0 | $ | 730 | $ | 548 | $ | 1,278 | |||||||||||||
Derivatives not accounted for as hedging instruments | ||||||||||||||||||||||||
Commodity Contracts | Credit Contracts | Equity Contracts | Foreign Exchange Contracts | Interest Rate Contracts | Total | |||||||||||||||||||
Net Realized Gain (Loss) on Financial Derivative Instruments | ||||||||||||||||||||||||
Exchange-traded or centrally cleared | ||||||||||||||||||||||||
Swap Agreements | $ | 0 | $ | 165 | $ | 0 | $ | 0 | $ | 13,503 | $ | 13,668 | ||||||||||||
Over the counter | ||||||||||||||||||||||||
Forward Foreign Currency Contracts | $ | 0 | $ | 0 | $ | 0 | $ | 1,586 | $ | 0 | $ | 1,586 | ||||||||||||
Swap Agreements | 0 | 22 | 0 | 0 | 0 | 22 | ||||||||||||||||||
| $ | 0 | $ | 22 | $ | 0 | $ | 1,586 | $ | 0 | $ | 1,608 | |||||||||||||
| $ | 0 | $ | 187 | $ | 0 | $ | 1,586 | $ | 13,503 | $ | 15,276 | |||||||||||||
Net Change in Unrealized Appreciation (Depreciation) on Financial Derivative Instruments | ||||||||||||||||||||||||
Exchange-traded or centrally cleared | ||||||||||||||||||||||||
Futures | $ | 0 | $ | 0 | $ | 0 | $ | 0 | $ | 270 | $ | 270 | ||||||||||||
Swap Agreements | 0 | 133 | 0 | 0 | (974 | ) | (841 | ) | ||||||||||||||||
| $ | 0 | $ | 133 | $ | 0 | $ | 0 | $ | (704 | ) | $ | (571 | ) | |||||||||||
Over the counter | ||||||||||||||||||||||||
Forward Foreign Currency Contracts | $ | 0 | $ | 0 | $ | 0 | $ | (1,787 | ) | $ | 0 | $ | (1,787 | ) | ||||||||||
Swap Agreements | 0 | (6 | ) | 0 | 0 | 0 | (6 | ) | ||||||||||||||||
| $ | 0 | $ | (6 | ) | $ | 0 | $ | (1,787 | ) | $ | 0 | $ | (1,793 | ) | ||||||||||
| $ | 0 | $ | 127 | $ | 0 | $ | (1,787 | ) | $ | (704 | ) | $ | (2,364 | ) | ||||||||||
Category and Subcategory | Level 1 | Level 2 | Level 3 | Fair Value at 06/30/2023 | ||||||||||||
Investments in Securities, at Value | ||||||||||||||||
Loan Participations and Assignments | $ | 0 | $ | 24,116 | $ | 19,077 | $ | 43,193 | ||||||||
Corporate Bonds & Notes | ||||||||||||||||
Banking & Finance | 0 | 42,996 | 0 | 42,996 | ||||||||||||
Industrials | 0 | 38,198 | 0 | 38,198 | ||||||||||||
Utilities | 0 | 8,291 | 0 | 8,291 | ||||||||||||
Convertible Bonds & Notes | ||||||||||||||||
Banking & Finance | 0 | 111 | 0 | 111 | ||||||||||||
Municipal Bonds & Notes | ||||||||||||||||
California | 0 | 1,713 | 0 | 1,713 | ||||||||||||
Illinois | 0 | 15 | 0 | 15 | ||||||||||||
Puerto Rico | 0 | 551 | 0 | 551 | ||||||||||||
West Virginia | 0 | 2,392 | 0 | 2,392 | ||||||||||||
U.S. Government Agencies | 0 | 299,401 | 0 | 299,401 | ||||||||||||
Non-Agency Mortgage-Backed Securities | 0 | 56,413 | 1,151 | 57,564 | ||||||||||||
Asset-Backed Securities | 0 | 8,695 | 6,006 | 14,701 | ||||||||||||
Sovereign Issues | 0 | 3,007 | 0 | 3,007 | ||||||||||||
Common Stocks | ||||||||||||||||
Communication Services | 734 | 0 | 173 | 907 | ||||||||||||
Energy | 0 | 0 | 13 | 13 | ||||||||||||
Financials | 813 | 0 | 2,269 | 3,082 | ||||||||||||
Category and Subcategory | Level 1 | Level 2 | Level 3 | Fair Value at 06/30/2023 | ||||||||||||
Industrials | $ | 0 | $ | 0 | $ | 5,762 | $ | 5,762 | ||||||||
Rights | ||||||||||||||||
Financials | 0 | 0 | 50 | 50 | ||||||||||||
Warrants | ||||||||||||||||
Financials | 0 | 0 | 76 | 76 | ||||||||||||
Information Technology | 0 | 0 | 429 | 429 | ||||||||||||
Preferred Securities | ||||||||||||||||
Banking & Finance | 0 | 7 | 0 | 7 | ||||||||||||
Financials | 0 | 6,730 | 0 | 6,730 | ||||||||||||
Real Estate Investment Trusts | ||||||||||||||||
Real Estate | 1,347 | 0 | 0 | 1,347 | ||||||||||||
Short-Term Instruments | ||||||||||||||||
Repurchase Agreements | 0 | 9,084 | 0 | 9,084 | ||||||||||||
Argentina Treasury Bills | 0 | 69 | 0 | 69 | ||||||||||||
U.S. Treasury Bills | 0 | 3,423 | 0 | 3,423 | ||||||||||||
Total Investments | $ | 2,894 | $ | 505,212 | $ | 35,006 | $ | 543,112 | ||||||||
Short Sales, at Value - Liabilities | ||||||||||||||||
U.S. Government Agencies | $ | 0 | $ | (2,368 | ) | $ | 0 | $ | (2,368 | ) | ||||||
| See Accompanying Notes | ANNUAL REPORT | | | JUNE 30, 2023 | 63 |
Schedule of Investments | PIMCO Strategic Income Fund, Inc. | (Cont.) |
Category and Subcategory | Level 1 | Level 2 | Level 3 | Fair Value at 06/30/2023 | ||||||||||||
Financial Derivative Instruments - Assets | ||||||||||||||||
Exchange-traded or centrally cleared | $ | 0 | $ | 322 | $ | 0 | $ | 322 | ||||||||
Over the counter | 0 | 137 | 0 | 137 | ||||||||||||
| $ | 0 | $ | 459 | $ | 0 | $ | 459 | |||||||||
Category and Subcategory | Level 1 | Level 2 | Level 3 | Fair Value at 06/30/2023 | ||||||||||||
Financial Derivative Instruments - Liabilities | ||||||||||||||||
Exchange-traded or centrally cleared | $ | 0 | $ | (548 | ) | $ | 0 | $ | (548 | ) | ||||||
Over the counter | 0 | (730 | ) | 0 | (730 | ) | ||||||||||
| $ | 0 | $ | (1,278 | ) | $ | 0 | $ | (1,278 | ) | |||||||
Total Financial Derivative Instruments | $ | 0 | $ | (819 | ) | $ | 0 | $ | (819 | ) | ||||||
Totals | $ | 2,894 | $ | 502,025 | $ | 35,006 | $ | 539,925 | ||||||||
Category and Subcategory | Beginning Balance at 06/30/2022 | Net Purchases | Net Sales/ Settlements | Accrued Discounts/ (Premiums) | Realized Gain/(Loss) | Net Change in Unrealized Appreciation/ (Depreciation) (1) | Transfers into Level 3 | Transfers out of Level 3 | Ending Balance at 06/30/2023 | Net Change in Unrealized Appreciation/ (Depreciation) on Investments Held at 06/30/2023 (1) | ||||||||||||||||||||||||||||||
Investments in Securities, at Value | ||||||||||||||||||||||||||||||||||||||||
Loan Participations and Assignments | $ | 12,340 | $ | 12,105 | $ | (4,625 | ) | $ | (171 | ) | $ | (2,512 | ) | $ | 1,848 | $ | 550 | $ | (458 | ) | $ | 19,077 | $ | (361 | ) | |||||||||||||||
Corporate Bonds & Notes | ||||||||||||||||||||||||||||||||||||||||
Banking & Finance | 2,899 | 0 | (2,808 | ) | 0 | 208 | (299 | ) | �� | 0 | 0 | 0 | 0 | |||||||||||||||||||||||||||
Industrials | 14,118 | 235 | 0 | 57 | 0 | (1,287 | ) | 0 | (13,123 | ) | 0 | 0 | ||||||||||||||||||||||||||||
Non-Agency Mortgage-Backed Securities | 0 | 0 | 0 | 0 | 0 | 0 | 1,151 | 0 | 1,151 | 0 | ||||||||||||||||||||||||||||||
Asset-Backed Securities | 8,827 | 0 | 0 | 0 | 0 | (2,957 | ) | 136 | 0 | 6,006 | (2,957 | ) | ||||||||||||||||||||||||||||
Common Stocks | ||||||||||||||||||||||||||||||||||||||||
Communication Services | 376 | 0 | (1 | ) | 0 | 0 | (202 | ) | 0 | 0 | 173 | (202 | ) | |||||||||||||||||||||||||||
Energy | 6 | 0 | 1 | 0 | 0 | 6 | 0 | 0 | 13 | 6 | ||||||||||||||||||||||||||||||
Financials | 2,763 | 0 | (1 | ) | 0 | 0 | (493 | ) | 0 | 0 | 2,269 | (493 | ) | |||||||||||||||||||||||||||
Industrials | 6,400 | 100 | 1 | 0 | 0 | (739 | ) | 0 | 0 | 5,762 | (739 | ) | ||||||||||||||||||||||||||||
Materials | 92 | 0 | (101 | ) | 0 | 101 | (92 | ) | 0 | 0 | 0 | 0 | ||||||||||||||||||||||||||||
Rights | ||||||||||||||||||||||||||||||||||||||||
Financials | 50 | 0 | 0 | 0 | 0 | 0 | 0 | 0 | 50 | 0 | ||||||||||||||||||||||||||||||
Warrants | ||||||||||||||||||||||||||||||||||||||||
Financials | 54 | 0 | (1 | ) | 0 | 0 | 23 | 0 | 0 | 76 | 22 | |||||||||||||||||||||||||||||
Information Technology | 598 | 0 | 0 | 0 | 0 | (169 | ) | 0 | 0 | 429 | (169 | ) | ||||||||||||||||||||||||||||
Totals | $ | 48,523 | $ | 12,440 | $ | (7,535 | ) | $ | (114 | ) | $ | (2,203 | ) | $ | (4,361 | ) | $ | 1,837 | $ | (13,581 | ) | $ | 35,006 | $ | (4,893 | ) | ||||||||||||||
Category and Subcategory | Ending Balance at 06/30/2023 | Valuation Technique | Unobservable Inputs | (% Unless Noted Otherwise) | ||||||||||||||
Input Value(s) | Weighted Average | |||||||||||||||||
Investments in Securities, at Value | ||||||||||||||||||
Loan Participations and Assignments | $ | 5,265 | Comparable Multiple | EBITDA Multiple | X | 11.000 | — | |||||||||||
| 1,648 | Discounted Cash Flow | Discount Rate | 9.000 | — | ||||||||||||||
| 2,967 | Expect Recovery Valuation | Comparable Bond Price | 60.000 | — | ||||||||||||||
| 443 | Other Valuation Techniques (2) | — | — | — | ||||||||||||||
| 2,567 | Recent Transaction | Price | 98.000 | — | ||||||||||||||
| 2,647 | Recent Transaction | Purchase Price | 100.000 | |||||||||||||||
| 2,127 | Reference Instruments | Third Party Vendor | 42.000 | — | ||||||||||||||
| 1,413 | Third Party Vendor | Broker Quote | 91.000-92.500 | 91.917 | ||||||||||||||
Non-Agency Mortgage-Backed Securities | 1,151 | Fair Valuation of Odd Lot Positions | Adjustment Factor | 2.500 | — | |||||||||||||
Asset-Backed Securities | 5,870 | Discounted Cash Flow | Discount Rate | 10.000-20.000 | 14.977 | |||||||||||||
| 136 | Fair Valuation of Odd Lot Positions | Adjustment Factor | 2.500 | — | ||||||||||||||
Common Stocks | ||||||||||||||||||
Communication Services | 173 | Adjusted Market Price | Adjustment Factor | 10.000 | — | |||||||||||||
Energy | 13 | Comparable Multiple | LTM EBITDA Multiple | X | 3.300 | — | ||||||||||||
Financials | 2,269 | Indicative Market Quotation | Broker Quote | $ | 23.000 | — | ||||||||||||
Industrials | 4,992 | Comparable Multiple/Discounted Cash Flow | LTM Revenue Forward EBITDA/Discount Rate | X/X/% | 0.550/6.010/9.750 | — | ||||||||||||
| 770 | Discounted Cash Flow | Discount Rate | 14.975 | — | ||||||||||||||
Rights | ||||||||||||||||||
Financials | 50 | Indicative Market Quotation | Broker Quote | $ | 4.750 | — | ||||||||||||
64 | PIMCO CLOSED-END FUNDS | See Accompanying Notes |
| June 30, 2023 |
Category and Subcategory | Ending Balance at 06/30/2023 | Valuation Technique | Unobservable Inputs | (% Unless Noted Otherwise) | ||||||||||||||
Input Value(s) | Weighted Average | |||||||||||||||||
Warrants | ||||||||||||||||||
Financials | $ | 76 | Indicative Market Quotation | Broker Quote | $ | 0.750-7.250 | 7.169 | |||||||||||
Information Technology | 429 | Comparable Multiple | EBITDA Multiple | X | 4.590 | — | ||||||||||||
Total | $ | 35,006 | ||||||||||||||||
(1) | Any difference between Net Change in Unrealized Appreciation/(Depreciation) and Net Change in Unrealized Appreciation/(Depreciation) on Investments Held at June 30, 2023 may be due to an investment no longer held or categorized as Level 3 at period end. |
(2) | Includes valuation techniques not defined in the Notes to Financial Statements as securities valued using such techniques are not considered significant to the Fund. |
| See Accompanying Notes | ANNUAL REPORT | | | JUNE 30, 2023 | 65 |
Consolidated Schedule of Investments | PIMCO Access Income Fund |
PRINCIPAL AMOUNT (000S) | MARKET VALUE (000S) | |||||||||||
INVESTMENTS IN SECURITIES 183.1% | ||||||||||||
LOAN PARTICIPATIONS AND ASSIGNMENTS 34.2% | ||||||||||||
AmSurg LLC | ||||||||||||
0.500% - 11.000% (PRIME + 2.750%) due 07/20/2026 «~ | $ | 86 | $ | 86 | ||||||||
AP Core Holdings LLC | ||||||||||||
10.717% due 09/01/2027 « | 1,844 | 1,788 | ||||||||||
CIRCOR International, Inc. | ||||||||||||
TBD% due 06/20/2029 «µ | 166 | 163 | ||||||||||
TBD% due 06/20/2030 « | 1,434 | 1,413 | ||||||||||
Comexposium | ||||||||||||
1.138% - 4.414% (EUR012M + 3.250%) due 03/28/2025 ~ | EUR | 3,392 | 3,184 | |||||||||
4.969% (EUR012M + 4.000%) due 03/28/2026 ~ | 18,708 | 17,557 | ||||||||||
Diamond Sports Group LLC | ||||||||||||
13.064% due 05/25/2026 | $ | 15,258 | 11,811 | |||||||||
Diebold Nixdorf, Inc. | ||||||||||||
TBD% - 10.479% due 07/15/2025 ^(c) | 101 | 18 | ||||||||||
Envision Healthcare Corp. | ||||||||||||
16.070% due 04/29/2027 | 10,466 | 12,480 | ||||||||||
16.695% due 04/28/2028 « | 25,974 | 19,648 | ||||||||||
Espai Barca Fondo De Titulizacion | ||||||||||||
TBD% due 05/31/2028 « | EUR | 3,500 | 3,781 | |||||||||
Incora | ||||||||||||
TBD% - 13.725% due 03/01/2024 «µ | $ | 1,742 | 1,742 | |||||||||
Instant Brands Holdings, Inc. | ||||||||||||
TBD% (LIBOR03M + 0.000%) due 04/12/2028 ^~(c) | 8,545 | 1,862 | ||||||||||
15.217% due 12/12/2023 « | 3,322 | 3,073 | ||||||||||
Kiwi VFS Sub SARL | ||||||||||||
9.998% (EUR003M + 6.400%) due 05/16/2029 «~ | EUR | 6,160 | 6,790 | |||||||||
Market Bidco Ltd. | ||||||||||||
8.073% (EUR003M + 4.750%) due 11/04/2027 ~ | 8,643 | 8,116 | ||||||||||
8.991% due 11/04/2027 | GBP | 2,827 | 3,155 | |||||||||
NAC Aviation 29 DAC | ||||||||||||
7.501% due 06/30/2026 | $ | 4,707 | 4,187 | |||||||||
Oi SA | ||||||||||||
TBD% - 14.000% due 09/07/2024 µ | 6,184 | 6,184 | ||||||||||
1.750% (LIBOR06M + 1.750%) due 02/26/2035 ~ | 7,765 | 562 | ||||||||||
Poseidon Bidco SASU | ||||||||||||
8.848% (EUR003M + 5.250%) due 07/14/2028 «~ | EUR | 8,800 | 9,410 | |||||||||
Profrac Services LLC | ||||||||||||
12.753% due 03/04/2025 | $ | 15,705 | 15,764 | |||||||||
Promotora de Informaciones SA | ||||||||||||
8.189% (EUR003M + 5.000%) due 06/30/2026 «~ | EUR | 16,000 | 17,573 | |||||||||
8.439% (EUR003M + 5.220%) due 12/31/2026 ~ | 3,208 | 3,296 | ||||||||||
Rising Tide Holdings, Inc. | ||||||||||||
10.264% due 06/01/2028 | $ | 3,330 | 2,028 | |||||||||
13.466% due 06/01/2029 « | 3,438 | 301 | ||||||||||
13.966% due 06/01/2029 « | 3,503 | 1,546 | ||||||||||
14.091% due 06/01/2026 « | 2,470 | 2,401 | ||||||||||
SCUR-Alpha 1503 GmbH | ||||||||||||
8.918% - 9.087% (EUR001M + 5.500%) due 03/29/2030 ~ | EUR | 2,400 | 2,504 | |||||||||
10.602% due 03/28/2030 | $ | 3,791 | 3,596 | |||||||||
Steenbok Lux Finco 2 SARL | ||||||||||||
TBD% due 06/30/2026 « | EUR | 26,849 | 18,084 | |||||||||
Syniverse Holdings, Inc. | ||||||||||||
12.242% due 05/13/2027 | $ | 17,951 | 16,509 | |||||||||
Team Health Holdings, Inc. | ||||||||||||
7.943% (LIBOR01M + 2.750%) due 02/06/2024 ~ | 1,133 | 1,007 | ||||||||||
10.352% due 03/02/2027 | 1,527 | 1,056 | ||||||||||
PRINCIPAL AMOUNT (000S) | MARKET VALUE (000S) | |||||||||||
Telemar Norte Leste SA | ||||||||||||
1.750% due 02/26/2035 | $ | 14,586 | $ | 1,055 | ||||||||
1.750% (LIBOR06M + 1.750%) due 02/26/2035 ~ | 6,008 | 434 | ||||||||||
U.S. Renal Care, Inc. | ||||||||||||
10.193% (LIBOR01M + 5.000%) due 06/26/2026 ~ | 22,670 | 10,636 | ||||||||||
10.193% (LIBOR01M + 5.500%) due 06/26/2026 ~ | 2,919 | 1,369 | ||||||||||
Windstream Services LLC | ||||||||||||
9.202% due 02/23/2027 « | 7,620 | 7,429 | ||||||||||
Total Loan Participations and Assignments (Cost $255,020) | 223,598 | |||||||||||
CORPORATE BONDS & NOTES 24.8% | ||||||||||||
BANKING & FINANCE 9.8% | ||||||||||||
ADLER Real Estate AG | ||||||||||||
3.000% due 04/27/2026 | EUR | 1,200 | 1,019 | |||||||||
Agps Bondco PLC | ||||||||||||
4.250% due 07/31/2025 ^(c) | 900 | 759 | ||||||||||
4.625% due 01/14/2026 ^(c) | 4,000 | 1,703 | ||||||||||
5.000% due 04/27/2027 ^(c) | 5,100 | 1,974 | ||||||||||
5.500% due 11/13/2026 ^(c) | 1,200 | 503 | ||||||||||
6.000% due 08/05/2025 ^(c) | 6,800 | 3,247 | ||||||||||
Armor Holdco, Inc. | ||||||||||||
8.500% due 11/15/2029 (j) | $ | 8,000 | 6,647 | |||||||||
Banca Monte dei Paschi di Siena SpA | ||||||||||||
2.625% due 04/28/2025 | EUR | 15,420 | 15,796 | |||||||||
7.677% due 01/18/2028 • | 2,400 | 2,207 | ||||||||||
8.000% due 01/22/2030 • | 956 | 938 | ||||||||||
10.500% due 07/23/2029 | 8,348 | 9,060 | ||||||||||
BOI Finance BV | ||||||||||||
7.500% due 02/16/2027 | 4,000 | 3,770 | ||||||||||
Corestate Capital Holding SA | ||||||||||||
3.500% due 07/31/2023 ^(c) | 2,000 | 308 | ||||||||||
Hestia Re Ltd. | ||||||||||||
14.768% (T-BILL 1MO + 9.500%) due 04/22/2025 ~ | $ | 939 | 812 | |||||||||
Sanders Re Ltd. | ||||||||||||
17.018% (T-BILL 3MO + 11.750%) due 04/09/2029 ~ | 1,815 | 1,707 | ||||||||||
SVB Financial Group | ||||||||||||
1.800% due 02/02/2031 ^(c) | 1,395 | 887 | ||||||||||
2.100% due 05/15/2028 ^(c) | 200 | 136 | ||||||||||
3.125% due 06/05/2030 ^(c) | 200 | 132 | ||||||||||
3.500% due 01/29/2025 ^(c) | 100 | 73 | ||||||||||
4.345% due 04/29/2028 ^(c) | 600 | 421 | ||||||||||
4.570% due 04/29/2033 ^(c) | 1,900 | 1,276 | ||||||||||
UBS Group AG | ||||||||||||
2.250% due 06/09/2028 • | GBP | 100 | 105 | |||||||||
4.194% due 04/01/2031 •(j) | $ | 500 | 445 | |||||||||
7.750% due 03/01/2029 • | EUR | 230 | 278 | |||||||||
Uniti Group LP | ||||||||||||
6.000% due 01/15/2030 (j) | $ | 8,400 | 5,699 | |||||||||
10.500% due 02/15/2028 (j) | 2,671 | 2,652 | ||||||||||
Veraison Re Ltd. | ||||||||||||
17.278% (T-BILL 1MO + 12.000%) due 03/10/2031 ~ | 700 | 745 | ||||||||||
Yosemite Re Ltd. | ||||||||||||
15.018% (T-BILL 3MO + 9.978%) due 06/06/2025 ~ | 980 | 1,002 | ||||||||||
| �� | ||||||||||||
| 64,301 | ||||||||||||
INDUSTRIALS 10.3% | ||||||||||||
Altice France Holding SA | ||||||||||||
10.500% due 05/15/2027 (j) | 17,400 | 10,556 | ||||||||||
Carvana Co. | ||||||||||||
10.250% due 05/01/2030 | 3,200 | 2,525 | ||||||||||
CGG SA | ||||||||||||
7.750% due 04/01/2027 | EUR | 2,000 | 1,835 | |||||||||
8.750% due 04/01/2027 | $ | 2,000 | 1,677 | |||||||||
PRINCIPAL AMOUNT (000S) | MARKET VALUE (000S) | |||||||||||
DISH DBS Corp. | ||||||||||||
5.250% due 12/01/2026 (j) | $ | 3,400 | $ | 2,734 | ||||||||
5.750% due 12/01/2028 (j) | 14,100 | 10,514 | ||||||||||
Inter Media & Communication SpA | ||||||||||||
6.750% due 02/09/2027 | EUR | 300 | 317 | |||||||||
Market Bidco Finco PLC | ||||||||||||
4.750% due 11/04/2027 | 1,000 | 881 | ||||||||||
U.S. Renal Care, Inc. | ||||||||||||
10.625% due 07/15/2027 | $ | 12,771 | 3,257 | |||||||||
Vale SA | ||||||||||||
3.202% due 12/29/2049 ~(g) | BRL | 10,300 | 661 | |||||||||
Veritas US, Inc. | ||||||||||||
7.500% due 09/01/2025 (j) | $ | 7,400 | 6,015 | |||||||||
Wesco Aircraft Holdings, Inc. (7.500% Cash and 3.000% PIK) | ||||||||||||
10.500% due 11/15/2026 ^(b)(c) | 7,105 | 6,466 | ||||||||||
Windstream Escrow LLC | ||||||||||||
7.750% due 08/15/2028 (j) | 23,816 | 19,791 | ||||||||||
| 67,229 | ||||||||||||
UTILITIES 4.7% | ||||||||||||
Adler Financing SARL | ||||||||||||
12.500% due 06/30/2025 (j) | EUR | 14,042 | 15,729 | |||||||||
Eskom Holdings SOC Ltd. | ||||||||||||
6.750% due 08/06/2023 | $ | 3,800 | 3,789 | |||||||||
Oi SA | ||||||||||||
10.000% due 07/27/2025 ^(c) | 34,485 | 2,493 | ||||||||||
Peru LNG SRL | ||||||||||||
5.375% due 03/22/2030 | 11,082 | 8,930 | ||||||||||
| 30,941 | ||||||||||||
Total Corporate Bonds & Notes (Cost $203,441) | 162,471 | |||||||||||
MUNICIPAL BONDS & NOTES 2.9% | ||||||||||||
PUERTO RICO 2.9% | ||||||||||||
Commonwealth of Puerto Rico Bonds, Series 2022 | ||||||||||||
0.000% due 11/01/2043 | 25,950 | 13,105 | ||||||||||
0.000% due 11/01/2051 | 14,056 | 5,903 | ||||||||||
Total Municipal Bonds & Notes (Cost $20,911) | 19,008 | |||||||||||
NON-AGENCY MORTGAGE-BACKED SECURITIES 56.7% | ||||||||||||
225 Liberty Street Trust | ||||||||||||
4.803% due 02/10/2036 ~(j) | 14,239 | 9,865 | ||||||||||
245 Park Avenue Trust | ||||||||||||
3.779% due 06/05/2037 ~ | 2,680 | 1,998 | ||||||||||
Ashford Hospitality Trust | ||||||||||||
8.069% due 06/15/2035 •(j) | 1,000 | 946 | ||||||||||
8.419% due 04/15/2035 •(j) | 14,536 | 13,850 | ||||||||||
Atrium Hotel Portfolio Trust | ||||||||||||
8.843% due 06/15/2035 •(j) | 6,223 | 5,804 | ||||||||||
BAMLL Commercial Mortgage Securities Trust | ||||||||||||
7.703% due 03/15/2037 •(j) | 2,000 | 1,886 | ||||||||||
7.903% due 03/15/2037 •(j) | 3,000 | 2,812 | ||||||||||
Barclays Commercial Mortgage Securities Trust | ||||||||||||
3.811% due 02/15/2053 ~(j) | 4,785 | 2,886 | ||||||||||
Barclays Commercial Real Estate Trust | ||||||||||||
4.715% due 08/10/2033 ~(j) | 5,370 | 4,010 | ||||||||||
BCAP LLC Trust | ||||||||||||
2.224% due 11/27/2036 • | 38,346 | 7,710 | ||||||||||
3.489% due 04/25/2038 ~ | 3,509 | 2,705 | ||||||||||
Beast Mortgage Trust | ||||||||||||
8.643% due 03/15/2036 •(j) | 6,750 | 4,873 | ||||||||||
9.643% due 03/15/2036 •(j) | 2,500 | 1,712 | ||||||||||
Benchmark Mortgage Trust | ||||||||||||
3.555% due 08/15/2052 ~(j) | 8,600 | 7,667 | ||||||||||
Beneria Cowen & Pritzer Collateral Funding Corp. | ||||||||||||
8.831% due 06/15/2038 •(j) | 5,500 | 4,045 | ||||||||||
66 | PIMCO CLOSED-END FUNDS | See Accompanying Notes |
| June 30, 2023 |
PRINCIPAL AMOUNT (000S) | MARKET VALUE (000S) | |||||||||||
BMO Mortgage Trust | ||||||||||||
3.378% due 02/17/2055 ~(j) | $ | 9,615 | $ | 7,293 | ||||||||
4.070% due 02/17/2055 ~(j) | 11,000 | 5,962 | ||||||||||
Braemar Hotels & Resorts Trust | ||||||||||||
7.718% due 06/15/2035 •(j) | 8,500 | 7,735 | ||||||||||
BSST Mortgage Trust | ||||||||||||
10.647% due 02/15/2037 •(j) | 8,800 | 6,390 | ||||||||||
11.647% due 02/15/2037 •(j) | 1,500 | 1,059 | ||||||||||
BX Trust | ||||||||||||
7.430% due 10/15/2036 •(j) | 4,000 | 3,716 | ||||||||||
8.363% due 05/15/2030 •(j) | 3,754 | 3,641 | ||||||||||
Canada Square Funding PLC | ||||||||||||
7.352% due 12/17/2057 • | GBP | 2,000 | 2,477 | |||||||||
Citigroup Commercial Mortgage Trust | ||||||||||||
8.118% due 12/15/2036 •(j) | $ | 585 | 560 | |||||||||
8.968% due 12/15/2036 •(j) | 3,400 | 3,225 | ||||||||||
COLT Mortgage Loan Trust | ||||||||||||
4.687% due 03/25/2067 ~(j) | 7,200 | 6,135 | ||||||||||
Connecticut Avenue Securities Trust | ||||||||||||
10.317% due 03/25/2042 •(j) | 2,000 | 2,086 | ||||||||||
14.567% due 03/25/2042 •(j) | 5,200 | 5,544 | ||||||||||
Countrywide Home Loan Mortgage Pass-Through Trust | ||||||||||||
6.500% due 01/25/2038 (j) | 14,307 | 7,183 | ||||||||||
Credit Suisse Mortgage Capital Trust | ||||||||||||
8.493% due 07/15/2032 •(j) | 12,000 | 10,939 | ||||||||||
DBGS Mortgage Trust | ||||||||||||
7.293% due 06/15/2033 •(j) | 15,000 | 11,882 | ||||||||||
DOLP Trust | ||||||||||||
3.704% due 05/10/2041 ~(j) | 14,250 | 6,518 | ||||||||||
Extended Stay America Trust | ||||||||||||
8.894% due 07/15/2038 •(j) | 11,247 | 10,721 | ||||||||||
Freddie Mac | ||||||||||||
7.717% due 01/25/2051 • | 620 | 602 | ||||||||||
8.067% due 12/25/2050 • | 760 | 750 | ||||||||||
8.117% due 01/25/2034 •(j) | 855 | 841 | ||||||||||
8.817% due 02/25/2042 •(j) | 5,200 | 5,241 | ||||||||||
9.817% due 02/25/2042 •(j) | 1,700 | 1,696 | ||||||||||
10.567% due 01/25/2034 • | 900 | 816 | ||||||||||
13.567% due 02/25/2042 • | 800 | 804 | ||||||||||
GS Mortgage Securities Corp. Trust | ||||||||||||
7.793% due 08/15/2032 •(j) | 5,000 | 4,620 | ||||||||||
GSMSC Resecuritization Trust | ||||||||||||
5.748% due 11/26/2037 (j) | 18,130 | 15,440 | ||||||||||
Harbour PLC | ||||||||||||
7.557% due 01/28/2054 • | GBP | 10,416 | 12,333 | |||||||||
Hilton Orlando Trust | ||||||||||||
8.093% due 12/15/2034 •(j) | $ | 1,250 | 1,220 | |||||||||
HPLY Trust | ||||||||||||
8.343% due 11/15/2036 •(j) | 7,744 | 7,331 | ||||||||||
9.093% due 11/15/2036 •(j) | 11,600 | 10,765 | ||||||||||
Jackson Park Trust | ||||||||||||
3.350% due 10/14/2039 ~(j) | 2,700 | 1,922 | ||||||||||
JP Morgan Chase Commercial Mortgage Securities Trust | ||||||||||||
5.542% due 07/05/2033 ~(j) | 1,183 | 983 | ||||||||||
7.383% due 06/15/2038 •(j) | 1,226 | 1,047 | ||||||||||
7.493% due 12/15/2031 •(j) | 5,211 | 4,915 | ||||||||||
8.293% due 03/15/2036 •(j) | 2,000 | 1,574 | ||||||||||
8.583% due 06/15/2038 • | 250 | 206 | ||||||||||
9.043% due 03/15/2036 •(j) | 19,256 | 14,591 | ||||||||||
Jupiter Mortgage No. 1 PLC | ||||||||||||
7.991% due 07/20/2060 • | GBP | 6,424 | 8,053 | |||||||||
MAD Mortgage Trust | ||||||||||||
4.167% due 08/15/2034 ~(j) | $ | 745 | 571 | |||||||||
Morgan Stanley Bank of America Merrill Lynch Trust | ||||||||||||
4.908% due 12/15/2046 ~(j) | 4,260 | 3,615 | ||||||||||
Morgan Stanley Capital Trust | ||||||||||||
7.743% due 07/15/2035 •(j) | 7,084 | 6,910 | ||||||||||
MRCD Mortgage Trust | ||||||||||||
2.718% due 12/15/2036 (j) | 16,198 | 10,391 | ||||||||||
Natixis Commercial Mortgage Securities Trust | ||||||||||||
3.917% due 11/15/2032 ~(j) | 3,000 | 1,974 | ||||||||||
7.593% due 11/15/2034 •(j) | 4,435 | 4,172 | ||||||||||
PRINCIPAL AMOUNT (000S) | MARKET VALUE (000S) | |||||||||||
New Orleans Hotel Trust | ||||||||||||
7.882% due 04/15/2032 •(j) | $ | 7,900 | $ | 7,384 | ||||||||
New Residential Mortgage Loan Trust | ||||||||||||
3.885% due 11/25/2059 ~ | 15,500 | 7,487 | ||||||||||
Preston Ridge Partners Mortgage LLC | ||||||||||||
6.291% due 02/25/2027 þ | 3,000 | 2,833 | ||||||||||
Residential Mortgage Securities PLC | ||||||||||||
8.885% due 06/20/2070 | GBP | 2,500 | 3,168 | |||||||||
Seasoned Credit Risk Transfer Trust | ||||||||||||
4.500% due 11/25/2061 ~(j) | $ | 5,900 | 4,666 | |||||||||
6.412% due 11/25/2061 ~(a) | 6,737 | 2,040 | ||||||||||
SFO Commercial Mortgage Trust | ||||||||||||
7.593% due 05/15/2038 • | 340 | 262 | ||||||||||
8.093% due 05/15/2038 •(j) | 6,500 | 4,761 | ||||||||||
Stratton Hawksmoor PLC | ||||||||||||
6.766% due 02/25/2053 • | GBP | 3,800 | 4,575 | |||||||||
7.516% due 02/25/2053 • | 8,379 | 9,922 | ||||||||||
Tharaldson Hotel Portfolio Trust | ||||||||||||
8.671% due 11/11/2034 •(j) | $ | 4,050 | 3,899 | |||||||||
Uropa Securities PLC | ||||||||||||
4.405% due 10/10/2040 • | EUR | 2,747 | 2,619 | |||||||||
WaMu Mortgage Pass-Through Certificates Trust | ||||||||||||
6.050% due 10/25/2045 •(j) | $ | 7,690 | 6,401 | |||||||||
Wells Fargo Commercial Mortgage Trust | ||||||||||||
3.989% due 09/15/2031 ~(j) | 1,500 | 1,335 | ||||||||||
5.092% due 12/15/2039 ~(j) | 8,600 | 7,070 | ||||||||||
7.933% due 02/15/2037 •(j) | 3,080 | 2,861 | ||||||||||
Total Non-Agency Mortgage-Backed Securities (Cost $421,330) | 370,501 | |||||||||||
ASSET-BACKED SECURITIES 34.1% | ||||||||||||
ACE Securities Corp. Home Equity Loan Trust | ||||||||||||
5.570% due 04/25/2036 •(j) | 23,983 | 17,963 | ||||||||||
5.590% due 08/25/2036 ^•(j) | 21,699 | 5,541 | ||||||||||
Bear Stearns Asset-Backed Securities Trust | ||||||||||||
6.200% due 07/25/2034 •(j) | 5,720 | 5,607 | ||||||||||
BNC Mortgage Loan Trust | ||||||||||||
5.440% due 05/25/2037 •(j) | 16,250 | 13,458 | ||||||||||
Cologix Canadian Issuer LP | ||||||||||||
7.740% due 01/25/2052 | CAD | 5,400 | 3,666 | |||||||||
Countrywide Asset-Backed Certificates Trust | ||||||||||||
5.400% due 06/25/2047 •(j) | $ | 10,195 | 7,708 | |||||||||
5.410% due 06/25/2047 •(j) | 14,675 | 11,471 | ||||||||||
5.645% due 03/25/2037 •(j) | 11,382 | 9,786 | ||||||||||
6.120% due 08/25/2047 | 2,000 | 1,462 | ||||||||||
Deer Park CLO DAC | ||||||||||||
0.000% due 10/15/2034 ~ | EUR | 4,000 | 2,399 | |||||||||
Duke Funding Ltd. | ||||||||||||
5.711% due 04/08/2039 •(j) | $ | 125,567 | 9,917 | |||||||||
First Franklin Mortgage Loan Trust | ||||||||||||
5.460% due 10/25/2036 •(j) | 15,000 | 12,047 | ||||||||||
Flagship Credit Auto Trust | ||||||||||||
0.000% due 06/15/2029 «(f) | 25 | 4,537 | ||||||||||
GSAMP Trust | ||||||||||||
5.570% due 05/25/2046 •(j) | 10,425 | 8,074 | ||||||||||
6.095% due 07/25/2045 •(j) | 15,226 | 11,408 | ||||||||||
Home Equity Mortgage Loan Asset-Backed Trust | ||||||||||||
6.065% due 10/25/2035 •(j) | 11,200 | 8,820 | ||||||||||
HSI Asset Securitization Corp. Trust | ||||||||||||
5.960% due 12/25/2035 •(j) | 13,243 | 9,985 | ||||||||||
LendingPoint Pass-Through Trust | ||||||||||||
0.000% due 04/15/2028 «(f) | 7,600 | 2,066 | ||||||||||
0.000% due 05/15/2028 «(f) | 7,554 | 2,212 | ||||||||||
Long Beach Mortgage Loan Trust | ||||||||||||
6.725% due 02/25/2035 •(j) | 10,153 | 8,289 | ||||||||||
Merrill Lynch Mortgage Investors Trust | ||||||||||||
6.200% due 04/25/2036 •(j) | 5,905 | 5,045 | ||||||||||
PRET LLC | ||||||||||||
6.170% due 07/25/2051 þ(j) | 11,600 | 10,849 | ||||||||||
7.870% due 06/25/2052 þ(j) | 6,600 | 6,326 | ||||||||||
RR 1 Ltd. | ||||||||||||
0.000% due 07/15/2117 ~ | 3,200 | 1,377 | ||||||||||
PRINCIPAL AMOUNT (000S) | MARKET VALUE (000S) | |||||||||||
RR 17 Ltd. | ||||||||||||
0.000% due 07/15/2034 ~ | $ | 4,000 | $ | 2,646 | ||||||||
RR 7 Ltd. | ||||||||||||
0.000% due 01/15/2120 ~ | 14,600 | 7,583 | ||||||||||
Saxon Asset Securities Trust | ||||||||||||
5.440% due 01/25/2047 •(j) | 1,706 | 1,514 | ||||||||||
Securitized Asset-Backed Receivables LLC Trust | ||||||||||||
5.750% due 11/25/2035 •(j) | 6,446 | 5,240 | ||||||||||
SMB Private Education Loan Trust | ||||||||||||
0.000% due 11/16/2054 «(f) | 9 | 7,753 | ||||||||||
0.000% due 02/16/2055 «(f) | 5 | 6,414 | ||||||||||
5.950% due 02/16/2055 (j) | 5,730 | 5,338 | ||||||||||
Structured Asset Securities Corp. Mortgage Loan Trust | ||||||||||||
6.575% due 02/25/2036 •(j) | 6,876 | 6,269 | ||||||||||
Total Asset-Backed Securities (Cost $259,351) | 222,770 | |||||||||||
SOVEREIGN ISSUES 0.9% | ||||||||||||
Russia Government International Bond | ||||||||||||
5.625% due 04/04/2042 ^(c) | 8,800 | 6,001 | ||||||||||
5.875% due 09/16/2043 ^(c) | 200 | 126 | ||||||||||
12.750% due 06/24/2028 ^(c) | 100 | 99 | ||||||||||
Total Sovereign Issues (Cost $2,840) | 6,226 | |||||||||||
SHARES | ||||||||||||
MUTUAL FUNDS 0.0% | ||||||||||||
RLM LLC | 10 | 0 | ||||||||||
Total Mutual Funds (Cost $0) | 0 | |||||||||||
COMMON STOCKS 1.8% | ||||||||||||
CONSUMER DISCRETIONARY 0.0% | ||||||||||||
Steinhoff CVR «(d) | 39,030,027 | 0 | ||||||||||
FINANCIALS 0.4% | ||||||||||||
ADLER Group SA «(d) | 157,845 | 84 | ||||||||||
Banca Monte dei Paschi di Siena SpA (d) | 1,073,500 | 2,696 | ||||||||||
| 2,780 | ||||||||||||
INDUSTRIALS 1.3% | ||||||||||||
Syniverse Holdings, Inc. «(h) | 9,444,241 | 8,692 | ||||||||||
REAL ESTATE 0.1% | ||||||||||||
ADLER Group SA | 349,513 | 211 | ||||||||||
Total Common Stocks (Cost $11,372) | 11,683 | |||||||||||
PREFERRED SECURITIES 0.9% | ||||||||||||
BANKING & FINANCE 0.0% | ||||||||||||
SVB Financial Group | ||||||||||||
4.000% due 05/15/2026 ^(c)(g) | 200,000 | 14 | ||||||||||
FINANCIALS 0.9% | ||||||||||||
Stichting AK Rabobank Certificaten | ||||||||||||
6.500% due 12/29/2049 þ(g) | 5,728,525 | 5,812 | ||||||||||
SVB Financial Group | ||||||||||||
4.250% due 11/15/2026 ^(c)(g) | 100,000 | 7 | ||||||||||
4.700% due 11/15/2031 ^(c)(g) | 190,000 | 14 | ||||||||||
| 5,833 | ||||||||||||
Total Preferred Securities (Cost $8,211) | 5,847 | |||||||||||
REAL ESTATE INVESTMENT TRUSTS 1.3% | ||||||||||||
FINANCIALS 1.3% | ||||||||||||
KKR Real Estate Finance Trust, Inc. | 203,500 | 2,477 | ||||||||||
| See Accompanying Notes | ANNUAL REPORT | | | JUNE 30, 2023 | 67 |
Consolidated Schedule of Investments | PIMCO Access Income Fund | (Cont.) |
SHARES | MARKET VALUE (000S) | |||||||||||
Starwood Property Trust, Inc. | 175,100 | $ | 3,397 | |||||||||
TPG RE Finance Trust, Inc. | 346,700 | 2,569 | ||||||||||
Total Real Estate Investment Trusts (Cost $12,894) | 8,443 | |||||||||||
SHORT-TERM INSTRUMENTS 25.5% | ||||||||||||
REPURCHASE AGREEMENTS (i) 24.0% | ||||||||||||
| 156,900 | ||||||||||||
PRINCIPAL AMOUNT (000S) | MARKET VALUE (000S) | |||||||||||
U.S. TREASURY BILLS 1.5% | ||||||||||||
5.191% due 08/10/2023 - 09/14/2023 (e)(f)(j)(m) | $ | 9,707 | $ | 9,638 | ||||||||
Total Short-Term Instruments (Cost $166,539) | 166,538 | |||||||||||
Total Investments in Securities (Cost $1,361,909) | 1,197,085 | |||||||||||
Total Investments 183.1% (Cost $1,361,909) | $ | 1,197,085 | ||||||||||
Financial Derivative Instruments (k)(l) 0.1% (Cost or Premiums, net $12,173) | 814 | |||||||||||
Other Assets and Liabilities, net (83.2)% | (544,008 | ) | ||||||||||
Net Assets 100.0% | $ | 653,891 | ||||||||||
* | A zero balance may reflect actual amounts rounding to less than one thousand. |
^ | Security is in default. |
« | Security valued using significant unobservable inputs (Level 3). |
µ | All or a portion of this amount represents unfunded loan commitments. The interest rate for the unfunded portion will be determined at the time of funding. See Note 4, Securities and Other Investments, in the Notes to Financial Statements for more information regarding unfunded loan commitments. |
~ | Variable or Floating rate security. Rate shown is the rate in effect as of period end. Certain variable rate securities are not based on a published reference rate and spread, rather are determined by the issuer or agent and are based on current market conditions. Reference rate is as of reset date, which may vary by security. These securities may not indicate a reference rate and/or spread in their description. |
• | Rate shown is the rate in effect as of period end. The rate may be based on a fixed rate, a capped rate or a floor rate and may convert to a variable or floating rate in the future. These securities do not indicate a reference rate and spread in their description. |
þ | Coupon represents a rate which changes periodically based on a predetermined schedule or event. Rate shown is the rate in effect as of period end. |
(a) | Security is an Interest Only (“IO”) or IO Strip. |
(b) | Payment in-kind security. |
(c) | Security is not accruing income as of the date of this report. |
(d) | Security did not produce income within the last twelve months. |
(e) | Coupon represents a weighted average yield to maturity. |
(f) | Zero coupon security. |
(g) | Perpetual maturity; date shown, if applicable, represents next contractual call date. |
Issuer Description | Acquisition Date | Cost | Market Value | Market Value as Percentage of Net Assets | ||||||||||||||||||||
Syniverse Holdings, Inc. | 05/12/2022 - 05/31/2023 | $ | 9,278 | $ | 8,692 | 1.33% | ||||||||||||||||||
Counterparty | Lending Rate | Settlement Date | Maturity Date | Principal Amount | Collateralized By | Collateral (Received) | Repurchase Agreements, at Value | Repurchase Agreement Proceeds to be Received (1) | ||||||||||||||||||||||
| BPS | 5.100 | % | 06/30/2023 | 07/03/2023 | $ | 70,200 | U.S. Treasury Inflation Protected Securities 1.000% due 02/15/2049 | $ | (72,716 | ) | $ | 70,200 | $ | 70,230 | ||||||||||||||||
| 5.120 | 06/30/2023 | 07/03/2023 | 10,800 | U.S. Treasury Notes 2.750% due 04/30/2027 | (11,011 | ) | 10,800 | 10,804 | ||||||||||||||||||||||
| 5.140 | 07/03/2023 | 07/05/2023 | 69,800 | U.S. Treasury Notes 0.375% due 04/30/2025 | (71,223 | ) | 69,800 | 69,800 | ||||||||||||||||||||||
| MBC | 5.160 | 06/30/2023 | 07/03/2023 | 6,100 | U.S. Treasury Notes 4.125% due 11/15/2032 | (6,302 | ) | 6,100 | 6,103 | |||||||||||||||||||||
Total Repurchase Agreements | $ | (161,252 | ) | $ | 156,900 | $ | 156,937 | |||||||||||||||||||||||
68 | PIMCO CLOSED-END FUNDS | See Accompanying Notes |
| June 30, 2023 |
Counterparty | Borrowing Rate (2) | Settlement Date | Maturity Date | Amount Borrowed (2) | Payable for Reverse Repurchase Agreements | |||||||||||||||||||
BOS | 6.360 | % | 06/05/2023 | 10/03/2023 | $ | (4,241 | ) | $ | (4,262 | ) | ||||||||||||||
BPS | 3.700 | 05/10/2023 | TBD | (3) | EUR | (14,334 | ) | (15,723 | ) | |||||||||||||||
| 5.740 | 03/14/2023 | 07/14/2023 | $ | (18,549 | ) | (18,869 | ) | |||||||||||||||||
| 6.310 | 04/13/2023 | 10/10/2023 | (7,978 | ) | (8,089 | ) | ||||||||||||||||||
| 6.310 | 04/19/2023 | 10/17/2023 | (2,465 | ) | (2,498 | ) | ||||||||||||||||||
| 6.310 | 05/10/2023 | 11/02/2023 | (4,040 | ) | (4,079 | ) | ||||||||||||||||||
| 6.310 | 06/15/2023 | 10/10/2023 | (34,101 | ) | (34,208 | ) | ||||||||||||||||||
| 6.410 | 04/19/2023 | 10/17/2023 | (3,153 | ) | (3,195 | ) | ||||||||||||||||||
BRC | 3.750 | 05/10/2023 | TBD | (3) | EUR | (8,305 | ) | (9,110 | ) | |||||||||||||||
| 5.990 | 04/14/2023 | 07/14/2023 | $ | (5,515 | ) | (5,588 | ) | |||||||||||||||||
| 6.000 | 01/23/2023 | 07/24/2023 | (14,559 | ) | (14,950 | ) | ||||||||||||||||||
| 6.000 | 04/21/2023 | 07/24/2023 | (1,482 | ) | (1,500 | ) | ||||||||||||||||||
| 6.005 | 01/05/2023 | 07/05/2023 | (13,237 | ) | (13,632 | ) | ||||||||||||||||||
| 6.090 | 01/30/2023 | 08/30/2023 | (2,848 | ) | (2,922 | ) | ||||||||||||||||||
| 6.200 | 05/01/2023 | 08/29/2023 | (45,509 | ) | (46,003 | ) | ||||||||||||||||||
| 6.250 | 02/15/2023 | 09/15/2023 | (6,361 | ) | (6,513 | ) | ||||||||||||||||||
| 6.250 | 03/10/2023 | 09/15/2023 | (935 | ) | (953 | ) | ||||||||||||||||||
| 6.310 | 05/24/2023 | 08/24/2023 | (5,774 | ) | (5,814 | ) | ||||||||||||||||||
| 6.420 | 04/19/2023 | 10/19/2023 | (6,142 | ) | (6,224 | ) | ||||||||||||||||||
BYR | 5.770 | 03/24/2023 | 09/20/2023 | (2,269 | ) | (2,304 | ) | |||||||||||||||||
| 5.780 | 04/13/2023 | 10/10/2023 | (14,999 | ) | (15,192 | ) | ||||||||||||||||||
DBL | 6.199 | 06/20/2023 | 08/17/2023 | (8,464 | ) | (8,483 | ) | |||||||||||||||||
| 6.738 | 06/09/2023 | 08/10/2023 | (7,591 | ) | (7,625 | ) | ||||||||||||||||||
| 6.779 | 06/29/2023 | 08/31/2023 | (12,434 | ) | (12,443 | ) | ||||||||||||||||||
JML | 2.250 | 05/10/2023 | TBD | (3) | EUR | (688 | ) | (753 | ) | |||||||||||||||
| 3.810 | 06/30/2023 | 09/08/2023 | (4,639 | ) | (5,064 | ) | ||||||||||||||||||
JPS | 6.287 | 02/14/2023 | 10/12/2023 | $ | (12,361 | ) | (12,661 | ) | ||||||||||||||||
| 6.320 | 04/18/2023 | 10/16/2023 | (1,582 | ) | (1,603 | ) | ||||||||||||||||||
| 6.420 | 04/18/2023 | 10/16/2023 | (1,406 | ) | (1,425 | ) | ||||||||||||||||||
MEI | 3.914 | 05/18/2023 | 09/18/2023 | EUR | (3,112 | ) | (3,413 | ) | ||||||||||||||||
| 5.430 | 06/19/2023 | 09/19/2023 | GBP | (6,554 | ) | (8,341 | ) | |||||||||||||||||
| 5.680 | 06/19/2023 | 09/19/2023 | (5,758 | ) | (7,328 | ) | ||||||||||||||||||
| 5.730 | 06/19/2023 | 09/19/2023 | (6,946 | ) | (8,841 | ) | ||||||||||||||||||
MSB | 6.310 | 05/08/2023 | 11/06/2023 | $ | (8,091 | ) | (8,171 | ) | ||||||||||||||||
| 6.310 | 05/15/2023 | 11/13/2023 | (9,864 | ) | (9,948 | ) | ||||||||||||||||||
| 6.360 | 05/08/2023 | 11/06/2023 | (5,098 | ) | (5,148 | ) | ||||||||||||||||||
| 6.410 | 05/15/2023 | 11/13/2023 | (6,957 | ) | (7,017 | ) | ||||||||||||||||||
MZF | 6.490 | 06/07/2023 | 12/07/2023 | (64,292 | ) | (64,594 | ) | |||||||||||||||||
RBC | 6.510 | 05/08/2023 | 11/08/2023 | (3,276 | ) | (3,309 | ) | |||||||||||||||||
RDR | 5.540 | 06/12/2023 | 07/12/2023 | (209 | ) | (210 | ) | |||||||||||||||||
SOG | 3.995 | 06/23/2023 | 08/23/2023 | EUR | (12,347 | ) | (13,488 | ) | ||||||||||||||||
| 5.480 | 01/04/2023 | 07/03/2023 | $ | (4,113 | ) | (4,226 | ) | |||||||||||||||||
| 5.520 | 02/02/2023 | 08/02/2023 | (7,256 | ) | (7,424 | ) | ||||||||||||||||||
| 5.620 | 04/12/2023 | 10/12/2023 | (2,621 | ) | (2,654 | ) | ||||||||||||||||||
| 5.770 | 05/12/2023 | 11/13/2023 | (5,549 | ) | (5,595 | ) | ||||||||||||||||||
| 5.770 | 07/03/2023 | 01/03/2024 | (3,317 | ) | (3,317 | ) | ||||||||||||||||||
| 5.780 | 02/03/2023 | 08/03/2023 | (8,477 | ) | (8,677 | ) | ||||||||||||||||||
| 6.210 | 03/07/2023 | 08/04/2023 | (9,000 | ) | (9,178 | ) | ||||||||||||||||||
| 6.285 | 05/15/2023 | 11/15/2023 | (839 | ) | (846 | ) | ||||||||||||||||||
| 6.310 | 05/03/2023 | 11/02/2023 | (800 | ) | (809 | ) | ||||||||||||||||||
| 6.360 | 05/03/2023 | 11/02/2023 | (6,175 | ) | (6,241 | ) | ||||||||||||||||||
| 6.410 | 05/03/2023 | 11/02/2023 | (2,745 | ) | (2,774 | ) | ||||||||||||||||||
TDM | 5.370 | 05/05/2023 | TBD | (3) | (2,371 | ) | (2,392 | ) | ||||||||||||||||
UBS | 3.850 | 04/17/2023 | 08/18/2023 | EUR | (2,505 | ) | (2,756 | ) | ||||||||||||||||
| 6.110 | 01/27/2023 | 07/27/2023 | $ | (844 | ) | (867 | ) | |||||||||||||||||
| 6.360 | 06/16/2023 | 08/16/2023 | (2,808 | ) | (2,817 | ) | ||||||||||||||||||
| 6.430 | 04/19/2023 | 10/19/2023 | (9,337 | ) | (9,462 | ) | ||||||||||||||||||
| 6.590 | 06/05/2023 | 12/05/2023 | (11,985 | ) | (12,047 | ) | ||||||||||||||||||
| 6.770 | 06/30/2023 | 01/04/2024 | (14,804 | ) | (14,812 | ) | ||||||||||||||||||
Total Reverse Repurchase Agreements | $ | (508,387 | ) | |||||||||||||||||||||
| See Accompanying Notes | ANNUAL REPORT | | | JUNE 30, 2023 | 69 |
Consolidated Schedule of Investments | PIMCO Access Income Fund | (Cont.) |
Counterparty | Repurchase Agreement Proceeds to be Received (1) | Payable for Reverse Repurchase Agreements | Payable for Sale-Buyback Transactions | Total Borrowings and Other Financing Transactions | Collateral Pledged/(Received) | Net Exposure (4) | ||||||||||||||||||
Global/Master Repurchase Agreement | ||||||||||||||||||||||||
BOS | $ | 0 | $ | (4,262 | ) | $ | 0 | $ | (4,262 | ) | $ | 5,310 | $ | 1,048 | ||||||||||
BPS | 150,834 | (86,661 | ) | 0 | 64,173 | (48,185 | ) | 15,988 | ||||||||||||||||
BRC | 0 | (113,209 | ) | 0 | (113,209 | ) | 138,471 | 25,262 | ||||||||||||||||
BYR | 0 | (17,496 | ) | 0 | (17,496 | ) | 20,958 | 3,462 | ||||||||||||||||
DBL | 0 | (28,551 | ) | 0 | (28,551 | ) | 39,098 | 10,547 | ||||||||||||||||
JML | 0 | (5,817 | ) | 0 | (5,817 | ) | 6,517 | 700 | ||||||||||||||||
JPS | 0 | (15,689 | ) | 0 | (15,689 | ) | 19,811 | 4,122 | ||||||||||||||||
MBC | 6,103 | 0 | 0 | 6,103 | (6,302 | ) | (199 | ) | ||||||||||||||||
MEI | 0 | (27,923 | ) | 0 | (27,923 | ) | 36,389 | 8,466 | ||||||||||||||||
MSB | 0 | (30,284 | ) | 0 | (30,284 | ) | 40,530 | 10,246 | ||||||||||||||||
MZF | 0 | (64,594 | ) | 0 | (64,594 | ) | 90,308 | 25,714 | ||||||||||||||||
RBC | 0 | (3,309 | ) | 0 | (3,309 | ) | 5,544 | 2,235 | ||||||||||||||||
RDR | 0 | (210 | ) | 0 | (210 | ) | 222 | 12 | ||||||||||||||||
SOG | 0 | (65,229 | ) | 0 | (65,229 | ) | 76,720 | 11,491 | ||||||||||||||||
TDM | 0 | (2,392 | ) | 0 | (2,392 | ) | 2,734 | 342 | ||||||||||||||||
UBS | 0 | (42,761 | ) | 0 | (42,761 | ) | 59,321 | 16,560 | ||||||||||||||||
Total Borrowings and Other Financing Transactions | $ | 156,937 | $ | (508,387 | ) | $ | 0 | |||||||||||||||||
Overnight and Continuous | Up to 30 days | 31-90 days | Greater Than 90 days | Total | ||||||||||||||||
Reverse Repurchase Agreements | ||||||||||||||||||||
Corporate Bonds & Notes | $ | 0 | $ | (23,304 | ) | $ | (38,062 | ) | $ | (58,679 | ) | $ | (120,045 | ) | ||||||
Non-Agency Mortgage-Backed Securities | 0 | (36,536 | ) | (107,193 | ) | (104,237 | ) | (247,966 | ) | |||||||||||
Asset-Backed Securities | 0 | 0 | (20,068 | ) | (111,927 | ) | (131,995 | ) | ||||||||||||
Preferred Securities | 0 | 0 | (5,064 | ) | 0 | (5,064 | ) | |||||||||||||
Total Borrowings | $ | 0 | $ | (59,840 | ) | $ | (170,387 | ) | $ | (274,843 | ) | $ | (505,070 | ) | ||||||
Payable for reverse repurchase agreements (5) | $ | (505,070 | ) | |||||||||||||||||
(j) | Securities with an aggregate market value of $642,366 and cash of $6,332 have been pledged as collateral under the terms of the above master agreements as of June 30, 2023. |
(1) | Includes accrued interest. |
(2) | The average amount of borrowings outstanding during the period ended June 30, 2023 was $(556,299) at a weighted average interest rate of 4.423%. Average borrowings may include reverse repurchase agreements and sale-buyback transactions, if held during the period. |
(3) | Open maturity reverse repurchase agreement. |
(4) | Net Exposure represents the net receivable/(payable) that would be due from/to the counterparty in the event of default. Exposure from borrowings and other financing transactions can only be netted across transactions governed under the same master agreement with the same legal entity. See Note 8, Master Netting Arrangements, in the Notes to Financial Statements for more information. |
(5) | Unsettled reverse repurchase agreements liability of $(3,317) is outstanding at period end. |
Description | Expiration Month | # of Contracts | Notional Amount | Unrealized Appreciation/ (Depreciation) | Variation Margin | |||||||||||||||||||
Asset | Liability | |||||||||||||||||||||||
3-Month SOFR Active Contract December Futures | 03/2024 | 32 | $ | (7,571 | ) | $ | 215 | $ | 0 | $ | (3 | ) | ||||||||||||
3-Month SOFR Active Contract December Futures | 03/2025 | 17 | (4,079 | ) | 76 | 2 | 0 | |||||||||||||||||
3-Month SOFR Active Contract December Futures | 03/2026 | 18 | (4,344 | ) | 59 | 0 | 0 | |||||||||||||||||
3-Month SOFR Active Contract June Futures | 09/2024 | 20 | (4,762 | ) | 117 | 0 | 0 | |||||||||||||||||
3-Month SOFR Active Contract June Futures | 09/2025 | 17 | (4,095 | ) | 63 | 1 | 0 | |||||||||||||||||
3-Month SOFR Active Contract March Futures | 06/2024 | 28 | (6,642 | ) | 180 | 0 | (1 | ) | ||||||||||||||||
70 | PIMCO CLOSED-END FUNDS | See Accompanying Notes |
| June 30, 2023 |
Description | Expiration Month | # of Contracts | Notional Amount | Unrealized Appreciation/ (Depreciation) | Variation Margin | |||||||||||||||||||
Asset | Liability | |||||||||||||||||||||||
3-Month SOFR Active Contract March Futures | 06/2025 | 15 | $ | (3,608 | ) | $ | 60 | $ | 1 | $ | 0 | |||||||||||||
3-Month SOFR Active Contract March Futures | 06/2026 | 16 | (3,863 | ) | 49 | 0 | 0 | |||||||||||||||||
3-Month SOFR Active Contract September Futures | 12/2024 | 19 | (4,542 | ) | 98 | 2 | 0 | |||||||||||||||||
3-Month SOFR Active Contract September Futures | 12/2025 | 13 | (3,135 | ) | 45 | 1 | 0 | |||||||||||||||||
Total Futures Contracts | $ | 962 | $ | 7 | $ | (4 | ) | |||||||||||||||||
Pay/ Receive Floating Rate | Floating Rate Index | Fixed Rate | Payment Frequency | Maturity Date | Notional Amount | Premiums Paid/(Received) | Unrealized Appreciation/ (Depreciation) | Market Value | Variation Margin | |||||||||||||||||||||||||||||||
Asset | Liability | |||||||||||||||||||||||||||||||||||||||
Receive (1) | 1-Day USD-SOFR Compounded-OIS | 2.450 | % | Annual | 12/20/2024 | $ | 32,400 | $ | (2 | ) | $ | 768 | $ | 766 | $ | 0 | $ | (6 | ) | |||||||||||||||||||||
Pay | 1-Day USD-SOFR Compounded-OIS | 4.800 | Annual | 12/21/2024 | 146,000 | 42 | (690 | ) | (648 | ) | 50 | 0 | ||||||||||||||||||||||||||||
Receive (1) | 1-Day USD-SOFR Compounded-OIS | 2.350 | Annual | 01/17/2025 | 16,200 | 2 | 378 | 380 | 0 | (4 | ) | |||||||||||||||||||||||||||||
Receive (1) | 1-Day USD-SOFR Compounded-OIS | 2.300 | Annual | 01/17/2026 | 2,600 | 1 | 94 | 95 | 0 | 0 | ||||||||||||||||||||||||||||||
Pay | 1-Day USD-SOFR Compounded-OIS | 4.150 | Annual | 12/21/2027 | 185,900 | (49 | ) | 563 | 514 | 53 | 0 | |||||||||||||||||||||||||||||
Pay (1) | 1-Day USD-SOFR Compounded-OIS | 3.750 | Annual | 12/20/2028 | 76,900 | 639 | (395 | ) | 244 | 47 | 0 | |||||||||||||||||||||||||||||
Receive | 1-Day USD-SOFR Compounded-OIS | 1.750 | Annual | 06/15/2052 | 25,600 | 6,320 | 527 | 6,847 | 0 | (216 | ) | |||||||||||||||||||||||||||||
Receive | 1-Day USD-SOFR Compounded-OIS | 1.750 | Annual | 12/21/2052 | 17,400 | 4,191 | 734 | 4,925 | 0 | (150 | ) | |||||||||||||||||||||||||||||
Receive | 1-Day USD-SOFR Compounded-OIS | 3.400 | Annual | 12/21/2052 | 22,900 | 40 | (739 | ) | (699 | ) | 0 | (244 | ) | |||||||||||||||||||||||||||
Receive | 6-Month EUR-EURIBOR | 0.500 | Annual | 09/21/2052 | EUR | 7,800 | 676 | 2,845 | 3,521 | 40 | 0 | |||||||||||||||||||||||||||||
Receive (1) | 6-Month EUR-EURIBOR | 0.830 | Annual | 12/09/2052 | 22,900 | 313 | 935 | 1,248 | 5 | 0 | ||||||||||||||||||||||||||||||
Total Swap Agreements | $ | 12,173 | $ | 5,020 | $ | 17,193 | $ | 195 | $ | (620 | ) | |||||||||||||||||||||||||||||
Financial Derivative Assets | Financial Derivative Liabilities | |||||||||||||||||||||||||||||||||||
Market Value | Variation Margin Asset | Total | Market Value | Variation Margin Liability | Total | |||||||||||||||||||||||||||||||
Purchased Options | Futures | Swap Agreements | Written Options | Futures | Swap Agreements | |||||||||||||||||||||||||||||||
Total Exchange-Traded or Centrally Cleared | $ | 0 | $ | 7 | $ | 195 | $ | 202 | $ | 0 | $ | (4) | $ | (620) | $ | (624) | ||||||||||||||||||||
(1) | This instrument has a forward starting effective date. See Note 2, Securities Transactions and Investment Income, in the Notes to Financial Statements for further information. |
Counterparty | Settlement Month | Currency to be Delivered | Currency to be Received | Unrealized Appreciation/ (Depreciation) | ||||||||||||||||||||
Asset | Liability | |||||||||||||||||||||||
BOA | 08/2023 | EUR | 2,185 | $ | 2,400 | $ | 11 | $ | 0 | |||||||||||||||
| 08/2023 | $ | 25 | AUD | 37 | 0 | 0 | ||||||||||||||||||
| 08/2023 | 2,059 | EUR | 1,899 | 18 | 0 | |||||||||||||||||||
BPS | 08/2023 | EUR | 4,189 | $ | 4,526 | 4 | (59 | ) | ||||||||||||||||
| 08/2023 | $ | 1,197 | EUR | 1,114 | 21 | 0 | ||||||||||||||||||
BRC | 08/2023 | GBP | 2,240 | $ | 2,839 | 9 | (16 | ) | ||||||||||||||||
CBK | 08/2023 | CAD | 1,925 | 1,443 | 0 | (11 | ) | |||||||||||||||||
| 08/2023 | EUR | 514 | 563 | 1 | 0 | |||||||||||||||||||
| 08/2023 | $ | 1,860 | EUR | 1,711 | 11 | 0 | ||||||||||||||||||
JPM | 08/2023 | CAD | 3,164 | $ | 2,367 | 0 | (23 | ) | ||||||||||||||||
| 08/2023 | EUR | 700 | 757 | 0 | (8 | ) | ||||||||||||||||||
| 08/2023 | GBP | 6,889 | 8,726 | 0 | (26 | ) | ||||||||||||||||||
| 08/2023 | $ | 583 | EUR | 529 | 0 | (4 | ) | |||||||||||||||||
MBC | 08/2023 | EUR | 128,265 | $ | 141,537 | 1,285 | 0 | |||||||||||||||||
RBC | 08/2023 | GBP | 1,331 | 1,682 | 0 | (9 | ) | |||||||||||||||||
SCX | 08/2023 | $ | 13,363 | EUR | 12,340 | 130 | 0 | |||||||||||||||||
UAG | 08/2023 | GBP | 6,035 | $ | 7,628 | 0 | (38 | ) | ||||||||||||||||
| 08/2023 | $ | 6,056 | EUR | 5,491 | 0 | (52 | ) | |||||||||||||||||
Total Forward Foreign Currency Contracts | $ | 1,490 | $ | (246 | ) | |||||||||||||||||||
| See Accompanying Notes | ANNUAL REPORT | | | JUNE 30, 2023 | 71 |
Consolidated Schedule of Investments | PIMCO Access Income Fund | (Cont.) |
Counterparty | Pay/Receive | Underlying Reference | Financing Rate | Payment Frequency | Maturity Date | Notional Amount | Premiums Paid/(Received) | Unrealized Appreciation/ (Depreciation) | Swap Agreements, at Value | |||||||||||||||||||||||||
Asset | Liability | |||||||||||||||||||||||||||||||||
| BPS | Pay | AP Core Holdings II, LLC | 1-Month USD-LIBOR | Quarterly | 07/31/2023 | $ | 300 | $ | 0 | $ | 72 | $ | 72 | $ | 0 | |||||||||||||||||||
| BPS | Pay | PUG LLC | 1-Month USD-LIBOR | Quarterly | 07/31/2023 | 282 | 0 | 29 | 29 | 0 | ||||||||||||||||||||||||
| BPS | Pay | Team Health Holdings, Inc. | 1-Month USD-LIBOR | Quarterly | 07/31/2023 | 1,492 | 0 | (139 | ) | 0 | (139 | ) | ||||||||||||||||||||||
| BPS | Pay | Veritas US Inc. | 1-Month USD-LIBOR | Quarterly | 07/31/2023 | 730 | 0 | 30 | 30 | 0 | ||||||||||||||||||||||||
Total Swap Agreements | $ | 0 | $ | (8 | ) | $ | 131 | $ | (139 | ) | ||||||||||||||||||||||||
Financial Derivative Assets | Financial Derivative Liabilities | |||||||||||||||||||||||||||||||||||||||||||||||
Counterparty | Forward Foreign Currency Contracts | Purchased Options | Swap Agreements | Total Over the Counter | Forward Foreign Currency Contracts | Written Options | Swap Agreements | Total Over the Counter | Net Market Value of OTC Derivatives | Collateral Pledged/ (Received) | Net Exposure (1) | |||||||||||||||||||||||||||||||||||||
BOA | $ | 29 | $ | 0 | $ | 0 | $ | 29 | $ | 0 | $ | 0 | $ | 0 | $ | 0 | $ | 29 | $ | 0 | $ | 29 | ||||||||||||||||||||||||||
BPS | 25 | 0 | 131 | 156 | (59 | ) | 0 | (139 | ) | (198 | ) | (42 | ) | 579 | 537 | |||||||||||||||||||||||||||||||||
BRC | 9 | 0 | 0 | 9 | (16 | ) | 0 | 0 | (16 | ) | (7 | ) | 0 | (7 | ) | |||||||||||||||||||||||||||||||||
CBK | 12 | 0 | 0 | 12 | (11 | ) | 0 | 0 | (11 | ) | 1 | 0 | 1 | |||||||||||||||||||||||||||||||||||
JPM | 0 | 0 | 0 | 0 | (61 | ) | 0 | 0 | (61 | ) | (61 | ) | 0 | (61 | ) | |||||||||||||||||||||||||||||||||
MBC | 1,285 | 0 | 0 | 1,285 | 0 | 0 | 0 | 0 | 1,285 | (1,550 | ) | (265 | ) | |||||||||||||||||||||||||||||||||||
RBC | 0 | 0 | 0 | 0 | (9 | ) | 0 | 0 | (9 | ) | (9 | ) | 0 | (9 | ) | |||||||||||||||||||||||||||||||||
SCX | 130 | 0 | 0 | 130 | 0 | 0 | 0 | 0 | 130 | 0 | 130 | |||||||||||||||||||||||||||||||||||||
UAG | 0 | 0 | 0 | 0 | (90 | ) | 0 | 0 | (90 | ) | (90 | ) | 0 | (90 | ) | |||||||||||||||||||||||||||||||||
Total Over the Counter | $ | 1,490 | $ | 0 | $ | 131 | $ | 1,621 | $ | (246 | ) | $ | 0 | $ | (139 | ) | $ | (385 | ) | |||||||||||||||||||||||||||||
(m) | Securities with an aggregate market value of $579 have been pledged as collateral for financial derivative instruments as governed by International Swaps and Derivatives Association, Inc. master agreements as of June 30, 2023. |
(1) | Net Exposure represents the net receivable/(payable) that would be due from/to the counterparty in the event of default. Exposure from OTC derivatives can only be netted across transactions governed under the same master agreement with the same legal entity. Note 8, Master Netting Arrangements, in the Notes to Financial Statements for more information. |
Derivatives not accounted for as hedging instruments | ||||||||||||||||||||||||
Commodity Contracts | Credit Contracts | Equity Contracts | Foreign Exchange Contracts | Interest Rate Contracts | Total | |||||||||||||||||||
Financial Derivative Instruments - Assets | ||||||||||||||||||||||||
Exchange-traded or centrally cleared | ||||||||||||||||||||||||
Futures | $ | 0 | $ | 0 | $ | 0 | $ | 0 | $ | 7 | $ | 7 | ||||||||||||
Swap Agreements | 0 | 0 | 0 | 0 | 195 | 195 | ||||||||||||||||||
| $ | 0 | $ | 0 | $ | 0 | $ | 0 | $ | 202 | $ | 202 | |||||||||||||
Over the counter | ||||||||||||||||||||||||
Forward Foreign Currency Contracts | $ | 0 | $ | 0 | $ | 0 | $ | 1,490 | $ | 0 | $ | 1,490 | ||||||||||||
Swap Agreements | 0 | 131 | 0 | 0 | 0 | 131 | ||||||||||||||||||
| $ | 0 | $ | 131 | $ | 0 | $ | 1,490 | $ | 0 | $ | 1,621 | |||||||||||||
| $ | 0 | $ | 131 | $ | 0 | $ | 1,490 | $ | 202 | $ | 1,823 | |||||||||||||
Financial Derivative Instruments - Liabilities | ||||||||||||||||||||||||
Exchange-traded or centrally cleared | ||||||||||||||||||||||||
Futures | $ | 0 | $ | 0 | $ | 0 | $ | 0 | $ | 4 | $ | 4 | ||||||||||||
Swap Agreements | 0 | 0 | 0 | 0 | 620 | 620 | ||||||||||||||||||
| $ | 0 | $ | 0 | $ | 0 | $ | 0 | $ | 624 | $ | 624 | |||||||||||||
72 | PIMCO CLOSED-END FUNDS | See Accompanying Notes |
| June 30, 2023 |
Derivatives not accounted for as hedging instruments | ||||||||||||||||||||||||
Commodity Contracts | Credit Contracts | Equity Contracts | Foreign Exchange Contracts | Interest Rate Contracts | Total | |||||||||||||||||||
Over the counter | ||||||||||||||||||||||||
Forward Foreign Currency Contracts | $ | 0 | $ | 0 | $ | 0 | $ | 246 | $ | 0 | $ | 246 | ||||||||||||
Swap Agreements | 0 | 139 | 0 | 0 | 0 | 139 | ||||||||||||||||||
| $ | 0 | $ | 139 | $ | 0 | $ | 246 | $ | 0 | $ | 385 | |||||||||||||
| $ | 0 | $ | 139 | $ | 0 | $ | 246 | $ | 624 | $ | 1,009 | |||||||||||||
Derivatives not accounted for as hedging instruments | ||||||||||||||||||||||||
Commodity Contracts | Credit Contracts | Equity Contracts | Foreign Exchange Contracts | Interest Rate Contracts | Total | |||||||||||||||||||
Net Realized Gain (Loss) on Financial Derivative Instruments | ||||||||||||||||||||||||
Exchange-traded or centrally cleared | ||||||||||||||||||||||||
Swap Agreements | $ | 0 | $ | 2,045 | $ | 0 | $ | 0 | $ | (6,602 | ) | $ | (4,557 | ) | ||||||||||
Over the counter | ||||||||||||||||||||||||
Forward Foreign Currency Contracts | $ | 0 | $ | 0 | $ | 0 | $ | (4,891 | ) | $ | 0 | $ | (4,891 | ) | ||||||||||
Swap Agreements | 0 | (146 | ) | 0 | 0 | 0 | (146 | ) | ||||||||||||||||
| $ | 0 | $ | (146 | ) | $ | 0 | $ | (4,891 | ) | $ | 0 | $ | (5,037 | ) | ||||||||||
| $ | 0 | $ | 1,899 | $ | 0 | $ | (4,891 | ) | $ | (6,602 | ) | $ | (9,594 | ) | ||||||||||
Net Change in Unrealized Appreciation (Depreciation) on Financial Derivative Instruments | ||||||||||||||||||||||||
Exchange-traded or centrally cleared | ||||||||||||||||||||||||
Futures | $ | 0 | $ | 0 | $ | 0 | $ | 0 | $ | 962 | $ | 962 | ||||||||||||
Swap Agreements | 0 | 2,665 | 0 | 0 | 4,707 | 7,372 | ||||||||||||||||||
| $ | 0 | $ | 2,665 | $ | 0 | $ | 0 | $ | 5,669 | $ | 8,334 | |||||||||||||
Over the counter | ||||||||||||||||||||||||
Forward Foreign Currency Contracts | $ | 0 | $ | 0 | $ | 0 | $ | 374 | $ | 0 | $ | 374 | ||||||||||||
Swap Agreements | 0 | 723 | 0 | 0 | 0 | 723 | ||||||||||||||||||
| $ | 0 | $ | 723 | $ | 0 | $ | 374 | $ | 0 | $ | 1,097 | |||||||||||||
| $ | 0 | $ | 3,388 | $ | 0 | $ | 374 | $ | 5,669 | $ | 9,431 | |||||||||||||
Category and Subcategory | Level 1 | Level 2 | Level 3 | Fair Value at 06/30/2023 | ||||||||||||
Investments in Securities, at Value | ||||||||||||||||
Loan Participations and Assignments | $ | 0 | $ | 128,370 | $ | 95,228 | $ | 223,598 | ||||||||
Corporate Bonds & Notes | ||||||||||||||||
Banking & Finance | 0 | 64,301 | 0 | 64,301 | ||||||||||||
Industrials | 0 | 67,229 | 0 | 67,229 | ||||||||||||
Utilities | 0 | 30,941 | 0 | 30,941 | ||||||||||||
Municipal Bonds & Notes | ||||||||||||||||
Puerto Rico | 0 | 19,008 | 0 | 19,008 | ||||||||||||
Non-Agency Mortgage-Backed Securities | 0 | 370,501 | 0 | 370,501 | ||||||||||||
Asset-Backed Securities | 0 | 199,788 | 22,982 | 222,770 | ||||||||||||
Sovereign Issues | 0 | 6,226 | 0 | 6,226 | ||||||||||||
Common Stocks | ||||||||||||||||
Financials | 2,696 | 0 | 84 | 2,780 | ||||||||||||
Industrials | 0 | 0 | 8,692 | 8,692 | ||||||||||||
Real Estate | 211 | 0 | 0 | 211 | ||||||||||||
Preferred Securities | ||||||||||||||||
Banking & Finance | 0 | 14 | 0 | 14 | ||||||||||||
Financials | 0 | 5,833 | 0 | 5,833 | ||||||||||||
Real Estate Investment Trusts | ||||||||||||||||
Financials | 8,443 | 0 | 0 | 8,443 | ||||||||||||
Category and Subcategory | Level 1 | Level 2 | Level 3 | Fair Value at 06/30/2023 | ||||||||||||
Short-Term Instruments | ||||||||||||||||
Repurchase Agreements | $ | 0 | $ | 156,900 | $ | 0 | $ | 156,900 | ||||||||
U.S. Treasury Bills | 0 | 9,638 | 0 | 9,638 | ||||||||||||
Total Investments | $ | 11,350 | $ | 1,058,749 | $ | 126,986 | $ | 1,197,085 | ||||||||
Financial Derivative Instruments - Assets | ||||||||||||||||
Exchange-traded or centrally cleared | 0 | 202 | 0 | 202 | ||||||||||||
Over the counter | 0 | 1,621 | 0 | 1,621 | ||||||||||||
| $ | 0 | $ | 1,823 | $ | 0 | $ | 1,823 | |||||||||
Financial Derivative Instruments - Liabilities | ||||||||||||||||
Exchange-traded or centrally cleared | 0 | (624 | ) | 0 | (624 | ) | ||||||||||
Over the counter | 0 | (385 | ) | 0 | (385 | ) | ||||||||||
| $ | 0 | $ | (1,009 | ) | $ | 0 | $ | (1,009 | ) | |||||||
Total Financial Derivative Instruments | $ | 0 | $ | 814 | $ | 0 | $ | 814 | ||||||||
Totals | $ | 11,350 | $ | 1,059,563 | $ | 126,986 | $ | 1,197,899 | ||||||||
| See Accompanying Notes | ANNUAL REPORT | | | JUNE 30, 2023 | 73 |
Consolidated Schedule of Investments | PIMCO Access Income Fund | (Cont.) | June 30, 2023 |
Category and Subcategory | Beginning Balance at 06/30/2022 | Net Purchases | Net Sales/ Settlements | Accrued Discounts/ (Premiums) | Realized Gain/(Loss) | Net Change in Unrealized Appreciation/ (Depreciation) (1) | Transfers into Level 3 | Transfers out of Level 3 | Ending Balance at 06/30/2023 | Net Change in Unrealized Appreciation/ (Depreciation) on Investments Held at 06/30/2023 (1) | ||||||||||||||||||||||||||||||
Investments in Securities, at Value | ||||||||||||||||||||||||||||||||||||||||
Loan Participations and Assignments | $ | 71,254 | $ | 61,717 | $ | (14,780 | ) | $ | 3,170 | $ | (11,387 | ) | $ | 1,655 | $ | 1,788 | $ | (18,189 | ) | $ | 95,228 | $ | 2,152 | |||||||||||||||||
Corporate Bonds & Notes | ||||||||||||||||||||||||||||||||||||||||
Industrials | 828 | 16 | 0 | 11 | 0 | (176 | ) | 0 | (679 | ) | 0 | 0 | ||||||||||||||||||||||||||||
Asset-Backed Securities | 45,337 | 3,000 | 0 | 0 | 0 | (19,029 | ) | 0 | (6,326 | ) | 22,982 | (18,718 | ) | |||||||||||||||||||||||||||
Common Stocks | ||||||||||||||||||||||||||||||||||||||||
Financials | 0 | 0 | 0 | 0 | 0 | 84 | 0 | 0 | 84 | 84 | ||||||||||||||||||||||||||||||
Industrials | 8,153 | 1,125 | 0 | 0 | 0 | (586 | ) | 0 | 0 | 8,692 | (586 | ) | ||||||||||||||||||||||||||||
Totals | $ | 125,572 | $ | 65,858 | $ | (14,780 | ) | $ | 3,181 | $ | (11,387 | ) | $ | (18,052 | ) | $ | 1,788 | $ | (25,194 | ) | $ | 126,986 | $ | (17,068 | ) | |||||||||||||||
Category and Subcategory | Ending Balance at 06/30/2023 | Valuation Technique | Unobservable Inputs | (% Unless Noted Otherwise) | ||||||||||||||
Input Value(s) | Weighted Average | |||||||||||||||||
Investments in Securities, at Value | ||||||||||||||||||
Loan Participations and Assignments | $ | 19,648 | Comparable Multiple | EBITDA Multiple | X | 11.000 | — | |||||||||||
| 1,847 | Comparable Multiple | Revenue Multiple | X | 0.675 | — | |||||||||||||
| 6,790 | Discounted Cash Flow | Discounted Rate | 10.270 | — | ||||||||||||||
| 2,401 | Discounted Cash Flow | Discounted Cash Flow | 15.420 | — | ||||||||||||||
| 10,537 | Expect Recovery Valuation | Comparable Bond Price | 60.000 | — | ||||||||||||||
| 1,574 | Other Valuation Techniques (2) | — | — | — | ||||||||||||||
| 17,659 | Proxy Pricing | Base Price | 100.000-100.523 | 100.521 | ||||||||||||||
| 9,411 | Recent Transaction | Price | 98.000 | — | ||||||||||||||
| 11,048 | Recent Transaction | Purchase Price | 97.500-100.000 | 98.550 | ||||||||||||||
| 2,023 | Reference Instruments | Third Party Vendor | 42.000 | — | ||||||||||||||
| 12,290 | Third Party Vendor | Broker Quote | 92.500-97.500 | 96.177 | ||||||||||||||
Asset-Backed Securities | 22,982 | Discounted Cash Flow | Discount Rate | 14.000-20.000 | 16.639 | |||||||||||||
Common Stocks | ||||||||||||||||||
Financials | 84 | Option Pricing Model | Volatility | 56.314 | — | |||||||||||||
Industrials | 8,692 | Discounted Cash Flow | Discount Rate | 14.975 | — | |||||||||||||
Total | $ | 126,986 | ||||||||||||||||
(1) | Any difference between Net Change in Unrealized Appreciation/(Depreciation) and Net Change in Unrealized Appreciation/(Depreciation) on Investments Held at June 30, 2023 may be due to an investment no longer held or categorized as Level 3 at period end. |
(2) | Includes valuation techniques not defined in the Notes to Financial Statements as securities valued using such techniques are not considered significant to the Fund. |
74 | PIMCO CLOSED-END FUNDS | See Accompanying Notes |
Consolidated Schedule of Investments | PIMCO Dynamic Income Fund | June 30, 2023 |
PRINCIPAL AMOUNT (000S) | MARKET VALUE (000S) | |||||||||||
INVESTMENTS IN SECURITIES 172.4% | ||||||||||||
LOAN PARTICIPATIONS AND ASSIGNMENTS 39.3% | ||||||||||||
American Airlines, Inc. | ||||||||||||
10.000% (LIBOR03M + 4.750%) due 04/20/2028 ~ | $ | 8,697 | $ | 8,894 | ||||||||
AmSurg LLC | ||||||||||||
0.500% - 11.000% (PRIME + 2.750%) due 07/20/2026 «~ | 13,878 | 13,896 | ||||||||||
AP Core Holdings LLC | ||||||||||||
10.717% due 09/01/2027 | 3,638 | 3,513 | ||||||||||
10.717% due 09/01/2027 « | 2,351 | 2,280 | ||||||||||
Applegreen Ireland | ||||||||||||
7.077% (EUR003M + 3.500%) due 06/29/2026 «~ | EUR | 8,804 | 8,824 | |||||||||
7.928% due 06/29/2026 « | GBP | 2,500 | 2,925 | |||||||||
Carnival Corp. | ||||||||||||
7.168% (EUR001M + 3.750%) due 06/30/2025 ~ | EUR | 2,439 | 2,655 | |||||||||
CIRCOR International, Inc. | ||||||||||||
TBD% due 06/20/2029 «µ | $ | 1,066 | 1,050 | |||||||||
TBD% due 06/20/2030 « | 10,545 | 10,387 | ||||||||||
Comexposium | ||||||||||||
1.138% - 4.414% (EUR012M + 3.250%) due 03/28/2025 ~ | EUR | 7,874 | 7,389 | |||||||||
4.969% (EUR012M + 4.000%) due 03/28/2026 ~ | 64,126 | 60,178 | ||||||||||
Cromwell EREIT Lux Finco SARL | ||||||||||||
4.761% (EUR003M + 1.500%) due 11/21/2024 «~ | 2,000 | 2,047 | ||||||||||
Diamond Offshore Drilling, Inc. | ||||||||||||
11.202% due 04/22/2027 « | $ | 8,500 | 7,905 | |||||||||
Diamond Sports Group LLC | ||||||||||||
13.064% due 05/25/2026 | 68,230 | 52,815 | ||||||||||
Encina Private Credit LLC | ||||||||||||
TBD% - 9.867% (LIBOR01M + 4.674%) due 11/30/2025 «~µ | 3,950 | 3,818 | ||||||||||
Envision Healthcare Corp. | ||||||||||||
16.070% due 04/29/2027 | 88,763 | 105,850 | ||||||||||
16.695% due 04/28/2028 « | 127,109 | 96,157 | ||||||||||
Espai Barca Fondo De Titulizacion | ||||||||||||
TBD% due 05/31/2028 « | EUR | 23,850 | 25,765 | |||||||||
Exgen Texas Power LLC | ||||||||||||
11.948% (LIBOR03M + 6.750%) due 10/08/2026 «~ | $ | 42,002 | 42,212 | |||||||||
Finastra USA, Inc. | ||||||||||||
9.038% - 9.231% (LIBOR03M + 3.500%) due 06/13/2024 ~ | 18,300 | 17,639 | ||||||||||
Forbes Energy Services LLC | ||||||||||||
TBD% due 12/31/2023 « | 2,666 | 0 | ||||||||||
Gateway Casinos & Entertainment Ltd. | ||||||||||||
13.050% due 10/18/2027 | CAD | 19,351 | 14,616 | |||||||||
13.221% due 10/15/2027 | $ | 88,913 | 88,969 | |||||||||
Gibson Brands, Inc. | ||||||||||||
10.248% (LIBOR03M + 5.000%) due 08/11/2028 ~ | 3,349 | 2,713 | ||||||||||
GIP Blue Holding LP | ||||||||||||
9.717% due 09/29/2028 | 4 | 4 | ||||||||||
Incora | ||||||||||||
TBD% - 13.725% due 03/01/2024 «µ | 50,319 | 50,319 | ||||||||||
Instant Brands Holdings, Inc. | ||||||||||||
TBD% (LIBOR03M + 0.000%) due 04/12/2028 ^~(d) | 3,616 | 788 | ||||||||||
15.217% due 12/12/2023 « | 1,184 | 1,095 | ||||||||||
Intelsat Jackson Holdings SA | ||||||||||||
9.443% due 02/01/2029 | 31,966 | 31,878 | ||||||||||
Ivanti Software, Inc. | ||||||||||||
9.420% (LIBOR01M + 4.250%) due 12/01/2027 ~ | 25,509 | 21,617 | ||||||||||
Lealand Finance Co. BV | ||||||||||||
8.217% due 06/28/2024 | 385 | 308 | ||||||||||
Lealand Finance Co. BV (6.193% Cash and 3.000% PIK) | ||||||||||||
9.193% (LIBOR01M + 1.000%) due 06/30/2025 ~(c) | 5,859 | 3,418 | ||||||||||
PRINCIPAL AMOUNT (000S) | MARKET VALUE (000S) | |||||||||||
LifeMiles Ltd. | ||||||||||||
10.514% (LIBOR03M + 5.250%) due 08/30/2026 «~ | $ | 15,113 | $ | 14,924 | ||||||||
Market Bidco Ltd. | ||||||||||||
8.073% (EUR003M + 4.750%) due 11/04/2027 ~ | EUR | 22,200 | 20,847 | |||||||||
8.991% due 11/04/2027 | GBP | 57,219 | 63,857 | |||||||||
Mediapro | ||||||||||||
11.098% (EUR003M + 7.500%) due 07/29/2027 ~ | EUR | 29,900 | 31,424 | |||||||||
MPH Acquisition Holdings LLC | ||||||||||||
9.726% (LIBOR03M + 4.250%) due 09/01/2028 ~ | $ | 9,825 | 8,807 | |||||||||
NAC Aviation 29 DAC | ||||||||||||
7.501% due 06/30/2026 | 4,871 | 4,332 | ||||||||||
Naked Juice LLC | ||||||||||||
11.342% due 01/24/2030 | 1,300 | 1,044 | ||||||||||
Oi SA | ||||||||||||
TBD% - 14.000% due 09/07/2024 µ | 27,160 | 27,160 | ||||||||||
1.750% (LIBOR06M + 1.750%) due 02/26/2035 ~ | 3,128 | 226 | ||||||||||
Poseidon Bidco SASU | ||||||||||||
8.848% (EUR003M + 5.250%) due 07/14/2028 «~ | EUR | 51,900 | 55,501 | |||||||||
Preylock Reitman Santa Cruz Mezz LLC | ||||||||||||
10.841% due 11/09/2023 «(i) | $ | 37,100 | 36,697 | |||||||||
Profrac Services LLC | ||||||||||||
12.420% due 03/04/2025 | 88,288 | 88,619 | ||||||||||
Project Anfora Senior | ||||||||||||
5.927% (EUR003M + 2.750%) due 10/01/2026 «~(i) | EUR | 34,261 | 36,619 | |||||||||
Project Quasar Pledgco SLU | ||||||||||||
6.578% (EUR001M + 3.250%) due 03/15/2026 «~ | 17,416 | 18,302 | ||||||||||
Promotora de Informaciones SA | ||||||||||||
8.189% (EUR003M + 5.000%) due 06/30/2026 «~ | 15,200 | 16,694 | ||||||||||
8.439% (EUR003M + 5.220%) due 12/31/2026 ~ | 110,728 | 113,779 | ||||||||||
Promotora de Informaciones SA (6.189% Cash and 5.000% PIK) | ||||||||||||
11.189% (EUR003M + 2.970%) due 06/30/2027 «~(c) | 10,873 | 10,796 | ||||||||||
PUG LLC | ||||||||||||
9.452% (LIBOR01M + 4.250%) due 02/12/2027 «~ | $ | 1,478 | 1,341 | |||||||||
Quantum Bidco Ltd. | ||||||||||||
9.879% due 01/29/2028 | GBP | 16,500 | 18,870 | |||||||||
Radiate Holdco LLC | ||||||||||||
8.477% due 09/25/2026 | $ | 20,406 | 17,083 | |||||||||
Redstone Holdco 2 LP | ||||||||||||
10.005% (LIBOR03M + 4.750%) due 04/27/2028 ~ | 13,444 | 11,253 | ||||||||||
13.042% (LIBOR03M + 7.750%) due 04/27/2029 ~ | 2,000 | 1,263 | ||||||||||
RegionalCare Hospital Partners Holdings, Inc. | ||||||||||||
9.023% (LIBOR03M + 3.750%) due 11/16/2025 ~ | 260 | 241 | ||||||||||
Republic of Cote d’lvoire | ||||||||||||
7.985% (EUR006M + 5.000%) due 03/19/2027 «~ | EUR | 800 | 851 | |||||||||
Rising Tide Holdings, Inc. | ||||||||||||
10.264% due 06/01/2028 | $ | 17,269 | 10,519 | |||||||||
13.466% due 06/01/2029 �� | 1,301 | 114 | ||||||||||
13.966% due 06/01/2029 « | 1,325 | 585 | ||||||||||
14.091% due 06/01/2026 « | 158 | 154 | ||||||||||
SCUR-Alpha 1503 GmbH | ||||||||||||
8.918% - 9.087% (EUR001M + 5.500%) due 03/29/2030 ~ | EUR | 16,200 | 16,901 | |||||||||
10.602% due 03/28/2030 | $ | 25,237 | 23,943 | |||||||||
Sierra Hamilton LLC | ||||||||||||
15.000% due 09/12/2023 « | 8 | 8 | ||||||||||
Softbank Vision Fund | ||||||||||||
5.000% due 12/21/2025 « | 36,237 | 33,921 | ||||||||||
PRINCIPAL AMOUNT (000S) | MARKET VALUE (000S) | |||||||||||
Steenbok Lux Finco 2 SARL | ||||||||||||
TBD% due 06/30/2026 « | EUR | 176,014 | $ | 104,867 | ||||||||
Sunseeker | ||||||||||||
TBD% - 10.872% (LIBOR06M + 5.500%) due 10/31/2028 «~ | $ | 25,100 | 23,784 | |||||||||
Syniverse Holdings, Inc. | ||||||||||||
12.242% due 05/13/2027 | 112,761 | 103,705 | ||||||||||
Team Health Holdings, Inc. | ||||||||||||
7.943% (LIBOR01M + 2.750%) due 02/06/2024 ~ | 62,614 | 55,688 | ||||||||||
Telemar Norte Leste SA | ||||||||||||
1.750% (LIBOR06M + 1.750%) due 02/26/2035 ~ | 41,251 | 2,982 | ||||||||||
1.750% due 02/26/2035 | 38,115 | 2,756 | ||||||||||
Trinseo Materials Operating SCA | ||||||||||||
TBD% due 09/06/2024 | 700 | 677 | ||||||||||
U.S. Renal Care, Inc. | ||||||||||||
TBD% (LIBOR01M + 5.500%) due 06/26/2026 ~ | 11,037 | 5,178 | ||||||||||
10.193% (LIBOR01M + 5.000%) due 06/26/2026 ~ | 92,411 | 43,357 | ||||||||||
Veritas U.S., Inc. | ||||||||||||
10.217% (LIBOR01M + 5.000%) due 09/01/2025 ~ | 12,925 | 10,601 | ||||||||||
Viad Corp. | ||||||||||||
10.217% due 07/30/2028 | 3,734 | 3,640 | ||||||||||
Westmoreland Mining Holdings LLC | ||||||||||||
8.000% due 03/15/2029 | 9,636 | 7,107 | ||||||||||
Windstream Services LLC | ||||||||||||
9.202% due 02/23/2027 « | 46,280 | 45,123 | ||||||||||
11.452% due 09/21/2027 | 14,164 | 13,261 | ||||||||||
Total Loan Participations and Assignments (Cost $1,933,616) | 1,801,325 | |||||||||||
CORPORATE BONDS & NOTES 30.7% | ||||||||||||
BANKING & FINANCE 9.8% | ||||||||||||
ADLER Real Estate AG | ||||||||||||
3.000% due 04/27/2026 | EUR | 10,700 | 9,085 | |||||||||
Agps Bondco PLC | ||||||||||||
4.250% due 07/31/2025 ^(d) | 600 | 506 | ||||||||||
4.625% due 01/14/2026 ^(d) | 23,400 | 9,963 | ||||||||||
5.000% due 04/27/2027 ^(d) | 11,000 | 4,258 | ||||||||||
5.000% due 01/14/2029 ^(d) | 400 | 142 | ||||||||||
5.500% due 11/13/2026 ^(d) | 2,700 | 1,130 | ||||||||||
6.000% due 08/05/2025 ^(d) | 11,900 | 5,682 | ||||||||||
Ambac Assurance Corp. | ||||||||||||
5.100% due 12/31/2099 (h) | $ | 185 | 270 | |||||||||
Armor Holdco, Inc. | ||||||||||||
8.500% due 11/15/2029 (k) | 5,100 | 4,238 | ||||||||||
Banca Monte dei Paschi di Siena SpA | ||||||||||||
1.875% due 01/09/2026 | EUR | 28,732 | 27,922 | |||||||||
2.625% due 04/28/2025 | 27,530 | 28,202 | ||||||||||
7.677% due 01/18/2028 • | 33,989 | 31,252 | ||||||||||
8.000% due 01/22/2030 • | 8,451 | 8,292 | ||||||||||
8.500% due 09/10/2030 • | 4,762 | 4,703 | ||||||||||
10.500% due 07/23/2029 | 23,185 | 25,161 | ||||||||||
Banco de Credito del Peru SA | ||||||||||||
4.650% due 09/17/2024 | PEN | 6,500 | 1,718 | |||||||||
BOI Finance BV | ||||||||||||
7.500% due 02/16/2027 | EUR | 10,000 | 9,425 | |||||||||
CIFI Holdings Group Co. Ltd. | ||||||||||||
4.375% due 04/12/2027 ^(d) | $ | 400 | 46 | |||||||||
4.450% due 08/17/2026 ^(d) | 300 | 34 | ||||||||||
5.250% due 05/13/2026 ^(d) | 200 | 23 | ||||||||||
Claveau Re Ltd. | ||||||||||||
22.523% (T-BILL 3MO + 17.250%) due 07/08/2028 ~(k) | 8,500 | 4,165 | ||||||||||
Corestate Capital Holding SA | ||||||||||||
3.500% due 07/31/2023 ^(d) | EUR | 1,300 | 200 | |||||||||
Corsair International Ltd. | ||||||||||||
7.772% due 01/28/2027 • | 4,900 | 5,320 | ||||||||||
8.122% due 01/28/2029 • | 2,100 | 2,274 | ||||||||||
| See Accompanying Notes | ANNUAL REPORT | | | JUNE 30, 2023 | 75 |
Consolidated Schedule of Investments | PIMCO Dynamic Income Fund | (Cont.) |
PRINCIPAL AMOUNT (000S) | MARKET VALUE (000S) | |||||||||||
Cosaint Re Pte. Ltd. | ||||||||||||
14.783% (T-BILL 1MO + 9.250%) due 04/03/2028 ~ | $ | 600 | $ | 489 | ||||||||
Country Garden Holdings Co. Ltd. | ||||||||||||
2.700% due 07/12/2026 | 200 | 61 | ||||||||||
3.125% due 10/22/2025 | 1,200 | 378 | ||||||||||
3.875% due 10/22/2030 | 800 | 229 | ||||||||||
4.800% due 08/06/2030 | 200 | 58 | ||||||||||
6.150% due 09/17/2025 | 1,000 | 330 | ||||||||||
8.000% due 01/27/2024 | 200 | 131 | ||||||||||
Credit Suisse AG | ||||||||||||
5.464% (SOFRRATE + 0.390%) due 02/02/2024 ~ | 450 | 447 | ||||||||||
7.500% due 02/15/2028 (k) | 6,750 | 7,177 | ||||||||||
Credit Suisse AG AT1 Claim ^ | 5,060 | 202 | ||||||||||
Fairfax India Holdings Corp. | ||||||||||||
5.000% due 02/26/2028 (k) | 12,350 | 10,683 | ||||||||||
FloodSmart Re Ltd. | ||||||||||||
18.858% (T-BILL 3MO + 13.000%) due 03/01/2024 ~ | 6,084 | 5,720 | ||||||||||
22.608% (T-BILL 3MO + 16.750%) due 03/01/2024 ~(k) | 1,737 | 1,436 | ||||||||||
FORESEA Holding SA | ||||||||||||
7.500% due 06/15/2030 « | 2,721 | 2,435 | ||||||||||
Hudson Pacific Properties LP | ||||||||||||
3.950% due 11/01/2027 | 200 | 146 | ||||||||||
5.950% due 02/15/2028 | 200 | 159 | ||||||||||
Jefferson Capital Holdings LLC | ||||||||||||
6.000% due 08/15/2026 (k) | 10,933 | 8,897 | ||||||||||
National Health Investors, Inc. | ||||||||||||
3.000% due 02/01/2031 (k) | 200 | 154 | ||||||||||
Preferred Term Securities Ltd. | ||||||||||||
5.932% (US0003M + 0.380%) due 09/23/2035 ~ | 55 | 54 | ||||||||||
Sanders Re Ltd. | ||||||||||||
17.018% (T-BILL 3MO + 11.750%) due 04/09/2029 ~ | 11,610 | 10,921 | ||||||||||
Seazen Group Ltd. | ||||||||||||
4.450% due 07/13/2025 | 200 | 104 | ||||||||||
6.000% due 08/12/2024 | 200 | 143 | ||||||||||
Sunac China Holdings Ltd. | ||||||||||||
7.000% due 07/09/2025 ^(d) | 600 | 91 | ||||||||||
SVB Financial Group | ||||||||||||
1.800% due 02/02/2031 ^(d) | 9,346 | 5,944 | ||||||||||
2.100% due 05/15/2028 ^(d) | 1,200 | 816 | ||||||||||
3.125% due 06/05/2030 ^(d) | 1,600 | 1,056 | ||||||||||
3.500% due 01/29/2025 ^(d) | 700 | 509 | ||||||||||
4.345% due 04/29/2028 ^(d) | 3,916 | 2,748 | ||||||||||
4.570% due 04/29/2033 ^(d) | 12,400 | 8,325 | ||||||||||
Toll Road Investors Partnership LP | ||||||||||||
0.000% due 02/15/2043 (g) | 31,012 | 8,563 | ||||||||||
UBS Group AG | ||||||||||||
2.250% due 06/09/2028 • | GBP | 100 | 105 | |||||||||
3.091% due 05/14/2032 •(k) | $ | 1,000 | 809 | |||||||||
4.194% due 04/01/2031 •(k) | 1,750 | 1,559 | ||||||||||
6.373% due 07/15/2026 • | 450 | 447 | ||||||||||
6.442% due 08/11/2028 | 300 | 301 | ||||||||||
6.442% due 08/11/2028 •(k) | 1,000 | 1,005 | ||||||||||
6.537% due 08/12/2033 •(k) | 4,900 | 5,023 | ||||||||||
7.750% due 03/01/2029 • | EUR | 1,200 | 1,452 | |||||||||
9.016% due 11/15/2033 •(k) | $ | 1,000 | 1,199 | |||||||||
Unique Pub Finance Co. PLC | ||||||||||||
5.659% due 06/30/2027 (k) | GBP | 905 | 1,126 | |||||||||
7.395% due 03/28/2024 | 1,886 | 2,401 | ||||||||||
Uniti Group LP | ||||||||||||
6.000% due 01/15/2030 (k) | $ | 57,451 | 38,978 | |||||||||
6.500% due 02/15/2029 (k) | 9,015 | 6,389 | ||||||||||
10.500% due 02/15/2028 (k) | 25,502 | 25,323 | ||||||||||
Veraison Re Ltd. | ||||||||||||
17.278% (T-BILL 1MO + 12.000%) due 03/10/2031 ~ | 4,600 | 4,898 | ||||||||||
Voyager Aviation Holdings LLC | ||||||||||||
8.500% due 05/09/2026 (k) | 122,450 | 96,735 | ||||||||||
| 450,167 | ||||||||||||
PRINCIPAL AMOUNT (000S) | MARKET VALUE (000S) | |||||||||||
INDUSTRIALS 16.9% | ||||||||||||
Altice Financing SA | ||||||||||||
5.750% due 08/15/2029 (k) | $ | 15,830 | $ | 12,279 | ||||||||
American Airlines Pass-Through Trust | ||||||||||||
3.375% due 11/01/2028 (k) | 600 | 539 | ||||||||||
3.700% due 04/01/2028 (k) | 717 | 646 | ||||||||||
British Airways Pass-Through Trust | ||||||||||||
4.250% due 05/15/2034 | 52 | 47 | ||||||||||
Carvana Co. | ||||||||||||
4.875% due 09/01/2029 | 600 | 341 | ||||||||||
5.500% due 04/15/2027 | 200 | 134 | ||||||||||
5.875% due 10/01/2028 | 300 | 174 | ||||||||||
10.250% due 05/01/2030 | 18,400 | 14,517 | ||||||||||
CGG SA | ||||||||||||
7.750% due 04/01/2027 | EUR | 38,535 | 35,365 | |||||||||
8.750% due 04/01/2027 (k) | $ | 56,461 | 47,350 | |||||||||
Community Health Systems, Inc. | ||||||||||||
8.000% due 03/15/2026 (k) | 1,886 | 1,839 | ||||||||||
Constellation Oil Services Holding SA (3.000% Cash or 4.000% PIK) | ||||||||||||
3.000% due 12/31/2026 (c) | 232 | 137 | ||||||||||
CVS Pass-Through Trust | ||||||||||||
7.507% due 01/10/2032 (k) | 1,711 | 1,785 | ||||||||||
DISH DBS Corp. | ||||||||||||
5.250% due 12/01/2026 (k) | 17,440 | 14,023 | ||||||||||
5.750% due 12/01/2028 (k) | 25,200 | 18,791 | ||||||||||
DISH Network Corp. | ||||||||||||
11.750% due 11/15/2027 (k) | 9,200 | 8,989 | ||||||||||
Exela Intermediate LLC | ||||||||||||
11.500% due 07/15/2026 | 697 | 66 | ||||||||||
Gazprom PJSC Via Gaz Capital SA | ||||||||||||
7.288% due 08/16/2037 | 300 | 256 | ||||||||||
8.625% due 04/28/2034 | 1,081 | 966 | ||||||||||
Intelsat Jackson Holdings SA | ||||||||||||
6.500% due 03/15/2030 (k) | 129,139 | 117,885 | ||||||||||
Inter Media & Communication SpA | ||||||||||||
6.750% due 02/09/2027 | EUR | 10,250 | 10,842 | |||||||||
Iris Holdings, Inc. (8.750% Cash or 9.500% PIK) | ||||||||||||
8.750% due 02/15/2026 (c)(k) | $ | 1,900 | 1,810 | |||||||||
Market Bidco Finco PLC | ||||||||||||
4.750% due 11/04/2027 | EUR | 6,600 | 5,816 | |||||||||
Newfold Digital Holdings Group, Inc. | ||||||||||||
6.000% due 02/15/2029 (k) | $ | 14,296 | 10,745 | |||||||||
Noble Finance LLC | ||||||||||||
8.000% due 04/15/2030 (k) | 1,335 | 1,359 | ||||||||||
Odebrecht Oil & Gas Finance Ltd. | ||||||||||||
0.000% due 07/31/2023 (g)(h) | 5,220 | 14 | ||||||||||
Olympus Water U.S. Holding Corp. | ||||||||||||
5.375% due 10/01/2029 | EUR | 2,200 | 1,682 | |||||||||
Prosus NV | ||||||||||||
2.031% due 08/03/2032 | 500 | 389 | ||||||||||
2.778% due 01/19/2034 | 900 | 725 | ||||||||||
Russian Railways Via RZD Capital PLC | ||||||||||||
7.487% due 03/25/2031 ^(d) | GBP | 200 | 197 | |||||||||
Times Square Hotel Trust | ||||||||||||
8.528% due 08/01/2026 | $ | 1,928 | 1,907 | |||||||||
Topaz Solar Farms LLC | ||||||||||||
4.875% due 09/30/2039 (k) | 15,838 | 14,571 | ||||||||||
5.750% due 09/30/2039 (k) | 71,877 | 70,584 | ||||||||||
U.S. Renal Care, Inc. | ||||||||||||
10.625% due 07/15/2027 | 33,858 | 8,634 | ||||||||||
Valaris Ltd. | ||||||||||||
8.375% due 04/30/2030 (k) | 4,733 | 4,753 | ||||||||||
Vale SA | ||||||||||||
3.202% due 12/29/2049 ~(h) | BRL | 830,470 | 53,306 | |||||||||
Veritas US, Inc. | ||||||||||||
7.500% due 09/01/2025 (k) | $ | 27,985 | 22,747 | |||||||||
Viking Cruises Ltd. | ||||||||||||
13.000% due 05/15/2025 (k) | 41,902 | 44,026 | ||||||||||
Wesco Aircraft Holdings, Inc. | ||||||||||||
10.500% due 11/15/2026 ^(d) | 2,377 | 2,163 | ||||||||||
PRINCIPAL AMOUNT (000S) | MARKET VALUE (000S) | |||||||||||
Wesco Aircraft Holdings, Inc. (7.500% Cash and 3.000% PIK) | ||||||||||||
10.500% due 11/15/2026 ^(c)(d) | $ | 202,913 | $ | 184,650 | ||||||||
Windstream Escrow LLC | ||||||||||||
7.750% due 08/15/2028 (k) | 64,273 | 53,410 | ||||||||||
Yellowstone Energy LP | ||||||||||||
5.750% due 12/31/2026 « | 1,922 | 1,919 | ||||||||||
| 772,378 | ||||||||||||
UTILITIES 4.0% | ||||||||||||
Adler Financing SARL | ||||||||||||
12.500% due 06/30/2025 (k) | EUR | 27,533 | 30,840 | |||||||||
Eskom Holdings SOC Ltd. | ||||||||||||
6.750% due 08/06/2023 | $ | 52,880 | 52,735 | |||||||||
Gazprom PJSC via Gaz Finance PLC | ||||||||||||
3.000% due 06/29/2027 | 200 | 145 | ||||||||||
NGD Holdings BV | ||||||||||||
6.750% due 12/31/2026 | 6,185 | 4,546 | ||||||||||
Oi SA | ||||||||||||
10.000% due 07/27/2025 ^(d) | 139,217 | 10,065 | ||||||||||
Pacific Gas & Electric Co. | ||||||||||||
4.000% due 12/01/2046 | 57 | 38 | ||||||||||
4.450% due 04/15/2042 (k) | 5,473 | 4,151 | ||||||||||
4.750% due 02/15/2044 (k) | 36,628 | 28,472 | ||||||||||
Peru LNG SRL | ||||||||||||
5.375% due 03/22/2030 | 42,051 | 33,886 | ||||||||||
Rio Oil Finance Trust | ||||||||||||
9.250% due 07/06/2024 (k) | 5,661 | 5,716 | ||||||||||
9.250% due 07/06/2024 | 632 | 638 | ||||||||||
Tierra Mojada Luxembourg SARL | ||||||||||||
5.750% due 12/01/2040 (k) | 15,080 | 12,916 | ||||||||||
| 184,148 | ||||||||||||
Total Corporate Bonds & Notes (Cost $1,686,491) | 1,406,693 | |||||||||||
CONVERTIBLE BONDS & NOTES 0.7% | ||||||||||||
BANKING & FINANCE 0.2% | ||||||||||||
Corestate Capital Holding SA | ||||||||||||
1.375% due 07/31/2023 ^(d) | EUR | 9,900 | 1,573 | |||||||||
PennyMac Corp. | ||||||||||||
5.500% due 03/15/2026 (k) | $ | 7,700 | 6,872 | |||||||||
8,445 | ||||||||||||
INDUSTRIALS 0.5% | ||||||||||||
Multiplan Corp. (6.000% Cash or 7.000% PIK) | ||||||||||||
6.000% due 10/15/2027 (c)(k) | 33,700 | 22,882 | ||||||||||
Total Convertible Bonds & Notes (Cost $52,555) | 31,327 | |||||||||||
MUNICIPAL BONDS & NOTES 2.3% | ||||||||||||
MICHIGAN 0.1% | ||||||||||||
Michigan Tobacco Settlement Finance Authority Revenue Bonds, Series 2008 | ||||||||||||
0.000% due 06/01/2046 (g) | 23,000 | 2,376 | ||||||||||
PUERTO RICO 1.5% | ||||||||||||
Commonwealth of Puerto Rico Bonds, Series 2022 | ||||||||||||
0.000% due 11/01/2043 | 38,262 | 19,322 | ||||||||||
0.000% due 11/01/2051 | 99,704 | 49,806 | ||||||||||
| 69,128 | ||||||||||||
WEST VIRGINIA 0.7% | ||||||||||||
Tobacco Settlement Finance Authority, West Virginia Revenue Bonds, Series 2007 | ||||||||||||
0.000% due 06/01/2047 (g) | 355,485 | 33,610 | ||||||||||
Total Municipal Bonds & Notes (Cost $104,838) | 105,114 | |||||||||||
76 | PIMCO CLOSED-END FUNDS | See Accompanying Notes |
| June 30, 2023 |
PRINCIPAL AMOUNT (000S) | MARKET VALUE (000S) | |||||||||||
U.S. GOVERNMENT AGENCIES 1.9% | ||||||||||||
Fannie Mae | ||||||||||||
0.000% due 10/25/2042 •(k) | $ | 1,081 | $ | 829 | ||||||||
0.000% due 10/25/2060 ~(a)(k) | 21,243 | 1,535 | ||||||||||
0.770% due 07/25/2041 •(a)(k) | 1,867 | 122 | ||||||||||
0.787% due 01/25/2041 •(k) | 3,506 | 3,215 | ||||||||||
0.850% due 08/25/2038 •(a) | 376 | 20 | ||||||||||
0.900% due 08/25/2049 •(a) | 172 | 18 | ||||||||||
0.900% due 07/25/2059 •(a)(k) | 6,703 | 713 | ||||||||||
0.920% due 10/25/2040 •(a)(k) | 2,042 | 78 | ||||||||||
1.000% due 02/25/2043 •(a)(k) | 1,524 | 135 | ||||||||||
1.039% due 08/25/2043 ~(a) | 20,459 | 668 | ||||||||||
1.200% due 12/25/2037 •(a) | 34 | 2 | ||||||||||
1.370% due 09/25/2037 •(a)(k) | 307 | 17 | ||||||||||
1.450% due 03/25/2040 •(a)(k) | 1,640 | 58 | ||||||||||
1.490% due 12/25/2036 •(a)(k) | 1,349 | 111 | ||||||||||
1.500% due 11/25/2036 •(a) | 41 | 2 | ||||||||||
1.570% due 06/25/2037 •(a) | 159 | 8 | ||||||||||
1.830% due 03/25/2038 •(a)(k) | 768 | 72 | ||||||||||
1.850% due 02/25/2038 •(a)(k) | 471 | 45 | ||||||||||
3.000% due 01/25/2042 (a)(k) | 125 | 6 | ||||||||||
3.500% due 08/25/2032 - 06/25/2050 (a)(k) | 17,492 | 3,207 | ||||||||||
4.000% due 06/25/2050 (a)(k) | 10,139 | 1,930 | ||||||||||
4.500% due 04/25/2042 (a)(k) | 641 | 84 | ||||||||||
5.000% due 01/25/2048 (a)(k) | 4,335 | 938 | ||||||||||
10.900% due 07/25/2029 •(k) | 9,180 | 10,305 | ||||||||||
Freddie Mac | ||||||||||||
0.000% due 09/15/2041 •(k) | 602 | 497 | ||||||||||
0.000% due 11/15/2048 •(a)(k) | 36,061 | 996 | ||||||||||
0.700% due 11/25/2055 ~(a)(k) | 262,319 | 17,384 | ||||||||||
0.757% due 04/15/2039 •(a)(k) | 1,158 | 116 | ||||||||||
0.950% due 06/25/2050 •(a)(k) | 1,059 | 106 | ||||||||||
0.957% due 01/15/2047 •(a) | 264 | 31 | ||||||||||
1.000% due 05/25/2050 •(a)(k) | 7,657 | 855 | ||||||||||
1.007% due 09/15/2042 •(a)(k) | 537 | 30 | ||||||||||
1.107% due 05/15/2037 •(a)(k) | 850 | 64 | ||||||||||
1.217% due 05/15/2037 •(a) | 72 | 5 | ||||||||||
1.233% due 01/25/2051 •(a)(k) | 9,940 | 1,252 | ||||||||||
1.277% due 07/15/2036 •(a)(k) | 1,047 | 81 | ||||||||||
1.387% due 09/15/2036 •(a)(k) | 343 | 28 | ||||||||||
1.407% due 05/15/2041 •(a)(k) | 664 | 60 | ||||||||||
1.507% due 04/15/2036 •(a)(k) | 231 | 13 | ||||||||||
2.079% due 11/25/2045 ~(a)(k) | 75,137 | 5,746 | ||||||||||
2.587% due 09/15/2036 •(a)(k) | 572 | 68 | ||||||||||
3.000% due 06/25/2050 (a)(k) | 11,490 | 1,839 | ||||||||||
3.500% due 07/25/2050 (a)(k) | 24,357 | 4,726 | ||||||||||
4.000% due 03/15/2027 (a) | 102 | 4 | ||||||||||
4.000% due 07/25/2050 (a)(k) | 19,000 | 4,143 | ||||||||||
5.000% due 05/25/2048 (a)(k) | 6,641 | 1,100 | ||||||||||
10.300% due 10/25/2029 •(k) | 8,600 | 9,385 | ||||||||||
14.150% due 03/25/2029 •(k) | 6,835 | 7,292 | ||||||||||
15.650% due 10/25/2028 • | 1,481 | 1,654 | ||||||||||
Ginnie Mae | ||||||||||||
0.943% due 12/20/2048 •(a)(k) | 3,000 | 244 | ||||||||||
0.974% due 08/20/2042 •(a)(k) | 1,441 | 134 | ||||||||||
1.104% due 12/20/2040 •(a)(k) | 1,041 | 39 | ||||||||||
2.500% due 09/20/2036 (a)(k) | 48,127 | 4,099 | ||||||||||
3.500% due 06/20/2042 (a)(k) | 195 | 28 | ||||||||||
Total U.S. Government Agencies (Cost $95,038) | 86,137 | |||||||||||
NON-AGENCY MORTGAGE-BACKED SECURITIES 47.7% | ||||||||||||
225 Liberty Street Trust | ||||||||||||
4.803% due 02/10/2036 ~ | 5,000 | 3,464 | ||||||||||
245 Park Avenue Trust | ||||||||||||
3.779% due 06/05/2037 ~(k) | 16,761 | 11,802 | ||||||||||
280 Park Avenue Mortgage Trust | ||||||||||||
6.718% due 09/15/2034 •(k) | 12,600 | 11,173 | ||||||||||
8.009% due 09/15/2034 •(k) | 2,500 | 2,085 | ||||||||||
Adjustable Rate Mortgage Trust | ||||||||||||
4.558% due 03/25/2037 ~ | 1,319 | 1,157 | ||||||||||
4.871% due 03/25/2036 ^~ | 2,036 | 1,118 | ||||||||||
5.410% due 03/25/2036 •(k) | 3,162 | 1,895 | ||||||||||
5.450% due 03/25/2037 • | 730 | 797 | ||||||||||
6.119% due 11/25/2037 ^~ | 854 | 596 | ||||||||||
PRINCIPAL AMOUNT (000S) | MARKET VALUE (000S) | |||||||||||
American Home Mortgage Assets Trust | ||||||||||||
5.690% due 11/25/2035 • | $ | 420 | $ | 379 | ||||||||
5.730% due 08/25/2037 ^•(k) | 7,433 | 6,681 | ||||||||||
American Home Mortgage Investment Trust | ||||||||||||
5.690% due 03/25/2037 • | 2,601 | 1,006 | ||||||||||
5.750% due 09/25/2045 •(k) | 2,719 | 2,398 | ||||||||||
6.050% due 02/25/2044 •(k) | 8,488 | 7,644 | ||||||||||
6.600% due 01/25/2037 þ | 4,653 | 875 | ||||||||||
Anthracite Ltd. | ||||||||||||
5.678% due 06/20/2041 | 2,021 | 0 | ||||||||||
ASG Resecuritization Trust | ||||||||||||
3.168% due 01/28/2037 ~(k) | 8,506 | 6,996 | ||||||||||
6.000% due 06/28/2037 ~(k) | 25,341 | 12,599 | ||||||||||
Ashford Hospitality Trust | ||||||||||||
6.719% due 04/15/2035 •(k) | 10,360 | 9,988 | ||||||||||
8.419% due 04/15/2035 •(k) | 10,939 | 10,423 | ||||||||||
Atrium Hotel Portfolio Trust | ||||||||||||
7.093% due 12/15/2036 •(k) | 1,840 | 1,719 | ||||||||||
7.393% due 12/15/2036 •(k) | 7,000 | 6,349 | ||||||||||
7.743% due 06/15/2035 •(k) | 3,204 | 3,050 | ||||||||||
Austin Fairmont Hotel Trust | ||||||||||||
7.993% due 09/15/2032 •(k) | 5,000 | 4,812 | ||||||||||
Avon Finance PLC | ||||||||||||
0.000% due 09/20/2048 (b)(g) | GBP | 28,441 | 31,770 | |||||||||
0.000% due 09/20/2048 ~ | 10 | 24,477 | ||||||||||
7.909% due 09/20/2048 • | 20,316 | 25,621 | ||||||||||
8.159% due 09/20/2048 • | 8,126 | 10,233 | ||||||||||
BAMLL Commercial Mortgage Securities Trust | ||||||||||||
2.627% due 01/15/2032 (k) | $ | 20,930 | 16,851 | |||||||||
7.343% due 03/15/2037 •(k) | 7,579 | 7,359 | ||||||||||
7.443% due 03/15/2037 •(k) | 14,228 | 13,591 | ||||||||||
Banc of America Alternative Loan Trust | ||||||||||||
1.490% due 06/25/2037 ^•(a) | 321 | 26 | ||||||||||
5.510% due 06/25/2037 • | 298 | 222 | ||||||||||
6.000% due 06/25/2037 | 102 | 85 | ||||||||||
6.000% due 06/25/2046 | 46 | 41 | ||||||||||
6.000% due 07/25/2046 ^ | 684 | 576 | ||||||||||
Banc of America Funding Trust | ||||||||||||
0.000% due 06/26/2035 ~(k) | 1,802 | 1,605 | ||||||||||
0.000% due 11/26/2036 ~(k) | 26,070 | 7,424 | ||||||||||
2.803% due 05/26/2036 ~(k) | 5,035 | 4,104 | ||||||||||
2.874% due 08/25/2047 ^~ | 2,544 | 2,069 | ||||||||||
3.111% due 12/20/2034 «~ | 406 | 286 | ||||||||||
3.720% due 09/20/2047 ^~ | 188 | 156 | ||||||||||
3.826% due 01/20/2047 ^«~ | 82 | 68 | ||||||||||
3.847% due 03/20/2036 ^~ | 895 | 730 | ||||||||||
3.867% due 09/20/2037 «~ | 387 | 295 | ||||||||||
3.896% due 10/20/2046 ^~ | 262 | 222 | ||||||||||
3.950% due 01/25/2035 «~ | 104 | 99 | ||||||||||
4.106% due 04/20/2035 ^~ | 935 | 816 | ||||||||||
4.215% due 12/20/2036 «~ | 25 | 24 | ||||||||||
4.287% due 09/20/2046 ^~ | 698 | 668 | ||||||||||
5.570% due 04/25/2037 ^• | 962 | 796 | ||||||||||
5.577% due 04/20/2047 ^•(k) | 4,874 | 3,860 | ||||||||||
5.832% due 02/20/2035 •(k) | 3,035 | 2,903 | ||||||||||
6.000% due 10/25/2037 ^(k) | 2,819 | 2,354 | ||||||||||
6.619% due 07/26/2036 ~(k) | 8,795 | 2,877 | ||||||||||
Banc of America Mortgage Trust | ||||||||||||
4.122% due 10/20/2046 ^«~ | 63 | 53 | ||||||||||
4.163% due 01/25/2036 «~ | 103 | 93 | ||||||||||
5.750% due 10/25/2036 ^ | 663 | 540 | ||||||||||
5.750% due 05/25/2037 ^ | 598 | 461 | ||||||||||
6.000% due 10/25/2036 ^« | 80 | 65 | ||||||||||
Bancorp Commercial Mortgage Trust | ||||||||||||
8.943% due 08/15/2032 •(k) | 4,995 | 4,963 | ||||||||||
Barclays Commercial Mortgage Securities Trust | ||||||||||||
8.143% due 10/15/2037 •(k) | 2,600 | 2,420 | ||||||||||
8.743% due 07/15/2037 •(k) | 5,000 | 4,729 | ||||||||||
Barclays Commercial Real Estate Trust | ||||||||||||
4.715% due 08/10/2033 ~(k) | 7,430 | 5,835 | ||||||||||
Bayview Commercial Asset Trust | ||||||||||||
5.480% due 03/25/2037 • | 151 | 136 | ||||||||||
BCAP LLC Trust | ||||||||||||
1.891% due 02/26/2037 ~(k) | 8,524 | 7,203 | ||||||||||
3.343% due 04/26/2037 ~(k) | 6,431 | 5,092 | ||||||||||
3.605% due 07/26/2036 ~ | 390 | 337 | ||||||||||
3.676% due 05/26/2037 ~(k) | 1,619 | 1,460 | ||||||||||
PRINCIPAL AMOUNT (000S) | MARKET VALUE (000S) | |||||||||||
3.782% due 05/26/2036 •(k) | $ | 3,915 | $ | 3,080 | ||||||||
3.857% due 03/26/2037 ~ | 835 | 670 | ||||||||||
3.909% due 11/26/2035 ~(k) | 2,324 | 2,056 | ||||||||||
3.950% due 02/26/2036 ~ | 2,578 | 1,799 | ||||||||||
3.988% due 02/26/2047 •(k) | 11,575 | 9,239 | ||||||||||
4.048% due 03/27/2037 ~(k) | 4,606 | 3,802 | ||||||||||
4.489% due 07/26/2045 ~(k) | 3,412 | 3,213 | ||||||||||
4.515% due 06/26/2036 ~ | 2,151 | 1,785 | ||||||||||
5.317% due 07/26/2035 «~ | 369 | 279 | ||||||||||
5.500% due 05/26/2035 •(k) | 5,114 | 4,488 | ||||||||||
5.500% due 12/26/2035 ~(k) | 5,485 | 3,371 | ||||||||||
5.500% due 12/26/2035 ~ | 3,504 | 2,222 | ||||||||||
5.967% due 10/26/2037 ~ | 1,676 | 1,235 | ||||||||||
6.000% due 06/26/2037 ~ | 1,641 | 1,398 | ||||||||||
6.000% due 08/26/2037 ~ | 2,262 | 1,747 | ||||||||||
14.806% due 01/26/2036 ~(k) | 20,149 | 5,603 | ||||||||||
Bear Stearns Adjustable Rate Mortgage Trust | ||||||||||||
3.793% due 08/25/2047 ^~ | 155 | 132 | ||||||||||
4.010% due 09/25/2034 «~ | 12 | 10 | ||||||||||
4.060% due 06/25/2047 ^~(k) | 1,309 | 1,181 | ||||||||||
4.112% due 09/25/2034 «~ | 36 | 32 | ||||||||||
4.524% due 02/25/2036 ^~ | 311 | 280 | ||||||||||
4.589% due 10/25/2036 ^«~ | 51 | 47 | ||||||||||
Bear Stearns ALT-A Trust | ||||||||||||
3.614% due 11/25/2035 ^~(k) | 9,090 | 5,698 | ||||||||||
3.651% due 04/25/2035 «~ | 121 | 101 | ||||||||||
3.695% due 05/25/2036 ^~ | 242 | 177 | ||||||||||
3.731% due 11/25/2036 ^~ | 1,703 | 807 | ||||||||||
3.744% due 04/25/2037 ~(k) | 4,335 | 3,240 | ||||||||||
3.765% due 05/25/2035 «~ | 132 | 122 | ||||||||||
3.855% due 12/25/2046 ^~(k) | 3,342 | 1,800 | ||||||||||
3.859% due 09/25/2035 ^~(k) | 7,359 | 3,033 | ||||||||||
3.863% due 11/25/2035 ~ | 25 | 18 | ||||||||||
3.866% due 08/25/2046 ^~(k) | 4,200 | 3,011 | ||||||||||
4.009% due 03/25/2036 ~(k) | 1,130 | 678 | ||||||||||
4.116% due 08/25/2036 ^~ | 281 | 147 | ||||||||||
4.125% due 09/25/2034 «~ | 186 | 174 | ||||||||||
4.148% due 07/25/2036 ~(k) | 50,886 | 25,853 | ||||||||||
4.433% due 07/25/2035 ^~ | 223 | 164 | ||||||||||
5.470% due 06/25/2046 ^•(k) | 1,197 | 1,033 | ||||||||||
5.490% due 08/25/2036 ^•(k) | 14,345 | 13,564 | ||||||||||
5.550% due 02/25/2034 •(k) | 2,547 | 2,273 | ||||||||||
5.650% due 01/25/2036 ^•(k) | 3,854 | 3,431 | ||||||||||
6.275% due 01/25/2035 • | 1,007 | 930 | ||||||||||
6.275% due 03/25/2035 •(k) | 6,676 | 5,598 | ||||||||||
Bear Stearns Asset-Backed Securities Trust | ||||||||||||
6.000% due 12/25/2035 ^« | 277 | 144 | ||||||||||
6.500% due 03/25/2037 þ(k) | 8,909 | 7,555 | ||||||||||
Bear Stearns Mortgage Funding Trust | ||||||||||||
7.500% due 08/25/2036 þ | 323 | 319 | ||||||||||
Beast Mortgage Trust | ||||||||||||
8.643% due 03/15/2036 •(k) | 6,000 | 4,331 | ||||||||||
Benchmark Mortgage Trust | ||||||||||||
4.029% due 03/15/2062 ~ | 5,423 | 3,773 | ||||||||||
Beneria Cowen & Pritzer Collateral Funding Corp. | ||||||||||||
8.831% due 06/15/2038 •(k) | 11,100 | 8,163 | ||||||||||
BIG Commercial Mortgage Trust | ||||||||||||
7.487% due 02/15/2039 • | 485 | 462 | ||||||||||
BMO Mortgage Trust | ||||||||||||
3.378% due 02/17/2055 ~(k) | 7,850 | 5,955 | ||||||||||
Braemar Hotels & Resorts Trust | ||||||||||||
7.118% due 06/15/2035 (k) | 6,500 | 6,054 | ||||||||||
7.718% due 06/15/2035 •(k) | 11,000 | 10,010 | ||||||||||
Bridgegate Funding PLC | ||||||||||||
0.000% due 10/16/2062 ~(k) | GBP | 39,972 | 24,118 | |||||||||
0.000% due 10/16/2062 ~ | 20,785 | 79 | ||||||||||
0.000% due 10/16/2062 (g) | 5,795 | 258 | ||||||||||
10.466% due 10/16/2062 •(k) | 23,983 | 28,600 | ||||||||||
13.466% due 10/16/2062 •(k) | 11,991 | 15,341 | ||||||||||
BSREP Commercial Mortgage Trust | ||||||||||||
6.144% due 08/15/2038 •(k) | $ | 7,200 | 6,532 | |||||||||
6.544% due 08/15/2038 • | 500 | 446 | ||||||||||
BSST Mortgage Trust | ||||||||||||
6.897% due 02/15/2037 •(k) | 3,300 | 2,837 | ||||||||||
BX Commercial Mortgage Trust | ||||||||||||
7.044% due 11/15/2038 •(k) | 22,375 | 21,636 | ||||||||||
7.391% due 11/15/2038 (k) | 7,750 | 7,477 | ||||||||||
| See Accompanying Notes | ANNUAL REPORT | | | JUNE 30, 2023 | 77 |
Consolidated Schedule of Investments | PIMCO Dynamic Income Fund | (Cont.) |
PRINCIPAL AMOUNT (000S) | MARKET VALUE (000S) | |||||||||||
7.611% due 04/15/2034 •(k) | $ | 6,000 | $ | 5,158 | ||||||||
8.348% due 04/15/2034 •(k) | 4,000 | 3,383 | ||||||||||
BX Trust | ||||||||||||
7.080% due 10/15/2036 (k) | 2,741 | 2,573 | ||||||||||
7.430% due 10/15/2036 •(k) | 1,010 | 938 | ||||||||||
7.611% due 02/15/2038 (k) | 1,996 | 1,850 | ||||||||||
7.620% due 10/15/2026 •(k) | 1,500 | 1,426 | ||||||||||
7.930% due 10/15/2036 •(k) | 7,993 | 7,380 | ||||||||||
8.363% due 05/15/2030 •(k) | 5,500 | 5,334 | ||||||||||
BXP Trust | ||||||||||||
2.868% due 01/15/2044 ~(k) | 3,000 | 1,820 | ||||||||||
CALI Mortgage Trust | ||||||||||||
3.957% due 03/10/2039 (k) | 24,500 | 19,238 | ||||||||||
CBA Commercial Small Balance Commercial Mortgage | ||||||||||||
6.040% due 01/25/2039 ^þ | 331 | 308 | ||||||||||
CD Mortgage Trust | ||||||||||||
5.688% due 10/15/2048 (k) | 1,403 | 1,237 | ||||||||||
Chase Mortgage Finance Trust | ||||||||||||
3.814% due 01/25/2036 ^~(k) | 3,394 | 2,906 | ||||||||||
3.962% due 03/25/2037 ^~ | 997 | 928 | ||||||||||
6.000% due 03/25/2037 ^ | 516 | 280 | ||||||||||
Citigroup Commercial Mortgage Trust | ||||||||||||
5.617% due 12/10/2049 ~(k) | 8,727 | 5,890 | ||||||||||
8.968% due 12/15/2036 •(k) | 10,233 | 9,706 | ||||||||||
Citigroup Global Markets Mortgage Securities, Inc. | ||||||||||||
6.500% due 02/25/2029 « | 121 | 112 | ||||||||||
Citigroup Mortgage Loan Trust | ||||||||||||
0.000% due 08/25/2037 ~ | 1,632 | 103 | ||||||||||
3.386% due 07/25/2036 ^~ | 1,956 | 1,193 | ||||||||||
3.584% due 03/25/2037 ^~(k) | 2,000 | 1,718 | ||||||||||
3.915% due 10/25/2035 ^~(k) | 1,021 | 965 | ||||||||||
3.974% due 09/25/2037 ^~(k) | 2,249 | 1,974 | ||||||||||
4.041% due 04/25/2037 ^~ | 362 | 307 | ||||||||||
4.101% due 03/25/2037 ^«~ | 480 | 439 | ||||||||||
4.374% due 08/25/2034 ~(k) | 6,115 | 5,691 | ||||||||||
4.524% due 03/25/2037 ^«~ | 170 | 163 | ||||||||||
4.572% due 02/25/2036 ~(k) | 5,110 | 4,669 | ||||||||||
5.500% due 11/25/2035 ^« | 213 | 189 | ||||||||||
5.500% due 12/25/2035 | 1,909 | 1,063 | ||||||||||
6.000% due 07/25/2036 (k) | 4,049 | 2,132 | ||||||||||
6.380% due 03/25/2036 ^• | 94 | 87 | ||||||||||
6.500% due 09/25/2036 | 900 | 529 | ||||||||||
Colony Mortgage Capital Ltd. | ||||||||||||
6.937% due 11/15/2038 •(k) | 2,020 | 1,884 | ||||||||||
7.286% due 11/15/2038 •(k) | 5,005 | 4,644 | ||||||||||
7.982% due 11/15/2038 •(k) | 15,475 | 14,249 | ||||||||||
8.678% due 11/15/2038 •(k) | 24,000 | 21,360 | ||||||||||
COLT Mortgage Loan Trust | ||||||||||||
4.687% due 03/25/2067 ~(k) | 4,900 | 4,175 | ||||||||||
Commercial Mortgage Lease-Backed Certificates | ||||||||||||
6.250% due 06/20/2031 ~(k) | 4,299 | 4,211 | ||||||||||
Commercial Mortgage Loan Trust | ||||||||||||
6.809% due 12/10/2049 ~(k) | 4,688 | 1,132 | ||||||||||
Commercial Mortgage Trust | ||||||||||||
2.819% due 01/10/2039 (k) | 9,131 | 7,589 | ||||||||||
3.754% due 02/10/2037 ~(k) | 9,000 | 8,194 | ||||||||||
3.754% due 02/10/2037 (k) | 19,830 | 17,834 | ||||||||||
6.214% due 07/10/2038 ~(k) | 4,688 | 2,900 | ||||||||||
9.344% due 12/15/2038 •(k) | 10,004 | 8,438 | ||||||||||
10.194% due 12/15/2038 •(k) | 5,000 | 4,033 | ||||||||||
11.194% due 12/15/2038 •(k) | 3,360 | 2,531 | ||||||||||
Connecticut Avenue Securities Trust | ||||||||||||
7.817% due 12/25/2041 •(k) | 2,600 | 2,533 | ||||||||||
10.317% due 03/25/2042 • | 1,400 | 1,460 | ||||||||||
10.567% due 12/25/2041 • | 1,200 | 1,168 | ||||||||||
11.067% due 10/25/2041 •(k) | 3,600 | 3,557 | ||||||||||
11.417% due 05/25/2042 •(k) | 550 | 592 | ||||||||||
14.567% due 03/25/2042 •(k) | 3,400 | 3,625 | ||||||||||
15.667% due 05/25/2042 •(k) | 600 | 662 | ||||||||||
Countrywide Alternative Loan Resecuritization Trust | ||||||||||||
7.000% due 01/25/2037 ^ | 5,107 | 1,103 | ||||||||||
Countrywide Alternative Loan Trust | ||||||||||||
0.816% due 12/25/2035 ~(a) | 8,140 | 339 | ||||||||||
1.775% due 12/25/2035 ~(a) | 3,198 | 225 | ||||||||||
2.000% due 07/25/2036 •(a) | 6,967 | 1,054 | ||||||||||
4.008% due 06/25/2037 ^~ | 81 | 69 | ||||||||||
4.295% due 05/25/2036 ~(k) | 2,466 | 2,176 | ||||||||||
PRINCIPAL AMOUNT (000S) | MARKET VALUE (000S) | |||||||||||
4.826% due 11/25/2046 •(k) | $ | 2,380 | $ | 2,022 | ||||||||
5.286% due 07/20/2035 ^•(k) | 4,630 | 3,952 | ||||||||||
5.347% due 03/20/2047 • | 399 | 329 | ||||||||||
5.400% due 06/25/2037 ^• | 528 | 443 | ||||||||||
5.500% due 09/28/2023 « | 16 | 13 | ||||||||||
5.500% due 07/25/2035 ^ | 706 | 364 | ||||||||||
5.500% due 10/25/2035 ^«• | 468 | 289 | ||||||||||
5.500% due 10/25/2035 ^« | 114 | 79 | ||||||||||
5.500% due 11/25/2035 ^ | 329 | 198 | ||||||||||
5.500% due 11/25/2035 | 1,423 | 886 | ||||||||||
5.500% due 12/25/2035 ^ | 702 | 401 | ||||||||||
5.500% due 01/25/2036 ^« | 63 | 57 | ||||||||||
5.500% due 02/25/2036 ^ | 876 | 532 | ||||||||||
5.500% due 02/25/2036 | 818 | 590 | ||||||||||
5.500% due 05/25/2036 (k) | 2,574 | 2,147 | ||||||||||
5.500% due 05/25/2036 ^ | 836 | 697 | ||||||||||
5.500% due 05/25/2036 ^• | 1,184 | 344 | ||||||||||
5.500% due 08/25/2036 ^• | 797 | 363 | ||||||||||
5.500% due 04/25/2037 ^(k) | 1,526 | 834 | ||||||||||
5.510% due 05/25/2036 •(k) | 7,503 | 6,801 | ||||||||||
5.530% due 09/25/2046 ^•(k) | 5,449 | 4,746 | ||||||||||
5.570% due 08/25/2047 ^• | 848 | 691 | ||||||||||
5.590% due 05/25/2047 •(k) | 4,532 | 2,494 | ||||||||||
5.610% due 03/25/2036 •(k) | 7,823 | 7,558 | ||||||||||
5.636% due 07/25/2035 • | 59 | 54 | ||||||||||
5.650% due 06/25/2037 •(k) | 5,542 | 4,645 | ||||||||||
5.670% due 07/25/2036 •(k) | 7,972 | 6,478 | ||||||||||
5.750% due 01/25/2036 « | 127 | 69 | ||||||||||
5.750% due 05/25/2036 ^ | 144 | 62 | ||||||||||
5.750% due 01/25/2037 ^(k) | 7,794 | 4,331 | ||||||||||
5.750% due 04/25/2037 ^(k) | 976 | 823 | ||||||||||
5.763% due 11/20/2035 • | 74 | 69 | ||||||||||
5.830% due 09/25/2035 • | 2,475 | 1,480 | ||||||||||
5.830% due 10/25/2046 ^• | 105 | 77 | ||||||||||
6.000% due 03/25/2035 ^ | 286 | 138 | ||||||||||
6.000% due 11/25/2035 ^« | 320 | 54 | ||||||||||
6.000% due 04/25/2036 | 480 | 249 | ||||||||||
6.000% due 04/25/2036 ^ | 181 | 97 | ||||||||||
6.000% due 08/25/2036 ^ | 232 | 134 | ||||||||||
6.000% due 11/25/2036 ^« | 221 | 120 | ||||||||||
6.000% due 12/25/2036 | 670 | 294 | ||||||||||
6.000% due 01/25/2037 ^ | 1,467 | 1,083 | ||||||||||
6.000% due 02/25/2037 ^ | 2,115 | 896 | ||||||||||
6.000% due 03/25/2037 ^(k) | 8,246 | 3,459 | ||||||||||
6.000% due 03/25/2037 ^ | 2,541 | 1,066 | ||||||||||
6.000% due 04/25/2037 ^ | 5,130 | 2,430 | ||||||||||
6.000% due 04/25/2037 ^(k) | 3,693 | 1,830 | ||||||||||
6.000% due 09/25/2037 (k) | 7,707 | 2,910 | ||||||||||
6.250% due 12/25/2036 ^• | 500 | 236 | ||||||||||
6.500% due 09/25/2032 ^« | 69 | 61 | ||||||||||
6.500% due 06/25/2036 ^ | 347 | 176 | ||||||||||
6.500% due 11/25/2036 | 8,381 | 2,817 | ||||||||||
6.610% due 11/25/2035 •(k) | 7,920 | 7,275 | ||||||||||
8.097% due 05/25/2037 ^• | 656 | 610 | ||||||||||
Countrywide Asset-Backed Certificates Trust | ||||||||||||
5.630% due 04/25/2036 ^• | 389 | 329 | ||||||||||
Countrywide Home Loan Mortgage Pass-Through Trust | ||||||||||||
3.451% due 06/20/2035 «~ | 18 | 17 | ||||||||||
3.502% due 11/25/2035 ^~ | 819 | 651 | ||||||||||
3.594% due 03/25/2037 ^~ | 2,982 | 2,370 | ||||||||||
3.666% due 11/20/2035 ~(k) | 5,238 | 4,689 | ||||||||||
3.929% due 05/20/2036 ^~ | 741 | 648 | ||||||||||
4.022% due 09/25/2047 ^~ | 1,648 | 1,257 | ||||||||||
4.029% due 08/20/2035 ^~ | 28 | 27 | ||||||||||
4.239% due 09/20/2036 ~ | 2,513 | 2,219 | ||||||||||
4.687% due 06/25/2047 ^~(k) | 1,278 | 1,265 | ||||||||||
5.000% due 11/25/2035 ^« | 20 | 11 | ||||||||||
5.500% due 12/25/2034 « | 48 | 45 | ||||||||||
5.500% due 08/25/2035 ^« | 30 | 17 | ||||||||||
5.500% due 11/25/2035 ^ | 25 | 14 | ||||||||||
5.750% due 03/25/2035 • | 146 | 100 | ||||||||||
5.830% due 03/25/2036 • | 142 | 31 | ||||||||||
6.000% due 07/25/2037 ^« | 143 | 69 | ||||||||||
6.000% due 08/25/2037 ^« | 1 | 1 | ||||||||||
6.000% due 08/25/2037 (k) | 3,048 | 1,437 | ||||||||||
7.020% due 03/25/2046 ^•(k) | 24,750 | 16,282 | ||||||||||
Credit Suisse Commercial Mortgage Trust | ||||||||||||
5.787% due 01/15/2049 ~(k) | 10,300 | 11,269 | ||||||||||
Credit Suisse First Boston Mortgage Securities Corp. | ||||||||||||
6.000% due 01/25/2036 ^ | 235 | 150 | ||||||||||
7.500% due 05/25/2032 (k) | 707 | 712 | ||||||||||
PRINCIPAL AMOUNT (000S) | MARKET VALUE (000S) | |||||||||||
Credit Suisse Mortgage Capital Certificates | ||||||||||||
2.074% due 02/27/2047 ~(k) | $ | 32,613 | $ | 12,407 | ||||||||
2.796% due 12/29/2037 ~ | 2,827 | 1,565 | ||||||||||
3.695% due 05/26/2036 ~(k) | 3,115 | 2,495 | ||||||||||
3.816% due 10/26/2036 ~(k) | 9,782 | 9,030 | ||||||||||
3.839% due 06/25/2036 ~ | 3,209 | 2,831 | ||||||||||
3.839% due 09/26/2047 ~(k) | 16,358 | 8,007 | ||||||||||
3.842% due 05/27/2036 ~ | 2,293 | 1,818 | ||||||||||
3.906% due 04/28/2037 ~(k) | 2,113 | 1,962 | ||||||||||
4.081% due 07/26/2037 ~(k) | 5,656 | 4,962 | ||||||||||
4.702% due 04/26/2035 ~(k) | 7,261 | 6,699 | ||||||||||
5.750% due 05/26/2037 (k) | 11,278 | 7,081 | ||||||||||
7.000% due 08/26/2036 (k) | 14,477 | 3,674 | ||||||||||
7.000% due 08/27/2036 | 2,935 | 1,360 | ||||||||||
18.431% due 11/27/2037 •(k) | 8,557 | 7,170 | ||||||||||
19.293% due 11/25/2037 •(k) | 7,164 | 6,291 | ||||||||||
Credit Suisse Mortgage Capital Mortgage-Backed Trust | ||||||||||||
5.750% due 07/25/2036 ^«• | 407 | 71 | ||||||||||
6.000% due 07/25/2036 | 1,586 | 835 | ||||||||||
6.000% due 07/25/2036 « | 141 | 73 | ||||||||||
6.396% due 04/25/2036 þ(k) | 4,642 | 2,502 | ||||||||||
6.500% due 05/25/2036 ^ | 2,388 | 908 | ||||||||||
6.500% due 05/25/2036 ^« | 311 | 124 | ||||||||||
Credit Suisse Mortgage Capital Trust | ||||||||||||
3.828% due 08/15/2037 ~(k) | 5,326 | 4,626 | ||||||||||
6.500% due 07/26/2036 ^ | 11,228 | 2,856 | ||||||||||
7.093% due 07/15/2032 •(k) | 3,000 | 2,724 | ||||||||||
8.094% due 07/15/2038 •(k) | 15,850 | 13,165 | ||||||||||
8.493% due 07/15/2032 •(k) | 7,454 | 6,795 | ||||||||||
9.094% due 07/15/2038 •(k) | 13,700 | 10,658 | ||||||||||
9.543% due 07/15/2032 •(k) | 15,000 | 13,681 | ||||||||||
DBGS Mortgage Trust | ||||||||||||
6.038% due 06/15/2033 •(k) | 1,100 | 1,025 | ||||||||||
6.223% due 06/15/2033 •(k) | 1,600 | 1,435 | ||||||||||
7.293% due 06/15/2033 •(k) | 3,600 | 2,852 | ||||||||||
7.843% due 06/15/2033 •(k) | 6,100 | 4,673 | ||||||||||
8.344% due 10/15/2036 •(k) | 26,404 | 21,735 | ||||||||||
DBWF Mortgage Trust | ||||||||||||
3.791% due 12/10/2036 (k) | 17,961 | 15,513 | ||||||||||
Deutsche ALT-A Securities, Inc. Mortgage Loan Trust | ||||||||||||
5.300% due 02/25/2047 • | 322 | 197 | ||||||||||
5.500% due 12/25/2035 ^ | 478 | 399 | ||||||||||
Deutsche ALT-B Securities, Inc. Mortgage Loan Trust | ||||||||||||
5.450% due 04/25/2037 •(k) | 3,861 | 2,597 | ||||||||||
6.250% due 07/25/2036 ^«~ | 38 | 30 | ||||||||||
Deutsche Mortgage Securities, Inc. Mortgage Loan Trust | ||||||||||||
5.500% due 09/25/2033 « | 64 | 61 | ||||||||||
DOLP Trust | ||||||||||||
3.704% due 05/10/2041 ~(k) | 29,000 | 15,350 | ||||||||||
Downey Savings & Loan Association Mortgage Loan Trust | ||||||||||||
5.337% due 04/19/2047 ^• | 212 | 226 | ||||||||||
Dssv SARL | ||||||||||||
6.177% due 10/15/2024 « | EUR | 4,351 | 4,648 | |||||||||
Eurosail PLC | ||||||||||||
0.000% due 06/13/2045 ~ | GBP | 6 | 3,642 | |||||||||
4.309% due 03/13/2045 • | EUR | 7,067 | 6,391 | |||||||||
6.240% (BP0003M + 1.250%) due 06/13/2045 ~ | GBP | 14,072 | 15,008 | |||||||||
6.590% due 09/13/2045 • | 15,554 | 17,743 | ||||||||||
6.740% (BP0003M + 1.750%) due 06/13/2045 ~ | 8,667 | 8,763 | ||||||||||
7.240% due 09/13/2045 • | 11,113 | 12,362 | ||||||||||
8.490% (BP0003M + 3.500%) due 06/13/2045 ~ | 3,082 | 3,058 | ||||||||||
8.840% due 09/13/2045 • | 9,266 | 11,618 | ||||||||||
Extended Stay America Trust | ||||||||||||
8.894% due 07/15/2038 •(k) | $ | 44,236 | 42,169 | |||||||||
First Horizon Alternative Mortgage Securities Trust | ||||||||||||
0.000% due 09/28/2023 | 2 | 0 | ||||||||||
1.950% due 11/25/2036 •(a) | 731 | 95 | ||||||||||
4.878% due 02/25/2036 «~ | 33 | 25 | ||||||||||
4.900% due 05/25/2036 ^«~ | 451 | 361 | ||||||||||
5.139% due 11/25/2036 ^~ | 453 | 326 | ||||||||||
5.373% due 08/25/2035 ^«~ | 126 | 13 | ||||||||||
6.250% due 11/25/2036 ^ | 55 | 19 | ||||||||||
78 | PIMCO CLOSED-END FUNDS | See Accompanying Notes |
| June 30, 2023 |
PRINCIPAL AMOUNT (000S) | MARKET VALUE (000S) | |||||||||||
First Horizon Mortgage Pass-Through Trust | ||||||||||||
3.858% due 07/25/2037 ^«~ | $ | 14 | $ | 9 | ||||||||
4.010% due 05/25/2037 ^~ | 2,250 | 976 | ||||||||||
4.186% due 01/25/2037 ^~ | 201 | 123 | ||||||||||
5.500% due 08/25/2037 ^« | 213 | 83 | ||||||||||
Freddie Mac | ||||||||||||
8.417% due 09/25/2041 •(k) | 6,000 | 5,774 | ||||||||||
8.817% due 02/25/2042 •(k) | 16,000 | 16,125 | ||||||||||
9.817% due 02/25/2042 •(k) | 5,000 | 4,989 | ||||||||||
9.817% due 01/25/2051 • | 2,300 | 2,110 | ||||||||||
9.867% due 10/25/2050 •(k) | 2,500 | 2,696 | ||||||||||
10.567% due 01/25/2034 • | 2,800 | 2,538 | ||||||||||
11.317% due 09/25/2041 •(k) | 6,400 | 6,001 | ||||||||||
12.067% due 12/25/2041 • | 500 | 467 | ||||||||||
12.567% due 10/25/2041 •(k) | 4,900 | 4,895 | ||||||||||
13.567% due 02/25/2042 • | 2,350 | 2,362 | ||||||||||
GC Pastor Hipotecario FTA | ||||||||||||
3.721% due 06/21/2046 • | EUR | 19,392 | 18,281 | |||||||||
GMAC Mortgage Corp. Loan Trust | ||||||||||||
3.614% due 07/19/2035 ~ | $ | 18 | 14 | |||||||||
GreenPoint Mortgage Funding Trust | ||||||||||||
5.510% due 01/25/2037 • | 527 | 458 | ||||||||||
5.550% due 12/25/2046 ^•(k) | 2,579 | 2,396 | ||||||||||
GS Mortgage Securities Corp. Trust | ||||||||||||
4.744% due 10/10/2032 ~(k) | 39,357 | 36,062 | ||||||||||
7.743% due 11/15/2032 •(k) | 10,358 | 10,016 | ||||||||||
7.793% due 08/15/2032 •(k) | 10,621 | 9,814 | ||||||||||
8.293% due 08/15/2032 •(k) | 11,668 | 10,702 | ||||||||||
GS Mortgage Securities Trust | ||||||||||||
0.568% due 08/10/2043 ~(a) | 1,016 | 8 | ||||||||||
GS Mortgage-Backed Securities Trust | ||||||||||||
0.000% due 07/25/2059 (b)(g) | 59 | 59 | ||||||||||
0.000% due 07/25/2059 ~(a) | 134,339 | 1,553 | ||||||||||
0.090% due 07/25/2059 ~(a) | 120,678 | 412 | ||||||||||
3.848% due 07/25/2059 ~(k) | 20,073 | 12,185 | ||||||||||
GSC Capital Corp. Mortgage Trust | ||||||||||||
5.510% due 05/25/2036 ^• | 1,186 | 1,101 | ||||||||||
GSR Mortgage Loan Trust | ||||||||||||
3.935% due 01/25/2036 ^~ | 301 | 294 | ||||||||||
4.031% due 12/25/2034 «~ | 9 | 8 | ||||||||||
4.157% due 11/25/2035 ~ | 122 | 69 | ||||||||||
5.600% due 07/25/2037 ^«• | 232 | 43 | ||||||||||
6.000% due 09/25/2034 « | 271 | 260 | ||||||||||
6.500% due 08/25/2036 ^• | 600 | 225 | ||||||||||
HarborView Mortgage Loan Trust | ||||||||||||
3.719% due 08/19/2036 ^«~ | 44 | 38 | ||||||||||
4.423% due 06/19/2045 ^• | 945 | 483 | ||||||||||
5.537% due 02/19/2046 • | 734 | 611 | ||||||||||
5.577% due 11/19/2036 • | 1,097 | 956 | ||||||||||
5.626% due 03/19/2036 ^•(k) | 7,195 | 6,535 | ||||||||||
5.657% due 01/19/2036 •(k) | 4,353 | 2,698 | ||||||||||
5.706% due 06/19/2034 «• | 67 | 58 | ||||||||||
5.797% due 01/19/2035 • | 103 | 86 | ||||||||||
6.132% due 06/20/2035 •(k) | 4,068 | 3,598 | ||||||||||
6.507% due 06/20/2035 • | 939 | 816 | ||||||||||
Harbour PLC | ||||||||||||
6.557% due 01/28/2054 • | GBP | 2,200 | 2,675 | |||||||||
7.057% due 01/28/2054 • | 12,153 | 14,654 | ||||||||||
HomeBanc Mortgage Trust | ||||||||||||
3.912% due 04/25/2037 ^~(k) | $ | 2,335 | 2,044 | |||||||||
5.650% due 03/25/2035 •(k) | 3,840 | 3,127 | ||||||||||
HSI Asset Loan Obligation Trust | ||||||||||||
6.000% due 06/25/2037 ^ | 2,362 | 2,032 | ||||||||||
IM Pastor Fondo de Titluzacion Hipotecaria | ||||||||||||
3.727% due 03/22/2043 • | EUR | 14,172 | 13,376 | |||||||||
3.727% due 03/22/2044 • | 696 | 686 | ||||||||||
Impac CMB Trust | ||||||||||||
5.670% due 11/25/2035 ^• | $ | 103 | 89 | |||||||||
5.870% due 10/25/2034 • | 72 | 68 | ||||||||||
Impac Secured Assets Trust | ||||||||||||
5.370% due 05/25/2037 ^• | 2 | 2 | ||||||||||
6.010% due 03/25/2036 • | 1,088 | 869 | ||||||||||
IndyMac IMSC Mortgage Loan Trust | ||||||||||||
3.747% due 06/25/2037 ^~(k) | 2,768 | 1,922 | ||||||||||
IndyMac INDA Mortgage Loan Trust | ||||||||||||
2.828% due 03/25/2037 «~ | 18 | 15 | ||||||||||
3.677% due 12/25/2036 ^~ | 421 | 359 | ||||||||||
PRINCIPAL AMOUNT (000S) | MARKET VALUE (000S) | |||||||||||
IndyMac INDX Mortgage Loan Trust | ||||||||||||
3.058% due 02/25/2035 ~ | $ | 206 | $ | 177 | ||||||||
3.103% due 06/25/2037 ^~ | 134 | 110 | ||||||||||
3.317% due 05/25/2037 ^~ | 1,714 | 1,410 | ||||||||||
3.410% due 11/25/2036 ^~ | 543 | 476 | ||||||||||
3.510% due 11/25/2035 ^~(k) | 2,266 | 1,998 | ||||||||||
3.717% due 06/25/2036 ~ | 592 | 510 | ||||||||||
5.550% due 11/25/2046 •(k) | 3,410 | 3,077 | ||||||||||
5.570% due 11/25/2036 • | 108 | 100 | ||||||||||
5.610% due 04/25/2035 • | 40 | 35 | ||||||||||
5.650% due 02/25/2037 • | 2,087 | 1,339 | ||||||||||
5.750% due 07/25/2036 • | 318 | 222 | ||||||||||
5.950% due 08/25/2034 «• | 111 | 93 | ||||||||||
6.010% due 09/25/2034 «• | 190 | 163 | ||||||||||
Jackson Park Trust | ||||||||||||
3.350% due 10/14/2039 ~(k) | 2,900 | 2,065 | ||||||||||
Jefferies Resecuritization Trust | ||||||||||||
6.000% due 12/26/2036 ~ | 3,522 | 1,019 | ||||||||||
JP Morgan Alternative Loan Trust | ||||||||||||
3.576% due 11/25/2036 ^«~ | 77 | 78 | ||||||||||
3.759% due 05/25/2036 ^~ | 577 | 340 | ||||||||||
5.500% due 11/25/2036 ^«~ | 8 | 3 | ||||||||||
5.550% due 06/25/2037 •(k) | 22,420 | 9,224 | ||||||||||
5.660% due 06/27/2037 •(k) | 4,846 | 3,512 | ||||||||||
6.000% due 12/25/2035 ^ | 538 | 375 | ||||||||||
6.294% due 06/27/2037 ~(k) | 13,190 | 5,700 | ||||||||||
6.460% due 12/25/2036 ^þ(k) | 2,248 | 2,140 | ||||||||||
JP Morgan Chase Commercial Mortgage Securities Trust | ||||||||||||
4.128% due 07/05/2031 (k) | 3,360 | 3,068 | ||||||||||
4.248% due 07/05/2033 (k) | 6,360 | 5,741 | ||||||||||
4.379% due 07/05/2031 (k) | 8,343 | 6,916 | ||||||||||
6.254% due 04/15/2037 •(k) | 1,493 | 1,384 | ||||||||||
6.493% due 12/15/2036 •(k) | 7,905 | 6,596 | ||||||||||
6.663% due 07/05/2033 • | 3,000 | 2,718 | ||||||||||
6.943% due 03/15/2036 •(k) | 7,900 | 6,747 | ||||||||||
6.943% due 12/15/2036 •(k) | 2,500 | 1,767 | ||||||||||
7.033% due 06/15/2038 •(k) | 2,000 | 1,727 | ||||||||||
8.443% due 02/15/2035 •(k) | 12,053 | 11,400 | ||||||||||
8.709% due 11/15/2038 •(k) | 9,000 | 8,751 | ||||||||||
10.454% due 11/15/2038 •(k) | 19,700 | 17,878 | ||||||||||
JP Morgan Mortgage Trust | ||||||||||||
3.636% due 10/25/2036 ^~ | 12 | 9 | ||||||||||
3.904% due 10/25/2036 ~ | 283 | 205 | ||||||||||
3.927% due 05/25/2036 ^«~ | 190 | 152 | ||||||||||
4.118% due 06/25/2037 ^~(k) | 1,590 | 1,261 | ||||||||||
4.366% due 07/25/2035 ~ | 21 | 20 | ||||||||||
6.000% due 08/25/2037 ^« | 340 | 180 | ||||||||||
JP Morgan Resecuritization Trust | ||||||||||||
4.238% due 03/21/2037 «~ | 366 | 331 | ||||||||||
6.000% due 09/26/2036 ~ | 1,050 | 810 | ||||||||||
6.500% due 04/26/2036 ~ | 4,008 | 1,480 | ||||||||||
Lansdowne Mortgage Securities PLC | ||||||||||||
3.862% due 09/16/2048 • | EUR | 6,179 | 6,023 | |||||||||
3.986% due 06/15/2045 • | 900 | 731 | ||||||||||
Lavender Trust | ||||||||||||
6.000% due 11/26/2036 (k) | $ | 6,907 | 6,219 | |||||||||
6.250% due 10/26/2036 (k) | 3,624 | 1,897 | ||||||||||
Lehman Mortgage Trust | ||||||||||||
5.890% due 04/25/2036 ^~ | 194 | 128 | ||||||||||
6.000% due 08/25/2036 ^ | 458 | 374 | ||||||||||
6.000% due 09/25/2036 ^« | 336 | 184 | ||||||||||
6.000% due 05/25/2037 ^« | 17 | 17 | ||||||||||
6.000% due 01/25/2038 ^« | 479 | 443 | ||||||||||
6.500% due 09/25/2037 ^ | 3,150 | 1,141 | ||||||||||
7.250% due 09/25/2037 ^(k) | 31,125 | 9,342 | ||||||||||
Lehman XS Trust | ||||||||||||
5.710% due 07/25/2037 •(k) | 22,489 | 15,059 | ||||||||||
6.050% due 08/25/2047 ^• | 234 | 196 | ||||||||||
6.150% due 07/25/2047 •(k) | 3,393 | 2,945 | ||||||||||
LUXE Commercial Mortgage Trust | ||||||||||||
8.443% due 10/15/2038 •(k) | 5,211 | 5,022 | ||||||||||
MAD Mortgage Trust | ||||||||||||
3.478% due 08/15/2034 ~(k) | 2,620 | 2,232 | ||||||||||
MASTR Adjustable Rate Mortgages Trust | ||||||||||||
3.912% due 10/25/2034 ~ | 183 | 164 | ||||||||||
4.716% due 01/25/2047 ^«• | 33 | 32 | ||||||||||
5.830% due 05/25/2047 ^•(k) | 6,765 | 5,663 | ||||||||||
PRINCIPAL AMOUNT (000S) | MARKET VALUE (000S) | |||||||||||
MASTR Alternative Loan Trust | ||||||||||||
5.500% due 03/25/2036 • | $ | 19,963 | $ | 1,996 | ||||||||
5.550% due 03/25/2036 ^• | 26,386 | 2,671 | ||||||||||
Merrill Lynch Alternative Note Asset Trust | ||||||||||||
6.000% due 05/25/2037 ^(k) | 2,287 | 1,794 | ||||||||||
Merrill Lynch Mortgage Investors Trust | ||||||||||||
3.738% due 03/25/2036 ^~(k) | 6,593 | 3,718 | ||||||||||
4.288% due 05/25/2036 ~ | 1,545 | 1,453 | ||||||||||
MFA Trust | ||||||||||||
4.039% due 04/25/2065 ~(k) | 14,456 | 11,735 | ||||||||||
Morgan Stanley Capital Trust | ||||||||||||
2.509% due 04/05/2042 ~(k) | 2,985 | 2,054 | ||||||||||
3.912% due 09/09/2032 (k) | 25,132 | 20,320 | ||||||||||
6.143% due 12/15/2036 •(k) | 6,246 | 5,095 | ||||||||||
6.693% due 12/15/2036 • | 453 | 279 | ||||||||||
7.437% due 12/15/2036 •(k) | 18,590 | 7,755 | ||||||||||
8.243% due 07/15/2035 •(k) | 10,478 | 10,205 | ||||||||||
9.388% due 12/15/2038 •(k) | 18,000 | 16,363 | ||||||||||
10.287% due 12/15/2038 •(k) | 19,500 | 17,431 | ||||||||||
Morgan Stanley Mortgage Capital Holdings Trust | ||||||||||||
3.865% due 09/13/2039 ~(k) | 1,780 | 1,304 | ||||||||||
Morgan Stanley Mortgage Loan Trust | ||||||||||||
4.445% due 05/25/2036 ^~ | 1,605 | 754 | ||||||||||
4.616% due 07/25/2035 ^~ | 523 | 437 | ||||||||||
4.806% due 01/25/2035 ^~(k) | 164 | 134 | ||||||||||
5.460% due 01/25/2035 «• | 288 | 252 | ||||||||||
5.490% due 05/25/2036 «• | 146 | 27 | ||||||||||
5.750% due 12/25/2035 ^« | 179 | 121 | ||||||||||
5.962% due 06/25/2036 ^~ | 1,799 | 544 | ||||||||||
6.000% due 08/25/2037 ^ | 136 | 57 | ||||||||||
Morgan Stanley Re-REMIC Trust | ||||||||||||
2.643% due 03/26/2037 þ(k) | 1,271 | 1,216 | ||||||||||
2.702% due 02/26/2037 «• | 2,056 | 1,886 | ||||||||||
4.189% due 09/26/2035 ~(k) | 648 | 609 | ||||||||||
4.366% due 07/26/2035 ~(k) | 6,570 | 6,266 | ||||||||||
4.850% due 06/26/2035 ~(k) | 10,914 | 8,277 | ||||||||||
6.000% due 04/26/2036 (k) | 7,210 | 7,075 | ||||||||||
Mortgage Equity Conversion Asset Trust | ||||||||||||
4.000% due 07/25/2060 | 3,246 | 2,884 | ||||||||||
Mortgage Funding PLC | ||||||||||||
8.190% due 03/13/2046 • | GBP | 1,000 | 1,243 | |||||||||
MSDB Trust | ||||||||||||
3.427% due 07/11/2039 ~(k) | $ | 21,938 | 18,703 | |||||||||
Natixis Commercial Mortgage Securities Trust | ||||||||||||
4.193% due 04/10/2037 ~(k) | 5,880 | 3,954 | ||||||||||
8.343% due 11/15/2034 •(k) | 8,574 | 8,064 | ||||||||||
9.343% due 11/15/2034 •(k) | 3,718 | 3,480 | ||||||||||
New Orleans Hotel Trust | ||||||||||||
7.232% due 04/15/2032 (k) | 13,642 | 12,867 | ||||||||||
New Residential Mortgage Loan Trust | ||||||||||||
3.885% due 11/25/2059 ~ | 8,300 | 4,009 | ||||||||||
New York Mortgage Trust | ||||||||||||
3.558% due 08/25/2061 þ(k) | 1,000 | 795 | ||||||||||
5.250% due 07/25/2062 þ(k) | 14,480 | 13,612 | ||||||||||
Newgate Funding PLC | ||||||||||||
4.776% due 12/15/2050 • | EUR | 1,052 | 1,054 | |||||||||
5.026% due 12/15/2050 • | 2,009 | 1,954 | ||||||||||
Nomura Asset Acceptance Corp. Alternative Loan Trust | ||||||||||||
5.470% due 10/25/2036 • | $ | 1,048 | 897 | |||||||||
Nomura Resecuritization Trust | ||||||||||||
4.536% due 09/26/2035 ~(k) | 3,927 | 3,380 | ||||||||||
NovaStar Mortgage Funding Trust | ||||||||||||
0.440% due 09/25/2046 • | 146 | 140 | ||||||||||
NYO Commercial Mortgage Trust | ||||||||||||
6.806% due 11/15/2038 •(k) | 2,200 | 1,891 | ||||||||||
PMT Credit Risk Transfer Trust | ||||||||||||
8.078% due 02/27/2024 •(k) | 4,323 | 4,232 | ||||||||||
Preston Ridge Partners Mortgage LLC | ||||||||||||
6.291% due 02/25/2027 þ(k) | 1,000 | 944 | ||||||||||
Prime Mortgage Trust | ||||||||||||
5.500% due 06/25/2036 ^• | 1,432 | 974 | ||||||||||
7.000% due 07/25/2034 « | 49 | 42 | ||||||||||
RBSSP Resecuritization Trust | ||||||||||||
3.831% due 07/26/2045 ~(k) | 10,345 | 9,815 | ||||||||||
4.031% due 05/26/2037 ~ | 2,841 | 1,749 | ||||||||||
| See Accompanying Notes | ANNUAL REPORT | | | JUNE 30, 2023 | 79 |
Consolidated Schedule of Investments | PIMCO Dynamic Income Fund | (Cont.) |
PRINCIPAL AMOUNT (000S) | MARKET VALUE (000S) | |||||||||||
4.342% due 09/26/2035 ~ | $ | 3,368 | $ | 1,973 | ||||||||
6.000% due 03/26/2036 ^~ | 3,540 | 2,033 | ||||||||||
6.000% due 06/26/2037 ~ | 408 | 353 | ||||||||||
Regal Trust | ||||||||||||
3.910% due 09/29/2031 «• | 1 | 1 | ||||||||||
Residential Accredit Loans, Inc. Trust | ||||||||||||
4.976% due 01/25/2046 ^•(k) | 2,900 | 2,425 | ||||||||||
5.450% due 02/25/2037 • | 309 | 272 | ||||||||||
5.500% due 04/25/2037 « | 44 | 33 | ||||||||||
5.510% due 07/25/2036 ^•(k) | 6,890 | 2,887 | ||||||||||
5.530% due 05/25/2037 •(k) | 7,010 | 6,283 | ||||||||||
5.570% due 06/25/2037 • | 750 | 635 | ||||||||||
5.755% due 01/25/2036 «~ | 17 | 27 | ||||||||||
6.000% due 08/25/2035 ^ | 606 | 514 | ||||||||||
6.000% due 12/25/2035 ^(k) | 1,270 | 1,143 | ||||||||||
6.000% due 06/25/2036 « | 148 | 115 | ||||||||||
6.000% due 09/25/2036 ^(k) | 3,069 | 1,434 | ||||||||||
6.000% due 11/25/2036 ^(k) | 1,449 | 1,161 | ||||||||||
6.000% due 01/25/2037 ^ | 215 | 166 | ||||||||||
6.250% due 02/25/2037 ^(k) | 2,148 | 1,756 | ||||||||||
6.500% due 09/25/2037 ^ | 784 | 624 | ||||||||||
7.000% due 10/25/2037 (k) | 4,614 | 3,585 | ||||||||||
Residential Asset Mortgage Products Trust | ||||||||||||
8.000% due 05/25/2032 « | 351 | 228 | ||||||||||
Residential Asset Securitization Trust | ||||||||||||
5.500% due 07/25/2035 | 602 | 387 | ||||||||||
6.000% due 02/25/2037 ^ | 166 | 77 | ||||||||||
6.000% due 03/25/2037 ^ | 2,795 | 958 | ||||||||||
6.000% due 07/25/2037 ^ | 6,200 | 2,687 | ||||||||||
6.250% due 08/25/2037 ^ | 4,035 | 1,115 | ||||||||||
Residential Funding Mortgage Securities, Inc. Trust | ||||||||||||
5.377% due 07/27/2037 ^«~ | 112 | 84 | ||||||||||
5.850% due 11/25/2035 ^« | 54 | 49 | ||||||||||
6.000% due 04/25/2037 ^ | 396 | 307 | ||||||||||
6.000% due 06/25/2037 ^ | 159 | 121 | ||||||||||
RiverView HECM Trust | ||||||||||||
5.790% due 05/25/2047 • | 8,112 | 7,874 | ||||||||||
Seasoned Credit Risk Transfer Trust | ||||||||||||
4.250% due 11/25/2059 ~(k) | 4,530 | 3,883 | ||||||||||
4.250% due 09/25/2060 | 1,800 | 1,553 | ||||||||||
4.250% due 03/25/2061 ~ | 700 | 554 | ||||||||||
4.500% due 11/25/2061 ~(k) | 3,900 | 3,084 | ||||||||||
5.000% due 04/25/2062 ~(k) | 3,400 | 2,677 | ||||||||||
6.165% due 11/25/2059 ~(k) | 6,794 | 2,476 | ||||||||||
6.412% due 11/25/2061 ~(a) | 4,494 | 1,361 | ||||||||||
9.482% due 03/25/2061 ~ | 498 | 253 | ||||||||||
13.916% due 11/25/2060 ~ | 1,199 | 917 | ||||||||||
14.094% due 09/25/2060 ~ | 1,594 | 1,141 | ||||||||||
Sequoia Mortgage Trust | ||||||||||||
3.604% due 01/20/2038 ^«~ | 80 | 62 | ||||||||||
5.708% due 02/20/2034 • | 161 | 144 | ||||||||||
5.897% due 07/20/2036 «• | 125 | 17 | ||||||||||
6.357% due 10/20/2027 «• | 226 | 191 | ||||||||||
6.706% due 09/20/2032 «~ | 216 | 201 | ||||||||||
SFO Commercial Mortgage Trust | ||||||||||||
6.343% due 05/15/2038 •(k) | 18,150 | 15,924 | ||||||||||
6.693% due 05/15/2038 •(k) | 2,120 | 1,743 | ||||||||||
6.993% due 05/15/2038 •(k) | 1,760 | 1,395 | ||||||||||
SG Commercial Mortgage Securities Trust | ||||||||||||
4.660% due 02/15/2041 ~(k) | 9,000 | 6,529 | ||||||||||
SMRT Commercial Mortgage Trust | ||||||||||||
7.847% due 01/15/2039 •(k) | 30,200 | 28,547 | ||||||||||
Starwood Mortgage Residential Trust | ||||||||||||
3.935% due 11/25/2066 ~ | 500 | 313 | ||||||||||
Starwood Mortgage Trust | ||||||||||||
8.193% due 04/15/2034 •(k) | 13,424 | 12,821 | ||||||||||
9.193% due 04/15/2034 •(k) | 6,612 | 6,316 | ||||||||||
Stratton Hawksmoor PLC | ||||||||||||
6.766% due 02/25/2053 • | GBP | 1,967 | 2,368 | |||||||||
7.516% due 02/25/2053 • | 4,300 | 5,092 | ||||||||||
Stratton Mortgage Funding PLC | ||||||||||||
7.991% due 07/20/2060 • | 2,000 | 2,492 | ||||||||||
8.865% due 03/12/2052 • | 2,500 | 3,096 | ||||||||||
Structured Adjustable Rate Mortgage Loan Trust | ||||||||||||
3.635% due 02/25/2037 ^~(k) | $ | 5,513 | 3,812 | |||||||||
4.197% due 04/25/2047 ~ | 1,012 | 489 | ||||||||||
4.378% due 01/25/2036 ^~ | 569 | 353 | ||||||||||
4.470% due 08/25/2036 ~ | 2,255 | 550 | ||||||||||
PRINCIPAL AMOUNT (000S) | MARKET VALUE (000S) | |||||||||||
Structured Asset Mortgage Investments Trust | ||||||||||||
4.605% due 02/25/2036 ~ | $ | 2,914 | $ | 1,521 | ||||||||
5.490% due 03/25/2037 ^• | 883 | 249 | ||||||||||
5.530% due 07/25/2046 ^•(k) | 8,766 | 6,316 | ||||||||||
5.570% due 05/25/2036 • | 1,034 | 697 | ||||||||||
5.570% due 08/25/2036 ^• | 758 | 622 | ||||||||||
5.610% due 05/25/2045 • | 55 | 50 | ||||||||||
Structured Asset Securities Corp. Mortgage Pass-Through Certificates | ||||||||||||
5.263% due 01/25/2034 ~ | 73 | 70 | ||||||||||
SunTrust Adjustable Rate Mortgage Loan Trust | ||||||||||||
4.078% due 02/25/2037 ^~(k) | 1,192 | 1,033 | ||||||||||
SunTrust Alternative Loan Trust | ||||||||||||
2.000% due 04/25/2036 ^•(a) | 3,903 | 579 | ||||||||||
TBW Mortgage-Backed Trust | ||||||||||||
6.000% due 07/25/2036 ^« | 204 | 78 | ||||||||||
6.500% due 07/25/2036 (k) | 18,327 | 4,735 | ||||||||||
TDA Mixto Fondo de Titulizacion de Activos | ||||||||||||
3.442% due 10/28/2050 • | EUR | 8,181 | 4,741 | |||||||||
3.767% due 12/28/2050 • | 6,614 | 5,995 | ||||||||||
Tharaldson Hotel Portfolio Trust | ||||||||||||
8.671% due 11/11/2034 •(k) | $ | 13,128 | 12,637 | |||||||||
TTAN | ||||||||||||
7.594% due 03/15/2038 •(k) | 9,670 | 9,304 | ||||||||||
VASA Trust | ||||||||||||
9.093% due 07/15/2039 •(k) | 4,435 | 2,401 | ||||||||||
Verus Securitization Trust | ||||||||||||
5.396% due 07/25/2067 ~(k) | 4,300 | 3,943 | ||||||||||
VNDO Mortgage Trust | ||||||||||||
4.033% due 01/10/2035 ~(k) | 4,814 | 3,815 | ||||||||||
Waikiki Beach Hotel Trust | ||||||||||||
7.223% due 12/15/2033 •(k) | 19,450 | 18,724 | ||||||||||
7.873% due 12/15/2033 •(k) | 20,500 | 19,237 | ||||||||||
WaMu Mortgage Pass-Through Certificates Trust | ||||||||||||
3.347% due 11/25/2036 ^~ | 96 | 87 | ||||||||||
3.472% due 03/25/2037 ^~ | 239 | 190 | ||||||||||
3.514% due 07/25/2037 ^~ | 1,025 | 766 | ||||||||||
3.672% due 08/25/2036 ^~(k) | 911 | 836 | ||||||||||
3.704% due 02/25/2037 ^~ | 1,622 | 1,360 | ||||||||||
3.757% due 03/25/2037 ^~(k) | 1,676 | 1,535 | ||||||||||
3.784% due 06/25/2037 ^~ | 645 | 566 | ||||||||||
3.809% due 07/25/2037 ^~ | 508 | 470 | ||||||||||
4.016% due 03/25/2033 «~ | 23 | 21 | ||||||||||
4.726% due 06/25/2047 ^• | 1,652 | 1,161 | ||||||||||
4.774% due 07/25/2047 ^• | 377 | 327 | ||||||||||
4.786% due 07/25/2047 •(k) | 11,494 | 9,377 | ||||||||||
4.856% due 10/25/2046 ^• | 215 | 184 | ||||||||||
5.024% due 07/25/2046 •(k) | 2,581 | 2,173 | ||||||||||
5.690% due 07/25/2045 • | 101 | 96 | ||||||||||
5.990% due 06/25/2044 •(k) | 80 | 74 | ||||||||||
Warwick Finance Residential Mortgages PLC | ||||||||||||
0.000% due 12/21/2049 (g) | GBP | 0 | 1,836 | |||||||||
7.564% due 12/21/2049 • | 646 | 806 | ||||||||||
8.064% due 12/21/2049 • | 646 | 792 | ||||||||||
Washington Mutual Mortgage Pass-Through Certificates Trust | ||||||||||||
2.818% due 06/25/2046 •(k) | $ | 5,488 | 3,160 | |||||||||
3.725% due 06/25/2033 «~ | 64 | 57 | ||||||||||
4.826% due 10/25/2046 ^• | 250 | 210 | ||||||||||
5.630% due 01/25/2047 ^•(k) | 7,405 | 6,639 | ||||||||||
5.750% due 11/25/2035 ^(k) | 830 | 727 | ||||||||||
5.750% due 07/25/2036 ^•(k) | 3,237 | 2,090 | ||||||||||
6.000% due 04/25/2037 ^(k) | 1,288 | 1,088 | ||||||||||
6.467% due 05/25/2036 ^þ(k) | 3,545 | 2,990 | ||||||||||
Wells Fargo Alternative Loan Trust | ||||||||||||
5.134% due 07/25/2037 ^~ | 1,291 | 1,164 | ||||||||||
5.750% due 07/25/2037 ^ | 187 | 157 | ||||||||||
Wells Fargo Commercial Mortgage Trust | ||||||||||||
4.708% due 09/15/2031 ~(k) | 27,000 | 24,027 | ||||||||||
7.933% due 02/15/2037 •(k) | 10,000 | 9,289 | ||||||||||
Wells Fargo Mortgage Loan Trust | ||||||||||||
3.575% due 03/27/2037 ~ | 3,271 | 1,998 | ||||||||||
4.692% due 04/27/2036 ~(k) | 3,220 | 2,928 | ||||||||||
Wells Fargo Mortgage-Backed Securities Trust | ||||||||||||
4.509% due 10/25/2036 ^«~ | 5 | 4 | ||||||||||
4.517% due 09/25/2036 ^«~ | 4 | 4 | ||||||||||
PRINCIPAL AMOUNT (000S) | MARKET VALUE (000S) | |||||||||||
6.000% due 06/25/2037 ^« | $ | 29 | $ | 26 | ||||||||
6.000% due 06/25/2037 ^ | 29 | 25 | ||||||||||
Worldwide Plaza Trust | ||||||||||||
3.715% due 11/10/2036 ~(k) | 8,000 | 2,847 | ||||||||||
Total Non-Agency Mortgage-Backed Securities (Cost $2,327,505) | 2,185,835 | |||||||||||
ASSET-BACKED SECURITIES 30.1% | ||||||||||||
510 Loan Acquisition Trust | ||||||||||||
5.107% due 09/25/2060 þ(k) | 17,047 | 16,691 | ||||||||||
Acacia CDO Ltd. | ||||||||||||
6.174% due 11/08/2039 •(k) | 8,674 | 2,362 | ||||||||||
Access Financial Manufactured Housing Contract Trust | ||||||||||||
7.650% due 05/15/2049 | 200 | 3 | ||||||||||
ACE Securities Corp. Home Equity Loan Trust | ||||||||||||
5.370% due 12/25/2036 •(k) | 21,465 | 5,756 | ||||||||||
6.110% due 08/25/2035 •(k) | 5,031 | 3,266 | ||||||||||
6.245% due 07/25/2035 ^•(k) | 17,938 | 15,767 | ||||||||||
Adagio CLO DAC | ||||||||||||
0.000% due 04/30/2031 ~ | EUR | 1,800 | 636 | |||||||||
Aegis Asset-Backed Securities Trust Mortgage Pass-Through Certificates | ||||||||||||
7.250% due 09/25/2034 • | $ | 740 | 738 | |||||||||
AIM Aviation Finance Ltd. | ||||||||||||
6.213% due 02/15/2040 þ(k) | 1,709 | 1,043 | ||||||||||
American Money Management Corp. CLO Ltd. | ||||||||||||
11.311% due 04/14/2029 •(k) | 6,100 | 6,070 | ||||||||||
Ameriquest Mortgage Securities, Inc. Asset-Backed Pass-Through Certificates | ||||||||||||
3.407% due 09/25/2032 • | 1,148 | 987 | ||||||||||
6.875% due 05/25/2034 • | 154 | 146 | ||||||||||
6.875% due 08/25/2035 (k) | 6,340 | 5,084 | ||||||||||
8.000% due 08/25/2032 «• | 291 | 274 | ||||||||||
Argent Securities Trust | ||||||||||||
5.300% due 09/25/2036 •(k) | 7,721 | 2,544 | ||||||||||
5.350% due 06/25/2036 • | 6,610 | 1,847 | ||||||||||
5.390% due 04/25/2036 • | 1,039 | 344 | ||||||||||
5.450% due 06/25/2036 • | 3,721 | 1,040 | ||||||||||
5.530% due 03/25/2036 •(k) | 10,275 | 5,715 | ||||||||||
Argent Securities, Inc. Asset-Backed Pass-Through Certificates | ||||||||||||
5.840% due 11/25/2035 •(k) | 29,851 | 25,054 | ||||||||||
5.910% due 02/25/2036 •(k) | 21,346 | 16,314 | ||||||||||
Asset-Backed Funding Certificates Trust | ||||||||||||
5.300% due 10/25/2036 • | 961 | 948 | ||||||||||
5.710% due 10/25/2033 «• | 167 | 155 | ||||||||||
6.200% due 03/25/2034 ^• | 478 | 445 | ||||||||||
Banco Bilbao Vizcaya Argentaria | ||||||||||||
4.237% due 03/22/2046 • | EUR | 550 | 351 | |||||||||
Bear Stearns Asset-Backed Securities Trust | ||||||||||||
3.534% due 09/25/2034 «• | $ | 127 | 120 | |||||||||
3.534% due 09/25/2034 • | 43 | 42 | ||||||||||
3.916% due 10/25/2036 ~ | 132 | 105 | ||||||||||
3.945% due 10/25/2036 ~ | 2,493 | 1,150 | ||||||||||
4.037% due 07/25/2036 «~ | 55 | 53 | ||||||||||
4.858% due 12/25/2036 •(k) | 9,234 | 12,510 | ||||||||||
5.240% due 12/25/2034 •(k) | 16,571 | 16,036 | ||||||||||
6.650% due 10/27/2032 «• | 1 | 3 | ||||||||||
Bombardier Capital Mortgage Securitization Corp. | ||||||||||||
7.830% due 06/15/2030 ~ | 3,549 | 471 | ||||||||||
Carlyle Global Market Strategies CLO Ltd. | ||||||||||||
0.000% due 04/17/2031 ~ | 2,900 | 667 | ||||||||||
Carrington Mortgage Loan Trust | ||||||||||||
5.230% due 03/25/2035 • | 608 | 477 | ||||||||||
5.570% due 12/26/2036 •(k) | 13,201 | 10,395 | ||||||||||
CIFC Funding Ltd. | ||||||||||||
0.000% due 04/24/2030 ~ | 3,390 | 687 | ||||||||||
Citigroup Mortgage Loan Trust | ||||||||||||
4.607% due 03/25/2036 ^þ | 1,449 | 725 | ||||||||||
5.350% due 05/25/2037 • | 441 | 291 | ||||||||||
5.450% due 12/25/2036 •(k) | 17,528 | 7,072 | ||||||||||
5.470% due 09/25/2036 •(k) | 10,879 | 7,949 | ||||||||||
5.470% due 12/25/2036 •(k) | 11,477 | 6,452 | ||||||||||
5.590% due 12/25/2036 •(k) | 12,842 | 5,200 | ||||||||||
5.850% due 11/25/2046 •(k) | 4,267 | 3,484 | ||||||||||
80 | PIMCO CLOSED-END FUNDS | See Accompanying Notes |
| June 30, 2023 |
PRINCIPAL AMOUNT (000S) | MARKET VALUE (000S) | |||||||||||
6.352% due 05/25/2036 ^þ | $ | 376 | $ | 151 | ||||||||
6.851% due 05/25/2036 ^þ | 2,184 | 875 | ||||||||||
Cologix Canadian Issuer LP | ||||||||||||
7.740% due 01/25/2052 | CAD | 2,000 | 1,358 | |||||||||
Conseco Finance Corp. | ||||||||||||
6.530% due 02/01/2031 ~ | $ | 460 | 402 | |||||||||
7.060% due 02/01/2031 ~ | 2,002 | 1,777 | ||||||||||
7.500% due 03/01/2030 ~ | 6,233 | 2,435 | ||||||||||
Conseco Finance Securitizations Corp. | ||||||||||||
7.770% due 09/01/2031 þ | 328 | 324 | ||||||||||
7.960% due 05/01/2031 | 1,458 | 438 | ||||||||||
8.060% due 09/01/2029 ~ | 2,914 | 614 | ||||||||||
8.260% due 12/01/2030 ~ | 4,584 | 1,198 | ||||||||||
8.850% due 12/01/2030 ~ | 5,630 | 1,071 | ||||||||||
9.163% due 03/01/2033 ~(k) | 9,809 | 8,996 | ||||||||||
9.546% due 12/01/2033 ~(k) | 6,480 | 6,220 | ||||||||||
Cork Street CLO Designated Activity Co. | ||||||||||||
0.000% due 11/27/2028 ~ | EUR | 1,401 | 276 | |||||||||
Coronado CDO Ltd. | ||||||||||||
6.000% due 09/04/2038 (k) | $ | 3,781 | 1,899 | |||||||||
6.999% due 09/04/2038 •(k) | 23,864 | 10,607 | ||||||||||
Countrywide Asset-Backed Certificates Trust | ||||||||||||
4.095% due 02/25/2036 «~ | 2 | 2 | ||||||||||
4.450% due 10/25/2032 ^~(k) | 3,961 | 3,853 | ||||||||||
5.350% due 06/25/2037 ^•(k) | 18,405 | 18,075 | ||||||||||
5.400% due 11/25/2047 ^•(k) | 3,447 | 3,006 | ||||||||||
5.410% due 12/25/2036 ^•(k) | 5,301 | 4,749 | ||||||||||
5.430% due 03/25/2037 •(k) | 11,670 | 11,101 | ||||||||||
5.540% due 01/25/2046 ^•(k) | 36,303 | 28,927 | ||||||||||
5.630% due 03/25/2036 •(k) | 15,585 | 13,804 | ||||||||||
5.630% due 05/25/2036 •(k) | 4,093 | 3,328 | ||||||||||
5.630% due 03/25/2047 ^•(k) | 7,655 | 6,678 | ||||||||||
5.735% due 04/25/2036 •(k) | 8,762 | 7,880 | ||||||||||
5.830% due 12/25/2036 ^• | 287 | 211 | ||||||||||
5.859% due 10/25/2046 ^~ | 473 | 487 | ||||||||||
5.885% due 04/25/2036 •(k) | 15,850 | 13,472 | ||||||||||
6.050% due 03/25/2047 ^• | 975 | 803 | ||||||||||
6.250% due 05/25/2047 ^•(k) | 5,188 | 3,939 | ||||||||||
6.320% due 04/25/2036 •(k) | 9,384 | 7,736 | ||||||||||
6.867% due 09/25/2046 þ | 6,387 | 4,274 | ||||||||||
7.175% due 11/25/2035 • | 3,157 | 2,218 | ||||||||||
Credit Suisse First Boston Mortgage Securities Corp. | ||||||||||||
6.200% due 02/25/2031 • | 610 | 577 | ||||||||||
Credit-Based Asset Servicing & Securitization CBO Corp. | ||||||||||||
5.746% due 09/06/2041 • | 98,373 | 10 | ||||||||||
CSAB Mortgage-Backed Trust | ||||||||||||
5.500% due 05/25/2037 ^ | 1,936 | 1,394 | ||||||||||
Duke Funding Ltd. | ||||||||||||
5.711% due 04/08/2039 •(k) | 7,546 | 596 | ||||||||||
ECAF Ltd. | ||||||||||||
3.473% due 06/15/2040 | 1,166 | 683 | ||||||||||
4.947% due 06/15/2040 (k) | 7,723 | 4,677 | ||||||||||
EMC Mortgage Loan Trust | ||||||||||||
8.525% due 04/25/2042 • | 1,596 | 1,527 | ||||||||||
Encore Credit Receivables Trust | ||||||||||||
5.840% due 07/25/2035 • | 363 | 345 | ||||||||||
Euromax ABS PLC | ||||||||||||
3.652% due 11/10/2095 • | EUR | 2,982 | 3,248 | |||||||||
Exeter Automobile Receivables Trust | ||||||||||||
0.000% due 05/15/2031 «(g) | $ | 22 | 6,156 | |||||||||
0.000% due 08/15/2031 «(g) | 24 | 8,875 | ||||||||||
0.000% due 07/15/2033 «(g) | 27 | 29,504 | ||||||||||
0.000% due 12/15/2033 «(g) | 25 | 7,629 | ||||||||||
FAB UK Ltd. | ||||||||||||
0.000% due 12/06/2045 ~ | GBP | 14,563 | 5,378 | |||||||||
Fieldstone Mortgage Investment Trust | ||||||||||||
5.490% due 07/25/2036 • | $ | 4,245 | 2,116 | |||||||||
First Franklin Mortgage Loan Trust | ||||||||||||
5.720% due 02/25/2036 •(k) | 5,500 | 5,072 | ||||||||||
6.095% due 09/25/2035 •(k) | 5,831 | 5,101 | ||||||||||
6.125% due 05/25/2036 •(k) | 16,413 | 14,523 | ||||||||||
Flagship Credit Auto Trust | ||||||||||||
0.000% due 12/15/2027 «(g) | 9 | 914 | ||||||||||
0.000% due 06/15/2029 «(g) | 3 | 755 | ||||||||||
PRINCIPAL AMOUNT (000S) | MARKET VALUE (000S) | |||||||||||
FREED ABS Trust | ||||||||||||
0.000% due 09/20/2027 «(g) | $ | 10 | $ | 1,146 | ||||||||
Fremont Home Loan Trust | ||||||||||||
5.300% due 01/25/2037 • | 2,885 | 1,335 | ||||||||||
5.630% due 02/25/2037 • | 1,136 | 393 | ||||||||||
Glacier Funding CDO Ltd. | ||||||||||||
5.606% due 08/04/2035 •(k) | 31,282 | 3,984 | ||||||||||
GMACM Home Equity Loan Trust | ||||||||||||
6.749% due 12/25/2037 þ | 666 | 675 | ||||||||||
Greenpoint Manufactured Housing | ||||||||||||
9.230% due 12/15/2029 ~(k) | 6,013 | 5,270 | ||||||||||
GSAMP Trust | ||||||||||||
5.210% due 01/25/2037 • | 2,633 | 1,542 | ||||||||||
5.240% due 01/25/2037 • | 785 | 460 | ||||||||||
5.290% due 12/25/2036 • | 820 | 444 | ||||||||||
5.350% due 11/25/2036 • | 3,399 | 1,647 | ||||||||||
5.400% due 12/25/2036 • | 3,828 | 1,878 | ||||||||||
5.470% due 04/25/2036 • | 442 | 276 | ||||||||||
5.690% due 04/25/2036 •(k) | 15,753 | 9,917 | ||||||||||
6.800% due 10/25/2034 «• | 104 | 99 | ||||||||||
7.025% due 06/25/2034 •(k) | 1,253 | 1,116 | ||||||||||
Hillcrest CDO Ltd. | ||||||||||||
5.465% due 12/10/2039 •(k) | 32,573 | 6,448 | ||||||||||
Home Equity Mortgage Loan Asset-Backed Trust | ||||||||||||
5.310% due 11/25/2036 •(k) | 3,234 | 2,753 | ||||||||||
5.390% due 04/25/2037 •(k) | 17,289 | 11,284 | ||||||||||
5.470% due 04/25/2037 •(k) | 2,651 | 2,255 | ||||||||||
Hout Bay Corp. | ||||||||||||
4.422% due 07/05/2041 • | 108,638 | 21,304 | ||||||||||
4.622% due 07/05/2041 • | 4,871 | 0 | ||||||||||
4.752% due 07/05/2041 • | 1,690 | 0 | ||||||||||
HSI Asset Securitization Corp. Trust | ||||||||||||
5.290% due 12/25/2036 •(k) | 8,705 | 7,316 | ||||||||||
5.340% due 01/25/2037 •(k) | 28,395 | 19,638 | ||||||||||
5.370% due 12/25/2036 •(k) | 20,144 | 5,472 | ||||||||||
5.470% due 10/25/2036 • | 6,594 | 2,680 | ||||||||||
5.490% due 12/25/2036 • | 12,338 | 3,318 | ||||||||||
IndyMac Home Equity Mortgage Loan Asset-Backed Trust | ||||||||||||
5.668% due 12/25/2031 ^«þ | 467 | 202 | ||||||||||
IXIS Real Estate Capital Trust | ||||||||||||
6.125% due 09/25/2035 ^•(k) | 2,700 | 2,678 | ||||||||||
JP Morgan Mortgage Acquisition Trust | ||||||||||||
5.310% due 08/25/2036 «• | 6 | 2 | ||||||||||
5.340% due 03/25/2047 • | 270 | 267 | ||||||||||
5.450% due 07/25/2036 • | 1,340 | 600 | ||||||||||
5.462% due 09/25/2029 ^þ | 2,606 | 1,631 | ||||||||||
5.470% due 07/25/2036 ^• | 989 | 270 | ||||||||||
5.888% due 10/25/2036 ^þ(k) | 7,140 | 4,465 | ||||||||||
KGS-Alpha SBA COOF Trust | ||||||||||||
1.047% due 04/25/2038 «~(a) | 859 | 18 | ||||||||||
Labrador Aviation Finance Ltd. | ||||||||||||
4.300% due 01/15/2042 (k) | 3,240 | 2,685 | ||||||||||
Lehman ABS Mortgage Loan Trust | ||||||||||||
5.240% due 06/25/2037 • | 3,435 | 2,208 | ||||||||||
Lehman XS Trust | ||||||||||||
4.328% due 05/25/2037 ^~(k) | 6,669 | 5,498 | ||||||||||
6.670% due 06/24/2046 «þ | 308 | 318 | ||||||||||
LendingPoint Pass-Through Trust | ||||||||||||
0.000% due 03/15/2028 «(g) | 1,400 | 342 | ||||||||||
0.000% due 04/15/2028 «(g) | 1,700 | 462 | ||||||||||
LoanCore Issuer Ltd. | ||||||||||||
8.231% due 07/15/2035 •(k) | 2,705 | 2,471 | ||||||||||
Long Beach Mortgage Loan Trust | ||||||||||||
5.530% due 02/25/2036 •(k) | 34,595 | 28,340 | ||||||||||
5.690% due 05/25/2046 • | 8,200 | 2,621 | ||||||||||
5.855% due 11/25/2035 •(k) | 56,093 | 51,495 | ||||||||||
Madison Park Funding Ltd. | ||||||||||||
0.000% due 07/27/2047 ~(k) | 5,600 | 2,602 | ||||||||||
Margate Funding Ltd. | ||||||||||||
5.316% due 12/04/2044 •(k) | 17,556 | 5,345 | ||||||||||
Marlette Funding Trust | ||||||||||||
0.000% due 07/16/2029 «(g) | 16 | 1,264 | ||||||||||
0.000% due 09/17/2029 «(g) | 35 | 2,798 | ||||||||||
0.000% due 03/15/2030 «(g) | 33 | 1,169 | ||||||||||
0.000% due 09/16/2030 «(g) | 9 | 371 | ||||||||||
PRINCIPAL AMOUNT (000S) | MARKET VALUE (000S) | |||||||||||
MASTR Asset-Backed Securities Trust | ||||||||||||
5.370% due 08/25/2036 • | $ | 2,749 | $ | 1,076 | ||||||||
5.450% due 03/25/2036 •(k) | 5,232 | 3,185 | ||||||||||
5.490% due 06/25/2036 •(k) | 3,954 | 3,454 | ||||||||||
5.510% due 02/25/2036 •(k) | 6,138 | 2,495 | ||||||||||
5.630% due 06/25/2036 • | 2,643 | 1,010 | ||||||||||
5.690% due 12/25/2035 •(k) | 15,155 | 12,471 | ||||||||||
5.720% due 01/25/2036 • | 184 | 179 | ||||||||||
Mid-State Trust | ||||||||||||
6.742% due 10/15/2040 | 2,763 | 2,698 | ||||||||||
Morgan Stanley ABS Capital, Inc. Trust | ||||||||||||
5.220% due 10/25/2036 • | 1,415 | 615 | ||||||||||
5.250% due 11/25/2036 • | 1,199 | 660 | ||||||||||
5.270% due 09/25/2036 • | 3,261 | 1,221 | ||||||||||
5.290% due 10/25/2036 •(k) | 7,358 | 3,201 | ||||||||||
5.300% due 11/25/2036 •(k) | 13,073 | 7,201 | ||||||||||
5.370% due 10/25/2036 • | 3,546 | 1,544 | ||||||||||
5.450% due 06/25/2036 • | 5,179 | 2,872 | ||||||||||
5.450% due 09/25/2036 • | 6,551 | 2,466 | ||||||||||
5.480% due 02/25/2037 • | 4,530 | 2,189 | ||||||||||
6.185% due 01/25/2035 •(k) | 6,376 | 5,210 | ||||||||||
7.100% due 05/25/2034 «• | 415 | 409 | ||||||||||
Morgan Stanley Capital, Inc. Trust | ||||||||||||
5.510% due 03/25/2036 • | 11 | 9 | ||||||||||
Morgan Stanley Home Equity Loan Trust | ||||||||||||
5.380% due 04/25/2037 •(k) | 22,030 | 11,569 | ||||||||||
National Collegiate Commutation Trust | ||||||||||||
0.000% due 03/25/2038 • | 135,200 | 41,104 | ||||||||||
New Century Home Equity Loan Trust | ||||||||||||
8.150% due 01/25/2033 ^• | 248 | 212 | ||||||||||
Nomura Home Equity Loan, Inc. Home Equity Loan Trust | ||||||||||||
5.430% due 07/25/2036 •(k) | 3,500 | 2,856 | ||||||||||
5.810% due 10/25/2036 ^• | 4,225 | 955 | ||||||||||
NovaStar Mortgage Funding Trust | ||||||||||||
5.490% due 11/25/2036 • | 1,076 | 336 | ||||||||||
Oakwood Mortgage Investors, Inc. | ||||||||||||
5.423% due 06/15/2032 • | 1 | 1 | ||||||||||
7.840% due 11/15/2029 ~ | 1,149 | 1,148 | ||||||||||
8.490% due 10/15/2030 ^ | 1,161 | 1,075 | ||||||||||
OCP CLO Ltd. | ||||||||||||
0.000% due 07/20/2032 ~ | 11 | 3,923 | ||||||||||
Option One Mortgage Loan Trust | ||||||||||||
5.280% due 07/25/2037 •(k) | 21,390 | 13,746 | ||||||||||
5.290% due 01/25/2037 • | 274 | 179 | ||||||||||
5.290% due 01/25/2037 •(k) | 8,035 | 4,613 | ||||||||||
5.370% due 01/25/2037 • | 1,639 | 941 | ||||||||||
5.400% due 03/25/2037 • | 500 | 247 | ||||||||||
5.480% due 04/25/2037 • | 2,042 | 1,023 | ||||||||||
5.662% due 01/25/2037 ^«þ | 2 | 2 | ||||||||||
Orient Point CDO Ltd. | ||||||||||||
5.447% due 10/03/2045 •(k) | 391,989 | 127,276 | ||||||||||
Ownit Mortgage Loan Trust | ||||||||||||
3.157% due 10/25/2035 þ | 1,617 | 942 | ||||||||||
Palisades CDO Ltd. | ||||||||||||
6.223% due 07/22/2039 •(k) | 6,700 | 2,797 | ||||||||||
Park Place Securities, Inc. Asset-Backed Pass-Through Certificates | ||||||||||||
7.025% due 10/25/2034 • | 1,161 | 1,013 | ||||||||||
7.175% due 12/25/2034 •(k) | 25,974 | 23,850 | ||||||||||
PRET LLC | ||||||||||||
3.721% due 07/25/2051 þ | 1,200 | 987 | ||||||||||
3.844% due 07/25/2051 þ | 2,900 | 2,360 | ||||||||||
3.967% due 09/25/2051 þ(k) | 3,900 | 3,360 | ||||||||||
6.170% due 07/25/2051 þ | 2,100 | 1,964 | ||||||||||
7.870% due 06/25/2052 þ | 3,500 | 3,355 | ||||||||||
Putnam Structured Product Funding Ltd. | ||||||||||||
1.584% due 10/15/2038 •(k) | 801 | 514 | ||||||||||
RAAC Trust | ||||||||||||
7.775% due 05/25/2046 •(k) | 17,151 | 16,255 | ||||||||||
Renaissance Home Equity Loan Trust | ||||||||||||
5.612% due 04/25/2037 þ | 3,152 | 897 | ||||||||||
Residential Asset Mortgage Products Trust | ||||||||||||
4.555% due 08/25/2033 «• | 367 | 348 | ||||||||||
5.650% due 04/25/2034 •(k) | 1,445 | 1,414 | ||||||||||
5.730% due 04/25/2034 • | 585 | 579 | ||||||||||
| See Accompanying Notes | ANNUAL REPORT | | | JUNE 30, 2023 | 81 |
Consolidated Schedule of Investments | PIMCO Dynamic Income Fund | (Cont.) |
PRINCIPAL AMOUNT (000S) | MARKET VALUE (000S) | |||||||||||
6.200% due 04/25/2034 ^• | $ | 1,041 | $ | 972 | ||||||||
6.470% due 04/25/2034 ^• | 1,738 | 1,619 | ||||||||||
Residential Asset Securities Corp. Trust | ||||||||||||
5.410% due 11/25/2036 •(k) | 4,447 | 4,085 | ||||||||||
5.490% due 10/25/2036 •(k) | 3,606 | 3,440 | ||||||||||
5.630% due 08/25/2036 •(k) | 9,773 | 8,816 | ||||||||||
5.645% due 04/25/2036 •(k) | 5,975 | 4,839 | ||||||||||
5.810% due 12/25/2035 •(k) | 7,091 | 6,272 | ||||||||||
Rockford Tower CLO Ltd. | ||||||||||||
0.000% due 10/15/2029 ~(k) | 11,667 | 2,890 | ||||||||||
0.000% due 10/20/2030 ~ | 4,967 | 2,006 | ||||||||||
0.000% due 10/20/2031 ~ | 4,967 | 1,990 | ||||||||||
0.000% due 04/20/2034 ~(k) | 22,000 | 11,207 | ||||||||||
Saxon Asset Securities Trust | ||||||||||||
1.501% due 11/25/2035 •(k) | 5,547 | 3,427 | ||||||||||
2.029% due 03/25/2035 • | 5,096 | 2,888 | ||||||||||
Securitized Asset-Backed Receivables LLC Trust | ||||||||||||
5.380% due 02/25/2037 ^«• | 227 | 97 | ||||||||||
5.430% due 07/25/2036 •(k) | 12,585 | 10,166 | ||||||||||
5.470% due 07/25/2036 • | 2,699 | 947 | ||||||||||
5.650% due 05/25/2036 •(k) | 15,578 | 8,383 | ||||||||||
5.750% due 11/25/2035 •(k) | 10,666 | 8,670 | ||||||||||
5.810% due 08/25/2035 ^•(k) | 1,633 | 1,259 | ||||||||||
5.825% due 01/25/2035 • | 6 | 6 | ||||||||||
Segovia European CLO DAC | ||||||||||||
0.000% due 04/15/2035 ~ | EUR | 1,400 | 694 | |||||||||
SLM Student Loan EDC Repackaging Trust | ||||||||||||
0.000% due 10/28/2029 «(g)(k) | $ | 36 | 20,681 | |||||||||
SLM Student Loan Trust | ||||||||||||
0.000% due 01/25/2042 «(g) | 31 | 8,205 | ||||||||||
SMB Private Education Loan Trust | ||||||||||||
0.000% due 10/15/2048 «(g) | 8 | 2,490 | ||||||||||
0.000% due 09/15/2054 «(g)(k) | 54,567 | 64,932 | ||||||||||
0.000% due 11/16/2054 «(g) | 5 | 4,634 | ||||||||||
0.000% due 02/16/2055 «(g) | 9 | 12,375 | ||||||||||
5.950% due 02/16/2055 (k) | 11,206 | 10,439 | ||||||||||
SoFi Professional Loan Program LLC | ||||||||||||
0.000% due 05/25/2040 (g) | 31,475 | 3,013 | ||||||||||
0.000% due 07/25/2040 «(g) | 157 | 1,651 | ||||||||||
0.000% due 09/25/2040 «(g) | 14,219 | 1,730 | ||||||||||
Soloso CDO Ltd. | ||||||||||||
5.531% due 10/07/2037 •(k) | 17,418 | 14,370 | ||||||||||
Soundview Home Loan Trust | ||||||||||||
5.300% due 06/25/2037 • | 2,277 | 1,534 | ||||||||||
5.330% due 02/25/2037 • | 7,058 | 2,028 | ||||||||||
5.410% due 02/25/2037 • | 8,191 | 2,377 | ||||||||||
5.430% due 06/25/2037 •(k) | 5,628 | 3,790 | ||||||||||
6.100% due 10/25/2037 •(k) | 4,297 | 3,184 | ||||||||||
6.250% due 09/25/2037 • | 1,764 | 1,380 | ||||||||||
South Coast Funding Ltd. | ||||||||||||
0.476% due 01/06/2041 •(k) | 168,529 | 31,698 | ||||||||||
0.476% due 01/06/2041 • | 48 | 9 | ||||||||||
Specialty Underwriting & Residential Finance Trust | ||||||||||||
3.700% due 02/25/2037 ^þ | 2,525 | 986 | ||||||||||
3.746% due 06/25/2037 • | 3,019 | 1,465 | ||||||||||
5.500% due 03/25/2037 • | 295 | 166 | ||||||||||
Start Ltd. | ||||||||||||
4.089% due 03/15/2044 | 648 | 572 | ||||||||||
Structured Asset Securities Corp. | ||||||||||||
11.150% due 05/25/2032 ^•(k) | 5,172 | 4,412 | ||||||||||
Taberna Preferred Funding Ltd. | ||||||||||||
5.666% due 05/05/2038 •(k) | 2,256 | 2,120 | ||||||||||
5.706% due 08/05/2036 • | 2,911 | 2,540 | ||||||||||
5.706% due 08/05/2036 ^•(k) | 11,709 | 10,216 | ||||||||||
Talon Funding Ltd. | ||||||||||||
5.989% due 06/05/2035 • | 676 | 135 | ||||||||||
Tropic CDO Ltd. | ||||||||||||
5.580% due 07/15/2036 •(k) | 3,359 | 3,090 | ||||||||||
UCFC Home Equity Loan Trust | ||||||||||||
7.750% due 04/15/2030 «~ | 373 | 342 | ||||||||||
Verde CDO Ltd. | ||||||||||||
5.453% due 10/05/2045 •(k) | 240,688 | 59,817 | ||||||||||
Total Asset-Backed Securities (Cost $1,866,436) | 1,379,565 | |||||||||||
PRINCIPAL AMOUNT (000S) | MARKET VALUE (000S) | |||||||||||
SOVEREIGN ISSUES 1.7% | ||||||||||||
Argentina Government International Bond | ||||||||||||
0.500% due 07/09/2030 þ | $ | 31,687 | $ | 8,717 | ||||||||
1.000% due 07/09/2029 (k) | 5,302 | 1,733 | ||||||||||
1.450% due 08/13/2023 | ARS | 181,092 | 1,732 | |||||||||
1.500% due 07/09/2035 þ | $ | 35,144 | 10,113 | |||||||||
1.500% due 07/09/2046 þ | 230 | 69 | ||||||||||
3.500% due 07/09/2041 þ(k) | 17,060 | 5,494 | ||||||||||
3.875% due 01/09/2038 þ(k) | 76,360 | 26,985 | ||||||||||
15.500% due 10/17/2026 | ARS | 555,410 | 230 | |||||||||
Autonomous City of Buenos Aires | ||||||||||||
95.645% (BADLARPP + 3.750%) due 02/22/2028 ~ | 155,766 | 309 | ||||||||||
Ecuador Government International Bond | ||||||||||||
5.500% due 07/31/2030 þ | $ | 2,960 | 1,439 | |||||||||
Ghana Government International Bond | ||||||||||||
6.375% due 02/11/2027 ^(d)(k) | 4,477 | 1,943 | ||||||||||
7.875% due 02/11/2035 ^(d)(k) | 5,412 | 2,368 | ||||||||||
8.750% due 03/11/2061 ^(d)(k) | 1,500 | 626 | ||||||||||
Peru Government International Bond | ||||||||||||
5.350% due 08/12/2040 | PEN | 100 | 23 | |||||||||
5.400% due 08/12/2034 | 1 | 0 | ||||||||||
6.150% due 08/12/2032 | 5 | 1 | ||||||||||
6.900% due 08/12/2037 | 15 | 4 | ||||||||||
6.950% due 08/12/2031 | 5 | 2 | ||||||||||
Provincia de Buenos Aires | ||||||||||||
88.734% due 04/12/2025 | ARS | 2,270,878 | 4,211 | |||||||||
Russia Government International Bond | ||||||||||||
5.100% due 03/28/2035 ^(d) | $ | 600 | 267 | |||||||||
5.625% due 04/04/2042 ^(d) | 10,200 | 6,955 | ||||||||||
5.875% due 09/16/2043 ^(d) | 200 | 126 | ||||||||||
Turkiye Ihracat Kredi Bankasi AS | ||||||||||||
8.250% due 01/24/2024 (k) | 1,400 | 1,399 | ||||||||||
Ukraine Government International Bond | ||||||||||||
4.375% due 01/27/2032 ^(d) | EUR | 10,155 | 2,422 | |||||||||
6.876% due 05/21/2031 ^(d) | $ | 13,000 | 3,001 | |||||||||
Venezuela Government International Bond | ||||||||||||
8.250% due 10/13/2024 ^(d) | 136 | 13 | ||||||||||
9.250% due 09/15/2027 ^(d) | 734 | 66 | ||||||||||
Total Sovereign Issues (Cost $167,489) | 80,248 | |||||||||||
SHARES | ||||||||||||
COMMON STOCKS 2.4% | ||||||||||||
COMMUNICATION SERVICES 0.3% | ||||||||||||
Clear Channel Outdoor Holdings, Inc. (e) | 4,853,248 | 6,649 | ||||||||||
iHeartMedia, Inc. ‘A’ (e) | 2,021,190 | 7,357 | ||||||||||
Promotora de Informaciones SA (e) | 4,079,279 | 1,692 | ||||||||||
| 15,698 | ||||||||||||
CONSUMER DISCRETIONARY 0.0% | ||||||||||||
Caesars Entertainment, Inc. (e) | 2 | 0 | ||||||||||
Desarrolladora Homex SAB de CV (e) | 719,113 | 1 | ||||||||||
Steinhoff CVR «(e) | 299,163,087 | 0 | ||||||||||
Urbi Desarrollos Urbanos SAB de CV (e) | 4,776 | 2 | ||||||||||
| 3 | ||||||||||||
ENERGY 0.0% | ||||||||||||
Axis Energy Services ‘A’ «(i) | 17,105 | 514 | ||||||||||
Constellation Oil ‘B’ «(e)(i) | 252,651 | 27 | ||||||||||
| 541 | ||||||||||||
SHARES | MARKET VALUE (000S) | |||||||||||
FINANCIALS 1.2% | ||||||||||||
ADLER Group SA «(e) | 309,490 | $ | 164 | |||||||||
Banca Monte dei Paschi di Siena SpA (e) | 6,139,000 | 15,421 | ||||||||||
Intelsat Emergence SA «(e)(i) | 1,751,422 | 40,283 | ||||||||||
UBS Group AG | 12,342 | 249 | ||||||||||
| 56,117 | ||||||||||||
INDUSTRIALS 0.6% | ||||||||||||
Drillco Holding Lux SA «(e) | 264,251 | 5,073 | ||||||||||
Mcdermott International Ltd. (e) | 585,418 | 105 | ||||||||||
Syniverse Holdings, Inc. «(i) | 17,396,719 | 16,010 | ||||||||||
Voyager Aviation Holdings LLC «(e) | 16,278 | 0 | ||||||||||
Westmoreland Mining Holdings «(e)(i) | 238,883 | 2,986 | ||||||||||
Westmoreland Mining Holdings «(e) | 240,987 | 1,597 | ||||||||||
| 25,771 | ||||||||||||
REAL ESTATE 0.0% | ||||||||||||
ADLER Group SA | 685,298 | 413 | ||||||||||
Stearns Holding LLC ‘B’ «(e) | 59,964 | 0 | ||||||||||
| 413 | ||||||||||||
UTILITIES 0.3% | ||||||||||||
TexGen Power LLC «(e)(i) | 450,094 | 12,603 | ||||||||||
Total Common Stocks (Cost $257,582) | 111,146 | |||||||||||
RIGHTS 0.0% | ||||||||||||
FINANCIALS 0.0% | ||||||||||||
Intelsat Jackson Holdings SA «(e) | 188,308 | 895 | ||||||||||
Total Rights (Cost $0) | 895 | |||||||||||
WARRANTS 1.1% | ||||||||||||
FINANCIALS 0.0% | ||||||||||||
Guranteed Rate, Inc. - Exp. 12/31/2060 « | 288 | 0 | ||||||||||
Intelsat Emergence SA - Exp. 02/17/2027 « | 13,833 | 21 | ||||||||||
Intelsat Jackson Holdings SA - Exp. 12/05/2025 « | 182,955 | 1,327 | ||||||||||
| 1,348 | ||||||||||||
INFORMATION TECHNOLOGY 1.1% | ||||||||||||
Windstream Holdings LLC - Exp. 9/21/2055 « | 3,155,914 | 48,317 | ||||||||||
Total Warrants (Cost $68,646) | 49,665 | |||||||||||
PREFERRED SECURITIES 3.4% | ||||||||||||
BANKING & FINANCE 0.0% | ||||||||||||
SVB Financial Group | ||||||||||||
4.000% due 05/15/2026 ^(d)(h) | 1,600,000 | 116 | ||||||||||
FINANCIALS 2.9% | ||||||||||||
AGFC Capital Trust | ||||||||||||
7.010% (US0003M + 1.750%) due 01/15/2067 ~(k) | 35,500,000 | 19,140 | ||||||||||
American AgCredit Corp. | ||||||||||||
5.250% due 06/15/2026 •(h) | 10,000,000 | 8,904 | ||||||||||
82 | PIMCO CLOSED-END FUNDS | See Accompanying Notes |
| June 30, 2023 |
SHARES | MARKET VALUE (000S) | |||||||||||
Capital Farm Credit ACA | ||||||||||||
5.000% due 03/15/2026 •(h)(k) | 4,300,000 | $ | 3,993 | |||||||||
Compeer Financial ACA | ||||||||||||
4.875% due 08/15/2026 •(h)(k) | 1,900,000 | 1,717 | ||||||||||
OCP CLO Ltd. | ||||||||||||
0.000% due 04/26/2028 (g) | 2,600 | 1,239 | ||||||||||
Stichting AK Rabobank Certificaten | ||||||||||||
6.500% due 12/29/2049 þ(h) | 93,550,000 | 94,911 | ||||||||||
SVB Financial Group | ||||||||||||
4.250% due 11/15/2026 ^(d)(h) | 1,000,000 | 74 | ||||||||||
4.700% due 11/15/2031 ^(d)(h) | 1,593,000 | 113 | ||||||||||
| 130,091 | ||||||||||||
INDUSTRIALS 0.5% | ||||||||||||
Voyager Aviation Holdings LLC « | 97,668 | 23,548 | ||||||||||
Total Preferred Securities (Cost $199,380) | 153,755 | |||||||||||
REAL ESTATE INVESTMENT TRUSTS 0.7% | ||||||||||||
REAL ESTATE 0.7% | ||||||||||||
CBL & Associates Properties, Inc. | 17,153 | 378 | ||||||||||
Uniti Group, Inc. | 1,591,211 | 7,351 | ||||||||||
VICI Properties, Inc. | 711,293 | 22,356 | ||||||||||
Total Real Estate Investment Trusts (Cost $18,967) | 30,085 | |||||||||||
PRINCIPAL AMOUNT (000S) | MARKET VALUE (000S) | |||||||||||
SHORT-TERM INSTRUMENTS 10.4% | ||||||||||||
COMMERCIAL PAPER 0.3% | ||||||||||||
VW Credit, Inc. | ||||||||||||
5.430% due 08/01/2023 | $ | 14,200 | $ | 14,131 | ||||||||
REPURCHASE AGREEMENTS (j) 8.6% | ||||||||||||
| 391,856 | ||||||||||||
SHORT-TERM NOTES 0.0% | ||||||||||||
Corestate Capital Holding SA | ||||||||||||
15.000% due 07/31/2023 «(i) | EUR | 400 | 441 | |||||||||
ARGENTINA TREASURY BILLS 0.1% | ||||||||||||
(20.541)% due 09/18/2023 - 11/23/2023 (f)(g) | ARS | 2,217,493 | 5,362 | |||||||||
U.S. TREASURY BILLS 1.4% | ||||||||||||
5.241% due 08/24/2023 - 09/14/2023 (f)(g)(k)(n) | $ | 62,726 | 62,096 | |||||||||
Total Short-Term Instruments (Cost $474,023) | 473,886 | |||||||||||
Total Investments in Securities (Cost $9,252,566) | 7,895,676 | |||||||||||
SHARES | MARKET VALUE (000S) | |||||||||||
INVESTMENTS IN AFFILIATES 2.0% | ||||||||||||
COMMON STOCKS 2.0% | ||||||||||||
AFFILIATED INVESTMENTS 2.0% | ||||||||||||
Neiman Marcus Group Ltd. LLC «(e)(i) | 602,840 | $ | 91,591 | |||||||||
Sierra Hamilton Holder LLC «(e)(i) | 30,337,712 | 3 | ||||||||||
Total Investments in Affiliates (Cost $27,066) | 91,594 | |||||||||||
Total Investments 174.4% (Cost $9,279,632) | $ | 7,987,270 | ||||||||||
Financial Derivative Instruments (l)(m) (0.5)% (Cost or Premiums, net $(10,550)) | (23,160 | ) | ||||||||||
Other Assets and Liabilities, net (73.9)% | (3,385,628 | ) | ||||||||||
Net Assets 100.0% | $ | 4,578,482 | ||||||||||
* | A zero balance may reflect actual amounts rounding to less than one thousand. |
^ | Security is in default. |
« | Security valued using significant unobservable inputs (Level 3). |
µ | All or a portion of this amount represents unfunded loan commitments. The interest rate for the unfunded portion will be determined at the time of funding. See Note 4, Securities and Other Investments, in the Notes to Financial Statements for more information regarding unfunded loan commitments. |
~ | Variable or Floating rate security. Rate shown is the rate in effect as of period end. Certain variable rate securities are not based on a published reference rate and spread, rather are determined by the issuer or agent and are based on current market conditions. Reference rate is as of reset date, which may vary by security. These securities may not indicate a reference rate and/or spread in their description. |
• | Rate shown is the rate in effect as of period end. The rate may be based on a fixed rate, a capped rate or a floor rate and may convert to a variable or floating rate in the future. These securities do not indicate a reference rate and spread in their description. |
þ | Coupon represents a rate which changes periodically based on a predetermined schedule or event. Rate shown is the rate in effect as of period end. |
(a) | Security is an Interest Only (“IO”) or IO Strip. |
(b) | Principal only security. |
(c) | Payment in-kind security. |
(d) | Security is not accruing income as of the date of this report. |
(e) | Security did not produce income within the last twelve months. |
(f) | Coupon represents a weighted average yield to maturity. |
(g) | Zero coupon security. |
(h) | Perpetual maturity; date shown, if applicable, represents next contractual call date. |
Issuer Description | Acquisition Date | Cost | Market Value | Market Value as Percentage of Net Assets | ||||||||||||
Axis Energy Services ‘A’ | 07/01/2021 | $ | 252 | $ | 514 | 0.01 | % | |||||||||
Constellation Oil ‘B’ | 06/10/2022 | 27 | 27 | 0.00 | ||||||||||||
Corestate Capital Holding SA 15.000% due 07/31/2023 | 12/06/2022 | 419 | 441 | 0.01 | ||||||||||||
Intelsat Emergence SA | 06/19/2017 - 02/23/2022 | 114,056 | 40,283 | 0.87 | ||||||||||||
Neiman Marcus Group Ltd. LLC | 09/25/2020 | 19,376 | 91,591 | 2.00 | ||||||||||||
Preylock Reitman Santa Cruz Mezz LLC 10.841% due 11/09/2023 | 04/09/2018 | 37,127 | 36,697 | 0.80 | ||||||||||||
Project Anfora Senior 5.927% due 10/01/2026 | 09/30/2019 | 37,294 | 36,619 | 0.80 | ||||||||||||
Sierra Hamilton Holder LLC | 07/31/2017 | 7,690 | 3 | 0.00 | ||||||||||||
| See Accompanying Notes | ANNUAL REPORT | | | JUNE 30, 2023 | 83 |
Consolidated Schedule of Investments | PIMCO Dynamic Income Fund | (Cont.) |
Issuer Description | Acquisition Date | Cost | Market Value | Market Value as Percentage of Net Assets | ||||||||||||
Syniverse Holdings, Inc. | 05/12/2022 - 05/31/2023 | $ | 17,090 | $ | 16,010 | 0.35 | % | |||||||||
TexGen Power LLC | 07/20/2018 | 14,263 | 12,603 | 0.28 | ||||||||||||
Westmoreland Mining Holdings | 12/08/2014 - 03/26/2019 | 6,949 | 2,986 | 0.07 | ||||||||||||
| $ | 254,543 | $ | 237,774 | 5.19 | % | |||||||||||
Counterparty | Lending Rate | Settlement Date | Maturity Date | Principal Amount | Collateralized By | Collateral (Received) | Repurchase Agreements, at Value | Repurchase Agreement Proceeds to be Received (1) | ||||||||||||||||||||||
| BPS | 5.060 | % | 07/03/2023 | 07/05/2023 | $ | 171,800 | U.S. Treasury Inflation Protected Securities 0.750% due 07/15/2028 | $ | (175,169 | ) | $ | 171,800 | $ | 171,800 | ||||||||||||||||
| 5.100 | 06/30/2023 | 07/03/2023 | 195,300 | U.S. Treasury Inflation Protected Securities 0.875% due 01/15/2029 | (199,634 | ) | 195,300 | 195,383 | ||||||||||||||||||||||
| FICC | 2.400 | 06/30/2023 | 07/03/2023 | 3,856 | U.S. Treasury Notes 4.625% due 06/30/2025 | (3,933 | ) | 3,856 | 3,856 | |||||||||||||||||||||
| MBC | 5.160 | 06/30/2023 | 07/03/2023 | 20,900 | U.S. Treasury Notes 1.875% due 02/15/2032 | (21,532 | ) | 20,900 | 20,909 | |||||||||||||||||||||
Total Repurchase Agreements | $ | (400,268 | ) | $ | 391,856 | $ | 391,948 | |||||||||||||||||||||||
Counterparty | Borrowing Rate (2) | Settlement Date | Maturity Date | Amount Borrowed (2) | Payable for Reverse Repurchase Agreements | |||||||||||||||||
BCY | (0.500 | )% | 08/15/2022 | TBD | (3) | $ | (703 | ) | $ | (699 | ) | |||||||||||
BNY | 5.850 | 01/17/2023 | 07/17/2023 | (2,060 | ) | (2,116 | ) | |||||||||||||||
| 5.930 | 02/03/2023 | 08/03/2023 | (57,141 | ) | (58,553 | ) | ||||||||||||||||
| 5.935 | 02/06/2023 | 08/07/2023 | (38,530 | ) | (39,464 | ) | ||||||||||||||||
| 5.961 | 06/22/2023 | 10/10/2023 | (7,055 | ) | (7,068 | ) | ||||||||||||||||
| 6.171 | 04/20/2023 | 10/20/2023 | (87,149 | ) | (88,254 | ) | ||||||||||||||||
| 6.299 | 03/09/2023 | 09/08/2023 | (30,217 | ) | (30,831 | ) | ||||||||||||||||
BOM | 5.820 | 06/01/2023 | 09/01/2023 | (3,657 | ) | (3,676 | ) | |||||||||||||||
BOS | 5.320 | 04/12/2023 | 07/11/2023 | (6,891 | ) | (6,974 | ) | |||||||||||||||
| 5.840 | 05/19/2023 | 09/18/2023 | (348 | ) | (350 | ) | ||||||||||||||||
| 6.110 | 06/07/2023 | 10/06/2023 | (17,878 | ) | (17,956 | ) | ||||||||||||||||
| 6.110 | 06/16/2023 | 10/16/2023 | (11,162 | ) | (11,194 | ) | ||||||||||||||||
| 6.160 | 06/07/2023 | 10/06/2023 | (14,826 | ) | (14,891 | ) | ||||||||||||||||
| 6.210 | 06/16/2023 | 10/16/2023 | (3,538 | ) | (3,548 | ) | ||||||||||||||||
| 6.310 | 06/07/2023 | 10/06/2023 | (4,398 | ) | (4,417 | ) | ||||||||||||||||
| 6.360 | 06/05/2023 | 10/03/2023 | (8,337 | ) | (8,378 | ) | ||||||||||||||||
BPS | 0.000 | 05/10/2023 | TBD | (3) | EUR | (2,401 | ) | (2,619 | ) | |||||||||||||
| 3.580 | 04/14/2023 | 07/14/2023 | EUR | (14,214 | ) | (15,633 | ) | |||||||||||||||
| 3.700 | 05/10/2023 | TBD | (3) | (2,304 | ) | (2,514 | ) | |||||||||||||||
| 3.770 | 05/10/2023 | 08/10/2023 | (9,820 | ) | (10,776 | ) | ||||||||||||||||
| 3.800 | 06/08/2023 | TBD | (3) | (2,541 | ) | (2,780 | ) | |||||||||||||||
| 3.940 | 05/12/2023 | 11/13/2023 | (2,740 | ) | (3,007 | ) | ||||||||||||||||
| 3.987 | 06/30/2023 | 08/30/2023 | (20,042 | ) | (21,877 | ) | ||||||||||||||||
| 5.500 | 06/21/2023 | 10/10/2023 | $ | (4,014 | ) | (4,022 | ) | |||||||||||||||
| 5.504 | 06/02/2023 | 10/02/2023 | GBP | (6,944 | ) | (8,860 | ) | |||||||||||||||
| 5.650 | 01/17/2023 | 10/17/2023 | $ | (8,343 | ) | (8,561 | ) | |||||||||||||||
| 5.740 | 03/14/2023 | 07/14/2023 | (79,939 | ) | (81,316 | ) | ||||||||||||||||
| 5.748 | 07/03/2023 | 11/03/2023 | GBP | (6,517 | ) | (8,276 | ) | |||||||||||||||
| 5.760 | 03/16/2023 | 07/17/2023 | $ | (22,166 | ) | (22,519 | ) | |||||||||||||||
| 5.760 | 03/23/2023 | 07/21/2023 | (2,024 | ) | (2,055 | ) | ||||||||||||||||
| 5.790 | 03/01/2023 | 07/31/2023 | (3,167 | ) | (3,225 | ) | ||||||||||||||||
| 6.110 | 06/05/2023 | 11/30/2023 | (3,274 | ) | (3,290 | ) | ||||||||||||||||
| 6.310 | 04/13/2023 | 10/10/2023 | (121,732 | ) | (123,438 | ) | ||||||||||||||||
| 6.310 | 05/11/2023 | 11/08/2023 | (18,291 | ) | (18,461 | ) | ||||||||||||||||
| 6.310 | 06/05/2023 | 11/30/2023 | (8,444 | ) | (8,485 | ) | ||||||||||||||||
| 6.310 | 06/15/2023 | 10/10/2023 | (40,719 | ) | (40,847 | ) | ||||||||||||||||
| 6.310 | 06/22/2023 | 10/10/2023 | (2,345 | ) | (2,349 | ) | ||||||||||||||||
| 6.310 | 06/22/2023 | 12/20/2023 | (8,881 | ) | (8,898 | ) | ||||||||||||||||
| 6.350 | 06/21/2023 | 10/10/2023 | (5,287 | ) | (5,298 | ) | ||||||||||||||||
| 6.360 | 04/13/2023 | 10/10/2023 | (3,192 | ) | (3,237 | ) | ||||||||||||||||
| 6.410 | 04/13/2023 | 10/10/2023 | (18,297 | ) | (18,554 | ) | ||||||||||||||||
84 | PIMCO CLOSED-END FUNDS | See Accompanying Notes |
| June 30, 2023 |
Counterparty | Borrowing Rate (2) | Settlement Date | Maturity Date | Amount Borrowed (2) | Payable for Reverse Repurchase Agreements | |||||||||||||||||
| 6.410 | % | 06/22/2023 | 12/20/2023 | $ | (1,877 | ) | $ | (1,881 | ) | |||||||||||||
| 6.610 | 04/13/2023 | 10/10/2023 | (6,442 | ) | (6,532 | ) | ||||||||||||||||
BRC | 3.580 | 05/10/2023 | TBD | (3) | EUR | (8,595 | ) | (9,426 | ) | |||||||||||||
| 3.750 | 05/10/2023 | TBD | (3) | (3,133 | ) | (3,436 | ) | |||||||||||||||
| 4.167 | 06/19/2023 | 09/19/2023 | (4,527 | ) | (4,948 | ) | ||||||||||||||||
| 4.350 | 05/05/2023 | TBD | (3) | $ | (495 | ) | (499 | ) | ||||||||||||||
| 4.800 | 05/05/2023 | TBD | (3) | (487 | ) | (492 | ) | |||||||||||||||
| 5.100 | 05/10/2023 | 08/10/2023 | GBP | (579 | ) | (740 | ) | |||||||||||||||
| 5.350 | 05/05/2023 | TBD | (3) | $ | (786 | ) | (793 | ) | ||||||||||||||
| 5.400 | 05/05/2023 | TBD | (3) | (5,573 | ) | (5,625 | ) | |||||||||||||||
| 5.450 | 06/28/2023 | TBD | (3) | (11,158 | ) | (11,167 | ) | |||||||||||||||
| 5.450 | 07/03/2023 | TBD | (3) | (8,911 | ) | (8,911 | ) | |||||||||||||||
| 5.710 | 05/22/2023 | 08/18/2023 | (2,918 | ) | (2,938 | ) | ||||||||||||||||
| 5.750 | 05/05/2023 | TBD | (3) | (47,117 | ) | (47,561 | ) | |||||||||||||||
| 5.928 | 06/05/2023 | 09/05/2023 | GBP | (25,178 | ) | (32,120 | ) | |||||||||||||||
| 5.980 | 01/20/2023 | 07/20/2023 | $ | (5,335 | ) | (5,481 | ) | |||||||||||||||
| 6.000 | 01/23/2023 | 07/24/2023 | (16,501 | ) | (16,944 | ) | ||||||||||||||||
| 6.010 | 02/03/2023 | 08/03/2023 | (4,879 | ) | (5,001 | ) | ||||||||||||||||
| 6.010 | 04/21/2023 | 08/03/2023 | (1,686 | ) | (1,707 | ) | ||||||||||||||||
| 6.015 | 02/07/2023 | 08/07/2023 | (1,805 | ) | (1,849 | ) | ||||||||||||||||
| 6.024 | 06/12/2023 | 12/12/2023 | GBP | (8,690 | ) | (11,075 | ) | |||||||||||||||
| 6.030 | 01/20/2023 | 07/20/2023 | $ | (26,860 | ) | (27,598 | ) | |||||||||||||||
| 6.040 | 04/14/2023 | 07/14/2023 | (21,876 | ) | (22,169 | ) | ||||||||||||||||
| 6.050 | 01/17/2023 | 07/19/2023 | (21,418 | ) | (22,019 | ) | ||||||||||||||||
| 6.060 | 02/03/2023 | 08/03/2023 | (19,565 | ) | (20,059 | ) | ||||||||||||||||
| 6.090 | 01/30/2023 | 08/30/2023 | (29,665 | ) | (30,438 | ) | ||||||||||||||||
| 6.090 | 02/10/2023 | 08/10/2023 | (1,333 | ) | (1,365 | ) | ||||||||||||||||
| 6.100 | 01/17/2023 | 07/19/2023 | (9,101 | ) | (9,358 | ) | ||||||||||||||||
| 6.110 | 02/14/2023 | 08/14/2023 | (5,607 | ) | (5,739 | ) | ||||||||||||||||
| 6.250 | 02/15/2023 | 09/15/2023 | (33,724 | ) | (34,532 | ) | ||||||||||||||||
| 6.270 | 02/28/2023 | 08/28/2023 | (25,541 | ) | (26,097 | ) | ||||||||||||||||
| 6.320 | 04/05/2023 | 10/02/2023 | (5,434 | ) | (5,519 | ) | ||||||||||||||||
| 6.360 | 06/06/2023 | 10/04/2023 | (15,356 | ) | (15,429 | ) | ||||||||||||||||
| 6.410 | 06/13/2023 | 10/11/2023 | (14,424 | ) | (14,475 | ) | ||||||||||||||||
BYR | 5.300 | 04/03/2023 | 09/27/2023 | (11,588 | ) | (11,751 | ) | |||||||||||||||
| 5.560 | 03/30/2023 | 09/27/2023 | (16,172 | ) | (16,410 | ) | ||||||||||||||||
| 5.720 | 01/20/2023 | 08/03/2023 | (15,227 | ) | (15,603 | ) | ||||||||||||||||
| 5.760 | 01/19/2023 | 10/19/2023 | (20,283 | ) | (20,791 | ) | ||||||||||||||||
| 5.760 | 01/20/2023 | 10/19/2023 | (7,356 | ) | (7,539 | ) | ||||||||||||||||
| 5.770 | 03/23/2023 | 09/19/2023 | (29,058 | ) | (29,491 | ) | ||||||||||||||||
| 5.770 | 03/23/2023 | 09/20/2023 | (11,668 | ) | (11,855 | ) | ||||||||||||||||
| 5.770 | 03/24/2023 | 09/20/2023 | (5,000 | ) | (5,079 | ) | ||||||||||||||||
| 5.770 | 03/30/2023 | 09/20/2023 | (8,585 | ) | (8,713 | ) | ||||||||||||||||
| 5.780 | 04/18/2023 | 09/29/2023 | (501 | ) | (507 | ) | ||||||||||||||||
| 5.780 | 04/26/2023 | 10/23/2023 | (911 | ) | (921 | ) | ||||||||||||||||
CDC | 5.350 | 01/30/2023 | 07/28/2023 | (6,638 | ) | (6,790 | ) | |||||||||||||||
| 5.370 | 02/13/2023 | 08/11/2023 | (3,434 | ) | (3,506 | ) | ||||||||||||||||
| 5.430 | 02/17/2023 | 08/16/2023 | (992 | ) | (1,013 | ) | ||||||||||||||||
| 5.530 | 04/05/2023 | 07/05/2023 | (5,039 | ) | (5,108 | ) | ||||||||||||||||
| 5.550 | 04/06/2023 | 07/05/2023 | (78 | ) | (79 | ) | ||||||||||||||||
| 5.560 | 01/30/2023 | 07/28/2023 | (4,948 | ) | (5,065 | ) | ||||||||||||||||
| 5.560 | 03/30/2023 | 07/28/2023 | (2,478 | ) | (2,514 | ) | ||||||||||||||||
| 5.570 | 03/30/2023 | 08/09/2023 | (1,077 | ) | (1,093 | ) | ||||||||||||||||
| 5.570 | 06/13/2023 | 08/09/2023 | (1,701 | ) | (1,706 | ) | ||||||||||||||||
| 5.630 | 02/13/2023 | 08/11/2023 | (16,245 | ) | (16,600 | ) | ||||||||||||||||
| 5.630 | 03/30/2023 | 08/11/2023 | (1,508 | ) | (1,530 | ) | ||||||||||||||||
| 5.630 | 04/04/2023 | 10/02/2023 | (635 | ) | (644 | ) | ||||||||||||||||
| 5.630 | 06/07/2023 | 08/11/2023 | (606 | ) | (608 | ) | ||||||||||||||||
| 5.640 | 02/07/2023 | 08/04/2023 | (11,400 | ) | (11,660 | ) | ||||||||||||||||
| 5.680 | 03/30/2023 | 08/16/2023 | (13,631 | ) | (13,835 | ) | ||||||||||||||||
| 5.880 | 05/17/2023 | 08/16/2023 | (3,793 | ) | (3,822 | ) | ||||||||||||||||
| 6.040 | 05/15/2023 | 08/15/2023 | (7,852 | ) | (7,916 | ) | ||||||||||||||||
CDI | 3.610 | 02/22/2023 | 08/22/2023 | EUR | (5,065 | ) | (5,599 | ) | ||||||||||||||
CEW | 5.780 | 05/05/2023 | TBD | (3) | $ | (690 | ) | (697 | ) | |||||||||||||
| 5.800 | 05/05/2023 | TBD | (3) | (1,505 | ) | (1,520 | ) | |||||||||||||||
| 5.830 | 05/05/2023 | TBD | (3) | (457 | ) | (462 | ) | |||||||||||||||
| 5.900 | 05/05/2023 | TBD | (3) | (6,221 | ) | (6,282 | ) | |||||||||||||||
CIB | 5.390 | 01/17/2023 | 07/17/2023 | (615 | ) | (631 | ) | |||||||||||||||
DBL | 3.660 | 05/10/2023 | TBD | (3) | EUR | (827 | ) | (907 | ) | |||||||||||||
| 3.670 | 05/10/2023 | TBD | (3) | (405 | ) | (444 | ) | |||||||||||||||
| See Accompanying Notes | ANNUAL REPORT | | | JUNE 30, 2023 | 85 |
Consolidated Schedule of Investments | PIMCO Dynamic Income Fund | (Cont.) |
Counterparty | Borrowing Rate (2) | Settlement Date | Maturity Date | Amount Borrowed (2) | Payable for Reverse Repurchase Agreements | |||||||||||||||||
| 5.871 | % | 06/28/2023 | 08/31/2023 | $ | (11,342 | ) | $ | (11,351 | ) | |||||||||||||
| 5.971 | 06/28/2023 | 08/31/2023 | (6,310 | ) | (6,315 | ) | ||||||||||||||||
| 6.021 | 06/28/2023 | 08/31/2023 | (3,699 | ) | (3,702 | ) | ||||||||||||||||
| 6.271 | 06/28/2023 | 08/31/2023 | (1,479 | ) | (1,480 | ) | ||||||||||||||||
| 6.488 | 06/09/2023 | 08/10/2023 | (4,438 | ) | (4,457 | ) | ||||||||||||||||
| 6.578 | 07/03/2023 | 08/31/2023 | (1,883 | ) | (1,883 | ) | ||||||||||||||||
| 6.668 | 06/26/2023 | 08/25/2023 | (12,144 | ) | (12,159 | ) | ||||||||||||||||
| 6.688 | 06/09/2023 | 08/10/2023 | (84,356 | ) | (84,733 | ) | ||||||||||||||||
| 6.699 | 06/12/2023 | 08/11/2023 | (7,106 | ) | (7,134 | ) | ||||||||||||||||
| 6.738 | 06/09/2023 | 08/10/2023 | (7,058 | ) | (7,090 | ) | ||||||||||||||||
| 6.749 | 06/12/2023 | 08/11/2023 | (8,400 | ) | (8,433 | ) | ||||||||||||||||
| 6.778 | 07/03/2023 | 08/31/2023 | (15,130 | ) | (15,130 | ) | ||||||||||||||||
| 6.838 | 06/09/2023 | 08/10/2023 | (42,777 | ) | (42,972 | ) | ||||||||||||||||
| 6.878 | 07/03/2023 | 08/31/2023 | (8,684 | ) | (8,684 | ) | ||||||||||||||||
| 6.978 | 07/03/2023 | 08/31/2023 | (3,313 | ) | (3,313 | ) | ||||||||||||||||
IND | 3.840 | 06/12/2023 | 09/12/2023 | EUR | (899 | ) | (983 | ) | ||||||||||||||
| 3.870 | 06/12/2023 | 09/12/2023 | (1,703 | ) | (1,862 | ) | ||||||||||||||||
| 5.230 | 02/01/2023 | 08/01/2023 | $ | (1,393 | ) | (1,424 | ) | |||||||||||||||
| 5.230 | 06/22/2023 | 08/01/2023 | (3,595 | ) | (3,601 | ) | ||||||||||||||||
| 5.300 | 04/03/2023 | 08/03/2023 | (2,993 | ) | (3,033 | ) | ||||||||||||||||
| 5.330 | 02/01/2023 | 08/01/2023 | (7,863 | ) | (8,040 | ) | ||||||||||||||||
| 5.330 | 03/30/2023 | 07/31/2023 | (776 | ) | (787 | ) | ||||||||||||||||
| 5.440 | 06/16/2023 | 09/18/2023 | GBP | (826 | ) | (1,052 | ) | |||||||||||||||
| 5.460 | 03/07/2023 | 07/07/2023 | $ | (6,987 | ) | (7,112 | ) | |||||||||||||||
| 5.460 | 03/30/2023 | 07/07/2023 | (4,280 | ) | (4,342 | ) | ||||||||||||||||
| 5.480 | 03/07/2023 | 07/07/2023 | (6,876 | ) | (7,000 | ) | ||||||||||||||||
| 5.540 | 03/07/2023 | 07/07/2023 | (4,913 | ) | (5,003 | ) | ||||||||||||||||
| 5.890 | 06/02/2023 | 09/01/2023 | (47,081 | ) | (47,320 | ) | ||||||||||||||||
JML | 3.000 | 05/10/2023 | TBD | (3) | EUR | (8,386 | ) | (9,194 | ) | |||||||||||||
| 3.600 | 05/10/2023 | 08/10/2023 | (1,442 | ) | (1,582 | ) | ||||||||||||||||
| 3.650 | 05/10/2023 | 08/10/2023 | (26,820 | ) | (29,425 | ) | ||||||||||||||||
| 3.695 | 06/05/2023 | 08/07/2023 | (17,073 | ) | (18,683 | ) | ||||||||||||||||
| 3.790 | 06/05/2023 | 09/05/2023 | (49,551 | ) | (54,228 | ) | ||||||||||||||||
| 3.867 | 06/16/2023 | 09/18/2023 | (8,918 | ) | (9,749 | ) | ||||||||||||||||
| 5.450 | 05/05/2023 | 07/28/2023 | $ | (8,149 | ) | (8,221 | ) | |||||||||||||||
| 5.500 | 05/05/2023 | 07/28/2023 | (27,476 | ) | (27,724 | ) | ||||||||||||||||
| 5.560 | 06/14/2023 | 07/06/2023 | (1,449 | ) | (1,453 | ) | ||||||||||||||||
| 6.152 | 06/29/2023 | 09/29/2023 | GBP | (4,050 | ) | (5,146 | ) | |||||||||||||||
| 6.252 | 06/29/2023 | 09/29/2023 | (7,614 | ) | (9,677 | ) | ||||||||||||||||
JPS | 6.060 | 04/05/2023 | 10/02/2023 | (6,845 | ) | (6,945 | ) | |||||||||||||||
| 6.070 | 04/06/2023 | 10/02/2023 | (6,176 | ) | (6,266 | ) | ||||||||||||||||
| 6.080 | 06/05/2023 | 12/04/2023 | (23,257 | ) | (23,367 | ) | ||||||||||||||||
| 6.110 | 04/05/2023 | 10/02/2023 | (8,235 | ) | (8,356 | ) | ||||||||||||||||
| 6.130 | 06/05/2023 | 12/04/2023 | (14,040 | ) | (14,107 | ) | ||||||||||||||||
| 6.170 | 06/15/2023 | 12/04/2023 | (4,068 | ) | (4,081 | ) | ||||||||||||||||
| 6.230 | 06/30/2023 | 12/26/2023 | (1,341 | ) | (1,342 | ) | ||||||||||||||||
| 6.260 | 05/02/2023 | 10/30/2023 | (23,710 | ) | (23,965 | ) | ||||||||||||||||
| 6.260 | 07/03/2023 | 01/02/2024 | (2,878 | ) | (2,878 | ) | ||||||||||||||||
| 6.280 | 06/28/2023 | 12/26/2023 | (1,620 | ) | (1,621 | ) | ||||||||||||||||
| 6.280 | 06/30/2023 | 12/26/2023 | (3,067 | ) | (3,069 | ) | ||||||||||||||||
| 6.287 | 02/14/2023 | 10/12/2023 | (5,363 | ) | (5,494 | ) | ||||||||||||||||
| 6.287 | 06/20/2023 | 10/12/2023 | (13,108 | ) | (13,138 | ) | ||||||||||||||||
| 6.310 | 07/03/2023 | 01/02/2024 | (6,264 | ) | (6,264 | ) | ||||||||||||||||
| 6.430 | 07/03/2023 | 01/02/2024 | (1,169 | ) | (1,169 | ) | ||||||||||||||||
| 6.460 | 07/03/2023 | 01/02/2024 | (5,193 | ) | (5,193 | ) | ||||||||||||||||
| 6.480 | 07/03/2023 | 01/02/2024 | (14,296 | ) | (14,296 | ) | ||||||||||||||||
| 6.520 | 06/15/2023 | 12/04/2023 | (7,124 | ) | (7,147 | ) | ||||||||||||||||
| 6.550 | 06/21/2023 | 12/04/2023 | (17,910 | ) | (17,949 | ) | ||||||||||||||||
| 6.570 | 06/15/2023 | 12/04/2023 | (2,939 | ) | (2,947 | ) | ||||||||||||||||
| 6.580 | 06/28/2023 | 12/26/2023 | (1,119 | ) | (1,120 | ) | ||||||||||||||||
| 6.630 | 06/28/2023 | 12/26/2023 | (5,029 | ) | (5,033 | ) | ||||||||||||||||
| 6.660 | 07/03/2023 | 01/02/2024 | (1,110 | ) | (1,110 | ) | ||||||||||||||||
| 6.710 | 07/03/2023 | 01/02/2024 | (2,307 | ) | (2,307 | ) | ||||||||||||||||
MBC | 5.560 | 06/15/2023 | 09/15/2023 | GBP | (10,407 | ) | (13,254 | ) | ||||||||||||||
| 5.610 | 06/15/2023 | 09/15/2023 | (6,489 | ) | (8,264 | ) | ||||||||||||||||
MEI | 3.914 | 05/18/2023 | 09/18/2023 | EUR | (821 | ) | (900 | ) | ||||||||||||||
| 5.430 | 06/19/2023 | 09/19/2023 | GBP | (17,575 | ) | (22,366 | ) | |||||||||||||||
| 5.680 | 06/19/2023 | 09/19/2023 | (2,983 | ) | (3,797 | ) | ||||||||||||||||
| 5.840 | 05/19/2023 | 09/18/2023 | $ | (11,785 | ) | (11,871 | ) | |||||||||||||||
MSB | 5.433 | 06/12/2023 | 12/12/2023 | GBP | (17,237 | ) | (21,960 | ) | ||||||||||||||
86 | PIMCO CLOSED-END FUNDS | See Accompanying Notes |
| June 30, 2023 |
Counterparty | Borrowing Rate (2) | Settlement Date | Maturity Date | Amount Borrowed (2) | Payable for Reverse Repurchase Agreements | |||||||||||||||||
| 5.523 | % | 06/12/2023 | 12/12/2023 | GBP | (9,636 | ) | $ | (12,277 | ) | |||||||||||||
| 5.538 | 06/26/2023 | 10/26/2023 | (1,465 | ) | (1,863 | ) | ||||||||||||||||
| 6.310 | 05/15/2023 | 11/13/2023 | $ | (5,547 | ) | (5,595 | ) | |||||||||||||||
| 6.310 | 05/23/2023 | 11/20/2023 | (21,742 | ) | (21,898 | ) | ||||||||||||||||
| 6.310 | 05/30/2023 | 11/30/2023 | (31,117 | ) | (31,304 | ) | ||||||||||||||||
| 6.310 | 06/15/2023 | 12/15/2023 | (2,819 | ) | (2,828 | ) | ||||||||||||||||
| 6.360 | 05/30/2023 | 11/30/2023 | (16,023 | ) | (16,119 | ) | ||||||||||||||||
| 6.360 | 06/07/2023 | 12/07/2023 | (14,955 | ) | (15,024 | ) | ||||||||||||||||
| 6.360 | 06/15/2023 | 12/15/2023 | (24,837 | ) | (24,916 | ) | ||||||||||||||||
| 6.410 | 05/30/2023 | 11/30/2023 | (32,878 | ) | (33,075 | ) | ||||||||||||||||
MYI | 0.500 | 05/19/2023 | TBD | (3) | EUR | (473 | ) | (517 | ) | |||||||||||||
MZF | 6.340 | 05/24/2023 | 11/22/2023 | $ | (1,670 | ) | (1,682 | ) | ||||||||||||||
| 6.490 | 06/07/2023 | 12/07/2023 | (14,781 | ) | (14,851 | ) | ||||||||||||||||
| 6.490 | 06/14/2023 | 12/12/2023 | (790 | ) | (793 | ) | ||||||||||||||||
| 6.490 | 06/21/2023 | 12/21/2023 | (36,761 | ) | (36,840 | ) | ||||||||||||||||
NOM | 5.900 | 06/08/2023 | 07/10/2023 | (263 | ) | (264 | ) | |||||||||||||||
| 5.950 | 05/05/2023 | TBD | (3) | (15,986 | ) | (16,142 | ) | |||||||||||||||
RBC | 6.110 | 06/12/2023 | 10/12/2023 | (3,104 | ) | (3,115 | ) | |||||||||||||||
| 6.160 | 06/14/2023 | 08/14/2023 | (2,496 | ) | (2,505 | ) | ||||||||||||||||
| 6.310 | 06/14/2023 | 08/14/2023 | (10,053 | ) | (10,087 | ) | ||||||||||||||||
| 6.510 | 05/08/2023 | 11/08/2023 | (2,142 | ) | (2,164 | ) | ||||||||||||||||
| 6.810 | 06/16/2023 | 10/16/2023 | (70,804 | ) | (71,031 | ) | ||||||||||||||||
RCE | 2.550 | 05/10/2023 | TBD | (3) | EUR | (4,398 | ) | (4,823 | ) | |||||||||||||
| 3.500 | 05/10/2023 | TBD | (3) | (910 | ) | (998 | ) | |||||||||||||||
| 3.550 | 05/10/2023 | TBD | (3) | (20,169 | ) | (22,118 | ) | |||||||||||||||
| 3.700 | 05/10/2023 | TBD | (3) | (21,040 | ) | (23,073 | ) | |||||||||||||||
| 4.437 | 06/30/2023 | 10/30/2023 | (2,978 | ) | (3,251 | ) | ||||||||||||||||
RCY | 5.400 | 01/17/2023 | 07/17/2023 | $ | (10,173 | ) | (10,428 | ) | ||||||||||||||
| 5.450 | 04/06/2023 | 10/06/2023 | (7,312 | ) | (7,410 | ) | ||||||||||||||||
| 5.660 | 02/17/2023 | 09/18/2023 | (1,744 | ) | (1,781 | ) | ||||||||||||||||
| 5.700 | 06/20/2023 | 08/21/2023 | (4,036 | ) | (4,045 | ) | ||||||||||||||||
RDR | 5.540 | 06/12/2023 | 07/12/2023 | (711 | ) | (713 | ) | |||||||||||||||
| 5.550 | 06/02/2023 | 08/02/2023 | (1,505 | ) | (1,512 | ) | ||||||||||||||||
| 5.550 | 06/15/2023 | 08/02/2023 | (1,889 | ) | (1,895 | ) | ||||||||||||||||
RTA | 5.775 | 03/23/2023 | 07/24/2023 | (13,942 | ) | (13,958 | ) | |||||||||||||||
| 5.790 | 06/12/2023 | 10/12/2023 | (26,947 | ) | (27,038 | ) | ||||||||||||||||
| 5.810 | 06/27/2023 | 10/27/2023 | (20,704 | ) | (20,724 | ) | ||||||||||||||||
| 6.070 | 04/03/2023 | 07/03/2023 | (5,512 | ) | (5,597 | ) | ||||||||||||||||
| 6.200 | 06/29/2023 | 10/30/2023 | (7,799 | ) | (7,805 | ) | ||||||||||||||||
| 6.210 | 05/03/2023 | 11/03/2023 | (30,687 | ) | (31,013 | ) | ||||||||||||||||
| 6.250 | 06/02/2023 | 10/02/2023 | (7,874 | ) | (7,916 | ) | ||||||||||||||||
| 6.250 | 07/03/2023 | 10/31/2023 | (7,757 | ) | (7,757 | ) | ||||||||||||||||
| 6.260 | 05/03/2023 | 11/03/2023 | (9,808 | ) | (9,912 | ) | ||||||||||||||||
| 6.260 | 06/29/2023 | 10/30/2023 | (9,894 | ) | (9,901 | ) | ||||||||||||||||
| 6.270 | 06/05/2023 | 10/05/2023 | (12,011 | ) | (12,069 | ) | ||||||||||||||||
| 6.290 | 05/12/2023 | 11/13/2023 | (6,972 | ) | (7,036 | ) | ||||||||||||||||
| 6.300 | 06/02/2023 | 10/02/2023 | (6,917 | ) | (6,955 | ) | ||||||||||||||||
| 6.300 | 07/03/2023 | 10/31/2023 | (6,800 | ) | (6,800 | ) | ||||||||||||||||
| 6.310 | 05/03/2023 | 11/03/2023 | (43,125 | ) | (43,584 | ) | ||||||||||||||||
| 6.310 | 05/18/2023 | 11/17/2023 | (5,570 | ) | (5,615 | ) | ||||||||||||||||
| 6.310 | 07/03/2023 | 10/02/2023 | (5,761 | ) | (5,761 | ) | ||||||||||||||||
| 6.350 | 06/05/2023 | 10/05/2023 | (2,638 | ) | (2,651 | ) | ||||||||||||||||
| 6.400 | 06/05/2023 | 10/05/2023 | (5,216 | ) | (5,241 | ) | ||||||||||||||||
| 6.410 | 05/12/2023 | 11/13/2023 | (2,673 | ) | (2,697 | ) | ||||||||||||||||
| 6.480 | 06/05/2023 | 10/05/2023 | (884 | ) | (888 | ) | ||||||||||||||||
SBI | 6.360 | 04/18/2023 | 10/17/2023 | (27,085 | ) | (27,444 | ) | |||||||||||||||
| 6.410 | 04/18/2023 | 10/17/2023 | (24,192 | ) | (24,513 | ) | ||||||||||||||||
| 6.460 | 04/18/2023 | 10/17/2023 | (13,131 | ) | (13,305 | ) | ||||||||||||||||
SOG | 3.700 | 06/14/2023 | 08/14/2023 | EUR | (2,462 | ) | (2,692 | ) | ||||||||||||||
| 3.995 | 06/23/2023 | 08/23/2023 | (1,836 | ) | (2,006 | ) | ||||||||||||||||
| 5.480 | 01/24/2023 | 07/24/2023 | $ | (866 | ) | (887 | ) | |||||||||||||||
| 5.490 | 01/27/2023 | 07/27/2023 | (2,172 | ) | (2,224 | ) | ||||||||||||||||
| 5.520 | 01/30/2023 | 07/28/2023 | (9,288 | ) | (9,508 | ) | ||||||||||||||||
| 5.520 | 02/02/2023 | 08/02/2023 | (6,021 | ) | (6,160 | ) | ||||||||||||||||
| 5.520 | 07/03/2023 | 07/28/2023 | (2,195 | ) | (2,195 | ) | ||||||||||||||||
| 5.580 | 05/15/2023 | 07/28/2023 | (4,117 | ) | (4,148 | ) | ||||||||||||||||
| 5.620 | 04/12/2023 | 10/12/2023 | (20,793 | ) | (21,059 | ) | ||||||||||||||||
| 5.620 | 06/08/2023 | 10/12/2023 | (1,490 | ) | (1,496 | ) | ||||||||||||||||
| 5.630 | 01/31/2023 | 07/31/2023 | (1,681 | ) | (1,722 | ) | ||||||||||||||||
| 5.670 | 03/10/2023 | 07/10/2023 | (3,753 | ) | (3,814 | ) | ||||||||||||||||
| See Accompanying Notes | ANNUAL REPORT | | | JUNE 30, 2023 | 87 |
Consolidated Schedule of Investments | PIMCO Dynamic Income Fund | (Cont.) |
Counterparty | Borrowing Rate (2) | Settlement Date | Maturity Date | Amount Borrowed (2) | Payable for Reverse Repurchase Agreements | |||||||||||||||||
| 5.670 | % | 03/14/2023 | 07/14/2023 | $ | (14,337 | ) | $ | (14,565 | ) | |||||||||||||
| 5.670 | 03/15/2023 | 07/14/2023 | (5,258 | ) | (5,342 | ) | ||||||||||||||||
| 5.690 | 02/17/2023 | 08/17/2023 | (2,160 | ) | (2,206 | ) | ||||||||||||||||
| 5.750 | 02/22/2023 | 08/22/2023 | (18,994 | ) | (19,392 | ) | ||||||||||||||||
| 5.770 | 05/15/2023 | 11/15/2023 | (7,257 | ) | (7,314 | ) | ||||||||||||||||
| 5.780 | 02/06/2023 | 08/03/2023 | (1,087 | ) | (1,111 | ) | ||||||||||||||||
| 5.780 | 03/30/2023 | 08/03/2023 | (19,610 | ) | (19,896 | ) | ||||||||||||||||
| 5.780 | 06/28/2023 | 08/03/2023 | (1,054 | ) | (1,055 | ) | ||||||||||||||||
| 6.078 | 01/27/2023 | 07/27/2023 | (9,519 | ) | (9,771 | ) | ||||||||||||||||
| 6.160 | 03/31/2023 | 09/29/2023 | (1,836 | ) | (1,864 | ) | ||||||||||||||||
| 6.240 | 05/25/2023 | 10/25/2023 | (4,224 | ) | (4,252 | ) | ||||||||||||||||
| 6.310 | 03/29/2023 | 09/29/2023 | (10,072 | ) | (10,239 | ) | ||||||||||||||||
| 6.310 | 03/31/2023 | 09/29/2023 | (5,913 | ) | (6,007 | ) | ||||||||||||||||
| 6.310 | 07/03/2023 | 12/29/2023 | (15,896 | ) | (15,896 | ) | ||||||||||||||||
| 6.340 | 04/06/2023 | 10/06/2023 | (3,866 | ) | (3,925 | ) | ||||||||||||||||
| 6.360 | 03/29/2023 | 09/29/2023 | (16,932 | ) | (17,214 | ) | ||||||||||||||||
| 6.360 | 05/03/2023 | 11/02/2023 | (42,533 | ) | (42,990 | ) | ||||||||||||||||
| 6.360 | 05/10/2023 | 11/10/2023 | (10,836 | ) | (10,939 | ) | ||||||||||||||||
| 6.360 | 07/03/2023 | 12/29/2023 | (17,684 | ) | (17,684 | ) | ||||||||||||||||
| 6.410 | 05/10/2023 | 11/10/2023 | (16,615 | ) | (16,775 | ) | ||||||||||||||||
TDM | 5.250 | 05/05/2023 | TBD | (3) | (1,017 | ) | (1,025 | ) | ||||||||||||||
UBS | 3.600 | 06/08/2023 | TBD | (3) | EUR | (11,198 | ) | (12,249 | ) | |||||||||||||
| 3.826 | 06/08/2023 | 09/08/2023 | (6,837 | ) | (7,480 | ) | ||||||||||||||||
| 4.028 | 06/15/2023 | 09/15/2023 | (13,387 | ) | (14,638 | ) | ||||||||||||||||
| 4.097 | 06/19/2023 | 09/19/2023 | (4,830 | ) | (5,279 | ) | ||||||||||||||||
| 4.100 | 06/21/2023 | TBD | (3) | (23,445 | ) | (25,619 | ) | |||||||||||||||
| 4.118 | 06/23/2023 | 09/25/2023 | (330 | ) | (360 | ) | ||||||||||||||||
| 4.178 | 06/15/2023 | 09/15/2023 | (4,954 | ) | (5,417 | ) | ||||||||||||||||
| 5.492 | 06/15/2023 | 09/15/2023 | GBP | (2,193 | ) | (2,792 | ) | |||||||||||||||
| 5.550 | 02/03/2023 | 08/03/2023 | $ | (11,610 | ) | (11,878 | ) | |||||||||||||||
| 5.590 | 02/03/2023 | 08/03/2023 | (15,278 | ) | (15,634 | ) | ||||||||||||||||
| 5.620 | 04/13/2023 | 07/12/2023 | (42 | ) | (43 | ) | ||||||||||||||||
| 5.650 | 01/30/2023 | 07/28/2023 | (1,782 | ) | (1,825 | ) | ||||||||||||||||
| 5.650 | 04/17/2023 | 07/17/2023 | (24,332 | ) | (24,626 | ) | ||||||||||||||||
| 5.750 | 04/19/2023 | 10/19/2023 | (1,245 | ) | (1,260 | ) | ||||||||||||||||
| 5.790 | 06/02/2023 | 08/31/2023 | (2,630 | ) | (2,643 | ) | ||||||||||||||||
| 5.910 | 02/06/2023 | 08/04/2023 | (3,682 | ) | (3,770 | ) | ||||||||||||||||
| 5.960 | 02/06/2023 | 08/04/2023 | (14,942 | ) | (15,306 | ) | ||||||||||||||||
| 6.060 | 01/27/2023 | 07/27/2023 | (27,533 | ) | (28,261 | ) | ||||||||||||||||
| 6.060 | 02/06/2023 | 08/04/2023 | (2,158 | ) | (2,211 | ) | ||||||||||||||||
| 6.080 | 02/01/2023 | 08/01/2023 | (15,552 | ) | (15,951 | ) | ||||||||||||||||
| 6.110 | 02/06/2023 | 08/04/2023 | (1,130 | ) | (1,158 | ) | ||||||||||||||||
| 6.160 | 02/06/2023 | 08/04/2023 | (1,813 | ) | (1,859 | ) | ||||||||||||||||
| 6.170 | 01/30/2023 | 07/28/2023 | (44,020 | ) | (45,182 | ) | ||||||||||||||||
| 6.220 | 04/13/2023 | 07/12/2023 | (10,179 | ) | (10,322 | ) | ||||||||||||||||
| 6.230 | 04/06/2023 | 10/06/2023 | (25,371 | ) | (25,757 | ) | ||||||||||||||||
| 6.250 | 07/03/2023 | 01/05/2024 | (24,352 | ) | (24,352 | ) | ||||||||||||||||
| 6.260 | 01/17/2023 | 10/17/2023 | (15,264 | ) | (15,707 | ) | ||||||||||||||||
| 6.360 | 06/16/2023 | 08/16/2023 | (4,000 | ) | (4,012 | ) | ||||||||||||||||
| 6.365 | 03/31/2023 | 09/26/2023 | (4,593 | ) | (4,670 | ) | ||||||||||||||||
| 6.610 | 06/06/2023 | 03/06/2024 | (13,838 | ) | (13,906 | ) | ||||||||||||||||
| 6.670 | 06/30/2023 | 01/04/2024 | (6,530 | ) | (6,534 | ) | ||||||||||||||||
| 6.670 | 07/03/2023 | 01/05/2024 | (9,685 | ) | (9,685 | ) | ||||||||||||||||
WFS | 5.800 | 06/29/2023 | 09/13/2023 | (24,666 | ) | (24,682 | ) | |||||||||||||||
| 5.850 | 06/13/2023 | 09/13/2023 | (21,803 | ) | (21,874 | ) | ||||||||||||||||
Total Reverse Repurchase Agreements | $ | (3,526,365 | ) | |||||||||||||||||||
Counterparty | Repurchase Agreement Proceeds to be Received (1) | Payable for Reverse Repurchase Agreements | Payable for Sale-Buyback Transactions | Total Borrowings and Other Financing Transactions | Collateral Pledged/(Received) | Net Exposure (4) | ||||||||||||||||||
Global/Master Repurchase Agreement | ||||||||||||||||||||||||
BCY | $ | 0 | $ | (699 | ) | $ | 0 | $ | (699 | ) | $ | 0 | $ | (699 | ) | |||||||||
BNY | 0 | (226,286 | ) | 0 | (226,286 | ) | 289,658 | 63,372 | ||||||||||||||||
88 | PIMCO CLOSED-END FUNDS | See Accompanying Notes |
| June 30, 2023 |
Counterparty | Repurchase Agreement Proceeds to be Received (1) | Payable for Reverse Repurchase Agreements | Payable for Sale-Buyback Transactions | Total Borrowings and Other Financing Transactions | Collateral Pledged/(Received) | Net Exposure (4) | ||||||||||||||||||
BOM | $ | 0 | $ | (3,676 | ) | $ | 0 | $ | (3,676 | ) | $ | 4,488 | $ | 812 | ||||||||||
BOS | 0 | (67,708 | ) | 0 | (67,708 | ) | 83,019 | 15,311 | ||||||||||||||||
BPS | 367,183 | (439,310 | ) | 0 | (72,127 | ) | 156,829 | 84,702 | ||||||||||||||||
BRC | 0 | (405,510 | ) | 0 | (405,510 | ) | 539,274 | 133,764 | ||||||||||||||||
BYR | 0 | (128,660 | ) | 0 | (128,660 | ) | 151,288 | 22,628 | ||||||||||||||||
CDC | 0 | (83,489 | ) | 0 | (83,489 | ) | 98,134 | 14,645 | ||||||||||||||||
CDI | 0 | (5,599 | ) | 0 | (5,599 | ) | 5,816 | 217 | ||||||||||||||||
CEW | 0 | (8,961 | ) | 0 | (8,961 | ) | 10,574 | 1,613 | ||||||||||||||||
CIB | 0 | (631 | ) | 0 | (631 | ) | 626 | (5 | ) | |||||||||||||||
DBL | 0 | (220,187 | ) | 0 | (220,187 | ) | 276,126 | 55,939 | ||||||||||||||||
FICC | 3,856 | 0 | 0 | 3,856 | (3,933 | ) | (77 | ) | ||||||||||||||||
IND | 0 | (91,559 | ) | 0 | (91,559 | ) | 106,348 | 14,789 | ||||||||||||||||
JML | 0 | (175,082 | ) | 0 | (175,082 | ) | 203,828 | 28,746 | ||||||||||||||||
JPS | 0 | (179,164 | ) | 0 | (179,164 | ) | 176,384 | (2,780 | ) | |||||||||||||||
MBC | 20,909 | (21,518 | ) | 0 | (609 | ) | 4,510 | 3,901 | ||||||||||||||||
MEI | 0 | (38,934 | ) | 0 | (38,934 | ) | 48,184 | 9,250 | ||||||||||||||||
MSB | 0 | (186,859 | ) | 0 | (186,859 | ) | 255,747 | 68,888 | ||||||||||||||||
MYI | 0 | (517 | ) | 0 | (517 | ) | 506 | (11 | ) | |||||||||||||||
MZF | 0 | (54,166 | ) | 0 | (54,166 | ) | 73,111 | 18,945 | ||||||||||||||||
NOM | 0 | (16,406 | ) | 0 | (16,406 | ) | 21,736 | 5,330 | ||||||||||||||||
RBC | 0 | (88,902 | ) | 0 | (88,902 | ) | 147,648 | 58,746 | ||||||||||||||||
RCE | 0 | (54,263 | ) | 0 | (54,263 | ) | 55,232 | 969 | ||||||||||||||||
RCY | 0 | (23,664 | ) | 0 | (23,664 | ) | 26,386 | 2,722 | ||||||||||||||||
RDR | 0 | (4,120 | ) | 0 | (4,120 | ) | 4,104 | (16 | ) | |||||||||||||||
RTA | 0 | (240,918 | ) | 0 | (240,918 | ) | 286,390 | 45,473 | ||||||||||||||||
SBI | 0 | (65,262 | ) | 0 | (65,262 | ) | 88,610 | 23,348 | ||||||||||||||||
SOG | 0 | (286,348 | ) | 0 | (286,348 | ) | 317,347 | 30,999 | ||||||||||||||||
TDM | 0 | (1,025 | ) | 0 | (1,025 | ) | 1,014 | (11 | ) | |||||||||||||||
UBS | 0 | (360,386 | ) | 0 | (360,386 | ) | 416,841 | 56,455 | ||||||||||||||||
WFS | 0 | (46,556 | ) | 0 | (46,556 | ) | 52,711 | 6,155 | ||||||||||||||||
Total Borrowings and Other Financing Transactions | $ | 391,948 | $ | (3,526,365 | ) | $ | 0 | |||||||||||||||||
Overnight and Continuous | Up to 30 days | 31-90 days | Greater Than 90 days | Total | ||||||||||||||||
Reverse Repurchase Agreements | ||||||||||||||||||||
Corporate Bonds & Notes | $ | 0 | $ | (249,772 | ) | $ | (344,340 | ) | $ | (293,256 | ) | $ | (887,368 | ) | ||||||
Convertible Bonds & Notes | 0 | (5,597 | ) | 0 | (16,142 | ) | (21,739 | ) | ||||||||||||
U.S. Government Agencies | 0 | (11,059 | ) | (33,845 | ) | (21,582 | ) | (66,486 | ) | |||||||||||
Non-Agency Mortgage-Backed Securities | 0 | (180,145 | ) | (420,974 | ) | (881,167 | ) | (1,482,286 | ) | |||||||||||
Asset-Backed Securities | 0 | (19,076 | ) | (287,354 | ) | (441,968 | ) | (748,398 | ) | |||||||||||
Sovereign Issues | 0 | (35,945 | ) | 0 | (10,057 | ) | (46,002 | ) | ||||||||||||
Preferred Securities | 0 | (5,108 | ) | (89,285 | ) | (10,148 | ) | (104,541 | ) | |||||||||||
Total Borrowings | $ | 0 | $ | (506,702 | ) | $ | (1,175,798 | ) | $ | (1,674,320 | ) | $ | (3,356,820 | ) | ||||||
Payable for reverse repurchase agreements (5) | $ | (3,356,820 | ) | |||||||||||||||||
(k) | Securities with an aggregate market value of $4,274,818 and cash of $37,601 have been pledged as collateral under the terms of the above master agreements as of June 30, 2023. |
(1) | Includes accrued interest. |
(2) | The average amount of borrowings outstanding during the period ended June 30, 2023 was $(3,250,884) at a weighted average interest rate of 4.210%. Average borrowings may include reverse repurchase agreements and sale-buyback transactions, if held during the period. |
(3) | Open maturity reverse repurchase agreement. |
(4) | Net Exposure represents the net receivable/(payable) that would be due from/to the counterparty in the event of default. Exposure from borrowings and other financing transactions can only be netted across transactions governed under the same master agreement with the same legal entity. See Note 8, Master Netting Arrangements, in the Notes to Financial Statements for more information. |
(5) | Unsettled reverse repurchase agreements liability of $(169,545) is outstanding at period end. |
| See Accompanying Notes | ANNUAL REPORT | | | JUNE 30, 2023 | 89 |
Consolidated Schedule of Investments | PIMCO Dynamic Income Fund | (Cont.) |
Description | Expiration Month | # of Contracts | Notional Amount | Unrealized Appreciation/ (Depreciation) | Variation Margin | |||||||||||||||||||
Asset | Liability | |||||||||||||||||||||||
3-Month SOFR Active Contract December Futures | 03/2024 | 179 | $ | (42,351 | ) | $ | 1,199 | $ | 0 | $ | (15 | ) | ||||||||||||
3-Month SOFR Active Contract December Futures | 03/2025 | 93 | (22,314 | ) | 415 | 9 | 0 | |||||||||||||||||
3-Month SOFR Active Contract December Futures | 03/2026 | 102 | (24,616 | ) | 334 | 3 | 0 | |||||||||||||||||
3-Month SOFR Active Contract June Futures | 09/2024 | 117 | (27,858 | ) | 688 | 2 | 0 | |||||||||||||||||
3-Month SOFR Active Contract June Futures | 09/2025 | 94 | (22,645 | ) | 346 | 6 | 0 | |||||||||||||||||
3-Month SOFR Active Contract March Futures | 06/2024 | 155 | (36,768 | ) | 996 | 0 | (10 | ) | ||||||||||||||||
3-Month SOFR Active Contract March Futures | 06/2025 | 85 | (20,445 | ) | 340 | 7 | 0 | |||||||||||||||||
3-Month SOFR Active Contract March Futures | 06/2026 | 95 | (22,939 | ) | 294 | 2 | 0 | |||||||||||||||||
3-Month SOFR Active Contract September Futures | 12/2024 | 108 | (25,820 | ) | 555 | 9 | 0 | |||||||||||||||||
3-Month SOFR Active Contract September Futures | 12/2025 | 76 | (18,327 | ) | 262 | 3 | 0 | |||||||||||||||||
Total Futures Contracts | $ | 5,429 | $ | 41 | $ | (25 | ) | |||||||||||||||||
Reference Entity | Fixed Receive Rate | Payment Frequency | Maturity Date | Implied Credit Spread at June 30, 2023 (2) | Notional Amount (3) | Premiums Paid/(Received) | Unrealized Appreciation/ (Depreciation) | Market Value (4) | Variation Margin | |||||||||||||||||||||||||||||||||||
Asset | Liability | |||||||||||||||||||||||||||||||||||||||||||
Jaguar Land Rover Automotive | 5.000 | % | Quarterly | 06/20/2026 | 4.659 | % | EUR | 600 | $ | 38 | $ | (31 | ) | $ | 7 | $ | 4 | $ | 0 | |||||||||||||||||||||||||
Jaguar Land Rover Automotive | 5.000 | Quarterly | 12/20/2026 | 5.190 | 12,613 | 637 | (690 | ) | (53 | ) | 131 | 0 | ||||||||||||||||||||||||||||||||
| $ | 675 | $ | (721 | ) | $ | (46 | ) | $ | 135 | $ | 0 | |||||||||||||||||||||||||||||||||
Pay/Receive Floating Rate | Floating Rate Index | Fixed Rate | Payment Frequency | Maturity Date | Notional Amount | Premiums Paid/(Received) | Unrealized Appreciation/ (Depreciation) | Market Value | Variation Margin | |||||||||||||||||||||||||||||||
Asset | Liability | |||||||||||||||||||||||||||||||||||||||
Receive | 1-Day GBP-SONIO Compounded-OIS | 0.500 | % | Annual | 09/16/2030 | GBP | 27,000 | $ | 335 | $ | 8,950 | $ | 9,285 | $ | 178 | $ | 0 | |||||||||||||||||||||||
Receive | 1-Day GBP-SONIO Compounded-OIS | 0.750 | Annual | 09/21/2052 | 28,300 | (2,278 | ) | 21,926 | 19,648 | 185 | 0 | |||||||||||||||||||||||||||||
Pay | 1-Day USD-SOFR Compounded-OIS | 0.000 | Quarterly | 09/15/2023 | $ | 16,600 | 0 | (237 | ) | (237 | ) | 0 | (7 | ) | ||||||||||||||||||||||||||
Pay | 1-Day USD-SOFR Compounded-OIS | 0.000 | Quarterly | 09/16/2023 | 1,800 | 0 | (26 | ) | (26 | ) | 0 | (1 | ) | |||||||||||||||||||||||||||
Pay (5) | 1-Day USD-SOFR Compounded-OIS | 2.750 | Maturity | 12/19/2023 | 30,600 | (37 | ) | (184 | ) | (221 | ) | 2 | 0 | |||||||||||||||||||||||||||
Pay (5) | 1-Day USD-SOFR Compounded-OIS | 1.750 | Maturity | 12/21/2023 | 152,800 | 298 | (1,774 | ) | (1,476 | ) | 9 | 0 | ||||||||||||||||||||||||||||
Receive (5) | 1-Day USD-SOFR Compounded-OIS | 2.450 | Annual | 12/20/2024 | 189,000 | (13 | ) | 4,484 | 4,471 | 0 | (33 | ) | ||||||||||||||||||||||||||||
Receive (5) | 1-Day USD-SOFR Compounded-OIS | 2.350 | Annual | 01/17/2025 | 94,800 | 10 | 2,214 | 2,224 | 0 | (25 | ) | |||||||||||||||||||||||||||||
Receive (5) | 1-Day USD-SOFR Compounded-OIS | 2.300 | Annual | 01/17/2026 | 15,100 | 7 | 544 | 551 | 1 | 0 | ||||||||||||||||||||||||||||||
Pay (5) | 1-Day USD-SOFR Compounded-OIS | 0.500 | Semi-Annual | 06/16/2026 | 184,100 | (2,392 | ) | (16,519 | ) | (18,911 | ) | 89 | 0 | |||||||||||||||||||||||||||
Pay | 1-Day USD-SOFR Compounded-OIS | 1.000 | Annual | 12/15/2026 | 11,200 | 21 | (1,402 | ) | (1,381 | ) | 2 | 0 | ||||||||||||||||||||||||||||
Pay (5) | 1-Day USD-SOFR Compounded-OIS | 0.660 | Semi-Annual | 12/21/2026 | 483,000 | 62 | (53,708 | ) | (53,646 | ) | 244 | 0 | ||||||||||||||||||||||||||||
Pay (5) | 1-Day USD-SOFR Compounded-OIS | 1.750 | Semi-Annual | 12/21/2026 | 303,000 | 2,991 | (26,881 | ) | (23,890 | ) | 158 | 0 | ||||||||||||||||||||||||||||
Receive (5) | 1-Day USD-SOFR Compounded-OIS | 1.360 | Semi-Annual | 02/15/2027 | 13,450 | (2 | ) | 1,314 | 1,312 | 0 | (6 | ) | ||||||||||||||||||||||||||||
Pay (5) | 1-Day USD-SOFR Compounded-OIS | 1.600 | Semi-Annual | 02/15/2027 | 53,800 | (133 | ) | (4,703 | ) | (4,836 | ) | 25 | 0 | |||||||||||||||||||||||||||
Pay (5) | 1-Day USD-SOFR Compounded-OIS | 1.500 | Semi-Annual | 06/21/2027 | 209,400 | (6,804 | ) | (12,966 | ) | (19,770 | ) | 50 | 0 | |||||||||||||||||||||||||||
Pay (5) | 1-Day USD-SOFR Compounded-OIS | 3.700 | Annual | 12/05/2027 | 864,600 | (534 | ) | (3,644 | ) | (4,178 | ) | 253 | 0 | |||||||||||||||||||||||||||
Pay (5) | 1-Day USD-SOFR Compounded-OIS | 2.500 | Semi-Annual | 12/20/2027 | 91,250 | 554 | (6,435 | ) | (5,881 | ) | 27 | 0 | ||||||||||||||||||||||||||||
Pay (5) | 1-Day USD-SOFR Compounded-OIS | 0.500 | Semi-Annual | 06/16/2028 | 660 | (31 | ) | (70 | ) | (101 | ) | 0 | 0 | |||||||||||||||||||||||||||
Pay (5) | 1-Day USD-SOFR Compounded-OIS | 2.250 | Semi-Annual | 06/20/2028 | 8,200 | (269 | ) | (377 | ) | (646 | ) | 4 | 0 | |||||||||||||||||||||||||||
Pay (5) | 1-Day USD-SOFR Compounded-OIS | 3.750 | Annual | 12/20/2028 | 170,600 | 1,578 | (1,038 | ) | 540 | 104 | 0 | |||||||||||||||||||||||||||||
Pay | 1-Day USD-SOFR Compounded-OIS | 2.000 | Annual | 12/21/2029 | 249,900 | (25,675 | ) | (2,681 | ) | (28,356 | ) | 180 | 0 | |||||||||||||||||||||||||||
Receive | 1-Day USD-SOFR Compounded-OIS | 1.500 | Annual | 12/15/2031 | 98,500 | (2,199 | ) | 18,888 | 16,689 | 0 | (148 | ) | ||||||||||||||||||||||||||||
Receive | 1-Day USD-SOFR Compounded-OIS | 1.750 | Semi-Annual | 12/15/2031 | 16,600 | (225 | ) | 2,802 | 2,577 | 0 | (26 | ) | ||||||||||||||||||||||||||||
Receive | 1-Day USD-SOFR Compounded-OIS | 2.000 | Annual | 12/21/2032 | 88,000 | 10,651 | 1,593 | 12,244 | 0 | (174 | ) | |||||||||||||||||||||||||||||
Receive | 1-Day USD-SOFR Compounded-OIS | 3.850 | Annual | 12/21/2038 | 108,200 | 418 | (4,619 | ) | (4,201 | ) | 0 | (524 | ) | |||||||||||||||||||||||||||
Receive (5) | 1-Day USD-SOFR Compounded-OIS | 2.750 | Semi-Annual | 03/20/2043 | 1,300 | (4 | ) | 170 | 166 | 0 | (8 | ) | ||||||||||||||||||||||||||||
Receive | 1-Day USD-SOFR Compounded-OIS | 2.750 | Semi-Annual | 12/16/2045 | 1,800 | (17 | ) | 269 | 252 | 0 | (13 | ) | ||||||||||||||||||||||||||||
Receive (5) | 1-Day USD-SOFR Compounded-OIS | 2.750 | Semi-Annual | 12/16/2045 | 2,000 | (27 | ) | 289 | 262 | 0 | (14 | ) | ||||||||||||||||||||||||||||
Receive (5) | 1-Day USD-SOFR Compounded-OIS | 2.500 | Semi-Annual | 06/20/2048 | 3,100 | 256 | 276 | 532 | 0 | (24 | ) | |||||||||||||||||||||||||||||
Receive (5) | 1-Day USD-SOFR Compounded-OIS | 2.250 | Semi-Annual | 03/12/2050 | 20,500 | (367 | ) | 4,795 | 4,428 | 0 | (165 | ) | ||||||||||||||||||||||||||||
Receive | 1-Day USD-SOFR Compounded-OIS | 1.750 | Annual | 06/15/2052 | 68,000 | 16,788 | 1,399 | 18,187 | 0 | (575 | ) | |||||||||||||||||||||||||||||
Receive | 1-Day USD-SOFR Compounded-OIS | 1.750 | Annual | 12/21/2052 | 45,800 | 11,031 | 1,932 | 12,963 | 0 | (395 | ) | |||||||||||||||||||||||||||||
Receive | 1-Day USD-SOFR Compounded-OIS | 3.500 | Annual | 12/21/2052 | 92,160 | 786 | (5,558 | ) | (4,772 | ) | 0 | (943 | ) | |||||||||||||||||||||||||||
Pay | 1-Year BRL-CDI | 11.140 | Maturity | 01/02/2025 | BRL | 7,800 | 0 | (28 | ) | (28 | ) | 2 | 0 | |||||||||||||||||||||||||||
90 | PIMCO CLOSED-END FUNDS | See Accompanying Notes |
| June 30, 2023 |
Pay/Receive Floating Rate | Floating Rate Index | Fixed Rate | Payment Frequency | Maturity Date | Notional Amount | Premiums Paid/(Received) | Unrealized Appreciation/ (Depreciation) | Market Value | Variation Margin | |||||||||||||||||||||||||||||||
Asset | Liability | |||||||||||||||||||||||||||||||||||||||
Pay | 1-Year BRL-CDI | 11.160 | % | Maturity | 01/02/2025 | BRL | 5,200 | $ | 0 | $ | (18 | ) | $ | (18 | ) | $ | 1 | $ | 0 | |||||||||||||||||||||
Pay | 1-Year BRL-CDI | 11.350 | Maturity | 01/02/2025 | 6,400 | 0 | (16 | ) | (16 | ) | 2 | 0 | ||||||||||||||||||||||||||||
Pay | 1-Year BRL-CDI | 12.000 | Maturity | 01/02/2025 | 17,400 | 0 | 6 | 6 | 4 | 0 | ||||||||||||||||||||||||||||||
Pay | 1-Year BRL-CDI | 12.080 | Maturity | 01/02/2025 | 28,900 | 0 | 21 | 21 | 7 | 0 | ||||||||||||||||||||||||||||||
Pay | 1-Year BRL-CDI | 12.140 | Maturity | 01/02/2025 | 14,600 | 0 | 15 | 15 | 4 | 0 | ||||||||||||||||||||||||||||||
Pay | 1-Year BRL-CDI | 12.145 | Maturity | 01/02/2025 | 14,300 | 0 | 15 | 15 | 3 | 0 | ||||||||||||||||||||||||||||||
Pay | 1-Year BRL-CDI | 12.160 | Maturity | 01/02/2025 | 29,100 | 0 | 32 | 32 | 7 | 0 | ||||||||||||||||||||||||||||||
Pay | 1-Year BRL-CDI | 11.220 | Maturity | 01/04/2027 | 9,400 | 0 | 19 | 19 | 8 | 0 | ||||||||||||||||||||||||||||||
Pay | 1-Year BRL-CDI | 11.245 | Maturity | 01/04/2027 | 4,700 | 0 | 10 | 10 | 4 | 0 | ||||||||||||||||||||||||||||||
Pay | 1-Year BRL-CDI | 11.260 | Maturity | 01/04/2027 | 4,700 | 0 | 11 | 11 | 4 | 0 | ||||||||||||||||||||||||||||||
Pay | 1-Year BRL-CDI | 11.700 | Maturity | 01/04/2027 | 2,400 | 0 | 12 | 12 | 2 | 0 | ||||||||||||||||||||||||||||||
Pay | 1-Year BRL-CDI | 11.715 | Maturity | 01/04/2027 | 10,500 | 0 | 55 | 55 | 9 | 0 | ||||||||||||||||||||||||||||||
Receive | 1-Year BRL-CDI | 11.788 | Maturity | 01/04/2027 | 599,100 | 0 | (3,731 | ) | (3,731 | ) | 0 | (509 | ) | |||||||||||||||||||||||||||
Pay | 1-Year BRL-CDI | 11.870 | Maturity | 01/04/2027 | 25,100 | 0 | 156 | 156 | 21 | 0 | ||||||||||||||||||||||||||||||
Pay | 1-Year BRL-CDI | 12.015 | Maturity | 01/04/2027 | 437,000 | 0 | 3,115 | 3,115 | 373 | 0 | ||||||||||||||||||||||||||||||
Receive | 3-Month USD-LIBOR | 1.360 | Semi-Annual | 08/15/2023 | $ | 13,450 | 0 | 95 | 95 | 4 | 0 | |||||||||||||||||||||||||||||
Pay | 3-Month USD-LIBOR | 1.600 | Semi-Annual | 08/15/2023 | 53,800 | 0 | (316 | ) | (316 | ) | 0 | (17 | ) | |||||||||||||||||||||||||||
Receive | 3-Month USD-LIBOR | 2.250 | Semi-Annual | 09/12/2023 | 20,500 | 0 | 65 | 65 | 6 | 0 | ||||||||||||||||||||||||||||||
Receive | 3-Month USD-LIBOR | 0.000 | Quarterly | 09/15/2023 | 16,600 | 0 | 241 | 241 | 8 | 0 | ||||||||||||||||||||||||||||||
Receive | 3-Month USD-LIBOR | 0.000 | Quarterly | 09/16/2023 | 1,800 | 0 | 26 | 26 | 1 | 0 | ||||||||||||||||||||||||||||||
Pay | 3-Month USD-LIBOR | 0.500 | Semi-Annual | 09/16/2023 | 184,760 | 0 | (2,471 | ) | (2,471 | ) | 0 | (78 | ) | |||||||||||||||||||||||||||
Receive | 3-Month USD-LIBOR | 2.750 | Semi-Annual | 09/16/2023 | 2,000 | 0 | 15 | 15 | 0 | 0 | ||||||||||||||||||||||||||||||
Pay | 3-Month USD-LIBOR | 2.750 | Semi-Annual | 09/19/2023 | 30,600 | 0 | (223 | ) | (223 | ) | 0 | (7 | ) | |||||||||||||||||||||||||||
Pay | 3-Month USD-LIBOR | 2.250 | Semi-Annual | 09/20/2023 | 8,200 | 0 | (71 | ) | (71 | ) | 0 | (2 | ) | |||||||||||||||||||||||||||
Pay | 3-Month USD-LIBOR | 2.500 | Semi-Annual | 09/20/2023 | 88,150 | 0 | (704 | ) | (704 | ) | 0 | (22 | ) | |||||||||||||||||||||||||||
Receive | 3-Month USD-LIBOR | 2.750 | Semi-Annual | 09/20/2023 | 1,300 | 0 | 1 | 1 | 0 | 0 | ||||||||||||||||||||||||||||||
Pay | 3-Month USD-LIBOR | 1.500 | Semi-Annual | 09/21/2023 | 209,400 | 0 | (2,210 | ) | (2,210 | ) | 0 | (70 | ) | |||||||||||||||||||||||||||
Pay | 3-Month USD-LIBOR | 1.750 | Semi-Annual | 09/21/2023 | 455,800 | 0 | (4,519 | ) | (4,519 | ) | 0 | (144 | ) | |||||||||||||||||||||||||||
Receive | 6-Month EUR-EURIBOR | 0.150 | Annual | 03/18/2030 | EUR | 20,400 | 373 | 4,134 | 4,507 | 102 | 0 | |||||||||||||||||||||||||||||
Receive | 6-Month EUR-EURIBOR | 0.150 | Annual | 06/17/2030 | 1,200 | (1 | ) | 241 | 240 | 6 | 0 | |||||||||||||||||||||||||||||
Receive | 6-Month EUR-EURIBOR | 0.250 | Annual | 03/18/2050 | 2,500 | 139 | 1,088 | 1,227 | 12 | 0 | ||||||||||||||||||||||||||||||
Receive | 6-Month EUR-EURIBOR | 0.500 | Annual | 06/17/2050 | 500 | (16 | ) | 234 | 218 | 3 | 0 | |||||||||||||||||||||||||||||
Receive | 6-Month EUR-EURIBOR | 0.500 | Annual | 09/21/2052 | 34,600 | 2,992 | 12,629 | 15,621 | 179 | 0 | ||||||||||||||||||||||||||||||
Receive (5) | 6-Month EUR-EURIBOR | 0.830 | Annual | 12/09/2052 | 143,700 | 1,990 | 5,839 | 7,829 | 29 | 0 | ||||||||||||||||||||||||||||||
Receive (5) | 6-Month EUR-EURIBOR | 2.500 | Annual | 09/20/2053 | 13,800 | 80 | (40 | ) | 40 | 97 | 0 | |||||||||||||||||||||||||||||
Receive | 28-Day MXN-TIIE | 8.675 | Lunar | 04/03/2024 | MXN | 63,800 | 0 | 71 | 71 | 0 | 0 | |||||||||||||||||||||||||||||
Receive | 28-Day MXN-TIIE | 8.660 | Lunar | 04/04/2024 | 32,100 | 0 | 36 | 36 | 0 | 0 | ||||||||||||||||||||||||||||||
Receive | 28-Day MXN-TIIE | 8.750 | Lunar | 04/05/2024 | 11,300 | 0 | 12 | 12 | 0 | 0 | ||||||||||||||||||||||||||||||
Receive | 28-Day MXN-TIIE | 8.410 | Lunar | 03/31/2027 | 7,600 | 0 | 3 | 3 | 1 | 0 | ||||||||||||||||||||||||||||||
Receive | 28-Day MXN-TIIE | 8.730 | Lunar | 04/06/2027 | 4,700 | 0 | 0 | 0 | 0 | 0 | ||||||||||||||||||||||||||||||
Receive | 28-Day MXN-TIIE | 7.495 | Lunar | 01/14/2032 | 2,300 | 9 | (4 | ) | 5 | 0 | 0 | |||||||||||||||||||||||||||||
Receive | 28-Day MXN-TIIE | 7.498 | Lunar | 01/15/2032 | 9,500 | 39 | (18 | ) | 21 | 0 | (1 | ) | ||||||||||||||||||||||||||||
Receive | 28-Day MXN-TIIE | 8.732 | Lunar | 03/30/2032 | 2,400 | 0 | (5 | ) | (5 | ) | 0 | 0 | ||||||||||||||||||||||||||||
Receive | 28-Day MXN-TIIE | 8.701 | Lunar | 03/31/2032 | 5,600 | 0 | (12 | ) | (12 | ) | 0 | 0 | ||||||||||||||||||||||||||||
| $ | 10,384 | $ | (57,166 | ) | $ | (46,782 | ) | $ | 2,410 | $ | (3,931 | ) | ||||||||||||||||||||||||||||
Total Swap Agreements | $ | 11,059 | $ | (57,887 | ) | $ | (46,828 | ) | $ | 2,545 | $ | (3,931 | ) | |||||||||||||||||||||||||||
Financial Derivative Assets | Financial Derivative Liabilities | |||||||||||||||||||||||||||||||||||
Market Value | Variation Margin Asset | Total | Market Value | Variation Margin Liability | Total | |||||||||||||||||||||||||||||||
Purchased Options | Futures | Swap Agreements | Written Options | Futures | Swap Agreements | |||||||||||||||||||||||||||||||
Total Exchange-Traded or Centrally Cleared | $ | 0 | $ | 41 | $ | 2,545 | $ | 2,586 | $ | 0 | $ | (25) | $ | (3,931) | $ | (3,956) | ||||||||||||||||||||
(1) | If the Fund is a seller of protection and a credit event occurs, as defined under the terms of that particular swap agreement, the Fund will either (i) pay to the buyer of protection an amount equal to the notional amount of the swap and take delivery of the referenced obligation or underlying securities comprising the referenced index or (ii) pay a net settlement amount in the form of cash, securities or other deliverable obligations equal to the notional amount of the swap less the recovery value of the referenced obligation or underlying securities comprising the referenced index. |
(2) | Implied credit spreads, represented in absolute terms, utilized in determining the market value of credit default swap agreements on corporate issues as of period end serve as indicators of the current status of the payment/performance risk and represent the likelihood or risk of default for the credit derivative. The implied credit spread of a particular referenced entity reflects the cost of buying/selling protection and may include upfront payments required to be made to enter into the agreement. Wider credit spreads represent a deterioration of the referenced entity’s credit soundness and a greater likelihood or risk of default or other credit event occurring as defined under the terms of the agreement. |
| See Accompanying Notes | ANNUAL REPORT | | | JUNE 30, 2023 | 91 |
Consolidated Schedule of Investments | PIMCO Dynamic Income Fund | (Cont.) |
(3) | The maximum potential amount the Fund could be required to pay as a seller of credit protection or receive as a buyer of credit protection if a credit event occurs as defined under the terms of that particular swap agreement. |
(4) | The prices and resulting values for credit default swap agreements serve as indicators of the current status of the payment/performance risk and represent the likelihood of an expected liability (or profit) for the credit derivative should the notional amount of the swap agreement be closed/sold as of the period end. Increasing market values, in absolute terms when compared to the notional amount of the swap, represent a deterioration of the underlying referenced instrument’s credit soundness and a greater likelihood or risk of default or other credit event occurring as defined under the terms of the agreement. |
(5) | This instrument has a forward starting effective date. See Note 2, Securities Transactions and Investment Income, in the Notes to Financial Statements for further information. |
Counterparty | Settlement Month | Currency to be Delivered | Currency to be Received | Unrealized Appreciation/ (Depreciation) | ||||||||||||||||||||
Asset | Liability | |||||||||||||||||||||||
BOA | 07/2023 | EUR | 4,662 | $ | 4,993 | $ | 0 | $ | (94 | ) | ||||||||||||||
| 07/2023 | MXN | 613,173 | 33,307 | 0 | (2,427 | ) | ||||||||||||||||||
| 07/2023 | $ | 6,723 | EUR | 6,256 | 103 | 0 | ||||||||||||||||||
| 08/2023 | AUD | 444 | $ | 300 | 4 | 0 | ||||||||||||||||||
| 09/2023 | $ | 83 | IDR | 1,249,606 | 0 | 0 | ||||||||||||||||||
BPS | 07/2023 | BRL | 2,192 | $ | 455 | 0 | (3 | ) | ||||||||||||||||
| 07/2023 | CZK | 7,161 | 333 | 4 | 0 | |||||||||||||||||||
| 07/2023 | EUR | 7,983 | 8,733 | 22 | 0 | |||||||||||||||||||
| 07/2023 | GBP | 2,238 | 2,847 | 4 | 0 | |||||||||||||||||||
| 07/2023 | $ | 452 | BRL | 2,192 | 6 | 0 | ||||||||||||||||||
| 07/2023 | 6,259 | EUR | 5,730 | 0 | (7 | ) | ||||||||||||||||||
| 07/2023 | 1,980 | GBP | 1,558 | 0 | (1 | ) | ||||||||||||||||||
| 08/2023 | BRL | 2,192 | $ | 450 | 0 | (6 | ) | |||||||||||||||||
| 08/2023 | CNH | 13,821 | 2,000 | 93 | 0 | |||||||||||||||||||
| 08/2023 | $ | 9 | CNY | 58 | 0 | 0 | ||||||||||||||||||
| 08/2023 | 6,341 | EUR | 5,838 | 38 | 0 | |||||||||||||||||||
| 09/2023 | 5,082 | IDR | 76,372,105 | 9 | 0 | |||||||||||||||||||
| 09/2023 | ZAR | 31,868 | $ | 1,759 | 77 | 0 | ||||||||||||||||||
BRC | 07/2023 | GBP | 5,856 | 7,455 | 18 | 0 | ||||||||||||||||||
| 09/2023 | IDR | 134,047 | 9 | 0 | 0 | |||||||||||||||||||
| 09/2023 | $ | 1,907 | ZAR | 33,679 | 0 | (130 | ) | |||||||||||||||||
CBK | 07/2023 | CZK | 6,320 | $ | 293 | 3 | 0 | |||||||||||||||||
| 07/2023 | GBP | 8,172 | 10,439 | 60 | 0 | |||||||||||||||||||
| 07/2023 | PEN | 10,007 | 2,756 | 0 | (3 | ) | ||||||||||||||||||
| 07/2023 | $ | 4,350 | EUR | 3,999 | 17 | (3 | ) | |||||||||||||||||
| 07/2023 | 2,576 | PEN | 10,007 | 183 | 0 | |||||||||||||||||||
| 08/2023 | CAD | 7,595 | $ | 5,695 | 0 | (41 | ) | |||||||||||||||||
| 08/2023 | CNH | 22 | 3 | 0 | 0 | |||||||||||||||||||
| 08/2023 | GBP | 7,671 | 9,696 | 0 | (48 | ) | ||||||||||||||||||
DUB | 07/2023 | BRL | 62,263 | 11,491 | 0 | (1,512 | ) | |||||||||||||||||
| 07/2023 | PEN | 10,007 | 2,736 | 0 | (22 | ) | ||||||||||||||||||
| 07/2023 | $ | 12,920 | BRL | 62,263 | 84 | 0 | ||||||||||||||||||
| 07/2023 | 5,490 | PEN | 20,014 | 26 | 0 | |||||||||||||||||||
GLM | 08/2023 | CHF | 41 | $ | 46 | 0 | 0 | |||||||||||||||||
| 10/2023 | $ | 22,902 | MXN | 402,050 | 138 | 0 | ||||||||||||||||||
JPM | 07/2023 | GBP | 1,558 | $ | 1,970 | 0 | (9 | ) | ||||||||||||||||
| 07/2023 | $ | 697,144 | EUR | 638,469 | 0 | (447 | ) | |||||||||||||||||
| 08/2023 | CAD | 12,485 | $ | 9,338 | 0 | (92 | ) | |||||||||||||||||
| 08/2023 | CHF | 61 | 70 | 1 | 0 | |||||||||||||||||||
| 08/2023 | CNH | 11,094 | 1,605 | 74 | 0 | |||||||||||||||||||
| 08/2023 | EUR | 638,469 | 698,119 | 467 | 0 | |||||||||||||||||||
| 08/2023 | HUF | 112,971 | 324 | 0 | (3 | ) | ||||||||||||||||||
| 08/2023 | $ | 9 | CNY | 62 | 0 | (1 | ) | |||||||||||||||||
| 08/2023 | 1,970 | GBP | 1,558 | 9 | 0 | |||||||||||||||||||
| 09/2023 | IDR | 244,381 | $ | 16 | 0 | 0 | ||||||||||||||||||
| 09/2023 | PEN | 6,773 | 1,839 | 0 | (16 | ) | ||||||||||||||||||
| 09/2023 | $ | 35 | IDR | 522,728 | 0 | 0 | ||||||||||||||||||
| 09/2023 | 24 | INR | 1,956 | 0 | 0 | |||||||||||||||||||
| 10/2023 | 12,947 | MXN | 227,319 | 80 | 0 | |||||||||||||||||||
MBC | 07/2023 | EUR | 33,798 | $ | 36,512 | 62 | (430 | ) | ||||||||||||||||
| 07/2023 | GBP | 174,996 | 216,631 | 0 | (5,614 | ) | ||||||||||||||||||
| 07/2023 | $ | 1,337 | GBP | 1,046 | 0 | (9 | ) | |||||||||||||||||
MYI | 07/2023 | EUR | 5,837 | $ | 6,315 | 0 | (54 | ) | ||||||||||||||||
| 07/2023 | IDR | 329,404 | 22 | 0 | 0 | |||||||||||||||||||
| 07/2023 | $ | 3,439 | EUR | 3,179 | 30 | 0 | ||||||||||||||||||
| 07/2023 | 31,001 | GBP | 25,011 | 763 | 0 | |||||||||||||||||||
| 07/2023 | 22 | IDR | 329,404 | 0 | 0 | |||||||||||||||||||
| 09/2023 | 2,783 | 41,569,251 | 0 | (13 | ) | |||||||||||||||||||
92 | PIMCO CLOSED-END FUNDS | See Accompanying Notes |
| June 30, 2023 |
Counterparty | Settlement Month | Currency to be Delivered | Currency to be Received | Unrealized Appreciation/ (Depreciation) | ||||||||||||||||||||
Asset | Liability | |||||||||||||||||||||||
NGF | 08/2023 | CNH | 16,959 | $ | 2,471 | $ | 130 | $ | 0 | |||||||||||||||
RBC | 07/2023 | MXN | 3,334 | 173 | 0 | (21 | ) | |||||||||||||||||
| 08/2023 | $ | 303 | MXN | 5,258 | 1 | 0 | ||||||||||||||||||
RYL | 07/2023 | 56,823 | EUR | 52,946 | 952 | 0 | ||||||||||||||||||
| 09/2023 | 328 | ZAR | 5,644 | 0 | (30 | ) | ||||||||||||||||||
SCX | 07/2023 | 2,279 | GBP | 1,813 | 24 | 0 | ||||||||||||||||||
| 08/2023 | CNH | 5,258 | $ | 764 | 39 | 0 | ||||||||||||||||||
| 09/2023 | IDR | 242,006,774 | 16,276 | 144 | 0 | |||||||||||||||||||
| 09/2023 | $ | 8,596 | IDR | 128,796,555 | 1 | (12 | ) | |||||||||||||||||
| 09/2023 | 15 | INR | 1,224 | 0 | 0 | |||||||||||||||||||
| 09/2023 | ZAR | 5,644 | $ | 322 | 24 | 0 | ||||||||||||||||||
SOG | 07/2023 | EUR | 650,119 | 699,359 | 0 | (10,051 | ) | |||||||||||||||||
| 07/2023 | $ | 1,488 | PLN | 6,411 | 87 | 0 | ||||||||||||||||||
| 09/2023 | ZAR | 101,290 | $ | 5,756 | 411 | 0 | ||||||||||||||||||
SSB | 07/2023 | PEN | 10,007 | 2,744 | 0 | (14 | ) | |||||||||||||||||
| 07/2023 | $ | 11,959 | BRL | 60,072 | 587 | 0 | ||||||||||||||||||
| 08/2023 | 2,740 | PEN | 10,007 | 12 | 0 | |||||||||||||||||||
TOR | 07/2023 | EUR | 8,180 | $ | 8,917 | 0 | (9 | ) | ||||||||||||||||
| 07/2023 | $ | 207,623 | GBP | 163,392 | 0 | (115 | ) | |||||||||||||||||
| 08/2023 | GBP | 163,392 | $ | 207,668 | 118 | 0 | ||||||||||||||||||
| 08/2023 | HUF | 71,555 | 204 | 0 | (3 | ) | ||||||||||||||||||
UAG | 09/2023 | $ | 5,674 | ZAR | 99,479 | 0 | (425 | ) | ||||||||||||||||
Total Forward Foreign Currency Contracts | $ | 4,905 | $ | (21,665 | ) | |||||||||||||||||||
Counterparty | Reference Entity | Fixed Receive Rate | Payment Frequency | Maturity Date | Implied Credit Spread at June 30, 2023 (2) | Notional Amount (3) | Premiums Paid/(Received) | Unrealized Appreciation/ (Depreciation) | Swap Agreements, at Value (4) | |||||||||||||||||||||||||||||||
Asset | Liability | |||||||||||||||||||||||||||||||||||||||
| DUB | Eskom « | 4.650% | Quarterly | 06/30/2029 | 0.031% | $ | 22,100 | $ | 0 | $ | 952 | $ | 952 | $ | 0 | |||||||||||||||||||||||||
Counterparty | Index/Tranches | Fixed Receive Rate | Payment Frequency | Maturity Date | Notional Amount (3) | Premiums Paid/(Received) | Unrealized Appreciation/ (Depreciation) | Swap Agreements, at Value (4) | ||||||||||||||||||||||||||||||
Asset | Liability | |||||||||||||||||||||||||||||||||||||
| FBF | ABX.HE.AA.6-2 Index « | 0.170 | % | Monthly | 05/25/2046 | $ | 22,708 | $ | (20,211 | ) | $ | 14,311 | $ | 0 | $ | (5,900 | ) | |||||||||||||||||||||
| GST | ABX.HE.AA.6-1 Index « | 0.320 | Monthly | 07/25/2045 | 4,833 | (962 | ) | 626 | 0 | (336 | ) | |||||||||||||||||||||||||||
ABX.HE.PENAAA.7-1 Index « | 0.090 | Monthly | 08/25/2037 | 1,468 | (461 | ) | 241 | 0 | (220 | ) | ||||||||||||||||||||||||||||
| $ | (21,634 | ) | $ | 15,178 | $ | 0 | $ | (6,456 | ) | |||||||||||||||||||||||||||||
Counterparty | Pay/Receive (5) | Underlying Reference | # of Units | Financing Rate | Payment Frequency | Maturity Date | Notional Amount | Premiums Paid/(Received) | Unrealized Appreciation/ (Depreciation) | Swap Agreements, at Value | ||||||||||||||||||||||||||
Asset | Liability | |||||||||||||||||||||||||||||||||||
MYC | Receive | United States Treasury Inflation Indexed Bonds« | N/A | 0.000% | Maturity | 01/28/2036 | CNY | 59,900 | $ | 25 | $ | (428 | ) | $ | 0 | $ | (403 | ) | ||||||||||||||||||
Counterparty | Pay/Receive | Underlying Reference | Financing Rate | Payment Frequency | Maturity Date | Notional Amount | Premiums Paid/(Received) | Unrealized Appreciation/ (Depreciation) | Swap Agreements, at Value | |||||||||||||||||||||||
Asset | Liability | |||||||||||||||||||||||||||||||
BPS | Pay | AP Core Holdings II, LLC | 1-Month USD-LIBOR | Quarterly | 07/31/2023 | $ 225 | $ | 0 | $ | 0 | $ | 0 | $ | 0 | ||||||||||||||||||
BPS | Pay | AP Core Holdings II, LLC | 1-Month USD-LIBOR | Quarterly | 07/31/2023 | 240 | 0 | 444 | 444 | 0 | ||||||||||||||||||||||
BPS | Pay | PUG LLC | 1-Month USD-LIBOR | Quarterly | 07/31/2023 | 2,381 | 0 | 243 | 243 | 0 | ||||||||||||||||||||||
BPS | Pay | Team Health Holdings, Inc. | 1-Month USD-LIBOR | Quarterly | 07/31/2023 | 2,487 | 0 | (41 | ) | 0 | (41 | ) | ||||||||||||||||||||
BPS | Pay | Veritas US Inc. | 1-Month USD-LIBOR | Quarterly | 07/31/2023 | 5,625 | 0 | 231 | 231 | 0 | ||||||||||||||||||||||
| $ | 0 | $ | 877 | $ | 918 | $ | (41 | ) | ||||||||||||||||||||||||
Total Swap Agreements | $ | (21,609 | ) | $ | 16,579 | $ | 1,870 | $ | (6,900 | ) | ||||||||||||||||||||||
| See Accompanying Notes | ANNUAL REPORT | | | JUNE 30, 2023 | 93 |
Consolidated Schedule of Investments | PIMCO Dynamic Income Fund | (Cont.) |
Financial Derivative Assets | Financial Derivative Liabilities | |||||||||||||||||||||||||||||||||||||||||||||||
Counterparty | Forward Foreign Currency Contracts | Purchased Options | Swap Agreements | Total Over the Counter | Forward Foreign Currency Contracts | Written Options | Swap Agreements | Total Over the Counter | Net Market Value of OTC Derivatives | Collateral Pledged/ (Received) | Net Exposure (6) | |||||||||||||||||||||||||||||||||||||
BOA | $ | 107 | $ | 0 | $ | 0 | $ | 107 | $ | (2,521 | ) | $ | 0 | $ | 0 | $ | (2,521 | ) | $ | (2,414 | ) | $ | 2,487 | $ | 73 | |||||||||||||||||||||||
BPS | 253 | 0 | 918 | 1,171 | (17 | ) | 0 | (41 | ) | (58 | ) | 1,113 | (2,580 | ) | (1,467 | ) | ||||||||||||||||||||||||||||||||
BRC | 18 | 0 | 0 | 18 | (130 | ) | 0 | 0 | (130 | ) | (112 | ) | 0 | (112 | ) | |||||||||||||||||||||||||||||||||
CBK | 263 | 0 | 0 | 263 | (95 | ) | 0 | 0 | (95 | ) | 168 | (365 | ) | (197 | ) | |||||||||||||||||||||||||||||||||
DUB | 110 | 0 | 952 | 1,062 | (1,534 | ) | 0 | 0 | (1,534 | ) | (472 | ) | 600 | 128 | ||||||||||||||||||||||||||||||||||
FBF | 0 | 0 | 0 | 0 | 0 | 0 | (5,900 | ) | (5,900 | ) | (5,900 | ) | 4,617 | (1,283 | ) | |||||||||||||||||||||||||||||||||
GLM | 138 | 0 | 0 | 138 | 0 | 0 | 0 | 0 | 138 | (70 | ) | 68 | ||||||||||||||||||||||||||||||||||||
GST | 0 | 0 | 0 | 0 | 0 | 0 | (556 | ) | (556 | ) | (556 | ) | 776 | 220 | ||||||||||||||||||||||||||||||||||
JPM | 631 | 0 | 0 | 631 | (568 | ) | 0 | 0 | (568 | ) | 63 | 0 | 63 | |||||||||||||||||||||||||||||||||||
MBC | 62 | 0 | 0 | 62 | (6,053 | ) | 0 | 0 | (6,053 | ) | (5,991 | ) | 4,784 | (1,207 | ) | |||||||||||||||||||||||||||||||||
MYC | 0 | 0 | 0 | 0 | 0 | 0 | (403 | ) | (403 | ) | (403 | ) | 313 | (90 | ) | |||||||||||||||||||||||||||||||||
MYI | 793 | 0 | 0 | 793 | (67 | ) | 0 | 0 | (67 | ) | 726 | (553 | ) | 173 | ||||||||||||||||||||||||||||||||||
NGF | 130 | 0 | 0 | 130 | 0 | 0 | 0 | 0 | 130 | 0 | 130 | |||||||||||||||||||||||||||||||||||||
RBC | 1 | 0 | 0 | 1 | (21 | ) | 0 | 0 | (21 | ) | (20 | ) | 12 | (8 | ) | |||||||||||||||||||||||||||||||||
RYL | 952 | 0 | 0 | 952 | (30 | ) | 0 | 0 | �� | (30 | ) | 922 | (980 | ) | (58 | ) | ||||||||||||||||||||||||||||||||
SCX | 232 | 0 | 0 | 232 | (12 | ) | 0 | 0 | (12 | ) | 220 | (300 | ) | (80 | ) | |||||||||||||||||||||||||||||||||
SOG | 498 | 0 | 0 | 498 | (10,051 | ) | 0 | 0 | (10,051 | ) | (9,553 | ) | 6,883 | (2,670 | ) | |||||||||||||||||||||||||||||||||
SSB | 599 | 0 | 0 | 599 | (14 | ) | 0 | 0 | (14 | ) | 585 | (627 | ) | (42 | ) | |||||||||||||||||||||||||||||||||
TOR | 118 | 0 | 0 | 118 | (127 | ) | 0 | 0 | (127 | ) | (9 | ) | 0 | (9 | ) | |||||||||||||||||||||||||||||||||
UAG | 0 | 0 | 0 | 0 | (425 | ) | 0 | 0 | (425 | ) | (425 | ) | 267 | (158 | ) | |||||||||||||||||||||||||||||||||
Total Over the Counter | $ | 4,905 | $ | 0 | $ | 1,870 | $ | 6,775 | $ | (21,665 | ) | $ | 0 | $ | (6,900 | ) | $ | (28,565 | ) | |||||||||||||||||||||||||||||
(n) | Securities with an aggregate market value of $20,739 have been pledged as collateral for financial derivative instruments as governed by International Swaps and Derivatives Association, Inc. master agreements as of June 30, 2023. |
(1) | If the Fund is a seller of protection and a credit event occurs, as defined under the terms of that particular swap agreement, the Fund will either (i) pay to the buyer of protection an amount equal to the notional amount of the swap and take delivery of the referenced obligation or underlying securities comprising the referenced index or (ii) pay a net settlement amount in the form of cash, securities or other deliverable obligations equal to the notional amount of the swap less the recovery value of the referenced obligation or underlying securities comprising the referenced index. |
(2) | Implied credit spreads, represented in absolute terms, utilized in determining the market value of credit default swap agreements on corporate issues as of period end serve as indicators of the current status of the payment/performance risk and represent the likelihood or risk of default for the credit derivative. The implied credit spread of a particular referenced entity reflects the cost of buying/selling protection and may include upfront payments required to be made to enter into the agreement. Wider credit spreads represent a deterioration of the referenced entity’s credit soundness and a greater likelihood or risk of default or other credit event occurring as defined under the terms of the agreement. |
(3) | The maximum potential amount the Fund could be required to pay as a seller of credit protection or receive as a buyer of credit protection if a credit event occurs as defined under the terms of that particular swap agreement. |
(4) | The prices and resulting values for credit default swap agreements serve as indicators of the current status of the payment/performance risk and represent the likelihood of an expected liability (or profit) for the credit derivative should the notional amount of the swap agreement be closed/sold as of the period end. Increasing market values, in absolute terms when compared to the notional amount of the swap, represent a deterioration of the underlying referenced instrument’s credit soundness and a greater likelihood or risk of default or other credit event occurring as defined under the terms of the agreement. |
(5) | Receive represents that the Fund receives payments for any positive net return on the underlying reference. The Fund makes payments for any negative net return on such underlying reference. Pay represents that the Fund receives payments for any negative net return on the underlying reference. The Fund makes payments for any positive net return on such underlying reference. |
(6) | Net Exposure represents the net receivable/(payable) that would be due from/to the counterparty in the event of default. Exposure from OTC derivatives can only be netted across transactions governed under the same master agreement with the same legal entity. See Note 8, Master Netting Arrangements, in the Notes to Financial Statements for more information. |
94 | PIMCO CLOSED-END FUNDS | See Accompanying Notes |
| June 30, 2023 |
Derivatives not accounted for as hedging instruments | ||||||||||||||||||||||||
Commodity Contracts | Credit Contracts | Equity Contracts | Foreign Exchange Contracts | Interest Rate Contracts | Total | |||||||||||||||||||
Financial Derivative Instruments - Assets | ||||||||||||||||||||||||
Exchange-traded or centrally cleared | ||||||||||||||||||||||||
Futures | $ | 0 | $ | 0 | $ | 0 | $ | 0 | $ | 41 | $ | 41 | ||||||||||||
Swap Agreements | 0 | 135 | 0 | 0 | 2,410 | 2,545 | ||||||||||||||||||
| $ | 0 | $ | 135 | $ | 0 | $ | 0 | $ | 2,451 | $ | 2,586 | |||||||||||||
Over the counter | ||||||||||||||||||||||||
Forward Foreign Currency Contracts | $ | 0 | $ | 0 | $ | 0 | $ | 4,905 | $ | 0 | $ | 4,905 | ||||||||||||
Swap Agreements | 0 | 1,870 | 0 | 0 | 0 | 1,870 | ||||||||||||||||||
| $ | 0 | $ | 1,870 | $ | 0 | $ | 4,905 | $ | 0 | $ | 6,775 | |||||||||||||
| $ | 0 | $ | 2,005 | $ | 0 | $ | 4,905 | $ | 2,451 | $ | 9,361 | |||||||||||||
Financial Derivative Instruments - Liabilities | ||||||||||||||||||||||||
Exchange-traded or centrally cleared | ||||||||||||||||||||||||
Futures | $ | 0 | $ | 0 | $ | 0 | $ | 0 | $ | 25 | $ | 25 | ||||||||||||
Swap Agreements | 0 | 0 | 0 | 0 | 3,931 | 3,931 | ||||||||||||||||||
| $ | 0 | $ | 0 | $ | 0 | $ | 0 | $ | 3,956 | $ | 3,956 | |||||||||||||
Over the counter | ||||||||||||||||||||||||
Forward Foreign Currency Contracts | $ | 0 | $ | 0 | $ | 0 | $ | 21,665 | $ | 0 | $ | 21,665 | ||||||||||||
Swap Agreements | 0 | 6,497 | 403 | 0 | 0 | 6,900 | ||||||||||||||||||
| $ | 0 | $ | 6,497 | $ | 403 | $ | 21,665 | $ | 0 | $ | 28,565 | |||||||||||||
| $ | 0 | $ | 6,497 | $ | 403 | $ | 21,665 | $ | 3,956 | $ | 32,521 | |||||||||||||
Derivatives not accounted for as hedging instruments | ||||||||||||||||||||||||
Commodity Contracts | Credit Contracts | Equity Contracts | Foreign Exchange Contracts | Interest Rate Contracts | Total | |||||||||||||||||||
Net Realized Gain (Loss) on Financial Derivative Instruments | ||||||||||||||||||||||||
Exchange-traded or centrally cleared | ||||||||||||||||||||||||
Swap Agreements | $ | 0 | $ | 3,099 | $ | 0 | $ | 0 | $ | 75,790 | $ | 78,889 | ||||||||||||
Over the counter | ||||||||||||||||||||||||
Forward Foreign Currency Contracts | $ | 0 | $ | 0 | $ | 0 | $ | 12,747 | $ | 0 | $ | 12,747 | ||||||||||||
Swap Agreements | 0 | 1,244 | 582 | 0 | 39 | 1,865 | ||||||||||||||||||
| $ | 0 | $ | 1,244 | $ | 582 | $ | 12,747 | $ | 39 | $ | 14,612 | |||||||||||||
| $ | 0 | $ | 4,343 | $ | 582 | $ | 12,747 | $ | 75,829 | $ | 93,501 | |||||||||||||
Net Change in Unrealized Appreciation (Depreciation) on Financial Derivative Instruments | ||||||||||||||||||||||||
Exchange-traded or centrally cleared | ||||||||||||||||||||||||
Futures | $ | 0 | $ | 0 | $ | 0 | $ | 0 | $ | 5,430 | $ | 5,430 | ||||||||||||
Swap Agreements | 0 | 5,979 | 0 | 0 | (86,941 | ) | (80,962 | ) | ||||||||||||||||
| $ | 0 | $ | 5,979 | $ | 0 | $ | 0 | $ | (81,511 | ) | $ | (75,532 | ) | |||||||||||
Over the counter | ||||||||||||||||||||||||
Forward Foreign Currency Contracts | $ | 0 | $ | 0 | $ | 0 | $ | (31,522 | ) | $ | 0 | $ | (31,522 | ) | ||||||||||
Swap Agreements | 0 | 728 | (427 | ) | 0 | (509 | ) | (208 | ) | |||||||||||||||
| $ | 0 | $ | 728 | $ | (427 | ) | $ | (31,522 | ) | $ | (509 | ) | $ | (31,730 | ) | |||||||||
| $ | 0 | $ | 6,707 | $ | (427 | ) | $ | (31,522 | ) | $ | (82,020 | ) | $ | (107,262 | ) | |||||||||
| See Accompanying Notes | ANNUAL REPORT | | | JUNE 30, 2023 | 95 |
Consolidated Schedule of Investments | PIMCO Dynamic Income Fund | (Cont.) |
Category and Subcategory | Level 1 | Level 2 | Level 3 | Fair Value at 06/30/2023 | ||||||||||||
Investments in Securities, at Value | ||||||||||||||||
Loan Participations and Assignments | $ | 0 | $ | 1,132,364 | $ | 668,961 | $ | 1,801,325 | ||||||||
Corporate Bonds & Notes | ||||||||||||||||
Banking & Finance | 0 | 447,732 | 2,435 | 450,167 | ||||||||||||
Industrials | 0 | 770,459 | 1,919 | 772,378 | ||||||||||||
Utilities | 0 | 184,148 | 0 | 184,148 | ||||||||||||
Convertible Bonds & Notes | ||||||||||||||||
Banking & Finance | 0 | 8,445 | 0 | 8,445 | ||||||||||||
Industrials | 0 | 22,882 | 0 | 22,882 | ||||||||||||
Municipal Bonds & Notes | ||||||||||||||||
Michigan | 0 | 2,376 | 0 | 2,376 | ||||||||||||
Puerto Rico | 0 | 69,128 | 0 | 69,128 | ||||||||||||
West Virginia | 0 | 33,610 | 0 | 33,610 | ||||||||||||
U.S. Government Agencies | 0 | 86,137 | 0 | 86,137 | ||||||||||||
Non-Agency Mortgage-Backed Securities | 0 | 2,171,016 | 14,819 | 2,185,835 | ||||||||||||
Asset-Backed Securities | 0 | 1,199,035 | 180,530 | 1,379,565 | ||||||||||||
Sovereign Issues | 0 | 80,248 | 0 | 80,248 | ||||||||||||
Common Stocks | ||||||||||||||||
Communication Services | 15,698 | 0 | 0 | 15,698 | ||||||||||||
Consumer Discretionary | 3 | 0 | 0 | 3 | ||||||||||||
Energy | 0 | 0 | 541 | 541 | ||||||||||||
Financials | 15,670 | 0 | 40,447 | 56,117 | ||||||||||||
Industrials | 0 | 105 | 25,666 | 25,771 | ||||||||||||
Real Estate | 413 | 0 | 0 | 413 | ||||||||||||
Utilities | 0 | 0 | 12,603 | 12,603 | ||||||||||||
Rights | ||||||||||||||||
Financials | 0 | 0 | 895 | 895 | ||||||||||||
Warrants | ||||||||||||||||
Financials | 0 | 0 | 1,348 | 1,348 | ||||||||||||
Information Technology | 0 | 0 | 48,317 | 48,317 | ||||||||||||
Preferred Securities | ||||||||||||||||
Banking & Finance | 0 | 116 | 0 | 116 | ||||||||||||
Financials | 0 | 130,091 | 0 | 130,091 | ||||||||||||
Industrials | 0 | 0 | 23,548 | 23,548 | ||||||||||||
Category and Subcategory | Level 1 | Level 2 | Level 3 | Fair Value at 06/30/2023 | ||||||||||||
Real Estate Investment Trusts | ||||||||||||||||
Real Estate | $ | 30,085 | $ | 0 | $ | 0 | $ | 30,085 | ||||||||
Short-Term Instruments | ||||||||||||||||
Commercial Paper | 0 | 14,131 | 0 | 14,131 | ||||||||||||
Repurchase Agreements | 0 | 391,856 | 0 | 391,856 | ||||||||||||
Short-Term Notes | 0 | 0 | 441 | 441 | ||||||||||||
Argentina Treasury Bills | 0 | 5,362 | 0 | 5,362 | ||||||||||||
U.S. Treasury Bills | 0 | 62,096 | 0 | 62,096 | ||||||||||||
| $ | 61,869 | $ | 6,811,337 | $ | 1,022,470 | $ | 7,895,676 | |||||||||
Investments in Affiliates, at Value | ||||||||||||||||
Common Stocks | ||||||||||||||||
Affiliated Investments | 0 | 0 | 91,594 | 91,594 | ||||||||||||
Total Investments | $ | 61,869 | $ | 6,811,337 | $ | 1,114,064 | $ | 7,987,270 | ||||||||
Financial Derivative Instruments - Assets | ||||||||||||||||
Exchange-traded or centrally cleared | 0 | 2,586 | 0 | 2,586 | ||||||||||||
Over the counter | 0 | 5,823 | 952 | 6,775 | ||||||||||||
| $ | 0 | $ | 8,409 | $ | 952 | $ | 9,361 | |||||||||
Financial Derivative Instruments - Liabilities | ||||||||||||||||
Exchange-traded or centrally cleared | 0 | (3,956 | ) | 0 | (3,956 | ) | ||||||||||
Over the counter | 0 | (21,706 | ) | (6,859 | ) | (28,565 | ) | |||||||||
| $ | 0 | $ | (25,662 | ) | $ | (6,859 | ) | $ | (32,521 | ) | ||||||
Total Financial Derivative Instruments | $ | 0 | $ | (17,253 | ) | $ | (5,907 | ) | $ | (23,160 | ) | |||||
Totals | $ | 61,869 | $ | 6,794,084 | $ | 1,108,157 | $ | 7,964,110 | ||||||||
Category and Subcategory | Beginning Balance at 06/30/2022 | Net Purchases (1) | Net Sales/ Settlements (1) | Accrued Discounts/ (Premiums) | Realized Gain/(Loss) | Net Change in Unrealized Appreciation/ (Depreciation) (2) | Transfers into Level 3 | Transfers out of Level 3 | Ending Balance at 06/30/2023 | Net Change in Unrealized Appreciation/ (Depreciation) on Investments Held at 06/30/2023 (2) | ||||||||||||||||||||||||||||||
Investments in Securities, at Value | ||||||||||||||||||||||||||||||||||||||||
Loan Participations and Assignments | $ | 560,306 | $ | 460,331 | $ | (226,297 | ) | $ | 6,359 | $ | (61,682 | ) | $ | 20,271 | $ | 28,000 | $ | (118,327 | ) | $ | 668,961 | $ | (5,379 | ) | ||||||||||||||||
Corporate Bonds & Notes | ||||||||||||||||||||||||||||||||||||||||
Banking & Finance | 40,468 | 2,381 | (39,204 | ) | 2 | 2,904 | (4,116 | ) | 0 | 0 | 2,435 | 52 | ||||||||||||||||||||||||||||
Industrials | 258,893 | 4,535 | (508 | ) | 962 | (16 | ) | (22,438 | ) | 0 | (239,509 | ) | 1,919 | (63 | ) | |||||||||||||||||||||||||
Non-Agency Mortgage-Backed Securities | 9,526 | 0 | (5,047 | ) | 2 | (204 | ) | 371 | 10,171 | 0 | 14,819 | 122 | ||||||||||||||||||||||||||||
Asset-Backed Securities | 303,604 | 1,598 | (25,258 | ) | 660 | (26,680 | ) | (72,467 | ) | 2,427 | (3,354 | ) | 180,530 | (88,290 | ) | |||||||||||||||||||||||||
Common Stocks | ||||||||||||||||||||||||||||||||||||||||
Energy | 280 | 0 | 0 | 0 | 0 | 261 | 0 | 0 | 541 | 261 | ||||||||||||||||||||||||||||||
Financials | 49,040 | 0 | 0 | 0 | 0 | (8,593 | ) | 0 | 0 | 40,447 | (8,593 | ) | ||||||||||||||||||||||||||||
Industrials | 15,352 | 8,953 | (1,868 | ) | 0 | (59 | ) | 3,415 | 0 | (127 | ) | 25,666 | 1,753 | |||||||||||||||||||||||||||
Materials | 2,646 | 0 | (2,897 | ) | 0 | 2,897 | (2,646 | ) | 0 | 0 | 0 | 0 | ||||||||||||||||||||||||||||
Utilities | 11,252 | 0 | 0 | 0 | 0 | 1,351 | 0 | 0 | 12,603 | 1,350 | ||||||||||||||||||||||||||||||
Rights | ||||||||||||||||||||||||||||||||||||||||
Financials | 895 | 0 | 0 | 0 | 0 | 0 | 0 | 0 | 895 | 0 | ||||||||||||||||||||||||||||||
Warrants | ||||||||||||||||||||||||||||||||||||||||
Financials | 951 | 0 | 0 | 0 | 0 | 397 | 0 | 0 | 1,348 | 397 | ||||||||||||||||||||||||||||||
Industrials | 1,682 | 0 | (339 | ) | 0 | 339 | (1,682 | ) | 0 | 0 | 0 | 0 | ||||||||||||||||||||||||||||
Information Technology | 67,297 | 0 | 0 | 0 | 0 | (18,980 | ) | 0 | 0 | 48,317 | (18,979 | ) | ||||||||||||||||||||||||||||
96 | PIMCO CLOSED-END FUNDS | See Accompanying Notes |
| June 30, 2023 |
Category and Subcategory | Beginning Balance at 06/30/2022 | Net Purchases (1) | Net Sales/ Settlements (1) | Accrued Discounts/ (Premiums) | Realized Gain/(Loss) | Net Change in Unrealized Appreciation/ (Depreciation) (2) | Transfers into Level 3 | Transfers out of Level 3 | Ending Balance at 06/30/2023 | Net Change in Unrealized Appreciation/ (Depreciation) on Investments Held at 06/30/2023 (2) | ||||||||||||||||||||||||||||||
Preferred Securities | ||||||||||||||||||||||||||||||||||||||||
Industrials | $ | 132,091 | $ | 0 | $ | (121,967 | ) | $ | 0 | $ | 69,836 | $ | (56,412 | ) | $ | 0 | $ | 0 | $ | 23,548 | $ | (5,982 | ) | |||||||||||||||||
Utilities | 33,921 | 0 | (33,577 | ) | 0 | (2,561 | ) | 2,217 | 0 | 0 | 0 | 0 | ||||||||||||||||||||||||||||
Short-Term Instruments | ||||||||||||||||||||||||||||||||||||||||
Short-Term Notes | 0 | 419 | 0 | 0 | 0 | 22 | 0 | 0 | 441 | 22 | ||||||||||||||||||||||||||||||
| $ | 1,488,204 | $ | 478,217 | $ | (456,962 | ) | $ | 7,985 | $ | (15,226 | ) | $ | (159,029 | ) | $ | 40,598 | $ | (361,317 | ) | $ | 1,022,470 | $ | (123,329 | ) | ||||||||||||||||
Investments in Affiliates | ||||||||||||||||||||||||||||||||||||||||
Common Stocks | ||||||||||||||||||||||||||||||||||||||||
Affiliated Investments | $ | 104,203 | $ | 0 | $ | 0 | $ | 0 | $ | 0 | $ | (12,609 | ) | $ | 0 | $ | 0 | $ | 91,594 | $ | (12,609 | ) | ||||||||||||||||||
Financial Derivative Instruments- Assets | ||||||||||||||||||||||||||||||||||||||||
Over the counter | $ | 0 | $ | 0 | $ | 0 | $ | 0 | $ | 0 | $ | 952 | $ | 0 | $ | 0 | $ | 952 | $ | 952 | ||||||||||||||||||||
Financial Derivative Instruments- Liabilities | ||||||||||||||||||||||||||||||||||||||||
Over the counter | $ | 605 | $ | 0 | $ | 0 | $ | 0 | $ | 0 | $ | (1,002 | ) | $ | (6,462 | ) | $ | 0 | $ | (6,859 | ) | $ | (1,002 | ) | ||||||||||||||||
Totals | $ | 1,593,012 | $ | 478,217 | $ | (456,962 | ) | $ | 7,985 | $ | (15,226 | ) | $ | (171,688 | ) | $ | 34,136 | $ | (361,317 | ) | $ | 1,108,157 | $ | (135,998 | ) | |||||||||||||||
Category and Subcategory | Ending Balance at 06/30/2023 | Valuation Technique | Unobservable Inputs | (% Unless Noted Otherwise) | ||||||||||||||
Input Value(s) | Weighted Average | |||||||||||||||||
Investments in Securities, at Value | ||||||||||||||||||
Loan Participations and Assignments | $ | 96,157 | Comparable Multiple | EBITDA Multiple | X | 11.000 | — | |||||||||||
| 698 | Comparable Multiple | Revenue Multiple | X | 0.675 | — | |||||||||||||
| 166,937 | Discounted Cash Flow | Discounted Rate | 6.540-14.587 | 10.042 | ||||||||||||||
| 42,212 | Discounted Cash Flow | Discounted Spread | 8.250 | — | ||||||||||||||
| 154 | Discounted Cash Flow | Discounted Cash Flow | 15.420 | — | ||||||||||||||
| 8 | Expected Recovery | Price Recovery Rate | 100.000 | — | ||||||||||||||
| 72,174 | Expect Recovery Valuation | Comparable Bond Price | 60.000 | — | ||||||||||||||
| 851 | Indicative Market Quotation | Price | 7.123 | — | ||||||||||||||
| 10,785 | Other Valuation Techniques (3) | — | — | — | ||||||||||||||
| 30,591 | Proxy Pricing | Base Price | 100.000-100.523 | 100.285 | ||||||||||||||
| 55,501 | Recent Transaction | Price | 98.000 | — | ||||||||||||||
| 88,197 | Recent Transaction | Purchase Price | 97.500-100.000 | 99.494 | ||||||||||||||
| 21,232 | Reference Instruments | Third Party Vendor | 42.000 | — | ||||||||||||||
| 83,464 | Third Party Vendor | Broker Quote | 90.750-98.750 | 96.269 | ||||||||||||||
Corporate Bonds & Notes | ||||||||||||||||||
Banking & Finance | 2,435 | Other Valuation Techniques (3) | — | — | — | |||||||||||||
Industrials | 1,919 | Discounted Cash Flow | Discount Rate | 5.913 | — | |||||||||||||
Non-Agency Mortgage-Backed Securities | 4,648 | Discounted Cash Flow | Discount Rate | 9.250 | — | |||||||||||||
| 8,285 | Fair Valuation of Odd Lot Positions | Adjustment Factor | 2.500 | — | ||||||||||||||
| 1,886 | Proxy Pricing | Base Price | 92.173 | — | ||||||||||||||
Asset-Backed Securities | 178,085 | Discounted Cash Flow | Discount Rate | 10.000-25.000 | 16.244 | |||||||||||||
| 18 | Expected Recovery | Discount Rate | 2.080 | — | ||||||||||||||
| 2,427 | Fair Valuation of Odd Lot Positions | Adjustment Factor | 2.500 | — | ||||||||||||||
Common Stocks | ||||||||||||||||||
Energy | 27 | Comparable Multiple | EBITDA Multiple | X | 6.600 | — | ||||||||||||
| 514 | Comparable Multiple | LTM EBITDA Multiple | X | 3.300 | — | |||||||||||||
Financials | 40,282 | Indicative Market Quotation | Broker Quote | $ | 23.000 | — | ||||||||||||
| 165 | Option Pricing Model | Volatility | 56.314 | — | ||||||||||||||
Industrials | 16,010 | Discounted Cash Flow | Discount Rate | 14.975 | — | |||||||||||||
| 2,986 | Indicative Market Quotation | Broker Quote | $ | 19.500 | — | |||||||||||||
| 5,073 | Other Valuation Techniques (3) | — | — | — | ||||||||||||||
| 1,597 | Recent Transaction | Purchase Price | $ | 6.625 | — | |||||||||||||
Utilities | 12,603 | Indicative Market Quotation | Broker Quote | $ | 28.000 | — | ||||||||||||
Rights | ||||||||||||||||||
Financials | 895 | Indicative Market Quotation | Broker Quote | $ | 4.750 | — | ||||||||||||
Warrants | ||||||||||||||||||
Financials | 1,348 | Indicative Market Quotation | Broker Quote | $ | 0.750-7.250 | 7.161 | ||||||||||||
Information Technology | 48,317 | Comparable Multiple | EBITDA Multiple | X | 4.590 | — | ||||||||||||
| See Accompanying Notes | ANNUAL REPORT | | | JUNE 30, 2023 | 97 |
Consolidated Schedule of Investments | PIMCO Dynamic Income Fund | (Cont.) | June 30, 2023 |
Category and Subcategory | Ending Balance at 06/30/2023 | Valuation Technique | Unobservable Inputs | (% Unless Noted Otherwise) | ||||||||||||||
Input Value(s) | Weighted Average | |||||||||||||||||
Preferred Securities | ||||||||||||||||||
Industrials | $ | 23,548 | Comparable Multiple/ Discounted Cash Flow | Book Value Multiple/ Discount Rate | X/% | 0.350/27.749 | — | |||||||||||
Short-Term Instruments | ||||||||||||||||||
Short-Term Notes | 441 | Proxy Pricing | Base Price | 100.868 | — | |||||||||||||
Investments in Affiliates | ||||||||||||||||||
Common Stocks | ||||||||||||||||||
Consumer Discretionary | 91,591 | Comparable Multiple/ Discounted Cash Flow | LTM Revenue Forward EBITDA/ Discount Rate | X/X/% | 0.550/6.010/9.750 | — | ||||||||||||
Industrials | 3 | Expected Recovery | Price | 0.000 | (4) | — | ||||||||||||
Financial Derivative Instruments- Assets | ||||||||||||||||||
Over the counter | 952 | Indicative Market Quotation | Broker Quote | 3.092 | — | |||||||||||||
Financial Derivative Instruments- Liabilities | ||||||||||||||||||
Over the counter | (403 | ) | Indicative Market Quotation | Broker Quote | (4.884 | ) | — | |||||||||||
| (6,456 | ) | Other Valuation Techniques (3) | — | — | — | |||||||||||||
Total | $ | 1,108,157 | ||||||||||||||||
(1) | Net Purchases and Settlements for Financial Derivative Instruments may include payments made or received upon entering into swap agreements to compensate for differences between the stated terms of the swap agreement and prevailing market conditions. |
(2) | Any difference between Net Change in Unrealized Appreciation/(Depreciation) and Net Change in Unrealized Appreciation/(Depreciation) on Investments Held at June 30, 2023 may be due to an investment no longer held or categorized as Level 3 at period end. |
(3) | Includes valuation techniques not defined in the Notes to Financial Statements as securities valued using such techniques are not considered significant to the Fund. |
(4) | Input Value is 0.0001. |
98 | PIMCO CLOSED-END FUNDS | See Accompanying Notes |
Consolidated Schedule of Investments | PIMCO Dynamic Income Opportunities Fund | June 30, 2023 |
PRINCIPAL AMOUNT (000S) | MARKET VALUE (000S) | |||||||||||
INVESTMENTS IN SECURITIES 171.5% | ||||||||||||
LOAN PARTICIPATIONS AND ASSIGNMENTS 41.2% | ||||||||||||
AP Core Holdings LLC | ||||||||||||
10.717% due 09/01/2027 | $ | 2,668 | $ | 2,576 | ||||||||
Carnival Corp. | ||||||||||||
7.168% (EUR001M + 3.750%) due 06/30/2025 ~ | EUR | 276 | 300 | |||||||||
Comexposium | ||||||||||||
4.969% (EUR012M + 4.000%) due 03/28/2026 ~ | 21,515 | 20,190 | ||||||||||
Cromwell EREIT Lux Finco SARL | ||||||||||||
4.761% (EUR003M + 1.500%) due 11/21/2024 «~ | 6,800 | 6,961 | ||||||||||
Diamond Sports Group LLC | ||||||||||||
13.064% due 05/25/2026 | $ | 19,161 | 14,832 | |||||||||
Envision Healthcare Corp. | ||||||||||||
16.070% due 04/29/2027 | 24,285 | 28,959 | ||||||||||
16.695% due 04/28/2028 « | 56,805 | 42,972 | ||||||||||
Espai Barca Fondo De Titulizacion | ||||||||||||
TBD% due 05/31/2028 « | EUR | 7,400 | 7,994 | |||||||||
Gateway Casinos & Entertainment Ltd. | ||||||||||||
13.050% due 10/18/2027 | CAD | 10,011 | 7,562 | |||||||||
13.221% due 10/15/2027 | $ | 45,888 | 45,917 | |||||||||
Gibson Brands, Inc. | ||||||||||||
10.248% (LIBOR03M + 5.000%) due 08/11/2028 ~ | 6,206 | 5,026 | ||||||||||
Incora | ||||||||||||
TBD% - 13.725% due 03/01/2024 «µ | 20,573 | 20,573 | ||||||||||
Instant Brands Holdings, Inc. | ||||||||||||
TBD% (LIBOR03M + 0.000%) due 04/12/2028 ^~(c) | 18,105 | 3,944 | ||||||||||
15.217% due 12/12/2023 « | 7,038 | 6,510 | ||||||||||
Intelsat Jackson Holdings SA | ||||||||||||
9.443% due 02/01/2029 | 12,084 | 12,051 | ||||||||||
LifeMiles Ltd. | ||||||||||||
10.514% (LIBOR03M + 5.250%) due 08/30/2026 «~ | 6,220 | 6,142 | ||||||||||
Market Bidco Ltd. | ||||||||||||
8.991% due 11/04/2027 | GBP | 22,078 | 24,639 | |||||||||
NAC Aviation 29 DAC | ||||||||||||
7.501% due 06/30/2026 | $ | 19,821 | 17,630 | |||||||||
Obol France 3 SAS | ||||||||||||
8.040% (EUR001M + 4.750%) due 12/31/2025 ~ | EUR | 7,000 | 6,995 | |||||||||
Oi SA | ||||||||||||
TBD% - 14.000% due 09/07/2024 µ | $ | 12,430 | 12,430 | |||||||||
1.750% (LIBOR06M + 1.750%) due 02/26/2035 ~ | 29,964 | 2,166 | ||||||||||
Poseidon Bidco SASU | ||||||||||||
8.848% (EUR003M + 5.250%) due 07/14/2028 «~ | EUR | 9,500 | 10,159 | |||||||||
Profrac Services LLC | ||||||||||||
12.753% due 03/04/2025 | $ | 11,257 | 11,300 | |||||||||
Project Quasar Pledgco SLU | ||||||||||||
6.578% (EUR001M + 3.250%) due 03/15/2026 «~ | EUR | 10,074 | 10,586 | |||||||||
Promotora de Informaciones SA | ||||||||||||
8.439% (EUR003M + 5.220%) due 12/31/2026 ~ | 29,650 | 30,467 | ||||||||||
Promotora de Informaciones SA (6.189% Cash and 5.000% PIK) | ||||||||||||
11.189% (EUR003M + 2.970%) due 06/30/2027 «~(b) | 5,330 | 5,293 | ||||||||||
Quantum Bidco Ltd. | ||||||||||||
9.879% due 01/29/2028 | GBP | 20,000 | 22,873 | |||||||||
Republic of Cote d’lvoire | ||||||||||||
7.985% (EUR006M + 5.000%) due 03/19/2027 «~ | EUR | 800 | 851 | |||||||||
SCUR-Alpha 1503 GmbH | ||||||||||||
8.918% - 9.087% (EUR001M + 5.500%) due 03/29/2030 ~ | 5,200 | 5,425 | ||||||||||
10.602% due 03/28/2030 | $ | 7,980 | 7,571 | |||||||||
PRINCIPAL AMOUNT (000S) | MARKET VALUE (000S) | |||||||||||
Softbank Vision Fund | ||||||||||||
5.000% due 12/21/2025 « | $ | 25,857 | $ | 24,205 | ||||||||
Steenbok Lux Finco 2 SARL | ||||||||||||
10.000% due 06/30/2026 « | EUR | 71,680 | 45,829 | |||||||||
Sunseeker | ||||||||||||
TBD% - 10.872% (LIBOR06M + 5.500%) due 10/31/2028 «~ | $ | 22,100 | 20,941 | |||||||||
Syniverse Holdings, Inc. | ||||||||||||
12.242% due 05/13/2027 | 47,746 | 43,912 | ||||||||||
Team Health Holdings, Inc. | ||||||||||||
7.943% (LIBOR01M + 2.750%) due 02/06/2024 ~ | 10,311 | 9,170 | ||||||||||
Telemar Norte Leste SA | ||||||||||||
1.750% (LIBOR06M + 1.750%) due 02/26/2035 ~ | 3,866 | 280 | ||||||||||
1.750% due 02/26/2035 | 2,363 | 171 | ||||||||||
U.S. Renal Care, Inc. | ||||||||||||
10.193% (LIBOR01M + 5.000%) due 06/26/2026 ~ | 30,176 | 14,158 | ||||||||||
10.193% (LIBOR01M + 5.500%) due 06/26/2026 ~ | 5,590 | 2,622 | ||||||||||
Viad Corp. | ||||||||||||
10.217% due 07/30/2028 | 1,104 | 1,077 | ||||||||||
Windstream Services LLC | ||||||||||||
9.202% due 02/23/2027 « | 16,810 | 16,390 | ||||||||||
Total Loan Participations and Assignments (Cost $654,350) | 579,649 | |||||||||||
CORPORATE BONDS & NOTES 36.2% | ||||||||||||
BANKING & FINANCE 14.1% | ||||||||||||
ADLER Real Estate AG | ||||||||||||
3.000% due 04/27/2026 | EUR | 15,900 | 13,501 | |||||||||
Agps Bondco PLC | ||||||||||||
4.625% due 01/14/2026 ^(c) | 13,000 | 5,535 | ||||||||||
5.000% due 04/27/2027 ^(c) | 1,800 | 697 | ||||||||||
6.000% due 08/05/2025 ^(c) | 3,800 | 1,814 | ||||||||||
Banca Monte dei Paschi di Siena SpA | ||||||||||||
1.875% due 01/09/2026 | 20,927 | 20,337 | ||||||||||
2.625% due 04/28/2025 | 7,000 | 7,171 | ||||||||||
7.677% due 01/18/2028 • | 6,500 | 5,977 | ||||||||||
8.000% due 01/22/2030 • | 1,603 | 1,573 | ||||||||||
10.500% due 07/23/2029 | 16,766 | 18,195 | ||||||||||
Claveau Re Ltd. | ||||||||||||
22.523% (T-BILL 3MO + 17.250%) due 07/08/2028 ~(k) | $ | 3,400 | 1,666 | |||||||||
Corsair International Ltd. | ||||||||||||
7.772% due 01/28/2027 • | EUR | 1,700 | 1,846 | |||||||||
8.122% due 01/28/2029 • | 1,100 | 1,191 | ||||||||||
Credit Suisse AG AT1 Claim ^ | $ | 800 | 32 | |||||||||
Fairfax India Holdings Corp. | ||||||||||||
5.000% due 02/26/2028 (k) | 18,350 | 15,873 | ||||||||||
FloodSmart Re Ltd. | ||||||||||||
18.858% (T-BILL 3MO + 13.000%) due 03/01/2024 ~ (k) | 3,920 | 3,685 | ||||||||||
22.608% (T-BILL 3MO + 16.750%) due 03/01/2024 ~ (k) | 1,120 | 926 | ||||||||||
Hestia Re Ltd. | ||||||||||||
14.768% (T-BILL 1MO + 9.500%) due 04/22/2025 ~ | 2,347 | 2,030 | ||||||||||
Jefferson Capital Holdings LLC | ||||||||||||
6.000% due 08/15/2026 (k) | 4,680 | 3,808 | ||||||||||
Sanders Re Ltd. | ||||||||||||
17.018% (T-BILL 3MO + 11.750%) due 04/09/2029 ~ | 4,164 | 3,917 | ||||||||||
SVB Financial Group | ||||||||||||
1.800% due 02/02/2031 ^(c) | 3,175 | 2,019 | ||||||||||
2.100% due 05/15/2028 ^(c) | 400 | 272 | ||||||||||
3.125% due 06/05/2030 ^(c) | 500 | 330 | ||||||||||
3.500% due 01/29/2025 ^(c) | 200 | 145 | ||||||||||
PRINCIPAL AMOUNT (000S) | MARKET VALUE (000S) | |||||||||||
4.345% due 04/29/2028 ^(c) | $ | 1,300 | $ | 912 | ||||||||
4.570% due 04/29/2033 ^(c) | 4,000 | 2,685 | ||||||||||
UBS Group AG | ||||||||||||
2.250% due 06/09/2028 • | GBP | 100 | 105 | |||||||||
3.091% due 05/14/2032 •(k) | $ | 500 | 405 | |||||||||
4.194% due 04/01/2031 • (k) | 500 | 445 | ||||||||||
6.537% due 08/12/2033 •(k) | 250 | 256 | ||||||||||
7.750% due 03/01/2029 • | EUR | 400 | 484 | |||||||||
Uniti Group LP | ||||||||||||
6.000% due 01/15/2030 (k) | $ | 21,202 | 14,385 | |||||||||
6.500% due 02/15/2029 (k) | 26,904 | 19,067 | ||||||||||
10.500% due 02/15/2028 (k) | 6,343 | 6,298 | ||||||||||
Veraison Re Ltd. | ||||||||||||
17.278% (T-BILL 1MO + 12.000%) due 03/10/2031 ~ | 1,600 | 1,703 | ||||||||||
Voyager Aviation Holdings LLC | ||||||||||||
8.500% due 05/09/2026 (k) | 49,287 | 38,937 | ||||||||||
| 198,222 | ||||||||||||
INDUSTRIALS 19.9% | ||||||||||||
Altice Financing SA | ||||||||||||
5.750% due 08/15/2029 (k) | 5,253 | 4,075 | ||||||||||
American Airlines Pass-Through Trust | ||||||||||||
3.700% due 04/01/2028 (k) | 1,931 | 1,739 | ||||||||||
Carvana Co. | ||||||||||||
10.250% due 05/01/2030 | 7,400 | 5,839 | ||||||||||
CGG SA | ||||||||||||
7.750% due 04/01/2027 | EUR | 3,800 | 3,487 | |||||||||
8.750% due 04/01/2027 (k) | $ | 19,353 | 16,230 | |||||||||
DISH DBS Corp. | ||||||||||||
5.250% due 12/01/2026 (k) | 5,630 | 4,527 | ||||||||||
DISH Network Corp. | ||||||||||||
11.750% due 11/15/2027(k) | 7,400 | 7,230 | ||||||||||
Intelsat Jackson Holdings SA | ||||||||||||
6.500% due 03/15/2030 (k) | 48,922 | 44,659 | ||||||||||
Iris Holdings, Inc. (8.750% Cash or 9.500% PIK) | ||||||||||||
8.750% due 02/15/2026 (b)(k) | 18,158 | 17,300 | ||||||||||
Market Bidco Finco PLC | ||||||||||||
4.750% due 11/04/2027 | EUR | 2,300 | 2,027 | |||||||||
Newfold Digital Holdings Group, Inc. | ||||||||||||
6.000% due 02/15/2029(k) | $ | 10,800 | 8,117 | |||||||||
Times Square Hotel Trust | ||||||||||||
8.528% due 08/01/2026 | 402 | 397 | ||||||||||
Turkish Airlines Pass-Through Trust | ||||||||||||
4.200% due 09/15/2028 | 250 | 230 | ||||||||||
U.S. Renal Care, Inc. | ||||||||||||
10.625% due 07/15/2027 | 20,402 | 5,202 | ||||||||||
Vale SA | ||||||||||||
3.202% due 12/29/2049 ~(h) | BRL | 340,000 | 21,824 | |||||||||
Veritas US, Inc. | ||||||||||||
7.500% due 09/01/2025(k) | $ | 22,099 | 17,963 | |||||||||
Wesco Aircraft Holdings, Inc. (7.500% Cash and 3.000% PIK) | ||||||||||||
10.500% due 11/15/2026 ^(b)(c) | 83,934 | 76,380 | ||||||||||
Windstream Escrow LLC | ||||||||||||
7.750% due 08/15/2028(k) | 51,680 | 42,945 | ||||||||||
| 280,171 | ||||||||||||
UTILITIES 2.2% | ||||||||||||
Adler Financing SARL | ||||||||||||
12.500% due 06/30/2025(k) | EUR | 5,980 | 6,698 | |||||||||
Eskom Holdings SOC Ltd. | ||||||||||||
6.750% due 08/06/2023 | $ | 4,200 | 4,188 | |||||||||
Gazprom PJSC via Gaz Finance PLC | ||||||||||||
3.000% due 06/29/2027 | 200 | 145 | ||||||||||
NGD Holdings BV | ||||||||||||
6.750% due 12/31/2026 | 1,113 | 818 | ||||||||||
Oi SA | ||||||||||||
10.000% due 07/27/2025 ^(c) | 64,741 | 4,681 | ||||||||||
Pacific Gas & Electric Co. | ||||||||||||
4.450% due 04/15/2042(k) | 448 | 340 | ||||||||||
| See Accompanying Notes | ANNUAL REPORT | | | JUNE 30, 2023 | 99 |
Consolidated Schedule of Investments | PIMCO Dynamic Income Opportunities Fund | (Cont.) |
PRINCIPAL AMOUNT (000S) | MARKET VALUE (000S) | |||||||||||
Peru LNG SRL | ||||||||||||
5.375% due 03/22/2030 | $ | 16,625 | $ | 13,397 | ||||||||
| 30,267 | ||||||||||||
Total Corporate Bonds & Notes (Cost $645,961) | 508,660 | |||||||||||
CONVERTIBLE BONDS & NOTES 1.8% | ||||||||||||
BANKING & FINANCE 1.6% | ||||||||||||
Corestate Capital Holding SA | ||||||||||||
1.375% due 07/31/2023 ^(c) | EUR | 7,300 | 1,159 | |||||||||
PennyMac Corp. | ||||||||||||
5.500% due 03/15/2026 (k) | $ | 24,225 | 21,621 | |||||||||
| 22,780 | ||||||||||||
INDUSTRIALS 0.2% | ||||||||||||
DISH Network Corp. | ||||||||||||
3.375% due 08/15/2026 (k) | 3,700 | 1,896 | ||||||||||
Total Convertible Bonds & Notes (Cost $36,581) | 24,676 | |||||||||||
MUNICIPAL BONDS & NOTES 1.8% | ||||||||||||
PUERTO RICO 1.6% | ||||||||||||
Commonwealth of Puerto Rico Bonds, Series 2022 | ||||||||||||
0.000% due 11/01/2043(k) | 17,178 | 8,675 | ||||||||||
0.000% due 11/01/2051 | 29,682 | 13,935 | ||||||||||
| 22,610 | ||||||||||||
WEST VIRGINIA 0.2% | ||||||||||||
Tobacco Settlement Finance Authority, West Virginia Revenue Bonds, Series 2007 | ||||||||||||
0.000% due 06/01/2047 (f) | 25,000 | 2,364 | ||||||||||
Total Municipal Bonds & Notes (Cost $27,075) | 24,974 | |||||||||||
U.S. GOVERNMENT AGENCIES 1.8% | ||||||||||||
Fannie Mae | ||||||||||||
2.500% due 04/25/2049 - 02/25/2050 (a)(k) | 22,833 | 3,047 | ||||||||||
3.000% due 12/25/2032 - 01/25/2051 (a)(k) | 13,049 | 1,995 | ||||||||||
3.500% due 05/25/2030 (a)(k) | 4,537 | 288 | ||||||||||
4.000% due 09/25/2051 (a)(k) | 25,065 | 5,468 | ||||||||||
4.500% due 07/25/2045 (a)(k) | 2,446 | 485 | ||||||||||
5.000% due 08/25/2043 (a)(k) | 2,736 | 528 | ||||||||||
Freddie Mac | ||||||||||||
0.807% due 07/15/2042 •(a)(k) | 1,885 | 169 | ||||||||||
1.007% due 03/15/2043 - 11/15/2047 •(a)(k) | 9,144 | 646 | ||||||||||
2.000% due 11/25/2050 - 01/25/2051 (a)(k) | 19,394 | 1,735 | ||||||||||
3.000% due 11/25/2050 - 09/25/2051 (a)(k) | 46,723 | 6,801 | ||||||||||
3.500% due 04/25/2041 (a)(k) | 9,003 | 1,160 | ||||||||||
4.000% due 11/25/2048 - 06/25/2051 (a)(k) | 14,744 | 2,792 | ||||||||||
4.500% due 12/25/2050 (a)(k) | 4,461 | 776 | ||||||||||
Total U.S. Government Agencies (Cost $24,782) | 25,890 | |||||||||||
NON-AGENCY MORTGAGE-BACKED SECURITIES 53.7% | ||||||||||||
280 Park Avenue Mortgage Trust | ||||||||||||
8.009% due 09/15/2034 •(k) | 4,750 | 3,961 | ||||||||||
Ashford Hospitality Trust | ||||||||||||
7.419% due 04/15/2035 •(k) | 2,500 | 2,404 | ||||||||||
8.419% due 04/15/2035 •(k) | 8,700 | 8,290 | ||||||||||
Atrium Hotel Portfolio Trust | ||||||||||||
8.493% due 12/15/2036 •(k) | 1,111 | 981 | ||||||||||
8.843% due 06/15/2035 •(k) | 11,037 | 10,293 | ||||||||||
PRINCIPAL AMOUNT (000S) | MARKET VALUE (000S) | |||||||||||
Austin Fairmont Hotel Trust | ||||||||||||
7.443% due 09/15/2032 •(k) | $ | 4,900 | $ | 4,806 | ||||||||
Banc of America Funding Trust | ||||||||||||
2.697% due 09/26/2036 ~(k) | 4,471 | 3,267 | ||||||||||
5.390% due 06/26/2036 •(k) | 3,356 | 2,714 | ||||||||||
5.750% due 05/26/2036 « | 330 | 219 | ||||||||||
Barclays Commercial Mortgage Securities Trust | ||||||||||||
3.811% due 02/15/2053 ~(k) | 15,650 | 10,437 | ||||||||||
8.743% due 07/15/2037 •(k) | 4,278 | 4,046 | ||||||||||
Barclays Commercial Real Estate Trust | ||||||||||||
4.715% due 08/10/2033 ~(k) | 16,650 | 12,432 | ||||||||||
Bear Stearns Commercial Mortgage Securities Trust | ||||||||||||
5.566% due 01/12/2045 ~ | 42 | 40 | ||||||||||
Beast Mortgage Trust | ||||||||||||
8.643% due 03/15/2036 •(k) | 5,750 | 4,151 | ||||||||||
9.643% due 03/15/2036 •(k) | 7,125 | 4,878 | ||||||||||
Beneria Cowen & Pritzer Collateral Funding Corp. | ||||||||||||
7.685% due 06/15/2038 •(k) | 10,000 | 7,919 | ||||||||||
8.831% due 06/15/2038 •(k) | 5,000 | 3,677 | ||||||||||
Braemar Hotels & Resorts Trust | ||||||||||||
7.718% due 06/15/2035 •(k) | 7,900 | 7,189 | ||||||||||
Citigroup Commercial Mortgage Trust | ||||||||||||
3.635% due 05/10/2035 ~(k) | 1,300 | 1,097 | ||||||||||
3.917% due 12/15/2072 ~(k) | 4,600 | 2,582 | ||||||||||
8.118% due 12/15/2036 •(k) | 8,811 | 8,428 | ||||||||||
Citigroup Mortgage Loan Trust | ||||||||||||
3.938% due 08/25/2036 ~(k) | 1,386 | 1,225 | ||||||||||
Colony Mortgage Capital Ltd. | ||||||||||||
7.982% due 11/15/2038 •(k) | 15,000 | 13,811 | ||||||||||
Commercial Mortgage Trust | ||||||||||||
6.593% due 06/15/2034 •(k) | 2,300 | 2,027 | ||||||||||
6.843% due 06/15/2034 •(k) | 4,950 | 4,267 | ||||||||||
7.687% due 06/15/2034 •(k) | 7,400 | 5,702 | ||||||||||
Connecticut Avenue Securities Trust | ||||||||||||
7.817% due 12/25/2041 •(k) | 4,300 | 4,188 | ||||||||||
Countrywide Alternative Loan Trust | ||||||||||||
6.250% due 12/25/2036(k) | 4,586 | 2,089 | ||||||||||
Credit Suisse Mortgage Capital Trust | ||||||||||||
3.987% due 01/25/2060 | 8,144 | 5,638 | ||||||||||
8.493% due 07/15/2032 •(k) | 19,982 | 18,216 | ||||||||||
CRSNT Commercial Mortgage Trust | ||||||||||||
8.700% due 04/15/2036 •(k) | 7,000 | 5,843 | ||||||||||
DBWF Mortgage Trust | ||||||||||||
8.264% due 12/19/2030 •(k) | 29,075 | 28,409 | ||||||||||
Deutsche Mortgage & Asset Receiving Corp. | ||||||||||||
3.746% due 11/27/2036 •(k) | 6,337 | 5,464 | ||||||||||
DOLP Trust | ||||||||||||
0.665% due 05/10/2041 ~(a)(k) | 309,500 | 11,763 | ||||||||||
3.704% due 05/10/2041 ~(k) | 32,400 | 15,612 | ||||||||||
DROP Mortgage Trust | ||||||||||||
7.943% due 10/15/2043 •(k) | 5,500 | 4,714 | ||||||||||
Extended Stay America Trust | ||||||||||||
8.894% due 07/15/2038 •(k) | 18,118 | 17,272 | ||||||||||
Freddie Mac | ||||||||||||
8.817% due 02/25/2042 •(k) | 8,400 | 8,466 | ||||||||||
9.817% due 02/25/2042 •(k) | 2,600 | 2,594 | ||||||||||
10.567% due 01/25/2034 •(k) | 4,000 | 3,626 | ||||||||||
12.567% due 10/25/2041 •(k) | 22,000 | 21,978 | ||||||||||
13.567% due 02/25/2042 •(k) | 1,200 | 1,206 | ||||||||||
GCT Commercial Mortgage Trust | ||||||||||||
8.543% due 02/15/2038 •(k) | 49,700 | 22,802 | ||||||||||
Greenwood Park CLO Ltd. | ||||||||||||
0.000% due 10/20/2030 « | 13,000 | 89 | ||||||||||
0.000% due 04/15/2031 « | 27,000 | 188 | ||||||||||
GS Mortgage Securities Corp. Trust | ||||||||||||
7.743% due 11/15/2032 •(k) | 10,782 | 10,426 | ||||||||||
GS Mortgage-Backed Securities Corp. Trust | ||||||||||||
0.000% due 12/25/2060 ~ | 178 | 167 | ||||||||||
0.000% due 12/25/2060 ~(a) | 178,489 | 6,244 | ||||||||||
0.165% due 12/25/2060 ~(a) | 155,974 | 1,068 | ||||||||||
3.827% due 12/25/2060 ~(k) | 34,468 | 19,355 | ||||||||||
Hawaii Hotel Trust | ||||||||||||
7.943% due 05/15/2038 •(k) | 34,720 | 33,757 | ||||||||||
7.943% due 05/15/2038 | 5,000 | 4,861 | ||||||||||
PRINCIPAL AMOUNT (000S) | MARKET VALUE (000S) | |||||||||||
Hilton Orlando Trust | ||||||||||||
8.093% due 12/15/2034 •(k) | $ | 6,953 | $ | 6,788 | ||||||||
HPLY Trust | ||||||||||||
8.343% due 11/15/2036 •(k) | 1,676 | 1,587 | ||||||||||
JP Morgan Alternative Loan Trust | ||||||||||||
5.430% due 03/25/2037 •(k) | 14,915 | 14,888 | ||||||||||
JP Morgan Chase Commercial Mortgage Securities Trust | ||||||||||||
7.493% due 02/15/2035 •(k) | 1,310 | 1,250 | ||||||||||
7.663% due 07/05/2033 •(k) | 5,012 | 4,381 | ||||||||||
8.013% due 07/05/2033 •(k) | 10,000 | 8,550 | ||||||||||
8.293% due 03/15/2036 •(k) | 25,550 | 20,110 | ||||||||||
9.043% due 03/15/2036 •(k) | 9,500 | 7,199 | ||||||||||
JP Morgan Resecuritization Trust | ||||||||||||
3.769% due 12/27/2046 •(k) | 12,810 | 10,514 | ||||||||||
Lehman XS Trust | ||||||||||||
5.750% due 08/25/2037 •(k) | 22,623 | 19,130 | ||||||||||
Mill City Mortgage Loan Trust | ||||||||||||
0.000% due 04/25/2057 ~ | 147,373 | 3,311 | ||||||||||
0.000% due 04/25/2057 ~(a) | 147,373 | 560 | ||||||||||
0.000% due 11/25/2058 ~(a) | 124,201 | 553 | ||||||||||
0.000% due 11/25/2058 ~ | 124,201 | 321 | ||||||||||
3.888% due 11/25/2058 ~(k) | 16,205 | 8,928 | ||||||||||
3.905% due 04/25/2057 ~(k) | 19,586 | 12,262 | ||||||||||
Morgan Stanley Capital Trust | ||||||||||||
7.437% due 12/15/2036 •(k) | 4,294 | 1,791 | ||||||||||
7.518% due 11/15/2034 •(k) | 5,370 | 5,101 | ||||||||||
8.468% due 11/15/2034 •(k) | 3,357 | 3,142 | ||||||||||
Morgan Stanley Re-REMIC Trust | ||||||||||||
2.643% due 03/26/2037 þ(k) | 3,178 | 3,040 | ||||||||||
MRCD Mortgage Trust | ||||||||||||
2.718% due 12/15/2036(k) | 28,715 | 20,307 | ||||||||||
Natixis Commercial Mortgage Securities Trust | ||||||||||||
3.917% due 11/15/2032 ~(k) | 15,192 | 9,914 | ||||||||||
7.593% due 11/15/2034 •(k) | 6,000 | 5,645 | ||||||||||
New Orleans Hotel Trust | ||||||||||||
7.882% due 04/15/2032 •(k) | 7,491 | 7,001 | ||||||||||
New Residential Mortgage Loan Trust | ||||||||||||
3.528% due 07/25/2055 ~(k) | 1,242 | 895 | ||||||||||
4.008% due 07/25/2059 ~(k) | 5,000 | 3,085 | ||||||||||
4.328% due 07/25/2055 ~(k) | 1,000 | 730 | ||||||||||
New York Mortgage Trust | ||||||||||||
5.250% due 07/25/2062 þ(k) | 27,559 | 25,907 | ||||||||||
PMT Credit Risk Transfer Trust | ||||||||||||
8.078% due 02/27/2024 •(k) | 16,670 | 16,315 | ||||||||||
Residential Accredit Loans, Inc. Trust | ||||||||||||
5.570% due 06/25/2037 • | 874 | 740 | ||||||||||
Seasoned Credit Risk Transfer Trust | ||||||||||||
3.561% due 05/25/2057 ~(k) | 17,750 | 6,084 | ||||||||||
4.250% due 09/25/2060(k) | 7,547 | 6,513 | ||||||||||
4.250% due 03/25/2061 ~(k) | 3,263 | 2,581 | ||||||||||
4.750% due 10/25/2058 ~(k) | 2,360 | 2,122 | ||||||||||
13.916% due 11/25/2060 ~(k) | 5,548 | 4,241 | ||||||||||
14.094% due 09/25/2060 ~(k) | 4,234 | 3,032 | ||||||||||
SFO Commercial Mortgage Trust | ||||||||||||
8.093% due 05/15/2038 •(k) | 18,000 | 13,184 | ||||||||||
8.843% due 05/15/2038 •(k) | 8,000 | 5,513 | ||||||||||
Tharaldson Hotel Portfolio Trust | ||||||||||||
8.671% due 11/11/2034 •(k) | 5,025 | 4,837 | ||||||||||
Trinity Square PLC | ||||||||||||
0.000% due 07/15/2059 (f) | GBP | 10,853 | 31,238 | |||||||||
7.966% due 07/15/2059 • | 10,843 | 13,505 | ||||||||||
8.966% due 07/15/2059 • | 5,421 | 6,763 | ||||||||||
9.466% due 07/15/2059 • | 9,153 | 11,605 | ||||||||||
VASA Trust | ||||||||||||
8.343% due 07/15/2039 •(k) | $ | 10,000 | 6,892 | |||||||||
9.093% due 07/15/2039 •(k) | 7,000 | 3,790 | ||||||||||
Verus Securitization Trust | ||||||||||||
3.195% due 10/25/2063 ~(k) | 1,800 | 1,376 | ||||||||||
Waikiki Beach Hotel Trust | ||||||||||||
7.223% due 12/15/2033 •(k) | 3,000 | 2,888 | ||||||||||
7.873% due 12/15/2033 •(k) | 5,000 | 4,692 | ||||||||||
WaMu Mortgage Pass-Through Certificates Trust | ||||||||||||
4.786% due 07/25/2047 •(k) | 2,206 | 1,799 | ||||||||||
6.200% due 12/25/2045 •(k) | 12,853 | 11,264 | ||||||||||
100 | PIMCO CLOSED-END FUNDS | See Accompanying Notes |
| June 30, 2023 |
PRINCIPAL AMOUNT (000S) | MARKET VALUE (000S) | |||||||||||
Wells Fargo Mortgage-Backed Securities Trust | ||||||||||||
4.478% due 10/25/2036 ~(k) | $ | 249 | $ | 232 | ||||||||
Total Non-Agency Mortgage-Backed Securities (Cost $916,303) | 754,974 | |||||||||||
ASSET-BACKED SECURITIES 20.9% | ||||||||||||
Aames Mortgage Investment Trust | ||||||||||||
7.850% due 01/25/2035 • (k) | 5,000 | 3,418 | ||||||||||
ACE Securities Corp. Home Equity Loan Trust | ||||||||||||
5.525% due 08/25/2036 • (k) | 24,208 | 18,109 | ||||||||||
Ameriquest Mortgage Securities, Inc. Asset-Backed Pass-Through Certificates | ||||||||||||
6.950% due 07/25/2035 • (k) | 7,500 | 5,866 | ||||||||||
Argent Securities, Inc. Asset-Backed Pass-Through Certificates | ||||||||||||
5.840% due 01/25/2036 • (k) | 16,376 | 13,521 | ||||||||||
Asset-Backed Securities Corp. Home Equity Loan Trust | ||||||||||||
5.380% due 05/25/2037 • (k) | 8,317 | 5,711 | ||||||||||
Ayresome CDO Ltd. | ||||||||||||
5.883% due 12/08/2045 • (k) | 25,992 | 8,220 | ||||||||||
Bear Stearns Asset-Backed Securities Trust | ||||||||||||
4.595% due 01/25/2037 • (k) | 6,306 | 5,462 | ||||||||||
BSPRT Issuer Ltd. | ||||||||||||
7.593% due 05/15/2029 • (k) | 5,000 | 4,891 | ||||||||||
Carvana Auto Receivables Trust | ||||||||||||
0.000% due 01/10/2028 «(f) | 10 | 1,908 | ||||||||||
College Avenue Student Loans LLC | ||||||||||||
4.120% due 07/25/2051 | 1,750 | 1,604 | ||||||||||
Duke Funding High Grade Ltd. | ||||||||||||
0.090% due 08/02/2049 (a) | 840,370 | 175 | ||||||||||
5.333% due 08/02/2049 • | 29,910 | 263 | ||||||||||
Encore Credit Receivables Trust | ||||||||||||
6.905% due 10/25/2035 • (k) | 5,715 | 5,128 | ||||||||||
Exeter Automobile Receivables Trust | ||||||||||||
0.000% due 05/15/2031 «(f) | 7 | 1,897 | ||||||||||
0.000% due 08/15/2031 «(f) | 12 | 4,466 | ||||||||||
0.000% due 12/15/2033 «(f) | 12 | 3,858 | ||||||||||
Fieldstone Mortgage Investment Trust | ||||||||||||
8.075% due 08/25/2034 • (k) | 2,958 | 2,180 | ||||||||||
First Franklin Mortgage Loan Trust | ||||||||||||
5.460% due 10/25/2036 • (k) | 6,000 | 4,819 | ||||||||||
6.080% due 11/25/2035 • (k) | 7,501 | 6,502 | ||||||||||
First NLC Trust | ||||||||||||
6.170% due 12/25/2035 • (k) | 11,479 | 9,533 | ||||||||||
Flagship Credit Auto Trust | ||||||||||||
0.000% due 04/17/2028 «(f) | 10 | 1,489 | ||||||||||
FREED ABS Trust | ||||||||||||
0.000% due 09/20/2027 «(f) | 4 | 487 | ||||||||||
Greenwood Park CLO Ltd. | ||||||||||||
0.000% due 04/15/2031 ~ (k) | 27,000 | 9,466 | ||||||||||
GSAMP Trust | ||||||||||||
5.600% due 08/25/2036 • (k) | 16,065 | 11,475 | ||||||||||
KKR CLO Ltd. | ||||||||||||
0.000% due 04/20/2034 ~ (k) | 10,000 | 7,471 | ||||||||||
Madison Park Funding Ltd. | ||||||||||||
0.000% due 07/27/2047 ~ (k) | 5,600 | 2,602 | ||||||||||
Marlette Funding Trust | ||||||||||||
0.000% due 09/16/2030 «(f) | 38 | 1,597 | ||||||||||
Montauk Point CDO Ltd. | ||||||||||||
5.529% due 04/06/2046 • (k) | 327,058 | 1,927 | ||||||||||
5.534% due 10/06/2042 • (k) | 213,556 | 13,293 | ||||||||||
Morgan Stanley ABS Capital, Inc. Trust | ||||||||||||
6.260% due 07/25/2035 • (k) | 11,629 | 8,433 | ||||||||||
Morgan Stanley Capital, Inc. Trust | ||||||||||||
5.510% due 03/25/2036 • (k) | 2,366 | 1,910 | ||||||||||
Morgan Stanley Home Equity Loan Trust | ||||||||||||
6.215% due 05/25/2035 • (k) | 5,321 | 4,484 | ||||||||||
Myers Park CLO Ltd. | ||||||||||||
0.000% due 10/20/2030 «~ | 13,000 | 8,468 | ||||||||||
New Century Home Equity Loan Trust | ||||||||||||
6.170% due 06/25/2035 • (k) | 17,495 | 16,071 | ||||||||||
PRINCIPAL AMOUNT (000S) | MARKET VALUE (000S) | |||||||||||
Option One Mortgage Loan Trust | ||||||||||||
5.390% due 04/25/2037 • (k) | $ | 3,638 | $ | 2,055 | ||||||||
PRET LLC | ||||||||||||
3.721% due 07/25/2051 þ (k) | 2,600 | 2,138 | ||||||||||
3.967% due 09/25/2051 þ (k) | 17,900 | 15,420 | ||||||||||
Ready Capital Mortgage Financing LLC | ||||||||||||
8.900% due 04/25/2038 • (k) | 7,000 | 6,530 | ||||||||||
Renaissance Home Equity Loan Trust | ||||||||||||
5.586% due 11/25/2036 þ (k) | 7,935 | 2,917 | ||||||||||
Securitized Asset-Backed Receivables LLC Trust | ||||||||||||
5.650% due 03/25/2036 • (k) | 1,493 | 936 | ||||||||||
Sierra Madre Funding Ltd. | ||||||||||||
5.571% due 09/07/2039 • | 1,093 | 783 | ||||||||||
SMB Private Education Loan Trust | ||||||||||||
0.000% due 02/16/2055 «(f) | 5 | 6,651 | ||||||||||
Specialty Underwriting & Residential Finance Trust | ||||||||||||
3.597% due 09/25/2037 • (k) | 23,112 | 7,809 | ||||||||||
Structured Asset Investment Loan Trust | ||||||||||||
5.670% due 05/25/2036 • (k) | 14,747 | 6,111 | ||||||||||
Structured Asset Securities Corp. Mortgage Loan Trust | ||||||||||||
5.350% due 06/25/2037 • (k) | 5,536 | 3,451 | ||||||||||
5.390% due 01/25/2037 • (k) | 9,398 | 5,923 | ||||||||||
5.450% due 04/25/2036 • (k) | 20,649 | 17,115 | ||||||||||
Structured Finance Advisors ABS CDO Ltd. | ||||||||||||
5.177% due 07/02/2037 | 41,770 | 7,230 | ||||||||||
Summer Street Ltd. | ||||||||||||
5.746% due 12/06/2045 • (k) | 49,629 | 12,371 | ||||||||||
Total Asset-Backed Securities (Cost $408,444) | 294,144 | |||||||||||
SOVEREIGN ISSUES 1.3% | ||||||||||||
Argentina Government International Bond | ||||||||||||
3.500% due 07/09/2041 þ(k) | 5,233 | 1,685 | ||||||||||
Ecuador Government International Bond | ||||||||||||
2.500% due 07/31/2035 þ | 3,300 | 1,155 | ||||||||||
5.500% due 07/31/2030 þ | 19,720 | 9,588 | ||||||||||
Russia Government International Bond | ||||||||||||
5.100% due 03/28/2035 ^(c) | 200 | 89 | ||||||||||
5.625% due 04/04/2042 ^(c) | 4,200 | 2,864 | ||||||||||
Ukraine Government International Bond | ||||||||||||
6.876% due 05/21/2031 ^(c) | 10,700 | 2,470 | ||||||||||
Total Sovereign Issues (Cost $29,564) | 17,851 | |||||||||||
SHARES | ||||||||||||
COMMON STOCKS 2.4% | ||||||||||||
COMMUNICATION SERVICES 0.0% | ||||||||||||
Promotora de Informaciones SA (d) | 1,623,357 | 673 | ||||||||||
CONSUMER DISCRETIONARY 0.0% | ||||||||||||
Steinhoff CVR «(d) | 115,240,705 | 0 | ||||||||||
FINANCIALS 1.5% | ||||||||||||
ADLER Group SA «(d) | 67,217 | 36 | ||||||||||
Banca Monte dei Paschi di Siena SpA (d) | 2,274,000 | 5,712 | ||||||||||
Intelsat Emergence SA «(d)(i) | 650,684 | 14,965 | ||||||||||
UBS Group AG | 5,143 | 104 | ||||||||||
| 20,817 | ||||||||||||
INDUSTRIALS 0.9% | ||||||||||||
NAC Aviation Restricted «(d)(i) | 373,201 | 5,948 | ||||||||||
Syniverse Holdings, Inc. «(i) | 6,721,650 | 6,186 | ||||||||||
Voyager Aviation Holdings LLC «(d) | 6,860 | 0 | ||||||||||
| 12,134 | ||||||||||||
SHARES | MARKET VALUE (000S) | |||||||||||
REAL ESTATE 0.0% | ||||||||||||
ADLER Group SA | 148,837 | $ | 90 | |||||||||
Total Common Stocks (Cost $59,567) | 33,714 | |||||||||||
RIGHTS 0.0% | ||||||||||||
FINANCIALS 0.0% | ||||||||||||
Intelsat Jackson Holdings SA «(d) | 68,143 | 324 | ||||||||||
Total Rights (Cost $0) | 324 | |||||||||||
WARRANTS 0.0% | ||||||||||||
FINANCIALS 0.0% | ||||||||||||
Intelsat Jackson Holdings SA - Exp. 12/05/2025 « | 68,143 | 494 | ||||||||||
Total Warrants (Cost $0) | 494 | |||||||||||
PREFERRED SECURITIES 0.9% | ||||||||||||
BANKING & FINANCE 0.0% | ||||||||||||
SVB Financial Group | ||||||||||||
4.000% due 05/15/2026 ^(c)(h) | 500,000 | 36 | ||||||||||
FINANCIALS 0.2% | ||||||||||||
Stichting AK Rabobank Certificaten | ||||||||||||
6.500% due 12/29/2049 þ(h) | 1,846,500 | 1,873 | ||||||||||
SVB Financial Group | ||||||||||||
4.250% due 11/15/2026 ^(c)(h) | 300,000 | 22 | ||||||||||
4.700% due 11/15/2031 ^(c)(h) | 492,000 | 35 | ||||||||||
| 1,930 | ||||||||||||
INDUSTRIALS 0.7% | ||||||||||||
Voyager Aviation Holdings LLC « | 41,160 | 9,924 | ||||||||||
Total Preferred Securities (Cost $16,481) | 11,890 | |||||||||||
REAL ESTATE INVESTMENT TRUSTS 2.3% | ||||||||||||
FINANCIALS 2.3% | ||||||||||||
Annaly Capital Mangaement, Inc. | 609,500 | 12,196 | ||||||||||
KKR Real Estate Finance Trust, Inc. | 1,082,100 | 13,169 | ||||||||||
PennyMac Mortgage Investment Trust | 556,200 | 7,498 | ||||||||||
Total Real Estate Investment Trusts (Cost $47,328) | 32,863 | |||||||||||
PRINCIPAL AMOUNT (000S) | ||||||||||||
SHORT-TERM INSTRUMENTS 7.2% | ||||||||||||
REPURCHASE AGREEMENTS (j) 6.1% | ||||||||||||
| 85,700 | ||||||||||||
SHORT-TERM NOTES 0.2% | ||||||||||||
Corestate Capital Holding SA | ||||||||||||
15.000% due 07/31/2023 «(i) | EUR | 300 | 331 | |||||||||
Federal Home Loan Bank | ||||||||||||
5.140% due 11/29/2023 (g)(k) | $ | 3,100 | 3,101 | |||||||||
| 3,432 | ||||||||||||
| See Accompanying Notes | ANNUAL REPORT | | | JUNE 30, 2023 | 101 |
Consolidated Schedule of Investments | PIMCO Dynamic Income Opportunities Fund | (Cont.) |
PRINCIPAL AMOUNT (000S) | MARKET VALUE (000S) | |||||||||||
U.S. TREASURY BILLS 0.9% | ||||||||||||
5.200% due 08/10/2023 - 09/14/2023 (e)(f)(n) | $ | 13,291 | $ | 13,182 | ||||||||
Total Short-Term Instruments (Cost $102,298) | 102,314 | |||||||||||
Total Investments in Securities (Cost $2,968,734) | 2,412,417 | |||||||||||
Total Investments 171.5% (Cost $2,968,734) | $ | 2,412,417 | ||||||||||
Financial Derivative Instruments (l)(m) (0.0)% (Cost or Premiums, net $(15,675)) | (158 | ) | ||||||||||
Other Assets and Liabilities, net (71.5)% | (1,005,723 | ) | ||||||||||
Net Assets 100.0% | $ | 1,406,536 | ||||||||||
* | A zero balance may reflect actual amounts rounding to less than one thousand. |
^ | Security is in default. |
« | Security valued using significant unobservable inputs (Level 3). |
µ | All or a portion of this amount represents unfunded loan commitments. The interest rate for the unfunded portion will be determined at the time of funding. See Note 4, Securities and Other Investments, in the Notes to Financial Statements for more information regarding unfunded loan commitments. |
~ | Variable or Floating rate security. Rate shown is the rate in effect as of period end. Certain variable rate securities are not based on a published reference rate and spread, rather are determined by the issuer or agent and are based on current market conditions. Reference rate is as of reset date, which may vary by security. These securities may not indicate a reference rate and/or spread in their description. |
• | Rate shown is the rate in effect as of period end. The rate may be based on a fixed rate, a capped rate or a floor rate and may convert to a variable or floating rate in the future. These securities do not indicate a reference rate and spread in their description. |
þ | Coupon represents a rate which changes periodically based on a predetermined schedule or event. Rate shown is the rate in effect as of period end. |
(a) | Security is an Interest Only (“IO”) or IO Strip. |
(b) | Payment in-kind security. |
(c) | Security is not accruing income as of the date of this report. |
(d) | Security did not produce income within the last twelve months. |
(e) | Coupon represents a weighted average yield to maturity. |
(f) | Zero coupon security. |
(g) | Coupon represents a yield to maturity. |
(h) | Perpetual maturity; date shown, if applicable, represents next contractual call date. |
Issuer Description | Acquisition Date | Cost | Market Value | Market Value as Percentage of Net Assets | ||||||||||||
Corestate Capital Holding SA 15.000% due 07/31/2023 | 12/06/2022 | $ | 314 | $ | 331 | 0.02 | % | |||||||||
Intelsat Emergence SA | 01/29/2021 - 03/09/2021 | 38,681 | 14,965 | 1.07 | ||||||||||||
NAC Aviation Restricted | 06/01/2022 - 07/27/2022 | 8,750 | 5,948 | 0.42 | ||||||||||||
Syniverse Holdings, Inc. | 05/12/2022 - 05/31/2023 | 6,603 | 6,186 | 0.44 | ||||||||||||
| $ | 54,348 | $ | 27,430 | 1.95 | % | |||||||||||
Counterparty | Lending Rate | Settlement Date | Maturity Date | Principal Amount | Collateralized By | Collateral (Received) | Repurchase Agreements, at Value | Repurchase Agreement Proceeds to be Received (1) | ||||||||||||||||||||||
| BPS | 5.100 | % | 06/30/2023 | 07/03/2023 | $ | 85,700 | U.S. Treasury Inflation Protected Securities 0.250% due 07/15/2029 | $ | (87,582 | ) | $ | 85,700 | $ | 85,736 | ||||||||||||||||
Total Repurchase Agreements | $ | (87,582 | ) | $ | 85,700 | $ | 85,736 | |||||||||||||||||||||||
102 | PIMCO CLOSED-END FUNDS | See Accompanying Notes |
| June 30, 2023 |
Counterparty | Borrowing Rate (2) | Settlement Date | Maturity Date | Amount Borrowed (2) | Payable for Reverse Repurchase Agreements | |||||||||||||||||
BOM | 5.820 | % | 06/01/2023 | 09/01/2023 | (13,000 | ) | $ | (13,067 | ) | |||||||||||||
BPS | 0.000 | 05/10/2023 | TBD | (3) | EUR | (1,442 | ) | (1,573 | ) | |||||||||||||
| 3.770 | 06/02/2023 | 08/10/2023 | (375 | ) | (410 | ) | ||||||||||||||||
| 3.800 | 06/08/2023 | TBD | (3) | (4,236 | ) | (4,634 | ) | |||||||||||||||
| 3.987 | 06/30/2023 | 08/30/2023 | (5,858 | ) | (6,394 | ) | ||||||||||||||||
| 4.014 | 06/22/2023 | 09/22/2023 | (1,635 | ) | (1,786 | ) | ||||||||||||||||
| 5.740 | 03/14/2023 | 07/14/2023 | $ | (47,880 | ) | (48,652 | ) | |||||||||||||||
| 5.740 | 05/19/2023 | 11/20/2023 | (5,266 | ) | (5,303 | ) | ||||||||||||||||
| 5.750 | 06/01/2023 | 08/30/2023 | (342 | ) | (343 | ) | ||||||||||||||||
| 5.750 | 06/12/2023 | 07/14/2023 | (2,096 | ) | (2,103 | ) | ||||||||||||||||
| 5.760 | 03/23/2023 | 07/21/2023 | (3,332 | ) | (3,382 | ) | ||||||||||||||||
| 5.760 | 06/12/2023 | 07/21/2023 | (8,054 | ) | (8,081 | ) | ||||||||||||||||
| 5.780 | 06/16/2023 | 12/15/2023 | (19,140 | ) | (19,192 | ) | ||||||||||||||||
| 5.790 | 03/01/2023 | 07/31/2023 | (7,377 | ) | (7,511 | ) | ||||||||||||||||
| 5.790 | 03/02/2023 | 07/31/2023 | (6,435 | ) | (6,551 | ) | ||||||||||||||||
| 5.950 | 06/01/2023 | 08/30/2023 | (2,661 | ) | (2,675 | ) | ||||||||||||||||
| 6.310 | 04/13/2023 | 10/10/2023 | (98,136 | ) | (99,511 | ) | ||||||||||||||||
| 6.310 | 05/17/2023 | 11/15/2023 | (13,556 | ) | (13,668 | ) | ||||||||||||||||
| 6.310 | 06/15/2023 | 10/10/2023 | (17,223 | ) | (17,277 | ) | ||||||||||||||||
| 6.360 | 04/13/2023 | 10/10/2023 | (9,576 | ) | (9,710 | ) | ||||||||||||||||
| 6.410 | 04/13/2023 | 10/10/2023 | (4,487 | ) | (4,550 | ) | ||||||||||||||||
| 6.490 | 06/01/2023 | 08/30/2023 | (2,685 | ) | (2,701 | ) | ||||||||||||||||
| 6.610 | 04/13/2023 | 10/10/2023 | (13,896 | ) | (14,090 | ) | ||||||||||||||||
BRC | 3.750 | 05/10/2023 | TBD | (3) | EUR | (1,330 | ) | (1,459 | ) | |||||||||||||
| 5.940 | 02/10/2023 | 08/10/2023 | $ | (6,492 | ) | (6,646 | ) | |||||||||||||||
| 5.990 | 04/14/2023 | 07/14/2023 | (18,336 | ) | (18,580 | ) | ||||||||||||||||
| 6.005 | 01/05/2023 | 07/05/2023 | (4,521 | ) | (4,656 | ) | ||||||||||||||||
| 6.010 | 02/03/2023 | 08/03/2023 | (22,517 | ) | (23,080 | ) | ||||||||||||||||
| 6.060 | 02/03/2023 | 08/03/2023 | (2,351 | ) | (2,411 | ) | ||||||||||||||||
| 6.060 | 07/03/2023 | TBD | (3) | (5,681 | ) | (5,681 | ) | |||||||||||||||
| 6.090 | 01/30/2023 | 08/30/2023 | (14,123 | ) | (14,491 | ) | ||||||||||||||||
| 6.090 | 02/10/2023 | 08/10/2023 | (22,948 | ) | (23,504 | ) | ||||||||||||||||
| 6.140 | 01/30/2023 | 08/30/2023 | (21,139 | ) | (21,694 | ) | ||||||||||||||||
| 6.380 | 06/05/2023 | 09/05/2023 | (4,398 | ) | (4,420 | ) | ||||||||||||||||
| 6.410 | 06/13/2023 | 10/11/2023 | (22,860 | ) | (22,941 | ) | ||||||||||||||||
| 6.430 | 06/05/2023 | 09/05/2023 | (6,087 | ) | (6,117 | ) | ||||||||||||||||
| 6.530 | 06/05/2023 | 09/05/2023 | (6,414 | ) | (6,447 | ) | ||||||||||||||||
| 6.580 | 06/05/2023 | 09/05/2023 | (982 | ) | (987 | ) | ||||||||||||||||
BYR | 5.770 | 03/24/2023 | 09/20/2023 | (17,004 | ) | (17,274 | ) | |||||||||||||||
| 5.780 | 04/26/2023 | 10/23/2023 | (28,045 | ) | (28,349 | ) | ||||||||||||||||
CEW | 5.750 | 05/05/2023 | TBD | (3) | (9,788 | ) | (9,880 | ) | ||||||||||||||
| 6.450 | 06/13/2023 | TBD | (3) | (6,735 | ) | (6,759 | ) | |||||||||||||||
CIB | 5.390 | 01/17/2023 | 07/17/2023 | (25 | ) | (26 | ) | |||||||||||||||
DBL | 6.179 | 06/29/2023 | 08/31/2023 | (1,734 | ) | (1,735 | ) | |||||||||||||||
| 6.688 | 06/09/2023 | 08/10/2023 | (18,329 | ) | (18,411 | ) | ||||||||||||||||
| 6.699 | 06/20/2023 | 08/17/2023 | (9,361 | ) | (9,384 | ) | ||||||||||||||||
| 6.738 | 06/09/2023 | 08/10/2023 | (13,409 | ) | (13,469 | ) | ||||||||||||||||
| 6.749 | 06/12/2023 | 08/11/2023 | (1,008 | ) | (1,012 | ) | ||||||||||||||||
IND | 5.460 | 03/07/2023 | 07/07/2023 | (3,120 | ) | (3,176 | ) | |||||||||||||||
| 5.480 | 03/07/2023 | 07/07/2023 | (555 | ) | (565 | ) | ||||||||||||||||
JML | 5.500 | 05/05/2023 | 07/28/2023 | (9,476 | ) | (9,562 | ) | |||||||||||||||
JPS | 6.150 | 04/03/2023 | 07/03/2023 | (1,998 | ) | (2,029 | ) | |||||||||||||||
| 6.170 | 05/05/2023 | 11/01/2023 | (18,253 | ) | (18,437 | ) | ||||||||||||||||
| 6.200 | 04/03/2023 | 07/03/2023 | (8,892 | ) | (9,028 | ) | ||||||||||||||||
| 6.230 | 05/31/2023 | 11/20/2023 | (3,808 | ) | (3,830 | ) | ||||||||||||||||
| 6.250 | 04/03/2023 | 07/03/2023 | (4,218 | ) | (4,283 | ) | ||||||||||||||||
| 6.287 | 02/14/2023 | 10/12/2023 | (16,821 | ) | (17,229 | ) | ||||||||||||||||
| 6.300 | 05/16/2023 | 11/13/2023 | (3,052 | ) | (3,078 | ) | ||||||||||||||||
| 6.400 | 05/16/2023 | 11/13/2023 | (13,782 | ) | (13,900 | ) | ||||||||||||||||
| 6.610 | 07/03/2023 | 01/02/2024 | (1,254 | ) | (1,254 | ) | ||||||||||||||||
| 6.680 | 07/03/2023 | 01/02/2024 | (9,756 | ) | (9,756 | ) | ||||||||||||||||
| 6.710 | 07/03/2023 | 01/02/2024 | (2,634 | ) | (2,634 | ) | ||||||||||||||||
MEI | 2.250 | 05/10/2023 | TBD | (3) | EUR | (746 | ) | (817 | ) | |||||||||||||
| 5.430 | 06/19/2023 | 09/19/2023 | GBP | (9,132 | ) | (11,622 | ) | |||||||||||||||
MSB | 5.258 | 05/02/2023 | 09/04/2023 | (4,006 | ) | (5,133 | ) | |||||||||||||||
| 5.358 | 05/02/2023 | 09/04/2023 | (7,576 | ) | (9,708 | ) | ||||||||||||||||
| 5.408 | 05/02/2023 | 09/04/2023 | (6,527 | ) | (8,365 | ) | ||||||||||||||||
| 5.606 | 07/03/2023 | 11/03/2023 | (4,112 | ) | (5,222 | ) | ||||||||||||||||
| See Accompanying Notes | ANNUAL REPORT | | | JUNE 30, 2023 | 103 |
Consolidated Schedule of Investments | PIMCO Dynamic Income Opportunities Fund | (Cont.) |
Counterparty | Borrowing Rate (2) | Settlement Date | Maturity Date | Amount Borrowed (2) | Payable for Reverse Repurchase Agreements | |||||||||||||||||
| 5.706 | % | 07/03/2023 | 11/03/2023 | GBP | (7,740 | ) | $ | (9,829 | ) | |||||||||||||
| 5.756 | 07/03/2023 | 11/03/2023 | (6,471 | ) | (8,218 | ) | ||||||||||||||||
| 6.310 | 05/15/2023 | 11/13/2023 | $ | (1,979 | ) | (1,996 | ) | |||||||||||||||
| 6.310 | 05/30/2023 | 11/30/2023 | (49,223 | ) | (49,516 | ) | ||||||||||||||||
| 6.360 | 01/27/2023 | 07/26/2023 | (8,453 | ) | (8,677 | ) | ||||||||||||||||
| 6.360 | 05/30/2023 | 11/30/2023 | (27,396 | ) | (27,559 | ) | ||||||||||||||||
| 6.410 | 05/30/2023 | 11/30/2023 | (17,252 | ) | (17,355 | ) | ||||||||||||||||
MZF | 6.490 | 06/07/2023 | 12/07/2023 | (9,126 | ) | (9,169 | ) | |||||||||||||||
| 6.670 | 06/01/2023 | 11/28/2023 | (7,046 | ) | (7,088 | ) | ||||||||||||||||
NOM | 5.400 | 05/05/2023 | TBD | (3) | (477 | ) | (481 | ) | ||||||||||||||
RBC | 6.110 | 06/12/2023 | 10/12/2023 | (13,896 | ) | (13,945 | ) | |||||||||||||||
| 6.490 | 06/16/2023 | 10/16/2023 | (3,896 | ) | (3,908 | ) | ||||||||||||||||
RCY | 5.400 | 01/17/2023 | 07/17/2023 | (3,413 | ) | (3,499 | ) | |||||||||||||||
| 5.660 | 02/17/2023 | 09/18/2023 | (5,584 | ) | (5,704 | ) | ||||||||||||||||
RDR | 5.550 | 06/02/2023 | 08/02/2023 | (985 | ) | (990 | ) | |||||||||||||||
RTA | 5.790 | 06/12/2023 | 10/12/2023 | (23,475 | ) | (23,554 | ) | |||||||||||||||
| 5.840 | 06/12/2023 | 10/12/2023 | (6,179 | ) | (6,200 | ) | ||||||||||||||||
| 6.070 | 04/03/2023 | 07/03/2023 | (17,341 | ) | (17,608 | ) | ||||||||||||||||
| 6.210 | 06/07/2023 | 12/07/2023 | (16,089 | ) | (16,161 | ) | ||||||||||||||||
| 6.270 | 06/05/2023 | 10/05/2023 | (6,306 | ) | (6,336 | ) | ||||||||||||||||
| 6.290 | 06/02/2023 | 10/02/2023 | (17,228 | ) | (17,321 | ) | ||||||||||||||||
| 6.290 | 07/03/2023 | 10/31/2023 | (17,130 | ) | (17,130 | ) | ||||||||||||||||
| 6.310 | 07/03/2023 | 10/02/2023 | (18,125 | ) | (18,125 | ) | ||||||||||||||||
| 6.340 | 06/05/2023 | 10/05/2023 | (2,642 | ) | (2,655 | ) | ||||||||||||||||
SBI | 5.350 | 06/05/2023 | 07/05/2023 | (2,949 | ) | (2,961 | ) | |||||||||||||||
SOG | 5.480 | 01/24/2023 | 07/24/2023 | (4,896 | ) | (5,015 | ) | |||||||||||||||
| 5.580 | 05/15/2023 | 07/28/2023 | (3,378 | ) | (3,403 | ) | ||||||||||||||||
| 5.750 | 02/22/2023 | 08/22/2023 | (4,427 | ) | (4,520 | ) | ||||||||||||||||
| 5.770 | 06/08/2023 | 11/15/2023 | (2,598 | ) | (2,608 | ) | ||||||||||||||||
| 6.092 | 01/05/2023 | 07/05/2023 | (7,612 | ) | (7,843 | ) | ||||||||||||||||
| 6.310 | 05/18/2023 | 11/17/2023 | (6,085 | ) | (6,134 | ) | ||||||||||||||||
| 6.360 | 04/25/2023 | 10/25/2023 | (9,196 | ) | (9,307 | ) | ||||||||||||||||
UBS | 3.570 | 05/10/2023 | TBD | (3) | EUR | (1,144 | ) | (1,255 | ) | |||||||||||||
| 3.600 | 06/08/2023 | TBD | (3) | (12,458 | ) | (13,627 | ) | |||||||||||||||
| 3.680 | 05/10/2023 | TBD | (3) | (2,410 | ) | (2,643 | ) | |||||||||||||||
| 3.730 | 05/10/2023 | TBD | (3) | (5,818 | ) | (6,382 | ) | |||||||||||||||
| 3.815 | 06/12/2023 | 08/14/2023 | (12,441 | ) | (13,606 | ) | ||||||||||||||||
| 4.000 | 06/12/2023 | 09/12/2023 | (4,594 | ) | (5,024 | ) | ||||||||||||||||
| 4.100 | 06/12/2023 | 09/12/2023 | (3,019 | ) | (3,294 | ) | ||||||||||||||||
| 4.100 | 07/03/2023 | 09/12/2023 | (1,430 | ) | (1,560 | ) | ||||||||||||||||
| 5.550 | 02/03/2023 | 08/03/2023 | $ | (754 | ) | (772 | ) | |||||||||||||||
| 5.590 | 02/03/2023 | 08/03/2023 | (18,478 | ) | (18,909 | ) | ||||||||||||||||
| 5.620 | 04/13/2023 | 07/12/2023 | (9,063 | ) | (9,174 | ) | ||||||||||||||||
| 5.760 | 04/27/2023 | 01/22/2024 | (15,801 | ) | (15,971 | ) | ||||||||||||||||
| 6.060 | 02/06/2023 | 08/04/2023 | (9,903 | ) | (10,148 | ) | ||||||||||||||||
| 6.250 | 07/03/2023 | 01/05/2024 | (9,342 | ) | (9,342 | ) | ||||||||||||||||
| 6.420 | 06/30/2023 | 01/04/2024 | (6,130 | ) | (6,134 | ) | ||||||||||||||||
| 6.480 | 06/01/2023 | 08/30/2023 | (1,611 | ) | (1,621 | ) | ||||||||||||||||
| 6.530 | 06/01/2023 | 08/30/2023 | (1,538 | ) | (1,547 | ) | ||||||||||||||||
| 6.590 | 06/05/2023 | 12/05/2023 | (3,550 | ) | (3,568 | ) | ||||||||||||||||
| 6.620 | 06/30/2023 | 01/04/2024 | (10,699 | ) | (10,704 | ) | ||||||||||||||||
| 6.650 | 06/13/2023 | 12/12/2023 | (12,922 | ) | (12,970 | ) | ||||||||||||||||
| 6.770 | 06/30/2023 | 01/04/2024 | (10,697 | ) | (10,703 | ) | ||||||||||||||||
Total Reverse Repurchase Agreements | $ | (1,195,974 | ) | |||||||||||||||||||
Counterparty | Repurchase Agreement Proceeds to be Received (1) | Payable for Reverse Repurchase Agreements | Payable for Sale-Buyback Transactions | Total Borrowings and Other Financing Transactions | Collateral Pledged/(Received) | Net Exposure (4) | ||||||||||||||||||
Global/Master Repurchase Agreement | ||||||||||||||||||||||||
BOM | $ | 0 | $ | (13,067 | ) | $ | 0 | $ | (13,067 | ) | $ | 15,898 | $ | 2,831 | ||||||||||
BPS | 85,736 | (280,097 | ) | 0 | (194,361 | ) | 261,216 | 66,855 | ||||||||||||||||
BRC | 0 | (163,114 | ) | 0 | (163,114 | ) | 191,619 | 28,505 | ||||||||||||||||
BYR | 0 | (45,623 | ) | 0 | (45,623 | ) | 53,467 | 7,844 | ||||||||||||||||
104 | PIMCO CLOSED-END FUNDS | See Accompanying Notes |
| June 30, 2023 |
Counterparty | Repurchase Agreement Proceeds to be Received (1) | Payable for Reverse Repurchase Agreements | Payable for Sale-Buyback Transactions | Total Borrowings and Other Financing Transactions | Collateral Pledged/(Received) | Net Exposure (4) | ||||||||||||||||||
CEW | $ | 0 | $ | (16,639 | ) | $ | 0 | $ | (16,639 | ) | $ | 21,116 | $ | 4,477 | ||||||||||
CIB | 0 | (26 | ) | 0 | (26 | ) | 25 | (1 | ) | |||||||||||||||
DBL | 0 | (44,011 | ) | 0 | (44,011 | ) | 64,409 | 20,398 | ||||||||||||||||
IND | 0 | (3,741 | ) | 0 | (3,741 | ) | 4,426 | 685 | ||||||||||||||||
JML | 0 | (9,562 | ) | 0 | (9,562 | ) | 11,296 | 1,734 | ||||||||||||||||
JPS | 0 | (85,458 | ) | 0 | (85,458 | ) | 91,714 | 6,256 | ||||||||||||||||
MEI | 0 | (12,439 | ) | 0 | (12,439 | ) | 14,261 | 1,822 | ||||||||||||||||
MSB | 0 | (151,578 | ) | 0 | (151,578 | ) | 172,762 | 21,184 | ||||||||||||||||
MZF | 0 | (16,257 | ) | 0 | (16,257 | ) | 24,014 | 7,757 | ||||||||||||||||
NOM | 0 | (481 | ) | 0 | (481 | ) | 718 | 237 | ||||||||||||||||
RBC | 0 | (17,853 | ) | 0 | (17,853 | ) | 23,114 | 5,261 | ||||||||||||||||
RCY | 0 | (9,203 | ) | 0 | (9,203 | ) | 9,837 | 634 | ||||||||||||||||
RDR | 0 | (990 | ) | 0 | (990 | ) | 1,041 | 51 | ||||||||||||||||
RTA | 0 | (125,090 | ) | 0 | (125,090 | ) | 116,478 | (8,612 | ) | |||||||||||||||
SBI | 0 | (2,961 | ) | 0 | (2,961 | ) | 3,101 | 140 | ||||||||||||||||
SOG | 0 | (38,830 | ) | 0 | (38,830 | ) | 50,816 | 11,986 | ||||||||||||||||
UBS | 0 | (158,954 | ) | 0 | (158,954 | ) | 191,952 | 32,998 | ||||||||||||||||
Total Borrowings and Other Financing Transactions | $ | 85,736 | $ | (1,195,974 | ) | $ | 0 | |||||||||||||||||
Overnight and Continuous | Up to 30 days | 31-90 days | Greater Than 90 days | Total | ||||||||||||||||
Reverse Repurchase Agreements | ||||||||||||||||||||
Corporate Bonds & Notes | $ | 0 | $ | (81,737 | ) | $ | (98,498 | ) | $ | (133,568 | ) | $ | (313,803 | ) | ||||||
Sovereign Issues | 0 | (9,562 | ) | 0 | (482 | ) | (10,044 | ) | ||||||||||||
U.S. Government Agencies | 0 | (3,524 | ) | (18,771 | ) | 0 | (22,295 | ) | ||||||||||||
Preferred Securities | 0 | 0 | (2,783 | ) | 0 | (2,783 | ) | |||||||||||||
Non-Agency Mortgage-Backed Securities | 0 | (47,253 | ) | (117,173 | ) | (392,063 | ) | (556,489 | ) | |||||||||||
Asset-Backed Securities | 0 | (7,843 | ) | (68,839 | ) | (89,249 | ) | (165,931 | ) | |||||||||||
Convertible Bonds & Notes | 0 | (19,422 | ) | 0 | (6,078 | ) | (25,500 | ) | ||||||||||||
Municipal Bonds & Notes | 0 | 0 | (7,416 | ) | 0 | (7,416 | ) | |||||||||||||
Short-term Notes | 0 | (2,961 | ) | 0 | 0 | (2,961 | ) | |||||||||||||
Total Borrowings | $ | 0 | $ | (172,302 | ) | $ | (313,480 | ) | $ | (621,440 | ) | $ | (1,107,222 | ) | ||||||
Payable for reverse repurchase agreements (5) | $ | (1,107,222 | ) | |||||||||||||||||
(k) | Securities with an aggregate market value of $1,396,615 and cash of $20,485 have been pledged as collateral under the terms of the above master agreements as of June 30, 2023. |
(1) | Includes accrued interest. |
(2) | The average amount of borrowings outstanding during the period ended June 30, 2023 was $(1,261,577) at a weighted average interest rate of 4.222%. Average borrowings may include reverse repurchase agreements and sale-buyback transactions, if held during the period. |
(3) | Open maturity reverse repurchase agreement. |
(4) | Net Exposure represents the net receivable/(payable) that would be due from/to the counterparty in the event of default. Exposure from borrowings and other financing transactions can only be netted across transactions governed under the same master agreement with the same legal entity. See Note 8, Master Netting Arrangements, in the Notes to Financial Statements for more information. |
(5) | Unsettled reverse repurchase agreements liability of $(88,752) is outstanding at period end. |
Description | Expiration Month | # of Contracts | Notional Amount | Unrealized Appreciation/ (Depreciation) | Variation Margin | |||||||||||||||||||
Asset | Liability | |||||||||||||||||||||||
3-Month SOFR Active Contract December Futures | 03/2024 | 66 | $ | (15,616 | ) | $ | 442 | $ | 0 | $ | (6 | ) | ||||||||||||
3-Month SOFR Active Contract December Futures | 03/2025 | 35 | (8,398 | ) | 156 | 3 | 0 | |||||||||||||||||
3-Month SOFR Active Contract December Futures | 03/2026 | 38 | (9,171 | ) | 124 | 1 | 0 | |||||||||||||||||
3-Month SOFR Active Contract June Futures | 09/2024 | 44 | (10,476 | ) | 259 | 1 | 0 | |||||||||||||||||
3-Month SOFR Active Contract June Futures | 09/2025 | 35 | (8,432 | ) | 129 | 2 | 0 | |||||||||||||||||
3-Month SOFR Active Contract March Futures | 06/2024 | 58 | (13,758 | ) | 373 | 0 | (3 | ) | ||||||||||||||||
| See Accompanying Notes | ANNUAL REPORT | | | JUNE 30, 2023 | 105 |
Consolidated Schedule of Investments | PIMCO Dynamic Income Opportunities Fund | (Cont.) |
Description | Expiration Month | # of Contracts | Notional Amount | Unrealized Appreciation/ (Depreciation) | Variation Margin | |||||||||||||||||||
Asset | Liability | |||||||||||||||||||||||
3-Month SOFR Active Contract March Futures | 06/2025 | 31 | $ | (7,456 | ) | $ | 124 | $ | 3 | $ | 0 | |||||||||||||
3-Month SOFR Active Contract March Futures | 06/2026 | 36 | (8,693 | ) | 111 | 1 | 0 | |||||||||||||||||
3-Month SOFR Active Contract September Futures | 12/2024 | 41 | (9,802 | ) | 211 | 4 | 0 | |||||||||||||||||
3-Month SOFR Active Contract September Futures | 12/2025 | 29 | (6,993 | ) | 100 | 1 | 0 | |||||||||||||||||
Total Futures Contracts | $ | 2,029 | $ | 16 | $ | (9 | ) | |||||||||||||||||
Reference Entity | Fixed Receive Rate | Payment Frequency | Maturity Date | Implied Credit Spread at June 30, 2023 (2) | Notional Amount (3) | Premiums Paid/(Received) | Unrealized Appreciation/ (Depreciation) | Market Value (4) | Variation Margin | |||||||||||||||||||||||||||||||||||
Asset | Liability | |||||||||||||||||||||||||||||||||||||||||||
Jaguar Land Rover Automotive | 5.000 | % | Quarterly | 06/20/2026 | 4.659 | % | EUR | 1,000 | $ | 64 | $ | (52 | ) | $ | 12 | $ | 7 | $ | 0 | |||||||||||||||||||||||||
Jaguar Land Rover Automotive | 5.000 | Quarterly | 12/20/2026 | 5.190 | 13,300 | 739 | (795 | ) | (56 | ) | 138 | 0 | ||||||||||||||||||||||||||||||||
| $ | 803 | $ | (847 | ) | $ | (44 | ) | $ | 145 | $ | 0 | |||||||||||||||||||||||||||||||||
Pay/Receive Floating Rate | Floating Rate Index | Fixed Rate | Payment Frequency | Maturity Date | Notional Amount | Premiums Paid/(Received) | Unrealized Appreciation/ (Depreciation) | Market Value | Variation Margin | |||||||||||||||||||||||||||||||
Asset | Liability | |||||||||||||||||||||||||||||||||||||||
Receive | 1-Day GBP-SONIO Compounded-OIS | 0.750 | % | Annual | 09/21/2052 | GBP | 9,800 | $ | 286 | $ | 6,518 | $ | 6,804 | $ | 64 | $ | 0 | |||||||||||||||||||||||
Receive (5) | 1-Day USD-SOFR Compounded-OIS | 2.450 | Annual | 12/20/2024 | $ | 71,200 | (5 | ) | 1,689 | 1,684 | 0 | (13 | ) | |||||||||||||||||||||||||||
Receive (5) | 1-Day USD-SOFR Compounded-OIS | 2.350 | Annual | 01/17/2025 | 24,600 | 0 | 577 | 577 | 0 | (7 | ) | |||||||||||||||||||||||||||||
Pay | 1-Day USD-SOFR Compounded-OIS | 1.250 | Annual | 09/21/2026 | 91,700 | (6,758 | ) | (3,818 | ) | (10,576 | ) | 24 | 0 | |||||||||||||||||||||||||||
Pay | 1-Day USD-SOFR Compounded-OIS | 2.000 | Annual | 12/21/2027 | 230,100 | (19,716 | ) | (2,240 | ) | (21,956 | ) | 7 | 0 | |||||||||||||||||||||||||||
Pay | 1-Day USD-SOFR Compounded-OIS | 4.000 | Annual | 12/21/2027 | 309,800 | 313 | (1,540 | ) | (1,227 | ) | 74 | 0 | ||||||||||||||||||||||||||||
Pay (5) | 1-Day USD-SOFR Compounded-OIS | 0.500 | Semi-Annual | 06/16/2028 | 6,300 | (259 | ) | (702 | ) | (961 | ) | 3 | 0 | |||||||||||||||||||||||||||
Pay (5) | 1-Day USD-SOFR Compounded-OIS | 1.500 | Semi-Annual | 12/15/2028 | 43,200 | (40 | ) | (5,078 | ) | (5,118 | ) | 27 | 0 | |||||||||||||||||||||||||||
Pay | 1-Day USD-SOFR Compounded-OIS | 2.000 | Annual | 12/21/2029 | 144,300 | (14,841 | ) | (1,533 | ) | (16,374 | ) | 104 | 0 | |||||||||||||||||||||||||||
Pay (5) | 1-Day USD-SOFR Compounded-OIS | 3.500 | Annual | 12/20/2033 | 50,400 | 479 | (221 | ) | 258 | 143 | 0 | |||||||||||||||||||||||||||||
Receive | 1-Day USD-SOFR Compounded-OIS | 1.750 | Annual | 06/15/2052 | 40,100 | 9,900 | 825 | 10,725 | 0 | (339 | ) | |||||||||||||||||||||||||||||
Receive | 1-Day USD-SOFR Compounded-OIS | 1.750 | Annual | 12/21/2052 | 27,100 | 6,527 | 1,143 | 7,670 | 0 | (234 | ) | |||||||||||||||||||||||||||||
Receive | 1-Day USD-SOFR Compounded-OIS | 3.500 | Annual | 12/21/2052 | 81,300 | (245 | ) | (3,965 | ) | (4,210 | ) | 0 | (832 | ) | ||||||||||||||||||||||||||
Pay | 1-Year BRL-CDI | 11.140 | Maturity | 01/02/2025 | BRL | 1,000 | 0 | (3 | ) | (3 | ) | 0 | 0 | |||||||||||||||||||||||||||
Pay | 1-Year BRL-CDI | 11.160 | Maturity | 01/02/2025 | 700 | 0 | (2 | ) | (2 | ) | 0 | 0 | ||||||||||||||||||||||||||||
Pay | 1-Year BRL-CDI | 11.350 | Maturity | 01/02/2025 | 800 | 0 | (2 | ) | (2 | ) | 0 | 0 | ||||||||||||||||||||||||||||
Pay | 1-Year BRL-CDI | 12.000 | Maturity | 01/02/2025 | 2,200 | 0 | 1 | 1 | 1 | 0 | ||||||||||||||||||||||||||||||
Pay | 1-Year BRL-CDI | 12.080 | Maturity | 01/02/2025 | 3,700 | 0 | 3 | 3 | 1 | 0 | ||||||||||||||||||||||||||||||
Pay | 1-Year BRL-CDI | 12.140 | Maturity | 01/02/2025 | 1,900 | 0 | 2 | 2 | 0 | 0 | ||||||||||||||||||||||||||||||
Pay | 1-Year BRL-CDI | 12.145 | Maturity | 01/02/2025 | 1,800 | 0 | 2 | 2 | 0 | 0 | ||||||||||||||||||||||||||||||
Pay | 1-Year BRL-CDI | 12.160 | Maturity | 01/02/2025 | 3,800 | 0 | 4 | 4 | 1 | 0 | ||||||||||||||||||||||||||||||
Pay | 1-Year BRL-CDI | 6.990 | Maturity | 01/04/2027 | 318,400 | 2,522 | (8,032 | ) | (5,510 | ) | 249 | 0 | ||||||||||||||||||||||||||||
Pay | 1-Year BRL-CDI | 11.220 | Maturity | 01/04/2027 | 1,200 | 0 | 3 | 3 | 1 | 0 | ||||||||||||||||||||||||||||||
Pay | 1-Year BRL-CDI | 11.245 | Maturity | 01/04/2027 | 600 | 0 | 1 | 1 | 1 | 0 | ||||||||||||||||||||||||||||||
Pay | 1-Year BRL-CDI | 11.260 | Maturity | 01/04/2027 | 600 | 0 | 1 | 1 | 1 | 0 | ||||||||||||||||||||||||||||||
Pay | 1-Year BRL-CDI | 11.700 | Maturity | 01/04/2027 | 300 | 0 | 2 | 2 | 0 | 0 | ||||||||||||||||||||||||||||||
Pay | 1-Year BRL-CDI | 11.715 | Maturity | 01/04/2027 | 1,400 | 0 | 7 | 7 | 1 | 0 | ||||||||||||||||||||||||||||||
Receive | 1-Year BRL-CDI | 11.788 | Maturity | 01/04/2027 | 471,000 | 0 | (2,933 | ) | (2,933 | ) | 0 | (400 | ) | |||||||||||||||||||||||||||
Pay | 1-Year BRL-CDI | 11.870 | Maturity | 01/04/2027 | 3,200 | 0 | 20 | 20 | 3 | 0 | ||||||||||||||||||||||||||||||
Pay | 1-Year BRL-CDI | 12.015 | Maturity | 01/04/2027 | 124,200 | 0 | 885 | 885 | 106 | 0 | ||||||||||||||||||||||||||||||
Pay | 3-Month USD-LIBOR | 1.500 | Semi-Annual | 09/15/2023 | $ | 43,200 | 0 | (461 | ) | (461 | ) | 0 | (15 | ) | ||||||||||||||||||||||||||
Pay | 3-Month USD-LIBOR | 0.500 | Semi-Annual | 09/16/2023 | 6,300 | 0 | (84 | ) | (84 | ) | 0 | (3 | ) | |||||||||||||||||||||||||||
Receive | 6-Month EUR-EURIBOR | 0.250 | Annual | 09/21/2032 | EUR | 50,200 | 4,740 | 7,618 | 12,358 | 276 | 0 | |||||||||||||||||||||||||||||
Receive | 6-Month EUR-EURIBOR | 1.750 | Annual | 03/15/2033 | 5,700 | 448 | 231 | 679 | 34 | 0 | ||||||||||||||||||||||||||||||
Receive (5) | 6-Month EUR-EURIBOR | 0.830 | Annual | 12/09/2052 | 29,900 | 182 | 1,447 | 1,629 | 6 | 0 | ||||||||||||||||||||||||||||||
Receive | 28-Day MXN-TIIE | 8.675 | Lunar | 04/03/2024 | MXN | 41,000 | 0 | 46 | 46 | 0 | 0 | |||||||||||||||||||||||||||||
Receive | 28-Day MXN-TIIE | 8.660 | Lunar | 04/04/2024 | 17,100 | 0 | 19 | 19 | 0 | 0 | ||||||||||||||||||||||||||||||
Receive | 28-Day MXN-TIIE | 8.750 | Lunar | 04/05/2024 | 10,200 | 0 | 11 | 11 | 0 | 0 | ||||||||||||||||||||||||||||||
Receive | 28-Day MXN-TIIE | 8.410 | Lunar | 03/31/2027 | 4,900 | 0 | 2 | 2 | 0 | 0 | ||||||||||||||||||||||||||||||
Receive | 28-Day MXN-TIIE | 8.730 | Lunar | 04/06/2027 | 4,300 | 0 | 0 | 0 | 0 | 0 | ||||||||||||||||||||||||||||||
Receive | 28-Day MXN-TIIE | 7.495 | Lunar | 01/14/2032 | 2,100 | 9 | (4 | ) | 5 | 0 | 0 | |||||||||||||||||||||||||||||
Receive | 28-Day MXN-TIIE | 7.498 | Lunar | 01/15/2032 | 8,700 | 36 | (17 | ) | 19 | 0 | 0 | |||||||||||||||||||||||||||||
Receive | 28-Day MXN-TIIE | 8.732 | Lunar | 03/30/2032 | 2,100 | 0 | (5 | ) | (5 | ) | 0 | 0 | ||||||||||||||||||||||||||||
Receive | 28-Day MXN-TIIE | 8.701 | Lunar | 03/31/2032 | 5,000 | 0 | (11 | ) | (11 | ) | 0 | 0 | ||||||||||||||||||||||||||||
| $ | (16,422 | ) | $ | (9,594 | ) | $ | (26,016 | ) | $ | 1,127 | $ | (1,843 | ) | |||||||||||||||||||||||||||
Total Swap Agreements | $ | (15,619 | ) | $ | (10,441 | ) | $ | (26,060 | ) | $ | 1,272 | $ | (1,843 | ) | ||||||||||||||||||||||||||
106 | PIMCO CLOSED-END FUNDS | See Accompanying Notes |
| June 30, 2023 |
Financial Derivative Assets | Financial Derivative Liabilities | |||||||||||||||||||||||||||||||||||
Market Value | Variation Margin Asset | Total | Market Value | Variation Margin Liability | Total | |||||||||||||||||||||||||||||||
Purchased Options | Futures | Swap Agreements | Written Options | Futures | Swap Agreements | |||||||||||||||||||||||||||||||
Total Exchange-Traded or Centrally Cleared | $ | 0 | $ | 16 | $ | 1,272 | $ | 1,288 | $ | 0 | $ | (9) | $ | (1,843) | $ | (1,852) | ||||||||||||||||||||
(1) | If the Fund is a seller of protection and a credit event occurs, as defined under the terms of that particular swap agreement, the Fund will either (i) pay to the buyer of protection an amount equal to the notional amount of the swap and take delivery of the referenced obligation or underlying securities comprising the referenced index or (ii) pay a net settlement amount in the form of cash, securities or other deliverable obligations equal to the notional amount of the swap less the recovery value of the referenced obligation or underlying securities comprising the referenced index. |
(2) | Implied credit spreads, represented in absolute terms, utilized in determining the market value of credit default swap agreements on corporate issues as of period end serve as indicators of the current status of the payment/performance risk and represent the likelihood or risk of default for the credit derivative. The implied credit spread of a particular referenced entity reflects the cost of buying/selling protection and may include upfront payments required to be made to enter into the agreement. Wider credit spreads represent a deterioration of the referenced entity’s credit soundness and a greater likelihood or risk of default or other credit event occurring as defined under the terms of the agreement. |
(3) | The maximum potential amount the Fund could be required to pay as a seller of credit protection or receive as a buyer of credit protection if a credit event occurs as defined under the terms of that particular swap agreement. |
(4) | The prices and resulting values for credit default swap agreements serve as indicators of the current status of the payment/performance risk and represent the likelihood of an expected liability (or profit) for the credit derivative should the notional amount of the swap agreement be closed/sold as of the period end. Increasing market values, in absolute terms when compared to the notional amount of the swap, represent a deterioration of the underlying referenced instrument’s credit soundness and a greater likelihood or risk of default or other credit event occurring as defined under the terms of the agreement. |
(5) | This instrument has a forward starting effective date. See Note 2, Securities Transactions and Investment Income, in the Notes to Financial Statements for further information. |
Counterparty | Settlement Month | Currency to be Delivered | Currency to be Received | Unrealized Appreciation/ (Depreciation) | ||||||||||||||||||||
Asset | Liability | |||||||||||||||||||||||
BOA | 07/2023 | $ | 14,379 | MXN | 252,004 | $ | 319 | $ | 0 | |||||||||||||||
| 08/2023 | EUR | 19,118 | $ | 20,781 | 52 | (175 | ) | |||||||||||||||||
| 08/2023 | GBP | 3,948 | 4,981 | 9 | (43 | ) | ||||||||||||||||||
| 08/2023 | $ | 4,747 | EUR | 4,336 | 4 | (10 | ) | |||||||||||||||||
| 09/2023 | 959 | IDR | 14,349,703 | 0 | (6 | ) | ||||||||||||||||||
BPS | 08/2023 | CHF | 134 | $ | 151 | 1 | 0 | |||||||||||||||||
| 08/2023 | EUR | 146,187 | 160,309 | 460 | 0 | |||||||||||||||||||
| 08/2023 | MXN | 258,653 | 14,856 | 0 | (134 | ) | ||||||||||||||||||
| 08/2023 | $ | 905 | EUR | 841 | 14 | 0 | ||||||||||||||||||
| 09/2023 | IDR | 5,535,256 | $ | 368 | 1 | 0 | ||||||||||||||||||
BRC | 08/2023 | EUR | 4,364 | 4,684 | 0 | (88 | ) | |||||||||||||||||
| 08/2023 | GBP | 46,827 | 58,847 | 24 | (662 | ) | ||||||||||||||||||
| 08/2023 | MXN | 618 | 36 | 0 | 0 | |||||||||||||||||||
| 08/2023 | $ | 17,935 | EUR | 16,584 | 199 | 0 | ||||||||||||||||||
| 09/2023 | 1 | IDR | 17,149 | 0 | 0 | |||||||||||||||||||
CBK | 08/2023 | CAD | 10,220 | $ | 7,664 | 0 | (56 | ) | ||||||||||||||||
| 08/2023 | EUR | 2,312 | 2,512 | 0 | (16 | ) | ||||||||||||||||||
| 08/2023 | GBP | 908 | 1,126 | 0 | (28 | ) | ||||||||||||||||||
| 08/2023 | $ | 1,259 | EUR | 1,158 | 7 | 0 | ||||||||||||||||||
| 09/2023 | 0 | IDR | 6,662 | 0 | 0 | |||||||||||||||||||
| 09/2023 | 639 | PEN | 2,351 | 5 | 0 | |||||||||||||||||||
MYI | 07/2023 | IDR | 3,782,764 | $ | 253 | 1 | 0 | |||||||||||||||||
| 07/2023 | $ | 252 | IDR | 3,782,764 | 1 | 0 | ||||||||||||||||||
| 08/2023 | 1,016 | EUR | 927 | 0 | (3 | ) | ||||||||||||||||||
| 09/2023 | IDR | 5,276,015 | $ | 353 | 3 | 0 | ||||||||||||||||||
| 09/2023 | $ | 253 | IDR | 3,786,053 | 0 | (2 | ) | |||||||||||||||||
SCX | 08/2023 | 16,864 | EUR | 15,547 | 143 | (7 | ) | |||||||||||||||||
| 09/2023 | IDR | 12,119,591 | $ | 809 | 4 | 0 | ||||||||||||||||||
| 09/2023 | $ | 444 | IDR | 6,596,405 | 0 | (6 | ) | |||||||||||||||||
| 09/2023 | ZAR | 525 | $ | 30 | 2 | 0 | ||||||||||||||||||
SSB | 09/2023 | $ | 7,976 | BRL | 40,435 | 375 | 0 | |||||||||||||||||
UAG | 08/2023 | EUR | 44,392 | $ | 48,736 | 195 | 0 | |||||||||||||||||
| See Accompanying Notes | ANNUAL REPORT | | | JUNE 30, 2023 | 107 |
Consolidated Schedule of Investments | PIMCO Dynamic Income Opportunities Fund | (Cont.) |
Counterparty | Settlement Month | Currency to be Delivered | Currency to be Received | Unrealized Appreciation/ (Depreciation) | ||||||||||||||||||||
Asset | Liability | |||||||||||||||||||||||
| 08/2023 | GBP | 29,773 | $ | 37,632 | $ | 0 | $ | (188 | ) | |||||||||||||||
| 08/2023 | $ | 1,796 | EUR | 1,628 | 0 | (15 | ) | |||||||||||||||||
Total Forward Foreign Currency Contracts | $ | 1,819 | $ | (1,439 | ) | |||||||||||||||||||
Counterparty | Reference Entity | Fixed Receive Rate | Payment Frequency | Maturity Date | Implied Credit Spread at June 30, 2023 (2) | Notional Amount (3) | Premiums Paid/(Received) | Unrealized Appreciation/ (Depreciation) | Swap Agreements, at Value (4) | |||||||||||||||||||||||||||||||
Asset | Liability | |||||||||||||||||||||||||||||||||||||||
| BYL | Banca Monte Dei Paschi Di | 5.000% | Quarterly | 06/20/2024 | 3.756% | EUR | 2,000 | $ | (56 | ) | $ | 85 | $ | 29 | $ | 0 | ||||||||||||||||||||||||
Counterparty | Pay/Receive | Underlying Reference | Financing Rate | Payment Frequency | Maturity Date | Notional Amount | Premiums Paid/(Received) | Unrealized Appreciation/ (Depreciation) | Swap Agreements, at Value | |||||||||||||||||||||||||
Asset | Liability | |||||||||||||||||||||||||||||||||
| BPS | Pay | AP Core Holdings II, LLC | 1-Month USD-LIBOR | Quarterly | 07/31/2023 | $ | 30 | $ | 0 | $ | 36 | $ | 36 | $ | 0 | |||||||||||||||||||
| BPS | Pay | PUG LLC | 1-Month USD-LIBOR | Quarterly | 07/31/2023 | 1,264 | 0 | 129 | 129 | 0 | ||||||||||||||||||||||||
| BPS | Pay | Team Health Holdings, Inc. | 1-Month USD-LIBOR | Quarterly | 07/31/2023 | 2,487 | 0 | (232 | ) | 0 | (232 | ) | ||||||||||||||||||||||
| BPS | Pay | Veritas US Inc. | 1-Month USD-LIBOR | Quarterly | 07/31/2023 | 1,542 | 0 | 64 | 64 | 0 | ||||||||||||||||||||||||
| $ | 0 | $ | (3 | ) | $ | 229 | $ | (232 | ) | |||||||||||||||||||||||||
Total Swap Agreements | $ | (56 | ) | $ | 82 | $ | 258 | $ | (232 | ) | ||||||||||||||||||||||||
Financial Derivative Assets | Financial Derivative Liabilities | |||||||||||||||||||||||||||||||||||||||||||||||
Counterparty | Forward Foreign Currency Contracts | Purchased Options | Swap Agreements | Total Over the Counter | Forward Foreign Currency Contracts | Written Options | Swap Agreements | Total Over the Counter | Net Market Value of OTC Derivatives | Collateral Pledged/ (Received) | Net Exposure (5) | |||||||||||||||||||||||||||||||||||||
BOA | $ | 384 | $ | 0 | $ | 0 | $ | 384 | $ | (234 | ) | $ | 0 | $ | 0 | $ | (234 | ) | $ | 150 | $ | 0 | $ | 150 | ||||||||||||||||||||||||
BPS | 476 | 0 | 229 | 705 | (134 | ) | 0 | (232 | ) | (366 | ) | 339 | 0 | 339 | ||||||||||||||||||||||||||||||||||
BRC | 223 | 0 | 0 | 223 | (750 | ) | 0 | 0 | (750 | ) | (527 | ) | 148 | (379 | ) | |||||||||||||||||||||||||||||||||
BYL | 0 | 0 | 29 | 29 | 0 | 0 | 0 | 0 | 29 | 0 | 29 | |||||||||||||||||||||||||||||||||||||
CBK | 12 | 0 | 0 | 12 | (100 | ) | 0 | 0 | (100 | ) | (88 | ) | 0 | (88 | ) | |||||||||||||||||||||||||||||||||
MYI | 5 | 0 | 0 | 5 | (5 | ) | 0 | 0 | (5 | ) | 0 | 0 | 0 | |||||||||||||||||||||||||||||||||||
SCX | 149 | 0 | 0 | 149 | (13 | ) | 0 | 0 | (13 | ) | 136 | 0 | 136 | |||||||||||||||||||||||||||||||||||
SSB | 375 | 0 | 0 | 375 | 0 | 0 | 0 | 0 | 375 | (402 | ) | (27 | ) | |||||||||||||||||||||||||||||||||||
UAG | 195 | 0 | 0 | 195 | (203 | ) | 0 | 0 | (203 | ) | (8 | ) | (420 | ) | (428 | ) | ||||||||||||||||||||||||||||||||
Total Over the Counter | $ | 1,819 | $ | 0 | $ | 258 | $ | 2,077 | $ | (1,439 | ) | $ | 0 | $ | (232 | ) | $ | (1,671 | ) | |||||||||||||||||||||||||||||
(n) | Securities with an aggregate market value of $148 have been pledged as collateral for financial derivative instruments as governed by International Swaps and Derivatives Association, Inc. master agreements as of June 30, 2023. |
(1) | If the Fund is a seller of protection and a credit event occurs, as defined under the terms of that particular swap agreement, the Fund will either (i) pay to the buyer of protection an amount equal to the notional amount of the swap and take delivery of the referenced obligation or underlying securities comprising the referenced index or (ii) pay a net settlement amount in the form of cash, securities or other deliverable obligations equal to the notional amount of the swap less the recovery value of the referenced obligation or underlying securities comprising the referenced index. |
(2) | Implied credit spreads, represented in absolute terms, utilized in determining the market value of credit default swap agreements on corporate issues as of period end serve as indicators of the current status of the payment/performance risk and represent the likelihood or risk of default for the credit derivative. The implied credit spread of a particular referenced entity reflects the cost of buying/selling protection and may include upfront payments required to be made to enter into the agreement. Wider credit spreads represent a deterioration of the referenced entity’s credit soundness and a greater likelihood or risk of default or other credit event occurring as defined under the terms of the agreement. |
(3) | The maximum potential amount the Fund could be required to pay as a seller of credit protection or receive as a buyer of credit protection if a credit event occurs as defined under the terms of that particular swap agreement. |
(4) | The prices and resulting values for credit default swap agreements serve as indicators of the current status of the payment/performance risk and represent the likelihood of an expected liability (or profit) for the credit derivative should the notional amount of the swap agreement be closed/sold as of the period end. Increasing market values, in absolute terms when compared to the notional amount of the swap, represent a deterioration of the underlying referenced instrument’s credit soundness and a greater likelihood or risk of default or other credit event occurring as defined under the terms of the agreement. |
(5) | Net Exposure represents the net receivable/(payable) that would be due from/to the counterparty in the event of default. Exposure from OTC derivatives can only be netted across transactions governed under the same master agreement with the same legal entity. See Note 8, Master Netting Arrangements, in the Notes to Financial Statements for more information. |
108 | PIMCO CLOSED-END FUNDS | See Accompanying Notes |
| June 30, 2023 |
Derivatives not accounted for as hedging instruments | ||||||||||||||||||||||||
Commodity Contracts | Credit Contracts | Equity Contracts | Foreign Exchange Contracts | Interest Rate Contracts | Total | |||||||||||||||||||
Financial Derivative Instruments - Assets | ||||||||||||||||||||||||
Exchange-traded or centrally cleared | ||||||||||||||||||||||||
Futures | $ | 0 | $ | 0 | $ | 0 | $ | 0 | $ | 16 | $ | 16 | ||||||||||||
Swap Agreements | 0 | 145 | 0 | 0 | 1,127 | 1,272 | ||||||||||||||||||
| $ | 0 | $ | 145 | $ | 0 | $ | 0 | $ | 1,143 | $ | 1,288 | |||||||||||||
Over the counter | ||||||||||||||||||||||||
Forward Foreign Currency Contracts | $ | 0 | $ | 0 | $ | 0 | $ | 1,819 | $ | 0 | $ | 1,819 | ||||||||||||
Swap Agreements | 0 | 258 | 0 | 0 | 0 | 258 | ||||||||||||||||||
| $ | 0 | $ | 258 | $ | 0 | $ | 1,819 | $ | 0 | $ | 2,077 | |||||||||||||
| $ | 0 | $ | 403 | $ | 0 | $ | 1,819 | $ | 1,143 | $ | 3,365 | |||||||||||||
Financial Derivative Instruments - Liabilities | ||||||||||||||||||||||||
Exchange-traded or centrally cleared | ||||||||||||||||||||||||
Futures | $ | 0 | $ | 0 | $ | 0 | $ | 0 | $ | 9 | $ | 9 | ||||||||||||
Swap Agreements | 0 | 0 | 0 | 0 | 1,843 | 1,843 | ||||||||||||||||||
| $ | 0 | $ | 0 | $ | 0 | $ | 0 | $ | 1,852 | $ | 1,852 | |||||||||||||
Over the counter | ||||||||||||||||||||||||
Forward Foreign Currency Contracts | $ | 0 | $ | 0 | $ | 0 | $ | 1,439 | $ | 0 | $ | 1,439 | ||||||||||||
Swap Agreements | 0 | 232 | 0 | 0 | 0 | 232 | ||||||||||||||||||
| $ | 0 | $ | 232 | $ | 0 | $ | 1,439 | $ | 0 | $ | 1,671 | |||||||||||||
| $ | 0 | $ | 232 | $ | 0 | $ | 1,439 | $ | 1,852 | $ | 3,523 | |||||||||||||
Derivatives not accounted for as hedging instruments | ||||||||||||||||||||||||
Commodity Contracts | Credit Contracts | Equity Contracts | Foreign Exchange Contracts | Interest Rate Contracts | Total | |||||||||||||||||||
Net Realized Gain (Loss) on Financial Derivative Instruments | ||||||||||||||||||||||||
Exchange-traded or centrally cleared | ||||||||||||||||||||||||
Swap Agreements | $ | 0 | $ | 294 | $ | 0 | $ | 0 | $ | 3,901 | $ | 4,195 | ||||||||||||
Over the counter | ||||||||||||||||||||||||
Forward Foreign Currency Contracts | $ | 0 | $ | 0 | $ | 0 | $ | (6,026 | ) | $ | 0 | $ | (6,026 | ) | ||||||||||
Swap Agreements | 0 | 316 | 0 | 0 | 5 | 321 | ||||||||||||||||||
| $ | 0 | $ | 316 | $ | 0 | $ | (6,026 | ) | $ | 5 | $ | (5,705 | ) | |||||||||||
| $ | 0 | $ | 610 | $ | 0 | $ | (6,026 | ) | $ | 3,906 | $ | (1,510 | ) | |||||||||||
Net Change in Unrealized Appreciation (Depreciation) on Financial Derivative Instruments | ||||||||||||||||||||||||
Exchange-traded or centrally cleared | ||||||||||||||||||||||||
Futures | $ | 0 | $ | 0 | $ | 0 | $ | 0 | $ | 2,029 | $ | 2,029 | ||||||||||||
Swap Agreements | 0 | 4,253 | 0 | 0 | (5,155 | ) | (902 | ) | ||||||||||||||||
| $ | 0 | $ | 4,253 | $ | 0 | $ | 0 | $ | (3,126 | ) | $ | 1,127 | ||||||||||||
Over the counter | ||||||||||||||||||||||||
Forward Foreign Currency Contracts | $ | 0 | $ | 0 | $ | 0 | $ | (1,033 | ) | $ | 0 | $ | (1,033 | ) | ||||||||||
Swap Agreements | 0 | 104 | 0 | 0 | 159 | 263 | ||||||||||||||||||
| $ | 0 | $ | 104 | $ | 0 | $ | (1,033 | ) | $ | 159 | $ | (770 | ) | |||||||||||
| $ | 0 | $ | 4,357 | $ | 0 | $ | (1,033 | ) | $ | (2,967 | ) | $ | 357 | |||||||||||
| See Accompanying Notes | ANNUAL REPORT | | | JUNE 30, 2023 | 109 |
Consolidated Schedule of Investments | PIMCO Dynamic Income Opportunities Fund | (Cont.) |
Category and Subcategory | Level 1 | Level 2 | Level 3 | Fair Value at 06/30/2023 | ||||||||||||
Investments in Securities, at Value | ||||||||||||||||
Loan Participations and Assignments | $ | 0 | $ | 354,243 | $ | 225,406 | $ | 579,649 | ||||||||
Corporate Bonds & Notes | ||||||||||||||||
Banking & Finance | 0 | 198,222 | 0 | 198,222 | ||||||||||||
Industrials | 0 | 280,171 | 0 | 280,171 | ||||||||||||
Utilities | 0 | 30,267 | 0 | 30,267 | ||||||||||||
Convertible Bonds & Notes | ||||||||||||||||
Banking & Finance | 0 | 22,780 | 0 | 22,780 | ||||||||||||
Industrials | 0 | 1,896 | 0 | 1,896 | ||||||||||||
Municipal Bonds & Notes | ||||||||||||||||
Puerto Rico | 0 | 22,610 | 0 | 22,610 | ||||||||||||
West Virginia | 0 | 2,364 | 0 | 2,364 | ||||||||||||
U.S. Government Agencies | 0 | 25,890 | 0 | 25,890 | ||||||||||||
Non-Agency Mortgage-Backed Securities | 0 | 754,478 | 496 | 754,974 | ||||||||||||
Asset-Backed Securities | 0 | 263,323 | 30,821 | 294,144 | ||||||||||||
Sovereign Issues | 0 | 17,851 | 0 | 17,851 | ||||||||||||
Common Stocks | ||||||||||||||||
Communication Services | 673 | 0 | 0 | 673 | ||||||||||||
Financials | 5,816 | 0 | 15,001 | 20,817 | ||||||||||||
Industrials | 0 | 0 | 12,134 | 12,134 | ||||||||||||
Real Estate | 90 | 0 | 0 | 90 | ||||||||||||
Rights | ||||||||||||||||
Financials | 0 | 0 | 324 | 324 | ||||||||||||
Warrants | ||||||||||||||||
Financials | 0 | 0 | 494 | 494 | ||||||||||||
Preferred Securities | ||||||||||||||||
Banking & Finance | 0 | 36 | 0 | 36 | ||||||||||||
Financials | 0 | 1,930 | 0 | 1,930 | ||||||||||||
Category and Subcategory | Level 1 | Level 2 | Level 3 | Fair Value at 06/30/2023 | ||||||||||||
Industrials | $ | 0 | $ | 0 | $ | 9,924 | $ | 9,924 | ||||||||
Real Estate Investment Trusts | ||||||||||||||||
Financials | 32,863 | 0 | 0 | 32,863 | ||||||||||||
Short-Term Instruments | ||||||||||||||||
Repurchase Agreements | 0 | 85,700 | 0 | 85,700 | ||||||||||||
Short-Term Notes | 0 | 3,101 | 331 | 3,432 | ||||||||||||
U.S. Treasury Bills | 0 | 13,182 | 0 | 13,182 | ||||||||||||
Total Investments | $ | 39,442 | $ | 2,078,044 | $ | 294,931 | $ | 2,412,417 | ||||||||
Financial Derivative Instruments - Assets | ||||||||||||||||
Exchange-traded or centrally cleared | 0 | 1,288 | 0 | 1,288 | ||||||||||||
Over the counter | 0 | 2,077 | 0 | 2,077 | ||||||||||||
| $ | 0 | $ | 3,365 | $ | 0 | $ | 3,365 | |||||||||
Financial Derivative Instruments - Liabilities | ||||||||||||||||
Exchange-traded or centrally cleared | 0 | (1,852 | ) | 0 | (1,852 | ) | ||||||||||
Over the counter | 0 | (1,671 | ) | 0 | (1,671 | ) | ||||||||||
| $ | 0 | $ | (3,523 | ) | $ | 0 | $ | (3,523 | ) | |||||||
Total Financial Derivative Instruments | $ | 0 | $ | (158 | ) | $ | 0 | $ | (158 | ) | ||||||
Totals | $ | 39,442 | $ | 2,077,886 | $ | 294,931 | $ | 2,412,259 | ||||||||
Category and Subcategory | Beginning Balance at 06/30/2022 | Net Purchases | Net Sales/ Settlements | Accrued Discounts/ (Premiums) | Realized Gain/(Loss) | Net Change in Unrealized Appreciation/ (Depreciation) (1) | Transfers into Level 3 | Transfers out of Level 3 | Ending Balance at 06/30/2023 | Net Change in Unrealized Appreciation/ (Depreciation) on Investments Held at 06/30/2023 (1) | ||||||||||||||||||||||||||||||
Investments in Securities, at Value | ||||||||||||||||||||||||||||||||||||||||
Loan Participations and Assignments | $ | 219,124 | $ | 133,608 | $ | (91,559 | ) | $ | 671 | $ | (27,373 | ) | $ | 8,386 | $ | 11,435 | $ | (28,886 | ) | $ | 225,406 | $ | (6,461 | ) | ||||||||||||||||
Corporate Bonds & Notes | ||||||||||||||||||||||||||||||||||||||||
Industrials | 105,768 | 1,287 | 0 | 387 | 0 | (9,172 | ) | 0 | (98,270 | ) | 0 | 0 | ||||||||||||||||||||||||||||
Non-Agency Mortgage-Backed Securities | 701 | 0 | 0 | 0 | 0 | (422 | ) | 217 | 0 | 496 | (422 | ) | ||||||||||||||||||||||||||||
Asset-Backed Securities | 51,484 | 0 | (1,422 | ) | 318 | (761 | ) | (18,798 | ) | 0 | 0 | 30,821 | (19,459 | ) | ||||||||||||||||||||||||||
Common Stocks | ||||||||||||||||||||||||||||||||||||||||
Financials | 18,219 | 0 | 0 | 0 | 0 | (3,218 | ) | 0 | 0 | 15,001 | (3,218 | ) | ||||||||||||||||||||||||||||
Industrials | 14,859 | 801 | (306 | ) | 0 | 0 | (3,220 | ) | 0 | 0 | 12,134 | (417 | ) | |||||||||||||||||||||||||||
Rights | ||||||||||||||||||||||||||||||||||||||||
Financials | 324 | 0 | 0 | 0 | 0 | 0 | 0 | 0 | 324 | 0 | ||||||||||||||||||||||||||||||
Warrants | ||||||||||||||||||||||||||||||||||||||||
Financials | 341 | 0 | 0 | 0 | 0 | 153 | 0 | 0 | 494 | 153 | ||||||||||||||||||||||||||||||
Preferred Securities | ||||||||||||||||||||||||||||||||||||||||
Industrials | 12,445 | 0 | 0 | 0 | 0 | (2,521 | ) | 0 | 0 | 9,924 | (2,521 | ) | ||||||||||||||||||||||||||||
Short-Term Instruments | ||||||||||||||||||||||||||||||||||||||||
Short-Term Notes | 0 | 314 | 0 | 0 | 0 | 17 | 0 | 0 | 331 | 16 | ||||||||||||||||||||||||||||||
Totals | $ | 423,265 | $ | 136,010 | $ | (93,287 | ) | $ | 1,376 | $ | (28,134 | ) | $ | (28,795 | ) | $ | �� 11,652 | $ | (127,156 | ) | $ | 294,931 | $ | (32,329 | ) | |||||||||||||||
110 | PIMCO CLOSED-END FUNDS | See Accompanying Notes |
| June 30, 2023 |
Category and Subcategory | Ending Balance at 06/30/2023 | Valuation Technique | Unobservable Inputs | (% Unless Noted Otherwise) | ||||||||||||||||
Input Value(s) | Weighted Average | |||||||||||||||||||
Investments in Securities, at Value | ||||||||||||||||||||
Loan Participations and Assignments | $ | 42,973 | Comparable Multiple | EBITDA Multiple | X | 11.000 | — | |||||||||||||
| 62,692 | Discounted Cash Flow | Discount Rate | 6.540-9.000 | 8.041 | ||||||||||||||||
| 33,245 | Expect Recovery Valuation | Comparable Bond Price | 60.000 | — | ||||||||||||||||
| 851 | Indicative Market Quotation | Price | 7.123 | — | ||||||||||||||||
| 4,968 | Other Valuation Techniques (2) | — | — | — | ||||||||||||||||
| 34,334 | Third Party Vendor | Broker Quote | 91.000-98.750 | 95.774 | ||||||||||||||||
| 10,159 | Recent Transaction | Price | 98.000 | — | ||||||||||||||||
| 31,632 | Recent Transaction | Purchase Price | 97.500-100.000 | 99.505 | ||||||||||||||||
| 4,552 | Reference Instruments | Third Party Vendor | 42.000 | — | ||||||||||||||||
Non-Agency Mortgage-Backed Securities | 278 | Discounted Cash Flow | Discount Rate | 9.000 | — | |||||||||||||||
| 218 | Fair Value of Odd Lot Positions | Adjustment Factor | 2.500 | — | ||||||||||||||||
Asset-Backed Securities | 30,821 | Discounted Cash Flow | Discount Rate | 10.000-27.500 | 19.610 | |||||||||||||||
Common Stocks | ||||||||||||||||||||
Financials | 35 | Option Pricing Model | Volatility | 56.314 | — | |||||||||||||||
| 14,966 | Indicative Market Quotation | Broker Quote | $ | 23.000 | — | |||||||||||||||
Industrials | 6,186 | Discounted Cash Flow | Discount Rate | 14.975 | — | |||||||||||||||
| 5,948 | Indicative Market Quotation | Broker Quote | $ | 15.250 | — | |||||||||||||||
Rights | ||||||||||||||||||||
Financials | 324 | Indicative Market Quotation | Broker Quote | $ | 4.750 | — | ||||||||||||||
Warrants | ||||||||||||||||||||
Financials | 494 | Indicative Market Quotation | Broker Quote | $ | 7.250 | — | ||||||||||||||
Preferred Securities | ||||||||||||||||||||
Industrials | 9,924 | Comparable Multiple/ Discounted Cash Flow | Book Value Multiple/ Discount Rate Total | X/ | % | 0.350/27.749 | — | |||||||||||||
Short-Term Instruments | ||||||||||||||||||||
Short-Term Notes | 331 | Proxy Pricing | Base Price | 100.868 | — | |||||||||||||||
Total | $ | 294,931 | ||||||||||||||||||
(1) | Any difference between Net Change in Unrealized Appreciation/(Depreciation) and Net Change in Unrealized Appreciation/(Depreciation) on Investments Held at June 30, 2023 may be due to an investment no longer held or categorized as Level 3 at period end. |
(2) | Includes valuation techniques not defined in the Notes to Financial Statements as securities valued using such techniques are not considered significant to the Fund. |
| See Accompanying Notes | ANNUAL REPORT | | | JUNE 30, 2023 | 111 |
Notes to Financial Statements |
Fund Name | Formation Date | |||||||
| PCM Fund, Inc. | June 23,1993 | |||||||
PIMCO Global StocksPLUS ® | February 16, 2005 | |||||||
| PIMCO Strategic Income Fund, Inc. | December 9, 1993 | |||||||
| PIMCO Access Income Fund | October 1, 2021 | |||||||
| PIMCO Dynamic Income Fund | January 19, 2011 | |||||||
| PIMCO Dynamic Income Opportunities Fund | December 23, 2019 | |||||||
112 | PIMCO CLOSED-END FUNDS |
| June 30, 2023 |
Distribution Frequency | ||||||||||||
Fund Name | Declared | Distributed | ||||||||||
| PCM Fund, Inc. | Monthly | Monthly | ||||||||||
PIMCO Global StocksPLUS ® | Monthly | Monthly | ||||||||||
| PIMCO Strategic Income Fund, Inc. | Monthly | Monthly | ||||||||||
| PIMCO Access Income Fund | Monthly | Monthly | ||||||||||
| PIMCO Dynamic Income Fund | Monthly | Monthly | ||||||||||
| PIMCO Dynamic Income Opportunities Fund | Monthly | Monthly | ||||||||||
ANNUAL REPORT | | | JUNE 30, 2023 | 113 |
Notes to Financial Statements | (Cont.) |
114 | PIMCO CLOSED-END FUNDS |
| June 30, 2023 |
ANNUAL REPORT | | | JUNE 30, 2023 | 115 |
Notes to Financial Statements | (Cont.) |
∎ | Level 1 — Quoted prices (unadjusted) in active markets or exchanges for identical assets and liabilities. |
∎ | Level 2 — Significant other observable inputs, which may include, but are not limited to, quoted prices for similar assets or liabilities in markets that are active, quoted prices for identical or similar assets or liabilities in markets that are not active, inputs other than quoted prices that are observable for the assets or liabilities (such as interest rates, yield curves, volatilities, prepayment speeds, loss severities, credit risks and default rates) or other market corroborated inputs. |
∎ | Level 3 — Significant unobservable inputs based on the best information available in the circumstances, to the extent observable inputs are not available, which may include assumptions made by the Valuation Designee that are used in determining the fair value of investments. |
116 | PIMCO CLOSED-END FUNDS |
| June 30, 2023 |
ANNUAL REPORT | | | JUNE 30, 2023 | 117 |
Notes to Financial Statements | (Cont.) |
118 | PIMCO CLOSED-END FUNDS |
| June 30, 2023 |
Security Name | Market Value at 06/30/2022 | Purchases at cost | Proceeds from Sale | Net Realized Gain/(Loss) | Change in Unrealized Appreciation (Depreciation) | Market Value at 06/30/2023 | Dividend Income | Shares Held at 06/30/2023 | ||||||||||||||||||||||||||||
| Neiman Marcus Group Ltd. LLC | $ | 104,200 | $ | 0 | $ | 0 | $ | 0 | $ | (12,609 | ) | $ | 91,591 | $ | 0 | 602,840 | ||||||||||||||||||||
| Sierra Hamilton Holder LLC | 3 | 0 | 0 | 0 | 0 | 3 | 0 | 30,337,712 | ||||||||||||||||||||||||||||
† | A zero balance may reflect actual amounts rounding to less than one thousand. |
ANNUAL REPORT | | | JUNE 30, 2023 | 119 |
Notes to Financial Statements | (Cont.) |
120 | PIMCO CLOSED-END FUNDS |
| June 30, 2023 |
ANNUAL REPORT | | | JUNE 30, 2023 | 121 |
Notes to Financial Statements | (Cont.) |
122 | PIMCO CLOSED-END FUNDS |
| June 30, 2023 |
ANNUAL REPORT | | | JUNE 30, 2023 | 123 |
Notes to Financial Statements | (Cont.) |
124 | PIMCO CLOSED-END FUNDS |
| June 30, 2023 |
ANNUAL REPORT | | | JUNE 30, 2023 | 125 |
Notes to Financial Statements | (Cont.) |
126 | PIMCO CLOSED-END FUNDS |
| June 30, 2023 |
ANNUAL REPORT | | | JUNE 30, 2023 | 127 |
Notes to Financial Statements | (Cont.) |
PCM Fund, Inc. (PCM) | PIMCO Global StocksPLUS ® & Income Fund (PGP) | PIMCO Strategic Income Fund, Inc. (RCS) | PIMCO Access Income Fund (PAXS) | PIMCO Dynamic Income Fund (PDI) | PIMCO Dynamic Income Opportunities Fund (PDO) | |||||||||
| Asset Allocation | — | — | — | X | X | X | ||||||||
| Call | X | X | X | X | X | X | ||||||||
| Collateralized Bond Obligations, Collateralized Loan Obligations and Collateralized Debt Obligations | — | — | — | X | X | — | ||||||||
| Collateralized Loan Obligations | X | X | X | — | — | X | ||||||||
| Confidential Information Access | — | — | — | X | X | X | ||||||||
| Contingent Convertible Securities | X | X | X | X | X | X | ||||||||
| Convertible Securities | — | — | — | X | X | X | ||||||||
| Counterparty | X | X | X | X | X | X | ||||||||
| “Covenant-lite” Obligations | — | — | — | X | X | X | ||||||||
| Credit Default Swaps | X | X | X | X | X | X | ||||||||
| Credit | X | X | X | X | X | X | ||||||||
| Currency | — | — | — | X | X | X | ||||||||
| Cyber Security | X | X | X | X | X | X | ||||||||
| Debt Securities | X | X | X | X | X | X | ||||||||
| Derivatives | X | X | X | X | X | X | ||||||||
| Distressed and Defaulted Securities | — | — | — | X | X | X | ||||||||
| Distribution Rate | X | X | X | X | X | X | ||||||||
| Emerging Markets | X | X | X | X | X | X | ||||||||
| Equity Securities and Related Market | X | X | X | X | X | X | ||||||||
| Focused Investment | — | — | — | X | X | X | ||||||||
| Foreign (Non·U.S.) Investment | X | X | X | X | X | X | ||||||||
| Foreign Loan Originations | — | — | — | X | X | X | ||||||||
| High Yield Securities | X | X | X | X | X | X | ||||||||
| Inflation/Deflation | X | X | X | X | X | X | ||||||||
| Inflation-Indexed Security | X | X | X | X | X | X | ||||||||
| Interest Rate | X | X | X | X | X | X | ||||||||
| Issuer | X | X | X | X | X | X | ||||||||
| Leverage | X | X | X | X | X | X | ||||||||
| Limited Term | — | — | — | X | — | X | ||||||||
| Liquidity | X | X | X | X | X | X | ||||||||
| Loan Origination | — | — | — | X | X | X | ||||||||
| Loans and Other Indebtedness; Loan Participations and Assignments | X | X | — | X | X | X | ||||||||
| Management | X | X | X | X | X | X | ||||||||
| Market Discount | — | — | — | X | X | X | ||||||||
| Market Disruptions | X | X | X | X | X | X | ||||||||
128 | PIMCO CLOSED-END FUNDS |
| June 30, 2023 |
PCM Fund, Inc. (PCM) | PIMCO Global StocksPLUS ® & Income Fund (PGP) | PIMCO Strategic Income Fund, Inc. (RCS) | PIMCO Access Income Fund (PAXS) | PIMCO Dynamic Income Fund (PDI) | PIMCO Dynamic Income Opportunities Fund (PDO) | |||||||||
| Market | X | X | X | X | X | X | ||||||||
| Mortgage-Related and Other Asset-Backed Securities | X | X | X | X | X | X | ||||||||
| Mortgage-Related Derivative Instruments | — | — | — | X | X | X | ||||||||
Non-Diversification | — | — | — | X | — | X | ||||||||
| Operational | X | X | X | X | X | X | ||||||||
| Other Investment Companies | X | X | X | X | X | X | ||||||||
| Platform | — | — | — | X | X | X | ||||||||
| Portfolio Turnover | X | X | X | X | X | X | ||||||||
| Potential Conflicts of Interest Risk-Allocation of Investment Opportunities | — | — | — | X | X | X | ||||||||
| Preferred Securities | X | X | X | X | X | X | ||||||||
| Privacy and Data Security | — | — | — | X | X | X | ||||||||
| Private Placement and Restricted Securities | X | X | X | X | X | X | ||||||||
| Privately-Issued Mortgage-Related Securities | X | X | X | X | X | X | ||||||||
| Real Estate | — | — | — | X | X | X | ||||||||
| Regulation S Securities | — | — | — | X | — | — | ||||||||
| Regulatory Changes | X | X | X | X | X | X | ||||||||
| Regulatory Risk-Commodity Pool Operator | X | — | — | X | X | X | ||||||||
| Regulatory Risk-LIBOR | X | X | X | X | X | X | ||||||||
| Reinvestment | X | X | X | X | X | X | ||||||||
| REIT | — | — | — | X | X | — | ||||||||
| Repurchase Agreements | X | X | X | X | X | X | ||||||||
| Risk Retention Investment | — | — | — | X | X | — | ||||||||
| Securities Lending | — | — | — | — | X | — | ||||||||
| Senior Debt | X | X | X | X | X | X | ||||||||
| Short Exposure | — | — | — | — | X | — | ||||||||
| Smaller Company | — | — | — | — | X | — | ||||||||
| Sovereign Debt | X | X | X | X | X | X | ||||||||
| Special Purpose Acquisition Companies (“SPACs”) | — | — | — | — | X | — | ||||||||
| Structured Investments | X | X | X | X | X | X | ||||||||
| Subprime | — | — | — | X | X | X | ||||||||
| Subsidiary | — | — | — | X | X | X | ||||||||
| Synthetic Convertible Securities | — | — | — | X | X | X | ||||||||
| Tax | X | X | X | X | X | X | ||||||||
| U.S. Government Securities | X | X | X | X | X | X | ||||||||
| Valuation | X | X | X | X | X | X | ||||||||
Zero-Coupon Bond, Step-Ups andPayment-in-Kind | — | — | — | X | X | X | ||||||||
ANNUAL REPORT | | | JUNE 30, 2023 | 129 |
Notes to Financial Statements | (Cont.) |
130 | PIMCO CLOSED-END FUNDS |
| June 30, 2023 |
ANNUAL REPORT | | | JUNE 30, 2023 | 131 |
Notes to Financial Statements | (Cont.) |
132 | PIMCO CLOSED-END FUNDS |
| June 30, 2023 |
ANNUAL REPORT | | | JUNE 30, 2023 | 133 |
Notes to Financial Statements | (Cont.) |
134 | PIMCO CLOSED-END FUNDS |
| June 30, 2023 |
ANNUAL REPORT | | | JUNE 30, 2023 | 135 |
Notes to Financial Statements | (Cont.) |
136 | PIMCO CLOSED-END FUNDS |
| June 30, 2023 |
ANNUAL REPORT | | | JUNE 30, 2023 | 137 |
Notes to Financial Statements | (Cont.) |
138 | PIMCO CLOSED-END FUNDS |
| June 30, 2023 |
Fund Name | Annual Rate | |||||||
| PCM Fund, Inc. | 0.900% | (1) | ||||||
PIMCO Global StocksPLUS ® | 1.105% | (2) | ||||||
| PIMCO Strategic Income Fund, Inc. | 0.955% | (3) | ||||||
| PIMCO Access Income Fund | 1.250% | (4) | ||||||
| PIMCO Dynamic Income Fund | 1.100% | (5) | ||||||
| PIMCO Dynamic Income Opportunities Fund | 1.150% | (5) | ||||||
(1) | Management fees calculated based on the Fund’s average daily “total managed assets”. Total managed assets refer to the total assets of the Fund (including assets attributable to any reverse repurchase agreements, borrowings and preferred shares that may be outstanding) minus accrued liabilities (other than liabilities representing reverse repurchase agreements and borrowings). |
(2) | Management fees calculated based on the Fund’s average daily “total managed assets”. Total managed assets refer to the total assets of the Fund (including assets attributable to any preferred shares and borrowings that may be outstanding) minus accrued liabilities (other than liabilities representing borrowings). |
(3) | Management fees calculated based on the Fund’s average daily net asset value (including daily net assets attributable to any preferred shares of the Fund that may be outstanding). |
(4) | Management fees calculated based on the Fund’s average daily “total managed assets”. Total managed assets refer to the total assets of the Fund (including any assets attributable to any reverse repurchase agreements dollar rolls/buy backs, borrowings and preferred shares that may be outstanding) minus accrued liabilities (other than liabilities representing reverse repurchase agreements, dollar rolls/buy backs, and borrowings). |
(5) | Management fees calculated based on the Fund’s average daily “total managed assets.” Total managed assets include total assets of the Fund (including assets attributable to any reverse repurchase agreements, dollar rolls, borrowings and preferred shares that may be outstanding) minus accrued liabilities (other than liabilities representing reverse repurchase agreements, dollar rolls and borrowings). |
ANNUAL REPORT | | | JUNE 30, 2023 | 139 |
Notes to Financial Statements | (Cont.) |
140 | PIMCO CLOSED-END FUNDS |
| June 30, 2023 |
ANNUAL REPORT | | | JUNE 30, 2023 | 141 |
Notes to Financial Statements | (Cont.) |
Fund Name | Purchases | Sales | Realized Gain/(Loss) | |||||||||||||
| PCM Fund, Inc. | $ | 0 | $ | 4,573 | $ | (53 | ) | |||||||||
PIMCO Global StocksPLUS ® | 129 | 3,663 | (58 | ) | ||||||||||||
| PIMCO Strategic Income Fund, Inc. | 3,517 | 6,837 | (176 | ) | ||||||||||||
| PIMCO Access Income Fund | 3,764 | 33,994 | (1,402 | ) | ||||||||||||
| PIMCO Dynamic Income Fund | 0 | 102,196 | (1,151 | ) | ||||||||||||
| PIMCO Dynamic Income Opportunities Fund | 289 | 67,813 | (2,224 | ) | ||||||||||||
† | A zero balance may reflect actual amounts rounding to less than one thousand. |
U.S. Government/Agency | All Other | |||||||||||||||||||
Fund Name | Purchases | Sales | Purchases | Sales | ||||||||||||||||
| PCM Fund, Inc. | $ | 0 | $ | 0 | $ | 29,170 | $ | 31,300 | ||||||||||||
PIMCO Global StocksPLUS ® | 612,043 | 605,933 | 18,242 | 37,773 | ||||||||||||||||
| PIMCO Strategic Income Fund, Inc. | 3,103,276 | 2,915,748 | 64,710 | 107,993 | ||||||||||||||||
| PIMCO Access Income Fund | 1,508 | 862 | 332,367 | 386,837 | ||||||||||||||||
| PIMCO Dynamic Income Fund | 5,437 | 3,369 | 1,861,277 | 1,491,786 | ||||||||||||||||
| PIMCO Dynamic Income Opportunities Fund | 4,306 | 10,394 | 435,420 | 839,563 | ||||||||||||||||
† | A zero balance may reflect actual amounts rounding to less than one thousand. |
142 | PIMCO CLOSED-END FUNDS |
| June 30, 2023 |
PDI | PDO | |||||||||||||||||||
Year Ended 06/30/23 | Year Ended 06/30/22 | Year Ended 06/30/23 | Year Ended 06/30/22 | |||||||||||||||||
| Common Shares registered (aggregate $) | $ | 1,000,000,000 | $ | 1,000,000,000 | $ | 500,000,000 | $ | 0 | ||||||||||||
| Common Shares sold | 33,640,810 | 7,210,365 | 37,311 | 0 | ||||||||||||||||
| Common Shares sold in Reorganization | 0 | 147,078,552 | N/A | N/A | ||||||||||||||||
| Offering proceeds (net of offering costs) | 659,396,856 | 181,490,778 | 526,677 | 0 | ||||||||||||||||
| Offering proceeds (net of offering costs) in Reorganization | 0 | 3,562,154,298 | N/A | N/A | ||||||||||||||||
ANNUAL REPORT | | | JUNE 30, 2023 | 143 |
Notes to Financial Statements | (Cont.) |
Fund name | Subsidiary | Date of Formation | Subsidiary % of Consolidated Fund Net Assets † | |||||||||||
| PIMCO Access Income Fund | PAXSLS I LLC | 12/13/2021 | 2.7% | |||||||||||
| PIMCO Access Income Fund | RLM 4355 LLC | 12/13/2021 | 0.0% | |||||||||||
| PIMCO Dynamic Income Fund | PCILS I LLC | 03/07/2013 | 0.7% | |||||||||||
| PIMCO Dynamic Income Fund | PDILS I LLC | 03/12/2013 | 2.2% | |||||||||||
| PIMCO Dynamic Income Opportunities Fund | PDOLS I LLC | 01/15/2021 | 0.9% | |||||||||||
| PIMCO Dynamic Income Opportunities Fund | RLM 4365 LLC | 01/15/2021 | 0.0% | |||||||||||
† | A zero balance may reflect actual amounts rounding to less than 0.01%. |
Shares Outstanding | Net Assets | Net Assets Value Per Share | Net Unrealized Appreciation (Depreciation) | |||||||||||||||||
Acquired Fund | ||||||||||||||||||||
| PIMCO Income Opportunity Fund | 21,513 | $ | 494,490 | $ | 22.99 | $ | 2,056 | |||||||||||||
| PIMCO Dynamic Credit and Mortgage Income Fund | 154,747 | 3,067,680 | 19.82 | (31,809 | ) | |||||||||||||||
Acquiring Fund | ||||||||||||||||||||
| PIMCO Dynamic Income Fund | 73,058 | 1,769,430 | 24.22 | 1,387 | ||||||||||||||||
Post Reorganization | ||||||||||||||||||||
| Acquiring Fund | ||||||||||||||||||||
| PIMCO Dynamic Income Fund | 220,137 | 5,331,584 | 24.22 | (28,366 | ) | |||||||||||||||
144 | PIMCO CLOSED-END FUNDS |
| June 30, 2023 |
| Net Income | $ | 603,000 | ||||||
| Net realized and unrealized gain/loss | (1,013,276 | ) | ||||||
| Total increase in net assets from investments operations | $ | (410,276 | ) | |||||
Undistributed Ordinary Income (1) | Undistributed Long-Term Capital Gains | Net Tax Basis Unrealized Appreciation/ (Depreciation) (2) | Other Book-to-Tax Accounting Differences (3) | Accumulated Capital Losses (4) | Qualified Late-Year Loss Deferral - Capital (5) | Qualified Late-Year Loss Deferral - Ordinary (6) | Total Components of Distributable Earnings | |||||||||||||||||||||||||||||
| PCM Fund, Inc. | $ | 0 | $ | 0 | $ | (15,611 | ) | $ | (953 | ) | $ | (14,065 | ) | $ | 0 | $ | 0 | $ | (30,629 | ) | ||||||||||||||||
PIMCO Global StocksPLUS ® | 819 | 0 | (16,420 | ) | (782 | ) | (36,713 | ) | 0 | 0 | (53,096 | ) | ||||||||||||||||||||||||
| PIMCO Strategic Income Fund, Inc. | 0 | 0 | (52,861 | ) | (2,322 | ) | (86,089 | ) | 0 | (6,667 | ) | (147,939 | ) | |||||||||||||||||||||||
| PIMCO Access Income Fund | 0 | 0 | (162,627 | ) | (6,574 | ) | (50,404 | ) | 0 | (6,458 | ) | (226,063 | ) | |||||||||||||||||||||||
| PIMCO Dynamic Income Fund | 0 | 0 | (1,411,082 | ) | (57,941 | ) | (664,212 | ) | 0 | (134,226 | ) | (2,267,461 | ) | |||||||||||||||||||||||
| PIMCO Dynamic Income Opportunities Fund | 0 | 0 | (573,903 | ) | (14,181 | ) | (180,558 | ) | 0 | (37,294 | ) | (805,936 | ) | |||||||||||||||||||||||
† | A zero balance may reflect actual amounts rounding to less than one thousand. |
(1) | Includes undistributed short-term capital gains, if any. |
(2) | Adjusted for open wash sale loss deferrals and the accelerated recognition of unrealized gain or loss on certain futures, options and/or forward contracts for federal income tax purposes. Also adjusted for differences between book and tax realized and unrealized gain (loss) on hyperinflationary investments, swap contracts, straddle loss deferrals, passive foreign investment companies (PFICs), interest accrued on defaulted securities, return of capital distributions from underlying funds, grantor trusts and partnerships. |
(3) | Represents differences in income tax regulations and financial accounting principles generally accepted in the United States of America, mainly for distributions payable at fiscal year end. |
(4) | Capital losses available to offset future net capital gains as shown below. |
(5) | Capital losses realized during the period November 1, 2022 through June 30, 2023, which the Funds elected to defer to the following taxable year pursuant to income tax regulations. |
(6) | Specified losses realized during the period November 1, 2022 through June 30, 2023 and Ordinary losses realized during the period January 1, 2023 through June 30, 2023, which the Funds elected to defer to the following taxable year pursuant to income tax regulations. |
Short-Term | Long-Term | |||||||||||
| PCM Fund, Inc. | $ | 1,206 | $ | 12,859 | ||||||||
PIMCO Global StocksPLUS ® | 24,926 | 11,787 | ||||||||||
| PIMCO Strategic Income Fund, Inc. | 32,348 | 53,741 | ||||||||||
| PIMCO Access Income Fund | 37,291 | 13,113 | ||||||||||
| PIMCO Dynamic Income Fund* | 293,082 | 371,130 | ||||||||||
| PIMCO Dynamic Income Opportunities Fund | 20,765 | 159,793 | ||||||||||
† | A zero balance may reflect actual amounts rounding to less than one thousand. |
| * | Portion of amount represents realized loss and recognized built-in loss under IRC Sections 382-83, which is carried forward to future years to offset future realized gain subject to certain limitations. |
ANNUAL REPORT | | | JUNE 30, 2023 | 145 |
Notes to Financial Statements | (Cont.) | June 30, 2023 |
Federal Tax Cost | Unrealized Appreciation | Unrealized (Depreciation) | Net Unrealized Appreciation/ (Depreciation) (7) | |||||||||||||||||
| PCM Fund, Inc. | $ | 164,687 | $ | 12,810 | $ | (28,422 | ) | $ | (15,612 | ) | ||||||||||
PIMCO Global StocksPLUS ® | 167,065 | 20,230 | (36,580 | ) | (16,350 | ) | ||||||||||||||
| PIMCO Strategic Income Fund, Inc. | 620,210 | 45,602 | (98,523 | ) | (52,921 | ) | ||||||||||||||
| PIMCO Access Income Fund | 1,379,603 | 30,868 | (193,994 | ) | (163,126 | ) | ||||||||||||||
| PIMCO Dynamic Income Fund | 9,329,497 | 498,098 | (1,903,514 | ) | (1,405,416 | ) | ||||||||||||||
| PIMCO Dynamic Income Opportunities Fund | 2,962,404 | 50,311 | (623,924 | ) | (573,613 | ) | ||||||||||||||
† | A zero balance may reflect actual amounts rounding to less than one thousand. |
(7) | Adjusted for open wash sale loss deferrals and the accelerated recognition of unrealized gain or loss on certain futures, options, and/or forward contracts for federal income tax purposes. Also adjusted for differences between book and tax realized and unrealized gain (loss) on hyperinflationary investments, swap contracts, straddle loss deferrals, passive foreign investment companies (PFICs), interest accrued on defaulted securities, return of capital distributions from underlying funds, grantor trusts, and partnerships. |
June 30, 2023 | June 30, 2022 | |||||||||||||||||||||||||||||||
Ordinary Income Distributions (8) | Long-Term Capital Gain Distributions | Return of Capital (9) | Ordinary Income Distributions (8) | Long-Term Capital Gain Distributions | Return of Capital (9) | |||||||||||||||||||||||||||
| PCM Fund, Inc. | $ | 8,675 | $ | 0 | $ | 2,703 | $ | 10,961 | $ | 0 | $ | 303 | ||||||||||||||||||||
PIMCO Global StocksPLUS ® | 9,334 | 0 | 0 | 9,228 | 0 | 0 | ||||||||||||||||||||||||||
| PIMCO Strategic Income Fund, Inc. | 27,542 | 0 | 135 | 26,999 | 0 | 320 | ||||||||||||||||||||||||||
| PIMCO Access Income Fund | 98,875 | 0 | 0 | 20,531 | 0 | 0 | ||||||||||||||||||||||||||
| PIMCO Dynamic Income Fund | 803,703 | 0 | 0 | 391,635 | 0 | 0 | ||||||||||||||||||||||||||
| PIMCO Dynamic Income Opportunities Fund | 275,384 | 0 | 0 | 208,371 | 904 | 0 | ||||||||||||||||||||||||||
† | A zero balance may reflect actual amounts rounding to less than one thousand. |
(8) | Includes short-term capital gains distributed, if any. |
(9) | A portion of the distributions made represents a tax return of capital. Return of capital distributions have been reclassified from undistributed net investment income to paid-in capital to more appropriately conform financial accounting to tax accounting. |
| PCM Fund, Inc. | $ | 0.080000 per common share | ||||||
PIMCO Global StocksPLUS ® | $ | 0.069000 per common share | ||||||
| PIMCO Strategic Income Fund, Inc. | $ | 0.051000 per common share | ||||||
| PIMCO Access Income Fund | $ | 0.149400 per common share | ||||||
| PIMCO Dynamic Income Fund | $ | 0.220500 per common share | ||||||
| PIMCO Dynamic Income Opportunities Fund | $ | 0.127900 per common share | ||||||
146 | PIMCO CLOSED-END FUNDS |
Report of Independent Registered Public Accounting Firm |
ANNUAL REPORT | | | JUNE 30, 2023 | 147 |
Glossary: | (abbreviations that may be used in the preceding statements) | (Unaudited) |
Counterparty Abbreviations: | ||||||||||
AZD | Australia and New Zealand Banking Group | FBF | Credit Suisse International | RBC | Royal Bank of Canada | |||||
BCY | Barclays Capital, Inc. | FICC | Fixed Income Clearing Corporation | RCE | Royal Bank of Canada Europe Limited | |||||
BNY | Bank of New York Mellon | GLM | Goldman Sachs Bank USA | RCY | Royal Bank of Canada | |||||
BOA | Bank of America N.A. | GST | Goldman Sachs International | RDR | RBC Capital Markets LLC | |||||
BOM | Bank of Montreal | IND | Crédit Agricole Corporate and Investment Bank S.A. | RTA | RBC (Barbados) Trading Bank Corp. | |||||
BOS | BofA Securities, Inc. | JML | JP Morgan Securities Plc | RYL | NatWest Markets Plc | |||||
BPS | BNP Paribas S.A. | JPM | JP Morgan Chase Bank N.A. | SAL | Citigroup Global Markets, Inc. | |||||
BRC | Barclays Bank PLC | JPS | J.P. Morgan Securities LLC | SBI | Citigroup Global Markets Ltd. | |||||
BYL | Barclays Bank PLC London Branch | MBC | HSBC Bank Plc | SCX | Standard Chartered Bank, London | |||||
BYR | The Bank of Nova Scotia - Toronto | MEI | Merrill Lynch International | SOG | Societe Generale Paris | |||||
CBK | Citibank N.A. | MSB | Morgan Stanley Bank, N.A | SSB | State Street Bank and Trust Co. | |||||
CDC | Natixis Securities Americas LLC | MYC | Morgan Stanley Capital Services LLC | TDM | TD Securities (USA) LLC | |||||
CDI | Natixis Singapore | MYI | Morgan Stanley & Co. International PLC | TOR | The Toronto-Dominion Bank | |||||
CEW | Canadian Imperial Bank of Commerce World Markets | MZF | Mizuho Securities USA LLC | UAG | UBS AG Stamford | |||||
CIB | Canadian Imperial Bank of Commerce | NGF | Nomura Global Financial Products, Inc. | UBS | UBS Securities LLC | |||||
DBL | Deutsche Bank AG London | NOM | Nomura Securities International, Inc. | WFS | Wells Fargo Securities, LLC | |||||
DUB | Deutsche Bank AG | |||||||||
Currency Abbreviations: | ||||||||||
ARS | Argentine Peso | CZK | Czech Koruna | MXN | Mexican Peso | |||||
AUD | Australian Dollar | EUR | Euro | PEN | Peruvian New Sol | |||||
BRL | Brazilian Real | GBP | British Pound | PLN | Polish Zloty | |||||
CAD | Canadian Dollar | HUF | Hungarian Forint | TWD | Taiwanese Dollar | |||||
CHF | Swiss Franc | IDR | Indonesian Rupiah | USD (or $) | United States Dollar | |||||
CNH | Chinese Renminbi (Offshore) | INR | Indian Rupee | ZAR | South African Rand | |||||
CNY | Chinese Renminbi (Mainland) | JPY | Japanese Yen | |||||||
Exchange Abbreviations: | ||||||||||
CME | Chicago Mercantile Exchange | OTC | Over the Counter | |||||||
Index/Spread Abbreviations: | ||||||||||
ABX.HE | Asset-Backed Securities Index - Home Equity | EUR012M | 12 Month EUR Swap Rate | PRIME | Daily US Prime Rate | |||||
BADLARPP | Argentina Badlar Floating Rate Notes | LIBOR01M | 1 Month USD-LIBOR | S&P 500 | Standard & Poor’s 500 Index | |||||
BP0003M | 3 Month GBP-LIBOR | LIBOR03M | 3 Month USD-LIBOR | SOFR | Secured Overnight Financing Rate | |||||
EUR001M | 1 Month EUR Swap Rate | LIBOR06M | 6 Month USD-LIBOR | SONIO | Sterling Overnight Interbank Average Rate | |||||
EUR003M | 3 Month EUR Swap Rate | NDDUEAFE | MSCI EAFE Index | US0003M | ICE 3-Month USD LIBOR | |||||
EUR006M | 6 Month EUR Swap Rate | PENAAA | Penultimate AAA Sub-Index | |||||||
Other Abbreviations: | ||||||||||
ABS | Asset-Backed Security | DAC | Designated Activity Company | REMIC | Real Estate Mortgage Investment Conduit | |||||
ALT | Alternate Loan Trust | EBITDA | Earnings before Interest, Taxes, Depreciation and Amoritization | TBA | To-Be-Announced | |||||
BABs | Build America Bonds | EURIBOR | Euro Interbank Offered Rate | TBD | To-Be-Determined | |||||
BRL-CDI | Brazil Interbank Deposit Rate | LIBOR | London Interbank Offered Rate | TBD% | Interest rate to be determined when loan settles or at the time of funding | |||||
CBO | Collateralized Bond Obligation | Lunar | Monthly payment based on 28-day periods. One year consists of 13 periods. | TIIE | Tasa de Interés Interbancaria de Equilibrio “Equilibrium Interbank Interest Rate” | |||||
CDO | Collateralized Debt Obligation | OIS | Overnight Index Swap | |||||||
CLO | Collateralized Loan Obligation | PIK | Payment-in-Kind | |||||||
148 | PIMCO CLOSED-END FUNDS |
Federal Income Tax Information | (Unaudited) |
Dividend Received Deduction % | Qualified Dividend Income % | Qualified Interest Income (000s) † | Qualified Short-Term Capital Gains (000s) † | 163(j) Interest Dividends (000s) † | ||||||||||||||||||||
| PCM Fund, Inc. | 0.00% | 0.00% | $ | 8,675 | $ | 0 | $ | 7,721 | ||||||||||||||||
PIMCO Global StocksPLUS ® | 0.00% | 0.00% | 6,335 | 0 | 6,745 | |||||||||||||||||||
| PIMCO Strategic Income Fund, Inc. | 0.00% | 0.00% | 27,542 | 0 | 15,178 | |||||||||||||||||||
| PIMCO Access Income Fund | 0.00% | 1.22% | 96,619 | 0 | 62,834 | |||||||||||||||||||
| PIMCO Dynamic Income Fund | 0.00% | 0.00% | 803,703 | 0 | 3,066 | |||||||||||||||||||
| PIMCO Dynamic Income Opportunities Fund | 0.00% | 0.00% | 227,550 | 0 | 0 | |||||||||||||||||||
† | A zero balance may reflect actual amounts rounding to less than one thousand. |
199A Dividends | ||||||||
| PCM Fund, Inc. | 0.00% | |||||||
PIMCO Global StocksPLUS ® | 0.00% | |||||||
| PIMCO Strategic Income Fund, Inc. | 0.00% | |||||||
| PIMCO Access Income Fund | 0.00% | |||||||
| PIMCO Dynamic Income Fund | 0.00% | |||||||
| PIMCO Dynamic Income Opportunities Fund | 1.64% | |||||||
ANNUAL REPORT | | | JUNE 30, 2023 | 149 |
Distribution Information |
PCM Fund, Inc. | Net Investment Income* | Net Realized Capital Gains* | Paid-in Surplus or Other Capital Sources** | Total (per common share) | ||||||||||||||||
| January 2023 | $ | 0.0518 | $ | 0.0000 | $ | 0.0282 | $ | 0.0800 | ||||||||||||
| February 2023 | $ | 0.0576 | $ | 0.0000 | $ | 0.0224 | $ | 0.0800 | ||||||||||||
| March 2023 | $ | 0.0800 | $ | 0.0000 | $ | 0.0000 | $ | 0.0800 | ||||||||||||
| April 2023 | $ | 0.0727 | $ | 0.0000 | $ | 0.0073 | $ | 0.0800 | ||||||||||||
| May 2023 | $ | 0.0700 | $ | 0.0000 | $ | 0.0100 | $ | 0.0800 | ||||||||||||
| June 2023 | $ | 0.0497 | $ | 0.0000 | $ | 0.0303 | $ | 0.0800 | ||||||||||||
PIMCO Global StocksPLUS ® | Net Investment Income* | Net Realized Capital Gains* | Paid-in Surplus orOther Capital Sources** | Total (per common share) | ||||||||||||||||
| January 2023 | $ | 0.0690 | $ | 0.0000 | $ | 0.0000 | $ | 0.0690 | ||||||||||||
| February 2023 | $ | 0.0690 | $ | 0.0000 | $ | 0.0000 | $ | 0.0690 | ||||||||||||
| March 2023 | $ | 0.0690 | $ | 0.0000 | $ | 0.0000 | $ | 0.0690 | ||||||||||||
| April 2023 | $ | 0.0690 | $ | 0.0000 | $ | 0.0000 | $ | 0.0690 | ||||||||||||
| May 2023 | $ | 0.0690 | $ | 0.0000 | $ | 0.0000 | $ | 0.0690 | ||||||||||||
| June 2023 | $ | 0.0690 | $ | 0.0000 | $ | 0.0000 | $ | 0.0690 | ||||||||||||
PIMCO Strategic Income Fund, Inc. | Net Investment Income* | Net Realized Capital Gains* | Paid-in Surplus orOther Capital Sources** | Total (per common share) | ||||||||||||||||
| January 2023 | $ | 0.0445 | $ | 0.0000 | $ | 0.0065 | $ | 0.0510 | ||||||||||||
| February 2023 | $ | 0.0369 | $ | 0.0000 | $ | 0.0141 | $ | 0.0510 | ||||||||||||
| March 2023 | $ | 0.0510 | $ | 0.0000 | $ | 0.0000 | $ | 0.0510 | ||||||||||||
| April 2023 | $ | 0.0461 | $ | 0.0000 | $ | 0.0049 | $ | 0.0510 | ||||||||||||
| May 2023 | $ | 0.0450 | $ | 0.0000 | $ | 0.0060 | $ | 0.0510 | ||||||||||||
| June 2023 | $ | 0.0494 | $ | 0.0000 | $ | 0.0016 | $ | 0.0510 | ||||||||||||
PIMCO Dynamic Income Fund | Net Investment Income* | Net Realized Capital Gains* | Paid-in Surplus orOther Capital Sources** | Total (per common share) | ||||||||||||||||
| January 2023 | $ | 0.2205 | $ | 0.0000 | $ | 0.0000 | $ | 0.2205 | ||||||||||||
| February 2023 | $ | 0.2205 | $ | 0.0000 | $ | 0.0000 | $ | 0.2205 | ||||||||||||
| March 2023 | $ | 0.2205 | $ | 0.0000 | $ | 0.0000 | $ | 0.2205 | ||||||||||||
| April 2023 | $ | 0.2205 | $ | 0.0000 | $ | 0.0000 | $ | 0.2205 | ||||||||||||
| May 2023 | $ | 0.2205 | $ | 0.0000 | $ | 0.0000 | $ | 0.2205 | ||||||||||||
| June 2023 | $ | 0.2205 | $ | 0.0000 | $ | 0.0000 | $ | 0.2205 | ||||||||||||
PIMCO Dynamic Income Opportunities Fund | Net Investment Income* | Net Realized Capital Gains* | Paid-in Surplus orOther Capital Sources** | Total (per common share) | ||||||||||||||||
| January 2023 | $ | 0.1279 | $ | 0.0000 | $ | 0.0000 | $ | 0.1279 | ||||||||||||
| February 2023 | $ | 0.1279 | $ | 0.0000 | $ | 0.0000 | $ | 0.1279 | ||||||||||||
| March 2023 | $ | 0.1279 | $ | 0.0000 | $ | 0.0000 | $ | 0.1279 | ||||||||||||
| April 2023 | $ | 0.1279 | $ | 0.0000 | $ | 0.0000 | $ | 0.1279 | ||||||||||||
| May 2023 | $ | 0.1279 | $ | 0.0000 | $ | 0.0000 | $ | 0.1279 | ||||||||||||
| June 2023 | $ | 0.1279 | $ | 0.0000 | $ | 0.0000 | $ | 0.1279 | ||||||||||||
150 | PIMCO CLOSED-END FUNDS |
| (Unaudited) |
PIMCO Access Income Fund | Net Investment Income* | Net Realized Capital Gains* | Paid-in Surplus or Other Capital Sources** | Total (per common share) | ||||||||||||||||
| January 2023 | $ | 0.1494 | $ | 0.0000 | $ | 0.0000 | $ | 0.1494 | ||||||||||||
| February 2023 | $ | 0.1494 | $ | 0.0000 | $ | 0.0000 | $ | 0.1494 | ||||||||||||
| March 2023 | $ | 0.1494 | $ | 0.0000 | $ | 0.0000 | $ | 0.1494 | ||||||||||||
| April 2023 | $ | 0.1494 | $ | 0.0000 | $ | 0.0000 | $ | 0.1494 | ||||||||||||
| May 2023 | $ | 0.1494 | $ | 0.0000 | $ | 0.0000 | $ | 0.1494 | ||||||||||||
| June 2023 | $ | 0.1494 | $ | 0.0000 | $ | 0.0000 | $ | 0.1494 | ||||||||||||
| * | The source of dividends provided in the table differs, in some respects, from information presented in this report prepared in accordance with generally accepted accounting principles, or U.S. GAAP. For example, net earnings from certain interest rate swap contracts are included as a source of net investment income for purposes of Section 19(a). Accordingly, the information in the table may differ from information in the accompanying financial statements that are presented on the basis of U.S. GAAP and may differ from tax information presented in the footnotes. Amounts shown may include accumulated, as well as fiscal period net income and net profits. |
| ** | Occurs when a fund distributes an amount greater than its accumulated net income and net profits. Amounts are not reflective of a fund’s net income, yield, earnings or investment performance. |
ANNUAL REPORT | | | JUNE 30, 2023 | 151 |
Shareholder Meeting Results |
Affirmative | Withheld Authority | |||||||||||
| Election of Kathleen A. McCartney — Class II to serve until the annual meeting held during the 2025-2026 fiscal year | 7,825,685 | 533,836 | ||||||||||
Re-election of David N. Fisher† | 7,825,685 | 533,836 | ||||||||||
† | Interested Trustee |
Affirmative | Withheld Authority | |||||||||||
| Election of Kathleen A. McCartney — Class II to serve until the annual meeting held during the 2025-2026 fiscal year | 80,357,062 | 2,839,137 | ||||||||||
Re-election of Sarah E. Cogan — Class II to serve until the annual meeting held during the 2025-2026 fiscal year | 80,357,062 | 2,839,137 | ||||||||||
Re-election of E. Grace Vandecruze — Class II to serve until the annual meeting held during the 2025-2026 fiscal year | 80,357,062 | 2,839,137 | ||||||||||
Affirmative | Withheld Authority | |||||||||||
| Election of Kathleen McCartney — Class II to serve until the annual meeting held during the 2025-2026 fiscal year | 28,477,109 | 2,065,019 | ||||||||||
Election of Libby Cantrill † | 28,477,109 | 2,065,019 | ||||||||||
Re-election of E. Grace Vandecruze — Class II to serve until the annual meeting held during the 2025-2026 fiscal year | 28,477,080 | 2,065,048 | ||||||||||
Re-election of Joseph B. Kittredge, Jr. — Class II to serve until the annual meeting held during the 2025-2026 fiscal year | 28,477,080 | 2,065,048 | ||||||||||
† | Interested Trustee |
Affirmative | Withheld Authority | |||||||||||
| Election of Kathleen A. McCartney — Class I to serve until the annual meeting held during the 2023-2024 fiscal year | 7,481,996 | 474,085 | ||||||||||
Re-election of Debora A. DeCotis. — Class III to serve until the annual meeting held during the 2025-2026 fiscal year | 7,481,996 | 474,085 | ||||||||||
Re-election of Sarah E. Cogan — Class III to serve until the annual meeting held during the 2025-2026 fiscal year | 7,481,996 | 474,085 | ||||||||||
Re-election of Alan Rappaport — Class III to serve until the annual meeting held during the 2025-2026 fiscal year | 7,481,996 | 474,085 | ||||||||||
152 | PIMCO CLOSED-END FUNDS |
| (Unaudited) |
Affirmative | Withheld Authority | |||||||||||
| Election of Kathleen A. McCartney — Class I to serve until the annual meeting held during the 2024-2025 fiscal year | 181,414,045 | 6,675,977 | ||||||||||
Re-election of E. Grace Vandecruze — Class II to serve until the annual meeting held during the 2025-2026 fiscal year | 181,412,295 | 6,677,727 | ||||||||||
Re-election of Joseph B. Kittredge, Jr. — Class II to serve until the annual meeting held during the 2025-2026 fiscal year | 181,415,878 | 6,674,144 | ||||||||||
Re-election of David N. Fisher† | 181,414,776 | 6,675,246 | ||||||||||
† | Interested Trustee |
ANNUAL REPORT | | | JUNE 30, 2023 | 153 |
Changes to Board of Trustees | (Unaudited) |
154 | PIMCO CLOSED-END FUNDS |
Dividend Reinvestment Plan | (Unaudited) |
ANNUAL REPORT | | | JUNE 30, 2023 | 155 |
Dividend Reinvestment Plan | (Cont.) | (Unaudited) |
156 | PIMCO CLOSED-END FUNDS |
Additional Information Regarding the Funds | (Unaudited) |
| 1. | Effective December 22, 2022, the non-fundamental investment disclosure guideline governing the amount of leverage the PIMCO Global StocksPLUS & Income Fund can maintain and related asset segregation and coverage requirements that are no longer applicable to the Fund were removed. The Fund remains subject to other applicable leverage limitations under the Investment Company Act of 1940, as amended (the “1940 Act”), and related rules. |
| 2. | The PIMCO Dynamic Income Opportunities Fund may originate loans. Related disclosure has been added to the Fund’s principal investment strategies and principal risks. Please see below for further details: |
ANNUAL REPORT | | | JUNE 30, 2023 | 157 |
Additional Information Regarding the Funds | (Cont.) |
| 3. | The following principal risk disclosure has been added with respect to the PIMCO Dynamic Income Opportunities Fund: |
158 | PIMCO CLOSED-END FUNDS |
| (Unaudited) |
Fund Name | Total Commissions Paid | Commissions Paid to Affiliated Brokers | ||||||||||
| PCM Fund, Inc. | $ | 436 | 0 | |||||||||
PIMCO Global StocksPLUS ® | 17,452 | 0 | ||||||||||
| PIMCO Strategic Income Fund, Inc. | 529 | 0 | ||||||||||
| PIMCO Access Income Fund | 269 | 0 | ||||||||||
| PIMCO Dynamic Income Fund | 9,213 | 0 | ||||||||||
| PIMCO Dynamic Income Opportunities Fund | 15,739 | 0 | ||||||||||
ANNUAL REPORT | | | JUNE 30, 2023 | 159 |
Principal Investment Strategies |
160 | PIMCO CLOSED-END FUNDS |
| (Unaudited) |
ANNUAL REPORT | | | JUNE 30, 2023 | 161 |
Principal Investment Strategies | (Cont.) |
162 | PIMCO CLOSED-END FUNDS |
| (Unaudited) |
ANNUAL REPORT | | | JUNE 30, 2023 | 163 |
Principal Investment Strategies | (Cont.) |
164 | PIMCO CLOSED-END FUNDS |
| (Unaudited) |
ANNUAL REPORT | | | JUNE 30, 2023 | 165 |
Principal Investment Strategies | (Cont.) |
166 | PIMCO CLOSED-END FUNDS |
| (Unaudited) |
ANNUAL REPORT | | | JUNE 30, 2023 | 167 |
Principal Investment Strategies | (Cont.) |
168 | PIMCO CLOSED-END FUNDS |
| (Unaudited) |
ANNUAL REPORT | | | JUNE 30, 2023 | 169 |
Principal Investment Strategies | (Cont.) |
170 | PIMCO CLOSED-END FUNDS |
| (Unaudited) |
ANNUAL REPORT | | | JUNE 30, 2023 | 171 |
Principal Investment Strategies | (Cont.) |
172 | PIMCO CLOSED-END FUNDS |
| (Unaudited) |
ANNUAL REPORT | | | JUNE 30, 2023 | 173 |
Principal Investment Strategies | (Cont.) |
174 | PIMCO CLOSED-END FUNDS |
| (Unaudited) |
ANNUAL REPORT | | | JUNE 30, 2023 | 175 |
Principal Investment Strategies | (Cont.) |
176 | PIMCO CLOSED-END FUNDS |
| (Unaudited) |
ANNUAL REPORT | | | JUNE 30, 2023 | 177 |
Principal Investment Strategies | (Cont.) |
178 | PIMCO CLOSED-END FUNDS |
| (Unaudited) |
ANNUAL REPORT | | | JUNE 30, 2023 | 179 |
Principal Investment Strategies | (Cont.) |
180 | PIMCO CLOSED-END FUNDS |
| (Unaudited) |
ANNUAL REPORT | | | JUNE 30, 2023 | 181 |
Principal Investment Strategies | (Cont.) |
182 | PIMCO CLOSED-END FUNDS |
| (Unaudited) |
ANNUAL REPORT | | | JUNE 30, 2023 | 183 |
Principal Investment Strategies | (Cont.) |
184 | PIMCO CLOSED-END FUNDS |
| (Unaudited) |
ANNUAL REPORT | | | JUNE 30, 2023 | 185 |
Principal Investment Strategies | (Cont.) |
186 | PIMCO CLOSED-END FUNDS |
| (Unaudited) |
ANNUAL REPORT | | | JUNE 30, 2023 | 187 |
Principal Risks of the Funds |
188 | PIMCO CLOSED-END FUNDS |
| (Unaudited) |
ANNUAL REPORT | | | JUNE 30, 2023 | 189 |
Principal Risks of the Funds | (Cont.) |
190 | PIMCO CLOSED-END FUNDS |
| (Unaudited) |
ANNUAL REPORT | | | JUNE 30, 2023 | 191 |
Principal Risks of the Funds | (Cont.) |
192 | PIMCO CLOSED-END FUNDS |
| (Unaudited) |
ANNUAL REPORT | | | JUNE 30, 2023 | 193 |
Principal Risks of the Funds | (Cont.) |
194 | PIMCO CLOSED-END FUNDS |
| (Unaudited) |
ANNUAL REPORT | | | JUNE 30, 2023 | 195 |
Principal Risks of the Funds | (Cont.) |
196 | PIMCO CLOSED-END FUNDS |
| (Unaudited) |
ANNUAL REPORT | | | JUNE 30, 2023 | 197 |
Principal Risks of the Funds | (Cont.) |
198 | PIMCO CLOSED-END FUNDS |
| (Unaudited) |
ANNUAL REPORT | | | JUNE 30, 2023 | 199 |
Principal Risks of the Funds | (Cont.) |
200 | PIMCO CLOSED-END FUNDS |
| (Unaudited) |
∎ | the likelihood of greater volatility of NAV and market price of Common Shares, and of the investment return to Common Shareholders, than a comparable portfolio without leverage; |
∎ | the possibility either that Common Share dividends will fall if the interest and other costs of leverage rise, or that dividends paid on Common Shares will fluctuate because such costs vary over time; and |
∎ | the effects of leverage in a declining market or a rising interest rate environment, as leverage is likely to cause a greater decline in the NAV of the Common Shares than if the Fund were not leveraged. |
ANNUAL REPORT | | | JUNE 30, 2023 | 201 |
Principal Risks of the Funds | (Cont.) |
202 | PIMCO CLOSED-END FUNDS |
| (Unaudited) |
ANNUAL REPORT | | | JUNE 30, 2023 | 203 |
Principal Risks of the Funds | (Cont.) |
204 | PIMCO CLOSED-END FUNDS |
| (Unaudited) |
ANNUAL REPORT | | | JUNE 30, 2023 | 205 |
Principal Risks of the Funds | (Cont.) |
206 | PIMCO CLOSED-END FUNDS |
| (Unaudited) |
ANNUAL REPORT | | | JUNE 30, 2023 | 207 |
Principal Risks of the Funds | (Cont.) |
208 | PIMCO CLOSED-END FUNDS |
| (Unaudited) |
ANNUAL REPORT | | | JUNE 30, 2023 | 209 |
Principal Risks of the Funds | (Cont.) |
210 | PIMCO CLOSED-END FUNDS |
| (Unaudited) |
ANNUAL REPORT | | | JUNE 30, 2023 | 211 |
Principal Risks of the Funds | (Cont.) |
212 | PIMCO CLOSED-END FUNDS |
| (Unaudited) |
ANNUAL REPORT | | | JUNE 30, 2023 | 213 |
Principal Risks of the Funds | (Cont.) |
214 | PIMCO CLOSED-END FUNDS |
| (Unaudited) |
ANNUAL REPORT | | | JUNE 30, 2023 | 215 |
Principal Risks of the Funds | (Cont.) |
216 | PIMCO CLOSED-END FUNDS |
| (Unaudited) |
ANNUAL REPORT | | | JUNE 30, 2023 | 217 |
Principal Risks of the Funds | (Cont.) |
218 | PIMCO CLOSED-END FUNDS |
| (Unaudited) |
ANNUAL REPORT | | | JUNE 30, 2023 | 219 |
Principal Risks of the Funds | (Cont.) | (Unaudited) |
220 | PIMCO CLOSED-END FUNDS |
Risk Management Strategies 1 | (Unaudited) |
ANNUAL REPORT | | | JUNE 30, 2023 | 221 |
Effects of Leverage 1 | (Unaudited) |
PCM Fund, Inc. (PCM) | PIMCO Global StocksPLUS ® & Income Fund (PGP) | PIMCO Strategic Income Fund, Inc. (RCS) | PIMCO Dynamic Income Fund (PDI) | PIMCO Dynamic Income Opportunities Fund (PDO) | PIMCO Access Income Fund (PAXS) | |||||||||||||||||||||||
| Reverse Repurchase Agreements as a Percentage of Total Managed Assets (Including Assets Attributable to Reverse Repurchase Agreements) | 45.72 | % | 30.86 | % | 38.03 | % | 42.06 | % | 44.94 | % | 43.79 | % | ||||||||||||||||
| Estimated Annual Effective Interest Expense Rate Payable by Fund on Reverse Repurchase Agreements | 4.59 | % | 3.78 | % | 3.67 | % | 4.21 | % | 4.22 | % | 4.42 | % | ||||||||||||||||
| Annual Return Fund Portfolio Must Experience (net of expenses) to Cover Estimated Annual Effective Interest Expense Rate on Reverse Repurchase Agreements | 2.10 | % | 1.17 | % | 1.40 | % | 1.77 | % | 1.90 | % | 1.94 | % | ||||||||||||||||
| Common Share Total Return for (10.00)% Assumed Portfolio Total Return | (22.29 | )% | (16.15 | )% | (18.39 | )% | (20.32 | )% | (21.61 | )% | (21.23 | )% | ||||||||||||||||
| Common Share Total Return for (5.00)% Assumed Portfolio Total Return | (13.08 | )% | (8.92 | )% | (10.32 | )% | (11.69 | )% | (12.53 | )% | (12.34 | )% | ||||||||||||||||
| Common Share Total Return for 0.00% Assumed Portfolio Total Return | (3.87 | )% | (1.69 | )% | (2.25 | )% | (3.06 | )% | (3.45 | )% | (3.45 | )% | ||||||||||||||||
| Common Share Total Return for 5.00% Assumed Portfolio Total Return | 5.34 | % | 5.55 | % | 5.81 | % | 5.57 | % | 5.63 | % | 5.45 | % | ||||||||||||||||
| Common Share Total Return for 10.00% Assumed Portfolio Total Return | 14.55 | % | 12.78 | % | 13.88 | % | 14.20 | % | 14.72 | % | 14.34 | % | ||||||||||||||||
222 | PIMCO CLOSED-END FUNDS |
Fundamental Investment Restrictions 1 | (Unaudited) |
| (1) | Issue senior securities (including borrowing money for other than temporary purposes) in excess of the limits set forth in the 1940 Act; or pledge its assets other than to secure such issuances or borrowings or in connection with permitted transactions involving derivative instruments, when-issued and forward commitment transactions and other permitted investment strategies. |
| (2) | Make investments for the purpose of exercising control or management. |
| (3) | Purchase or sell real estate, commodities or commodity contracts; provided that the Fund may invest in securities secured by real estate or interests therein or issued by companies that invest in real estate or interests therein, and the Fund may purchase and sell financial futures contracts and options thereon and other derivative instruments. |
| (4) | Underwrite securities of other issuers except insofar as the Fund may be deemed an underwriter under the Securities Act of 1933 in selling portfolio securities. |
| (5) | Make loans to other persons, except (i) to the extent that the Fund may be deemed to be making loans by purchasing debt securities and entering into repurchase agreements in accordance with its investment objectives, policies and limitations and (ii) the Fund may lend its portfolio securities. |
| (6) | Purchase any securities on margin, except that the Fund may obtain such short-term credit as may be necessary for the clearance of purchases and sales of portfolio securities, and may make margin deposits in connection with the entry into of positions in financial future contracts and options thereon and other derivative instruments. |
| (7) | Make short sales of securities in a manner inconsistent with the 1940 Act, as it may be interpreted from time to time, or in excess of 25% of the value of the Fund’s total assets. |
| (8) | The Fund, under normal circumstances, will invest at least 25% of its total assets (i.e., concentrate) in privately-issued mortgage-related securities not issued or guaranteed as to principal or interest by the U.S. Government or its agencies or instrumentalities. The Fund may not purchase any security if as a result 25% or more of the Fund’s total assets (taken at current value at the time of investment) (i.e., concentrate) would be invested in a single industry (for purposes of this restriction, investment companies are not considered to be part of any industry). |
| (1) | Concentrate its investments in a particular “industry,” as that term is used in the 1940 Act, as interpreted, modified or otherwise permitted from time to time by regulatory authority having jurisdiction. |
| (2) | Purchase or sell real estate, although it may purchase securities secured by real estate or interests therein, or securities issued by companies that invest in real estate, or interests therein. |
| (3) | Purchase or sell commodities or commodities contracts or oil, gas or mineral programs. This restriction shall not prohibit the Fund, subject to certain restrictions, from purchasing, selling or entering into futures contracts, options on futures contracts, forward contracts, or any interest rate, securities-related or other derivative instrument, including swap agreements and other derivative instruments, subject to compliance with any applicable provisions of the federal securities or commodities laws. |
| (4) | Borrow money or issue any senior security, except to the extent permitted under the 1940 Act, as interpreted, modified or otherwise permitted from time to time by regulatory authority having jurisdiction. |
| (5) | Make loans, except to the extent permitted under the 1940 Act, as interpreted, modified or otherwise permitted from time to time by regulatory authority having jurisdiction. |
ANNUAL REPORT | | | JUNE 30, 2023 | 223 |
Fundamental Investment Restrictions 1 | (Cont.) |
| (6) | Act as an underwriter of securities of other issuers, except to the extent that in connection with the disposition of portfolio securities, it may be deemed to be an underwriter under the federal securities laws. |
| (1) | Purchase securities on margin, except that the Fund may obtain any short-term credits necessary for the clearance of purchases and sales of securities. For purposes of this restriction, the deposit or payment of initial or variation margin in connection with futures contracts or related options will not be deemed to be a purchase of securities on margin. |
| (2) | Borrow money, except that the Fund may engage in reverse repurchase agreements and dollar roll transactions and may borrow in an amount not exceeding 33 1/3% of the value of the Fund’s total assets (including the amount borrowed) valued at market, less liabilities (not including the amount borrowed) at the time the borrowing is made, and may use the proceeds of such borrowing for investment purposes. In addition, the Fund may borrow money for temporary or emergency purposes in an amount not exceeding 5% of the value of the Fund’s total assets (not including the amount borrowed) provided that the total amount borrowed by the Fund for any purpose does not exceed 33 1/3% of its total assets. |
| (3) | Pledge, hypothecate, mortgage, or otherwise encumber its assets except to secure borrowings and as margin or collateral for financial futures, swaps and other negotiable transactions in the over-the-counter market. |
| (4) | Underwrite the securities of other issuers, except insofar as the Fund may be deemed an underwriter in the course of disposing of portfolio securities. |
| (5) | Purchase or sell real estate or interests in real estate, except that the Fund may purchase and sell securities that are secured by real estate or interests in real estate and may purchase securities by companies that invest or deal in real estate. |
| (6) | Invest in commodities, except that the Fund may invest in futures contracts and options thereon, and options on currencies. |
| (7) | Make loans to others, except through the purchase of qualified debt obligations, the entry into repurchase agreements and loans of portfolio securities consistent with the Fund’s investment objectives and policies. |
| (8) | Invest in securities of other investment companies registered or required to be registered under the 1940 Act, except as they may be acquired as part of a merger, consolidation, reorganization, acquisition of assets or an offer of exchange, or to the extent permitted by the 1940 Act. |
| (9) | Purchase any securities which would cause more than 25% of the value of the Fund’s total assets at the time of purchase to be invested in the securities of issuers conducting their principal securities business activities in the same industry; provided that there shall be no limit on the purchase of U.S. government securities, including securities issued by any agency or instrumentality of the U.S. government, and related repurchase agreements. |
| (1) | Purchase any security if as a result 25% or more of the Fund’s total assets (taken at current value at the time of investment) would be invested in a single industry (for purposes of this restriction, investment companies are not considered to be part of any industry). As a fundamental policy, the Fund, under normal circumstances, will invest at least 25% of its total assets in mortgage-related securities not issued or guaranteed as to principal or interest by the U.S. Government or its agencies or instrumentalities and other investments that the Fund’s investment adviser or sub-adviser determines have the same primary economic characteristics. |
224 | PIMCO CLOSED-END FUNDS |
| (Unaudited) |
| (2) | Purchase or sell real estate, although it may purchase securities secured by real estate or interests therein, or securities issued by companies that invest in real estate, or interests therein. |
| (3) | Purchase or sell commodities or commodities contracts or oil, gas or mineral programs. This restriction shall not prohibit the Fund, subject to certain restrictions, from purchasing, selling or entering into futures contracts, options on futures contracts, forward contracts, or any interest rate, securities-related or other derivative instrument, including swap agreements and other derivative instruments, subject to compliance with any applicable provisions of the federal securities or commodities laws. |
| (4) | Borrow money or issue any senior security, except to the extent permitted under the 1940 Act and as interpreted, modified, or otherwise permitted from time to time by regulatory authority having jurisdiction. |
| (5) | Make loans, except to the extent permitted under the Investment Company Act of 1940, as amended, and as interpreted, modified, or otherwise permitted by regulatory authority having jurisdiction. |
| (6) | Act as an underwriter of securities of other issuers, except to the extent that in connection with the disposition of portfolio securities, it may be deemed to be an underwriter under the federal securities laws. |
| (1) | Except for mortgage-related assets as described in the next sentence, purchase any security if as a result 25% or more of the Fund’s total assets (taken at current value at the time of investment) would be invested in a single industry (for purposes of this restriction, investment companies are not considered to be part of any industry). As a fundamental policy, the Fund will normally invest at least 25% of its total assets (i.e., concentrate) in mortgage-related assets issued by government agencies or |
| other governmental entities or by private originators or issuers, which for purposes of this investment restriction the Fund treats collectively as an industry or group of related industries. |
| (2) | Purchase or sell real estate, except to the extent permitted under the 1940 Act, as interpreted, modified, or otherwise permitted from time to time by regulatory authority having jurisdiction. |
| (3) | Purchase or sell commodities or commodities contracts or oil, gas or mineral programs, except to the extent permitted under the 1940 Act, as interpreted, modified, or otherwise permitted from time to time by regulatory authority having jurisdiction. This restriction shall not prohibit the Fund from purchasing, selling or entering into futures contracts, options on futures contracts, forward contracts, or any interest rate, securities-related or other derivative instrument, including swap agreements and other derivative instruments, subject to compliance with any applicable provisions of the federal securities or commodities laws. |
| (4) | Borrow money or issue any senior security, except to the extent permitted under the 1940 Act, as interpreted, modified, or otherwise permitted from time to time by regulatory authority having jurisdiction. |
| (5) | Make loans, except to the extent permitted under the 1940 Act, as interpreted, modified, or otherwise permitted from time to time by regulatory authority having jurisdiction. |
| (6) | Act as an underwriter of securities of other issuers, except to the extent that in connection with the disposition of portfolio securities, it may be deemed to be an underwriter under the federal securities laws. |
| (1) | Except for real estate investments and mortgage-related assets as described in the next sentence, purchase any security if as a result 25% or more of the Fund’s total assets (taken at current value at the time of investment) would be invested in a single industry (for purposes of this restriction, investment companies are not considered to be part of any industry). As a fundamental policy, the Fund will normally invest at least 25% of its total assets (i.e., concentrate) in real estate investments and mortgage-related assets issued by government agencies or other governmental entities or by private originators or issuers, which for purposes of this investment restriction the Fund treats collectively as an industry or group of related industries. |
ANNUAL REPORT | | | JUNE 30, 2023 | 225 |
Fundamental Investment Restrictions 1 | (Cont.) | (Unaudited) |
| (2) | Purchase or sell real estate, except to the extent permitted under the 1940 Act, as interpreted, modified, or otherwise permitted from time to time by regulatory authority having jurisdiction. |
| (3) | Purchase or sell commodities or commodities contracts or oil, gas or mineral programs, except to the extent permitted under the 1940 Act, as interpreted, modified, or otherwise permitted from time to time by regulatory authority having jurisdiction. This restriction shall not prohibit the Fund, subject to restrictions described in the Prospectus and elsewhere in this Statement of Additional Information, from purchasing, selling or entering into futures contracts, options on futures contracts, forward contracts, or any interest rate, securities-related or other derivative instrument, including swap agreements and other derivative instruments, subject to compliance with any applicable provisions of the federal securities or commodities laws. |
| (4) | Borrow money or issue any senior security, except to the extent permitted under the 1940 Act, as interpreted, modified, or otherwise permitted from time to time by regulatory authority having jurisdiction. |
| (5) | Make loans, except to the extent permitted under the 1940 Act, as interpreted, modified, or otherwise permitted from time to time by regulatory authority having jurisdiction. |
| (6) | Act as an underwriter of securities of other issuers, except to the extent that in connection with the disposition of portfolio securities, it may be deemed to be an underwriter under the federal securities laws. |
226 | PIMCO CLOSED-END FUNDS |
Management of the Funds | (Unaudited) |
Name and Year of Birth | Position(s) Held with the Funds | Term of Office and Length of Time Served* | Principal Occupation(s) During the Past 5 Years | Number of Portfolios in Fund Complex Overseen by Trustee/ Director | Other Directorships Held by Trustee/ Director During the Past 5 Years | |||||
Independent Trustees | ||||||||||
Deborah A. DeCotis 1952 | Chair of the Board, Trustee/ Director | Trustee/Director of PCM, PGP and RCS since 2011, Trustee of PDI since 2012, Trustee of PDO since 2021 and Trustee of PAXS since 2022, expected to stand for re-election at the annual meeting of shareholders held during the 2023-2024 fiscal year for PCM, PDI and RCS and the 2024-2025 fiscal year for PDO, and the 2025-2026 fiscal year for PGP. | Advisory Director, Morgan Stanley & Co., Inc. (since 1996); Member, Circle Financial Group (since 2009); Member, Council on Foreign Relations (since 2013); Trustee, Smith College (since 2017); Director, Watford Re (since 2017); and Director, Cadre Inc., a manufacturer of safety equipment (since 2022). Formerly, Co-Chair Special Projects Committee, Memorial Sloan Kettering (2005-2015); Trustee, Stanford University (2010- 2015); Principal, LaLoop LLC, a retail accessories company (1999-2014); Director, Helena Rubenstein Foundation (1997-2010); and Director, Armor Holdings (2002-2010). | 30 | Trustee, Allianz Funds (2011-2021); Trustee, Virtus Funds (2021-Present). | |||||
Sarah E. Cogan 1956 | Trustee/Director | Trustee/Director of PCM, PDI, PGP and RCS since 2019, Trustee of PDO since 2021 and Trustee of PAXS since 2022, expected to stand for re-election at the annual meeting of shareholders held during the 2023-2024 fiscal year for PDI, RCS and PCM, the 2024-2025 fiscal year for PDO, and the 2025-2026 fiscal year for PGP. | Retired Partner, Simpson Thacher & Bartlett LLP (law firm) (1989-2018); Director, Girl Scouts of Greater New York, Inc. (since 2016); and Trustee, Natural Resources Defense Council, Inc. (since 2013). | 30 | Trustee, Allianz Funds (2019-2021); Trustee, Virtus Funds (2021-Present). | |||||
Joseph B. Kittredge, Jr. 1954 | Trustee/Director | Trustee/Director of PCM, RCS, PGP, and PDI since 2020, Trustee of PDO since 2021 and Trustee of PAXS since 2022, expected to stand for re-election at the annual meeting of shareholders held during the 2023-2024 fiscal year for PCM and the 2024-2025 fiscal year for PDO and PGP, and the 2025-2026 fiscal year for PDI and RCS. | Trustee (since 2019) and Governance Committee (since 2020), Vermont Law School (since 2019); Director and Treasurer, Center for Reproductive Rights (since 2015). Formerly, Director (2013-2020) and Chair (2018-2020), ACLU of Massachusetts; General Counsel, Grantham, Mayo, Van Otterloo & Co. LLC (2005-2018) and Partner (2007-2018); President, GMO Trust (institutional mutual funds) (2009-2018); Chief Executive Officer, GMO Trust (2009-2015); and President and Chief Executive Officer, GMO Series Trust (platform based mutual funds) (2011-2013). | 30 | Trustee, GMO Trust (2010-2018); Chairman of the Board of Trustees, GMO Series Trust (2011-2018). | |||||
ANNUAL REPORT | | | JUNE 30, 2023 | 227 |
Management of the Funds | (Cont.) |
Name and Year of Birth | Position(s) Held with the Funds | Term of Office and Length of Time Served* | Principal Occupation(s) During the Past 5 Years | Number of Portfolios in Fund Complex Overseen by Trustee/ Director | Other Directorships Held by Trustee/ Director During the Past 5 Years | |||||
Kathleen McCartney 1955 | Trustee/Director | Trustee/Director since 2022, expected to stand for re-election at the annual meeting of shareholders held during the 2023-2024 fiscal year for PGP, the 2024-2025 fiscal year for PDI, and the 2025-2026 fiscal year for PCM, PDO, and RCS. | President, Smith College (since 2013); Director (since 2013) and President (since 2020), Five Colleges, Inc., consortium of liberal arts colleges and universities (since 2013); Formerly, Director, American Council on Education Board of Directors, (2015-2019); Director, Consortium on Financing Higher Education Board of Directors (2015-2019); Director, edX Board of Directors, online course provider (2012-2013); Director, Bellwether Education Partners Board, national nonprofit organization (2010-2013); Dean, Harvard Graduate School of Education (2006-2013); and Trustee, Tufts University(2007-2013). | 30 | None. | |||||
Alan Rappaport 1953 | Trustee/Director | Trustee/Director of RCS, PCM and PGP since 2012, Trustee of PDI since 2012, Trustee of PDO since 2021 and Trustee of PAXS since 2022, expected to stand for re-election at the annual meeting of shareholders held during the 2023-2024 fiscal year for PCM, PDO and RCS, the 2024-2025 fiscal year for PDI, and the 2025-2026 fiscal year for PGP. | Director, Victory Capital Holdings, Inc., an asset management firm (since 2013). Formerly, Adjunct Professor, New York University Stern School of Business (2011-2020); Lecturer, Stanford University Graduate School of Business (2013-2020); Advisory Director (formerly Vice Chairman), Roundtable Investment Partners(2009-2018); Member of Board of Overseers, NYU Langone Medical Center (2015-2016); Trustee, American Museum of Natural History (2005-2015); Trustee, NYU Langone Medical Center(2007-2015); and Vice Chairman (formerly, Chairman and President), U.S. Trust (formerly, Private Bank of Bank of America, the predecessor entity of U.S. Trust)(2001-2008). | 30 | Trustee, Allianz Funds (2010-2021); Chairman of the Board of Trustees, Virtus Closed-End Funds (2021-Present). | |||||
E. Grace Vandecruze 1963 | Trustee/Director | Trustee/Director of PCM, PDI, PDO, PGP and RCS since 2021 and Trustee of PAXS since 2022, expected to stand for re-election at the annual meeting of shareholders held during the 2024-2025 fiscal year for PCM and PGP and the 2025-2026 fiscal year for PDI, PDO and RCS. | Founder and Managing Director, Grace Global Capital LLC, a strategic advisory firm to the insurance industry (since 2006); Director, The Doctors Company, a medical malpractice insurance company (since 2020); Director, Link Logistics REIT, a real estate company (since 2021); Director and Member of the Investment & Risk Committee, Resolution Life Group Holdings, a global life insurance group (since 2021); Director, Wharton Graduate Executive Board; Chief Financial Officer, ShoulderUp Technology Acquisition Corp, a special purpose acquisition company (since 2021); and Director, Blackstone Private Equity Strategies Fund L.P. (since 2022). Formerly, Director, Resolution Holdings (2015-2019); Director and Member of the Audit Committee and the Wealth Solutions Advisory Committee, M Financial Group, a life insurance company (2015-2021); Chief Financial Officer, Athena Technology Acquisition Corp, a special purpose acquisition company (2021-2022); and Director, SBLI USA, a life insurance company (2015-2018). | 30 | None. | |||||
228 | PIMCO CLOSED-END FUNDS |
| (Unaudited) |
Name and Year of Birth | Position(s) Held with the Funds | Term of Office and Length of Time Served* | Principal Occupation(s) During the Past 5 Years | Number of Portfolios in Fund Complex Overseen by Trustee/ Director | Other Directorships Held by Trustee/ Director During the Past 5 Years | |||||
Interested Trustees** | ||||||||||
David N. Fisher*** 1968 | Trustee/ Director | Trustee/Director of PCM, PDI, PGP and RCS since 2019, Trustee of PDO since 2021 and Trustee of PAXS since 2022, expected to stand for re-election at the annual meeting of shareholders held during the 2023-2024 fiscal year for PGP and RCS, the 2024-2025 fiscal year for PDO, and the 2025-2026 fiscal year for PCM and PDI. | Managing Director and Co-Head of U.S. Global Wealth Management Strategic Accounts, PIMCO (since 2021); and Director, Court Appointed Special Advocates (CASA) of Orange County, anon-profit organization (since 2015). Formerly, Managing Director and Head of Traditional Product Strategies, PIMCO (2015-2021); Global Bond Strategist, PIMCO (2008-2015); and Managing Director and Head of Global Fixed Income, HSBC Global Asset Management(2005-2008). | 30 | None. | |||||
Libby D. Cantrill*** 1968 | Trustee/ Director | Trustee since 2023; expected to stand for election at the annual meeting of shareholders held during the 2023 -2024 fiscal year for PDO, PCM, PGP, and PDI and for re-election for the2024-2025 fiscal year for RCS. | Managing Director, Head of Public Policy, PIMCO (since 2007); Institutional Account Manager, PIMCO (2007-2010); Legislative Aide, House of Representatives (2003-2005); Investment Banking Analyst, Morgan Stanley (2000-2003). | 30 | Covenant House New York (2021-Present); Securities Industry and Financial Markets Association (2022-Present). | |||||
| * | Under each Fund’s Agreement and Declaration of Trust, as amended and/or restated from time to time, a Trustee/Director serves until his or her retirement, resignation or replacement. |
| ** | The Trustee/Director is an “interested person” of the Fund, as defined in Section 2(a)(19) of the 1940 Act, due to their affiliations with PIMCO and its affiliates. |
| *** | Mr. Fisher’s and Ms. Cantrill’s address is 650 Newport Center Drive, Newport Beach, California 92660. |
Name, Address and Year of Birth | Position(s) Held with Funds | Term of Office and Length of Time Served | Principal Occupation(s) During the Past 5 Years | |||
Eric D. Johnson 1 1970 | President | Since 2019 | Executive Vice President and Head of Funds Business Group Americas, PIMCO. President, PIMCO-Managed Funds, PIMCO Funds, PIMCO Variable Insurance Trust, PIMCO ETF Trust, PIMCO Equity Series, PIMCO Equity Series VIT and PIMCO Flexible Real Estate Income Fund. | |||
Keisha Audain-Pressley 1975 | Chief Compliance Officer | Since 2018 | Executive Vice President and Deputy Chief Compliance Officer, PIMCO. Chief Compliance Officer, PIMCO-Managed Funds, PIMCO Funds, PIMCO Variable Insurance Trust, PIMCO ETF Trust, PIMCO Equity Series, PIMCO Equity Series VIT, PIMCO Capital Solutions BDC Corp. and PIMCO Flexible Real Estate Income Fund. | |||
Ryan G. Leshaw 1 1980 | Chief Legal Officer | Since 2019 | Executive Vice President and Senior Counsel, PIMCO. Chief Legal Officer, PIMCO-Managed Funds, PIMCO Capital Solutions BDC Corp. and PIMCO Flexible Real Estate Income Fund. Chief Legal Officer and Secretary, PIMCO Funds, PIMCO Variable Insurance Trust, PIMCO ETF Trust, PIMCO Equity Series and PIMCO Equity Series VIT. Formerly, Associate, Willkie Farr & Gallagher LLP. | |||
Joshua D. Ratner 1976 | Senior Vice President | Since 2019 | Executive Vice President and Head of Americas Operations, PIMCO. Senior Vice President, PIMCO-Managed Funds, PIMCO Funds, PIMCO Variable Insurance Trust, PIMCO ETF Trust, PIMCO Equity Series and PIMCO Equity Series VIT. | |||
Peter G. Strelow 1 1970 | Senior Vice President | Since 2019 | Managing Director and Co-Chief Operating Officer, PIMCO. Senior Vice President, PIMCO-Managed Funds, PIMCO Funds, PIMCO Variable Insurance Trust, PIMCO ETF Trust, PIMCO Equity Series and PIMCO Equity Series VIT. Formerly, Chief Administrative Officer, PIMCO. | |||
Wu-Kwan Kit1 1981 | Vice President, Senior Counsel and Secretary | Since 2018 | Senior Vice President and Senior Counsel, PIMCO. Vice President, Senior Counsel and Secretary, PIMCO-Managed Funds, PIMCO Capital Solutions BDC Corp. and PIMCO Flexible Real Estate Income Fund. Assistant Secretary, PIMCO Funds, PIMCO Variable Insurance Trust, PIMCO ETF Trust, PIMCO Equity Series and PIMCO Equity Series VIT. Formerly, Assistant General Counsel, VanEck Associates Corp. | |||
Douglas B. Burrill 1980 | Vice President | Since 2022 | Senior Vice President, PIMCO. Vice President, PIMCO-Managed Funds, PIMCO Funds, PIMCO Variable Insurance Trust, PIMCO ETF Trust, PIMCO Equity Series, PIMCO Equity Series VIT, PIMCO Capital Solutions BDC Corp. and PIMCO Flexible Real Estate Income Fund. | |||
ANNUAL REPORT | | | JUNE 30, 2023 | 229 |
Management of the Funds | (Cont.) | (Unaudited) |
Name, Address and Year of Birth | Position(s) Held with Funds | Term of Office and Length of Time Served | Principal Occupation(s) During the Past 5 Years | |||
Elizabeth A. Duggan 1 1964 | Vice President | Since 2021 | Executive Vice President, PIMCO. Vice President, PIMCO-Managed Funds, PIMCO Funds, PIMCO Variable Insurance Trust, PIMCO ETF Trust, PIMCO Equity Series, PIMCO Equity Series VIT, PIMCO Capital Solutions BDC Corp. and PIMCO Flexible Real Estate Income Fund. | |||
Jason R. Duran 1 1977 | Vice President | Since March 2023 | Vice President, PIMCO. Vice President, PIMCO-Managed Funds, PIMCO Funds, PIMCO Variable Insurance Trust, PIMCO ETF Trust, PIMCO Equity Series and PIMCO Equity Series VIT. | |||
Mark A. Jelic 1 1981 | Vice President | Since 2021 | Senior Vice President, PIMCO. Vice President, PIMCO-Managed Funds, PIMCO Funds, PIMCO Variable Insurance Trust, PIMCO ETF Trust, PIMCO Equity Series, PIMCO Equity Series VIT, PIMCO Capital Solutions BDC Corp. and PIMCO Flexible Real Estate Income Fund. | |||
Kenneth W. Lee 1 1972 | Vice President | Since 2022 | Senior Vice President, PIMCO. Vice President, PIMCO-Managed Funds, PIMCO Funds, PIMCO Variable Insurance Trust, PIMCO ETF Trust, PIMCO Equity Series, PIMCO Equity Series VIT, PIMCO Capital Solutions BDC Corp. and PIMCO Flexible Real Estate Income Fund. | |||
Greg J. Mason 2 1981 | Vice President | Since March 2023 | Senior Vice President, PIMCO. Vice President, PIMCO-Managed Funds, PIMCO Flexible Real Estate Income Fund, PIMCO Funds, PIMCO Variable Insurance Trust, PIMCO ETF Trust, PIMCO Equity Series and PIMCO Equity Series VIT. | |||
Brian J. Pittluck 1 1977 | Vice President | Since 2020 | Senior Vice President, PIMCO. Vice President, PIMCO-Managed Funds, PIMCO Funds, PIMCO Variable Insurance Trust, PIMCO ETF Trust, PIMCO Equity Series, PIMCO Equity Series VIT, PIMCO Capital Solutions BDC Corp. and PIMCO Flexible Real Estate Income Fund. | |||
Keith A. Werber 1 1973 | Vice President | Since 2022 | Executive Vice President, PIMCO. Vice President, PIMCO-Managed Funds, PIMCO Funds, PIMCO Variable Insurance Trust, PIMCO ETF Trust, PIMCO Equity Series, PIMCO Equity Series VIT, PIMCO Capital Solutions BDC Corp. and PIMCO Flexible Real Estate Income Fund. | |||
Bijal Y. Parikh 1 1978 | Treasurer | Since 2021 | Executive Vice President, PIMCO. Treasurer, PIMCO-Managed Funds, PIMCO Funds, PIMCO Variable Insurance Trust, PIMCO ETF Trust, PIMCO Equity Series, PIMCO Equity Series VIT and PIMCO Flexible Real Estate Income Fund. | |||
Brandon T. Evans 1 1982 | Deputy Treasurer | Since 2022 | Senior Vice President, PIMCO. Deputy Treasurer, PIMCO-Managed Funds. Assistant Treasurer, PIMCO Funds, PIMCO Variable Insurance Trust, PIMCO ETF Trust, PIMCO Equity Series, Equity Series VIT and PIMCO Flexible Real Estate Income Fund. | |||
Erik C. Brown 2 1967 | Assistant Treasurer | Since 2015 | Executive Vice President, PIMCO. Assistant Treasurer, PIMCO-Managed Funds, PIMCO Funds, PIMCO Variable Insurance Trust, PIMCO ETF Trust, PIMCO Equity Series, PIMCO Equity Series VIT, PIMCO Capital Solutions BDC Corp. and PIMCO Flexible Real Estate Income Fund. | |||
Maria M. Golota 1983 | Assistant Treasurer | Since March 2023 | Vice President, PIMCO. Assistant Treasurer, PIMCO Funds, PIMCO ETF Trust, PIMCO Equity Series, PIMCO Equity Series VIT, PIMCO Managed Accounts Trust, PIMCO-Sponsored Interval Funds, PIMCO-Sponsored Closed-End Funds and PIMCO Flexible Real Estate Income Fund. | |||
1 | The address of these officers is Pacific Investment Management Company LLC, 650 Newport Center Drive, Newport Beach, California 92660. |
2 | The address of these officers is Pacific Investment Management Company LLC, 401 Congress Ave., Austin, Texas 78701. |
230 | PIMCO CLOSED-END FUNDS |
Approval of Investment Management Agreements | (Unaudited) |
ANNUAL REPORT | | | JUNE 30, 2023 | 231 |
Approval of Investment Management Agreements | (Cont.) |
232 | PIMCO CLOSED-END FUNDS |
| (Unaudited) |
ANNUAL REPORT | | | JUNE 30, 2023 | 233 |
Approval of Investment Management Agreements | (Cont.) |
234 | PIMCO CLOSED-END FUNDS |
| (Unaudited) |
ANNUAL REPORT | | | JUNE 30, 2023 | 235 |
Approval of Investment Management Agreements | (Cont.) | (Unaudited) |
236 | PIMCO CLOSED-END FUNDS |
Privacy Policy 1 | (Unaudited) |
ANNUAL REPORT | | | JUNE 30, 2023 | 237 |

| Item 2. | Code of Ethics. |
As of the end of the period covered by this report, the Registrant has adopted a code of ethics (the “Code”) that applies to the Registrant’s principal executive officer and principal financial officer. The Registrant did not grant any waivers, including implicit waivers, from any provisions of the Code to the principal executive officer or principal financial officer during the period covered by this report.
A copy of the Code is included as an exhibit to this report.
| Item 3. | Audit Committee Financial Expert. |
The Board of Trustees has determined that Joseph B. Kittredge, Jr., who serves on the Board’s Audit Oversight Committee, qualifies as an “audit committee financial expert” as such term is defined in the instructions to this Item 3. The Board has also determined that Mr. Kittredge is “independent” as such term is interpreted under this Item 3.
| Item 4. | Principal Accountant Fees and Services. |
| (a) | Fiscal Year Ended | Audit Fees | ||
| June 30, 2023 | $ 198,763 | |||
| June 30, 2022 | $ 330,006 | |||
| (b) | Fiscal Year Ended | Audit-Related Fees | ||
| June 30, 2023 | $ 275,500 | |||
| June 30, 2022 | $ 365,950 | |||
| (c) | Fiscal Year Ended | Tax Fees (1) | ||
| June 30, 2023 | $ — | |||
| June 30, 2022 | $ — | |||
| (d) | Fiscal Year Ended | All Other Fees (2) | ||
| June 30, 2023 | $ — | |||
| June 30, 2022 | $ — | |||
“Audit Fees” represents fees billed for each of the last two fiscal years for professional services rendered for the audit and review of the Registrant’s annual financial statements for those fiscal years or services that are normally provided by the accountant in connection with statutory or regulatory filings or engagements for those fiscal years.
“Audit-Related Fees” represents fees billed for each of the last two fiscal years for assurance and related services that are reasonably related to the performance of the audit or review of the Registrant’s financial statements, but not reported under “Audit Fees” above, and that include accounting consultations, agreed-upon procedure reports (inclusive of annual review of basic maintenance testing associated with the Preferred Shares), attestation reports and comfort letters for those fiscal years.
“Tax Fees” represents fees billed for each of the last two fiscal years for professional services related to tax compliance, tax advice and tax planning, including services relating to the filing or amendment of federal, state or local income tax returns, regulated investment company qualification reviews, and tax distribution and analysis reviews.
“All Other Fees” represents fees, if any, billed for other products and services rendered by the principal accountant to the Registrant other than those reported above under “Audit Fees,” “Audit-Related Fees” and “Tax Fees” for the last two fiscal years.
(1) There were no “Tax Fees” for the last two fiscal years.
(2) There were no “All Other Fees” for the last two fiscal years.
| © | Pre-approval policies and procedures |
(1) The Registrant’s Audit Oversight Committee has adopted pre-approval policies and procedures (the “Procedures”) to govern the Audit Oversight Committee’s pre-approval of (i) all audit services and permissible non-audit services to be provided to the Registrant by its independent accountant, and (ii) all permissible non-audit services to be provided by such independent accountant to the Registrant’s investment adviser and to any entity controlling, controlled by, or under common control with the investment adviser that provides ongoing services to the Registrant (collectively, the “Service Affiliates”) if the services provided directly relate to the Registrant’s operations and financial reporting. In accordance with the Procedures, the Audit Oversight Committee is responsible for the engagement of the independent accountant to certify the Registrant’s financial statements for each fiscal year. With respect to the pre-approval of non-audit services provided to the Registrant and its Service Affiliates, the Procedures provide that the Audit Oversight Committee may annually pre-approve a list of types or categories of non-audit services that may be provided to the Registrant or its Service Affiliates, or the Audit Oversight Committee may pre-approve such services on a project-by-project basis as they arise. Unless a type of service has received general pre-approval, it will require specific pre-approval by the Audit Oversight Committee if it is to be provided by the independent accountant. The Procedures also permit the Audit Oversight Committee to delegate authority to one or more of its members to pre-approve any proposed non-audit services that have not been previously pre-approved by the Audit Oversight Committee, subject to the ratification by the full Audit Oversight Committee no later than its next scheduled meeting.
(2) With respect to the services described in paragraphs (b) through (d) of this Item 4, no amount was approved by the Audit Oversight Committee pursuant to paragraph (c)(7)(i)(C) of Rule 2-01 of Regulation S-X.
| (f) | Not applicable. |
| (g) |
Aggregate Non-Audit Fees Billed to Entity
| ||||||||||||||||
Entity
| June 30, 2023
| June 30, 2022
| ||||||||||||||
PIMCO Dynamic Income Fund | $ | 275,500 | $ | 365,950 | ||||||||||||
Pacific Investment Management Company LLC (“PIMCO”) |
| 29,289,017
|
|
| 9,618,697
|
| ||||||||||
Totals | $ | 29,564,517 | $ | 9,984,647 | ||||||||||||
| (h) | The Registrant’s Audit Oversight Committee has considered whether the provision of non-audit services that were rendered to the Registrant’s investment adviser, and any entity controlling, controlled by, or under common control with the investment adviser that provides ongoing services to the Registrant which were not pre-approved (not requiring pre-approval) is compatible with maintaining the principal accountant’s independence. |
| (i) | Not applicable. |
| (j) | Not applicable. |
| Item 5. | Audit Committee of Listed Registrants. |
The Registrant has a separately-designated standing audit committee (known as the Audit Oversight Committee) established in accordance with Section 3(a)(58)(A) of the Securities Exchange Act of 1934, as amended. The Audit Oversight Committee is comprised of:
Joseph B. Kittredge, Jr. (Chair)
Sarah E. Cogan
Deborah A. DeCotis
Kathleen A. McCartney
Alan Rappaport
E. Grace Vandecruze
| Item 6. | Schedule of Investments. |
The information required by this Item 6 is included as part of the annual report to shareholders filed under Item 1 of this Form N-CSR.
| Item 7. | Disclosure of Proxy Voting Policies and Procedures for Closed-End Management Investment Companies. |
Policy Statement: The proxy voting policy is intended to foster PIMCO’s compliance with its fiduciary obligations and applicable law; the policy applies to any voting or consent rights with respect to securities held in accounts over which PIMCO has discretionary voting authority. The Policy is designed in a manner reasonably expected to ensure that voting and consent rights are exercised in the best interests of PIMCO’s clients.
Overview: PIMCO has adopted a written proxy voting1 policy (“Proxy Policy”) as required by Rule 206(4)-6 under the Advisers Act. As a general matter, when PIMCO has proxy voting authority, PIMCO has a fiduciary obligation to monitor corporate events and to take appropriate action on client proxies that come to its attention. Each proxy is voted on a case-by-case basis, taking into account relevant facts and circumstances. When considering client proxies, PIMCO may determine not to vote a proxy in limited circumstances.
Equity Securities. 2 PIMCO has retained an Industry Service Provider (“ISP”) to provide research and voting recommendations for proxies relating to equity securities in accordance with the ISP’s guidelines. By following the guidelines of an independent third party, PIMCO seeks to mitigate potential conflicts of interest PIMCO may have with respect to proxies covered by the ISP. PIMCO will follow the recommendations of the ISP unless: (i) the ISP does not provide a voting recommendation; or (ii) a portfolio manager decides to override the ISP’s voting recommendation. In either such case as described above, the Legal and Compliance department will review the proxy to determine whether a material conflict of interest, or the appearance of one, exists.
Fixed-Income Securities. Fixed income securities can be processed as proxy ballots or corporate action-consents3 at the discretion of the issuer/ custodian. When processed as proxy ballots, the ISP generally does not provide a voting recommendation and their role is limited to election processing and recordkeeping. When processed as corporate action-consents, the Legal and Compliance department will review all election forms to determine whether a conflict of interest, or the appearance of one, exists with respect to the PM’s consent election. PIMCO’s Credit Research and Portfolio Management Groups are responsible for issuing recommendations on how to vote proxy ballots and corporation action-consents with respect to fixed income securities.
Resolution of Potential Conflicts of Interest. The Proxy Policy permits PIMCO to seek to resolve material conflicts of interest by pursuing any one of several courses of action. With respect to material conflicts of interest between PIMCO and a client account, the Proxy Policy permits PIMCO to either: (i) convene a working group to assess and resolve the conflict (the “Proxy Working Group”); or (ii) vote in accordance with protocols previously established by the Proxy Policy, the Proxy Working Group and/or other relevant procedures approved by PIMCO’s Legal and Compliance department with respect to specific types of conflicts.
PIMCO will supervise and periodically review its proxy voting activities and the implementation of the Proxy Policy.
Sub-Adviser Engagement: As an investment manager, PIMCO may exercise its discretion to engage a Sub-Adviser to provide portfolio management services to the Fund. Consistent with its management responsibilities, the Sub-Adviser would assume the authority for voting proxies on behalf of PIMCO for the Fund. Sub-Advisers may utilize third parties to perform certain services related to their portfolio management responsibilities. As a fiduciary, PIMCO will maintain oversight of the investment management responsibilities (which may include proxy voting) performed by the Sub-Adviser and contracted third parties.
1 Proxies generally describe corporate action consent rights (relative to fixed income securities) and proxy voting ballots (relative to fixed income or equity securities) as determined by the issuer or custodian.
2 The term “Equity Securities” means common and preferred stock, including common and preferred shares issued by investment companies; it does not include debt securities convertible into equity securities.
3 Voting or consent rights shall not include matters which are primarily decisions to buy or sell investments, such as tender offers, exchange offers, conversions, put options, redemptions, and Dutch auctions.
| Item 8. | Portfolio Managers of Closed-End Management Investment Companies. |
(a)(1)
As of August 31, 2023, the following individuals have primary responsibility for the day-to-day management of the PIMCO Dynamic Income Fund (the “Fund”):
Daniel J. Ivascyn - Mr. Ivascyn has been the lead portfolio manager of the Fund since its inception in May 2012. Mr. Ivascyn is Group Chief Investment Officer and a managing director in the Newport Beach office. Prior to joining PIMCO in 1998, he worked at Bear Stearns in the asset-backed securities group, as well as T. Rowe Price and Fidelity Investments.
Joshua Anderson - Mr. Anderson has been a portfolio manager of the Fund since its inception in May 2012. Mr. Anderson is a managing director and portfolio manager in the Newport Beach office. He oversees ABS (asset-backed securities) portfolio management team and supports the firm’s opportunistic strategies. Previously, he oversaw PIMCO’s European opportunistic investments across public and private mortgage, real estate and specialty finance markets, and earlier he was a structured product portfolio manager in the Newport Beach office. Prior to joining PIMCO in 2003, he was an analyst at Merrill Lynch covering both the residential ABS and collateralized debt obligation sectors and was ranked as one of the top analysts by Institutional Investor magazine. He was previously a portfolio manager at Merrill Lynch Investment Managers.
Alfred T. Murata - Mr. Murata has been a portfolio manager of the Fund since its inception in May 2012. Mr. Murata is a managing director in the Newport Beach office and a portfolio manager on the mortgage credit team. Prior to joining PIMCO in 2001, he researched and implemented exotic equity and interest rate derivatives at Nikko Financial Technologies.
(a)(2)
The following summarizes information regarding each of the accounts, excluding the Fund, managed by the Portfolio Managers as of June 30, 2023, including accounts managed by a team, committee, or other group that includes a Portfolio Manager. Unless mentioned otherwise, the advisory fee charged for managing each of the accounts listed below is not based on performance.
| Registered Investment Companies | Other Pooled Investment Vehicles | Other Accounts | ||||||||||
Portfolio Manager | # | AUM($million) | # | AUM($million) | # | AUM($million) | ||||||
Daniel J. Ivascyn1 | 20 | $161,155.36 | 23 | $92,053.82 | 29 | $37,573.50 | ||||||
Joshua Anderson2 | 8 | $144,493.90 | 16 | $18,048.36 | 1 | $0.11 | ||||||
Alfred T. Murata3 | 21 | $164,984.24 | 22 | $45,379.20 | 5 | $1,014.08 | ||||||
1 Of these Other Pooled Investment Vehicles, 10 accounts totaling $18,133.06 million in assets pay an advisory fee that is based in part on the performance of the accounts. Of these Other Accounts, 1 account totaling $314.95 million in assets pays an advisory fee that is based in part on the performance of the accounts.
2 Of these Other Pooled Investment Vehicles, 10 accounts totaling $12,767.28 million in assets pay an advisory fee that is based in part on the performance of the accounts.
3 Of these Other Pooled Investment Vehicles, 5 accounts totaling $9,569.39 million in assets pay an advisory fee that is based in part on the performance of the accounts.
From time to time, potential and actual conflicts of interest may arise between a portfolio manager’s management of the investments of the Fund, on the one hand, and the management of other accounts, on the other. Potential and actual conflicts of interest may also arise as a result of PIMCO’s other business activities and PIMCO’s possession of material non-public information (“MNPI”) about an issuer. Other accounts managed by a portfolio manager might have similar investment objectives or strategies as the Fund, track the same index the Fund tracks or otherwise hold, purchase, or sell securities that are eligible to be held, purchased or sold by the Fund. The other accounts might also have different investment objectives or strategies than the Fund. Investors should be aware that investments made by the Fund and the results achieved by the Fund at any given time are not expected to be the same as those made by other funds for which PIMCO acts as investment adviser, including funds with names, investment objectives and policies, and/or portfolio management teams, similar to the Fund. This may be attributable to a wide variety of factors, including, but not limited to, the use of a different strategy or portfolio management team, when a particular fund commenced operations or the size of a particular fund, in each case as compared to other similar funds. Potential and actual conflicts of interest may also arise as a result of PIMCO serving as investment adviser to accounts that invest in the Fund or to accounts in which the Fund invests. In this case, such conflicts of interest
could in theory give rise to incentives for PIMCO to, among other things, vote proxies, purchase or redeem shares of the underlying account, or take other actions with respect to the underlying account, in a manner beneficial to the investing account and/or PIMCO but detrimental to the underlying account. Such conflicts of interest could similarly in theory give rise to incentives for PIMCO to, among other things, vote proxies or purchase or redeem shares of the underlying account, or take other actions with respect to the underlying account, in a manner beneficial to the underlying account and/or PIMCO and that may or may not be detrimental to the investing account. For example, even if there is a fee waiver or reimbursement in place relating to the Fund’s investment in an underlying account, or relating to an investing account’s investment in the Fund, this will not necessarily eliminate all conflicts of interest, as PIMCO could nevertheless have a financial incentive to favor investments in PIMCO-affiliated funds and managers (for example, to increase the assets under management of PIMCO or a fund, product or line of business, or otherwise provide support to, certain funds, products or lines of business), which could also impact the manner in which certain transaction fees are set. Conversely, PIMCO’s duties to the Fund, as well as regulatory or other limitations applicable to the Fund, may affect the courses of action available to PIMCO-advised accounts (including the Fund) that invest in the Fund in a manner that is detrimental to such investing accounts. In addition, regulatory restrictions, actual or potential conflicts of interest or other considerations may cause PIMCO to restrict or prohibit participation in certain investments.
Because PIMCO is affiliated with Allianz SE, a large multi-national financial institution (together with its affiliates, “Allianz”), conflicts similar to those described below may occur between the Fund or other accounts managed by PIMCO and PIMCO’s affiliates or accounts managed by those affiliates. Those affiliates (or their clients), which generally operate autonomously from PIMCO, may take actions that are adverse to the Fund or other accounts managed by PIMCO. In many cases, PIMCO will not be in a position to mitigate those actions or address those conflicts, which could adversely affect the performance of the Fund or other accounts managed by PIMCO (each, a “Client,” and collectively, the “Clients”). In addition, because certain Clients are affiliates of PIMCO or have investors who are affiliates or employees of PIMCO, PIMCO may have incentives to resolve conflicts of interest in favor of these Clients over other Clients.
Knowledge and Timing of Fund Trades. A potential conflict of interest may arise as a result of a portfolio manager’s day-to-day management of the Fund. Because of their positions with the Fund, the portfolio managers know the size, timing and possible market impact of the Fund’s trades. It is theoretically possible that the portfolio managers could use this information to the advantage of other accounts they manage and to the possible detriment of the Fund.
Cross Trades. A potential conflict of interest may arise in instances where the Fund buys an instrument from a Client or sells an instrument to a Client (each, a “cross trade”). Such conflicts of interest may arise, among other reasons, as a result of PIMCO representing the interests of both the buying party and the selling party in the cross trade or because the price at which the instrument is bought or sold through a cross trade may not be as favorable as the price that might have been obtained had the trade been executed in the open market. PIMCO effects cross trades when appropriate pursuant to procedures adopted under applicable rules and SEC guidance. Among other things, such procedures require that the cross trade is consistent with the respective investment policies and investment restrictions of both parties and is in the best interests of both the buying and selling accounts.
Investment Opportunities. A potential conflict of interest may arise as a result of a portfolio manager’s management of a number of accounts with varying investment guidelines. Often, an investment opportunity may be suitable for one or more Clients, but may not be available in sufficient quantities for all accounts to participate fully. PIMCO has adopted policies and procedures reasonably designed to allocate investment opportunities on a fair and equitable basis over time. In addition, regulatory issues applicable to PIMCO or one or more Clients may result in certain Clients not receiving securities that may otherwise be appropriate for them.
PIMCO seeks to allocate orders across eligible Client accounts with similar investment guidelines and investment styles fairly and equitably, taking into consideration relevant factors including, among others, applicable investment restrictions and guidelines, including regulatory restrictions; Client account-specific investment objectives, restrictions and other Client instructions, as applicable; risk tolerances; amounts of available cash; the need to rebalance a Client account’s portfolio (e.g., due to investor contributions and redemptions); whether the allocation would result in a Client account receiving a trivial amount or an amount below the established minimum quantity; regulatory requirements; the origin of the investment; the bases for an issuer’s allocation to PIMCO; and other Client account-specific factors. As part of PIMCO’s trade allocation process, portions of new fixed income investment opportunities are distributed among Client account categories where the relevant portfolio managers seek to participate in the investment. Those portions are then further allocated among the Client accounts within such categories pursuant to PIMCO’s trade allocation policy. Portfolio managers managing quantitative strategies and specialized accounts, such as those focused on international securities, mortgage-backed securities, bank loans, or other specialized asset classes, will likely receive an increased distribution of new fixed income investment opportunities where the investment involves a quantitative strategy or specialized asset class that matches the investment objective or focus
of the Client account category. PIMCO seeks to allocate fixed income investments to Client accounts with the general purpose of maintaining consistent concentrations across similar accounts and achieving, as nearly as possible, portfolio characteristic parity among such accounts. Client accounts furthest from achieving portfolio characteristic parity typically receive priority in allocations. With respect to an order to buy or sell an equity security in the secondary market, PIMCO seeks to allocate the order across Client accounts with similar investment guidelines and investment styles fairly and equitably over time, taking into consideration the relevant factors discussed above.
Any particular allocation decision among Client accounts may be more or less advantageous to any one Client or group of Clients, and certain allocations will, to the extent consistent with PIMCO’s fiduciary obligations, deviate from a pro rata basis among Clients in order to address for example, differences in legal, tax, regulatory, risk management, concentration, exposure, Client guideline limitations and/or mandate or strategy considerations for the relevant Clients. PIMCO may determine that an investment opportunity or particular purchases or sales are appropriate for one or more Clients, but not appropriate for other Clients, or are appropriate or suitable for, or available to, Clients but in different sizes, terms, or timing than is appropriate or suitable for other Clients. For example, some Clients have higher risk tolerances than other Clients, such as private funds, which, in turn, allows PIMCO to allocate a wider variety and/or greater percentage of certain types of investments (which may or may not outperform other types of investments) to such Clients. Further, the respective risk tolerances of different types of Clients may change over time as market conditions change. Those Clients receiving an increased allocation as a result of the effect of their respective risk tolerance may be Clients that pay higher investment management fees or that pay incentive fees. In addition, certain Client account categories focusing on certain types of investments or asset classes will be given priority in new issue distribution and allocation with respect to the investments or asset classes that are the focus of their investment mandate. PIMCO may also take into account the bases for an issuer’s allocation to PIMCO, for example, by giving priority allocations to Client accounts holding existing positions in the issuer’s debt if the issuer’s allocation to PIMCO is based on such holdings. Legal, contractual, or regulatory issues and/or related expenses applicable to PIMCO or one or more Clients may result in certain Clients not receiving securities that may otherwise be appropriate for them or may result in PIMCO selling securities out of Client accounts even if it might otherwise be beneficial to continue to hold them. Additional factors that are taken into account in the distribution and allocation of investment opportunities to Client accounts include, without limitation: ability to utilize leverage and risk tolerance of the Client account; the amount of discretion and trade authority given to PIMCO by the Client; availability of other similar investment opportunities; the Client account’s investment horizon and objectives; hedging, cash and liquidity needs of the portfolio; minimum increments and lot sizes; and underlying benchmark factors. Given all of the foregoing factors, the amount, timing, structuring, or terms of an investment by a Client, including the Fund, may differ from, and performance may be lower than, investments and performance of other Clients, including those that may provide greater fees or other compensation (including performance-based fees or allocations) to PIMCO. PIMCO has also adopted additional procedures to complement the general trade allocation policy that are designed to address potential conflicts of interest due to the side-by-side management of the Fund and certain pooled investment vehicles, including investment opportunity allocation issues.
From time to time, PIMCO may take an investment position or action for one or more Clients that may be different from, or inconsistent with, an action or position taken for one or more other Clients having similar or differing investment objectives. These positions and actions may adversely impact, or in some instances may benefit, one or more affected Clients (including Clients that are PIMCO affiliates) in which PIMCO has an interest, or which pays PIMCO higher fees or a performance fee. For example, a Client may buy a security and another Client may establish a short position in that same security. The subsequent short sale may result in a decrease in the price of the security that the other Client holds. Similarly, transactions or investments by one or more Clients may have the effect of diluting or otherwise disadvantaging the values, prices or investment strategies of another Client.
When PIMCO implements for one Client a portfolio decision or strategy ahead of, or contemporaneously with, similar portfolio decisions or strategies of another Client, market impact, liquidity constraints or other factors could result in one or more Clients receiving less favorable trading results, the costs of implementing such portfolio decisions or strategies could be increased or such Clients could otherwise be disadvantaged. On the other hand, potential conflicts may also arise because portfolio decisions regarding a Client may benefit other Clients. For example, the sale of a long position or establishment of a short position for a Client may decrease the price of the same security sold short by (and therefore benefit) other Clients, and the purchase of a security or covering of a short position in a security for a Client may increase the price of the same security held by (and therefore benefit) other Clients.
Under certain circumstances, a Client may invest in a transaction in which one or more other Clients are expected to participate, or already have made or will seek to make, an investment. In addition, to the extent permitted by applicable law, a Client may also engage in investment transactions that may result in other Clients being relieved of obligations, or that may cause other Clients to divest certain investments (e.g., a Client may make a loan to, or directly or indirectly acquire securities
or indebtedness of, a company that uses the proceeds to refinance or reorganize its capital structure, which could result in repayment of debt held by another Client). Such Clients (or groups of Clients) may have conflicting interests and objectives in connection with such investments, including with respect to views on the operations or activities of the issuer involved, the targeted returns from the investment and the timeframe for, and method of, exiting the investment. When making such investments, PIMCO may do so in a way that favors one Client over another Client, even if both Clients are investing in the same security at the same time. Certain Clients may invest on a “parallel” basis (i.e., proportionately in all transactions at substantially the same time and on substantially the same terms and conditions). In addition, other accounts may expect to invest in many of the same types of investments as another account. However, there may be investments in which one or more of such accounts does not invest (or invests on different terms or on a non-pro rata basis) due to factors such as legal, tax, regulatory, business, contractual or other similar considerations or due to the provisions of a Client’s governing documents. Decisions as to the allocation of investment opportunities among such Clients present numerous conflicts of interest, which may not be resolved in a manner that is favorable to a Client’s interests. To the extent an investment is not allocated pro rata among such entities, a Client could incur a disproportionate amount of income or loss related to such investment relative to such other Client.
In addition, Clients may invest alongside one another in the same underlying investments or otherwise pursuant to a substantially similar investment strategy as one or more other Clients. In such cases, certain Clients may have preferential liquidity and information rights relative to other Clients holding the same investments, with the result that such Clients will be able to withdraw/redeem their interests in underlying investments in priority to Clients who may have more limited access to information or more restrictive withdrawal/redemption rights. Clients with more limited information rights or more restrictive liquidity may therefore be adversely affected in the event of a downturn in the markets.
Further, potential conflicts may be inherent in PIMCO’s use of multiple strategies. For example, conflicts will arise in cases where different Clients invest in different parts of an issuer’s capital structure, including circumstances in which one or more Clients may own private securities or obligations of an issuer and other Clients may own or seek to acquire private securities of the same issuer. For example, a Client may acquire a loan, loan participation or a loan assignment of a particular borrower in which one or more other Clients have an equity investment, or may invest in senior debt obligations of an issuer for one Client and junior debt obligations or equity of the same issuer for another Client. PIMCO may also, for example, direct a Client to invest in a tranche of a structured finance vehicle, such as a CLO or CDO, where PIMCO is also, at the same or different time, directing another Client to make investments in a different tranche of the same vehicle, which tranche’s interests may be adverse to other tranches.
PIMCO may also cause a Client to purchase from, or sell assets to, an entity, such as a structured finance vehicle, in which other Clients may have an interest, potentially in a manner that will have an adverse effect on the other Clients. There may also be conflicts where, for example, a Client holds certain debt or equity securities of an issuer, and that same issuer has issued other debt, equity or other instruments that are owned by other Clients or by an entity, such as a structured finance vehicle, in which other Clients have an interest.
In each of the situations described above, PIMCO may take actions with respect to the assets held by one Client that are adverse to the other Clients, for example, by foreclosing on loans, by putting an issuer into default, or by exercising rights to purchase or sell to an issuer, causing an issuer to take actions adverse to certain classes of securities, or otherwise. In negotiating the terms and conditions of any such investments, or any subsequent amendments or waivers or taking any other actions, PIMCO may find that the interests of a Client and the interests of one or more other Clients could conflict. In these situations, decisions over items such as whether to make the investment or take an action, proxy voting, corporate reorganization, how to exit an investment, or bankruptcy or similar matters (including, for example, whether to trigger an event of default or the terms of any workout) may result in conflicts of interest. Similarly, if an issuer in which a Client and one or more other Clients directly or indirectly hold different classes of securities (or other assets, instruments or obligations issued by such issuer or underlying investments of such issuer) encounters financial problems, decisions over the terms of any workout will raise conflicts of interests (including, for example, conflicts over proposed waivers and amendments to debt covenants). For example, a debt holder may be better served by a liquidation of the issuer in which it may be paid in full, whereas an equity or junior bond holder might prefer a reorganization that holds the potential to create value for the equity holders. In some cases PIMCO may refrain from taking certain actions or making certain investments on behalf of Clients in order to avoid or mitigate certain conflicts of interest or to prevent adverse regulatory or other effects on PIMCO, or may sell investments for certain Clients (in each case potentially disadvantaging the Clients on whose behalf the actions are not taken, investments not made, or investments sold). In other cases, PIMCO may not refrain from taking actions or making investments on behalf of certain Clients that have the potential to disadvantage other Clients. In addition, PIMCO may take actions or refrain from taking actions in order to mitigate legal risks to PIMCO or its affiliates or its Clients even if disadvantageous to
a Client’s account. Moreover, a Client may invest in a transaction in which one or more other Clients are expected to participate, or already have made or will seek to make, an investment.
Additionally, certain conflicts may exist with respect to portfolio managers who make investment decisions on behalf of several different types of Clients. Such portfolio managers may have an incentive to allocate trades, time or resources to certain Clients, including those Clients who pay higher investment management fees or that pay incentive fees or allocations, over other Clients. These conflicts may be heightened with respect to portfolio managers who are eligible to receive a performance allocation under certain circumstances as part of their compensation.
From time to time, PIMCO personnel may come into possession of MNPI which, if disclosed, might affect an investor’s decision to buy, sell or hold a security. Should a PIMCO employee come into possession of MNPI with respect to an issuer, he or she generally will be prohibited from communicating such information to, or using such information for the benefit of, Clients, which could limit the ability of Clients to buy, sell or hold certain investments, thereby limiting the investment opportunities or exit strategies available to Clients. In addition, holdings in the securities or other instruments of an issuer by PIMCO or its affiliates may affect the ability of a Client to make certain acquisitions of or enter into certain transactions with such issuer. PIMCO has no obligation or responsibility to disclose such information to, or use such information for the benefit of, any person (including Clients).
PIMCO maintains one or more restricted lists of companies whose securities are subject to certain trading prohibitions due to PIMCO’s business activities. PIMCO may restrict trading in an issuer’s securities if the issuer is on a restricted list or if PIMCO has MNPI about that issuer. In some situations, PIMCO may restrict Clients from trading in a particular issuer’s securities in order to allow PIMCO to receive MNPI on behalf of other Clients. A Client may be unable to buy or sell certain securities until the restriction is lifted, which could disadvantage the Client. PIMCO may also be restricted from making (or divesting of) investments in respect of some Clients but not others. In some cases PIMCO may not initiate or recommend certain types of transactions, or may otherwise restrict or limit its advice relating to certain securities if a security is restricted due to MNPI or if PIMCO is seeking to limit receipt of MNPI.
PIMCO may conduct litigation or engage in other legal actions on behalf of one or more Clients. In such cases, Clients may be required to bear certain fees, costs, expenses and liabilities associated with the litigation. Other Clients that are or were investors in, or otherwise involved with, the subject investments may or may not (depending on the circumstances) be parties to such litigation actions, with the result that certain Clients may participate in litigation actions in which not all Clients with similar investments may participate, and such nonparticipating Clients may benefit from the results of such litigation actions without bearing or otherwise being subject to the associated fees, costs, expenses and liabilities. PIMCO, for example, typically does not pursue legal claims on behalf of its separate accounts. Furthermore, in certain situations, litigation or other legal actions pursued by PIMCO on behalf of a Client may be brought against or be otherwise adverse to a portfolio company or other investment held by a Client.
Co-Investments. The 1940 Act imposes significant limits on co-investment with affiliates of the Fund. PIMCO has received exemptive relief from the SEC that permits the Fund to, among other things, co-invest with certain affiliates. Co-investment transactions may give rise to conflicts of interest or perceived conflicts of interest among the Fund and its affiliates. If granted, the exemptive order will impose certain conditions that may limit or restrict the Fund’s ability to participate in an investment or participate in an investment to a lesser extent. An inability to receive the desired allocation to potential investments may affect the Fund’s ability to achieve the desired investment returns. In the event investment opportunities are allocated among the Fund and its affiliates pursuant to co-investment exemptive relief, the Fund may not be able to structure its investment portfolio in the manner desired. Although PIMCO will endeavor to allocate investment opportunities in a fair and equitable manner, the Fund will generally not be permitted to co-invest in any issuer in which a fund managed by PIMCO or any of its downstream affiliates (other than the Fund and its downstream affiliates) currently has an investment. However, the Fund would be able to co-invest with funds managed by PIMCO or any of its downstream affiliates, subject to compliance with existing regulatory guidance, applicable regulations and its allocation procedures. Pursuant to co-investment exemptive relief, the Fund will be able to invest in opportunities in which PIMCO and/or its affiliates has an investment, and PIMCO and/or its affiliates will be able to invest in opportunities in which the Fund has made an investment. From time to time, the Fund and its affiliates may make investments at different levels of an issuer’s capital structure or otherwise in different classes of an issuer’s securities. Such investments inherently give rise to conflicts of interest or perceived conflicts of interest between or among the various classes of securities that may be held by such entities. PIMCO has adopted procedures governing the co-investment in securities acquired in private placements with certain clients of PIMCO.
The foregoing is not a complete list of conflicts to which PIMCO or Clients may be subject. PIMCO seeks to review conflicts on a case-by-case basis as they arise. Any review will take into consideration the interests of the relevant Clients, the
circumstances giving rise to the conflict, applicable PIMCO policies and procedures, and applicable laws. Clients (and investors in the Fund) should be aware that conflicts will not necessarily be resolved in favor of their interests and may in fact be resolved in a manner adverse to their interests. PIMCO will attempt to resolve such matters fairly, but even so, matters may be resolved in favor of other Clients which pay PIMCO higher fees or performance fees or in which PIMCO or its affiliates have a significant proprietary interest. There can be no assurance that any actual or potential conflicts of interest will not result in a particular Client or group of Clients receiving less favorable investment terms in or returns from certain investments than if such conflicts of interest did not exist.
Conflicts like those described above may also occur between Clients, on the one hand, and PIMCO or its affiliates, on the other. These conflicts will not always be resolved in favor of the Client. In addition, because PIMCO is affiliated with Allianz, a large multi-national financial institution, conflicts similar to those described above may occur between clients of PIMCO and PIMCO’s affiliates or accounts managed by those affiliates. Those affiliates (or their clients), which generally operate autonomously from PIMCO, may take actions that are adverse to PIMCO’s Clients. In many cases, PIMCO will have limited or no ability to mitigate those actions or address those conflicts, which could adversely affect Client performance. In addition, certain regulatory or internal restrictions may prohibit PIMCO from using certain brokers or investing in certain companies (even if such companies are not affiliated with Allianz) because of the applicability of certain laws and regulations or internal Allianz policies applicable to PIMCO, Allianz SE or their affiliates. An account’s willingness to negotiate terms or take actions with respect to an investment may also be, directly or indirectly, constrained or otherwise impacted to the extent Allianz SE, PIMCO, and/or their affiliates, directors, partners, managers, members, officers or personnel are also invested therein or otherwise have a connection to the subject investment (e.g., serving as a trustee or board member thereof).
Certain service providers to the Fund are expected to be owned by or otherwise related to or affiliated with a Client, and in certain cases, such service providers are expected to be, or are owned by, employed by, or otherwise related to, PIMCO, Allianz SE, their affiliates and/or their respective employees, consultants and other personnel. PIMCO may, in its sole discretion, determine to provide, or engage or recommend an affiliate of PIMCO to provide, certain services to the Fund, instead of engaging or recommending one or more third parties to provide such services. Subject to the governance requirements of a particular fund and applicable law, PIMCO or its affiliates, as applicable, will receive compensation in connection with the provision of such services. As a result, PIMCO faces a conflict of interest when selecting or recommending service providers for the Fund. Fees paid to an affiliated service provider will be determined in PIMCO’s commercially reasonable discretion, taking into account the relevant facts and circumstances, and consistent with PIMCO’s responsibilities. Although PIMCO has adopted various policies and procedures intended to mitigate or otherwise manage conflicts of interest with respect to affiliated service providers, there can be no guarantee that such policies and procedures (which may be modified or terminated at any time in PIMCO’s sole discretion) will be successful.
Performance Fees. A portfolio manager may advise certain accounts with respect to which the advisory fee is based entirely or partially on performance. Performance fee arrangements may create a conflict of interest for the portfolio manager in that the portfolio manager may have an incentive to allocate the investment opportunities that he or she believes might be the most profitable to such other accounts instead of allocating them to the Fund. PIMCO has adopted policies and procedures reasonably designed to allocate investment opportunities between the Fund and such other accounts on a fair and equitable basis over time.
(a)(3)
As of June 30, 2023, the following explains the compensation structure of the individuals who have primary responsibility for day-to-day portfolio management of the Fund:
Portfolio Manager Compensation
PIMCO and its affiliates’ approach to compensation seeks to provide professionals with a compensation process that is driven by values of collaboration, openness, responsibility and excellence.
Generally, compensation packages consist of three components. The compensation program for portfolio managers is designed to align with clients’ interests, emphasizing each portfolio manager’s ability to generate long-term investment success for clients, among other factors. A portfolio manager’s compensation is not based solely on the performance of the Fund or any other account managed by that portfolio manager:
Base Salary – Base salary is determined based on core job responsibilities, positions/levels and market factors. Base salary levels are reviewed annually, when there is a significant change in job responsibilities or position, or when there is a significant change in market levels.
Variable Compensation – In addition to a base salary, portfolio managers have a variable component of their compensation, which is based on a combination of individual and company performance and includes both qualitative and quantitative factors. The following non-exhaustive list of qualitative and quantitative factors is considered when determining total compensation for portfolio managers:
| ☐ | Performance measured over a variety of longer- and shorter-term periods, including 5- year, 4-year, 3-year, 2- year and 1-year dollar-weighted and account-weighted, pre-tax total and risk-adjusted investment performance as judged against the applicable benchmarks (which may include internal investment performance-related benchmarks) for each account managed by a portfolio manager (including the Fund) and relative to applicable industry peer groups; and |
| ☐ | Amount and nature of assets managed by the portfolio manager. |
The variable compensation component of an employee’s compensation may include a deferred component. The deferred portion will generally be subject to vesting and may appreciate or depreciate based on the performance of PIMCO and/or its affiliates. PIMCO’s Long-Term Incentive Plan provides participants with deferred cash awards that appreciate or depreciate based on PIMCO’s operating earnings over a rolling three-year period.
Portfolio managers who are Managing Directors of PIMCO receive compensation from a non-qualified profit sharing plan consisting of a portion of PIMCO’s net profits. Portfolio managers who are Managing Directors receive an amount determined by the Compensation Committee, based upon an individual’s overall contribution to the firm.
(a)(4)
The following summarizes the dollar range of securities of the Fund the Portfolio Managers beneficially owned as of June 30, 2023:
| Portfolio Manager | Dollar Range of Equity Securities of the Fund Owned as of June 30, 2023
| |
| Daniel J. Ivascyn | over $1,000,000 | |
| Joshua Anderson | $100,001-$500,000 | |
| Alfred T. Murata | $500,001-$100,000,000 |
| Item 9. | Purchases of Equity Securities by Closed-End Management Investment Company and Affiliated Purchasers. |
None.
| Item 10. | Submission of Matters to a Vote of Security Holders. |
There have been no material changes to the procedures by which shareholders may recommend nominees to the Fund’s
Board of Trustees since the Fund last provided disclosure in response to this item.
| Item 11. | Controls and Procedures. |
| (a) | The principal executive officer and principal financial & accounting officer have concluded as of a date within 90 days of the filing date of this report, based on their evaluation of the Registrant’s disclosure controls and procedures (as defined in Rule 30a-3(c) under the 1940 Act), that the design of such procedures is effective to provide reasonable assurance that material information required to be disclosed by the Registrant on Form N-CSR is recorded, processed, summarized and reported within the time periods specified in the Commission’s rules and forms. |
| (b) | There were no changes in the Registrant’s internal control over financial reporting (as defined in Rule 30a-3(d) under the 1940 Act (17 CFR 270.30a-3(d))) that occurred during the period covered by this report that have materially affected, or are reasonably likely to materially affect, the Registrant’s internal control over financial reporting. |
| Item 12. | Disclosure of Securities Lending Activities for Closed-End Management Investment Companies. |
None.
| Item 13. | Exhibits. |
| (a)(3) | None. |
| (a)(4) | There was no change in the registrant’s independent public accountant for the period covered by the report. |
Signatures
Pursuant to the requirements of the Securities Exchange Act of 1934 and the Investment Company Act of 1940, the registrant has duly caused this report to be signed on its behalf by the undersigned, thereunto duly authorized.
| PIMCO Dynamic Income Fund | ||
| By: | /s/ Eric D. Johnson
| |
| ||
| Eric D. Johnson | ||
| President (Principal Executive Officer) | ||
| Date: | August 31, 2023 | |
Pursuant to the requirements of the Securities Exchange Act of 1934 and the Investment Company Act of 1940, this report has been signed below by the following persons on behalf of the registrant and in the capacities and on the dates indicated.
| By: | /s/ Eric D. Johnson
| |
| ||
| Eric D. Johnson | ||
| President (Principal Executive Officer) | ||
| Date: | August 31, 2023 | |
| By: | /s/ Bijal Y. Parikh
| |
| ||
| Bijal Y. Parikh | ||
| Treasurer (Principal Financial & Accounting Officer) | ||
| Date: | August 31, 2023 | |