Securian AM Dynamic Managed Volatility Fund
Institutional Class Shares – VVMIX
Securian AM Managed Volatility Equity Fund
Institutional Class Shares – VMEIX
Securian AM Real Asset Income Fund
Institutional Class Shares – VSDIX
Annual Report
| www.securianamfunds.com | August 31, 2019 |
SECURIAN AM FUNDS
October 9, 2019
Securian AM Dynamic Managed Volatility Fund
Managers:
Craig Stapleton, CFA; Jeremy Gogos, CFA; Merlin Erickson
Securian Asset Management
FUND PERFORMANCE UPDATE
For the period beginning September 1, 2018 and ending August 31, 2019, the Dynamic Managed Volatility Fund (the “DMV Fund”) Institutional Class returned 4.54%, underperforming the DMV Benchmark return of 6.22%.
The Fund had a realized volatility, as measured by its standard deviation of daily returns, of 9.08%, compared to the Fund’s custom benchmark realized volatility of 9.56%.
The DMV Benchmark is a custom benchmark for the DMV Fund developed by Securian Asset Management.
For comparison, the S&P 500 Index (dividend adjusted) was up 2.92% with a volatility of 16.61% over the same period.
STRATEGY UPDATE
This period began with low volatility prevailing in the market. S&P 500 realized one-month volatility was 7.30% on August 31, 2018, and that metric drifted marginally lower over the course of September. As such, the Fund entered the period with an equity exposure of 81.33%. On October 10, 2018, the S&P 500 saw a 3.29% selloff, and the beginning of a period of elevated volatility that would last through January 2019. At its minimum, on Christmas Eve, the S&P had sold off 19.36% from its previous high, just shy of a bear market. In response to the escalating volatility, the Fund equity exposure was reduced to a period minimum of 27.00% on November 30, 2018 and was positioned at 32.81% at the trough of the S&P selloff (December 24, 2018). As volatility decreased through Q1 of 2019, the Fund equity exposure was increased, and closed out Q1 at 79.92%. May 2019 saw another bout of modestly elevated volatility, and a drawdown on the S&P of 6.62% (May 3, 2019 to June 3, 2019). Again, the Fund equity exposure was decreased to 53.65% in response. As volatility subsided in early June, we took a more defensive approach to re-risking the Fund and introduced S&P 500 call spreads, as opposed to direct linear exposure (e.g. futures). This approach proved appropriate, as the Fund was able to participate in some of the positive equity returns through July and avoid some of the volatility and losses that occurred in August. The Fund ended the period at 31.26% equity exposure.
MARKET SECTOR UPDATE
This period saw the current U.S. economic expansion set the record for longest ever: 123 months and counting, as of August 2019. While this fact could be taken as a positive indication for both the economy and financial assets going forward, we are firmly of the belief that the spectrum of possible equity returns over the near term is substantially skewed to the downside. Consider the following asset class returns.
SECURIAN AM FUNDS
Returns September 30, 2018 to August 30, 2019 | Gold (in U.S. Dollars) | Long Treasuries | Low Volatility Equity | S&P 500 | Russell 2000 | |
| Nasdaq |
| |
| 27.67% | 27.98% | 13.79% | 2.33% | -10.78% | 1.89% |
Source: Bloomberg.
September 30, 2018 was the approximate date the S&P made a local high before the volatility flare in Q4. And since that high, its price return has been essentially flat. More risky equity has fared worse. On the other hand, perceived “safe-haven” assets have performed incredibly well.
This period also saw global negative yielding debt top $16 trillion, S&P 500 earnings decline year over year for the first two quarters of 2019, and the U.S.-China trade dispute start to materially impact gross domestic product (GDP), with estimates ranging from 0.3 to 0.6% of GDP lost due to tariffs. Finally, the U.S. 3M-10Y yield curve was inverted for essentially all of the final three months, and as we have previously alluded to, the yield curve inversion has preceded every recession since 1980.
We view this mosaic as the manifestation of misguided monetary policy—more on that shortly—and poor execution on trade negotiations coming home to roost.
Regarding monetary policy, all three major central banks had been on a path toward tighter monetary policy in early 2019. Unfortunately, no bank made it very far toward normalization. The European Central Bank (ECB) merely stopped quantitative easing at the end of 2018; their policy rate is still 0%. The Bank of Japan (BOJ) is still targeting essentially 0% yield on its policy rate and 10Y bond. The Federal Reserve managed to hike its policy rate to 2.5%, but began cutting rates again on July 30, 2019! On the one hand, short-term yields in the United States are quite out of line with most of the rest of the developed world, so one can argue that rate cuts are warranted. On the other hand, the Fed’s policy rate was 5.25%, and its balance sheet was less than $1 trillion, going into the Great Financial Crisis. Starting from a policy rate of 2.25%, and a balance sheet of over $3.5 trillion, means that there is significantly less ammunition with which to combat the next recession.
This period also saw markets venture into uncharted territory. No prior time in history has seen the confluence of monetary, fiscal, and foreign policy unfolding on social media, and algorithmic trading reacting to this “news” in real time. At first blush, this certainly seems a destabilizing influence on equity markets.
SECURIAN AM FUNDS
OUTLOOK
Because of the state of the yield curve at the time of our last commentary, we had dismissed the possibility of further Fed hikes. We had also pointed to the Fed being forced to cut rates because of weakening macroeconomic conditions as our most likely outcome, and that seems to have come to pass. This reporting period began as one in which all three major central banks were simultaneously moving toward tighter monetary policy. By the end of the period, both the ECB and the Fed had announced, or actually enacted, easing measures. While the U.S. consumer is one area of economic strength, economic data across the globe has largely been deteriorating through 2019. Inflation has been muted, and below central bank targets. And global bond markets are screaming that there is no growth or inflation on the horizon; maybe the most extreme example of this is the Swiss 50Y sovereign bond, which was yielding -0.46% on August 30. Other long-duration sovereign yields may be a bit higher—the U.S. 30Y yield hit 1.95% on August 27 (an all-time low)—but they are telling the same story.
One could argue that the equity markets are also harmonizing with fixed income; over this period, we have seen selloffs and retracements to lost highs, but precious little appreciation past those previous high water marks. On a trailing one-year basis, most developed world indexes are either only modestly up:
| | • | S&P 500 = 2.92% |
| | • | Nasdaq = 1.60% |
| | • | FTSE 100 = 1.40% |
or outright in the red:
| | • | Russell 2000 = -12.92% |
| | • | MSCI EAFE (USD) = -2.65% |
| | • | MSCI Emerging Markets (USD) = -4.01% |
Maybe the most ominous signal from the global equity markets is the following. The Fed announced its first rate cut in this cycle on July 30, and that rate cut, along with several more over the next year were already priced into the market at that point. Even against that backdrop of anticipated monetary policy easing, every equity index mentioned above was down at least -1.58% for August. This reaction suggests that the world may have finally reached the limits of supporting financial asset valuations through monetary policy.
It is possible that the Federal Reserve’s new easing campaign could continue to support equity valuations for a time. Internationally, our view is that the ECB and BOJ are essentially helpless to foment further growth; they are already at the zero rate boundary, and any attempt to normalize monetary policy would almost certainly send their respective economies into recession. If one assumes cuts of 25 basis points, and four cuts per year, this implies the Fed can keep markets moving, and GDP from contracting, for about two years. We feel it would be optimistic to expect the current expansion to last that long, or to expect equities to produce returns in these next two years on par with the prior ten. We also expect volatility to be elevated going forward. Regardless, we will continue to use our volatility metrics to inform the equity allocation of the DMV Fund. We will aim to de-risk when we believe volatility will be high, and aim to re-risk when we believe volatility will be low.
SECURIAN AM FUNDS
October 9, 2019
Securian AM Managed Volatility Equity Fund
Managers:
Craig Stapleton, CFA; Jeremy Gogos, CFA; Merlin Erickson
Securian Asset Management
FUND PERFORMANCE UPDATE
For the period September 1, 2018 and ending August 31, 2019, the Managed Volatility Equity Fund (the “MVE Fund”) Institutional Class returned 3.32%, underperforming the MVE Benchmark return of 11.97%.
The MVE Benchmark is a custom benchmark for the MVE Fund developed by Securian Asset Management.
The Fund had a realized volatility, as measured by its standard deviation of daily returns, of 9.01%, as compared to the MVE Benchmark realized volatility of 7.94%.
For comparison, the S&P 500 Index (dividend adjusted) was up 2.92% with a volatility of 16.61% over the same period.
STRATEGY UPDATE
This period began with low volatility prevailing in the market. S&P 500 realized one-month volatility was 7.30% on August 31, 2018, and that metric drifted marginally lower over the course of September. As such, the Fund entered the period with an equity exposure of 93.97%. On October 10, 2018, the S&P 500 saw a 3.29% selloff, and the beginning of a period of elevated volatility that would last through January, 2019. At its minimum, on Christmas Eve, the S&P had sold off 19.36% from its previous high, just shy of a bear market. In response to the escalating volatility, the Fund equity exposure was gradually reduced over the course of December and was positioned at 62.08% at the trough of the S&P selloff (December 24, 2018). As volatility decreased through Q1 of 2019, the Fund equity exposure was increased, and closed out Q1 at 97.96%. While May and August saw periods of modestly elevated volatility, the Managed Volatility Equity allocation target did not materially change, and so the Fund equity exposure was maintained between 94.32% and 98.05%. We did, however, carry S&P put spread or VIX call options through June, July, and August, to hedge against a significant equity market selloff. The Fund ended the period at 97.51% equity exposure.
Another obvious strategy point to address is the large underperformance of the Fund relative to the benchmark for this period. Managed Volatility Equity is a global equity strategy that targets a 10% realized volatility over a full market cycle and seeks to mitigate severe equity drawdowns. We select what we believe are best-of-breed low volatility equity vehicles as a starting point for the portfolio, and we then incorporate a derivatives-based risk management overlay. The domestic and international low volatility vehicles we employ track indexes from MSCI; the benchmark’s constituents are from S&P and were chosen simply because they were thematically similar to our actual investments, but distinct in their approach. MSCI begins from a universe (domestic or international) of mid and large cap stocks similar to other developed market indexes and employs a constrained optimization approach that attempts to constructs a minimum variance portfolio that maintains roughly the same market cap distribution and sector representation as the starting universe. S&P, on the other hand, simply weights each universe member by the reciprocal of its realized volatility, and then takes a fixed number of members to create a low volatility index (100 members, in the case of the S&P 500 Low Volatility Index). This approach tends to skew heavily toward utilities, financials, real estate, consumer staples, and other “defensive” sectors. To give a sense for what this heavy sector skew in the benchmark produced during the period, consider the following returns for the period:
SECURIAN AM FUNDS
| | • | S&P 500 = 2.92% |
| | • | S&P 500 Utilities = 21.18% |
| | • | S&P 500 Financials = -2.91% |
| | • | S&P 500 Real Estate = 20.29% |
| | • | S&P 500 Consumer Staples = 16.09% |
Financials did poorly, which is understandable given the current interest rate environment. On the other hand, It is extremely unusual to see the utilities, real estate, and consumer staples sectors so massively outperform the full S&P 500 Index. And, in the S&P 500, utilities currently have a weight around 3.5%; in the S&P 500 Low Volatility Index, they comprise around 28%. These happenstance sector overweights are the predominant reason for the recent exceptional benchmark performance.
Clearly, the benchmark would have been a better managed volatility choice for this one-year period. But longer term, we still firmly believe in diversification, and still believe that the MSCI approach is the superior method for constructing a minimum variance equity portfolio. Further, something feels fundamentally amiss when the Fund outperformed the S&P 500 for the period, and yet the performance is deeply unsatisfactory. We actually interpret this as a market inflection point and delve into why in the remainder of this Letter.
MARKET SECTOR UPDATE
This period saw the current U.S. economic expansion set the record for longest ever: 123 months and counting, as of August 2019. While this fact could be taken as a positive indication for both the economy and financial assets going forward, we are firmly of the belief that the spectrum of possible equity returns over the near term is substantially skewed to the downside. Consider the following asset class returns.
Returns September 30, 2018 to August 30, 2019 | Gold (in U.S. Dollars) | Long Treasuries | Low Volatility Equity | S&P 500 | Russell 2000 | |
| Nasdaq |
| |
| 27.67% | 27.98% | 13.79% | 2.33% | -10.78% | 1.89% |
Source: Bloomberg.
September 30, 2018 was the approximate date the S&P made a local high before the volatility flare in Q4. And since that high, its price return has been essentially flat. More risky equity has fared worse. On the other hand, perceived “safe-haven” assets have performed incredibly well.
This period also saw global negative yielding debt top $16T, S&P 500 earnings decline year over year for the first two quarters of 2019, and the US-China trade dispute start to materially impact gross domestic product (GDP), with estimates ranging from 0.3 to 0.6% of GDP lost due to tariffs. Finally, the US 3M-10Y yield curve was inverted for essentially all of the final three months, and as we have previously alluded to, the yield curve inversion has preceded every recession since 1980.
SECURIAN AM FUNDS
We view this mosaic as the manifestation of misguided monetary policy—more on that shortly—and poor execution on trade negotiations coming home to roost.
Regarding monetary policy, all three major central banks had been on a path toward tighter monetary policy in early 2019. Unfortunately, no bank made it very far toward normalization. The European Central Bank (ECB) merely stopped quantitative easing at the end of 2018; their policy rate is still 0%. The Bank of Japan (BOJ) is still targeting essentially 0% yield on its policy rate and 10Y bond. The Federal Reserve managed to hike its policy rate to 2.5%, but began cutting rates again on July 30, 2019! On the one hand, short-term yields in the United States are quite out of line with most of the rest of the developed world, so one can argue that rate cuts are warranted. On the other hand, the Fed’s policy rate was 5.25%, and its balance sheet was less than $1T, going into the Great Financial Crisis. Starting from a policy rate of 2.25%, and a balance sheet of over $3.5T, means that there is significantly less ammunition with which to combat the next recession.
This period also saw markets venture into uncharted territory. No prior time in history has seen the confluence of monetary, fiscal, and foreign policy unfolding on social media, and algorithmic trading reacting to this “news” in real time. At first blush, this certainly seems a destabilizing influence on equity markets.
OUTLOOK
Because of the state of the yield curve at the time of our last commentary, we had dismissed the possibility of further Fed hikes. We had also pointed to the Fed being forced to cut rates because of weakening macroeconomic conditions as our most likely outcome, and that seems to have come to pass. This reporting period began as one in which all three major central banks were simultaneously moving toward tighter monetary policy. By the end of the period, both the ECB and the Fed had announced, or actually enacted, easing measures. While the US consumer is one area of economic strength, economic data across the globe has largely been deteriorating through 2019. Inflation has been muted, and below central bank targets. And global bond markets are screaming that there is no growth or inflation on the horizon; maybe the most extreme example of this is the Swiss 50Y sovereign bond, which was yielding -0.46% on August 30. Other long-duration sovereign yields may be a bit higher—the US 30Y yield hit 1.95% on August 27 (an all-time low)—but they are telling the same story.
SECURIAN AM FUNDS
One could argue that the equity markets are also harmonizing with fixed income; over this period, we have seen selloffs and retracements to lost highs, but precious little appreciation past those previous high water marks. On a trailing one-year basis, most developed world indexes are either only modestly up:
| | • | S&P 500 = 2.92% |
| | • | Nasdaq = 1.60% |
| | • | FTSE 100 = 1.40% |
or outright in the red:
| | • | Russell 2000 = -12.92% |
| | • | MSCI EAFE (USD) = -2.65% |
| | • | MSCI Emerging Markets (USD) = -4.01% |
Maybe the most ominous signal from the global equity markets is the following. The Fed announced its first rate cut in this cycle on July 30, and that rate cut, along with several more over the next year were already priced into the market at that point. Even against that backdrop of anticipated monetary policy easing, every equity index mentioned above was down at least -1.58% for August. This reaction suggests that the world may have finally reached the limits of supporting financial asset valuations through monetary policy.
It is possible that the Federal Reserve’s new easing campaign could continue to support equity valuations for a time. Internationally, our view is that the ECB and BOJ are essentially helpless to foment further growth; they are already at the zero rate boundary, and any attempt to normalize monetary policy would almost certainly send their respective economies into recession. If one assumes cuts of 25 bps, and four cuts per year, this implies the Fed can keep markets moving, and GDP from contracting, for about two years. We feel it would be optimistic to expect the current expansion to last that long, or to expect equities to produce returns in these next two years on par with the prior ten. We also expect volatility to be elevated going forward. Regardless, we will continue to use our volatility metrics to inform the equity allocation of the MVE Fund. We will aim to de-risk when we believe volatility will be high, and aim to re-risk when we believe volatility will be low.
SECURIAN AM FUNDS
October 9, 2019
Securian AM Real Asset Income Fund
Managers:
Joseph Betlej, CFA; Lowell Bolken, CFA; Craig Stapleton, CFA
Securian Asset Management
For the period beginning September 1, 2018 and ending August 31, 2019, the return for the Securian AM Real Asset Income Fund’s (the “RAI Fund”) Institutional Class was 6.32%, outperforming the Morningstar US Real Asset Total Return Index at 1.65%, but trailing the RAI custom benchmark return of 9.41%. For additional comparison, the S&P 500 Index (dividend adjusted) was up 2.92% during the same period. The RAI Fund’s dividend yield and volatility relative to the S&P 500 volatility throughout the year was consistent with expectations.
Indeed, spikes of market volatility returned to investment markets during the year. A lack of clarity regarding long- and short-term interest rates, energy commodity price drops, Federal Reserve (the “Fed”) actions, trade tensions, slowing economic growth, and corporate earnings provided many short-term swings in market performance. Growing uncertainty let risk sentiment to rise throughout the period. U.S. growth, however, remained relatively strong versus other parts of the globe. The Fed has attempted to support economic growth and targeted inflation through more dovish positioning through the year. Investment markets moved to a defensive stance, providing support for many of the Fund’s target sectors.
Real Estate Investment Trusts (“REITs”) saw a decline in the beginning of the period after a significant rally at the end of the previous timeframe. With concerns on a weakening economy and continued slowing of earnings growth, REITs had weak performance during the first four months of the reporting period. Later, with the return of defensive sentiment, REITs rebounded, on the backs of higher yielding, more visible earnings property types, such as healthcare, self-storage, multifamily, and warehouse. Economically sensitive REIT sectors (hotels and retail) provided lesser performance. For the year, REITs were up 12.1 percent.
Utilities generated very strong performance in the period, with positive returns of 21.0 percent. Among the uncertain economic backdrop, utility companies also provided a defensive, perceived “safe haven” in the market. Best opportunities were in well-capitalized regulated utilities with very visible earnings.
Midstream energy infrastructure stocks, as measured by the Alerian MLP Index, plummeted down 11.2 percent for the year, reflecting concerns on product flow based on weak energy commodity prices. Trade issues and Middle Eastern tensions added significant volatility to this group for the year.
Bonds and preferred stock performed well during the year. Tightening credit spreads and declining yields on long-term Treasury bonds were factors supporting performance in these asset classes.
STRATEGY
A weaker outlook for the economy and corporate earnings led us to increase weightings in more defensive names in our targeted sectors. Significant momentum, however, carried into utility and REIT stocks, particularly into names with high multiples and low dividend yields. On valuations at the high end of historic ranges, our discipline led us to sell. This move, however, was to the detriment of portfolio return as we missed out on the extended valuation move found in these sectors in the year. We added to midstream energy infrastructure names as commodity prices dragged down the stock prices for these companies. Additionally, we feel that many of these companies are better investments today, having restructured their business models, improved balance sheets, and are moving away from the need to tap the capital markets to enhance their growth.
SECURIAN AM FUNDS
OUTLOOK
In these times of uncertainty, it appears that investors are taking refuge in fast growing and income producing sectors. Though the broader equity markets hit record highs during the summer, much of the gain came from the large-cap tech companies. Still, some defensive sectors, such as utilities and some REITs were outperformers. With U.S. gross domestic product expectations to be below 2 percent versus earlier thoughts of 3 percent growth, corporate earnings may also be weaker. Tariff wars with China, flare-ups in the Mideast, and global economic weakness (some influence from Brexit issues) are ingredients leading to heightened volatility. The question is whether domestic earnings, boosted by the Fed’s recent dovish stance, can sustain amidst turmoil abroad.
Commercial real estate markets are showing near-term improvement as modest demand continues, and new supply additions appear to be slowing. While the next few quarter’s earnings might have some challenges, continued economic and job growth should allow for sound fundamentals for REITs. The direction of interest rates will continue to be a major factor influencing returns for REITs. Focus will be on companies with a competitive advantage in their markets, and a visible earnings growth path.
Regulated rate base growth should continue to drive performance for utility stocks, while valuation multiples are not likely to expand from this point. Companies investing in renewable generation, system reliability, and some merger and acquisition activity could provide opportunities for outperformance in utilities.
If Oil and Natural Gas prices continue their rebound from recent lows, energy commodity volumes should pick up, benefiting midstream companies. Best opportunities may be in energy basins that could see upside due to better pricing metrics in their markets. Constrained access to midstream assets, particularly export facilities, should drive better margins and improved cashflow for these companies.
SECURIAN AM FUNDS
Past performance is not a guarantee of future results.
Fund holdings and sector allocations are subject to change and should not be considered a recommendation to buy or sell any security. For a complete list of fund holdings, please refer to the Schedule of Investments in this report.
Diversification does not assure a profit nor protect against loss in a declining market.
Mutual fund investing involves risk. Principal loss is possible. Investors should be aware of the risks involved with investing in a fund concentrating in a specific industry such as REITs or real estate securities. These include risks such as declines in the value of real estate and increased susceptibility to adverse economic or regulatory developments. Investing in small and medium-sized companies involves greater risks than those associated with investing in large company stocks, such as business risk, significant stock price fluctuations and illiquidity. The Funds may invest in foreign securities which involve political, economic and currency risks, greater volatility and differences in accounting methods. Investments in ETFs and ETNs are subject to additional risks that do not apply to conventional mutual funds, including the risks that the market price of the shares may trade at a discount to its net asset value (“NAV”), an active secondary trading market may not develop or be maintained, or trading may be halted by the exchange in which they trade, which may impact a Fund’s ability to sell its shares. MLPs are subject to certain risks inherent in the structure of MLPs, including complex tax structure risks, the limited ability for election or removal of management, limited voting rights, potential dependence on parent companies or sponsors for revenues to satisfy obligations, and potential conflicts of interest between partners, members and affiliates. The funds may also use options and future contracts, which have the risks of unlimited losses of the underlying holdings due to unanticipated market movements and failure to correctly predict the direction of securities prices, interest rates and currency exchange rates. Covered calls may limit the upside potential of the underlying security. Interest payments on TIPS are unpredictable and will fluctuate as the principal and corresponding interest payments are adjusted for inflation. Investments in debt securities typically decrease in value when interest rates rise. This risk is usually greater for longer-term debt securities. Investment in lower-rated and non-rated securities presents a greater risk of loss to principal and interest than higher-rated securities. Investments in asset backed and mortgage backed securities include additional risks that investors should be aware of such as credit risk, prepayment risk, possible illiquidity and default, as well as increased susceptibility to adverse economic developments. Municipal securities are subject to adverse political or economic factors, including changes in the tax law. Derivatives involve special risks including leverage, correlation, counterparty, liquidity, operational, accounting and tax risks. These risks, in certain cases, may be greater than the risks presented by more traditional investments. The Funds may invest in illiquid securities which involve the risk that the securities will not be able to be sold at the time or prices desired by the fund, particularly during times of market turmoil.
The DMV Benchmark is a custom benchmark created by Securian Asset Management, it is comprised of 60% S&P 500 Index and 40% Bloomberg Barclays U.S. Aggregate Bond Index. The S&P 500 Index is an unmanaged, market-value weighted index of stocks, which is widely regarded as the standard for measuring large-cap U.S. stock market performance. The Bloomberg Barclays U.S. Aggregate Bond Index is an unmanaged, market-value weighted index of bonds, which is widely regarded as the standard for measuring investment grade bond performance.
The MVE Benchmark is a custom benchmark created by Securian Asset Management, it is comprised of 60% S&P 500 Low Volatility Index; 20% S&P BMI International Developed Low Volatility Index; and 20% Bloomberg Barclays U.S. 3 Month Treasury Bellwether Index. The S&P 500 Low Volatility Index measures the performance of the 100 least volatile stocks in the S&P 500 Index based on their historical volatility. The S&P BMI International Developed Low Volatility Index measures the performance of the 200 least volatile stocks in the S&P Developed Market large/midcap universe. Constituents are weighted relative to the inverse of their corresponding volatility, with the least volatile stocks receiving the highest weights. The Bloomberg Barclays U.S. 3 Month Treasury Bellwether Index measures the performance of U.S. Treasury Bills with a maturity of less than three months.
The RAI Benchmark is a custom benchmark created by Securian Asset Management, it is comprised of 54% FTSE NAREIT Equity REITs Index; 12% S&P 500 Utilities Index; 12% Alerian MLP Total Return Index; 12% Bloomberg Barclays Capital US Government Inflation Linked Bond Index; and 10% Wells Fargo Hybrid & Preferred REIT. Alerian MLP Total Return Index – a composite of the 50 most prominent energy Master Limited Partnerships (MLPs). Bloomberg Barclays Capital US Government Inflation Linked Bond Index – an index that includes publicly issued, U.S. Treasury inflation protected securities that have at least 1 year remaining to maturity of index rebalancing date, with an issue size equal to or in excess of $500 million. The S&P 500 Utilities Index – an index of those companies included in the S&P 500 that are classified as members of the GICS® utilities sector. Wells Fargo Hybrid & Preferred REIT Index – an index composed exclusively of preferred shares and depository shares designed to track the performance of preferred securities issued in the U.S. markets by Real Estate Investment Trusts (REITs). FTSE NAREIT Equity REITs Index – an index of publicly traded U.S. real estate equity securities.
The Alerian MLP Index is a market-cap weighted, float-adjusted index created to provide a comprehensive benchmark for investors to track the performance of the energy MLP sector.
SECURIAN AM FUNDS
The CBOE Volatility Index® (VIX®) is a key measure of market expectations of near-term volatility conveyed by S&P 500 stock index option prices.
The FTSE (Financial Times Stock Exchange) 100 Index is a market-capitalization weighted index of UK-listed blue chip companies. The index is part of the FTSE UK Series and is designed to measure the performance of the 100 largest companies traded on the London Stock Exchange that pass screening for size and liquidity. FTSE 100 constituents are all traded on the London Stock Exchange’s SETS trading system.
The Morningstar US Real Asset Index is a diversified portfolio of four different asset classes that have historically displayed high sensitivity to inflation. These four asset classes are U.S. Treasury inflation-protected securities (“TIPS”), commodity futures-based strategies, real estate investment trusts (“REITs”), and inflation-sensitive equities such as upstream commodity stocks and master limited partnerships.
The MSCI EAFE Index is a stock market index that is designed to measure the equity market performance of developed markets outside of the U.S. and Canada. The EAFE acronym stands for Europe, Australasia and Far East.
The MSCI Emerging Markets Index captures large and mid cap representation across 26 emerging markets countries. With 1,202 constituents, the index covers approximately 85% of the free-float adjusted market capitalization in each country.
The NASDAQ Composite Index measures all NASDAQ domestic and international based common type stocks listed on The NASDAQ Stock Market. The NASDAQ Composite is calculated under a market capitalization weighted methodology index.
The Russell 2000 Index measures the performance of the small-cap segment of the U.S. equity universe. It includes approximately 2,000 of the smallest securities based on a combination of their market cap and current index membership.
S&P 500 Financials Index – an index of those companies included in the S&P 500 that are classified as members of the GICS® financial sector.
S&P 500 Real Estate Index – an index of those companies included in the S&P 500 that are classified as members of the GICS® real estate sector.
S&P 500 Consumer Staples Index – an index of those companies included in the S&P 500 that are classified as members of the GICS® consumer staples sector.
It is not possible to invest directly in an index.
Standard deviation measures the dispersion of a set of data from its mean.
Dividend yield is calculated by annualizing the last quarterly dividend paid and dividing it by the current share price. The dividend yield is that of the securities held in the portfolio; it is not reflective of the yield distributed to shareholders.
Drawdown reflects the peak-to-trough decline during a specific period of time.
Spread is the difference between a bid and ask price. It also refers to the difference in a trading position – the gap between a short position in one futures contract and a long position in another.
Basis points is a common unit of measure in finance and is used to denote the percentage change in a financial instrument. One basis point is equal to 0.01 percent.
A stock may trade with more or less liquidity than a bond depending on the number of shares and bonds outstanding, the size of the company, and the demand for the securities. Gold is considered a commodity and liquidity is based on buying or selling an asset easily without disrupting price in a market.
Treasury notes are guaranteed by the U.S. government and thus they are considered to be safer than other asset classes.
All investments involve risk. Principal loss is possible.
Must be preceded or accompanied by a current prospectus.
Quasar Distributors, LLC, distributor.
Earnings growth is not a measure of the Fund’s future performance.
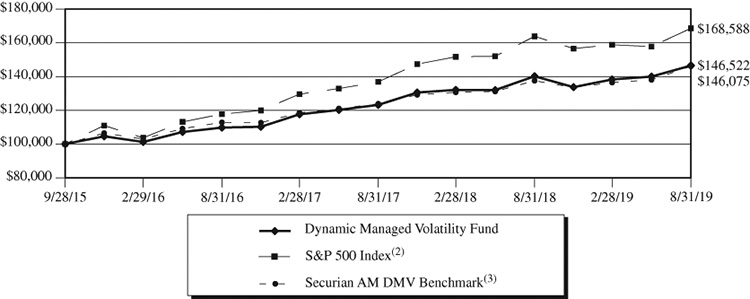
SECURIAN AM DYNAMIC MANAGED VOLATILITY FUND
Value of $100,000 Investment (Unaudited)
The chart assumes an initial investment of $100,000. Performance reflects waivers of fee and operating expenses in effect. In the absence of such waivers, total return would be reduced. Past performance is not predictive of future performance. Investment return and principal value will fluctuate, so that your shares, when redeemed may be worth more or less than their original cost. Performance assumes the reinvestment of capital gains and income distributions. The performance does not reflect the deduction of taxes that a shareholder would pay on Fund distributions or the redemption of Fund shares.
Annualized Rates of Return (%) – As of August 31, 2019 (Unaudited)
| | One Year | Three Years | Since Inception(1) |
| Dynamic Managed Volatility Fund | 4.54% | 10.11% | 10.22% |
S&P 500 Index(2) | 2.92% | 12.70% | 14.23% |
Securian AM DMV Benchmark(3) | 6.22% | 8.98% | 10.13% |
| (1) | September 28, 2015. |
| (2) | The Standard & Poor’s 500 Index is an unmanaged, capitalization-weighted index generally representative of the U.S. market for large capitalization stocks. This Index cannot be invested in directly. |
| (3) | The Securian AM DMV Benchmark is comprised of 60% S&P 500 Index and 40% Bloomberg Barclays U.S. Aggregate Bond Index. This Index cannot be invested in directly. |
SECURIAN AM MANAGED VOLATILITY EQUITY FUND
Value of $100,000 Investment (Unaudited)
The chart assumes an initial investment of $100,000. Performance reflects waivers of fee and operating expenses in effect. In the absence of such waivers, total return would be reduced. Past performance is not predictive of future performance. Investment return and principal value will fluctuate, so that your shares, when redeemed may be worth more or less than their original cost. Performance assumes the reinvestment of capital gains and income distributions. The performance does not reflect the deduction of taxes that a shareholder would pay on Fund distributions or the redemption of Fund shares.
Annualized Rates of Return (%) – As of August 31, 2019 (Unaudited)
| | One Year | Three Years | Since Inception(1) |
| Managed Volatility Equity Fund | 3.32% | 6.76% | 7.73% |
S&P 500 Index(2) | 2.92% | 12.70% | 14.23% |
Securian AM MVE Benchmark(3) | 11.97% | 9.85% | 11.37% |
| (1) | September 28, 2015. |
| (2) | The Standard & Poor’s 500 Index is an unmanaged, capitalization-weighted index generally representative of the U.S. market for large capitalization stocks. This Index cannot be invested in directly. |
| (3) | The Securian AM MVE Benchmark is comprised of 60% S&P 500 Low Volatility Index, 20% S&P BMI International Developed Low Volatility Index, and 20% Bloomberg Barclays U.S. 3 Month Treasury Bellwether Index. This Index cannot be invested in directly. |
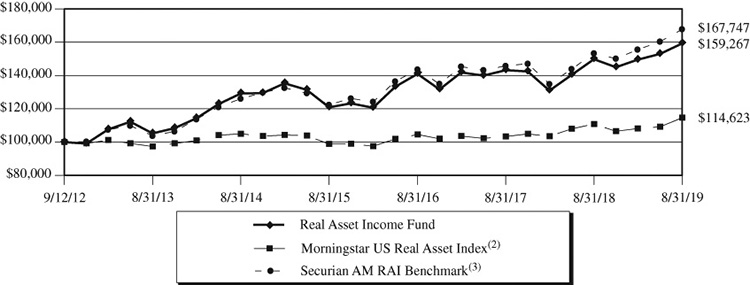
SECURIAN AM REAL ASSET INCOME FUND
Value of $100,000 Investment (Unaudited)
The chart assumes an initial investment of $100,000. Performance reflects waivers of fee and operating expenses in effect. In the absence of such waivers, total return would be reduced. Past performance is not predictive of future performance. Investment return and principal value will fluctuate, so that your shares, when redeemed may be worth more or less than their original cost. Performance assumes the reinvestment of capital gains and income distributions. The performance does not reflect the deduction of taxes that a shareholder would pay on Fund distributions or the redemption of Fund shares.
Annualized Rates of Return (%) – As of August 31, 2019 (Unaudited)
| | One Year | Three Years | Five Years | Since Inception(1) |
| Real Asset Income Fund | 6.32% | 4.15% | 4.27% | 6.91% |
Morningstar US Real Asset Index(2) | 3.41% | 3.11% | 1.77% | 1.98% |
Securian AM RAI Benchmark(3) | 9.41% | 5.32% | 5.88% | 7.71% |
| (1) | September 12, 2012. |
| (2) | The Morningstar US Real Asset Index is a diversified portfolio of four different asset classes that have historically displayed high sensitivity to inflation. These four asset classes are U.S. Treasury inflation-protected securities (“TIPS”), commodity futures-based strategies, real estate investment trusts (“REITs”), and inflation-sensitive equities such as upstream commodity stocks and master limited partnerships. This Index cannot be invested in directly. |
| (3) | The Securian AM RAI Benchmark is comprised of 54% FTSE NAREIT Equity REITs Index; 12% S&P 500 Utilities Index; 12% Alerian MLP Total Return Index; 12% Bloomberg Barclays Capital US Government Inflation Linked Bond Index; and 10% Wells Fargo Hybrid & Preferred REIT Index. This Index cannot be invested in directly. |
SECURIAN AM FUNDS
Expense Example (Unaudited)
August 31, 2019
As a shareholder of the Funds, you incur two types of costs: (1) transaction costs and (2) ongoing costs, including management fees and other Fund expenses. This example is intended to help you understand your ongoing costs (in dollars) of investing in the Funds and to compare these costs with the ongoing costs of investing in other mutual funds. The example is based on an investment of $1,000 invested at the beginning of the period and held for the entire period (March 1, 2019 – August 31, 2019).
ACTUAL EXPENSES
For each Fund, the first line of the table below provides information about actual account values and actual expenses. You may use the information in this line, together with the amount you invested, to estimate the expenses that you paid over the period. Simply divide your account value by $1,000 (for example, an $8,600 account value divided by $1,000 = 8.6), then multiply the result by the number in the first line under the heading entitled “Expenses Paid During Period” to estimate the expenses you paid on your account during this period.
HYPOTHETICAL EXAMPLE FOR COMPARISON PURPOSES
For each Fund, the second line of the table below provides information about hypothetical account values and hypothetical expenses based on the Fund’s actual expense ratio and an assumed rate of return of 5% per year before expenses, which is not the Fund’s actual return. The hypothetical account values and expenses may not be used to estimate the actual ending account balance or expenses you paid for the period. You may use this information to compare the ongoing costs of investing in the Funds and other funds. To do so, compare this 5% hypothetical example with the 5% hypothetical examples that appear in the shareholder reports of the other funds.
Please note that the expenses shown in the table are meant to highlight your ongoing costs only and do not reflect any transactional costs. Therefore, the second line of the table is useful in comparing ongoing costs only, and will not help you determine the relative total costs of owning different funds. In addition, if these transactional costs were included, your costs may have been higher.
Securian AM Dynamic Managed Volatility Fund
| | Beginning | Ending | Expenses Paid |
| | Account Value | Account Value | During Period(1) |
| | (3/1/2019) | (8/31/2019) | (3/1/2019 to 8/31/2019) |
Dynamic Managed Volatility Fund Actual(2) | $1,000.00 | $1,059.70 | $2.86 |
| Dynamic Managed Volatility Fund Hypothetical | | | |
| (5% annual return before expenses) | $1,000.00 | $1,022.43 | $2.80 |
| (1) | Expenses are equal to the Fund’s annualized expense ratio for the most recent six-month period of 0.55% for the Fund multiplied by the average account value over the period, multiplied by 184/365 to reflect the one-half year period. |
| (2) | Based on the actual returns for the six-month period ended August 31, 2019 of 5.97% for the Fund. |
SECURIAN AM FUNDS
Expense Example (Unaudited) – Continued
August 31, 2019
Securian AM Managed Volatility Equity Fund
| | Beginning | Ending | Expenses Paid |
| | Account Value | Account Value | During Period(3) |
| | (3/1/2019) | (8/31/2019) | (3/1/2019 to 8/31/2019) |
Managed Volatility Equity Fund Actual(4) | $1,000.00 | $1,047.80 | $2.84 |
| Managed Volatility Equity Fund Hypothetical | | | |
| (5% annual return before expenses) | $1,000.00 | $1,022.43 | $2.80 |
| (3) | Expenses are equal to the Fund’s annualized expense ratio for the most recent six-month period of 0.55% for the Fund multiplied by the average account value over the period, multiplied by 184/365 to reflect the one-half year period. |
| (4) | Based on the actual returns for the six-month period ended August 31, 2019 of 4.78% for the Fund. |
Securian AM Real Asset Income Fund
| | Beginning | Ending | Expenses Paid |
| | Account Value | Account Value | During Period(5) |
| | (3/1/2019) | (8/31/2019) | (3/1/2019 to 8/31/2019) |
Real Asset Income Fund Actual(6) | $1,000.00 | $1,065.30 | $3.90 |
| Real Asset Income Fund Hypothetical | | | |
| (5% annual return before expenses) | $1,000.00 | $1,021.42 | $3.82 |
| (5) | Expenses are equal to the Fund’s annualized expense ratio for the most recent six-month period of 0.75% for the Fund multiplied by the average account value over the period, multiplied by 184/365 to reflect the one-half year period. |
| (6) | Based on the actual returns for the six-month period ended August 31, 2019 of 6.53% for the Fund. |
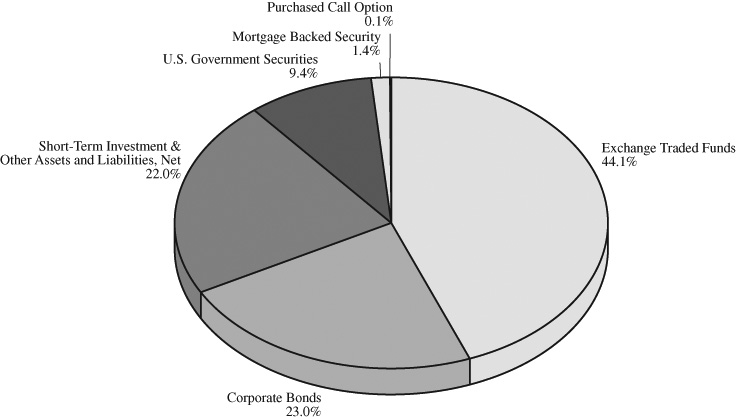
SECURIAN AM DYNAMIC MANAGED VOLATILITY FUND
Asset Allocation (Unaudited)
As of August 31, 2019(1)
(% of net assets)
Top Ten Holdings (Unaudited)
As of August 31, 2019(1)(2)
(% of net assets)
| iShares Core S&P 500 Fund | 39.8% |
| U.S. Treasury Bond, 2.625%, 12/15/2021 | 8.6% |
| iShares iBoxx $ Investment Grade Corporate Bond Fund | 4.4% |
| Credit Suisse Mortgage Trust, Series 2015-GLPA, 4.276%, 11/15/2037 | 1.4% |
| Takeda Pharmaceutical Company, 5.000%, 11/26/2028 | 1.0% |
| E*TRADE Financial, 2.950%, 08/24/2022 | 0.9% |
| Abbott Laboratories, 4.750%, 04/15/2043 | 0.6% |
| AT&T, 4.500%, 05/15/2035 | 0.6% |
| Florida Gas Transmission, 4.350%, 07/15/2025 | 0.5% |
| Sherwin-Williams, 3.950%, 01/15/2026 | 0.5% |
| (1) | Fund holdings and sector allocations are subject to change at any time and are not recommendations to buy or sell any security. |
| (2) | Short-term investments are not included. |
SECURIAN AM MANAGED VOLATILITY EQUITY FUND
Asset Allocation (Unaudited)
As of August 31, 2019(1)
(% of net assets)
Fund Holdings (Unaudited)
As of August 31, 2019(1)(2)
(% of net assets)
| iShares MSCI USA Minimum Volatility Fund | 33.3% |
| iShares MSCI EAFE Minimum Volatility Fund | 24.9% |
| iShares Core High Dividend Fund | 17.8% |
| iShares MSCI Emerging Markets Minimum Volatility Fund | 6.0% |
| iShares Short Maturity Bond Fund | 5.0% |
| iShares MSCI Germany Fund | 3.8% |
| (1) | Fund holdings and sector allocations are subject to change at any time and are not recommendations to buy or sell any security. |
| (2) | Short-term investments are not included. |
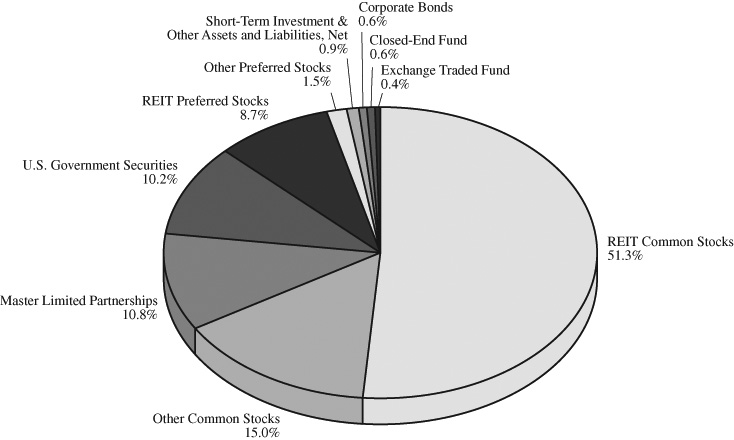
SECURIAN AM REAL ASSET INCOME FUND
Asset Allocation (Unaudited)
As of August 31, 2019(1)
(% of net assets)
Top Ten Holdings (Unaudited)
As of August 31, 2019(1)(2)
(% of net assets)
| Simon Property Group | 2.6% |
| Digital Realty Trust | 2.1% |
| Crown Castle International | 1.9% |
| U.S. Treasury Bond, 2.375%, 01/15/2025 | 1.8% |
| Enterprise Products Partners | 1.8% |
| Prologis | 1.8% |
| Ventas | 1.7% |
| Welltower | 1.7% |
| Energy Transfer | 1.6% |
| STAG Industrial | 1.5% |
| (1) | Fund holdings and sector allocations are subject to change at any time and are not recommendations to buy or sell any security. |
| (2) | Short-term investments are not included. |
SECURIAN AM DYNAMIC MANAGED VOLATILITY FUND
Schedule of Investments
August 31, 2019
| | | | | | Fair | |
| | | Shares | | | Value | |
| EXCHANGE TRADED FUNDS – 44.1% | | | | | | |
| iShares Core S&P 500 Fund (a)(b) | | | 80,666 | | | $ | 23,737,584 | |
| iShares iBoxx $ Investment Grade Corporate Bond Fund | | | 20,300 | | | | 2,614,640 | |
| Total Exchange Traded Funds | | | | | | | | |
| (Cost $19,621,243) | | | | | | | 26,352,224 | |
| | | | | | | | | |
| | | Par | | | | | |
| CORPORATE BONDS – 23.0% | | | | | | | | |
| | | | | | | | | |
| Airlines – 0.3% | | | | | | | | |
| British Airways | | | | | | | | |
| Series 2013-1 | | | | | | | | |
| 4.625%, 12/20/2025 (c) | | $ | 187,504 | | | | 199,776 | |
| | | | | | | | | |
| Banks – 2.1% | | | | | | | | |
| Astoria Financial | | | | | | | | |
| 3.500%, 06/08/2020 | | | 250,000 | | | | 250,773 | |
| Barclays | | | | | | | | |
| 4.375%, 01/12/2026 (d) | | | 200,000 | | | | 211,643 | |
| JPMorgan Chase | | | | | | | | |
| 4.500%, 01/24/2022 | | | 250,000 | | | | 264,673 | |
| PNC Bank | | | | | | | | |
| 2.450%, 07/28/2022 | | | 250,000 | | | | 253,371 | |
| Synchrony Bank | | | | | | | | |
| 3.000%, 06/15/2022 | | | 250,000 | | | | 254,627 | |
| | | | | | | | 1,235,087 | |
| Chemicals – 1.0% | | | | | | | | |
| Sherwin-Williams | | | | | | | | |
| 3.950%, 01/15/2026 | | | 300,000 | | | | 321,821 | |
| Yara International | | | | | | | | |
| 4.750%, 06/01/2028 (c)(d)(e) | | | 250,000 | | | | 275,200 | |
| | | | | | | | 597,021 | |
| Consumer Discretionary – 1.0% | | | | | | | | |
| CBS | | | | | | | | |
| 3.500%, 01/15/2025 | | | 300,000 | | | | 312,935 | |
| Harley-Davidson Financial Services | | | | | | | | |
| 3.550%, 05/21/2021 (c)(e) | | | 250,000 | | | | 254,545 | |
| | | | | | | | 567,480 | |
See Notes to the Financial Statements
SECURIAN AM DYNAMIC MANAGED VOLATILITY FUND
Schedule of Investments – Continued
August 31, 2019
| | | | | | Fair | |
| | | Par | | | Value | |
| CORPORATE BONDS – 23.0% (Continued) | | | | | | |
| | | | | | | |
| Consumer Staples – 0.4% | | | | | | |
| CVS Health | | | | | | |
| 6.943%, 01/10/2030 | | $ | 197,104 | | | $ | 234,514 | |
| | | | | | | | | |
| Diversified Financial Services – 3.0% | | | | | | | | |
| American Express | | | | | | | | |
| 2.500%, 08/01/2022 | | | 250,000 | | | | 253,604 | |
| Capital One Financial | | | | | | | | |
| 4.250%, 04/30/2025 | | | 250,000 | | | | 271,920 | |
| E*TRADE Financial | | | | | | | | |
| 2.950%, 08/24/2022 | | | 500,000 | | | | 510,491 | |
| First American Financial | | | | | | | | |
| 4.600%, 11/15/2024 | | | 200,000 | | | | 215,815 | |
| Invesco Financial | | | | | | | | |
| 3.750%, 01/15/2026 (d) | | | 250,000 | | | | 269,140 | |
| Total System Services | | | | | | | | |
| 4.800%, 04/01/2026 | | | 250,000 | | | | 281,667 | |
| | | | | | | | 1,802,637 | |
| Energy – 2.8% | | | | | | | | |
| Florida Gas Transmission | | | | | | | | |
| 4.350%, 07/15/2025 (c) | | | 300,000 | | | | 325,436 | |
| ONEOK | | | | | | | | |
| 4.000%, 07/13/2027 | | | 250,000 | | | | 263,148 | |
| Phillips 66 | | | | | | | | |
| 4.650%, 11/15/2034 | | | 200,000 | | | | 232,312 | |
| Valero Energy | | | | | | | | |
| 3.650%, 03/15/2025 | | | 300,000 | | | | 316,692 | |
| 4.350%, 06/01/2028 | | | 250,000 | | | | 272,318 | |
| Williams Partners | | | | | | | | |
| 3.750%, 06/15/2027 | | | 250,000 | | | | 260,910 | |
| | | | | | | | 1,670,816 | |
| Health Care – 0.6% | | | | | | | | |
| Abbott Laboratories | | | | | | | | |
| 4.750%, 04/15/2043 | | | 300,000 | | | | 375,482 | |
| | | | | | | | | |
| Industrial – 1.3% | | | | | | | | |
| General Dynamics | | | | | | | | |
| 3.500%, 05/15/2025 | | | 250,000 | | | | 269,266 | |
| Textron | | | | | | | | |
| 4.000%, 03/15/2026 | | | 250,000 | | | | 268,746 | |
See Notes to the Financial Statements
SECURIAN AM DYNAMIC MANAGED VOLATILITY FUND
Schedule of Investments – Continued
August 31, 2019
| | | | | | Fair | |
| | | Par | | | Value | |
| CORPORATE BONDS – 23.0% (Continued) | | | | | | |
| | | | | | | |
| Industrial – 1.3% (Continued) | | | | | | |
| Tyco Electronics Group | | | | | | |
| 3.700%, 02/15/2026 (d) | | $ | 250,000 | | | $ | 266,703 | |
| | | | | | | | 804,715 | |
| Insurance – 3.0% | | | | | | | | |
| Allied World Assurance Company Holdings | | | | | | | | |
| 4.350%, 10/29/2025 (d) | | | 250,000 | | | | 260,117 | |
| Assured Guaranty US Holdings | | | | | | | | |
| 5.000%, 07/01/2024 | | | 200,000 | | | | 221,845 | |
| Hanover Insurance Group | | | | | | | | |
| 4.500%, 04/15/2026 | | | 250,000 | | | | 271,614 | |
| Horace Mann Educators | | | | | | | | |
| 4.500%, 12/01/2025 | | | 250,000 | | | | 266,569 | |
| Liberty Mutual Group | | | | | | | | |
| 4.250%, 06/15/2023 (c) | | | 250,000 | | | | 266,497 | |
| Manulife Financial | | | | | | | | |
| 4.150%, 03/04/2026 (d) | | | 250,000 | | | | 277,398 | |
| Old Republic International | | | | | | | | |
| 4.875%, 10/01/2024 | | | 200,000 | | | | 221,147 | |
| | | | | | | | 1,785,187 | |
| Pharmaceuticals – 1.0% | | | | | | | | |
| Takeda Pharmaceutical Company | | | | | | | | |
| 5.000%, 11/26/2028 (c)(d)(e) | | | 500,000 | | | | 592,160 | |
| | | | | | | | | |
| Real Estate Investment Trusts – 2.2% | | | | | | | | |
| Alexandria Real Estate Equities | | | | | | | | |
| 4.300%, 01/15/2026 | | | 200,000 | | | | 220,779 | |
| Essex Portfolio | | | | | | | | |
| 3.500%, 04/01/2025 | | | 300,000 | | | | 315,867 | |
| Healthcare Trust of America Holdings | | | | | | | | |
| 3.750%, 07/01/2027 | | | 250,000 | | | | 263,656 | |
| Host Hotels & Resorts | | | | | | | | |
| Series F | | | | | | | | |
| 4.500%, 02/01/2026 | | | 250,000 | | | | 273,936 | |
| Kimco Realty | | | | | | | | |
| 3.400%, 11/01/2022 | | | 250,000 | | | | 259,017 | |
| | | | | | | | 1,333,255 | |
See Notes to the Financial Statements
SECURIAN AM DYNAMIC MANAGED VOLATILITY FUND
Schedule of Investments – Continued
August 31, 2019
| | | | | | Fair | |
| | | Par | | | Value | |
| CORPORATE BONDS – 23.0% (Continued) | | | | | | |
| | | | | | | |
| Technology – 0.5% | | | | | | |
| Hewlett Packard Enterprise | | | | | | |
| 4.900%, 10/15/2025 | | $ | 100,000 | | | $ | 110,810 | |
| Juniper Networks | | | | | | | | |
| 4.500%, 03/15/2024 | | | 200,000 | | | | 217,677 | |
| | | | | | | | 328,487 | |
| Telecommunications – 2.1% | | | | | | | | |
| AT&T | | | | | | | | |
| 4.500%, 05/15/2035 | | | 300,000 | | | | 334,276 | |
| Comcast | | | | | | | | |
| 4.650%, 07/15/2042 | | | 250,000 | | | | 305,497 | |
| Verizon Communications | | | | | | | | |
| 5.250%, 03/16/2037 | | | 250,000 | | | | 316,629 | |
| Vodafone Group | | | | | | | | |
| 4.125%, 05/30/2025 (d) | | | 250,000 | | | | 271,538 | |
| | | | | | | | 1,227,940 | |
| Transportation – 1.3% | | | | | | | | |
| Kansas City Southern | | | | | | | | |
| 4.300%, 05/15/2043 | | | 250,000 | | | | 280,284 | |
| Penske Truck Leasing / PTL Finance | | | | | | | | |
| 3.300%, 04/01/2021 (c) | | | 200,000 | | | | 203,192 | |
| 3.900%, 02/01/2024 (c) | | | 250,000 | | | | 264,537 | |
| | | | | | | | 748,013 | |
| Utilities – 0.4% | | | | | | | | |
| Oglethorpe Power | | | | | | | | |
| 4.250%, 04/01/2046 | | | 200,000 | | | | 214,201 | |
| Total Corporate Bonds | | | | | | | | |
| (Cost $12,633,003) | | | | | | | 13,716,771 | |
| | | | | | | | | |
| U.S. GOVERNMENT SECURITIES – 9.4% | | | | | | | | |
| | | | | | | | | |
| U.S. Treasury Bonds – 9.4% | | | | | | | | |
| 2.000%, 01/31/2020 | | | 500,000 | | | | 500,117 | |
| 2.625%, 12/15/2021 | | | 5,000,000 | | | | 5,129,200 | |
| Total U.S. Government Securities | | | | | | | | |
| (Cost $5,479,265) | | | | | | | 5,629,317 | |
See Notes to the Financial Statements
SECURIAN AM DYNAMIC MANAGED VOLATILITY FUND
Schedule of Investments – Continued
August 31, 2019
| | | | | | Fair | |
| | | Par | | | Value | |
| MORTGAGE BACKED SECURITY – 1.4% | | | | | | |
| | | | | | | |
| Commercial – 1.4% | | | | | | |
| Credit Suisse Mortgage Trust | | | | | | |
| Series 2015-GLPA, Class C | | | | | | |
| 4.276%, 11/15/2037 (c)(f) | | | | | | |
| (Cost $754,411) | | $ | 750,000 | | | $ | 824,246 | |
| | | | Contracts | | | Notional | | | |
| PURCHASED CALL OPTION – 0.1% | | | | | | | | | |
| CBOE S&P 500 Index (g) | | | | | | | | | |
| Expiration: September 2019, Exercise Price: $3,005 | | | | | | | | | |
| (Cost $74,360) | | | | 55 | | | $ | 16,095,530 | | 44,275 | |
| | | Shares | | | | |
| SHORT-TERM INVESTMENT – 19.9% | | | | | | |
| First American Government Obligations Fund, Class X, 2.03% (h) | | | | | | |
| (Cost $11,862,961) | | | 11,862,961 | | | | 11,862,961 | |
| Total Investments – 97.9% | | | | | | | | |
| (Cost $50,425,243) | | | | | | | 58,429,794 | |
| Other Assets and Liabilities, Net – 2.1% | | | | | | | 1,235,149 | |
| Total Net Assets – 100.0% | | | | | | $ | 59,664,943 | |
| (a) | All or a portion of this security is designated as collateral for futures contracts. As of August 31, 2019, the fair value of collateral was $23,737,584. |
| (b) | Fair value of this security exceeds 25% of the Fund’s net assets. Additional information for this security, including the financial statements, is available from the SEC’s EDGAR database at www.sec.gov. |
| (c) | Security purchased within the terms of a private placement memorandum, exempt from registration under Rule 144A of the Securities Act of 1933, as amended, and may be sold only to dealers in that program or other “qualified institutional buyers.” As of August 31, 2019, the fair value of these investments were $3,205,589, or 5.4% of total net assets. |
| (d) | Foreign Security. The Fund had $2,423,899 or 4.1% of net assets in foreign securities at August 31, 2019. |
| (e) | Security considered illiquid and is categorized in Level 2 of the fair value hierarchy. See Notes 2 & 3 in Notes to the Financial Statements. |
| (f) | Variable rate security – The coupon is based on an underlying pool of loans. |
| (g) | Held in connection with written option contracts. See Schedule of Written Options for further information. |
| (h) | The rate shown is the annualized seven day effective yield as of August 31, 2019. |
See Notes to the Financial Statements
SECURIAN AM DYNAMIC MANAGED VOLATILITY FUND
Schedule of Open Futures Contracts
August 31, 2019
| | Number of | | | | |
| | Contracts | Expiration | Notional | Fair | Unrealized |
Description | Sold | Date | Amount | Value | Depreciation |
| E-mini S&P 500 Index | 36 | September 2019 | $5,264,640 | $3,420 | $(14,625)
|
Schedule of Written Options
August 31, 2019
| | | Contracts | Expiration | Notional | Exercise | Fair |
Description | Call/Put | Written | Date | Amount | Price | Value |
| CBOE S&P 500 Index* | Call | 55 | September 2019 | $16,095,530 | $3,110 | $1,925
|
| * | Held in connection with purchased option contracts. See Schedule of Investments for further information. |
See Notes to the Financial Statements
SECURIAN AM MANAGED VOLATILITY EQUITY FUND
Schedule of Investments
August 31, 2019
| | | | | | Fair | |
| | | Shares | | | Value | |
| EXCHANGE TRADED FUNDS – 90.8% | | | | | | |
| iShares Core High Dividend Fund | | | 76,717 | | | $ | 7,108,597 | |
| iShares MSCI EAFE Minimum Volatility Fund (a) | | | 137,716 | | | | 9,903,846 | |
| iShares MSCI Emerging Markets Minimum Volatility Fund | | | 41,866 | | | | 2,377,570 | |
| iShares MSCI Germany Fund | | | 57,796 | | | | 1,517,145 | |
| iShares MSCI USA Minimum Volatility Fund (a)(b) | | | 207,929 | | | | 13,256,514 | |
| iShares Short Maturity Bond Fund | | | 39,455 | | | | 1,986,362 | |
| Total Exchange Traded Funds | | | | | | | | |
| (Cost $28,383,900) | | | | | | | 36,150,034 | |
| | | | | | | | | |
| | | Par | | | | | |
| U.S. GOVERNMENT SECURITY – 1.2% | | | | | | | | |
| | | | | | | | | |
| U.S. Treasury Bond – 1.2% | | | | | | | | |
| 2.000%, 01/31/2020 | | | | | | | | |
| (Cost $498,975) | | $ | 500,000 | | | | 500,117 | |
| | | Contracts | | | Notional | | |
| |
| PURCHASED PUT OPTIONS – 0.1% | | | | | | | | | |
| CBOE S&P 500 Index (c) | | | | | | | | | |
| Expiration: September 2019, Exercise Price: $2,750 | | | 14 | | | $ | 3,850,000 | | | | 15,750 | |
| Expiration: September 2019, Exercise Price: $2,810 | | | 14 | | | | 3,934,000 | | | | 26,040 | |
| Total Purchased Put Options | | | | | | | | | | | | |
| (Cost $68,726) | | | | | | | | | | | 41,790 | |
| | | Shares | | | | |
| SHORT-TERM INVESTMENT – 7.6% | | | | | | |
| First American Government Obligations Fund, Class X, 2.03% (d) | | | | | | |
| (Cost $3,018,657) | | | 3,018,657 | | | | 3,018,657 | |
| Total Investments – 99.7% | | | | | | | | |
| (Cost $31,970,258) | | | | | | | 39,710,598 | |
| Other Assets and Liabilities, Net – 0.3% | | | | | | | 115,270 | |
| Total Net Assets – 100.0% | | | | | | $ | 39,825,868 | |
| (a) | All or a portion of this security is designated as collateral for futures contracts. As of August 31, 2019, the fair value of the collateral was $12,135,096. |
| (b) | Fair value of this security exceeds 25% of the Fund’s net assets. Additional information for this security, including the financial statements, is available from the SEC’s EDGAR database at www.sec.gov. |
| (c) | Held in connection with written option contracts. See Schedule of Written Options for further information. |
| (d) | The rate shown is the annualized seven day effective yield as of August 31, 2019. |
See Notes to the Financial Statements
SECURIAN AM MANAGED VOLATILITY EQUITY FUND
Schedule of Open Futures Contracts
August 31, 2019
| | Number of | | | | |
| | Contracts | Expiration | Notional | Fair | Unrealized |
Description | Purchased | Date | Amount | Value | Appreciation |
| E-mini S&P 500 Index | 32 | September 2019 | $4,679,680 | $(3,040) | $50,266
|
Schedule of Written Options
August 31, 2019
| | | | Contracts | | Expiration | | Notional | | | Exercise | | | Fair | |
Description | Call/Put | | Written | | Date | | Amount | | | Price | | | Value | |
| CBOE S&P 500 Index* | Put | | 14 | | September 2019 | | $ | 3,612,000 | | | $ | 2,580 | | | $ | 3,745 | |
| CBOE S&P 500 Index* | Put | | 14 | | September 2019 | | | 3,668,000 | | | | 2,620 | | | | 5,180 | |
| | | | | | | | | | | | | | | | $ | 8,925 | |
| * | Held in connection with purchased option contracts. See Schedule of Investments for further information. |
See Notes to the Financial Statements
SECURIAN AM REAL ASSET INCOME FUND
Schedule of Investments
August 31, 2019
| | | | | | Fair | |
| | | Shares | | | Value | |
| REIT COMMON STOCKS – 51.3% | | | | | | |
| | | | | | | |
| Health Care – 8.5% | | | | | | |
| CareTrust REIT | | | 24,812 | | | $ | 590,277 | |
| HCP | | | 34,238 | | | | 1,188,401 | |
| Healthcare Trust of America, Class A | | | 8,214 | | | | 232,949 | |
| LTC Properties | | | 4,400 | | | | 214,720 | |
| National Health Investors | | | 8,581 | | | | 711,880 | |
| OMEGA Healthcare Investors | | | 13,078 | | | | 532,013 | |
| Physicians Realty Trust | | | 30,400 | | | | 526,528 | |
| Sabra Health Care REIT | | | 10,659 | | | | 230,448 | |
| Ventas | | | 19,500 | | | | 1,431,105 | |
| Welltower | | | 15,764 | | | | 1,411,824 | |
| | | | | | | | 7,070,145 | |
| Hotels – 2.9% | | | | | | | | |
| Hersha Hospitality Trust | | | 20,590 | | | | 286,201 | |
| Hospitality Properties Trust | | | 30,100 | | | | 726,614 | |
| Host Hotels & Resorts | | | 21,100 | | | | 338,444 | |
| Pebblebrook Hotel Trust | | | 24,500 | | | | 660,765 | |
| Ryman Hospitality Properties | | | 5,600 | | | | 446,096 | |
| | | | | | | | 2,458,120 | |
| Industrial – 3.9% | | | | | | | | |
| Industrial Logistics Properties Trust | | | 23,648 | | | | 505,831 | |
| Prologis | | | 17,601 | | | | 1,471,795 | |
| STAG Industrial | | | 44,026 | | | | 1,280,276 | |
| | | | | | | | 3,257,902 | |
| Mortgage – 2.3% | | | | | | | | |
| Blackstone Mortgage Trust, Class A | | | 22,447 | | | | 781,156 | |
| Ladder Capital | | | 13,500 | | | | 226,530 | |
| Starwood Property Trust | | | 39,600 | | | | 927,828 | |
| | | | | | | | 1,935,514 | |
| Multi-Family – 7.2% | | | | | | | | |
| American Campus Communities | | | 24,500 | | | | 1,138,760 | |
| Apartment Investment & Management Company, Class A | | | 19,303 | | | | 984,453 | |
| AvalonBay Communities | | | 5,600 | | | | 1,190,336 | |
| Camden Property Trust | | | 10,778 | | | | 1,166,719 | |
| Equity Residential | | | 1,500 | | | | 127,140 | |
| Mid-America Apartment Communities | | | 4,000 | | | | 506,720 | |
| UDR | | | 18,000 | | | | 867,240 | |
| | | | | | | | 5,981,368 | |
See Notes to the Financial Statements
SECURIAN AM REAL ASSET INCOME FUND
Schedule of Investments – Continued
August 31, 2019
| | | | | | Fair | |
| | | Shares | | | Value | |
| REIT COMMON STOCKS – 51.3% (Continued) | | | | | | |
| | | | | | | |
| Net Lease – 3.5% | | | | | | |
| Agree Realty | | | 10,212 | | | $ | 762,734 | |
| Easterly Government Properties | | | 27,400 | | | | 563,070 | |
| EPR Properties | | | 4,000 | | | | 313,000 | |
| Spirit Realty Capital | | | 4,155 | | | | 199,191 | |
| STORE Capital | | | 28,298 | | | | 1,068,532 | |
| | | | | | | | 2,906,527 | |
| Office – 4.4% | | | | | | | | |
| Boston Properties | | | 7,300 | | | | 937,466 | |
| Brandywine Realty Trust | | | 6,700 | | | | 96,145 | |
| City Office REIT | | | 7,500 | | | | 101,550 | |
| Corporate Office Properties Trust | | | 11,110 | | | | 320,968 | |
| Highwoods Properties | | | 27,500 | | | | 1,188,275 | |
| SL Green Realty | | | 7,222 | | | | 579,349 | |
| Vornado Realty Trust | | | 8,000 | | | | 483,760 | |
| | | | | | | | 3,707,513 | |
| Retail – 7.7% | | | | | | | | |
| Acadia Realty Trust | | | 7,000 | | | | 191,450 | |
| Essential Properties Realty Trust | | | 16,500 | | | | 374,715 | |
| Federal Realty Investment Trust | | | 1,500 | | | | 193,815 | |
| Four Corners Property Trust | | | 10,400 | | | | 296,296 | |
| Getty Realty | | | 11,500 | | | | 365,240 | |
| Macerich | | | 7,700 | | | | 219,681 | |
| National Retail Properties | | | 12,500 | | | | 701,875 | |
| Regency Centers | | | 15,700 | | | | 1,012,807 | |
| Retail Opportunity Investments | | | 26,836 | | | | 469,898 | |
| Simon Property Group | �� | | 14,400 | | | | 2,144,736 | |
| Weingarten Realty Investors | | | 18,600 | | | | 492,714 | |
| | | | | | | | 6,463,227 | |
| Specialty – 10.9% | | | | | | | | |
| CatchMark Timber Trust, Class A | | | 31,500 | | | | 312,165 | |
| CoreSite Realty | | | 3,900 | | | | 453,102 | |
| Crown Castle International | | | 11,200 | | | | 1,625,904 | |
| CubeSmart | | | 7,800 | | | | 279,942 | |
| CyrusOne | | | 5,049 | | | | 370,899 | |
| Digital Realty Trust | | | 14,312 | | | | 1,769,393 | |
| Extra Space Storage | | | 3,743 | | | | 456,347 | |
| Hannon Armstrong Sustainable Infrastructure Capital | | | 8,500 | | | | 234,855 | |
See Notes to the Financial Statements
SECURIAN AM REAL ASSET INCOME FUND
Schedule of Investments – Continued
August 31, 2019
| | | | | | Fair | |
| | | Shares | | | Value | |
| REIT COMMON STOCKS – 51.3% (Continued) | | | | | | |
| | | | | | | |
| Specialty – 10.9% (Continued) | | | | | | |
| Jernigan Capital | | | 17,800 | | | $ | 343,718 | |
| Life Storage | | | 3,600 | | | | 381,456 | |
| Public Storage | | | 3,200 | | | | 847,168 | |
| QTS Realty Trust, Class A | | | 8,300 | | | | 407,198 | |
| VICI Properties | | | 36,300 | | | | 804,408 | |
| Weyerhaeuser Company | | | 33,100 | | | | 870,861 | |
| | | | | | | | 9,157,416 | |
| Total REIT Common Stocks | | | | | | | | |
| (Cost $36,593,293) | | | | | | | 42,937,732 | |
| | | | | | | | | |
| OTHER COMMON STOCKS – 15.0% | | | | | | | | |
| | | | | | | | | |
| Energy – 2.7% | | | | | | | | |
| Kinder Morgan | | | 36,473 | | | | 739,308 | |
| ONEOK | | | 13,000 | | | | 926,640 | |
| Targa Resources | | | 6,000 | | | | 216,720 | |
| Williams Companies | | | 16,160 | | | | 381,376 | |
| | | | | | | | 2,264,044 | |
| Infrastructure – 1.1% | | | | | | | | |
| Brookfield Infrastructure Partners (a) | | | 19,300 | | | | 907,100 | |
| | | | | | | | | |
| Real Estate Operating Company – 0.5% | | | | | | | | |
| Brookfield Property Partners (a) | | | 18,823 | | | | 354,437 | |
| | | | | | | | | |
| Telecommunications – 0.6% | | | | | | | | |
| Verizon Communications | | | 8,900 | | | | 517,624 | |
| | | | | | | | | |
| Utilities – 10.1% | | | | | | | | |
| AES | | | 53,300 | | | | 817,089 | |
| American Electric Power | | | 13,110 | | | | 1,194,976 | |
| Brookfield Renewable Partners (a) | | | 13,100 | | | | 490,726 | |
| CenterPoint Energy | | | 29,500 | | | | 816,855 | |
| Clearway Energy, Class A | | | 5,900 | | | | 98,884 | |
| Covanta Holding | | | 10,593 | | | | 182,200 | |
| Dominion Energy | | | 9,170 | | | | 711,867 | |
| DTE Energy | | | 3,847 | | | | 498,802 | |
| Duke Energy | | | 5,800 | | | | 537,892 | |
| Entergy | | | 1,800 | | | | 203,112 | |
| Evergy | | | 9,356 | | | | 608,140 | |
| Exelon | | | 25,200 | | | | 1,190,952 | |
See Notes to the Financial Statements
SECURIAN AM REAL ASSET INCOME FUND
Schedule of Investments – Continued
August 31, 2019
| | | | | | Fair | |
| | | Shares | | | Value | |
| OTHER COMMON STOCKS – 15.0% (Continued) | | | | | | |
| | | | | | | |
| Utilities – 10.1% (Continued) | | | | | | |
| FirstEnergy | | | 10,100 | | | $ | 464,600 | |
| South Jersey Industries | | | 20,241 | | | | 654,594 | |
| | | | | | | | 8,470,689 | |
| Total Other Common Stocks | | | | | | | | |
| (Cost $10,219,058) | | | | | | | 12,513,894 | |
| | | | | | | | | |
| MASTER LIMITED PARTNERSHIPS – 10.8% | | | | | | | | |
| | | | | | | | | |
| Energy – 10.8% | | | | | | | | |
| Cheniere Energy Partners | | | 5,100 | | | | 223,533 | |
| DCP Midstream | | | 15,000 | | | | 365,400 | |
| Enable Midstream Partners | | | 27,631 | | | | 348,151 | |
| Energy Transfer | | | 97,252 | | | | 1,323,600 | |
| Enterprise Products Partners | | | 53,084 | | | | 1,513,425 | |
| Magellan Midstream Partners | | | 16,601 | | | | 1,106,955 | |
| MPLX | | | 40,472 | | | | 1,129,573 | |
| NextEra Energy Partners | | | 13,300 | | | | 681,625 | |
| PBF Logistics | | | 8,394 | | | | 174,595 | |
| Plains All American Pipeline | | | 54,500 | | | | 1,167,935 | |
| Sprague Resources | | | 16,875 | | | | 271,856 | |
| USA Compression Partners | | | 21,100 | | | | 357,645 | |
| Western Midstream Partners | | | 16,473 | | | | 379,526 | |
| Total Master Limited Partnerships | | | | | | | | |
| (Cost $7,700,775) | | | | | | | 9,043,819 | |
| | | | | | | | | |
| | | Par | | | | | |
| U.S. GOVERNMENT SECURITIES – 10.2% | | | | | | | | |
| | | | | | | | | |
| U.S. Treasury Bonds – 10.2% | | | | | | | | |
| 1.250%, 07/15/2020 (b) | | $ | 587,255 | | | | 590,111 | |
| 1.125%, 01/15/2021 (b) | | | 585,465 | | | | 588,297 | |
| 0.625%, 07/15/2021 (b) | | | 568,235 | | | | 571,789 | |
| 0.125%, 07/15/2022 (b) | | | 556,920 | | | | 556,510 | |
| 0.125%, 01/15/2023 (b) | | | 443,880 | | | | 443,115 | |
| 0.375%, 07/15/2023 (b) | | | 550,330 | | | | 557,651 | |
| 0.125%, 07/15/2024 (b) | | | 1,159,646 | | | | 1,169,533 | |
| 2.375%, 01/15/2025 (b) | | | 1,358,870 | | | | 1,528,585 | |
| 0.375%, 07/15/2025 (b) | | | 432,048 | | | | 443,002 | |
| 0.625%, 01/15/2026 (b) | | | 592,895 | | | | 616,143 | |
See Notes to the Financial Statements
SECURIAN AM REAL ASSET INCOME FUND
Schedule of Investments – Continued
August 31, 2019
| | | | | | Fair | |
| | | Par | | | Value | |
| U.S. GOVERNMENT SECURITIES – 10.2% (Continued) | | | | | | |
| | | | | | | |
| U.S. Treasury Bonds – 10.2% (Continued) | | | | | | |
| 3.875%, 04/15/2029 (b) | | $ | 779,055 | | | $ | 1,066,458 | |
| 2.125%, 02/15/2040 (b) | | | 296,270 | | | | 407,892 | |
| Total U.S. Government Securities | | | | | | | | |
| (Cost $8,441,323) | | | | | | | 8,539,086 | |
| | | | | | | | | |
| | | Shares | | | | | |
| REIT PREFERRED STOCKS – 8.7% | | | | | | | | |
| | | | | | | | | |
| Hotels – 2.8% | | | | | | | | |
| Hersha Hospitality Trust, Series E, 6.500% | | | 16,270 | | | | 407,726 | |
| Pebblebrook Hotel Trust, Series D, 6.375% | | | 15,500 | | | | 417,570 | |
| Pebblebrook Hotel Trust, Series E, 6.375% | | | 19,702 | | | | 502,598 | |
| Summit Hotel Properties, Series D, 6.450% | | | 16,071 | | | | 418,650 | |
| Summit Hotel Properties, Series E, 6.250% | | | 11,200 | | | | 294,000 | |
| Sunstone Hotel Investors, Series E, 6.950% | | | 11,963 | | | | 319,532 | |
| | | | | | | | 2,360,076 | |
| Industrial – 0.2% | | | | | | | | |
| STAG Industrial, Series C, 6.875% | | | 5,427 | | | | 149,785 | |
| | | | | | | | | |
| Net Lease – 0.6% | | | | | | | | |
| EPR Properties, Series G, 5.750% | | | 20,380 | | | | 531,307 | |
| | | | | | | | | |
| Office – 1.5% | | | | | | | | |
| Armada Hoffler Properties, Series A, 6.750% | | | 12,700 | | | | 340,487 | |
| PS Business Parks, Series U, 5.750% | | | 13,848 | | | | 357,555 | |
| PS Business Parks, Series W, 5.200% | | | 21,100 | | | | 542,270 | |
| | | | | | | | 1,240,312 | |
| Other – 0.3% | | | | | | | | |
| Colony Capital, Class H, 7.125% | | | 6,900 | | | | 147,936 | |
| Digital Realty Trust, Series I, 6.350% | | | 4,063 | | | | 107,263 | |
| | | | | | | | 255,199 | |
| Retail – 2.0% | | | | | | | | |
| Investors Real Estate Trust, Series C, 6.625% | | | 12,332 | | | | 321,671 | |
| Kimco Realty, Series K, 5.625% | | | 13,033 | | | | 328,432 | |
| National Retail Properties, Series E, 5.700% | | | 11,507 | | | | 289,056 | |
| Pennsylvania Real Estate Investment Trust, Series D, 6.875% | | | 17,586 | | | | 351,720 | |
| Saul Centers, Series D, 6.125% | | | 14,300 | | | | 364,650 | |
| | | | | | | | 1,655,529 | |
See Notes to the Financial Statements
SECURIAN AM REAL ASSET INCOME FUND
Schedule of Investments – Continued
August 31, 2019
| | | | | | Fair | |
| | | Shares | | | Value | |
| REIT PREFERRED STOCKS – 8.7% (Continued) | | | | | | |
| | | | | | | |
| Single-Family – 0.8% | | | | | | |
| American Homes 4 Rent, Series F, 5.875% | | | 23,798 | | | $ | 622,080 | |
| | | | | | | | | |
| Specialty – 0.5% | | | | | | | | |
| Public Storage, Series H, 5.600% | | | 15,700 | | | | 439,443 | |
| Total REIT Preferred Stocks | | | | | | | | |
| (Cost $6,950,754) | | | | | | | 7,253,731 | |
| | | | | | | | | |
| OTHER PREFERRED STOCKS – 1.5% | | | | | | | | |
| | | | | | | | | |
| Energy – 0.8% | | | | | | | | |
| Energy Transfer Partners, Series D, 7.625% | | | 14,600 | | | | 357,700 | |
| Sempra Energy, 5.750% | | | 11,600 | | | | 310,880 | |
| | | | | | | | 668,580 | |
| Utilities – 0.7% | | | | | | | | |
| CMS Energy, 5.875% | | | 10,500 | | | | 295,680 | |
| Duke Energy, 5.625% | | | 10,400 | | | | 291,720 | |
| | | | | | | | 587,400 | |
| Total Other Preferred Stocks | | | | | | | | |
| (Cost $1,168,101) | | | | | | | 1,255,980 | |
| | | | | | | | | |
| | | Par | | | | | |
| CORPORATE BONDS – 0.6% | | | | | | | | |
| | | | | | | | | |
| Real Estate – 0.4% | | | | | | | | |
| CyrusOne LP / CyrusOne Finance | | | | | | | | |
| 5.000%, 03/15/2024 | | $ | 300,000 | | | | 310,500 | |
| | | | | | | | | |
| Utilities – 0.2% | | | | | | | | |
| CenterPoint Energy | | | | | | | | |
| 6.125%, 03/01/2024 | | | 200,000 | | | | 209,643 | |
| Total Corporate Bonds | | | | | | | | |
| (Cost $500,000) | | | | | | | 520,143 | |
| | | | | | | | | |
| | | Shares | | | | | |
| CLOSED-END FUND – 0.6% | | | | | | | | |
| BlackRock Floating Rate Income Strategies Fund | | | | | | | | |
| (Cost $541,357) | | | 40,922 | | | | 509,888 | |
See Notes to the Financial Statements
SECURIAN AM REAL ASSET INCOME FUND
Schedule of Investments – Continued
August 31, 2019
| | | | | | Fair | |
| | | Shares | | | Value | |
| EXCHANGE TRADED FUND – 0.4% | | | | | | |
| Invesco DB Commodity Index Tracking Fund | | | | | | |
| (Cost $274,382) | | | 19,400 | | | $ | 287,702 | |
| | | | | | | | | |
| SHORT-TERM INVESTMENT – 0.7% | | | | | | | | |
| First American Government Obligations Fund, Class X, 2.03% (c) | | | | | | | | |
| (Cost $626,446) | | | 626,446 | | | | 626,446 | |
| Total Investments – 99.8% | | | | | | | | |
| (Cost $73,015,489) | | | | | | | 83,488,421 | |
| Other Assets and Liabilities, Net – 0.2% | | | | | | | 208,492 | |
| Total Net Assets – 100.0% | | | | | | $ | 83,696,913 | |
| (a) | Foreign Security. The Fund had $1,752,263 or 2.1% of net assets in foreign securities at August 31, 2019. |
| (b) | U.S. Treasury inflation-protected security (TIPS). TIPS are securities in which the principal amount is adjusted for inflation and the semiannual interest payments equal a fixed percentage of the inflation-adjusted principal amount. |
| (c) | The rate shown is the annualized seven day effective yield as of August 31, 2019. |
REIT – Real Estate Investment Trust
See Notes to the Financial Statements
SECURIAN AM FUNDS
Statements of Assets and Liabilities
August 31, 2019
| | | Dynamic | | | Managed | | | | |
| | | Managed | | | Volatility | | | Real Asset | |
| | | Volatility Fund | | | Equity Fund | | | Income Fund | |
| ASSETS: | | | | | | | | | |
| Investments, at fair value: | | | | | | | | | |
| (cost $50,425,243, $31,970,258, and $73,015,489, respectively) | | $ | 58,429,794 | | | $ | 39,710,598 | | | $ | 83,488,421 | |
| Receivable for investment securities sold | | | — | | | | — | | | | 189,964 | |
| Receivable for capital shares sold | | | 582,986 | | | | 124,223 | | | | 81,199 | |
| Dividends & interest receivable | | | 182,690 | | | | 6,159 | | | | 116,227 | |
| Return of capital receivable | | | — | | | | — | | | | 22,655 | |
| Variation margin receivable | | | 3,420 | | | | — | | | | — | |
| Cash held as collateral | | | 525,000 | | | | 24,762 | | | | — | |
| Prepaid expenses | | | 730 | | | | 19,499 | | | | 16,247 | |
| Total assets | | | 59,724,620 | | | | 39,885,241 | | | | 83,914,713 | |
| | | | | | | | | | | | | |
| LIABILITIES: | | | | | | | | | | | | |
| Written option contracts, at value (premiums received | | | | | | | | | | | | |
| $6,019, $17,856, and $0 respectively) | | | 1,925 | | | | 8,925 | | | | — | |
| Payable for capital shares redeemed | | | 5 | | | | 200 | | | | — | |
| Payable for investment securities purchased | | | — | | | | — | | | | 128,081 | |
| Payable to adviser, net | | | 11,088 | | | | 5,510 | | | | 39,434 | |
| Payable for fund administration & accounting fees | | | 11,903 | | | | 11,138 | | | | 13,830 | |
| Payable for compliance fees | | | 1,799 | | | | 1,808 | | | | 1,805 | |
| Payable for custody fees | | | 1,950 | | | | 1,952 | | | | 4,798 | |
| Payable for transfer agent fees & expenses | | | 4,571 | | | | 5,405 | | | | 5,459 | |
| Payable for audit & tax fees | | | 19,496 | | | | 17,497 | | | | 18,500 | |
| Payable to trustees | | | 340 | | | | 360 | | | | 309 | |
| Variation margin payable | | | — | | | | 3,040 | | | | — | |
| Other accrued expenses | | | 6,600 | | | | 3,538 | | | | 5,584 | |
| Total liabilities | | | 59,677 | | | | 59,373 | | | | 217,800 | |
| NET ASSETS | | $ | 59,664,943 | | | $ | 39,825,868 | | | $ | 83,696,913 | |
| | | | | | | | | | | | | |
| NET ASSETS CONSIST OF: | | | | | | | | | | | | |
| Paid-in capital | | $ | 50,864,945 | | | $ | 32,515,248 | | | $ | 73,112,412 | |
| Distributable earnings | | | 8,799,998 | | | | 7,310,620 | | | | 10,584,501 | |
| Net Assets | | $ | 59,664,943 | | | $ | 39,825,868 | | | $ | 83,696,913 | |
| | | | | | | | | | | | | |
Shares issued and outstanding(1) | | | 4,696,675 | | | | 3,241,185 | | | | 7,239,464 | |
| Net asset value, offering price, and redemption price per share | | $ | 12.70 | | | $ | 12.29 | | | $ | 11.56 | |
| (1) | Unlimited shares authorized without par value. |
See Notes to the Financial Statements
SECURIAN AM FUNDS
Statements of Operations
For the Year Ended August 31, 2019
| | | Dynamic | | | Managed | | | | |
| | | Managed | | | Volatility | | | Real Asset | |
| | | Volatility Fund | | | Equity Fund | | | Income Fund | |
| INVESTMENT INCOME: | | | | | | | | | |
| Dividend income (net of foreign taxes withheld of $0, | | | | | | | | | |
| $0 and $2,909, respectively) | | $ | 482,351 | | | $ | 920,284 | | | $ | 2,145,067 | |
| Distributions received from master limited partnerships | | | — | | | | — | | | | 813,296 | |
| Less: return of capital distributions | | | — | | | | — | | | | (813,296 | ) |
| Net distributions from master limited partnerships | | | — | | | | — | | | | — | |
| Interest income | | | 941,580 | | | | 65,967 | | | | 220,785 | |
| Total investment income | | | 1,423,931 | | | | 986,251 | | | | 2,365,852 | |
| | | | | | | | | | | | | |
| EXPENSES: | | | | | | | | | | | | |
| Advisory fees (See note 5) | | | 342,966 | | | | 247,083 | | | | 596,772 | |
| Fund administration & accounting fees (See note 5) | | | 73,923 | | | | 67,221 | | | | 81,572 | |
| Federal & state registration fees | | | 34,850 | | | | 23,217 | | | | 23,842 | |
| Transfer agent fees (See note 5) | | | 25,899 | | | | 31,981 | | | | 30,264 | |
| Audit fees | | | 19,495 | | | | 17,496 | | | | 18,501 | |
| Trustee fees | | | 13,066 | | | | 13,375 | | | | 12,951 | |
| Compliance fees (See note 5) | | | 10,546 | | | | 10,554 | | | | 10,558 | |
| Custody fees (See note 5) | | | 7,153 | | | | 7,033 | | | | 17,680 | |
| Legal fees | | | 5,229 | | | | 5,218 | | | | 5,230 | |
| Other | | | 5,183 | | | | 5,599 | | | | 10,123 | |
| Postage & printing fees | | | 4,116 | | | | 4,814 | | | | 5,682 | |
| Total expenses before waiver | | | 542,426 | | | | 433,591 | | | | 813,175 | |
| Less: waiver by adviser | | | (252,224 | ) | | | (224,521 | ) | | | (216,403 | ) |
| Net expenses | | | 290,202 | | | | 209,070 | | | | 596,772 | |
| NET INVESTMENT INCOME | | | 1,133,729 | | | | 777,181 | | | | 1,769,080 | |
| | | | | | | | | | | | | |
| REALIZED AND UNREALIZED | | | | | | | | | | | | |
| GAIN (LOSS) ON INVESTMENTS: | | | | | | | | | | | | |
| Net realized gain (loss) on investments | | | (2,479 | ) | | | 315,231 | | | | 2,084,572 | |
| Net realized gain (loss) on futures contracts | | | 376,639 | | | | (1,428,490 | ) | | | — | |
| Net realized gain on purchased option contracts | | | 526,743 | | | | 838,309 | | | | — | |
| Net realized gain (loss) on written option contracts | | | 99,658 | | | | (368,343 | ) | | | — | |
| Net change in unrealized appreciation/depreciation on investments | | | 1,949,724 | | | | 1,267,634 | | | | 1,047,165 | |
| Net change in unrealized appreciation/depreciation on futures contracts | | | (793,748 | ) | | | (96,238 | ) | | | — | |
| Net change in unrealized appreciation/depreciation | | | | | | | | | | | | |
| on written option contracts | | | 3,119 | | | | 8,021 | | | | — | |
| Net realized and unrealized gain on investments | | | 2,159,656 | | | | 536,124 | | | | 3,131,737 | |
| | | | | | | | | | | | | |
| NET INCREASE IN NET ASSETS | | | | | | | | | | | | |
| RESULTING FROM OPERATIONS | | $ | 3,293,385 | | | $ | 1,313,305 | | | $ | 4,900,817 | |
See Notes to the Financial Statements
SECURIAN AM DYNAMIC MANAGED VOLATILITY FUND
Statements of Changes in Net Assets
| | | Year Ended | | | Year Ended | |
| | | August 31, 2019 | | | August 31, 2018 | |
| OPERATIONS: | | | | | | |
| Net investment income | | $ | 1,133,729 | | | $ | 718,232 | |
| Net realized loss on investments | | | (2,479 | ) | | | (687 | ) |
| Net realized gain on futures contracts | | | 376,639 | | | | 1,976,700 | |
| Net realized gain (loss) on purchased option contracts | | | 526,743 | | | | (339,120 | ) |
| Net realized gain on written option contracts | | | 99,658 | | | | 28,459 | |
| Net change in unrealized appreciation/depreciation on investments | | | 1,949,724 | | | | 2,072,978 | |
| Net change in unrealized appreciation/depreciation on futures contracts | | | (793,748 | ) | | | 572,932 | |
| Net change in unrealized appreciation/depreciation on written options | | | 3,119 | | | | 975 | |
| Net increase in net assets resulting from operations | | | 3,293,385 | | | | 5,030,469 | |
| | | | | | | | | |
| CAPITAL SHARE TRANSACTIONS: | | | | | | | | |
Class A(1): | | | | | | | | |
| Proceeds from shares sold | | | — | | | | — | |
| Proceeds from reinvestment of distributions | | | — | | | | 1,270 | |
| Payment for conversion of Institutional Class shares | | | — | | | | (292,813 | ) |
| Payments for shares redeemed | | | — | | | | (62,504 | ) |
| Decrease in net assets resulting from Class A transactions | | | — | | | | (354,047 | ) |
| Institutional Class: | | | | | | | | |
| Proceeds from shares sold | | | 15,094,126 | | | | 1,258,537 | |
| Proceeds from reinvestment of distributions | | | 2,315,282 | | | | 2,512,988 | |
| Proceeds for conversion of Institutional Class shares | | | — | | | | 292,813 | |
| Payments for shares redeemed | | | (409,063 | ) | | | (501,046 | ) |
| Increase in net assets resulting from Institutional Class transactions | | | 17,000,345 | | | | 3,563,292 | |
| Net increase in net assets resulting from capital share transactions | | | 17,000,345 | | | | 3,209,245 | |
| | | | | | | | | |
| DISTRIBUTIONS TO SHAREHOLDERS: | | | | | | | | |
Class A(1) | | | — | | | | (1,270 | ) |
| Institutional Class | | | (2,352,620 | ) | | | (2,533,718 | ) |
| Total distributions to shareholders | | | (2,352,620 | ) | | | (2,534,988 | )* |
| | | | | | | | | |
| TOTAL INCREASE IN NET ASSETS | | | 17,941,110 | | | | 5,704,726 | |
| | | | | | | | | |
| NET ASSETS: | | | | | | | | |
| Beginning of period | | | 41,723,833 | | | | 36,019,107 | |
| End of period | | $ | 59,664,943 | | | $ | 41,723,833 | ** |
| (1) | | Class A shares converted to Institutional Class shares on December 26, 2017 (See Note 1 in the Notes to Financial Statements). |
| * | | Includes net investment income distributions of $1,270 and $629,236 and net realized gain distributions of $0 and $1,904,482 for Class A and the Institutional Class, respectively. |
| ** | | Includes undistributed net investment income of $184,005. |
See Notes to the Financial Statements
SECURIAN AM MANAGED VOLATILITY EQUITY FUND
Statements of Changes in Net Assets
| | | Year Ended | | | Year Ended | |
| | | August 31, 2019 | | | August 31, 2018 | |
| OPERATIONS: | | | | | | |
| Net investment income | | $ | 777,181 | | | $ | 703,127 | |
| Net realized gain on investments | | | 315,231 | | | | 1,130,353 | |
| Net realized gain (loss) on futures contracts | | | (1,428,490 | ) | | | 6,287 | |
| Net realized gain (loss) on purchased option contracts | | | 838,309 | | | | (124,136 | ) |
| Net realized gain (loss) on written option contracts | | | (368,343 | ) | | | 78,241 | |
| Net change in unrealized appreciation/depreciation of investments | | | 1,267,634 | | | | 1,216,330 | |
| Net change in unrealized appreciation/depreciation on futures contracts | | | (96,238 | ) | | | 99,187 | |
| Net change in unrealized appreciation/depreciation on written options | | | 8,021 | | | | 910 | |
| Net increase in net assets resulting from operations | | | 1,313,305 | | | | 3,110,299 | |
| | | | | | | | | |
| CAPITAL SHARE TRANSACTIONS: | | | | | | | | |
Class A(1): | | | | | | | | |
| Proceeds from shares sold | | | — | | | | 222,782 | |
| Proceeds from reinvestment of distributions | | | — | | | | 8,054 | |
| Payment for conversion of Institutional Class shares | | | — | | | | (3,350,703 | ) |
| Payments for shares redeemed | | | — | | | | (319,077 | ) |
| Increase (Decrease) in net assets resulting from Class A transactions | | | — | | | | (3,438,944 | ) |
| Institutional Class: | | | | | | | | |
| Proceeds from shares sold | | | 6,841,551 | | | | 6,918,644 | |
| Proceeds from reinvestment of distributions | | | 1,203,400 | | | | 545,033 | |
| Proceeds from conversion of Institutional Class shares | | | — | | | | 3,350,703 | |
| Payments for shares redeemed | | | (6,193,632 | ) | | | (19,637,840 | ) |
| Increase (Decrease) in net assets resulting from Institutional Class transactions | | | 1,851,319 | | | | (8,823,460 | ) |
| Net increase (decrease) in net assets resulting from capital share transactions | | | 1,851,319 | | | | (12,262,404 | ) |
| | | | | | | | | |
| DISTRIBUTIONS TO SHAREHOLDERS: | | | | | | | | |
Class A(1) | | | — | | | | (8,214 | ) |
| Institutional Class | | | (1,319,565 | ) | | | (578,651 | ) |
| Total distributions to shareholders | | | (1,319,565 | ) | | | (586,865 | )* |
| | | | | | | | | |
| TOTAL INCREASE (DECREASE) IN NET ASSETS | | | 1,845,059 | | | | (9,738,970 | ) |
| | | | | | | | | |
| NET ASSETS: | | | | | | | | |
| Beginning of period | | | 37,980,809 | | | | 47,719,779 | |
| End of period | | $ | 39,825,868 | | | $ | 37,980,809 | ** |
| (1) | | Class A shares converted to Institutional Class shares on December 26, 2017 (See Note 1 in the Notes to Financial Statements). |
| * | | Includes net investment income distributions of $8,214 and $578,651 for Class A and the Institutional Class, respectively. |
| ** | | Includes undistributed net investment income of $133,206. |
See Notes to the Financial Statements
SECURIAN AM REAL ASSET INCOME FUND
Statements of Changes in Net Assets
| | | Year Ended | | | Year Ended | |
| | | August 31, 2019 | | | August 31, 2018 | |
| OPERATIONS: | | | | | | |
| Net investment income | | $ | 1,769,080 | | | $ | 1,792,258 | |
| Net realized gain on investments | | | 2,084,572 | | | | 927,949 | |
| Net change in unrealized appreciation/depreciation on investments | | | 1,047,165 | | | | 736,677 | |
| Net increase in net assets resulting from operations | | | 4,900,817 | | | | 3,456,884 | |
| | | | | | | | | |
| CAPITAL SHARE TRANSACTIONS: | | | | | | | | |
Class A(1): | | | | | | | | |
| Proceeds from shares sold | | | — | | | | 100,112 | |
| Proceeds from reinvestment of distributions | | | — | | | | 921 | |
| Payment for conversion of Institutional Class shares | | | — | | | | (338,879 | ) |
| Payments for shares redeemed | | | — | | | | (10,741 | ) |
| Decrease in net assets resulting from Class A transactions | | | — | | | | (248,587 | ) |
| Institutional Class: | | | | | | | | |
| Proceeds from shares sold | | | 616,808 | | | | 968,888 | |
| Proceeds from reinvestment of distributions | | | 1,744,428 | | | | 1,413,112 | |
| Proceeds from conversion of Institutional Class shares | | | — | | | | 338,879 | |
| Payments for shares redeemed | | | (1,724,551 | ) | | | (8,698,034 | ) |
| Increase (Decrease) in net assets resulting from Institutional Class transactions | | | 636,685 | | | | (5,977,155 | ) |
| Net increase (decrease) in net assets resulting from capital share transactions | | | 636,685 | | | | (6,225,742 | ) |
| | | | | | | | | |
| DISTRIBUTIONS TO SHAREHOLDERS: | | | | | | | | |
Class A(1) | | | — | | | | (940 | ) |
| Institutional Class | | | (3,228,444 | ) | | | (2,607,183 | ) |
| Total distributions to shareholders | | | (3,228,444 | ) | | | (2,608,123 | )* |
| | | | | | | | | |
| TOTAL INCREASE (DECREASE) IN NET ASSETS | | | 2,309,058 | | | | (5,376,981 | ) |
| | | | | | | | | |
| NET ASSETS: | | | | | | | | |
| Beginning of period | | | 81,387,855 | | | | 86,764,836 | |
| End of period | | $ | 83,696,913 | | | $ | 81,387,855 | ** |
| (1) | | Class A shares converted to Institutional Class shares on December 26, 2017 (See Note 1 in the Notes to Financial Statements). |
| * | | Includes net investment income distributions of $940 and $1,603,543 and net realized gain distributions of $0 and $1,003,640 for Class A and the Institutional Class, respectively. |
| ** | | Includes accumulated net investment loss of $(815,160). |
See Notes to the Financial Statements
SECURIAN AM DYNAMIC MANAGED VOLATILITY FUND
Financial Highlights
| | | | | | | | | | | | For The Period | |
| | | Year Ended | | | Year Ended | | | Year Ended | | | Inception through | |
| | | August 31, 2019 | | | August 31, 2018 | | | August 31, 2017 | | | August 31, 2016(1) | |
PER SHARE DATA(2): | | | | | | | | | | | | |
| Net asset value, beginning of period | | $ | 12.72 | | | $ | 11.95 | | | $ | 10.81 | | | $ | 10.00 | |
| | | | | | | | | | | | | | | | | |
| INVESTMENT OPERATIONS: | | | | | | | | | | | | | | | | |
| Net investment income | | | 0.24 | | | | 0.23 | | | | 0.19 | | | | 0.16 | |
| Net realized and unrealized | | | | | | | | | | | | | | | | |
| gain on investments | | | 0.28 | | | | 1.36 | | | | 1.12 | | | | 0.81 | |
| Total from investment operations | | | 0.52 | | | | 1.59 | | | | 1.31 | | | | 0.97 | |
| | | | | | | | | | | | | | | | | |
| LESS DISTRIBUTIONS: | | | | | | | | | | | | | | | | |
| From net investment income | | | (0.17 | ) | | | (0.20 | ) | | | (0.17 | ) | | | (0.14 | ) |
| From net capital gains | | | (0.37 | ) | | | (0.62 | ) | | | — | | | | (0.02 | ) |
| Total distributions | | | (0.54 | ) | | | (0.82 | ) | | | (0.17 | ) | | | (0.16 | ) |
| Net asset value, end of period | | $ | 12.70 | | | $ | 12.72 | | | $ | 11.95 | | | $ | 10.81 | |
| | | | | | | | | | | | | | | | | |
TOTAL RETURN(3) | | | 4.54 | % | | | 13.74 | % | | | 12.27 | % | | | 9.75 | % |
| | | | | | | | | | | | | | | | | |
| SUPPLEMENTAL DATA AND RATIOS: | | | | | | | | | | | | | | | | |
| Net assets, end of period (in millions) | | $ | 59.7 | | | $ | 41.7 | | | $ | 35.6 | | | $ | 28.2 | |
| | | | | | | | | | | | | | | | | |
Ratio of expenses to average net assets(4): | | | | | | | | | | | | | | | | |
Before expense reimbursement(5) | | | 1.03 | % | | | 1.19 | % | | | 1.36 | % | | | 1.55 | % |
After expense reimbursement(5) | | | 0.55 | % | | | 0.55 | % | | | 0.55 | % | | | 0.55 | % |
| | | | | | | | | | | | | | | | | |
| Ratio of net investment income | | | | | | | | | | | | | | | | |
to average net assets(4): | | | | | | | | | | | | | | | | |
Before expense reimbursement(5) | | | 1.67 | % | | | 1.20 | % | | | 0.87 | % | | | 0.62 | % |
After expense reimbursement(5) | | | 2.15 | % | | | 1.84 | % | | | 1.68 | % | | | 1.62 | % |
| | | | | | | | | | | | | | | | | |
Portfolio turnover rate(3) | | | 1 | % | | | 7 | % | | | 0 | %(6) | | | 36 | % |
| (1) | Inception date of the Fund was September 28, 2015. |
| (2) | For an Institutional Class Fund Share outstanding for the entire period. |
| (3) | Not annualized for periods less than one year. |
| (4) | Does not include income and expenses of investment companies in which the Fund invests. |
| (5) | Annualized for periods less than one year. |
| (6) | Rate is less than 0.5%. |
See Notes to the Financial Statements
SECURIAN AM MANAGED VOLATILITY EQUITY FUND
Financial Highlights
| | | | | | | | | | | | For The Period | |
| | | Year Ended | | | Year Ended | | | Year Ended | | | Inception through | |
| | | August 31, 2019 | | | August 31, 2018 | | | August 31, 2017 | | | August 31, 2016(1) | |
PER SHARE DATA(2): | | | | | | | | | | | | |
| Net asset value, beginning of period | | $ | 12.33 | | | $ | 11.62 | | | $ | 10.85 | | | $ | 10.00 | |
| | | | | | | | | | | | | | | | | |
| INVESTMENT OPERATIONS: | | | | | | | | | | | | | | | | |
| Net investment income | | | 0.24 | | | | 0.22 | | | | 0.23 | | | | 0.15 | |
| Net realized and unrealized | | | | | | | | | | | | | | | | |
| gain on investments | | | 0.14 | | | | 0.67 | | | | 0.77 | | | | 0.86 | |
| Total from investment operations | | | 0.38 | | | | 0.89 | | | | 1.00 | | | | 1.01 | |
| | | | | | | | | | | | | | | | | |
| LESS DISTRIBUTIONS: | | | | | | | | | | | | | | | | |
| From net investment income | | | (0.19 | ) | | | (0.18 | ) | | | (0.23 | ) | | | (0.15 | ) |
| From net capital gains | | | (0.23 | ) | | | — | | | | — | | | | — | |
| From return of capital | | | — | | | | — | | | | — | | | | (0.01 | ) |
| Total distributions | | | (0.42 | ) | | | (0.18 | ) | | | (0.23 | ) | | | (0.16 | ) |
| Net asset value, end of period | | $ | 12.29 | | | $ | 12.33 | | | $ | 11.62 | | | $ | 10.85 | |
| | | | | | | | | | | | | | | | | |
TOTAL RETURN(3) | | | 3.32 | % | | | 7.69 | % | | | 9.36 | % | | | 10.10 | % |
| | | | | | | | | | | | | | | | | |
| SUPPLEMENTAL DATA AND RATIOS: | | | | | | | | | | | | | | | | |
| Net assets, end of period (in millions) | | $ | 39.8 | | | $ | 38.0 | | | $ | 44.4 | | | $ | 29.9 | |
| | | | | | | | | | | | | | | | | |
Ratio of expenses to average net assets(4): | | | | | | | | | | | | | | | | |
Before expense reimbursement(5) | | | 1.14 | % | | | 1.15 | % | | | 1.22 | % | | | 1.67 | % |
After expense reimbursement(5) | | | 0.55 | % | | | 0.55 | % | | | 0.55 | % | | | 0.55 | % |
| | | | | | | | | | | | | | | | | |
| Ratio of net investment income | | | | | | | | | | | | | | | | |
to average net assets(4): | | | | | | | | | | | | | | | | |
Before expense reimbursement(5) | | | 1.45 | % | | | 1.13 | % | | | 1.48 | % | | | 0.40 | % |
After expense reimbursement(5) | | | 2.04 | % | | | 1.73 | % | | | 2.15 | % | | | 1.52 | % |
| | | | | | | | | | | | | | | | | |
Portfolio turnover rate(3) | | | 8 | % | | | 12 | % | | | 0 | %(6) | | | 15 | % |
| (1) | Inception date of the Fund was September 28, 2015. |
| (2) | For an Institutional Class Fund Share outstanding for the entire period. |
| (3) | Not annualized for periods less than one year. |
| (4) | Does not include income and expenses of investment companies in which the Fund invests. |
| (5) | Annualized for periods less than one year. |
| (6) | Rate is less than 0.5%. |
See Notes to the Financial Statements
SECURIAN AM REAL ASSET INCOME FUND
Financial Highlights
| | | Year Ended | | | Year Ended | | | Year Ended | | | Year Ended | | | Year Ended | |
| | | August 31, | | | August 31, | | | August 31, | | | August 31, | | | August 31, | |
| | | 2019 | | | 2018 | | | 2017 | | | 2016 | | | 2015 | |
| Institutional Class | | | | | | | | | | | | | | | |
| | | | | | | | | | | | | | | | |
PER SHARE DATA(1): | | | | | | | | | | | | | | | |
| Net asset value, beginning of year | | $ | 11.35 | | | $ | 11.21 | | | $ | 11.27 | | | $ | 10.46 | | | $ | 11.91 | |
| | | | | | | | | | | | | | | | | | | | | |
| INVESTMENT OPERATIONS: | | | | | | | | | | | | | | | | | | | | |
| Net investment income | | | 0.25 | | | | 0.23 | | | | 0.21 | | | | 0.24 | | | | 0.23 | |
| Net realized and unrealized | | | | | | | | | | | | | | | | | | | | |
| gain (loss) on investments | | | 0.41 | | | | 0.27 | | | | (0.04 | ) | | | 1.39 | | | | (0.94 | ) |
| Total from investment operations | | | 0.66 | | | | 0.50 | | | | 0.17 | | | | 1.63 | | | | (0.71 | ) |
| | | | | | | | | | | | | | | | | | | | | |
| LESS DISTRIBUTIONS: | | | | | | | | | | | | | | | | | | | | |
| From net investment income | | | (0.32 | ) | | | (0.22 | ) | | | (0.23 | ) | | | (0.31 | ) | | | (0.28 | ) |
| From net capital gains | | | (0.13 | ) | | | (0.14 | ) | | | — | | | | (0.51 | ) | | | (0.46 | ) |
| Total distributions | | | (0.45 | ) | | | (0.36 | ) | | | (0.23 | ) | | | (0.82 | ) | | | (0.74 | ) |
| Net asset value, end of year | | $ | 11.56 | | | $ | 11.35 | | | $ | 11.21 | | | $ | 11.27 | | | $ | 10.46 | |
| | | | | | | | | | | | | | | | | | | | | |
| TOTAL RETURN | | | 6.32 | % | | | 4.61 | % | | | 1.59 | % | | | 16.59 | % | | | (6.42 | )% |
| | | | | | | | | | | | | | | | | | | | | |
| SUPPLEMENTAL DATA AND RATIOS: | | | | | | | | | | | | | | | | | | | | |
| Net assets, end of year (in millions) | | $ | 83.7 | | | $ | 81.4 | | | $ | 86.5 | | | $ | 88.1 | | | $ | 75.2 | |
| | | | | | | | | | | | | | | | | | | | | |
| Ratio of expenses to average net assets: | | | | | | | | | | | | | | | | | | | | |
| Before expense reimbursement | | | 1.02 | % | | | 1.06 | % | | | 1.07 | % | | | 1.09 | % | | | 1.07 | % |
| After expense reimbursement | | | 0.75 | % | | | 0.82 | %(2) | | | 0.95 | % | | | 0.95 | % | | | 0.95 | % |
| | | | | | | | | | | | | | | | | | | | | |
| Ratio of net investment income | | | | | | | | | | | | | | | | | | | | |
| to average net assets: | | | | | | | | | | | | | | | | | | | | |
| Before expense reimbursement | | | 1.95 | % | | | 2.02 | % | | | 1.83 | % | | | 1.99 | % | | | 1.85 | % |
| After expense reimbursement | | | 2.22 | % | | | 2.26 | % | | | 1.95 | % | | | 2.13 | % | | | 1.97 | % |
| | | | | | | | | | | | | | | | | | | | | |
| Portfolio turnover rate | | | 46 | % | | | 56 | % | | | 74 | % | | | 82 | % | | | 73 | % |
| (1) | For an Institutional Class Fund Share outstanding for the entire year. |
| (2) | Effective December 29, 2017, the contractual rate was lowered from 0.95% to 0.75% of average daily net assets. |
See Notes to the Financial Statements
SECURIAN AM FUNDS
Notes to Financial Statements
August 31, 2019
1. ORGANIZATION
Managed Portfolio Series (the “Trust”) was organized as a Delaware statutory trust on January 27, 2011. The Trust is registered under the Investment Company Act of 1940, as amended (the “1940 Act”), as an open-end management investment company. The Securian AM Dynamic Managed Volatility Fund (“Dynamic Managed Volatility Fund”), the Securian AM Managed Volatility Equity Fund (“Managed Volatility Equity Fund”), and Securian AM Real Asset Income Fund (“Real Asset Income Fund”) (or collectively, “the Funds”) are each a diversified series with their own investment objectives and policies within the Trust. Each Fund is an investment company and accordingly follows the investment company accounting and reporting guidance of the Financial Accounting Standards Board (“FASB”) Accounting Standards Codification Topic 946 Financial Services – Investment Companies.
The Dynamic Managed Volatility Fund seeks to maximize risk-adjusted total returns relative to its blended benchmark index, comprised of 60% S&P 500® Index and 40% Bloomberg Barclays U.S. Aggregate Bond Index. The Dynamic Managed Volatility Fund seeks to achieve its investment objective by investing in other funds and directly in securities, while using hedging techniques to manage portfolio risk and volatility. The Dynamic Managed Volatility Fund achieves its equity exposure by investing primarily in equity securities or in exchange-traded funds (“ETFs”) that invest in equity securities. The Dynamic Managed Volatility Fund achieves its fixed income exposure by investing primarily in fixed income securities that are investment-grade corporate bonds, ETFs that invest in investment-grade fixed income securities, exchange traded notes (“ETNs”), interest rate swaps, treasury and interest rate futures, or other instruments that have characteristics similar to the fixed income securities included in the Bloomberg Barclays U.S. Aggregate Bond Index. The Dynamic Managed Volatility Fund commenced operations on September 28, 2015. The Dynamic Managed Volatility Fund currently only offers Institutional Class shares. Effective November 22, 2017, the Dynamic Managed Volatility Fund ceased offering Class A shares. The remaining Class A shares were converted to Institutional Class shares at the close of the business on December 26, 2017.
The Managed Volatility Equity Fund seeks to maximize risk-adjusted returns relative to its blended benchmark index, comprised of 60% S&P 500® Low Volatility Index, 20% S&P BMI International Developed Low Volatility Index and 20% Bloomberg Barclays U.S. 3 Month Treasury Bellwether Index. The Managed Volatility Equity Fund seeks to achieve its investment objective by investing in other funds or directly in securities while using hedging techniques to manage portfolio risk and volatility. Under normal market conditions, the Managed Volatility Equity Fund invests at least 80% of its net assets (plus any borrowings for investment purposes) in equity securities. Equity securities include those that are equity-based, such as ETFs that invest primarily in U.S. and foreign equity securities. Over time, the Managed Volatility Equity Fund will target an approximate 85% equity exposure and 15% cash or cash equivalent exposure. The Managed Volatility Equity Fund will generally seek to invest in ETFs that invest in equity securities whose prices are less volatile than the equity markets as a whole. The Managed Volatility Equity Fund commenced operations on September 28, 2015. The Managed Volatility Equity Fund currently only offers Institutional Class shares. Effective November 22, 2017, the Managed Volatility Equity Fund ceased offering Class A shares. The remaining Class A shares were converted to Institutional Class shares at the close of the business on December 26, 2017.
The investment objective of the Real Asset Income Fund is above average income and long-term growth of real estate securities. The Real Asset Income Fund seeks to achieve its objective by investing in “real assets” and securities in companies that derive at least 50% of their revenues from activities related to real assets. Real assets are defined broadly by the Fund to include any assets that have physical properties, such as energy and natural resources, real estate, basic materials, equipment, utilities and infrastructure, and commodities. Prior to December 29, 2018, the Real Asset Income Fund had a different investment objective and principal investment strategies. The Real Asset Income
SECURIAN AM FUNDS
Notes to Financial Statements – Continued
August 31, 2019
Fund may also invest up to 25% of its total assets in the securities of master limited partnerships (“MLPs”). In addition, the Adviser may invest in ETFs, ETNs, Treasury inflation-protected securities (“TIPS”), futures, and may write covered calls to accomplish one or more of the following: manage inflation or volatility, increase income, or gain market exposure. The Fund commenced operations on September 12, 2012. The Real Asset Income Fund currently only offers Institutional Class shares. Effective November 22, 2017, the Real Asset Income Fund ceased offering Class A shares. The remaining Class A shares were converted to Institutional Class shares at the close of the business on December 26, 2017.
2. SIGNIFICANT ACCOUNTING POLICIES
The following is a summary of significant accounting policies consistently followed by the Funds in the preparation of their financial statements. These policies are in conformity with generally accepted accounting principles in the United States of America (“GAAP”).
Security Valuation – All investments in securities are recorded at their estimated fair value, as described in Note 3.
Federal Income Taxes – Each of the Funds complies with the requirements of Subchapter M of the Internal Revenue Code of 1986, as amended, necessary to qualify as a regulated investment company and distributes substantially all net taxable investment income and net realized gains to shareholders in a manner which results in no tax cost to the Funds. Therefore, no federal income or excise tax provision is required. As of and during the year ended August 31, 2019, the Funds did not have any tax positions that did not meet the “more-likely-than-not” threshold of being sustained by the applicable tax authority. As of and during the year ended August 31, 2019, the Funds did not have liabilities for any unrecognized tax benefits. The Funds recognize interest and penalties, if any, related to unrecognized tax benefits on uncertain tax positions as income tax expense in the Statements of Operations. During the year ended August 31, 2019, the Funds did not incur any interest or penalties. The Dynamic Managed Volatility Fund and Managed Volatility Equity Fund are subject to examination by U.S. taxing authorities for the tax periods since the commencement of operations. Each of the tax years in the four-year period ended August 31, 2019, remains subject to examination by taxing authorities for the Real Asset Income Fund.
Security Transactions, Income and Distributions – The Funds follow industry practice and record security transactions on the trade date. Realized gains and losses on sales of securities are calculated on the basis of identified cost. Dividend income is recorded on the ex-dividend date and interest income is recorded on an accrual basis. Withholding taxes on foreign dividends have been provided for in accordance with the Funds’ understanding of the applicable country’s tax rules and regulations. Discounts and premiums on securities purchased are amortized over the expected life of the respective securities using the constant yield method of calculation.
The Funds will make distributions of net investment income quarterly. Any net realized long term or short term capital gains on sales of the Funds’ securities are distributed to shareholders at least annually. Distributions from net realized gains for book purposes may include short term capital gains. All short term capital gains are included in ordinary income for tax purposes. The treatment for financial reporting purposes of distributions made to shareholders during the year from net investment income or net realized capital gains may differ from their ultimate treatment for federal income tax purposes. These differences are caused primarily by differences in the timing of the recognition of certain components of income, expense or realized capital gain for federal income tax purposes, such as differing book and tax treatments of MLPs, tax equalization, distribution redesignations, derivatives and the deferral of losses on wash sales. Where such differences are permanent in nature, GAAP requires that they be reclassified in the components of the net assets based on their ultimate characterization for federal income tax purposes. Any such reclassifications will have no effect on net assets, results of operations or net asset values per share of the Funds.
SECURIAN AM FUNDS
Notes to Financial Statements – Continued
August 31, 2019
| | Distributable Earnings | Paid-In Capital |
| Dynamic Managed Volatility Fund | $(5,895) | $5,895 |
| Real Asset Income Fund | (9,106) | 9,106 |
These adjustments were due to equalization and nondeductible expenses from partnerships.
Distributions received from the Real Asset Income Fund’s investments in MLPs generally are comprised of ordinary income and return of capital from the MLPs. The Real Asset Income Fund allocates distributions between investment income and return of capital based on estimates. Such estimates are based on information provided by each MLP and other industry sources. These estimates may subsequently be revised based on actual allocations received from MLPs after their tax reporting periods are concluded, as the actual character of these distributions is not known until after the fiscal year end of the Real Asset Income Fund. Generally, 100% of the distributions received from MLPs is recorded as return of capital and is reflected as such on the Statements of Operations.
Distributions received from the Real Asset Income Fund’s investments in REITs may be characterized as ordinary income, net capital gain, or a return of capital. The proper characterization of REIT distributions is generally not known until after the end of each calendar year. The Real Asset Income Fund must use estimates in reporting the character of their income and distributions for financial statement purposes. The actual character of distributions to Real Asset Income Fund shareholders will be reflected on the Form 1099 received by shareholders after the end of the calendar year. Due to the nature of REIT investments, a portion of the distributions received by a Real Asset Income Fund shareholder may represent a return of capital.
Futures Contracts and Option Contracts – The Funds are subject to equity price risk, interest rate risk, and foreign currency exchange risk in the normal course of pursuing their investment objectives. The Funds use futures contracts and options on futures contracts to gain exposure to, or hedge against, changes in the value of equities, interest rates or foreign currencies. A futures contract represents a commitment for the future purchase or sale of an asset at a specified price on a specified date. Upon entering into such contracts, the Funds are required to deposit with the broker, either in cash or securities, an initial margin deposit in an amount equal to a certain percentage of the contract amount. In addition, the Fund segregates liquid securities when purchasing or selling futures contracts to comply with Trust policies. Subsequent payments (variation margin) are made or received by the Funds each day, depending on the daily fluctuations in the value of the contract, and are recorded for financial statement purposes as unrealized gains or losses by the Funds. Upon entering into such contracts, the Funds bear the risk of interest or exchange rates or securities prices moving unexpectedly, in which case, the Funds may not achieve the anticipated benefits of the futures contracts and may realize a loss. With futures, there is minimal counterparty credit risk to the Funds since futures are exchange traded and the exchange’s clearinghouse, as counterparty to all exchange-traded futures, guarantees the futures against default. The use of futures contracts, and options on futures contracts, involves the risk of imperfect correlation in movements in the price of futures contracts and options thereon, interest rates and the underlying hedged assets.
The Funds may use purchased option contracts and written option contracts to hedge against the changes in the value of equities or to meet their investment objectives. The Funds may write put and call options only if they (i) own an offsetting position in the underlying security or (ii) maintain cash or other liquid assets in an amount equal to or greater than its obligation under the option.
When the Funds write a call or put option, an amount equal to the premium received is included in the Statements of Assets & Liabilities as a liability. The amount of the liability is subsequently adjusted to reflect the current fair value of the option. If an option expires on its stipulated expiration date or if the Funds enter into a closing purchase transaction,
SECURIAN AM FUNDS
Notes to Financial Statements – Continued
August 31, 2019
a gain or loss is realized. If a written call option is exercised, a gain or loss is realized for the sale of the underlying security and the proceeds from the sale are increased by the premium originally received. If a written put option is exercised, the cost of the security acquired is decreased by the premium originally received. As the writer of an option, the Funds have no control over whether the underlying securities are subsequently sold (call) or purchased (put) and, as a result, bear the market risk of an unfavorable change in the price of the security underlying the written option.
The Funds may purchase call and put options. When the Funds purchase a call or put option, an amount equal to the premium paid is included in the Statements of Assets & Liabilities as an investment, and is subsequently adjusted to reflect the fair value of the option. If an option expires on the stipulated expiration date or if the Funds enter into a closing sale transaction, a gain or loss is realized. If the Funds exercise a call option, the cost of the security acquired is increased by the premium paid for the call. If the Funds exercise a put option, a gain or loss is realized from the sale of the underlying security, and the proceeds from such a sale are decreased by the premium originally paid. Written and purchased options are non-income producing securities. Written and purchased options expose the Funds to minimal counterparty risk since they are exchange traded and the exchange’s clearinghouse guarantees the options against default. Please refer to Note 4 for more information on derivatives.
Foreign Currency – Investment securities and other assets and liabilities denominated in foreign currencies are translated into U.S. dollar amounts at the date of valuation. Purchases and sales of investment securities and income and expense items denominated in foreign currencies are translated into U.S. dollar amounts on the respective dates of such transactions.
The Funds do not isolate that portion of the results of operations resulting from changes in foreign exchange rates on investments from the fluctuations arising from changes in market prices of securities held. Such fluctuations are included with the net realized and unrealized gain or loss from investments.
The Funds report net realized foreign exchange gains or losses that arise from sales of foreign currencies, currency gains or losses realized between the trade and settlement dates on securities transactions, and the difference between the amounts of dividends, interest, and foreign withholding taxes recorded on the Funds’ books and the U.S. dollar equivalent of the amounts actually received or paid. Net unrealized foreign exchange gains and losses arise from changes in the fair values of assets and liabilities, other than investments in securities at fiscal period end, resulting from changes in exchange rates.
Use of Estimates – The preparation of financial statements in conformity with GAAP requires management to make estimates and assumptions that affect the reported amounts of assets and liabilities and disclosure of contingent assets and liabilities at the date of the financial statements and the reported amounts of revenues and expenses during the reporting period. Actual results could differ from those estimates.
Indemnifications – Under the Trust’s organizational documents, its officers and trustees are indemnified against certain liabilities arising out of the performance of their duties to the Trust. In addition, in the normal course of business, the Trust may enter into contracts that provide general indemnification to other parties. The Trust’s maximum exposure under these arrangements is unknown, as this would involve future claims that may be made against the Trust that have not yet occurred, and may not occur. However, the Trust has not had prior claims or losses pursuant to these contracts and expects the risk of loss to be remote.
Allocation of Income, Expenses and Gains/Losses – Expenses associated with a specific fund in the Trust are charged to that fund. Common Trust expenses are typically allocated evenly between the funds of the Trust, or by other equitable means.
SECURIAN AM FUNDS
Notes to Financial Statements – Continued
August 31, 2019
Illiquid Securities – A security may be considered illiquid if it lacks a readily available market. Securities are generally considered liquid if they can be sold or disposed of in the ordinary course of business within seven days at approximately the price at which the security is valued by the Fund. Illiquid securities may be valued under methods approved by the Board of Trustees (the “Board”) as reflecting fair value. The Fund will not hold more than 15% of the value of its net assets in illiquid securities. At August 31, 2019, the Dynamic Managed Volatility Fund has investments in illiquid securities with a total value of $1,121,905 or 1.9% of total net assets. At August 31, 2019, the Managed Volatility Equity Fund and Real Asset Income Fund did not hold any illiquid securities.
| Security | Par | Dates Acquired | Cost Basis |
| Harley-Davidson Financial Services | $250,000 | 5/2018 | $249,958 |
| Takeda Pharmaceuticals Company | 500,000 | 11/2018
| 497,900 |
| Yara International | 250,000 | 5/2018 | 249,370 |
3. SECURITIES VALUATION
The Funds have adopted fair value accounting standards which establish an authoritative definition of fair value and set out a hierarchy for measuring fair value. These standards require additional disclosures about the various inputs and valuation techniques used to develop the measurements of fair value, a discussion in changes in valuation techniques and related inputs during the period and expanded disclosure of valuation levels for major security types. These inputs are summarized in the three broad levels listed below:
| Level 1 – | Unadjusted quoted prices in active markets for identical assets or liabilities that the Funds have the ability to access. |
| | |
| Level 2 – | Observable inputs other than quoted prices included in Level 1 that are observable for the asset or liability, either directly or indirectly. These inputs may include quoted prices for the identical instrument on an inactive market, prices for similar instruments, interest rates, prepayment speeds, credit risk, yield curves, default rates and similar data. |
| | |
| Level 3 – | Unobservable inputs for the asset or liability, to the extent relevant observable inputs are not available, representing the Funds’ own assumptions about the assumptions a market participant would use in valuing the asset or liability, and would be based on the best information available. |
Following is a description of the valuation techniques applied to each Fund’s major categories of assets and liabilities measured at fair value on a recurring basis. Each Fund’s investments are carried at fair value.
Equity Securities – Equity securities, including common stocks, preferred stocks, MLPs and REITs that are primarily traded on a national securities exchange are valued at the last sale price on the exchange on which they are primarily traded on the day of valuation or, if there has been no sale on such day, at the mean between the bid and ask prices. Securities traded primarily on the Nasdaq Global Market System for which market quotations are readily available are valued using the Nasdaq Official Closing Price (“NOCP”). If the NOCP is not available, such securities are valued at the last sale price on the day of valuation, or if there has been no sale on such day, at the mean between the bid and ask prices. To the extent these securities are actively traded and valuation adjustments are not applied, they are categorized in Level 1 of the fair value hierarchy. If the market for a particular security is not active, and the mean between bid and ask is used, these securities are categorized in Level 2 of the fair value hierarchy.
SECURIAN AM FUNDS
Notes to Financial Statements – Continued
August 31, 2019
Exchange Traded Funds – Exchange traded funds, including closed-end funds, are valued at the last reported sale price on the exchange on which the security is principally traded. If, on a particular day, an exchange-traded fund does not trade, then the mean between the most recent quoted bid and asked prices will be used. To the extent these securities are actively traded and valuation adjustments are not applied, they are categorized in Level 1 of the fair value hierarchy.
Corporate and Municipal Bonds – Corporate and municipal bonds, including listed issues, are valued at fair value on the basis of valuations furnished by an independent pricing service which utilizes both dealer-supplied valuations and formula-based techniques. The pricing service may consider recently executed transactions in securities of the issuer or comparable issuers, market price quotations (where observable), bond spreads, and fundamental data relating to the issuer. Most corporate and municipal bonds are categorized in Level 2 of the fair value hierarchy.
U.S. Government & Agency Securities – U.S. government & agency securities are normally valued by an independent pricing service using a model that incorporates market observable data such as reported sales of similar securities, broker quotes, yields, bids, offers, and reference data. Certain securities are valued principally using dealer quotations. U.S. government and agency securities are categorized in Level 1 or Level 2 of the fair value hierarchy depending on the inputs used and market activity levels for specific securities.
Mortgage and Asset Backed Securities – Mortgage and asset backed securities are usually issued as separate tranches, or classes, of securities within each package of underlying securities. These securities are also normally valued by pricing service providers that use broker dealer quotations or valuation estimates from their internal pricing models. The pricing models for these securities usually consider tranche level attributes, estimated cash flows and market-based yield spreads for each tranche, and current market data and incorporate packaged, collateral performance, as available. Mortgage and asset backed securities that use such valuation techniques and inputs are categorized as Level 2 of the fair value hierarchy.
Short-Term Investments – Investments in other mutual funds, including money market funds, are valued at their net asset value per share. To the extent these securities are actively traded and valuation adjustments are not applied, they are categorized in Level 1 of the fair value hierarchy.
Derivative Instruments – Listed derivatives, including options, rights, warrants and futures that are actively traded are valued based on quoted prices from the exchange and categorized in Level 1 of the fair value hierarchy.
Securities for which market quotations are not readily available, or if the closing price does not represent fair value, are valued following procedures approved by the Board. These procedures consider many factors, including the type of security, size of holding, trading volume and news events. There can be no assurance that the Funds could obtain the fair value assigned to a security if they were to sell the security at approximately the time at which the Funds determine their net asset values per share. The Board has established a Valuation Committee to administer, implement, and oversee the fair valuation process, and to make fair value decisions when necessary. The Board regularly reviews reports that describe any fair value determinations and methods.
The inputs or methodology used for valuing securities are not an indication of the risk associated with investing in those securities.
SECURIAN AM FUNDS
Notes to Financial Statements – Continued
August 31, 2019
The following table is a summary of the inputs used to value each Fund’s securities by level within the fair value hierarchy as of August 31, 2019:
| Dynamic Managed Volatility Fund | | Level 1 | | | Level 2 | | | Level 3 | | | Total | |
| Exchange Traded Funds | | $ | 26,352,224 | | | $ | — | | | $ | — | | | $ | 26,352,224 | |
| Corporate Bonds | | | — | | | | 13,716,771 | | | | — | | | | 13,716,771 | |
| Short-Term Investment | | | 11,862,961 | | | | — | | | | — | | | | 11,862,961 | |
| U.S. Government Securities | | | — | | | | 5,629,317 | | | | — | | | | 5,629,317 | |
| Mortgage Backed Security | | | — | | | | 824,246 | | | | — | | | | 824,246 | |
| Purchased Call Options | | | 44,275 | | | | — | | | | — | | | | 44,275 | |
| Total investments in securities | | $ | 38,259,460 | | | $ | 20,170,334 | | | $ | — | | | $ | 58,429,794 | |
As of August 31, 2019, the Fund’s investments in other financial instruments* were classified as follows:
| Short Futures Contracts | | $ | (14,625 | ) | | $ | — | | | $ | — | | | $ | (14,625 | ) |
| Written Call Options | | | (1,925 | ) | | | — | | | | — | | | | (1,925 | ) |
| Total Other Financial Instruments | | $ | (16,550 | ) | | $ | — | | | $ | — | | | $ | (16,550 | ) |
| | | | | | | | | | | | | |
| Managed Volatility Equity Fund | | Level 1 | | | Level 2 | | | Level 3 | | | Total | |
| Exchange Traded Funds | | $ | 36,150,034 | | | $ | — | | | $ | — | | | $ | 36,150,034 | |
| Short-Term Investment | | | 3,018,657 | | | | — | | | | — | | | | 3,018,657 | |
| U.S. Government Security | | | — | | | | 500,117 | | | | — | | | | 500,117 | |
| Purchased Put Options | | | 41,790 | | | | — | | | | — | | | | 41,790 | |
| Total investments in securities | | $ | 39,168,691 | | | $ | 500,117 | | | $ | — | | | $ | 39,710,598 | |
As of August 31, 2019, the Fund’s investments in other financial instruments* were classified as follows:
| Long Futures Contracts | | $ | 50,266 | | | $ | — | | | $ | — | | | $ | 50,266 | |
| Written Put Options | | | (8,925 | ) | | | — | | | | — | | | | (8,925 | ) |
| Total Other Financial Instruments | | $ | 41,341 | | | $ | — | | | $ | — | | | $ | 41,341 | |
| | | | | | | | | | | | | |
| Real Asset Income Fund | | Level 1 | | | Level 2 | | | Level 3 | | | Total | |
| REIT Common Stocks | | $ | 42,937,732 | | | $ | — | | | $ | — | | | $ | 42,937,732 | |
| Other Common Stocks | | | 12,513,894 | | | | — | | | | — | | | | 12,513,894 | |
| Master Limited Partnerships | | | 9,043,819 | | | | — | | | | — | | | | 9,043,819 | |
| U.S. Government Securities | | | — | | | | 8,539,086 | | | | — | | | | 8,539,086 | |
| REIT Preferred Stocks | | | 7,253,731 | | | | — | | | | — | | | | 7,253,731 | |
| Other Preferred Stocks | | | 1,255,980 | | | | — | | | | — | | | | 1,255,980 | |
| Short-Term Investment | | | 626,446 | | | | — | | | | — | | | | 626,446 | |
| Corporate Bonds | | | — | | | | 520,143 | | | | — | | | | 520,143 | |
| Closed-End Fund | | | 509,888 | | | | — | | | | — | | | | 509,888 | |
| Exchange Traded Fund | | | 287,702 | | | | — | | | | — | | | | 287,702 | |
| Total investments in securities | | $ | 74,429,192 | | | $ | 9,059,229 | | | $ | — | | | $ | 83,488,421 | |
| * | Other financial instruments are derivative instruments not reflected in the Schedule of Investments, such as futures and written options. Futures are presented at the unrealized appreciation (depreciation) on the instruments. |
Refer to each Fund’s Schedule of Investments for additional industry information.
SECURIAN AM FUNDS
Notes to Financial Statements – Continued
August 31, 2019
4. DERIVATIVES TRANSACTIONS
The Funds may use derivatives for different purposes, such as a substitute for taking a position in the underlying asset and/or as part of a strategy designed to reduce exposure to other risks, such as interest rate or currency risk. The various derivative instruments that the Funds may use are options, futures contracts and options on futures contracts and other derivative securities. The Funds may also use derivatives for leverage, in which case their use would involve leveraging risk. A Fund investing in a derivative instrument could lose more than the principal amount invested.
FASB Accounting Standards Codification Topic 815, Derivatives and Hedging (“ASC 815”) requires enhanced disclosures about each Fund’s use of, and accounting for, derivative instruments and the effect of derivative instruments on each Fund’s results of operations and financial position. Tabular disclosure regarding derivative fair value and gain/loss by contract type (e.g., interest rate contracts, foreign exchange contracts, credit contracts, etc.) is required and derivatives accounted for as hedging instruments under ASC 815 must be disclosed separately from those that do not qualify for hedge accounting. Even though the Funds may use derivatives in an attempt to achieve an economic hedge, the Funds’ derivatives are not accounted for as hedging instruments under ASC 815 because investment companies account for their derivatives at fair value and record any changes in fair value in current period earnings.
For the year ended August 31, 2019, the Funds’ average monthly notional values are as follows:
| | | Purchased | | | Written | | | Long | | | Short | |
| | | Option | | | Option | | | Futures | | | Futures | |
| Fund | | Contracts | | | Contracts | | | Contracts | | | Contracts | |
| Dynamic Managed Volatility Fund | | $ | 10,668,032 | | | $ | (6,360,817 | ) | | $ | 10,755,011 | | | $ | (2,567,490 | ) |
| Managed Volatility Equity Fund | | | 6,179,509 | | | | (4,537,686 | ) | | | 2,536,310 | | | | (2,150,198 | ) |
The locations on the Statements of Assets and Liabilities of the Funds’ derivative positions by type of exposure, all of which are not accounted for as hedging instruments under ASC 815, are as follows:
Values of Derivative Instruments as of August 31, 2019, on the Statements of Assets and Liabilities:
Dynamic Managed Volatility Fund
| | |
| Assets | | Liabilities | |
| Derivatives not accounted for as | | | | | | | | | |
| hedging instruments under ASC 815 | | Location | | Fair Value | | Location | | Fair Value | |
| Equity Contracts – Futures | | Net Assets – | | | | Net Assets – | | | |
| | | | unrealized | | | | unrealized | | | |
| | | | appreciation on | | | | depreciation on | | | |
| | | | futures contracts** | | $ | — | | futures contracts** | | $ | (14,625 | ) |
| Equity Contracts – Purchased Options | | Investments, | | | | | Investments, | | | | |
| | | | at fair value | | | 44,275 | | at fair value | | | — | |
| Equity Contracts – Written Options | | Written option contracts, | | | | | Written option contracts, | | | | |
| | | | at fair value | | | — | | at fair value | | | (1,925 | ) |
| Total | | | | $ | 44,275 | | | | $ | (16,550 | ) |
| ** | Includes cumulative appreciation/depreciation on futures contracts as reported in the Schedules of Open Futures Contracts. Variation margin is presented on the Statements of Assets and Liabilities. |
SECURIAN AM FUNDS
Notes to Financial Statements – Continued
August 31, 2019
Managed Volatility Equity Fund
| | |
| Assets | | Liabilities | |
| Derivatives not accounted for as | | | | | | | | | |
| hedging instruments under ASC 815 | | Location | | Fair Value | | Location | | Fair Value | |
| Equity Contracts – Futures | | Net Assets – | | | | Net Assets – | | | |
| | | | unrealized | | | | unrealized | | | |
| | | | appreciation on | | | | depreciation on | | | |
| | | | futures contracts** | | $ | 50,266 | | futures contracts** | | $ | — | |
| Equity Contracts – Purchased Options | | Investments, | | | | | Investments, | | | | |
| | | | at fair value | | | 41,790 | | at fair value | | | — | |
| Equity Contracts – Written Options | | Written option contracts, | | | | | Written option contracts, | | | | |
| | | | at fair value | | | — | | at fair value | | | (8,925 | ) |
| Total | | | | $ | 92,056 | | | | $ | (8,925 | ) |
| ** | Includes cumulative appreciation/depreciation on futures contracts as reported in the Schedules of Open Futures Contracts. Variation margin is presented on the Statements of Assets and Liabilities. |
The effect of Derivative Instruments on the Statements of Operations for the year ended August 31, 2019:
Amount of Realized Gain or (Loss) on Derivatives
| | | Dynamic Managed Volatility Fund | | | Managed Volatility Equity Fund | |
| Derivatives not accounted for as | | | | | Purchased | | | Written | | | | | | Purchased | | | Written | |
| hedging instruments under ASC 815 | | Futures | | | Options | | | Options | | | Futures | | | Options | | | Options | |
| Interest Rate Contracts | | $ | (179,089 | ) | | $ | — | | | $ | — | | | $ | — | | | $ | — | | | $ | — | |
| Equity Contracts | | | 555,728 | | | | 526,743 | | | | 99,658 | | | | (1,428,490 | ) | | | 838,309 | | | | (368,343 | ) |
| Total | | $ | 376,639 | | | $ | 526,743 | | | $ | 99,658 | | | $ | (1,428,490 | ) | | $ | 838,309 | | | $ | (368,343 | ) |
Change in Unrealized Appreciation or (Depreciation) on Derivatives
| | | Dynamic Managed Volatility Fund | | | Managed Volatility Equity Fund | |
| Derivatives not accounted for as | | | | | Purchased | | | Written | | | | | | Purchased | | | Written | |
| hedging instruments under ASC 815 | | Futures | | | Options* | | | Options | | | Futures | | | Options* | | | Options | |
| Interest Rate Contracts | | $ | 716 | | | $ | — | | | $ | — | | | $ | — | | | $ | — | | | $ | — | |
| Equity Contracts | | | (794,464 | ) | | | (25,810 | ) | | | 3,119 | | | | (96,238 | ) | | | (22,946 | ) | | | 8,021 | |
| Total | | $ | (793,748 | ) | | $ | (25,810 | ) | | $ | 3,119 | | | $ | (96,238 | ) | | $ | (22,946 | ) | | $ | 8,021 | |
| * | Included in net change in unrealized appreciation on investments as reported on the Statements of Operations. |
Balance Sheet Offsetting Information
The following table provides a summary of offsetting financial liabilities and derivatives and the effect of derivative instruments on the Statements of Assets and Liabilities as of August 31, 2019.
SECURIAN AM FUNDS
Notes to Financial Statements – Continued
August 31, 2019
Dynamic Managed Volatility Fund
| | |
| | | | | | | | | | | Gross Amounts Not Offset in | |
| | | | | | | | | | | | | | Statements of Assets and Liabilities | |
| | | | | | | | Gross | | | Net Amounts | | | | | | | | | | |
| | | | | | | | Amounts | | | of Assets | | | | | | | | | | |
| | | | | | | | Offset in | | | Presented | | | | | | | | | | |
| | | | | Gross | | | Statements of | | | in Statements | | | | | | Cash | | | | |
| | | | | Amounts | | | Assets and | | | of Assets and | | | Financial | | | Collateral | | | Net | |
| Assets: | | | Recognized | | | Liabilities | | | Liabilities | | | Instruments | | | Pledged | | | Amount | |
| Futures Contracts** | | | $ | 3,420 | | | $ | — | | | $ | 3,420 | | | $ | — | | | $ | — | | | $ | 3,420 | |
| Purchased Option Contracts | | | | 44,275 | | | | — | | | | 44,275 | | | | — | | | | — | | | | 44,275 | |
| | | | | $ | 47,695 | | | $ | — | | | $ | 47,695 | | | $ | — | | | $ | — | | | $ | 47,695 | |
| Liabilities: | | | | | | | | | | | | | | | | | | | | | | | | | |
| Written Option Contracts | | | $ | 1,925 | | | $ | — | | | $ | 1,925 | | | $ | — | | | $ | 1,925 | | | $ | — | |
| | | | | | | | | | | | | | |
| Managed Volatility Equity Fund | | | | | | | | | | | | | |
| | | | | | | | | | | | | | | | | | |
| | | | | | | | | | | | | | | | | Gross Amounts Not Offset in | |
| | | | | | | | | | | | | | | | | Statements of Assets and Liabilities | |
| | | | | | | | | Gross | | | Net Amounts | | | | | | | | | | | | | |
| | | | | | | | | Amounts | | | of Assets | | | | | | | | | | | | | |
| | | | | | | | | Offset in | | | Presented | | | | | | | | | | | | | |
| | | | | Gross | | | Statements of | | | in Statements | | | | | | | Cash | | | | | |
| | | | | Amounts | | | Assets and | | | of Assets and | | | Financial | | | Collateral | | | Net | |
| Assets: | | | Recognized | | | Liabilities | | | Liabilities | | | Instruments | | | Pledged | | | Amount | |
| Purchased Option Contracts | | | $ | 41,790 | | | $ | — | | | $ | 41,790 | | | $ | — | | | $ | — | | | $ | 41,790 | |
| Liabilities: | | | | | | | | | | | | | | | | | | | | | | | | | |
| Futures Contracts** | | | $ | 3,040 | | | $ | — | | | $ | 3,040 | | | $ | 3,040 | | | $ | — | | | $ | — | |
| Written Option Contracts | | | | 8,925 | | | | — | | | | 8,925 | | | | — | | | | 8,925 | | | | — | |
| | | | | $ | 11,965 | | | $ | — | | | $ | 11,965 | | | $ | 3,040 | | | $ | 8,925 | | | $ | — | |
| ** | Cumulative appreciation/depreciation on futures contracts is reported in the Schedules of Open Futures Contracts. Variation margin presented above is presented on the Statements of Assets and Liabilities. |
During the ordinary course of business, the Funds may enter into transactions subject to enforceable netting agreements or other similar arrangements (“netting agreements”). Generally, the right to offset in netting agreements allows the Funds to offset any exposure to a specific counterparty with any collateral received or delivered to that counterparty based on the terms of the agreement. Generally, each fund manages its cash collateral and securities collateral on a counterparty basis. As of August 31, 2019, the Funds did not enter into any netting agreements which would require any portfolio securities to be netted.
5. INVESTMENT ADVISORY FEE AND OTHER TRANSACTIONS WITH AFFILIATES
The Trust has an agreement with Securian Asset Management, Inc. (the “Adviser”) to furnish investment advisory services to the Funds. For its services, the Funds pay the Adviser a monthly management fee based upon the average daily net assets of the Funds at the following annual rates:
| Fund | | |
| Dynamic Managed Volatility Fund | 0.65% | |
| Managed Volatility Equity Fund | 0.65% | |
| Real Asset Income Fund | 0.75% | |
SECURIAN AM FUNDS
Notes to Financial Statements – Continued
August 31, 2019
The Funds’ Adviser has contractually agreed to waive a portion or all of its management fees and reimburse the Fund for its expenses to ensure that total annual operating expenses (excluding acquired fund fees and expenses, interest, taxes, brokerage commissions and extraordinary expenses) based upon the average daily net assets of the Funds do not exceed the following annual rates:
| Fund | | |
| Dynamic Managed Volatility Fund | 0.55% | |
| Managed Volatility Equity Fund | 0.55% | |
| Real Asset Income Fund | 0.75% | |
Fees waived and expenses reimbursed by the Adviser may be recouped by the Adviser for a period thirty-six months following the date on which such waiver or reimbursement was made if such recoupment can be achieved without exceeding the expense limit in effect at the time the waiver and reimbursement occurred. The Operating Expenses Limitation Agreement is intended to be continual in nature and cannot be terminated within a year after the effective date of the Funds’ prospectus. After that date, the agreement may be terminated at any time upon 60 days’ written notice by the Board or the Adviser, with the consent of the Board. During the year ended August 31, 2019, the Adviser did not recoup any previously waived fees. Waived fees and reimbursed expenses subject to potential recovery by month of expiration are as follows:
| | | September 2019- | | | September 2020- | | | September 2021- | |
| Fund | | August 2020 | | | August 2021 | | | August 2022 | |
| Dynamic Managed Volatility Fund | | $ | 261,877 | | | $ | 248,378 | | | $ | 252,224 | |
| Managed Volatility Equity Fund | | | 277,285 | | | | 243,024 | | | | 224,521 | |
| Real Asset Income Fund | | | 99,204 | | | | 189,095 | | | | 216,403 | |
U.S. Bancorp Fund Services, LLC, doing business as U.S. Bank Global Fund Services (“Fund Services” or the “Administrator”), acts as the Funds’ Administrator, Transfer Agent, and Fund Accountant. U.S. Bank N.A. (the “Custodian”) serves as the custodian to the Funds. The Custodian is an affiliate of the Administrator. The Administrator performs various administrative and accounting services for the Funds. The Administrator prepares various federal and state regulatory filings, reports and returns for the Funds; prepares reports and materials to be supplied to the Trustees; monitors the activities of the Funds’ custodian; coordinates the payment of the Funds’ expenses and reviews the Funds’ expense accruals. The officers of the Trust, including the Chief Compliance Officer, are employees of the Administrator. As compensation for its services, the Administrator is entitled to a monthly fee at an annual rate based upon the average daily net assets of the Funds, subject to annual minimums. Fees paid by the Funds for administration and accounting, transfer agency, custody and compliance services for the year ended August 31, 2019 are disclosed in the Statements of Operations.
Quasar Distributors, LLC (the “Distributor”) acts as the Funds’ principal underwriter in a continuous public offering of the Funds’ shares. The Distributor is an affiliate of the Administrator.
Minnesota Mutual Companies, Inc. (“Minnesota Life”) is the parent company of the Adviser. Minnesota Life performs sub-transfer agency services for the Dynamic Managed Volatility Fund and the Real Asset Income Fund. As compensation for its services, Minnesota Life is entitled to a monthly fee at an annual rate based upon the average value of the shareholder accounts it services. For the year ended August 31, 2019, the Dynamic Managed Volatility Fund and the Real Asset Income Fund paid $1,973 and $4,022, respectively, to Minnesota Life.
SECURIAN AM FUNDS
Notes to Financial Statements – Continued
August 31, 2019
6. CAPITAL SHARE TRANSACTIONS
Transactions in shares of the Funds were as follows:
| | | Dynamic Managed Volatility Fund | | | Managed Volatility Equity Fund | |
| | | Year Ended | | | Year Ended | | | Year Ended | | | Year Ended | |
| | | August 31, 2019 | | | August 31, 2018 | | | August 31, 2019 | | | August 31, 2018 | |
Class A(1): | | | | | | | | | | | | |
| Shares sold | | | — | | | | — | | | | — | | | | 18,878 | |
| Shares issued to holders in | | | | | | | | | | | | | | | | |
| reinvestment of dividends | | | — | | | | 106 | | | | — | | | | 691 | |
| Shares exchanged for | | | | | | | | | | | | | | | | |
| Institutional Class shares | | | — | | | | (23,012 | ) | | | — | | | | (275,746 | ) |
| Shares redeemed | | | — | | | | (5,217 | ) | | | — | | | | (26,546 | ) |
| Decrease in Class A | | | | | | | | | | | | | | | | |
| shares outstanding | | | — | | | | (28,123 | ) | | | — | | | | (282,723 | ) |
| Institutional Class: | | | | | | | | | | | | | | | | |
| Shares sold | | | 1,252,293 | | | | 103,233 | | | | 573,049 | | | | 578,052 | |
| Shares issued to holders in | | | | | | | | | | | | | | | | |
| reinvestment of dividends | | | 198,939 | | | | 208,458 | | | | 104,213 | | | | 45,941 | |
| Shares issued in exchange | | | | | | | | | | | | | | | | |
| for Class A shares | | | — | | | | 22,995 | | | | — | | | | 275,388 | |
| Shares redeemed | | | (33,629 | ) | | | (40,563 | ) | | | (516,529 | ) | | | (1,642,382 | ) |
| Increase (Decrease) in Institutional | | | | | | | | | | | | | | | | |
| Class shares outstanding | | | 1,417,603 | | | | 294,123 | | | | 160,733 | | | | (743,001 | ) |
| Net increase (decrease) | | | | | | | | | | | | | | | | |
| in shares outstanding | | | 1,417,603 | | | | 266,000 | | | | 160,733 | | | | (1,025,724 | ) |
| (1) | Class A shares converted to Institutional Class shares on December 26, 2017. |
| | | Real Asset Income Fund | |
| | | Year Ended | | | Year Ended | |
| | | August 31, 2019 | | | August 31, 2018 | |
Class A(1): | | | | | | |
| Shares sold | | | — | | | | 9,035 | |
| Shares issued to holders in reinvestment of dividends | | | — | | | | 83 | |
| Shares exchanged for Institutional Class shares | | | — | | | | (30,600 | ) |
| Shares redeemed | | | — | | | | (973 | ) |
| Decrease in Class A shares outstanding | | | — | | | | (22,455 | ) |
| Institutional Class: | | | | | | | | |
| Shares sold | | | 54,892 | | | | 89,357 | |
| Shares issued to holders in reinvestment of dividends | | | 167,640 | | | | 130,245 | |
| Shares issued in exchange for Class A shares | | | — | | | | 30,619 | |
| Shares redeemed | | | (156,612 | ) | | | (792,210 | ) |
| Increase (Decrease) in Institutional Class shares outstanding | | | 65,920 | | | | (541,989 | ) |
| Net increase (decrease) in shares outstanding | | | 65,920 | | | | (564,444 | ) |
| (1) | Class A shares converted to Institutional Class shares on December 26, 2017. |
SECURIAN AM FUNDS
Notes to Financial Statements – Continued
August 31, 2019
7. INVESTMENT TRANSACTIONS
The aggregate purchases and sales, excluding short-term investments, by the Funds for the year ended August 31, 2019, were as follows:
| | | U.S. Government Securities | | | Other | |
| | | Purchases | | | Sales | | | Purchases | | | Sales | |
| Dynamic Managed Volatility Fund | | $ | 4,980,290 | | | $ | — | | | $ | 6,143,959 | | | $ | 527,421 | |
| Managed Volatility Equity Fund | | | — | | | | — | | | | 2,740,577 | | | | 2,926,846 | |
| Real Asset Income Fund | | | — | | | | — | | | | 36,746,130 | | | | 36,130,149 | |
8. FEDERAL TAX INFORMATION
The aggregate gross unrealized appreciation and depreciation of securities held by the Funds and the total cost of securities for federal income tax purposes at August 31, 2019, the Funds’ most recently completed fiscal year end, were as follows:
| | | Aggregate | | | Aggregate | | | | | | Federal | |
| | | Gross | | | Gross | | | Net | | | Income | |
| Fund | | Appreciation | | | Depreciation | | | Appreciation | | | Tax Cost | |
| Dynamic Managed Volatility Fund | | $ | 8,067,806 | | | $ | (30,085 | ) | | $ | 8,037,721 | | | $ | 50,375,523 | |
| Managed Volatility Equity Fund | | | 7,818,060 | | | | (54,962 | ) | | | 7,763,098 | | | | 31,988,841 | |
| Real Asset Income Fund | | | 12,856,575 | | | | (2,181,046 | ) | | | 10,675,529 | | | | 72,812,892 | |
The difference between book basis and tax-basis unrealized appreciation is attributable primarily to derivatives for the Dynamic Managed Volatility Fund and Managed Volatility Equity Fund.
The difference between book-basis and tax-basis unrealized appreciation is attributable primarily to the tax deferral of wash sale losses and tax partnership basis adjustments outstanding for the Real Asset Income Fund.
At August 31, 2019, the most recently completed fiscal year end, components of distributable earnings (accumulated loss) on a tax-basis were as follows:
| | | Undistributed | | | Undistributed | | | Other | | | | | | Total | |
| | | Ordinary | | | Long-Term | | | Accumulated | | | Unrealized | | | Distributable | |
| Fund | | Income | | | Capital Gains | | | Losses | | | Appreciation | | | Earnings | |
| Dynamic Managed Volatility Fund | | $ | 658,732 | | | $ | 103,545 | | | $ | — | | | $ | 8,037,721 | | | $ | 8,799,998 | |
| Managed Volatility Equity Fund | | | 299,631 | | | | — | | | | (752,109 | ) | | | 7,763,098 | | | | 7,310,620 | |
| Real Asset Income Fund | | | 606,988 | | | | 697,219 | | | | (1,395,235 | ) | | | 10,675,529 | | | | 10,584,501 | |
As of August 31, 2019, the Managed Volatility Equity Fund had short-term capital loss carryovers of $255,011 and long-term capital loss carryovers of $497,098, which will be permitted to be carried over for an unlimited period. A regulated investment company may elect for any taxable year to treat any portion of any qualified late year loss as arising on the first day of the next taxable year. Qualified late year losses are certain capital, and ordinary losses which occur during the portion of the Funds’ taxable year subsequent to October 31 and December 31, 2018, respectively. For the taxable year ended August 31, 2019, the Funds did not defer any qualified late year losses.
SECURIAN AM FUNDS
Notes to Financial Statements – Continued
August 31, 2019
For the year ended August 31, 2019, the Funds paid the following distributions to shareholders:
| | | Ordinary | | | Long Term | | | | |
| Fund | | Income* | | | Capital Gains** | | | Total | |
| Dynamic Managed Volatility Fund | | $ | 1,279,453 | | | $ | 1,073,167 | | | $ | 2,352,620 | |
| Managed Volatility Equity Fund | | | 794,778 | | | | 524,787 | | | | 1,319,565 | |
| Real Asset Income Fund | | | 2,615,620 | | | | 612,824 | | | | 3,228,444 | |
For the year ended August 31, 2018, the Funds paid the following distributions to shareholders:
| | | Ordinary | | | Long Term | | | | |
| Fund | | Income* | | | Capital Gains** | | | Total | |
| Dynamic Managed Volatility Fund | | $ | 1,385,141 | | | $ | 1,149,847 | | | $ | 2,534,988 | |
| Managed Volatility Equity Fund | | | 586,865 | | | | — | | | | 586,865 | |
| Real Asset Income Fund | | | 1,800,296 | | | | 807,827 | | | | 2,608,123 | |
| * | | For federal income tax purposes, distributions of short-term capital gains are treated as ordinary income distributions. |
| ** | | The Funds designate long term capital gain dividends pursuant to Sec. 852(b)(3)(C). |
9. CONTROL OWNERSHIP
The beneficial ownership, either directly or indirectly, of more than 25% of the voting securities of a fund creates a presumption of control of the fund, under Section 2(a)(9) of the Investment Company Act of 1940. As of August 31, 2019, each Fund’s percentage of control ownership positions greater than 25% are as follows:
| Fund | Shareholder | Percent of Shares Held |
| Dynamic Managed Volatility Fund | Minnesota Life Insurance Company | 66.7% |
| Managed Volatility Equity Fund | Pershing LLC | 76.2% |
| Real Asset Income Fund | Minnesota Life Insurance Company | 35.6% |
| Real Asset Income Fund | Comerica Bank (FBO) | 28.1% |
10. SUBSEQUENT EVENTS
On September 27, 2019, the Dynamic Managed Volatility Fund paid an income distribution in the amount of $283,126 or $0.0600 per share.
On September 27, 2019, the Managed Volatility Equity Fund paid an income distribution in the amount of $97,576 or $0.0300 per share.
On September 27, 2019, the Real Asset Income Fund paid an income distribution in the amount of $469,492 or $0.0650 per share.
Management has performed an evaluation of subsequent events through the date the financial statements were issued and has determined that no additional items require recognition or disclosure.
SECURIAN AM FUNDS
Report of Independent Registered Public Accounting Firm
To the Shareholders of Securian AM Funds and
Board of Trustees of Managed Portfolio Series
Opinion on the Financial Statements
We have audited the accompanying statements of assets and liabilities, including the schedules of investments, open futures contracts, and written options, of Securian AM Dynamic Managed Volatility Fund, Securian AM Managed Volatility Equity Fund, and Securian AM Real Asset Income Fund (“Securian AM Funds” or the “Funds”), each a series of Managed Portfolio Series, as of August 31, 2019, and the related statements of operations for the year then ended, the statements of changes in net assets for each of the two years in the period then ended, including the related notes, and the financial highlights for each of the four periods in the period then ended for Securian AM Dynamic Managed Volatility Fund and Securian AM Managed Volatility Equity Fund, and for each of the five years in the period then ended for Securian AM Real Asset Income Fund (collectively referred to as the “financial statements”). In our opinion, the financial statements present fairly, in all material respects, the financial position of each of the Funds as of August 31, 2019, the results of their operations for the year then ended, the changes in their net assets for each of the two years in the period then ended, and the financial highlights for each of the periods indicated, in conformity with accounting principles generally accepted in the United States of America.
Basis for Opinion
These financial statements are the responsibility of the Funds’ management. Our responsibility is to express an opinion on the Funds’ financial statements based on our audits. We are a public accounting firm registered with the Public Company Accounting Oversight Board (United States) (“PCAOB”) and are required to be independent with respect to the Funds in accordance with the U.S. federal securities laws and the applicable rules and regulations of the Securities and Exchange Commission and the PCAOB.
We conducted our audits in accordance with the standards of the PCAOB. Those standards require that we plan and perform the audit to obtain reasonable assurance about whether the financial statements are free of material misstatement, whether due to error or fraud.
Our audits included performing procedures to assess the risks of material misstatement of the financial statements, whether due to error or fraud, and performing procedures that respond to those risks. Such procedures included examining, on a test basis, evidence regarding the amounts and disclosures in the financial statements. Our procedures included confirmation of securities owned as of August 31, 2019, by correspondence with the custodian and brokers. Our audits also included evaluating the accounting principles used and significant estimates made by management, as well as evaluating the overall presentation of the financial statements. We believe that our audits provide a reasonable basis for our opinion.
We have served as the Funds’ auditor since 2015.
COHEN & COMPANY, LTD.
Milwaukee, WI
October 29, 2019
SECURIAN AM FUNDS
Additional Information (Unaudited)
August 31, 2019
Trustees and Officers
| | | | Number of | | |
| | | Term of | Portfolios | Principal | Other Directorships |
| | Position(s) | Office and | in Trust | Occupation(s) | Held by Trustee |
| Name, Address | Held with | Length of | Overseen | During the | During the |
| and Year of Birth | the Trust | Time Served | by Trustee | Past Five Years | Past Five Years |
| Independent Trustees | | | | | |
| Leonard M. Rush, CPA | Lead | Indefinite | 37 | Retired, Chief Financial | Independent Trustee, |
| 615 E. Michigan St. | Independent | Term; Since | | Officer, Robert W. Baird | ETF Series Solutions |
| Milwaukee, WI 53202 | Trustee | April 2011 | | & Co. Incorporated | (49 Portfolios) |
| Year of Birth: 1946 | and Audit | | | (2000-2011). | (2012-Present); |
| | Committee | | | | Director, Anchor |
| | Chairman | | | | Bancorp Wisconsin, |
| | | | | | Inc. (2011-2013). |
| David A. Massart | Trustee | Indefinite | 37 | Co-Founder and Chief | Independent Trustee, |
| 615 E. Michigan St. | and | Term; Since | | Investment Strategist, | ETF Series Solutions |
| Milwaukee, WI 53202 | Valuation | April 2011 | | Next Generation Wealth | (49 Portfolios) |
| Year of Birth: 1967 | Committee | | | Management, Inc. | (2012-Present). |
| | Chairman | | | (2005-Present). | |
| David M. Swanson | Trustee | Indefinite | 37 | Founder and Managing | Independent Trustee, |
| 615 E. Michigan St. | | Term; Since | | Principal, SwanDog | ALPS Variable |
| Milwaukee, WI 53202 | | April 2011 | | Strategic Marketing, LLC | Investment Trust |
| Year of Birth: 1957 | | | | (2006-Present). | (10 Portfolios) |
| | | | | | (2006-Present); |
| | | | | | Independent Trustee, |
| | | | | | RiverNorth |
| | | | | | Opportunities |
| | | | | | Closed-End Fund |
| | | | | | (2015-Present). |
| Interested Trustee | | | | | |
| Robert J. Kern* | Chairman, | Indefinite | 37 | Retired, Executive Vice | None |
| 615 E. Michigan St. | and | Term; Since | | President, U.S. Bancorp | |
| Milwaukee, WI 53202 | Trustee | January 2011 | | Fund Services, LLC | |
| Year of Birth: 1958 | | | | (1994-2018). | |
| Officers | | | | | |
| Brian R. Wiedmeyer | President | Indefinite | N/A | Vice President, U.S. | N/A |
| 615 E. Michigan St. | and | Term; Since | | Bancorp Fund Services, | |
| Milwaukee, WI 53202 | Principal | November 2018 | | LLC (2005-Present). | |
| Year of Birth: 1973 | Executive | | | | |
| | Officer | | | | |
| * | Mr. Kern is an “interested person” of the Trust as defined by the 1940 Act by virtue of the fact that he was a board member of the Fund’s principal underwriter, Quasar Distributors, LLC. |
SECURIAN AM FUNDS
Additional Information (Unaudited) – Continued
August 31, 2019
| | | | Number of | | |
| | | Term of | Portfolios | Principal | Other Directorships |
| | Position(s) | Office and | in Trust | Occupation(s) | Held by Trustee |
| Name, Address | Held with | Length of | Overseen | During the | During the |
| and Year of Birth | the Trust | Time Served | by Trustee | Past Five Years | Past Five Years |
| Deborah Ward | Vice | Indefinite | N/A | Senior Vice President, | N/A |
| 615 E. Michigan St. | President, | Term; Since | | U.S. Bancorp Fund Services, | |
| Milwaukee, WI 53202 | Chief | April 2013 | | LLC (2004-Present). | |
| Year of Birth: 1966 | Compliance | | | | |
| | Officer and | | | | |
| | Anti-Money | | | | |
| | Laundering | | | | |
| | Officer | | | | |
| Benjamin Eirich | Vice | Indefinite | N/A | Assistant Vice President, | N/A |
| 615 E. Michigan St. | President, | Term; Since | | U.S. Bancorp Fund Services, | |
| Milwaukee, WI 53202 | Treasurer, | August 2019 | | LLC (2008-Present). | |
| Year of Birth: 1981 | and | (Treasurer); | | | |
| | Principal | Since | | | |
| | Financial | November 2018 | | | |
| | Officer | (Vice President) | | | |
| Thomas A. Bausch, Esq. | Secretary | Indefinite | N/A | Vice President, | N/A |
| 615 E. Michigan St. | | Term; Since | | U.S. Bancorp Fund Services, | |
| Milwaukee, WI 53202 | | November 2017 | | LLC (2016-Present); Associate, | |
| Year of Birth: 1979 | | | | Godfrey & Kahn S.C. | |
| | | | | (2012-2016). | |
| Douglas Schafer | Vice | Indefinite | N/A | Assistant Vice President, | N/A |
| 615 E. Michigan St. | President | Term; Since | | U.S. Bancorp Fund Services, | |
| Milwaukee, WI 53202 | and | May 2016 | | LLC (2002-Present). | |
| Year of Birth: 1970 | Assistant | (Assistant | | | |
| | Treasurer | Treasurer); | | | |
| | | Since | | | |
| | | November 2018 | | | |
| | | (Vice President) | | | |
| Michael Cyr II | Vice | Indefinite | N/A | Officer, U.S. Bancorp Fund | N/A |
| 615 E. Michigan St. | President | Term; Since | | Services, LLC | |
| Milwaukee, WI 53202 | and | August 2019 | | (2013-Present). | |
| Year of Birth: 1992 | Assistant | | | | |
| | Treasurer | | | | |
SECURIAN AM FUNDS
Additional Information (Unaudited) – Continued
August 31, 2019
AVAILABILITY OF FUND PORTFOLIO INFORMATION
The Funds file complete schedules of portfolio holdings with the SEC for the first and third quarters of each fiscal year on Form N-Q, which is available on the SEC’s website at www.sec.gov. The Funds’ Form N-Q may be reviewed and copied at the SEC’s Public Reference Room in Washington, D.C. For information on the Public Reference Room call 1-800-SEC-0330. In addition, the Funds’ Form N-Q is available without charge upon request by calling 1-888-964-0788.
AVAILABILITY OF PROXY VOTING INFORMATION
A description of the Funds’ Proxy Voting Policies and Procedures is available without charge, upon request, by calling 1-888-964-0788. Information regarding how the Funds voted proxies relating to portfolio securities during the most recent 12 month year ended June 30, is available (1) without charge, upon request, by calling 1-888-964-0788, or (2) on the SEC’s website at www.sec.gov.
QUALIFIED DIVIDEND INCOME/DIVIDENDS RECEIVED DEDUCTION
For the fiscal year ended August 31, 2019, certain dividends paid by the Funds may be reported as qualified dividend income and may be eligible for taxation at capital gain rates. The percentage of dividends declared from ordinary income designated as qualified dividend income was 25.66%, 91.55%, and 22.07% for the Dynamic Managed Volatility Fund, Managed Volatility Equity Fund, and Real Asset Income Fund, respectively.
For corporate shareholders, the percent of ordinary income distributions qualifying for the corporate dividends received deduction for the fiscal year ended August 31, 2019 was 23.77%, 54.46%, and 19.96% for the Dynamic Managed Volatility Fund, Managed Volatility Equity Fund, and Real Asset Income Fund, respectively.
The percentage of taxable ordinary income distributions that are designated as short-term capital gain distributions under Internal Revenue Section 871(k)(2)(C) was 42.66%, 23.16% and 12.05% for the Dynamic Managed Volatility Fund, Managed Volatility Fund and Real Asset Income Fund, respectively.
SECURIAN AM FUNDS
Privacy Notice
The Funds collect only relevant information about you that the law allows or requires it to have in order to conduct its business and properly service you. The Funds collect financial and personal information about you (“Personal Information”) directly (e.g., information on account applications and other forms, such as your name, address, and social security number, and information provided to access account information or conduct account transactions online, such as password, account number, e-mail address, and alternate telephone number), and indirectly (e.g., information about your transactions with us, such as transaction amounts, account balance and account holdings).
The Funds do not disclose any non-public personal information about its shareholders or former shareholders other than for everyday business purposes such as to process a transaction, service an account, respond to court orders and legal investigations or as otherwise permitted by law. Third parties that may receive this information include companies that provide transfer agency, technology and administrative services to the Funds, as well as the Funds’ investment adviser who is an affiliate of the Funds. If you maintain a retirement/educational custodial account directly with the Funds, we may also disclose your Personal Information to the custodian for that account for shareholder servicing purposes. The Funds limit access to your Personal Information provided to unaffiliated third parties to information necessary to carry out their assigned responsibilities to the Funds. All shareholder records will be disposed of in accordance with applicable law. The Funds maintain physical, electronic and procedural safeguards to protect your Personal Information and requires its third party service providers with access to such information to treat your Personal Information with the same high degree of confidentiality.
In the event that you hold shares of the Funds through a financial intermediary, including, but not limited to, a broker-dealer, credit union, bank or trust company, the privacy policy of your financial intermediary governs how your non-public personal information is shared with unaffiliated third parties.
INVESTMENT ADVISER
Securian Asset Management, Inc.
400 Robert St. North
St. Paul, MN 55101-2098
DISTRIBUTOR
Quasar Distributors, LLC
777 East Wisconsin Avenue
Milwaukee, WI 53202
CUSTODIAN
U.S. Bank, N.A.
1555 North Rivercenter Drive
Milwaukee, WI 53212
ADMINISTRATOR, FUND ACCOUNTANT
AND TRANSFER AGENT
U.S. Bancorp Fund Services, LLC
615 East Michigan Street
Milwaukee, WI 53202
INDEPENDENT REGISTERED PUBLIC ACCOUNTING FIRM
Cohen & Company, Ltd.
342 North Water Street, Suite 830
Milwaukee, WI 53202
LEGAL COUNSEL
Stradley Ronon Stevens & Young LLP
2005 Market Street, Suite 2600
Philadelphia, PA 19103
This report should be accompanied or preceded by a prospectus.
The Funds’ Statement of Additional Information contains additional information about the Funds’ trustees and is available without charge upon request by calling 1-888-964-0788.
Item 2. Code of Ethics.
The registrant has adopted a code of ethics that applies to the registrant’s principal executive officer and principal financial officer. The registrant has not made any substantive amendments to its code of ethics during the period covered by this period.
The registrant has not granted any waivers from any provisions of the code of ethics during the period covered by this report.
A copy of the registrant’s code of ethics that applies to the registrant’s principal executive officer and principal financial officer is filed herewith.
Item 3. Audit Committee Financial Expert.
The registrant’s Board of Trustees has determined that there is at least one audit committee financial expert serving on its audit committee. Leonard M. Rush is the “audit committee financial expert” and is considered to be “independent” as each term is defined in Item 3 of Form N-CSR.
Item 4. Principal Accountant Fees and Services.
The registrant has engaged its principal accountant to perform audit services, audit-related services, tax services and other services during the past fiscal year. “Audit services” refer to performing an audit of the registrant's annual financial statements or services that are normally provided by the accountant in connection with statutory and regulatory filings or engagements for the past fiscal year. “Audit-related services” refer to the assurance and related services by the principal accountant that are reasonably related to the performance of the audit. “Tax services” refer to professional services rendered by the principal accountant for tax compliance, tax advice, and tax planning; including reviewing the Fund’s tax returns and distribution calculations. There were no “other services” provided by the principal accountant. For the fiscal years ended August 31, 2019 and August 31, 2018, the Fund’s principal accountant was Cohen & Company. The following table details the aggregate fees billed or expected to be billed for each of the last fiscal years for audit fees, audit-related fees, tax fees and other fees by the principal accountant.
| | FYE 8/31/2019 | FYE 8/31/2018 |
Audit Fees | $45,500 | $44,000 |
Audit-Related Fees | $0 | $0 |
Tax Fees | $14,500 | $10,000 |
All Other Fees | $0 | $0 |
The audit committee has adopted pre-approval policies and procedures that require the audit committee to pre‑approve all audit and non‑audit services of the registrant, including services provided to any entity affiliated with the registrant.
The percentage of fees billed by Cohen & Company applicable to non-audit services pursuant to waiver of pre-approval requirement was as follows:
| | FYE 8/31/2019 | FYE 8/31/2018 |
Audit-Related Fees | 0% | 0% |
Tax Fees | 0% | 0% |
All Other Fees | 0% | 0% |
All of the principal accountant’s hours spent on auditing the registrant’s financial statements were attributed to work performed by full‑time permanent employees of the principal accountant.
The following table indicates the non-audit fees billed or expected to be billed by the registrant’s accountant for services to the registrant and to the registrant’s investment adviser (and any other controlling entity, etc.—not sub-adviser) for the last two years. The audit committee of the board of trustees/directors has considered whether the provision of non-audit services that were rendered to the registrant's investment adviser is compatible with maintaining the principal accountant's independence and has concluded that the provision of such non-audit services by the accountant has not compromised the accountant’s independence.
Non-Audit Related Fees | FYE 8/31/2019 | FYE 8/31/2018 |
Registrant | $0 | $0 |
Registrant’s Investment Adviser | $0 | $0 |
Item 5. Audit Committee of Listed Registrants.
Not applicable to registrants who are not listed issuers (as defined in Rule 10A-3 under the Securities Exchange Act of 1934).
Item 6. Investments.
(a) Schedule of Investments is included as part of the report to shareholders filed under Item 1 of this Form.
(b) Not applicable.
Item 7. Disclosure of Proxy Voting Policies and Procedures for Closed-End Management Investment Companies.
Not applicable to open-end investment companies.
Item 8. Portfolio Managers of Closed-End Management Investment Companies.
Not applicable to open-end investment companies.
Item 9. Purchases of Equity Securities by Closed‑End Management Investment Company and Affiliated Purchasers.
Not applicable to open-end investment companies.
Item 10. Submission of Matters to a Vote of Security Holders.
There have been no material changes to the procedures by which shareholders may recommend nominees to the Registrant’s Board of Trustees.
Item 11. Controls and Procedures.
(a) | The Registrant’s President and Treasurer have reviewed the Registrant's disclosure controls and procedures (as defined in Rule 30a-3(c) under the Investment Company Act of 1940 (the “Act”)) as of a date within 90 days of the filing of this report, as required by Rule 30a-3(b) under the Act and Rules 13a-15(b) or 15d‑15(b) under the Securities Exchange Act of 1934. Based on their review, such officers have concluded that the disclosure controls and procedures are effective in ensuring that information required to be disclosed in this report is appropriately recorded, processed, summarized and reported and made known to them by others within the Registrant and by the Registrant’s service provider. |
(b) | There were no significant changes in the Registrant's internal control over financial reporting (as defined in Rule 30a-3(d) under the Act) that occurred during the second fiscal quarter of the period covered by this report that has materially affected, or is reasonably likely to materially affect, the Registrant's internal control over financial reporting. |
Item 12. Disclosure of Securities Lending Activities for Closed-End Management Investment Companies.
Not applicable to open-end investment companies.
Item 13. Exhibits.
(a) | (1) Any code of ethics or amendment thereto, that is subject of the disclosure required by Item 2, to the extent that the registrant intends to satisfy Item 2 requirements through filing an exhibit. 1) Filed herewith |
(2) Certifications pursuant to Section 302 of the Sarbanes-Oxley Act of 2002. Filed herewith.
(3) Any written solicitation to purchase securities under Rule 23c‑1 under the Act sent or given during the period covered by the report by or on behalf of the registrant to 10 or more persons. Not applicable to open-end investment companies.
(4) Change in the registrant’s independent public accountant. There was no change in the registrant’s independent public accountant for the period covered by this report.
| (b) | Certification pursuant to Section 906 of the Sarbanes‑Oxley Act of 2002. Furnished herewith. |
SIGNATURES
Pursuant to the requirements of the Securities Exchange Act of 1934 and the Investment Company Act of 1940, the registrant has duly caused this report to be signed on its behalf by the undersigned, thereunto duly authorized.
(Registrant) Managed Portfolio Series
By (Signature and Title)* /s/Brian R. Wiedmeyer
Brian R. Wiedmeyer, President
Date November 7, 2019
Pursuant to the requirements of the Securities Exchange Act of 1934 and the Investment Company Act of 1940, this report has been signed below by the following persons on behalf of the registrant and in the capacities and on the dates indicated.
By (Signature and Title)* /s/Brian R. Wiedmeyer
Brian R. Wiedmeyer, President
Date November 7, 2019
By (Signature and Title)* /s/Benjamin J. Eirich
Benjamin J. Eirich, Treasurer
Date November 7, 2019
* Print the name and title of each signing officer under his or her signature.