Olstein
All Cap Value Fund
Olstein
Strategic Opportunities Fund
ANNUAL REPORT
JUNE 30, 2020
Beginning on January 1, 2021, as permitted by regulations adopted by the SEC, paper copies of the Funds’ shareholder reports will no longer be sent by mail, unless you specifically request paper copies of the reports from the Funds (defined herein) or from your financial intermediary, such as a broker-dealer or bank. Instead, the reports will be made available on the Funds’ website (www.olsteinfunds.com), and you will be notified by mail each time a report is posted and provided with a website link to access the report.
If you already elected to receive shareholder reports electronically, you will not be affected by this change and you need not take any action. You may elect to receive shareholder reports and other communications from the Funds by contacting your financial intermediary (such as a broker-dealer or bank) or, if you are a direct investor, by calling 800-799-2113 or by sending an e-mail request to info@olsteinfunds.com.
You may elect to receive all future reports in paper free of charge. If you invest through a financial intermediary, you can contact your financial intermediary to request that you continue to receive paper copies of your shareholder reports. If you invest directly with the Funds, you can call 800-799-2113 or send an e-mail request to info@olsteinfunds.com to let the Funds know you wish to continue receiving paper copies of your shareholder reports. Your election to receive reports in paper will apply to all funds held in your account if you invest through your financial intermediary.
The Olstein Funds
CONTENTS
| | 3 | | Letters to Shareholders |
| | | | |
| | | | |
| | 19 | | Value of $10,000 Investment |
| | | | |
| | | | |
| | 25 | | Expense Examples |
| | | | |
| | | | |
| | 28 | | Schedules of Investments |
| | | | |
| | | | |
| | 38 | | Statements of Assets |
| | | | and Liabilities |
| | | | |
| | | | |
| | 40 | | Statements of Operations |
| | | | |
| | | | |
| | 42 | | Statements of Changes |
| | | | in Net Assets |
| | | | |
| | | | |
| | 46 | | Financial Highlights |
| | | | |
| | | | |
| | 52 | | Notes to Financial Statements |
| | | | |
| | | | |
| | 64 | | Report of Independent |
| | | | Registered Public Accounting Firm |
| | | | |
| | | | |
| | 65 | | Additional Information |
OLSTEIN ALL CAP VALUE FUND
Letter to Shareholders
DEAR FELLOW SHAREHOLDERS:
For the quarter ended June 30, 2020, Adviser Class shares of the Fund appreciated 22.42%; Class A shares appreciated 22.29% and Class C shares appreciated 22.08%. The Fund’s primary benchmark, the Russell 3000® Value Index, appreciated 14.55% and the Fund’s secondary benchmark, Russell 3000® Index appreciated 22.03% during the second quarter of 2020. For the fiscal year ended June 30, 2020, Adviser Class shares of the Olstein All Cap Value Fund depreciated 8.27%, Class A shares of the Fund depreciated 8.54% and Class C shares of the Fund depreciated 9.21%. During the same twelve-month period, the Russell 3000® Value Index depreciated 9.42% and the Russell 3000® Index appreciated 6.53%.1
MARKET OUTLOOK
Turmoil characterized equity markets during the first half of 2020 (the second half of the Fund’s fiscal year), as the longest running bull market in U.S. history ended abruptly due to the rapid spread of the COVID-19 virus. Over the course of the Fund’s fiscal year, from July 1, 2019 through June 30, 2020, U.S. equity markets experienced a wild ride that culminated with major equity indices reaching all-time highs in February 2020, followed by one of the steepest declines in market history during the month of March 2020. As the economic toll of government-imposed lockdowns to contain the spread of the virus became more apparent, equity markets experienced
1 | The performance data quoted represents past performance and does not guarantee future results. The Olstein All Cap Value Fund’s Class C average annual return for the one-year, five-year, and ten-year periods ended 6/30/20, assuming reinvestment of dividends and capital gain distributions and deduction of the Olstein All Cap Value Fund’s maximum CDSC of 1% during the one-year period, was -10.09%, 1.86%, and 8.75%, respectively. Per the Fund’s prospectus dated 10/28/19, the expense ratio for the Olstein All Cap Value Fund Class C was 2.19%. Performance and expense ratios for other share classes will vary due to differences in sales charge structure and class expenses. The investment return and principal value of an investment will fluctuate so that an investor’s shares, when redeemed, may be worth more or less than their original cost. Current performance may be lower or higher than performance quoted. To obtain performance data current to the most recent month end, please go to our website at www.olsteinfunds.com. |
| OLSTEIN ALL CAP VALUE FUND |
“waterfall” type declines. What startled equity investors the most was the swiftness of the market’s sharp decline. Twenty-three trading days after closing at its all-time high on February 19, 2020, the broad-market benchmark S&P 500 Index fell 34% to its 2020 low on March 23, 2020. Since then, equity markets continued their wild volatility as the S&P 500® Index then bounced back dramatically, rising 39% off its March 23, 2020 low through the close of the Fund’s fiscal year on June 30, 2020.
Fueling the rally in equity prices off the market’s March 23rd low, was the extraordinary speed and scope of lending programs provided by the Federal Reserve to support state and local governments as well as small and medium-sized businesses, in combination with a $2.2 trillion economic relief package from the federal government to assist American workers and families. While this unparalleled fiscal and monetary intervention reduced some of the uncertainty clouding companies’ near-term prospects and has temporarily lessened investors’ fears, the principal cause of uncertainty, the COVID-19 pandemic, remains unresolved as infections continue to increase. The widening crisis, marked by a sharp contraction of global supply and demand due to an unprecedented shutdown of most economic activity, has raised fears of a severe, and possibly prolonged, economic downturn.
While fears of a prolonged downturn have prevented equity markets from settling down long enough to establish a consistent, long-term perspective, we believe it is important to maintain a mindset that looks beyond the ups and downs of the daily market moves based on COVID-19 statistics no matter how difficult. Our strategy is based on the belief that the market will eventually recognize and reprice good companies selling at material discounts to our calculation of their private market values as the current turmoil and pessimism hopefully begin to lift. We believe that eventually this too shall pass, and markets should favor companies that generate free cash flow. During the remainder of 2020, as local, state and federal government intervention works to flatten the pandemic curve, and as the extraordinary $2.2 trillion stimulus relief package begins to reinvigorate economic activity through increased spending and employment, we believe that business, consumer and investor sentiment should find a surer footing, and result in money flowing into companies with strong fundamentals and are selling at material discounts to private market value. We have been purchasing companies that are still generating excess cash flow and practicing sound capital management throughout the crisis that have experienced market price declines under the assumption that the pandemic will last forever. The word “forever” is one of the most overused words in the investing world but is a key factor influencing the creation of undervalued and/or overvalued securities. In the current environment, we are finding it easier to identify companies selling at material discounts to our calculation of
| OLSTEIN ALL CAP VALUE FUND |
private market value, which we believe are based on short term thinking and a have little to do with long-term fundamentals based on our assessment of a companies normalized ability to generate free cash flow. Pessimism is a value investor’s ally because of the bargain prices that can be produced, especially in companies with strong long-term fundamentals and strong balance sheets.
OUR STRATEGY
The sharp swing in market sentiment and price volatility from February 19, 2020 to the end of the Fund’s fiscal year, highlights a key tenet of our value approach to equity investing. When we see a growing disconnect between stock prices and our calculation of the intrinsic value of individual businesses, and when negative sentiment overwhelms equity markets as it did during the sharp market decline from mid-February to mid-March of this year, selectivity and highly focused company-specific analysis become critical factors for long-term investment success. The most important metric we use to calculate intrinsic value is our assessment of a company’s ability to generate and/or grow future free cash flow. To estimate future free cash flow, we utilize a proprietary inferential look behind the numbers of a company’s financial statements. Our forensic analysis of financial statements seeks to identify early signs that could be indicative that a company’s ability to generate future free cash flow is not being properly valued by the public markets. We believe our accounting-based “look behind the numbers” investment discipline provides us with an advantage in valuing a company, especially during periods of investor pessimism or euphoria. Over the last ten years, index and momentum investing have been replacing active value investing, creating discounts and underperformance in value-type investment strategies. We believe that the use of forensic accounting techniques to adjust reported earnings to determine a company’s ability to generate normalized free cash flow in order to correctly value a company has virtually disappeared, replaced by short-term price targets based on whether or not a company beats or misses an analyst’s quarterly estimate by a few cents a share.
We never stand still and are always aware of economic and psychological factors affecting overall investment perceptions, and this was especially true with the onset of the COVID-19 pandemic. As we have done in the past, we re-examined every portfolio holding to retest our investment thesis under the new and challenging environment. We eliminated the stocks of companies that we believed did not offer an optimal risk-reward tradeoff; whose upside potential was severely compromised by the shutdown of economic activity due to the pandemic, or whose business models were likely to suffer long-term impairment in a post-COVID environment. We initiated positions or increased holdings in companies that we believed were automatically, yet unfairly, penalized by the market in reaction to current
| OLSTEIN ALL CAP VALUE FUND |
economic conditions, but, in our opinion, had unique business models, strong balance sheets, and the ability to withstand a recession and were selling at a material discount to our determination of private market value.
We will continue to focus on those companies selling at a discount to intrinsic value that we believe demonstrate a commitment to maintaining a strong financial position; have the ability to ride out periods of prolonged economic distress and are led by management teams that intelligently manage debt, and deploy cash to increase returns to shareholders. Value investors usually underperform as they begin purchasing securities whose prices have been unfairly punished because of either short-term fundamental issues or overall market pessimism. Stocks experiencing what we believe are short-term issues that are perceived to be permanent can, as a result, underperform and sell at price discounts. Over the last several years, investor impatience in value-type stocks has been tested as investors liquidated these securities to buy a handful of large cap high growth oriented names (such as the so called “FANG” stocks) selling at higher and higher multiples which dominated the headlines and were responsible for a material amount of the five year gains in the market averages (as measured by the S&P 500® Index).
Further compounding investor impatience with the value-oriented underperformance stocks selling at what we believe are material discounts to their private market values was the unexpected COVID-19 pandemic which started in early 2020. The panic resulted in unique outstanding businesses being dumped indiscriminately at ridiculous prices under the assumption that all companies will be affected the same amount over the long-term as if the pandemic would be permanent. It is during periods such as the last five years that investor patience has been challenged waiting for undervalued securities in more mature industries to be priced correctly as large-cap high growth investors outperformed riding the momentum in the high multiple oriented names.
Undifferentiated investor pessimism applied to companies which are free cash flow generating and unique, great businesses but are currently experiencing short-term problems can be a tremendous opportunity for a value investor. Despite underperformance by value investors in the recent past, we believe the current market is showing signs of beginning to recognize the outstanding values available in non-”FANG” stocks that have been beaten down by short-term perceptions. The past five years has created values and discounts in non-”FANG” stocks that we believe investors are finding too inviting to pass up. Most investors have expectations of immediate gratification similar to a lottery win. Patience is a value investor’s best friend. Businesses usually do not change values as quick as their stock prices do. A value investor’s timing is based on paying the right price that results in a favorable long-term risk/reward ratio. The favorable risk/reward ratio is created by investing in a company at a material discount to a
| OLSTEIN ALL CAP VALUE FUND |
company’s ability to generate normalized future excess cash flow. We believe the current pessimistic environment has created a plethora of companies selling at prices which we believe represent material discounts in good companies generating continued excess cash flow, having outstanding balance sheets and management teams who emphasize returns on investments and increasing shareholder value. Investing in companies with the aforementioned qualities can be worth the wait, despite the possibility of short-term underperformance. We believe paying the right price is a key factor to long-term performance. The three most important factors we consider before adding a company to our portfolio under our value discipline are “price”, “price”, “price”. Remaining true to our investment discipline, we intend to seize on market dips as buying opportunities to either strategically add to existing positions in the portfolio or initiate new positions in companies that we believe possess unique business models, strong balance sheets, and selling at a discount to our calculations of private market value.
PORTFOLIO REVIEW
At June 30, 2020, the Olstein All Cap Value Fund portfolio consisted of 88 holdings with an average weighted market capitalization of $131.89 billion. During the fiscal year, the Fund initiated positions in eleven companies and eliminated its holdings in seventeen companies. Of particular note, we added high-quality businesses to the Fund’s portfolio, including Accenture PLC, Automatic Data Processing, Inc, Berkshire Hathaway, Inc., Facebook, Inc., and Johnson & Johnson, while eliminating those companies whose businesses were either severely compromised by the economic shutdown or are likely to suffer long-term consequences of the pandemic, which include companies such as Norwegian Cruise Line Holdings Ltd. and Spirit Airlines, Inc.
Our current portfolio consists of companies that we believe have sustainable competitive advantages, discernible balance sheet strength, management teams that emphasize decisions based on cost of capital calculations and deploy free cash flow to create shareholder value. We remain focused on individual companies, their balance sheets, their operations and their prospects for maintaining or growing sustainable free cash flow. From our perspective as long-term value investors, we recognize that companies generating sustainable free cash flow are well positioned to compete profitably during challenging economic environments. We continue to seek and invest in companies that we believe have an ability to deliver long-term value to their shareholders that, in most cases, is not currently recognized by the market.
| OLSTEIN ALL CAP VALUE FUND |
Our Leaders
Leading performers for the twelve-month reporting period ended June 30, 2020, include Generac Holdings, Inc., Apple, Inc., Hologic, Inc., Microsoft Corporation, and Lam Research Corporation. At the close of the fiscal year the Fund continued to maintain positions in Hologic, Inc., Apple, Inc., Generac Holdings, Inc., and Microsoft Corporation. During the fiscal year, the Fund liquidated its position in Lam Research Corporation as the price of the company’s stock reached our valuation.
Our Laggards
Laggards during the twelve-month reporting period include Norwegian Cruise Line Holdings Ltd., Spirit Airlines, Inc., Tapestry, Inc., BorgWarner Inc., and SeaWorld Entertainment, Inc. At the close of the fiscal year the Fund maintained positions in Tapestry, Inc. and SeaWorld Entertainment, Inc.. The Fund liquidated its position in Norwegian Cruise Line Holdings Ltd. since we believe that the cruise industry is especially vulnerable to major changes in consumer expectations and behavior brought on by the COVID-19 pandemic which may last for a longer term than expected. Similarly, we consolidated the portfolio’s overall airline exposure and liquidated the Fund’s holding in Spirit Airlines, Inc. since its business model is heavily reliant on the “vacation” or “casual” traveler and does not have a diverse customer base of business and family travelers. The Fund also liquidated its holdings in BorgWarner, Inc. Although still bullish on General Motors Company, we felt that we had too much exposure to the auto industry during the present economic environment.
FINAL THOUGHTS
We firmly believe that our emphasis on assessing downside risk before determining upside potential is more critical in today’s environment as we face the economic challenges created by the COVID-19 crisis. Our main method for assessing risk is performing an inferential analysis of a company’s financial statements to determine a company’s normalized ability to generate and/or grow normalized free cash flow (which is the main determinate of value), and to purchase these companies at a discount. As pessimism periodically dominates equity markets and drags equity prices down, it is important to identify those companies that have maintained a balance sheet discipline that eschews material leverage; have honed their operations to protect, or in some cases expand, margins; and have accrued strategic cash balances that can fund initiatives to build profitable market share or be used to for favorable acquisitions.
| OLSTEIN ALL CAP VALUE FUND |
It is our opinion that the current climate created by extraordinary conditions, has created many bargains characterized by stock prices selling below our assessment of private market value. We believe our portfolio is dominated by today’s bargains, which should increase the probability of producing above average future returns. Thus, our portfolio is heavily weighted toward companies which, in our opinion, are being unfairly penalized by the current pessimism and/or other short-term problems. While past performance is not indicative of future results, it is noteworthy that the seeds of past periods of relative outperformance by the fund were sown during volatile and extremely emotional down markets in 1998, 2002 and 2008-2009. By definition, the bottom of a bear market is the point of collective maximum negative sentiment and activity. While we have never figured out a method of predicting a market bottom, we can say that the panic that resulted in the sharp decline in equity markets between February 19, 2020 and March 23, 2020 has created fertile ground for potential above-average future returns based on the value discounts that we believe have been created by short-term thinking without regard to future long-term fundamentals. As value investors, we believe in having a long-term horizon in an environment that is maniacally focused on short-term events. We believe that our long-term horizon, in conjunction with our emphasis on an inferential analysis of financial statements, should provide us with an advantage in the current uncertain environment. Again, patience is the most important trait of a value investor.
We value your trust and remind you that our money is invested alongside yours as we work hard to accomplish the Fund’s primary investment objective of long-term capital appreciation. We look forward to writing to you again at the close of the year.
Sincerely,
 |  |
| Robert A. Olstein | Eric R. Heyman |
| Chairman and Chief Investment Officer | Co-Portfolio Manager |
| OLSTEIN ALL CAP VALUE FUND |
The following chart illustrates the growth, on a quarterly basis, of a hypothetical $10,000 investment made in the Olstein All Cap Value Fund’s Class C share at the Olstein All Cap Value Fund’s inception date of September 21, 1995 (with dividends and capital gain distributions reinvested but no deduction of taxes on reinvested distributions—see important disclosures below):
(UNAUDITED)
| | | | Value of Shares | |
| | | | Owned, If Initial | |
| | | | Investment | |
| | Date
| | was $10,000 | |
| | 9/21/95 | | $10,000 | |
| | 9/30/95 | | 10,010 | |
| | 12/31/95 | | 10,261 | |
| | 3/31/96 | | 10,882 | |
| | 6/30/96 | | 11,462 | |
| | 9/30/96 | | 11,713 | |
| | 12/31/96 | | 12,760 | |
| | 3/31/97 | | 13,327 | |
| | 6/30/97 | | 14,602 | |
| | 9/30/97 | | 17,250 | |
| | 12/31/97 | | 17,205 | |
| | 3/31/98 | | 19,851 | |
| | 6/30/98 | | 18,468 | |
| | 9/30/98 | | 15,499 | |
| | 12/31/98 | | 19,788 | |
| | 3/31/99 | | 20,717 | |
| | 6/30/99 | | 25,365 | |
| | 9/30/99 | | 23,675 | |
| | 12/31/99 | | 26,692 | |
| | 3/31/00 | | 28,170 | |
| | 6/30/00 | | 28,899 | |
| | 9/30/00 | | 30,596 | |
| | 12/31/00 | | 30,142 | |
| | 3/31/01 | | 30,207 | |
| | 6/30/01 | | 36,192 | |
| | 9/30/01 | | 28,213 | |
| | 12/31/01 | | 35,340 | |
| | 3/31/02 | | 38,259 | |
| | 6/30/02 | | 33,797 | |
| | 9/30/02 | | 25,870 | |
| | 12/31/02 | | 28,528 | |
| | 3/31/03 | | 26,226 | |
| | 6/30/03 | | 31,448 | |
| | 9/30/03 | | 33,797 | |
| | 12/31/03 | | 38,853 | |
| | 3/31/04 | | 40,870 | |
| | 6/30/04 | | 41,297 | |
| | 9/30/04 | | 39,043 | |
| | 12/31/04 | | 43,146 | |
| | 3/31/05 | | 42,640 | |
| | 6/30/05 | | 42,302 | |
| | 9/30/05 | | 43,749 | |
| | 12/31/05 | | 44,350 | |
| | 3/31/06 | | 46,566 | |
| | 6/30/06 | | 44,241 | |
| | 9/30/06 | | 46,836 | |
| | 12/31/06 | | 50,755 | |
| | 3/31/07 | | 51,863 | |
| | 6/30/07 | | 55,536 | |
| | 9/30/07 | | 53,029 | |
| | 12/31/07 | | 49,012 | |
| | 3/31/08 | | 42,447 | |
| | 6/30/08 | | 40,189 | |
| | 9/30/08 | | 38,452 | |
| | 12/31/08 | | 27,545 | |
| | 3/31/09 | | 24,767 | |
| | 6/30/09 | | 30,102 | |
| | 9/30/09 | | 35,648 | |
| | 12/31/09 | | 37,741 | |
| | 3/31/10 | | 40,392 | |
| | 6/30/10 | | 35,788 | |
| | 9/30/10 | | 39,695 | |
| | 12/31/10 | | 43,845 | |
| | 3/31/11 | | 45,276 | |
| | 6/30/11 | | 45,310 | |
| | 9/30/11 | | 37,497 | |
| | 12/31/11 | | 41,962 | |
| | 3/31/12 | | 48,519 | |
| | 6/30/12 | | 45,555 | |
| | 9/30/12 | | 47,159 | |
| | 12/31/12 | | 48,380 | |
| | 3/31/13 | | 54,275 | |
| | 6/30/13 | | 56,786 | |
| | 9/30/13 | | 60,379 | |
| | 12/31/13 | | 65,995 | |
| | 3/31/14 | | 66,867 | |
| | 6/30/14 | | 69,134 | |
| | 9/30/14 | | 69,413 | |
| | 12/31/14 | | 75,913 | |
| | 3/31/15 | | 77,290 | |
| | 6/30/15 | | 75,525 | |
| | 9/30/15 | | 66,631 | |
| | 12/31/15 | | 68,694 | |
| | 3/31/16 | | 70,220 | |
| | 6/30/16 | | 68,859 | |
| | 9/30/16 | | 73,312 | |
| | 12/31/16 | | 76,612 | |
| | 3/31/17 | | 80,372 | |
| | 6/30/17 | | 82,232 | |
| | 9/30/17 | | 82,438 | |
| | 12/31/17 | | 87,561 | |
| | 3/31/18 | | 86,683 | |
| | 6/30/18 | | 86,815 | |
| | 9/30/18 | | 91,553 | |
| | 12/31/18 | | 77,934 | |
| | 3/31/19 | | 87,094 | |
| | 6/30/19 | | 91,214 | |
| | 9/30/19 | | 91,699 | |
| | 12/31/19 | | 99,092 | |
| | 3/31/20 | | 67,832 | |
| | 6/30/20 | | 82,811 | |
Details:
The performance data quoted represents past performance and does not guarantee future results. The Olstein All Cap Value Fund’s Class C average annual return for the one-year, five-year, and ten-year periods ended 6/30/20, assuming reinvestment of dividends and capital gain distributions and deduction of the Olstein All Cap Value Fund’s maximum CDSC of 1% during the one-year period, was -10.09%,
| OLSTEIN ALL CAP VALUE FUND |
1.86%, and 8.75%, respectively. Per the Fund’s prospectus dated 10/28/19, the expense ratio for the Olstein All Cap Value Fund Class C was 2.19%. Performance and expense ratios for other share classes will vary due to differences in sales charge structure and class expenses. The investment return and principal value of an investment will fluctuate so that an investor’s shares, when redeemed, may be worth more or less than their original cost. Current performance may be lower or higher than performance quoted. To obtain performance data current to the most recent month end, please go to our website at www.olsteinfunds.com.
The above represents opinion and is not intended to be a forecast of future events, a guarantee of future results, or investment advice. The references to securities are not buy or sell recommendations but are intended to be descriptive examples of the Fund’s investment philosophy and are subject to change. Do not make investments based on the securities referenced. A full schedule of fund holdings as of 6/30/20 is contained in this report and is subject to change. This information should be preceded or accompanied by a current prospectus, which contains more complete information, including investment objectives, risks, charges and expenses of the Olstein Funds and should be read carefully before investing. A current prospectus may be obtained by calling (800) 799-2113 or visiting the Olstein Funds’ website at www.olsteinfunds.com.
The Olstein Funds follow a value-oriented investment approach. However, a particular value stock may not increase in price as the Investment Manager anticipates and may actually decline in price if other investors fail to recognize the stock’s value or if a catalyst that the Investment Manager believes will increase the price of the stock does not occur or does not affect the price of the stock in the manner or to the degree that the Investment Manager anticipated. Also, the Investment Manager’s calculation of a stock’s private market value involves estimates of future cash flow which may prove to be incorrect and, therefore, could result in sales of the stock at prices lower than the Fund’s original purchase price. There is no assurance that the Fund will achieve its investment objective.
The Russell 3000® Index is an unmanaged index that seeks to represent the broad U.S. equity universe accounting for approximately 98% of the U.S. market capitalization. The Russell 3000® Value Index measures the performance of the broad value segment of U.S. equity value universe. It includes those Russell 3000® companies with lower price-to-book ratios and lower forecasted growth values. The Russell 3000® Value Index is constructed to provide a comprehensive and unbiased barometer of the broad value market. The S&P 500® Index is an unmanaged index created by Standard & Poor’s Corporation that includes a representative sample of 500 leading companies in leading industries of the U.S. economy and is considered to be a broad based indicator representing the U.S. stock market performance in general. Past performance does not guarantee future results. Index returns do not reflect payment of any expenses, fees or sales charges an investor would pay to purchase the securities the index represents. Such costs would lower performance. One cannot invest directly in an index.
| OLSTEIN ALL CAP VALUE FUND |
OLSTEIN STRATEGIC
OPPORTUNITIES FUND
Letter to Shareholders
DEAR FELLOW SHAREHOLDERS:
For the quarter ended June 30, 2020, Adviser Class shares of the Strategic Opportunities Fund appreciated 27.51%; load-waived Class A shares appreciated 27.43% and load-waived Class C shares appreciated 27.19%. The Fund’s primary benchmark, the Russell 2500® Value Index, appreciated 20.60% and the Fund’s secondary benchmark, Russell 2500® Index appreciated 26.56% during the second quarter of 2020. For the fiscal year ended June 30, 2020, Adviser Class shares of the Fund depreciated 11.65%, Class A shares depreciated 11.89% (load waived) and Class C shares depreciated 12.49% (load waived). During the same twelve-month period, the Russell 2500® Value Index decreased 15.50% and the Russell 2500® Index dropped 4.70%.1
MARKET OUTLOOK
Over the course of the Fund’s fiscal year, from July 1, 2019 through June 30, 2020, the stocks of small- to mid-sized (SMID) companies experienced a wild ride that culminated with the SMID-cap benchmark Russell 2500® Index reaching an all-time high in February 2020, followed by a steep, rapid decline during the month of March 2020. Small- to mid-sized companies were hit especially hard with the onset of the COVID-19 crisis during the first quarter of 2020, as investors retreated to larger-capitalization, defensive
1 | The performance data quoted represents past performance and does not guarantee future results. The Olstein Strategic Opportunities Fund Class A return as of 6/30/20 for the one-year, five-year, and ten-year periods, assuming deduction of the maximum Class A sales charge of 5.50%, was -16.72%, -2.06% and 8.13%, respectively. Per the Fund’s 10/28/19 prospectus, the gross expense ratio for the Class A share was 1.73% and the net expense ratio was 1.60%. The Adviser has contractually agreed to waive certain fees/expenses until October 28, 2020. Performance would have been lower without waivers in effect. Expense ratios for other share classes will vary. Performance for other share classes will vary due to differences in sales charge structure and class expenses. The investment return and principal value of an investment will fluctuate so that an investor’s shares, when redeemed, may be worth more or less than their original cost. Current performance may be lower or higher than performance quoted. To obtain performance data current to the most recent month end, please visit our website at www.olsteinfunds.com. |
| OLSTEIN STRATEGIC OPPORTUNITIES FUND |
names or shifted their allocation away from SMID cap equities in favor of assets with a perceived lower risk premium. The widening crisis, marked by a sharp contraction of global supply and demand due to an unprecedented shutdown of most economic activity, raised fears of a severe, prolonged economic downturn. Against this backdrop, volatility of SMID stocks increased significantly during the first quarter, with the SMID benchmark Russell 2500® Index falling 41.52% from its peak close on February 20, 2020 to its year-to-date-low on March 23, 2020. A sharp reversal of misfortune for small- to mid-sized companies unfolded during the second quarter of the year, however, with the benchmark Russell 2500® Index increasing 47.64% from its March 23rd low to the close of the second quarter on June 30, 2020.
Despite the volatility in equity prices during the first half of 2020, our cautious outlook for SMID investing during the second half of the year is rooted in an investment approach tested by previous market downturns. We anticipate that government intervention to flatten the pandemic curve will prove effective; that the unprecedented $2.2 trillion stimulus/relief package will help reinvigorate economic activity; and that business, consumer and investor sentiment will improve as economic activity restarts. As we have seen with past crises, as these positive trends unfold, and more confidence develops in the ability to see the future more clearly and with less pessimism, we believe markets should have more conviction in high quality SMID capitalization companies that have been unfairly punished by the current pessimism. We believe that SMID companies selling at discounts to our calculation of private market value, based on a company’s normalized ability to produce future excess cash flow with solid management teams dedicated to creating shareholder value and conservative balance sheets, are plentiful in the current environment.
OUR STRATEGY
We believe that the best defense for the difficult economic and investment environment created by the pandemic and subsequent slowdown, is to buy companies that have unique business models, have the ability to generate free cash flow, have little or no debt or are aggressively paying down debt, and to buy such companies at a significant discount to their intrinsic value. Throughout the first half of the year, the volatile market environment has afforded ample opportunity to buy such companies at what we believe are extremely attractive prices. For the remainder of 2020, we will continue to focus on company-specific factors and fundamentals utilizing our proprietary “looking behind the numbers of financial statements” investment discipline to identify unrecognized value in a market that has become increasingly nervous about the lingering effects of the COVID-19 pandemic, overall economic growth, and increased political uncertainty.
| OLSTEIN STRATEGIC OPPORTUNITIES FUND |
In today’s market, a company’s ability to generate sustainable future free cash flow and securities prices that allow us to buy good companies at what we believe are very advantageous prices, guide our pursuit of value. Our current portfolio consists of companies that we believe have a sustainable competitive advantage, discernible balance sheet strength, management teams that emphasize decisions based on cost of capital calculations and deploy free cash flow to create shareholder value. We remain focused on individual companies, their operations, and prospects for maintaining or growing sustainable free cash flow since we recognize that such companies are well positioned to compete more profitably during both favorable and challenging economic times. Thus, we will continue purchasing SMID companies generating excess cash flow and with leadership practicing sound capital management throughout the crisis that have experienced market price declines under the assumption that the pandemic will last forever. The word “forever” is one of the most overused words in the investing world, but is a key factor influencing the creation of undervalued and/or overvalued securities. In the current environment, we are finding it easier to identify companies selling at material discounts to our calculation of private market value which we believe is based on short-term thinking and have little to do with long-term fundamentals and valuations based on their normalized ability to generate future free cash flow. Pessimism is a value investor’s ally because of the bargain prices that can be produced, especially in companies with strong long-term fundamentals and strong balance sheets. The most important metric we use to calculate intrinsic value is our assessment of a company’s ability to generate and/or grow future free cash flow. We utilize a proprietary inferential look behind the numbers of a company’s financial statements to estimate future free cash flow. Our forensic analysis of financial statements seeks to identify early signs that could be indicative that a company’s ability to generate future free cash flow is not being properly valued by the public markets. We believe our accounting-based “look behind the numbers” investment discipline provides us with an advantage in valuing SMID companies especially, during periods of investor pessimism or euphoria.
Most investors have expectations of immediate gratification similar to a lottery win. A value investor’s best friend is patience. Businesses generally do not change values as quick as their stock prices do. A value investor’s timing is based on paying the right price that results in a favorable long-term risk/reward ratio. The favorable risk/reward ratio is created by investing in a company at a material discount to a company’s ability to generate normalized future excess cash flow. We believe the current pessimistic environment has created a plethora of companies selling at prices which represent material discounts in good SMID companies generating continued excess cash flow, having outstanding balance sheets and management teams who emphasize
| OLSTEIN STRATEGIC OPPORTUNITIES FUND |
returns on investments and increasing shareholder value. Investing in companies with the aforementioned qualities can be worth the wait despite the potential for short term underperformance. We believe paying the right price is a key factor to long term outperformance. The three most important factors we consider before adding a company to our portfolio under our value discipline are “price”, “price”, “price”. Remaining true to our investment discipline, we intend to seize on market dips as buying opportunities to either strategically add to existing position in the portfolio or initiate new positions in companies with unique business models, strong balance sheets, and selling at a discount to our calculations of private market value.
PORTFOLIO REVIEW
As we have done during previous periods marked by rapid declines in equity values, we re-examined every portfolio holding to retest our investment thesis under the new and challenging environment. We eliminated the stocks of companies that did not offer an optimal risk-reward tradeoff or whose upside potential was severely compromised by the difficult economic environment we expect to face. We initiated positions or increased holdings in companies that we believed were automatically, yet unfairly, penalized by the market in reaction to current economic conditions, but, in our opinion, have unique business models, strong balance sheets, the ability to withstand a recession, and were selling at a material discount to our determination of private market value.
As of June 30, 2020, the Olstein Strategic Opportunities Fund portfolio consisted of 40 holdings with an average weighted market capitalization of $4.89 billion. During the fiscal year, the Fund initiated positions in nine companies and eliminated seven holdings. The Fund initiated positions in the bank holding company, First Hawaiian, Inc., power generation equipment company, Generac Holdings, Inc., investment management company, Invesco Ltd., airline company, JetBlue Airways Corporation, management consulting/executive search firm, Korn Ferry, restaurant & kitchen equipment company, The Middleby Corporation, energy services company NOW, Inc., luxury fashion holding company, Tapestry, Inc. and semi-conductor manufacturer, Vishay Intertechnology, Inc. The Fund liquidated its holdings in Hain Celestial Group, Inc., Janus Henderson Group PLC, Legg Mason, Inc., Lydall, Inc., Park-Ohio Holdings Corporation, Skechers USA, Inc. and Spirit Airlines, Inc.
The Fund sold its holdings in Hain Celestial Group, Inc. and Skechers USA, Inc. as each company’s stock price reached our valuation. The Fund exited its position in Legg Mason, Inc., one of the Fund’s top-performing holdings during the fiscal year, following the announcement that Franklin Resources would acquire the company for $50 per share. The Fund exited its position in
| OLSTEIN STRATEGIC OPPORTUNITIES FUND |
Janus Henderson Group PLC as the asset management company continued to experience net outflows and was not on track to reverse this problematic trend as we anticipated in our investment thesis. The Fund liquidated its holdings in Lydall, Inc. and Park-Ohio Holdings Corporation to redeploy capital into opportunities that offered a better risk-reward tradeoff. Similarly, the Fund eliminated its position in Spirit Airlines, Inc. to consolidate the portfolio’s overall airline exposure and reduce exposure to a business model that does not have a diverse customer base of business and family travelers but is, instead heavily reliant on the “vacation” or “casual” travelers.
Our Leaders
Leading performers for the fiscal year include Generac Holdings, Inc., Big Lots, Inc., The Shyft Group, Central Garden and Pet Company and Legg Mason, Inc. At the close of the fiscal year the Fund continued to maintain positions in Generac Holdings, Inc., Big Lots, Inc., The Shyft Group and Central Garden and Pet Company. As discussed previously, the Fund exited its holding in Legg Mason, Inc., during the fiscal year, following the announcement of its acquisition by Franklin Resources.
Our Laggards
Laggards during the fiscal year include: Spirit Airlines, Inc., Dine Brands Global, Inc., SeaWorld Entertainment, Inc., Park-Ohio Holdings Corporation, and Denny’s Corporation. During the reporting period the Fund liquidated its position in Park-Ohio Holdings Corporation and Spirit Airlines as discussed previously in this letter. At the close of its fiscal year, the Fund continued to hold Dine Brands Global, Inc., SeaWorld Entertainment, Inc., and Denny’s Corporation in its portfolio.
FINAL THOUGHTS
Since the COVID-19 crisis and government-imposed lockdowns have drastically altered short-term earnings prospects and have clouded the near-term outlook for company earnings and free cash flow levels, we have focused on several metrics especially important to identifying and assessing high-quality SMID capitalization companies: strong balance sheets with low leverage, business models with strong free cash flow or strong free cash flow potential, high return on investment, clean accounting and sound corporate governance. We cannot stress enough the importance of balance sheet strength and fiscal discipline for each of our portfolio companies in the current environment. While we may not know how long the pandemic will last or what the ultimate economic effect will be, we do know that a strong balance sheet enhances the quality, durability and survival of a company in
| OLSTEIN STRATEGIC OPPORTUNITIES FUND |
tough times. We own a portfolio of companies that we believe will not only make it through these difficult times, but also includes many businesses that have the strength and flexibility to opportunistically enhance their competitive standing during such times. It is our opinion that the current climate, created by extraordinary conditions, has created many SMID bargains characterized by stock prices selling below our calculation of private market value. We believe our portfolio is dominated by today’s bargains, which should increase the probability of producing above average future returns. Thus, our portfolio is heavily weighted toward companies that, in our opinion, are being unfairly penalized by current pessimism and/or other short-term problems. The bottom of a bear market is, by definition, the point of collective maximum negative sentiment and activity. While we have never figured out a method of predicting a market bottom, we can say that the panic that resulted in the sharp decline in equity markets between February 19, 2020 and March 23, 2020 has created fertile ground for potential above average future returns based on the value discounts that have been created by short-term thinking without regard to future long-term fundamentals. As value investors, we believe in having a long-term horizon, in conjunction with our emphasis on an inferential analysis of financial statements, should provide the Fund with an advantage in the current uncertain environment. Patience is the most important trait of a value investor. We believe that the objective of trying to perform all the time is an impediment to performance over time.
Analysis of specific companies, their potential, prospects and value and not overall market sentiment will continue to guide our course in 2020. We value your trust and remind you that our money is invested alongside yours as we work hard to accomplish the Fund’s objective of long-term capital appreciation. We look forward to writing to you again at the close of the year.
Sincerely,
| |
| Eric R. Heyman | Robert A. Olstein |
| Co-Portfolio Manager | Chairman and Chief Investment Officer |
The above represents the opinion of the Manager and is not intended to be a forecast of future events, a guarantee of future results, or investment advice. The references to securities are not buy or sell recommendations but are intended to be descriptive examples of the Fund’s investment philosophy and are subject to change. Do not make investments based on the securities referenced. A full schedule of Fund holdings as of 6/30/20 is contained in this report and is subject to change. This information
| OLSTEIN STRATEGIC OPPORTUNITIES FUND |
should be preceded or accompanied by a current prospectus, which contains more complete information, including investment objectives, risks, charges and expenses of the Olstein Funds and should be read carefully before investing. A current prospectus may be obtained by calling (800) 799-2113 or visiting the Olstein Funds’ website at www.olsteinfunds.com.
The Olstein Funds follow a value-oriented investment approach. However, a particular value stock may not increase in price as the Investment Manager anticipates and may actually decline in price if other investors fail to recognize the stock’s value or if a catalyst that the Investment Manager believes will increase the price of the stock does not occur or does not affect the price of the stock in the manner or to the degree that the Investment Manager anticipated. Also, the Investment Manager’s calculation of a stock’s private market value involves estimates of future cash flow which may prove to be incorrect and, therefore, could result in sales of the stock at prices lower than the Fund’s original purchase price. The investment return and principal value of an investment will fluctuate so that an investor’s shares, when redeemed, may be worth more or less than their original cost. There is no assurance that the Fund will achieve its investment objective.
An investment in a portfolio containing small- and mid-cap companies is subject to additional risks, as the share prices of small- and mid-cap companies are often more volatile than those of larger companies due to several factors, including limited trading volumes, products, financial resources, management inexperience and less publicly available information. The activist strategy invests in stocks of underperforming companies and any shareholder activism might not result in a change in performance or corporate governance. These stocks could also experience less liquidity and higher share price and trading volume volatility than stocks of other companies.
The Russell 2500® Index measures the performance of the small to mid-cap segment of the U.S. equity universe, commonly referred to as “SMID” cap. The Russell 2500® Index is a subset of the Russell 3000® Index. It includes approximately 2,500 of the smallest securities based on a combination of their market cap and current index membership. The Russell 2500® Value Index measures the performance of the small to mid-cap value segment of the U.S. equity universe. It includes those Russell 2500® companies that are considered more value oriented relative to the overall market as defined by Russell’s leading style methodology. The Russell 2500® Value Index is constructed to provide a comprehensive and unbiased barometer of the small to mid-cap value market. Past performance does not guarantee future results. Index returns do not reflect payment of any expenses, fees or sales charges an investor would pay to purchase the securities the Index represents. Such costs would lower performance. One cannot invest directly in an index.
| OLSTEIN STRATEGIC OPPORTUNITIES FUND |
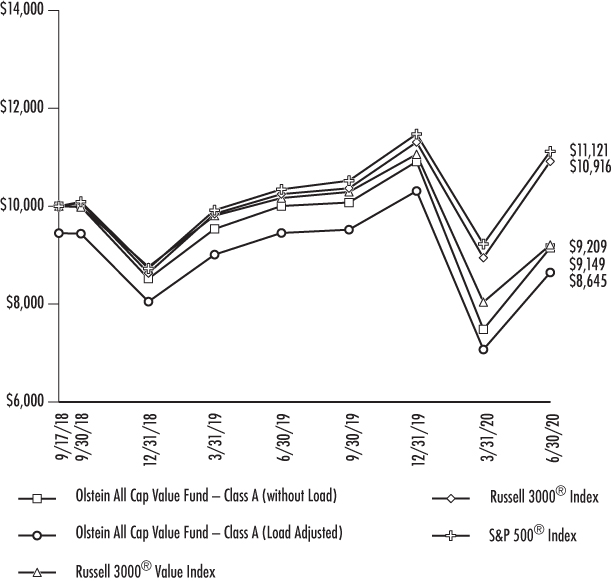
Value of $10,000 Investment (Unaudited)
Comparison of the Change in Value of a Hypothetical $10,000 Investment in the Fund’s Class A shares from Inception through the Fiscal Year End of June 30, 2020. The returns listed in the table do not reflect the deduction of taxes on reinvested dividends.
Average Annual Rate of Return For Periods Ended June 30, 2020 |
| | 1 Year | Inception(5) |
Olstein All Cap Value – Class A (without Load)(1) | -8.54% | -4.86% |
Olstein All Cap Value – Class A (Load Adjusted)(1) | -13.56% | -7.84% |
Russell 3000® Value Index(2) | -9.42% | -4.51% |
Russell 3000® Index(3) | 6.53% | 5.04% |
S&P 500® Index(4) | 7.51% | 6.14% |
| (1) | Assumes reinvestment of dividends and capital gains. Reflects the effect of the maximum sale load charge of 5.50% in load adjusted return. Past performance is not necessarily indicative of future results. Investment returns and principal values may fluctuate, so that, when redeemed, shares may be worth more or less than their original cost. |
| (2) | The Russell 3000® Value Index return is adjusted upward to reflect reinvested dividends, but does not reflect the deduction of any fees or expenses associated with investments in the index, and thus represents a “gross return”. One cannot invest directly in an index. |
| (3) | The Russell 3000® Index reflects the broad U.S. equity universe and represents approximately 98% of the U.S. market. The Russell 3000® Index return is adjusted upward to reflect reinvested dividends, but does not reflect the deduction of any fees or expenses associated with investments in the index, and thus represents a “gross return”. One cannot invest directly in an index. |
| (4) | The S&P 500® Index return is adjusted upward to reflect reinvested dividends, but does not reflect the deduction of any fees or expenses associated with investment in the index, and thus represents a “gross return”. One cannot invest directly in an index. |
| (5) | Commenced operations on September 17, 2018. |
| OLSTEIN ALL CAP VALUE FUND |
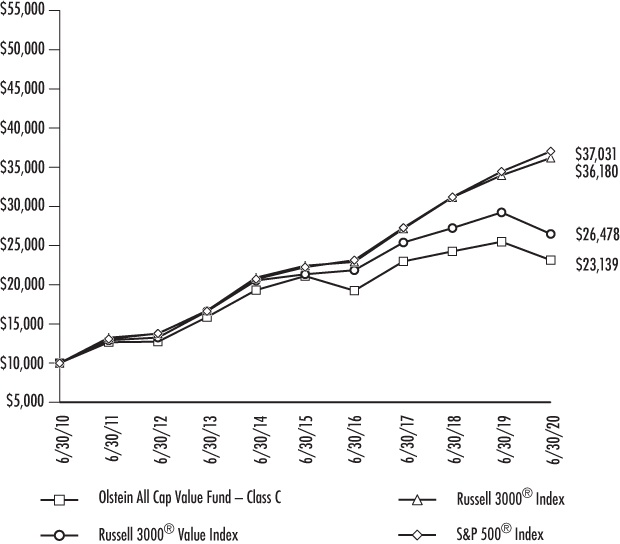
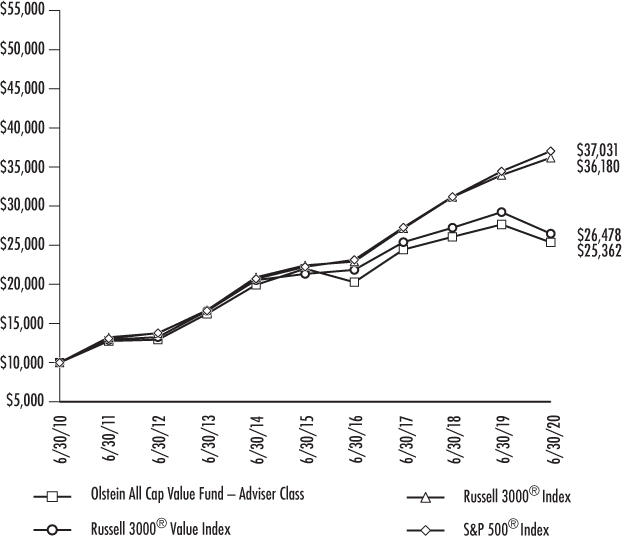
Value of $10,000 Investment (Unaudited)
Comparison of the Change in Value of a Hypothetical $10,000 Investment in the Fund’s Class C shares for the past 10 years through the Fiscal Year End of June 30, 2020. The line chart does not reflect any applicable Contingent Deferred Sales Charge. The returns listed in the table do not reflect the deduction of taxes on reinvested dividends.
Average Annual Rate of Return For Periods Ended June 30, 2020 |
| | 1 Year | 5 Year | 10 Year | 15 Year | Inception(5) |
Olstein All Cap Value – Class C(1) | -10.09% | 1.86% | 8.75% | 4.58% | 8.91% |
Russell 3000® Value Index(2) | -9.42% | 4.41% | 10.23% | 6.15% | 8.23% |
Russell 3000® Index(3) | 6.53% | 10.03% | 13.72% | 8.78% | 9.00% |
S&P 500® Index(4) | 7.51% | 10.73% | 13.99% | 8.83% | 9.04% |
| (1) | Assumes reinvestment of dividends and capital gains. Also includes all expenses at the end of each period and assumes the deduction of the appropriate CDSC as if an investor had redeemed at the end of the one year period, and thus represents a “net return”. The CDSC is based on the lesser of the original purchase price and the value of such shares at the time of redemption. Past performance is not necessarily indicative of future results. Investment returns and principal values may fluctuate, so that, when redeemed, shares may be worth more or less than their original cost. |
| (2) | The Russell 3000® Value Index return is adjusted upward to reflect reinvested dividends, but does not reflect the deduction of any fees or expenses associated with investments in the index, and thus represents a “gross return”. One cannot invest directly in an index. |
| (3) | The Russell 3000® Index reflects the broad U.S. equity universe and represents approximately 98% of the U.S. market. The Russell 3000® Index return is adjusted upward to reflect reinvested dividends, but does not reflect the deduction of any fees or expenses associated with investments in the index, and thus represents a “gross return”. One cannot invest directly in an index. |
| (4) | The S&P 500® Index return is adjusted upward to reflect reinvested dividends, but does not reflect the deduction of any fees or expenses associated with investment in the index, and thus represents a “gross return”. One cannot invest directly in an index. |
| (5) | Commenced operations on September 21, 1995. |
| OLSTEIN ALL CAP VALUE FUND |
Value of $10,000 Investment (Unaudited)
Comparison of the Change in Value of a Hypothetical $10,000 Investment in the Fund’s Adviser Class shares for the past 10 years through the Fiscal Year End of June 30, 2020. The returns listed in the table do not reflect the deduction of taxes on reinvested dividends.
Average Annual Rate of Return For Periods Ended June 30, 2020 |
| | 1 Year | 5 Year | 10 Year | 15 Year | Inception(5) |
| Olstein All Cap Value – | | | | | |
Adviser Class(1) | -8.27% | 2.88% | 9.75% | 5.49% | 6.89% |
Russell 3000® Value Index(2) | -9.42% | 4.41% | 10.23% | 6.15% | 6.19% |
Russell 3000® Index(3) | 6.53% | 10.03% | 13.72% | 8.78% | 6.64% |
S&P 500® Index(4) | 7.51% | 10.73% | 13.99% | 8.83% | 6.28% |
| (1) | Assumes reinvestment of dividends and capital gains. Also includes all expenses at the end of each period and thus represents a “net return”. Past performance is not necessarily indicative of future results. Investment returns and principal values may fluctuate, so that, when redeemed, shares may be worth more or less than their original cost. |
| (2) | The Russell 3000® Value Index return is adjusted upward to reflect reinvested dividends, but does not reflect the deduction of any fees or expenses associated with investments in the index, and thus represents a “gross return”. One cannot invest directly in an index. |
| (3) | The Russell 3000® Index reflects the broad U.S. equity universe and represents approximately 98% of the U.S. market. The Russell 3000® Index return is adjusted upward to reflect reinvested dividends, but does not reflect the deduction of any fees or expenses associated with investments in the index, and thus represents a “gross return”. One cannot invest directly in an index. |
| (4) | The S&P 500® Index return is adjusted upward to reflect reinvested dividends, but does not reflect the deduction of any fees or expenses associated with investment in the index, and thus represents a “gross return”. One cannot invest directly in an index. |
| (5) | Commenced operations on September 21, 1999. |
| OLSTEIN ALL CAP VALUE FUND |
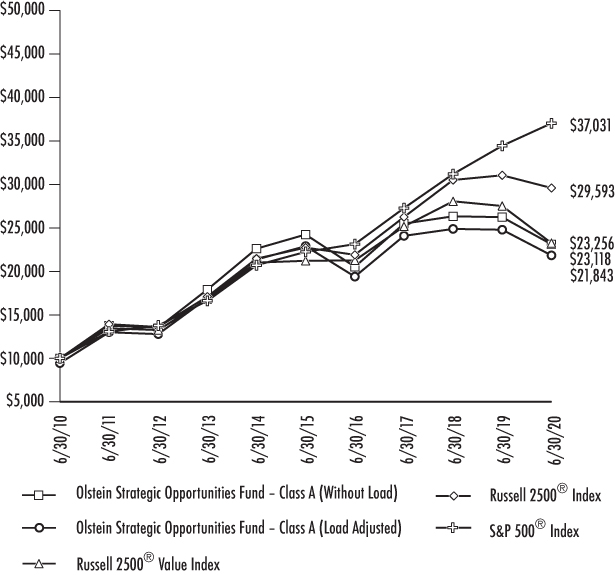
Value of $10,000 Investment (Unaudited)
Comparison of the Change in Value of a Hypothetical $10,000 Investment in the Fund’s Class A shares for the past 10 years through the Fiscal Year End of June 30, 2020. The returns listed in the table do not reflect the deduction of taxes on reinvested dividends.
Average Annual Rate of Return For Periods Ended June 30, 2020 |
| | 1 Year | 5 Year | 10 Year | Inception(5) |
| Olstein Strategic Opportunities – | | | | |
Class A (without Load)(1) | -11.89% | -0.94% | 8.74% | 5.18% |
| Olstein Strategic Opportunities – | | | | |
Class A (Load Adjusted)(1) | -16.72% | -2.06% | 8.13% | 4.74% |
Russell 2500® Value Index(2) | -15.50% | 1.85% | 8.81% | 4.99% |
Russell 2500® Index(3) | -4.70% | 5.41% | 11.46% | 7.35% |
S&P 500® Index(4) | 7.51% | 10.73% | 13.99% | 8.44% |
| (1) | Assumes reinvestment of dividends and capital gains. Reflects the effect of the maximum sale load charge of 5.50% in load adjusted return. Past performance is not necessarily indicative of future results. Investment returns and principal values may fluctuate, so that, when redeemed, shares may be worth more or less than their original cost. |
| (2) | The Russell 2500® Value Index return is adjusted upward to reflect reinvested dividends, but does not reflect the deduction of any fees or expenses associated with investments in the index, and thus represents a “gross return”. One cannot invest directly in an index. |
| (3) | The Russell 2500® Index measures the performance of the 2,500 smallest companies in the Russell 3000® Index. The Russell 2500® Index return is adjusted upward to reflect reinvested dividends, but does not reflect the deduction of any fees or expenses associated with investments in the index, and thus represents a “gross return”. One cannot invest directly in an index. |
| (4) | The S&P 500® Index return is adjusted upward to reflect reinvested dividends, but does not reflect the deduction of any fees or expenses associated with investment in the index, and thus represents a “gross return”. One cannot invest directly in an index. |
| (5) | Commencement of operation was November 1, 2006. |
| OLSTEIN STRATEGIC OPPORTUNITIES FUND |
Value of $10,000 Investment (Unaudited)
Comparison of the Change in Value of a Hypothetical $10,000 Investment in the Fund’s Class C shares for the past 10 years through the Fiscal Year End of June 30, 2020. The line chart does not reflect any applicable Contingent Deferred Sales Charge. The returns listed in the table do not reflect the deduction of taxes on reinvested dividends.
Average Annual Rate of Return For Periods Ended June 30, 2020 |
| | 1 Year | 5 Year | 10 Year | Inception(5) |
| Olstein Strategic Opportunities – | | | | |
Class C(1) | -13.37% | -1.67% | 7.94% | 4.42% |
Russell 2500® Value Index(2) | -15.50% | 1.85% | 8.81% | 4.99% |
Russell 2500® Index(3) | -4.70% | 5.41% | 11.46% | 7.35% |
S&P 500® Index(4) | 7.51% | 10.73% | 13.99% | 8.44% |

| (1) | Assumes reinvestment of dividends and capital gains. Also includes all expenses at the end of each period and assumes the deduction of the appropriate CDSC as if an investor had redeemed at the end of the one year period, and thus represents a “net return”. The CDSC is based on the lesser of the original purchase price and the value of such shares at the time of redemption. Past performance is not necessarily indicative of future results. Investment returns and principal values may fluctuate, so that, when redeemed, shares may be worth more or less than their original cost. |
| (2) | The Russell 2500® Value Index return is adjusted upward to reflect reinvested dividends, but does not reflect the deduction of any fees or expenses associated with investments in the index, and thus represents a “gross return”. One cannot invest directly in an index. |
| (3) | The Russell 2500® Index measures the performance of the 2,500 smallest companies in the Russell 3000® Index. The Russell 2500® Index return is adjusted upward to reflect reinvested dividends, but does not reflect the deduction of any fees or expenses associated with investments in the index, and thus represents a “gross return”. One cannot invest directly in an index. |
| (4) | The S&P 500® Index return is adjusted upward to reflect reinvested dividends, but does not reflect the deduction of any fees or expenses associated with investment in the index, and thus represents a “gross return”. One cannot invest directly in an index. |
| (5) | Commencement of operation was November 1, 2006. |
| OLSTEIN STRATEGIC OPPORTUNITIES FUND |
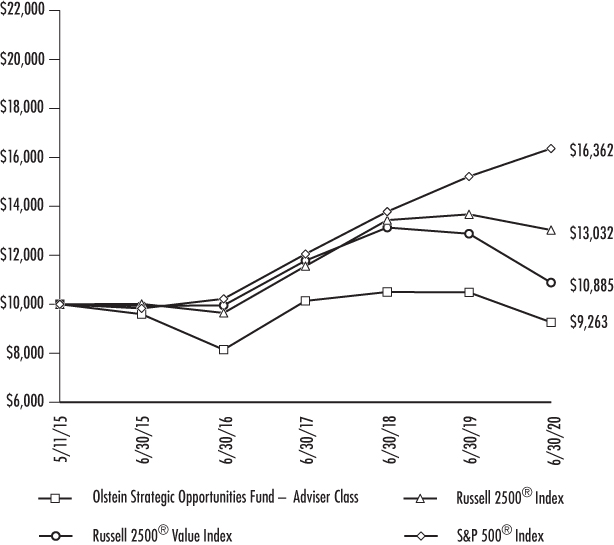
Value of $10,000 Investment (Unaudited)
Comparison of the Change in Value of a Hypothetical $10,000 Investment in the Fund’s Adviser Class shares from Inception through the Fiscal Year End of June 30, 2020. The returns listed in the table do not reflect the deduction of taxes on reinvested dividends.
Average Annual Rate of Return For Periods Ended June 30, 2020 |
| | 1 Year | 3 Year | 5 Year | Inception(5) |
| Olstein Strategic Opportunities – | | | | |
Adviser Class(1) | -11.65% | -2.96% | -0.70% | -1.48% |
Russell 2500® Value Index(2) | -15.50% | -2.60% | 1.85% | 1.66% |
Russell 2500® Index(3) | -4.70% | 4.08% | 5.41% | 5.29% |
S&P 500® Index(4) | 7.51% | 10.73% | 10.73% | 10.06% |
| (1) | Assumes reinvestment of dividends and capital gains. Also include all expense at the end of the period and thus represents a “net return”. Past performance is not necessarily indicative of future results. Investment returns and principal values may fluctuate, so that, when redeemed, shares may be worth more or less than their original cost. |
| (2) | The Russell 2500® Value Index return is adjusted upward to reflect reinvested dividends, but does not reflect the deduction of any fees or expenses associated with investments in the index, and thus represents a “gross return”. One cannot invest directly in an index. |
| (3) | The Russell 2500® Index measures the performance of the 2,500 smallest companies in the Russell 3000® Index. The Russell 2500® Index return is adjusted upward to reflect reinvested dividends, but does not reflect the deduction of any fees or expenses associated with investments in the index, and thus represents a “gross return”. One cannot invest directly in an index. |
| (4) | The S&P 500® Index return is adjusted upward to reflect reinvested dividends, but does not reflect the deduction of any fees or expenses associated with investment in the index, and thus represents a “gross return”. One cannot invest directly in an index. |
| (5) | Commencement of operation was May 11, 2015. |
| OLSTEIN STRATEGIC OPPORTUNITIES FUND |
The Olstein Funds
Expense Examples as of June 30, 2020 (Unaudited)
As a shareholder of a Fund, you incur two types of costs: (1) transaction costs, including brokerage commissions on purchases and sales of Fund shares, sales loads on purchase payments or contingent deferred sales charges on redemptions, if any, and (2) ongoing costs, including management fees, distribution and/or service (12b-1) fees, interest expense and other Fund expenses. This Example is intended to help you understand your ongoing costs (in dollars) of investing in a Fund and to compare these costs with the ongoing costs of investing in other mutual funds. The Example is based on an investment of $1,000 invested at the beginning of the period and held for the entire period, January 1, 2020 – June 30, 2020.
Actual Expenses For each class, the first line of the table provides information about actual account values and actual expenses. You may use the information in this table, together with the amount you invested, to estimate the expenses that you paid over the period. Simply divide your account value by $1,000 (for example, an $8,600 account value divided by $1,000 = 8.6), then multiply the result by the number in the table under the heading entitled “Expenses Paid During Period” to estimate the expenses you paid on your account during this period.
Hypothetical Example for Comparison Purposes For each class, the second line of the following table provides information about hypothetical account values and hypothetical expenses based on the Fund’s actual expense ratio and an assumed rate of return of 5% per year before expenses, which is not the Fund’s actual return. The hypothetical account values and expenses may not be used to estimate the actual ending account balance or expenses you paid for the period. You may use this information to compare the ongoing costs of investing in the Fund and other funds. To do so, compare this 5% hypothetical example with the 5% hypothetical examples that appear in the shareholder reports of the other funds.
Please note that the expenses shown in the tables are meant to highlight your ongoing costs only and do not reflect any transactional costs. Therefore, the second line of the tables are useful in comparing ongoing costs only, and will not help you determine the relative total costs of owning different funds. In addition, if these transactional costs were included, your costs may have been higher.
Olstein All Cap Value Fund
| | Beginning | Ending | Expenses Paid |
| | Account Value | Account Value | During Period(1) |
| | 1/1/20 | 6/30/20 | 1/1/20 to 6/30/20 |
| Actual | | | |
Class A(2) | $1,000.00 | $838.60 | $6.35 |
Class C(2) | $1,000.00 | $835.70 | $9.77 |
Adviser Class(2) | $1,000.00 | $839.60 | $5.21 |
| Hypothetical (5% annual | | | |
| return before expenses) | | | |
| Class A | $1,000.00 | $1,017.95 | $6.97 |
| Class C | $1,000.00 | $1,014.22 | $10.72 |
| Adviser Class | $1,000.00 | $1,019.19 | $5.72 |
| (1) | Expenses are equal to the Fund’s annualized expense ratio for the most recent six-month period of 1.39%, 2.14% and 1.14% for Class A, Class C, and Adviser Class, respectively, multiplied by the average account value over the period, multiplied by 182/366 to reflect the one-half year period. |
| (2) | Based on the actual returns for the six-month period ended June 30, 2020, of -16.14%, -16.43%, and -16.04% for the Class A, Class C and the Adviser Class, respectively. |
Olstein Strategic Opportunities Fund
| | Beginning | Ending | Expenses Paid |
| | Account Value | Account Value | During Period(3) |
| | 1/1/20 | 6/30/20 | 1/1/20 to 6/30/20 |
| Actual | | | |
Class A(4) | $1,000.00 | $793.20 | $7.13 |
Class C(4) | $1,000.00 | $791.10 | $10.47 |
Adviser Class(4) | $1,000.00 | $794.50 | $6.02 |
| Hypothetical (5% annual | | | |
| return before expenses) | | | |
| Class A | $1,000.00 | $1,016.91 | $8.02 |
| Class C | $1,000.00 | $1,013.18 | $11.76 |
| Adviser Class | $1,000.00 | $1,018.15 | $6.77 |
| (3) | Expenses are equal to the Fund’s annualized expense ratio for the most recent six-month period of 1.60%, 2.35% and 1.35% for Class A, Class C, and Adviser Class, respectively, multiplied by the average account value over the period, multiplied by 182/366 to reflect the one-half year period. |
| (4) | Based on the actual returns for the six-month period ended June 30, 2020, of -20.68%, -20.89%, and -20.55% for the Class A, Class C and the Adviser Class, respectively. |
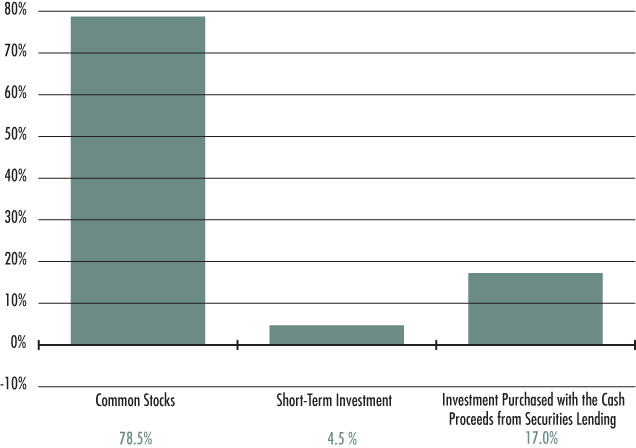
Olstein All Cap Value Fund
Allocation of Portfolio Assets as a percentage of investments
June 30, 2020 (Unaudited)
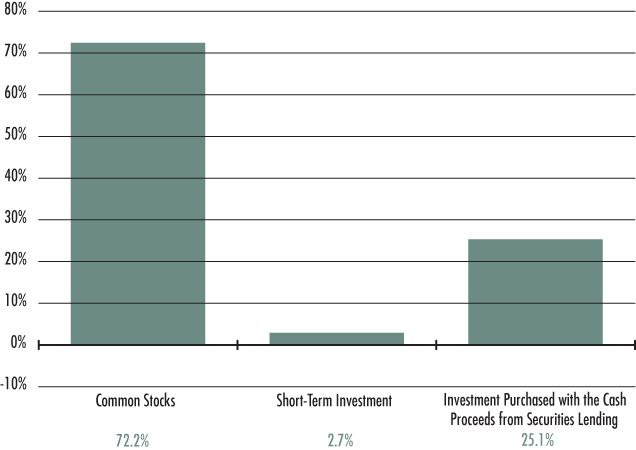
Olstein Strategic Opportunities Fund
Allocation of Portfolio Assets as a percentage of investments
June 30, 2020 (Unaudited)
Olstein All Cap Value Fund
Schedule of Investments as of June 30, 2020
| COMMON STOCKS – 94.6% | | | | | | |
| ADVERTISING AGENCIES – 1.6% | | Shares | | | Value | |
| Omnicom Group, Inc. (a) | | | 148,000 | | | $ | 8,080,800 | |
| | | | | | | | | |
| AEROSPACE & DEFENSE – 0.6% | | | | | | | | |
| Raytheon Technologies Corporation | | | 50,000 | | | | 3,081,000 | |
| | | | | | | | | |
| AIR DELIVERY & FREIGHT SERVICES – 3.0% | | | | | | | | |
| FedEx Corporation (a) | | | 58,000 | | | | 8,132,760 | |
| United Parcel Service, Inc. – Class B (a) | | | 62,000 | | | | 6,893,160 | |
| | | | | | | | 15,025,920 | |
| AIRLINES – 1.7% | | | | | | | | |
| Delta Air Lines, Inc. | | | 158,000 | | | | 4,431,900 | |
| JetBlue Airways Corporation (a)(b) | | | 380,150 | | | | 4,143,635 | |
| | | | | | | | 8,575,535 | |
| AUTO COMPONENTS – 0.7% | | | | | | | | |
| Aptiv PLC (a)(c) | | | 47,000 | | | | 3,662,240 | |
| | | | | | | | | |
| AUTO MANUFACTURERS – 1.2% | | | | | | | | |
| General Motors Company | | | 244,000 | | | | 6,173,200 | |
| | | | | | | | | |
| BUILDING PRODUCTS – 0.8% | | | | | | | | |
| Carrier Global Corporation | | | 181,000 | | | | 4,021,820 | |
| | | | | | | | | |
| CAPITAL MARKETS – 1.5% | | | | | | | | |
| Goldman Sachs Group, Inc. | | | 39,000 | | | | 7,707,180 | |
| | | | | | | | | |
| CHEMICALS – 3.7% | | | | | | | | |
| Corteva, Inc. | | | 252,600 | | | | 6,767,154 | |
| DuPont de Nemours, Inc. | | | 120,000 | | | | 6,375,600 | |
| Eastman Chemical Company | | | 83,000 | | | | 5,780,120 | |
| | | | | | | | 18,922,874 | |
| COMMERCIAL BANKS – 5.7% | | | | | | | | |
| Citizens Financial Group, Inc. | | | 268,440 | | | | 6,775,426 | |
| Fifth Third Bancorp | | | 288,000 | | | | 5,552,640 | |
| Prosperity Bancshares, Inc. | | | 58,100 | | | | 3,449,978 | |
| U.S. Bancorp | | | 152,000 | | | | 5,596,640 | |
The accompanying notes are an integral part of these financial statements.
| OLSTEIN ALL CAP VALUE FUND |
COMMON STOCKS – 94.6% – continued | | | | | | |
COMMERCIAL BANKS – 5.7% – continued | | Shares | | | Value | |
| Wells Fargo & Company | | | 292,000 | | | $ | 7,475,200 | |
| | | | | | | | 28,849,884 | |
| COMMERCIAL SERVICES – 1.7% | | | | | | | | |
| Moody’s Corporation | | | 19,000 | | | | 5,219,870 | |
| S&P Global, Inc. | | | 11,000 | | | | 3,624,280 | |
| | | | | | | | 8,844,150 | |
| COMMUNICATIONS EQUIPMENT – 1.9% | | | | | | | | |
| Cisco Systems, Inc. | | | 212,000 | | | | 9,887,680 | |
| | | | | | | | | |
| COMPUTERS – 3.1% | | | | | | | | |
| Apple, Inc. | | | 27,500 | | | | 10,032,000 | |
| Western Digital Corporation | | | 133,000 | | | | 5,871,950 | |
| | | | | | | | 15,903,950 | |
| CONSUMER FINANCE – 4.1% | | | | | | | | |
| American Express Company | | | 57,000 | | | | 5,426,400 | |
| Equifax, Inc. | | | 34,500 | | | | 5,929,860 | |
| MasterCard, Inc. – Class A | | | 16,000 | | | | 4,731,200 | |
| Visa, Inc. – Class A (a) | | | 24,000 | | | | 4,636,080 | |
| | | | | | | | 20,723,540 | |
| CONTAINERS & PACKAGING – 1.3% | | | | | | | | |
| WestRock Company | | | 227,150 | | | | 6,419,259 | |
| | | | | | | | | |
| DIVERSIFIED FINANCIAL SERVICES – 2.6% | | | | | | | | |
| Berkshire Hathaway, Inc. – Class B (a)(b) | | | 26,000 | | | | 4,641,260 | |
| Invesco Ltd. (a)(c) | | | 814,200 | | | | 8,760,792 | |
| | | | | | | | 13,402,052 | |
| E-COMMERCE – 1.3% | | | | | | | | |
| eBay, Inc. | | | 129,000 | | | | 6,766,050 | |
| | | | | | | | | |
| ELECTRICAL EQUIPMENT – 2.7% | | | | | | | | |
| Eaton Corporation PLC (c) | | | 34,000 | | | | 2,974,320 | |
| Generac Holdings, Inc. (a)(b) | | | 64,000 | | | | 7,803,520 | |
| Littelfuse, Inc. | | | 17,850 | | | | 3,045,745 | |
| | | | | | | | 13,823,585 | |
The accompanying notes are an integral part of these financial statements.
| OLSTEIN ALL CAP VALUE FUND |
COMMON STOCKS – 94.6% – continued | | | | | | |
| ELECTRONICS – 1.7% | | Shares | | | Value | |
| Keysight Technologies, Inc. (a)(b) | | | 58,000 | | | $ | 5,845,240 | |
| Sensata Technologies Holding PLC (b)(c) | | | 80,277 | | | | 2,988,713 | |
| | | | | | | | 8,833,953 | |
| ENERGY – 1.7% | | | | | | | | |
| Chevron Corporation | | | 52,000 | | | | 4,639,960 | |
| Schlumberger Ltd. (c) | | | 229,000 | | | | 4,211,310 | |
| | | | | | | | 8,851,270 | |
| FOOD & DRUG RETAILERS – 3.9% | | | | | | | | |
| CVS Health Corporation | | | 144,000 | | | | 9,355,680 | |
| Walgreens Boots Alliance, Inc. | | | 242,000 | | | | 10,258,380 | |
| | | | | | | | 19,614,060 | |
| HEALTH CARE EQUIPMENT & SUPPLIES – 6.7% | | | | | | | | |
| Baxter International, Inc. | | | 53,000 | | | | 4,563,300 | |
| Becton, Dickinson and Company | | | 39,500 | | | | 9,451,165 | |
| Danaher Corporation | | | 18,000 | | | | 3,182,940 | |
| Hologic, Inc. (b) | | | 25,000 | | | | 1,425,000 | |
| Medtronic PLC (c) | | | 86,000 | | | | 7,886,200 | |
| Zimmer Biomet Holdings, Inc. | | | 63,000 | | | | 7,519,680 | |
| | | | | | | | 34,028,285 | |
| HEALTH CARE PROVIDERS & SERVICES – 2.6% | | | | | | | | |
| UnitedHealth Group, Inc. | | | 23,000 | | | | 6,783,850 | |
| Universal Health Services, Inc. – Class B | | | 71,000 | | | | 6,595,190 | |
| | | | | | | | 13,379,040 | |
| HOTELS & LEISURE – 0.8% | | | | | | | | |
| SeaWorld Entertainment, Inc. (a)(b) | | | 256,650 | | | | 3,800,986 | |
| | | | | | | | | |
| HOUSEHOLD DURABLES – 1.6% | | | | | | | | |
| Mohawk Industries, Inc. (a)(b) | | | 55,000 | | | | 5,596,800 | |
| Snap-on, Inc. (a) | | | 18,000 | | | | 2,493,180 | |
| | | | | | | | 8,089,980 | |
| INDUSTRIAL EQUIPMENT WHOLESALE – 1.2% | | | | | | | | |
| WESCO International, Inc. (b) | | | 168,050 | | | | 5,900,236 | |
The accompanying notes are an integral part of these financial statements.
| OLSTEIN ALL CAP VALUE FUND |
COMMON STOCKS – 94.6% – continued | | | | | | |
| INSURANCE – 2.9% | | Shares | | | Value | |
| Aon PLC – Class A (a)(c) | | | 9,000 | | | $ | 1,733,400 | |
| Marsh & McLennan Companies, Inc. | | | 34,000 | | | | 3,650,580 | |
| Travelers Companies, Inc. (a) | | | 51,000 | | | | 5,816,550 | |
| Willis Towers Watson PLC (c) | | | 19,000 | | | | 3,742,050 | |
| | | | | | | | 14,942,580 | |
| INTERACTIVE MEDIA & SERVICES – 1.4% | | | | | | | | |
| Facebook, Inc. – Class A (b) | | | 30,400 | | | | 6,902,928 | |
| | | | | | | | | |
| INTERNET & DIRECT MARKETING RETAIL – 1.0% | | | | | | | | |
| Booking Holdings, Inc. (a)(b) | | | 3,100 | | | | 4,936,254 | |
| | | | | | | | | |
| INTERNET SOFTWARE & SERVICES – 2.3% | | | | | | | | |
| Alphabet, Inc. – Class C (b) | | | 8,300 | | | | 11,732,963 | |
| | | | | | | | | |
| IT SERVICES – 0.9% | | | | | | | | |
| Accenture PLC – Class A (c) | | | 8,000 | | | | 1,717,760 | |
| Automatic Data Processing, Inc. | | | 18,000 | | | | 2,680,020 | |
| | | | | | | | 4,397,780 | |
| MACHINERY – 3.7% | | | | | | | | |
| Caterpillar, Inc. | | | 37,000 | | | | 4,680,500 | |
| Cummins, Inc. | | | 17,000 | | | | 2,945,420 | |
| Ingersoll Rand, Inc. (a)(b) | | | 83,000 | | | | 2,333,960 | |
| Middleby Corporation (b) | | | 79,000 | | | | 6,236,260 | |
| Regal Beloit Corporation | | | 30,400 | | | | 2,654,528 | |
| | | | | | | | 18,850,668 | |
| MATERIALS – 0.8% | | | | | | | | |
| Axalta Coating Systems Ltd. (b)(c) | | | 175,813 | | | | 3,964,583 | |
| | | | | | | | | |
| MEDIA – 6.1% | | | | | | | | |
| Comcast Corporation – Class A | | | 168,000 | | | | 6,548,640 | |
| Discovery, Inc. – Class C (a)(b) | | | 435,854 | | | | 8,394,548 | |
| ViacomCBS, Inc. – Class B (a) | | | 357,000 | | | | 8,325,240 | |
| Walt Disney Company | | | 70,600 | | | | 7,872,606 | |
| | | | | | | | 31,141,034 | |
| MULTILINE RETAIL – 0.9% | | | | | | | | |
| Dollar Tree, Inc. (b) | | | 49,000 | | | | 4,541,320 | |
The accompanying notes are an integral part of these financial statements.
| OLSTEIN ALL CAP VALUE FUND |
COMMON STOCKS – 94.6% – continued | | | | | | |
| OFFICE ELECTRONICS – 0.8% | | Shares | | | Value | |
| Zebra Technologies Corporation – Class A (b) | | | 15,100 | | | $ | 3,864,845 | |
| | | | | | | | | |
| PHARMACEUTICALS – 1.2% | | | | | | | | |
| Johnson & Johnson | | | 26,000 | | | | 3,656,380 | |
| Thermo Fisher Scientific, Inc. | | | 7,000 | | | | 2,536,380 | |
| | | | | | | | 6,192,760 | |
| RESTAURANTS – 3.6% | | | | | | | | |
| Cracker Barrel Old Country Store, Inc. (a) | | | 43,000 | | | | 4,769,130 | |
| Denny’s Corporation (b) | | | 356,275 | | | | 3,598,377 | |
| Dine Brands Global, Inc. (a) | | | 95,538 | | | | 4,022,150 | |
| McDonald’s Corporation | | | 31,000 | | | | 5,718,570 | |
| | | | | | | | 18,108,227 | |
| SEMICONDUCTORS & SEMICONDUCTOR EQUIPMENT – 3.5% | | | | | | | | |
| Intel Corporation | | | 152,000 | | | | 9,094,160 | |
| Kulicke and Soffa Industries, Inc. | | | 238,000 | | | | 4,957,540 | |
| Texas Instruments, Inc. | | | 29,000 | | | | 3,682,130 | |
| | | | | | | | 17,733,830 | |
| SOFTWARE – 1.6% | | | | | | | | |
| Microsoft Corporation | | | 15,200 | | | | 3,093,352 | |
| Oracle Corporation | | | 95,000 | | | | 5,250,650 | |
| | | | | | | | 8,344,002 | |
| SPECIALTY RETAIL – 0.8% | | | | | | | | |
| Lowe’s Companies, Inc. | | | 30,000 | | | | 4,053,600 | |
| | | | | | | | | |
| TELECOMMUNICATIONS – 1.7% | | | | | | | | |
| Corning, Inc. (a) | | | 340,000 | | | | 8,806,000 | |
| | | | | | | | | |
| TEXTILES, APPAREL & LUXURY GOODS – 1.1% | | | | | | | | |
| Tapestry, Inc. (a) | | | 413,000 | | | | 5,484,640 | |
| | | | | | | | | |
| TRANSPORTATION EQUIPMENT – 0.9% | | | | | | | | |
| Greenbrier Companies, Inc. (a) | | | 202,200 | | | | 4,600,050 | |
| TOTAL COMMON STOCKS (Cost $475,449,394) | | | | | | | 480,966,593 | |
The accompanying notes are an integral part of these financial statements.
| OLSTEIN ALL CAP VALUE FUND |
| SHORT-TERM INVESTMENT – 5.4% | | | | | | |
| MONEY MARKET DEPOSIT ACCOUNT – 5.4% | | Shares | | | Value | |
| U.S. Bank N.A., 0.09% (d) | | | | | | |
| Total Money Market Deposit Account | | | 27,417,349 | | | $ | 27,417,349 | |
| TOTAL SHORT-TERM INVESTMENT (Cost $27,417,349) | | | | | | | 27,417,349 | |
| | | | | | | | | |
| INVESTMENT PURCHASED WITH THE CASH | | | | | | | | |
| PROCEEDS FROM SECURITIES LENDING – 20.5% | | | | | | | | |
| INVESTMENT COMPANY – 20.5% | | | | | | | | |
| Mount Vernon Liquid Assets Portfolio, LLC 0.34% (e) | | | | | | | | |
| Total Investment Company | | | 104,189,768 | | | | 104,189,768 | |
| TOTAL INVESTMENT PURCHASED WITH THE CASH | | | | | | | | |
| PROCEEDS FROM SECURITIES LENDING (Cost $104,189,768) | | | | | | | 104,189,768 | |
| | | | | | | | | |
| TOTAL INVESTMENTS – 120.5% | | | | | | | | |
| (Cost $607,056,511) | | | | | | | 612,573,710 | |
| LIABILITIES IN EXCESS OF OTHER ASSETS – (20.5)% | | | | | | | (104,302,808 | ) |
| TOTAL NET ASSETS – 100.0% | | | | | | $ | 508,270,902 | |
| (a) | All or a portion of this security was out on loan at June 30, 2020. Total loaned securities had a value of $102,988,204 at June 30, 2020. |
| (b) | Non-income producing security. |
| (c) | U.S. Dollar-denominated foreign security. |
| (d) | The Money Market Deposit Account (the “MMDA”) is a short-term investment vehicle in which the Fund holds cash balances. The MMDA will bear interest at a variable rate that is determined based on conditions and may change daily and by any amount. The rate shown is as of June 30, 2020. |
| (e) | The rate quoted is the annualized seven-day yield for the fund at year end. |
| | PLC – Public Limited Company |
The accompanying notes are an integral part of these financial statements.
| OLSTEIN ALL CAP VALUE FUND |
Olstein Strategic Opportunities Fund
Schedule of Investments as of June 30, 2020
| COMMON STOCKS – 96.6% | | | | | | |
| AIRLINES – 1.2% | | Shares | | | Value | |
| JetBlue Airways Corporation (a)(b) | | | 62,550 | | | $ | 681,795 | |
| | | | | | | | | |
| AUTO COMPONENTS – 1.8% | | | | | | | | |
| Miller Industries, Inc. | | | 33,523 | | | | 997,980 | |
| | | | | | | | | |
| AUTO MANUFACTURERS – 3.6% | | | | | | | | |
| Blue Bird Corporation (b) | | | 135,121 | | | | 2,025,463 | |
| | | | | | | | | |
| COMMERCIAL BANKS – 10.2% | | | | | | | | |
| Citizens Financial Group, Inc. | | | 84,460 | | | | 2,131,770 | |
| First Hawaiian, Inc. | | | 52,000 | | | | 896,480 | |
| Home BancShares, Inc. (a) | | | 88,000 | | | | 1,353,440 | |
| Prosperity Bancshares, Inc. | | | 23,000 | | | | 1,365,740 | |
| | | | | | | | 5,747,430 | |
| COMMERCIAL SERVICES & SUPPLIES – 1.0% | | | | | | | | |
| Korn Ferry | | | 18,000 | | | | 553,140 | |
| | | | | | | | | |
| CONTAINERS & PACKAGING – 3.0% | | | | | | | | |
| WestRock Company | | | 59,850 | | | | 1,691,361 | |
| | | | | | | | | |
| DIVERSIFIED FINANCIAL SERVICES – 4.8% | | | | | | | | |
| Invesco Ltd. (a)(c) | | | 248,800 | | | | 2,677,088 | |
| | | | | | | | | |
| ELECTRICAL EQUIPMENT – 3.6% | | | | | | | | |
| Generac Holdings, Inc. (a)(b) | | | 10,000 | | | | 1,219,300 | |
| Littelfuse, Inc. (a) | | | 4,600 | | | | 784,898 | |
| | | | | | | | 2,004,198 | |
| ELECTRONIC COMPONENTS – 1.3% | | | | | | | | |
| Vishay Intertechnology, Inc. (a) | | | 46,000 | | | | 702,420 | |
| | | | | | | | | |
| ELECTRONICS – 4.1% | | | | | | | | |
| Keysight Technologies, Inc. (a)(b) | | | 8,400 | | | | 846,552 | |
| Sensata Technologies Holding PLC (b)(c) | | | 39,000 | | | | 1,451,970 | |
| | | | | | | | 2,298,522 | |
| HEALTH CARE EQUIPMENT & SUPPLIES – 3.6% | | | | | | | | |
| Zimmer Biomet Holdings, Inc. | | | 17,000 | | | | 2,029,120 | |
The accompanying notes are an integral part of these financial statements.
| OLSTEIN STRATEGIC OPPORTUNITIES FUND |
COMMON STOCKS – 96.6% – continued | | | | | | |
| HEALTH CARE PRODUCTS – 3.0% | | Shares | | | Value | |
| Integra LifeSciences Holdings Corporation (b) | | | 36,000 | | | $ | 1,691,640 | |
| | | | | | | | | |
| HOTELS & LEISURE – 3.1% | | | | | | | | |
| SeaWorld Entertainment, Inc. (a)(b) | | | 116,250 | | | | 1,721,662 | |
| | | | | | | | | |
| HOUSEHOLD DURABLES – 4.3% | | | | | | | | |
| Central Garden & Pet Company – Class A (b) | | | 39,000 | | | | 1,317,810 | |
| Lifetime Brands, Inc. | | | 166,000 | | | | 1,115,520 | |
| | | | | | | | 2,433,330 | |
| INDUSTRIAL EQUIPMENT WHOLESALE – 3.7% | | | | | | | | |
| WESCO International, Inc. (b) | | | 59,950 | | | | 2,104,845 | |
| | | | | | | | | |
| MACHINERY – 12.8% | | | | | | | | |
| AGCO Corporation | | | 14,000 | | | | 776,440 | |
| Federal Signal Corporation | | | 29,000 | | | | 862,170 | |
| Ingersoll Rand, Inc. (a)(b) | | | 31,000 | | | | 871,720 | |
| Middleby Corporation (b) | | | 18,300 | | | | 1,444,602 | |
| Regal Beloit Corporation | | | 13,564 | | | | 1,184,408 | |
| Shyft Group, Inc. | | | 123,000 | | | | 2,071,320 | |
| | | | | | | | 7,210,660 | |
| MATERIALS – 2.6% | | | | | | | | |
| Axalta Coating Systems Ltd. (b)(c) | | | 64,187 | | | | 1,447,417 | |
| | | | | | | | | |
| MEDIA – 3.5% | | | | | | | | |
| Discovery, Inc. – Class C (a)(b) | | | 102,146 | | | | 1,967,332 | |
| | | | | | | | | |
| OFFICE ELECTRONICS – 2.1% | | | | | | | | |
| Zebra Technologies Corporation – Class A (b) | | | 4,500 | | | | 1,151,775 | |
| | | | | | | | | |
| OIL & GAS – 2.0% | | | | | | | | |
| NOW, Inc. (b) | | | 131,000 | | | | 1,130,530 | |
| | | | | | | | | |
| PHARMACEUTICALS – 2.5% | | | | | | | | |
| Prestige Consumer Healthcare, Inc. (b) | | | 37,000 | | | | 1,389,720 | |
| | | | | | | | | |
| RESTAURANTS – 6.9% | | | | | | | | |
| Cracker Barrel Old Country Store, Inc. (a) | | | 11,000 | | | | 1,220,010 | |
| Denny’s Corporation (b) | | | 118,178 | | | | 1,193,598 | |
| Dine Brands Global, Inc. (a) | | | 35,462 | | | | 1,492,950 | |
| | | | | | | | 3,906,558 | |
The accompanying notes are an integral part of these financial statements.
| OLSTEIN STRATEGIC OPPORTUNITIES FUND |
COMMON STOCKS – 96.6% – continued | | | | | | |
| SEMICONDUCTORS & SEMICONDUCTOR EQUIPMENT – 2.1% | | Shares | | | Value | |
| Kulicke and Soffa Industries, Inc. | | | 57,000 | | | $ | 1,187,310 | |
| | | | | | | | | |
| SPECIALTY RETAIL – 1.4% | | | | | | | | |
| Big Lots, Inc. (a) | | | 19,000 | | | | 798,000 | |
| | | | | | | | | |
| TEXTILES, APPAREL & LUXURY GOODS – 1.3% | | | | | | | | |
| Tapestry, Inc. | | | 56,000 | | | | 743,680 | |
| | | | | | | | | |
| TRANSPORTATION EQUIPMENT – 7.1% | | | | | | | | |
| Greenbrier Companies, Inc. (a) | | | 79,800 | | | | 1,815,450 | |
| Wabash National Corporation (a) | | | 205,871 | | | | 2,186,350 | |
| | | | | | | | 4,001,800 | |
| TOTAL COMMON STOCKS (Cost $56,612,527) | | | | | | | 54,294,776 | |
| | | | | | | | | |
| SHORT-TERM INVESTMENT – 3.6% | | | | | | | | |
| MONEY MARKET DEPOSIT ACCOUNT – 3.6% | | | | | | | | |
| U.S. Bank N.A., 0.09% (d) | | | | | | | | |
| Total Money Market Deposit Account | | | 2,062,131 | | | | 2,062,131 | |
| TOTAL SHORT-TERM INVESTMENT (COST $2,062,131) | | | | | | | 2,062,131 | |
| | | | | | | | | |
| INVESTMENT PURCHASED WITH THE CASH | | | | | | | | |
| PROCEEDS FROM SECURITIES LENDING – 33.6% | | | | | | | | |
| INVESTMENT COMPANY – 33.6% | | | | | | | | |
| Mount Vernon Liquid Assets Portfolio, LLC 0.34% (e) | | | | | | | | |
| Total Investment Company | | | 18,878,913 | | | | 18,878,913 | |
| TOTAL INVESTMENT PURCHASED WITH THE CASH | | | | | | | | |
| PROCEEDS FROM SECURITIES LENDING (Cost $18,878,913) | | | | | | | 18,878,913 | |
| | | | | | | | | |
| TOTAL INVESTMENTS – 133.8% | | | | | | | | |
| (Cost $77,553,571) | | | | | | | 75,235,820 | |
| LIABILITIES IN EXCESS OF OTHER ASSETS – (33.8)% | | | | | | | (19,017,020 | ) |
| TOTAL NET ASSETS – 100.0% | | | | | | $ | 56,218,800 | |
| (a) | All or a portion of this security was out on loan at June 30, 2020. Total loaned securities had a value of $18,546,486 at June 30, 2020. |
| (b) | Non-income producing security. |
| (c) | U.S. Dollar-denominated foreign security. |
| (d) | The Money Market Deposit Account (the “MMDA”) is a short-term investment vehicle in which the Fund holds cash balances. The MMDA will bear interest at a variable rate that is determined based on conditions and may change daily and by any amount. The rate shown is as of June 30, 2020. |
| (e) | The rate quoted is the annualized seven-day yield for the fund at year end. |
| | PLC – Public Limited Company |
The accompanying notes are an integral part of these financial statements.
| OLSTEIN STRATEGIC OPPORTUNITIES FUND |
(THIS PAGE INTENTIONALLY LEFT BLANK.)
The Olstein Funds
Statements of Assets and Liabilities as of June 30, 2020
| | | | | | Olstein | |
| | | Olstein | | | Strategic | |
| | | All Cap | | | Opportunities | |
| | | Value Fund | | | Fund | |
| Assets: | | | | | | |
Investments, at value(1) (at cost $607,056,511 | | | | | | |
| and $77,553,571, respectively) | | $ | 612,573,710 | | | $ | 75,235,820 | |
| Receivable for investment securities sold | | | 222,138 | | | | 45,238 | |
| Receivable for capital shares sold | | | 42,300 | | | | 106,514 | |
| Dividends and interest receivable | | | 664,030 | | | | 26,059 | |
| Securities lending income receivable | | | 6,437 | | | | 1,451 | |
| Prepaid expenses | | | 90,302 | | | | 32,287 | |
| Total Assets | | $ | 613,598,917 | | | $ | 75,447,369 | |
| | | | | | | | | |
| Liabilities: | | | | | | | | |
| Payable upon return of securities loaned | | | 104,189,768 | | | | 18,878,913 | |
| Payable for investment securities purchased | | | 52,444 | | | | 13,781 | |
| Payable for capital shares redeemed | | | 300,070 | | | | 213,151 | |
| Payable to investment adviser | | | 424,563 | | | | 37,741 | |
| Accrued distribution fees | | | 228,841 | | | | 13,294 | |
| Payable for transfer agent fees & expenses | | | 56,683 | | | | 21,145 | |
| Payable for fund administration & accounting fees | | | 32,444 | | | | 22,699 | |
| Payable for trustee fees | | | 2,722 | | | | 2,732 | |
| Payable for compliance fees | | | 2,165 | | | | 2,164 | |
| Payable for custody fees | | | 5,683 | | | | 734 | |
| Payable for audit fees | | | 19,498 | | | | 17,998 | |
| Accrued expenses | | | 13,134 | | | | 4,217 | |
| Total Liabilities | | | 105,328,015 | | | | 19,228,569 | |
| Net Assets | | $ | 508,270,902 | | | $ | 56,218,800 | |
| | | | | | | | | |
| Net Assets Consist of: | | | | | | | | |
| Paid-in capital | | $ | 508,007,992 | | | $ | 63,553,650 | |
| Total distributable earnings (accumulated loss) | | | 262,910 | | | | (7,334,850 | ) |
| Total net assets | | $ | 508,270,902 | | | $ | 56,218,800 | |
| (1) | Includes securities on loan with a value of $102,988,204 and $18,546,486, respectively. |
The accompanying notes are an integral part of these financial statements.
| | | | | | Olstein | |
| | | Olstein | | | Strategic | |
| | | All Cap | | | Opportunities | |
| | | Value Fund | | | Fund | |
| Class A: | | | | | | |
| Net assets | | $ | 93,358,924 | | | $ | 15,872,892 | |
Shares of beneficial interest outstanding(1) | | | 4,362,769 | | | | 1,044,667 | |
| Net asset value, offering price and redemption price per share | | $ | 21.40 | | | $ | 15.19 | |
Maximum offering price per share(2) | | $ | 22.65 | | | $ | 16.07 | |
| | | | | | | | | |
| Class C: | | | | | | | | |
| Net assets | | $ | 248,420,437 | | | $ | 11,134,887 | |
Shares of beneficial interest outstanding(1) | | | 15,031,687 | | | | 823,842 | |
Net asset value, offering price and redemption price per share(3) | | $ | 16.53 | | | $ | 13.52 | |
| | | | | | | | | |
| Adviser Class: | | | | | | | | |
| Net assets | | $ | 166,491,541 | | | $ | 29,211,021 | |
Shares of beneficial interest outstanding(1) | | | 7,741,823 | | | | 1,897,965 | |
| Net asset value, offering price and redemption price per share | | $ | 21.51 | | | $ | 15.39 | |
| (1) | Unlimited number of shares authorized without par value. |
| (2) | The offering price is calculated by dividing the net asset value by 1 minus the maximum sales charge of 5.50%. |
| (3) | May be subject to a contingent deferred sales charge of 1.00% on certain shares redeemed within 12 months of purchase on Class C shares. |
The accompanying notes are an integral part of these financial statements.
The Olstein Funds
Statements of Operations
For the Year Ended June 30, 2020
| | | | | | Olstein | |
| | | Olstein | | | Strategic | |
| | | All Cap | | | Opportunities | |
| | | Value Fund | | | Fund | |
| Investment Income: | | | | | | |
| Dividend income | | $ | 11,380,362 | | | $ | 994,947 | |
| Interest income | | | 740,624 | | | | 61,273 | |
| Securities lending income, net | | | 94,844 | | | | 22,815 | |
| Total investment income | | | 12,215,830 | | | | 1,079,035 | |
| | | | | | | | | |
| Expenses: | | | | | | | | |
| Investment advisory fees (See Note 4) | | | 5,683,061 | | | | 703,677 | |
| Transfer agent fees & expenses (See Note 4) | | | 337,886 | | | | 119,608 | |
| Fund administration & accounting fees (See Note 4) | | | 291,019 | | | | 131,216 | |
| Federal & state registration fees | | | 55,138 | | | | 47,092 | |
| Custody fees (See Note 4) | | | 38,757 | | | | 5,238 | |
| Postage & printing fees | | | 28,296 | | | | 6,672 | |
| Legal fees | | | 26,222 | | | | 25,660 | |
| Insurance fees | | | 20,182 | | | | 3,850 | |
| Audit fees | | | 19,505 | | | | 17,999 | |
| Trustee fees | | | 13,147 | | | | 12,921 | |
| Compliance fees (See Note 4) | | | 12,999 | | | | 12,999 | |
| Other expenses | | | 7,283 | | | | 5,835 | |
| Distribution fees (See Note 5) | | | | | | | | |
| Class A | | | 155,592 | | | | 44,954 | |
| Class C | | | 3,215,594 | | | | 152,162 | |
| Total expenses | | | 9,904,681 | | | | 1,289,883 | |
| Less: waiver from investment adviser (See Note 4) | | | — | | | | (142,803 | ) |
| Net expenses | | | 9,904,681 | | | | 1,147,080 | |
| Net investment income (loss) | | | 2,311,149 | | | | (68,045 | ) |
| | | | | | | | | |
| Realized and Unrealized Loss on Investments: | | | | | | | | |
| Net realized loss on investments | | | (2,774,105 | ) | | | (3,431,991 | ) |
| Net change in unrealized appreciation/depreciation on investments | | | (52,494,596 | ) | | | (6,187,114 | ) |
| Net realized and unrealized loss on investments | | | (55,268,701 | ) | | | (9,619,105 | ) |
| Net decrease in net assets resulting from operations | | $ | (52,957,552 | ) | | $ | (9,687,150 | ) |
The accompanying notes are an integral part of these financial statements.
(THIS PAGE INTENTIONALLY LEFT BLANK.)
Olstein All Cap Value Fund
Statements of Changes in Net Assets
| | | For the | | | For the | |
| | | Year Ended | | | Year Ended | |
| | | June 30, 2020 | | | June 30, 2019 | |
| Operations: | | | | | | |
| Net investment income | | $ | 2,311,149 | | | $ | 1,030,634 | |
| Net realized gain (loss) on investments | | | (2,774,105 | ) | | | 25,818,043 | |
| Change in unrealized appreciation/depreciation on investments | | | (52,494,596 | ) | | | 3,206,445 | |
| Net increase (decrease) in net assets resulting from operations | | | (52,957,552 | ) | | | 30,055,122 | |
| | | | | | | | | |
| Capital Share Transactions: | | | | | | | | |
Class A(1): | | | | | | | | |
| Proceeds from shares sold | | | 91,262,827 | | | | 13,341,335 | |
| Proceeds from reinvestment of distributions | | | 2,029,505 | | | | 68 | |
| Payments for shares redeemed | | | (6,057,487 | ) | | | (689,390 | ) |
| Increase in net assets resulting from Class A transactions | | | 87,234,845 | | | | 12,652,013 | |
| Class C: | | | | | | | | |
| Proceeds from shares sold | | | 4,357,258 | | | | 4,678,652 | |
| Proceeds from reinvestment of distributions | | | 9,924,575 | | | | 34,974,662 | |
| Payments for shares redeemed | | | (123,362,849 | ) | | | (76,243,691 | ) |
| Decrease in net assets resulting from Class C transactions | | | (109,081,016 | ) | | | (36,590,377 | ) |
| Adviser Class: | | | | | | | | |
| Proceeds from shares sold | | | 8,272,852 | | | | 8,354,399 | |
| Proceeds from reinvestment of distributions | | | 5,200,929 | | | | 12,734,803 | |
| Payments for shares redeemed | | | (18,982,393 | ) | | | (27,670,335 | ) |
| Decrease in net assets resulting | | | | | | | | |
| from Adviser Class transactions | | | (5,508,612 | ) | | | (6,581,133 | ) |
| Net decrease in net assets from capital share transactions | | | (27,354,783 | ) | | | (30,519,497 | ) |
| (1) | Inception date of Class A was September 17, 2018. |
The accompanying notes are an integral part of these financial statements.
| OLSTEIN ALL CAP VALUE FUND |
| | | For the | | | For the | |
| | | Year Ended | | | Year Ended | |
| | | June 30, 2020 | | | June 30, 2019 | |
| Distributions to shareholders: | | | | | | |
Class A(1) | | $ | (2,033,873 | ) | | $ | (68 | ) |
| Class C | | | (11,483,184 | ) | | | (38,756,217 | ) |
| Adviser Class | | | (5,937,958 | ) | | | (14,497,588 | ) |
| Total distributions to shareholders | | | (19,455,015 | ) | | | (53,253,873 | ) |
| | | | | | | | | |
| Total Decrease in Net Assets: | | | (99,767,350 | ) | | | (53,718,248 | ) |
| | | | | | | | | |
| Net Assets: | | | | | | | | |
| Beginning of year | | | 608,038,252 | | | | 661,756,500 | |
| End of year | | $ | 508,270,902 | | | $ | 608,038,252 | |
The accompanying notes are an integral part of these financial statements.
| OLSTEIN ALL CAP VALUE FUND |
Olstein Strategic Opportunities Fund
Statements of Changes in Net Assets
| | | For the | | | For the | |
| | | Year Ended | | | Year Ended | |
| | | June 30, 2020 | | | June 30, 2019 | |
| Operations: | | | | | | |
| Net investment loss | | $ | (68,045 | ) | | $ | (187,241 | ) |
| Net realized gain (loss) on investments | | | (3,431,991 | ) | | | 3,749,961 | |
| Change in unrealized appreciation/depreciation on investments | | | (6,187,114 | ) | | | (4,286,931 | ) |
| Net decrease in net assets resulting from operations | | | (9,687,150 | ) | | | (724,211 | ) |
| | | | | | | | | |
| Capital Share Transactions: | | | | | | | | |
| Class A: | | | | | | | | |
| Proceeds from shares sold | | | 5,238,030 | | | | 1,291,668 | |
| Proceeds from reinvestment of distributions | | | — | | | | 136,525 | |
| Payments for shares redeemed | | | (4,721,176 | ) | | | (6,296,117 | ) |
| Increase (Decrease) in net assets resulting | | | | | | | | |
| from Class A transactions | | | 516,854 | | | | (4,867,924 | ) |
| Class C: | | | | | | | | |
| Proceeds from shares sold | | | 659,540 | | | | 1,373,230 | |
| Proceeds from reinvestment of distributions | | | — | | | | 182,393 | |
| Payments for shares redeemed | | | (7,095,684 | ) | | | (6,053,844 | ) |
| Decrease in net assets resulting from Class C transactions | | | (6,436,144 | ) | | | (4,498,221 | ) |
| Adviser Class: | | | | | | | | |
| Proceeds from shares sold | | | 5,295,661 | | | | 4,535,213 | |
| Proceeds from reinvestment of distributions | | | — | | | | 382,394 | |
| Payments for shares redeemed | | | (12,059,842 | ) | | | (36,904,913 | ) |
| Decrease in net assets resulting from | | | | | | | | |
| Adviser Class transactions | | | (6,764,181 | ) | | | (31,987,306 | ) |
| Net decrease in net assets from capital share transactions | | | (12,683,471 | ) | | | (41,353,451 | ) |
The accompanying notes are an integral part of these financial statements.
| OLSTEIN STRATEGIC OPPORTUNITIES FUND |
| | | For the | | | For the | |
| | | Year Ended | | | Year Ended | |
| | | June 30, 2020 | | | June 30, 2019 | |
| Distributions to shareholders: | | | | | | |
| Class A | | $ | — | | | $ | (169,641 | ) |
| Class C | | | — | | | | (193,761 | ) |
| Adviser Class | | | — | | | | (417,384 | ) |
| Total distributions to shareholders | | | — | | | | (780,786 | ) |
| | | | | | | | | |
| Total decrease in net assets | | | (22,370,621 | ) | | | (42,858,448 | ) |
| | | | | | | | | |
| Net Assets | | | | | | | | |
| Beginning of year | | | 78,589,421 | | | | 121,447,869 | |
| End of year | | $ | 56,218,800 | | | $ | 78,589,421 | |
The accompanying notes are an integral part of these financial statements.
| OLSTEIN STRATEGIC OPPORTUNITIES FUND |
Olstein All Cap Value Fund
Financial Highlights
Class A
| | | | | | Period | |
| | | For the | | | Inception(1) | |
| | | Year Ended | | | through | |
| | | June 30, | | | June 30, | |
| | | 2020 | | | 2019 | |
| Net Asset Value, Beginning of Period | | $ | 24.10 | | | $ | 26.07 | |
| Investment Operations: | | | | | | | | |
Net investment income(2) | | | 0.17 | | | | 0.13 | |
| Net realized and unrealized loss on investments | | | (2.12 | ) | | | (0.32 | ) |
| Total from investment operations | | | (1.95 | ) | | | (0.19 | ) |
| Less distributions from: | | | | | | | | |
| Net investment income | | | (0.10 | ) | | | — | |
| Net realized gains | | | (0.65 | ) | | | (1.78 | ) |
| Total distributions | | | (0.75 | ) | | | (1.78 | ) |
| Net Asset Value, End of Period | | $ | 21.40 | | | $ | 24.10 | |
Total Return(3)(4) | | | -8.54 | % | | | 0.04 | % |
| Supplemental Data and Ratios | | | | | | | | |
| Net assets, end of period (000’s omitted) | | $ | 93,359 | | | $ | 12,920 | |
Ratio of expenses to average net assets(5) | | | 1.40 | % | | | 1.43 | % |
Ratio of net investment income to average net assets(5) | | | 0.75 | % | | | 0.68 | % |
Portfolio Turnover(4)(6) | | | 47.68 | % | | | 38.73 | % |
| (1) | Inception date of Class A was September 17, 2018. |
| (2) | Per share amounts calculated using the average shares method. |
| (3) | Total return does not reflect sales charges. |
| (4) | Not annualized for periods less than one year. |
| (5) | Annualized for periods less than one year. |
| (6) | Portfolio turnover disclosed is for the Fund as a whole. |
The accompanying notes are an integral part of these financial statements.
| OLSTEIN ALL CAP VALUE FUND |
Olstein All Cap Value Fund
Financial Highlights
Class C
| | | For the | | | For the | | | For the | | | For the | | | For the | |
| | | Year | | | Year | | | Year | | | Year | | | Year | |
| | | Ended | | | Ended | | | Ended | | | Ended | | | Ended | |
| | | June 30, | | | June 30, | | | June 30, | | | June 30, | | | June 30, | |
| | | 2020 | | | 2019 | | | 2018 | | | 2017 | | | 2016 | |
| Net Asset Value, Beginning of Year | | $ | 18.82 | | | $ | 19.79 | | | $ | 19.90 | | | $ | 16.70 | | | $ | 21.40 | |
| Investment Operations: | | | | | | | | | | | | | | | | | | | | |
Net investment loss(1) | | | (0.00 | )(2) | | | (0.03 | ) | | | (0.12 | ) | | | (0.14 | ) | | | (0.07 | ) |
| Net realized and unrealized | | | | | | | | | | | | | | | | | | | | |
| gain (loss) on investments | | | (1.64 | ) | | | 0.84 | | | | 1.22 | | | | 3.38 | | | | (1.74 | ) |
| Total from investment operations | | | (1.64 | ) | | | 0.81 | | | | 1.10 | | | | 3.24 | | | | (1.81 | ) |
| Less distributions from: | | | | | | | | | | | | | | | | | | | | |
| Net realized gains | | | (0.65 | ) | | | (1.78 | ) | | | (1.21 | ) | | | (0.04 | ) | | | (2.89 | ) |
| Total distributions | | | (0.65 | ) | | | (1.78 | ) | | | (1.21 | ) | | | (0.04 | ) | | | (2.89 | ) |
| Net Asset Value, End of Year | | $ | 16.53 | | | $ | 18.82 | | | $ | 19.79 | | | $ | 19.90 | | | $ | 16.70 | |
Total Return(3) | | | -9.21 | % | | | 5.07 | % | | | 5.57 | % | | | 19.42 | % | | | -8.83 | % |
| Supplement Data and Ratios | | | | | | | | | | | | | | | | | | | | |
| Net assets, end of year (000’s omitted) | | $ | 248,420 | | | $ | 400,820 | | | $ | 456,794 | | | $ | 493,526 | | | $ | 463,972 | |
| Ratio of expenses to average net assets | | | 2.15 | % | | | 2.19 | % | | | 2.25 | % | | | 2.25 | % | | | 2.25 | % |
| Ratio of net investment loss to average net assets | | | (0.00 | )%(5) | | | (0.15 | )% | | | (0.60 | )% | | | (0.74 | )% | | | (0.40 | )% |
Portfolio Turnover(4) | | | 47.68 | % | | | 38.73 | % | | | 53.79 | % | | | 55.51 | % | | | 51.13 | % |
| (1) | Per share amounts calculated using the average shares method. |
| (2) | Amount rounds to less than $0.01 per share. |
| (3) | Total return does not reflect sales charges. |
| (4) | Portfolio turnover disclosed is for the Fund as a whole. |
| (5) | Amount rounds to less than 0.01%. |
The accompanying notes are an integral part of these financial statements.
| OLSTEIN ALL CAP VALUE FUND |
Olstein All Cap Value Fund
Financial Highlights
Adviser Class
| | | For the | | | For the | | | For the | | | For the | | | For the | |
| | | Year | | | Year | | | Year | | | Year | | | Year | |
| | | Ended | | | Ended | | | Ended | | | Ended | | | Ended | |
| | | June 30, | | | June 30, | | | June 30, | | | June 30, | | | June 30, | |
| | | 2020 | | | 2019 | | | 2018 | | | 2017 | | | 2016 | |
| Net Asset Value, Beginning of Year | | $ | 24.15 | | | $ | 24.64 | | | $ | 24.25 | | | $ | 20.15 | | | $ | 24.94 | |
| Investment Operations: | | | | | | | | | | | | | | | | | | | | |
Net investment income(1) | | | 0.23 | | | | 0.20 | | | | 0.10 | | | | 0.06 | | | | 0.13 | |
| Net realized and unrealized | | | | | | | | | | | | | | | | | | | | |
| gain (loss) on investments | | | (2.13 | ) | | | 1.09 | | | | 1.50 | | | | 4.08 | | | | (2.03 | ) |
| Total from investment operations | | | (1.90 | ) | | | 1.29 | | | | 1.60 | | | | 4.14 | | | | (1.90 | ) |
| Less distributions from: | | | | | | | | | | | | | | | | | | | | |
| Net investment income | | | (0.09 | ) | | | — | | | | — | | | | — | | | | — | |
| Net realized gains | | | (0.65 | ) | | | (1.78 | ) | | | (1.21 | ) | | | (0.04 | ) | | | (2.89 | ) |
| Total distributions | | | (0.74 | ) | | | (1.78 | ) | | | (1.21 | ) | | | (0.04 | ) | | | (2.89 | ) |
| Net Asset Value, End of Year | | $ | 21.51 | | | $ | 24.15 | | | $ | 24.64 | | | $ | 24.25 | | | $ | 20.15 | |
| Total Return | | | -8.27 | % | | | 6.06 | % | | | 6.66 | % | | | 20.56 | % | | | -7.87 | % |
| Supplement Data and Ratios | | | | | | | | | | | | | | | | | | | | |
| Net assets, end of year (000’s omitted) | | $ | 166,492 | | | $ | 194,298 | | | $ | 204,963 | | | $ | 198,876 | | | $ | 166,465 | |
| Ratio of expenses to average net assets | | | 1.15 | % | | | 1.19 | % | | | 1.25 | % | | | 1.25 | % | | | 1.25 | % |
| Ratio of net investment income to average net assets | | | 1.00 | % | | | 0.85 | % | | | 0.40 | % | | | 0.26 | % | | | 0.60 | % |
Portfolio Turnover(2) | | | 47.68 | % | | | 38.73 | % | | | 53.79 | % | | | 55.51 | % | | | 51.13 | % |
| (1) | Per share amounts calculated using the average shares method. |
| (2) | Portfolio turnover disclosed is for the Fund as a whole. |
The accompanying notes are an integral part of these financial statements.
| OLSTEIN ALL CAP VALUE FUND |
Olstein Strategic Opportunities Fund
Financial Highlights
Class A
| | | For the | | | For the | | | For the | | | For the | | | For the | |
| | | Year | | | Year | | | Year | | | Year | | | Year | |
| | | Ended | | | Ended | | | Ended | | | Ended | | | Ended | |
| | | June 30, | | | June 30, | | | June 30, | | | June 30, | | | June 30, | |
| | | 2020 | | | 2019 | | | 2018 | | | 2017 | | | 2016 | |
| Net Asset Value, Beginning of Year | | $ | 17.24 | | | $ | 17.46 | | | $ | 16.90 | | | $ | 13.61 | | | $ | 17.71 | |
| Investment Operations: | | | | | | | | | | | | | | | | | | | | |
Net investment loss(1) | | | (0.01 | ) | | | (0.03 | ) | | | (0.09 | ) | | | (0.08 | ) | | | (0.05 | ) |
| Net realized and unrealized | | | | | | | | | | | | | | | | | | | | |
| gain (loss) on investments | | | (2.04 | ) | | | (0.05 | ) | | | 0.65 | | | | 3.37 | | | | (2.63 | ) |
| Total from investment operations | | | (2.05 | ) | | | (0.08 | ) | | | 0.56 | | | | 3.29 | | | | (2.68 | ) |
| Less distributions from: | | | | | | | | | | | | | | | | | | | | |
| Net realized gains | | | — | | | | (0.14 | ) | | | — | | | | — | | | | (1.42 | ) |
| Total distributions | | | — | | | | (0.14 | ) | | | — | | | | — | | | | (1.42 | ) |
| Net Asset Value, End of Year | | $ | 15.19 | | | $ | 17.24 | | | $ | 17.46 | | | $ | 16.90 | | | $ | 13.61 | |
Total Return(2) | | | -11.89 | % | | | -0.38 | % | | | 3.31 | % | | | 24.17 | % | | | -15.31 | % |
| Supplemental Data and Ratios | | | | | | | | | | | | | | | | | | | | |
| Net assets, end of year (000’s omitted) | | $ | 15,873 | | | $ | 17,801 | | | $ | 23,176 | | | $ | 31,537 | | | $ | 46,225 | |
| Ratio of expenses to average net assets: | | | | | | | | | | | | | | | | | | | | |
| Before expense waiver | | | 1.81 | % | | | 1.73 | % | | | 1.62 | % | | | 1.61 | % | | | 1.70 | % |
| After expense waiver | | | 1.60 | % | | | 1.60 | % | | | 1.60 | % | | | 1.60 | % | | | 1.60 | % |
| Ratio of net investment loss to average net assets: | | | | | | | | | | | | | | | | | | | | |
| After expense waiver | | | (0.07 | )% | | | (0.17 | )% | | | (0.54 | )% | | | (0.50 | )% | | | (0.31 | )% |
| Portfolio Turnover | | | 45.05 | % | | | 35.03 | % | | | 52.98 | % | | | 64.90 | % | | | 58.24 | % |
| (1) | Per share amounts calculated using the average shares method. |
| (2) | Total return does not reflect sales charges. |
The accompanying notes are an integral part of these financial statements.
| OLSTEIN STRATEGIC OPPORTUNITIES FUND |
Olstein Strategic Opportunities Fund
Financial Highlights
Class C
| | | For the | | | For the | | | For the | | | For the | | | For the | |
| | | Year | | | Year | | | Year | | | Year | | | Year | |
| | | Ended | | | Ended | | | Ended | | | Ended | | | Ended | |
| | | June 30, | | | June 30, | | | June 30, | | | June 30, | | | June 30, | |
| | | 2020 | | | 2019 | | | 2018 | | | 2017 | | | 2016 | |
| Net Asset Value, Beginning of Year | | $ | 15.45 | | | $ | 15.78 | | | $ | 15.39 | | | $ | 12.49 | | | $ | 16.50 | |
| Investment Operations: | | | | | | | | | | | | | | | | | | | | |
Net investment loss(1) | | | (0.12 | ) | | | (0.14 | ) | | | (0.20 | ) | | | (0.18 | ) | | | (0.14 | ) |
| Net realized and unrealized | | | | | | | | | | | | | | | | | | | | |
| gain (loss) on investments | | | (1.81 | ) | | | (0.05 | ) | | | 0.59 | | | | 3.08 | | | | (2.45 | ) |
| Total from investment operations | | | (1.93 | ) | | | (0.19 | ) | | | 0.39 | | | | 2.90 | | | | (2.59 | ) |
| Less distributions from: | | | | | | | | | | | | | | | | | | | | |
| Net realized gains | | | — | | | | (0.14 | ) | | | — | | | | — | | | | (1.42 | ) |
| Total distributions | | | — | | | | (0.14 | ) | | | — | | | | — | | | | (1.42 | ) |
| Net Asset Value, End of Year | | $ | 13.52 | | | $ | 15.45 | | | $ | 15.78 | | | $ | 15.39 | | | $ | 12.49 | |
Total Return(2) | | | -12.49 | % | | | -1.12 | % | | | 2.53 | % | | | 23.22 | % | | | -15.92 | % |
| Supplemental Data and Ratios | | | | | | | | | | | | | | | | | | | | |
| Net assets, end of year (000’s omitted) | | $ | 11,135 | | | $ | 19,532 | | | $ | 24,484 | | | $ | 35,107 | | | $ | 36,127 | |
| Ratio of expenses to average net assets: | | | | | | | | | | | | | | | | | | | | |
| Before expense waiver | | | 2.55 | % | | | 2.48 | % | | | 2.37 | % | | | 2.36 | % | | | 2.45 | % |
| After expense waiver | | | 2.35 | % | | | 2.35 | % | | | 2.35 | % | | | 2.35 | % | | | 2.35 | % |
| Ratio of net investment loss to average net assets: | | | | | | | | | | | | | | | | | | | | |
| After expense waiver | | | (0.82 | )% | | | (0.92 | )% | | | (1.29 | )% | | | (1.25 | )% | | | (1.05 | )% |
| Portfolio Turnover | | | 45.05 | % | | | 35.03 | % | | | 52.98 | % | | | 64.90 | % | | | 58.24 | % |
| (1) | Per share amounts calculated using the average shares method. |
| (2) | Total return does not reflect sales charges. |
The accompanying notes are an integral part of these financial statements.
| OLSTEIN STRATEGIC OPPORTUNITIES FUND |
Olstein Strategic Opportunities Fund
Financial Highlights
Adviser Class
| | | For the | | | For the | | | For the | | | For the | | | For the | |
| | | Year | | | Year | | | Year | | | Year | | | Year | |
| | | Ended | | | Ended | | | Ended | | | Ended | | | Ended | |
| | | June 30, | | | June 30, | | | June 30, | | | June 30, | | | June 30, | |
| | | 2020 | | | 2019 | | | 2018 | | | 2017 | | | 2016 | |
| Net Asset Value, Beginning of Year | | $ | 17.42 | | | $ | 17.60 | | | $ | 16.99 | | | $ | 13.65 | | | $ | 17.72 | |
| Investment Operations: | | | | | | | | | | | | | | | | | | | | |
Net investment income (loss)(1) | | | 0.03 | | | | 0.01 | | | | (0.05 | ) | | | (0.04 | ) | | | (0.01 | ) |
| Net realized and unrealized | | | | | | | | | | | | | | | | | | | | |
| gain (loss) on investments | | | (2.06 | ) | | | (0.05 | ) | | | 0.66 | | | | 3.38 | | | | (2.64 | ) |
| Total from investment operations | | | (2.03 | ) | | | (0.04 | ) | | | 0.61 | | | | 3.34 | | | | (2.65 | ) |
| Less distributions from: | | | | | | | | | | | | | | | | | | | | |
| Net realized gains | | | — | | | | (0.14 | ) | | | — | | | | — | | | | (1.42 | ) |
| Total distributions | | | — | | | | (0.14 | ) | | | — | | | | — | | | | (1.42 | ) |
| Net Asset Value, End of Year | | $ | 15.39 | | | $ | 17.42 | | | $ | 17.60 | | | $ | 16.99 | | | $ | 13.65 | |
| Total Return | | | -11.65 | % | | | -0.15 | % | | | 3.59 | % | | | 24.47 | % | | | -15.11 | % |
| Supplemental Data and Ratios | | | | | | | | | | | | | | | | | | | | |
| Net assets, end of year (000’s omitted) | | $ | 29,211 | | | $ | 41,256 | | | $ | 73,788 | | | $ | 86,824 | | | $ | 60,159 | |
| Ratio of expenses to average net assets: | | | | | | | | | | | | | | | | | | | | |
| Before expense waiver | | | 1.55 | % | | | 1.48 | % | | | 1.37 | % | | | 1.36 | % | | | 1.45 | % |
| After expense waiver | | | 1.35 | % | | | 1.35 | % | | | 1.35 | % | | | 1.35 | % | | | 1.35 | % |
| Ratio of net investment income (loss) | | | | | | | | | | | | | | | | | | | | |
| to average net assets: | | | | | | | | | | | | | | | | | | | | |
| After expense waiver | | | 0.18 | % | | | 0.08 | % | | | (0.29 | )% | | | (0.25 | )% | | | (0.06 | )% |
| Portfolio Turnover | | | 45.05 | % | | | 35.03 | % | | | 52.98 | % | | | 64.90 | % | | | 58.24 | % |
| (1) | Per share amounts calculated using the average shares method. |
The accompanying notes are an integral part of these financial statements.
| OLSTEIN STRATEGIC OPPORTUNITIES FUND |
The Olstein Funds
Notes to Financial Statements
| 1 | Organization Managed Portfolio Series (the “Trust”) was organized as a Delaware statutory trust on January 27, 2011. The Trust is registered under the Investment Company Act of 1940, as amended (the “1940 Act”), as an open-end management investment company. The Olstein All Cap Value Fund (“All Cap Value Fund”) and Olstein Strategic Opportunities Fund (“Strategic Fund”) (each a “Fund” and collectively, the “Funds”) are each a diversified series with their own investment objectives and policies within the Trust. The investment objective of each Fund is long-term capital appreciation with a secondary objective of income. The Funds are investment companies and accordingly follow the investment company accounting and reporting guidance of the Financial Accounting Standards Board (“FASB”) Accounting Standards Codification Topic 946 Financial Services – Investment Companies. Each Fund offers three different share classes – Adviser Class, Class A, and Class C. The All Cap Value Fund commenced operations on September 21, 1995. The Class C shares commenced operations on September 21, 1995, the Adviser Class shares commenced operations on September 1, 1999, and the Class A shares commenced operations on September 17, 2018. The Strategic Fund commenced operations on November 1, 2006. The Class A shares and Class C shares each commenced operations on November 1, 2006 and the Adviser Class shares commenced operations on May 11, 2015. Each class of shares has identical rights and privileges except with respect to distribution fees and voting rights on matters affecting a single share class. Class A shares are subject to a front-end sales charge of up to 5.50% and a 0.25% Rule 12b-1 distribution and servicing fee. Class C shares may be subject to a contingent deferred sales charge of up to 1.00% and are subject to a 1.00% Rule 12b-1 distribution and servicing fee. The Funds may issue an unlimited number of shares of beneficial interest without par value. |
| | |
| | On September 14, 2018, as the result of a tax-free reorganization, the Olstein All Cap Value Fund and Olstein Strategic Opportunities Fund (collectively the “Predecessor Funds”), each a series of the Olstein Funds, a registered open-end management investment company, were transferred into a newly created series of the Trust. The plan of reorganization was approved by the shareholders of the Predecessor Funds on September 12, 2018. On September 14, 2018, the Predecessor Funds |
| were renamed the Olstein All Cap Value Fund and the Olstein Strategic Opportunities Fund and all of their shares were exchanged for shares of the corresponding classes of the All Cap Value Fund and the Strategic Fund. The Predecessor Funds were deemed to be the accounting survivors for financial reporting purposes and as a result, the financial statements of the All Cap Value Fund and Strategic Fund reflect the operations of the Predecessor Funds for the period prior to the reorganization date. |
| |
| As a tax-free reorganization, any unrealized appreciation or depreciation on the securities on the date of reorganization was treated as a non-taxable event, thus the cost basis of the securities held reflect their historical cost basis as of the date of reorganization. Immediately prior to the reorganization, the net assets, fair value of investments, and net unrealized appreciation of the Predecessor Funds were as follows: |
| | | | Fair Value of | Unrealized |
| | Fund | Net Assets | Investments | Net Appreciation |
| | Predecessor All Cap Value Fund | $685,050,053 | $684,263,125 | $83,404,222 |
| | Predecessor Strategic Opportunities Fund | 106,334,750 | 106,274,524 | 11,906,618 |
| | At the date of reorganization, total fund shares outstanding for the Predecessor All Cap Value Fund and Predecessor Strategic Opportunities Fund, were as follows: |
| | Predecessor Shares Outstanding |
| | Fund | Class A | Class C | Adviser Class | Total |
| | Predecessor All Cap Value Fund | — | 22,398,817 | 8,248,190 | 30,647,007 |
| | Predecessor Strategic Opportunities Fund | 1,261,998 | 1,480,446 | 3,092,629 | 5,835,073 |
| 2 | Significant Accounting Policies The following is a summary of significant accounting policies consistently followed by the Funds in preparation of their financial statements. These policies are in conformity with generally accepted accounting principles in the United States of America (“GAAP”). |
| | |
| | Security Valuation. All investments in securities are recorded at their estimated fair value, as described in Note 3. |
| | |
| | Federal Income Taxes. The Funds comply with the requirements of subchapter M of the Internal Revenue Code of 1986, as amended, necessary to qualify as regulated investment companies and distribute substantially all net taxable investment income and net realized gains to shareholders in a manner which results in no tax cost to the Funds. Therefore, no federal income or excise tax provision is required. As of and during the year ended June 30, 2020, the Funds did not have any tax positions that did not meet the “more-likely-than-not” threshold of being sustained by the applicable tax authority. As of |
| | and during the year ended June 30, 2020, the Funds did not have liabilities for any unrecognized tax benefits. The Funds recognize interest and penalties, if any, related to unrecognized tax benefits on uncertain tax positions as income tax expense in the Statements of Operations. As of and during the year ended June 30, 2020, the Funds did not incur any interest or penalties. The Funds are not subject to examination by U.S. tax authorities for tax years prior to the fiscal year ended June 30, 2017. |
| | |
| | Security Transactions, Income and Distributions. The Funds follow industry practice and record security transactions on the trade date. Realized gains and losses on sales of securities are calculated on the basis of identified cost. Dividend income is recorded on the ex-dividend date and interest income is recorded on an accrual basis. Withholding taxes on foreign dividends have been provided for in accordance with the Funds’ understanding of the applicable country’s tax rules and regulations. Discounts and premiums on securities purchased are amortized over the expected life of the respective securities using the constant yield method. |
| | |
| | The Funds distribute substantially all net investment income and net realized capital gains, if any, at least annually. Distributions to shareholders are recorded on the ex-dividend date. The treatment for financial reporting purposes of distributions made to shareholders during the year from net investment income or net realized capital gains may differ from their treatment for federal income tax purposes. These differences are caused primarily by differences in the timing of the recognition of certain components of income, expense or realized capital gain for federal income tax purposes. Where such differences are permanent in nature, GAAP requires that they be reclassified in the components of the net assets based on their ultimate characterization for federal income tax purposes. Any such reclassifications will have no effect on net assets, results of operations or net asset value (“NAV”) per share of the Funds. For the year ended June 30, 2020, the following reclassifications were made: |
| | | Total Distributable Earnings | |
| | Fund | (Accumulated Loss) | Paid-In Capital |
| | All Cap Value Fund | $ — | $ — |
| | Strategic Fund | 47,816 | (47,816) |
| | Adjustments to the Funds shown in the above table were due to net operating loss forfeiture. |
| | |
| | Allocation of Income, Expenses and Gains/Losses. Income, expenses (other than those deemed attributable to a specific share class), and gains and losses of the Funds are allocated daily to each class of shares based upon the ratio of net assets represented by each class as a percentage of the net assets of each Fund. Expenses deemed directly attributable to a class of shares are recorded by the specific class. Most Fund expenses are allocated by class based on relative net assets. 12b-1 fees are expensed at an annual rate of 0.25% and 1.00% of the Class A shares and Class C shares average daily net assets, respectively (See Note 5). Expenses associated with a specific fund in the Trust are charged to that fund. Common Trust expenses are typically allocated evenly between the Funds of the Trust, or by other equitable means. |
| | |
| | Use of Estimates. The preparation of financial statements in conformity with GAAP requires management to make estimates and assumptions that affect the reported amounts of assets and liabilities and disclosure of contingent assets and liabilities at the date of the financial statements and the reported amounts of revenues and expenses during the reporting period. Actual results could differ from those estimates. |
| | |
| 3 | Securities Valuation The Funds have adopted authoritative fair value accounting standards which establish an authoritative definition of fair value and set out a hierarchy for measuring fair value. These standards require additional disclosures about the various inputs and valuation techniques used to develop the measurements of fair value, a discussion in changes in valuation techniques and related inputs during the period and expanded disclosure of valuation Levels for major security types. These inputs are summarized in the three broad Levels listed below: |
| | Level 1 – | Unadjusted quoted prices in active markets for identical assets or liabilities that the Funds have the ability to access. |
| | | |
| | Level 2 – | Observable inputs other than quoted prices included in Level 1 that are observable for the asset or liability, either directly or indirectly. These inputs may include quoted prices for the identical instrument on an inactive market, prices for similar instruments, interest rates, prepayment speeds, credit risk, yield curves, default rates and similar data. |
| | Level 3 – | Unobservable inputs for the asset or liability, to the extent relevant observable inputs are not available, representing the Funds’ own assumptions about the assumptions a market participant would use in valuing the asset or liability, and would be based on the best information available. |
| | Following is a description of the valuation techniques applied to each Fund’s major categories of assets and liabilities measured at fair value on a recurring basis. Each Fund’s investments are carried at fair value. |
| | |
| | Equity Securities. Equity securities that are primarily traded on a national securities exchange are valued at the last sale price on the exchange on which they are primarily traded on the day of valuation or, if there has been no sale on such day, at the mean between the bid and ask prices. Securities traded primarily in the Nasdaq Global Market System for which market quotations are readily available are valued using the Nasdaq Official Closing Price (“NOCP”). If the NOCP is not available, such securities are valued at the last sale price on the day of valuation, or if there has been no sale on such day, at the mean between the bid and ask prices. To the extent these securities are actively traded and valuation adjustments are not applied, they are categorized in Level 1 of the fair value hierarchy. If the market for a particular security is not active, and the mean between bid and ask prices is used, these securities are categorized in Level 2 of the fair value hierarchy. |
| | |
| | Short-Term Investments. Investments in other mutual funds, including money market funds, are valued at their NAV per share. Deposit accounts are valued at acquisition cost, which approximates fair value. To the extent these securities are actively traded and valuation adjustments are not applied, they are categorized in Level 1 of the fair value hierarchy. |
| | |
| | Securities for which market quotations are not readily available, or if the closing price does not represent fair value, are valued following procedures approved by the Board of Trustees (the “Board”). These procedures consider many factors, including the type of security, size of holding, trading volume and news events. There can be no assurance that the Fund could obtain the fair value assigned to a security if they were to sell the security at approximately the time at which the Fund determines their NAVs per share. The Board has established a Valuation Committee to administer, implement, and oversee the fair valuation process, and to make fair value decisions when necessary. The Board regularly reviews reports of the Valuation Committee that describe any fair value determinations and methods. |
| | The inputs or methodology used for valuing securities are not an indication of the risk associated with investing in those securities. The following tables are a summary of the inputs used to value each Fund’s securities as of June 30, 2020: |
| | | | Uncategorized | | | Level 1 | | | Level 2 | | | Level 3 | | | Total | |
| | All Cap Value Fund | | | | | | | | | | | | | | | |
| | Common Stocks | | $ | — | | | $ | 480,966,593 | | | $ | — | | | $ | — | | | $ | 480,966,593 | |
| | Short-Term Investment | | | — | | | | 27,417,349 | | | | — | | | | — | | | | 27,417,349 | |
| | Investment Purchased with the Cash | | | | | | | | | | | | | | | | | | | | |
| | Proceeds from Securities Lending* | | | 104,189,768 | | | | — | | | | — | | | | — | | | | 104,189,768 | |
| | Total Investments in Securities | | $ | 104,189,768 | | | $ | 508,383,942 | | | $ | — | | | $ | — | | | $ | 612,573,710 | |
| | | | | | | | | | | | | | | | | | | | | | |
| | | | Uncategorized | | | Level 1 | | | Level 2 | | | Level 3 | | | Total | |
| | Strategic Fund | | | | | | | | | | | | | | | | | | | | |
| | Common Stocks | | $ | — | | | $ | 54,294,776 | | | $ | — | | | $ | — | | | $ | 54,294,776 | |
| | Short-Term Investment | | | — | | | | 2,062,131 | | | | — | | | | — | | | | 2,062,131 | |
| | Investment Purchased with the Cash | | | | | | | | | | | | | | | | | | | | |
| | Proceeds from Securities Lending* | | | 18,878,913 | | | | — | | | | — | | | | — | | | | 18,878,913 | |
| | Total Investments in Securities | | $ | 18,878,913 | | | $ | 56,356,907 | | | $ | — | | | $ | — | | | $ | 75,235,820 | |
| | * | Certain investments that are measured at fair value using the NAV per share (or its equivalent) as a practical expedient have not been characterized in the fair value hierarchy. The fair value amounts presented in the table are intended to permit reconciliation of the fair value hierarchy to the amounts presented in the Statements of Assets and Liabilities. See Note 9 for additional information regarding securities lending activity. |
| | Refer to the Schedules of Investments for further information on the classification of investments. |
| | |
| 4 | Investment Advisory Fee and Other Related Party Transactions The Trust has an agreement with Olstein Capital Management, L.P. (the “Adviser”) to furnish investment advisory services to the Funds. For its services, the All Cap Value Fund pays the Adviser a monthly management fee of 1.00% of the Fund’s average daily net assets up to $1 billion, 0.95% of the Fund’s average daily net assets on the next $500 million, 0.90% of the Fund’s average daily net assets on the next $500 million, 0.85% of the Fund’s average daily net assets on the next $500 million, 0.80% of the Fund’s average daily net assets on the next $500 million, and 0.75% of the Fund’s average daily net assets in excess of $3 billion. The Strategic Fund pays the Adviser a monthly management fee of 1.00% of the Fund’s average daily net assets. |
| | The Adviser has contractually agreed to waive a portion or all of its management fees and reimburse the Strategic Fund for its expenses to ensure that total operating expenses (excluding Rule 12b-1 fees, acquired fund fees and expenses, leverage, interest, taxes, brokerage commissions and extraordinary expenses), based upon the average daily net assets of the Fund, do not exceed an annual rate of 1.35%. |
| | |
| | Effective September 14, 2018, fees waived and expenses reimbursed by the Adviser may be recouped by the Adviser for a period of thirty-six months following the month during which such waiver or reimbursement was made if such recoupment can be achieved without exceeding the expense limit in effect at the time the waiver or reimbursement occurred. Fees waived and expenses reimbursed prior to September 14, 2018 by the Predecessor Funds are not eligible for recoupment by agreement of the Adviser. Between July 1, 2018 and September 14, 2018, these non-recoupable fees waived by the Adviser totaled $22,893. The Operating Expenses Limitation Agreement for the Strategic Fund is indefinite in term, but cannot be terminated within a year after the effective date of the Funds’ prospectus. After that date, the agreement may be terminated at any time upon 60 days’ written notice by the Board or the Adviser, with the consent of the Board. Waived fees subject to potential recovery by month of expiration are as follows: |
| | Expiration – Strategic Fund | | |
| | September 2021 – June 2022 | $95,788 | |
| | July 2022 – June 2023 | 142,803 | |
| | U.S. Bancorp Fund Services, LLC (the “Administrator”), doing business as U.S. Bank Global Fund Services, acts as the Funds’ Administrator, Transfer Agent, and Fund Accountant. U.S. Bank N.A. (the “Custodian”) serves as the Custodian to the Funds. The Custodian is an affiliate of the Administrator. The Administrator performs various administrative and accounting services for the Funds. The Administrator prepares various federal and state regulatory filings, reports and returns for the Funds; prepares reports and materials to be supplied to the Trustees; monitors the activities of the Custodian; coordinates the payment of the Funds’ expenses and reviews the Funds’ expense accruals. The officers of the Trust, including the Chief Compliance Officer, are employees of the Administrator. As compensation for its services, the Administrator is entitled to a monthly fee at an annual rate based upon the average daily net assets of the Funds, subject to annual minimums. |
| | Fees paid by the Funds for administration and accounting, transfer agency, custody and compliance services for the year ended June 30, 2020, are disclosed in the Statements of Operations. |
| | |
| 5 | Distribution Costs The Funds have adopted a Distribution Plan pursuant to Rule 12b-1 (the “Plan”) in Class A and Class C only. The Plan permits the Funds to pay for distribution and related expenses at an annual rate of 0.25% and 1.00% of Class A and Class C average daily net assets, respectively. The expenses covered by the Plan may include the cost of preparing and distributing prospectuses and other sales material, advertising and public relations expenses, payments to financial intermediaries and compensation of personnel involved in selling shares of the Funds. For the year ended June 30, 2020, the All Cap Value Fund and Strategic Fund incurred expenses of $155,592 and $44,954, respectively in Class A pursuant to the Plan. The All Cap Value Fund and Strategic Fund also incurred additional expenses of $3,215,594 and $152,162, respectively in Class C. |
| | |
| 6 | Capital Share Transactions Transactions in shares of the Funds were as follows: |
| | All Cap Value Fund | | | | | | |
| | | | Year Ended | | | Year Ended | |
| | | | June 30, 2020 | | | June 30, 2019 | |
| | Class A(1): | | | | | | |
| | Shares sold | | | 4,021,012 | | | | 566,381 | |
| | Shares issued in reinvestment of distributions | | | 81,769 | | | | 3 | |
| | Shares redeemed | | | (276,166 | ) | | | (30,230 | ) |
| | Net increase | | | 3,826,615 | | | | 536,154 | |
| | Class C: | | | | | | | | |
| | Shares sold | | | 238,391 | | | | 265,280 | |
| | Shares issued in reinvestment of distributions | | | 515,562 | | | | 2,063,402 | |
| | Shares redeemed | | | (7,023,424 | ) | | | (4,105,344 | ) |
| | Net decrease | | | (6,269,471 | ) | | | (1,776,662 | ) |
| | Adviser Class: | | | | | | | | |
| | Shares sold | | | 357,705 | | | | 347,814 | |
| | Shares issued in reinvestment of distributions | | | 208,789 | | | | 588,484 | |
| | Shares redeemed | | | (868,865 | ) | | | (1,210,990 | ) |
| | Net decrease | | | (302,371 | ) | | | (274,692 | ) |
| | Net decrease in capital shares | | | (2,745,227 | ) | | | (1,515,200 | ) |
| | (1) | Inception date of Class A was September 17, 2018. |
| | Transactions in shares of the Funds were as follows: |
| | Strategic Fund | | | | | | |
| | | | Year Ended | | | Year Ended | |
| | | | June 30, 2020 | | | June 30, 2019 | |
| | Class A: | | | | | | |
| | Shares sold | | | 318,471 | | | | 77,735 | |
| | Shares issued in reinvestment of distributions | | | — | | | | 8,685 | |
| | Shares redeemed | | | (306,460 | ) | | | (380,951 | ) |
| | Net increase (decrease) | | | 12,011 | | | | (294,531 | ) |
| | Class C: | | | | | | | | |
| | Shares sold | | | 55,419 | | | | 99,581 | |
| | Shares issued in reinvestment of distributions | | | — | | | | 12,890 | |
| | Shares redeemed | | | (495,922 | ) | | | (399,336 | ) |
| | Net decrease | | | (440,503 | ) | | | (286,865 | ) |
| | Adviser Class: | | | | | | | | |
| | Shares sold | | | 338,831 | | | | 269,776 | |
| | Shares issued in reinvestment of distributions | | | — | | | | 24,110 | |
| | Shares redeemed | | | (809,712 | ) | | | (2,117,797 | ) |
| | Net decrease | | | (470,881 | ) | | | (1,823,911 | ) |
| | Net decrease in capital shares | | | (899,373 | ) | | | (2,405,307 | ) |
| 7 | Investment Transactions The aggregate purchases and sales, excluding short-term investments, by Fund for the year ended June 30, 2020, were as follows: |
| | | | U.S. Government Securities | | | Other Securities | |
| | Fund | | Purchases | | | Sales | | | Purchases | | | Sales | |
| | All Cap Value Fund | | $ | — | | | $ | — | | | $ | 247,782,486 | | | $ | 257,309,830 | |
| | Strategic Fund | | | — | | | | — | | | | 29,868,556 | | | | 41,420,097 | |
| 8 | Federal Tax Information The aggregate gross unrealized appreciation and depreciation of securities held by the Funds and the total cost of securities for federal income tax purposes at June 30, 2020, were as follows: |
| | | Aggregate | Aggregate | Net Appreciation/ | Federal Income |
| | Fund | Gross Appreciation | Gross Depreciation | (Depreciation) | Tax Cost |
| | All Cap Value Fund | $74,173,104 | $(69,503,027) | $4,670,077 | $607,903,633 |
| | Strategic Fund | 6,706,496 | (9,266,775) | (2,560,279) | 77,796,099 |
| | The differences between book-basis and tax-basis unrealized appreciation/depreciation is attributable primarily to the tax deferral of losses on wash sales. |
| | At June 30, 2020, the components of distributable earnings/accumulated loss on a tax-basis were as follows: |
| | | | | | Net | Total |
| | | Undistributed | Undistributed | Other | Unrealized | Distributable |
| | | Ordinary | Long-Term | Accumulated | Appreciation/ | Earnings |
| | Fund | Income | Capital Gains | Losses | (Depreciation) | (Accumulated Loss) |
| | All Cap Value Fund | $2,311,149 | $— | $(6,718,316) | $4,670,077 | $262,910 |
| | Strategic Fund | — | — | (4,774,571) | (2,560,279) | (7,334,850) |
| | As of June 30, 2020, the Strategic Fund had short-term capital loss carryovers of $1,059,791, which will be permitted to be carried over for an unlimited period. A regulated investment company may elect for any taxable year to treat any portion of any qualified late year loss as arising on the first day of the next taxable year. Qualified late year losses are certain capital, and ordinary losses which occur during the portion of the Fund’s taxable year subsequent to October 31 and December 31, respectively. For the taxable year ended June 30, 2020, the All Cap Value Fund did not defer any late-year ordinary losses. The All Cap Value Fund and the Strategic Fund deferred, on a tax basis, post-October capital losses of $6,718,316 and $3,650,817, respectively. The Strategic Fund deferred, on a tax basis, qualified late year ordinary losses of $63,963. |
| | |
| | The tax character of distributions paid for the year ended June 30, 2020 was as follows: |
| | | Ordinary* | Long Term | |
| | Fund | Income | Capital Gains | Total |
| | All Cap Value Fund | $1,030,374 | $18,424,641 | $19,455,015 |
| | Strategic Fund | — | — | — |
| | The tax character of distributions paid for the year ended June 30, 2019 was as follows: |
| | | Ordinary* | Long Term | |
| | Fund | Income | Capital Gains | Total |
| | All Cap Value Fund | $5,048,919 | $48,204,954 | $53,253,873 |
| | Strategic Fund | — | 780,786 | 780,786 |
| | * | For Federal income tax purposes, distributions of short-term capital gains are treated as ordinary income distributions. |
| 9 | Securities Lending Following terms of a securities lending agreement with the Funds’ Custodian, the Funds may lend securities from their portfolios to brokers, dealers and financial institutions in order to increase the return on its portfolio, primarily through the receipt of borrowing fees and |
| | earnings on invested collateral. Any such loan must be continuously secured by collateral in cash or cash equivalents maintained on a current basis in an amount at least equal to 105% of the value of the loaned securities that are foreign securities or 102% of the value of any U.S. loaned securities at the inception of the loan. Loans shall be marked to market daily and the margin restored in the event the collateralization is below 100% of the value of the securities loaned. During the time securities are on loan, the borrower will pay the applicable Fund any accrued income on those securities, and the Fund may invest the cash collateral and earn income or receive an agreed-upon fee from a borrower that has delivered cash-equivalent collateral. In determining whether or not to lend a security to a particular broker, dealer or financial institution, the Adviser considers all relevant facts and circumstances, including the size, creditworthiness and reputation of the broker, dealer or financial institution. Securities lending involves the risk of a default or insolvency of the borrower. In either of these cases, a Fund could experience delays in recovering securities or collateral or could lose all or part of the value of the loaned securities. A Fund also could lose money in the event of a decline in the value of the collateral provided for loaned securities. Additionally, the loaned portfolio securities may not be available to a Fund on a timely basis and a Fund may therefore lose the opportunity to sell the securities at a desirable price. Any decline in the value of a security that occurs while the security is out on loan would continue to be borne by the Funds. As of June 30, 2020, the All Cap Value Fund and the Strategic Fund had 24 and 15 securities out on loan, respectively. |
| | |
| | The Funds receive cash as collateral in return for securities lent as part of the securities lending program. The collateral is invested in the Mount Vernon Liquid Assets Portfolio, LLC of which the investment objective is to seek to maximize current income to the extent with the preservation of capital and liquidity and maintain a stable NAV of $1.00 per unit. The All Cap Value Fund and the Strategic Fund held $104,189,768 and $18,878,913 as of June 30, 2020, respectively. The remaining contractual maturity of all securities lending collateral is overnight and continuous. The Funds are not subject to a master netting agreement with respect to securities lending; therefore no additional disclosures are required. The net income earned by the Funds on investments of cash collateral received from borrowers for the securities loaned to them is reflected in the Funds’ Statements of Operations. Securities lending income, as disclosed in the Funds’ Statements of Operations, represents the income |
| | earned from the investment of cash collateral, net of fee rebates paid to the borrower and net of fees paid to the Custodian as lending agent. |
| | |
| 10 | Line of Credit The All Cap Value Fund and Strategic Fund each has established a secured Line of Credit (“LOC”) in the amount of $50,000,000 and $15,000,000, respectively, or 33.33% of the fair value of each Fund’s unencumbered assets, whichever is less. Each LOC matures unless renewed on July 24, 2020. These LOCs are intended to provide short-term financing, if necessary, subject to certain restrictions and covenants in connection with shareholder redemptions and other short-term liquidity needs of the Fund. The LOCs are with the Custodian. Interest is charged at the prime rate which was 3.25% as of June 30, 2020. The interest rate during the period was between 3.25%-5.50%. Each Fund has authorized the Custodian to charge any of each Fund’s accounts for missed payments. For the period ended June 30, 2020, the Funds did not have any borrowing under the LOCs. Prior to July 25, 2019, the Strategic Fund had a maximum borrowing limit of $20,000,000. |
| | |
| | On July 24, 2020, the Funds renewed their LOCs through July 23, 2021. Borrowing under the renewed LOCs for the All Cap Value Fund and Strategic Fund is limited to $40,000,000 and $10,000,000, respectively, or 33.33% of the fair value of each Fund’s unencumbered assets, whichever is less. As part of the renewal, the LOCs were amended from secured to unsecured. |
| | |
| 11 | Control Ownership The beneficial ownership, either directly or indirectly, of more than 25% of the voting securities of a fund creates a presumption of control of the fund, under Section 2(a)(9) of the 1940 Act. As of June 30, 2020, Morgan Stanley Smith Barney, for the benefit of its customers held 25.5% of the outstanding shares of the Strategic Fund. |
| | |
| 12 | COVID-19 The global outbreak of COVID-19 (commonly referred to as “coronavirus”) has disrupted economic markets and the prolonged economic impact is uncertain. The ultimate economic fallout from the pandemic, and the long-term impact on economies, markets, industries and individual issuers, are not known. The operational and financial performance of the issuers of securities in which the Funds invest depends on future developments, including the duration and spread of the outbreak, and such uncertainty may in turn adversely affect the value and liquidity of the Funds’ investments, impair the Funds’ ability to satisfy redemption requests, and negatively impact the Funds’ performance. |
Report of Independent Registered Public Accounting Firm
To the Shareholders of Olstein Funds and
Board of Trustees of Managed Portfolio Series
Opinion on the Financial Statements
We have audited the accompanying statements of assets and liabilities, including the schedules of investments, of Olstein All Cap Value Fund and Olstein Strategic Opportunities Fund (the “Funds”), each a series of Managed Portfolio Series, as of June 30, 2020, the related statements of operations for the year then ended, the statements of changes in net assets for each of the two years in the period then ended, including the related notes, and the financial highlights for each of the five years in the period then ended (collectively referred to as the “financial statements”). In our opinion, the financial statements present fairly, in all material respects, the financial position of each of the Funds as of June 30, 2020, the results of their operations for the year then ended, the changes in their net assets for each of the two years in the period then ended, and the financial highlights for each of the five years in the period then ended, in conformity with accounting principles generally accepted in the United States of America.
Basis for Opinion
These financial statements are the responsibility of the Funds’ management. Our responsibility is to express an opinion on the Funds’ financial statements based on our audits. We are a public accounting firm registered with the Public Company Accounting Oversight Board (United States) (“PCAOB”) and are required to be independent with respect to the Funds in accordance with the U.S. federal securities laws and the applicable rules and regulations of the Securities and Exchange Commission and the PCAOB.
We conducted our audits in accordance with the standards of the PCAOB. Those standards require that we plan and perform the audit to obtain reasonable assurance about whether the financial statements are free of material misstatement whether due to error or fraud.
Our audits included performing procedures to assess the risks of material misstatement of the financial statements, whether due to error or fraud, and performing procedures that respond to those risks. Such procedures included examining, on a test basis, evidence regarding the amounts and disclosures in the financial statements. Our procedures included confirmation of securities owned as of June 30, 2020, by correspondence with the custodian and brokers. Our audits also included evaluating the accounting principles used and significant estimates made by management, as well as evaluating the overall presentation of the financial statements. We believe that our audits provide a reasonable basis for our opinion.
We have served as the Funds’ auditor since 2012.
COHEN & COMPANY, LTD.
Milwaukee, Wisconsin
August 28, 2020
THE OLSTEIN FUNDS
Additional Information (Unaudited)
APPROVAL OF INVESTMENT ADVISORY AGREEMENT
At the regular meeting of the Board of Trustees of Managed Portfolio Series (“Trust”) on February 17-18, 2020, the Trust’s Board of Trustees (“Board”), each of whom were present in person, including all of the Trustees who are not “interested persons” of the Trust, as that term is defined in Section 2(a)(19) of the Investment Company Act of 1940, as amended (“Independent Trustees”), considered and approved the continuation of the Investment Advisory Agreement between the Trust and Olstein Capital Management, L.P. (“OCM” or the “Adviser”) regarding the Olstein All Cap Value Fund (the “All Cap Value Fund”) and the Olstein Strategic Opportunities Fund (the “Strategic Opportunities Fund” and together with the All Cap Value Fund, the “Funds”) (the “Investment Advisory Agreement”) for an additional one year term.
Prior to the meeting and at a meeting held on January 7, 2020, the Trustees received and considered information from OCM and the Trust’s administrator designed to provide the Trustees with the information necessary to evaluate the continuance of the Investment Advisory Agreement (“Support Materials”). Before voting to approve the continuance of the Investment Advisory Agreement, the Trustees reviewed the Support Materials with Trust management and with counsel to the Independent Trustees, and received a memorandum from such counsel discussing the legal standards for the Trustees’ consideration of the renewal of the Investment Advisory Agreement. This information, together with the information provided to the Board throughout the course of the year, formed the primary (but not exclusive) basis for the Board’s determinations.
In determining whether to continue the Investment Advisory Agreement, the Trustees considered all factors they believed relevant, including the following with respect to each Fund: (1) the nature, extent, and quality of the services to be provided by OCM with respect to the Fund; (2) the Fund’s historical performance as managed by OCM; (3) the costs of the services to be provided by OCM and the profits to be realized by OCM from services rendered to the Fund; (4) comparative fee and expense data for the Fund and other investment companies with similar investment objectives; (5) the
Additional Information (Unaudited) Continued
extent to which economies of scale may be realized as the Fund grows, and whether the advisory fee for the Fund reflects such economies of scale for the Fund’s benefit; and (6) other benefits to OCM resulting from its relationship with the Fund. In their deliberations, the Trustees weighed to varying degrees the importance of the information provided to them, did not identify any particular information that was all-important or controlling, and considered the information and made its determinations for each Fund separately and independently of the other Fund.
Based upon OCM’s presentation and information from OCM and the Trust’s administrator designed to provide the Trustees with the information necessary to evaluate the terms of the Advisory Agreement, the Board concluded that the overall arrangements between the Trust and OCM set forth in the Investment Advisory Agreement, as the agreement relates to each Fund, continue to be fair and reasonable in light of the services that OCM will perform, the investment advisory fees that each Fund pays, and such other matters as the Trustees considered relevant in the exercise of their reasonable business judgment. The material factors and conclusions that formed the basis of the Trustees’ determination to approve the continuation of the Investment Advisory Agreement as it relates to each Fund are summarized below.
Nature, Extent and Quality of Services Provided. The Trustees considered the scope of services that OCM provides under the Investment Advisory Agreement with respect to each Fund, noting that such services include, but are not limited to, the following: (1) investing each Fund’s assets consistent with the Fund’s investment objective and investment policies; (2) determining the portfolio securities to be purchased, sold, or otherwise disposed of and the timing of such transactions; (3) voting all proxies, if any, with respect to each Fund’s portfolio securities; (4) maintaining the required books and records for transactions effected by OCM on behalf of the Funds; (5) selecting broker-dealers to execute orders on behalf of the Funds; and (6) monitoring and maintaining each Fund’s compliance with policies and procedures of the Trust and with applicable securities laws. The Trustees noted that OCM is well capitalized. The Trustees also considered OCM’s assets under management. The Trustees noted that OCM has been managing the Funds, since 1996 in the case of the All Cap Value Fund and 2006 in the case of the Strategic Opportunities Fund, and manages a composite of separately managed accounts with investment objectives and investment
Additional Information (Unaudited) Continued
strategies that are substantially similar to each Fund. The Trustees also considered the experience of the portfolio managers that OCM utilizes in managing each OCM Fund’s assets and that the lead portfolio manager has been the same since each Fund’s inception. The Trustees concluded that they were satisfied with the nature, extent and quality of services that OCM provides to each Fund under the Investment Advisory Agreement.
Fund Historical Performance and the Overall Performance of OCM. In assessing the quality of the portfolio management delivered by OCM, the Trustees reviewed the short-term and longer-term performance of each Fund on both an absolute basis and in comparison to an appropriate securities benchmark index, each Fund’s respective peer funds according to Morningstar classifications, and each Fund’s respective composite of separate accounts that OCM manages utilizing investment strategies similar to those of the Funds. When reviewing each Fund’s performance against its respective Morningstar peer group, the Trustees took into account that the investment objective and strategies of each Fund, as well as the Fund’s level of risk tolerance, may differ significantly from funds in its peer group.
| | • | All Cap Value Fund. The Trustees considered that the All Cap Value Fund outperformed its peer group median and average over the year-to-date, one-year and ten-year periods ended October 31, 2019, but underperformed the peer group median and average over the three-year and five-year periods ended October 31, 2019. The Trustees also considered that the Fund had outperformed its primary benchmark over the year-to-date and one-year periods ended October 31, 2019, but underperformed its primary benchmark across all other periods ended October 31, 2019. The Trustees noted that the Fund had underperformed both of its secondary benchmarks across all periods ended October 31, 2019. The Trustees then observed that the Fund’s performance was consistent with the performance of a composite of similar accounts managed by OCM over all relevant time periods. |
| | | |
| | • | Strategic Opportunities Fund. The Trustees considered that the Strategic Opportunities Fund outperformed its peer group median and average over the year-to-date, one-year, and ten-year periods ended October 31, 2019, but underperformed the peer group median and average over the five-year period ended October 31, 2019. The Trustees |
Additional Information (Unaudited) Continued
| | | noted that over the three-year period ended October 31, 2019, the Fund had outperformed the peer group average but underperformed the peer group median. The Trustees also considered that the Fund had outperformed its primary benchmark over the year-to-date and one-year periods ended October 31, 2019, but underperformed its primary benchmark over the three-year, five-year and ten-year periods ended October 31, 2019. The Trustees also considered that the Fund had underperformed both of its secondary benchmarks over the year-to-date, three-year, five-year and ten-year periods. The Trustees noted that over the one-year period ended October 31, 2019, the Fund outperformed one of its secondary benchmarks and underperformed the other. The Trustees then observed that the Fund’s performance was consistent with the performance of a composite of similar accounts managed by OCM over all relevant time periods. |
Cost of Advisory Services and Profitability. The Trustees considered the annual management fee that each Fund pays to OCM under the Advisory Agreement in the amount of 1.00% of the Fund’s average annual daily net assets. They also considered OCM’s profitability analysis for the 12-month period ended September 30, 2019 for services that OCM rendered to each Fund. In that regard, the Trustees noted that each Fund had been profitable to OCM over that period. The Trustees noted that OCM manages a composite of separately managed accounts with investment strategies that are substantially similar to each Fund. The Trustees noted that the management fee charged to the separately managed accounts is equal to or lower than the management fee charged by corresponding Fund. OCM identified additional services provided to the Funds to justify a higher management fee. The Trustees also noted that OCM had contractually agreed, for a period of at least one year from the effective date of the Strategic Opportunities Fund’s prospectus, to waive its management fees and reimburse the Fund for its operating expenses to the extent necessary to ensure that total operating expenses of the Fund do not exceed the amount set forth in the Fund’s prospectus. The Trustees concluded that OCM’s service relationship with each Fund yielded a reasonable profit.
Additional Information (Unaudited) Continued
Comparative Fee and Expense Data. The Trustees considered a comparative analysis of contractual expenses that each Fund will bear and those of funds in the Morningstar peer group for each Fund. The Trustees noted that:
| | • | All Cap Value Fund. The All Cap Value Fund’s management fee was above the peer group median and average. The total expenses of each class of the All Cap Value Fund were above the peer group median and average total expenses. The Trustees further took into account that the average net assets of the funds comprising the peer group were significantly higher than the projected assets of the All Cap Value Fund and that the management fee was within the range of the management fees in the peer group. |
| | | |
| | • | Strategic Opportunities Fund. The Strategic Opportunities Fund’s management fee was above the peer group median and average. The total expenses of each class of the Strategic Opportunities Fund (after fee waivers and expense reimbursements) was higher than the peer group median and average. The Trustees further took into account that the average net assets of the funds comprising the peer group were significantly higher than the assets of the Strategic Opportunities Fund and that the management fee was within the range of the management fees in the peer group. |
While recognizing that it is difficult to compare advisory fees because the scope of advisory services provided may vary from one investment adviser to another, the Trustees concluded that OCM’s advisory fee with respect to each Fund continues to be reasonable.
Economies of Scale. The Trustees considered whether the Funds would benefit from any economies of scale, noting that the management fee for the All Cap Value Fund includes breakpoints once the Fund hits $1 billion in assets. The Trustees also took into account that the Strategic Opportunities Fund’s management fee did not have breakpoints. Given the current size of the Strategic Opportunities Fund the Trustees concluded that it is not necessary to consider the implementation of fee breakpoints at the present time, but committed to revisit this issue in the future as circumstances change and asset levels increase.
Additional Information (Unaudited) Continued
Other Benefits. The Trustees considered the direct and indirect benefits that could be realized by OCM and its affiliates from their respective relationships with the Funds. The Trustees noted that OCM utilizes soft dollar arrangements with respect to portfolio transactions. The Trustees noted that OCM does not use affiliated brokers to execute the Funds’ portfolio transactions. The Trustees considered that OCM may receive some form of reputational benefit from services rendered to the Funds, but that such benefits are immaterial and cannot otherwise be quantified. The Trustees concluded that OCM does not receive additional material benefits from their relationship with the Funds.
Additional Information (Unaudited) Continued
STATEMENT REGARDING THE FUNDS’
LIQUIDITY RISK MANAGEMENT PROGRAM
Pursuant to Rule 22e-4 under the Investment Company Act of 1940, the Trust, on behalf of the Olstein All Cap Value Fund and Olstein Strategic Opportunities Fund (each a “Fund” and together, the “Funds”), has adopted and implemented a written liquidity risk management program (the “Program”) that includes policies and procedures reasonably designed to comply with the requirements of Rule 22e-4, including: (i) assessment, management and periodic review of liquidity risk; (ii) classification of portfolio holdings; (iii) establishment of a highly liquid investment minimum (“HLIM”), as applicable; (iv) limitation on illiquid investments; and (v) redemptions in-kind. The Trust’s Board of Trustees (the “Board”) has approved the designation of Olstein Capital, L.P. (“Olstein”) as the administrator of the Program (the “Program Administrator”). Personnel of Olstein conduct the day-to-day operation of the Program pursuant to policies and procedures administered by the Olstein Liquidity Committee.
In accordance with Rule 22e-4, the Board reviewed a report prepared by the Program Administrator (the “Report”) regarding the operation of the Program and its adequacy and effectiveness of implementation for the period June 1, 2019, through December 31, 2019 (the “Reporting Period”). No significant liquidity events impacting the Funds during the Reporting Period or material changes to the Program were noted in the Report.
Under the Program, Olstein manages and periodically reviews each Fund’s liquidity risk, including consideration of applicable factors specified in Rule 22e-4 and the Program. Liquidity risk is defined as the risk that a Fund could not meet shareholder redemption requests without significant dilution of remaining shareholders’ interests in the Fund. In general, this risk was managed during the Reporting Period by monitoring the degree of liquidity of each Fund’s investments, limiting the amount of each Fund’s illiquid investments, and utilizing various risk management tools and facilities available to each Fund for meeting shareholder redemptions, among other means. In the Report, Olstein provided its assessment that, based on the information considered in its review, the Program remains reasonably designed to manage each Fund’s liquidity risk and each Fund’ s investment strategy remains appropriate for an open-end fund.
Additional Information (Unaudited) Continued
Pursuant to the Program, the Olstein Liquidity Committee oversaw the classification of each of the Funds’ portfolio investments as highly liquid, moderately liquid, less liquid or illiquid during the Reporting Period, including in connection with recording investment classifications on Form N-PORT. Olstein’s process of determining the degree of liquidity of each Fund’s investments is supported by one or more third-party liquidity assessment vendors.
Each Fund qualified as a “primarily highly liquid fund” as defined in the Program during the Reporting Period. Accordingly, each Fund was not required to establish a HLIM or comply with the related Program provisions during the Reporting Period.
During the Reporting Period, each Fund’s investments were monitored for compliance with the 15% limitation on illiquid investments pursuant to the Program and in accordance with Rule 22e-4.
The Report noted any redemptions in-kind effected by the Funds during the Reporting Period were effectuated in accordance with the Trust’s Redemption in Kind Policy. The Report concluded, with respect to each Fund: (i) the Program was implemented and operated effectively to achieve the goal of assessing and managing the Fund’s liquidity risk during the Reporting Period; and (ii) the Fund was able to meet requests for redemption without significant dilution of remaining investors’ interests in the Fund during the Reporting Period.
Additional Information (Unaudited) Continued
TRUSTEES AND OFFICERS
| | | Term of | Number of | | Other |
| | | Office** | Portfolios | | Directorships |
| | Position(s) | and Length | in Trust | Principal | Held by Trustee |
| Name, Address and | Held with | of Time | Overseen | Occupation(s) During | During the Past |
Year of Birth | the Trust | Served | by Trustee | the Past Five Years | Five Years |
| Independent Trustees | | | | | |
| | | | | | |
| Leonard M. Rush, CPA | Lead | Indefinite | 39 | Retired, Chief | Independent |
| 615 E. Michigan St. | Independent | Term; | | Financial Officer, | Trustee, ETF |
| Milwaukee, WI 53202 | Trustee | Since | | Robert W. Baird | Series |
| Year of Birth: 1946 | and Audit | April | | & Co. Incorporated | Solutions (49 |
| | Committee | 2011 | | (2000-2011). | Portfolios) |
| | Chairman | | | | (2012- |
| | | | | | Present); |
| | | | | | Director, |
| | | | | | Anchor |
| | | | | | Bancorp |
| | | | | | Wisconsin, |
| | | | | | Inc. |
| | | | | | (2011-2013). |
| | | | | | |
| David A. Massart | Trustee | Indefinite | 39 | Co-Founder | Independent |
| 615 E. Michigan St. | and | Term; | | and Chief | Trustee, ETF |
| Milwaukee, WI 53202 | Valuation | Since | | Investment | Series |
| Year of Birth: 1967 | Committee | April | | Strategist, Next | Solutions |
| | Chairman | 2011 | | Generation | (49 |
| | | | | Wealth | Portfolios) |
| | | | | Management, Inc. | (2012- |
| | | | | (2005-Present). | Present). |
Additional Information (Unaudited) Continued
| | | Term of | Number of | | Other |
| | | Office** | Portfolios | | Directorships |
| | Position(s) | and Length | in Trust | Principal | Held by Trustee |
| Name, Address and | Held with | of Time | Overseen | Occupation(s) During | During the Past |
Year of Birth | the Trust | Served | by Trustee | the Past Five Years | Five Years |
| David M. Swanson | Trustee | Indefinite | 39 | Founder and | Independent |
| 615 E. Michigan St. | and | Term; | | Managing | Trustee, |
| Milwaukee, WI 53202 | Nominating | Since | | Principal, | ALPS |
| Year of Birth: 1957 | & | April | | SwanDog | Variable |
| | Governance | 2011 | | Strategic | Investment |
| | Committee | | | Marketing, LLC | Trust |
| | Chairman | | | (2006-Present). | (7 Portfolios) |
| | | | | | (2006- |
| | | | | | Present); |
| | | | | | Independent |
| | | | | | Trustee, |
| | | | | | RiverNorth |
| | | | | | Opportunities |
| | | | | | Closed-End |
| | | | | | Fund (2015- |
| | | | | | Present); |
| | | | | | Independent |
| | | | | | Trustee, |
| | | | | | RiverNorth |
| | | | | | Funds |
| | | | | | (3 Portfolios) |
| | | | | | (2018- |
| | | | | | Present); |
| | | | | | RiverNorth |
| | | | | | Managed |
| | | | | | Duration |
| | | | | | Municipal |
| | | | | | Income Fund |
| | | | | | Inc. |
| | | | | | (1 Portfolio) |
| | | | | | (2019 to |
| | | | | | Present); |
| | | | | | RiverNorth |
| | | | | | Marketplace |
| | | | | | Lending |
| | | | | | Corporation |
| | | | | | (1 Portfolio) |
| | | | | | (2018 to |
| | | | | | Present); |
Additional Information (Unaudited) Continued
| | | Term of | Number of | | Other |
| | | Office** | Portfolios | | Directorships |
| | Position(s) | and Length | in Trust | Principal | Held by Trustee |
| Name, Address and | Held with | of Time | Overseen | Occupation(s) During | During the Past |
Year of Birth | the Trust | Served | by Trustee | the Past Five Years | Five Years |
| David M. Swanson | | | | | RiverNorth/ |
| Continued | | | | | DoubleLine |
| | | | | | Strategic |
| | | | | | Opportunity |
| | | | | | Fund, Inc. |
| | | | | | (1 Portfolio) |
| | | | | | (2018 to |
| | | | | | Present); |
| | | | | | RiverNorth |
| | | | | | Opportunities |
| | | | | | Fund, Inc. |
| | | | | | (1 Portfolio) |
| | | | | | (2013 to |
| | | | | | Present); |
| | | | | | RiverNorth |
| | | | | | Opportunistic |
| | | | | | Municipal |
| | | | | | Income Fund, |
| | | | | | Inc. |
| | | | | | (1 Portfolio) |
| | | | | | (2018 to |
| | | | | | Present). |
| | | | | | |
| Interested Trustee | | | | | |
| | | | | | |
| Robert J. Kern* | Chairman, | Indefinite | 39 | Retired (July | None |
| 615 E. Michigan St. | and | Term; | | 2018 – Present); | |
| Milwaukee, WI 53202 | Trustee | Since | | Executive Vice | |
| Year of Birth: 1958 | | January | | President, U.S. | |
| | | 2011 | | Bancorp Fund | |
| | | | | Services, LLC | |
| | | | | (1994-2018). | |
| | | | | | |
| Officers | | | | | |
| | | | | | |
| Brian R. Wiedmeyer | President | Indefinite | N/A | Vice President, | N/A |
| 615 E. Michigan St. | and | Term; | | U.S. Bancorp | |
| Milwaukee, WI 53202 | Principal | Since | | Fund Services, | |
| Year of Birth: 1973 | Executive | November | | LLC (2005- | |
| | Officer | 2018 | | Present). | |
| * | Mr. Kern is an “interested person” of the Trust as defined by the 1940 Act by virtue of the fact that he was a board member of the Funds’ principal underwriter, Quasar Distributors, LLC, previously an affiliate of the Administrator. |
Additional Information (Unaudited) Continued
| | | Term of | Number of | | Other |
| | | Office** | Portfolios | | Directorships |
| | Position(s) | and Length | in Trust | Principal | Held by Trustee |
| Name, Address and | Held with | of Time | Overseen | Occupation(s) During | During the Past |
Year of Birth | the Trust | Served | by Trustee | the Past Five Years | Five Years |
| Deborah Ward | Vice | Indefinite | N/A | Senior Vice | N/A |
| 615 E. Michigan St. | President, | Term; | | President, U.S. | |
| Milwaukee, WI 53202 | Chief | Since | | Bancorp Fund | |
| Year of Birth: 1966 | Compliance | April | | Services, LLC | |
| | Officer and | 2013 | | (2004-Present). | |
| | Anti-Money | | | | |
| | Laundering | | | | |
| | Officer | | | | |
| | | | | | |
| Benjamin Eirich | Treasurer, | Indefinite | N/A | Assistant Vice | N/A |
| 615 E. Michigan St. | Principal | Term; | | President, U.S. | |
| Milwaukee, WI 53202 | Financial | Since | | Bancorp Fund | |
| Year of Birth: 1981 | Officer | August | | Services, LLC | |
| | and Vice | 2019 | | (2008-Present). | |
| | President | (Treasurer); | | | |
| | | Since | | | |
| | | November | | | |
| | | 2018 | | | |
| | | (Vice | | | |
| | | President) | | | |
| | | | | | |
| Thomas A. | Secretary | Indefinite | N/A | Vice President, | N/A |
| Bausch, Esq. | | Term; | | U.S. Bancorp | |
| 615 E. Michigan St. | | Since | | Fund Services, | |
| Milwaukee, WI 53202 | | November | | LLC (2016- | |
| Year of Birth: 1979 | | 2017 | | Present); | |
| | | | | Associate, | |
| | | | | Godfrey & | |
| | | | | Kahn S.C. | |
| | | | | (2012-2016). | |
| | | | | | |
| Douglas Schafer | Assistant | Indefinite | N/A | Assistant Vice | N/A |
| 615 E. Michigan St. | Treasurer | Term; | | President, U.S. | |
| Milwaukee, WI 53202 | and Vice | Since | | Bancorp Fund | |
| Year of Birth: 1970 | President | May 2016 | | Services, LLC | |
| | | (Assistant | | (2002-Present). | |
| | | Treasurer); | | | |
| | | Since | | | |
| | | November | | | |
| | | 2018 | | | |
| | | (Vice | | | |
| | | President) | | | |
Additional Information (Unaudited) Continued
| | | Term of | Number of | | Other |
| | | Office** | Portfolios | | Directorships |
| | Position(s) | and Length | in Trust | Principal | Held by Trustee |
| Name, Address and | Held with | of Time | Overseen | Occupation(s) During | During the Past |
Year of Birth | the Trust | Served | by Trustee | the Past Five Years | Five Years |
| Michael J. Cyr II, CPA | Assistant | Indefinite | N/A | Officer, U.S. | N/A |
| 615 E. Michigan St. | Treasurer | Term; | | Bancorp Fund | |
| Milwaukee, WI 53202 | and Vice | Since | | Services, LLC | |
| Year of Birth: 1992 | President | August | | (2013-Present). | |
| | | 2019 | | | |
Additional Information (Unaudited) Continued
AVAILABILITY OF FUND PORTFOLIO INFORMATION
Each Fund files complete schedules of portfolio holdings with the SEC for the first and third quarters of each fiscal year on Form N-Q or Part F of Form N-PORT (beginning with filings after March 31, 2020). Each Fund’s Form N-Q or Part F of N-PORT are available on the SEC’s website at www.sec.gov and may be reviewed and copied at the SEC’s Public Reference Room in Washington, D.C. For information on the Public Reference Room call 1-800-SEC-0330. In addition, each Fund’s Form N-Q or Part F of Form N-PORT is available without charge upon request by calling 1-800-799-2113.
AVAILABILITY OF FUND PROXY VOTING INFORMATION
A description of the Funds’ Proxy Voting Policies and Procedures is available without charge, upon request, by calling 1-800-799-2113. Information regarding how the Funds voted proxies relating to portfolio securities during the most recent 12 month period ended June 30 is available (1) without charge, upon request, by calling 1-800-799-2113, or (2) on the SEC’s website at www.sec.gov.
QUALIFIED DIVIDEND INCOME/DIVIDENDS
RECEIVED DEDUCTION
For the fiscal year ended June 30, 2020, certain dividends paid by the Fund may be reported as qualified dividend income and may be eligible for taxation at capital gain rates. The percentage of dividends declared from ordinary income designated as qualified dividend income was 100.00% and 0.00% for the Olstein All Cap Value Fund and Olstein Strategic Opportunities Fund, respectively.
For corporate shareholders, the percent of ordinary income distributions qualifying for the corporate dividends received deduction for the year ended June 30, 2020 was 100.00% and 0.00% for the Olstein All Cap Value Fund and Olstein Strategic Opportunities Fund, respectively.
The percentage of taxable ordinary income distributions that are designated as short-term capital gain distributions under Internal Revenue Section 871(k)(2)(C) was 0.00% and 0.00% for the Olstein All Cap Value Fund and Olstein Strategic Opportunities Fund, respectively.
PRIVACY POLICY (UNAUDITED)
The Funds collect only relevant information about you that the law allows or requires it to have in order to conduct its business and properly service you. The Funds collect financial and personal information about you (“Personal Information”) directly (e.g., information on account applications and other forms, such as your name, address, and social security number, and information provided to access account information or conduct account transactions online, such as password, account number, e-mail address, and alternate telephone number), and indirectly (e.g., information about your transactions with us, such as transaction amounts, account balance and account holdings).
The Funds do not disclose any non-public personal information about its shareholders or former shareholders other than for everyday business purposes such as to process a transaction, service an account, respond to court orders and legal investigations or as otherwise permitted by law. Third parties that may receive this information include companies that provide transfer agency, technology and administrative services to the Funds, as well as the Funds’ investment adviser who is an affiliate of the Funds. If you maintain a retirement/educational custodial account directly with the Funds, we may also disclose your Personal Information to the custodian for that account for shareholder servicing purposes. The Funds limit access to your Personal Information provided to unaffiliated third parties to information necessary to carry out their assigned responsibilities to the Funds. All shareholder records will be disposed of in accordance with applicable law. The Funds maintain physical, electronic and procedural safeguards to protect your Personal Information and requires its third party service providers with access to such information to treat your Personal Information with the same high degree of confidentiality.
In the event that you hold shares of the Funds through a financial intermediary, including, but not limited to, a broker-dealer, credit union, bank or trust company, the privacy policy of your financial intermediary governs how your non-public personal information is shared with unaffiliated third parties.
Olstein
All Cap Value Fund
Olstein
Strategic Opportunities Fund
Investment Adviser
Olstein Capital Management, L.P.
4 Manhattanville Road
Purchase, New York 10577
Distributor
Compass Distributors, LLC
Three Canal Plaza, Suite 100
Portland, Maine 04101
Custodian
U.S. Bank N.A.
1555 North Rivercenter Drive, Suite 302
Milwaukee, Wisconsin 53212
Administrator, Fund Accountant
and Transfer Agent
U.S. Bancorp Fund Services, LLC
615 East Michigan Street
Milwaukee, Wisconsin 53202
Independent Registered Public Accounting Firm
Cohen & Company, Ltd.
342 North Water Street, Suite 830
Milwaukee, Wisconsin 53202
Legal Counsel
Stradley Ronon Stevens & Young, LLP
2005 Market Street, Suite 2600
Philadelphia, Pennsylvania 19103
This report is submitted for the general information of the shareholders of the Funds. It is not authorized for distribution to prospective investors unless preceded or accompanied by an effective prospectus, which includes information regarding the Funds’ risks, objectives, fees and expenses, experience of its management, and other information.
The Funds’ Statement of Additional Information contains additional information about the Funds’ trustees and is available without charge upon request by calling 1-800-799-2113.
The Olstein Funds
4 Manhattanville Road
Purchase, New York 10577
Item 2. Code of Ethics.
The Registrant has adopted a code of ethics that applies to the Registrant’s principal executive officer and principal financial officer. The Registrant has not made any amendments to its code of ethics during the period covered by this report. The Registrant has not granted any waivers from any provisions of the code of ethics during the period covered by this report.
A copy of the Registrant’s Code of Ethics that applies to the Registrant’s principal executive officer and principal financial officer is filed herewith.
Item 3. Audit Committee Financial Expert.
The Registrant’s board of trustees has determined that there is at least one audit committee financial expert serving on its audit committee. Leonard M. Rush is the “audit committee financial expert” and is considered to be “independent” as each term is defined in Item 3 of Form N‑CSR.
Item 4. Principal Accountant Fees and Services.
The Registrant has engaged its principal accountant to perform audit services, audit-related services, tax services and other services during the past two fiscal years. “Audit services” refer to performing an audit of the Registrant's annual financial statements or services that are normally provided by the accountant in connection with statutory and regulatory filings or engagements for those fiscal years. “Audit-related services” refer to the assurance and related services by the principal accountant that are reasonably related to the performance of the audit. “Tax services” refer to professional services rendered by the principal accountant for tax compliance, tax advice, and tax planning; including reviewing the Fund’s tax returns and distributions calculations. There were no “other services” provided by the principal accountant. For the fiscal years ended June 30, 2020 and June 30, 2019, the Fund’s principal accountant was Cohen & Company, Ltd. The following table details the aggregate fees billed or expected to be billed for each of the last two fiscal years for audit fees, audit-related fees, tax fees and other fees by the principal accountant.
| | FYE 6/30/2020 | FYE 6/30/2019 |
Audit Fees | $30,000 | $31,000 |
Audit-Related Fees | $0 | $0 |
Tax Fees | $6,000 | $7,500 |
All Other Fees | $- | $- |
The audit committee has adopted pre-approval policies and procedures that require the audit committee to pre‑approve all audit and non‑audit services of the Registrant, including services provided to any entity affiliated with the Registrant.
The percentage of fees billed by Cohen & Company, Ltd applicable to non-audit services pursuant to waiver of pre-approval requirement were as follows:
.
| | FYE 6/30/2020 | FYE 6/30/2019 |
Audit-Related Fees | 0% | 0% |
Tax Fees | 0% | 0% |
All Other Fees | 0% | 0% |
All of the principal accountant’s hours spent on auditing the Registrant’s financial statements were attributed to work performed by full‑time permanent employees of the principal accountant.
The following table indicates the non-audit fees billed or expected to be billed by the Registrant’s accountant for services to the Registrant and to the Registrant’s investment adviser (and any other controlling entity, etc.—not sub-adviser) for the last two years. The audit committee of the board of trustees/directors has considered whether the provision of non-audit services that were rendered to the Registrant's investment adviser is compatible with maintaining the principal accountant's independence and has concluded that the provision of such non-audit services by the accountant has not compromised the accountant’s independence.
Non-Audit Related Fees | FYE 6/30/2020 | FYE 6/30/2019 |
Registrant | N/A | N/A |
Registrant’s Investment Adviser | N/A | N/A |
Item 5. Audit Committee of Listed Registrants.
Not applicable to Registrants who are not listed as issuers (as defined in Rule 10A-3 under the Securities Exchange Act of 1934).
Item 6. Schedule of Investments.
| (a) | Schedule of Investments is included as part of the report to shareholders filed under Item 1 of this Form. |
Item 7. Disclosure of Proxy Voting Policies and Procedures for Closed-End Management Investment Companies.
Not applicable to open-end investment companies.
Item 8. Portfolio Managers of Closed-End Management Investment Companies.
Not applicable to open-end investment companies.
Item 9. Purchases of Equity Securities by Closed‑End Management Investment Company and Affiliated Purchasers.
Not applicable to open-end investment companies.
Item 10. Submission of Matters to a Vote of Security Holders.
There have been no material changes to the procedures by which shareholders may recommend nominees to the Registrant’s board of trustees.
Item 11. Controls and Procedures.
(a) | The Registrant’s President and Treasurer have reviewed the Registrant's disclosure controls and procedures (as defined in Rule 30a-3(c) under the Investment Company Act of 1940 (the “Act”)) as of a date within 90 days of the filing of this report, as required by Rule 30a-3(b) under the Act and Rules 13a-15(b) or 15d‑15(b) under the Securities Exchange Act of 1934. Based on their review, such officers have concluded that the disclosure controls and procedures are effective in ensuring that information required to be disclosed in this report is appropriately recorded, processed, summarized and reported and made known to them by others within the Registrant and by the Registrant’s service provider. |
(b) | There were no significant changes in the Registrant's internal control over financial reporting (as defined in Rule 30a-3(d) under the Act) that occurred during the period covered by this report that has materially affected, or is reasonably likely to materially affect, the Registrant's internal control over financial reporting. |
Item 12. Disclosures of Securities Lending Activities for Closed-End Management Investment Companies.
Not applicable to open-end investment companies.
Item 13. Exhibits.
(3) Any written solicitation to purchase securities under Rule 23c‑1 under the Act sent or given during the period covered by the report by or on behalf of the Registrant to 10 or more persons. Not applicable to open-end investment companies.
(4) Change in the Registrant’s independent public accountant. There was no change in the Registrant’s independent public accountant for the period covered by this report.
SIGNATURES
Pursuant to the requirements of the Securities Exchange Act of 1934 and the Investment Company Act of 1940, the Registrant has duly caused this report to be signed on its behalf by the undersigned, thereunto duly authorized.
(Registrant) Managed Portfolio Series
By (Signature and Title) /s/Brian R. Wiedmeyer
Brian R. Wiedmeyer, President
Date September 7, 2020
Pursuant to the requirements of the Securities Exchange Act of 1934 and the Investment Company Act of 1940, this report has been signed below by the following persons on behalf of the Registrant and in the capacities and on the dates indicated.
By (Signature and Title) /s/Brian R. Wiedmeyer
Brian R. Wiedmeyer, President
Date September 7, 2020
By (Signature and Title) /s/Benjamin Eirich
Benjamin Eirich, Treasurer
Date September 7, 2020