Securian AM Dynamic Managed Volatility Fund
Institutional Class Shares – VVMIX
Securian AM Managed Volatility Equity Fund
Institutional Class Shares – VMEIX
Securian AM Real Asset Income Fund
Institutional Class Shares – VSDIX
Annual Report
| www.securianamfunds.com | August 31, 2020 |
SECURIAN AM FUNDS
September 25, 2020
Securian AM Dynamic Managed Volatility Fund
Managers:
Craig Stapleton, CFA; Jeremy Gogos, CFA; Merlin Erickson
Securian Asset Management
FUND PERFORMANCE UPDATE
For the period beginning September 1, 2019 and ending August 31, 2020, the Dynamic Managed Volatility Fund (the “Fund”) Institutional Class returned 14.76%, underperforming the Dynamic Managed Volatility Benchmark return of 16.20%.
The Fund had a realized volatility, as measured by its standard deviation of daily returns, of 11.82%, compared to the Fund’s custom benchmark realized volatility of 19.64%. The benchmark is a custom benchmark for the Fund developed by Securian Asset Management.
For comparison, the S&P 500 Index (dividend adjusted), which the Fund uses as a broad-based securities market index, was up 21.94% with a volatility of 33.19% over the same period.
STRATEGY UPDATE
In terms of volatility, this period truly is a tale of two polar opposites. The first half of the period, September of 2019 through most of February 2020, was rather calm, despite troubling underlying geopolitical and economic fundamentals. As we highlighted in our last semi-annual letter, late 2019 saw weakening economic data globally, declining corporate earnings in the U.S., and continued U.S.-China trade conflict. Equity volatility of the S&P 500 began the period at 21.0% (September 1, 2019), and thanks to the Federal Reserve (Fed) easing monetary policy, volatility drifted lower, ranging between 5.0% to 14.5% for October 2019 through mid-February 2020. As such, the Fund equity exposure began this period at 30.8%, was increased as volatility dropped, and ranged between 42.0% and 80.1% from October 2019 through mid-February 2020.
As is widely known, the second half of the period—mid-February 2020 through the end of August 2020—was one of the most volatile and unusual periods in the history of U.S. equity markets. The global lockdown intended to slow the spread of coronavirus had a dramatic economic impact, the full extent of which still isn’t known. March of 2020 proved to be the most volatile calendar month in the S&P 500’s history, seeing 93.4% realized volatility. For context, in the most volatile month from the Great Financial Crisis (GFC)—October of 2008—the S&P 500 realized 80.8% volatility. Because of this extreme volatility, the Fund’s equity exposure was steadily reduced from 72.5% on February 20 to 19.5% on March 16. Ultimately, the Dynamic Managed Volatility blended benchmark of 60% S&P 500 Index/40% Bloomberg Barclays U.S. Aggregate Bond Index drew down -21.6% peak-to-trough in the coronavirus panic; the Fund saw a drawdown of -15.0%.
Thanks to massive intervention from both the Fed and the Federal government, the equity market stabilized, and volatility declined steadily throughout April and May, and apart from a brief pullback in June, the market relentlessly rallied for the rest of the period. The volatility of the S&P 500 closed out this period at 8.2%, and so the Fund’s equity exposure ended the period at 76%.
MARKET SECTOR UPDATE
The record domestic economic expansion finally came to an end in this period, with February of 2020 as the 128th and final month of uninterrupted growth in the U.S. The coronavirus lockdowns ushered in a period of
SECURIAN AM FUNDS
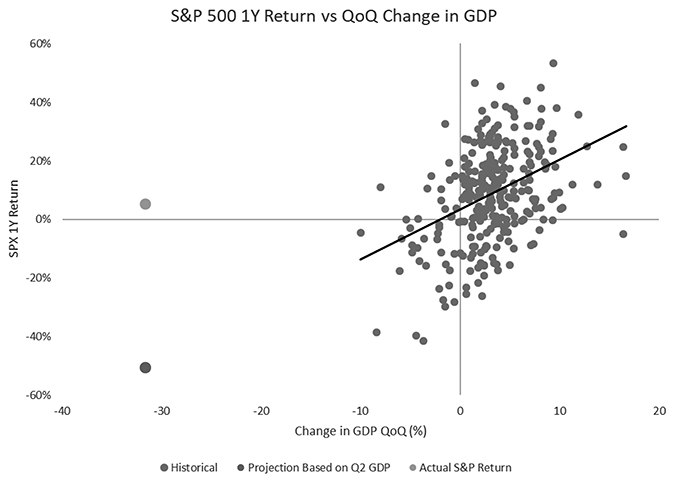
economic contraction unprecedented in the modern era. First quarter of 2020 saw Gross Domestic Product (GDP) shrink -5.0% quarter-over-quarter, and second quarter saw a -31.7% quarter-over-quarter reduction of the same. For context, in the depths of the Great Financial Crisis, the fourth quarter of 2008 saw GDP decline -8.4% quarter-over-quarter.
The historical relationship between this quarter-over-quarter change in GDP, and the S&P 500 trailing 1-year return, is depicted below. The blue dots show the S&P 500 trailing 1-year return vs quarter-over-quarter change in GDP for the second quarter of 1947 through first quarter of 2020. The red dot shows the S&P 500 return implied by extending the best fit line, defined as the line that best expresses the relationship between the points in the scatter plot, to the known -31.7 decrease in GDP for second quarter 2020 GDP. The green dot shows the actual S&P 500 return.
Source: Bloomberg
This is an absurd dislocation of equity valuations from the real economy, even by modern standards. Some other basic market facts we found extremely worrisome:
| | • | Five technology-related companies—Apple, Amazon, Microsoft, Google, and Facebook—now comprise 24.5% of the S&P 500’s total market capitalization, and over 50% of the Nasdaq. This S&P 500 concentration makes any standard equity portfolio very brittle and overexposed to single name risk. |
| | | |
| | • | Over the course of 2019, three of the four quarters saw S&P company earnings decline year-over-year. Fourth quarter 2019’s earnings growth was only 0.9%. As these results were coming to light, and as the coronavirus began to spread outside of China, the S&P made a new record high on February 19, 2020. |
| | | |
| | • | In response to the coronavirus lockdowns, the Federal Reserve cut its policy rate 150 basis points (bps) over the course of 10 days, taking it all the way to 0. In addition, it introduced multiple new programs meant to bolster the economy. Unfortunately, the Fed (technically through the Treasury) is now purchasing corporate bonds to support asset prices, which is not only outside of the Fed’s mandate, but is also a philosophical travesty in a supposedly free market. These new programs have exploded the Fed’s balance sheet, from $4.2 trillion pre-coronavirus, to $7.0 trillion at the end of the period. |
SECURIAN AM FUNDS
| | • | Global negative-yielding debt hit a new record of $16.2 trillion on August 10, 2020. |
| | | |
| | • | In response to the Fed’s implicit promise to support risk asset prices by any means necessary, the S&P 500 aggressively rallied off of its March 23, 2020 low. Its drawdown to that point was -33.9%. Over the next 103 days, it rallied 51.5% to surpass its previous high. This rally is unmatched in the last 87 years; only periods from 1932 and 1933 saw a larger S&P 500 price appreciation in the same number of business days. The same can be said about the 56.5% return the S&P turned in for March 23 through the official end of this period. |
Finally, consider the following YTD returns:
| | | Long | Low | | | |
| | Silver | Treasuries | Volatility | | | |
| Returns | (in USD) | (Bloomberg | Equity | S&P 500 | Russell 2000 | Nasdaq |
| |
| | (MSCI USA | | | |
| |
| Long Treasury) | Min Vol Index) | | | |
| 01/01/2020 | | | | | | |
| to | 57.64% | 20.88% | 0.53% | 9.74% | -5.54% | 39.56% |
| 08/31/2020 | | | | | | |
Source: Bloomberg
This mosaic of dramatic tech stock outperformance, most other equity sectors lagging significantly, and silver—often considered an inflation hedge—appreciating 57.6% when the Fed’s rate policy and liquidity injections are the main supports underneath the market, was troubling.
The punchline is, quite simply, we are living through a very dysfunctional market.
OUTLOOK
The coronavirus continues to spread throughout the world population, with about 25 million cases globally, and 6 million cases in the U.S., as of the end of this period. Each state is attempting to return to their pre-COVID normal, but essentially all are still operating at a reduced capacity. Weekly initial jobless claims have been running above the peak of the Great Financial Crisis for almost six months, and the unemployment rate was at 8.4%. The third quarter 2020 earnings decline for the S&P 500 is currently estimated at -21.8% year-over-year. Despite this context, the S&P 500 set yet another new record high one day before the end of this period.
Essentially all fundamental equity valuation metrics—trailing Price-Earnings (PE) ratio, forward PE ratio, market capitalization to GDP, equity dividend yield, etc.—are at, or near, historic extremes. Also of note is that, because of the highly contentious political climate, the initial fiscal stimulus Congress had passed in response to the coronavirus has now run out. Currently, the Democrats and Republicans are nowhere near agreement on the size or scope of the second round of stimulus; presumably, both sides believe they can blame the other for this failure to deliver more stimulus, and consequently pick up votes in the looming election. Even the election itself is extreme; this election will likely have the highest percentage of absentee ballots ever, and the current Administration has attempted to sow doubt in the integrity of the election in multiple ways.
In light of the dramatic uncertainty facing the United States over the next few months, we anticipate equity volatility to rise from where it currently is, and equity valuations to struggle.
SECURIAN AM FUNDS
One final point we will highlight is that, going forward, we believe fixed income assets will likely be less effective hedges to equity losses in volatile time periods. For example, in the coronavirus selloff, the US 10-year Treasury future returned 7.50% on a rolling 3-month basis, as of March 23, 2020. The corresponding rate move was -1.13%. The current 10-year Treasury rate was only 0.72% at the end of the period. Thus, in the next equity selloff, we believe that Treasuries simply do not have nearly as much room to rally. We view this as yet another reason to be cautious in one’s portfolio construction.
As always, we will continue to use our volatility metrics to inform the equity allocation of the Fund. We will aim to de-risk when we believe volatility will be high, and aim to re-risk when we believe volatility will be low.
SECURIAN AM FUNDS
September 30, 2020
Securian AM Managed Volatility Equity Fund
Managers:
Craig Stapleton, CFA; Jeremy Gogos, CFA; Merlin Erickson
Securian Asset Management
FUND PERFORMANCE UPDATE
For the period September 1, 2019 and ending August 31, 2020, the Managed Volatility Equity Fund (the “Fund”) Institutional Class returned -2.76%, compared to the secondary benchmark return of -1.70%.
The Fund had a realized volatility, as measured by its standard deviation of daily returns, of 11.17%, as compared to the benchmark realized volatility of 23.29% for the same period.
For comparison, the S&P 500 Index (dividend adjusted), which the Fund uses as a broad-based securities market index, was up 21.94% with a volatility of 33.19%, and the MSCI All Cap World Index (“MSCI ACWI”) was up 17.15% with a realized volatility of 26.23% over the same period.
STRATEGY UPDATE
In terms of volatility, this period truly is a tale of two polar opposites. The first half of the period, September of 2019 through most of February 2020, was rather calm, despite troubling underlying geopolitical and economic fundamentals. As we highlighted in our last semi-annual letter, late 2019 saw weakening economic data globally, declining corporate earnings in the U.S., and continued U.S.-China trade conflict. Equity volatility began the period at 21.00% (September 1, 2019), and thanks to the Federal Reserve (Fed) easing monetary policy, volatility drifted lower, ranging between 5.00% to 14.50% for October 2019 through mid-February 2020. As such, the Fund equity exposure began this period at 97.5%, and was maintained between 97.0% and 100.0% from October 2019 through mid-February 2020.
As is widely known, the second half of the period—mid-February 2020 through the end of August 2020—was one of the most volatile and unusual periods in the history of U.S. equity markets. The global lockdown intended to slow the spread of coronavirus had a dramatic economic impact, the full extent of which still isn’t known. March of 2020 proved to be the most volatile calendar month in the S&P 500’s history, seeing 93.4% realized volatility. For context, in the most volatile month from the Great Financial Crisis (GFC)—October of 2008—the S&P 500 realized 80.8% volatility. International markets fared similarly through the initial coronavirus panic; European and Asian indexes drew down approximately 30-40% from mid-February to mid-March, with quite elevated volatility. For 02/15/2020 – 03/18/2020.
| 02/15/20 – | | | | Hang Seng |
| 03/18/20 | EuroStoxx 50 | FTSE 100 (UK) | Nikkei 225 (Japan) | (Hong Kong) |
| Return (%) | -37.94 | -31.26 | -29.75 | -19.28 |
| Volatility (%) | 55.64 | 49.82 | 31.96 | 28.70 |
Source: Bloomberg
SECURIAN AM FUNDS
Because of this extreme volatility, the Fund’s equity exposure was steadily reduced from 99.3% on February 20 to 23.6% on March 18. Ultimately, the MSCI ACWI benchmark drew down -33.70% peak-to-trough in the coronavirus panic; the Fund saw a drawdown of -14.06%.
Thanks to massive intervention from both the Fed and the Federal government, the equity market stabilized, and volatility declined steadily throughout April and May, and apart from a brief pullback in June, the market relentlessly rallied for the rest of the period. Volatility closed out this period at 8.19%, and so the Fund’s equity exposure ended the period at 96.8%.
Another obvious strategy point to address is the large underperformance of the Fund relative to the benchmark for this period. Managed Volatility is a global equity strategy that targets a 10% realized volatility over a full market cycle, and seeks to mitigate severe equity drawdowns. The strategy was very successful in that latter objective. Again, peak to trough, the MSCI ACWI lost -33.70% and the Fund lost -14.06%, a differential of 19.64%. In the subsequent rally, which was overwhelmingly driven by technology stocks, being underweight equity in general, and being more diversified within equity (i.e. lower IT sector exposure), hampered short-term performance significantly. We comment on this current market situation later in this letter; suffice to say for now that we view the extreme gap in “growth vs value” performance that manifested itself, and the resulting index overconcentration in tech stocks, will revert in the future, and so we believe Managed Volatility Equity’s performance will normalize with the broader market.
MARKET SECTOR UPDATE
The record domestic economic expansion finally came to an end in this period, with February of 2020 as the 128th and final month of uninterrupted growth in the U.S. The coronavirus lockdowns ushered in a period of economic contraction unprecedented in the modern era. First quarter of 2020 saw Gross Domestic Product (GDP) shrink -5.0% quarter-over-quarter, and second quarter saw a -31.7% quarter-over-quarter reduction of the same. For context, in the depths of the Great Financial Crisis, the fourth quarter of 2008 saw GDP decline -8.4% quarter-over-quarter.
The historical relationship between this quarter-over-quarter change in GDP, and the S&P 500 trailing 1-year return, is depicted below. The blue dots show the S&P 500 trailing 1-year return vs quarter-over-quarter change in GDP for the second quarter 1947 through first quarter 2020. The red dot shows the S&P 500 return implied by extending the best fit line to the known -31.7 decrease in GDP for second quarter GDP. The green dot shows the actual S&P 500 return.
SECURIAN AM FUNDS
Source: Bloomberg
This is an absurd dislocation of equity valuations from the real economy, even by modern standards. Some other basic market facts we found extremely worrisome:
| | • | Five technology-related companies—Apple, Amazon, Microsoft, Google, and Facebook—now comprise 24.5% of the S&P 500’s total market capitalization, and over 50% of the Nasdaq. This concentration makes any standard equity portfolio very brittle and overexposed to single name risk. |
| | | |
| | • | Over the course of 2019, three of the four quarters saw S&P company earnings decline year-over-year. Fourth quarter 2019’s earnings growth was only 0.9%. As these results were coming to light, and as the coronavirus began to spread outside of China, the S&P made a new record high on February 19, 2020. |
| | | |
| | • | In response to the coronavirus lockdowns, the Federal Reserve cut its policy rate 150 basis points (bps) over the course of 10 days, taking it all the way to 0. In addition, it introduced multiple new programs meant to bolster the economy. Unfortunately, the Fed (technically through the Treasury) is now purchasing corporate bonds to support asset prices, which is not only outside of the Fed’s mandate, but is also a philosophical travesty in a supposedly free market. These new programs have exploded the Fed’s balance sheet, from $4.2 trillion pre-coronavirus, to $7.0 trillion at the end of the period. |
| | | |
| | • | Global negative-yielding debt hit a new record of $16.2 trillion on August 10, 2020. |
| | | |
| | • | In response to the Fed’s implicit promise to support risk asset prices by any means necessary, the S&P 500 aggressively rallied off of its March 23, 2020 low. Its drawdown to that point was -33.9%. Over the next 103 days, it rallied 51.5% to surpass its previous high. This rally is unmatched in the last 87 years; only periods from 1932 and 1933 saw a larger S&P 500 price appreciation in the same number of business days. The same can be said about the 56.5% return the S&P turned in for March 23 through the official end of this period. |
SECURIAN AM FUNDS
Finally, consider the following YTD returns:
| | | Long | Low | | | |
| | Silver | Treasuries | Volatility | | | |
| Returns | (in USD) | (Bloomberg | Equity | S&P 500 | Russell 2000 | Nasdaq |
| |
| | (MSCI USA | | | |
| |
| Long Treasury) | Min Vol Index) | | | |
| 01/01/2020 | | | | | | |
| to | 57.64% | 20.88% | 0.53% | 9.74% | -5.54% | 39.56% |
| 08/31/2020 | | | | | | |
Source: Bloomberg
This mosaic of dramatic tech stock outperformance, most other equity sectors lagging significantly, and silver—often considered an inflation hedge—appreciating 57.6% when the Fed’s rate policy and liquidity injections are the main supports underneath the market, was troubling.
The punchline is, quite simply, we are living through a very dysfunctional market.
OUTLOOK
The coronavirus continues to spread throughout the world population, with about 25 million cases globally, and 6 million cases in the U.S., as of the end of this period. Each state is attempting to return to their pre-COVID normal, but essentially all are still operating at a reduced capacity. Weekly initial jobless claims have been running above the peak of the Great Financial Crisis for almost six months, and the unemployment rate was at 8.4%. The third quarter 2020 earnings decline for the S&P 500 is currently estimated at -21.8% year-over-year. Despite this context, the S&P 500 set yet another new record high one day before the end of this period.
Essentially all fundamental equity valuation metrics—trailing Price-Earnings (PE) ratio, forward PE ratio, market cap to GDP, equity dividend yield, etc.—are at, or near, historic extremes. Also of note is that, because of the highly contentious political climate, the initial fiscal stimulus Congress had passed in response to the coronavirus has now run out. Currently, the Democrats and Republicans are nowhere near agreement on the size or scope of the second round of stimulus; presumably, both sides believe they can blame the other for this failure to deliver more stimulus, and consequently pick up votes in the looming election. Even the election itself is extreme; this election will likely have the highest percentage of absentee ballots ever, and the current Administration has attempted to sow doubt in the integrity of the election in multiple ways.
In light of the dramatic uncertainty facing the United States over the next few months, we anticipate equity volatility to rise from where it currently is, and equity valuations to struggle.
One final point we will highlight is that, going forward, we believe fixed income assets will likely be less effective hedges to equity losses in volatile time periods. For example, in the coronavirus selloff, the US 10-year Treasury future returned 7.50% on a rolling 3-month basis, as of March 23, 2020. The corresponding rate move was -1.13%. The current 10-year rate was only 0.72% at the end of the period. Thus, in the next equity selloff, we believe that Treasuries simply do not have nearly as much room to rally. We view this as yet another reason to be cautious in one’s portfolio construction.
As always, we will continue to use our volatility metrics to inform the equity allocation of the Fund. We will aim to de-risk when we believe volatility will be high, and aim to re-risk when we believe volatility will be low.
SECURIAN AM FUNDS
September 30, 2020
Securian AM Real Asset Income Fund
Managers:
Joseph Betlej, CFA; Lowell Bolken, CFA; Craig Stapleton, CFA
Securian Asset Management
FUND PERFORMANCE UPDATE
For the 12-month period ending August 31, 2020, the return for the Securian AM Real Asset Income Fund’s (the “RAI Fund”) Institutional Class was -14.25%, underperforming the Morningstar U.S. Real Asset Total Return Index at -1.42%, and the RAI Fund secondary benchmark return of -10.04%. The RAI Fund secondary benchmark is a custom benchmark for the RAI Fund, developed by Securian Asset Management. For additional comparison, the S&P 500 Index (dividend adjusted) was up 21.94% during the same period. The RAI Fund’s dividend yield and volatility relative to the S&P 500 Index was consistent with expectations.
The reporting period can be divided into two categories: pre-COVID and post-COVID. On February 19, 2020, the S&P 500 index reached a then-record high Economic conditions were balanced as the global trade wars and disruption of global supply chains weighed on progress, but the consumer continued strong with solid employment markets, retail sales, and lower interest rates boosting the housing markets. However, beginning on February 20 (post-COVID), the broader market began its descent as an accelerating number of COVID cases outside of China and China’s third revision of coronavirus data inspired a fresh wave of risk-off sentiment. News and sentiment continued to turn negative, and the equity market downturn continued through March 23, 2020. The S&P 500 dropped 34% during that 23-day period, but energy, utilities, and real estate all had steeper declines as measured by the secondary custom benchmark’s sub-indices. Despite the real asset nature of energy and commercial real estate, the specter of a severe cessation of usage for both asset types inspired the accelerated sell-off. Utilities, historically regarded as a defensive play, also underperformed the broader market during this 23-day period, which was somewhat of a surprise. This market reaction challenged our efforts to defensively reposition by reducing energy infrastructure and REITs, while increasing utility exposure.
As the Federal Reserve (Fed) launched a massive Quantitative Easing (QE) program and the U.S. Congress passed the CAREs Act in March, the market sharply pivoted. The S&P 500 bounced back with a total return of +57% from March 23 through August 31. The reopening of economies state by state also drove a marked improvement in economic activity: the Atlanta Fed’s GDPNow model forecast for third quarter 2020 currently predicts 32% quarter over quarter growth, which almost mirrors the -32% actual GDP collapse in second quarter. This type of “V” recovery, as in past accelerated movements, tended to overwhelm high-yielding dividend equity stocks over the short term. The result was Fund underperformance during this post-COVID period. As the price of oil (West Texas Intermediate) spent two weeks below $20 (at one point was temporarily negative), our discipline directed us to underweight energy infrastructure, but oil then took a sharp turn upward in May by doubling in price over the course of 5 weeks. On the other hand, even though REITs as a group lagged the broader market as sectors such as retail (particularly theaters and restaurants) and healthcare continued to face operating uncertainties, our efforts to position the Fund to react to this dynamic were successful from the March 23 low. The fixed income portfolio contributed to underperformance, primarily due to the sharp pivot in the equity market in the last week in March, during which the portfolio was conservatively overweight versus the benchmark.
SECURIAN AM FUNDS
STRATEGY UPDATE
Pre-COVID, the portfolio was positioned for growth with overweight positions in REITs and infrastructure, and an underweight in fixed income. The portfolio added defensive securities post-COVID and portfolio holdings in energy infrastructure were reduced on concerns of poor capital discipline, as well as the impact expected from the decline in natural gas pricing.
Anticipating tailwinds from the Fed and the legislative stimulus, we reacted to this second phase of the Post-COVID environment, favoring better growth names in our target sectors. As states re-opened their economies, we rotated into REIT sectors with solid fundamentals that had been heavily discounted given the uncertainty, such as grocery-anchored shopping centers. We refined our focus on energy infrastructure companies to proven management teams that have restructured balance sheets and dialed-back spending plans, yet retained a path for stable income with growth upside. As our individual holdings of preferred securities were called, proceeds were used to fund this rotation to growth. Utilities remain part of our defensive equation, but holdings are subject to valuation discipline and growth potential.
OUTLOOK
Though the equity markets may be pricing in a return to normalcy, it is being supported by a compliant Federal Reserve that appears to be willing to step in as needs arise. Indeed, this may be what is feeding valuations. Unemployment remains elevated, segments of the economy are still closed and/or highly restricted with an uncertain reopening time frame, and timing for vaccine development and distribution is also uncertain. The post-COVID economy may forever be changed with work-from-home and its attendant technological advancements. Finally, the form and direction of the U.S. government may change within the coming months. Prediction of higher market volatility in this environment is hardly courageous.
With that backdrop, we are cautiously optimistic about growth in our sectors relative to where we have been. REITs are especially poised to benefit in many ways (e.g., data centers, wireless towers, warehouse logistics, etc.) that never would have been contemplated in 2019. Energy infrastructure and utilities are rapidly advancing their models to be more Environmental, Social, Governance (ESG)-friendly in an effort to adapt to a new generation of investors. Consistent with our long-term investment history, we expect to position the portfolio in quality companies with strong balance sheets, disciplined capital investment, and above average dividend coverage to position the portfolio for potentially better performance ahead.
Past performance is not a guarantee of future results.
Fund holdings and sector allocations are subject to change and should not be considered a recommendation to buy or sell any security. For a complete list of fund holdings, please refer to the Schedule of Investments in this report.
Diversification does not assure a profit nor protect against loss in a declining market.
Mutual fund investing involves risk. Principal loss is possible. Investors should be aware of the risks involved with investing in a fund concentrating in a specific industry such as REITs or real estate securities. These include risks such as declines in the value of real estate and increased susceptibility to adverse economic or regulatory developments. Investing in small and medium-sized companies involves greater risks than those associated with investing in large company stocks, such as business risk, significant stock price fluctuations and illiquidity. The Funds may invest in foreign securities which involve political, economic and currency risks, greater volatility and differences in accounting methods. Investments in ETFs and ETNs are subject to additional risks that do not apply to conventional mutual funds, including the risks that the market price of the shares may trade at a discount to its net asset value (“NAV”), an active secondary trading market may not develop or be maintained, or trading may be halted by the exchange in which they trade, which may impact a Fund’s ability to sell its shares. MLPs are subject to certain risks inherent in the structure of MLPs, including complex tax structure risks, the limited ability for election or removal of management, limited voting
SECURIAN AM FUNDS
rights, potential dependence on parent companies or sponsors for revenues to satisfy obligations, and potential conflicts of interest between partners, members and affiliates. The Funds may also use options and future contracts, which have the risks of unlimited losses of the underlying holdings due to unanticipated market movements and failure to correctly predict the direction of securities prices, interest rates and currency exchange rates. Covered calls may limit the upside potential of the underlying security. Interest payments on TIPS are unpredictable and will fluctuate as the principal and corresponding interest payments are adjusted for inflation. Investments in debt securities typically decrease in value when interest rates rise. This risk is usually greater for longer-term debt securities. Investment in lower-rated and non-rated securities presents a greater risk of loss to principal and interest than higher-rated securities. Investments in asset backed and mortgage backed securities include additional risks that investors should be aware of such as credit risk, prepayment risk, possible illiquidity and default, as well as increased susceptibility to adverse economic developments. Municipal securities are subject to adverse political or economic factors, including changes in the tax law. Derivatives involve special risks including leverage, correlation, counterparty, liquidity, operational, accounting and tax risks. These risks, in certain cases, may be greater than the risks presented by more traditional investments. The Funds may invest in illiquid securities which involve the risk that the securities will not be able to be sold at the time or prices desired by the fund, particularly during times of market turmoil.
The Dynamic Managed Volatility Benchmark is a custom benchmark created by Securian Asset Management, comprised of 60% S&P 500 Index and 40% Bloomberg Barclays U.S. Aggregate Index. The S&P 500 Index is an unmanaged, market-value weighted index of stocks, which is widely regarded as the standard for measuring large-cap U.S. stock market performance. The Bloomberg Barclays U.S. Aggregate Index is an unmanaged, market-value weighted index of bonds, which is widely regarded as the standard for measuring investment grade bond performance.
The Managed Volatility Equity Fund secondary benchmark is a custom benchmark created by Securian Asset Management, comprised of 60% S&P 500 Low Volatility Index; 20% S&P BMI International Developed Low Volatility Index; and 20% Bloomberg Barclays U.S. 3 Month Treasury Bellwether Index. The S&P 500 Low Volatility Index measures the performance of the 100 least volatile stocks in the S&P 500 Index based on their historical volatility. The S&P BMI International Developed Low Volatility Index measures the performance of the 200 least volatile stocks in the S&P Developed Market large/midcap universe. Constituents are weighted relative to the inverse of their corresponding volatility, with the least volatile stocks receiving the highest weights. The Bloomberg Barclays U.S. 3 Month Treasury Bellwether Index measures the performance of U.S. Treasury Bills with a maturity of less than three months.
The Real Asset Income Benchmark is the Morningstar® US Real Asset IndexSM, which is a broadly diversified index that meets the needs of real-asset investors. To maintain broad exposure and diversification, the index will maintain a weight allocation at each rebalance of: 40% Treasury Inflation-Protected Securities, or TIPS; 30% commodities; 15% real estate investment trusts, or REITs; 10% upstream commodity stocks; and 5% master limited partnerships, or MLPs.
The secondary Real Asset Income Benchmark is a custom benchmark created by Securian Asset Management, it is comprised of 54% FTSE NAREIT Equity REITs Index; 12% S&P 500 Utilities Index; 12% Alerian MLP Total Return Index; 12% Bloomberg Barclays Capital US Government Inflation Linked Bond Index; and 10% Wells Fargo Hybrid & Preferred REIT. Alerian MLP Total Return Index – a composite of the 50 most prominent energy Master Limited Partnerships (MLPs). Bloomberg Barclays Capital US Government Inflation Linked Bond Index – an index that includes publicly issued, U.S. Treasury inflation protected securities that have at least 1 year remaining to maturity of index rebalancing date, with an issue size equal to or in excess of $500 million. The S&P 500 Utilities Index – an index of those companies included in the S&P 500 that are classified as members of the GICS® utilities sector. Wells Fargo Hybrid & Preferred REIT Index – an index composed exclusively of preferred shares and depository shares designed to track the performance of preferred securities issued in the U.S. markets by Real Estate Investment Trusts (REITs). FTSE NAREIT Equity REITs Index – an index of publicly traded U.S. real estate equity securities.
The MSCI ACWI Index captures large and mid-cap representation across 23 Developed Markets (DM) and 24 Emerging Markets (EM) countries. The Index covers approximately 85% of the global investable opportunity set. The returns are shown net of foreign dividend withholding taxes.
The Euro Stoxx 50 provides blue-chip representation of supersector leaders in the Eurozone. The index covers 50 stocks from 11 Eurozone countries: Austria, Belgium, Finland, France, Germany, Ireland, Italy, Luxembourg, the Netherlands, Portugal and Spain.
The Nikkei 225 Index is a price-weighted index comprised of Japan’s top 225 blue-chip companies traded on the Tokyo Stock Exchange.
The Bloomberg Barclays U.S. Long Treasury Index measures U.S. dollar-denominated, fixed-rate, nominal debt issued by the U.S. Treasury with 10 years or more to maturity.
The MSCI USA Minimum Volatility Index aims to reflect the performance characteristics of a minimum variance strategy applied to the large and mid-cap USA equity universe.
SECURIAN AM FUNDS
The NASDAQ Composite Index measures all NASDAQ domestic and international based common type stocks listed on The NASDAQ Stock Market. The NASDAQ Composite is calculated under a market capitalization weighted methodology index.
The Russell 2000 Index measures the performance of the small-cap segment of the U.S. equity universe. It includes approximately 2,000 of the smallest securities based on a combination of their market cap and current index membership.
The FTSE 100 Index is a market-capitalization weighted index of UK-listed blue-chip companies. The index is part of the FTSE UK Series and is designed to measure the performance of the 100 largest companies traded on the London Stock Exchange that pass screening for size and liquidity.
The Hang Seng Index is a market capitalization-weighted index of the largest companies that trade on the Hong Kong Exchange, covering approximately 65% of its total market capitalization.
Drawdown refers to the peak-to-trough decline during a specific period for an investment.
Trailing price-to-earnings ratio is a relative valuation multiple that is based on stock price divided by the trailing earnings per share for the past 12 months.
Forward price-to-earnings ratio is a relative valuation multiple that is based on stock price divided by the future forecasted earnings per share.
Market capitalization to GDP is a ratio used to determine whether an overall market is undervalued or overvalued compared to a historical average.
Standard deviation measures the dispersion of a set of data from its mean.
A basis point is a common unit of measurement for interest rates and other percentages in finance. One basis point is equal to 1/100th of 1%, or 0.01% (0.0001), and is used to denote percentage change in a financial instrument.
Dividend yield is calculated by annualizing the last quarterly dividend paid and dividing it by the current share price. The dividend yield is that of the securities held in the portfolio; it is not reflective of the yield distributed to shareholders.
Must be preceded or accompanied by a current prospectus.
Quasar Distributors, LLC, distributor.
Earnings growth is not a measure of the Fund’s future performance.
A stock may trade with more or less liquidity than a bond depending on the number of shares and bonds outstanding, the size of the company, and the demand for the securities. Silver is considered a commodity and liquidity is based on buying or selling an asset easily without disrupting price in a market. Treasury notes are guaranteed by the U.S. government and thus they are considered to be safer than other asset classes.
SECURIAN AM DYNAMIC MANAGED VOLATILITY FUND
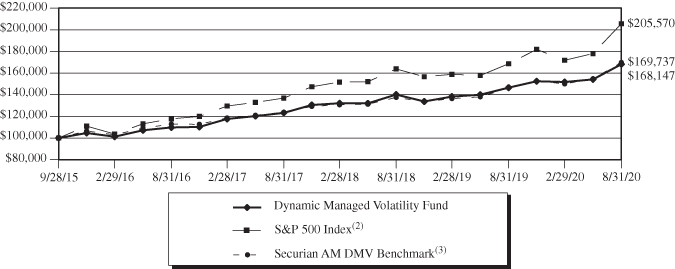
Value of $100,000 Investment (Unaudited)
The chart assumes an initial investment of $100,000. Performance reflects waivers of fee and operating expenses in effect. In the absence of such waivers, total return would be reduced. Performance data quoted represents past performance and does not guarantee future results. Investment returns and principal value will fluctuate, and when sold, may be worth more or less than their original cost. Performance current to the most recent month-end may be lower or higher than the performance quoted and can be obtained by calling 855-824-1355. Performance assumes the reinvestment of capital gains and income distributions. The performance does not reflect the deduction of taxes that a shareholder would pay on Fund distributions or the redemption of Fund shares.
Annualized Rates of Return (%) – As of August 31, 2020 (Unaudited)
| | One Year | Three Years | Since Inception(1) |
| Dynamic Managed Volatility Fund | 14.76% | 10.92% | 11.13% |
S&P 500 Index(2) | 21.94% | 14.52% | 15.75% |
Securian AM DMV Benchmark(3) | 16.20% | 11.08% | 11.34% |
| (1) | September 28, 2015. |
| (2) | The Standard & Poor’s 500 Index is an unmanaged, capitalization-weighted index generally representative of the U.S. market for large capitalization stocks. This Index cannot be invested in directly. |
| (3) | The Securian AM DMV Benchmark is comprised of 60% S&P 500 Index and 40% Bloomberg Barclays U.S. Aggregate Bond Index. This Index cannot be invested in directly. |
The following is expense information for the Securian AM Dynamic Managed Volatility Fund as disclosed in the Fund’s most recent prospectus dated December 29, 2019:
Gross Expenses: 0.99%; Net Expenses: 0.61%. Securian Asset Management, Inc. (the “Adviser” or “Securian AM”) has contractually agreed to waive its management fees and pay Fund expenses, in order to ensure that Total Annual Fund Operating Expenses (excluding acquired fund fees and expenses, leverage/borrowing, interest, interest expense, dividends paid on short sales, taxes, brokerage commissions and extraordinary expenses) do not exceed 0.55% of the average daily net assets of the Institutional Class. Fees waived and expenses paid by the Adviser may be recouped by the Adviser for a period of 36 months following the month during which such fee waiver and/or expense payment was made if such recoupment can be achieved without exceeding the expense limit in effect at the time the fee waiver and/or expense payment occurred and the expense limit in place at the time of recoupment. The Operating Expenses Limitation Agreement is indefinite, but cannot be terminated through at least December 29, 2020. Thereafter, the agreement may be terminated at any time upon 60 days’ written notice by the Trust’s Board of Trustees (the “Board”) or the Adviser.
SECURIAN AM MANAGED VOLATILITY EQUITY FUND
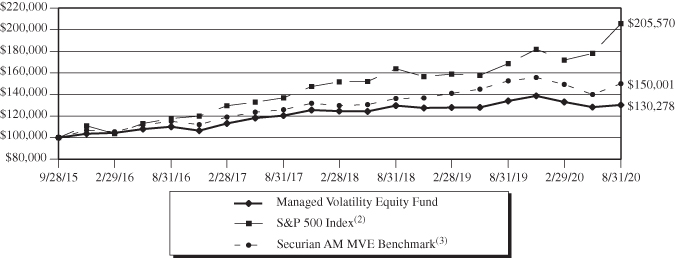
Value of $100,000 Investment (Unaudited)
The chart assumes an initial investment of $100,000. Performance reflects waivers of fee and operating expenses in effect. In the absence of such waivers, total return would be reduced. Performance data quoted represents past performance and does not guarantee future results. Investment returns and principal value will fluctuate, and when sold, may be worth more or less than their original cost. Performance current to the most recent month-end may be lower or higher than the performance quoted and can be obtained by calling 855-824-1355. Performance assumes the reinvestment of capital gains and income distributions. The performance does not reflect the deduction of taxes that a shareholder would pay on Fund distributions or the redemption of Fund shares.
Annualized Rates of Return (%) – As of August 31, 2020 (Unaudited)
| | One Year | Three Years | Since Inception(1) |
| Managed Volatility Equity Fund | -2.76% | 2.66% | 5.52% |
S&P 500 Index(2) | 21.94% | 14.52% | 15.75% |
Securian AM MVE Benchmark(3) | -1.70% | 6.01% | 8.58% |
| (1) | September 28, 2015. |
| (2) | The Standard & Poor’s 500 Index is an unmanaged, capitalization-weighted index generally representative of the U.S. market for large capitalization stocks. This Index cannot be invested in directly. |
| (3) | The Securian AM MVE Benchmark is comprised of 60% S&P 500 Low Volatility Index, 20% S&P BMI International Developed Low Volatility Index, and 20% Bloomberg Barclays U.S. 3 Month Treasury Bellwether Index. This Index cannot be invested in directly. |
The following is expense information for the Securian AM Managed Volatility Equity Fund as disclosed in the Fund’s most recent prospectus dated December 29, 2019:
Gross Expenses: 1.21%; Net Expenses: 0.72%. Securian Asset Management, Inc. (the “Adviser” or “Securian AM”) has contractually agreed to waive its management fees and pay Fund expenses, in order to ensure that Total Annual Fund Operating Expenses (excluding acquired fund fees and expenses, leverage/borrowing interest, interest expense, dividends paid on short sales, taxes, brokerage commissions and extraordinary expenses) do not exceed 0.55% of the average daily net assets of the Institutional Class. Fees waived and expenses paid by the Adviser may be recouped by the Adviser for a period of 36 months following the month during which such fee waiver and/or expense payment was made if such recoupment can be achieved without exceeding the expense limit in effect at the time the fee waiver and/or expense payment occurred and the expense limit in place at the time of recoupment. The Operating Expenses Limitation Agreement is indefinite but cannot be terminated through at least December 29, 2020. Thereafter, the agreement may be terminated at any time upon 60 days’ written notice by the Trust’s Board of Trustees (the “Board”) or the Adviser.
SECURIAN AM REAL ASSET INCOME FUND
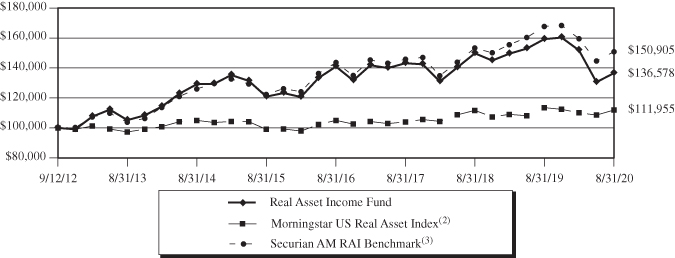
Value of $100,000 Investment (Unaudited)
The chart assumes an initial investment of $100,000. Performance reflects waivers of fee and operating expenses in effect. In the absence of such waivers, total return would be reduced. Performance data quoted represents past performance and does not guarantee future results. Investment returns and principal value will fluctuate, and when sold, may be worth more or less than their original cost. Performance current to the most recent month-end may be lower or higher than the performance quoted and can be obtained by calling 855-824-1355. Performance assumes the reinvestment of capital gains and income distributions. The performance does not reflect the deduction of taxes that a shareholder would pay on Fund distributions or the redemption of Fund shares.
Annualized Rates of Return (%) – As of August 31, 2020 (Unaudited)
| | One Year | Three Years | Five Years | Since Inception(1) |
| Real Asset Income Fund | -14.25% | -1.57% | 2.47% | 3.99% |
Morningstar US Real Asset Index(2) | -1.42% | 2.47% | 2.47% | 1.43% |
Securian AM RAI Benchmark(3) | -10.04% | 1.16% | 4.28% | 5.30% |
| (1) | September 12, 2012. |
| (2) | The Morningstar US Real Asset Index is a diversified portfolio of four different asset classes that have historically displayed high sensitivity to inflation. These four asset classes are U.S. Treasury inflation-protected securities (“TIPS”), commodity futures-based strategies, real estate investment trusts (“REITs”), and inflation-sensitive equities such as upstream commodity stocks and master limited partnerships. This Index cannot be invested in directly. |
| (3) | The Securian AM RAI Benchmark is comprised of 54% FTSE NAREIT Equity REITs Index; 12% S&P 500 Utilities Index; 12% Alerian MLP Total Return Index; 12% Bloomberg Barclays Capital U.S. Government Inflation Linked Bond Index; and 10% Wells Fargo Hybrid & Preferred REIT Index. This Index cannot be invested in directly. |
The following is expense information for the Securian AM Real Asset Income Fund as disclosed in the Fund’s most recent prospectus dated December 29, 2019:
Gross Expenses: 1.04%; Net Expenses: 0.77%. Securian Asset Management, Inc. (the “Adviser” or “Securian AM”) has contractually agreed to waive its management fees and pay Fund expenses, in order to ensure that Total Annual Fund Operating Expenses (excluding acquired fund fees and expenses, leverage/borrowing interest, interest expense, dividends paid on short sales, taxes, brokerage commissions and extraordinary expenses) do not exceed 0.75% of the average daily net assets of the Institutional Class. Fees waived and expenses paid by the Adviser may be recouped by the Adviser for a period of 36 months following the month during which such fee waiver and/or expense payment was made if such recoupment can be achieved without exceeding the expense limit in effect at the time the fee waiver and/or expense payment occurred and the expense limit in place at the time of recoupment. The Operating Expenses Limitation Agreement is indefinite but cannot be terminated through at least December 29, 2020. Thereafter, the agreement may be terminated at any time upon 60 days’ written notice by the Trust’s Board of Trustees (the “Board”) or the Adviser.
SECURIAN AM FUNDS
Expense Examples (Unaudited)
August 31, 2020
As a shareholder of a Fund, you incur two types of costs: (1) transaction costs and (2) ongoing costs, including management fees and other Fund expenses. This Example is intended to help you understand your ongoing costs (in dollars) of investing in the Fund and to compare these costs with the ongoing costs of investing in other mutual funds. The Example is based on an investment of $1,000 invested at the beginning of the period and held for the entire period (March 1, 2020 – August 31, 2020).
ACTUAL EXPENSES
For each class, the first line of the table provides information about actual account values and actual expenses. You may use the information in this line, together with the amount you invested, to estimate the expenses that you paid over the period. Simply divide your account value by $1,000 (for example, an $8,600 account value divided by $1,000 = 8.6), then multiply the result by the number in the first line under the heading entitled “Expenses Paid During Period” to estimate the expenses you paid on your account during this period.
HYPOTHETICAL EXAMPLE FOR COMPARISON PURPOSES
For each class, the second line of the table below provides information about hypothetical account values and hypothetical expenses based on the Fund’s actual expense ratio and an assumed rate of return of 5% per year before expenses, which is not the Fund’s actual return. The hypothetical account values and expenses may not be used to estimate the actual ending account balance or expenses you paid for the period. You may use this information to compare the ongoing costs of investing in the Fund and other funds. To do so, compare this 5% hypothetical example with the 5% hypothetical examples that appear in the shareholder reports of the other funds.
Please note that the expenses shown in the table are meant to highlight your ongoing costs only. Therefore, the second line of the table is useful in comparing ongoing costs only, and will not help you determine the relative total costs of owning different funds.
Securian AM Dynamic Managed Volatility Fund
| | Beginning | Ending | Expenses Paid |
| | Account Value | Account Value | During Period(1) |
| | (3/1/2020) | (8/31/2020) | (3/1/2020 to 8/31/2020) |
Dynamic Managed Volatility Fund Actual(2) | $1,000.00 | $1,108.10 | $2.91 |
| Dynamic Managed Volatility Fund Hypothetical | | | |
| (5% return before expenses) | $1,000.00 | $1,022.37 | $2.80 |
| (1) | Expenses are equal to the Fund’s annualized expense ratio for the most recent six-month period of 0.55%, multiplied by the average account value over the period, multiplied by 184/366 to reflect the one-half year period. |
| (2) | Based on the actual returns for the six-month period ended August 31, 2020 of 10.81%. |
SECURIAN AM FUNDS
Expense Examples (Unaudited) – Continued
August 31, 2020
Securian AM Managed Volatility Equity Fund
| | Beginning | Ending | Expenses Paid |
| | Account Value | Account Value | During Period(3) |
| | (3/1/2020) | (8/31/2020) | (3/1/2020 to 8/31/2020) |
Managed Volatility Equity Fund Actual(4) | $1,000.00 | $ 979.30 | $2.74 |
| Managed Volatility Equity Fund Hypothetical | | | |
| (5% return before expenses) | $1,000.00 | $1,022.37 | $2.80 |
| (3) | Expenses are equal to the Fund’s annualized expense ratio for the most recent six-month period of 0.55%, multiplied by the average account value over the period, multiplied by 184/366 to reflect the one-half year period. |
| (4) | Based on the actual returns for the six-month period ended August 31, 2020 of -2.07%. |
Securian AM Real Asset Income Fund
| | Beginning | Ending | Expenses Paid |
| | Account Value | Account Value | During Period(5) |
| | (3/1/2020) | (8/31/2020) | (3/1/2020 to 8/31/2020) |
Real Asset Income Fund Actual(6) | $1,000.00 | $ 899.60 | $3.58 |
| Real Asset Income Fund Hypothetical | | | |
| (5% return before expenses) | $1,000.00 | $1,021.37 | $3.81 |
| (5) | Expenses are equal to the Fund’s annualized expense ratio for the most recent six-month period of 0.75%, multiplied by the average account value over the period, multiplied by 184/366 to reflect the one-half year period. |
| (6) | Based on the actual returns for the six-month period ended August 31, 2020 of -10.04%. |
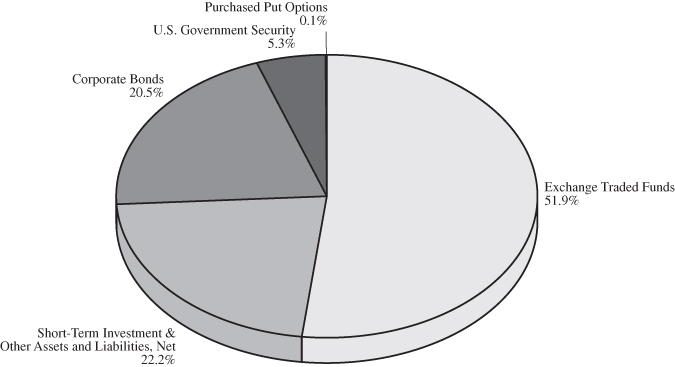
SECURIAN AM DYNAMIC MANAGED VOLATILITY FUND
Asset Allocation (Unaudited)
As of August 31, 2020(1)
(% of net assets)
Top Ten Holdings (Unaudited)
As of August 31, 2020(1)(2)
(% of net assets)
| iShares Core S&P 500 Fund | | | 42.6 | % |
| iShares iBoxx $ Investment Grade Corporate Bond Fund | | | 9.3 | % |
| U.S. Treasury Bond, 2.625%, 12/15/2021 | | | 5.3 | % |
| Takeda Pharmaceutical, 5.000%, 11/26/2028 | | | 0.9 | % |
| E*TRADE Financial, 2.950%, 08/24/2022 | | | 0.8 | % |
| Abbott Laboratories, 4.750%, 04/15/2043 | | | 0.6 | % |
| AT&T, 4.500%, 05/15/2035 | | | 0.5 | % |
| Sherwin-Williams, 3.950%, 01/15/2026 | | | 0.5 | % |
| Florida Gas Transmission, 4.350%, 07/15/2025 | | | 0.5 | % |
| Verizon Communications, 5.250%, 03/16/2037 | | | 0.5 | % |
| (1) | Fund holdings and sector allocations are subject to change at any time and are not recommendations to buy or sell any security. |
| (2) | Short-term investments and derivatives are not included. |
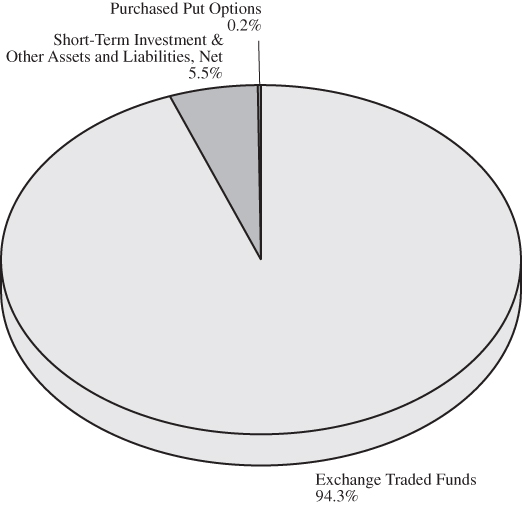
SECURIAN AM MANAGED VOLATILITY EQUITY FUND
Asset Allocation (Unaudited)
As of August 31, 2020(1)
(% of net assets)
Fund Holdings (Unaudited)
As of August 31, 2020(1)(2)
(% of net assets)
| iShares MSCI USA Minimum Volatility Fund | | | 32.7 | % |
| iShares MSCI EAFE Minimum Volatility Fund | | | 26.9 | % |
| iShares Core High Dividend Fund | | | 19.0 | % |
| iShares MSCI Emerging Markets Minimum Volatility Fund | | | 6.8 | % |
| iShares MSCI Germany Fund | | | 4.7 | % |
| iShares Short Maturity Bond Fund | | | 4.2 | % |
| (1) | Fund holdings and sector allocations are subject to change at any time and are not recommendations to buy or sell any security. |
| (2) | Short-term investments and derivatives are not included. |
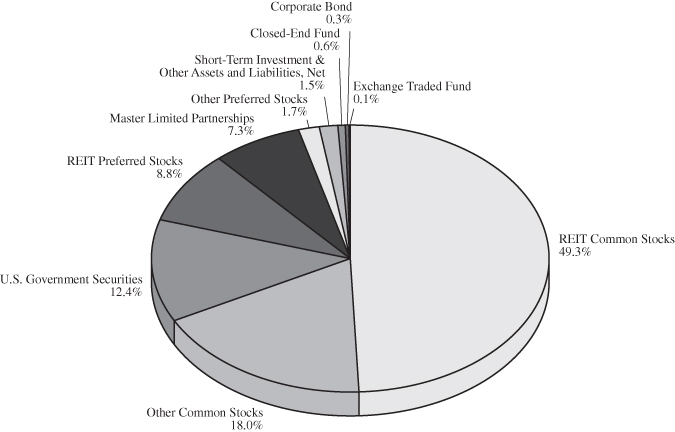
SECURIAN AM REAL ASSET INCOME FUND
Asset Allocation (Unaudited)
As of August 31, 2020(1)
(% of net assets)
Top Ten Holdings (Unaudited)
As of August 31, 2020(1)(2)
(% of net assets)
| Prologis | | | 2.9 | % |
| Digital Realty Trust | | | 2.9 | % |
| Equinix | | | 2.4 | % |
| U.S. Treasury Bond, 2.375%, 01/15/2025 | | | 2.4 | % |
| Crown Castle International | | | 2.4 | % |
| STAG Industrial | | | 2.1 | % |
| U.S. Treasury Bond, 0.125%, 07/15/2024 | | | 1.8 | % |
| Public Storage | | | 1.7 | % |
| U.S. Treasury Bond, 0.125%, 07/15/2024 | | | 1.7 | % |
| Welltower | | | 1.6 | % |
| (1) | Fund holdings and sector allocations are subject to change at any time and are not recommendations to buy or sell any security. |
| (2) | Short-term investments are not included. |
SECURIAN AM DYNAMIC MANAGED VOLATILITY FUND
Schedule of Investments
August 31, 2020
| | | | | | Fair | |
| | | Shares | | | Value | |
| EXCHANGE TRADED FUNDS – 51.9% | | | | | | |
iShares Core S&P 500 Fund (a)(b) | | | 80,666 | | | $ | 28,295,213 | |
iShares iBoxx $ Investment Grade Corporate Bond Fund | | | 45,500 | | | | 6,169,800 | |
| Total Exchange Traded Funds | | | | | | | | |
| (Cost $22,820,471) | | | | | | | 34,465,013 | |
| | | | | | | | | |
| | | Par | | | | | |
| CORPORATE BONDS – 20.5% | | | | | | | | |
| | | | | | | | | |
| Airlines – 0.2% | | | | | | | | |
British Airways | | | | | | | | |
Series 2013-1 | | | | | | | | |
4.625%, 12/20/2025 (c) | | $ | 171,161 | | | | 164,177 | |
| | | | | | | | | |
| Banks – 1.5% | | | | | | | | |
Barclays | | | | | | | | |
4.375%, 01/12/2026 (d) | | | 200,000 | | | | 227,969 | |
JPMorgan Chase | | | | | | | | |
4.500%, 01/24/2022 | | | 250,000 | | | | 264,488 | |
PNC Bank | | | | | | | | |
2.450%, 07/28/2022 | | | 250,000 | | | | 259,556 | |
Synchrony Bank | | | | | | | | |
3.000%, 06/15/2022 | | | 250,000 | | | | 258,541 | |
| | | | | | | | 1,010,554 | |
| | | | | | | | | |
| Chemicals – 1.0% | | | | | | | | |
Sherwin-Williams | | | | | | | | |
3.950%, 01/15/2026 | | | 300,000 | | | | 342,440 | |
Yara International | | | | | | | | |
4.750%, 06/01/2028 (c)(d) | | | 250,000 | | | | 292,684 | |
| | | | | | | | 635,124 | |
| | | | | | | | | |
| Consumer Discretionary – 0.9% | | | | | | | | |
CBS | | | | | | | | |
3.500%, 01/15/2025 | | | 300,000 | | | | 331,401 | |
Harley-Davidson Financial Services | | | | | | | | |
3.550%, 05/21/2021 (c) | | | 250,000 | | | | 253,703 | |
| | | | | | | | 585,104 | |
| | | | | | | | | |
| Consumer Staples – 0.3% | | | | | | | | |
CVS Health | | | | | | | | |
6.943%, 01/10/2030 | | | 183,714 | | | | 218,217 | |
See Notes to the Financial Statements
SECURIAN AM DYNAMIC MANAGED VOLATILITY FUND
Schedule of Investments – Continued
August 31, 2020
| | | | | | Fair | |
| | | Par | | | Value | |
| CORPORATE BONDS – 20.5% (Continued) | | | | | | |
| | | | | | | |
| Diversified Financial Services – 2.8% | | | | | | |
American Express | | | | | | |
2.500%, 08/01/2022 | | $ | 250,000 | | | $ | 259,551 | |
Capital One Financial | | | | | | | | |
4.250%, 04/30/2025 | | | 250,000 | | | | 285,838 | |
E*TRADE Financial | | | | | | | | |
2.950%, 08/24/2022 | | | 500,000 | | | | 522,746 | |
First American Financial | | | | | | | | |
4.600%, 11/15/2024 | | | 200,000 | | | | 215,497 | |
Invesco Financial | | | | | | | | |
3.750%, 01/15/2026 (d) | | | 250,000 | | | | 282,143 | |
Total System Services | | | | | | | | |
4.800%, 04/01/2026 | | | 250,000 | | | | 294,938 | |
| | | | | | | | 1,860,713 | |
| Energy – 2.6% | | | | | | | | |
Florida Gas Transmission | | | | | | | | |
4.350%, 07/15/2025 (c) | | | 300,000 | | | | 341,935 | |
ONEOK | | | | | | | | |
4.000%, 07/13/2027 | | | 250,000 | | | | 261,509 | |
Phillips 66 | | | | | | | | |
4.650%, 11/15/2034 | | | 200,000 | | | | 243,668 | |
Valero Energy | | | | | | | | |
3.650%, 03/15/2025 | | | 300,000 | | | | 329,127 | |
4.350%, 06/01/2028 | | | 250,000 | | | | 285,269 | |
Williams Partners | | | | | | | | |
3.750%, 06/15/2027 | | | 250,000 | | | | 276,374 | |
| | | | | | | | 1,737,882 | |
| Health Care – 0.6% | | | | | | | | |
Abbott Laboratories | | | | | | | | |
4.750%, 04/15/2043 | | | 300,000 | | | | 415,744 | |
| | | | | | | | | |
| Industrial – 1.3% | | | | | | | | |
General Dynamics | | | | | | | | |
3.500%, 05/15/2025 | | | 250,000 | | | | 281,081 | |
Textron | | | | | | | | |
4.000%, 03/15/2026 | | | 250,000 | | | | 276,081 | |
Tyco Electronics Group | | | | | | | | |
3.700%, 02/15/2026 (d) | | | 250,000 | | | | 280,278 | |
| | | | | | | | 837,440 | |
See Notes to the Financial Statements
SECURIAN AM DYNAMIC MANAGED VOLATILITY FUND
Schedule of Investments – Continued
August 31, 2020
| | | | | | Fair | |
| | | Par | | | Value | |
| CORPORATE BONDS – 20.5% (Continued) | | | | | | |
| | | | | | | |
| Insurance – 2.8% | | | | | | |
Allied World Assurance Company Holdings | | | | | | |
4.350%, 10/29/2025 (d) | | $ | 250,000 | | | $ | 261,947 | |
Assured Guaranty US Holdings | | | | | | | | |
5.000%, 07/01/2024 | | | 200,000 | | | | 225,847 | |
Hanover Insurance Group | | | | | | | | |
4.500%, 04/15/2026 | | | 250,000 | | | | 281,365 | |
Horace Mann Educators | | | | | | | | |
4.500%, 12/01/2025 | | | 250,000 | | | | 275,572 | |
Liberty Mutual Group | | | | | | | | |
4.250%, 06/15/2023 (c) | | | 250,000 | | | | 274,633 | |
Manulife Financial | | | | | | | | |
4.150%, 03/04/2026 (d) | | | 250,000 | | | | 296,239 | |
Old Republic International | | | | | | | | |
4.875%, 10/01/2024 | | | 200,000 | | | | 223,491 | |
| | | | | | | | 1,839,094 | |
| | | | | | | | | |
| Pharmaceuticals – 0.9% | | | | | | | | |
Takeda Pharmaceutical | | | | | | | | |
5.000%, 11/26/2028 (d) | | | 500,000 | | | | 620,064 | |
| | | | | | | | | |
| Real Estate Investment Trusts – 1.7% | | | | | | | | |
Alexandria Real Estate Equities | | | | | | | | |
4.300%, 01/15/2026 | | | 200,000 | | | | 232,578 | |
Essex Portfolio | | | | | | | | |
3.500%, 04/01/2025 | | | 300,000 | | | | 332,146 | |
Healthcare Trust of America Holdings | | | | | | | | |
3.750%, 07/01/2027 | | | 250,000 | | | | 273,139 | |
Kimco Realty | | | | | | | | |
3.400%, 11/01/2022 | | | 250,000 | | | | 263,080 | |
| | | | | | | | 1,100,943 | |
| | | | | | | | | |
| Technology – 0.5% | | | | | | | | |
Hewlett Packard Enterprise | | | | | | | | |
4.900%, 10/15/2025 | | | 100,000 | | | | 115,679 | |
Juniper Networks | | | | | | | | |
4.500%, 03/15/2024 | | | 200,000 | | | | 224,942 | |
| | | | | | | | 340,621 | |
See Notes to the Financial Statements
SECURIAN AM DYNAMIC MANAGED VOLATILITY FUND
Schedule of Investments – Continued
August 31, 2020
| | | | | | Fair | |
| | | Par | | | Value | |
| CORPORATE BONDS – 20.5% (Continued) | | | | | | |
| | | | | | | |
| Telecommunications – 2.0% | | | | | | |
AT&T | | | | | | |
4.500%, 05/15/2035 | | $ | 300,000 | | | $ | 359,846 | |
Comcast | | | | | | | | |
4.650%, 07/15/2042 | | | 250,000 | | | | 324,079 | |
Verizon Communications | | | | | | | | |
5.250%, 03/16/2037 | | | 250,000 | | | | 340,010 | |
Vodafone Group | | | | | | | | |
4.125%, 05/30/2025 (d) | | | 250,000 | | | | 287,048 | |
| | | | | | | | 1,310,983 | |
| | | | | | | | | |
| Transportation – 1.1% | | | | | | | | |
Kansas City Southern | | | | | | | | |
4.300%, 05/15/2043 | | | 250,000 | | | | 259,189 | |
Penske Truck Leasing / PTL Finance | | | | | | | | |
3.300%, 04/01/2021 (c) | | | 200,000 | | | | 202,805 | |
3.900%, 02/01/2024 (c) | | | 250,000 | | | | 271,872 | |
| | | | | | | | 733,866 | |
| | | | | | | | | |
| Utilities – 0.3% | | | | | | | | |
Oglethorpe Power | | | | | | | | |
4.250%, 04/01/2046 | | | 200,000 | | | | 216,398 | |
| Total Corporate Bonds | | | | | | | | |
| (Cost $12,093,099) | | | | | | | 13,626,924 | |
| | | | | | | | | |
| U.S. GOVERNMENT SECURITY – 5.3% | | | | | | | | |
| | | | | | | | | |
| U.S Treasury Bond – 5.3% | | | | | | | | |
2.625%, 12/15/2021 | | | | | | | | |
| Total U.S. Government Securities | | | | | | | | |
| (Cost $3,386,597) | | | 3,400,000 | | | | 3,508,574 | |
See Notes to the Financial Statements
SECURIAN AM DYNAMIC MANAGED VOLATILITY FUND
Schedule of Investments – Continued
August 31, 2020
| | | | | | | | | Fair | |
| | | Contracts | | | Notional | | | Value | |
| PURCHASED PUT OPTIONS – 0.1% | | | | | | | | | |
CBOE S&P 500 Index (e) | | | | | | | | | |
Expiration: September 2020, Exercise Price: $3,160 | | | 10 | | | $ | 3,160,000 | | | $ | 9,700 | |
Expiration: September 2020, Exercise Price: $3,175 | | | 10 | | | | 3,175,000 | | | | 10,300 | |
| | | | | | | | | | | | 20,000 | |
CBOE VIX Index (e) | | | | | | | | | | | | |
Expiration: October 2020, Exercise Price: $26 | | | 236 | | | | 613,600 | | | | 28,320 | |
Expiration: October 2020, Exercise Price: $27 | | | 236 | | | | 637,200 | | | | 37,760 | |
| | | | | | | | | | | | 66,080 | |
| Total Purchased Put Options | | | | | | | | | | | | |
| (Cost $193,383) | | | | | | | | | | | 86,080 | |
| | | | | | | | | | | | | |
| | | | | | | Shares | | | | | |
| SHORT-TERM INVESTMENT – 20.3% | | | | | | | | | | | | |
First American Government Obligations Fund, Class X, 0.07% (f) | | | | | | | | | | | | |
| (Cost $13,469,114) | | |
| | | | 13,469,114 | | | | 13,469,114 | |
| Total Investments – 98.1% | | | | | | | | | | | | |
| (Cost $51,962,664) | | | | | | | | | | | 65,155,705 | |
| Other Assets and Liabilities, Net – 1.9% | | | | | | | | | | | 1,283,281 | |
| Total Net Assets – 100.0% | | | | | | | | | | $ | 66,438,986 | |
| (a) | All or a portion of this security is designated as collateral for futures contracts. As of August 31, 2020, the fair value of collateral was $26,307,750. |
| (b) | Fair value of this security exceeds 25% of the Fund’s net assets. Additional information for this security, including the financial statements, is available from the SEC’s EDGAR database at www.sec.gov. |
| (c) | Security purchased within the terms of a private placement memorandum, exempt from registration under Rule 144A of the Securities Act of 1933, as amended, and may be sold only to dealers in that program or other “qualified institutional buyers.” As of August 31, 2020, the fair value of these investments were $1,801,809, or 2.7% of total net assets. |
| (d) | Foreign Security. The Fund had $2,548,372 or 3.8% of net assets in foreign securities at August 31, 2020. |
| (e) | Held in connection with written option contracts. See Schedule of Written Options for further information. |
| (f) | The rate shown is the annualized seven-day effective yield as of August 31, 2020. |
See Notes to the Financial Statements
SECURIAN AM DYNAMIC MANAGED VOLATILITY FUND
Schedule of Open Futures Contracts
August 31, 2020
| Futures Contracts Purchased | | | | | |
| | Number of | | | | |
| | Contracts | Expiration | Notional | Fair | Unrealized |
Description | Purchased | Date | Amount | Value | Appreciation |
E-mini S&P 500 Index | 127 | September 2020 | $22,218,015 | $(34,925) | $1,323,663 |
| | | | | | |
| Futures Contracts Sold | | | | | |
| | Number of | | | | |
| | Contracts | Expiration | Notional | Fair | Unrealized |
Description | Sold | Date | Amount | Value | Depreciation |
Ultra U.S. Treasury Bond Futures | 3 | December 2020 | $ 478,310 | $(1,461) | $(1,461) |
U.S. Treasury 5 Year Note Futures | 25 | December 2020 | 3,150,780 | (1,427) | (1,427) |
| | | | | | $(2,888) |
Schedule of Written Options
August 31, 2020
| | | Contracts | Expiration | Notional | Exercise | Fair |
Description | Call/Put | Written | Date | Amount | Price | Value |
CBOE S&P 500 Index* | | | | | | |
(Premiums received $8,984) | Put | 10 | September 2020 | $2,820,000 | $2,820 | $2,950 |
CBOE S&P 500 Index* | | | | | | |
(Premiums received $8,127) | Put | 10 | September 2020 | 2,830,000 | 2,830 | 3,050 |
CBOE VIX Index* | | | | | | |
(Premiums received $28) | Put | 14 | October 2020 | 21,000 | 15 | 35 |
| | | | | | | $6,035 |
* | Held in connection with purchased option contracts. See Schedule of Investments for further information. |
See Notes to the Financial Statements
SECURIAN AM MANAGED VOLATILITY EQUITY FUND
Schedule of Investments
August 31, 2020
| | | | | | Fair | |
| | | Shares | | | Value | |
| EXCHANGE TRADED FUNDS – 94.3% | | | | | | |
iShares Core High Dividend Fund (a) | | | 69,707 | | | $ | 5,906,274 | |
iShares MSCI EAFE Minimum Volatility Fund (b) | | | 121,046 | | | | 8,336,438 | |
iShares MSCI Emerging Markets Minimum Volatility Fund | | | 38,086 | | | | 2,120,628 | |
iShares MSCI Germany Fund | | | 48,596 | | | | 1,462,740 | |
iShares MSCI USA Minimum Volatility Fund (a)(b) | | | 156,014 | | | | 10,161,192 | |
iShares Short Maturity Bond Fund | | | 26,125 | | | | 1,310,169 | |
| Total Exchange Traded Funds | | | | | | | | |
| (Cost $22,558,284) | | | | | | | 29,297,441 | |
| | | Contracts |
|
| Notional | | | | |
| PURCHASED PUT OPTIONS – 0.2% | | | | | | | | | |
CBOE S&P 500 Index (c) | | | | | | | | | |
Expiration: September 2020, Exercise Price: $3,160 | | | 7 | | | $ | 2,212,000 | | | | 6,790 | |
Expiration: September 2020, Exercise Price: $3,175 | | | 7 | | | | 2,222,500 | | | | 7,210 | |
| | | | | | | | | | | | 14,000 | |
CBOE VIX Index (c) | | | | | | | | | | | | |
Expiration: October 2020, Exercise Price: $26 | | | 117 | | | | 304,200 | | | | 14,040 | |
Expiration: October 2020, Exercise Price: $27 | | | 117 | | | | 315,900 | | | | 18,720 | |
| | | | | | | | | | | | 32,760 | |
| Total Purchased Put Options | | | | | | | | | | | | |
| (Cost $109,318) | | | | | | | | | | | 46,760 | |
| | | Shares | | | | |
| SHORT-TERM INVESTMENT – 1.0% | | | | | | |
First American Government Obligations Fund, Class X, 0.07% (d) | | | | | | |
| (Cost $309,948) | | | 309,948 | | | | 309,948 | |
| Total Investments – 95.5% | | | | | | | | |
| (Cost $22,977,550) | | | | | | | 29,654,149 | |
| Other Assets and Liabilities, Net – 4.5% | | | | | | | 1,413,521 | |
| Total Net Assets – 100.0% | | | | | | $ | 31,067,670 | |
| (a) | All or a portion of this security is designated as collateral for futures contracts. As of August 31, 2020, the fair value of the collateral was $10,725,894. |
| (b) | Fair value of this security exceeds 25% of the Fund’s net assets. Additional information for this security, including the financial statements, is available from the SEC’s EDGAR database at www.sec.gov. |
| (c) | Held in connection with written option contracts. See Schedule of Written Options for further information. |
| (d) | The rate shown is the annualized seven-day effective yield as of August 31, 2020. |
| | |
See Notes to the Financial Statements
SECURIAN AM MANAGED VOLATILITY EQUITY FUND
Schedule of Open Futures Contracts
August 31, 2020
Futures Contracts Purchased
| | Number of | | | | |
| | Contracts | Expiration | Notional | Fair | Unrealized |
Description | Purchased | Date | Amount | Value | Appreciation |
E-mini S&P 500 Index | 12 | September 2020 | $2,099,340 | $(3,300) | $99,457 |
Schedule of Written Options
August 31, 2020
| | | Contracts | Expiration | Notional | Exercise | Fair |
Description | Call/Put | Written | Date | Amount | Price | Value |
CBOE S&P 500 Index* | | | | | | |
(Premiums received $6,289) | Put | 7 | September 2020 | $1,974,000 | $2,820 | $2,065 |
CBOE S&P 500 Index* | | | | | | |
(Premiums received $5,689) | Put | 7 | September 2020 | 1,981,000 | 2,830 | 2,135 |
CBOE VIX Index* | | | | | | |
(Premiums received $12) | Put | 6 | October 2020 | 9,000 | 15 | 15 |
| | | | | | | $4,215 |
* | Held in connection with purchased option contracts. See Schedule of Investments for further information. |
See Notes to the Financial Statements
SECURIAN AM REAL ASSET INCOME FUND
Schedule of Investments
August 31, 2020
| | | | | | Fair | |
| | | Shares | | | Value | |
| REIT COMMON STOCKS – 49.3% | | | | | | |
| | | | | | | |
| Health Care – 7.1% | | | | | | |
CareTrust REIT | | | 31,612 | | | $ | 612,324 | |
Healthcare Trust of America, Class A | | | 16,114 | | | | 425,249 | |
Healthpeak Properties | | | 37,113 | | | | 1,025,803 | |
National Health Investors | | | 6,281 | | | | 390,992 | |
OMEGA Healthcare Investors | | | 17,578 | | | | 544,391 | |
Physicians Realty Trust | | | 26,100 | | | | 473,715 | |
Ventas | | | 5,600 | | | | 230,776 | |
Welltower | | | 19,064 | | | | 1,096,561 | |
| | | | | | | | 4,799,811 | |
| | | | | | | | | |
| Hotels – 0.7% | | | | | | | | |
DiamondRock Hospitality | | | 13,100 | | | | 69,430 | |
Host Hotels & Resorts | | | 15,600 | | | | 175,188 | |
RLJ Lodging Trust | | | 12,500 | | | | 118,000 | |
Summit Hotel Properties | | | 15,600 | | | | 91,884 | |
| | | | | | | | 454,502 | |
| | | | | | | | | |
| Industrial – 5.4% | | | | | | | | |
Americold Realty Trust | | | 3,300 | | | | 126,555 | |
Industrial Logistics Properties Trust | | | 7,248 | | | | 156,340 | |
Prologis | | | 19,601 | | | | 1,996,558 | |
STAG Industrial | | | 43,084 | | | | 1,391,613 | |
| | | | | | | | 3,671,066 | |
| | | | | | | | | |
| Mortgage – 0.7% | | | | | | | | |
Blackstone Mortgage Trust, Class A | | | 16,247 | | | | 386,191 | |
Starwood Property Trust | | | 5,125 | | | | 79,950 | |
| | | | | | | | 466,141 | |
| | | | | | | | | |
| Multi-Family – 8.2% | | | | | | | | |
American Campus Communities | | | 6,600 | | | | 223,740 | |
Apartment Investment & Management Company, Class A | | | 503 | | | | 18,123 | |
AvalonBay Communities | | | 2,100 | | | | 331,926 | |
Camden Property Trust | | | 11,778 | | | | 1,071,091 | |
Douglas Emmett | | | 10,100 | | | | 281,992 | |
Essex Property Trust | | | 900 | | | | 194,859 | |
Independence Realty Trust | | | 27,600 | | | | 323,196 | |
Invitation Homes | | | 20,000 | | | | 572,600 | |
Mid-America Apartment Communities | | | 8,900 | | | | 1,042,368 | |
See Notes to the Financial Statements
SECURIAN AM REAL ASSET INCOME FUND
Schedule of Investments – Continued
August 31, 2020
| | | | | | Fair | |
| | | Shares | | | Value | |
| REIT COMMON STOCKS – 49.3% (Continued) | | | | | | |
| | | | | | | |
| Multi-Family – 8.2% (Continued) | | | | | | |
Sun Communities | | | 3,800 | | | $ | 566,504 | |
UDR | | | 27,000 | | | | 939,870 | |
| | | | | | | | 5,566,269 | |
| | | | | | | | | |
| Net Lease – 4.7% | | | | | | | | |
Agree Realty | | | 9,812 | | | | 656,619 | |
Easterly Government Properties | | | 14,800 | | | | 358,012 | |
Essential Properties Realty Trust | | | 19,400 | | | | 329,218 | |
Gaming and Leisure Properties | | | 2,074 | | | | 75,390 | |
National Retail Properties | | | 21,100 | | | | 747,784 | |
STORE Capital | | | 17,898 | | | | 483,962 | |
VICI Properties | | | 25,700 | | | | 574,138 | |
| | | | | | | | 3,225,123 | |
| | | | | | | | | |
| Office – 4.5% | | | | | | | | |
Alexandria Real Estate Equities | | | 2,500 | | | | 420,950 | |
Boston Properties | | | 6,600 | | | | 573,342 | |
Corporate Office Properties Trust | | | 22,810 | | | | 562,038 | |
Cousins Properties | | | 11,700 | | | | 349,245 | |
Highwoods Properties | | | 20,300 | | | | 756,378 | |
Hudson Pacific Properties | | | 17,200 | | | | 403,856 | |
| | | | | | | | 3,065,809 | |
| | | | | | | | | |
| Retail – 2.7% | | | | | | | | |
Brixmor Property Group | | | 16,000 | | | | 188,800 | |
Regency Centers | | | 18,400 | | | | 730,664 | |
Retail Opportunity Investments | | | 15,936 | | | | 177,368 | |
Simon Property Group | | | 6,000 | | | | 407,100 | |
Weingarten Realty Investors | | | 18,000 | | | | 314,460 | |
| | | | | | | | 1,818,392 | |
| | | | | | | | | |
| Specialty – 15.3% | | | | | | | | |
CatchMark Timber Trust, Class A | | | 31,190 | | | | 309,717 | |
CoreSite Realty | | | 2,000 | | | | 244,900 | |
Crown Castle International | | | 9,800 | | | | 1,599,850 | |
CyrusOne | | | 9,049 | | | | 755,863 | |
Digital Realty Trust | | | 12,712 | | | | 1,978,623 | |
Equinix | | | 2,075 | | | | 1,638,793 | |
Extra Space Storage | | | 5,043 | | | | 537,332 | |
Hannon Armstrong Sustainable Infrastructure Capital | | | 9,700 | | | | 411,862 | |
See Notes to the Financial Statements
SECURIAN AM REAL ASSET INCOME FUND
Schedule of Investments – Continued
August 31, 2020
| | | | | | Fair | |
| | | Shares | | | Value | |
| REIT COMMON STOCKS – 49.3% (Continued) | | | | | | |
| | | | | | | |
| Specialty – 15.3% (Continued) | | | | | | |
Jernigan Capital | | | 15,200 | | | $ | 262,048 | |
Life Storage | | | 5,600 | | | | 590,408 | |
Public Storage | | | 5,500 | | | | 1,168,200 | |
QTS Realty Trust, Class A | | | 7,300 | | | | 495,086 | |
Weyerhaeuser Company | | | 14,200 | | | | 430,402 | |
| | | | | | | | 10,423,084 | |
| Total REIT Common Stocks | | | | | | | | |
| (Cost $29,133,236) | | | | | | | 33,490,197 | |
| | | | | | | | | |
| OTHER COMMON STOCKS – 18.0% | | | | | | | | |
| | | | | | | | | |
| Energy – 3.5% | | | | | | | | |
Enbridge (a) | | | 12,700 | | | | 406,654 | |
Equitrans Midstream | | | 34,744 | | | | 357,168 | |
Kinder Morgan | | | 39,473 | | | | 545,517 | |
NRG Energy | | | 11,800 | | | | 406,038 | |
ONEOK | | | 5,000 | | | | 137,400 | |
Williams Companies | | | 25,000 | | | | 519,000 | |
| | | | | | | | 2,371,777 | |
| | | | | | | | | |
| Infrastructure – 1.2% | | | | | | | | |
Brookfield Infrastructure (a) | | | 4,602 | | | | 229,732 | |
Brookfield Infrastructure Partners (a) | | | 14,100 | | | | 614,055 | |
| | | | | | | | 843,787 | |
| | | | | | | | | |
| Telecommunications – 1.2% | | | | | | | | |
AT&T | | | 3,500 | | | | 104,335 | |
Verizon Communications | | | 11,500 | | | | 681,605 | |
| | | | | | | | 785,940 | |
| | | | | | | | | |
| Utilities – 12.1% | | | | | | | | |
AES | | | 37,600 | | | | 667,400 | |
Alliant Energy | | | 3,500 | | | | 189,525 | |
American Electric Power | | | 9,410 | | | | 741,790 | |
Brookfield Renewable (a) | | | 1,675 | | | | 85,291 | |
Brookfield Renewable Partners (a) | | | 5,300 | | | | 240,832 | |
CenterPoint Energy | | | 11,800 | | | | 236,826 | |
Clearway Energy, Class A | | | 9,300 | | | | 224,595 | |
CMS Energy | | | 5,500 | | | | 332,695 | |
Dominion Energy | | | 7,070 | | | | 554,571 | |
See Notes to the Financial Statements
SECURIAN AM REAL ASSET INCOME FUND
Schedule of Investments – Continued
August 31, 2020
| | | | | | Fair | |
| | | Shares | | | Value | |
| OTHER COMMON STOCKS – 18.0% (Continued) | | | | | | |
| | | | | | | |
| Utilities – 12.1% (Continued) | | | | | | |
DTE Energy | | | 4,047 | | | $ | 480,258 | |
Duke Energy | | | 5,500 | | | | 441,870 | |
Entergy | | | 8,000 | | | | 793,120 | |
Evergy | | | 6,536 | | | | 347,846 | |
Exelon | | | 19,300 | | | | 712,363 | |
FirstEnergy | | | 5,900 | | | | 168,681 | |
NextEra Energy Partners | | | 7,100 | | | | 428,272 | |
NiSource | | | 15,800 | | | | 350,128 | |
Pinnacle West Capital | | | 600 | | | | 44,010 | |
PPL | | | 5,200 | | | | 143,676 | |
Sempra Energy | | | 4,700 | | | | 581,155 | |
South Jersey Industries | | | 19,041 | | | | 421,758 | |
| | | | | | | | 8,186,662 | |
| Total Other Common Stocks | | | | | | | | |
| (Cost $10,553,795) | | | | | | | 12,188,166 | |
| | | Par | | | | |
| U.S. GOVERNMENT SECURITIES – 12.4% | | | | | | |
| | | | | | | |
| U.S. Treasury Bonds – 12.4% | | | | | | |
1.125%, 01/15/2021 (b) | | $ | 589,245 | | | | 595,252 | |
0.625%, 07/15/2021 (b) | | | 571,905 | | | | 583,383 | |
0.125%, 07/15/2022 (b) | | | 560,520 | | | | 578,638 | |
0.125%, 01/15/2023 (b) | | | 446,744 | | | | 463,398 | |
0.375%, 07/15/2023 (b) | | | 553,885 | | | | 585,783 | |
0.125%, 07/15/2024 (b) | | | 1,167,138 | | | | 1,245,675 | |
2.375%, 01/15/2025 (b) | | | 1,367,650 | | | | 1,605,744 | |
0.375%, 07/15/2025 (b) | | | 434,836 | | | | 476,717 | |
0.625%, 01/15/2026 (b) | | | 596,723 | | | | 664,336 | |
3.875%, 04/15/2029 (b) | | | 784,085 | | | | 1,141,309 | |
2.125%, 02/15/2040 (b) | | | 298,183 | | | | 456,062 | |
| Total U.S. Government Securities | | | | | | | | |
| (Cost $7,821,689) | | | | | | | 8,396,297 | |
See Notes to the Financial Statements
SECURIAN AM REAL ASSET INCOME FUND
Schedule of Investments – Continued
August 31, 2020
| | | | | | Fair | |
| | | Shares | | | Value | |
| REIT PREFERRED STOCKS – 8.8% | | | | | | |
| | | | | | | |
| Hotels – 2.2% | | | | | | |
Pebblebrook Hotel Trust, Series D, 6.375% | | | 13,403 | | | $ | 288,165 | |
Pebblebrook Hotel Trust, Series E, 6.375% | | | 18,602 | | | | 404,407 | |
Summit Hotel Properties, Series D, 6.450% | | | 13,727 | | | | 294,658 | |
Summit Hotel Properties, Series E, 6.250% | | | 10,800 | | | | 231,984 | |
Sunstone Hotel Investors, Series E, 6.950% | | | 10,107 | | | | 247,622 | |
| | | | | | | | 1,466,836 | |
| | | | | | | | | |
| Industrial – 0.5% | | | | | | | | |
Rexford Industrial Realty, Series C, 5.625% | | | 11,200 | | | | 301,504 | |
STAG Industrial, Series C, 6.875% | | | 2,663 | | | | 69,504 | |
| | | | | | | | 371,008 | |
| | | | | | | | | |
| Net Lease – 0.4% | | | | | | | | |
EPR Properties, Series G, 5.750% | | | 13,580 | | | | 251,638 | |
| | | | | | | | | |
| Office – 1.6% | | | | | | | | |
Armada Hoffler Properties, Series A, 6.750% | | | 11,300 | | | | 273,686 | |
PS Business Parks, Series W, 5.200% | | | 17,100 | | | | 443,745 | |
PS Business Parks, Series Z, 4.875% | | | 12,700 | | | | 339,852 | |
| | | | | | | | 1,057,283 | |
| | | | | | | | | |
| Other – 0.5% | | | | | | | | |
Colony Capital, Class H, 7.125% | | | 2,998 | | | | 64,457 | |
Digital Realty Trust, Series L, 5.200% | | | 11,000 | | | | 302,500 | |
| | | | | | | | 366,957 | |
| | | | | | | | | |
| Retail – 1.5% | | | | | | | | |
Investors Real Estate Trust, Series C, 6.625% | | | 11,532 | | | | 296,372 | |
Saul Centers, Series D, 6.125% | | | 12,800 | | | | 313,600 | |
Saul Centers, Series E, 6.000% | | | 16,300 | | | | 379,464 | |
| | | | | | | | 989,436 | |
| | | | | | | | | |
| Single-Family – 0.8% | | | | | | | | |
American Homes 4 Rent, Series F, 5.875% | | | 21,698 | | | | 580,422 | |
| | | | | | | | | |
| Specialty – 1.3% | | | | | | | | |
Public Storage, Series H, 5.600% | | | 10,703 | | | | 303,965 | |
Public Storage. Series I, 4.875% | | | 22,000 | | | | 600,820 | |
| | | | | | | | 904,785 | |
| Total REIT Preferred Stocks | | | | | | | | |
| (Cost $6,025,189) | | | | | | | 5,988,365 | |
See Notes to the Financial Statements
SECURIAN AM REAL ASSET INCOME FUND
Schedule of Investments – Continued
August 31, 2020
| | | | | | Fair | |
| | | Shares | | | Value | |
| MASTER LIMITED PARTNERSHIPS – 7.3% | | | | | | |
| | | | | | | |
| Energy – 7.3% | | | | | | |
Cheniere Energy Partners | | | 7,700 | | | $ | 278,663 | |
Energy Transfer | | | 108,452 | | | | 696,262 | |
Enterprise Products Partners | | | 60,384 | | | | 1,060,343 | |
Magellan Midstream Partners | | | 27,101 | | | | 1,030,109 | |
MPLX | | | 42,072 | | | | 768,655 | |
PBF Logistics | | | 8,900 | | | | 85,885 | |
Plains All American Pipeline | | | 95,700 | | | | 677,556 | |
USA Compression Partners | | | 22,200 | | | | 245,088 | |
Viper Energy Partners | | | 14,000 | | | | 142,520 | |
| Total Master Limited Partnerships | | | | | | | | |
| (Cost $6,110,065) | | | | | | | 4,985,081 | |
| | | | | | | | | |
| OTHER PREFERRED STOCKS – 1.7% | | | | | | | | |
| | | | | | | | | |
| Energy – 0.9% | | | | | | | | |
Energy Transfer Partners, Series D, 7.625% | | | 13,300 | | | | 268,926 | |
Sempra Energy, 5.750% | | | 12,200 | | | | 331,230 | |
| | | | | | | | 600,156 | |
| | | | | | | | | |
| Utilities – 0.8% | | | | | | | | |
CMS Energy, 5.875% | | | 11,100 | | | | 304,473 | |
Duke Energy, 5.625% | | | 9,400 | | | | 264,892 | |
| | | | | | | | 569,365 | |
| Total Other Preferred Stocks | | | | | | | | |
| (Cost $1,120,233) | | | | | | | 1,169,521 | |
| | | | | | | | | |
| CLOSED-END FUND – 0.6% | | | | | | | | |
BlackRock Floating Rate Income Strategies Fund | | | | | | | | |
| (Cost $479,965) | | | 36,822 | | | | 431,554 | |
| | | | | | | | | |
| | | Par | | | | | |
| CORPORATE BOND – 0.3% | | | | | | | | |
| | | | | | | | | |
| Utilities – 0.3% | | | | | | | | |
CenterPoint Energy | | | | | | | | |
6.125%, 03/01/2024 | | | | | | | | |
| (Cost $200,000) | | $ | 200,000 | | | | 203,610 | |
See Notes to the Financial Statements
SECURIAN AM REAL ASSET INCOME FUND
Schedule of Investments – Continued
August 31, 2020
| | | | | | Fair | |
| | | Shares | | | Value | |
| EXCHANGE TRADED FUND – 0.1% | | | | | | |
Invesco DB Commodity Index Tracking Fund | | | | | | |
| (Cost $67,985) | | | 5,400 | | | $ | 73,116 | |
| | | | | | | | | |
| SHORT-TERM INVESTMENT – 1.9% | | | | | | | | |
First American Government Obligations Fund, Class X, 0.07% (c) | | | | | | | | |
| (Cost $1,275,590) | | | 1,275,590 | | | | 1,275,590 | |
| Total Investments – 100.4% | | | | | | | | |
| (Cost $62,787,747) | | | | | | | 68,201,497 | |
| Other Assets and Liabilities, Net – (0.4)% | | | | | | | (251,004 | ) |
| Total Net Assets – 100.0% | | | | | | $ | 67,950,493 | |
| (a) | Foreign Security. The Fund had $1,576,564 or 2.3% of net assets in foreign securities at August 31, 2020. |
| (b) | U.S. Treasury inflation-protected security (TIPS). TIPS are securities in which the principal amount is adjusted for inflation and the semiannual interest payments equal a fixed percentage of the inflation-adjusted principal amount. |
| (c) | The rate shown is the annualized seven-day effective yield as of August 31, 2020. |
REIT – Real Estate Investment Trust
See Notes to the Financial Statements
SECURIAN AM FUNDS
Statements of Assets and Liabilities
August 31, 2020
| | | Dynamic | | | Managed | | | | |
| | | Managed | | | Volatility | | | Real Asset | |
| | | Volatility Fund | | | Equity Fund | | | Income Fund | |
| ASSETS: | | | | | | | | | |
Investments, at fair value: | | | | | | | | | |
(cost $51,962,664, $22,977,550, and $62,787,747, respectively) | | $ | 65,155,705 | | | $ | 29,654,149 | | | $ | 68,201,497 | |
Cash held as collateral for written options contracts | | | 1,225,000 | | | | 955,027 | | | | — | |
Receivable for investment securities sold | | | — | | | | — | | | | 50,503 | |
Receivable for capital shares sold | | | 4,233 | | | | 7,158 | | | | 394 | |
Dividends & interest receivable | | | 147,241 | | | | 30 | | | | 95,719 | |
Return of capital receivable | | | — | | | | — | | | | 9,139 | |
Adviser reimbursements receivable | | | — | | | | 2,823 | | | | — | |
Cash held as collateral for futures contracts | | | — | | | | 650,000 | | | | — | |
Prepaid expenses | | | 16,206 | | | | 16,339 | | | | 15,942 | |
Total assets | | | 66,548,385 | | | | 31,285,526 | | | | 68,373,194 | |
| | | | | | | | | | | | | |
| LIABILITIES: | | | | | | | | | | | | |
Written option contracts, at value (premiums received | | | | | | | | | | | | |
$17,139, $11,990, and $0 respectively) | | | 6,035 | | | | 4,215 | | | | — | |
Payable for capital shares redeemed | | | 17 | | | | 162,827 | | | | — | |
Payable for investment securities purchased | | | — | | | | — | | | | 342,497 | |
Payable to adviser, net | | | 14,150 | | | | — | | | | 27,190 | |
Payable for fund administration & accounting fees | | | 14,498 | | | | 13,505 | | | | 15,498 | |
Payable for compliance fees | | | 1,941 | | | | 1,941 | | | | 1,944 | |
Payable for custody fees | | | 1,601 | | | | 1,697 | | | | 3,850 | |
Payable for transfer agent fees and expenses | | | 5,219 | | | | 5,750 | | | | 4,697 | |
Payable for audit & tax fees | | | 20,498 | | | | 17,001 | | | | 19,503 | |
Variation margin payable | | | 37,882 | | | | 3,300 | | | | — | |
Other accrued expenses | | | 7,558 | | | | 7,620 | | | | 7,522 | |
Total liabilities | | | 109,399 | | | | 217,856 | | | | 422,701 | |
| NET ASSETS | | $ | 66,438,986 | | | $ | 31,067,670 | | | $ | 67,950,493 | |
| | | | | | | | | | | | | |
| NET ASSETS CONSIST OF: | | | | | | | | | | | | |
Paid-in capital | | $ | 50,934,522 | | | $ | 26,037,576 | | | $ | 72,144,071 | |
Distributable earnings (Accumulated losses) | | | 15,504,464 | | | | 5,030,094 | | | | (4,193,578 | ) |
Net Assets | | $ | 66,438,986 | | | $ | 31,067,670 | | | $ | 67,950,493 | |
| | | | | | | | | | | | | |
Shares issued and outstanding(1) | | | 4,694,443 | | | | 2,680,846 | | | | 7,157,594 | |
Net asset value, offering price, and redemption price per share | | $ | 14.15 | | | $ | 11.59 | | | $ | 9.49 | |
| (1) | Unlimited shares authorized without par value. |
See Notes to the Financial Statements
SECURIAN AM FUNDS
Statements of Operations
For the Year Ended August 31, 2020
| | | Dynamic | | | Managed | | | | |
| | | Managed | | | Volatility | | | Real Asset | |
| | | Volatility Fund | | | Equity Fund | | | Income Fund | |
| INVESTMENT INCOME: | | | | | | | | | |
Dividend income (net of foreign taxes withheld of $0, | | | | | | | | | |
$0 and $2,207, respectively) | | $ | 663,372 | | | $ | 1,024,446 | | | $ | 1,853,372 | |
Distributions received from master limited partnerships | | | — | | | | — | | | | 659,745 | |
Less: return of capital distributions | | | — | | | | — | | | | (659,745 | ) |
Net distributions from master limited partnerships | | | — | | | | — | | | | — | |
Interest income | | | 837,270 | | | | 30,495 | | | | 86,472 | |
Total investment income | | | 1,500,642 | | | | 1,054,941 | | | | 1,939,844 | |
| | | | | | | | | | | | | |
| EXPENSES: | | | | | | | | | | | | |
Advisory fees (See note 5) | | | 356,964 | | | | 218,623 | | | | 552,814 | |
Fund administration & accounting fees (See note 5) | | | 80,275 | | | | 73,152 | | | | 87,286 | |
Transfer agent fees & expenses (See note 5) | | | 28,626 | | | | 33,146 | | | | 27,183 | |
Audit fees | | | 22,002 | | | | 17,004 | | | | 21,003 | |
Trustee fees (See note 5) | | | 13,851 | | | | 13,821 | | | | 12,897 | |
Legal fees | | | 12,471 | | | | 12,477 | | | | 12,676 | |
Compliance fees (See note 5) | | | 11,392 | | | | 11,383 | | | | 11,389 | |
Custody fees (See note 5) | | | 7,774 | | | | 7,919 | | | | 20,382 | |
Other fees | | | 4,278 | | | | 3,841 | | | | 7,119 | |
Insurance Expense | | | 1,592 | | | | 1,495 | | | | 1,682 | |
Postage & printing fees | | | 5,277 | | | | 6,502 | | | | 5,499 | |
Federal & state registration fees | | | 5,067 | | | | 24,894 | | | | 21,801 | |
Total expenses before waiver | | | 549,569 | | | | 424,257 | | | | 781,731 | |
Less: waiver by adviser | | | (212,359 | ) | | | (218,645 | ) | | | (228,917 | ) |
Net expenses | | | 337,210 | | | | 205,612 | | | | 552,814 | |
| NET INVESTMENT INCOME | | | 1,163,432 | | | | 849,329 | | | | 1,387,030 | |
| | | | | | | | | | | | | |
| REALIZED AND UNREALIZED | | | | | | | | | | | | |
| GAIN (LOSS) ON INVESTMENTS: | | | | | | | | | | | | |
Net realized gain (loss) on investments | | | 41,472 | | | | 785,503 | | | | (7,710,736 | ) |
Net realized loss on futures contracts | | | (175,046 | ) | | | (2,294,521 | ) | | | — | |
Net realized gain on purchased option contracts | | | 2,338,901 | | | | 1,282,770 | | | | — | |
Net realized loss on written option contracts | | | (1,299,688 | ) | | | (762,883 | ) | | | — | |
Net change in unrealized appreciation/depreciation on investments | | | 5,188,491 | | | | (1,063,741 | ) | | | (5,059,119 | ) |
Net change in unrealized appreciation/depreciation on futures contracts | | | 1,335,400 | | | | 49,191 | | | | — | |
Net change in unrealized appreciation/depreciation | | | | | | | | | | | | |
on written option contracts | | | 7,010 | | | | (1,156 | ) | | | — | |
Net realized and unrealized gain (loss) on investments | | | 7,436,540 | | | | (2,004,837 | ) | | | (12,769,855 | ) |
| NET INCREASE (DECREASE) IN NET ASSETS | | | | | | | | | | | | |
| RESULTING FROM OPERATIONS | | $ | 8,599,972 | | | $ | (1,155,508 | ) | | $ | (11,382,825 | ) |
See Notes to the Financial Statements
SECURIAN AM DYNAMIC MANAGED VOLATILITY FUND
Statements of Changes in Net Assets
| | | Year Ended | | | Year Ended | |
| | | August 31, 2020 | | | August 31, 2019 | |
| OPERATIONS: | | | | | | |
Net investment income | | $ | 1,163,432 | | | $ | 1,133,729 | |
Net realized gain (loss) on investments | | | 41,472 | | | | (2,479 | ) |
Net realized gain (loss) on futures contracts | | | (175,046 | ) | | | 376,639 | |
Net realized gain on purchased option contracts | | | 2,338,901 | | | | 526,743 | |
Net realized gain (loss) on written option contracts | | | (1,299,688 | ) | | | 99,658 | |
Net change in unrealized appreciation/depreciation on investments | | | 5,188,491 | | | | 1,949,724 | |
Net change in unrealized appreciation/depreciation on futures contracts | | | 1,335,400 | | | | (793,748 | ) |
Net change in unrealized appreciation/depreciation on written options | | | 7,010 | | | | 3,119 | |
Net increase in net assets resulting from operations | | | 8,599,972 | | | | 3,293,385 | |
| | | | | | | | | |
| CAPITAL SHARE TRANSACTIONS: | | | | | | | | |
Proceeds from shares sold | | | 3,121,052 | | | | 15,094,126 | |
Proceeds from reinvestment of distributions | | | 1,779,980 | | | | 2,315,282 | |
Payments for shares redeemed | | | (4,919,785 | ) | | | (409,063 | ) |
Net increase (decrease) in net assets resulting from capital share transactions | | | (18,753 | ) | | | 17,000,345 | |
| | | | | | | | | |
| DISTRIBUTIONS TO SHAREHOLDERS | | | (1,807,176 | ) | | | (2,352,620 | ) |
| | | | | | | | | |
| TOTAL INCREASE IN NET ASSETS | | | 6,774,043 | | | | 17,941,110 | |
| | | | | | | | | |
| NET ASSETS: | | | | | | | | |
Beginning of year | | | 59,664,943 | | | | 41,723,833 | |
End of year | | $ | 66,438,986 | | | $ | 59,664,943 | |
See Notes to the Financial Statements
SECURIAN AM MANAGED VOLATILITY EQUITY FUND
Statements of Changes in Net Assets
| | | Year Ended | | | Year Ended | |
| | | August 31, 2020 | | | August 31, 2019 | |
| OPERATIONS: | | | | | | |
Net investment income | | $ | 849,329 | | | $ | 777,181 | |
Net realized gain on investments | | | 785,503 | | | | 315,231 | |
Net realized loss on futures contracts | | | (2,294,521 | ) | | | (1,428,490 | ) |
Net realized gain on purchased option contracts | | | 1,282,770 | | | | 838,309 | |
Net realized loss on written option contracts | | | (762,883 | ) | | | (368,343 | ) |
Net change in unrealized appreciation/depreciation of investments | | | (1,063,741 | ) | | | 1,267,634 | |
Net change in unrealized appreciation/depreciation on futures contracts | | | 49,191 | | | | (96,238 | ) |
Net changed in unrealized appreciation/depreciation on written options | | | (1,156 | ) | | | 8,021 | |
Net increase (decrease) in net assets resulting from operations | | | (1,155,508 | ) | | | 1,313,305 | |
| | | | | | | | | |
| CAPITAL SHARE TRANSACTIONS: | | | | | | | | |
Proceeds from shares sold | | | 6,918,555 | | | | 6,841,551 | |
Proceeds from reinvestment of distributions | | | 950,678 | | | | 1,203,400 | |
Payments for shares redeemed | | | (14,346,905 | ) | | | (6,193,632 | ) |
Net increase (decrease) in net assets resulting from capital share transactions | | | (6,477,672 | ) | | | 1,851,319 | |
| | | | | | | | | |
| DISTRIBUTIONS TO SHAREHOLDERS | | | (1,125,018 | ) | | | (1,319,565 | ) |
| | | | | | | | | |
| TOTAL INCREASE (DECREASE) IN NET ASSETS | | | (8,758,198 | ) | | | 1,845,059 | |
| | | | | | | | | |
| NET ASSETS: | | | | | | | | |
Beginning of year | | | 39,825,868 | | | | 37,980,809 | |
End of year | | $ | 31,067,670 | | | $ | 39,825,868 | |
See Notes to the Financial Statements
SECURIAN AM REAL ASSET INCOME FUND
Statements of Changes in Net Assets
| | | Year Ended | | | Year Ended | |
| | | August 31, 2020 | | | August 31, 2019 | |
| OPERATIONS: | | | | | | |
Net investment income | | $ | 1,387,030 | | | $ | 1,769,080 | |
Net realized gain (loss) on investments | | | (7,710,736 | ) | | | 2,084,572 | |
Net change in unrealized appreciation/depreciation on investments | | | (5,059,119 | ) | | | 1,047,165 | |
Net increase (decrease) in net assets resulting from operations | | | (11,382,825 | ) | | | 4,900,817 | |
| | | | | | | | | |
| CAPITAL SHARE TRANSACTIONS: | | | | | | | | |
Proceeds from shares sold | | | 918,760 | | | | 616,808 | |
Proceeds from reinvestment of distributions | | | 1,802,221 | | | | 1,744,428 | |
Payments for shares redeemed | | | (3,733,864 | ) | | | (1,724,551 | ) |
Net increase (decrease) in net assets resulting from capital share transactions | | | (1,012,883 | ) | | | 636,685 | |
| | | | | | | | | |
| DISTRIBUTIONS TO SHAREHOLDERS | | | (3,350,712 | ) | | | (3,228,444 | ) |
| | | | | | | | | |
| TOTAL INCREASE (DECREASE) IN NET ASSETS | | | (15,746,420 | ) | | | 2,309,058 | |
| | | | | | | | | |
| NET ASSETS: | | | | | | | | |
Beginning of year | | | 83,696,913 | | | | 81,387,855 | |
End of year | | $ | 67,950,493 | | | $ | 83,696,913 | |
See Notes to the Financial Statements
SECURIAN AM DYNAMIC MANAGED VOLATILITY FUND
Financial Highlights
| | | Year | | | Year | | | Year | | | Year | | | | |
| | | Ended | | | Ended | | | Ended | | | Ended | | | For The Period | |
| | | August 31, | | | August 31, | | | August 31, | | | August 31, | | | Inception through | |
| | | 2020 | | | 2019 | | | 2018 | | | 2017 | | | August 31, 2016(1) | |
| Institutional Class | | | | | | | | | | | | | | | |
| | | | | | | | | | | | | | | | |
PER SHARE DATA(2): | | | | | | | | | | | | | | | |
Net asset value, beginning of period | | $ | 12.70 | | | $ | 12.72 | | | $ | 11.95 | | | $ | 10.81 | | | $ | 10.00 | |
| | | | | | | | | | | | | | | | | | | | | |
| INVESTMENT OPERATIONS: | | | | | | | | | | | | | | | | | | | | |
Net investment income | | | 0.25 | | | | 0.24 | | | | 0.23 | | | | 0.19 | | | | 0.16 | |
Net realized and unrealized | | | | | | | | | | | | | | | | | | | | |
gain on investments | | | 1.59 | | | | 0.28 | | | | 1.36 | | | | 1.12 | | | | 0.81 | |
Total from investment operations | | | 1.84 | | | | 0.52 | | | | 1.59 | | | | 1.31 | | | | 0.97 | |
| | | | | | | | | | | | | | | | | | | | | |
| LESS DISTRIBUTIONS: | | | | | | | | | | | | | | | | | | | | |
From net investment income | | | (0.35 | ) | | | (0.17 | ) | | | (0.20 | ) | | | (0.17 | ) | | | (0.14 | ) |
From net capital gains | | | (0.04 | ) | | | (0.37 | ) | | | (0.62 | ) | | | — | | | | (0.02 | ) |
Total distributions | | | (0.39 | ) | | | (0.54 | ) | | | (0.82 | ) | | | (0.17 | ) | | | (0.16 | ) |
Net asset value, end of period | | $ | 14.15 | | | $ | 12.70 | | | $ | 12.72 | | | $ | 11.95 | | | $ | 10.81 | |
| | | | | | | | | | | | | | | | | | | | | |
TOTAL RETURN(3) | | | 14.76 | % | | | 4.54 | % | | | 13.74 | % | | | 12.27 | % | | | 9.75 | % |
| | | | | | | | | | | | | | | | | | | | | |
| SUPPLEMENTAL DATA AND RATIOS: | | | | | | | | | | | | | | | | | |
Net assets, end of period (in millions) | | $ | 66.4 | | | $ | 59.7 | | | $ | 41.7 | | | $ | 35.6 | | | $ | 28.2 | |
| | | | | | | | | | | | | | | | | | | | | |
Ratio of expenses to average net assets(4): | | | | | | | | | | | | | | | | | |
Before expense reimbursement(5) | | | 0.90 | % | | | 1.03 | % | | | 1.19 | % | | | 1.36 | % | | | 1.55 | % |
After expense reimbursement(5) | | | 0.55 | % | | | 0.55 | % | | | 0.55 | % | | | 0.55 | % | | | 0.55 | % |
| | | | | | | | | | | | | | | | | | | | | |
Ratio of net investment income | | | | | | | | | | | | | | | | | | | | |
to average net assets(4): | | | | | | | | | | | | | | | | | | | | |
Before expense reimbursement(5) | | | 1.55 | % | | | 1.67 | % | | | 1.20 | % | | | 0.87 | % | | | 0.62 | % |
After expense reimbursement(5) | | | 1.90 | % | | | 2.15 | % | | | 1.84 | % | | | 1.68 | % | | | 1.62 | % |
| | | | | | | | | | | | | | | | | | | | | |
Portfolio turnover rate(3) | | | 6 | % | | | 1 | % | | | 7 | % | | | 0 | %(6) | | | 36 | % |
(1) | Inception date of the Fund was September 28, 2015. |
(2) | For an Institutional Class Fund Share outstanding for the entire period. |
(3) | Not annualized for periods less than one year. |
(4) | Does not include income and expenses of investment companies in which the Fund invests. |
(5) | Annualized for periods less than one year. |
(6) | Rate is less than 0.5%. |
See Notes to the Financial Statements
SECURIAN AM MANAGED VOLATILITY EQUITY FUND
Financial Highlights
| | | Year | | | Year | | | Year | | | Year | | | | |
| | | Ended | | | Ended | | | Ended | | | Ended | | | For The Period | |
| | | August 31, | | | August 31, | | | August 31, | | | August 31, | | | Inception through | |
| | | 2020 | | | 2019 | | | 2018 | | | 2017 | | | August 31, 2016(1) | |
| Institutional Class | | | | | | | | | | | | | | | |
| | | | | | | | | | | | | | | | |
PER SHARE DATA(2): | | | | | | | | | | | | | | | |
Net asset value, beginning of period | | $ | 12.29 | | | $ | 12.33 | | | $ | 11.62 | | | $ | 10.85 | | | $ | 10.00 | |
| | | | | | | | | | | | | | | | | | | | | |
| INVESTMENT OPERATIONS: | | | | | | | | | | | | | | | | | | | | |
Net investment income | | | 0.29 | | | | 0.24 | | | | 0.22 | | | | 0.23 | | | | 0.15 | |
Net realized and unrealized | | | | | | | | | | | | | | | | | | | | |
gain (loss) on investments | | | (0.62 | ) | | | 0.14 | | | | 0.67 | | | | 0.77 | | | | 0.86 | |
Total from investment operations | | | (0.33 | ) | | | 0.38 | | | | 0.89 | | | | 1.00 | | | | 1.01 | |
| | | | | | | | | | | | | | | | | | | | | |
| LESS DISTRIBUTIONS: | | | | | | | | | | | | | | | | | | | | |
From net investment income | | | (0.37 | ) | | | (0.19 | ) | | | (0.18 | ) | | | (0.23 | ) | | | (0.15 | ) |
From net capital gains | | | — | | | | (0.23 | ) | | | — | | | | — | | | | — | |
From return of capital | | | — | | | | — | | | | — | | | | — | | | | (0.01 | ) |
Total distributions | | | (0.37 | ) | | | (0.42 | ) | | | (0.18 | ) | | | (0.23 | ) | | | (0.16 | ) |
Net asset value, end of period | | $ | 11.59 | | | $ | 12.29 | | | $ | 12.33 | | | $ | 11.62 | | | $ | 10.85 | |
| | | | | | | | | | | | | | | | | | | | | |
TOTAL RETURN(3) | | | -2.76 | % | | | 3.32 | % | | | 7.69 | % | | | 9.36 | % | | | 10.10 | % |
| | | | | | | | | | | | | | | | | | | | | |
| SUPPLEMENTAL DATA AND RATIOS: | | | | | | | | | | | | | | | | | |
Net assets, end of period (in millions) | | $ | 31.1 | | | $ | 39.8 | | | $ | 38.0 | | | $ | 44.4 | | | $ | 29.9 | |
| | | | | | | | | | | | | | | | | | | | | |
Ratio of expenses to average net assets(4): | | | | | | | | | | | | | | | | | |
Before expense reimbursement(5) | | | 1.13 | % | | | 1.14 | % | | | 1.15 | % | | | 1.22 | % | | | 1.67 | % |
After expense reimbursement(5) | | | 0.55 | % | | | 0.55 | % | | | 0.55 | % | | | 0.55 | % | | | 0.55 | % |
| | | | | | | | | | | | | | | | | | | | | |
Ratio of net investment income | | | | | | | | | | | | | | | | | | | | |
to average net assets(4): | | | | | | | | | | | | | | | | | | | | |
Before expense reimbursement(5) | | | 1.69 | % | | | 1.45 | % | | | 1.13 | % | | | 1.48 | % | | | 0.40 | % |
After expense reimbursement(5) | | | 2.27 | % | | | 2.04 | % | | | 1.73 | % | | | 2.15 | % | | | 1.52 | % |
| | | | | | | | | | | | | | | | | | | | | |
Portfolio turnover rate(3) | | | 17 | % | | | 8 | % | | | 12 | % | | | 0 | %(6) | | | 15 | % |
(1) | Inception date of the Fund was September 28, 2015. |
(2) | For an Institutional Class Fund Share outstanding for the entire period. |
(3) | Not annualized for periods less than one year. |
(4) | Does not include income and expenses of investment companies in which the Fund invests. |
(5) | Annualized for periods less than one year. |
(6) | Rate is less than 0.5%. |
See Notes to the Financial Statements
SECURIAN AM REAL ASSET INCOME FUND
Financial Highlights
| | | Year | | | Year | | | Year | | | Year | | | Year | |
| | | Ended | | | Ended | | | Ended | | | Ended | | | Ended | |
| | | August 31, | | | August 31, | | | August 31, | | | August 31, | | | August 31, | |
| | | 2020 | | | 2019 | | | 2018 | | | 2017 | | | 2016 | |
| Institutional Class | | | | | | | | | | | | | | | |
| | | | | | | | | | | | | | | | |
PER SHARE DATA(1): | | | | | | | | | | | | | | | |
Net asset value, beginning of year | | $ | 11.56 | | | $ | 11.35 | | | $ | 11.21 | | | $ | 11.27 | | | $ | 10.46 | |
| | | | | | | | | | | | | | | | | | | | | |
| INVESTMENT OPERATIONS: | | | | | | | | | | | | | | | | | | | | |
Net investment income | | | 0.19 | | | | 0.25 | | | | 0.23 | | | | 0.21 | | | | 0.24 | |
Net realized and unrealized | | | | | | | | | | | | | | | | | | | | |
gain (loss) on investments | | | (1.79 | ) | | | 0.41 | | | | 0.27 | | | | (0.04 | ) | | | 1.39 | |
Total from investment operations | | | (1.60 | ) | | | 0.66 | | | | 0.50 | | | | 0.17 | | | | 1.63 | |
| | | | | | | | | | | | | | | | | | | | | |
| LESS DISTRIBUTIONS: | | | | | | | | | | | | | | | | | | | | |
From net investment income | | | (0.26 | ) | | | (0.32 | ) | | | (0.22 | ) | | | (0.23 | ) | | | (0.31 | ) |
From net capital gains | | | (0.21 | ) | | | (0.13 | ) | | | (0.14 | ) | | | — | | | | (0.51 | ) |
Total distributions | | | (0.47 | ) | | | (0.45 | ) | | | (0.36 | ) | | | (0.23 | ) | | | (0.82 | ) |
Net asset value, end of year | | $ | 9.49 | | | $ | 11.56 | | | $ | 11.35 | | | $ | 11.21 | | | $ | 11.27 | |
| | | | | | | | | | | | | | | | | | | | | |
| TOTAL RETURN | | | -14.25 | % | | | 6.32 | % | | | 4.61 | % | | | 1.59 | % | | | 16.59 | % |
| | | | | | | | | | | | | | | | | | | | | |
| SUPPLEMENTAL DATA AND RATIOS: | | | | | | | | | | | | | | | | | |
Net assets, end of year (in millions) | | $ | 68.0 | | | $ | 83.7 | | | $ | 81.4 | | | $ | 86.5 | | | $ | 88.1 | |
| | | | | | | | | | | | | | | | | | | | | |
Ratio of expenses to average net assets: | | | | | | | | | | | | | | | | | |
| Before expense reimbursement | | | 1.06 | % | | | 1.02 | % | | | 1.06 | % | | | 1.07 | % | | | 1.09 | % |
| After expense reimbursement | | | 0.75 | % | | | 0.75 | % | | | 0.82 | %(2) | | | 0.95 | % | | | 0.95 | % |
| | | | | | | | | | | | | | | | | | | | | |
Ratio of net investment income to average net assets: | | | | | | | | | | | | | | | | | |
| Before expense reimbursement | | | 1.57 | % | | | 1.95 | % | | | 2.02 | % | | | 1.83 | % | | | 1.99 | % |
| After expense reimbursement | | | 1.88 | % | | | 2.22 | % | | | 2.26 | % | | | 1.95 | % | | | 2.13 | % |
| | | | | | | | | | | | | | | | | | | | | |
Portfolio turnover rate | | | 50 | % | | | 46 | % | | | 56 | % | | | 74 | % | | | 82 | % |
(1) | For an Institutional Class Fund Share outstanding for the entire year. |
(2) | Effective December 29, 2017, the contractual rate was lowered from 0.95% to 0.75% of average daily net assets. |
See Notes to the Financial Statements
SECURIAN AM FUNDS
Notes to Financial Statements
August 31, 2020
Managed Portfolio Series (the “Trust”) was organized as a Delaware statutory trust on January 27, 2011. The Trust is registered under the Investment Company Act of 1940, as amended (the “1940 Act”), as an open-end management investment company. The Securian AM Dynamic Managed Volatility Fund (“Dynamic Managed Volatility Fund”), the Securian AM Managed Volatility Equity Fund (“Managed Volatility Equity Fund”), and Securian AM Real Asset Income Fund (“Real Asset Income Fund”) (or collectively, the “Funds”) are each a diversified series with their own investment objectives and policies within the Trust. Each Fund is an investment company and accordingly follows the investment company accounting and reporting guidance of the Financial Accounting Standards Board (“FASB”) Accounting Standards Codification Topic 946 Financial Services – Investment Companies.
The Dynamic Managed Volatility Fund seeks to maximize risk-adjusted total returns relative to its blended benchmark index, comprised of 60% S&P 500® Index and 40% Bloomberg Barclays U.S. Aggregate Bond Index. The Dynamic Managed Volatility Fund seeks to achieve its investment objective by investing in other funds and directly in securities, while using hedging techniques to manage portfolio risk and volatility. The Dynamic Managed Volatility Fund achieves its equity exposure by investing primarily in equity securities or in exchange-traded funds (“ETFs”) that invest in equity securities. The Dynamic Managed Volatility Fund achieves its fixed income exposure by investing primarily in fixed income securities that are investment-grade corporate bonds, ETFs that invest in investment-grade fixed income securities, exchange traded notes (“ETNs”), interest rate swaps, treasury and interest rate futures, or other instruments that have characteristics similar to the fixed income securities included in the Bloomberg Barclays U.S. Aggregate Bond Index. The Dynamic Managed Volatility Fund commenced operations on September 28, 2015. The Dynamic Managed Volatility Fund currently only offers Institutional Class shares. Effective November 22, 2017, the Dynamic Managed Volatility Fund ceased offering Class A shares. The remaining Class A shares were converted to Institutional Class shares at the close of the business on December 26, 2017.
The Managed Volatility Equity Fund seeks to maximize risk-adjusted returns relative to its blended benchmark index, comprised of 60% S&P 500® Low Volatility Index, 20% S&P BMI International Developed Low Volatility Index and 20% Bloomberg Barclays U.S. 3 Month Treasury Bellwether Index. The Managed Volatility Equity Fund seeks to achieve its investment objective by investing in other funds or directly in securities while using hedging techniques to manage portfolio risk and volatility. Under normal market conditions, the Managed Volatility Equity Fund invests at least 80% of its net assets (plus any borrowings for investment purposes) in equity securities. Equity securities include those that are equity-based, such as ETFs that invest primarily in U.S. and foreign equity securities. Over time, the Managed Volatility Equity Fund will target an approximate 85% equity exposure and 15% cash or cash equivalent exposure. The Managed Volatility Equity Fund will generally seek to invest in ETFs that invest in equity securities whose prices are less volatile than the equity markets as a whole. The Managed Volatility Equity Fund commenced operations on September 28, 2015. The Managed Volatility Equity Fund currently only offers Institutional Class shares. Effective November 22, 2017, the Managed Volatility Equity Fund ceased offering Class A shares. The remaining Class A shares were converted to Institutional Class shares at the close of business on December 26, 2017.
The investment objective of the Real Asset Income Fund is above average income and long-term growth of real estate securities. The Real Asset Income Fund seeks to achieve its objective by investing in “real assets” and securities in companies that derive at least 50% of their revenues from activities related to real assets. Real assets are defined broadly by the Fund to include any assets that have physical properties, such as energy and natural resources, real estate, basic materials, equipment, utilities and infrastructure, and commodities. Prior to December 29, 2018, the Real Asset Income Fund had a different investment objective and principal investment
SECURIAN AM FUNDS
Notes to Financial Statements – Continued
August 31, 2020
strategies. The Real Asset Income Fund may also invest up to 25% of its total assets in the securities of master limited partnerships (“MLPs”). In addition, the Adviser may invest in ETFs, ETNs, Treasury inflation-protected securities (“TIPS”), futures, and may write covered calls to accomplish one or more of the following: manage inflation or volatility, increase income, or gain market exposure. The Fund commenced operations on September 12, 2012. The Real Asset Income Fund currently only offers Institutional Class shares. Effective November 22, 2017, the Real Asset Income Fund ceased offering Class A shares. The remaining Class A shares were converted to Institutional Class shares at the close of the business on December 26, 2017.
| 2. | SIGNIFICANT ACCOUNTING POLICIES |
The following is a summary of significant accounting policies consistently followed by the Funds in the preparation of their financial statements. These policies are in conformity with generally accepted accounting principles in the United States of America (“GAAP”).
Security Valuation – All investments in securities are recorded at their estimated fair value, as described in Note 3.
Federal Income Taxes – Each of the Funds complies with the requirements of Subchapter M of the Internal Revenue Code of 1986, as amended, necessary to qualify as a regulated investment company and distributes substantially all net taxable investment income and net realized gains to shareholders in a manner which results in no tax cost to the Funds. Therefore, no federal income or excise tax provision is required. As of and during the year ended August 31, 2020, the Funds did not have any tax positions that did not meet the “more-likely-than-not” threshold of being sustained by the applicable tax authority. As of and during the year ended August 31, 2020, the Funds did not have liabilities for any unrecognized tax benefits. The Funds recognize interest and penalties, if any, related to unrecognized tax benefits on uncertain tax positions as income tax expense in the Statements of Operations. During the year ended August 31, 2020, the Funds did not incur any interest or penalties. The Funds are subject to examination by U.S. taxing authorities for each of the tax years in the four-year period ended August 31, 2020.
Security, Transactions, Income and Distributions – The Funds follow industry practice and record security transactions on the trade date. Realized gains and losses on sales of securities are calculated on the basis of identified cost. Dividend income is recorded on the ex-dividend date and interest income is recorded on an accrual basis. Withholding taxes on foreign dividends have been provided for in accordance with the Funds’ understanding of the applicable country’s tax rules and regulations. Discounts and premiums on securities purchased are amortized over the expected life of the respective securities using the constant yield method of calculation.
The Funds will make distributions of net investment income quarterly. Any net realized long-term or short-term capital gains on sales of the Funds’ securities are distributed to shareholders at least annually. Distributions from net realized gains for book purposes may include short-term capital gains. All short-term capital gains are included in ordinary income for tax purposes. The treatment for financial reporting purposes of distributions made to shareholders during the year from net investment income or net realized capital gains may differ from their ultimate treatment for federal income tax purposes. These differences are caused primarily by differences in the timing of the recognition of certain components of income, expense or realized capital gain for federal income tax purposes.
Reclassification of Capital Accounts – GAAP requires that certain components of net assets relating to permanent differences be reclassified between financial and tax reporting. These reclassifications have no effect on net assets, results of operations or net asset value (“NAV”) per share. For the year ended August 31, 2020, the following reclassifications were made due to equalization and non-deductible expenses from partnerships:
SECURIAN AM FUNDS
Notes to Financial Statements – Continued
August 31, 2020
| | Distributable Earnings | Paid-In Capital |
| Dynamic Managed Volatility Fund | $(88,330) | $88,330 |
| Real Asset Income Fund | (44,542) | 44,542 |
Distributions received from the Real Asset Income Fund’s investments in MLPs generally are comprised of ordinary income and return of capital from the MLPs. The Real Asset Income Fund allocates distributions between investment income and return of capital based on estimates. Such estimates are based on information provided by each MLP and other industry sources. These estimates may subsequently be revised based on actual allocations received from MLPs after their tax reporting periods are concluded, as the actual character of these distributions is not known until after the fiscal year end of the Real Asset Income Fund. Generally, 100% of the distributions received from MLPs is recorded as return of capital and is reflected as such on the Statement of Operations.
Distributions received from the Real Asset Income Fund’s investments in REITs may be characterized as ordinary income, net capital gain, or a return of capital. The proper characterization of REIT distributions is generally not known until after the end of each calendar year. The Real Asset Income Fund must use estimates in reporting the character of their income and distributions for financial statement purposes. The actual character of distributions to Real Asset Income Fund shareholders will be reflected on the Form 1099 received by shareholders after the end of the calendar year. Due to the nature of REIT investments, a portion of the distributions received by a Real Asset Income Fund shareholder may represent a return of capital.
New Accounting Pronouncements and Other Matters – In March 2017, the FASB issued Accounting Standards Update No. 2017-08 (“ASU”), Premium Amortization on Purchased Callable Debt Securities, which amends the accounting standards to shorten the amortization period of certain purchased callable debt securities to the earliest call date. The ASU is effective for fiscal years and interim periods within those fiscal years beginning after December 15, 2018. The Funds have adopted the new amendment as of September 1, 2019. This adoption of the ASU did not have a material impact on the financial statements and did not impact net assets of the Funds.
Futures Contracts and Option Contracts – The Funds are subject to equity price risk, interest rate risk, and foreign currency exchange risk in the normal course of pursuing their investment objectives. The Funds use futures contracts and options on futures contracts to gain exposure to, or hedge against, changes in the value of equities, interest rates or foreign currencies. A futures contract represents a commitment for the future purchase or sale of an asset at a specified price on a specified date. Upon entering into such contracts, the Funds are required to deposit with the broker, either in cash or securities, an initial margin deposit in an amount equal to a certain percentage of the contract amount. In addition, the Fund segregates liquid securities when purchasing or selling futures contracts to comply with Trust policies. Subsequent payments (variation margin) are made or received by the Funds each day, depending on the daily fluctuations in the value of the contract, and are recorded for financial statement purposes as unrealized gains or losses by the Funds. Upon entering into such contracts, the Funds bear the risk of interest or exchange rates or securities prices moving unexpectedly, in which case, the Funds may not achieve the anticipated benefits of the futures contracts and may realize a loss. With futures, there is minimal counterparty credit risk to the Funds since futures are exchange traded and the exchange’s clearinghouse, as counterparty to all exchange-traded futures, guarantees the futures against default. The use of futures contracts, and options on futures contracts, involves the risk of imperfect correlation in movements in the price of futures contracts and options thereon, interest rates and the underlying hedged assets.
The Funds may use purchased option contracts and written option contracts to hedge against the changes in the value of equities or to meet their investment objectives. The Funds may write put and call options only if they (i) own an offsetting position in the underlying security or (ii) maintain cash or other liquid assets in an amount equal to or greater than its obligation under the option.
SECURIAN AM FUNDS
Notes to Financial Statements – Continued
August 31, 2020
When the Funds write a call or put option, an amount equal to the premium received is included in the Statements of Assets and Liabilities as a liability. The amount of the liability is subsequently adjusted to reflect the current fair value of the option. If an option expires on its stipulated expiration date or if the Funds enter into a closing purchase transaction, a gain or loss is realized. If a written call option is exercised, a gain or loss is realized for the sale of the underlying security and the proceeds from the sale are increased by the premium originally received. If a written put option is exercised, the cost of the security acquired is decreased by the premium originally received. As the writer of an option, the Funds have no control over whether the underlying securities are subsequently sold (call) or purchased (put) and, as a result, bear the market risk of an unfavorable change in the price of the security underlying the written option.
The Funds may purchase call and put options. When the Funds purchase a call or put option, an amount equal to the premium paid is included in the Statements of Assets and Liabilities as an investment and is subsequently adjusted to reflect the fair value of the option. If an option expires on the stipulated expiration date or if the Funds enter into a closing sale transaction, a gain or loss is realized. If the Funds exercise a call option, the cost of the security acquired is increased by the premium paid for the call. If the Funds exercise a put option, a gain or loss is realized from the sale of the underlying security, and the proceeds from such a sale are decreased by the premium originally paid. Written and purchased options are non-income producing securities. Written and purchased options expose the Funds to minimal counterparty risk since they are exchange traded and the exchange’s clearinghouse guarantees the options against default. Please refer to Note 4 for more information on derivatives.
Foreign Currency – Investment securities and other assets and liabilities denominated in foreign currencies are translated into U.S. dollar amounts at the date of valuation. Purchases and sales of investment securities and income and expense items denominated in foreign currencies are translated into U.S. dollar amounts on the respective dates of such transactions.
The Funds do not isolate that portion of the results of operations resulting from changes in foreign exchange rates on investments from the fluctuations arising from changes in market prices of securities held. Such fluctuations are included with the net realized and unrealized gain or loss from investments.
The Funds report net realized foreign exchange gains or losses that arise from sales of foreign currencies, currency gains or losses realized between the trade and settlement dates on securities transactions, and the difference between the amounts of dividends, interest, and foreign withholding taxes recorded on the Funds’ books and the U.S. dollar equivalent of the amounts actually received or paid. Net unrealized foreign exchange gains and losses arise from changes in the fair values of assets and liabilities, other than investments in securities at fiscal period ended, resulting from changes in exchange rates.
Use of Estimates – The preparation of financial statements in conformity with GAAP requires management to make estimates and assumptions that affect the reported amounts of assets and liabilities and disclosure of contingent assets and liabilities at the date of the financial statements and the reported amounts of revenues and expenses during the reporting period. Actual results could differ from those estimates.
Indemnifications – Under the Trust’s organizational documents, its officers and trustees are indemnified against certain liabilities arising out of the performance of their duties to the Trust. In addition, in the normal course of business, the Trust may enter into contracts that provide general indemnification to other parties. The Trust’s maximum exposure under these arrangements is unknown, as this would involve future claims that may be made against the Trust that have not yet occurred and may not occur. However, the Trust has not had prior claims or losses pursuant to these contracts and expects the risk of loss to be remote.
SECURIAN AM FUNDS
Notes to Financial Statements – Continued
August 31, 2020
Allocation of Income, Expenses and Gains/Losses – Expenses associated with a specific fund in the Trust are charged to that fund. Common Trust expenses are typically allocated evenly between the funds of the Trust, or by other equitable means.
Illiquid Securities – A security may be considered illiquid if it lacks a readily available market. Securities are generally considered liquid if they can be sold or disposed of in the ordinary course of business within seven days at approximately the price at which the security is valued by the Fund. Illiquid securities may be valued under methods approved by the Board of Trustees (the “Board”) as reflecting fair value. The Funds will not hold more than 15% of the value of its net assets in illiquid securities. At August 31, 2020, the Funds did not hold any illiquid securities.
The Funds have adopted fair value accounting standards which establish an authoritative definition of fair value and set out a hierarchy for measuring fair value. These standards require additional disclosures about the various inputs and valuation techniques used to develop the measurements of fair value, a discussion in changes in valuation techniques and related inputs during the period and expanded disclosure of valuation Levels for major security types. These inputs are summarized in the three broad Levels listed below:
| Level 1 – | Unadjusted quoted prices in active markets for identical assets or liabilities that the Funds have the ability to access. |
| | |
| Level 2 – | Observable inputs other than quoted prices included in Level 1 that are observable for the asset or liability, either directly or indirectly. These inputs may include quoted prices for the identical instrument on an inactive market, prices for similar instruments, interest rates, prepayment speeds, credit risk, yield curves, default rates and similar data. |
| | |
| Level 3 – | Unobservable inputs for the asset or liability, to the extent relevant observable inputs are not available, representing the Funds’ own assumptions about the assumptions a market participant would use in valuing the asset or liability and would be based on the best information available. |
Following is a description of the valuation techniques applied to each Fund’s major categories of assets and liabilities measured at fair value on a recurring basis. Each Fund’s investments are carried at fair value.
Equity Securities – Equity securities, including common stocks, preferred stocks, MLPs and REITs that are primarily traded on a national securities exchange are valued at the last sale price on the exchange on which they are primarily traded on the day of valuation or, if there has been no sale on such day, at the mean between the bid and ask prices. Securities traded primarily on the Nasdaq Global Market System for which market quotations are readily available are valued using the Nasdaq Official Closing Price (“NOCP”). If the NOCP is not available, such securities are valued at the last sale price on the day of valuation, or if there has been no sale on such day, at the mean between the bid and ask prices. To the extent these securities are actively traded and valuation adjustments are not applied, they are categorized in Level 1 of the fair value hierarchy. If the market for a particular security is not active, and the mean between bid and ask is used, these securities are categorized in Level 2 of the fair value hierarchy.
Exchange Traded Funds – Exchange traded funds, including closed-end funds, are valued at the last reported sale price on the exchange on which the security is principally traded. If, on a particular day, an exchange-traded fund does not trade, then the mean between the most recent quoted bid and asked prices will be used. To the extent these securities are actively traded and valuation adjustments are not applied, they are categorized in Level 1 of the fair value hierarchy.
SECURIAN AM FUNDS
Notes to Financial Statements – Continued
August 31, 2020
Corporate and Municipal Bonds – Corporate and Municipal bonds, including listed issues, are valued at fair value on the basis of valuations furnished by an independent pricing service which utilizes both dealer-supplied valuations and formula-based techniques. The pricing service may consider recently executed transactions in securities of the issuer or comparable issuers, market price quotations (where observable), bond spreads, and fundamental data relating to the issuer. Most corporate and municipal bonds are categorized in Level 2 of the fair value hierarchy.
U.S. Government & Agency Securities – U.S. government & agency securities are normally valued by an independent pricing service using a model that incorporates market observable data such as reported sales of similar securities, broker quotes, yields, bids, offers, and reference data. Certain securities are valued principally using dealer quotations. U.S. government and agency securities are categorized in Level 1 or Level 2 of the fair value hierarchy depending on the inputs used and market activity levels for specific securities.
Mortgage and Asset Backed Securities – Mortgage and asset backed securities are usually issued as separate tranches, or classes, of securities within each package of underlying securities. These securities are also normally valued by pricing service providers that use broker dealer quotations or valuation estimates from their internal pricing models. The pricing models for these securities usually consider tranche level attributes, estimated cash flows and market-based yield spreads for each tranche, and current market data and incorporate packaged, collateral performance, as available. Mortgage and asset backed securities that use such valuation techniques and inputs are categorized as Level 2 of the fair value hierarchy.
Short-Term Investments – Investments in other mutual funds, including money market funds, are valued at their net asset value per share. To the extent these securities are actively traded and valuation adjustments are not applied, they are categorized in Level 1 of the fair value hierarchy.
Derivative Instruments – Listed derivatives, including options, rights, warrants and futures that are actively traded are valued based on quoted prices from the exchange and categorized in Level 1 of the fair value hierarchy.
Securities for which market quotations are not readily available, or if the closing price does not represent fair value, are valued following procedures approved by the Board. These procedures consider many factors, including the type of security, size of holding, trading volume and news events. There can be no assurance that the Funds could obtain the fair value assigned to a security if they were to sell the security at approximately the time at which the Funds determine their net asset values per share. The Board has established a Valuation Committee to administer, implement, and oversee the fair valuation process, and to make fair value decisions when necessary. The Board regularly reviews reports that describe any fair value determinations and methods.
The inputs or methodology used for valuing securities are not an indication of the risk associated with investing in those securities.
The following table is a summary of the inputs used to value each Fund’s securities by Level within the fair value hierarchy as of August 31, 2020:
| Dynamic Managed Volatility Fund | | Level 1 | | | Level 2 | | | Level 3 | | | Total | |
| Exchange Traded Funds | | $ | 34,465,013 | | | $ | — | | | $ | — | | | $ | 34,465,013 | |
| Corporate Bonds | | | — | | | | 13,626,924 | | | | — | | | | 13,626,924 | |
| Short-Term Investment | | | 13,469,114 | | | | — | | | | — | | | | 13,469,114 | |
| U.S. Government Security | | | — | | | | 3,508,574 | | | | — | | | | 3,508,574 | |
| Purchased Put Options | | | 86,080 | | | | — | | | | — | | | | 86,080 | |
| Total investments in securities | | $ | 48,020,207 | | | $ | 17,135,498 | | | $ | — | | | $ | 65,155,705 | |
SECURIAN AM FUNDS
Notes to Financial Statements – Continued
August 31, 2020
As of August 31, 2020, the Fund’s investments in other financial instruments* were classified as follows:
| Long Futures Contracts | | $ | 1,323,663 | | | $ | — | | | $ | — | | | $ | 1,323,663 | |
| Short Futures Contracts | | | (2,888 | ) | | | — | | | | — | | | | (2,888 | ) |
| Written Put Options | | | (6,035 | ) | | | — | | | | — | | | | (6,035 | ) |
| Total Other Financial Instruments | | $ | 1,314,740 | | | | | | | | — | | | $ | 1,314,740 | |
| | | | | | | | | | | | | |
| Managed Volatility Equity Fund | | Level 1 | | | Level 2 | | | Level 3 | | | Total | |
| Exchange Traded Funds | | $ | 29,297,441 | | | $ | — | | | $ | — | | | $ | 29,297,441 | |
| Short-Term Investment | | | 309,948 | | | | — | | | | — | | | | 309,948 | |
| Purchased Put Options | | | 46,760 | | | | — | | | | — | | | | 46,760 | |
| Total investments in securities | | $ | 29,654,149 | | | $ | — | | | $ | — | | | $ | 29,654,149 | |
As of August 31, 2020, the Fund’s investments in other financial instruments* were classified as follows:
| Long Futures Contracts | | $ | 99,457 | | | $ | — | | | $ | — | | | $ | 99,457 | |
| Written Put Options | | | (4,215 | ) | | | — | | | | — | | | | (4,215 | ) |
| Total Other Financial Instruments | | $ | 95,242 | | | $ | — | | | $ | — | | | $ | 95,242 | |
| | | | | | | | | | | | | | | | | |
| Real Asset Income Fund | | Level 1 | | | Level 2 | | | Level 3 | | | Total | |
| REIT Common Stocks | | $ | 33,490,197 | | | $ | — | | | $ | — | | | $ | 33,490,197 | |
| Other Common Stocks | | | 12,188,166 | | | | — | | | | — | | | | 12,188,166 | |
| U.S. Government Securities | | | — | | | | 8,396,297 | | | | — | | | | 8,396,297 | |
| REIT Preferred Stocks | | | 5,988,365 | | | | — | | | | — | | | | 5,988,365 | |
| Master Limited Partnerships | | | 4,985,081 | | | | — | | | | — | | | | 4,985,081 | |
| Short-Term Investment | | | 1,275,590 | | | | — | | | | — | | | | 1,275,590 | |
| Other Preferred Stocks | | | 1,169,521 | | | | — | | | | — | | | | 1,169,521 | |
| Closed-End Fund | | | 431,554 | | | | — | | | | — | | | | 431,554 | |
| Corporate Bond | | | — | | | | 203,610 | | | | — | | | | 203,610 | |
| Exchange Traded Fund | | | 73,116 | | | | — | | | | — | | | | 73,116 | |
| Total investments in securities | | $ | 59,601,590 | | | $ | 8,599,907 | | | $ | — | | | $ | 68,201,497 | |
| * | Other financial instruments are derivative instruments not reflected in the Schedule of Investments, such as futures and written options. Futures are presented at the unrealized appreciation (depreciation) on the instruments. |
Refer to each Fund’s Schedule of Investments for additional industry information.
The global outbreak of COVID-19 (commonly referred to as “coronavirus”) has disrupted economic markets and the prolonged economic impact is uncertain. The ultimate economic fallout from the pandemic, and the long-term impact on economies, markets, industries and individual issuers, are not known. The operational and financial performance of the issuers of securities in which the Funds invest depends on future developments, including the duration and spread of the outbreak, and such uncertainty may in turn adversely affect the value and liquidity of the Funds’ investments, impair the Funds’ ability to satisfy redemption requests, and negatively impact the Funds’ performance.
| 4. | DERIVATIVES TRANSACTIONS |
The Funds may use derivatives for different purposes, such as a substitute for taking a position in the underlying asset and/or as part of a strategy designed to reduce exposure to other risks, such as interest rate or currency risk. The
SECURIAN AM FUNDS
Notes to Financial Statements – Continued
August 31, 2020
various derivative instruments that the Funds may use are options, futures contracts and options on futures contracts and other derivative securities. The Funds may also use derivatives for leverage, in which case their use would involve leveraging risk. A Fund investing in a derivative instrument could lose more than the principal amount invested.
FASB Accounting Standards Codification 815, Derivatives and Hedging (“ASC 815”) requires enhanced disclosures about each Fund’s use of, and accounting for, derivative instruments and the effect of derivative instruments on each Fund’s results of operations and financial position. Tabular disclosure regarding derivative fair value and gain/loss by contract type (e.g., interest rate contracts, foreign exchange contracts, credit contracts, etc.) is required and derivatives accounted for as hedging instruments under ASC 815 must be disclosed separately from those that do not qualify for hedge accounting. Even though the Funds may use derivatives in an attempt to achieve an economic hedge, the Funds’ derivatives are not accounted for as hedging instruments under ASC 815 because investment companies account for their derivatives at fair value and record any changes in fair value in current period earnings.
For the year ended August 31, 2020, the Funds’ average monthly notional values are as follows:
| | Purchased | Written | Long | Short |
| | Option | Option | Futures | Futures |
| Fund | Contracts | Contracts | Contracts | Contracts |
| Dynamic Managed Volatility Fund | $11,375,673 | $(7,027,390) | $12,473,198 | $(5,000,972) |
| Managed Volatility Equity Fund | 6,794,905 | (5,996,571) | 2,317,845 | (7,142,507) |
The locations on the Statements of Assets and Liabilities of the Funds’ derivative positions by type of exposure, all of which are not accounted for as hedging instruments under ASC 815, are as follows:
Values of Derivative Instruments as of August 31, 2020 on the Statements of Assets and Liabilities:
Dynamic Managed Volatility Fund
| | Assets | | Liabilities | |
| Derivatives not accounted for as | | | | | | |
| hedging instruments under ASC 815 | Location | Fair Value | | Location | Fair Value | |
| Equity Contracts – Futures | Net Assets – | | | Net Assets – | | |
| | unrealized | | | unrealized | | |
| | appreciation on | | | depreciation on | | |
| futures contracts** | | $ | 1,323,663 | | futures contracts** | | $ | — | |
| Interest Rate Contracts – Futures | Net Assets – | | | | | Net Assets – | | | | |
| unrealized | | | | | unrealized | | | | |
| appreciation on | | | | | depreciation on | | | | |
| futures contracts** | | | — | | futures contracts** | | | (2,888 | ) |
| Equity Contracts – Purchased Options | Investments, | | | | | Investments, | | | | |
| at fair value | | | 86,080 | | at fair value | | | — | |
| Equity Contracts – Written Options | Written option contracts, | | | | | Written option contracts, | | | | |
| at fair value | | | — | | at fair value | | | (6,035 | ) |
| Total | | | $ | 1,409,743 | | | | $ | (8,923 | ) |
| ** | Includes cumulative appreciation/depreciation on futures contracts as reported in the Schedule of Open Futures Contracts. Variation margin is presented on the Statements of Assets and Liabilities. |
SECURIAN AM FUNDS
Notes to Financial Statements – Continued
August 31, 2020
Managed Volatility Equity Fund
| | |
| Assets | | Liabilities | |
| Derivatives not accounted for as | | | | | | | | | |
| hedging instruments under ASC 815 | | Location | | Fair Value | | Location | | Fair Value | |
| Equity Contracts – Futures | | Net Assets – | | | | Net Assets – | | | |
| | | | unrealized | | | | unrealized | | | |
| | | | appreciation on | | | | depreciation on | | | |
| | | | futures contracts** | | $ | 99,457 | | futures contracts** | | $ | — | |
| Equity Contracts – Purchased Options | | Investments, | | | | | Investments, | | | | |
| | | | at fair value | | | 46,760 | | at fair value | | | — | |
| Equity Contracts – Written Options | | Written option contracts, | | | | | Written option contracts, | | | | |
| | | | at fair value | | | — | | at fair value | | | (4,215 | ) |
| Total | | | | $ | 146,217 | | | | $ | (4,215 | ) |
| ** | Includes cumulative appreciation/depreciation on futures contracts as reported in the Schedule of Open Futures Contracts. Variation margin is presented on the Statements of Assets and Liabilities. |
The effect of Derivative Instruments on the Statements of Operations for the year ended August 31, 2020:
Amount of Realized Gain or (Loss) on Derivatives
| | | Dynamic Managed Volatility Fund | | | Managed Volatility Equity Fund
| |
| Derivatives not accounted for as | | | | | Purchased | | | Written | | | | | | Purchased | | | Written | |
| hedging instruments under ASC 815 | | Futures | | | Options | | | Options | | | Futures | | | Options | | | Options | |
Interest Rate Contracts | | $ | 110,165 | | | $ | — | | | $ | — | | | $ | — | | | $ | — | | | $ | — | |
Equity Contracts | | | (285,211 | ) | | | 2,338,901 | | | | (1,299,688 | ) | | | (2,294,521 | ) | | | 1,282,770 | | | | (762,883 | ) |
Total | | $ | (175,046 | ) | | $ | 2,338,901 | | | $ | (1,299,688 | ) | | $ | (2,294,521 | ) | | $ | 1,282,770 | | | $ | (762,883 | ) |
| | |
| Change in Unrealized Appreciation or (Depreciation) on Derivatives | |
| | |
| |
| | | Dynamic Managed Volatility Fund | | | Managed Volatility Equity Fund | |
| Derivatives not accounted for as | | | | | | Purchased | | | Written | | | | | | | Purchased | | | Written | |
| hedging instruments under ASC 815 | | Futures | | | Options* | | | Options | | | Futures | | | Options* | | | Options | |
Interest Rate Contracts | | $ | (2,889 | ) | | $ | — | | | $ | — | | | $ | — | | | $ | — | | | $ | — | |
Equity Contracts | | | 1,338,289 | | | | (77,218 | ) | | | 7,010 | | | | 49,191 | | | | (35,622 | ) | | | (1,156 | ) |
Total | | $ | 1,335,400 | | | $ | (77,218 | ) | | $ | 7,010 | | | $ | 49,191 | | | $ | (35,622 | ) | | $ | (1,156 | ) |
| * | Included in net change in unrealized appreciation on investments as reported on the Statements of Operations. |
SECURIAN AM FUNDS
Notes to Financial Statements – Continued
August 31, 2020
Balance Sheet Offsetting Information
The following table provides a summary of offsetting financial liabilities and derivatives and the effect of derivative instruments on the Statements of Assets and Liabilities as of August 31, 2020.
Dynamic Managed Volatility Fund
| | | | | | | | | | | | Gross Amounts Not Offset in | |
| | | | | | | | | | | | Statements of Assets and Liabilities | |
| | | | | | Gross | | | Net Amounts | | | | | | | | | | |
| | | | | | Amounts | | | of Assets | | | | | | | | | | |
| | | | | | Offset in | | | Presented | | | | | | | | | | |
| | | Gross | | | Statement of | | | in Statement | | | | | | Cash | | | | |
| | | Amounts | | | Assets and | | | of Assets and | | | Financial | | | Collateral | | | Net | |
| Assets: | | Recognized | | | Liabilities | | | Liabilities | | | Instruments | | | Pledged | | | Amount | |
| Futures Contracts** | | $ | — | | | $ | — | | | $ | — | | | $ | — | | | $ | — | | | $ | — | |
| Liabilities: | | | | | | | | | | | | | | | | | | | | | | | | |
| Futures Contracts** | | $ | 37,882 | | | $ | — | | | $ | 37,882 | | | $ | 37,882 | | | $ | — | | | $ | — | |
| Written Options Contracts | | | 6,035 | | | | — | | | | 6,035 | | | | — | | | | 6,035 | | | | — | |
| | | $ | 43,917 | | | $ | — | | | $ | 43,917 | | | $ | 37,882 | | | $ | 6,035 | | | $ | — | |
Managed Volatility Equity Fund
| | | | | | | | | | | | Gross Amounts Not Offset in | |
| | | | | | | | | | | | Statements of Assets and Liabilities | |
| | | | | | Gross | | | Net Amounts | | | | | | | | | | |
| | | | | | Amounts | | | of Assets | | | | | | | | | | |
| | | | | | Offset in | | | Presented | | | | | | | | | | |
| | | Gross | | | Statement of | | | in Statement | | | | | | Cash | | | | |
| | | Amounts | | | Assets and | | | of Assets and | | | Financial | | | Collateral | | | Net | |
| Assets: | | Recognized | | | Liabilities | | | Liabilities | | | Instruments | | | Pledged | | | Amount | |
| Futures Contracts** | | $ | — | | | $ | — | | | $ | — | | | $ | — | | | $ | — | | | $ | — | |
| Liabilities: | | | | | | | | | | | | | | | | | | | | | | | | |
| Futures Contracts** | | $ | 3,300 | | | $ | — | | | $ | 3,300 | | | $ | 3,300 | | | $ | — | | | $ | — | |
| Written Options Contracts | | | 4,215 | | | | — | | | | 4,215 | | | | — | | | | 4,215 | | | | — | |
| | | $ | 7,515 | | | $ | — | | | $ | 7,515 | | | $ | 3,300 | | | $ | 4,215 | | | $ | — | |
| ** | Cumulative appreciation/depreciation on futures contracts is reported in the Schedules of Open Futures Contracts. Variation margin presented above is presented on the Statements of Assets and Liabilities. |
During the ordinary course of business, the Funds may enter into transactions subject to enforceable netting agreements or other similar arrangements (“netting agreements”). Generally, the right to offset in netting agreements allows the Funds to offset any exposure to a specific counterparty with any collateral received or delivered to that counterparty based on the terms of the agreement. Generally, each fund manages its cash collateral and securities collateral on a counterparty basis. As of August 31, 2020, the Funds did not enter into any netting agreements which would require any portfolio securities to be netted.
SECURIAN AM FUNDS
Notes to Financial Statements – Continued
August 31, 2020
| 5. | INVESTMENT ADVISORY FEE AND OTHER TRANSACTIONS WITH AFFILIATES |
The Trust has an agreement with the Adviser to furnish investment advisory services to the Funds. For its services, the Funds pay the Adviser a monthly management fee based upon the average daily net assets of the Funds at the following annual rates:
| Fund | | | | |
Dynamic Managed Volatility Fund | | | 0.55 | %* |
|
Managed Volatility Equity Fund | | | 0.55 | %* |
|
Real Asset Income Fund | | | 0.75 | % |
|
| * | Prior to December 29, 2019, the management fee was 0.65%. |
The Funds’ Adviser has contractually agreed to waive a portion or all of its management fees and reimburse the Fund for its expenses to ensure that total annual operating expenses (excluding acquired fund fees and expenses, interest, taxes, brokerage commissions and extraordinary expenses) based upon the average daily net assets of the Funds do not exceed the following annual rates:
| Fund | | | | |
Dynamic Managed Volatility Fund | | | 0.55 | % | |
Managed Volatility Equity Fund | | | 0.55 | % | |
Real Asset Income Fund | | | 0.75 | % | |
Fees waived and expenses reimbursed by the Adviser may be recouped by the Adviser for a period thirty-six months following the date on which such waiver or reimbursement was made if such recoupment can be achieved without exceeding the expense limit in effect at the time the waiver and reimbursement occurred. The Operating Expense Limitation Agreement is intended to be continual in nature and cannot be terminated within a year after the effective date of the Funds’ prospectus. After that date, the agreement may be terminated at any time upon 60 days’ written notice by the Board or the Adviser, with the consent of the Board. During the year ended August 31, 2020, the Adviser did not recoup any previously waived fees. Waived fees and reimbursed expenses subject to potential recovery by month of expiration are as follows:
| | | September 2020- | | | September 2021- | | | September 2022- | |
| Fund | | August 2021 | | | August 2022 | | | August 2023 | |
Dynamic Managed Volatility Fund | | $ | 248,378 | | | $ | 252,224 | | | $ | 212,359 | |
Managed Volatility Equity Fund | | | 243,024 | | | | 224,521 | | | | 218,645 | |
Real Asset Income Fund | | | 189,095 | | | | 216,403 | | | | 228,917 | |
U.S. Bancorp Fund Services, LLC, doing business as U.S. Bank Global Fund Services (“Fund Services” or the “Administrator”), acts as the Funds’ Administrator, Transfer Agent, and Fund Accountant. U.S. Bank N.A. (the “Custodian”) serves as the custodian to the Funds. The Custodian is an affiliate of the Administrator. The Administrator performs various administrative and accounting services for the Funds. The Administrator prepares various federal and state regulatory filings, reports and returns for the Funds; prepares reports and materials to be supplied to the Trustees; monitors the activities of the Funds’ custodian; coordinates the payment of the Funds’ expenses and reviews the Funds’ expense accruals. The officers of the Trust, including the Chief Compliance Officer are employees of the Administrator. As compensation for its services, the Administrator is entitled to a monthly fee at an annual rate based upon the average daily net assets of the Funds, subject to annual minimums. Fees paid by the Funds for administration and accounting, transfer agency, custody and compliance services for the year ended August 31, 2020 are disclosed in the Statements of Operations.
SECURIAN AM FUNDS
Notes to Financial Statements – Continued
August 31, 2020
Quasar Distributors, LLC (“Quasar”) acts as the Funds’ principal underwriter in a continuous public offering of the Funds’ shares. Effective March 31, 2020, Foreside Financial Group, LLC (“Foreside”) acquired Quasar from U.S. Bancorp. As a result of the acquisition, Quasar became a wholly owned broker-dealer subsidiary of Foreside and is no longer affiliated with U.S. Bancorp. The Board of the Funds has approved a new Distribution Agreement to enable Quasar to continue serving as the Funds’ distributor.
Minnesota Mutual Companies, Inc. (“Minnesota Life”) is the parent company of the Adviser. Minnesota Life performs sub-transfer agency services for the Dynamic Managed Volatility Fund and the Real Asset Income Fund. As compensation for its services, Minnesota Life is entitled to a monthly fee at an annual rate based upon the average value of the shareholder accounts it services. For the year ended August 31, 2020, the Dynamic Managed Volatility Fund and the Real Asset Income Fund paid $3,037 and $2,881, respectively, to Minnesota Life. These amounts are disclosed as transfer agent fees and expenses on the Statements of Operations.
6.
| CAPITAL SHARE TRANSACTIONS |
Transactions in shares of the Funds were as follows:
| | | Dynamic Managed Volatility Fund | | | Managed Volatility Equity Fund | |
| | | Year Ended | | | Year Ended | | | Year Ended | | | Year Ended | |
| | | August 31, 2020 | | | August 31, 2019 | | | August 31, 2020 | | | August 31, 2019 | |
| Shares sold | | | 238,602 | | | | 1,252,293 | | | | 580,989 | | | | 573,049 | |
| Shares issued to holders in | | | | | | | | | | | | | | | | |
| reinvestment of dividends | | | 137,134 | | | | 198,939 | | | | 79,139 | | | | 104,213 | |
| Shares redeemed | | | (377,968 | ) | | | (33,629 | ) | | | (1,220,467 | ) | | | (516,529 | ) |
| Net increase (decrease) in | | | | | | | | | | | | | | | | |
| shares outstanding | | | (2,232 | ) | | | 1,417,603 | | | | (560,339 | ) | | | 160,733 | |
| | | | | | | | | | | | | | | | | |
| | | | | | | | | | | Real Asset Income Fund | |
| | | | | | | | | | | Year Ended | | | Year Ended | |
| | | | | | | | | | | August 31, 2020 | | | August 31, 2019 | |
| Shares sold | | | | | | | | | | | 86,453 | | | | 54,892 | |
| Shares issued to holders in reinvestment of dividends | | | | | | | | | | | 167,802 | | | | 167,640 | |
| Shares redeemed | | | | | | | | | | | (336,125 | ) | | | (156,612 | ) |
| Net decrease in shares outstanding | | | | | | | | | | | (81,870 | ) | | | (564,444 | ) |
| 7. | INVESTMENT TRANSACTIONS |
The aggregate purchases and sales, excluding short-term investments, by the Funds for the year ended August 31, 2020, were as follows:
| | | U.S. Government Securities | | | Other | |
| | | Purchases | | | Sales | | | Purchases | | | Sales | |
| Dynamic Managed Volatility Fund | | $ | — | | | $ | 1,634,244 | | | $ | 3,199,228 | | | $ | 1,286,660 | |
| Managed Volatility Equity Fund | | | — | | | | — | | | | 5,741,749 | | | | 12,352,869 | |
| Real Asset Income Fund | | | — | | | | 587,825 | | | | 36,346,591 | | | | 37,460,594 | |
SECURIAN AM FUNDS
Notes to Financial Statements – Continued
August 31, 2020
| 8. | FEDERAL TAX INFORMATION |
The aggregate gross unrealized appreciation and depreciation of investments held by the Funds and the total cost of investments for federal income tax purposes at August 31, 2020, the Funds’ most recently completed fiscal year end, were as follows:
| | | Aggregate | | | Aggregate | | | | | | Federal | |
| | | Gross | | | Gross | | | Net | | | Income | |
| Fund | | Appreciation | | | Depreciation | | | Appreciation | | | Tax Cost | |
| Dynamic Managed Volatility Fund | | $ | 13,423,110 | | | $ | (119,680 | ) | | $ | 13,303,430 | | | $ | 51,852,275 | |
| Managed Volatility Equity Fund | | | 6,801,716 | | | | (543,212 | ) | | | 6,258,504 | | | | 23,395,645 | |
| Real Asset Income Fund | | | 10,169,679 | | | | (5,367,075 | ) | | | 4,802,604 | | | | 63,398,893 | |
The difference between book basis and tax-basis unrealized appreciation is attributable primarily to the tax deferral of wash sale losses, derivatives, and debt modifications for the Dynamic Managed Volatility Fund and Managed Volatility Equity Fund.
The difference between book-basis and tax-basis unrealized appreciation is attributable primarily to the tax deferral of wash sale losses, passive foreign investment companies, REITs and tax partnership basis adjustments outstanding for the Real Asset Income Fund.
At August 31, 2020, the most recently completed fiscal year end, components of distributable earnings (deficit) on a tax-basis were as follows:
| | | Undistributed | | | Undistributed | | | Other | | | | | | Total | |
| | | Ordinary | | | Long-Term | | | Accumulated | | | Unrealized | | | Distributable | |
| Fund | | Income | | | Capital Gains | | | Losses | | | Appreciation | | | Earnings | |
Dynamic Managed Volatility Fund | | $ | 1,194,726 | | | $ | 1,465,965 | | | $ | (459,657 | ) | | $ | 13,303,430 | | | $ | 15,504,464 | |
Managed Volatility Equity Fund | | | 23,942 | | | | — | | | | (1,252,352 | ) | | | 6,258,504 | | | | 5,030,094 | |
Real Asset Income Fund | | | 367,109 | | | | — | | | | (9,363,291 | ) | | | 4,802,604 | | | | (4,193,578 | ) |
As of August 31, 2020, the Managed Volatility Equity Fund had short-term capital loss carryovers of $857,854 and long-term capital loss carryovers of $394,498, which will be permitted to be carried over for an unlimited period. A regulated investment company may elect for any taxable year to treat any portion of any qualified late year loss as arising on the first day of the next taxable year. Qualified late year losses are certain capital, and ordinary losses which occur during the portion of the Funds’ taxable year subsequent to October 31 and December 31, 2019 respectively. For the taxable year ended August 31, 2020, the Real Asset Income Fund plans to defer $7,526,316 in late year capital losses. The Dynamic Managed Volatility Fund and the Managed Volatility Equity Fund do not plan to defer any qualified late year losses.
For the year ended August 31, 2020, the Funds paid the following distributions to shareholders:
| | | Ordinary | | | Long-Term | | | | |
| Fund | | Income* | | | Capital Gains** | | | Total | |
Dynamic Managed Volatility Fund | | $ | 1,703,596 | | | $ | 103,580 | | | $ | 1,807,176 | |
Managed Volatility Equity Fund | | | 1,125,018 | | | | — | | | | 1,125,018 | |
Real Asset Income Fund | | | 2,266,932 | | | | 1,083,780 | | | | 3,350,712 | |
SECURIAN AM FUNDS
Notes to Financial Statements – Continued
August 31, 2020
For the year ended August 31, 2019, the Funds paid the following distributions to shareholders:
| | | Ordinary | | | Long Term | | | | |
| Fund | | Income* | | | Capital Gains** | | | Total | |
Dynamic Managed Volatility Fund | | $ | 1,279,453 | | | $ | 1,073,167 | | | $ | 2,352,620 | |
Managed Volatility Equity Fund | | | 794,778 | | | | 524,787 | | | | 1,319,565 | |
Real Asset Income Fund | | | 2,615,620 | | | | 612,824 | | | | 3,228,444 | |
| * | | For federal income tax purposes, distributions of short-term capital gains are treated as ordinary income distributions. |
| ** | | The Funds designate long term capital gain dividends pursuant to Sec. 852(b)(3)(C). |
The beneficial ownership, either directly or indirectly, of more than 25% of the voting securities of a fund creates a presumption of control of the fund, under Section 2(a)(9) of the Investment Company Act of 1940. As of August 31, 2020, each Fund’s percentage of control ownership positions greater than 25% are as follows:
| Fund | Shareholder | Percent of Shares Held |
Dynamic Managed Volatility Fund | Minnesota Life Insurance Company | 68.1% |
Managed Volatility Equity Fund | Pershing LLC | 70.3% |
Managed Volatility Equity Fund | Minnesota Life Insurance Company | 28.9% |
Real Asset Income Fund | Minnesota Life Insurance Company | 34.2% |
Real Asset Income Fund | Comerica Bank (FBO) | 34.7% |
On July 8, 2020, the Board approved a revision to the name and investment objective for the Dynamic Managed Volatility Fund. Effective September 8, 2020, the Dynamic Managed Volatility Fund will be renamed the Securian AM Balanced Stabilization Fund and the investment objective will be revised to seek maximize risk-adjusted returns within a balanced portfolio while using hedging techniques to target volatility of 10% or less over a full market cycle.
On July 8, 2020, the Board approved a revision to the name and investment objective for the Managed Volatility Equity Fund. Effective September 8, 2020, the Managed Volatility Equity Fund will be renamed the Securian AM Equity Stabilization Fund and the investment objective will be revised to seek maximize risk-adjusted returns while using hedging techniques to target volatility of 10% or less over a full market cycle.
Effective September 8, 2020, the Managed Volatility Equity Fund will change its secondary benchmark from a blended benchmark comprised of comprised of 60% S&P 500® Low Volatility Index, 20% S&P BMI International Developed Low Volatility Index and 20% Bloomberg Barclays U.S. 3 Month Treasury Bellwether Index to the MSCI ACWI Index.
On August 18, 2020, the Board unanimously approved an Agreement and Plan of Reorganization (the “Reorganizations”) providing for the reorganization of the Funds. The Reorganizations, which are expected to be tax free to the shareholders of the Funds, will entail a transfer of all of the assets and liabilities of the Funds into corresponding, newly created series of Investment Managers Series Trust (“IMST”) (the “Acquiring Funds”). The shares of the Acquiring Funds received by shareholders of the Funds will be equivalent in aggregate net asset value to the aggregate net asset value of their shares in the Trust at the time of the Reorganizations. The Trust will call a shareholder meeting at which shareholders of each Fund will be asked to vote on the proposed
SECURIAN AM FUNDS
Notes to Financial Statements – Continued
August 31, 2020
Reorganization with respect to their Fund. The shareholder meeting will occur in the fourth Quarter of 2020. The Acquiring Funds’ Trust has filed a proxy statement/prospectus which includes a full description of the Reorganizations, including the Acquiring Funds’ fees and expenses, as well as the Board’s reasons for approving the Reorganizations. The proxy statement/prospectus when finalized will be sent out to eligible shareholders ahead of the shareholder meeting. If the Reorganization of a Fund is approved by shareholders, the Reorganization of that Fund is expected to take effect in December 2020.
On September 29, 2020, the Dynamic Managed Volatility Fund paid an income distribution in the amount of $118,572 or $0.0253 per share.
On September 29, 2020, the Managed Volatility Equity Fund paid an income distribution in the amount of $23,942 or $0.0092 per share.
On September 29, 2020, the Real Asset Income Fund paid an income distribution in the amount of $365,606 or $0.0511 per share.
Management has performed an evaluation of subsequent events through the date the financial statements were issued and has determined that no additional items require recognition or disclosure.
SECURIAN AM FUNDS
Report of Independent Registered Public Accounting Firm
To the Shareholders of Securian AM Funds and
Board of Trustees of Managed Portfolio Series
Opinion on the Financial Statements
We have audited the accompanying statements of assets and liabilities, including the schedules of investments, open futures contracts, and written options, of Securian AM Dynamic Managed Volatility Fund, Securian AM Managed Volatility Equity Fund, and Securian AM Real Asset Income Fund (“Securian AM Funds” or the “Funds”), each a series of Managed Portfolio Series, as of August 31, 2020, the related statements of operations for the year then ended, the statements of changes in net assets for each of the two years in the period then ended, including the related notes, and the financial highlights for each of the five years in the period then ended (collectively referred to as the “financial statements”). In our opinion, the financial statements present fairly, in all material respects, the financial position of each of the Funds as of August 31, 2020, the results of their operations for the year then ended, the changes in their net assets for each of the two years in the period then ended, and the financial highlights for each of the five years in the period then ended, in conformity with accounting principles generally accepted in the United States of America.
Basis for Opinion
These financial statements are the responsibility of the Funds’ management. Our responsibility is to express an opinion on the Funds’ financial statements based on our audits. We are a public accounting firm registered with the Public Company Accounting Oversight Board (United States) (“PCAOB”) and are required to be independent with respect to the Funds in accordance with the U.S. federal securities laws and the applicable rules and regulations of the Securities and Exchange Commission and the PCAOB.
We conducted our audits in accordance with the standards of the PCAOB. Those standards require that we plan and perform the audit to obtain reasonable assurance about whether the financial statements are free of material misstatement whether due to error or fraud.
Our audits included performing procedures to assess the risks of material misstatement of the financial statements, whether due to error or fraud, and performing procedures that respond to those risks. Such procedures included examining, on a test basis, evidence regarding the amounts and disclosures in the financial statements. Our procedures included confirmation of securities owned as of August 31, 2020, by correspondence with the custodian and brokers or by other appropriate auditing procedures where replies from brokers were not received. Our audits also included evaluating the accounting principles used and significant estimates made by management, as well as evaluating the overall presentation of the financial statements. We believe that our audits provide a reasonable basis for our opinion.
We have served as the Funds’ auditor since 2015.
COHEN & COMPANY, LTD.
Milwaukee, Wisconsin
October 29, 2020
SECURIAN AM FUNDS
Statement Regarding the Funds’ Liquidity Risk Management Program (Unaudited)
August 31, 2020
Pursuant to Rule 22e-4 under the Investment Company Act of 1940, the Trust, on behalf of the Securian AM Dynamic Managed Volatility Fund, Securian AM Managed Volatility Equity Fund and the Securian AM Real Asset Income Fund (each a “Fund” and together, the “Funds”), has adopted and implemented a written liquidity risk management program (the “Program”) that includes policies and procedures reasonably designed to comply with the requirements of Rule 22e-4, including: (i) assessment, management and periodic review of liquidity risk; (ii) classification of portfolio holdings; (iii) establishment of a highly liquid investment minimum (“HLIM”), as applicable; (iv) limitation on illiquid investments; and (v) redemptions in-kind. The Trust’s Board of Trustees (the “Board”) has approved the designation of Securian Asset management, Inc. (“Securian”) as the administrator of the Program (the “Program Administrator”). Personnel of Securian conduct the day-to-day operation of the Program pursuant to policies and procedures administered by the Program Administrator.
In accordance with Rule 22e-4, the Board reviewed a report prepared by the Program Administrator (the “Report”) regarding the operation of the Program and its adequacy and effectiveness of implementation for the period June 1, 2019, through December 31, 2019 (the “Reporting Period”). No significant liquidity events impacting the Funds during the Reporting Period or material changes to the Program were noted in the Report.
Under the Program, Securian manages and periodically reviews each Fund’s liquidity risk, including consideration of applicable factors specified in Rule 22e-4 and the Program. Liquidity risk is defined as the risk that a Fund could not meet shareholder redemption requests without significant dilution of remaining shareholders’ interests in the Fund. In general, this risk was managed during the Reporting Period by monitoring the degree of liquidity of each Fund’s investments, limiting the amount of each Fund’s illiquid investments, and utilizing various risk management tools and facilities available to each Fund for meeting shareholder redemptions, among other means. In the Report, Securian provided its assessment that, based on the information considered in its review, the Program remains reasonably designed to manage each Fund’s liquidity risk and each Fund’s investment strategy remains appropriate for an open-end fund.
Pursuant to the Program, the Program Administrator oversaw the classification of each of the Funds’ portfolio investments as highly liquid, moderately liquid, less liquid or illiquid during the Reporting Period, including in connection with recording investment classifications on Form N-PORT. Securian’s process of determining the degree of liquidity of each Fund’s investments is supported by one or more third-party liquidity assessment vendors.
Each Fund qualified as a “primarily highly liquid fund” as defined in the Program during the Reporting Period. Accordingly, each Fund was not required to establish a HLIM or comply with the related Program provisions during the Reporting Period.
During the Reporting Period, each Fund’s investments were monitored for compliance with the 15% limitation on illiquid investments pursuant to the Program and in accordance with Rule 22e-4.
The Report noted that the Funds did not effect redemptions in-kind during the Reporting Period pursuant to the Program. The Report concluded, with respect to each Fund: (i) the Program was implemented and operated effectively to achieve the goal of assessing and managing the Fund’s liquidity risk during the Reporting Period; and (ii) the Fund was able to meet requests for redemption without significant dilution of remaining investors’ interests in the Fund during the Reporting Period.
SECURIAN AM FUNDS
Additional Information (Unaudited)
August 31, 2020
Trustees and Officers
| | | | Number of | | |
| | | Term of | Portfolios | Principal | Other Directorships |
| | Position(s) | Office and | in Trust | Occupation(s) | Held by Trustee |
| Name, Address | Held with | Length of | Overseen | During the | During the |
| and Year of Birth | the Trust | Time Served | by Trustee | Past Five Years | Past Five Years |
| Independent Trustees | | | | | |
Leonard M. Rush, CPA | Lead | Indefinite | 37 | Retired, Chief Financial | Independent Trustee, |
615 E. Michigan St. | Independent | Term; Since | | Officer, Robert W. Baird | ETF Series Solutions |
Milwaukee, WI 53202 | Trustee | April 2011 | | & Co. Incorporated | (46 Portfolios) |
Year of Birth: 1946 | and Audit | | | (2000-2011). | (2012-Present); |
| | Committee | | | | Director, Anchor |
| | Chairman | | | | Bancorp Wisconsin, |
| | | | | | Inc. (2011-2013). |
David A. Massart | Trustee | Indefinite | 37 | Co-Founder and Chief | Independent Trustee, |
615 E. Michigan St. | | Term; Since | | Investment Strategist, | ETF Series Solutions |
Milwaukee, WI 53202 | | April 2011 | | Next Generation Wealth | (46 Portfolios) |
Year of Birth: 1967 | | | | Management, Inc. | (2012-Present). |
| | | | | (2005-Present). | |
SECURIAN AM FUNDS
Additional Information (Unaudited) – Continued
August 31, 2020
| | | | Number of | | |
| | | Term of | Portfolios | Principal | Other Directorships |
| | Position(s) | Office and | in Trust | Occupation(s) | Held by Trustee |
| Name, Address | Held with | Length of | Overseen | During the | During the |
| and Year of Birth | the Trust | Time Served | by Trustee | Past Five Years | Past Five Years |
David M. Swanson | Trustee | Indefinite | 37 | Founder and Managing | Independent Trustee, |
615 E. Michigan St. | and | Term; Since | | Principal, SwanDog | ALPS Variable |
Milwaukee, WI 53202 | Nominating | April 2011 | | Strategic Marketing, LLC | Investment Trust |
Year of Birth: 1957 | & | | | (2006-Present). | (7 Portfolios) |
| | Governance | | | | (2006-Present); |
| | Committee | | | | Independent Trustee, |
| | Chairman | | | | RiverNorth |
| | | | | | Opportunities |
| | | | | | Closed-End Fund |
| | | | | | (2015-Present); |
| | | | | | Independent Trustee, |
| | | | | | RiverNorth Funds |
| | | | | | (3 Portfolios) |
| | | | | | (2018-Present); |
| | | | | | RiverNorth Managed |
| | | | | | Duration Municipal |
| | | | | | Income Fund Inc. |
| | | | | | (1 Portfolio) |
| | | | | | (2019-Present); |
| | | | | | RiverNorth |
| | | | | | Marketplace Lending |
| | | | | | Corporation |
| | | | | | (1 Portfolio) |
| | | | | | (2018-Present); |
| | | | | | RiverNorth/ |
| | | | | | DoubleLine Strategic |
| | | | | | Opportunity Fund, |
| | | | | | Inc. (1 Portfolio) |
| | | | | | (2018-Present); |
| | | | | | RiverNorth |
| | | | | | Opportunities Fund, |
| | | | | | Inc. (1 Portfolio) |
| | | | | | (2013-Present); |
| | | | | | RiverNorth |
| | | | | | Opportunistic |
| | | | | | Municipal Income |
| | | | | | Fund, Inc. |
| | | | | | (1 Portfolio) |
| | | | | | (2018-Present). |
Robert J. Kern* | Trustee | Indefinite | 37 | Retired (July 2018-Present); | None |
615 E. Michigan St. |
| Term; Since | | Executive Vice President, | |
Milwaukee, WI 53202 |
| January 2011 | | U.S. Bancorp Fund Services, | |
Year of Birth: 1958 | | | | LLC (1994-2018). | |
* | Mr. Kern became an Independent Trustee on July 6, 2020. Previously he was an Interested Trustee. |
SECURIAN AM FUNDS
Additional Information (Unaudited) – Continued
August 31, 2020
| |
|
| Number of | | |
| |
| | | | Other Directorships |
| | | | | Held by Trustee |
| Name, Address | Held with | Length of | Overseen | During the | During the |
| and Year of Birth | the Trust | Time Served | by Trustee | Past Five Years | Past Five Years |
| Officers | | | | | |
Brian R. Wiedmeyer | President | Indefinite | N/A | Vice President, U.S. | N/A |
615 E. Michigan St. | and | Term; Since | | Bancorp Fund Services, | |
Milwaukee, WI 53202 | Principal | November 2018 | | LLC (2005-Present). | |
Year of Birth: 1973 | Executive | | | | |
| | Officer | | | | |
Deborah Ward | Vice | Indefinite | N/A | Senior Vice President, | N/A |
615 E. Michigan St. | President, | Term; Since | | U.S. Bancorp Fund Services, | |
Milwaukee, WI 53202 | Chief | April 2013 | | LLC (2004-Present). | |
Year of Birth: 1966 | Compliance | | | | |
| | Officer and | | | | |
| | Anti-Money | | | | |
| | Laundering | | | | |
| | Officer | | | | |
Benjamin Eirich | Treasurer, | Indefinite | N/A | Assistant Vice President, | N/A |
615 E. Michigan St. | Principal | Term; Since | | U.S. Bancorp Fund Services, | |
Milwaukee, WI 53202 | Financial | August 2019 | | LLC (2008-Present). | |
Year of Birth: 1981 | Officer and | (Treasurer); | | | |
| | Vice | Indefinite | | | |
| | President | Term; Since | | | |
| | | November 2018 | | | |
| | | (Vice President) | | | |
Thomas A. Bausch, Esq. | Secretary | Indefinite | N/A | Vice President, U.S. Bancorp | N/A |
615 E. Michigan St. |
| | | Fund Services, LLC | |
Milwaukee, WI 53202 |
| | | (2016-Present); Associate, | |
Year of Birth: 1979 | |
| | Godfrey & Kahn S.C. | |
| | |
| | (2012-2016). | |
Douglas Schafer | Assistant | Indefinite | N/A | Assistant Vice President, | N/A |
615 E. Michigan St. | Treasurer | Term; Since | | U.S. Bancorp Fund Services, | |
Milwaukee, WI 53202 | and Vice | May 2016 | | LLC (2002-Present). | |
Year of Birth: 1970 | President | (Assistant | | | |
| |
| Treasurer); | | | |
| |
| Indefinite | | | |
| |
| Term; Since | | | |
| |
| November 2018 | | | |
| |
| (Vice President) | | | |
Michael J. Cyr II, CPA | Assistant | Indefinite | N/A | Officer, U.S. Bancorp | N/A |
615 E. Michigan St. | Treasurer | Term; Since | | Fund Services, LLC | |
Milwaukee, WI 53202 | and Vice | August 2019 | | (2013-Present). | |
Year of Birth: 1992 | President | | | | |
SECURIAN AM FUNDS
Additional Information (Unaudited) – Continued
August 31, 2020
AVAILABILITY OF FUND PORTFOLIO INFORMATION
The Funds file complete schedules of portfolio holdings with the SEC for the first and third quarters of each fiscal year on Part F of Form N-PORT, which is available on the SEC’s website at www.sec.gov. The Funds’ Part F of Form N-PORT may be reviewed and copied at the SEC’s Public Reference Room in Washington, D.C. For information on the Public Reference Room call 1-800-SEC-0330. In addition, the Funds’ Part F of Form N-PORT is available without charge upon request by calling 1-888-964-0788.
AVAILABILITY OF PROXY VOTING INFORMATION
A description of the Funds’ Proxy Voting Policies and Procedures is available without charge, upon request, by calling 1-888-964-0788. Information regarding how the Funds voted proxies relating to portfolio securities during the most recent 12-month period ended June 30, is available (1) without charge, upon request, by calling 1-888-964-0788, or (2) on the SEC’s website at www.sec.gov.
QUALIFIED DIVIDEND INCOME/DIVIDENDS RECEIVED DEDUCTION
For the fiscal year ended August 31, 2020, certain dividends paid by the Funds may be reported as qualified dividend income and may be eligible for taxation at capital gain rates. The percentage of dividends declared from ordinary income designated as qualified dividend income was 27.86%, 86.57%, and 20.27% for the Dynamic Managed Volatility Fund, Managed Volatility Equity Fund, and Real Asset Income Fund, respectively.
For corporate shareholders, the percent of ordinary income distributions qualifying for the corporate dividends received deduction for the fiscal year ended August 31, 2020 was 25.89%, 55.02%, and 18.59% for the Dynamic Managed Volatility Fund, Managed Volatility Equity Fund, and Real Asset Income Fund, respectively.
The percentage of taxable ordinary income distributions that are designated as short-term capital gain distributions under Internal Revenue Section 871(k)(2)(C) was 4.38%, 0.00% and 17.28% for the Dynamic Managed Volatility Fund, Managed Volatility Equity Fund and Real Asset Income Fund, respectively.
SECURIAN AM FUNDS
Privacy Notice
The Funds collect only relevant information about you that the law allows or requires it to have in order to conduct its business and properly service you. The Funds collect financial and personal information about you (“Personal Information”) directly (e.g., information on account applications and other forms, such as your name, address, and social security number, and information provided to access account information or conduct account transactions online, such as password, account number, e-mail address, and alternate telephone number), and indirectly (e.g., information about your transactions with us, such as transaction amounts, account balance and account holdings).
The Funds do not disclose any non-public personal information about its shareholders or former shareholders other than for everyday business purposes such as to process a transaction, service an account respond to court orders and legal investigations or as otherwise permitted by law. Third parties that may receive this information include companies that provide transfer agency, technology and administrative services to the Funds, as well as the Funds’ investment adviser who is an affiliate of the Funds. If you maintain a retirement/educational custodial account directly with the Funds, we may also disclose your Personal Information to the custodian for that account for shareholder servicing purposes. The Funds limit access to your Personal Information provided to unaffiliated third parties to information necessary to carry out their assigned responsibilities to the Funds. All shareholder records will be disposed of in accordance with applicable law. The Funds maintain physical, electronic and procedural safeguards to protect your Personal Information and requires its third-party service providers with access to such information to treat your Personal Information with the same high degree of confidentiality.
In the event that you hold shares of the Funds through a financial intermediary, including, but not limited to, a broker-dealer, credit union, bank or trust company, the privacy policy of your financial intermediary governs how your non-public personal information is shared with unaffiliated third parties.
INVESTMENT ADVISER
Securian Asset Management, Inc.
400 Robert St. North
St. Paul, MN 55101-2098
DISTRIBUTOR
Quasar Distributors, LLC
111 East Kilbourn Avenue, Suite 2200
Milwaukee, WI 53202
CUSTODIAN
U.S. Bank, N.A.
1555 North River Center Drive
Milwaukee, WI 53212
ADMINISTRATOR, FUND ACCOUNTANT
AND TRANSFER AGENT
U.S. Bancorp Fund Services, LLC
615 East Michigan Street
Milwaukee, WI 53202
INDEPENDENT REGISTERED PUBLIC ACCOUNTING FIRM
Cohen & Company, Ltd.
342 North Water Street, Suite 830
Milwaukee, WI 53202
LEGAL COUNSEL
Stradley Ronon Stevens & Young LLP
2005 Market Street, Suite 2600
Philadelphia, PA 19103
This report must be accompanied or preceded by a prospectus.
The Funds’ Statement of Additional Information contains additional information about the Funds’ trustees and is available without charge upon request by calling 1-888-964-0788.
Item 2. Code of Ethics.
The registrant has adopted a code of ethics that applies to the registrant’s principal executive officer and principal financial officer. The registrant has not made any substantive amendments to its code of ethics during the period covered by this report.
The registrant has not granted any waivers from any provisions of the code of ethics during the period covered by this report.
A copy of the registrant’s code of ethics that applies to the registrant’s principal executive officer and principal financial officer is filed herewith.
Item 3. Audit Committee Financial Expert.
The registrant’s Board of Trustees has determined that there is at least one audit committee financial expert serving on its audit committee. Leonard M. Rush is the “audit committee financial expert” and is considered to be “independent” as each term is defined in Item 3 of Form N-CSR.
Item 4. Principal Accountant Fees and Services.
The registrant has engaged its principal accountant to perform audit services, audit-related services, tax services and other services during the past fiscal year. “Audit services” refer to performing an audit of the registrant's annual financial statements or services that are normally provided by the accountant in connection with statutory and regulatory filings or engagements for the past fiscal year. “Audit-related services” refer to the assurance and related services by the principal accountant that are reasonably related to the performance of the audit. “Tax services” refer to professional services rendered by the principal accountant for tax compliance, tax advice, and tax planning; including reviewing the Fund’s tax returns and distribution calculations. There were no “other services” provided by the principal accountant. For the fiscal years ended August 31, 2020 and August 31, 2019, the Fund’s principal accountant was Cohen & Company, Ltd. The following table details the aggregate fees billed or expected to be billed for each of the last fiscal years for audit fees, audit-related fees, tax fees and other fees by the principal accountant.
| | FYE 8/31/2020 | FYE 8/31/2019 |
Audit Fees | $44,000 | $45,500 |
Audit-Related Fees | $0 | $0 |
Tax Fees | $13,000 | $13,000 |
All Other Fees | $0 | $0 |
The audit committee has adopted pre-approval policies and procedures that require the audit committee to pre‑approve all audit and non‑audit services of the registrant, including services provided to any entity affiliated with the registrant.
The percentage of fees billed by Cohen & Company applicable to non-audit services pursuant to waiver of pre-approval requirement was as follows:
| | FYE 8/31/2020 | FYE 8/31/2019 |
Audit-Related Fees | 0% | 0% |
Tax Fees | 0% | 0% |
All Other Fees | 0% | 0% |
All of the principal accountant’s hours spent on auditing the registrant’s financial statements were attributed to work performed by full‑time permanent employees of the principal accountant.
The following table indicates the non-audit fees billed or expected to be billed by the registrant’s accountant for services to the registrant and to the registrant’s investment adviser (and any other controlling entity, etc.—not sub-adviser) for the last two years. The audit committee of the board of trustees/directors has considered whether the provision of non-audit services that were rendered to the registrant's investment adviser is compatible with maintaining the principal accountant's independence and has concluded that the provision of such non-audit services by the accountant has not compromised the accountant’s independence.
Non-Audit Related Fees | FYE 8/31/2020 | FYE 8/31/2019 |
Registrant | $0 | $0 |
Registrant’s Investment Adviser | $0 | $0 |
Item 5. Audit Committee of Listed Registrants.
Not applicable to registrants who are not listed issuers (as defined in Rule 10A-3 under the Securities Exchange Act of 1934).
Item 6. Investments.
(a) Schedule of Investments is included as part of the report to shareholders filed under Item 1 of this Form.
(b) Not applicable.
Item 7. Disclosure of Proxy Voting Policies and Procedures for Closed-End Management Investment Companies.
Not applicable to open-end investment companies.
Item 8. Portfolio Managers of Closed-End Management Investment Companies.
Not applicable to open-end investment companies.
Item 9. Purchases of Equity Securities by Closed‑End Management Investment Company and Affiliated Purchasers.
Not applicable to open-end investment companies.
Item 10. Submission of Matters to a Vote of Security Holders.
There have been no material changes to the procedures by which shareholders may recommend nominees to the Registrant’s Board of Trustees.
Item 11. Controls and Procedures.
(a) | The Registrant’s President and Treasurer have reviewed the Registrant's disclosure controls and procedures (as defined in Rule 30a-3(c) under the Investment Company Act of 1940 (the “Act”)) as of a date within 90 days of the filing of this report, as required by Rule 30a-3(b) under the Act and Rules 13a-15(b) or 15d‑15(b) under the Securities Exchange Act of 1934. Based on their review, such officers have concluded that the disclosure controls and procedures are effective in ensuring that information required to be disclosed in this report is appropriately recorded, processed, summarized and reported and made known to them by others within the Registrant and by the Registrant’s service provider. |
(b) | There were no significant changes in the Registrant's internal control over financial reporting (as defined in Rule 30a-3(d) under the Act) that occurred during the period covered by this report that has materially affected, or is reasonably likely to materially affect, the Registrant's internal control over financial reporting. |
Item 12. Disclosure of Securities Lending Activities for Closed-End Management Investment Companies.
Not applicable to open-end investment companies.
Item 13. Exhibits.
(3) Any written solicitation to purchase securities under Rule 23c‑1 under the Act sent or given during the period covered by the report by or on behalf of the registrant to 10 or more persons. Not applicable to open-end investment companies.
(4) Change in the registrant’s independent public accountant. There was no change in the registrant’s independent public accountant for the period covered by this report.
SIGNATURES
Pursuant to the requirements of the Securities Exchange Act of 1934 and the Investment Company Act of 1940, the registrant has duly caused this report to be signed on its behalf by the undersigned, thereunto duly authorized.
(Registrant) Managed Portfolio Series
By (Signature and Title)* /s/Brian R. Wiedmeyer
Brian R. Wiedmeyer, President
Date November 3, 2020
Pursuant to the requirements of the Securities Exchange Act of 1934 and the Investment Company Act of 1940, this report has been signed below by the following persons on behalf of the registrant and in the capacities and on the dates indicated.
By (Signature and Title)* /s/Brian R. Wiedmeyer
Brian R. Wiedmeyer, President
Date November 3, 2020
By (Signature and Title)* /s/Benjamin J. Eirich
Benjamin J. Eirich, Treasurer
Date
November 3, 2020
* Print the name and title of each signing officer under his or her signature.