UNITED STATES
SECURITIES AND EXCHANGE COMMISSION
Washington, D.C. 20549
SECURITIES AND EXCHANGE COMMISSION
Washington, D.C. 20549
FORM N-CSR
CERTIFIED SHAREHOLDER REPORT OF REGISTERED
MANAGEMENT INVESTMENT COMPANIES
Investment Company Act file number 811-22525
Managed Portfolio Series
(Exact name of registrant as specified in charter)
(Exact name of registrant as specified in charter)
615 East Michigan Street
Milwaukee, WI 53202
(Address of principal executive offices) (Zip code)
(Address of principal executive offices) (Zip code)
Brian R. Wiedmeyer, President
Managed Portfolio Series
c/o U.S. Bancorp Fund Services, LLC
777 East Wisconsin Ave, 5th Fl
Milwaukee, WI 53202
(Name and address of agent for service)
(Name and address of agent for service)
(414) 765-6844
Registrant's telephone number, including area code
Date of fiscal year end: March 31, 2021
Date of reporting period: September 30, 2020
Item 1. Reports to Stockholders.
Great Lakes Bond Fund
Institutional Class Shares – GLBNX
Great Lakes Disciplined Equity Fund
Institutional Class Shares – GLDNX
Great Lakes Large Cap Value Fund
Institutional Class Shares – GLLIX
Great Lakes Small Cap Opportunity Fund
Investor Class Shares – GLSCX
Institutional Class Shares – GLSIX
Semi-Annual Report
September 30, 2020
1-855-278-2020
www.glafunds.com
Distributed by Quasar Distributors, LLC
Member FINRA
Beginning on January 1, 2021, as permitted by regulations adopted by the Securities and Exchange Commission (the “SEC”), paper copies of the Funds' shareholder reports will no longer be sent by mail, unless you specifically request paper copies of the reports from the Funds (defined herein) or from your financial intermediary, such as a broker-dealer or bank. Instead, the reports will be made available on the Funds' website (www.glafunds.com), and you will be notified by mail each time a report is posted and provided with a website link to access the report.
If you already elected to receive shareholder reports electronically, you will not be affected by this change and you need not take any action. You may elect to receive shareholder reports and other communications from the Funds electronically by contacting your financial intermediary (such as a broker-dealer or bank) or, if you are a direct investor, by calling 855-278-2020 or by sending an e-mail request to funds@glafunds.com.
You may elect to receive all future reports in paper free of charge. If you invest through a financial intermediary, you can contact your financial intermediary to request that you continue to receive paper copies of your shareholder reports. If you invest directly with the Funds, you can call 855-278-2020 or send an e-mail request to funds@glafunds.com to let the Funds know you wish to continue receiving paper copies of your shareholder reports. Your election to receive reports in paper will apply to all funds held in your account if you invest through your financial intermediary.
Great Lakes Bond Fund
October 30, 2020
Dear Shareholders,
I. INVESTMENT RESULTS
For the six months ended September 30th of 2020, your Great Lakes Bond Fund returned the following:
Share Class | 6 Months ended 9/30/20 | |
| Institutional Class | 5.85% | |
| Bloomberg Barclays U.S. Aggregate Bond Index | 3.53% |
During the six months ended September 30, 2020, the global pandemic, in the form of COVID-19, was the center of attention for the fed and global central banks. Unprecedented stimuli were introduced in an effort to keep the global economy from locking up. Interest rates plummeted as the fed opened the flood gates of liquidity, back-stopping everything from mortgages to corporate and municipal bonds, to municipalities and state governments and private businesses through an array of grants and loans. This move by the government led to a total reversal of the illiquid markets we saw in March, so much that Fund shares rose 57 cents to a high of $10.11 in early August, before settling back down a bit at the end of the period.
II. ATTRIBUTION
The Fund outperformed its benchmark significantly on a total return basis. The yield on the Fund and the income paid out to shareholders was very competitive with the benchmark, but owing to a much shorter average duration and maturity, the Fund was better insulated from the downward movement in bond prices that dropped in price in the volatile market environment near the end of the period. This is a reversal of what occurred in the previous six-month period.
III. OUTLOOK
We expect more muted volatility over the next few quarters in the form of price moves up and down as the market continues to dissect and digest the constant flow of data and chatter from the presidential election and more importantly, the global pandemic. We expect the Fed to continue to stimulate the economy with whatever means necessary. With regard to structure of the Fund, we have added some longer maturity assets in an attempt to move all-in duration closer, but still less than that of the benchmark. Although our outlook is for a steeper yield curve as the economy continues to recover, and the possibility of wider corporate spreads, the specter of increased volatility is still very real. We believe a shorter duration and average maturity, and continuing to emphasize yield from lower rated, shorter maturity bonds will continue to insulate the Fund shares from some of this expected volatility.
Patrick Morrissey
Past performance is not a guarantee of future results.
Investing involves risk including loss of principal. In addition to the normal risks associated with investing, international investments may involve risk of capital loss from unfavorable fluctuation in currency values, from differences in generally accepted accounting principles or from economic or political instability in other nations. The Funds may invest in ETFs. The market price of the shares of an ETF will fluctuate based on changes in the net asset value as well as changes in the supply and demand of its shares in the secondary market. ETFs have management and other expenses. The Fund will bear it’s pro rata portion of these expenses and therefore the Fund’s expenses may be higher than if it invested directly in securities.
1
Great Lakes Bond Fund
The opinions expressed are those of the fund managers and are not intended to be a forecast of future events, a guarantee of future results, nor investment advice.
Fund holdings and sector allocations are subject to change at any time and should not be considered a recommendation to buy or sell any security. Please refer to the schedules of investments for complete holdings information.
It is not possible to invest directly in an index.
Definitions:
The Bloomberg Barclays U.S. Aggregate Bond Index is an unmanaged, intermediate term index and a market capitalization-weighted index, where securities in the index are weighted according to the market size of each bond type and composed of securities from the Bloomberg Barclays Government/Corporate Bond Index, Mortgage-Backed Securities Index and the Asset-Backed Securities Index. Total return comprises price appreciation/depreciation and income as a percentage of the original investment.
Basis point (bp) is a unit equal to 1/100th of 1% and is used to denote the change in a financial instrument.
Duration is a measure of the sensitivity of the price of a bond or other debt instrument to a change in interest rates. Duration measures how long it takes, in years, for an investor to be repaid the bond’s price by the bond’s total cash flows.
A corporate spread is the difference in yield between a U.S. Treasury bond and a debt security with the same maturity but of lesser quality. Credit spreads between U.S. Treasuries and other bond issuances are measured in basis points, with a 1% difference in yield equal to a spread of 100 basis points.
Average maturity is the average time before bonds or other fixed-income investments mature. The longer the average maturity, the greater the risk of rising interest rates.
2
Great Lakes Bond Fund
Value of $10,000 Investment (Unaudited)
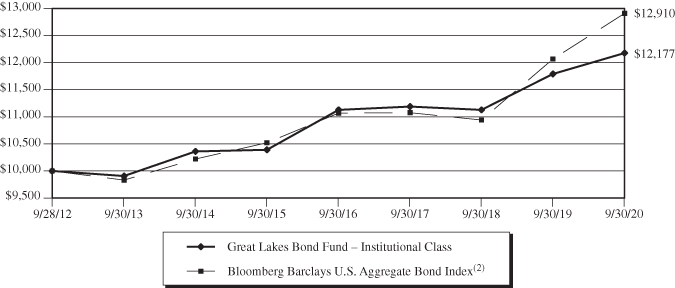
The chart assumes an initial investment of $10,000. Performance reflects waivers of fee and operating expenses in effect. In the absence of such waivers, total return would be reduced. Performance data quoted represents past performance and does not guarantee future results. Investment returns and principal value will fluctuate, and when sold, may be worth more or less than their original cost. Performance current to the most recent month-end may be lower or higher than the performance quoted and can be obtained by calling 855-278-2020. Performance assumes the reinvestment of capital gains and income distributions. The performance does not reflect the deduction of taxes that a shareholder would pay on Fund distributions or the redemption of Fund shares.
Annualized Rates of Return as of September 30, 2020
1-Year | 3-Year | 5-Year | Since Inception(1) | |
| Institutional Class | 3.27% | 2.86% | 3.22% | 2.49% |
Bloomberg Barclays U.S. Aggregate Bond Index(2) | 6.98% | 5.24% | 4.18% | 3.24% |
| (1) | Inception date of the Fund was September 28, 2012. |
| (2) | The Bloomberg Barclays U.S. Aggregate Bond Index is an intermediate term index and a market capitalization-weighted index, where securities in the index are weighted according to the market size of each bond type. This index can not be invested in directly. |
The following is expense information for the Great Lakes Bond Fund as disclosed in the Fund’s most recent prospectus dated July 29, 2020:
Gross Expenses: 0.57%; Net Expenses: 0.57%.
3
Great Lakes Bond Fund
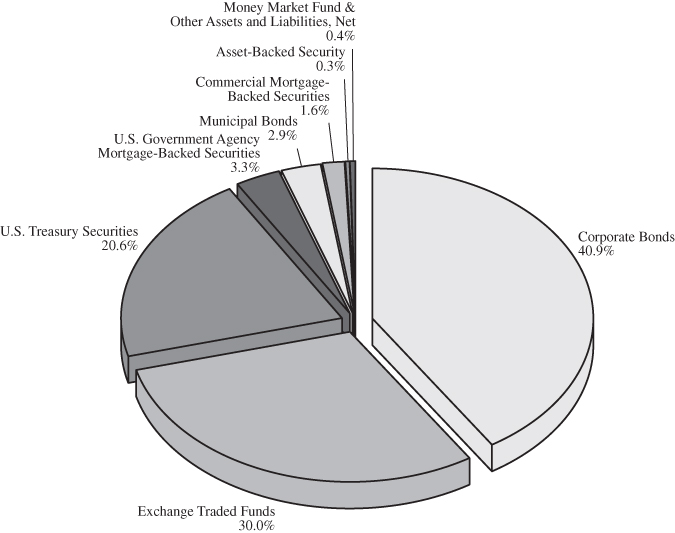
Allocation of Portfolio Net Assets (Unaudited)
September 30, 2020(1)
(% of Net Assets)
Top 10 Holdings (Unaudited)
September 30, 2020(1)
(% of Net Assets)
iShares Core U.S. Aggregate Bond Fund | 9.9 | % | |||
U.S. Treasury Note, 2.000%, 08/15/2025 | 7.9 | % | |||
iShares MBS Fund | 7.0 | % | |||
iShares 1-5 Year Investment Grade Corporate Bond Fund | 6.9 | % | |||
iShares iBoxx $ High Yield Corporate Bond Fund | 6.1 | % | |||
U.S. Treasury Note, 1.125%, 05/15/2040 | 5.4 | % | |||
U.S. Treasury Note, 0.625%, 05/15/2030 | 5.2 | % | |||
Morgan Stanley, 1.463%, 05/08/2024 | 3.7 | % | |||
Ford Motor Credit Co., LLC, 5.750%, 02/01/2021 | 3.3 | % | |||
Kinder Morgan, Inc., 5.300%, 12/01/2034 | 2.5 | % |
| (1) | Fund holdings and sector allocations are subject to change at any time and are not recommendations to buy or sell any security. |
4
Great Lakes Disciplined Equity Fund
November 2, 2020
Dear Shareholders,
I. INVESTMENT RESULTS
For the six months ended September 30 of 2020, your Great Lakes Disciplined Equity Fund returned the following:
Share Class | 6 Months ended 9/30/20 | |
| Institutional Class | 32.27% | |
| S&P 500 Index | 31.31% |
During the six months ended September 30, 2020, U.S. equities moved markedly higher across the market cap spectrum. Equities roared back in the second quarter and continued to advance in the third quarter despite mixed signals with respect to ongoing coronavirus flare-ups, progress on a vaccine, additional rounds of government stimulus, and growing socio-political angst. Perhaps we’re climbing the proverbial wall of worry, perhaps the unprecedented fiscal and monetary policy from this spring is the impetus... or more likely both.
In this six-month period, growth indices continued their relative outperformance versus value counterparts across the capitalization spectrum. The Russell 1000® Growth Index returning 44.7% and its value counterpart returning 20.7% for the six-month period. Growth stocks have a substantial lead over value stocks for 3, 5, and 10-year periods.
Within the S&P 500®, the Energy and Utilities sectors lagged the market as the only two sectors posting less than double digit returns for the period. Leading sector returns were the Consumer Discretionary and Technology sectors posting gains of 52.87% and 46.13% respectively.
II. ATTRIBUTION
In total, sector positioning added just over 200 basis points (bps) to active return:
| • | Underweighting the Utilities sector added 51 bps, as the sector underperformed the benchmark by a whopping 20% during this period. |
| • | Underweighting the HealthCare sector added 60 bps, as the sector underperformed the S&P 500 Index by 11%. |
Stock selection within the respective sectors added 104 bps to active return:
| • | Stock selection within the Consumer Discretionary and Industrials sector(s) was poor. | |
| o | Teledyne Technologies (TDY, -0.46%) beat consensus but lowered forward guidance on a sales decline from lower demand from its customers in aerospace and oil segments in the current environment. | |
| o | Tiffany & Co (TIFF, -0.33%) posted an earnings beat in a tough environment for luxury brands, however the scheduled acquisition by LVMH was called off in the period. | |
| • | Stock selection was best within the HealthCare and Technology sector(s). | |
| o | Intel Corporation (INTC, 0.55%), which we avoided due to an unfavorable rating, declined sharply after announcing the possibility of outsourcing its manufacturing. | |
| o | Exact Sciences Corp (EXAS, 0.31%) had several positive news events related to FDA approval for its COVID test as well as very positive news on a cancer screening blood test equating it to a “liquid biopsy”. | |
5
Great Lakes Disciplined Equity Fund
III. OUTLOOK
Following a quantitative investment discipline allows us to bypass emotion in the investment process. The world’s greatest detective, Sherlock Holmes, knew:
“The emotional qualities are antagonistic to clear reasoning.”
–Sherlock, The Sign of Four
This does not, however, mean we don’t acutely feel the tumult of the equity market, the political to and fro, the suffering caused by the COVID-19-induced economic shutdown, or the social unrest in our great country. And judging by the exceptional noise in the U.S. equity market – noise often below the surface and unobserved to those who follow the headline indices – investors are clearly not immune to wild swings of emotion. Our discipline allows us to have an upset stomach mid-day, but execute by process. Onto the Economic Review:
| • | Profits are down, volatility is up, and doubts about the path of recovery are manifest. |
| • | To combat this, the Fed and Treasury are maintaining easy conditions, which have resulted in positive economic surprises since May. Will positive surprises hold for the rest of the year? |
| • | Despite the easy conditions, underlying demand weakness has resulted in well-contained prices. |
| • | This demand weakness is reflected in soft commodity prices, with the exception of gold. Marginal growth in doubt regarding the future of the Dollar as the reserve currency often results in rising gold prices. |
| • | Why the marginal increase in doubt? Money Supply is up 23% year over year, and Debt to GDP ratio has soared to 136%. |
| • | The economy shed an unprecedented number of jobs this spring. To date, we’ve recovered about half of these positions. |
| • | Despite the job losses, rate cuts from last fall plus an additional leg down this spring have led to an incredibly robust housing market. |
| • | Stable, strong house prices combined with a solid rebound in equity markets have left asset-heavy households better off, and have abated the slide in consumer confidence. |
| • | It’s also true that those whose household wealth is driven primarily by income are suffering inordinately – thus the “k-shaped recovery” description is accurate. |
| • | Retail sales have rebounded nicely, with a shift to online shopping having accelerated. |
| • | Inventory to Sales ratio is very low, and a precursor to a demand shock at some point. ISM Manufacturing and Non-manufacturing indices are indicating expansions ahead – so poor Industrial Production numbers may fade in the months ahead. |
In terms of where this leaves equity markets, the sole truth is poor visibility. Stocks remain very expensive relative to fundamentals, but the duration of the poor Earnings Per Share (EPS) numbers is an unknown. A high Price-to-Earnings (P/E) ratio based on a non-recurring event means little. We can say that stocks are rich at this point – but it’s hard to know just how expensive. One thing we do know is stocks are certainly more attractive than bonds, sporting a 1-3% yield premium – despite their low earnings yield.
6
Great Lakes Disciplined Equity Fund
We’ll continue to follow our systematic approach rather than guess what may or may not lay ahead. To bring it back home, we evoke one more quote from Mr. Holmes in The Sign of Four:
“I never guess. It is a shocking habit — destructive to the logical faculty.”
Positioning:
The Large Cap models continue to show dampened risk aversion. Positive biases include Momentum, Growth and Size (market cap). Negative biases include Value, Earnings Yield, Dividend Yield, and Volatility. The growth bias can also be seen in the style box breakdown: max-cap and large-cap growth stocks are in favor, large-cap value stocks are again solidly out of favor.
Technology and Health Care stocks remain most in-favor within our models; Health Care is paced by Medical Services and Biotech, while Technology is led by Computer Software and Internet industries. Consumer Staples, Industrials, and Materials are all modestly out of favor.
From a return-driver perspective, we again see large changes from 3 months ago. Volatility is once again a negative tilt. Quality has fallen slightly negative on the whole, and most Valuation metrics remain extremely out of favor. Growth characteristics such as 5-year Sales and Earnings Growth are in favor, and our positive momentum tilts – both short and longer-term- have strengthened as well.
Jon Quigley, CFA
Past performance is not a guarantee of future results.
Investing involves risk including loss of principal. In addition to the normal risks associated with investing, international investments may involve risk of capital loss from unfavorable fluctuation in currency values, from differences in generally accepted accounting principles or from economic or political instability in other nations. The Funds may invest in ETFs. The market price of the shares of an ETF will fluctuate based on changes in the net asset value as well as changes in the supply and demand of its shares in the secondary market. ETFs have management and other expenses. The Fund will bear it’s pro rata portion of these expenses and therefore the Fund’s expenses may be higher than if it invested directly in securities.
The opinions expressed are those of the fund managers and are not intended to be a forecast of future events, a guarantee of future results, nor investment advice.
Growth stocks typically are more volatile than value stocks; however, value stocks have a lower expected growth rate in earnings and sales.
Fund holdings and sector allocations are subject to change at any time and should not be considered a recommendation to buy or sell any security. Please refer to the schedules of investments for complete holdings information.
Definitions:
Beta measures the sensitivity of rates of return on a fund to general market movements.
Basis point (bp) is a unit equal to 1/100th of 1% and is used to denote the change in a financial instrument.
Earnings Per Share (EPS) estimates are calculated as a company’s profit (net income, or earnings) divided by the outstanding shares of its common stock. The resulting number serves as an indicator of a company’s profitability.
Price-to-Earnings (P/E) ratio is the ratio for valuing a company that measures its current share price relative to its per-share earnings.
7
Great Lakes Disciplined Equity Fund
Russell 2000® Index, a subset of the Russell 3000® Index representing approximately 10% of the total market capitalization of that index, and includes approximately 2,000 of the smallest securities based on a combination of their market cap and current index membership.
The S&P 500® Index is a broad based unmanaged index of 500 stocks, which is widely recognized as representative of the equity market in general.
The S&P 100® is a sub-set of the S&P 500®, measures the performance of large cap companies in the United States. The Index comprises 100 major, blue chip companies across multiple industry groups. Individual stock options are listed for each index constituent.
The Russell Top 200® Index measures the performance of the largest cap segment of the U.S. equity universe. The Russell Top 200® Index is a subset of the Russell 3000® Index. It includes approximately 200 of the largest securities based on a combination of their market cap and current index membership and represents approximately 68% of the U.S. market.
The Russell Top 200® Growth Index measures the performance of the especially large cap segment of the U.S. equity universe represented by stocks in the largest 200 by market cap. It includes Russell Top 200® Index companies with higher growth earning potential as defined by Russell’s leading style methodology. The companies also are members of the Russell 1000® Growth Index.
The Russell 2000® Value Index measures the performance of small-cap value segment of the U.S. equity universe. It includes those Russell 2000® companies with lower price-to-book ratios and lower forecasted growth values.
The Russell 1000® Growth Index measures the performance of the large-cap growth segment of the U.S. equity universe. It includes those Russell 1000® Index companies with higher price-to-book ratios and higher forecasted growth values.
It is not possible to invest directly in an index.
8
Great Lakes Disciplined Equity Fund
Value of $10,000 Investment (Unaudited)

The chart assumes an initial investment of $10,000. Performance reflects waivers of fee and operating expenses in effect. In the absence of such waivers, total return would be reduced. Performance data quoted represents past performance and does not guarantee future results. Investment returns and principal value will fluctuate, and when sold, may be worth more or less than their original cost. Performance current to the most recent month-end may be lower or higher than the performance quoted and can be obtained by calling 855-278-2020. Performance assumes the reinvestment of capital gains and income distributions. The performance does not reflect the deduction of taxes that a shareholder would pay on Fund distributions or the redemption of Fund shares.
Annualized Rates of Return as of September 30, 2020
1-Year | 3-Year | 5-Year | 10-Year | Since Inception(1) | |
| Institutional Class | 17.54% | 12.58% | 13.14% | 13.37% | 13.69% |
S&P 500 Index(2) | 15.15% | 12.28% | 14.15% | 13.74% | 14.21% |
| (1) | Inception date of the Fund was June 1, 2009. |
| (2) | The S&P 500 Index is a broad based unmanaged index of 500 stocks, which is widely recognized as representative of the equity market in general. This index can not be invested in directly. |
The following is expense information for the Great Lakes Disciplined Equity Fund as disclosed in the Fund’s most recent prospectus dated July 29, 2020:
Gross Expenses: 0.98%; Net Expenses: 0.85%. Great Lakes Advisors, LLC (the “Adviser” or “Great Lakes”) has contractually agreed to waive its management fees and pay Fund expenses in order to ensure that Total Annual Fund Operating Expenses (excluding acquired fund fees and expenses (“AFFE”), leverage/borrowing interest, interest expense, dividends paid on short sales, taxes, brokerage commissions and other transactional expenses, and extraordinary expenses) do not exceed 0.85% of the average daily net assets of the Fund. Fees waived and expenses paid by the Adviser may be recouped by the Adviser for a period of 36 months following the month during which such fee waiver and expense payment was made if such recoupment can be achieved without exceeding the expense limit in effect at the time the fee waiver and expense payment occurred and at the time of recoupment. The Operating Expense Limitation Agreement is indefinite in term and cannot be terminated through at least July 29, 2021. Thereafter, the agreement may be terminated at any time upon 60 days’ written notice by the Trust’s Board or the Adviser, with the consent of the Board.
9
Great Lakes Disciplined Equity Fund
Allocation of Portfolio Net Assets (Unaudited)
September 30, 2020(1)
(% of Net Assets)

Top 10 Equity Holdings (Unaudited)
September 30, 2020(1)
(% of Net Assets)
Microsoft Corp. | 8.2 | % | |||
Apple, Inc. | 4.7 | % | |||
Amazon.com, Inc. | 3.7 | % | |||
Union Pacific Corp. | 2.9 | % | |||
Alphabet, Inc. – Class C | 2.8 | % | |||
Adobe, Inc. | 2.8 | % | |||
Netflix, Inc. | 2.6 | % | |||
Texas Instruments, Inc. | 2.5 | % | |||
Air Products & Chemicals, Inc. | 2.4 | % | |||
Expedia Group, Inc. | 2.4 | % |
| (1) | Fund holdings and sector allocations are subject to change at any time and are not recommendations to buy or sell any security. |
10
Great Lakes Large Cap Value Fund
November 11, 2020
Dear Shareholders,
I. INVESTMENT RESULTS
After a sudden sharp drop early in 2020 following two exogenous shocks to the world economy, the S&P 500 index turned around and jumped 30% over the April-September six-month period. Economic rebound after the deep fall, aggressive monetary policy accommodation, large fiscal stimulus programs, along with an easing of restrictions and opening of activities through the summer as the virus spread slowed, all underlie the equity market recovery. Very low interest rates, coupled with low inflation, have also been important for equities. Equity market movements have been volatile in 2020, while value style benchmarks have trailed the S&P 500 by one of the largest margins (over ten percentage points) ever.
Share Class | 6 Months ended 9/30/20 | |
| Institutional Class | 19.36% | |
| Russell 1000 Value Index | 20.68% |
II. ATTRIBUTION
Results in broad market areas were mixed over the period. Several areas more sensitive to the economic pace-including big-ticket consumer goods and services, consumer lending (Discover Financial, up 62.0% in price), industrial manufacturing and services (truck engine maker Cummins, up 56.0%), materials (DuPont de Nemours, up 62.7%) and entertainment leader Disney (up 35.5%)- led the strategy. Overall, 11 positions in five broad areas rose over 30% in price during the period.
But energy, also more sensitive to economic progress, limited the strategy, along with three health care positions (subject to changing regulation), semiconductor leader Intel (down 4.3% in price as next-generation products have been delayed), General Electric (down 21.5% as commercial aviation travel collapsed during the pandemic) and Citigroup (up 2.4% as regulators sought risk management improvement). Overall, ten positions in six broad areas rose less than 8% or declined during the six months to limit results.
III. OUTLOOK
Economic activity and investment markets remain volatile and highly uncertain during the global struggle with the pandemic. Economies around the world at first snapped back after the initial shock, but now appear to have slowed, a movement exacerbated by a second wave of the virus spread. Going over other variables influencing equity markets, corporate profits may rise in 2021. Monetary policy will remain accommodative. Importantly, low interest rates and low inflation continue to provide strong support to equities.
Edward J. Calkins, CFA
Senior Portfolio Manager
Fund Shareholder
Definitions:
The S&P 500 Index is a broad based index of 500 stocks, which is widely recognized as representative of the equity market in general.
The Russell 1000® Value Index measures the performance of those Russell 1000® Index companies with lower price-to-book ratios and lower forecasted growth rates.
11
Great Lakes Large Cap Value Fund
One cannot invest directly in an index.
Past performance does not guarantee future results.
Diversification does not assure a profit nor protect against loss in a declining market.
Opinions expressed are subject to change at any time, are not guaranteed and should not be considered investment advice.
Fund holdings and sector allocations are subject to change and are not recommendations to buy or sell any security. For a complete list of fund holdings, please see the Schedule of Investments included in this report.
Mutual fund investing involves risk. Principal loss is possible. The Fund’s value investments are subject to the risk that their intrinsic values may not be recognized by the broad market or that their prices may decline. Investing in ETFs are subject to additional risks that do not apply to conventional mutual funds, including the risks that the market price of the shares may trade at a discount to its net asset value (“NAV”), an active secondary trading market may not develop or be maintained, or trading may be halted by the exchange in which they trade, which may impact a Funds ability to sell its shares. The Fund invests in foreign securities which involve greater volatility and political, economic and currency risks and differences in accounting methods. These risks are greater in emerging markets.
12
Great Lakes Large Cap Value Fund
Value of $10,000 Investment (Unaudited)

The chart assumes an initial investment of $10,000. Performance reflects waivers of fee and operating expenses in effect. In the absence of such waivers, total return would be reduced. Performance data quoted represents past performance and does not guarantee future results. Investment returns and principal value will fluctuate, and when sold, may be worth more or less than their original cost. Performance current to the most recent month-end may be lower or higher than the performance quoted and can be obtained by calling 855-278-2020. Performance assumes the reinvestment of capital gains and income distributions. The performance does not reflect the deduction of taxes that a shareholder would pay on Fund distributions or the redemption of Fund shares.
Annualized Rates of Return as of September 30, 2020
1-Year | 3-Year | 5-Year | Since Inception(1) | |
| Institutional Class | -4.74% | 0.38% | 7.01% | 8.68% |
Russell 1000 Value Index(2) | -5.03% | 2.63% | 7.66% | 9.11% |
| (1) | Inception date of the Fund was September 28, 2012. |
| (2) | The Russell 1000 Value Index measures the performance of the large-cap value segment of the U.S. equity universe. It includes those Russell 1000 Index companies with lower price-to-book ratios and lower expected growth values. This index can not be invested in directly. |
The following is expense information for the Great Lakes Large Cap Value Fund as disclosed in the Fund’s most recent prospectus dated July 29, 2020:
Gross Expenses: 0.93%; Net Expenses: 0.85%. Great Lakes Advisors, LLC (the “Adviser” or “Great Lakes”) has contractually agreed to waive its management fees and pay Fund expenses in order to ensure that Total Annual Fund Operating Expenses (excluding acquired fund fees and expenses (“AFFE”), leverage/borrowing interest, interest expense, dividends paid on short sales, taxes, brokerage commissions and other transactional expenses, and extraordinary expenses) do not exceed 0.85% of the average daily net assets of the Fund. Fees waived and expenses paid by the Adviser may be recouped by the Adviser for a period of 36 months following the month during which such fee waiver and expense payment was made if such recoupment can be achieved without exceeding the expense limit in effect at the time the fee waiver and expense payment occurred and at the time of recoupment. The Operating Expense Limitation Agreement is indefinite in term and cannot be terminated through at least July 29, 2021. Thereafter, the agreement may be terminated at any time upon 60 days’ written notice by the Trust’s Board or the Adviser, with the consent of the Board.
13
Great Lakes Large Cap Value Fund
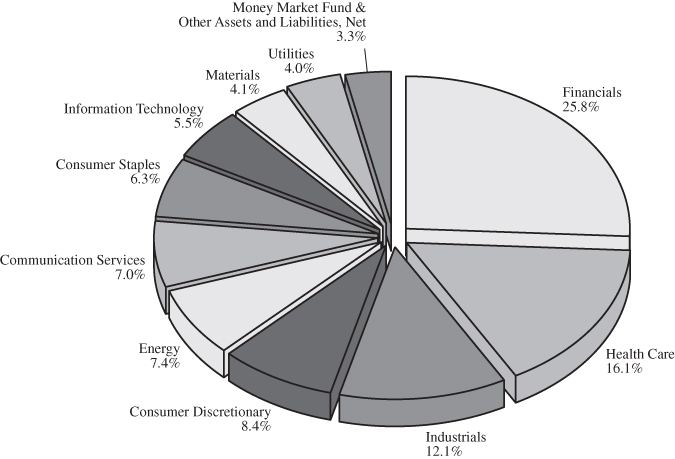
Allocation of Portfolio Net Assets (Unaudited)
September 30, 2020(1)
(% of Net Assets)
Top 10 Equity Holdings (Unaudited)
September 30, 2020(1)
(% of Net Assets)
Chevron Corp. | 5.5 | % | |||
BorgWarner, Inc. | 4.1 | % | |||
Comcast Corp. – Class A | 4.0 | % | |||
Philip Morris International, Inc. | 3.8 | % | |||
Berkshire Hathaway, Inc. – Class B | 3.5 | % | |||
PNC Financial Services Group, Inc. | 3.1 | % | |||
Public Service Enterprise Group, Inc. | 3.0 | % | |||
RenaissanceRe Holdings, Ltd. | 3.0 | % | |||
Oracle Corp. | 3.0 | % | |||
Merck & Co., Inc. | 2.9 | % |
(1) | Fund holdings and sector allocations are subject to change at any time and are not recommendations to buy or sell any security. |
14
Great Lakes Small Cap Opportunity Fund
October 30, 2020
Dear Shareholders,
I. INVESTMENT RESULTS
The Great Lakes Small Cap Opportunity Institutional Class (GLSIX) increased 20.47% for the six months ended September 30th, 2020. This lagged the Russell 2000 index return, which was up 31.60%.
Share Class | 6 Months ended 9/30/20 | |
| Institutional Class | 20.47% | |
| Russell 2000 Index | 31.60% |
The equity markets recovered sharply from the mid-March lows. The Russell 2000 index experienced one of its best quarters since the inception of the index. The rally was sparked by continued support from the U.S. Federal Reserve and the record fiscal stimulus from government.
What was unexpected was the continuation of growth stocks’ outperformance versus value stocks in the recovery period. Typically, coming out of a recession, value stocks outperform. However, this has not been a normal economic cycles. The pandemic conditions continue to negatively impact value stocks and benefit growth stocks. As a result, value is experiencing its longest drawdown, and the gap between value and growth is the widest it has ever been.
Our Fund is value-oriented, and as a result, it has been very tough keeping pace with the R2000 index which has morphed into growth index over the years.
We understand the narratives surrounding the exhilarating growth of technology and healthcare industries due to the COVID-19 situation. However, at this stage, it appears to us that there is absolutely no thinking about growth at the right price. Valuations have been thrown out the window. Investors are not carefully analyzing and valuing companies; instead they are buying higher with the hope of selling it higher. This is not investing, it’s simply speculation.
To understand the diversion of our performance versus the benchmark, it might help to understand the specifics of our valuation process. We estimate our companies’ normalized free cash flows (FCF) over a three to five year timeframe, and then discount those FCF to come up with what we believe is the intrinsic value of a company. We do not make investment decisions based on short-term noise. Instead, we take a long-term view, looking to take advantage of near-term uncertainty by investing in high-quality businesses at attractive prices.
Today, in a period of high uncertainty, the market has become even more myopic than we would have expected. The market has dramatically sold off our companies whose value lays in the gradual recovery from COVID impacts, and it has instead piled into companies with good growth “stories”, momentum stocks, or companies that may only temporarily benefit from short-term changes in behavior or government stimulus. We are reminded of the adage “be fearful when others are greedy, and be greedy when others are fearful.” The market has been far too greedy with respect to the near-term beneficiaries of COVID, and it has been far too fearful of companies that will only temporarily suffer.
Looking forward, we remain optimistic about the future prospects of our portfolio. We seek to outperform, largely due to owning discounted names, but also by avoiding the overheated parts of the market. Eventually, in our opinion, the pendulum will swing back to the value investing camp, and when it does, that should provide us with a major tailwind. In the meantime, we will remain focused on staying the course and maintaining a long-term focus.
15
Great Lakes Small Cap Opportunity Fund
II. ATTRIBUTION
For the six months ended September 20, 2020, the Fund lagged the Russell 2000 index by nearly 1,050 basis points. The Fund’s underperformance relative to the index was primarily driven by holdings in three sectors: Consumer Discretionary, Industrials, and Technology. On a positive note, we outperformed in Financials.
The Consumer Discretionary was the best performing sector in the Russell 2000 index, advancing 79.2%. Our stocks were up nicely, but lagged the group by 360 basis points due to weak stock performance from Adtalem and Nordstrom. Also, the Fund’s zero exposure to the hotel, restaurant, and leisure industries – which were up 108% – negatively impacted relative returns. Adtalem, a for-profit education company, declined 20% after announcing the acquisition of Walden University from Laureate, which doubled the size of the company. We were surprised by the size and type of business Adtalem acquired. Nordstrom’s sales have been negatively impacted by the “stay at home/work from home” theme.
��
The Industrial sector cost the Fund 237 basis points of alpha. Crane, Healthcare Services Group, and MSC Industrials were our biggest relative losers. These three companies are good examples of the myopic nature of the market today. Crane, Healthcare Services Group, and MSC have solid long-term track records of success and leadership positions in the markets they serve. In normal times, these names would trade at a premium to the market, but given these are not normal times and they all have some near-term challenges as a result of COVID-19, the stocks are trading at a steep discount to market. We do not believe any of these near-term challenges will persist beyond the next 3-5 years. Therefore, we expect higher earnings and multiples for these companies over time.
The Technology sector continues to benefit expensive stocks that are posting revenue growth, but remain unprofitable. We have generally avoided these businesses as we believe that the current valuations the market is conveying on these companies do not allow for downside protection should fundamentals fail to play out. Coherent, ViaSat, and Avnet were our weakest performers. Despite all three companies delivering acceptable earnings, investors continue to shun these stocks due to limited near-term revenue growth. Looking past the COVID environment, we believe that all three companies should have above average revenue growth potential.
The Financial sector was a bright spot for the Fund. Trupanion, PRA Group, and Jefferies helped drive our strong relative outperformance. Trupanion was a great investment for us. The stock was up 150% as the company delivered better than expected earnings, as its business remains very resilient in the current environment. The stock reached our price target so we exited the position. PRA Group and Jefferies have significantly outperformed the sector return, up 44% and 35% respectively. PRA Group fundamentals have held up well during the COVID-19, and with its strong balance sheet is in good position to grow. Jefferies continues to execute on its long-term strategy to simplify the business, increase returns, and buy back stock. We have high regard for this owner-operator management team, and the stock remains significantly undervalued.
Thanks for your trust and patience,
Benjamin Kim, CFA
Past performance is not a guarantee of future results.
Investing involves risk including loss of principal. In addition to the normal risks associated with investing, international investments may involve risk of capital loss from unfavorable fluctuation in currency values, from differences in generally accepted accounting principles or from economic or political instability in other nations. The Funds may invest in ETFs. The market price of the shares of an ETF will fluctuate based on changes in the net asset value as well as changes in the supply and demand of its shares in the secondary market. ETFs have management and other expenses. The Fund will bear it’s pro rata portion of these expenses and therefore the Fund’s expenses may be higher than if it invested directly in securities.
16
Great Lakes Small Cap Opportunity Fund
The opinions expressed are those of the fund managers and are not intended to be a forecast of future events, a guarantee of future results, nor investment advice.
Fund holdings and sector allocations are subject to change at any time and should not be considered a recommendation to buy or sell any security. Please refer to the schedules of investments for complete holdings information.
Definitions:
The Russell 2000 Index consists of the smallest 2,000 companies in a group of 3,000 U.S. companies in the Russell 3000 Index, as ranked by market capitalization.
The Russell 2000 Growth index consists of 2,000 companies in a group of 3,000 U.S. companies in the Russell 3000 Index that exhibit a growth probability.
The Russell 2000 Value index consists of 2,000 companies in a group of 3,000 U.S. companies in the Russell 3000 Index that also exhibit a value probability.
Basis point (bp) is a unit equal to 1/100th of 1% and is used to denote the change in a financial instrument.
Free cash flow is earnings before depreciation, amortization, and non-cash charges minus maintenance capital expenditures.
Yield Curve is a chart consisting of the yields of bonds of the same quality but different maturities. This measurement can be used as a gauge to evaluate the future of the interest rates. An upward trend with short-term rates lower than long-term rates is called a positive yield curve, while a down trend is a negative or inverted yield curve.
Alpha is used as a measure of performance, indicating when a strategy has managed to beat the market return over some period. Alpha, often considered the active return on an investment, gauges the performance of an investment against a market index or benchmark that is considered to represent the market’s movement as a whole. The excess return of an investment relative to the return of a benchmark index is the investment’s alpha. Alpha may be positive or negative and is the result of active investing.
Growth stocks typically are more volatile than value stocks; however, value stocks have a lower expected growth rate in earnings and sales.
Mutual fund investing involves risk. Principal loss is possible. Investing in ETFs are subject to additional risks that do not apply to conventional mutual funds, including the risks that the market price of the shares may trade at a discount to its net asset value (“NAV”), an active secondary trading market may not develop or be maintained, or trading may be halted by the exchange in which they trade, which may impact a Funds ability to sell its shares. Small-capitalization companies tend to have limited liquidity and greater price volatility than large-capitalization companies. The Fund invests in foreign securities which involve greater volatility and political, economic and currency risks and differences in accounting methods. These risks are greater in emerging markets. The Fund’s value investments are subject to the risk that their intrinsic values may not be recognized by the broad market or that their prices may decline.
It is not possible to invest directly in an index.
17
Great Lakes Small Cap Opportunity Fund
Value of $100,000 Investment (Unaudited)
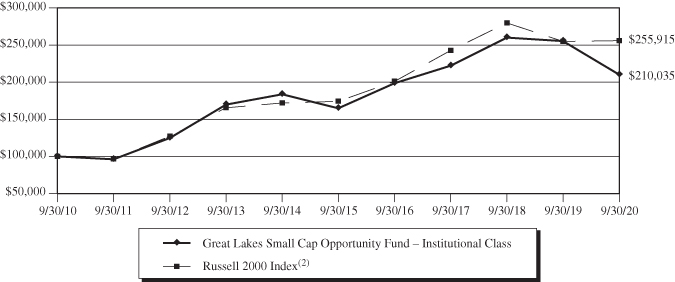
The chart assumes an initial investment of $100,000. Performance reflects waivers of fee and operating expenses in effect. In the absence of such waivers, total return would be reduced. Performance data quoted represents past performance and does not guarantee future results. Investment returns and principal value will fluctuate, and when sold, may be worth more or less than their original cost. Performance current to the most recent month-end may be lower or higher than the performance quoted and can be obtained by calling 855-278-2020. Performance assumes the reinvestment of capital gains and income distributions. The performance does not reflect the deduction of taxes that a shareholder would pay on Fund distributions or the redemption of Fund shares.
Annualized Rates of Return as of September 30, 2020
1-Year | 3-Year | 5-Year | 10-Year | Since Inception(1) | |
| Investor Class | -17.98% | -2.09% | 4.70% | 7.43% | 10.70% |
| Institutional Class | -17.73% | -1.86% | 4.97% | 7.70% | 10.99% |
Russell 2000 Index(2) | 0.39% | 1.77% | 8.00% | 9.85% | 12.09% |
| (1) | Inception date of each class was December 5, 2008. |
| (2) | The Russell 2000 Index is a market capitalization-weighted index comprised of the 2,000 smallest companies listed on the Russell 3000 Index, which contains the 3,000 largest companies in the U.S. based on market capitalization. This index can not be invested in directly. |
The following is expense information for the Great Lakes Small Cap Opportunity Fund as disclosed in the Fund’s most recent prospectus dated July 29, 2020:
| Investor Class Gross Expense Ratio: 1.13% | Net Expense Ratio: 1.13% |
| Institutional Class Gross Expense Ratio: 0.88% | Net Expense Ratio: 0.88% |
18
Great Lakes Small Cap Opportunity Fund
Allocation of Portfolio Net Assets (Unaudited)
September 30, 2020(1)(2)
(% of Net Assets)

Top 10 Equity Holdings (Unaudited)
September 30, 2020(1)
(% of Net Assets)
Crane Co. | 3.8 | % | |||
Jones Lang LaSalle, Inc. | 3.6 | % | |||
Axis Capital Holdings Ltd. | 3.6 | % | |||
Investors Bancorp, Inc. | 3.2 | % | |||
ViaSat, Inc. | 3.1 | % | |||
EnerSys | 3.0 | % | |||
TripAdvisor, Inc. | 3.0 | % | |||
First American Financial Corp. | 3.0 | % | |||
Dentsply Sirona, Inc. | 3.0 | % | |||
NewMarket Corp. | 3.0 | % |
(1) | Fund holdings and sector allocations are subject to change at any time and are not recommendations to buy or sell any security. |
(2) | Excludes securities lending collateral. |
19
Great Lakes Funds
Expense Examples (Unaudited)
September 30, 2020
As a shareholder of a Fund, you incur two types of costs: (1) transaction costs and (2) ongoing costs, including management fees; distribution (12b-1) fees (Investor Class only), and other Fund expenses. This Example is intended to help you understand your ongoing costs (in dollars) of investing in the Fund and to compare these costs with the ongoing costs of investing in other mutual funds. The Example is based on an investment of $1,000 invested at the beginning of the period and held for the entire period (April 1, 2020 – September 30, 2020).
ACTUAL EXPENSES
For each class, the first line of the table provides information about actual account values and actual expenses. You may use the information in this line, together with the amount you invested, to estimate the expenses that you paid over the period. Simply divide your account value by $1,000 (for example, an $8,600 account value divided by $1,000 = 8.6), then multiply the result by the number in the first line under the heading entitled “Expenses Paid During Period” to estimate the expenses you paid on your account during this period.
HYPOTHETICAL EXAMPLE FOR COMPARISON PURPOSES
For each class, the second line of the table below provides information about hypothetical account values and hypothetical expenses based on the Fund’s actual expense ratio and an assumed rate of return of 5% per year before expenses, which is not the Fund’s actual return. The hypothetical account values and expenses may not be used to estimate the actual ending account balance or expenses you paid for the period. You may use this information to compare the ongoing costs of investing in the Fund and other funds. To do so, compare this 5% hypothetical example with the 5% hypothetical examples that appear in the shareholder reports of the other funds.
Please note that the expenses shown in the table are meant to highlight your ongoing costs only. Therefore, the second line of the table is useful in comparing ongoing costs only, and will not help you determine the relative total costs of owning different funds.
Great Lakes Bond Fund
| Expenses Paid | |||
| Beginning Account | Ending Account | During Period(1) | |
Value (4/1/2020) | Value (9/30/2020) | (4/1/2020 to 9/30/2020) | |
Institutional Class Actual(2) | $1,000.00 | $1,058.50 | $3.10 |
Institutional Class | |||
Hypothetical (5% return before expenses) | $1,000.00 | $1,022.06 | $3.04 |
| (1) | Expenses are equal to the Fund’s annualized expense ratio for the most recent six-month period of 0.60%, multiplied by the average account value over the period, multiplied by 183/365 to reflect the one-half year period. |
| (2) | Based on the actual returns for the six-month period ended September 30, 2020 of 5.85%. |
Great Lakes Disciplined Equity Fund
| Expenses Paid | |||
| Beginning Account | Ending Account | During Period(3) | |
Value (4/1/2020) | Value (9/30/2020) | (4/1/2020 to 9/30/2020) | |
Institutional Class Actual(4)(5) | $1,000.00 | $1,322.70 | $5.01 |
Institutional Class(6) | |||
Hypothetical (5% return before expenses) | $1,000.00 | $1,020.73 | $4.36 |
| (3) | Expenses are equal to the Fund’s annualized expense ratio for the most recent six-month period of 0.85%, multiplied by the average account value over the period, multiplied by 183/365 to reflect the one-half year period. |
| (4) | Based on the actual returns for the six-month period ended September 30, 2020 of 32.27%. |
| (5) | Excluding interest expense, the actual expenses would be $4.95. |
| (6) | Excluding interest expense, the hypothetical expenses would be $4.31. |
20
Great Lakes Funds
Expense Examples (Unaudited)
September 30, 2020
Great Lakes Large Cap Value Fund
| Expenses Paid | |||
| Beginning Account | Ending Account | During Period(1) | |
Value (4/1/2020) | Value (9/30/2020) | (4/1/2020 to 9/30/2020) | |
Institutional Class Actual(2) | $1,000.00 | $1,193.60 | $4.67 |
Institutional Class | |||
Hypothetical (5% return before expenses) | $1,000.00 | $1,020.81 | $4.31 |
| (1) | Expenses are equal to the Fund’s annualized expense ratio for the most recent six-month period of 0.85%, multiplied by the average account value over the period, multiplied by 183/365 to reflect the one-half year period. |
| (2) | Based on the actual returns for the six-month period ended September 30, 2020 of 19.36%. |
Great Lakes Small Cap Opportunity Fund
| Expenses Paid | |||
| Beginning Account | Ending Account | During Period(3) | |
Value (4/1/2020) | Value (9/30/2020) | (4/1/2020 to 9/30/2020) | |
Investor Class Actual(4) | $1,000.00 | $1,203.10 | $6.85 |
Investor Class | |||
Hypothetical (5% return before expenses) | $1,000.00 | $1,018.85 | $6.28 |
Institutional Class Actual(4) | $1,000.00 | $1,204.70 | $4.86 |
Institutional Class | |||
Hypothetical (5% return before expenses) | $1,000.00 | $1,020.10 | $5.01 |
| (3) | Expenses are equal to the Fund’s annualized expense ratio for the most recent six-month period of 1.24% and 0.99% for the Investor Class and Institutional Class, respectively, multiplied by the average account value over the period, multiplied by 183/365 to reflect the one-half year period. |
| (4) | Based on the actual returns for the six-month period ended September 30, 2020 of 20.31% and 20.47% for the Investor Class and Institutional Class, respectively. |
21
Great Lakes Bond Fund
Schedule of Investments (Unaudited)
September 30, 2020
Description | Par | Value | ||||||
| CORPORATE BONDS – 40.9% | ||||||||
| Communication Services – 0.7% | ||||||||
Indiana Bell Telephone Co., Inc. | ||||||||
7.300%, 08/15/2026 | $ | 535,000 | $ | 672,182 | ||||
| Consumer Staples – 0.9% | ||||||||
Molson Coors Beverage Co. | ||||||||
5.000%, 05/01/2042 | 785,000 | 891,495 | ||||||
| Energy – 5.6% | ||||||||
Antero Resources Corp. | ||||||||
5.375%, 11/01/2021 | 500,000 | 476,250 | ||||||
El Paso Natural Gas Co., LLC | ||||||||
8.375%, 06/15/2032 | 500,000 | 689,188 | ||||||
Kinder Morgan, Inc. | ||||||||
5.300%, 12/01/2034 | 2,044,000 | 2,412,176 | ||||||
Marathon Oil Corp. | ||||||||
6.800%, 03/15/2032 | 1,116,000 | 1,197,753 | ||||||
MPLX LP | ||||||||
4.875%, 12/01/2024 | 250,000 | 279,447 | ||||||
4.800%, 02/15/2029 | 250,000 | 286,405 | ||||||
5,341,219 | ||||||||
| Financials# – 27.2% | ||||||||
Affiliated Managers Group | ||||||||
3.500%, 08/01/2025 | 445,000 | 488,745 | ||||||
Ally Financial, Inc. | ||||||||
5.125%, 09/30/2024 | 1,750,000 | 1,952,143 | ||||||
Carlyle Holdings II Finance | ||||||||
5.625%, 03/30/2043 (a) | 1,000,000 | 1,253,824 | ||||||
Credit Suisse Group Funding Ltd. | ||||||||
3.800%, 09/15/2022 | 1,000,000 | 1,058,748 | ||||||
3.800%, 06/09/2023 | 827,000 | 890,622 | ||||||
Ford Motor Credit Co., LLC | ||||||||
5.750%, 02/01/2021 | 3,105,000 | 3,132,169 | ||||||
3.810%, 01/09/2024 | 1,190,000 | 1,180,331 | ||||||
Goldman Sachs Group, Inc. | ||||||||
5.250%, 07/27/2021 | 1,593,000 | 1,657,207 | ||||||
1.298% (3 Month LIBOR USD + 1.050%), 06/05/2023^ | 2,187,000 | 2,201,798 | ||||||
1.856% (3 Month LIBOR USD + 1.600%), 11/29/2023^ | 1,250,000 | 1,287,271 | ||||||
Manufacturers & Traders Trust Co. | ||||||||
0.886% (3 Month LIBOR USD + 0.640%), 12/01/2021^ | 2,303,000 | 2,303,358 | ||||||
See Notes to the Financial Statements
22
Great Lakes Bond Fund
Schedule of Investments (Unaudited) – Continued
September 30, 2020
Description | Par | Value | ||||||
| CORPORATE BONDS – 40.9% (Continued) | ||||||||
| Financials# – 27.2% (Continued) | ||||||||
Morgan Stanley | ||||||||
1.188% (3 Month LIBOR USD + 0.930%), 07/22/2022^ | $ | 900,000 | $ | 904,243 | ||||
1.463% (3 Month LIBOR USD + 1.220%), 05/08/2024^ | 3,467,000 | 3,507,531 | ||||||
Sumitomo Mitsui Banking Corp. | ||||||||
3.000%, 01/18/2023 | 605,000 | 637,052 | ||||||
Symetra Financial Corp. | ||||||||
4.250%, 07/15/2024 | 640,000 | 705,601 | ||||||
Wells Fargo & Co. | ||||||||
4.125%, 08/15/2023 | 1,439,000 | 1,572,773 | ||||||
1.491% (3 Month LIBOR USD + 1.230%), 10/31/2023^ | 1,327,000 | 1,343,806 | ||||||
26,077,222 | ||||||||
| Health Care – 2.1% | ||||||||
CVS Health Corp. | ||||||||
2.125%, 06/01/2021 | 1,975,000 | 1,995,987 | ||||||
| Industrials – 2.9% | ||||||||
Rolls-Royce plc | ||||||||
2.375%, 10/14/2020 (a) | 1,792,000 | 1,789,760 | ||||||
Stanley Black & Decker, Inc. | ||||||||
3.400%, 12/01/2021 | 1,000,000 | 1,027,182 | ||||||
2,816,942 | ||||||||
| Utilities – 1.5% | ||||||||
PSEG Power LLC | ||||||||
4.150%, 09/15/2021 | 1,379,000 | 1,414,431 | ||||||
| Total Corporate Bonds | ||||||||
| (Cost $38,351,270) | 39,209,478 | |||||||
| Shares | ||||||||
| EXCHANGE-TRADED FUNDS – 30.0% | ||||||||
iShares 1-5 Year Investment Grade Corporate Bond Fund | 120,500 | 6,616,655 | ||||||
iShares Core U.S. Aggregate Bond Fund | 80,550 | 9,509,733 | ||||||
iShares iBoxx $ High Yield Corporate Bond Fund | 70,000 | 5,873,000 | ||||||
iShares MBS Fund | 61,000 | 6,734,400 | ||||||
| Total Exchange-Traded Funds | ||||||||
| (Cost $28,582,441) | 28,733,788 | |||||||
See Notes to the Financial Statements
23
Great Lakes Bond Fund
Schedule of Investments (Unaudited) – Continued
September 30, 2020
Description | Par | Value | ||||||
| U.S. TREASURY SECURITIES – 20.6% | ||||||||
U.S. Treasury Notes | ||||||||
2.000%, 08/15/2025 | $ | 7,000,000 | $ | 7,587,617 | ||||
0.625%, 05/15/2030 | 5,000,000 | 4,985,937 | ||||||
1.125%, 05/15/2040 | 5,250,000 | 5,178,633 | ||||||
U.S. Treasury Bill | ||||||||
0.065%, 10/27/2020 (b) | 2,000,000 | 1,999,903 | ||||||
| Total U.S. Treasury Securities | ||||||||
| (Cost $19,975,049) | 19,752,090 | |||||||
| U.S. GOVERNMENT AGENCY | ||||||||
| MORTGAGE-BACKED SECURITIES – 3.3% | ||||||||
Federal Home Loan Mortgage Association | ||||||||
Series 4949, Class BC | ||||||||
2.250%, 03/25/2049 | 969,049 | 1,005,742 | ||||||
Federal National Mortgage Association | ||||||||
Series 2013-130, Class CA | ||||||||
2.500%, 06/25/2043 | 295,047 | 306,361 | ||||||
Series 2013-130, Class CD | ||||||||
3.000%, 06/25/2043 | 536,448 | 570,712 | ||||||
Federal National Mortgage Association Pool | ||||||||
5.170%, 06/01/2028, #468516 | 215,701 | 247,898 | ||||||
Government National Mortgage Association | ||||||||
Series 2013-145, Class AG | ||||||||
5.072%, 09/16/2044 (c) | 11,780 | 13,363 | ||||||
Series 2017-99, Class DB | ||||||||
3.000%, 03/20/2046 | 667,000 | 725,315 | ||||||
Series 2018-52, Class AE | ||||||||
2.750%, 05/16/2051 | 238,999 | 249,874 | ||||||
| Total U.S. Government Agency Mortgage-Backed Securities | ||||||||
| (Cost $2,932,894) | 3,119,265 | |||||||
| MUNICIPAL BONDS – 2.9% | ||||||||
Carol Stream, Illinois Park District | ||||||||
6.100%, 11/01/2032 – AGM Insured | 500,000 | 502,315 | ||||||
Chicago, Illinois Board of Education | ||||||||
Series A | ||||||||
4.000%, 12/01/2020 | 1,000,000 | 1,004,840 | ||||||
Cook County, Illinois | ||||||||
Series B | ||||||||
4.940%, 11/15/2023 – BAM Insured | 500,000 | 520,020 | ||||||
See Notes to the Financial Statements
24
Great Lakes Bond Fund
Schedule of Investments (Unaudited) – Continued
September 30, 2020
Description | Par | Value | ||||||
| MUNICIPAL BONDS – 2.9% (Continued) | ||||||||
Madison & Jersey Counties, Illinois United School District #11 | ||||||||
5.625%, 12/01/2026 | $ | 250,000 | $ | 259,635 | ||||
Rosemont, Illinois General Obligation Fund | ||||||||
5.375%, 12/01/2023 – BAM Insured | 470,000 | 519,068 | ||||||
| Total Municipal Bonds | ||||||||
| (Cost $2,776,503) | 2,805,878 | |||||||
| COMMERCIAL MORTGAGE-BACKED SECURITIES – 1.6% | ||||||||
Citigroup Commercial Mortgage Trust | ||||||||
Series 2014-GC19, Class A4 | ||||||||
4.023%, 03/12/2047 | 500,000 | 544,829 | ||||||
Commercial Mortgage Trust | ||||||||
Series 2012-CR1, Class AM | ||||||||
3.912%, 05/17/2045 | 350,000 | 362,747 | ||||||
CS First Boston Commercial Mortgage Trust | ||||||||
Series 2003-29, Class 2A3 | ||||||||
5.500%, 12/25/2033 | 14,539 | 14,571 | ||||||
Greenpoint Mortgage | ||||||||
Series 2003-1, Class A1 | ||||||||
3.389%, 10/25/2033 (c) | 69,841 | 69,112 | ||||||
GS Mortgage Securities Trust | ||||||||
Series 2014-GC18, Class A4 | ||||||||
4.074%, 01/10/2047 | 500,000 | 542,771 | ||||||
| Total Commercial Mortgage-Backed Securities | ||||||||
| (Cost $1,472,108) | 1,534,030 | |||||||
| ASSET-BACKED SECURITY – 0.3% | ||||||||
Santander Drive Auto Receivables Trust | ||||||||
Series 2018-2, Class C | ||||||||
3.350%, 07/17/2023 | ||||||||
| Total Asset-Backed Security | ||||||||
| (Cost $258,570) | 256,952 | 259,963 | ||||||
See Notes to the Financial Statements
25
Great Lakes Bond Fund
Schedule of Investments (Unaudited) – Continued
September 30, 2020
Description | Shares | Value | ||||||
| MONEY MARKET FUND – 0.2% | ||||||||
First American Government Obligations Fund – Class Z, 0.05% (b) | ||||||||
| Total Money Market Fund | ||||||||
| (Cost $213,510) | 213,510 | $ | 213,510 | |||||
| Total Investments – 99.8% | ||||||||
| (Cost $94,562,345) | 95,628,002 | |||||||
| Other Assets and Liabilities, Net – 0.2% | 202,315 | |||||||
$ | 95,830,317 | |||||||
| # | As of September 30, 2020, the Fund had a significant portion of its assets invested in the financials sector. See Note 11 in the Notes to the Financial Statements. |
| (a) | Security purchased within the terms of a private placement memorandum, exempt from registration under Rule 144A of the Securities Act of 1933, as amended, and may be sold only to dealers in that program or other “qualified institutional buyers.” These securities are deemed to be liquid by the Adviser. As of September 30, 2020, the value of these investments were $3,043,584, or 3.2% of total net assets. |
| ^ | Variable rate security – The rate shown is the rate in effect as of September 30, 2020. |
| (b) | The rate shown is the annualized seven-day effective yield as of September 30, 2020. |
| (c) | Variable rate security. The coupon is based on an underlying pool of loans. |
The Global Industry Classification Standard (“GICS”®) was developed by and is the exclusive property of MSCI, Inc. (“MSCI”) and Standard & Poor’s Financial Services LLC (“S&P”). GICS is a service mark of MSCI and S&P and has been licensed for use.
AGM – Assured Guaranty
BAM – Build America Mutual Assurance Company
LIBOR – London Interbank Offered Rate
See Notes to the Financial Statements
26
Great Lakes Disciplined Equity Fund
Schedule of Investments (Unaudited)
September 30, 2020
Description | Shares | Value | ||||||
| COMMON STOCKS – 99.0% | ||||||||
| Communication Services – 8.1% | ||||||||
Alphabet, Inc. – Class C* | 659 | $ | 968,466 | |||||
Facebook, Inc. – Class A* | 1,973 | 516,729 | ||||||
Liberty Broadband Corp. – Class C* | 1,340 | 191,446 | ||||||
Netflix, Inc.* | 1,818 | 909,055 | ||||||
Walt Disney Co. | 1,718 | 213,169 | ||||||
2,798,865 | ||||||||
| Consumer Discretionary – 16.4% | ||||||||
Amazon.com, Inc.* | 405 | 1,275,236 | ||||||
Domino’s Pizza, Inc. | 598 | 254,317 | ||||||
Expedia Group, Inc. | 9,037 | 828,602 | ||||||
Home Depot, Inc. | 2,670 | 741,486 | ||||||
McDonald’s Corp. | 2,214 | 485,951 | ||||||
O’Reilly Automotive, Inc.* | 1,452 | 669,488 | ||||||
Starbucks Corp. | 1,397 | 120,030 | ||||||
Tiffany & Co. | 4,023 | 466,065 | ||||||
TJX Companies, Inc. | 2,057 | 114,472 | ||||||
V.F. Corp. | 6,468 | 454,377 | ||||||
Yum! Brands, Inc. | 2,391 | 218,298 | ||||||
5,628,322 | ||||||||
| Consumer Staples – 3.0% | ||||||||
Constellation Brands, Inc. – Class A | 3,210 | 608,327 | ||||||
Sysco Corp. | 7,022 | 436,909 | ||||||
1,045,236 | ||||||||
| Energy – 1.2% | ||||||||
Baker Hughes Co. | 8,042 | 106,878 | ||||||
Chevron Corp. | 1,869 | 134,568 | ||||||
Halliburton Co. | 14,454 | 174,171 | ||||||
415,617 | ||||||||
| Financials – 6.6% | ||||||||
BlackRock, Inc. | 1,190 | 670,624 | ||||||
CME Group, Inc. | 564 | 94,363 | ||||||
Moody’s Corp. | 2,318 | 671,872 | ||||||
S&P Global, Inc. | 1,611 | 580,927 | ||||||
T. Rowe Price Group, Inc. | 1,831 | 234,771 | ||||||
2,252,557 | ||||||||
See Notes to the Financial Statements
27
Great Lakes Disciplined Equity Fund
Schedule of Investments (Unaudited) – Continued
September 30, 2020
Description | Shares | Value | ||||||
| COMMON STOCKS – 99.0% (Continued) | ||||||||
| Health Care – 8.8% | ||||||||
ABIOMED, Inc.* | 765 | $ | 211,951 | |||||
Becton, Dickinson and Co. | 2,025 | 471,177 | ||||||
BioMarin Pharmaceutical, Inc.* | 4,998 | 380,248 | ||||||
Exact Sciences Corp.* | 2,596 | 264,662 | ||||||
IDEXX Laboratories, Inc.* | 495 | 194,590 | ||||||
Medtronic plc | 1,096 | 113,896 | ||||||
STERIS plc | 652 | 114,876 | ||||||
Stryker Corp. | 1,185 | 246,918 | ||||||
Thermo Fisher Scientific, Inc. | 856 | 377,941 | ||||||
Zoetis, Inc. | 3,918 | 647,920 | ||||||
3,024,179 | ||||||||
| Industrials – 12.8% | ||||||||
Equifax, Inc. | 2,553 | 400,566 | ||||||
IDEX Corp. | 1,256 | 229,107 | ||||||
Illinois Tool Works, Inc. | 673 | 130,030 | ||||||
Kansas City Southern | 2,669 | 482,635 | ||||||
Norfolk Southern Corp. | 1,416 | 303,010 | ||||||
PACCAR, Inc. | 6,080 | 518,502 | ||||||
Republic Services, Inc. | 1,288 | 120,235 | ||||||
Roper Technologies, Inc. | 738 | 291,591 | ||||||
Teledyne Technologies, Inc.* | 1,329 | 412,269 | ||||||
Union Pacific Corp. | 5,058 | 995,769 | ||||||
Verisk Analytics, Inc. | 1,508 | 279,448 | ||||||
W.W. Grainger, Inc. | 673 | 240,106 | ||||||
4,403,268 | ||||||||
| Information Technology# – 30.9% | ||||||||
Adobe, Inc.* | 1,960 | 961,243 | ||||||
Advanced Micro Devices, Inc.* | 2,326 | 190,709 | ||||||
Apple, Inc. | 14,023 | 1,624,004 | ||||||
Autodesk, Inc.* | 3,280 | 757,713 | ||||||
Fidelity National Information Services, Inc. | 1,045 | 153,834 | ||||||
Lam Research Corp. | 2,040 | 676,770 | ||||||
MasterCard, Inc. – Class A | 2,081 | 703,732 | ||||||
Microsoft Corp. | 13,334 | 2,804,540 | ||||||
NVIDIA Corp. | 1,228 | 664,618 | ||||||
Skyworks Solutions, Inc. | 878 | 127,749 | ||||||
Texas Instruments, Inc. | 5,958 | 850,743 | ||||||
See Notes to the Financial Statements
28
Great Lakes Disciplined Equity Fund
Schedule of Investments (Unaudited) – Continued
September 30, 2020
Description | Shares | Value | ||||||
| COMMON STOCKS – 99.0% (Continued) | ||||||||
| Information Technology# – 30.9% (Continued) | ||||||||
Trade Desk, Inc. – Class A* | 567 | $ | 294,148 | |||||
Visa, Inc. – Class A | 4,055 | 810,878 | ||||||
10,620,681 | ||||||||
| Materials – 5.5% | ||||||||
Air Products & Chemicals, Inc. | 2,821 | 840,263 | ||||||
Linde plc | 3,360 | 800,117 | ||||||
PPG Industries, Inc. | 2,177 | 265,768 | ||||||
1,906,148 | ||||||||
| Real Estate – 5.2% | ||||||||
Alexandria Real Estate Equities, Inc. – REIT | 1,837 | 293,920 | ||||||
Crown Castle International Corp. – REIT | 1,476 | 245,754 | ||||||
Digital Realty Trust, Inc. – REIT | 3,188 | 467,871 | ||||||
Prologis, Inc. – REIT | 6,399 | 643,867 | ||||||
Realty Income Corp. – REIT | 2,039 | 123,869 | ||||||
1,775,281 | ||||||||
| Utilities – 0.5% | ||||||||
Ameren Corp. | 2,133 | 168,678 | ||||||
| Total Common Stocks | ||||||||
| (Cost $25,558,350) | 34,038,832 | |||||||
| MONEY MARKET FUND – 1.0% | ||||||||
First American Government Obligations Fund – Class Z, 0.05%^ | ||||||||
| Total Money Market Fund | ||||||||
| (Cost $360,477) | 360,477 | 360,477 | ||||||
| Total Investments – 100.0% | ||||||||
| (Cost $25,918,827) | 34,399,309 | |||||||
| Other Assets and Liabilities, Net – 0.0% | (12,208 | ) | ||||||
| Total Net Assets – 100.0% | $ | 34,387,101 | ||||||
| * | Non-income producing security. |
| # | As of September 30, 2020, the Fund had a significant portion of its assets invested in the information technology sector. See Note 11 in the Notes to the Financial Statements. |
| ^ | The rate shown is the annualized seven-day effective yield as of September 30, 2020. |
REIT – Real Estate Investment Trust
The Global Industry Classification Standard (“GICS”®) was developed by and is the exclusive property of MSCI, Inc. (“MSCI”) and Standard & Poor’s Financial Services LLC (“S&P”). GICS is a service mark of MSCI and S&P and has been licensed for use.
See Notes to the Financial Statements
29
Great Lakes Large Cap Value Fund
Schedule of Investments (Unaudited)
September 30, 2020
Description | Shares | Value | ||||||
| COMMON STOCKS – 96.7% | ||||||||
| Communication Services – 7.0% | ||||||||
Alphabet, Inc. – Class C* | 250 | $ | 367,400 | |||||
Comcast Corp. – Class A | 31,284 | 1,447,198 | ||||||
Walt Disney Co. | 5,836 | 724,131 | ||||||
2,538,729 | ||||||||
| Consumer Discretionary – 8.4% | ||||||||
Booking Holdings, Inc.* | 374 | 639,794 | ||||||
BorgWarner, Inc. | 38,609 | 1,495,713 | ||||||
Expedia Group, Inc. | 5,824 | 534,002 | ||||||
Hasbro, Inc. | 4,597 | 380,264 | ||||||
3,049,773 | ||||||||
| Consumer Staples – 6.3% | ||||||||
Anheuser-Busch InBev SA/NV – ADR | 16,898 | 910,464 | ||||||
Philip Morris International, Inc. | 18,726 | 1,404,263 | ||||||
2,314,727 | ||||||||
| Energy – 7.4% | ||||||||
Chevron Corp. | 27,703 | 1,994,616 | ||||||
Schlumberger Ltd. | 45,302 | 704,899 | ||||||
2,699,515 | ||||||||
| Financials# – 25.8% | ||||||||
American Express Co. | 9,654 | 967,813 | ||||||
Ameriprise Financial, Inc. | 4,551 | 701,355 | ||||||
Bank of America Corp. | 42,886 | 1,033,124 | ||||||
Berkshire Hathaway, Inc. – Class B* | 5,994 | 1,276,362 | ||||||
Chubb Ltd. | 9,000 | 1,045,080 | ||||||
Citigroup, Inc. | 18,863 | 813,184 | ||||||
Discover Financial Services | 11,359 | 656,323 | ||||||
PNC Financial Services Group, Inc. | 10,365 | 1,139,217 | ||||||
Prudential Financial, Inc. | 10,502 | 667,087 | ||||||
RenaissanceRe Holdings, Ltd. | 6,435 | 1,092,277 | ||||||
9,391,822 | ||||||||
| Health Care – 16.1% | ||||||||
AbbVie, Inc. | 10,401 | 911,024 | ||||||
Biogen, Inc.* | 2,313 | 656,152 | ||||||
Boston Scientific Corp.* | 19,258 | 735,848 | ||||||
CVS Health Corp. | 17,285 | 1,009,444 | ||||||
McKesson Corp. | 4,878 | 726,481 | ||||||
See Notes to the Financial Statements
30
Great Lakes Large Cap Value Fund
Schedule of Investments (Unaudited) – Continued
September 30, 2020
Description | Shares | Value | ||||||
| COMMON STOCKS – 96.7% (Continued) | ||||||||
| Health Care – 16.1% (Continued) | ||||||||
Merck & Co., Inc. | 12,896 | $ | 1,069,723 | |||||
UnitedHealth Group, Inc. | 2,443 | 761,654 | ||||||
5,870,326 | ||||||||
| Industrials – 12.1% | ||||||||
Canadian National Railway Co. | 5,058 | 538,475 | ||||||
Cummins, Inc. | 4,350 | 918,546 | ||||||
Emerson Electric Co. | 5,558 | 364,438 | ||||||
General Electric Co. | 115,688 | 720,736 | ||||||
Lockheed Martin Corp. | 2,359 | 904,157 | ||||||
PACCAR, Inc. | 4,350 | 370,968 | ||||||
Wabtec Corp. | 9,435 | 583,838 | ||||||
4,401,158 | ||||||||
| Information Technology – 5.5% | ||||||||
Intel Corp. | 18,177 | 941,205 | ||||||
Oracle Corp. | 18,082 | 1,079,495 | ||||||
2,020,700 | ||||||||
| Materials – 4.1% | ||||||||
Avery Dennison Corp. | 6,091 | 778,674 | ||||||
DuPont de Nemours, Inc. | 13,165 | 730,394 | ||||||
1,509,068 | ||||||||
| Utilities – 4.0% | ||||||||
Ameren Corp. | 4,660 | 368,513 | ||||||
Public Service Enterprise Group, Inc. | 20,054 | 1,101,165 | ||||||
1,469,678 | ||||||||
| Total Common Stocks | ||||||||
| (Cost $36,239,276) | 35,265,496 | |||||||
See Notes to the Financial Statements
31
Great Lakes Large Cap Value Fund
Schedule of Investments (Unaudited) – Continued
September 30, 2020
Description | Shares | Value | ||||||
| MONEY MARKET FUND – 3.8% | ||||||||
First American Government Obligations Fund – Class Z, 0.05%^ | ||||||||
| Total Money Market Fund | ||||||||
| (Cost $1,377,117) | 1,377,117 | $ | 1,377,117 | |||||
| Total Investments – 100.5% | ||||||||
| (Cost $37,616,393) | 36,642,613 | |||||||
| Other Assets and Liabilities, Net – (0.5)% | (164,798 | ) | ||||||
| Total Net Assets – 100.0% | $ | 36,477,815 | ||||||
| * | Non-income producing security. |
| ADR – American Depositary Receipt | |
| # | As of September 30, 2020, the Fund had a significant portion of its assets invested in the financials sector. See Note 11 in the Notes to the Financial Statements. |
| ^ | The rate shown is the annualized seven-day effective yield as of September 30, 2020. |
The Global Industry Classification Standard (“GICS”®) was developed by and is the exclusive property of MSCI, Inc. (“MSCI”) and Standard & Poor’s Financial Services LLC (“S&P”). GICS is a service mark of MSCI and S&P and has been licensed for use.
See Notes to the Financial Statements
32
Great Lakes Small Cap Opportunity Fund
Schedule of Investments (Unaudited)
September 30, 2020
Description | Shares | Value | ||||||
| COMMON STOCKS – 96.4% | ||||||||
| Communication Services – 3.0% | ||||||||
TripAdvisor, Inc. | 63,229 | $ | 1,238,656 | |||||
| Consumer Discretionary – 12.1% | ||||||||
Adtalem Global Education, Inc.* | 24,785 | 608,224 | ||||||
frontdoor, Inc.* | 25,667 | 998,703 | ||||||
Gildan Activewear, Inc. | 60,665 | 1,193,280 | ||||||
Mattel, Inc.* | 58,560 | 685,152 | ||||||
ServiceMaster Global Holdings, Inc.* | 15,062 | 600,672 | ||||||
Urban Outfitters, Inc.* | 21,533 | 448,102 | ||||||
Zumiez, Inc.* | 14,958 | 416,132 | ||||||
4,950,265 | ||||||||
| Consumer Staples – 3.3% | ||||||||
Hain Celestial Group, Inc.* | 14,907 | 511,310 | ||||||
Spectrum Brands Holdings, Inc. | 14,358 | 820,703 | ||||||
1,332,013 | ||||||||
| Energy – 2.9% | ||||||||
Dril-Quip, Inc.* | 33,373 | 826,315 | ||||||
National Oilwell Varco, Inc. | 38,545 | 349,218 | ||||||
1,175,533 | ||||||||
| Financials – 19.7% | ||||||||
Axis Capital Holdings Ltd. | 33,137 | 1,459,353 | ||||||
Bank OZK | 39,820 | 848,962 | ||||||
First American Financial Corp. | 24,293 | 1,236,757 | ||||||
Horace Mann Educators Corp. | 17,781 | 593,885 | ||||||
Investors Bancorp, Inc. | 182,485 | 1,324,841 | ||||||
Jefferies Financial Group, Inc. | 46,514 | 837,252 | ||||||
PRA Group, Inc.* | 26,867 | 1,073,337 | ||||||
Pzena Investment Management, Inc. – Class A | 125,946 | 675,071 | ||||||
8,049,458 | ||||||||
| Health Care – 7.7% | ||||||||
Dentsply Sirona, Inc. | 28,102 | 1,228,901 | ||||||
Luminex Corp. | 25,901 | 679,901 | ||||||
Medpace Holdings, Inc.* | 3,697 | 413,140 | ||||||
Patterson Companies, Inc. | 34,258 | 825,789 | ||||||
3,147,731 | ||||||||
See Notes to the Financial Statements
33
Great Lakes Small Cap Opportunity Fund
Schedule of Investments (Unaudited) – Continued
September 30, 2020
Description | Shares | Value | ||||||
| COMMON STOCKS – 96.4% (Continued) | ||||||||
| Industrials – 23.4% | ||||||||
Acuity Brands, Inc. | 10,202 | $ | 1,044,175 | |||||
Crane Co. | 31,192 | 1,563,655 | ||||||
EnerSys | 18,528 | 1,243,599 | ||||||
Healthcare Services Group, Inc. | 28,895 | 622,109 | ||||||
KAR Auction Services, Inc. | 63,900 | 920,160 | ||||||
MSC Industrial Direct Co., Inc. – Class A | 16,483 | 1,043,044 | ||||||
Sensata Technologies Holding plc* | 14,656 | 632,260 | ||||||
UniFirst Corp. | 5,611 | 1,062,555 | ||||||
Valmont Industries, Inc. | 7,108 | 882,672 | ||||||
WESCO International, Inc.* | 12,004 | 528,416 | ||||||
9,542,645 | ||||||||
| Information Technology – 15.1% | ||||||||
ACI Worldwide, Inc.* | 24,264 | 634,018 | ||||||
Avnet, Inc. | 32,880 | 849,619 | ||||||
CACI International, Inc.* | 2,023 | 431,223 | ||||||
Coherent, Inc.* | 7,548 | 837,300 | ||||||
Knowles Corp.* | 41,653 | 620,630 | ||||||
MKS Instruments, Inc. | 6,020 | 657,565 | ||||||
SS&C Technologies Holdings, Inc. | 10,599 | 641,451 | ||||||
Upland Software, Inc.* | 5,866 | 221,148 | ||||||
ViaSat, Inc.* | 36,477 | 1,254,444 | ||||||
6,147,398 | ||||||||
| Materials – 5.6% | ||||||||
Berry Global Group, Inc.* | 21,972 | 1,061,687 | ||||||
NewMarket Corp. | 3,515 | 1,203,255 | ||||||
2,264,942 | ||||||||
| Real Estate – 3.6% | ||||||||
Jones Lang LaSalle, Inc. | 15,315 | 1,465,033 | ||||||
| Total Common Stocks | ||||||||
| (Cost $44,952,262) | 39,313,674 | |||||||
See Notes to the Financial Statements
34
Great Lakes Small Cap Opportunity Fund
Schedule of Investments (Unaudited) – Continued
September 30, 2020
Description | Shares | Value | ||||||
| MONEY MARKET FUND – 4.6% | ||||||||
First American Government Obligations Fund – Class Z, 0.05%^ | ||||||||
| Total Money Market Fund | ||||||||
| (Cost $1,881,293) | 1,881,293 | $ | 1,881,293 | |||||
| Total Investments – 101.0% | ||||||||
| (Cost $46,833,555) | 41,194,967 | |||||||
| Other Assets and Liabilities, Net – (1.0)% | (416,199 | ) | ||||||
| Total Net Assets – 100.0% | $ | 40,778,768 | ||||||
| * | Non-income producing security. |
| ^ | The rate shown is the annualized seven-day effective yield as of September 30, 2020. |
The Global Industry Classification Standard (“GICS”®) was developed by and is the exclusive property of MSCI, Inc. (“MSCI”) and Standard & Poor’s Financial Services LLC (“S&P”). GICS is a service mark of MSCI and S&P and has been licensed for use.
See Notes to the Financial Statements
35
Great Lakes Funds
Statements of Assets and Liabilities (Unaudited)
September 30, 2020
| Small Cap | ||||||||||||||||
| Disciplined | Large Cap | Opportunity | ||||||||||||||
| Bond Fund | Equity Fund | Value Fund | Fund | |||||||||||||
| ASSETS | ||||||||||||||||
| Investment securities: | ||||||||||||||||
| At cost | $ | 94,562,345 | $ | 25,918,827 | $ | 37,616,393 | $ | 46,833,555 | ||||||||
| At value | $ | 95,628,002 | $ | 34,399,309 | $ | 36,642,613 | $ | 41,194,967 | ||||||||
| Foreign currencies (cost $2,908) | — | — | 2,925 | — | ||||||||||||
| Receivable for investment securities sold | — | — | 1,692,951 | — | ||||||||||||
| Dividends & interest receivable | 355,035 | 15,207 | 57,729 | 15,801 | ||||||||||||
| Receivable for capital shares sold | 12,015 | 38,894 | 20,416 | 2,645 | ||||||||||||
| Prepaid expenses | 19,141 | 7,333 | 15,112 | 10,569 | ||||||||||||
| Total Assets | 96,014,193 | 34,460,743 | 38,431,746 | 41,223,982 | ||||||||||||
| LIABILITIES | ||||||||||||||||
| Distributions payable | 90,145 | — | — | — | ||||||||||||
| Payable for investment securities purchased | — | — | 1,853,437 | 350,883 | ||||||||||||
| Payable for capital shares redeemed | 8,661 | 24,317 | 45,039 | 23,118 | ||||||||||||
| Payable to investment adviser | 31,692 | 8,955 | 14,808 | 17,988 | ||||||||||||
| Payable for fund administration & accounting fees | 18,510 | 12,189 | 11,966 | 14,761 | ||||||||||||
| Payable for compliance fees | 1,989 | 1,989 | 1,989 | 1,990 | ||||||||||||
| Payable for transfer agent fees & expenses | 3,595 | 2,972 | 3,057 | 5,610 | ||||||||||||
| Payable for custody fees | 1,589 | 1,572 | 774 | 1,110 | ||||||||||||
| Payable for audit and tax fees | 8,640 | 7,493 | 7,502 | 7,493 | ||||||||||||
| Payable for trustee fees | 4,289 | 4,341 | 4,351 | 4,316 | ||||||||||||
| Accrued other fees | 14,766 | 9,814 | 11,008 | 12,257 | ||||||||||||
| Accrued distribution fees – Investor Class | — | — | — | 5,688 | ||||||||||||
| Total Liabilities | 183,876 | 73,642 | 1,953,931 | 445,214 | ||||||||||||
| NET ASSETS | $ | 95,830,317 | $ | 34,387,101 | $ | 36,477,815 | $ | 40,778,768 | ||||||||
| COMPOSITION OF NET ASSETS | ||||||||||||||||
| Paid-in capital | $ | 94,772,574 | $ | 23,676,221 | $ | 37,354,907 | $ | 50,941,940 | ||||||||
| Total distributable earnings (accumulated loss) | 1,057,743 | 10,710,880 | (877,092 | ) | (10,163,172 | ) | ||||||||||
| Total net assets | $ | 95,830,317 | $ | 34,387,101 | $ | 36,477,815 | $ | 40,778,768 | ||||||||
| Investor Class Shares: | ||||||||||||||||
| Net Assets | $ | — | $ | — | $ | — | $ | 4,412,770 | ||||||||
Shares issued and outstanding(1) | — | — | — | 351,273 | ||||||||||||
| Net asset value, offering price, and redemption price per share | $ | — | $ | — | $ | — | $ | 12.56 | ||||||||
| Institutional Class Shares: | ||||||||||||||||
| Net Assets | $ | 95,830,317 | $ | 34,387,101 | $ | 36,477,815 | $ | 36,365,998 | ||||||||
Shares issued and outstanding(1) | 9,581,736 | 1,939,951 | 3,056,369 | 2,834,393 | ||||||||||||
| Net asset value, offering price, and redemption price per share | $ | 10.00 | $ | 17.73 | $ | 11.94 | $ | 12.83 | ||||||||
| (1) | Unlimited shares authorized without par value. |
See Notes to the Financial Statements
36
Great Lakes Funds
Statements of Operations (Unaudited)
For the Six Months Ended September 30, 2020
| Small Cap | ||||||||||||||||
| Disciplined | Large Cap | Opportunity | ||||||||||||||
| Bond Fund | Equity Fund | Value Fund | Fund | |||||||||||||
| INVESTMENT INCOME: | ||||||||||||||||
| Interest income | $ | 1,119,521 | $ | 172 | $ 904 | $ | 906 | |||||||||
| Dividend income | 183,584 | 190,393 | 531,434 | 275,045 | ||||||||||||
| Less: Foreign taxes withheld | — | — | (5,951 | ) | — | |||||||||||
| Securities lending income | — | — | — | 2,489 | ||||||||||||
| Total investment income | 1,303,105 | 190,565 | 526,387 | 278,440 | ||||||||||||
| EXPENSES: | ||||||||||||||||
| Investment advisory fees (See Note 4) | 204,238 | 100,345 | 125,896 | 138,029 | ||||||||||||
| Fund administration & accounting fees (See Note 4) | 43,533 | 36,280 | 35,372 | 39,528 | ||||||||||||
| Transfer agent fees & expenses (See Note 4) | 10,732 | 8,781 | 8,929 | 16,118 | ||||||||||||
| Federal & state registration fees | 10,483 | 10,589 | 13,703 | 16,102 | ||||||||||||
| Audit and tax fees | 8,646 | 7,503 | 7,503 | 7,503 | ||||||||||||
| Trustee fees (See Note 4) | 6,777 | 6,763 | 6,763 | 6,763 | ||||||||||||
| Compliance fees (See Note 4) | 5,856 | 5,856 | 5,856 | 5,856 | ||||||||||||
| Postage & printing fees | 4,758 | 2,821 | 3,021 | 4,026 | ||||||||||||
| Custody fees (See Note 4) | 4,223 | 5,582 | 2,520 | 3,024 | ||||||||||||
| Legal fees | 4,103 | 3,415 | 3,415 | 3,415 | ||||||||||||
| Other fees | 2,182 | 2,196 | 2,195 | 3,418 | ||||||||||||
| Insurance fees | 991 | 808 | 808 | — | ||||||||||||
| Distribution fees – Investor Class (See Note 5) | — | — | — | 7,119 | ||||||||||||
| Total expenses before interest expense and waiver | 306,522 | 190,939 | 215,981 | 250,901 | ||||||||||||
| Interest expense (See Note 10) | 62 | 2,450 | 379 | — | ||||||||||||
| Total expenses before waiver | 306,584 | 193,389 | 216,360 | 250,901 | ||||||||||||
| Less: Fee waiver from investment adviser (See Note 4) | — | (48,784 | ) | (37,629 | ) | (16,034 | ) | |||||||||
| Total net expenses | 306,584 | 144,605 | 178,731 | 234,867 | ||||||||||||
| NET INVESTMENT INCOME | 996,521 | 45,960 | 347,656 | 43,573 | ||||||||||||
| REALIZED AND UNREALIZED | ||||||||||||||||
| GAIN (LOSS) ON INVESTMENTS | ||||||||||||||||
| Net realized gain (loss) on: | ||||||||||||||||
| Investments | 1,036,414 | 962,508 | 252,046 | (3,437,721 | ) | |||||||||||
| Foreign currency translation | — | — | (10 | ) | — | |||||||||||
| Net change in unrealized appreciation/depreciation of: | ||||||||||||||||
| Investments | 3,989,381 | 8,004,647 | 6,367,230 | 12,147,794 | ||||||||||||
| Foreign currency translation | — | — | 18 | — | ||||||||||||
| Net realized and unrealized gain on investments | 5,025,795 | 8,967,155 | 6,619,284 | 8,710,073 | ||||||||||||
| NET INCREASE IN NET ASSETS FROM OPERATIONS | $ | 6,022,316 | $ | 9,013,115 | $ | 6,966,940 | $ | 8,753,646 | ||||||||
See Notes to the Financial Statements
37
Great Lakes Bond Fund
Statements of Changes in Net Assets
| Six Months Ended | For the Year | |||||||
| September 30, 2020 | Ended | |||||||
| (Unaudited) | March 31, 2020 | |||||||
| OPERATIONS: | ||||||||
| Net investment income | $ | 996,521 | $ | 3,179,640 | ||||
| Net realized gain on investments | 1,036,414 | 1,132,344 | ||||||
| Net change in unrealized appreciation/depreciation of investments | 3,989,381 | (3,010,060 | ) | |||||
Net increase resulting from operations | 6,022,316 | 1,301,924 | ||||||
| CAPITAL SHARE TRANSACTIONS: | ||||||||
| Institutional Class: | ||||||||
| Proceeds from shares sold | 1,361,731 | 11,213,038 | ||||||
| Proceeds from reinvestment of distributions | 297,584 | 1,013,977 | ||||||
| Payments for shares redeemed | (14,727,955 | ) | (36,442,386 | ) | ||||
Net decrease in net assets from capital share transactions | (13,068,640 | ) | (24,215,371 | ) | ||||
| DISTRIBUTIONS TO SHAREHOLDERS: | ||||||||
Total distributions to shareholders | (1,002,383 | ) | (3,209,885 | ) | ||||
| TOTAL DECREASE IN NET ASSETS | (8,048,707 | ) | (26,123,332 | ) | ||||
| NET ASSETS: | ||||||||
| Beginning of Period | 103,879,024 | 130,002,356 | ||||||
| End of Period | $ | 95,830,317 | $ | 103,879,024 | ||||
See Notes to the Financial Statements
38
Great Lakes Disciplined Equity Fund
Statements of Changes in Net Assets
| Six Months Ended | For the Year | |||||||
| September 30, 2020 | Ended | |||||||
| (Unaudited) | March 31, 2020 | |||||||
| OPERATIONS: | ||||||||
| Net investment income | $ | 45,960 | $ | 349,495 | ||||
| Net realized gain on investments | 962,508 | 2,126,399 | ||||||
| Net change in unrealized appreciation/depreciation of investments | 8,004,647 | (4,994,003 | ) | |||||
| Net increase (decrease) resulting from operations | 9,013,115 | (2,518,109 | ) | |||||
| CAPITAL SHARE TRANSACTIONS: | ||||||||
| Institutional Class: | ||||||||
| Proceeds from shares sold | 1,095,156 | 5,188,288 | ||||||
| Proceeds from reinvestment of distributions | 17,110 | 876,281 | ||||||
| Payments for shares redeemed | (4,951,046 | ) | (15,532,066 | ) | ||||
Net decrease in net assets from capital share transactions | (3,838,780 | ) | (9,467,497 | ) | ||||
| DISTRIBUTIONS TO SHAREHOLDERS: | ||||||||
Total distributions to shareholders | (39,833 | ) | (1,596,824 | ) | ||||
| TOTAL INCREASE (DECREASE) IN NET ASSETS | 5,134,502 | (13,582,430 | ) | |||||
| NET ASSETS: | ||||||||
| Beginning of Period | 29,252,599 | 42,835,029 | ||||||
| End of Period | $ | 34,387,101 | $ | 29,252,599 | ||||
See Notes to the Financial Statements
39
Great Lakes Large Cap Value Fund
Statements of Changes in Net Assets
| Six Months Ended | For the Year | |||||||
| September 30, 2020 | Ended | |||||||
| (Unaudited) | March 31, 2020 | |||||||
| OPERATIONS: | ||||||||
| Net investment income | $ | 347,656 | $ | 779,753 | ||||
| Net realized gain (loss) on: | ||||||||
| Investments | 252,046 | 20,483 | ||||||
| Foreign currency translation | (10 | ) | — | |||||
| Net change in unrealized appreciation/depreciation of: | ||||||||
| Investments | 6,367,230 | (7,578,043 | ) | |||||
| Foreign currency translation | 18 | — | ||||||
Net increase (decrease) resulting from operations | 6,966,940 | (6,777,807 | ) | |||||
| CAPITAL SHARE TRANSACTIONS: | ||||||||
| Institutional Class: | ||||||||
| Proceeds from shares sold | 1,313,278 | 6,810,802 | ||||||
| Proceeds from reinvestment of distributions | 123,706 | 1,054,217 | ||||||
| Payments for shares redeemed | (8,994,344 | ) | (7,989,169 | ) | ||||
Net decrease in net assets from capital share transactions | (7,557,360 | ) | (124,150 | ) | ||||
| DISTRIBUTIONS TO SHAREHOLDERS: | ||||||||
Total distributions to shareholders | (355,228 | ) | (2,478,516 | ) | ||||
| TOTAL DECREASE IN NET ASSETS | (945,648 | ) | (9,380,473 | ) | ||||
| NET ASSETS: | ||||||||
| Beginning of Period | 37,423,463 | 46,803,936 | ||||||
| End of Period | $ | 36,477,815 | $ | 37,423,463 | ||||
See Notes to the Financial Statements
40
Great Lakes Small Cap Opportunity Fund
Statements of Changes in Net Assets
| Six Months Ended | For the Year | |||||||
| September 30, 2020 | Ended | |||||||
| (Unaudited) | March 31, 2020 | |||||||
| OPERATIONS: | ||||||||
| Net investment income | $ | 43,573 | $ | 928,564 | ||||
| Net realized loss on investments | (3,437,721 | ) | (199,834 | ) | ||||
| Net change in unrealized appreciation/depreciation of investments | 12,147,794 | (21,024,946 | ) | |||||
Net increase (decrease) resulting from operations | 8,753,646 | (20,296,216 | ) | |||||
| CAPITAL SHARE TRANSACTIONS: | ||||||||
| Investor Class: | ||||||||
| Proceeds from shares sold | 134,636 | 2,797,994 | ||||||
| Proceeds from reinvestment of distributions | — | 821,432 | ||||||
| Payments for shares redeemed | (3,439,940 | ) | (3,717,534 | ) | ||||
| Decrease in net assets from Investor Class transactions | (3,305,304 | ) | (98,108 | ) | ||||
| Institutional Class: | ||||||||
| Proceeds from shares sold | 2,984,970 | 6,881,224 | ||||||
| Proceeds from reinvestment of distributions | — | 3,331,708 | ||||||
| Payments for shares redeemed | (9,197,091 | ) | (21,752,292 | ) | ||||
| Decrease in net assets from Institutional Class transactions | (6,212,121 | ) | (11,539,360 | ) | ||||
Net decrease in net assets from capital share transactions | (9,517,425 | ) | (11,637,468 | ) | ||||
| DISTRIBUTIONS TO SHAREHOLDERS: | ||||||||
| Net Distributions to Shareholders – Investor Class | — | (821,488 | ) | |||||
| Net Distributions to Shareholders – Institutional Class | — | (4,374,202 | ) | |||||
Total distributions to shareholders | — | (5,195,690 | ) | |||||
| TOTAL DECREASE IN NET ASSETS | (763,779 | ) | (37,129,374 | ) | ||||
| NET ASSETS: | ||||||||
| Beginning of Period | 41,542,547 | 78,671,921 | ||||||
| End of Period | $ | 40,778,768 | $ | 41,542,547 | ||||
See Notes to the Financial Statements
41
Great Lakes Bond Fund
Financial Highlights
For a Fund share outstanding throughout the period
Institutional Class
| Six Months Ended | ||||||||||||||||||||||||
| September 30, | Year Ended | Year Ended | Year Ended | Year Ended | Year Ended | |||||||||||||||||||
| 2020 | March 31, | March 31, | March 31, | March 31, | March 31, | |||||||||||||||||||
| (Unaudited) | 2020 | 2019 | 2018 | 2017 | 2016 | |||||||||||||||||||
| Per Common Share Data | ||||||||||||||||||||||||
Net asset value, beginning of period | $ | 9.54 | $ | 9.71 | $ | 9.68 | $ | 9.76 | $ | 9.81 | $ | 9.92 | ||||||||||||
| Investment operations: | ||||||||||||||||||||||||
| Net investment income | 0.10 | 0.25 | 0.25 | 0.22 | 0.21 | 0.23 | ||||||||||||||||||
| Net realized and unrealized | ||||||||||||||||||||||||
| gain (loss) on investments | 0.46 | (0.17 | ) | 0.03 | (0.08 | ) | (0.04 | ) | (0.10 | ) | ||||||||||||||
| Total from | ||||||||||||||||||||||||
| investment operations | 0.56 | 0.08 | 0.28 | 0.14 | 0.17 | 0.13 | ||||||||||||||||||
| Less distributions from: | ||||||||||||||||||||||||
| Net investment income | (0.10 | ) | (0.25 | ) | (0.25 | ) | (0.22 | ) | (0.22 | ) | (0.24 | ) | ||||||||||||
| Net realized gains | — | — | — | — | — | — | ||||||||||||||||||
| Total distributions | (0.10 | ) | (0.25 | ) | (0.25 | ) | (0.22 | ) | (0.22 | ) | (0.24 | ) | ||||||||||||
Net asset value, end of period | $ | 10.00 | $ | 9.54 | $ | 9.71 | $ | 9.68 | $ | 9.76 | $ | 9.81 | ||||||||||||
| Total return | 5.85 | %(1) | 0.79 | % | 3.02 | % | 1.44 | % | 1.71 | % | 1.40 | % | ||||||||||||
| Supplemental Data and Ratios | ||||||||||||||||||||||||
Net assets, at end of period (000’s) | $ | 95,830 | $ | 103,879 | $ | 130,002 | $ | 134,724 | $ | 120,752 | $ | 92,656 | ||||||||||||
Ratio of expenses to average net assets: | ||||||||||||||||||||||||
| Before expense waiver/recoupment | 0.60 | %(2) | 0.57 | % | 0.56 | % | 0.57 | % | 0.60 | % | 0.73 | % | ||||||||||||
| After expense waiver/recoupment | 0.60 | %(2) | 0.57 | % | 0.61 | % | 0.65 | % | 0.65 | % | 0.65 | % | ||||||||||||
Ratio of net investment income | ||||||||||||||||||||||||
to average net assets: | ||||||||||||||||||||||||
| After expense waiver/recoupment | 1.95 | %(2) | 2.54 | % | 2.65 | % | 2.22 | % | 2.13 | % | 2.32 | % | ||||||||||||
Portfolio Turnover Rate | 55 | %(1) | 87 | % | 47 | % | 52 | % | 69 | % | 68 | % | ||||||||||||
(1) | Not annualized. |
(2) | Annualized. |
See Notes to the Financial Statements
42
Great Lakes Disciplined Equity Fund
Financial Highlights
For a Fund share outstanding throughout the period
Institutional Class
| Six Months Ended | ||||||||||||||||||||||||
| September 30, | Year Ended | Year Ended | Year Ended | Year Ended | Year Ended | |||||||||||||||||||
| 2020 | March 31, | March 31, | March 31, | March 31, | March 31, | |||||||||||||||||||
| (Unaudited) | 2020 | 2019 | 2018 | 2017 | 2016 | |||||||||||||||||||
| Per Common Share Data | ||||||||||||||||||||||||
Net asset value, beginning of period | $ | 13.43 | $ | 14.97 | $ | 15.16 | $ | 15.61 | $ | 14.41 | $ | 14.94 | ||||||||||||
| Investment operations: | ||||||||||||||||||||||||
| Net investment income | 0.02 | 0.13 | 0.13 | 0.15 | 0.22 | 0.15 | ||||||||||||||||||
| Net realized and unrealized | ||||||||||||||||||||||||
| gain (loss) on investments | 4.30 | (1.08 | ) | 1.13 | 1.87 | 1.91 | (0.20 | ) | ||||||||||||||||
| Total from | ||||||||||||||||||||||||
| investment operations | 4.32 | (0.95 | ) | 1.26 | 2.02 | 2.13 | (0.05 | ) | ||||||||||||||||
| Less distributions from: | ||||||||||||||||||||||||
| Net investment income | (0.02 | ) | (0.13 | ) | (0.14 | ) | (0.15 | ) | (0.22 | ) | (0.15 | ) | ||||||||||||
| Net realized gains | — | (0.46 | ) | (1.31 | ) | (2.32 | ) | (0.71 | ) | (0.33 | ) | |||||||||||||
| Total distributions | (0.02 | ) | (0.59 | ) | (1.45 | ) | (2.47 | ) | (0.93 | ) | (0.48 | ) | ||||||||||||
Net asset value, end of period | $ | 17.73 | $ | 13.43 | $ | 14.97 | $ | 15.16 | $ | 15.61 | $ | 14.41 | ||||||||||||
| Total return | 32.27 | %(1) | -6.88 | % | 9.22 | % | 12.76 | % | 14.95 | % | -0.26 | % | ||||||||||||
| Supplemental Data and Ratios | ||||||||||||||||||||||||
Net assets, at end of period (000’s) | $ | 34,387 | $ | 29,253 | $ | 42,835 | $ | 44,160 | $ | 46,611 | $ | 47,852 | ||||||||||||
Ratio of expenses to average net assets: | ||||||||||||||||||||||||
| Before expense waiver | 1.16 | %(2) | 0.98 | % | 0.95 | % | 0.95 | % | 0.92 | % | 0.98 | % | ||||||||||||
| After expense waiver | 0.87 | %(2) | 0.85 | % | 0.85 | % | 0.85 | % | 0.85 | % | 0.85 | % | ||||||||||||
Ratio of expenses excluding interest | ||||||||||||||||||||||||
expense to average net assets: | ||||||||||||||||||||||||
| Before expense waiver | 1.14 | %(2) | 0.98 | % | 0.95 | % | 0.95 | % | 0.92 | % | 0.98 | % | ||||||||||||
| After expense waiver | 0.85 | %(2) | 0.85 | % | 0.85 | % | 0.85 | % | 0.85 | % | 0.85 | % | ||||||||||||
Ratio of net investment income | ||||||||||||||||||||||||
to average net assets: | ||||||||||||||||||||||||
| After expense waiver | 0.27 | %(2) | 0.85 | % | 0.85 | % | 0.91 | % | 1.39 | % | 1.04 | % | ||||||||||||
Portfolio Turnover Rate | 42 | %(1) | 97 | % | 107 | % | 104 | % | 114 | % | 112 | % | ||||||||||||
(1) | Not annualized. |
(2) | Annualized. |
See Notes to the Financial Statements
43
Great Lakes Large Cap Value Fund
Financial Highlights
For a Fund share outstanding throughout the period
Institutional Class
| Six Months Ended | ||||||||||||||||||||||||
| September 30, | Year Ended | Year Ended | Year Ended | Year Ended | Year Ended | |||||||||||||||||||
| 2020 | March 31, | March 31, | March 31, | March 31, | March 31, | |||||||||||||||||||
| (Unaudited) | 2020 | 2019 | 2018 | 2017 | 2016 | |||||||||||||||||||
| Per Common Share Data | ||||||||||||||||||||||||
Net asset value, beginning of period | $ | 10.09 | $ | 12.75 | $ | 14.29 | $ | 15.23 | $ | 13.45 | $ | 14.11 | ||||||||||||
| Investment operations: | ||||||||||||||||||||||||
| Net investment income | 0.10 | 0.22 | 0.25 | 0.20 | 0.24 | 0.25 | ||||||||||||||||||
| Net realized and unrealized | ||||||||||||||||||||||||
| gain (loss) on investments | 1.85 | (2.19 | ) | (0.08 | ) | 1.01 | 2.26 | (0.13 | ) | |||||||||||||||
| Total from | ||||||||||||||||||||||||
| investment operations | 1.95 | (1.97 | ) | 0.17 | 1.21 | 2.50 | 0.12 | |||||||||||||||||
| Less distributions from: | ||||||||||||||||||||||||
| Net investment income | (0.10 | ) | (0.22 | ) | (0.25 | ) | (0.20 | ) | (0.24 | ) | (0.25 | ) | ||||||||||||
| Net realized gains | — | (0.47 | ) | (1.46 | ) | (1.95 | ) | (0.48 | ) | (0.53 | ) | |||||||||||||
| Total distributions | (0.10 | ) | (0.69 | ) | (1.71 | ) | (2.15 | ) | (0.72 | ) | (0.78 | ) | ||||||||||||
Net asset value, end of period | $ | 11.94 | $ | 10.09 | $ | 12.75 | $ | 14.29 | $ | 15.23 | $ | 13.45 | ||||||||||||
| Total return | 19.36 | %(1) | -16.64 | % | 1.98 | % | 7.36 | % | 18.87 | % | 1.11 | % | ||||||||||||
| Supplemental Data and Ratios | ||||||||||||||||||||||||
Net assets, at end of period (000’s) | $ | 36,478 | $ | 37,423 | $ | 46,804 | $ | 50,135 | $ | 50,902 | $ | 46,137 | ||||||||||||
Ratio of expenses to average net assets: | ||||||||||||||||||||||||
| Before expense waiver | 1.03 | %(2) | 0.93 | % | 0.90 | % | 0.90 | % | 0.91 | % | 1.01 | % | ||||||||||||
| After expense waiver | 0.85 | %(2) | 0.85 | % | 0.85 | % | 0.85 | % | 0.85 | % | 0.85 | % | ||||||||||||
Ratio of net investment income | ||||||||||||||||||||||||
to average net assets: | ||||||||||||||||||||||||
| After expense waiver | 1.66 | %(2) | 1.62 | % | 1.76 | % | 1.28 | % | 1.66 | % | 1.82 | % | ||||||||||||
Portfolio Turnover Rate | 22 | %(1) | 27 | % | 42 | % | 61 | % | 48 | % | 67 | % | ||||||||||||
(1) | Not annualized. |
(2) | Annualized. |
See Notes to the Financial Statements
44
Great Lakes Small Cap Opportunity Fund
Financial Highlights
For a Fund share outstanding throughout the period
Investor Class
| Six Months Ended | ||||||||||||||||||||||||
| September 30, | Year Ended | Year Ended | Year Ended | Year Ended | Year Ended | |||||||||||||||||||
| 2020 | March 31, | March 31, | March 31, | March 31, | March 31, | |||||||||||||||||||
| (Unaudited) | 2020 | 2019 | 2018 | 2017 | 2016 | |||||||||||||||||||
| Per Common Share Data | ||||||||||||||||||||||||
Net asset value, beginning of period | $ | 10.44 | $ | 16.50 | $ | 17.36 | $ | 17.24 | $ | 14.36 | $ | 16.44 | ||||||||||||
| Investment operations: | ||||||||||||||||||||||||
| Net investment income (loss) | 0.06 | 0.18 | (0.01 | ) | 0.02 | 0.04 | 0.07 | |||||||||||||||||
| Net realized and unrealized | ||||||||||||||||||||||||
| gain (loss) on investments | 2.06 | (5.07 | ) | 1.05 | 1.35 | 2.90 | (1.10 | ) | ||||||||||||||||
| Total from | ||||||||||||||||||||||||
| investment operations | 2.12 | (4.89 | ) | 1.04 | 1.37 | 2.94 | (1.03 | ) | ||||||||||||||||
| Less distributions from: | ||||||||||||||||||||||||
| Net investment income | — | (0.14 | ) | — | (0.06 | ) | (0.06 | ) | (0.01 | ) | ||||||||||||||
| Net realized gains | — | (1.03 | ) | (1.90 | ) | (1.19 | ) | — | (1.04 | ) | ||||||||||||||
| Total distributions | — | (1.17 | ) | (1.90 | ) | (1.25 | ) | (0.06 | ) | (1.05 | ) | |||||||||||||
Net asset value, end of period | $ | 12.56 | $ | 10.44 | $ | 16.50 | $ | 17.36 | $ | 17.24 | $ | 14.36 | ||||||||||||
| Total return | 20.31 | %(1) | -32.07 | % | 7.28 | % | 7.98 | % | 20.47 | % | -5.80 | % | ||||||||||||
| Supplemental Data and Ratios | ||||||||||||||||||||||||
Net assets, at end of period (000’s) | $ | 4,413 | $ | 6,531 | $ | 10,868 | $ | 7,238 | $ | 9,772 | $ | 9,868 | ||||||||||||
Ratio of expenses to average net assets: | ||||||||||||||||||||||||
| Before expense waiver | 1.31 | %(2) | 1.13 | % | 1.10 | % | 1.10 | % | 1.10 | % | 1.13 | % | ||||||||||||
| After expense waiver | 1.24 | %(2) | 1.13 | % | 1.10 | % | 1.10 | % | 1.10 | % | 1.13 | % | ||||||||||||
Ratio of net investment income | ||||||||||||||||||||||||
to average net assets: | ||||||||||||||||||||||||
| After expense waiver | 0.23 | (2) | 1.06 | % | 0.00 | % | 0.05 | % | 0.14 | % | 0.36 | % | ||||||||||||
Portfolio Turnover Rate | 28 | %(1) | 53 | % | 115 | % | 101 | % | 106 | % | 102 | % | ||||||||||||
(1) | Not annualized. |
(2) | Annualized. |
See Notes to the Financial Statements
45
Great Lakes Small Cap Opportunity Fund
Financial Highlights
For a Fund share outstanding throughout the period
Institutional Class
| Six Months Ended | ||||||||||||||||||||||||
| September 30, | Year Ended | Year Ended | Year Ended | Year Ended | Year Ended | |||||||||||||||||||
| 2020 | March 31, | March 31, | March 31, | March 31, | March 31, | |||||||||||||||||||
| (Unaudited) | 2020 | 2019 | 2018 | 2017 | 2016 | |||||||||||||||||||
| Per Common Share Data | ||||||||||||||||||||||||
Net asset value, beginning of period | $ | 10.65 | $ | 16.80 | $ | 17.64 | $ | 17.51 | $ | 14.58 | $ | 16.65 | ||||||||||||
| Investment operations: | ||||||||||||||||||||||||
| Net investment income | 0.02 | 0.23 | 0.04 | 0.06 | 0.06 | 0.11 | ||||||||||||||||||
| Net realized and unrealized | ||||||||||||||||||||||||
| gain (loss) on investments | 2.16 | (5.18 | ) | 1.06 | 1.37 | 2.97 | (1.11 | ) | ||||||||||||||||
| Total from | ||||||||||||||||||||||||
| investment operations | 2.18 | (4.95 | ) | 1.10 | 1.43 | 3.03 | (1.00 | ) | ||||||||||||||||
| Less distributions from: | ||||||||||||||||||||||||
| Net investment income | — | (0.18 | ) | (0.04 | ) | (0.11 | ) | (0.10 | ) | (0.03 | ) | |||||||||||||
| Net realized gains | — | (1.02 | ) | (1.90 | ) | (1.19 | ) | — | (1.04 | ) | ||||||||||||||
| Total distributions | — | (1.20 | ) | (1.94 | ) | (1.30 | ) | (0.10 | ) | (1.07 | ) | |||||||||||||
Net asset value, end of period | $ | 12.83 | $ | 10.65 | $ | 16.80 | $ | 17.64 | $ | 17.51 | $ | 14.58 | ||||||||||||
| Total return | 20.47 | %(1) | -31.87 | % | 7.51 | % | 8.21 | % | 20.78 | % | -5.57 | % | ||||||||||||
| Supplemental Data and Ratios | ||||||||||||||||||||||||
Net assets, at end of period (000’s) | $ | 36,366 | $ | 35,011 | $ | 67,804 | $ | 74,626 | $ | 72,171 | $ | 60,631 | ||||||||||||
Ratio of expenses to average net assets: | ||||||||||||||||||||||||
| Before expense waiver | 1.06 | %(2) | 0.88 | % | 0.85 | % | 0.85 | % | 0.85 | % | 0.88 | % | ||||||||||||
| After expense waiver | 0.99 | %(2) | 0.88 | % | 0.85 | % | 0.85 | % | 0.85 | % | 0.88 | % | ||||||||||||
Ratio of net investment income | ||||||||||||||||||||||||
to average net assets: | ||||||||||||||||||||||||
| After expense waiver | 0.18 | %(2) | 1.32 | % | 0.25 | % | 0.30 | % | 0.39 | % | 0.61 | % | ||||||||||||
Portfolio Turnover Rate | 28 | %(1) | 53 | % | 115 | % | 101 | % | 106 | % | 102 | % | ||||||||||||
(1) | Not annualized. |
(2) | Annualized. |
See Notes to the Financial Statements
46
Great Lakes Funds
Notes to the Financial Statements (Unaudited)
September 30, 2020
1. ORGANIZATION
Managed Portfolio Series (the “Trust”) was organized as a Delaware statutory trust on January 27, 2011. The Trust is registered under the Investment Company Act of 1940 (the “1940 Act”), as amended, as an open-end management investment company. The Great Lakes Bond Fund (“Bond Fund”), Great Lakes Disciplined Equity Fund (“Disciplined Equity Fund”), Great Lakes Large Cap Value Fund (“Large Cap Value Fund”), and Great Lakes Small Cap Opportunity Fund (“Small Cap Opportunity Fund”) (each a “Fund” and collectively, the “Funds”) are each a diversified series with their own investment objectives and policies within the Trust. The investment objective of each Fund is total return. Additionally, the Bond Fund has an emphasis on current income. The Funds are investment companies and accordingly follow the investment company accounting and reporting guidance of the Financial Accounting Standards Board (“FASB”) Accounting Standards Codification Topic 946 Financial Services – Investment Companies. The Bond Fund and Large Cap Value Fund commenced operations on September 28, 2012. The Disciplined Equity Fund commenced operations on June 1, 2009 and the Small Cap Opportunity Fund commenced operations on December 5, 2008. The Small Cap Opportunity Fund currently offers two classes of shares, the Investor Class and the Institutional Class. Each class of shares has identical rights and privileges except with respect to the distribution fees and voting rights on matters affecting a single share class. The Bond Fund, Disciplined Equity Fund and Large Cap Value Fund currently offer only Institutional Class shares. The Funds may issue an unlimited number of shares of beneficial interest, with no par value.
2. SIGNIFICANT ACCOUNTING POLICIES
The following is a summary of significant accounting policies consistently followed by the Funds in preparation of its financial statements. These policies are in conformity with generally accepted accounting principles in the United States of America (“GAAP”).
Security Valuation – All investments in securities are recorded at their estimated fair value, as described in Note 3.
Federal Income Taxes – The Funds comply with the requirements of subchapter M of the Internal Revenue Code of 1986, as amended, necessary to qualify as regulated investment companies and distribute substantially all net taxable investment income and net realized gains to shareholders in a manner which results in no cost to the Funds. Therefore, no federal income or excise tax provision is required. As of and during the period ended September 30, 2020, the Funds did not have any tax positions that did not meet the “more-likely-than-not” threshold of being sustained by the applicable tax authority. The Funds recognize interest and penalties, if any, related to unrecognized tax benefits on uncertain tax positions as income tax expense in the Statements of Operations. As of and during the period ended September 30, 2020, the Funds did not incur any interest or penalties. The Funds are not subject to examination by U.S. tax authorities for the years prior to March 31, 2017.
Security Transactions, Investment Income and Distributions – The Funds follow industry practice and record security transactions on the trade date. Realized gains and losses on sales of securities are calculated on the basis of identified cost. Dividend income is recorded on the ex-dividend date and interest income is recorded on an accrual basis. Withholding taxes on foreign dividends have been provided for in accordance with the Funds’ understanding of the applicable country’s tax rules and regulations. Gains realized by the Funds on the sale of securities in certain countries may also be subject to non-U.S. taxes. Discounts and premiums on securities purchased are amortized over the expected life of the respective securities using the constant yield method.
47
Great Lakes Funds
Notes to the Financial Statements (Unaudited) – Continued
September 30, 2020
The Bond Fund will declare daily and pay monthly distributions of net investment income. The Large Cap Value Fund and the Disciplined Equity Fund will make distributions, if any, of net investment income quarterly. The Small Cap Opportunity Fund will make distributions, if any, of net investment income annually. The Funds will also distribute net capital gains, if any, at least annually, typically during the month of December. The Funds may make additional distributions if deemed to be desirable any time during the year. Distributions to shareholders are recorded on the ex-dividend date. The treatment for financial reporting purposes of distributions made to shareholders during the year from net investment income or net realized capital gains may differ from their treatment for federal income tax purposes. Where such differences are permanent in nature, GAAP requires that they be reclassified in the components of the net assets based on their ultimate characterization for federal income tax purposes.
New Accounting Pronouncements and Other Matters – In March 2017, the FASB issued Accounting Standards Update No. 2017-08 (“ASU”), Premium Amortization on Purchased Callable Debt Securities, which amends the accounting standards to shorten the amortization period of certain purchased callable debt securities to the earliest call date. The ASU is effective for fiscal years and interim periods within those fiscal years beginning after December 15, 2018. The Funds have adopted the new amendment as of April 1, 2019. This adoption of the ASU did not have a material impact on the financial statements and did not impact net assets of the Funds.
Foreign Currency – Investment securities and other assets and liabilities denominated in foreign currencies are translated into U.S. dollar amounts at the date of valuation. Purchases and sales of investment securities and income and expense items denominated in foreign currencies are translated into U.S. dollar amounts on the respective dates of such transactions. The Funds do not isolate that portion of the results of operations resulting from changes in foreign exchange rates on investments from the fluctuations arising from changes in market prices of securities held. Such fluctuations are included with the net realized and unrealized gain or loss from investments. The Funds report net realized foreign exchange gains or losses that arise from sales of foreign currencies, currency gains or losses realized between the trade and settlement dates on securities transactions, and the difference between the amounts of dividends, interest, and foreign withholding taxes recorded on the Funds’ books and the U.S. dollar equivalent of the amounts actually received or paid. Net unrealized foreign exchange gains and losses arise from changes in the fair values of assets and liabilities, other than investments in securities at fiscal period end, resulting from changes in exchange rates.
Use of Estimates – The preparation of financial statements in conformity with GAAP requires management to make estimates and assumptions that affect the reported amounts of assets and liabilities and disclosure of contingent assets and liabilities at the date of the financial statements and the reported amounts of revenues and expenses during the reporting period. Actual results could differ from those estimates.
Allocation of Income, Expenses and Gains/Losses – Income, expenses (other than those deemed attributable to a specific share class), and gains and losses of the Funds are allocated daily to each class of shares based upon the ratio of net assets represented by each class as a percentage of the net assets of each Fund. Expenses deemed directly attributable to a class of shares are recorded by the specific class. Most Fund expenses are allocated by class based on relative net assets. 12b-1 fees are expensed at 0.25% of average daily net assets of Investor Class shares. Expenses associated with a specific fund in the Trust are charged to that fund. Common Trust expenses are typically allocated evenly between the funds of the Trust, or by other equitable means.
Illiquid Securities – A security may be considered illiquid if it lacks a readily available market. Securities are generally considered liquid if they can be sold or disposed of in the ordinary course of business within seven days at
48
Great Lakes Funds
Notes to the Financial Statements (Unaudited) – Continued
September 30, 2020
approximately the price at which the security is valued by the Fund. Illiquid securities may be valued under methods approved by the Board of Trustees (the “Board”) as reflecting fair value. The Funds will not hold more than 15% of the value of their net assets in illiquid securities. At September 30, 2020, the Funds did not hold any illiquid securities.
Security Loans – When the Funds loan securities held in their portfolios, the Funds receive compensation in the form of fees, or retain a portion of the interest on the investment of any cash received as collateral. The Funds also continue to receive dividends on the securities loaned. The loans are secured by collateral at least equal to 105% of the value of the loaned securities that are foreign securities or 102% of the value of any other loaned securities marked-to-market daily. Loans shall be marked to market daily and the margin restored in the event collateralization is below 100% of the value of securities loaned. Gain or loss in the value of securities loaned that may occur during the term of the loan will be for the account of the Funds. The Funds have the right under the lending agreement to recover the securities from the borrower on demand. Currently, only the Small Cap Opportunity Fund is eligible to participate in securities lending. See Note 9.
LIBOR – The London Interbank Offered Rate, or “LIBOR,” is intended to represent the rate at which contributing banks may obtain short-term borrowings from each other in the London interbank market. LIBOR may be available for different durations (e.g., 1 month or 3 months) and for different currencies. The terms of many investments, financings or other transactions to which the Funds may have exposure have been historically tied to LIBOR. LIBOR may be a significant factor in determining the Funds’ payment obligations under a derivative investment, the cost of financing to the Funds or an investment’s value or return to the Funds, and may be used in other ways that affect the Funds’ investment performance.
The regulatory authority that oversees financial services firms and financial markets in the U.K. has announced that, after the end of 2021, it would no longer persuade or compel contributing banks to make rate submissions for purposes of determining the LIBOR rate. As a result, it is possible that commencing in 2022, LIBOR may no longer be available or no longer deemed an appropriate reference rate upon which to determine the interest rate on or impacting certain investments of the Funds’ portfolio.
In light of this eventuality, public and private sector industry initiatives are currently underway to identify new or alternative reference rates to be used in place of LIBOR. However, there are obstacles to converting certain securities and transactions to a new reference rate. Transition planning is at an early stage, and neither the effect of the transition process nor its ultimate success can yet be known. The transition process might lead to increased volatility and illiquidity in markets for instruments whose terms currently include LIBOR. It could also lead to a reduction in the value of some LIBOR-based investments and reduce the effectiveness of new hedges placed against existing LIBOR-based investments. There is no assurance that the composition or characteristics of any such alternative reference rate will be similar to or produce the same value or economic equivalence as LIBOR or that it will have the same volume or liquidity as did LIBOR prior to its discontinuance or unavailability, which may affect the value or liquidity or return on certain investments of the Funds and result in costs incurred in connection with closing out positions and entering into new trades. These risks may also apply with respect to changes in connection with other interbank offering rates (e.g., Euribor) and a wide range of other index levels, rates and values that are treated as “benchmarks” and are the subject of recent regulatory reform. All of the aforementioned may adversely affect the Funds’ performance or NAV.
49
Great Lakes Funds
Notes to the Financial Statements (Unaudited) – Continued
September 30, 2020
3. SECURITIES VALUATION
The Funds have adopted authoritative fair value accounting standards which establish an authoritative definition of fair value and set out a hierarchy for measuring fair value. These standards require additional disclosures about the various inputs and valuation techniques used to develop the measurements of fair value, a discussion in changes in valuation techniques and related inputs during the period and expanded disclosure of valuation levels for major security types. These inputs are summarized in the three broad levels listed below:
| Level 1 – | Unadjusted quoted prices in active markets for identical assets or liabilities that the Funds have the ability to access. |
| Level 2 – | Observable inputs other than quoted prices included in Level 1 that are observable for the asset or liability, either directly or indirectly. These inputs may include quoted prices for the identical instrument on an inactive market, prices for similar instruments, interest rates, prepayment speeds, credit risk, yield curves, default rates and similar data. |
| Level 3 – | Unobservable inputs for the asset or liability, to the extent relevant observable inputs are not available, representing the Funds’ own assumptions about the assumptions a market participant would use in valuing the asset or liability, and would be based on the best information available. |
Following is a description of the valuation techniques applied to each Fund’s major categories of assets and liabilities measured at fair value on a recurring basis. Each Fund’s investments are carried at fair value.
Equity Securities – Equity securities, including common stocks and exchange traded funds (“ETFs”) and real estate investment trusts (“REITs”), that are primarily traded on a national securities exchange shall be valued at the last sale price on the exchange on which they are primarily traded on the day of valuation or, if there has been no sale on such day, at the mean between the bid and ask prices. Securities traded primarily in the Nasdaq Global Market System for which market quotations are readily available shall be valued using the Nasdaq Official Closing Price (“NOCP”). If the NOCP is not available, such securities shall be valued at the last sale price on the day of valuation, or if there has been no sale on such day, at the mean between the bid and ask prices. To the extent these securities are actively traded, and valuation adjustments are not applied, they are categorized in Level 1 of the fair value hierarchy. If the market for a particular security is not active, and the mean between bid and ask prices is used, these securities are categorized in Level 2 of the fair value hierarchy.
In the case of foreign securities, the occurrence of events after the close of foreign markets, but prior to the time the Funds’ NAV is calculated will result in an adjustment to the trading prices of foreign securities when foreign markets open on the following business day. The Funds will value foreign securities at fair value, taking into account such events in calculating the NAV. In such cases, use of fair valuation can reduce an investor’s ability to seek to profit by estimating the Funds’ NAV in advance of the time the NAV is calculated. In such cases, these securities are categorized in Level 2 of the fair value hierarchy.
Investment Companies – Investments in other mutual funds, including money market funds, are valued at their NAV per share and are categorized in Level 1 of the fair value hierarchy.
Fixed Income Securities – Asset-backed, corporate, mortgage-backed, municipal bonds, and U.S. government & agency securities are valued at fair value on the basis of valuations furnished by an independent pricing service which utilizes both dealer-supplied valuations and formula-based techniques. The pricing service may consider
50
Great Lakes Funds
Notes to the Financial Statements (Unaudited) – Continued
September 30, 2020
recently executed transactions in securities of the issuer or comparable issuers, market price quotations (where observable), bond spreads, and fundamental data relating to the issuer. Fixed income securities are categorized in Level 2 of the fair value hierarchy.
Securities for which market quotations are not readily available, or if the closing price does not represent fair value, are valued following procedures approved by the Board. These procedures consider many factors, including the type of security, size of holding, trading volume and news events. There can be no assurance that the Fund could obtain the fair value assigned to a security if they were to sell the security at approximately the time at which the Fund determines their net asset values per share. The Board has established a Valuation Committee to administer, implement, and oversee the fair valuation process, and to make fair value decisions when necessary. The Board regularly reviews reports of the Valuation Committee that describe any fair value determinations and methods.
The inputs or methodology used for valuing securities are not an indication of the risk associated with investing in those securities. The following is a summary of the inputs used to value each Fund’s securities as of September 30, 2020:
| Bond Fund | Level 1 | Level 2 | Level 3 | Total | ||||||||||||
| Corporate Bonds | $ | — | $ | 39,209,478 | $ | — | $ | 39,209,478 | ||||||||
| Exchange-Traded Funds | 28,733,788 | — | — | 28,733,788 | ||||||||||||
| U.S. Treasury Securities | — | 19,752,090 | — | 19,752,090 | ||||||||||||
| U.S. Government Agency | ||||||||||||||||
| Mortgage-Backed Securities | — | 3,119,265 | — | 3,119,265 | ||||||||||||
| Municipal Bonds | — | 2,805,878 | — | 2,805,878 | ||||||||||||
| Commercial Mortgage-Backed Securities | — | 1,534,030 | — | 1,534,030 | ||||||||||||
| Asset-Backed Security | — | 259,963 | — | 259,963 | ||||||||||||
| Money Market Fund | 213,510 | — | — | 213,510 | ||||||||||||
| Total Investments | $ | 28,947,298 | $ | 66,680,704 | $ | — | $ | 95,628,002 | ||||||||
| Disciplined Equity Fund | Level 1 | Level 2 | Level 3 | Total | ||||||||||||
| Common Stocks | $ | 34,038,832 | $ | — | $ | — | $ | 34,038,832 | ||||||||
| Money Market Fund | 360,477 | — | — | 360,477 | ||||||||||||
| Total Investments | $ | 34,399,309 | $ | — | $ | — | $ | 34,399,309 | ||||||||
| Large Cap Value Fund | Level 1 | Level 2 | Level 3 | Total | ||||||||||||
| Common Stocks | $ | 35,265,496 | $ | — | $ | — | $ | 35,265,496 | ||||||||
| Money Market Fund | 1,377,117 | — | — | 1,377,117 | ||||||||||||
| Total Investments | $ | 36,642,613 | $ | — | $ | — | $ | 36,642,613 | ||||||||
| Small Cap Opportunity Fund | Level 1 | Level 2 | Level 3 | Total | ||||||||||||
| Common Stocks | $ | 39,313,674 | $ | — | $ | — | $ | 39,313,674 | ||||||||
| Money Market Fund | 1,881,293 | — | — | 1,881,293 | ||||||||||||
| Total Investments | $ | 41,194,967 | $ | — | $ | — | $ | 41,194,967 | ||||||||
Refer to the Schedule of Investments for further information on the classification of investments.
51
Great Lakes Funds
Notes to the Financial Statements (Unaudited) – Continued
September 30, 2020
The global outbreak of COVID-19 (commonly referred to as “coronavirus”) has disrupted economic markets and the prolonged economic impact is uncertain. The ultimate economic fallout from the pandemic, and the long-term impact on economies, markets, industries and individual issuers, are not known. The operational and financial performance of the issuers of securities in which the Funds invest depends on future developments, including the duration and spread of the outbreak, and such uncertainty may in turn adversely affect the value and liquidity of the Funds’ investments, impair the Funds’ ability to satisfy redemption requests, and negatively impact the Funds’ performance.
4. INVESTMENT ADVISORY FEE AND OTHER TRANSACTIONS WITH AFFILIATES
The Trust has an agreement with Great Lakes Advisors, LLC (the “Adviser”) to furnish investment advisory services to the Funds. For its services, the Funds pay the Adviser a monthly management fee based upon the average daily net assets of the Funds at the following annual rates:
| Fund | |||||
| Bond Fund | 0.40 | % | |||
| Disciplined Equity Fund | 0.60 | % | |||
| Large Cap Value Fund | 0.60 | % | |||
| Small Cap Opportunity Fund | 0.60 | % | |||
The Funds’ Adviser has contractually agreed to waive its management fees and pay Fund expenses to ensure that total annual operating expenses (excluding acquired fund fees and expenses, leverage/borrowing interest, interest expense, taxes, brokerage commissions, and extraordinary expenses) do not exceed the following rates (based upon the average daily net assets of the Funds):
| Fund | Investor Class | Institutional Class | |
| Bond Fund | N/A | 0.65% | |
| Disciplined Equity Fund | N/A | 0.85% | |
| Large Cap Value Fund | N/A | 0.85% | |
| Small Cap Opportunity Fund | 1.24% | 0.99% |
Fees waived and expenses paid by the Adviser may be recouped by the Adviser for a period of thirty-six months following the date on which such fee waiver and expense payment was made, if such recoupment can be achieved without exceeding the expense limit in effect at the time the fee waiver and expense payment occurred and the expense limit in effect at the time of recoupment. The Operating Expenses Limitation Agreement is intended to be continual in nature and cannot be terminated within a year after the effective date of the Funds’ prospectus. After that date, the agreement may be terminated at any time upon 60 days’ written notice by the Trust’s Board or the Adviser. Waived fees and reimbursed expenses subject to potential recovery by month of expiration are as follows:
| October 2020 – | April 2021 – | April 2022 – | April 2023 – | |||||||||||||
| Fund | March 2021 | March 2022 | March 2023 | September 2023 | ||||||||||||
| Bond Fund | $ | — | $ | — | $ | — | $ | — | ||||||||
| Disciplined Equity Fund | 22,069 | 44,304 | 56,140 | 48,784 | ||||||||||||
| Large Cap Value Fund | 10,244 | 23,953 | 40,009 | 37,629 | ||||||||||||
| Small Cap Opportunity Fund | — | — | 3,364 | 16,034 | ||||||||||||
U.S. Bancorp Fund Services, LLC (the “Administrator”), doing business as U.S. Bank Global Fund Services, acts as the Funds’ Administrator, Transfer Agent, and Fund Accountant. U.S. Bank, N.A. (the “Custodian”) serves as the custodian to the Funds. The Custodian is an affiliate of the Administrator. The Administrator performs various
52
Great Lakes Funds
Notes to the Financial Statements (Unaudited) – Continued
September 30, 2020
administrative and accounting services for the Funds. The Administrator prepares various federal and state regulatory filings, reports and returns for the Funds; prepares reports and materials to be supplied to the Trustees; monitors the activities of the Funds’ custodian; coordinates the payment of the Funds’ expenses and reviews the Funds’ expense accruals. The officers of the Trust, including the Chief Compliance Officer, are employees of the Administrator. As compensation for its services, the Administrator is entitled to a monthly fee at an annual rate based upon the average daily net assets of the Funds, subject to annual minimums. Fees paid by the Funds for administration and accounting, transfer agency, custody and compliance services for the period ended September 30, 2020, are disclosed in the Statements of Operations.
Quasar Distributors, LLC (“Quasar”) acts as the Funds’ principal underwriter in a continuous public offering of the Funds’ shares.
5. DISTRIBUTION AND SHAREHOLDER SERVICING FEES
The Small Cap Opportunity Fund has adopted a Distribution Plan pursuant to Rule 12b-1 (the “Plan”) in the Investor Class only. The Plan permits the Fund to pay for distribution and related expenses at an annual rate of 0.25% of the Investor Class average daily net assets. The expenses covered by the Plan may include the cost of preparing and distributing prospectuses and other sales material, advertising and public relations expenses, payments to financial intermediaries and compensation of personnel involved in selling shares of the Fund. Payments made pursuant to the Plan will represent compensation for distribution and service activities, not reimbursements for specific expenses incurred. For the period ended September 30, 2020, the Fund’s Investor Class incurred the following expenses pursuant to the Plan:
| Fund | Amount | |
| Small Cap Opportunity Fund | $7,119 |
6. CAPITAL SHARE TRANSACTIONS
Transactions in shares of the Funds were as follows:
| Bond Fund | Disciplined Equity Fund | |||||||||||||||
| Six Months Ended | Six Months Ended | |||||||||||||||
| September 30, 2020 | Year Ended | September 30, 2020 | Year Ended | |||||||||||||
| (Unaudited) | March 31, 2020 | (Unaudited) | March 31, 2020 | |||||||||||||
| Institutional Class: | ||||||||||||||||
| Shares sold | 138,126 | 1,143,958 | 66,192 | 344,093 | ||||||||||||
| Shares issued in reinvestment | ||||||||||||||||
| of distributions | 29,885 | 102,805 | 1,035 | 56,218 | ||||||||||||
| Shares redeemed | (1,479,823 | ) | (3,735,466 | ) | (305,750 | ) | (1,083,611 | ) | ||||||||
| Net decrease in capital shares | (1,311,812 | ) | (2,488,703 | ) | (238,523 | ) | (683,300 | ) | ||||||||
53
Great Lakes Funds
Notes to the Financial Statements (Unaudited) – Continued
September 30, 2020
| Large Cap Value Fund | Small Cap Opportunity Fund | |||||||||||||||
| Six Months Ended | Six Months Ended | |||||||||||||||
| September 30, 2020 | Year Ended | September 30, 2020 | Year Ended | |||||||||||||
| (Unaudited) | March 31, 2020 | (Unaudited) | March 31, 2020 | |||||||||||||
| Investor Class: | ||||||||||||||||
| Shares sold | — | — | 11,949 | 170,623 | ||||||||||||
| Shares issued in reinvestment | ||||||||||||||||
| of distributions | — | — | — | 51,989 | ||||||||||||
| Shares redeemed | — | — | (286,189 | ) | (255,895 | ) | ||||||||||
| Net decrease | — | — | (274,240 | ) | (33,283 | ) | ||||||||||
| Institutional Class: | ||||||||||||||||
| Shares sold | 114,599 | 562,956 | 264,240 | 431,536 | ||||||||||||
| Shares issued in reinvestment | ||||||||||||||||
| of distributions | 10,877 | 80,424 | — | 206,939 | ||||||||||||
| Shares redeemed | (777,433 | ) | (604,704 | ) | (716,655 | ) | (1,386,653 | ) | ||||||||
| Net increase (decrease) | (651,957 | ) | 38,676 | (452,415 | ) | (748,178 | ) | |||||||||
| Net increase (decrease) | ||||||||||||||||
| in capital shares | (651,957 | ) | 38,676 | (726,655 | ) | (781,461 | ) | |||||||||
7. INVESTMENT TRANSACTIONS
The aggregate purchases and sales, excluding short-term investments, by the Funds for the period ended September 30, 2020, were as follows:
| U.S. Government Securities | Other | |||||||||||||||
| Fund | Purchases | Sales | Purchases | Sales | ||||||||||||
| Bond Fund | $ | 24,081,650 | $ | 16,616,755 | $ | 29,504,491 | $ | 48,000,095 | ||||||||
| Disciplined Equity Fund | — | — | 14,079,347 | 22,802,914 | ||||||||||||
| Large Cap Value Fund | — | — | 8,456,062 | 14,353,866 | ||||||||||||
| Small Cap Opportunity Fund | — | — | 12,053,534 | 20,621,858 | ||||||||||||
8. INCOME TAX INFORMATION
The aggregate gross unrealized appreciation and depreciation of securities held by the Funds and the total cost of securities for federal income tax purposes at March 31, 2020, the Funds’ most recently completed fiscal year end, were as follows:
| Aggregate Gross | Aggregate Gross | Net Appreciation | Federal Income | |||||||||||||
| Fund | Appreciation | Depreciation | (Depreciation) | Tax Cost | ||||||||||||
| Bond Fund | $ | 1,210,935 | $ | (4,168,433 | ) | $ | (2,957,498 | ) | $ | 104,854,874 | ||||||
| Disciplined Equity Fund | 3,988,036 | (3,539,145 | ) | 448,891 | 33,349,690 | |||||||||||
| Large Cap Value Fund | 2,232,416 | (9,744,035 | ) | (7,511,619 | ) | 43,523,880 | ||||||||||
| Small Cap Opportunity Fund | 1,163,256 | (19,663,676 | ) | (18,500,420 | ) | 60,469,182 | ||||||||||
The difference between book-basis and tax-basis unrealized appreciation (depreciation) is attributable primarily to the differences in tax treatment of wash sales.
54
Great Lakes Funds
Notes to the Financial Statements (Unaudited) – Continued
September 30, 2020
At March 31, 2020, the Funds’ most recently completed fiscal year end, the components of accumulated earnings (deficit) on a tax-basis were as follows:
| Total | ||||||||||||||||||||
| Earnings | ||||||||||||||||||||
| Undistributed | Undistributed | Other | Unrealized | Distributable | ||||||||||||||||
| Ordinary | Long-Term | Accumulated | Appreciation | (Accumulated | ||||||||||||||||
| Fund | Income | Capital Gains | Losses | (Depreciation) | Losses) | |||||||||||||||
| Bond Fund | $ | 120,269 | $ | — | $ | (1,124,961 | ) | $ | (2,957,498 | ) | $ | (3,962,190 | ) | |||||||
| Disciplined Equity Fund | — | 1,288,707 | — | 448,891 | 1,737,598 | |||||||||||||||
| Large Cap Value Fund | 22,815 | — | — | (7,511,619 | ) | (7,488,804 | ) | |||||||||||||
| Small Cap Opportunity Fund | 280,888 | — | (697,286 | ) | (18,500,420 | ) | (18,916,818 | ) | ||||||||||||
As of March 31, 2020, the Funds’ most recently completed fiscal year end, the Funds’ had the following in capital loss carryovers, which will be permitted to be carried over for an unlimited period.
| Fund | Short-Term | Long-Term | ||||||
| Bond Fund | $ | — | $ | 962,168 | ||||
| Disciplined Equity Fund | — | — | ||||||
| Large Cap Value Fund | — | — | ||||||
| Small Cap Opportunity Fund | — | — | ||||||
During the year ended March 31, 2020, the Bond Fund utilized short-term capital loss carryovers of $483,714 and long-term capital loss carryovers of $618,384. The Disciplined Equity Fund, the Large Cap Value Fund and the Small Cap Opportunity Fund did not utilize any capital loss carryovers during the year ended March 31, 2020.
A regulated investment company may elect for any taxable year to treat any portion of any qualified late year loss as arising on the first day of the next taxable year. Qualified late year losses are certain capital and ordinary losses which occur during the portion of each Fund’s taxable year subsequent to October 31 and December 31, respectively. For the taxable year ended March 31, 2020, the Small Cap Opportunity plans to defer $697,286 in late year losses. The Bond Fund, Disciplined Equity Fund and Large Cap Value Fund do not plan to defer any late year losses.
The tax character of distributions paid during the period ended September 30, 2020, was as follows:
| Fund | Ordinary Income* | Long-Term Capital Gains** | Total | |||||||||
| Bond Fund | $ | 1,002,383 | $ | — | $ | 1,002,383 | ||||||
| Disciplined Equity Fund | 39,833 | — | 39,833 | |||||||||
| Large Cap Value Fund | 355,228 | — | 355,228 | |||||||||
| Small Cap Opportunity Fund | — | — | — | |||||||||
55
Great Lakes Funds
Notes to the Financial Statements (Unaudited) – Continued
September 30, 2020
The tax character of distributions paid during the year ended March 31, 2020, was as follows:
| Fund | Ordinary Income* | Long-Term Capital Gains** | Total | |||||||||
| Bond Fund | $ | 3,262,785 | $ | — | $ | 3,262,785 | ||||||
| Disciplined Equity Fund | 485,757 | 1,111,067 | 1,596,824 | |||||||||
| Large Cap Value Fund | 777,020 | 1,701,496 | 2,478,516 | |||||||||
| Small Cap Opportunity Fund | 3,979,338 | 1,216,352 | 5,195,690 | |||||||||
| * | For Federal income tax purposes, distributions of short-term capital gains are treated as ordinary income. |
| ** | The Fund designated as long-term capital gain dividend, pursuant to Internal Revenue Code Section 852(b)(3), the amount necessary to reduce the earnings and profits of the Fund related to net capital gain to zero for the tax year ended March 31, 2020. To the extent necessary to fully distribute such capital gain, the Funds also designate earnings and profits distributed to shareholders on the redemption of shares. |
9. SECURITIES LENDING
Following the terms of a securities lending agreement with the Funds’ Custodian, the Funds may lend securities from its portfolio to brokers, dealers and financial institutions in order to increase the return on its portfolio, primarily through the receipt of borrowing fees and earnings on invested collateral. Any such loan must be continuously secured by collateral in cash or cash equivalents maintained on a current basis in an amount at least equal to 105% of the value of the loaned securities that are foreign securities or 102% of the value of any other loaned securities marked-to-market daily. Loans shall be marked to market daily and the margin restored in the event the collateralization is below 100% of the value of the securities loaned. During the time securities are on loan, the borrower will pay the applicable Fund any accrued income on those securities, and the Fund may invest the cash collateral and earn income or receive an agreed-upon fee from a borrower that has delivered cash-equivalent collateral. In determining whether or not to lend a security to a particular broker, dealer or financial institution, the Adviser considers all relevant facts and circumstances, including the size, creditworthiness and reputation of the broker, relevant facts dealer or financial institution. Securities lending involves the risk of a default or insolvency of the borrower. In either of these cases, a Fund could experience delays in recovering securities or collateral or could lose all or part of the value of the loaned securities. A Fund also could lose money in the event of a decline in the value of the collateral provided for loaned securities. Additionally, the loaned portfolio securities may not be available to a Fund on a timely basis and that Fund may therefore lose the opportunity to sell the securities at a desirable price. Any decline in the value of a security that occurs while the security is out on loan would continue to be borne by the applicable Fund. Currently, only the Small Cap Opportunity Fund is eligible to participate in securities lending. As of September 30, 2020, the Small Cap Opportunity Fund had no securities on loan.
The Funds receive cash as collateral in return for securities lent as part of the securities lending program. The collateral is invested in the First American Government Obligations Fund – Class Z (a money market fund subject to Rule 2a-7 under the 1940 Act). The remaining contractual maturity of all securities lending transactions is overnight and continuous. The Funds are not subject to a master netting agreement with respect to securities lending; therefore, no additional disclosures are required. The fee and interest income earned by the Funds on investments of cash collateral received from borrowers for the securities loaned to them are reflected in the Funds’ Statements of Operations. Securities lending income, as disclosed in the Funds’ Statements of Operations, represents the income earned from the investment of cash collateral, net of fee rebates paid to the borrower and net of fees paid to the Custodian as lending agent.
56
Great Lakes Funds
Notes to the Financial Statements (Unaudited) – Continued
September 30, 2020
10. LINE OF CREDIT
The Funds have established an unsecured line of credit (“LOC”) in the amount of $25,000,000, 15% of a Fund’s gross market value or 33.33% of the fair value of the Fund’s investments, whichever is less. The LOC matures, unless renewed on July 23, 2021. The LOC is intended to provide short-term financing, if necessary, subject to certain restrictions and covenants, in connection with shareholder redemptions and other short-term liquidity needs of the Funds. The LOC is with the Custodian. Interest is charged at the prime rate which was 3.25% as of and during the period ended September 30, 2020. The Funds have authorized U.S. Bank N.A. to charge any of the accounts of the Funds for any missed payments. For the period ended September 30, 2020, the Small Cap Opportunity Fund did not have any borrowings under the LOC. For the period ended September 30, 2020, the Bond Fund, Disciplined Equity Fund and Large Cap Value Fund LOC activity was as follows:
| Amount | ||||||||||||||||||
| Outstanding | Date of | |||||||||||||||||
| Average | as of | Interest | Maximum | Maximum | ||||||||||||||
| LOC Agent | Fund | Borrowings | September 30, 2020 | Expense | Borrowing | Borrowing | ||||||||||||
| U.S. Bank N.A. | Bond Fund | $ | 3,738 | $ | — | $ | 62 | $ | 684,000 | 04/01/2020 | ||||||||
| U.S. Bank N.A. | Disciplined | 147,716 | — | 2,450 | 5,184,000 | 04/01/2020 | ||||||||||||
| Equity Fund | ||||||||||||||||||
| U.S. Bank N.A. | Large Cap | 22,967 | — | 379 | 4,203,000 | 04/01/2020 | ||||||||||||
| Value Fund | ||||||||||||||||||
11. SECTOR RISK
As of September 30, 2020, the Bond Fund and the Large Cap Value Fund had a significant portion of their assets invested in the financials sector. The financials sector may be more greatly impacted by the performance of the overall economy, interest rates, competition, and consumer confidence spending. The Disciplined Equity Fund had a significant portion of its assets invested in the information technology sector. The information technology sector may be more sensitive to short product cycles, competition and more aggressive pricing than the overall market.
12. CONTROL OWNERSHIP
The beneficial ownership, either directly or indirectly, of more than 25% of the voting securities of a fund creates a presumption of control of the fund, under Section 2(a)(9) of the 1940 Act. As of September 30, 2020, each Fund’s percentage of control ownership positions greater than 25% are as follows:
| Fund | Shareholder | Percent of Shares Held |
Bond Fund | Maril & Co. FBO | 69.83% |
Wells Fargo Clearing | 26.17% | |
Disciplined Equity Fund | Maril & Co. FBO | 56.99% |
Wells Fargo Clearing | 37.81% | |
Large Cap Value Fund | Maril & Co. FBO | 43.60% |
Wells Fargo Clearing | 28.66% | |
Small Cap Opportunity Fund | Wells Fargo Clearing | 40.34% |
57
Great Lakes Funds
Discussion of Liquidity Risk Management Program (Unaudited)
Pursuant to Rule 22e-4 under the Investment Company Act of 1940, the Trust, on behalf of the Great Lakes Small Cap Opportunity Fund, the Great Lakes Bond Fund, the Great Lakes Large Cap Value Fund, and the Great Lakes Disciplined Equity Fund (each a “Fund” and together, the “Funds”), has adopted and implemented a written liquidity risk management program (the “Program”) that includes policies and procedures reasonably designed to comply with the requirements of Rule 22e-4, including: (i) assessment, management and periodic review of liquidity risk; (ii) classification of portfolio holdings; (iii) establishment of a highly liquid investment minimum (“HLIM”), as applicable; (iv) limitation on illiquid investments; and (v) redemptions in-kind. The Trust’s Board of Trustees (the “Board”) has approved the designation of Great Lakes Advisors, LLC (“Great Lakes”) as the administrator of the Program (the “Program Administrator”). Personnel of Great Lakes conduct the day-to-day operation of the Program pursuant to policies and procedures administered by the Program Administrator.
In accordance with Rule 22e-4, the Board reviewed a report prepared by the Program Administrator (the “Report”) regarding the operation of the Program and its adequacy and effectiveness of implementation for the period June 1, 2019, through December 31, 2019 (the “Reporting Period”). No significant liquidity events impacting the Funds during the Reporting Period or material changes to the Program were noted in the Report.
Under the Program, the Program Administrator manages and periodically reviews each Fund’s liquidity risk, including consideration of applicable factors specified in Rule 22e-4 and the Program. Liquidity risk is defined as the risk that a Fund could not meet shareholder redemption requests without significant dilution of remaining shareholders’ interests in the Fund. In general, this risk was managed during the Reporting Period by monitoring the degree of liquidity of each Fund’s investments, limiting the amount of each Fund’s illiquid investments, and utilizing various risk management tools and facilities available to each Fund for meeting shareholder redemptions, among other means. In the Report, Great Lakes provided its assessment that, based on the information considered in its review, the Program remains reasonably designed to manage each Fund’s liquidity risk and each Fund’ s investment strategy remains appropriate for an open-end fund.
Pursuant to the Program, the Program Administrator oversaw the classification of each of the Funds’ portfolio investments as highly liquid, moderately liquid, less liquid or illiquid during the Reporting Period, including in connection with recording investment classifications on Form N-PORT. The process utilized by Great Lakes for determining the degree of liquidity of each Fund’s investments is supported by one or more third-party liquidity assessment vendors.
Each Fund qualified as a “primarily highly liquid fund” as defined in the Program during the Reporting Period. Accordingly, each Fund was not required to establish a HLIM or comply with the related Program provisions during the Reporting Period.
During the Reporting Period, each Fund’s investments were monitored for compliance with the 15% limitation on illiquid investments pursuant to the Program and in accordance with Rule 22e-4.
The Report noted that the Funds’ redemptions in-kind during the Reporting Period were effectuated in accordance with the Trust’s Redemption in Kind policy. The Report concluded, with respect to each Fund: (i) the Program was implemented and operated effectively to achieve the goal of assessing and managing the Fund’s liquidity risk during the Reporting Period; and (ii) the Fund was able to meet requests for redemption without significant dilution of remaining investors’ interests in the Fund during the Reporting Period.
58
Great Lakes Funds
Additional Information (Unaudited)
September 30, 2020
AVAILABILITY OF FUND PORTFOLIO INFORMATION
Each Fund files complete schedules of portfolio holdings with the SEC for the first and third quarters of each fiscal year on Part F of Form N-PORT (beginning with filings after March 31, 2020). The Funds’ Part F of Form N-PORT are available on the SEC’s website at www.sec.gov and may be reviewed and copied at the SEC’s Public Reference Room in Washington, D.C. For information on the Public Reference Room call 1-800-SEC-0330. In addition, each Fund’s Form N-Q Part F of Form N-PORT is available without charge upon request by calling 1-855-278-2020.
AVAILABILITY OF FUND PROXY VOTING INFORMATION
A description of the Funds’ Proxy Voting Policies and Procedures is available without charge, upon request, by calling 1-855-278-2020. Information regarding how the Funds voted proxies relating to portfolio securities during the most recent 12-month period ended June 30 is available (1) without charge, upon request, by calling 1-855-278-2020, or (2) on the SEC’s website at www.sec.gov.
59
(This Page Intentionally Left Blank.)
Great Lakes Funds
PRIVACY NOTICE (UNAUDITED)
The Funds collect only relevant information about you that the law allows or requires it to have in order to conduct its business and properly service you. The Funds collect financial and personal information about you (“Personal Information”) directly (e.g., information on account applications and other forms, such as your name, address, and social security number, and information provided to access account information or conduct account transactions online, such as password, account number, e-mail address, and alternate telephone number), and indirectly (e.g., information about your transactions with us, such as transaction amounts, account balance and account holdings).
The Funds do not disclose any non-public personal information about its shareholders or former shareholders other than for everyday business purposes such as to process a transaction, service an account, respond to court orders and legal investigations or as otherwise permitted by law. Third parties that may receive this information include companies that provide transfer agency, technology and administrative services to the Funds, as well as the Funds’ investment adviser who is an affiliate of the Funds. If you maintain a retirement/educational custodial account directly with the Funds, we may also disclose your Personal Information to the custodian for that account for shareholder servicing purposes. The Funds limit access to your Personal Information provided to unaffiliated third parties to information necessary to carry out their assigned responsibilities to the Funds. All shareholder records will be disposed of in accordance with applicable law. The Funds maintain physical, electronic and procedural safeguards to protect your Personal Information and requires its third-party service providers with access to such information to treat your Personal Information with the same high degree of confidentiality.
In the event that you hold shares of the Funds through a financial intermediary, including, but not limited to, a broker-dealer, credit union, bank or trust company, the privacy policy of your financial intermediary governs how your non-public personal information is shared with unaffiliated third parties.
INVESTMENT ADVISER
Great Lakes Advisors, LLC
231 South LaSalle Street, 4th Floor
Chicago, Illinois 60604
DISTRIBUTOR
Quasar Distributors, LLC
111 East Kilbourn Avenue, Suite 2200
Milwaukee, Wisconsin 53202
CUSTODIAN
U.S. Bank, N.A.
1555 North River Center Drive
Milwaukee, Wisconsin 53212
ADMINISTRATOR, FUND ACCOUNTANT
AND TRANSFER AGENT
U.S. Bancorp Fund Services, LLC
615 East Michigan Street
Milwaukee, Wisconsin 53202
INDEPENDENT REGISTERED PUBLIC ACCOUNTING FIRM
Cohen & Company, Ltd.
1350 Euclid Avenue, Suite 800
Cleveland, Ohio 44115
LEGAL COUNSEL
Stradley Ronon Stevens & Young, LLP
2005 Market Street, Suite 2600
Philadelphia, Pennsylvania 19103
This report must be accompanied or preceded by a prospectus.
The Funds’ Statement of Additional Information contains additional information about the
Funds’ trustees and is available without charge upon request by calling 1-855-278-2020.
GK-SEMI
Item 2. Code of Ethics.
Not applicable for semi-annual reports.
Item 3. Audit Committee Financial Expert.
Not applicable for semi-annual reports.
Item 4. Principal Accountant Fees and Services.
Not applicable for semi-annual reports.
Item 5. Audit Committee of Listed Registrants.
Not applicable to registrants who are not listed issuers (as defined in Rule 10A-3 under the Securities Exchange Act of 1934).
Item 6. Investments.
(a) Schedule of Investments is included as part of the report to shareholders filed under Item 1 of this Form.
(b) Not applicable.
Item 7. Disclosure of Proxy Voting Policies and Procedures for Closed-End Management Investment Companies.
Not applicable to open-end investment companies.
Item 8. Portfolio Managers of Closed-End Management Investment Companies.
Not applicable to open-end investment companies.
Item 9. Purchases of Equity Securities by Closed‑End Management Investment Company and Affiliated Purchasers.
Not applicable to open-end investment companies.
Item 10. Submission of Matters to a Vote of Security Holders.
There have been no material changes to the procedures by which shareholders may recommend nominees to the registrant’s board of trustees.
Item 11. Controls and Procedures.
(a) | The Registrant’s President and Treasurer have reviewed the Registrant's disclosure controls and procedures (as defined in Rule 30a-3(c) under the Investment Company Act of 1940 (the “Act”)) as of a date within 90 days of the filing of this report, as required by Rule 30a-3(b) under the Act and Rules 13a-15(b) or 15d‑15(b) under the Securities Exchange Act of 1934. Based on their review, such officers have concluded that the disclosure controls and procedures are effective in ensuring that information required to be disclosed in this report is appropriately recorded, processed, summarized and reported and made known to them by others within the Registrant and by the Registrant’s service provider. |
(b) | There were no changes in the Registrant's internal control over financial reporting (as defined in Rule 30a-3(d) under the Act) that occurred during the period covered by this report that has materially affected, or is reasonably likely to materially affect, the Registrant's internal control over financial reporting. |
Item 12. Disclosure of Securities Lending Activities for Closed-End Management Investment Companies.
Not applicable to open-end investment companies.
Item 13. Exhibits.
| (a) | (1) Any code of ethics or amendment thereto, that is the subject of the disclosure required by Item 2, to the extent that the registrant intends to satisfy Item 2 requirements through filing an exhibit. Not applicable for semi-annual reports. |
(3) Any written solicitation to purchase securities under Rule 23c‑1 under the Act sent or given during the period covered by the report by or on behalf of the registrant to 10 or more persons. Not applicable to open-end investment companies.
(4) Change in the registrant’s independent public accountant. There was no change in the registrant’s independent public accountant for the period covered by this report.
SIGNATURES
Pursuant to the requirements of the Securities Exchange Act of 1934 and the Investment Company Act of 1940, the registrant has duly caused this report to be signed on its behalf by the undersigned, thereunto duly authorized.
(Registrant) Managed Portfolio Series
By (Signature and Title)* /s/Brian R. Wiedmeyer
Brian R. Wiedmeyer, President
Date December 3, 2020
Pursuant to the requirements of the Securities Exchange Act of 1934 and the Investment Company Act of 1940, this report has been signed below by the following persons on behalf of the registrant and in the capacities and on the dates indicated.
By (Signature and Title)* /s/Brian R. Wiedmeyer
Brian R. Wiedmeyer, President
Date December 3, 2020
By (Signature and Title)* /s/Benjamin J. Eirich
Benjamin J. Eirich, Treasurer
Date December 3, 2020
* Print the name and title of each signing officer under his or her signature.