UNITED STATES
SECURITIES AND EXCHANGE COMMISSION
Washington, D.C. 20549
SECURITIES AND EXCHANGE COMMISSION
Washington, D.C. 20549
FORM N-CSR
CERTIFIED SHAREHOLDER REPORT OF REGISTERED
MANAGEMENT INVESTMENT COMPANIES
Investment Company Act file number 811-22525
Managed Portfolio Series
(Exact name of registrant as specified in charter)
(Exact name of registrant as specified in charter)
615 East Michigan Street
Milwaukee, WI 53202
(Address of principal executive offices) (Zip code)
(Address of principal executive offices) (Zip code)
Brian R. Wiedmeyer, President
Managed Portfolio Series
c/o U.S. Bancorp Fund Services, LLC
777 East Wisconsin Ave, 5th Fl
Milwaukee, WI 53202
(Name and address of agent for service)
(Name and address of agent for service)
(414) 765-6844
Registrant's telephone number, including area code
Date of fiscal year end: March 31, 2021
Date of reporting period: September 30, 2020
Item 1. Reports to Stockholders.
Port Street Quality Growth Fund
Institutional Class Shares — PSQGX
Beginning on January 1, 2021, as permitted by regulations adopted by the SEC, paper copies of the Fund’s shareholder reports will no longer be sent by mail, unless you specifically request paper copies of the reports from the Fund (defined herein) or from your financial intermediary, such as a broker-dealer or bank. Instead, the reports will be made available on the Fund’s website (https://www.portstreetinvest.com/port-street-quality-growth-fund/about-the-fund/), and you will be notified by mail each time a report is posted and provided with a website link to access the report.
If you already elected to receive shareholder reports electronically, you will not be affected by this change and you need not take any action. You may elect to receive shareholder reports and other communications from the Fund by contacting your financial intermediary (such as a broker-dealer or bank) or, if you are a direct investor, by calling 1-855-369-6220 or by sending an e-mail request to info@portstreetinvest.com.
You may elect to receive all future reports in paper free of charge. If you invest through a financial intermediary, you can contact your financial intermediary to request that you continue to receive paper copies of your shareholder reports. If you invest directly with the Fund, you can call 1-855-369-6220 or send an e-mail request to info@portstreetinvest.com to let the Fund know you wish to continue receiving paper copies of your shareholder reports. Your election to receive reports in paper will apply to all funds held in your account if you invest through your financial intermediary.
| Semi-Annual Report | |
| www.portstreetinvest.com | September 30, 2020 |
(This Page Intentionally Left Blank.)
PORT STREET QUALITY GROWTH FUND
Dear Shareholders,
Thank you for the opportunity to report on the Fund’s performance strategy, and outlook.
Quality Growth Fund Performance
For the six-months ending September 30, 2020, the Port Street Quality Growth Fund returned 14.87%, while the S&P 500® returned 31.31%.
The Fund’s large cash position (46%) led to some performance lag relative to its benchmark during the summer months of 2020, but as volatility returned due to a debate over further Fiscal Stimulus, our cash position and quality portfolio provided expected ballast as markets sold off in September.
Our performance compared to the benchmark during the last six months was in-line with our expectations, with the Fund participating in positive returns at a rate greater than our participation in negative returns.
Quality Growth Fund Strategy
Quality Growth’s approach to investing focuses on those companies that can be purchased at market prices below their fair value with a record of consistent, above average profit growth, strong balance sheets, sustainable competitive advantages, and capable management. The source of such growth is persistently above average profitability, which, when combined with a sensible policy relating to the payout of such profits and intelligent re-investment, results in the compounding of retained earnings and long-term growth. Quality Growth’s investment strategy is designed to grow purchasing power in excess of inflation and outperform the general market over time while mitigating losses during periods of economic adversity.
Outlook
In the last six months the world has experienced a generational pandemic and every central bank in the world has fully extended themselves to stave off a globally synchronous recession, if not depression. As a result, fundamentals have been cast aside and stock prices have risen to record highs. This condition is temporary.
While the hope for more fiscal stimulus continues to buoy equities, we expect further short-term underperformance relative to benchmarks for the Fund. Our long-term fundamental approach to stock picking will be rewarded as government stimulus wanes and Quantitative Easing become less and less effective.
The Federal Reserve has announced their plan to keep interest rates near zero through 2023 and have also announced their intent to attempt to create higher than usual inflation, using Financial Repression to inflate the country out of its record debt level. Our portfolio’s low Maintenance CapEx and high Return on Equity will be rewarded as this scenario plays out.
For active managers like us, as long as equity markets and valuations continue to rise, the investable universe of great businesses priced below their intrinsic value continues to shrink. Because we are trying to maximize returns on every dollar we deploy, we remain strictly disciplined on the price we pay and the risk we’re taking to own a business.
We fully expect our disciplined approach to prevent us from fully participating in synthetic bull markets. Importantly, however, we also expect this discipline to protect us from permanent capital impairment when a long-anticipated revaluation of assets occurs. Furthermore, we expect that regardless of timing and direction, the capital preservation bias underlying our strategy will allow us the potential to better protect capital in down periods and in turn seek to better compound capital over full market cycles.
1
PORT STREET QUALITY GROWTH FUND
Thank you for your trust and confidence in our stewardship.
| Graham Pierce | Douglas Allison, CFA |
| CEO | President |
Diversification does not assure a profit nor protect against a loss in a declining market.
Opinions expressed are those of the Investment Manager and are subject to change, are not guaranteed and should not be considered investment advice.
Must be Preceded or Accompanied by a Prospectus.
The S&P 500® Index is a stock market index based on the market capitalizations of 500 large companies having common stock listed on the NYSE or NASDAQ. It is not possible to directly invest in an index.
Duration is a measure of the price sensitivity of a bond to interest rate movements.
Maintenance CapEx refers to the capital expenditure that is necessary for a company to continue operating in its current form.
Return on equity (ROE) is a measure of financial performance calculated by dividing net income by shareholders’ equity.
Fund holdings and sector allocations are subject to change and should not be considered to be a recommendation to buy or sell any security. For a complete list of Fund holdings, please refer to the Schedule of Investments in this report.
Mutual fund investing involves risk. Principal loss is possible. Investments in small-and mid-capitalization companies involve additional risks such as limited liquidity and greater volatility than large capitalization companies. Investments in foreign securities involve greater volatility; political, economic and currency risks; and differences in accounting methods. The Fund may have a relatively high concentration of assets in a single or smaller number of securities which can result in reduced diversification and greater volatility. The Fund will bear its share of expenses and the underlying risks of investments in Exchange Traded Funds (“ETFs”) and other investment companies. The market price of the shares of an ETF will fluctuate based on changes in the net asset value as well as changes in the supply and demand of its shares in the secondary market. It is also possible that an active secondary market of an ETF’s shares may not develop and market trading in the shares of the ETF may be halted under certain circumstances.
Port Street Funds are distributed by Quasar Distributors, LLC.
2
PORT STREET QUALITY GROWTH FUND
Value of $10,000 Investment (Unaudited)

The chart assumes an initial investment of $10,000. Performance reflects waivers of fee and operating expenses in effect. In the absence of such waivers, total return would be reduced. Past performance is not predictive of future performance. Investment return and principal value will fluctuate, so that your shares, when redeemed may be worth more or less than their original cost. Performance current to the most recent month-end may be lower or higher than the performance quoted and can be obtained by calling 1-855-369-6220. Performance assumes the reinvestment of capital gains and income distributions. The performance does not reflect the deduction of taxes that a shareholder would pay on Fund distributions or the redemption of Fund shares.
Annualized Rates of Return (%) – as of September 30, 2020
| Since | ||||
1 Year | 3 Year | 5 Year | Inception(1) | |
| Port Street Quality Growth Fund | 8.73% | 8.17% | 8.61% | 6.98% |
S&P 500® Index(2) | 15.15% | 12.28% | 14.15% | 11.67% |
| (1) | The Fund commenced operations on April 1, 2014. |
| (2) | The S&P 500® Index is a stock market index based on the market capitalization of 500 large companies having common stock listed on the NYSE or NASDAQ. It is not possible to directly in an index. |
The following is expense information for the Fund as disclosed in the most recent prospectus dated July 29, 2020: Gross Expenses: 1.21%, Net Expenses: 0.97%.
Port Street Investments, LLC (the “Adviser”) has contractually agreed to reduce its management fees, and pay Fund expenses in order to ensure that Total Annual Fund Operating Expenses (excluding any acquired fund fees and expenses, leverage/borrowing interest, interest expense, dividends paid on short sales, taxes, brokerage commissions and other transactional expenses, and extraordinary expenses) do not exceed 0.97% of the Fund’s average daily net assets. Fees waived and expenses paid by the Adviser may be recouped by the Adviser for a period of 36 months following the month during which such fee waiver and expense payment was made if such recoupment can be achieved without exceeding the expense limit in effect at the time the fee waiver and expense payment occurred and the expense limit in place at the time of recoupment. The Operating Expenses Limitation Agreement is indefinite in term and cannot be terminated through July 29, 2021. Thereafter, the agreement may be terminated at any time upon 60 days’ written notice by the Trust’s Board of Trustees (the “Board”) or the Adviser, with the consent of the Board.
3
PORT STREET QUALITY GROWTH FUND
Expense Example (Unaudited)
September 30, 2020
As a shareholder of the Fund, you incur two types of costs: (1) transaction costs, including brokerage commissions on purchases and sales of Fund shares, and (2) ongoing costs, including management fees, shareholder servicing fees, and other Fund expenses. This Example is intended to help you understand your ongoing costs (in dollars) of investing in the Fund and to compare these costs with the ongoing costs of investing in other mutual funds. The Example is based on an investment of $1,000 invested at the beginning of the period and held for the entire period (April 1, 2020 – September 30, 2020).
ACTUAL EXPENSES
The first line of the table below provides information about actual account values and actual expenses. You may use the information in this line, together with the amount you invested, to estimate the expenses that you paid over the period. Simply divide your account value by $1,000 (for example, an $8,600 account value divided by $1,000 = 8.6), then multiply the result by the number in the first line under the heading entitled “Expenses Paid During Period” to estimate the expenses you paid on your account during this period.
HYPOTHETICAL EXAMPLE FOR COMPARISON PURPOSES
The second line of the table below provides information about hypothetical account values and hypothetical expenses based on the Fund’s actual expense ratio and an assumed rate of return of 5% per year before expenses, which is not the Fund’s actual return. The hypothetical account values and expenses may not be used to estimate the actual ending account balance or expenses you paid for the period. You may use this information to compare the ongoing costs of investing in the Fund and other funds. To do so, compare this 5% hypothetical example with the 5% hypothetical examples that appear in the shareholder reports of the other funds.
Please note that the expenses shown in the table are meant to highlight your ongoing costs only and do not reflect any transactional costs. Therefore, the second line of the table is useful in comparing ongoing costs only, and will not help you determine the relative total costs of owning different funds. In addition, if transactional costs were included, your costs may have been higher.
| Beginning | Ending | Expenses Paid | |
| Account Value | Account Value | During Period(1) | |
(4/1/2020) | (9/30/2020) | (4/1/2020 to 9/30/2020) | |
Institutional Class Actual(2) | $1,000.00 | $1,148.70 | $5.22 |
| Institutional Class Hypothetical | |||
| (5% return before expenses) | $1,000.00 | $1,020.21 | $4.91 |
(1) | Expenses are equal to the Fund’s annualized expense ratio for the most recent six-month period of 0.97% multiplied by the average account value over the period, multiplied by 183/365 to reflect the one-half year period. |
(2) | Based on the actual returns for the six-month period ended September 30, 2020 of 14.87%. |
4
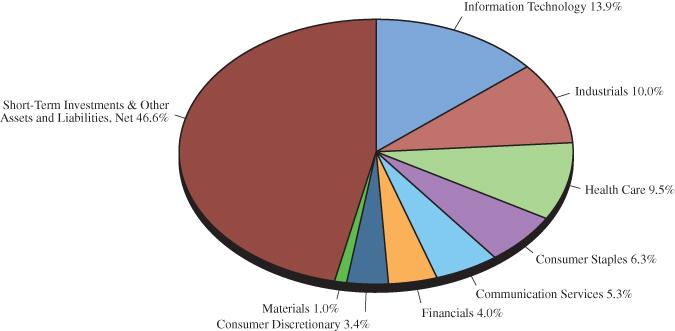
PORT STREET QUALITY GROWTH FUND
Sector Allocation(1) (Unaudited)
as of September 30, 2020
(% of net assets)
Top Ten Equity Holdings(1) (Unaudited)
as of September 30, 2020
(% of net assets)
| Berkshire Hathaway, Inc., Class B | 4.0% |
| Walt Disney Co. | 3.4% |
| Oracle Corp. | 3.1% |
| Raytheon Technologies Corp. | 2.9% |
| C.H. Robinson Worldwide, Inc. | 2.7% |
| Apple, Inc. | 2.7% |
| Microsoft Corp. | 2.6% |
| Novo Nordisk – ADR | 2.5% |
| Cisco Systems, Inc. | 2.2% |
| Biogen, Inc. | 2.0% |
(1) | Fund holdings and sector allocations are subject to change at any time and are not recommendations to buy or sell any security. |
5
PORT STREET QUALITY GROWTH FUND
Schedule of Investments (Unaudited)
September 30, 2020
| Shares | Value | |||||||
| COMMON STOCKS — 53.4% | ||||||||
| Communication Services — 5.3% | ||||||||
| Alphabet, Inc., Class A* | 2,100 | $ | 3,077,760 | |||||
| Walt Disney Co. | 45,600 | 5,658,048 | ||||||
| 8,735,808 | ||||||||
| Consumer Discretionary — 3.4% | ||||||||
| NIKE, Inc., Class B | 24,600 | 3,088,284 | ||||||
| Starbucks Corp. | 30,500 | 2,620,560 | ||||||
| 5,708,844 | ||||||||
| Consumer Staples — 6.3% | ||||||||
| Coca-Cola Co. | 80 | 3,950 | ||||||
| PepsiCo, Inc. | 14,500 | 2,009,700 | ||||||
| Procter & Gamble Co. | 15,700 | 2,182,143 | ||||||
| Reckitt Benckiser Group plc — ADR | 119,400 | 2,346,210 | ||||||
| Unilever plc | 27,500 | 1,696,200 | ||||||
| Walmart, Inc. | 15,600 | 2,182,596 | ||||||
| 10,420,799 | ||||||||
| Financials — 4.0% | ||||||||
| Berkshire Hathaway, Inc., Class B* | 30,800 | 6,558,552 | ||||||
| Health Care — 9.5% | ||||||||
| Becton, Dickinson & Co. | 3,500 | 814,380 | ||||||
| Biogen, Inc.* | 11,800 | 3,347,424 | ||||||
| Johnson & Johnson | 13,200 | 1,965,216 | ||||||
| Medtronic plc | 24,200 | 2,514,864 | ||||||
| Novo Nordisk — ADR | 60,400 | 4,193,572 | ||||||
| Varian Medical Systems, Inc.* | 16,600 | 2,855,200 | ||||||
| 15,690,656 | ||||||||
| Industrials — 10.0% | ||||||||
| 3M Co. | 15,400 | 2,466,772 | ||||||
| C.H. Robinson Worldwide, Inc. | 44,400 | 4,537,236 | ||||||
| Expeditors International of Washington, Inc. | 25,600 | 2,317,312 | ||||||
| General Dynamics Corp. | 17,600 | 2,436,368 | ||||||
| Raytheon Technologies Corp. | 83,300 | 4,793,082 | ||||||
| 16,550,770 | ||||||||
| Information Technology — 13.9% | ||||||||
| Accenture plc, Class A | 9,100 | 2,056,509 | ||||||
| Apple, Inc. | 38,720 | 4,484,163 | ||||||
| Cisco Systems, Inc. | 92,900 | 3,659,331 | ||||||
See Notes to the Financial Statements
6
PORT STREET QUALITY GROWTH FUND
Schedule of Investments (Unaudited) – Continued
September 30, 2020
| Shares | Value | |||||||
| Information Technology — 13.9% (Continued) | ||||||||
| Cognizant Technology Solutions Corp., Class A | 47,400 | $ | 3,290,508 | |||||
| Microsoft Corp. | 20,100 | 4,227,633 | ||||||
| Oracle Corp. | 86,700 | 5,175,990 | ||||||
| 22,894,134 | ||||||||
| Materials — 1.0% | ||||||||
| International Flavors & Fragrances, Inc. | 13,498 | 1,652,830 | ||||||
| Total Common Stocks | ||||||||
| (Cost $60,522,766) | 88,212,393 | |||||||
| Par | ||||||||
| SHORT-TERM INVESTMENTS — 40.9% | ||||||||
| U.S. Treasury Bills | ||||||||
| 0.080%, 10/29/2020 (a)(b) | $ | 15,500,000 | 15,499,005 | |||||
| 0.078%, 11/19/2020 (a)(b) | 18,000,000 | 17,998,040 | ||||||
| 0.084%, 11/27/2020 (a)(b) | 18,000,000 | 17,997,578 | ||||||
| 0.089%, 12/24/2020 (a)(b) | 16,000,000 | 15,996,640 | ||||||
| Total Short-Term Investments | ||||||||
| (Cost $67,490,631) | 67,491,263 | |||||||
| Total Investments — 94.3% | ||||||||
| (Cost $128,013,397) | 155,703,656 | |||||||
| Other Assets and Liabilities, Net — 5.7% | 9,427,446 | |||||||
| Total Net Assets — 100.0% | $ | 165,131,102 | ||||||
ADR — American Depositary Receipt
plc — Public Limited Company
| * | Non-income producing security |
| (a) | Rate shown is the effective yield as of September 30, 2020. |
| (b) | Level 2 security. |
See Notes to the Financial Statements
7
PORT STREET QUALITY GROWTH FUND
Statement of Assets and Liabilities (Unaudited)
September 30, 2020
| ASSETS: | ||||
| Investments, at value | ||||
| (Cost: $128,013,397) | $ | 155,703,656 | ||
| Cash | 9,088,132 | |||
| Dividends receivable | 94,106 | |||
| Receivable for capital shares sold | 834,730 | |||
| Prepaid expenses | 13,939 | |||
| Total assets | 165,734,563 | |||
| LIABILITIES: | ||||
| Payable to investment adviser | 93,212 | |||
| Payable for fund administration & accounting fees | 38,663 | |||
| Payable for capital shares redeemed | 413,091 | |||
| Payable for compliance fees | 5,252 | |||
| Payable for transfer agent fees & expenses | 15,119 | |||
| Payable for custody fees | 1,648 | |||
| Payable for trustee fees | 4,255 | |||
| Accrued shareholder servicing fees | 8,050 | |||
| Accrued expenses | 24,171 | |||
| Total liabilities | 603,461 | |||
| NET ASSETS | $ | 165,131,102 | ||
| NET ASSETS CONSIST OF: | ||||
| Paid-in capital | $ | 134,082,157 | ||
| Total distributable earnings | 31,048,945 | |||
| Net assets | $ | 165,131,102 | ||
| Net assets | $ | 165,131,102 | ||
Shares issued and outstanding(1) | 11,138,270 | |||
| Net asset value, redemption price and offering price per share | $ | 14.83 | ||
(1) | Unlimited shares authorized without par value. |
See Notes to the Financial Statements
8
PORT STREET QUALITY GROWTH FUND
Statement of Operations (Unaudited)
For the Six Months Ended September 30, 2020
| INVESTMENT INCOME: | ||||
| Dividend income | $ | 679,180 | ||
| Less: Foreign taxes withheld | (4,638 | ) | ||
| Interest income | 64,040 | |||
| Total investment income | 738,582 | |||
| EXPENSES: | ||||
| Investment adviser fees (See Note 4) | 591,919 | |||
| Fund administration & accounting fees (See Note 4) | 71,935 | |||
| Shareholder service fees (See Note 5) | 59,077 | |||
| Transfer agent fees & expenses (See Note 4) | 27,937 | |||
| Federal & state registration fees | 16,314 | |||
| Other fees | 10,512 | |||
| Compliance fees (See Note 4) | 10,430 | |||
| Audit fees | 9,671 | |||
| Custody fees (See Note 4) | 6,552 | |||
| Trustee fees | 6,227 | |||
| Legal fees | 5,056 | |||
| Postage & printing fees | 4,762 | |||
| Insurance expense | 1,097 | |||
| Total expenses before waiver | 821,489 | |||
| Less: waiver from investment adviser (See Note 4) | (134,183 | ) | ||
| Net expenses | 687,306 | |||
| NET INVESTMENT INCOME | 51,276 | |||
| REALIZED AND UNREALIZED GAIN ON INVESTMENTS | ||||
| Net realized gain on investments | 1,173,339 | |||
| Net change in unrealized appreciation/depreciation on investments | 17,194,763 | |||
| Net realized and unrealized gain on investments | 18,368,102 | |||
| NET INCREASE IN NET ASSETS RESULTING FROM OPERATIONS | $ | 18,419,378 | ||
See Notes to the Financial Statements
9
PORT STREET QUALITY GROWTH FUND
Statements of Changes in Net Assets
| Six Months Ended | ||||||||
| September 30, 2020 | Year Ended | |||||||
| (Unaudited) | March 31, 2020 | |||||||
| OPERATIONS: | ||||||||
| Net investment income | $ | 51,276 | $ | 882,619 | ||||
| Net realized gain on investments | 1,173,339 | 2,675,515 | ||||||
| Net change in unrealized appreciation/depreciation | ||||||||
| on investments | 17,194,763 | (6,296,923 | ) | |||||
| Net increase (decrease) in net | ||||||||
| assets resulting from operations | 18,419,378 | (2,738,789 | ) | |||||
| CAPITAL SHARE TRANSACTIONS: | ||||||||
| Proceeds from shares sold | 45,742,031 | 33,137,817 | ||||||
| Proceeds from reinvestment of distributions | — | 1,197,715 | ||||||
| Payments for shares redeemed | (14,387,043 | ) | (24,752,767 | ) | ||||
| Net increase in net assets resulting | ||||||||
| from capital share transactions | 31,354,988 | 9,582,765 | ||||||
| DISTRIBUTIONS TO SHAREHOLDERS: | ||||||||
| Total distributions to shareholders | — | (1,673,394 | ) | |||||
| TOTAL INCREASE IN NET ASSETS | 49,774,366 | 5,170,582 | ||||||
| NET ASSETS: | ||||||||
| Beginning of period | 115,356,736 | 110,186,154 | ||||||
| End of period | $ | 165,131,102 | $ | 115,356,736 | ||||
See Notes to the Financial Statements
10
PORT STREET QUALITY GROWTH FUND
Financial Highlights
For a Fund share outstanding throughout the periods.
| Six Months | ||||||||||||||||||||||||
| Ended | ||||||||||||||||||||||||
| September 30, | Year Ended | Year Ended | Year Ended | Year Ended | Year Ended | |||||||||||||||||||
| 2020 | March 31, | March 31, | March 31, | March 31, | March 31, | |||||||||||||||||||
| (Unaudited) | 2020 | 2019 | 2018 | 2017 | 2016 | |||||||||||||||||||
| PER SHARE DATA: | ||||||||||||||||||||||||
| Net asset value, | ||||||||||||||||||||||||
| beginning of period | $ | 12.91 | $ | 13.40 | $ | 12.73 | $ | 11.62 | $ | 10.97 | $ | 10.61 | ||||||||||||
| INVESTMENT OPERATIONS: | ||||||||||||||||||||||||
| Net investment income (loss) | 0.00 | (1) | 0.10 | 0.09 | 0.03 | 0.00 | (1) | (0.00 | )(1) | |||||||||||||||
| Net realized and unrealized | ||||||||||||||||||||||||
| gain on investments | 1.92 | (0.39 | ) | 0.79 | 1.15 | 0.72 | 0.39 | |||||||||||||||||
| Total from | ||||||||||||||||||||||||
| investment operations | 1.92 | (0.29 | ) | 0.88 | 1.18 | 0.72 | 0.39 | |||||||||||||||||
| LESS DISTRIBUTIONS FROM: | ||||||||||||||||||||||||
| Net investment income | — | (0.11 | ) | (0.07 | ) | (0.02 | ) | (0.00 | )(1) | (0.00 | )(1) | |||||||||||||
| Net realized gains | — | (0.09 | ) | (0.14 | ) | (0.05 | ) | (0.07 | ) | (0.03 | ) | |||||||||||||
| Total distributions | — | (0.20 | ) | (0.21 | ) | (0.07 | ) | (0.07 | ) | (0.03 | ) | |||||||||||||
| Net asset value, | ||||||||||||||||||||||||
| end of period | $ | 14.83 | $ | 12.91 | $ | 13.40 | $ | 12.73 | $ | 11.62 | $ | 10.97 | ||||||||||||
| TOTAL RETURN | 14.87 | %(2) | -2.31 | % | 7.07 | % | 10.13 | % | 6.57 | % | 3.65 | % | ||||||||||||
| SUPPLEMENTAL DATA AND RATIOS: | ||||||||||||||||||||||||
| Net assets, end of | ||||||||||||||||||||||||
| period (in millions) | $ | 165.1 | $ | 115.4 | $ | 110.2 | $ | 96.8 | $ | 53.2 | $ | 44.1 | ||||||||||||
| Ratio of expenses to | ||||||||||||||||||||||||
| average net assets: | ||||||||||||||||||||||||
| Before expense | ||||||||||||||||||||||||
| reimbursement/ | ||||||||||||||||||||||||
| waiver/recoupment | 1.16 | %(3) | 1.18 | % | 1.16 | % | 1.19 | % | 1.34 | % | 1.59 | % | ||||||||||||
| After expense | ||||||||||||||||||||||||
| reimbursement/ | ||||||||||||||||||||||||
| waiver/recoupment | 0.97 | %(3) | 0.97 | % | 1.13 | %(4) | 1.15 | % | 1.15 | % | 1.15 | % | ||||||||||||
| Ratio of net investment income | ||||||||||||||||||||||||
| (loss) to average net assets: | ||||||||||||||||||||||||
| After expense | ||||||||||||||||||||||||
| reimbursement/ | ||||||||||||||||||||||||
| waiver/recoupment | 0.07 | %(3) | 0.76 | % | 0.72 | % | 0.23 | % | 0.06 | % | (0.04 | )% | ||||||||||||
| Portfolio turnover rate | 9 | %(2) | 15 | % | 6 | % | 2 | % | 12 | % | 9 | % | ||||||||||||
(1) | Amount per share is less than $0.005. |
(2) | Not annualized. |
(3) | Annualized. |
(4) | Prior to February 13, 2019, the annual expense limitation was 1.15% of the average daily net assets of the Fund. Thereafter it was 0.97%. |
See Notes to the Financial Statements
11
PORT STREET QUALITY GROWTH FUND
Notes to the Financial Statements (Unaudited)
September 30, 2020
1. ORGANIZATION
Managed Portfolio Series (the “Trust”) was organized as a Delaware statutory trust on January 27, 2011. The Trust is registered under the Investment Company Act of 1940, as amended (the “1940 Act”), as an open-end management investment company. The Port Street Quality Growth Fund (the “Fund”) is a diversified series with its own investment objectives and policies within the Trust. The investment objective of the Fund is total return. The Fund is an investment company and accordingly follows the investment company accounting and reporting guidance of the Financial Accounting Standards Board (“FASB”) Accounting Standards Codification Topic 946 Financial Services – Investment Companies. The Fund commenced operations on April 1, 2014. The Fund currently offers an Institutional Class. Institutional Class shares are subject to a 0.10% shareholder servicing fee. The Fund may issue an unlimited number of shares of beneficial interest, with no par value.
2. SIGNIFICANT ACCOUNTING POLICIES
The following is a summary of significant accounting policies consistently followed by the Fund in the preparation of its financial statements. These policies are in conformity with generally accepted accounting principles in the United States of America (“GAAP”).
Security Valuation – All investments in securities are recorded at their estimated fair value, as described in Note 3.
Federal Income Taxes – The Fund complies with the requirements of Subchapter M of the Internal Revenue Code of 1986, as amended, necessary to qualify as a regulated investment company and distributes substantially all net taxable investment income and net realized gains to shareholders in a manner which results in no tax cost to the Fund. Therefore, no federal income or excise tax provision is required. As of and during the period ended September 30, 2020, the Fund did not have any tax positions that did not meet the “more-likely-than-not” threshold of being sustained by the applicable tax authority. The Fund recognizes interest and penalties, if any, related to unrecognized tax benefits on uncertain tax positions as income tax expense in the Statement of Operations. As of and during the period ended September 30, 2020, the Fund did not incur any interest or penalties. The Fund is not subject to examination by U.S. tax authorities for the tax years prior to the year ended March 31, 2017.
Security Transactions, Income and Distributions – The Fund follows industry practice and records security transactions on the trade date. Realized gains and losses on sales of securities are calculated on the basis of identified cost. Dividend income is recorded on the ex-dividend date and interest income is recorded on an accrual basis. Withholding taxes on foreign dividends have been provided for in accordance with the Fund’s understanding of the applicable country’s tax rules and regulations. Discounts and premiums on securities purchased are amortized over the expected life of the respective securities using the constant yield method.
The Fund distributes substantially all net investment income, if any, and net realized capital gains, if any, annually. Distributions to shareholders are recorded on the ex-dividend date. The treatment for financial reporting purposes of distributions made to shareholders during the year from net investment income or net realized capital gains may differ from their treatment for federal income tax purposes. These differences are caused primarily by differences in the timing of the recognition of certain components of income, expense or realized capital gain for federal income tax purposes. Where such differences are permanent in nature, GAAP requires that they be reclassified in the components of the net assets based on their ultimate characterization for federal income tax purposes. Any such reclassifications will have no effect on net assets, results of operations or net asset value (“NAV”) per share of the Fund.
Expenses – Expenses associated with a specific fund in the Trust are charged to that fund. Common Trust expenses are typically allocated evenly between funds of the Trust, or by other equitable means.
12
PORT STREET QUALITY GROWTH FUND
Notes to the Financial Statements (Unaudited) – Continued
September 30, 2020
Use of Estimates – The preparation of financial statements in conformity with GAAP requires management to make estimates and assumptions that affect the reported amounts of assets and liabilities and disclosure of contingent assets and liabilities at the date of the financial statements and the reported amounts of revenues and expenses during the reporting period. Actual results could differ from those estimates.
3. SECURITIES VALUATION
The Fund has adopted authoritative fair value accounting standards which establish an authoritative definition of fair value and set out a hierarchy for measuring fair value. These standards require additional disclosures about the various inputs and valuation techniques used to develop the measurements of fair value, a discussion in changes in valuation techniques and related inputs during the period and expanded disclosure of valuation Levels for major security types. These inputs are summarized in the three broad Levels listed below:
| Level 1 – | Unadjusted quoted prices in active markets for identical assets or liabilities that the Fund has the ability to access. |
| Level 2 – | Observable inputs other than quoted prices included in Level 1 that are observable for the asset or liability, either directly or indirectly. These inputs may include quoted prices for the identical instrument on an inactive market, prices for similar instruments, interest rates, prepayment speeds, credit risk, yield curves, default rates and similar data. |
| Level 3 – | Unobservable inputs for the asset or liability, to the extent relevant observable inputs are not available, representing the Fund’s own assumptions about the assumptions a market participant would use in valuing the asset or liability, and would be based on the best information available. |
Following is a description of the valuation techniques applied to the Fund’s major categories of assets and liabilities measured at fair value on a recurring basis. The Fund’s investments are carried at fair value.
Short-Term Investments – Investments in other mutual funds, including money market funds, are valued at their NAV per share and are categorized in Level 1 of the fair value hierarchy. U.S. government securities are normally valued using a model that incorporates market observable data such as reported sales of similar securities, broker quotes, yields, bids, offers, and reference data. These securities are valued principally using dealer quotations. U.S. government securities are categorized in Level 2 of the fair value hierarchy depending on the inputs used and market activity levels for specific securities.
Equity Securities – Equity securities that are primarily traded on a national securities exchange are valued at the last sale price on the exchange on which they are primarily traded on the day of valuation or, if there has been no sale on such day, at the mean between the bid and ask prices. Securities traded primarily in the Nasdaq Global Market System for which market quotations are readily available are valued using the Nasdaq Official Closing Price (“NOCP”). If the NOCP is not available, such securities are valued at the last sale price on the day of valuation, or if there has been no sale on such day, at the mean between the bid and ask prices. To the extent these securities are actively traded and valuation adjustments are not applied, they are categorized in Level 1 of the fair value hierarchy.
Securities for which market quotations are not readily available, or if the closing price does not represent fair value, are valued following procedures approved by the Board. These procedures consider many factors, including the type of security, size of holding, trading volume and news events. There can be no assurance that the Fund could
13
PORT STREET QUALITY GROWTH FUND
Notes to the Financial Statements (Unaudited) – Continued
September 30, 2020
obtain the fair value assigned to a security if they were to sell the security at approximately the time at which the Fund determines their NAV per share. The Board has established a Valuation Committee to administer, implement, and oversee the fair valuation process, and to make fair value decisions when necessary. The Board regularly reviews reports that describe any fair value determinations and methods.
The inputs or methodology used for valuing securities are not an indication of the risk associated with investing in those securities. The following is a summary of the inputs used to value the Fund’s securities as of September 30, 2020:
| Level 1 | Level 2 | Level 3 | Total | |||||||||||||
| Common Stocks | $ | 88,212,393 | $ | — | $ | — | $ | 88,212,393 | ||||||||
| Short-Term Investments | — | 67,491,263 | — | 67,491,263 | ||||||||||||
| Total Investments in Securities | $ | 88,212,393 | $ | 67,491,263 | $ | — | $ | 155,703,656 | ||||||||
Refer to the Schedule of Investments for further information on the classification of investments.
4. INVESTMENT ADVISORY FEE AND OTHER TRANSACTIONS WITH AFFILIATES
The Trust has an agreement with Port Street Investments, LLC (the “Adviser”) to furnish investment advisory services to the Fund. Pursuant to an Investment Advisory Agreement between the Trust and the Adviser, the Adviser is entitled to receive, on a monthly basis, an annual advisory fee equal to 0.85% on the first $100 million of net assets, 0.80% on the next $150 million of net assets, 0.75% on the next $500 million of net assets, and 0.70% on net assets over $750 million.
The Adviser has engaged Saratoga Research & Investment Management (the “Sub-Adviser”) as the Sub-Adviser to the Fund. Subject to the supervision of the Adviser, the Sub-Adviser is primarily responsible for the day-to-day management of the Fund’s portfolio, including purchase, retention and sale of securities. Fees associated with these services are paid to the Sub-Adviser by the Adviser.
The Adviser has contractually agreed to waive its management fees, and pay Fund expenses, in order to ensure that total annual operating expenses (excluding acquired fund fees and expenses, leverage/borrowing interest, interest expense, taxes, brokerage commissions and extraordinary expenses) for the Fund do not exceed 0.97% of the Fund’s average daily net assets. Fees waived and expenses paid by the Adviser may be recouped by the Adviser for a period of thirty-six months following the date on which such fee waiver and expense payment was made, if such recoupment can be achieved without exceeding the expense limit in effect at the time the fee waiver and expense payment occurred and the expense limit in effect at the time of recoupment. The Operating Expenses Limitation Agreement is indefinite in term and cannot be terminated within a year of the effective date of the Fund’s prospectus. Thereafter, the agreement may be terminated at any time upon 60 days’ written notice by the Board or the Adviser, with the consent of the Board. Waived fees and reimbursed expenses subject to potential recovery by year of expiration are as follows:
Expiration | Amount | |||
| October 2020 – March 2021 | $ | 11,679 | ||
| April 2021 – March 2022 | $ | 47,188 | ||
| April 2022 – March 2023 | $ | 243,851 | ||
| April 2023 – September 2023 | $ | 134,183 | ||
14
PORT STREET QUALITY GROWTH FUND
Notes to the Financial Statements (Unaudited) – Continued
September 30, 2020
U.S. Bancorp Fund Services, LLC (the “Administrator”), doing business as U.S. Bank Global Fund Services, acts as the Fund’s Administrator, Transfer Agent, and Fund Accountant. U.S. Bank N.A. (the “Custodian”) serves as the custodian to the Fund. The Custodian is an affiliate of the Administrator. The Administrator performs various administrative and accounting services for the Fund. The Administrator prepares various federal and state regulatory filings, reports and returns for the Fund; prepares reports and materials to be supplied to the Trustees; monitors the activities of the Custodian; coordinates the payment of the Fund’s expenses and reviews the Fund’s expense accruals. The officers of the Trust, including the Chief Compliance Officer, are employees of the Administrator. As compensation for its services, the Administrator is entitled to a monthly fee at an annual rate based upon the average daily net assets of the Fund, subject to annual minimums. Fees incurred by the Fund for administration and accounting, transfer agency, custody and chief compliance officer services for the period ended September 30, 2020, are disclosed in the Statement of Operations.
Quasar Distributors, LLC (“Quasar”) acts as the Fund’s principal underwriter in a continuous public offering of the Fund’s shares.
5. SHAREHOLDER SERVICING FEES
The Fund has entered into a shareholder servicing agreement (the “Agreement”) with the Adviser, under which the Fund may pay a servicing fee at a maximum annual rate of 0.10% of the average daily net assets of the Institutional Class. Payments to the Adviser under the Agreement may reimburse the Adviser for payments it makes to selected brokers, dealers and administrators which have entered into service agreements with the Adviser for services provided to shareholders of the Fund. The services provided by such intermediaries are primarily designed to assist shareholders of the Fund and include the furnishing of office space and equipment, telephone facilities, personnel and assistance to the Fund in servicing such shareholders. Services provided by such intermediaries also include the provision of support services to the Fund and includes establishing and maintaining shareholders’ accounts and record processing, purchase and redemption transactions, answering routine client inquiries regarding the Fund, and providing such other personal services to shareholders as the Fund may reasonably request. For the period ended September 30, 2020, the Fund incurred $59,077 in shareholder servicing fees under the Agreement.
6. CAPITAL SHARE TRANSACTIONS
Transactions in shares of the Fund were as follows:
| Six Months Ended | Year Ended | |||||||
| September 30, 2020 | March 31, 2020 | |||||||
| Shares sold | 3,218,312 | 2,434,565 | ||||||
| Shares issued to holders in reinvestment of dividends | — | 83,639 | ||||||
| Shares redeemed | (1,016,006 | ) | (1,808,686 | ) | ||||
| Net increase in shares outstanding | 2,202,306 | 714,518 | ||||||
7. INVESTMENT TRANSACTIONS
The aggregate purchases and sales, excluding short-term investments, by the Fund for the period ended September 30, 2020, were as follows:
| Purchases | Sales | |||||||
| U.S. Government Securities | $ | — | $ | — | ||||
| Other Securities | $ | 7,548,950 | $ | 7,890,629 | ||||
15
PORT STREET QUALITY GROWTH FUND
Notes to the Financial Statements (Unaudited) – Continued
September 30, 2020
8. FEDERAL TAX INFORMATION
The aggregate gross unrealized appreciation and depreciation of securities held by the Fund and the total cost of securities for federal income tax purposes at March 31, 2020, the Fund’s most recently completed fiscal year, were as follows:
| Aggregate Gross | Aggregate Gross | Net | Federal Income |
Appreciation | Depreciation | Appreciation | Tax Cost |
| $13,737,100 | $(3,249,807) | $10,487,293 | $88,953,999 |
Any difference between book-basis and tax-basis unrealized appreciation is attributable primarily to the differences in tax treatment of wash sales.
At March 31, 2020, components of distributable earnings on a tax-basis were as follows:
| Undistributed | Undistributed | Unrealized | Total Distributable |
Ordinary Income | Long-Term Capital Gains | Appreciation | Earnings |
| $229,771 | $1,912,503 | $10,487,293 | $12,629,567 |
As of March 31, 2020, the Fund did not have any capital loss carryovers. A regulated investment company may elect for any taxable year to treat any portion of any qualified late year loss as arising on the first day of the next taxable year. Qualified late year losses are certain capital, and ordinary losses which occur during the portion of the Fund’s taxable year subsequent to October 31 and December 31, respectively. For the taxable year ended March 31, 2020, the Fund did not defer any qualified late year losses.
There were no distributions paid by the Fund during the period ended September 30, 2020.
The tax character of distributions paid during the year ended March 31, 2020 were as follows:
| Ordinary | Long-Term | |
Income* | Capital Gains | Total |
| $1,135,361 | $538,033 | $1,673,394 |
* For federal income tax purposes, distributions of short-term capital gains are treated as ordinary income.
9. CONTROL OWNERSHIP
The beneficial ownership, either directly or indirectly, of more than 25% of the voting securities of a fund creates a presumption of control of the fund, under Section 2(a)(9) of the Investment Company Act of 1940. As of September 30, 2020, Charles Schwab & Co., Inc., for the benefit of its customers, owned 30.90% of the outstanding shares of the Fund.
10. COVID-19
The global outbreak of COVID-19 (commonly referred to as “coronavirus”) has disrupted economic markets and the prolonged economic impact is uncertain. The ultimate economic fallout from the pandemic, and the long-term impact on economies, markets, industries and individual issuers, are not known. The operational and financial performance of the issuers of securities in which the Fund invests depends on future developments, including the duration and spread of the outbreak, and such uncertainty may in turn adversely affect the value and liquidity of the Fund’s investments, impair the Fund’s ability to satisfy redemption requests, and negatively impact the Fund’s performance.
16
PORT STREET QUALITY GROWTH FUND
Statement Regarding the Fund’s Liquidity Risk Management Program (Unaudited)
Pursuant to Rule 22e-4 under the Investment Company Act of 1940, the Trust, on behalf of the Port Street Quality Growth Fund (the “Fund”), has adopted and implemented a written liquidity risk management program (the “Program”) that includes policies and procedures reasonably designed to comply with the requirements of Rule 22e-4, including: (i) assessment, management and periodic review of liquidity risk; (ii) classification of portfolio holdings; (iii) establishment of a highly liquid investment minimum (“HLIM”), as applicable; (iv) limitation on illiquid investments; and (v) redemptions in-kind. The Trust’s Board of Trustees (the “Board”) has approved the designation of Port Street Investments, LLC (“Port Street”) as the administrator of the Program (the “Program Administrator”). Personnel of Port Street and Saratoga Research & Investment Management, the investment sub-adviser to the Fund, conduct the day-to-day operation of the Program pursuant to policies and procedures administered by the Program Administrator.
In accordance with Rule 22e-4, the Board reviewed a report prepared by the Program Administrator (the “Report”) regarding the operation of the Program and its adequacy and effectiveness of implementation for the period June 1, 2019, through December 31, 2019 (the “Reporting Period”). No significant liquidity events impacting the Fund during the Reporting Period or material changes to the Program were noted in the Report.
Under the Program, the Program Administrator manages and periodically reviews the Fund’s liquidity risk, including consideration of applicable factors specified in Rule 22e-4 and the Program. Liquidity risk is defined as the risk that the Fund could not meet shareholder redemption requests without significant dilution of remaining shareholders’ interests in the Fund. In general, this risk was managed during the Reporting Period by monitoring the degree of liquidity of the Fund’s investments, limiting the amount of the Fund’s illiquid investments, and utilizing various risk management tools and facilities available to the Fund for meeting shareholder redemptions, among other means. In the Report, Port Street provided its assessment that, based on the information considered in its review, the Program remains reasonably designed to manage the Fund’s liquidity risk and the Fund’ s investment strategy remains appropriate for an open-end fund.
Pursuant to the Program, the Program Administrator oversaw the classification of each of the Fund’s portfolio investments as highly liquid, moderately liquid, less liquid or illiquid during the Reporting Period, including in connection with recording investment classifications on Form N-PORT. The Program Administrator’s process of determining the degree of liquidity of the Fund’s investments is supported by one or more third-party liquidity assessment vendors.
The Fund qualified as a “primarily highly liquid fund” as defined in the Program during the Reporting Period. Accordingly, the Fund was not required to establish a HLIM or comply with the related Program provisions during the Reporting Period.
During the Reporting Period, the Fund’s investments were monitored for compliance with the 15% limitation on illiquid investments pursuant to the Program and in accordance with Rule 22e-4.
The Report noted that the Fund did not effect redemptions in-kind during the Reporting Period pursuant to the Program. The Report concluded: (i) the Program was implemented and operated effectively to achieve the goal of assessing and managing the Fund’s liquidity risk during the Reporting Period; and (ii) the Fund was able to meet requests for redemption without significant dilution of remaining investors’ interests in the Fund during the Reporting Period.
17
PORT STREET QUALITY GROWTH FUND
Additional Information (Unaudited)
September 30, 2020
AVAILABILITY OF FUND PORTFOLIO INFORMATION
The Fund files complete schedules of portfolio holdings with the SEC for the first and third quarters of each fiscal year on Form N-Q or Part F of Form N-PORT (beginning with filings after March 31, 2020). The Fund’s Form N-Q or Part F of Form N-PORT are available on the SEC’s website at www.sec.gov and may be reviewed and copied at the SEC’s Public Reference Room in Washington, D.C. For information on the Public Reference Room call 1-800-SEC-0330. In addition, the Fund’s Form N-Q or Part F of Form N-PORT is available without charge upon request by calling 1-855-369-6220.
AVAILABILITY OF PROXY VOTING INFORMATION
A description of the Fund’s Proxy Voting Policies and Procedures is available without charge, upon request, by calling 1-855-369-6220. Information regarding how the Funds voted proxies relating to portfolio securities during the most recent 12 month period ended June 30, is available (1) without charge, upon request, by calling 1-855-369-6220, or (2) on the SEC’s website at www.sec.gov.
18
PORT STREET QUALITY GROWTH FUND
Privacy Notice (Unaudited)
The Fund collects only relevant information about you that the law allows or requires it to have in order to conduct its business and properly service you. The Fund collects financial and personal information about you (“Personal Information”) directly (e.g., information on account applications and other forms, such as your name, address, and social security number, and information provided to access account information or conduct account transactions online, such as password, account number, e-mail address, and alternate telephone number), and indirectly (e.g., information about your transactions with us, such as transaction amounts, account balance and account holdings).
The Fund does not disclose any non-public personal information about its shareholders or former shareholders other than for everyday business purposes such as to process a transaction, service an account, respond to court orders and legal investigations or as otherwise permitted by law. Third parties that may receive this information include companies that provide transfer agency, technology and administrative services to the Fund, as well as the Fund’s investment adviser who is an affiliate of the Fund. If you maintain a retirement/educational custodial account directly with the Fund, we may also disclose your Personal Information to the custodian for that account for shareholder servicing purposes. The Fund limits access to your Personal Information provided to unaffiliated third parties to information necessary to carry out their assigned responsibilities to the Fund. All shareholder records will be disposed of in accordance with applicable law. The Fund maintains physical, electronic and procedural safeguards to protect your Personal Information and requires its third party service providers with access to such information to treat your Personal Information with the same high degree of confidentiality.
In the event that you hold shares of the Fund through a financial intermediary, including, but not limited to, a broker-dealer, credit union, bank or trust company, the privacy policy of your financial intermediary governs how your non-public personal information is shared with unaffiliated third parties.
19
(This Page Intentionally Left Blank.)
INVESTMENT ADVISER
Port Street Investments, LLC
24 Corporate Plaza, Suite 150
Newport Beach, CA 92660
DISTRIBUTOR
Quasar Distributors, LLC
111 East Kilbourn Avenue, Suite 2200
Milwaukee, WI 53202
CUSTODIAN
U.S. Bank N.A.
1555 North Rivercenter Drive, Suite 302
Milwaukee, WI 53212
ADMINISTRATOR, FUND ACCOUNTANT
AND TRANSFER AGENT
U.S. Bancorp Fund Services, LLC
615 East Michigan Street
Milwaukee, WI 53202
INDEPENDENT REGISTERED PUBLIC ACCOUNTING FIRM
Cohen & Company, Ltd.
1350 Euclid Avenue, Suite 800
Cleveland, OH 44115
LEGAL COUNSEL
Stradley Ronon Stevens & Young, LLP
2005 Market Street, Suite 2600
Philadelphia, PA 19103
This report should be accompanied or preceded by a prospectus.
The Fund’s Statement of Additional Information contains additional information about the
Fund’s trustees and is available without charge upon request by calling 1-855-369-6220.
Item 2. Code of Ethics.
Not applicable for semi-annual reports.
Item 3. Audit Committee Financial Expert.
Not applicable for semi-annual reports.
Item 4. Principal Accountant Fees and Services.
Not applicable for semi-annual reports.
Item 5. Audit Committee of Listed Registrants.
Not applicable to registrants who are not listed issuers (as defined in Rule 10A-3 under the Securities Exchange Act of 1934).
Item 6. Investments.
(a) | Schedule of Investments is included as part of the report to shareholders filed under Item 1 of this Form. |
(b) | Not applicable. |
Item 7. Disclosure of Proxy Voting Policies and Procedures for Closed-End Management Investment Companies.
Not applicable to open-end investment companies.
Item 8. Portfolio Managers of Closed-End Management Investment Companies.
Not applicable to open-end investment companies.
Item 9. Purchases of Equity Securities by Closed‑End Management Investment Company and Affiliated Purchasers.
Not applicable to open-end investment companies.
Item 10. Submission of Matters to a Vote of Security Holders.
There have been no material changes to the procedures by which shareholder may recommend nominees to the Registrant’s Board of Trustees.
Item 11. Controls and Procedures.
(a) | The Registrant’s [President/Chief Executive Officer] and [Treasurer/Chief Financial Officer] have reviewed the Registrant's disclosure controls and procedures (as defined in Rule 30a-3(c) under the Investment Company Act of 1940 (the “Act”)) as of a date within 90 days of the filing of this report, as required by Rule 30a-3(b) under the Act and Rules 13a-15(b) or 15d‑15(b) under the Securities Exchange Act of 1934. Based on their review, such officers have concluded that the disclosure controls and procedures are effective in ensuring that information required to be disclosed in this report is appropriately recorded, processed, summarized and reported and made known to them by others within the Registrant and by the Registrant’s service provider. |
(b) | There were no changes in the Registrant's internal control over financial reporting (as defined in Rule 30a-3(d) under the Act) that occurred during the period covered by this report that has materially affected, or is reasonably likely to materially affect, the Registrant's internal control over financial reporting. |
Item 12. Disclosure of Securities Lending Activities for Closed-End Management Investment Companies.
Not applicable to open-end investment companies.
Item 13. Exhibits.
| (a) | (1) Any code of ethics or amendment thereto, that is the subject of the disclosure required by Item 2, to the extent that the registrant intends to satisfy Item 2 requirements through filing an exhibit. Not applicable for semi-annual reports. |
(3) Any written solicitation to purchase securities under Rule 23c‑1 under the Act sent or given during the period covered by the report by or on behalf of the registrant to 10 or more persons. Not applicable to open-end investment companies.
(4) Change in the registrant’s independent public accountant. There was no change in the registrant’s independent public accountant for the period covered by this report.
SIGNATURES
Pursuant to the requirements of the Securities Exchange Act of 1934 and the Investment Company Act of 1940, the registrant has duly caused this report to be signed on its behalf by the undersigned, thereunto duly authorized.
(Registrant) Managed Portfolio Series
By (Signature and Title)* /s/Brian R. Wiedmeyer
Brian R. Wiedmeyer, President
Date December 8, 2020
Pursuant to the requirements of the Securities Exchange Act of 1934 and the Investment Company Act of 1940, this report has been signed below by the following persons on behalf of the registrant and in the capacities and on the dates indicated.
By (Signature and Title)* /s/Brian R. Wiedmeyer
Brian R. Wiedmeyer President
Date December 8, 2020
By (Signature and Title)* /s/Benjamin J. Eirich
Benjamin J. Eirich, Treasurer
Date December 8, 2020
* Print the name and title of each signing officer under his or her signature.