| | Olstein |
| | All Cap Value Fund |
| | |
| | Olstein |
| | Strategic Opportunities Fund |
| | |
| | |
| | |
| | |
| | |
| | ANNUAL REPORT |
| | |
| | JUNE 30, 2021 |
| | |
| | |
| | |
| | |
| | |
| | |
| | |
| | |
| | |
| | |
| |  |
| | |
| | The Olstein Funds |
CONTENTS
| | 3 | | Letters to Shareholders |
| | | | |
| | | | |
| | 17 | | Value of $10,000 Investment |
| | | | |
| | | | |
| | 23 | | Expense Examples |
| | | | |
| | | | |
| | 26 | | Schedules of Investments |
| | | | |
| | | | |
| | 36 | | Statements of Assets |
| | | | and Liabilities |
| | | | |
| | | | |
| | 38 | | Statements of Operations |
| | | | |
| | | | |
| | 40 | | Statements of Changes |
| | | | in Net Assets |
| | | | |
| | | | |
| | 44 | | Financial Highlights |
| | | | |
| | | | |
| | 50 | | Notes to Financial Statements |
| | | | |
| | | | |
| | 62 | | Report of Independent |
| | | | Registered Public Accounting Firm |
| | | | |
| | | | |
| | 63 | | Additional Information |
OLSTEIN FUNDS
Letter to Shareholders
DEAR FELLOW SHAREHOLDERS:
THE OLSTEIN ALL CAP VALUE FUND PERFORMANCE
For the twelve-month reporting period ended June 30, 2021, Advisor Class shares of the Olstein All Cap Value Fund appreciated 61.49%, Class C shares (load waived) appreciated 59.89% and Class A shares (load waived) appreciated 61.15%. During the same twelve-month period, the Russell 3000 Value Index appreciated 45.40% and the Russell 3000 Index appreciated 44.16%.1
THE MARKET
The Olstein Funds’ most recent fiscal year, which ended on June 30, 2021, was extraordinary by any measure. The fiscal year began with equity markets continuing their dramatic rebound from one of the steepest declines in history and an economy digging its way out of a recession caused by the onset of the global COVID-19 pandemic. The fiscal year ended with equity markets reaching all-time highs – both the S&P 500 and Dow Jones Industrial Average indices continued to set all-time closing highs during the final quarter of the Funds’ fiscal year – and a strengthening economic recovery fueled by the extraordinary scope of fiscal stimulus and the rapid development and rollout of highly effective vaccines to combat the spread of the COVID-19 virus.
1 | The performance data quoted represents past performance and does not guarantee future results. The Olstein All Cap Value Fund’s Class C average annual return for the one-year, five-year, and ten-year periods ended 6/30/21, assuming reinvestment of dividends and capital gain distributions and deduction of the Olstein All Cap Value Fund’s maximum CDSC of 1% during the one-year period, was 58.89%, 13.97%, and 11.32%, respectively. Per the Fund’s prospectus dated 10/28/20, the expense ratio for the Olstein All Cap Value Fund Class C was 2.15%. Performance and expense ratios for other share classes will vary due to differences in sales charge structure and class expenses. The investment return and principal value of an investment will fluctuate so that an investor’s shares, when redeemed, may be worth more or less than their original cost. Current performance may be lower or higher than performance quoted. To obtain performance data current to the most recent month end, please go to our website at www.olsteinfunds.com. |
As a result of the sharp rebound in the market’s fortunes over the past twelve months, many investors are once again nervous about the prospect of slower economic growth restraining future equity returns. While the COVID-19 pandemic continues to pose global economic challenges, the market should continue to reward companies that practiced sound capital management throughout the crisis. Although discounts have narrowed during the past year, we are finding that the latest pessimism surrounding the Delta variant is again creating potential opportunities in companies which meet our criteria for investing.
OUR STRATEGIES
The portfolios of the Olstein All Cap Value Fund and Olstein Strategic Opportunities Fund consist of companies that we believe have sustainable competitive advantages, discernible balance sheet strength, management teams that emphasize decisions based on cost of capital calculations and deploy free cash flow to create value. We remain focused on individual companies, their operations, and prospects for maintaining or growing sustainable free cash flow. Our analysts and portfolio managers focus on looking behind the numbers of financial statements (10K’s, 10Q’s, shareholder letters, footnotes, etc.) looking for conservative or aggressive accounting assumptions or non-recurring items which we believe are causing the investing public to misread a company’s future ability to generate future free cash flow, and thus its value. Material undervaluation often occurs during periods of negative market psychology, or where there is over speculation and concentration in a limited group of rapidly growing companies where stock prices are advancing rapidly, which causes selling in more mature companies in order to raise funds to participate in the new bonanza. In addition, at times specific well-respected companies or industries can face temporary issues which cause over reactions by investors seeking instant gratification, creating additional potential under valuation opportunities. We are constantly screening our financial resources for new ideas. As long-term value investors, we recognize that companies generating sustainable free cash flow are generally well positioned to compete profitably during both favorable and challenging economic environments and can continue to build value during economic slowdowns.
In the recent strong pandemic rally, we were able to build a material cash position as we sold securities which had strong rallies and whose prices reached either full valuation or no longer offered the risk-reward ratio that we seek when investing in a stock. However, the recent fears of a market pullback have again created opportunities to invest in solid companies where we believe that our estimates of future free cash flows are not being properly valued by the market. Our cash position is slowly being re-employed. Our
timing is paying what we believe to be the right price, which creates favorable risk-reward ratios. We pay little attention to stock market forecasters, earnings beats and misses, or predictions of individual companies’ short-term stock movements based on short-term thinking. We continue to employ the same strategy now as we have since the Funds’ inception. We invite our shareholders to examine the Olstein All Cap Value Fund’s long-term performance table illustrated at the end of this letter.
PORTFOLIO REVIEW
At June 30, 2021, the Olstein All Cap Value Fund portfolio consisted of 86 holdings with an average weighted market capitalization of $165.49 billion. During the twelve-month reporting period, the Fund initiated positions in thirteen companies and eliminated its holdings in fifteen companies.
Positions initiated during the past fiscal year include: CBRE Group, Inc., Jones Lang LaSalle, Incorporated., Keurig Dr Pepper Inc, Kimberly-Clark Corporation, L3Harris Technologies, LKQ Corporation, Quest Diagnostics Incorporated, Reynolds Consumer Products, Southwest Airlines Co., SS&C Technologies, Inc., Stanley Black & Decker, Inc., The Timken Company and Winnebago Industries, Inc.
During the reporting period, the All Cap Value Fund sold its holdings in Aptiv plc, Caterpillar Inc., Danaher Corporation, DuPont de Nemours, Inc., Eaton Corporation plc, The Greenbrier Companies, Hologic, Inc., Ingersoll Rand, Inc., Littelfuse, Inc., Middleby Corp., Regal Beloit Corporation, SeaWorld Entertainment Inc., Snap-on Incorporated, Thermo Fisher Scientific, and Zebra Technologies Corporation as the stock price of each of these companies reached our valuation. We should note that many of the stocks in the portfolio rose significantly during the reporting period, which, given the Fund’s strict sell discipline triggered the liquidation of fourteen of the Fund’s holdings that reached or exceeded our value. In fact, seven of the above companies – Aptiv, DuPont, The Greenbrier Companies, Ingersoll Rand, Middleby, SeaWorld Entertainment, and Zebra Technologies increased approximately fifty percent or more in value during the reporting period. The Fund eliminated its position in Chevron Corporation as we lost confidence that the company’s free cash flow projections would support our valuation.
Our Leaders
The Olstein All Cap Value Fund’s leading performers for the twelve-month reporting period ended June 30, 2021, included: Generac Holdings Inc., Tapestry, Inc., Kulicke and Soffa Industries, Inc., WESCO International, Inc., and Invesco Ltd. We should note that, over the course of the fiscal year, the stock price of each of these companies increased more than 150%. At the close of the fiscal year the Fund continued to maintain positions in all five of these companies.
Our Laggards
Laggards during the twelve-month reporting period included: Chevron Corporation, Baxter International Inc., Intel Corporation, Kimberly-Clark and The Timken Company. Given the Fund’s strong investment performance for the fiscal year, it is important to note that the stock price of only three of these companies, Chevron, Baxter and Intel, decreased while the stock prices of Kimberly-Clark and Timken increased slightly over the past twelve months. At the close of the reporting period the All Cap Value Fund maintained positions in Baxter International Inc., Intel Corporation, Kimberly-Clark and The Timken Company. As previously discussed, the Fund eliminated its position in Chevron Corporation during the reporting period.
THE OLSTEIN STRATEGIC OPPORTUNITIES FUND
For the twelve-month reporting period ended June 30, 2021, Adviser Class shares of the Strategic Opportunities Fund appreciated 81.22%; Class A shares (load waived) appreciated 80.84% and Class C shares (load waived) appreciated 79.36%. The Fund’s primary benchmark, the Russell 2500® Value Index, appreciated 63.23% and the Fund’s secondary benchmark, Russell 2500® Index appreciated 57.79%, during the same period.2
PORTFOLIO REVIEW
As of June 30, 2021, the Olstein Strategic Opportunities Fund portfolio consisted of 43 holdings with an average weighted market capitalization of $6.91 billion. During the reporting period, the Fund initiated positions in twelve companies and eliminated nine holdings. The Fund initiated positions in Brady Corporation, Gates Industrial Corporation, Graham Corporation, Intelligent Systems Corporation, Johnson Outdoors Inc., Jones Lang LaSalle Incorporated, Kontoor Brands, Mohawk Industries, Inc., Reynolds Consumer Products, The Timken Company, UFP Technologies, Inc., and Winnebago Industries, Inc.
The Fund sold its holdings in AGCO Corporation, The Greenbrier Companies, Ingersoll Rand, Littelfuse, Inc., Middleby Corp., NOW Inc., Regal Beloit Corporation, SeaWorld Entertainment Inc., and Zebra Technologies Corporation as each company’s stock price reached or exceeded our valuation. Given the Fund’s strong investment returns over the fiscal year, many of the stocks in the portfolio rose significantly. In fact, six of the nine companies liquidated from the Fund’s portfolio — AGCO, The Greenbrier Companies, Ingersoll Rand, Middleby, SeaWorld Entertainment, and Zebra Technologies — appreciated approximately fifty percent or more during the reporting period.
2 | The performance data quoted represents past performance and does not guarantee future results. The Olstein Strategic Opportunities Fund Class C return as of 6/30/21 for the one-year, five-year, and ten-year periods, assuming deduction of the maximum Class C contingent deferred sales charge of 1% during the one-year period, was 78.36%, 14.42% and 10.92%, respectively. Per the Fund’s 10/28/20 prospectus, the gross expense ratio for the Class C share was 2.55% and the net expense ratio was 2.35%. The Adviser has contractually agreed to waive certain fees/expenses until October 28, 2021. Performance would have been lower without waivers in effect. Expense ratios for other share classes will vary. Performance for other share classes will vary due to differences in sales charge structure and class expenses. The investment return and principal value of an investment will fluctuate so that an investor’s shares, when redeemed, may be worth more or less than their original cost. Current performance may be lower or higher than performance quoted. To obtain performance data current to the most recent month end, please visit our website at www.olsteinfunds.com. |
Our Leaders
Leading performers for the twelve-month reporting period include: Generac Holdings Inc., Tapestry, Inc., Kulicke and Soffa Industries, Inc., WESCO International, Inc., and Invesco Ltd. We should note that, over the course of the fiscal year, the stock price of each of these companies increased more than 150%. At the close of the fiscal year the Fund continued to maintain positions in all five of these companies.
Our Laggards
Laggards during the twelve-month reporting period include: Johnson Outdoors Inc., Intelligent Systems Corp., Regal Beloit Company, Gates Industrial Corp. and Littelfuse Inc. It is important to note that due the Fund’s strong investment performance for the fiscal year, only two of the Fund’s “laggards” depreciated in value during the reporting period – Johnson Outdoors and Intelligent Systems Corp. We should also note that both of these laggards are recent additions to the Fund’s portfolio. Johnson Outdoors was added to the portfolio in March 2021 and Intelligent Systems Corp was added to in July 2020. We took advantage of price volatility to build a meaningful initial position in each name and will continue to monitor each company’s progress relative to our investment thesis.
The other three “laggards,” Regal Beloit Company, Gates Industrial Corp. and Littelfuse Inc. all increased in value, with our holdings in Regal Beloit appreciating approximately 11%, Gates Industrial appreciating approximately 17% and Littelfuse appreciating approximately 21% during the reporting period. At the close of the fiscal year the Strategic Opportunities Fund maintained positions in Johnson Outdoors Inc., Intelligent Systems Corp., Gates Industrial Corp. and Littelfuse Inc. As previously discussed, the Fund liquidated its holding in Regal Beloit Corporation.
Positioning for the Future
For the past twelve months we initiated positions or increased holdings in companies that we believed were unfairly penalized by the market in reaction to short-term fundamental problems or were being ignored by the investing public seeking “lottery type” returns. However, in our opinion, those holdings had unique business models, strong balance sheets, and the ability to withstand a recession and were selling at material discounts to our determination of private market value.
Over the course of the fiscal year, we eliminated twenty-six holdings between our two Funds, with the overwhelming majority of those sold companies performing extremely well to reach our valuation levels. With the proceeds from the sales, we invested in new ideas, initiating positions in
twenty-five companies between our two Funds over the past year. The significant number of liquidations and addition of new ideas to the Funds was not only due to the extraordinary performance of both Funds but also necessary to, in our opinion, best position the portfolios for success during the next phase of the economic recovery.
FOCUSING ON QUALITY
As the economic recovery continues to unfold, however uneven that may be, we continue to focus on identifying high-quality companies. We define high-quality companies as those with unique business models, and strong balance sheets led by management teams with a proven track record of deploying cash to the benefit shareholders. For us, quality is found in thoughtful growth initiatives and sensible capital spending that emphasizes returns on invested capital, increased free cash flow and conservative balance sheets, all of which can act as a hedge against short-term problems if they occur.
Our persistent focus on free cash flow not only guides our search for such high-quality companies, but it also informs and directs our investment analysis and company valuation processes as well. By focusing on a company’s ability to generate free cash flow we understand its competitive advantages, the economic reality and profit drivers of its businesses, and the capabilities of its management. Most importantly, our emphasis on quality, specifically the quality of a company’s earnings, allows us to make more reliable estimates of a company’s future free cash flow and thus, a more reliable estimate of its intrinsic value. We define the “Quality of Earnings” as the economic realism of a company’s financial statements to reflect a true picture of a company’s current operations.
While determining a company’s ability to generate free cash flow is an extremely important part of gauging a company’s potential for capital appreciation, assessing how management has historically used free cash flow to benefit shareholders also becomes a critical part of identifying high-quality investment opportunities. We assess whether management has consistently used free cash flow to enhance the company’s financial strength by improving the balance sheet or reducing debt levels. We determine if management has a proven track record of reinvesting in the business at suitable rates of return on investment or returning free cash to investors through increased dividends or share buybacks. Our assessment of management actions provides an invaluable context for our valuation models. On the other hand, we do not visit or talk to management about future estimates but rather, rely on our own analyses after performing a forensic review of company financial statements.
As we have said many times before, free cash flow is the lifeblood of a business and companies that generate sustainable excess cash flow have the potential to enhance shareholder value by increasing dividend payments,
repurchasing company shares, reducing outstanding debt, and engaging in strategic acquisitions. In addition, sustainable free cash flow companies also attract other companies to propose takeovers, joint ventures or other strategic value raising proposals. Since inception in late 1995 our Funds have experienced over 40 companies acquired at value raising premiums. For us, superior investment opportunities are found in companies that generate sustainable excess cash flow; and are led by managements who use that excess cash in ways that will increase shareholder value and that we can buy at a significant discount to our determination of their intrinsic value.
FINAL THOUGHTS
(Investment Practices Over the Past 25 Years have Emphasized Trading Techniques Rather than Long Term Investing Techniques and Needs to be Modernized)
The Olstein All Cap Value Fund celebrated its 25th anniversary (9/21/20) during the current reporting period. We are extremely proud of the investment organization we have built (over 150 years of collective experience in our 7-person research and portfolio management team), and the disciplined application and necessary adjustments to our self-developed looking behind the numbers value investment process.
During the Olstein All Cap Value Fund’s over twenty-five year life, significant events have disrupted and adversely affected equity markets, including, but certainly not limited to: the Asian financial crisis in 1997; the Russian financial crisis in 1998; the bursting of the Internet bubble in March 2000; the terrorist attacks of September 11, 2001; the corporate accounting scandals of the early 2000s (most notably Enron in 2001 and Tyco International and WorldCom, both in 2002); the global financial crisis of 2007-08 culminating in the collapse of Lehman Brothers in September 2008; the ensuing Great Recession, the infamous Bernie Madoff Ponzi Scheme of 2008; the prolonged European sovereign debt crisis between 2008 and 2012; the May 2010 “Flash Crash;” the fiscal cliff/debt ceiling crisis in 2011; the Brexit vote of 2016 and, most recently, the COVID-19 pandemic.
Despite these and other market disrupting events since the Olstein All Cap Fund’s inception on September 21,1995, through June 30, 2021, a hypothetical $10,000 investment in the Olstein All Cap Value Fund (Class C, load waived) has appreciated to $132,404, after all fees. We manage the Fund to achieve absolute returns after considering risk. However, for comparison purposes, over the same period a $10,000 investment in the Russell 3000 Value Index (the All Cap Fund’s primary benchmark) accumulated to $103,465, while a $10,000 investment during the same time period in the S&P 500 Index (generally considered a broad market benchmark) appreciated to $120,057.
In our opinion, attempts to trade in and out of our Funds based on reactions to gloom and doom forecasts by analysts and the media, or reactions to the Funds’ periods of underperformance is a loser’s game and shows a lack of understanding how markets and crowd behavior operate, and why that lack of understanding by much of the investing public can increase the probability of the Funds achieving their investment objectives.
Our Funds are managed for long-term investors (3–5-year holders) who seek to make money over time rather than all of the time and realize the risks of treating investments as if they are overnight winning lottery tickets. We have yet to see an investment strategy that always works and doesn’t disappoint investors at times. Even “no lose” Bernie Madoff finally disappointed investors after 20 years of producing fake reports. It is hard to believe that so many sophisticated investors believed the scheme and believed that 15% returns were possible with no down months over a 20-year period. If something seems too good to be true, it usually is!
Our brand of value investing assumes there will be periods of disappointing performance at times. Periods of underperformance usually occur when there is a disconnect between intrinsic values based on our assessment of a company’s normalized ability to produce future free cash flow and stock prices. For example, disconnects can occur when only a small segment of so called “growth” stocks are working and producing returns for a small segment of funds. Many investors are like lemmings. They forget the fundamentals and sell good companies to raise funds to participate in the frenzy, and thus good companies can fall to attractive prices creating discounts having little to do with fundamentals. Extreme market negativity could be created by health issues like the recent pandemic, as well as political issues, extreme economic forecasts, or interest rate changes, and create overreactions to the prices of great companies. Extreme negativity can create massive feeding frenzies for value investors with patience who believe that large discounts have been created in companies whose future normalized free cash flow are on sale. However, turning a battleship takes time and patience is often required to realize these potential values. It is during these periods that we seize upon the opportunity to separate companies which, in our opinion, are being wrongfully punished from other companies which were overvalued and coming back to earth. Individual companies also experience problems at times which are real, but we believe are temporary, and we purchase these companies to take advantage of the undervaluation. To repeat, our timing is based on buying good companies at what we believe to be the right price and that usually occurs when there are clouds (negative market psychology, temporary fundamental issues affecting a company or an industry, or perhaps missing a quarterly estimate which has little to do with a company’s long-term ability to produce normalized free cash flow). The quarterly
estimate game has developed over many years and is an obsession having little to do with long-term valuations. As previously stated, our Funds are managed for success over the long-term rather than instantaneous gratification. In general market timers and stock timers who are successful can produce high returns, but the probability of being successful is low and the risk of failure (which destroys capital) is high. We have yet to find a professed market timer who has been able to time the market with enough consistency to profit therefrom. Our “timing” is paying the right price. We believe the right price on any investment is that price which provides a material discount to a company’s intrinsic value which we calculate by estimating future normalized free cash flow after an exhaustive analysis of a company’s financial statements, footnotes, shareholder releases, etc. We believe long-term above average performance is determined by the number and severity of one’s losses. A large gain does not have the same impact on performance as a large loss does. For example, an 80% gain in one year on a $100,000 investment followed by a 50% loss in year 2 leaves the investor with $90,000, or a 10% loss, and losses destroy capital. Our method of trying to protect against large losses is by paying attention to the prices we pay (look for material discounts from our calculation of intrinsic value) We also require sound balance sheets and realistic financial statements which accurately portray the economic reality of the underlining businesses (we make adjustments when necessary to aggressive assumptions). In addition, we require that companies in our portfolios demonstrate outstanding disclosure of the important facts and assumptions needed to make an informed estimate of future normalized free cash flow which we use to help determine a company’s value.
Another misconception about our Funds are that we do not buy so called “growth” stocks with high P/E ratios and therefore our long-term performance will be less than growth funds. Not only are we agnostic to ever-changing stock market predictions, but we also stick doggedly to valuing companies based on our assessment of normalized future free cash flow. We could care less whether we own a so-called growth stock, value stock, cyclical stock, asset stock or high P/E stock. Our only limitation when purchasing a stock for the portfolio is paying the right price, so that future risk-reward ratios are more in our favor based on our estimate of expected future free cash flow. Our past performance has received contributions from different categories of stocks such as growth, cyclical, high P/E low P/E etc. We can value any kind of company, but our measuring stick is buying a company at a price that results in a discount based on our estimate of future normalized free cash flow. In the past, and not necessarily indicative of future results, the Funds have earned large capital gains in high P/E growth stocks (Apple, Disney, Microsoft, Google, Cisco) because we paid the right price.
We also earned material gains on boring cyclical stocks such as (GM, Generac, Keysight, Citizen’s Financial. etc.) also because we paid the right price. Of course, P/E ratios are lower on cyclical stocks because future free cash flow can be harder to predict, but that doesn’t mean that the potential for gain is not greater for cyclical stocks. We believe growth is not a separate category but a component of valuing a company, and in our opinion, the traditional style box should be updated to deal with modern day realities.
We also believe all the wasted time spent on Wall Street research reports and the media to discuss whether or not a company beats or misses quarterly estimates is similar to the tail wagging the dog. If the analyst accepts management’s estimates, the estimate is now the analyst’s as well. Management should report the quarter and the person valuing the company should make future estimates. Media statements such as “value is in” or “value is out” are nonsense. Value is always important, and we believe that the only alternative to value is overvalued. Are non-value funds over valued funds? Are all growth funds overvalued? We define growth funds as funds that grow their shareholders net asset value over long periods of time. Media and or analyst statements such as “active management is in or out” or “growth stocks will or will not beat value stocks” are ridiculous and are idle random chatter that don’t add anything to investment prowess. In addition, the word “forever” should completely be eliminated from investment literature. Investors and the media take their most recent experiences and cannot see their current experience’s ever changing directions. In essence, whatever is happening now is “forever” and it matters little whether the trends are positive or negative. Selfishly we hope that the concept “forever” is never eliminated from investment thinking because that thought process helps produces the values we seek to execute our investment philosophy.
In conclusion, we believe that attempts to utilize trading strategies when investing in products with longer-term investment strategies has a high probability of producing lower returns. Our experience is that most of our gains occur in short periods of time right after periods of negativity and being out of the market during those periods can materially lower long term returns.
We value your trust and invest our own money alongside our shareholders. We look forward to the future!
Sincerely,
 |  |
| Robert A. Olstein | Eric R. Heyman |
| Chairman and Chief Investment Officer | Co-Portfolio Manager |
The following chart illustrates the growth, on a quarterly basis, of a hypothetical $10,000 investment made in the Olstein All Cap Value Fund’s Class C share at the Olstein All Cap Value Fund’s inception date of September 21, 1995 (with dividends and capital gain distributions reinvested but no deduction of taxes on reinvested distributions—see important disclosures below):
(UNAUDITED)
| | | Value of Shares | |
| | | Owned, If Initial | |
| | | Investment | |
| | Date
| was $10,000 | |
| | 9/21/95 | |
| $10,000 | | |
| | 9/30/95 | | | 10,010 | | |
| | 12/31/95 | | | 10,261 | | |
| | 3/31/96 | | | 10,882 | | |
| | 6/30/96 | | | 11,462 | | |
| | 9/30/96 | | | 11,713 | | |
| | 12/31/96 | | | 12,760 | | |
| | 3/31/97 | | | 13,327 | | |
| | 6/30/97 | | | 14,602 | | |
| | 9/30/97 | | | 17,250 | | |
| | 12/31/97 | | | 17,205 | | |
| | 3/31/98 | | | 19,851 | | |
| | 6/30/98 | | | 18,468 | | |
| | 9/30/98 | | | 15,499 | | |
| | 12/31/98 | | | 19,788 | | |
| | 3/31/99 | | | 20,717 | | |
| | 6/30/99 | | | 25,365 | | |
| | 9/30/99 | | | 23,675 | | |
| | 12/31/99 | | | 26,692 | | |
| | 3/31/00 | | | 28,170 | | |
| | 6/30/00 | | | 28,899 | | |
| | 9/30/00 | | | 30,596 | | |
| | 12/31/00 | | | 30,142 | | |
| | 3/31/01 | | | 30,207 | | |
| | 6/30/01 | | | 36,192 | | |
| | 9/30/01 | | | 28,213 | | |
| | 12/31/01 | | | 35,340 | | |
| | 3/31/02 | | | 38,259 | | |
| | 6/30/02 | | | 33,797 | | |
| | 9/30/02 | | | 25,870 | | |
| | 12/31/02 | | | 28,528 | | |
| | 3/31/03 | | | 26,226 | | |
| | 6/30/03 | | | 31,448 | | |
| | 9/30/03 | | | 33,797 | | |
| | 12/31/03 | | | 38,853 | | |
| | 3/31/04 | |
| 40,870 | | |
| | 6/30/04 | | | 41,297 | | |
| | 9/30/04 | | | 39,043 | | |
| | 12/31/04 | | | 43,146 | | |
| | 3/31/05 | | | 42,640 | | |
| | 6/30/05 | | | 42,302 | | |
| | 9/30/05 | | | 43,749 | | |
| | 12/31/05 | | | 44,350 | | |
| | 3/31/06 | | | 46,566 | | |
| | 6/30/06 | | | 44,241 | | |
| | 9/30/06 | | | 46,836 | | |
| | 12/31/06 | | | 50,755 | | |
| | 3/31/07 | | | 51,863 | | |
| | 6/30/07 | | | 55,536 | | |
| | 9/30/07 | | | 53,029 | | |
| | 12/31/07 | | | 49,012 | | |
| | 3/31/08 | | | 42,447 | | |
| | 6/30/08 | | | 40,189 | | |
| | 9/30/08 | | | 38,452 | | |
| | 12/31/08 | | | 27,545 | | |
| | 3/31/09 | | | 24,767 | | |
| | 6/30/09 | | | 30,102 | | |
| | 9/30/09 | | | 35,648 | | |
| | 12/31/09 | | | 37,741 | | |
| | 3/31/10 | | | 40,392 | | |
| | 6/30/10 | | | 35,788 | | |
| | 9/30/10 | | | 39,695 | | |
| | 12/31/10 | | | 43,845 | | |
| | 3/31/11 | | | 45,276 | | |
| | 6/30/11 | | | 45,310 | | |
| | 9/30/11 | | | 37,497 | | |
| | 12/31/11 | | | 41,962 | | |
| | 3/31/12 | | | 48,519 | | |
| | 6/30/12 | | | 45,555 | | |
| | 9/30/12 | | | 47,159 | | |
| | 12/31/12 | |
| 48,380 | | |
| | 3/31/13 | | | 54,275 | | |
| | 6/30/13 | | | 56,786 | | |
| | 9/30/13 | | | 60,379 | | |
| | 12/31/13 | | | 65,995 | | |
| | 3/31/14 | | | 66,867 | | |
| | 6/30/14 | | | 69,134 | | |
| | 9/30/14 | | | 69,413 | | |
| | 12/31/14 | | | 75,913 | | |
| | 3/31/15 | | | 77,290 | | |
| | 6/30/15 | | | 75,525 | | |
| | 9/30/15 | | | 66,631 | | |
| | 12/31/15 | | | 68,694 | | |
| | 3/31/16 | | | 70,220 | | |
| | 6/30/16 | | | 68,859 | | |
| | 9/30/16 | | | 73,312 | | |
| | 12/31/16 | | | 76,612 | | |
| | 3/31/17 | | | 80,372 | | |
| | 6/30/17 | | | 82,232 | | |
| | 9/30/17 | | | 82,438 | | |
| | 12/31/17 | | | 87,561 | | |
| | 3/31/18 | | | 86,683 | | |
| | 6/30/18 | | | 86,815 | | |
| | 9/30/18 | | | 91,553 | | |
| | 12/31/18 | | | 77,934 | | |
| | 3/31/19 | | | 87,094 | | |
| | 6/30/19 | | | 91,214 | | |
| | 9/30/19 | | | 91,699 | | |
| | 12/31/19 | | | 99,092 | | |
| | 3/31/20 | | | 67,832 | | |
| | 6/30/20 | | | 82,811 | | |
| | 9/30/20 | | | 89,674 | | |
| | 12/31/20 | | | 109,015 | | |
| | 3/31/21 | | | 126,682 | | |
| | 6/30/21 | | | 132,404 | | |
Details:
The performance data quoted represents past performance and does not guarantee future results. The Olstein All Cap Value Fund’s Class C average annual return for the one-year, five-year, and ten-year periods ended 6/30/21, assuming reinvestment of dividends and capital gain distributions and deduction of the Olstein All Cap Value
Fund’s maximum CDSC of 1% during the one-year period, was 58.89%, 13.97%, and 11.32%, respectively. Per the Fund’s prospectus dated 10/28/20, the expense ratio for the Olstein All Cap Value Fund Class C was 2.15%. Performance and expense ratios for other share classes will vary due to differences in sales charge structure and class expenses. The investment return and principal value of an investment will fluctuate so that an investor’s shares, when redeemed, may be worth more or less than their original cost. Current performance may be lower or higher than performance quoted. To obtain performance data current to the most recent month end, please go to our website at www.olsteinfunds.com.
The above represents the opinion of the Manager and is not intended to be a forecast of future events, a guarantee of future results, or investment advice. The references to securities are not buy or sell recommendations but are intended to be descriptive examples of the Funds’ investment philosophy and are subject to change. Do not make investments based on the securities referenced. A full schedule of Fund holdings as of 6/30/21 is contained in this report and is subject to change. This information should be preceded or accompanied by a current prospectus, which contains more complete information, including investment objectives, risks, charges, and expenses of the Olstein Funds and should be read carefully before investing. A current prospectus may be obtained by calling (800) 799-2113 or visiting the Olstein Funds’ website at www.olsteinfunds.com.
The Olstein Funds follow a value-oriented investment approach. However, a particular value stock may not increase in price as the Investment Manager anticipates and may actually decline in price if other investors fail to recognize the stock’s value or if a catalyst that the Investment Manager believes will increase the price of the stock does not occur or does not affect the price of the stock in the manner or to the degree that the Investment Manager anticipated. Also, the Investment Manager’s calculation of a stock’s private market value involves estimates of future cash flow which may prove to be incorrect and, therefore, could result in sales of the stock at prices lower than the Fund’s original purchase price. The investment return and principal value of an investment will fluctuate so that an investor’s shares, when redeemed, may be worth more or less than their original cost. There is no assurance that the Fund will achieve its investment objective.
Regarding the Olstein Strategic Opportunities Fund, an investment in a portfolio containing small- and mid-cap companies is subject to additional risks, as the share prices of small- and mid-cap companies are often more volatile than those of larger companies due to several factors, including limited trading volumes, products, financial resources, management inexperience and less publicly available information. The activist strategy invests in stocks of underperforming companies and any shareholder activism might not result in a change in performance or corporate governance. These stocks could also experience less liquidity and higher share price and trading volume volatility than stocks of other companies.
The Russell 3000® Index is an unmanaged index that seeks to represent the broad U.S. equity universe accounting for approximately 98% of the U.S. market capitalization. The Russell 3000® Value Index measures the performance of the broad value segment of U.S. equity value universe. It includes those Russell 3000® companies with lower price-to-book ratios and lower forecasted growth values. The Russell 3000® Value Index is constructed to provide a comprehensive and unbiased barometer of the broad value market. The S&P 500® Index is an unmanaged index created by Standard & Poor’s Corporation that includes a representative sample of 500 leading companies in leading industries of the U.S. economy and is considered to be a broad-based indicator representing the U.S. stock market performance in general. The Russell 2500® Index measures the performance of the small to mid-cap segment of the U.S. equity universe, commonly referred to as “SMID” cap. The Russell 2500® Index is a subset of the Russell 3000® Index. It includes approximately 2,500 of the smallest securities based on a combination of their market cap and current index membership. The Russell 2500® Value Index measures the performance of the small to mid-cap value segment of the U.S. equity universe. It includes those Russell 2500® companies that are considered more value oriented relative to the overall market as defined by Russell’s leading style methodology. The Russell 2500® Value Index is constructed to provide a comprehensive and unbiased barometer of the small to mid-cap value market. Past performance does not guarantee future results. Index returns do not reflect payment of any expenses, fees or sales charges an investor would pay to purchase the securities the Index represents. Such costs would lower performance. One cannot invest directly in an index. Cash flow is the net amount of cash and cash-equivalents being transferred into and out of a business. At the most fundamental level, a company’s ability to create value for shareholders is determined by its ability to generate positive cash flows, or more specifically, maximize long-term free cash flow. Free cash flow represents the cash a company generates after accounting for cash outflows to support operations and maintain its capital assets. Unlike earnings or net income, free cash flow is a measure of profitability that excludes the non-cash expenses of the income statement and includes spending on equipment and assets as well as changes in working capital from the balance sheet. The price-earnings ratio (P/E ratio) is the ratio for valuing a company that measures its current share price relative to its per-share earnings. The Dow Jones Industrial Average is a price-weighted average of 30 blue-chip stocks that are generally the leaders in their industry. It is widely followed indicator of the stock market in general.
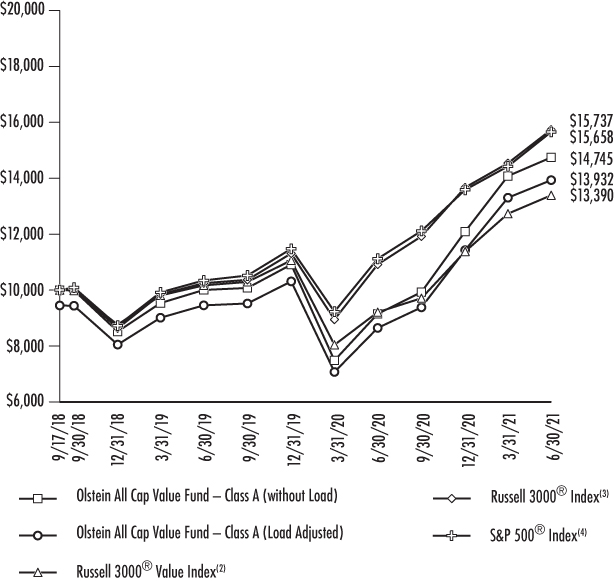
Value of $10,000 Investment (Unaudited)
Comparison of the Change in Value of a Hypothetical $10,000 Investment from the Fund’s Class A shares from Inception through the Fiscal Year End of June 30, 2021. The returns listed in the table do not reflect the deduction of taxes on reinvested dividends.
Average Annual Rate of Return For Periods Ended June 30, 2021 |
| | 1 Year | Inception(5) |
Olstein All Cap Value Fund – Class A (without Load)(1) | 61.15% | 14.97% |
Olstein All Cap Value Fund – Class A (Load Adjusted)(1) | 52.26% | 12.65% |
Russell 3000® Value Index(2) | 45.40% | 11.06% |
Russell 3000® Index(3) | 44.16% | 17.69% |
S&P 500® Index(4) | 40.79% | 17.48% |
| (1) | Assumes reinvestment of dividends and capital gains. Reflects the effect of the maximum sale load charge of 5.50% in load adjusted return. Past performance is not necessarily indicative of future results. Investment returns and principal values may fluctuate, so that, when redeemed, shares may be worth more or less than their original cost. |
| (2) | The Russell 3000® Value Index return is adjusted upward to reflect reinvested dividends, but does not reflect the deduction of any fees or expenses associated with investments in the index, and thus represents a “gross return”. One cannot invest directly in an index. |
| (3) | The Russell 3000® Index reflects the broad U.S. equity universe and represents approximately 98% of the U.S. market. The Russell 3000® Index return is adjusted upward to reflect reinvested dividends, but does not reflect the deduction of any fees or expenses associated with investments in the index, and thus represents a “gross return”. One cannot invest directly in an index. |
| (4) | The S&P 500® Index return is adjusted upward to reflect reinvested dividends, but does not reflect the deduction of any fees or expenses associated with investment in the index, and thus represents a “gross return”. One cannot invest directly in an index. |
| (5) | Commenced operations on September 17, 2018. |
| OLSTEIN ALL CAP VALUE FUND |
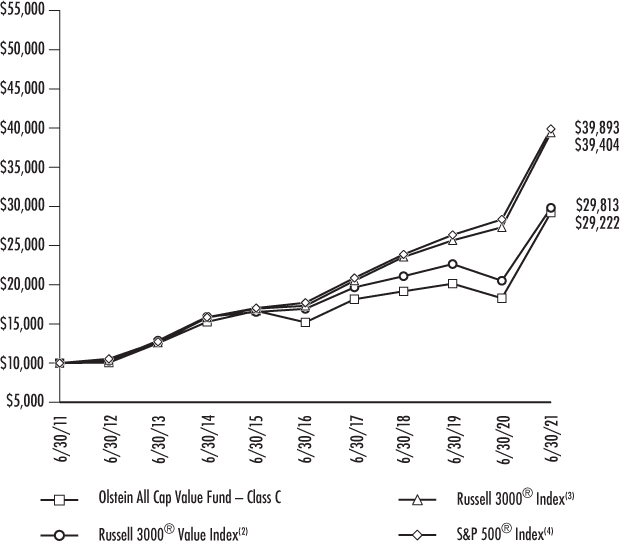
Value of $10,000 Investment (Unaudited)
Comparison of the Change in Value of a Hypothetical $10,000 Investment in the Fund’s Class C shares for the past 10 years through the Fiscal Year End of June 30, 2021. The line chart does not reflect any applicable Contingent Deferred Sales Charge. The returns listed in the table do not reflect the deduction of taxes on reinvested dividends.
Average Annual Rate of Return For Periods Ended June 30, 2021 |
| | 1 Year | 5 Year | 10 Year | 15 Year | Inception(5) |
Olstein All Cap Value – Class C(1) | 58.89% | 13.97% | 11.32% | 7.58% | 10.54% |
Russell 3000® Value Index(2) | 45.40% | 11.99% | 11.54% | 7.99% | 9.47% |
Russell 3000® Index(3) | 44.16% | 17.89% | 14.70% | 10.78% | 10.19% |
S&P 500® Index(4) | 40.79% | 17.65% | 14.84% | 10.73% | 10.12% |
| (1) | Assumes reinvestment of dividends and capital gains. Also includes all expenses at the end of each period and assumes the deduction of the appropriate CDSC of 1% as if an investor had redeemed at the end of the one year period, and thus represents a “net return”. The CDSC is based on the lesser of the original purchase price and the value of such shares at the time of redemption. Past performance is not necessarily indicative of future results. Investment returns and principal values may fluctuate, so that, when redeemed, shares may be worth more or less than their original cost. |
| (2) | The Russell 3000® Value Index return is adjusted upward to reflect reinvested dividends, but does not reflect the deduction of any fees or expense associated with investments in the index, and thus represents a “gross return”. One cannot invest directly in an index. |
| (3) | The Russell 3000® Index reflects the broad U.S. equity universe and represents approximately 98% of the U.S. market. The Russell 3000® Index return is adjusted upward to reflect reinvested dividends, but does not reflect the deduction of any fees or expenses associated with investments in the index, and thus represents a “gross return”. One cannot invest directly in an index. |
| (4) | The S&P 500® Index return is adjusted upward to reflect reinvested dividends, but does not reflect the deduction of any fees or expenses associated with investment in the index, and thus represents a “gross return”. One cannot invest directly in an index. |
| (5) | Commenced operations on September 21, 1995. |
| OLSTEIN ALL CAP VALUE FUND |
Value of $10,000 Investment (Unaudited)
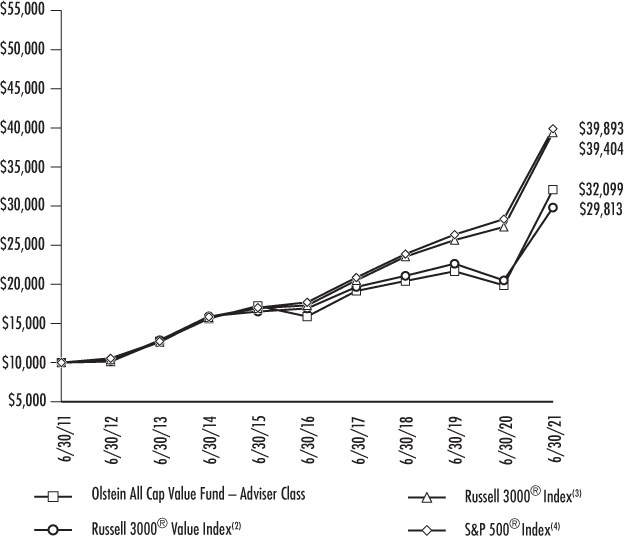
Comparison of the Change in Value of a Hypothetical $10,000 Investment from the Fund’s Adviser Class shares for the past 10 years through the Fiscal Year End of June 30, 2021. The returns listed in the table do not reflect the deduction of taxes on reinvested dividends.
Average Annual Rate of Return For Periods Ended June 30, 2021 |
| | 1 Year | 5 Year | 10 Year | 15 Year | Inception(5) |
| Olstein All Cap Value Fund – | | | | | |
Adviser Class(1) | 61.49% | 15.10% | 12.37% | 8.53% | 8.94% |
Russell 3000® Value Index(2) | 45.40% | 11.99% | 11.54% | 7.99% | 7.74% |
Russell 3000® Index(3) | 44.16% | 17.89% | 14.70% | 10.78% | 8.13% |
S&P 500® Index(4) | 40.79% | 17.65% | 14.84% | 10.73% | 7.66% |
| (1) | Assumes reinvestment of dividends and capital gains. Also includes all expenses at the end of each period and thus represents a “net return”. Past performance is not necessarily indicative of future results. Investment returns and principal values may fluctuate, so that, when redeemed, shares may be worth more or less than their original cost. |
| (2) | The Russell 3000® Value Index return is adjusted upward to reflect reinvested dividends, but does not reflect the deduction of any fees or expense associated with investments in the index, and thus represents a “gross return”. One cannot invest directly in an index. |
| (3) | The Russell 3000® Index reflects the broad U.S. equity universe and represents approximately 98% of the U.S. market. The Russell 3000® Index return is adjusted upward to reflect reinvested dividends, but does not reflect the deduction of any fees or expenses associated with investments in the index, and thus represents a “gross return”. One cannot invest directly in an index. |
| (4) | The S&P 500® Index return is adjusted upward to reflect reinvested dividends, but does not reflect the deduction of any fees or expenses associated with investment in the index, and thus represents a “gross return”. One cannot invest directly in an index. |
| (5) | Commenced operations on September 21, 1999. |
| OLSTEIN ALL CAP VALUE FUND |
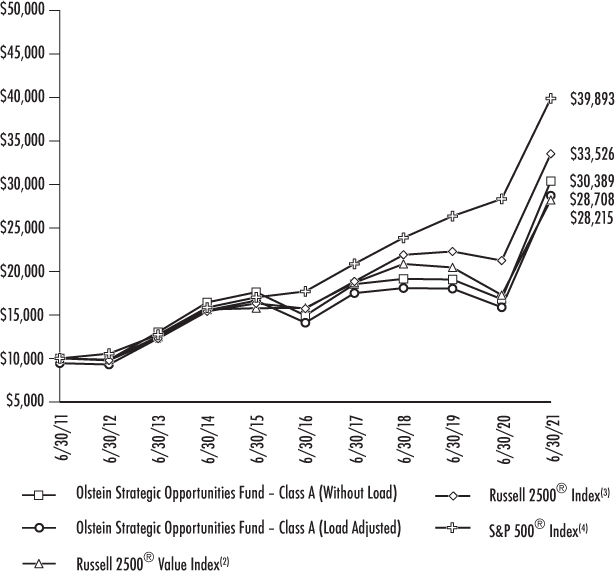
Value of $10,000 Investment (Unaudited)
Comparison of the Change in Value of a Hypothetical $10,000 Investment from the Fund’s Class A shares for the past 10 years through the Fiscal Year End of June 30, 2021. The returns listed in the table do not reflect the deduction of taxes on reinvested dividends.
Average Annual Rate of Return For Periods Ended June 30, 2021 |
| | 1 Year | 5 Year | 10 Year | Inception(5) |
| Olstein Strategic Opportunities Fund – | | | | |
Class A (without Load)(1) | 80.84% | 15.29% | 11.76% | 9.14% |
| Olstein Strategic Opportunities Fund – | | | | |
Class A (Load Adjusted)(1) | 70.94% | 13.99% | 11.12% | 8.72% |
Russell 2500® Value Index(2) | 63.23% | 12.29% | 10.93% | 8.20% |
Russell 2500® Index(3) | 57.79% | 16.35% | 12.86% | 10.21% |
S&P 500® Index(4) | 40.79% | 17.65% | 14.84% | 10.39% |
| (1) | Assumes reinvestment of dividends and capital gains. Reflects the effect of the maximum sale load charge of 5.50% in load adjusted return. Past performance is not necessarily indicative of future results. Investment returns and principal values may fluctuate, so that, when redeemed, shares may be worth more or less than their original cost. |
| (2) | The Russell 2500® Value Index return is adjusted upward to reflect reinvested dividends, but does not reflect the deduction of any fees or expenses associated with investments in the index, and thus represents a “gross return”. One cannot invest directly in an index. |
| (3) | The Russell 2500® Index measures the performance of the 2,500 smallest companies in the Russell 3000® Index. The Russell 2500® Index return is adjusted upward to reflect reinvested dividends, but does not reflect the deduction of any fees or expenses associated with investments in the index, and thus represents a “gross return”. One cannot invest directly in an index. |
| (4) | S&P 500® Index return is adjusted upward to reflect reinvested dividends, but does not reflect the deduction of any fees or expenses associated with investment in the index, and thus represents a “gross return”. One cannot invest directly in an index. |
| (5) | Commencement of operation was November 1, 2006. |
| OLSTEIN STRATEGIC OPPORTUNITIES FUND |
Value of $10,000 Investment (Unaudited)
Comparison of the Change in Value of a Hypothetical $10,000 Investment from the Fund’s Class C shares for the past 10 years through the Fiscal Year End of June 30, 2021. The line chart does not reflect any applicable Contingent Deferred Sales Charge. The returns listed in the table do not reflect the deduction of taxes on reinvested dividends.
Average Annual Rate of Return For Periods Ended June 30, 2021 |
| | 1 Year | 5 Year | 10 Year | Inception(5) |
| Olstein Strategic Opportunities Fund – | | | | |
Class C(1) | 78.36% | 14.42% | 10.92% | 8.34% |
Russell 2500® Value Index(2) | 63.23% | 12.29% | 10.93% | 8.20% |
Russell 2500® Index(3) | 57.79% | 16.35% | 12.86% | 10.21% |
S&P 500® Index(4) | 40.79% | 17.65% | 14.84% | 10.39% |

| (1) | Assumes reinvestment of dividends and capital gains. Also includes all expenses at the end of each period and assumes the deduction of the appropriate CDSC of 1% as if an investor had redeemed at the end of the one year period, and thus represents a “net return”. The CDSC is based on the lesser of the original purchase price and the value of such shares at the time of redemption. Past performance is not necessarily indicative of future results. Investment returns and principal values may fluctuate, so that, when redeemed, shares may be worth more or less than their original cost. |
| (2) | The Russell 2500® Value Index return is adjusted upward to reflect reinvested dividends, but does not reflect the deduction of any fees or expenses associated with investments in the index, and thus represents a “gross return”. One cannot invest directly in an index. |
| (3) | The Russell 2500® Index measures the performance of the 2,500 smallest companies in the Russell 3000® Index. The Russell 2500® Index return is adjusted upward to reflect reinvested dividends, but does not reflect the deduction of any fees or expenses associated with investments in the index, and thus represents a “gross return”. One cannot invest directly in an index. |
| (4) | The S&P 500® Index return is adjusted upward to reflect reinvested dividends, but does not reflect the deduction of any fees or expenses associated with investment in the index, and thus represents a “gross return”. One cannot invest directly in an index. |
| (5) | Commencement of operation was November 1, 2006. |
| OLSTEIN STRATEGIC OPPORTUNITIES FUND |
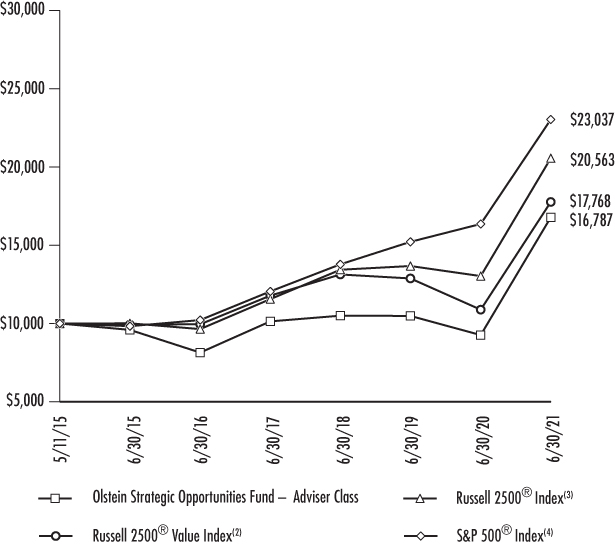
Value of $10,000 Investment (Unaudited)
Comparison of the Change in Value of a Hypothetical $10,000 Investment from the Fund’s Adviser Class shares from Inception through the Fiscal Year End of June 30, 2021. The returns listed in the table do not reflect the deduction of taxes on reinvested dividends.
Average Annual Rate of Return For Periods Ended June 30, 2021 |
| | 1 Year | 3 Year | 5 Year | Inception(5) |
| Olstein Strategic Opportunities Fund – | | | | |
Adviser Class(1) | 81.22% | 16.93% | 15.57% | 8.81% |
Russell 2500® Value Index(2) | 63.23% | 10.60% | 12.29% | 9.82% |
Russell 2500® Index(3) | 57.79% | 15.24% | 16.35% | 12.46% |
S&P 500® Index(4) | 40.79% | 18.67% | 17.65% | 14.57% |
| (1) | Assumes reinvestment of dividends and capital gains. Also include all expense at the end of the period and thus represents a “net return”. Past performance is not necessarily indicative of future results. Investment returns and principal values may fluctuate, so that, when redeemed, shares may be worth more or less than their original cost. |
| (2) | The Russell 2500® Value Index return is adjusted upward to reflect reinvested dividends, but does not reflect the deduction of any fees or expenses associated with investments in the index, and thus represents a “gross return”. One cannot invest directly in an index. |
| (3) | The Russell 2500® Index measures the performance of the 2,500 smallest companies in the Russell 3000® Index. The Russell 2500® Index return is adjusted upward to reflect reinvested dividends, but does not reflect the deduction of any fees or expenses associated with investments in the index, and thus represents a “gross return”. One cannot invest directly in an index. |
| (4) | The S&P 500® Index return is adjusted upward to reflect reinvested dividends, but does not reflect the deduction of any fees or expenses associated with investment in the index, and thus represents a “gross return”. One cannot invest directly in an index. |
| (5) | Commencement of operation was May 11, 2015. |
| OLSTEIN STRATEGIC OPPORTUNITIES FUND |
The Olstein Funds
Expense Examples as of June 30, 2021 (Unaudited)
As a shareholder of a Fund, you incur two types of costs: (1) transaction costs, including brokerage commissions on purchase and sales of Fund shares, sales loads on purchase payments or contingent deferred sales charges on redemptions, if any, and (2) ongoing costs, including management fees, distribution and/or service (12b-1) fees, interest expense and other Fund expenses. This Example is intended to help you understand your ongoing costs (in dollars) of investing in a Fund and to compare these costs with the ongoing costs of investing in other mutual funds. The Example is based on an investment of $1,000 invested at the beginning of the period and held for the entire period, January 1, 2021 – June 30, 2021.
Actual Expenses For each class, the first line of the table provides information about actual account values and actual expenses. You may use the information in this table, together with the amount you invested, to estimate the expenses that you paid over the period. Simply divide your account value by $1,000 (for example, an $8,600 account value divided by $1,000 = 8.6), then multiply the result by the number in the table under the heading entitled “Expenses Paid During Period” to estimate the expenses you paid on your account during this period.
Hypothetical Example for Comparison Purposes For each class, the second line of the following table provides information about hypothetical account values and hypothetical expenses based on the Fund’s actual expense ratio and an assumed rate of return of 5% per year before expenses, which is not the Fund’s actual return. The hypothetical account values and expenses may not be used to estimate the actual ending account balance or expenses you paid for the period. You may use this information to compare the ongoing costs of investing in the Fund and other funds. To do so, compare this 5% hypothetical example with the 5% hypothetical examples that appear in the shareholder reports of the other funds.
Please note that the expenses shown in the table are meant to highlight your ongoing costs only and do not reflect any transactional costs. Therefore, the hypothetical information is useful in comparing ongoing costs only, and will not help you determine the relative total costs of owning different funds. In addition, if these transactional costs were included, your costs may have been higher.
Olstein All Cap Value Fund
| | Beginning | Ending | Expenses Paid |
| | Account Value | Account Value | During Period(1) |
| | 1/1/21 | 6/30/21 | 1/1/21 to 6/30/21 |
| Actual | | | |
Class A(2) | $1,000.00 | $1,219.20 | $7.59 |
Class C(2) | $1,000.00 | $1,214.50 | $11.70 |
Adviser Class(2) | $1,000.00 | $1,220.50 | $6.22 |
| Hypothetical (5% annual return | | | |
| before expenses) | | | |
| Class A | $1,000.00 | $1,017.95 | $6.90 |
| Class C | $1,000.00 | $1,014.23 | $10.64 |
| Adviser Class | $1,000.00 | $1,019.19 | $5.66 |
| (1) | Expenses are equal to the Fund’s annualized expense ratio for the most recent six-month period of 1.38%, 2.13% and 1.13% for Class A, Class C, and Adviser Class, respectively, multiplied by the average account value over the period, multiplied by 181/365 to reflect the one-half year period. |
| (2) | Based on the actual returns for the six-month period ended June 30, 2021 of 21.92%, 21.45%, and 22.05% for the Class A, Class C and the Adviser Class, respectively. |
Olstein Strategic Opportunities Fund
| | Beginning | Ending | Expenses Paid |
| | Account Value | Account Value | During Period(3) |
| | 1/1/21 | 6/30/21 | 1/1/21 to 6/30/21 |
| Actual | | | |
Class A(4) | $1,000.00 | $1,238.50 | $8.88 |
Class C(4) | $1,000.00 | $1,234.10 | $13.02 |
Adviser Class(4) | $1,000.00 | $1,240.10 | $7.50 |
| Hypothetical (5% annual return | | | |
| before expenses) | | | |
| Class A | $1,000.00 | $1,016.86 | $8.00 |
| Class C | $1,000.00 | $1,013.14 | $11.73 |
| Adviser Class | $1,000.00 | $1,018.10 | $6.76 |
| (3) | Expenses are equal to the Fund’s annualized expense ratio for the most recent six-month period of 1.60%, 2.35% and 1.35% for Class A, Class C, and Adviser Class, respectively, multiplied by the average account value over the period, multiplied by 181/365 to reflect the one-half year period. |
| (4) | Based on the actual returns for the six-month period ended June 30, 2021 of 23.85%, 23.41%, and 24.01% for the Class��A, Class C and the Adviser Class, respectively. |
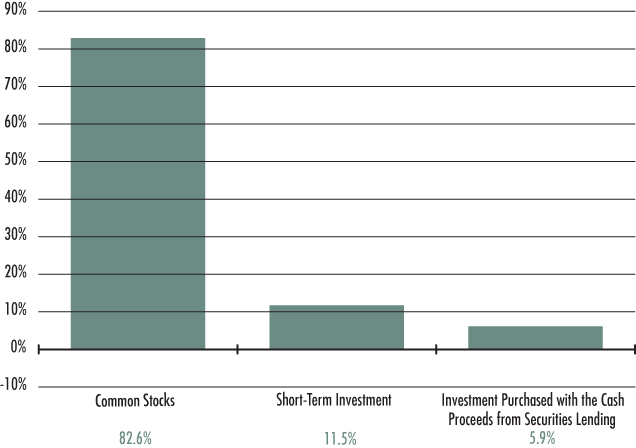
Olstein All Cap Value Fund
Allocation of Portfolio Assets as a percentage of investments
June 30, 2021 (Unaudited)
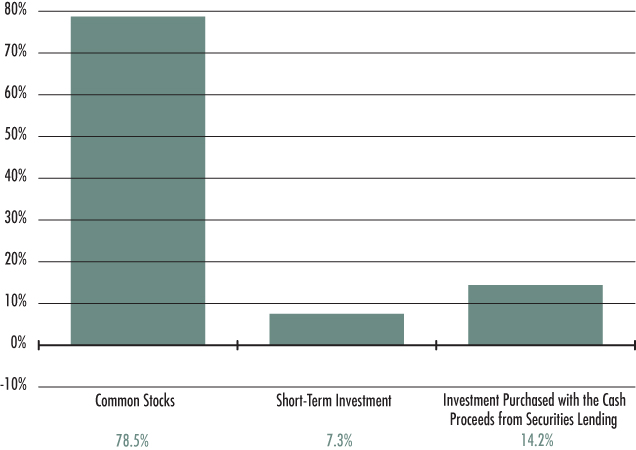
Olstein Strategic Opportunities Fund
Allocation of Portfolio Assets as a percentage of investments
June 30, 2021 (Unaudited)
Olstein All Cap Value Fund
Schedule of Investments as of June 30, 2021
| COMMON STOCKS – 88.2% | | | | | | |
| ADVERTISING AGENCIES – 1.5% | | Shares | | | Value | |
| Omnicom Group, Inc. (a) | | | 140,000 | | | $ | 11,198,600 | |
| | | | | | | | | |
| AEROSPACE & DEFENSE – 2.0% | | | | | | | | |
| L3Harris Technologies, Inc. | | | 39,000 | | | | 8,429,850 | |
| Raytheon Technologies Corporation | | | 77,000 | | | | 6,568,870 | |
| | | | | | | | 14,998,720 | |
| AIR DELIVERY & FREIGHT SERVICES – 2.4% | | | | | | | | |
| FedEx Corporation | | | 33,000 | | | | 9,844,890 | |
| United Parcel Service, Inc. – Class B | | | 39,000 | | | | 8,110,830 | |
| | | | | | | | 17,955,720 | |
| AIRLINES – 2.6% | | | | | | | | |
| Delta Air Lines, Inc. (b) | | | 193,000 | | | | 8,349,180 | |
| JetBlue Airways Corporation (b) | | | 447,000 | | | | 7,500,660 | |
| Southwest Airlines Company (b) | | | 72,000 | | | | 3,822,480 | |
| | | | | | | | 19,672,320 | |
| AUTO MANUFACTURERS – 1.0% | | | | | | | | |
| General Motors Company (b) | | | 129,000 | | | | 7,632,930 | |
| | | | | | | | | |
| AUTOMOBILES – 0.3% | | | | | | | | |
| Winnebago Industries, Inc. (a) | | | 37,550 | | | | 2,551,898 | |
| | | | | | | | | |
| BEVERAGES – 0.6% | | | | | | | | |
| Keurig Dr Pepper, Inc. | | | 124,000 | | | | 4,369,760 | |
| | | | | | | | | |
| BUILDING PRODUCTS – 1.3% | | | | | | | | |
| Carrier Global Corporation | | | 198,000 | | | | 9,622,800 | |
| | | | | | | | | |
| CAPITAL MARKETS – 1.2% | | | | | | | | |
| Goldman Sachs Group, Inc. | | | 24,500 | | | | 9,298,485 | |
| | | | | | | | | |
| CHEMICALS – 1.7% | | | | | | | | |
| Corteva, Inc. | | | 201,000 | | | | 8,914,350 | |
| Eastman Chemical Company | | | 31,000 | | | | 3,619,250 | |
| | | | | | | | 12,533,600 | |
The accompanying notes are an integral part of these financial statements.
| OLSTEIN ALL CAP VALUE FUND |
COMMON STOCKS – 88.2% – continued | | | | | | |
| COMMERCIAL BANKS – 5.6% | | Shares | | | Value | |
| Citizens Financial Group, Inc. | | | 180,750 | | | $ | 8,291,002 | |
| Fifth Third Bancorp (a) | | | 222,000 | | | | 8,487,060 | |
| Prosperity Bancshares, Inc. | | | 68,000 | | | | 4,882,400 | |
| U.S. Bancorp | | | 160,000 | | | | 9,115,200 | |
| Wells Fargo & Company | | | 247,000 | | | | 11,186,630 | |
| | | | | | | | 41,962,292 | |
| COMMERCIAL SERVICES – 1.5% | | | | | | | | |
| Moody’s Corporation | | | 15,500 | | | | 5,616,735 | |
| S&P Global, Inc. (a) | | | 13,500 | | | | 5,541,075 | |
| | | | | | | | 11,157,810 | |
| COMMUNICATIONS EQUIPMENT – 1.8% | | | | | | | | |
| Cisco Systems, Inc. | | | 251,000 | | | | 13,303,000 | |
| | | | | | | | | |
| COMPUTERS – 2.3% | | | | | | | | |
| Apple, Inc. | | | 75,000 | | | | 10,272,000 | |
| Western Digital Corporation (b) | | | 94,000 | | | | 6,689,980 | |
| | | | | | | | 16,961,980 | |
| CONSUMER FINANCE – 3.1% | | | | | | | | |
| American Express Company | | | 34,000 | | | | 5,617,820 | |
| Equifax, Inc. | | | 45,000 | | | | 10,777,950 | |
| Mastercard, Inc. – Class A | | | 7,500 | | | | 2,738,175 | |
| Visa, Inc. – Class A (a) | | | 19,000 | | | | 4,442,580 | |
| | | | | | | | 23,576,525 | |
| CONTAINERS & PACKAGING – 1.0% | | | | | | | | |
| WestRock Company | | | 139,750 | | | | 7,437,495 | |
| | | | | | | | | |
| DISTRIBUTORS – 0.9% | | | | | | | | |
| LKQ Corporation (a)(b) | | | 141,101 | | | | 6,944,991 | |
| | | | | | | | | |
| DIVERSIFIED FINANCIAL SERVICES – 2.6% | | | | | | | | |
| Berkshire Hathaway, Inc. – Class B (b) | | | 32,000 | | | | 8,893,440 | |
| Invesco Ltd. (c) | | | 409,600 | | | | 10,948,608 | |
| | | | | | | | 19,842,048 | |
| E-COMMERCE – 2.0% | | | | | | | | |
| eBay, Inc. | | | 214,000 | | | | 15,024,940 | |
The accompanying notes are an integral part of these financial statements.
| OLSTEIN ALL CAP VALUE FUND |
COMMON STOCKS – 88.2% – continued | | | | | | |
| ELECTRICAL EQUIPMENT – 1.0% | | Shares | | | Value | |
| Generac Holdings, Inc. (b) | | | 18,200 | | | $ | 7,555,730 | |
| | | | | | | | | |
| ELECTRONICS – 2.3% | | | | | | | | |
| Keysight Technologies, Inc. (b) | | | 49,650 | | | | 7,666,456 | |
| Sensata Technologies Holding PLC (b)(c) | | | 173,310 | | | | 10,046,781 | |
| | | | | | | | 17,713,237 | |
| ENERGY EQUIPMENT & SERVICES – 1.0% | | | | | | | | |
| Schlumberger Ltd. (c) | | | 239,000 | | | | 7,650,390 | |
| | | | | | | | | |
| FOOD & DRUG RETAILERS – 4.6% | | | | | | | | |
| CVS Health Corporation | | | 180,000 | | | | 15,019,200 | |
| Walgreens Boots Alliance, Inc. | | | 380,500 | | | | 20,018,105 | |
| | | | | | | | 35,037,305 | |
| HEALTH CARE EQUIPMENT & SUPPLIES – 5.5% | | | | | | | | |
| Baxter International, Inc. | | | 82,000 | | | | 6,601,000 | |
| Becton, Dickinson and Company | | | 47,000 | | | | 11,429,930 | |
| Hologic, Inc. (b) | | | 95,000 | | | | 6,338,400 | |
| Medtronic PLC (c) | | | 71,000 | | | | 8,813,230 | |
| Zimmer Biomet Holdings, Inc. | | | 52,000 | | | | 8,362,640 | |
| | | | | | | | 41,545,200 | |
| HEALTH CARE PROVIDERS & SERVICES – 2.8% | | | | | | | | |
| Quest Diagnostics, Inc. (a) | | | 62,000 | | | | 8,182,140 | |
| UnitedHealth Group, Inc. | | | 18,500 | | | | 7,408,140 | |
| Universal Health Services, Inc. – Class B | | | 37,000 | | | | 5,417,910 | |
| | | | | | | | 21,008,190 | |
| HOTELS, RESTAURANTS & LEISURE – 0.7% | | | | | | | | |
| Booking Holdings, Inc. (b) | | | 2,250 | | | | 4,923,203 | |
| | | | | | | | | |
| HOUSEHOLD DURABLES – 1.1% | | | | | | | | |
| Mohawk Industries, Inc. (b) | | | 44,250 | | | | 8,504,408 | |
| | | | | | | | | |
| HOUSEHOLD PRODUCTS – 1.4% | | | | | | | | |
| Kimberly-Clark Corporation | | | 47,000 | | | | 6,287,660 | |
| Reynolds Consumer Products, Inc. (a) | | | 132,000 | | | | 4,006,200 | |
| | | | | | | | 10,293,860 | |
The accompanying notes are an integral part of these financial statements.
| OLSTEIN ALL CAP VALUE FUND |
COMMON STOCKS – 88.2% – continued | | | | | | |
| INDUSTRIAL EQUIPMENT WHOLESALE – 1.3% | | Shares | | | Value | |
| WESCO International, Inc. (b) | | | 98,000 | | | $ | 10,076,360 | |
| | | | | | | | | |
| INSURANCE – 2.9% | | | | | | | | |
| Aon PLC – Class A (a)(c) | | | 9,000 | | | | 2,148,840 | |
| Marsh & McLennan Companies, Inc. (a) | | | 27,000 | | | | 3,798,360 | |
| Travelers Companies, Inc. | | | 51,000 | | | | 7,635,210 | |
| Willis Towers Watson PLC (c) | | | 36,000 | | | | 8,280,720 | |
| | | | | | | | 21,863,130 | |
| INTERACTIVE MEDIA & SERVICES – 1.4% | | | | | | | | |
| Facebook, Inc. – Class A (b) | | | 30,000 | | | | 10,431,300 | |
| | | | | | | | | |
| INTERNET SOFTWARE & SERVICES – 1.0% | | | | | | | | |
| Alphabet, Inc. – Class C (b) | | | 3,100 | | | | 7,769,592 | |
| | | | | | | | | |
| IT SERVICES – 1.3% | | | | | | | | |
| Accenture PLC – Class A (c) | | | 14,500 | | | | 4,274,455 | |
| Automatic Data Processing, Inc. | | | 29,000 | | | | 5,759,980 | |
| | | | | | | | 10,034,435 | |
| MACHINERY – 2.2% | | | | | | | | |
| Cummins, Inc. | | | 24,000 | | | | 5,851,440 | |
| Stanley Black & Decker, Inc. | | | 28,000 | | | | 5,739,720 | |
| Timken Company | | | 65,750 | | | | 5,298,793 | |
| | | | | | | | 16,889,953 | |
| MATERIALS – 0.7% | | | | | | | | |
| Axalta Coating Systems Ltd. (b)(c) | | | 172,700 | | | | 5,265,623 | |
| | | | | | | | | |
| MEDIA – 6.0% | | | | | | | | |
| Comcast Corporation – Class A | | | 168,000 | | | | 9,579,360 | |
| Discovery, Inc. – Class C (b) | | | 471,600 | | | | 13,666,968 | |
| ViacomCBS, Inc. – Class B | | | 275,000 | | | | 12,430,000 | |
| Walt Disney Company (b) | | | 55,000 | | | | 9,667,350 | |
| | | | | | | | 45,343,678 | |
| MULTILINE RETAIL – 1.0% | | | | | | | | |
| Dollar Tree, Inc. (b) | | | 76,000 | | | | 7,562,000 | |
The accompanying notes are an integral part of these financial statements.
| OLSTEIN ALL CAP VALUE FUND |
COMMON STOCKS – 88.2% – continued | | | | | | |
| PHARMACEUTICALS – 1.4% | | Shares | | | Value | |
| Johnson & Johnson | | | 64,000 | | | $ | 10,543,360 | |
| | | | | | | | | |
| REAL ESTATE MANAGEMENT & DEVELOPMENT – 1.5% | | | | | | | | |
| CBRE Group, Inc. – Class A (b) | | | 72,000 | | | | 6,172,560 | |
| Jones Lang LaSalle, Inc. (b) | | | 26,450 | | | | 5,169,917 | |
| | | | | | | | 11,342,477 | |
| RESTAURANTS – 3.4% | | | | | | | | |
| Cracker Barrel Old Country Store, Inc. | | | 39,000 | | | | 5,789,940 | |
| Denny’s Corporation (b) | | | 407,770 | | | | 6,724,127 | |
| Dine Brands Global, Inc. (b) | | | 85,850 | | | | 7,662,112 | |
| McDonald’s Corporation | | | 24,000 | | | | 5,543,760 | |
| | | | | | | | 25,719,939 | |
| SEMICONDUCTORS & SEMICONDUCTOR EQUIPMENT – 3.5% | | | | | | | | |
| Intel Corporation | | | 212,000 | | | | 11,901,680 | |
| Kulicke and Soffa Industries, Inc. (a) | | | 172,000 | | | | 10,526,400 | |
| Texas Instruments, Inc. | | | 20,000 | | | | 3,846,000 | |
| | | | | | | | 26,274,080 | |
| SOFTWARE – 2.5% | | | | | | | | |
| Microsoft Corporation | | | 21,000 | | | | 5,688,900 | |
| Oracle Corporation | | | 68,000 | | | | 5,293,120 | |
| SS&C Technologies Holdings, Inc. | | | 109,000 | | | | 7,854,540 | |
| | | | | | | | 18,836,560 | |
| SPECIALTY RETAIL – 0.7% | | | | | | | | |
| Lowe’s Companies, Inc. | | | 27,000 | | | | 5,237,190 | |
| | | | | | | | | |
| TELECOMMUNICATIONS – 1.3% | | | | | | | | |
| Corning, Inc. | | | 231,700 | | | | 9,476,530 | |
| | | | | | | | | |
| TEXTILES, APPAREL & LUXURY GOODS – 0.3% | | | | | | | | |
| Tapestry, Inc. (b) | | | 56,400 | | | | 2,452,272 | |
| TOTAL COMMON STOCKS (Cost $459,524,902) | | | | | | | 665,395,916 | |
The accompanying notes are an integral part of these financial statements.
| OLSTEIN ALL CAP VALUE FUND |
| SHORT-TERM INVESTMENT – 12.3% | | | | | | |
| MONEY MARKET DEPOSIT ACCOUNT – 12.3% | | Shares | | | Value | |
| U.S. Bank N.A., 0.01% (d) | | | | | | |
| Total Money Market Deposit Account | | | 92,854,217 | | | $ | 92,854,217 | |
| TOTAL SHORT-TERM INVESTMENT (Cost $92,854,217) | | | | | | | 92,854,217 | |
| | | | | | | | | |
| INVESTMENT PURCHASED WITH THE CASH | | | | | | | | |
| PROCEEDS FROM SECURITIES LENDING – 6.3% | | | | | | | | |
| INVESTMENT COMPANY – 6.3% | | | | | | | | |
| Mount Vernon Liquid Assets Portfolio, LLC, 0.10% (e) | | | | | | | | |
| Total Investment Company | | | 47,595,188 | | | | 47,595,188 | |
| TOTAL INVESTMENT PURCHASED WITH THE CASH | | | | | | | | |
| PROCEEDS FROM SECURITIES LENDING (Cost $47,595,188) | | | | | | | 47,595,188 | |
| | | | | | | | | |
| TOTAL INVESTMENTS – 106.8% | | | | | | | | |
| (Cost $599,974,307) | | | | | | | 805,845,321 | |
| LIABILITIES IN EXCESS OF OTHER ASSETS – (6.8)% | | | | | | | (51,529,754 | ) |
| TOTAL NET ASSETS – 100.0% | | | | | | $ | 754,315,567 | |
| | PLC – Public Limited Company |
| (a) | All or a portion of this security was out on loan at June 30, 2021. Total loaned securities had a value of $46,704,768 at June 30, 2021. |
| (b) | Non-income producing security. |
| (c) | U.S. Dollar-denominated foreign security. |
| (d) | The Money Market Deposit Account (the “MMDA”) is a short-term investment vehicle in which the Fund holds cash balances. The MMDA will bear interest at a variable rate that is determined based on conditions and may change daily and by any amount. The rate shown is as of June 30, 2021. |
| (e) | The rate quoted is the annualized seven-day yield for the Fund at year end. |
The accompanying notes are an integral part of these financial statements.
| OLSTEIN ALL CAP VALUE FUND |
Olstein Strategic Opportunities Fund
Schedule of Investments as of June 30, 2021
| COMMON STOCKS – 91.7% | | | | | | |
| AIRLINES – 2.5% | | Shares | | | Value | |
| JetBlue Airways Corporation (a) | | | 210,000 | | | $ | 3,523,800 | |
| | | | | | | | | |
| AUTO COMPONENTS – 1.2% | | | | | | | | |
| Miller Industries, Inc. | | | 43,000 | | | | 1,695,920 | |
| | | | | | | | | |
| AUTO MANUFACTURERS – 2.7% | | | | | | | | |
| Blue Bird Corporation (a) | | | 150,000 | | | | 3,729,000 | |
| | | | | | | | | |
| AUTOMOBILES – 1.6% | | | | | | | | |
| Winnebago Industries, Inc. (b) | | | 33,450 | | | | 2,273,262 | |
| | | | | | | | | |
| BANKS – 1.6% | | | | | | | | |
| First Hawaiian, Inc. (b) | | | 77,000 | | | | 2,182,180 | |
| | | | | | | | | |
| COMMERCIAL BANKS – 6.6% | | | | | | | | |
| Citizens Financial Group, Inc. | | | 86,250 | | | | 3,956,287 | |
| Home BancShares, Inc. | | | 129,000 | | | | 3,183,720 | |
| Prosperity Bancshares, Inc. | | | 30,211 | | | | 2,169,150 | |
| | | | | | | | 9,309,157 | |
| COMMERCIAL SERVICES & SUPPLIES – 1.1% | | | | | | | | |
| Brady Corporation – Class A | | | 27,000 | | | | 1,513,080 | |
| | | | | | | | | |
| CONTAINERS & PACKAGING – 3.0% | | | | | | | | |
| UFP Technologies, Inc. (a) | | | 12,300 | | | | 706,266 | |
| WestRock Company | | | 67,000 | | | | 3,565,740 | |
| | | | | | | | 4,272,006 | |
| DIVERSIFIED FINANCIAL SERVICES – 4.1% | | | | | | | | |
| Invesco Ltd. (c) | | | 217,484 | | | | 5,813,347 | |
| | | | | | | | | |
| ELECTRICAL EQUIPMENT – 3.4% | | | | | | | | |
| Generac Holdings, Inc. (a) | | | 4,300 | | | | 1,785,145 | |
| Vishay Intertechnology, Inc. (b) | | | 135,000 | | | | 3,044,250 | |
| | | | | | | | 4,829,395 | |
The accompanying notes are an integral part of these financial statements.
| OLSTEIN STRATEGIC OPPORTUNITIES FUND |
COMMON STOCKS – 91.7% – continued | | | | | | |
| ELECTRONICS – 4.0% | | Shares | | | Value | |
| Keysight Technologies, Inc. (a) | | | 6,850 | | | $ | 1,057,709 | |
| Sensata Technologies Holding PLC (a)(c) | | | 79,100 | | | | 4,585,427 | |
| | | | | | | | 5,643,136 | |
| HEALTH CARE EQUIPMENT & SUPPLIES – 1.7% | | | | | | | | |
| Zimmer Biomet Holdings, Inc. | | | 15,000 | | | | 2,412,300 | |
| | | | | | | | | |
| HEALTH CARE PRODUCTS – 2.2% | | | | | | | | |
| Integra LifeSciences Holdings Corporation (a)(b) | | | 46,000 | | | | 3,139,040 | |
| | | | | | | | | |
| HOUSEHOLD DURABLES – 7.4% | | | | | | | | |
| Central Garden & Pet Company – Class A (a) | | | 88,000 | | | | 4,250,400 | |
| Lifetime Brands, Inc. | | | 171,000 | | | | 2,559,870 | |
| Mohawk Industries, Inc. (a) | | | 18,750 | | | | 3,603,562 | |
| | | | | | | | 10,413,832 | |
| HOUSEHOLD PRODUCTS – 1.1% | | | | | | | | |
| Reynolds Consumer Products, Inc. (b) | | | 50,000 | | | | 1,517,500 | |
| | | | | | | | | |
| INDUSTRIAL EQUIPMENT WHOLESALE – 4.2% | | | | | | | | |
| WESCO International, Inc. (a) | | | 58,000 | | | | 5,963,560 | |
| | | | | | | | | |
| LEISURE PRODUCTS – 2.1% | | | | | | | | |
| Johnson Outdoors, Inc. – Class A | | | 24,000 | | | | 2,904,000 | |
| | | | | | | | | |
| MACHINERY – 9.6% | | | | | | | | |
| Federal Signal Corporation | | | 42,000 | | | | 1,689,660 | |
| Gates Industrial Corporation PLC (a)(c) | | | 200,000 | | | | 3,614,000 | |
| Graham Corporation | | | 113,910 | | | | 1,567,402 | |
| Shyft Group, Inc. (b) | | | 120,000 | | | | 4,489,200 | |
| Timken Company | | | 25,750 | | | | 2,075,192 | |
| | | | | | | | 13,435,454 | |
| MATERIALS – 1.9% | | | | | | | | |
| Axalta Coating Systems Ltd. (a)(c) | | | 86,000 | | | | 2,622,140 | |
| | | | | | | | | |
| MEDIA – 3.9% | | | | | | | | |
| Discovery, Inc. – Class C (a)(b) | | | 189,800 | | | | 5,500,404 | |
The accompanying notes are an integral part of these financial statements.
| OLSTEIN STRATEGIC OPPORTUNITIES FUND |
COMMON STOCKS – 91.7% – continued | | | | | | |
| PHARMACEUTICALS – 3.9% | | Shares | | | Value | |
| Prestige Consumer Healthcare, Inc. (a)(b) | | | 106,000 | | | $ | 5,522,600 | |
| | | | | | | | | |
| PROFESSIONAL SERVICES – 1.1% | | | | | | | | |
| Korn Ferry | | | 22,000 | | | | 1,596,100 | |
| | | | | | | | | |
| REAL ESTATE MANAGEMENT & DEVELOPMENT – 1.8% | | | | | | | | |
| Jones Lang LaSalle, Inc. (a)(b) | | | 12,550 | | | | 2,453,023 | |
| | | | | | | | | |
| RESTAURANTS – 7.3% | | | | | | | | |
| Cracker Barrel Old Country Store, Inc. | | | 17,000 | | | | 2,523,820 | |
| Denny’s Corporation (a) | | | 207,100 | | | | 3,415,079 | |
| Dine Brands Global, Inc. (a)(b) | | | 47,650 | | | | 4,252,763 | |
| | | | | | | | 10,191,662 | |
| SEMICONDUCTORS & SEMICONDUCTOR EQUIPMENT – 3.0% | | | | | | | | |
| Kulicke and Soffa Industries, Inc. (b) | | | 69,000 | | | | 4,222,800 | |
| | | | | | | | | |
| SOFTWARE – 2.6% | | | | | | | | |
| Intelligent Systems Corporation (a)(b) | | | 114,000 | | | | 3,586,440 | |
| | | | | | | | | |
| SPECIALTY RETAIL – 1.7% | | | | | | | | |
| Big Lots, Inc. (b) | | | 37,000 | | | | 2,442,370 | |
| | | | | | | | | |
| TEXTILES, APPAREL & LUXURY GOODS – 1.9% | | | | | | | | |
| Kontoor Brands, Inc. | | | 30,000 | | | | 1,692,300 | |
| Tapestry, Inc. (a) | | | 23,600 | | | | 1,026,128 | |
| | | | | | | | 2,718,428 | |
| TRANSPORTATION EQUIPMENT – 2.5% | | | | | | | | |
| Wabash National Corporation (b) | | | 219,000 | | | | 3,504,000 | |
| TOTAL COMMON STOCKS (Cost $94,261,215) | | | | | | | 128,929,936 | |
The accompanying notes are an integral part of these financial statements.
| OLSTEIN STRATEGIC OPPORTUNITIES FUND |
| SHORT-TERM INVESTMENT – 8.5% | | | | | | |
| MONEY MARKET DEPOSIT ACCOUNT – 8.5% | | Shares | | | Value | |
| U.S. Bank N.A., 0.01% (d) | | | | | | |
| Total Money Market Deposit Account | | | 11,964,200 | | | $ | 11,964,200 | |
| TOTAL SHORT-TERM INVESTMENT (COST $11,964,200) | | | | | | | 11,964,200 | |
| | | | | | | | | |
| INVESTMENT PURCHASED WITH THE CASH | | | | | | | | |
| PROCEEDS FROM SECURITIES LENDING – 16.6% | | | | | | | | |
| INVESTMENT COMPANY – 16.6% | | | | | | | | |
| Mount Vernon Liquid Assets Portfolio, LLC, 0.10% (e) | | | | | | | | |
| Total Investment Company | | | 23,268,499 | | | | 23,268,499 | |
| TOTAL INVESTMENT PURCHASED WITH THE CASH | | | | | | | | |
| PROCEEDS FROM SECURITIES LENDING (Cost $23,268,499) | | | | | | | 23,268,499 | |
| | | | | | | | | |
| TOTAL INVESTMENTS – 116.8% | | | | | | | | |
| (Cost $129,493,914) | | | | | | | 164,162,635 | |
| LIABILITIES IN EXCESS OF OTHER ASSETS – (16.8)% | | | | | | | (23,629,237 | ) |
| TOTAL NET ASSETS – 100.0% | | | | | | $ | 140,533,398 | |
| (a) | Non-income producing security. |
| (b) | All or a portion of this security was out on loan at June 30, 2021. Total loaned securities had a value of $22,844,516 at June 30, 2021. |
| (c) | U.S. Dollar-denominated foreign security. |
| (d) | The Money Market Deposit Account (the “MMDA”) is a short-term investment vehicle in which the Fund holds cash balances. The MMDA will bear interest at a variable rate that is determined based on conditions and may change daily and by any amount. The rate shown is as of June 30, 2021. |
| (e) | The rate quoted is the annualized seven-day yield for the Fund at year end. |
| | PLC – Public Limited Company |
The accompanying notes are an integral part of these financial statements.
| OLSTEIN STRATEGIC OPPORTUNITIES FUND |
The Olstein Funds
Statements of Assets and Liabilities as of June 30, 2021
| | | | | | Olstein | |
| | | Olstein | | | Strategic | |
| | | All Cap | | | Opportunities | |
| | | Value Fund | | | Fund | |
| Assets: | | | | | | |
Investments, at value(1) (Cost: $599,974,307 | | | | | | |
| and $129,493,914, respectively) | | $ | 805,845,321 | | | $ | 164,162,635 | |
| Receivable for investment securities sold | | | 576,136 | | | | 43,825 | |
| Receivable for capital shares sold | | | 311,219 | | | | 44,367 | |
| Dividends and interest receivable | | | 639,911 | | | | 30,347 | |
| Securities lending income receivable | | | 1,167 | | | | 619 | |
| Prepaid expenses | | | 76,481 | | | | 28,926 | |
| Total Assets | | $ | 807,450,235 | | | $ | 164,310,719 | |
| | | | | | | | | |
| Liabilities: | | | | | | | | |
| Payable upon return of securities loaned | | | 47,595,188 | | | | 23,268,499 | |
| Payable for investment securities purchased | | | 4,435,348 | | | | 227,642 | |
| Payable for capital shares redeemed | | | 14,093 | | | | 42,233 | |
| Payable to investment adviser | | | 619,997 | | | | 112,903 | |
| Accrued distribution fees | | | 277,667 | | | | 20,415 | |
| Payable for transfer agent fees & expenses | | | 106,087 | | | | 34,222 | |
| Payable for fund administration & accounting fees | | | 35,775 | | | | 34,201 | |
| Payable for trustee fees | | | 4,546 | | | | 4,549 | |
| Payable for compliance fees | | | 3,247 | | | | 3,247 | |
| Payable for custody fees | | | 8,244 | | | | 1,604 | |
| Payable for audit fees | | | 19,003 | | | | 18,998 | |
| Accrued expenses | | | 15,473 | | | | 8,808 | |
| Total Liabilities | | | 53,134,668 | | | | 23,777,321 | |
| Net Assets | | $ | 754,315,567 | | | $ | 140,533,398 | |
| | | | | | | | | |
| Net Assets Consist of: | | | | | | | | |
| Paid-in capital | | $ | 468,301,067 | | | $ | 99,073,393 | |
| Total distributable earnings | | | 286,014,500 | | | | 41,460,005 | |
| Total net assets | | $ | 754,315,567 | | | $ | 140,533,398 | |
| (1) | Includes securities on loan with a value of $46,704,768 and $22,844,516, respectively. |
The accompanying notes are an integral part of these financial statements.
| | | | | | Olstein | |
| | | Olstein | | | Strategic | |
| | | All Cap | | | Opportunities | |
| | | Value Fund | | | Fund | |
| Class A: | | | | | | |
| Net assets | | $ | 142,862,402 | | | $ | 31,827,247 | |
Shares of beneficial interest outstanding(1) | | | 4,163,221 | | | | 1,158,720 | |
| Net asset value, offering price and redemption price per share | | $ | 34.32 | | | $ | 27.47 | |
Maximum offering price per share(2) | | $ | 36.32 | | | $ | 29.07 | |
| | | | | | | | | |
| Class C: | | | | | | | | |
| Net assets | | $ | 289,103,108 | | | $ | 16,515,210 | |
Shares of beneficial interest outstanding(1) | | | 10,958,575 | | | | 681,004 | |
Net asset value, offering price and redemption price per share(3) | | $ | 26.38 | | | $ | 24.25 | |
| | | | | | | | | |
| Adviser Class: | | | | | | | | |
| Net assets | | $ | 322,350,057 | | | $ | 92,190,941 | |
Shares of beneficial interest outstanding(1) | | | 9,331,694 | | | | 3,305,135 | |
| Net asset value, offering price and redemption price per share | | $ | 34.54 | | | $ | 27.89 | |
| (1) | Unlimited number of shares authorized without par value. |
| (2) | The offering price is calculated by dividing the net asset value by 1 minus the maximum sales charge of 5.50%. |
| (3) | May be subject to a contingent deferred sales charge of 1.00% on certain shares redeemed within 12 months of purchase on Class C shares. |
The accompanying notes are an integral part of these financial statements.
The Olstein Funds
Statements of Operations
For the Year Ended June 30, 2021
| | | | | | Olstein | |
| | | Olstein | | | Strategic | |
| | | All Cap | | | Opportunities | |
| | | Value Fund | | | Fund | |
| Investment Income: | | | | | | |
| Dividend income | | $ | 8,444,523 | | | $ | 877,123 | |
| Interest income | | | 13,838 | | | | 2,099 | |
| Securities lending income, net | | | 24,870 | | | | 9,897 | |
| Total investment income | | | 8,483,231 | | | | 889,119 | |
| | | | | | | | | |
| Expenses: | | | | | | | | |
| Investment advisory fees (See Note 4) | | | 6,317,181 | | | | 967,190 | |
| Transfer agent fees & expenses (See Note 4) | | | 394,057 | | | | 136,463 | |
| Fund administration & accounting fees (See Note 4) | | | 288,304 | | | | 139,600 | |
| Federal & state registration fees | | | 49,875 | | | | 46,711 | |
| Custody fees (See Note 4) | | | 42,660 | | | | 7,100 | |
| Legal fees | | | 26,167 | | | | 26,167 | |
| Insurance fees | | | 20,556 | | | | 5,144 | |
| Postage & printing fees | | | 19,417 | | | | 6,290 | |
| Audit fees | | | 17,505 | | | | 19,000 | |
| Trustee fees | | | 16,764 | | | | 16,756 | |
| Compliance fees (See Note 4) | | | 12,999 | | | | 12,999 | |
| Other expenses | | | 7,055 | | | | 5,476 | |
| Distribution fees (See Note 5) | | | | | | | | |
| Class A | | | 306,014 | | | | 58,263 | |
| Class C | | | 2,905,442 | | | | 143,968 | |
| Total expenses | | | 10,423,996 | | | | 1,591,127 | |
| Plus: adviser recoupment (See Note 4) | | | — | | | | 9,324 | |
| Less: waiver from investment adviser (See Note 4) | | | — | | | | (92,513 | ) |
| Net expenses | | | 10,423,996 | | | | 1,507,938 | |
| Net investment loss | | | (1,940,765 | ) | | | (618,819 | ) |
| | | | | | | | | |
| Realized and Unrealized Gain on Investments: | | | | | | | | |
| Net realized gain on investments | | | 91,651,975 | | | | 12,639,365 | |
| Net change in unrealized appreciation/depreciation on investments | | | 200,353,815 | | | | 36,986,472 | |
| Net realized and unrealized gain on investments | | | 292,005,790 | | | | 49,625,837 | |
| Net increase in net assets resulting from operations | | $ | 290,065,025 | | | $ | 49,007,018 | |
The accompanying notes are an integral part of these financial statements.
(THIS PAGE INTENTIONALLY LEFT BLANK).
Olstein All Cap Value Fund
Statements of Changes in Net Assets
| | | For the | | | For the | |
| | | Year Ended | | | Year Ended | |
| | | June 30, 2021 | | | June 30, 2020 | |
| Operations: | | | | | | |
| Net investment income (loss) | | $ | (1,940,765 | ) | | $ | 2,311,149 | |
| Net realized gain (loss) on investments | | | 91,651,975 | | | | (2,774,105 | ) |
| Change in unrealized appreciation/depreciation on investments | | | 200,353,815 | | | | (52,494,596 | ) |
| Net increase (decrease) in net assets resulting from operations | | | 290,065,025 | | | | (52,957,552 | ) |
| | | | | | | | | |
| Capital Share Transactions: | | | | | | | | |
| Class A: | | | | | | | | |
| Proceeds from shares sold | | | 20,482,197 | | | | 91,262,827 | |
| Proceeds from reinvestment of distributions | | | 436,281 | | | | 2,029,505 | |
| Payments for shares redeemed | | | (27,354,921 | ) | | | (6,057,487 | ) |
| Increase (Decrease) in net assets resulting | | | | | | | | |
| from Class A transactions | | | (6,436,443 | ) | | | 87,234,845 | |
| Class C: | | | | | | | | |
| Proceeds from shares sold | | | 3,833,334 | | | | 4,357,258 | |
| Proceeds from reinvestment of distributions | | | 512,387 | | | | 9,924,575 | |
| Payments for shares redeemed | | | (98,162,990 | ) | | | (123,362,849 | ) |
| Decrease in net assets resulting from Class C transactions | | | (93,817,269 | ) | | | (109,081,016 | ) |
| Adviser Class: | | | | | | | | |
| Proceeds from shares sold | | | 81,948,325 | | | | 8,272,852 | |
| Proceeds from reinvestment of distributions | | | 1,080,886 | | | | 5,200,929 | |
| Payments for shares redeemed | | | (24,484,710 | ) | | | (18,982,393 | ) |
| Increase (Decrease) in net assets resulting | | | | | | | | |
| from Adviser Class transactions | | | 58,544,501 | | | | (5,508,612 | ) |
| Net decrease in net assets from capital share transactions | | | (41,709,211 | ) | | | (27,354,783 | ) |
The accompanying notes are an integral part of these financial statements.
| OLSTEIN ALL CAP VALUE FUND |
| | | For the | | | For the | |
| | | Year Ended | | | Year Ended | |
| | | June 30, 2021 | | | June 30, 2020 | |
| Distributions to shareholders: | | | | | | |
| Class A | | $ | (624,826 | ) | | $ | (2,033,873 | ) |
| Class C | | | (546,347 | ) | | | (11,483,184 | ) |
| Adviser Class | | | (1,139,976 | ) | | | (5,937,958 | ) |
| Total distributions to shareholders | | | (2,311,149 | ) | | | (19,455,015 | ) |
| | | | | | | | | |
| Total increase (decrease) in net assets | | | 246,044,665 | | | | (99,767,350 | ) |
| | | | | | | | | |
| Net Assets: | | | | | | | | |
| Beginning of year | | | 508,270,902 | | | | 608,038,252 | |
| End of year | | $ | 754,315,567 | | | $ | 508,270,902 | |
The accompanying notes are an integral part of these financial statements.
| OLSTEIN ALL CAP VALUE FUND |
Olstein Strategic Opportunities Fund
Statements of Changes in Net Assets
| | | For the | | | For the | |
| | | Year Ended | | | Year Ended | |
| | | June 30, 2021 | | | June 30, 2020 | |
| Operations: | | | | | | |
| Net investment loss | | $ | (618,819 | ) | | $ | (68,045 | ) |
| Net realized gain (loss) on investments | | | 12,639,365 | | | | (3,431,991 | ) |
| Change in unrealized appreciation/depreciation on investments | | | 36,986,472 | | | | (6,187,114 | ) |
| Net increase (decrease) in net assets resulting from operations | | | 49,007,018 | | | | (9,687,150 | ) |
| | | | | | | | | |
| Capital Share Transactions: | | | | | | | | |
| Class A: | | | | | | | | |
| Proceeds from shares sold | | | 6,708,992 | | | | 5,238,030 | |
| Proceeds from reinvestment of distributions | | | — | | | | — | |
| Payments for shares redeemed | | | (3,023,261 | ) | | | (4,721,176 | ) |
| Increase in net assets resulting | | | | | | | | |
| from Class A transactions | | | 3,685,731 | | | | 516,854 | |
| Class C: | | | | | | | | |
| Proceeds from shares sold | | | 1,497,077 | | | | 659,540 | |
| Proceeds from reinvestment of distributions | | | — | | | | — | |
| Payments for shares redeemed | | | (4,092,117 | ) | | | (7,095,684 | ) |
| Decrease in net assets resulting from Class C transactions | | | (2,595,040 | ) | | | (6,436,144 | ) |
| Adviser Class: | | | | | | | | |
| Proceeds from shares sold | | | 43,533,836 | | | | 5,295,661 | |
| Proceeds from reinvestment of distributions | | | — | | | | — | |
| Payments for shares redeemed | | | (9,316,947 | ) | | | (12,059,842 | ) |
| Increase (Decrease) in net assets resulting | | | | | | | | |
| from Adviser Class transactions | | | 34,216,889 | | | | (6,764,181 | ) |
| Net increase (decrease) in net assets | | | | | | | | |
| from capital share transactions | | | 35,307,580 | | | | (12,683,471 | ) |
The accompanying notes are an integral part of these financial statements.
| OLSTEIN STRATEGIC OPPORTUNITIES FUND |
| | | For the | | | For the | |
| | | Year Ended | | | Year Ended | |
| | | June 30, 2021 | | | June 30, 2020 | |
| Distributions to Shareholders: | | | | | | |
| Class A | | $ | — | | | $ | — | |
| Class C | | | — | | | | — | |
| Adviser Class | | | — | | | | — | |
| Total distributions to shareholders | | | — | | | | — | |
| | | | | | | | | |
| Total increase (decrease) in net assets | | | 84,314,598 | | | | (22,370,621 | ) |
| | | | | | | | | |
| Net Assets | | | | | | | | |
| Beginning of year | | | 56,218,800 | | | | 78,589,421 | |
| End of year | | $ | 140,533,398 | | | $ | 56,218,800 | |
The accompanying notes are an integral part of these financial statements.
| OLSTEIN STRATEGIC OPPORTUNITIES FUND |
Olstein All Cap Value Fund
Financial Highlights
Class A
| | | For the | | | For the | | | Period | |
| | | Year | | | Year | | | Inception(1) | |
| | | Ended | | | Ended | | | through | |
| | | June 30, | | | June 30, | | | June 30, | |
| | | 2021 | | | 2020 | | | 2019 | |
| Net Asset Value, Beginning of Period | | $ | 21.40 | | | $ | 24.10 | | | $ | 26.07 | |
| | | | | | | | | | | | | |
| Investment Operations: | | | | | | | | | | | | |
Net investment income (loss)(2) | | | (0.01 | ) | | | 0.17 | | | | 0.13 | |
| Net realized and unrealized gain (loss) on investments | | | 13.06 | | | | (2.12 | ) | | | (0.32 | ) |
| Total from investment operations | | | 13.05 | | | | (1.95 | ) | | | (0.19 | ) |
| | | | | | | | | | | | | |
| Less distributions from: | | | | | | | | | | | | |
| Net investment income | | | (0.13 | ) | | | (0.10 | ) | | | — | |
| Net realized gains | | | — | | | | (0.65 | ) | | | (1.78 | ) |
| Total distributions | | | (0.13 | ) | | | (0.75 | ) | | | (1.78 | ) |
| Net Asset Value, End of Period | | $ | 34.32 | | | $ | 21.40 | | | $ | 24.10 | |
| | | | | | | | | | | | | |
Total Return(3)(4) | | | 61.15 | % | | | -8.54 | % | | | 0.04 | % |
| | | | | | | | | | | | | |
| Supplemental Data and Ratios | | | | | | | | | | | | |
| Net assets, end of period (000’s omitted) | | $ | 142,863 | | | $ | 93,359 | | | $ | 12,920 | |
Ratio of expenses to average net assets(5) | | | 1.39 | % | | | 1.40 | % | | | 1.43 | % |
Ratio of net investment income (loss) to average net assets(5) | | | (0.05 | )% | | | 0.75 | % | | | 0.68 | % |
Portfolio Turnover(4)(6) | | | 41.64 | % | | | 47.68 | % | | | 38.73 | % |
| (1) | Inception date of Class A was September 17, 2018. |
| (2) | Per share amounts calculated using the average shares method. |
| (3) | Total return does not reflect sales charges. |
| (4) | Not annualized for periods less than one year. |
| (5) | Annualized for periods less than one year. |
| (6) | Portfolio turnover disclosed is for the Fund as a whole. |
The accompanying notes are an integral part of these financial statements.
| OLSTEIN ALL CAP VALUE FUND |
Olstein All Cap Value Fund
Financial Highlights
Class C
| | | For the | | | For the | | | For the | | | For the | | | For the | |
| | | Year | | | Year | | | Year | | | Year | | | Year | |
| | | Ended | | | Ended | | | Ended | | | Ended | | | Ended | |
| | | June 30, | | | June 30, | | | June 30, | | | June 30, | | | June 30, | |
| | | 2021 | | | 2020 | | | 2019 | | | 2018 | | | 2017 | |
| Net Asset Value, Beginning of Year | | $ | 16.53 | | | $ | 18.82 | | | $ | 19.79 | | | $ | 19.90 | | | $ | 16.70 | |
| | | | | | | | | | | | | | | | | | | | | |
| Investment Operations: | | | | | | | | | | | | | | | | | | | | |
Net investment loss(1) | | | (0.17 | ) | | | (0.00 | )(2) | | | (0.03 | ) | | | (0.12 | ) | | | (0.14 | ) |
| Net realized and unrealized | | | | | | | | | | | | | | | | | | | | |
| gain (loss) on investments | | | 10.06 | | | | (1.64 | ) | | | 0.84 | | | | 1.22 | | | | 3.38 | |
| Total from investment operations | | | 9.89 | | | | (1.64 | ) | | | 0.81 | | | | 1.10 | | | | 3.24 | |
| | | | | | | | | | | | | | | | | | | | | |
| Less distributions from: | | | | | | | | | | | | | | | | | | | | |
| Net investment income | | | (0.04 | ) | | | — | | | | — | | | | — | | | | — | |
| Net realized gains | | | — | | | | (0.65 | ) | | | (1.78 | ) | | | (1.21 | ) | | | (0.04 | ) |
| Total distributions | | | (0.04 | ) | | | (0.65 | ) | | | (1.78 | ) | | | (1.21 | ) | | | (0.04 | ) |
| Net Asset Value, End of Year | | $ | 26.38 | | | $ | 16.53 | | | $ | 18.82 | | | $ | 19.79 | | | $ | 19.90 | |
| | | | | | | | | | | | | | | | | | | | | |
Total Return(3) | | | 59.89 | % | | | -9.21 | % | | | 5.07 | % | | | 5.57 | % | | | 19.42 | % |
| | | | | | | | | | | | | | | | | | | | | |
| Supplement Data and Ratios | | | | | | | | | | | | | | | | | | | | |
| Net assets, end of year (000’s omitted) | | $ | 289,103 | | | $ | 248,420 | | | $ | 400,820 | | | $ | 456,794 | | | $ | 493,526 | |
| Ratio of expenses to average net assets | | | 2.14 | % | | | 2.15 | % | | | 2.19 | % | | | 2.25 | % | | | 2.25 | % |
| Ratio of net investment loss to average net assets | | | (0.80 | )% | | | (0.00 | )%(5) | | | (0.15 | )% | | | (0.60 | )% | | | (0.74 | )% |
Portfolio Turnover(4) | | | 41.64 | % | | | 47.68 | % | | | 38.73 | % | | | 53.79 | % | | | 55.51 | % |
| (1) | Per share amounts calculated using the average shares method. |
| (2) | Amount rounds to less than $0.01 per share. |
| (3) | Total return does not reflect sales charges. |
| (4) | Portfolio turnover disclosed is for the Fund as a whole. |
| (5) | Amount rounds to less than 0.01%. |
The accompanying notes are an integral part of these financial statements.
| OLSTEIN ALL CAP VALUE FUND |
Olstein All Cap Value Fund
Financial Highlights
Adviser Class
| | | For the | | | For the | | | For the | | | For the | | | For the | |
| | | Year | | | Year | | | Year | | | Year | | | Year | |
| | | Ended | | | Ended | | | Ended | | | Ended | | | Ended | |
| | | June 30, | | | June 30, | | | June 30, | | | June 30, | | | June 30, | |
| | | 2021 | | | 2020 | | | 2019 | | | 2018 | | | 2017 | |
| Net Asset Value, Beginning of Year | | $ | 21.51 | | | $ | 24.15 | | | $ | 24.64 | | | $ | 24.25 | | | $ | 20.15 | |
| | | | | | | | | | | | | | | | | | | | | |
| Investment Operations: | | | | | | | | | | | | | | | | | | | | |
Net investment income(1) | | | 0.06 | (3) | | | 0.23 | | | | 0.20 | | | | 0.10 | | | | 0.06 | |
| Net realized and unrealized | | | | | | | | | | | | | | | | | | | | |
| gain (loss) on investments | | | 13.13 | | | | (2.13 | ) | | | 1.09 | | | | 1.50 | | | | 4.08 | |
| Total from investment operations | | | 13.19 | | | | (1.90 | ) | | | 1.29 | | | | 1.60 | | | | 4.14 | |
| | | | | | | | | | | | | | | | | | | | | |
| Less distributions from: | | | | | | | | | | | | | | | | | | | | |
| Net investment income | | | (0.16 | ) | | | (0.09 | ) | | | — | | | | — | | | | — | |
| Net realized gains | | | — | | | | (0.65 | ) | | | (1.78 | ) | | | (1.21 | ) | | | (0.04 | ) |
| Total distributions | | | (0.16 | ) | | | (0.74 | ) | | | (1.78 | ) | | | (1.21 | ) | | | (0.04 | ) |
| Net Asset Value, End of Year | | $ | 34.54 | | | $ | 21.51 | | | $ | 24.15 | | | $ | 24.64 | | | $ | 24.25 | |
| | | | | | | | | | | | | | | | | | | | | |
| Total Return | | | 61.49 | % | | | -8.27 | % | | | 6.06 | % | | | 6.66 | % | | | 20.56 | % |
| | | | | | | | | | | | | | | | | | | | | |
| Supplement Data and Ratios | | | | | | | | | | | | | | | | | | | | |
| Net assets, end of year (000’s omitted) | | $ | 322,350 | | | $ | 166,492 | | | $ | 194,298 | | | $ | 204,963 | | | $ | 198,876 | |
| Ratio of expenses to average net assets | | | 1.14 | % | | | 1.15 | % | | | 1.19 | % | | | 1.25 | % | | | 1.25 | % |
| Ratio of net investment income to average net assets | | | 0.20 | % | | | 1.00 | % | | | 0.85 | % | | | 0.40 | % | | | 0.26 | % |
Portfolio Turnover(2) | | | 41.64 | % | | | 47.68 | % | | | 38.73 | % | | | 53.79 | % | | | 55.51 | % |
| (1) | Per share amounts calculated using the average shares method. |
| (2) | Portfolio turnover disclosed is for the Fund as a whole. |
| (3) | Net realized and unrealized loss per share in this caption is a balancing amount necessary to reconcile the change in net asset value per share for the year, and may not reconcile with the aggregate gain on the Statement of Operations due to share transactions for the year. |
The accompanying notes are an integral part of these financial statements.
| OLSTEIN ALL CAP VALUE FUND |
Olstein Strategic Opportunities Fund
Financial Highlights
Class A
| | | For the | | | For the | | | For the | | | For the | | | For the | |
| | | Year | | | Year | | | Year | | | Year | | | Year | |
| | | Ended | | | Ended | | | Ended | | | Ended | | | Ended | |
| | | June 30, | | | June 30, | | | June 30, | | | June 30, | | | June 30, | |
| | | 2021 | | | 2020 | | | 2019 | | | 2018 | | | 2017 | |
| Net Asset Value, Beginning of Year | | $ | 15.19 | | | $ | 17.24 | | | $ | 17.46 | | | $ | 16.90 | | | $ | 13.61 | |
| | | | | | | | | | | | | | | | | | | | | |
| Investment Operations: | | | | | | | | | | | | | | | | | | | | |
Net investment loss(1) | | | (0.15 | ) | | | (0.01 | ) | | | (0.03 | ) | | | (0.09 | ) | | | (0.08 | ) |
| Net realized and unrealized | | | | | | | | | | | | | | | | | | | | |
| gain (loss) on investments | | | 12.43 | | | | (2.04 | ) | | | (0.05 | ) | | | 0.65 | | | | 3.37 | |
| Total from investment operations | | | 12.28 | | | | (2.05 | ) | | | (0.08 | ) | | | 0.56 | | | | 3.29 | |
| | | | | | | | | | | | | | | | | | | | | |
| Less distributions from: | | | | | | | | | | | | | | | | | | | | |
| Net realized gains | | | — | | | | — | | | | (0.14 | ) | | | — | | | | — | |
| Total distributions | | | — | | | | — | | | | (0.14 | ) | | | — | | | | — | |
| Net Asset Value, End of Year | | $ | 27.47 | | | $ | 15.19 | | | $ | 17.24 | | | $ | 17.46 | | | $ | 16.90 | |
| | | | | | | | | | | | | | | | | | | | | |
Total Return(2) | | | 80.84 | % | | | -11.89 | % | | | -0.38 | % | | | 3.31 | % | | | 24.17 | % |
| | | | | | | | | | | | | | | | | | | | | |
| Supplemental Data and Ratios | | | | | | | | | | | | | | | | | | | | |
| Net assets, end of year (000’s omitted) | | $ | 31,827 | | | $ | 15,873 | | | $ | 17,801 | | | $ | 23,176 | | | $ | 31,537 | |
| Ratio of expenses to average net assets: | | | | | | | | | | | | | | | | | | | | |
| Before expense waiver/recoupment | | | 1.70 | % | | | 1.81 | % | | | 1.73 | % | | | 1.62 | % | | | 1.61 | % |
| After expense waiver/recoupment | | | 1.60 | % | | | 1.60 | % | | | 1.60 | % | | | 1.60 | % | | | 1.60 | % |
| Ratio of net investment loss to average net assets: | | | | | | | | | | | | | | | | | | | | |
| After expense waiver/recoupment | | | (0.68 | )% | | | (0.07 | )% | | | (0.17 | )% | | | (0.54 | )% | | | (0.50 | )% |
| Portfolio Turnover | | | 47.32 | % | | | 45.05 | % | | | 35.03 | % | | | 52.98 | % | | | 64.90 | % |
| (1) | Per share amounts calculated using the average shares method. |
| (2) | Total return does not reflect sales charges. |
The accompanying notes are an integral part of these financial statements.
| OLSTEIN STRATEGIC OPPORTUNITIES FUND |
Olstein Strategic Opportunities Fund
Financial Highlights
Class C
| | | For the | | | For the | | | For the | | | For the | | | For the | |
| | | Year | | | Year | | | Year | | | Year | | | Year | |
| | | Ended | | | Ended | | | Ended | | | Ended | | | Ended | |
| | | June 30, | | | June 30, | | | June 30, | | | June 30, | | | June 30, | |
| | | 2021 | | | 2020 | | | 2019 | | | 2018 | | | 2017 | |
| Net Asset Value, Beginning of Year | | $ | 13.52 | | | $ | 15.45 | | | $ | 15.78 | | | $ | 15.39 | | | $ | 12.49 | |
| | | | | | | | | | | | | | | | | | | | | |
| Investment Operations: | | | | | | | | | | | | | | | | | | | | |
Net investment loss(1) | | | (0.28 | ) | | | (0.12 | ) | | | (0.14 | ) | | | (0.20 | ) | | | (0.18 | ) |
| Net realized and unrealized | | | | | | | | | | | | | | | | | | | | |
| gain (loss) on investments | | | 11.01 | | | | (1.81 | ) | | | (0.05 | ) | | | 0.59 | | | | 3.08 | |
| Total from investment operations | | | 10.73 | | | | (1.93 | ) | | | (0.19 | ) | | | 0.39 | | | | 2.90 | |
| | | | | | | | | | | | | | | | | | | | | |
| Less distributions from: | | | | | | | | | | | | | | | | | | | | |
| Net realized gains | | | — | | | | — | | | | (0.14 | ) | | | — | | | | — | |
| Total distributions | | | — | | | | — | | | | (0.14 | ) | | | — | | | | — | |
| Net Asset Value, End of Year | | $ | 24.25 | | | $ | 13.52 | | | $ | 15.45 | | | $ | 15.78 | | | $ | 15.39 | |
| | | | | | | | | | | | | | | | | | | | | |
Total Return(2) | | | 79.36 | % | | | -12.49 | % | | | -1.12 | % | | | 2.53 | % | | | 23.22 | % |
| | | | | | | | | | | | | | | | | | | | | |
| Supplemental Data and Ratios | | | | | | | | | | | | | | | | | | | | |
| Net assets end of year (000’s omitted) | | $ | 16,515 | | | $ | 11,135 | | | $ | 19,532 | | | $ | 24,484 | | | $ | 35,107 | |
| Ratio of expenses to average net assets: | | | | | | | | | | | | | | | | | | | | |
| Before expense waiver/recoupment | | | 2.46 | % | | | 2.55 | % | | | 2.48 | % | | | 2.37 | % | | | 2.36 | % |
| After expense waiver/recoupment | | | 2.35 | % | | | 2.35 | % | | | 2.35 | % | | | 2.35 | % | | | 2.35 | % |
| Ratio of net investment loss to average net assets: | | | | | | | | | | | | | | | | | | | | |
| After expense waiver/recoupment | | | (1.43 | )% | | | (0.82 | )% | | | (0.92 | )% | | | (1.29 | )% | | | (1.25 | )% |
| Portfolio Turnover | | | 47.32 | % | | | 45.05 | % | | | 35.03 | % | | | 52.98 | % | | | 64.90 | % |
| (1) | Per share amounts calculated using the average shares method. |
| (2) | Total return does not reflect sales charges. |
The accompanying notes are an integral part of these financial statements.
| OLSTEIN STRATEGIC OPPORTUNITIES FUND |
Olstein Strategic Opportunities Fund
Financial Highlights
Adviser Class
| | | For the | | | For the | | | For the | | | For the | | | For the | |
| | | Year | | | Year | | | Year | | | Year | | | Year | |
| | | Ended | | | Ended | | | Ended | | | Ended | | | Ended | |
| | | June 30, | | | June 30, | | | June 30, | | | June 30, | | | June 30, | |
| | | 2021 | | | 2020 | | | 2019 | | | 2018 | | | 2017 | |
| Net Asset Value, Beginning of Year | | $ | 15.39 | | | $ | 17.42 | | | $ | 17.60 | | | $ | 16.99 | | | $ | 13.65 | |
| | | | | | | | | | | | | | | | | | | | | |
| Investment Operations: | | | | | | | | | | | | | | | | | | | | |
Net investment income (loss)(1) | | | (0.10 | ) | | | 0.03 | | | | 0.01 | | | | (0.05 | ) | | | (0.04 | ) |
| Net realized and unrealized | | | | | | | | | | | | | | | | | | | | |
| gain (loss) on investments | | | 12.60 | | | | (2.06 | ) | | | (0.05 | ) | | | 0.66 | | | | 3.38 | |
| Total from investment operations | | | 12.50 | | | | (2.03 | ) | | | (0.04 | ) | | | 0.61 | | | | 3.34 | |
| | | | | | | | | | | | | | | | | | | | | |
| Less distributions from: | | | | | | | | | | | | | | | | | | | | |
| Net realized gains | | | — | | | | — | | | | (0.14 | ) | | | — | | | | — | |
| Total distributions | | | — | | | | — | | | | (0.14 | ) | | | — | | | | — | |
| Net Asset Value, End of Year | | $ | 27.89 | | | $ | 15.39 | | | $ | 17.42 | | | $ | 17.60 | | | $ | 16.99 | |
| | | | | | | | | | | | | | | | | | | | | |
| Total Return | | | 81.22 | % | | | -11.65 | % | | | -0.15 | % | | | 3.59 | % | | | 24.47 | % |
| | | | | | | | | | | | | | | | | | | | | |
| Supplemental Data and Ratios | | | | | | | | | | | | | | | | | | | | |
| Net assets end of year (000’s omitted) | | $ | 92,191 | | | $ | 29,211 | | | $ | 41,256 | | | $ | 73,788 | | | $ | 86,824 | |
| Ratio of expenses to average net assets: | | | | | | | | | | | | | | | | | | | | |
| Before expense waiver/recoupment | | | 1.43 | % | | | 1.55 | % | | | 1.48 | % | | | 1.37 | % | | | 1.36 | % |
| After expense waiver/recoupment | | | 1.35 | % | | | 1.35 | % | | | 1.35 | % | | | 1.35 | % | | | 1.35 | % |
| Ratio of net investment income (loss) | | | | | | | | | | | | | | | | | | | | |
| to average net assets: | | | | | | | | | | | | | | | | | | | | |
| After expense waiver/recoupment | | | (0.43 | )% | | | 0.18 | % | | | 0.08 | % | | | (0.29 | )% | | | (0.25 | )% |
| Portfolio Turnover | | | 47.32 | % | | | 45.05 | % | | | 35.03 | % | | | 52.98 | % | | | 64.90 | % |
| (1) | Per share amounts calculated using the average shares method. |
The accompanying notes are an integral part of these financial statements.
| OLSTEIN STRATEGIC OPPORTUNITIES FUND |
The Olstein Funds
Notes to Financial Statements
| 1 | Organization Managed Portfolio Series (the “Trust”) was organized as a Delaware statutory trust on January 27, 2011. The Trust is registered under the Investment Company Act of 1940, as amended (the “1940 Act”), as an open-end management investment company. The Olstein All Cap Value Fund (“All Cap Value Fund”) and Olstein Strategic Opportunities Fund (“Strategic Fund”) (each a “Fund” and collectively, the “Funds”) are each a diversified series with their own investment objectives and policies within the Trust. The investment objective of each Fund is long-term capital appreciation with a secondary objective of income. The Funds are investment companies and accordingly follow the investment company accounting and reporting guidance of the Financial Accounting Standards Board (“FASB”) Accounting Standards Codification Topic 946, Financial Services – Investment Companies. Each Fund offers three different share classes – Adviser Class, Class A, and Class C. The All Cap Value Fund commenced operations on September 21, 1995. The Class C shares commenced operations on September 21, 1995, the Adviser Class shares commenced operations on September 1, 1999, and the Class A shares commenced operations on September 17, 2018. The Strategic Fund commenced operations on November 1, 2006. The Class A shares and Class C shares each commenced operations on November 1, 2006 and the Adviser Class shares commenced operations on May 11, 2015. Each class of shares has identical rights and privileges except with respect to distribution fees and voting rights on matters affecting a single share class. Class A shares are subject to a front-end sales charge of up to 5.50% and a 0.25% Rule 12b-1 distribution and shareholder servicing fee. Class C shares may be subject to a deferred sales charge of up to 1.00% and are subject to a 1.00% Rule 12b-1 distribution and shareholder servicing fee. The Funds may issue an unlimited number of shares of beneficial interest without par value. |
| | |
| 2 | Significant Accounting Policies The following is a summary of significant accounting policies consistently followed by the Funds in preparation of its financial statements. These policies are in conformity with generally accepted accounting principles in the United States of America (“GAAP”). |
| | Security Valuation. All investments in securities are recorded at their estimated fair value, as described in Note 3. |
| | |
| | Federal Income Taxes. The Funds comply with the requirements of subchapter M of the Internal Revenue Code of 1986, as amended, necessary to qualify as regulated investment companies and distribute substantially all net taxable investment income and net realized gains to shareholders in a manner which results in no tax cost to the Funds. Therefore, no federal income or excise tax provision is required. As of and during the year ended June 30, 2021, the Funds did not have any tax positions that did not meet the “more-likely-than-not” threshold of being sustained by the applicable tax authority. As of and during the year ended June 30, 2021, the Funds did not have liabilities for any unrecognized tax benefits. The Funds recognize interest and penalties, if any, related to unrecognized tax benefits on uncertain tax positions as income tax expense in the Statement of Operations. As of and during the year ended June 30, 2021, the Funds did not incur any interest or penalties. The Funds are not subject to examination by U.S. tax authorities for tax years prior to the fiscal year ended June 30, 2018. |
| | |
| | Security Transactions, Income and Distributions. The Funds follow industry practice and record security transactions on the trade date. Realized gains and losses on sales of securities are calculated on the basis of identified cost. Dividend income is recorded on the ex-dividend date and interest income is recorded on an accrual basis. Withholding taxes on foreign dividends have been provided for in accordance with the Funds’ understanding of the applicable country’s tax rules and regulations. Discounts and premiums on securities purchased are amortized over the expected life of the respective securities using the constant yield method. |
| | |
| | The Funds distribute substantially all net investment income and net realized capital gains, if any, at least annually. Distributions to shareholders are recorded on the ex-dividend date. The treatment for financial reporting purposes of distributions made to shareholders during the year from net investment income or net realized capital gains may differ from their treatment for federal income tax purposes. These differences are caused primarily by differences in the timing of the recognition of certain components of income, expense or realized capital gain for federal income tax purposes. Where such differences are permanent in nature, GAAP requires that they be reclassified in the |
| | components of the net assets based on their ultimate characterization for federal income tax purposes. Any such reclassifications will have no effect on net assets, results of operations on net asset value (“NAV”) per share of the Funds. For the year ended June 30, 2021, the following reclassifications were made: |
| | Fund | Total Distributable Earnings | Paid-In Capital |
| | All Cap Value Fund | $(2,002,286) | $2,002,286 |
| | Strategic Fund | (212,163) | 212,163 |
| | Adjustments to the Funds shown in the above table were due to net operating loss reclassification and the utilization of tax equalization. |
| | |
| | Allocation of Income, Expenses and Gains/Losses. Income, expenses (other than those deemed attributable to a specific share class), and gains and losses of the Funds are allocated daily to each class of shares based upon the ratio of net assets represented by each class as a percentage of the net assets of each Fund. Expenses deemed directly attributable to a class of shares are recorded by the specific class. Most Fund expenses are allocated by class based on relative net assets. 12b-1 fees are expensed at an annual rate of 0.25% and 1.00% of the Class A shares and Class C shares average daily net assets, respectively (See Note 5). Expenses associated with a specific fund in the Trust are charged to that fund. Common Trust expenses are typically allocated evenly between the Funds of the Trust, or by other equitable means. |
| | |
| | Use of Estimates. The preparation of financial statements in conformity with GAAP requires management to make estimates and assumptions that affect the reported amounts of assets and liabilities and disclosure of contingent assets and liabilities at the date of the financial statements and the reported amounts of revenues and expenses during the reporting period. Actual results could differ from those estimates. |
| | |
| 3 | Securities Valuation The Funds have adopted authoritative fair value accounting standards which establish an authoritative definition of fair value and set out a hierarchy for measuring fair value. These standards require additional disclosures about the various inputs and valuation techniques used to develop the measurements of fair value, a discussion in changes in valuation techniques and related inputs during the period and expanded disclosure of valuation Levels for major security types. These inputs are summarized in the three broad Levels listed below: |
| | Level 1 – | Unadjusted quoted prices in active markets for identical assets or liabilities that the Funds have the ability to access. |
| | Level 2 – | Observable inputs other than quoted prices included in Level 1 that are observable for the asset or liability, either directly or indirectly. These inputs may include quoted prices for the identical instrument on an inactive market, prices for similar instruments, interest rates, prepayment speeds, credit risk, yield curves, default rates and similar data. |
| | | |
| | Level 3 – | Unobservable inputs for the asset or liability, to the extent relevant observable inputs are not available, representing the Funds’ own assumptions about the assumptions a market participant would use in valuing the asset or liability, and would be based on the best information available. |
| | Following is a description of the valuation techniques applied to each Fund’s major categories of assets and liabilities measured at fair value on a recurring basis. Each Fund’s investments are carried at fair value. |
| | |
| | Equity Securities. Equity securities that are primarily traded on a national securities exchange are valued at the last sale price on the exchange on which they are primarily traded on the day of valuation or, if there has been no sale on such day, at the mean between the bid and ask prices. Securities traded primarily in the Nasdaq Global Market System for which market quotations are readily available are valued using the Nasdaq Official Closing Price (“NOCP”). If the NOCP is not available, such securities are valued at the last sale price on the day of valuation, or if there has been no sale on such day, at the mean between the bid and ask prices. To the extent these securities are actively traded and valuation adjustments are not applied, they are categorized in Level 1 of the fair value hierarchy. If the market for a particular security is not active, and the mean between bid and ask prices is used, these securities are categorized in Level 2 of the fair value hierarchy. |
| | |
| | Short-Term Investments. Investments in other mutual funds, including money market funds, are valued at their NAV per share. Deposit accounts are valued at acquisition cost, which approximates fair value. To the extent these securities are actively traded and valuation adjustments are not applied, they are categorized in Level 1 of the fair value hierarchy. |
| | |
| | Securities for which market quotations are not readily available, or if the closing price does not represent fair value, are valued following procedures approved by the Board of Trustees (the “Board”). These procedures consider many factors, including the type of security, size of |
| | holding, trading volume and news events. There can be no assurance that the Fund could obtain the fair value assigned to a security if they were to sell the security at approximately the time at which the Fund determines their NAVs per share. The Board has established a Valuation Committee to administer, implement, and oversee the fair valuation process, and to make fair value decisions when necessary. The Board regularly reviews reports of the Valuation Committee that describe any fair value determinations and methods. |
| | |
| | The inputs or methodology used for valuing securities are not an indication of the risk associated with investing in those securities. The following tables are a summary of the inputs used to value each Fund’s securities as of June 30, 2021: |
| | | | Uncategorized | | | Level 1 | | | Level 2 | | | Level 3 | | | Total | |
| | All Cap Value Fund | | | | | | | | | | | | | | | |
| | Common Stocks | | $ | — | | | $ | 665,395,916 | | | $ | — | | | $ | — | | | $ | 665,395,916 | |
| | Short-Term Investment | | | — | | | | 92,854,217 | | | | — | | | | — | | | | 92,854,217 | |
| | Investment Purchased with the Cash | | | | | | | | | | | | | | | | | | | | |
| | Proceeds from Securities Lending* | | | 47,595,188 | | | | — | | | | — | | | | — | | | | 47,595,188 | |
| | Total Investments in Securities | | $ | 47,595,188 | | | $ | 758,250,133 | | | $ | — | | | $ | — | | | $ | 805,845,321 | |
| | | | | | | | | | | | | | | | | |
| | | | Uncategorized | | | Level 1 | | | Level 2 | | | Level 3 | | | Total | |
| | Strategic Fund | | | | | | | | | | | | | | | | | | | | |
| | Common Stocks | | $ | — | | | $ | 128,929,936 | | | $ | — | | | $ | — | | | $ | 128,929,936 | |
| | Short-Term Investment | | | — | | | | 11,964,200 | | | | — | | | | — | | | | 11,964,200 | |
| | Investment Purchased with the Cash | | | | | | | | | | | | | | | | | | | | |
| | Proceeds from Securities Lending* | | | 23,268,499 | | | | — | | | | — | | | | — | | | | 23,268,499 | |
| | Total Investments in Securities | | $ | 23,268,499 | | | $ | 140,894,136 | | | $ | — | | | $ | — | | | $ | 164,162,635 | |
| | * | Certain investments that are measured at fair value using the NAV per share (or its equivalent) as a practical expedient have not been characterized in the fair value hierarchy. The fair value amounts presented in the table are intended to permit reconciliation of the fair value hierarchy to the amount presented in the Statements of Assets and Liabilities. See Note 9 for additional information regarding securities lending activity. |
| | Refer to the Schedule of Investments for further information on the classification of investments. |
| | |
| 4 | Investment Advisory Fee and Other Related Party Transactions The Trust has an agreement with Olstein Capital Management, L.P. (the “Adviser”) to furnish investment advisory services to the Funds. For its services, the All Cap Value Fund pays the Adviser an annualized |
| | monthly management fee of 1.00% of the Fund’s average daily net assets up to $1 billion, 0.95% of the Fund’s average daily net assets on the next $500 million, 0.90% of the Fund’s average daily net assets on the next $500 million, 0.85% of the Fund’s average daily net assets on the next $500 million, 0.80% of the Fund’s average daily net assets on the next $500 million, and 0.75% of the Fund’s average daily net assets in excess of $3 billion. The Strategic Fund pays the Adviser an annualized monthly management fee of 1.00% of the Fund’s average daily net assets. |
| | |
| | The Adviser has contractually agreed to waive a portion or all of its management fees and reimburse the Strategic Fund for its expenses to ensure that total operating expenses (excluding Rule 12b-1 fees, acquired fund fees and expenses, leverage, interest, taxes, brokerage commissions and extraordinary expenses), based upon the average daily net assets of the Fund, do not exceed an annual rate of 1.35%. |
| | |
| | Effective September 14, 2018, fees waived and expenses reimbursed by the Adviser may be recouped by the Adviser for a period of thirty-six months following the month during which such waiver or reimbursement was made if such recoupment can be achieved without exceeding the expense limit in effect at the time the waiver or reimbursement occurred. Fees waived and expenses reimbursed prior to September 14, 2018 are not eligible for recoupment by agreement of the Adviser. Between July 1, 2018 and September 14, 2018, these non-recoupable fees waived by the Adviser totaled $22,893. The Operating Expense Limitation Agreement for the Strategic Fund is indefinite in term, but cannot be terminated within a year after the effective date of the prospectus. After that date, the agreement may be terminated at any time upon 60 days’ written notice by the Board or the Adviser, with the consent of the Board. Waived fees subject to potential recovery by month of expiration are as follows: |
| | Expiration – Strategic Fund | | |
| | September 2021 – June 2022 | $86,465 | |
| | July 2022 – June 2023 | 142,803 | |
| | July 2023 – June 2024 | 92,513 | |
| | U.S. Bancorp Fund Services, LLC (the “Administrator”), doing business as U.S. Bank Global Fund Services, acts as the Funds’ Administrator, Transfer Agent, and Fund Accountant. U.S. Bank N.A. (the “Custodian”) serves as the Custodian to the Funds. The Custodian is an |
| | affiliate of the Administrator. The Administrator performs various administrative and accounting services for the Funds. The Administrator prepares various federal and state regulatory filings, reports and returns for the Funds; prepares reports and materials to be supplied to the Trustees; monitors the activities of the Custodian; coordinates the payment of the Funds’ expenses and reviews the Funds’ expense accruals. The officers of the Trust, including the Chief Compliance Officer, are employees of the Administrator. As compensation for its services, the Administrator is entitled to a monthly fee at an annual rate based upon the average daily net assets of the Funds, subject to annual minimums. Fees paid by the Funds for administration and accounting, transfer agency, custody and compliance services for the year ended June 30, 2021, are disclosed in the Statements of Operations. |
| | |
| 5 | Distribution Costs The Funds have adopted a Distribution Plan pursuant to Rule 12b-1 (the “Plan”) in Class A and Class C only. The Plan permits the Funds to pay for distribution and related expenses at an annual rate of 0.25% and 1.00% of Class A and Class C average daily net assets, respectively. The expenses covered by the Plan may include the cost of preparing and distributing prospectuses and other sales material, advertising and public relations expenses, payments to financial intermediaries and compensation of personnel involved in selling shares of the Funds. For the year ended June 30, 2021, the All Cap Value Fund and Strategic Fund incurred expenses of $306,014 and $58,263, respectively, in Class A pursuant to the Plan. The All Cap Value Fund and Strategic Fund also incurred additional expenses of $2,905,442 and $143,968, respectively, in Class C. |
| 6 | Capital Share Transactions Transactions in shares of the Funds were as follows: |
| | All Cap Value Fund | | | | | | |
| | | | Year Ended | | | Year Ended | |
| | | | June 30, 2021 | | | June 30, 2020 | |
| | Class A: | | | | | | |
| | Shares sold | | | 775,939 | | | | 4,021,012 | |
| | Shares issued in reinvestment of distributions | | | 15,756 | | | | 81,769 | |
| | Shares redeemed | | | (991,243 | ) | | | (276,166 | ) |
| | Net increase (decrease) | | | (199,548 | ) | | | 3,826,615 | |
| | Class C: | | | | | | | | |
| | Shares sold | | | 160,050 | | | | 238,391 | |
| | Shares issued in reinvestment of distributions | | | 23,966 | | | | 515,562 | |
| | Shares redeemed | | | (4,257,128 | ) | | | (7,023,424 | ) |
| | Net decrease | | | (4,073,112 | ) | | | (6,269,471 | ) |
| | Adviser Class: | | | | | | | | |
| | Shares sold | | | 2,550,050 | | | | 357,705 | |
| | Shares issued in reinvestment of distributions | | | 38,839 | | | | 208,789 | |
| | Shares redeemed | | | (999,018 | ) | | | (868,865 | ) |
| | Net increase (decrease) | | | 1,589,871 | | | | (302,371 | ) |
| | Net decrease in capital shares | | | (2,682,789 | ) | | | (2,745,227 | ) |
| | | | | | | | | | |
| | Strategic Fund | | | | | | | | |
| | | | Year Ended | | | Year Ended | |
| | | | June 30, 2021 | | | June 30, 2020 | |
| | Class A: | | | | | | | | |
| | Shares sold | | | 257,125 | | | | 318,471 | |
| | Shares issued in reinvestment of distributions | | | — | | | | — | |
| | Shares redeemed | | | (143,072 | ) | | | (306,460 | ) |
| | Net increase | | | 114,053 | | | | 12,011 | |
| | Class C: | | | | | | | | |
| | Shares sold | | | 63,657 | | | | 55,419 | |
| | Shares issued in reinvestment of distributions | | | — | | | | — | |
| | Shares redeemed | | | (206,495 | ) | | | (495,922 | ) |
| | Net decrease | | | (142,838 | ) | | | (440,503 | ) |
| | Adviser Class: | | | | | | | | |
| | Shares sold | | | 1,804,502 | | | | 338,831 | |
| | Shares issued in reinvestment of distributions | | | — | | | | — | |
| | Shares redeemed | | | (397,332 | ) | | | (809,712 | ) |
| | Net increase (decrease) | | | 1,407,170 | | | | (470,881 | ) |
| | Net increase (decrease) in capital shares | | | 1,378,385 | | | | (899,373 | ) |
| 7 | Investment Transactions The aggregate purchases and sales, excluding short-term investments, by Fund for the year ended June 30, 2021, were as follows: |
| | | | U.S. Government Securities | | | Other Securities | |
| | Fund | | Purchases | | | Sales | | | Purchases | | | Sales | |
| | All Cap Value Fund | | $ | — | | | $ | — | | | $ | 232,214,504 | | | $ | 339,768,046 | |
| | Strategic Fund | | | — | | | | — | | | | 64,560,296 | | | | 39,550,973 | |
| 8 | Federal Tax Information The aggregate gross unrealized appreciation and depreciation of securities held by the Funds and the total cost of securities for federal income tax purposes at June 30, 2021, were as follows: |
| | | Aggregate | Aggregate | | Federal Income |
| | Fund | Gross Appreciation | Gross Depreciation | Net Appreciation | Tax Cost |
| | All Cap Value Fund | $212,815,742 | $(7,304,363) | $205,511,379 | $600,333,942 |
| | Strategic Fund | 36,945,570 | (2,452,245) | 34,493,325 | 129,669,310 |
| | Any differences between book-basis and tax-basis unrealized appreciation/depreciation is attributable primarily to the tax deferral of losses on wash sales. |
| | |
| | At June 30, 2021, the components of distributable earnings/accumulated loss on a tax-basis were as follows: |
| | | Undistributed | Undistributed | Other | Net | Total |
| | | Ordinary | Long-Term | Accumulated | Unrealized | Distributable |
| | Fund | Income | Capital Gains | Gains | Appreciation | Earnings |
| | All Cap Value Fund | $6,893,691 | $73,609,430 | $— | $205,511,379 | $286,014,500 |
| | Strategic Fund | 555,355 | 6,411,325 | — | 34,493,325 | 41,460,005 |
| | As of June 30, 2021, the Funds did not have any short-term capital loss carryforwards. A regulated investment company may elect for any taxable year to treat any portion of any qualified late year loss as arising on the first day of the next taxable year. Qualified late year losses are certain capital, and ordinary losses which occur during the portion of the Funds’ taxable year subsequent to October 31 and December 31, respectively. For the taxable year ended June 30, 2021, the Funds did not defer any qualified late year losses. |
| | The tax character of distributions paid for the year ended June 30, 2021, was as follows: |
| | | Ordinary | Long Term | |
| | Fund | Income* | Capital Gains | Total |
| | All Cap Value Fund | $2,311,149 | $— | $2,311,149 |
| | Strategic Fund | — | — | — |
| | The tax character of distributions paid for the year ended June 30, 2020, was as follows: |
| | | Ordinary | Long Term | |
| | Fund | Income* | Capital Gains | Total |
| | All Cap Value Fund | $1,030,374 | $18,424,641 | $19,455,015 |
| | Strategic Fund | — | — | — |
| | * | For Federal income tax purposes, distributions of short-term capital gains are treated as ordinary income distributions. |
| 9 | Securities Lending Following terms of a securities lending agreement with the Funds’ Custodian, each Fund may lend securities from its portfolio to brokers, dealers and financial institutions in order to increase the return on its portfolio, primarily through the receipt of borrowing fees and earnings on invested collateral. Any such loan must be secured by collateral in cash or cash equivalents maintained on a current basis in an amount at least equal to 105% of the value of the loaned securities that are foreign securities or 102% of the value of any U.S. loaned securities at the inception of the loan. Loans shall be marked to market daily and the margin restored in the event the collateralization is below 100% of the value of the securities loaned. During the time securities are on loan, the borrower will pay the applicable Fund any accrued income on those securities, and the Fund may invest the cash collateral and earn income or receive an agreed-upon fee from a borrower that has delivered cash-equivalent collateral. In determining whether or not to lend a security to a particular broker, dealer or financial institution, the Adviser considers all relevant facts and circumstances, including the size, creditworthiness and reputation of the broker, dealer or financial institution. Securities lending involves the risk of a default or insolvency of the borrower. In either of these cases, a Fund could experience delays in recovering securities or collateral or could lose all or part of the value of the loaned securities. A Fund also could lose money in the event of a decline in the value of the collateral provided for loaned securities. Additionally, the loaned portfolio securities may not be available to a Fund on a timely basis and a Fund may therefore lose the opportunity to sell the securities at a desirable price. Any decline in the value of a security that occurs |
| | while the security is out on loan would continue to be borne by the Funds. As of June 30, 2021, the All Cap Value Fund and the Strategic Fund had 11 and 14 securities out on loan, respectively. |
| | |
| | The Funds receive cash as collateral in return for securities lent as part of the securities lending program. The collateral is invested in the Mount Vernon Liquid Assets Portfolio, LLC of which the investment objective is to seek to maximize current income to the extent with the preservation of capital and liquidity and maintain a stable NAV of $1.00 per unit, which are generally available for purchase or redemption each business day. The All Cap Value Fund and the Strategic Fund held $47,595,188 and $23,268,499 as of June 30, 2021, respectively. The remaining contractual maturity of all securities lending transactions is overnight and continuous. The Funds are not subject to a master netting agreement with respect to securities lending; therefore no additional disclosures are required. The net income earned by the Funds on investments of cash collateral received from borrowers for the securities loaned to them is reflected in the Funds’ Statements of Operations. Securities lending income, as disclosed in the Funds’ Statements of Operations, represents the income earned from the investment of cash collateral, net of fee rebates paid to the borrower and net of fees paid to the Custodian as lending agent. |
| | |
| 10 | Line Of Credit The All Cap Value Fund and Strategic Fund each has established an unsecured Line of Credit (“LOC”) in the amount of $40,000,000 and $10,000,000, respectively, or 33.33% of the fair value of each Fund’s unencumbered assets, whichever is less. Each LOC matures unless renewed on July 23, 2021. These LOCs are intended to provide short-term financing, if necessary, subject to certain restrictions and covenants in connection with shareholder redemptions and other short-term liquidity needs of the Funds. The LOCs are with the Custodian. Interest is charged at the prime rate which was 3.25% as of June 30, 2021. The interest rate during the period was 3.25%. Each Fund has authorized the Custodian to charge any of each Fund’s accounts for missed payments. For the year ended June 30, 2021, the Funds did not have any borrowing under the LOCs. Prior to July 24, 2020, the All Cap Value Fund and Strategic Fund had a maximum borrowing limit of $50,000,000 and $15,000,000, respectively. |
| | |
| | On July 23, 2021, the Funds renewed their LOCs through July 22, 2022. Borrowing under the renewed LOCs for the All Cap Value Fund and Strategic Fund is limited to $50,000,000 and $15,000,000, respectively, or 33.33% of the fair value of each Fund’s unencumbered assets, whichever is less. |
| 11. | Recent Accounting Pronouncement In December 2020, the SEC adopted a new rule providing a framework for fund valuation practices (“Rule 2a-5”). Rule 2a-5 establishes requirements for determining fair value in good faith for purposes of the 1940 Act. Rule 2a-5 will permit fund boards to designate certain parties to perform fair value determinations, subject to board oversight and certain other conditions. Rule 2a-5 also defines when market quotations are “readily available” for purposes of the 1940 Act and the threshold for determining whether a fund must fair value a security. In connection with Rule 2a-5, the SEC also adopted related recordkeeping requirements and is rescinding previously issued guidance, including with respect to the role of a board in determining fair value and the accounting and auditing of fund investments. The Funds will be required to comply with the rules by September 8, 2022. Management is currently assessing the potential impact of the new rules on the Funds’ financial statements. |
| | |
| 12 | COVID-19 The global outbreak of COVID-19 (commonly referred to as “coronavirus”) has disrupted economic markets and the prolonged economic impact is uncertain. The ultimate economic fallout from the pandemic, and the long-term impact on economies, markets, industries and individual issuers, are not known. The operational and financial performance of the issuers of securities in which the Funds invest depends on future developments, including the duration and spread of the outbreak, and such uncertainty may in turn adversely affect the value and liquidity of the Funds’ investments, impair the Funds’ ability to satisfy redemption requests, and negatively impact the Funds’ performance. |
| | |
| 13 | Subsequent Event On July 7, 2021, Foreside Financial Group, LLC (“Foreside”), the parent company of Compass Distributors, LLC (“Compass”), the Funds’ distributor, announced that it had entered into a definitive purchase and sale agreement with Genstar Capital (“Genstar”) such that Genstar would acquire a majority stake in Foreside. The transaction is expected to close at the end of the third quarter of 2021. Compass will remain the Funds’ distributor at the close of the transaction, subject to Board approval. |
Report of Independent Registered Public Accounting Firm
To the Shareholders of Olstein Funds and
Board of Trustees of Managed Portfolio Series
Opinion on the Financial Statements
We have audited the accompanying statements of assets and liabilities, including the schedules of investments, of Olstein All Cap Value Fund and Olstein Strategic Opportunities Fund (“Olstein Funds” or the “Funds”), each a series of Managed Portfolio Series, as of June 30, 2021, the related statements of operations for the year then ended, the statements of changes in net assets for each of the two years in the period then ended, the related notes, and the financial highlights for each of the five years in the period then ended (collectively referred to as the “financial statements”). In our opinion, the financial statements present fairly, in all material respects, the financial position of each of the Funds as of June 30, 2021, the results of their operations for the year then ended, the changes in net assets for each of the two years in the period then ended, and the financial highlights for each of the five years in the period then ended, in conformity with accounting principles generally accepted in the United States of America.
Basis for Opinion
These financial statements are the responsibility of the Funds’ management. Our responsibility is to express an opinion on the Funds’ financial statements based on our audits. We are a public accounting firm registered with the Public Company Accounting Oversight Board (United States) (“PCAOB”) and are required to be independent with respect to the Funds in accordance with the U.S. federal securities laws and the applicable rules and regulations of the Securities and Exchange Commission and the PCAOB.
We conducted our audits in accordance with the standards of the PCAOB. Those standards require that we plan and perform the audit to obtain reasonable assurance about whether the financial statements are free of material misstatement whether due to error or fraud.
Our audits included performing procedures to assess the risks of material misstatement of the financial statements, whether due to error or fraud, and performing procedures that respond to those risks. Such procedures included examining, on a test basis, evidence regarding the amounts and disclosures in the financial statements. Our procedures included confirmation of securities owned as of June 30, 2021, by correspondence with the custodian and brokers. Our audits also included evaluating the accounting principles used and significant estimates made by management, as well as evaluating the overall presentation of the financial statements. We believe that our audits provide a reasonable basis for our opinion.
We have served as the Funds’ auditor since 2012.
COHEN & COMPANY, LTD.
Milwaukee, Wisconsin
August 27, 2021
THE OLSTEIN FUNDS
Additional Information (Unaudited)
APPROVAL OF INVESTMENT ADVISORY AGREEMENT
At the regular meeting of the Board of Trustees of Managed Portfolio Series (“Trust”) on February 23-24, 2021, the Trust’s Board of Trustees (“Board”), each of whom were present virtually via video conference, including all of the Trustees who are not “interested persons” of the Trust, as that term is defined in Section 2(a)(19) of the Investment Company Act of 1940, as amended, (“Independent Trustees”) considered and approved the continuation of the Investment Advisory Agreement between the Trust and Olstein Capital Management, L.P. (“OCM” or the “Adviser”) regarding the Olstein All Cap Value Fund (the “All Cap Value Fund”) and the Olstein Strategic Opportunities Fund (the “Strategic Opportunities Fund” and together with the All Cap Value Fund, the “Funds”) (the “Investment Advisory Agreement”) for an additional one-year term.
Prior to the meeting and at a meeting held on January 6, 2021, the Trustees received and considered information from OCM and the Trust’s administrator designed to provide the Trustees with the information necessary to evaluate the continuance of the Investment Advisory Agreement (“Support Materials”). Before voting to approve the continuance of the Investment Advisory Agreement, the Trustees reviewed the Support Materials with Trust management and with counsel to the Independent Trustees, and received a memorandum from such counsel discussing the legal standards for the Trustees’ consideration of the renewal of the Investment Advisory Agreement. This information, together with the information provided to the Board throughout the course of the year, formed the primary (but not exclusive) basis for the Board’s determinations.
In determining whether to continue the Investment Advisory Agreement, the Trustees considered all factors they believed relevant, including the following with respect to each Fund: (1) the nature, extent, and quality of the services provided by OCM with respect to the Fund; (2) the Fund’s historical performance as managed by OCM; (3) the costs of the services to be provided by OCM and the profits to be realized by OCM from services rendered to the Fund; (4) comparative fee and expense data for the Fund and other investment companies with similar investment objectives; (5) the extent to
Additional Information (Unaudited) Continued
which economies of scale may be realized as the Fund grows, and whether the advisory fee for the Fund reflects such economies of scale for the Fund’s benefit; and (6) other benefits to OCM resulting from its relationship with the Fund. In their deliberations, the Trustees weighed to varying degrees the importance of the information provided to them, did not identify any particular information that was all-important or controlling, and considered the information and made its determinations for each Fund separately and independently of the other Fund.
Based upon OCM’s presentation and information from OCM and the Trust’s administrator designed to provide the Trustees with the information necessary to evaluate the terms of the Advisory Agreement, the Board concluded that the overall arrangements between the Trust and OCM set forth in the Investment Advisory Agreement, as the agreement relates to each Fund, continue to be fair and reasonable in light of the services that OCM performs, the investment advisory fees that each Fund pays, and such other matters as the Trustees considered relevant in the exercise of their reasonable business judgment. The material factors and conclusions that formed the basis of the Trustees’ determination to approve the continuation of the Investment Advisory Agreement, as it relates to each Fund, are summarized below.
Nature, Extent and Quality of Services Provided. The Trustees considered the scope of services that OCM provides under the Investment Advisory Agreement with respect to each Fund, noting that such services include, but are not limited to, the following: (1) investing each Fund’s assets consistent with the Fund’s investment objective and investment policies; (2) determining the portfolio securities to be purchased, sold, or otherwise disposed of and the timing of such transactions; (3) voting all proxies, if any, with respect to each Fund’s portfolio securities; (4) maintaining the required books and records for transactions effected by OCM on behalf of the Funds; (5) selecting broker-dealers to execute orders on behalf of the Funds; and (6) monitoring and maintaining each Fund’s compliance with policies and procedures of the Trust and with applicable securities laws. The Trustees reviewed OCM’s financial statements, assets under management and capitalization. In that regard, the Trustees concluded that OCM had sufficient resources to support the management of the Funds. The Trustees noted that OCM has been managing the Funds, since 1996 in the case of the All Cap Value Fund and 2006 in the case of the Strategic Opportunities Fund, and manages a composite of
Additional Information (Unaudited) Continued
separately managed accounts with investment objectives and investment strategies that are substantially similar to each Fund. The Trustees also considered the experience of the portfolio managers that OCM utilizes in managing each Fund’s assets and that the lead portfolio manager has been the same since each Fund’s inception. The Trustees concluded that they were satisfied with the nature, extent and quality of services that OCM provides to each Fund under the Investment Advisory Agreement.
Fund Historical Performance and the Overall Performance of OCM. In assessing the quality of the portfolio management delivered by OCM, the Trustees reviewed the short-term and longer-term performance of each Fund on both an absolute basis and in comparison to an appropriate securities benchmark index, each Fund’s respective peer funds according to Morningstar classifications, and each Fund’s respective composite of separate accounts that OCM manages utilizing investment strategies similar to those of the Funds. When reviewing each Fund’s performance against its respective Morningstar peer group, the Trustees took into account that the investment objective and strategies of each Fund, as well as the Fund’s level of risk tolerance, may differ significantly from funds in its peer group.
| | • | All Cap Value Fund. The Trustees considered that the All Cap Value Fund outperformed its peer group median and average over the year-to-date, one-year, three-year, five-year and ten-year periods ended October 31, 2020. The Trustees also considered that the Fund had outperformed its primary benchmark over the year-to-date, one-year, three-year, and five-year periods ended October 31, 2020, but underperformed its primary benchmark over the ten-year period ended October 31, 2020. The Trustees also considered that the Fund had underperformed its secondary benchmark across all periods. The Trustees then observed that the Fund’s performance was consistent with the performance of a composite of similar accounts managed by OCM over all relevant time periods. |
| | | |
| | • | Strategic Opportunities Fund. The Trustees considered that the Strategic Opportunities Fund outperformed its peer group median and average over the year-to-date, one-year, three-year and five-year periods ended October 31, 2020. The Trustees also considered that the Fund had outperformed its primary benchmark over the year-to-date, one-year, three-year and five-year periods ended October 31, 2020. The Trustees also considered that the Fund had underperformed its secondary |
Additional Information (Unaudited) Continued
benchmark across all periods. The Trustees then observed that the Fund’s performance was consistent with the performance of a composite of similar accounts managed by OCM over all relevant time periods.
Cost of Advisory Services and Profitability. The Trustees considered the annual management fee that each Fund pays to OCM under the Advisory Agreement in the amount of 1.00% of the Fund’s average annual daily net assets. They also considered OCM’s profitability analysis for the 12-month period ended September 30, 2020 for services that OCM rendered to each Fund. In that regard, the Trustees noted that the All Cap Value Fund had been profitable to OCM over that period and the Strategic Opportunities Fund was not profitable to OCM. The Trustees noted that OCM manages a composite of separately managed accounts with investment strategies that are substantially similar to each Fund. The Trustees noted that the management fee charged to the separately managed accounts is equal to or lower than the management fee charged by corresponding Fund. OCM identified additional services provided to the Funds to justify a higher management fee. The Trustees also noted that OCM had contractually agreed, for a period of at least one year from the effective date of the Strategic Opportunities Fund’s prospectus, to waive its management fees and reimburse the Fund for its operating expenses to the extent necessary to ensure that total operating expenses of the Fund do not exceed the amount set forth in the Fund’s prospectus. In that regard, the Trustees noted that OCM had waived a portion of its management fee during the 12-month period ended September 30, 2020 with respect to the Strategic Opportunities Fund. The Trustees concluded that OCM’s service relationship with the All Cap Value Fund yielded a reasonable profit. The Trustees also agreed to continue to review the Strategic Opportunities Fund’s profitability as part of its annual review of the investment advisory contract with OCM.
Comparative Fee and Expense Data. The Trustees considered a comparative analysis of contractual expenses that each Fund will bear and those of funds in the Morningstar peer group for each Fund. The Trustees noted that:
| | • | All Cap Value Fund. The All Cap Value Fund’s management fee was above the peer group median and average. The total expenses of each class of the All Cap Value Fund were above the peer group median and average total expenses. The Trustees further took into account that the average net assets of the funds comprising the peer group were significantly higher than the assets of the All Cap Value Fund. |
Additional Information (Unaudited) Continued
| | • | Strategic Opportunities Fund. The Strategic Opportunities Fund’s management fee was above the peer group median and average. The total expenses of each class of the Strategic Opportunities Fund (after fee waivers and expense reimbursements) was higher than the peer group median and average. The Trustees further took into account that the average net assets of the funds comprising the peer group were significantly higher than the assets of the Strategic Opportunities Fund and that the management fee was within the range of the management fees in the peer group. |
While recognizing that it is difficult to compare advisory fees because the scope of advisory services provided may vary from one investment adviser to another, the Trustees concluded that OCM’s advisory fee with respect to each Fund continues to be reasonable.
Economies of Scale. The Trustees considered whether the Funds would benefit from any economies of scale, noting that the management fee for the All Cap Value Fund includes breakpoints once the Fund hits $1 billion in assets. The Trustees also took into account that the Strategic Opportunities Fund’s management fee did not have breakpoints. Given the current size of the Strategic Opportunities Fund the Trustees concluded that it is not necessary to consider the implementation of fee breakpoints at the present time, but committed to revisit this issue in the future as circumstances change and asset levels increase.
Other Benefits. The Trustees considered the direct and indirect benefits that could be realized by OCM and its affiliates from their respective relationships with the Funds. The Trustees noted that OCM utilizes soft dollar arrangements with respect to portfolio transactions. The Trustees also noted that OCM is reimbursed under the Trust’s 12b-1 plan for expenses incurred in connection with distribution-related activities of OCM personnel and related expenses incurred by OCM. The Trustees noted that OCM does not consider such reimbursements to be a fall out benefit to OCM. The Trustees noted that OCM does not use affiliated brokers to execute the Funds’ portfolio transactions. The Trustees considered that OCM may receive some form of reputational benefit from services rendered to the Funds, but that such benefits are immaterial and cannot otherwise be quantified. The Trustees concluded that OCM does not receive additional material benefits from their relationship with the Funds.
Additional Information (Unaudited) Continued
STATEMENT REGARDING THE FUNDS’
LIQUIDITY RISK MANAGEMENT PROGRAM
Pursuant to Rule 22e-4 under the Investment Company Act of 1940, the Trust, on behalf of the Olstein All Cap Value Fund and Olstein Strategic Opportunities Fund (each a “Fund” and together, the “Funds”), has adopted and implemented a written liquidity risk management program (the “Program”) that includes policies and procedures reasonably designed to comply with the requirements of Rule 22e-4, including: (i) assessment, management and periodic review of liquidity risk; (ii) classification of portfolio holdings; (iii) establishment of a highly liquid investment minimum (“HLIM”), as applicable; (iv) limitation on illiquid investments; and (v) redemptions in-kind. The Trust’s Board of Trustees (the “Board”) has approved the designation of Olstein Capital, L.P. (“Olstein”) as the administrator of the Program (the “Program Administrator”). Personnel of Olstein conduct the day-to-day operation of the Program pursuant to policies and procedures administered by the Olstein Liquidity Committee.
In accordance with Rule 22e-4, the Board reviewed a report prepared by the Program Administrator (the “Report”) regarding the operation of the Program and its adequacy and effectiveness of implementation for the period January 1, 2020, through December 31, 2020 (the “Reporting Period”). No significant liquidity events impacting the Funds during the Reporting Period or material changes to the Program were noted in the Report.
Under the Program, Olstein manages and periodically reviews each Fund’s liquidity risk, including consideration of applicable factors specified in Rule 22e-4 and the Program. Liquidity risk is defined as the risk that a Fund could not meet shareholder redemption requests without significant dilution of remaining shareholders’ interests in the Fund. In general, this risk was managed during the Reporting Period by monitoring the degree of liquidity of each Fund’s investments, limiting the amount of each Fund’s illiquid investments, and utilizing various risk management tools and facilities available to each Fund for meeting shareholder redemptions, among other means. In the Report, Olstein provided its assessment that, based on the information considered in its review, the Program remains reasonably designed to manage each Fund’s liquidity risk and each Fund’ s investment strategy remains appropriate for an open-end fund.
Additional Information (Unaudited) Continued
Pursuant to the Program, the Olstein Liquidity Committee oversaw the classification of each of the Funds’ portfolio investments as highly liquid, moderately liquid, less liquid or illiquid during the Reporting Period, including in connection with recording investment classifications on Form N-PORT. Olstein’s process of determining the degree of liquidity of each Fund’s investments is supported by one or more third-party liquidity assessment vendors.
Each Fund qualified as a “primarily highly liquid fund” as defined in the Program during the Reporting Period. Accordingly, each Fund was not required to establish a HLIM or comply with the related Program provisions during the Reporting Period.
During the Reporting Period, each Fund’s investments were monitored for compliance with the 15% limitation on illiquid investments pursuant to the Program and in accordance with Rule 22e-4.
The report noted that the Funds did not effect redemptions-in-kind during the Reporting Period pursuant to the program. The Report concluded, with respect to each Fund: (i) the Program was implemented and operated effectively to achieve the goal of assessing and managing the Fund’s liquidity risk during the Reporting Period; and (ii) the Fund was able to meet requests for redemption without significant dilution of remaining investors’ interests in the Fund during the Reporting Period.
Additional Information (Unaudited) Continued
TRUSTEES AND OFFICERS
| | | Term of | Number of | | Other |
| | | Office | Portfolios | | Directorships |
| | Position(s) | and Length | in Trust | Principal | Held by Trustee |
| Name, Address and | Held with | of Time | Overseen | Occupation(s) During | During the Past |
Year of Birth | the Trust | Served | by Trustee | the Past Five Years | Five Years |
| Independent Trustees | | | | | |
| | | | | | |
| Leonard M. Rush, CPA | Chairman, | Indefinite | 32 | Retired, Chief | Independent |
| 615 E. Michigan St. | Trustee | Term; | | Financial Officer, | Trustee, ETF |
| Milwaukee, WI 53202 | and | Since | | Robert W. Baird | Series |
| Year of Birth: 1946 | Audit | April | | & Co. Incorporated | Solutions (47 |
| | Committee | | | (2000-2011). | Portfolios) |
| | Chairman | 2011 | | | (2012- |
| | | | | | Present); |
| | | | | | Director, |
| | | | | | Anchor |
| | | | | | Bancorp |
| | | | | | Wisconsin, |
| | | | | | Inc. |
| | | | | | (2011-2013). |
| | | | | | |
| David A. Massart | Trustee | Indefinite | 32 | Co-Founder | Independent |
| 615 E. Michigan St. | | Term; | | and Chief | Trustee, ETF |
| Milwaukee, WI 53202 | | Since | | Investment | Series |
| Year of Birth: 1967 | | April | | Strategist, Next | Solutions (49 |
| | | 2011 | | Generation | Portfolios) |
| | | | | Wealth | (2012- |
| | | | | Management, Inc. | Present). |
| | | | | (2005-Present). | |
Additional Information (Unaudited) Continued
| | | Term of | Number of | | Other |
| | | Office | Portfolios | | Directorships |
| | Position(s) | and Length | in Trust | Principal | Held by Trustee |
| Name, Address and | Held with | of Time | Overseen | Occupation(s) During | During the Past |
Year of Birth | the Trust | Served | by Trustee | the Past Five Years | Five Years |
| David M. Swanson | Trustee | Indefinite | 32 | Founder and | Independent |
| 615 E. Michigan St. | and | Term; | | Managing | Trustee, |
| Milwaukee, WI 53202 | Nominating | Since | | Principal, | ALPS |
| Year of Birth: 1957 | & | April | | SwanDog | Variable |
| | Governance | 2011 | | Strategic | Investment |
| | Committee | | | Marketing, LLC | Trust |
| | Chairman | | | (2006-Present). | (7 Portfolios) |
| | | | | | (2006- |
| | | | | | Present); |
| | | | | | Independent |
| | | | | | Trustee, |
| | | | | | RiverNorth |
| | | | | | Opportunities |
| | | | | | Closed-End |
| | | | | | Fund (2015- |
| | | | | | Present); |
| | | | | | Independent |
| | | | | | Trustee, |
| | | | | | RiverNorth |
| | | | | | Funds |
| | | | | | (3 Portfolios) |
| | | | | | (2018- |
| | | | | | Present); |
| | | | | | RiverNorth |
| | | | | | Managed |
| | | | | | Duration |
| | | | | | Municipal |
| | | | | | Income Fund |
| | | | | | Inc. |
| | | | | | (1 Portfolio) |
| | | | | | (2019- |
| | | | | | Present); |
| | | | | | RiverNorth |
| | | | | | Specialty |
| | | | | | Finance |
| | | | | | Corporation |
| | | | | | (1 Portfolio) |
| | | | | | (2018- |
| | | | | | Present); |
Additional Information (Unaudited) Continued
| | | Term of | Number of | | Other |
| | | Office | Portfolios | | Directorships |
| | Position(s) | and Length | in Trust | Principal | Held by Trustee |
| Name, Address and | Held with | of Time | Overseen | Occupation(s) During | During the Past |
Year of Birth | the Trust | Served | by Trustee | the Past Five Years | Five Years |
| David M. Swanson | | | | | RiverNorth/ |
| Continued | | | | | DoubleLine |
| | | | | | Strategic |
| | | | | | Opportunity |
| | | | | | Fund, Inc. |
| | | | | | (1 Portfolio) |
| | | | | | (2018- |
| | | | | | Present); |
| | | | | | RiverNorth |
| | | | | | Opportunities |
| | | | | | Fund, Inc. |
| | | | | | (1 Portfolio) |
| | | | | | (2015- |
| | | | | | Present); |
| | | | | | RiverNorth |
| | | | | | Opportunistic |
| | | | | | Municipal |
| | | | | | Income Fund, |
| | | | | | Inc. |
| | | | | | (1 Portfolio) |
| | | | | | (2018- |
| | | | | | Present); |
| | | | | | RiverNorth |
| | | | | | Flexible |
| | | | | | Municipal |
| | | | | | Income Fund |
| | | | | | (2020- |
| | | | | | Present). |
| | | | | | |
| Robert J. Kern* | Trustee | Indefinite | 32 | Retired (July | None |
| 615 E. Michigan St. | | Term; | | 2018-Present); | |
| Milwaukee, WI 53202 | | Since | | Executive Vice | |
| Year of Birth: 1958 | | January | | President, U.S. | |
| | | 2011 | | Bancorp Fund | |
| | | | | Services, LLC | |
| | | | | (1994-2018). | |
| | | | | | |
| Officers | | | | | |
| | | | | | |
| Brian R. Wiedmeyer | President | Indefinite | N/A | Vice President, | N/A |
| 615 E. Michigan St. | and | Term; | | U.S. Bancorp | |
| Milwaukee, WI 53202 | Principal | Since | | Fund Services, | |
| Year of Birth: 1973 | Executive | November | | LLC (2005- | |
| | Officer | 2018 | | Present). | |
| * | Mr. Kern became an Independent Trustee on July 6, 2020. Previously he was an Interested Trustee. |
Additional Information (Unaudited) Continued
| | | Term of | Number of | | Other |
| | | Office | Portfolios | | Directorships |
| | Position(s) | and Length | in Trust | Principal | Held by Trustee |
| Name, Address and | Held with | of Time | Overseen | Occupation(s) During | During the Past |
Year of Birth | the Trust | Served | by Trustee | the Past Five Years | Five Years |
| Deborah Ward | Vice | Indefinite | N/A | Senior Vice | N/A |
| 615 E. Michigan St. | President, | Term; | | President, U.S. | |
| Milwaukee, WI 53202 | Chief | Since | | Bancorp Fund | |
| Year of Birth: 1966 | Compliance | April | | Services, LLC | |
| | Officer and | 2013 | | (2004-Present). | |
| | Anti-Money | | | | |
| | Laundering | | | | |
| | Officer | | | | |
| | | | | | |
| Benjamin Eirich | Treasurer, | Indefinite | N/A | Assistant Vice | N/A |
| 615 E. Michigan St. | Principal | Term; | | President, U.S. | |
| Milwaukee, WI 53202 | Financial | Since | | Bancorp Fund | |
| Year of Birth: 1981 | Officer | August | | Services, LLC | |
| | and Vice | 2019 | | (2008-Present). | |
| | President | (Treasurer); | | | |
| | | Since | | | |
| | | November | | | |
| | | 2018 | | | |
| | | (Vice | | | |
| | | President) | | | |
| | | | | | |
| Joseph M. | Secretary | Indefinite | N/A | Assistant Vice | N/A |
| Destache, Esq. | | Term; | | President, U.S. | |
| 615 E. Michigan St. | | Since | | Bancorp Fund | |
| Milwaukee, WI 53202 | | March | | Services, LLC | |
| Year of Birth: 1991 | | 2011 | | (2019-Present); | |
| | | | | Regulatory | |
| | | | | Administration | |
| | | | | Intern, U.S. | |
| | | | | Bancorp Fund | |
| | | | | Services, LLC | |
| | | | | (2018-2019); | |
| | | | | Law Student | |
| | | | | (2016-2019) | |
Additional Information (Unaudited) Continued
| | | Term of | Number of | | Other |
| | | Office | Portfolios | | Directorships |
| | Position(s) | and Length | in Trust | Principal | Held by Trustee |
| Name, Address and | Held with | of Time | Overseen | Occupation(s) During | During the Past |
Year of Birth | the Trust | Served | by Trustee | the Past Five Years | Five Years |
| Douglas Schafer | Assistant | Indefinite | N/A | Assistant Vice | N/A |
| 615 E. Michigan St. | Treasurer | Term; | | President, U.S. | |
| Milwaukee, WI 53202 | and Vice | Since | | Bancorp Fund | |
| Year of Birth: 1970 | President | May 2016 | | Services, LLC | |
| | | (Assistant | | (2002-Present). | |
| | | Treasurer); | | | |
| | | Since | | | |
| | | November | | | |
| | | 2018 | | | |
| | | (Vice | | | |
| | | President) | | | |
| | | | | | |
| Michael J. Cyr II, CPA | Assistant | Indefinite | N/A | Assistant Vice | N/A |
| 615 E. Michigan St. | Treasurer | Term; | | President, U.S. | |
| Milwaukee, WI 53202 | and Vice | Since | | Bancorp Fund | |
| Year of Birth: 1992 | President | August | | Services, LLC | |
| | | 2019 | | (2013-Present). | |
Additional Information (Unaudited) Continued
AVAILABILITY OF FUND PORTFOLIO INFORMATION
Each Fund files complete schedules of portfolio holdings with the SEC for the first and third quarters of each fiscal year on Part F of Form N-PORT. Each Fund’s Part F of Form N-PORT is available on the SEC’s website at www.sec.gov and may be reviewed and copied at the SEC’s Public Reference Room in Washington, D.C. For information on the Public Reference Room call 1-800-SEC-0330. In addition, each Fund’s Part F of Form N-PORT is available without charge upon request by calling 1-800-799-2113.
AVAILABILITY OF FUND PROXY VOTING INFORMATION
A description of each Fund’s Proxy Voting Policies and Procedures is available without charge, upon request, by calling 1-800-799-2113. Information regarding how the Funds voted proxies relating to portfolio securities during the most recent 12 month period ended June 30 is available (1) without charge, upon request, by calling 1-800-799-2113, or (2) on the SEC’s website at www.sec.gov.
QUALIFIED DIVIDEND INCOME/DIVIDENDS
RECEIVED DEDUCTION
For the fiscal year ended June 30, 2021 certain dividends paid by the Funds may be reported as qualified dividend income and may be eligible for taxation at capital gain rates. The percentage of dividends declared from ordinary income designated as qualified dividend income was 100.00% and 0.00% for the All Cap Value Fund and Strategic Fund, respectively.
For corporate shareholders, the percent of ordinary income distributions qualifying for the corporate dividends received deduction for the year ended June 30, 2021 was 100.00% and 0.00% for the All Cap Value Fund and Strategic Fund, respectively.
The percentage of taxable ordinary income distributions that are designated as short-term capital gain distributions under Internal Revenue Section 871(k)(2)(C) was 0.00% and 0.00% for the All Cap Value Fund and Strategic Fund, respectively.
PRIVACY POLICY (UNAUDITED)
The Funds collect only relevant information about you that the law allows or requires it to have in order to conduct its business and properly service you. The Funds collect financial and personal information about you (“Personal Information”) directly (e.g., information on account applications and other forms, such as your name, address, and social security number, and information provided to access account information or conduct account transactions online, such as password, account number, e-mail address, and alternate telephone number), and indirectly (e.g., information about your transactions with us, such as transaction amounts, account balance and account holdings).
The Funds do not disclose any non-public personal information about its shareholders or former shareholders other than for everyday business purposes such as to process a transaction, service an account, respond to court orders and legal investigations or as otherwise permitted by law. Third parties that may receive this information include companies that provide transfer agency, technology and administrative services to the Funds, as well as the Funds’ investment adviser who is an affiliate of the Funds. If you maintain a retirement/educational custodial account directly with the Funds, we may also disclose your Personal Information to the custodian for that account for shareholder servicing purposes. The Funds limit access to your Personal Information provided to unaffiliated third parties to information necessary to carry out their assigned responsibilities to the Funds. All shareholder records will be disposed of in accordance with applicable law. The Funds maintain physical, electronic and procedural safeguards to protect your Personal Information and requires its third party service providers with access to such information to treat your Personal Information with the same high degree of confidentiality.
In the event that you hold shares of the Funds through a financial intermediary, including, but not limited to, a broker-dealer, credit union, bank or trust company, the privacy policy of your financial intermediary governs how your non-public personal information is shared with unaffiliated third parties.
(THIS PAGE INTENTIONALLY LEFT BLANK).
Olstein
All Cap Value Fund
Olstein
Strategic Opportunities Fund
Investment Adviser
Olstein Capital Management, L.P.
4 Manhattanville Road
Purchase, New York 10577
Distributor
Compass Distributors, LLC
Three Canal Plaza, Suite 100
Portland, Maine 04101
Custodian
U.S. Bank N.A.
1555 North Rivercenter Drive, Suite 302
Milwaukee, Wisconsin 53212
Administrator, Fund Accountant
And Transfer Agent
U.S. Bancorp Fund Services, LLC
615 East Michigan Street
Milwaukee, Wisconsin 53202
Independent Registered Public Accounting Firm
Cohen & Company, Ltd.
342 North Water Street, Suite 830
Milwaukee, Wisconsin 53202
Legal Counsel
Stradley Ronon Stevens & Young, LLP
2005 Market Street, Suite 2600
Philadelphia, Pennsylvania 19103
This report is submitted for the general information of the shareholders of the Funds. It is not authorized for distribution to prospective investors unless preceded or accompanied by an effective prospectus, which includes information regarding the Funds’ risks, objectives, fees and expenses, experience of its management, and other information.
The Funds’ Statement of Additional Information contains additional information about the Funds’ trustees and is available without charge upon request by calling 1-800-799-2113.
The Olstein Funds
4 Manhattanville Road
Purchase, New York 10577
(b) Not applicable.
Item 2. Code of Ethics.
The Registrant has adopted a code of ethics that applies to the Registrant’s principal executive officer and principal financial officer. The Registrant has not made any amendments to its code of ethics during the period covered by this report. The Registrant has not granted any waivers from any provisions of the code of ethics during the period covered by this report.
A copy of the Registrant’s Code of Ethics that applies to the Registrant’s principal executive officer and principal financial officer is filed herewith.
Item 3. Audit Committee Financial Expert.
The Registrant’s board of trustees has determined that there is at least one audit committee financial expert serving on its audit committee. Leonard M. Rush is the “audit committee financial expert” and is considered to be “independent” as each term is defined in Item 3 of Form N‑CSR.
Item 4. Principal Accountant Fees and Services.
The Registrant has engaged its principal accountant to perform audit services, audit-related services, tax services and other services during the past two fiscal years. “Audit services” refer to performing an audit of the Registrant's annual financial statements or services that are normally provided by the accountant in connection with statutory and regulatory filings or engagements for those fiscal years. “Audit-related services” refer to the assurance and related services by the principal accountant that are reasonably related to the performance of the audit. “Tax services” refer to professional services rendered by the principal accountant for tax compliance, tax advice, and tax planning; including reviewing the Fund’s tax returns and distributions calculations. There were no “other services” provided by the principal accountant. For the fiscal years ended June 30, 2021 and June 30, 2020, the Fund’s principal accountant was Cohen & Company, Ltd. The following table details the aggregate fees billed or expected to be billed for each of the last two fiscal years for audit fees, audit-related fees, tax fees and other fees by the principal accountant.
| | FYE 6/30/2021 | FYE 6/30/2020 |
(a) Audit Fees | $31,000 | $30,000 |
(b) Audit-Related Fees | $0 | $0 |
(c) Tax Fees | $10,000 | $6,000 |
(d) All Other Fees | $- | $- |
(e) (1) The audit committee has adopted pre-approval policies and procedures that require the audit committee to pre‑approve all audit and non‑audit services of the Registrant, including services provided to any entity affiliated with the Registrant.
(e) (2) The percentage of fees billed by Cohen & Company, Ltd applicable to non-audit services pursuant to waiver of pre-approval requirement were as follows:
| | FYE 6/30/2021 | FYE 6/30/2020 |
Audit-Related Fees | 0% | 0% |
Tax Fees | 0% | 0% |
All Other Fees | 0% | 0% |
(f) All of the principal accountant’s hours spent on auditing the Registrant’s financial statements were attributed to work performed by full‑time permanent employees of the principal accountant.
(g) The following table indicates the non-audit fees billed or expected to be billed by the Registrant’s accountant for services to the Registrant and to the Registrant’s investment adviser (and any other controlling entity, etc.—not sub-adviser) for the last two years.
Non-Audit Related Fees | FYE 6/30/2021 | FYE 6/30/2020 |
Registrant | N/A | N/A |
Registrant’s Investment Adviser | N/A | N/A |
(h) The audit committee of the board of trustees/directors has considered whether the provision of non-audit services that were rendered to the Registrant's investment adviser is compatible with maintaining the principal accountant's independence and has concluded that the provision of such non-audit services by the accountant has not compromised the accountant’s independence.
(i) Not applicable.
(j) Not applicable.
Item 5. Audit Committee of Listed Registrants.
Not applicable to Registrants who are not listed issuers (as defined in Rule 10A-3 under the Securities Exchange Act of 1934).
Item 6. Schedule of Investments.
| (a) | Schedule of Investments is included as part of the report to shareholders filed under Item 1 of this Form. |
Item 7. Disclosure of Proxy Voting Policies and Procedures for Closed-End Management Investment Companies.
Not applicable to open-end investment companies.
Item 8. Portfolio Managers of Closed-End Management Investment Companies.
Not applicable to open-end investment companies.
Item 9. Purchases of Equity Securities by Closed‑End Management Investment Company and Affiliated Purchasers.
Not applicable to open-end investment companies.
Item 10. Submission of Matters to a Vote of Security Holders.
There have been no material changes to the procedures by which shareholders may recommend nominees to the Registrant’s board of trustees.
Item 11. Controls and Procedures.
(a) | The Registrant’s President and Treasurer have reviewed the Registrant's disclosure controls and procedures (as defined in Rule 30a-3(c) under the Investment Company Act of 1940 (the “Act”)) as of a date within 90 days of the filing of this report, as required by Rule 30a-3(b) under the Act and Rules 13a-15(b) or 15d‑15(b) under the Securities Exchange Act of 1934. Based on their review, such officers have concluded that the disclosure controls and procedures are effective in ensuring that information required to be disclosed in this report is appropriately recorded, processed, summarized and reported and made known to them by others within the Registrant and by the Registrant’s service provider. |
(b) | There were no significant changes in the Registrant's internal control over financial reporting (as defined in Rule 30a-3(d) under the Act) that occurred during the period covered by this report that has materially affected, or is reasonably likely to materially affect, the Registrant's internal control over financial reporting. |
Item 12. Disclosures of Securities Lending Activities for Closed-End Management Investment Companies.
Not applicable to open-end investment companies.
Item 13. Exhibits.
(3) Any written solicitation to purchase securities under Rule 23c‑1 under the Act sent or given during the period covered by the report by or on behalf of the Registrant to 10 or more persons. Not applicable to open-end investment companies.
(4) Change in the Registrant’s independent public accountant. There was no change in the Registrant’s independent public accountant for the period covered by this report.
SIGNATURES
Pursuant to the requirements of the Securities Exchange Act of 1934 and the Investment Company Act of 1940, the Registrant has duly caused this report to be signed on its behalf by the undersigned, thereunto duly authorized.
(Registrant) Managed Portfolio Series
By (Signature and Title) /s/Brian R. Wiedmeyer
Brian R. Wiedmeyer, President
Date September 7, 2021
Pursuant to the requirements of the Securities Exchange Act of 1934 and the Investment Company Act of 1940, this report has been signed below by the following persons on behalf of the Registrant and in the capacities and on the dates indicated.
By (Signature and Title) /s/Brian R. Wiedmeyer
Brian R. Wiedmeyer, President
Date September 7, 2021
By (Signature and Title) /s/Benjamin J. Eirich
Benjamin J. Eirich, Treasurer
Date September 7, 2021