Use these links to rapidly review the document
TABLE OF CONTENTS
PART IV
UNIVERSAL AMERICAN CORP. AND SUBSIDIARIES INDEX TO CONSOLIDATED FINANCIAL STATEMENTS
UNITED STATES
SECURITIES AND EXCHANGE COMMISSION
Washington, D.C. 20549
FORM 10-K
| (Mark One) | ||
ý | ANNUAL REPORT PURSUANT TO SECTION 13 OR 15(d) OF THE SECURITIES EXCHANGE ACT OF 1934 | |
For the fiscal year ended December 31, 2014 | ||
OR | ||
o | TRANSITION REPORT PURSUANT TO SECTION 13 OR 15(d) OF THE SECURITIES EXCHANGE ACT OF 1934 | |
For the transition period from to | ||
Commission file Number: 001-35149
UNIVERSAL AMERICAN CORP.
(Exact name of registrant as specified in its charter)
| Delaware (State or other jurisdiction of incorporation or organization) | 27-4683816 (I.R.S. Employer Identification No.) |
44 South Broadway, Suite 1200, White Plains, New York 10601
(Address of principal executive offices and zip code)
(914) 934-5200
(Registrant's telephone number, including area code)
Securities registered pursuant to Section 12(b) of the Act:
| Title of Each Class | Name of Each Exchange On Which Registered | |
|---|---|---|
| Common Stock, par value $.01 per share | New York Stock Exchange, Inc. |
Securities registered pursuant to Section 12(g) of the Act:None
Indicate by check mark if the registrant is a well-known seasoned issuer, as defined in Rule 405 of the Securities Act. Yes o No ý
Indicate by check mark if the registrant is not required to file reports pursuant to Section 13 or 15(d) of the Act. Yes o No ý
Indicate by check mark whether the registrant (1) has filed all reports required to be filed by Section 13 or 15 (d) of the Securities Exchange Act of 1934 during the preceding 12 months (or for such shorter period that the registrant was required to file such reports), and (2) has been subject to such filing requirements for the past 90 days. Yes ý No o
Indicate by check mark whether the registrant has submitted electronically and posted on its corporate Web site, if any, every Interactive Data File required to be submitted and posted pursuant to Rule 405 of Regulation S-T during the preceding 12 months (or for such shorter period that the registrant was required to submit and post such files). Yes ý No o
Indicate by check mark if disclosure of delinquent filers pursuant to Item 405 of Regulation S-K is not contained herein, and will not be contained, to the best of registrant's knowledge, in definitive proxy or information statements incorporated by reference in Part III of this Form 10-K or any amendment to this Form 10-K. o
Indicate by check mark whether the registrant is a large accelerated filer, an accelerated filer, a non-accelerated filer, or a smaller reporting company. See definitions of "large accelerated filer," "accelerated filer," and "smaller reporting company" in Rule 12b-2 of the Exchange Act. (Check one):
| Large accelerated filer o | Accelerated filer ý | Non-accelerated filer o (Do not check if a smaller reporting company) | Smaller reporting company o |
Indicate by check mark whether the registrant is a shell company (as defined in Rule 12b-2 of the Exchange Act). Yes o No ý
The aggregate market value of the registrant's voting and non-voting common stock held by non-affiliates of the registrant on June 30, 2014, the last business day of the registrant's most recently completed second fiscal quarter, was approximately $367 million (based on the closing sales price of the registrant's common stock on that date). As of March 20, 2015, 80,812,734 shares of the registrant's voting common stock and 3,300,000 shares of the registrant's non-voting common stock were issued and outstanding.
DOCUMENTS INCORPORATED BY REFERENCE
The information contained in Part III, Items 10-14 of this Annual Report on Form 10-K will be included in the Company's definitive Proxy Statement for the 2014 Annual Meeting of Stockholders to be filed with the U.S. Securities and Exchange Commission.
| | Item | Description | Page | |||||
|---|---|---|---|---|---|---|---|---|
PART 1 | 1 | Business | 4 | |||||
| 1A | Risk Factors | 22 | ||||||
| 1B | Unresolved Staff Comments | 58 | ||||||
| 2 | Properties | 58 | ||||||
| 3 | Legal Proceedings | 58 | ||||||
| 4 | Mine Safety Disclosures | 58 | ||||||
PART II | 5 | Market for Registrant's Common Equity, Related Stockholder Matters and Issuer Purchases of Equity Securities | 59 | |||||
| 6 | Selected Financial Data | 60 | ||||||
| 7 | Management's Discussion and Analysis of Financial Condition and Results of Operations | 62 | ||||||
| 7A | Quantitative and Qualitative Disclosures about Market Risk | 108 | ||||||
| 8 | Financial Statements and Supplementary Data | 110 | ||||||
| 9 | Changes in and Disagreements with Accountants on Accounting and Financial Disclosure | 110 | ||||||
| 9A | Controls and Procedures | 110 | ||||||
| 9B | Other Information | 111 | ||||||
PART III | 10 | Directors, Executive Officers and Corporate Governance | 112 | |||||
| 11 | Executive Compensation | 112 | ||||||
| 12 | Security Ownership of Certain Beneficial Owners and Management and Related Stockholder Matters | 112 | ||||||
| 13 | Certain Relationships and Related Transactions, and Director Independence | 112 | ||||||
| 14 | Principal Accountant Fees and Services | 112 | ||||||
PART IV | 15 | Exhibits and Financial Statement Schedules | 113 | |||||
Signatures | 117 | |||||||
2
As used in this Annual Report on Form 10-K, except as otherwise indicated, references to the "Company," "Universal American," "we," "our," and "us" are to Universal American Corp., a Delaware corporation, and its subsidiaries.
DISCLOSURE REGARDING FORWARD LOOKING STATEMENTS
This report, including, without limitation, the information set forth or incorporated by reference in Item 1 "Business," Item 1A "Risk Factors" and Item 7 "Management's Discussion and Analysis of Financial Condition and Results of Operations," and other risks and uncertainties set forth in this report and oral statements made from time to time by our executive officers contains "forward-looking" statements within the meaning of Section 21E of the Securities Exchange Act of 1934, as amended, and the Private Securities Litigation Reform Act of 1995, known as the PSLRA. Statements in this report that are not historical facts are hereby identified as forward-looking statements and are intended to be covered by the safe harbor provisions of the PSLRA. They can be identified by the use of the words "believe," "expect," "predict," "project," "potential," "estimate," "anticipate," "should," "intend," "may," "will" and similar expressions or variations of such words, or by discussion of future financial results and events, strategy or risks and uncertainties, trends and conditions in the Company's business and competitive strengths, all of which involve risks and uncertainties.
Where, in any forward-looking statement, we or our management expresses an expectation or belief as to future results or actions, there can be no assurance that the statement of expectation or belief will result or be achieved or accomplished. Our actual results may differ materially from our expectations, plans or projections. We warn you that forward-looking statements are only predictions and estimates, which are inherently subject to risks, trends and uncertainties, many of which are beyond our ability to control or predict with accuracy and some of which we might not even anticipate. We give no assurance that we will achieve our expectations and we do not assume responsibility for the accuracy and completeness of the forward-looking statements. Future events and actual results, financial and otherwise, may differ materially from the results discussed in the forward-looking statements as a result of many factors, including the risk factors described or incorporated by reference in Part I, Item 1A of this report. We caution readers not to place undue reliance on these forward-looking statements that speak only as of the date made.
We undertake no obligation, other than as may be required under the federal securities laws, to publicly update or revise any forward-looking statements, whether as a result of new information, future events or otherwise. Although we believe that the expectations reflected in these forward-looking statements are reasonable at the time made, any or all of the forward-looking statements contained in this report and in any other public statements that are made may prove to be incorrect. This may occur as a result of inaccurate assumptions as a consequence of known or unknown risks and uncertainties. All of the forward- looking statements are qualified in their entirety by reference to the factors discussed or incorporated by reference under the caption "Risk Factors" under Part I, Item 1A of this report. We caution that these risk factors may not be exhaustive. We operate in a continually changing business environment that is highly complicated, regulated and competitive and new risk factors emerge from time to time. We cannot predict these new risk factors, nor can we assess the impact, if any, of the new risk factors on our business or the extent to which any factor or combination of factors may cause actual results to differ materially from those expressed or implied by any forward-looking statement. In light of these risks, uncertainties and assumptions, the forward-looking statements discussed in this report might not occur. You should carefully read this report and the documents that we incorporate by reference in this report in its entirety. It contains information that you should consider in making any investment decision in any of our securities.
3
BUSINESS
Universal American, through our family of healthcare companies, provides health benefits to people covered by Medicare and/or Medicaid. Our core strength is our ability to partner with providers, especially primary care physicians, to improve health outcomes while reducing cost in the Medicare population. We currently are focused on three main businesses:
- •
- Medicare Advantage: We serve the growing Medicare population by providing Medicare Advantage products to approximately 105,000 members as of January 1, 2015. Approximately 31% of the Medicare population in the United States is currently enrolled in Medicare Advantage plans; a type of Medicare health plan offered by private companies that contract with the federal government to provide enrollees with health insurance. Our current focus is to grow our Medicare Advantage business in Texas (especially Houston/Beaumont), upstate New York (especially the Syracuse area) and Maine, regions in which we have meaningful market positions.
- •
- Medicare Accountable Care Organizations: We believe there is an opportunity to address the high cost of health care for the majority of the Medicare population enrolled in traditional fee-for-service Medicare and have joined with primary-care and multi-specialty provider groups to operate twenty-four Accountable Care Organizations, or ACOs, pursuant to the Medicare Shared Saving Program, known as the MSSP.
- •
- Medicaid. We also provide services to Medicaid agencies and health plans through APS Healthcare and through our Total Care Medicaid health plan serving approximately 40,000 members in upstate New York.
Healthy Collaboration® Strategy
We have developed a successful primary care physician alignment strategy that we have branded as The Healthy Collaboration®. We work in collaboration with healthcare providers, especially primary care physicians, to help them assume and manage risk, in order to achieve measurably better quality and lower cost. Below are the key elements of the strategy:
- •
- We align incentives through gain sharing arrangements so that providers are incented to assist members to achieve healthy outcomes.
- •
- We provide actionable data and analytics to providers and employ enabling technology to ensure that the right care is delivered at the right time in the right setting.
- •
- We engage the people we serve to help them make informed choices about their healthcare.
Our Operating Segments
We manage and report our business as follows:
- •
- Medicare Advantage segment includes our Medicare Advantage businesses.
- •
- Management Services Organization, or MSO, segment supports our physician partnerships in the development of value-based healthcare models, such as ACOs, with a variety of capabilities and resources including technology, analytics, clinical care coordination, regulatory compliance and program administration.
- •
- Medicaid segment reflects the operations of our Total Care Medicaid health plan in upstate New York currently serving approximately 40,000 members in Syracuse and surrounding areas.
- •
- Traditional Insurance segment reflects our closed block of insurance products not offered through government programs, which includes Medicare supplement, long-term care, other
4
- •
- Corporate & Other segment reflects the activities of our holding company and the operations of APS Healthcare since its acquisition on March 2, 2012.
senior health insurance, specialty health insurance and life insurance. This business is currently in run-out as we discontinued marketing and selling Traditional insurance products after June 1, 2012.
As a result of the growth of our ACOs and Total Care, we have modified the way we manage and report our business. Our Medicare Advantage and Traditional Insurance segments remain unchanged; however, we have split our ACO and Total Care businesses from the Corporate & Other segment to form two new segments—MSO and Medicaid, respectively. We will continue to report the activities of our holding company, the operations of APS Healthcare, and other ancillary operations in our Corporate & Other segment.
Segment Business in Force
The following table sets forth our direct, acquired and assumed annualized premium in force, including only the portion of premiums on interest-sensitive products that is applied to the cost of insurance and related membership counts:
| | Gross Annualized Premium In Force | ||||||||||||||||||
|---|---|---|---|---|---|---|---|---|---|---|---|---|---|---|---|---|---|---|---|
| | December 31, 2014 | December 31, 2013(1) | |||||||||||||||||
| | $ | % | Members | $ | % | Members | |||||||||||||
| | (Dollars in millions, Members in thousands) | ||||||||||||||||||
Medicare Advantage(2) | |||||||||||||||||||
Southwest HMO | $ | 766.9 | 44.3 | % | 61.8 | $ | 698.2 | 39.2 | % | 54.6 | |||||||||
Other Core Networks | 334.4 | 19.3 | % | 29.7 | 377.7 | 21.3 | % | 31.5 | |||||||||||
| | | | | | | | | | | | | | | | | | | | |
Core Markets | 1,101.3 | 63.6 | % | 91.5 | 1,075.9 | 60.5 | % | 86.1 | |||||||||||
Non-Core Network | 167.1 | 9.6 | % | 20.7 | 218.1 | 12.3 | % | 24.8 | |||||||||||
Rural | 22.0 | 1.3 | % | 1.9 | 32.5 | 1.8 | % | 2.9 | |||||||||||
| | | | | | | | | | | | | | | | | | | | |
Sub total | 1,290.4 | 74.5 | % | 114.1 | 1,326.5 | 74.6 | % | 113.8 | |||||||||||
| | | | | | | | | | | | | | | | | | | | |
Medicaid | 178.3 | 10.3 | % | 40.0 | 153.3 | 8.6 | % | 35.2 | |||||||||||
Traditional Insurance | |||||||||||||||||||
Medicare Supplement and Other Senior Health | 166.4 | 9.6 | % | 58.9 | 193.6 | 10.9 | % | 70.6 | |||||||||||
Accident & Sickness and Other | 25.7 | 1.5 | % | 81.6 | 28.9 | 1.6 | % | 91.0 | |||||||||||
Long Term Care | 23.2 | 1.3 | % | 11.5 | 23.8 | 1.3 | % | 12.6 | |||||||||||
| | | | | | | | | | | | | | | | | | | | |
Sub total | 215.3 | 12.4 | % | 152.0 | 246.3 | 13.8 | % | 174.2 | |||||||||||
| | | | | | | | | | | | | | | | | | | | |
Life Insurance and Annuity | 48.8 | 2.8 | % | 105.2 | 53.3 | 3.0 | % | 114.9 | |||||||||||
| | | | | | | | | | | | | | | | | | | | |
Total | $ | 1,732.8 | 100.0 | % | 411.3 | $ | 1,779.4 | 100.0 | % | 438.1 | |||||||||
| | | | | | | | | | | | | | | | | | | | |
| | | | | | | | | | | | | | | | | | | | |
| | | | | | | | | | | | | | | | | | | | |
- (1)
- Excludes 13,200 members in areas subject to 2014 Service Area Reductions. This includes 10,700 rural members whose plans were not renewed for 2014.
- (2)
- These plans are pursuant to contracts with the Centers for Medicare & Medicaid Services, known as CMS.
Medicare Advantage
We believe that attractive growth opportunities exist in providing health insurance to the growing senior market. At present, approximately 53 million Americans are eligible for Medicare, the Federal
5
program that offers basic hospital and medical insurance to people over 65 years old and some disabled people under the age of 65. According to the U.S. Census Bureau, more than two million Americans turn 65 in the United States each year, and this number is expected to grow as the so-called baby boomers continue to turn 65. In addition, many large employers that traditionally provided medical and prescription drug coverage to their retirees have begun to curtail these benefits. Medicare Advantage continues to grow its share of the overall Medicare market and we believe is likely to continue to gain positive acceptance with consumers.
In 2014, we made a strategic decision to offer Medicare Advantage plans only in markets where we can positively impact the cost and quality of healthcare through collaboration with providers. Accordingly, we reduced our footprint for 2015 and now offer plans in only three states (Texas, New York and Maine). In the Houston/Beaumont region, we currently maintain the leading market position with strong brand awareness and committed and aligned physician groups. In upstate New York, we are in the process of converting this historically fee-for-service market into a more value-based system by introducing pay for performance to the primary care physicians in the region. We now have a complementary collection of businesses centered in upstate NY where we serve nearly 35,000 Medicare Advantage members, 17,000 Medicare fee-for-service beneficiaries through our ACO, and 40,000 Medicaid lives through our Total Care plan. With these 3 programs, we are now the largest sponsor of government programs in central New York.
Approximately 86% of our 2015 membership is in plans that received a 4-Star Medicare quality rating. The Company earned a 4-Star rating for its flagship TexanPlus® plan in Houston/Beaumont and for its largest plan in New York and Maine, Today's Options Network PFFS plan. A summary of these ratings is presented below:
Contract | Plan Name | Location | Members (000's) | 2015 Star Rating | |||||||
|---|---|---|---|---|---|---|---|---|---|---|---|
H4506 | Texan Plus HMO | Southeast Texas—Houston/Beaumont | 63.0 | 4.0 | |||||||
H2816 | Today's Options Network PFFS | Northeast—New York & Maine | 26.7 | 4.0 | |||||||
H2775 | Today's Options PPO | Northeast—New York & Maine | 10.9 | 3.5 | |||||||
H5656 | Texan Plus HMO | North Texas—Dallas | 4.0 | 3.0 | |||||||
| | | | | | | | | | | | |
| 104.6 | |||||||||||
| | | | | | | | | | | | |
| | | | | | | | | | | | |
| | | | | | | | | | | | |
Plans that achieve a 4-Star rating or better are entitled to additional bonus payments and higher rebate percentages from CMS which enables the plans to enhance their product offering to members through reduced premiums and/or additional benefits.
Medicare Advantage—Texas: Universal American's largest Medicare Advantage market is Texas, primarily the Houston/Beaumont region and North Texas. We market our products using the TexanPlus® brand.
- •
- Our HMO plans are offered under contracts with CMS and provide all basic Medicare covered benefits with reduced member cost-sharing as well as additional supplemental benefits, including a defined prescription drug benefit. We built this coordinated care product around contracted networks of providers who, in cooperation with the health plan, coordinate an active care management program. In addition to a monthly payment per member from CMS, the plan may collect a monthly premium from its members for specified products.
- •
- In connection with the HMOs, we operate separate Medicare Advantage Management Service Organizations that manage that business and affiliated Independent Physician Associations or IPAs. We participate in the net results derived from these affiliated IPAs.
6
Medicare Advantage—Northeast: Universal American's second largest market is upstate New York, primarily the ten counties that are considered part of the Syracuse market. Universal American markets its Medicare Advantage products using the Todays Options® brand. Enrollment in this market is generally supported by independent agents.
The products provided in our Northeast market include PPO and Network PFFS plans.
- •
- Our PPO plans are provided under the brand "Today's Options® PPO." They are offered under contracts with CMS and provide all basic Medicare covered benefits with reduced member cost-sharing as well as additional supplemental benefits, including a defined prescription drug benefit. This coordinated care product is built around contracted networks of providers who, in cooperation with the health plan, coordinate an active care management program. In addition to a monthly payment per member from CMS, the plan may collect a monthly premium from its members for specified products.
- •
- Our Network PFFS plans, which are provided under the brand "Today's Options®" are offered under contracts with CMS and provide enhanced health care benefits compared to traditional Medicare, subject to cost sharing and other limitations. Even though these plans allow the members more flexibility in the delivery of their health care services than other Medicare Advantage plans, we actively coordinate care for these members in a similar manner to our PPO and HMO plans. Some of these products include a defined prescription drug benefit. In addition to a fixed monthly payment per member from CMS, individuals in these plans may be required to pay a monthly premium in selected counties or for selected enhanced products.
The chart below details our current Medicare Advantage membership:
| | January 31, 2015 | December 31, 2014 | Change | |||||||
|---|---|---|---|---|---|---|---|---|---|---|
| | (in thousands) | | ||||||||
Membership | ||||||||||
Houston / Beaumont | 63.0 | 57.2 | 10 | % | ||||||
Dallas | 4.0 | 4.6 | –13 | % | ||||||
| | | | | | | | | | | |
Southwest HMO | 67.0 | 61.8 | 8 | % | ||||||
Northeast | 37.6 | 29.7 | 27 | % | ||||||
| | | | | | | | | | | |
Medicare Advantage | 104.6 | 91.5 | 14 | % | ||||||
| | | | | | | | | | | |
| | | | | | | | | | | |
| | | | | | | | | | | |
MSSP—Accountable Care Organizations
The Patient Protection and Affordable Care Act and The Healthcare and Education Reconciliation Act of 2010, which we collectively refer to as the ACA established Medicare Shared Savings ACOs as a tool to improve quality and lower costs through increased care coordination in the Medicare Fee-for-Service, or FFS, program, which covers the majority of Medicare recipients. CMS established the MSSP to facilitate coordination and cooperation among providers to improve the quality of care for FFS beneficiaries and reduce unnecessary costs. Eligible providers, hospitals, and suppliers may participate in the MSSP by creating or participating in an ACO.
The MSSP is designed to improve beneficiary outcomes and increase value of care by:
- •
- promoting accountability for the care of Medicare FFS beneficiaries;
- •
- requiring coordinated care for all services provided under Medicare FFS; and
- •
- encouraging investment in infrastructure and redesigned care processes.
7
The MSSP will reward ACOs that lower their health care costs while surpassing a minimum savings rate and meeting quality of care performance standards. Cost savings below the benchmark provided by CMS will be shared at least 50% with the ACOs. The minimum savings rate set by CMS varies depending on the number of patients assigned to the ACO, starting at 3.9% for ACOs with patients totaling 5,000 and grading to 2.0% for ACOs with patients totaling 10,000 or more.
At January 1, 2015, Universal American sponsors 24 ACOs in ten States, which include 3,800 participating providers and approximately 285,000 Medicare FFS beneficiaries covering more than $3 billion of medical spend. Certain of our ACOs overlap a portion of our Medicare Advantage footprint (Houston, Dallas and Syracuse) which capitalizes on our existing relationship with providers. The other ACOs have no overlap with existing operations, offering an opportunity for expansion into other products and services. We provide these ACOs with care coordination, analytics and reporting, technology and other administrative capabilities to enable participating providers to deliver better care and lower healthcare costs for their Medicare FFS beneficiaries. We employ local market staff (operations and clinical) to drive physician and their staff engagement and care coordination improvements. During 2014, we reduced the number of our active ACOs based on a variety of factors, including the level of engagement by the physicians in the ACO and the likelihood of the ACO achieving shared savings. We may make further reductions in 2015.
Medicaid Program
Established in 1965, Medicaid is the largest publicly funded program in the United States, and provides health insurance to low-income families and individuals with disabilities. Authorized by Title XIX of the Social Security Act, Medicaid is an entitlement program funded jointly by the federal and state governments and administered by the states. The majority of funding is provided at the federal level. Each state establishes its own eligibility standards, benefit packages, payment rates and program administration within federal standards. Eligibility is based on a combination of household income and assets, often determined by an income level relative to the federal poverty level. Historically, children have represented the largest eligibility group. Our APS Healthcare segment provides a variety of healthcare services to Medicaid members in numerous states.
Due to the Medicaid expansion provisions under the Affordable Care Act, CMS projects that Medicaid expenditures will increase from approximately $505 billion in 2014 to approximately $860 billion by 2022. In addition, as part of the Affordable Care Act, approximately 70 million people are expected to qualify for Medicaid in 2015.
A portion of Medicaid members are dual eligibles, low-income seniors and people with disabilities who are enrolled in both Medicaid and Medicare. Based on CMS, industry analyst and Kaiser Family Foundation data, we estimate there are approximately 10 million dual eligible enrollees with annual spending of approximately $400 billion. Only a small portion of the total spending on dual eligibles is administered by managed care organizations. Dual eligibles tend to consume more healthcare services due to their tendency to have more chronic health issues.
Total Care NY Medicaid Plan—On December 1, 2013, we acquired the Total Care Medicaid health plan. Total Care provides Medicaid managed care services to approximately 40,000 members in three counties in upstate New York that overlap with our existing Medicare Advantage footprint. Roughly 80% of its members are located in Onondaga County. In addition to the Medicaid program, Total Care also participates in the Child Health Plus program for low-income, uninsured children.
Traditional Insurance
Our Traditional Insurance segment reflects the results of Medicare supplement and other senior health products, specialty health insurance products, primarily fixed benefit accident and sickness insurance and senior life insurance business, as well as long-term care, disability, major medical,
8
universal life and fixed annuities. These are closed blocks of business as we discontinued marketing and selling Traditional insurance products after June 1, 2012.
We reinsure substantially all of our net in force life and annuity business. All of our primary reinsurers were rated "A–" (Excellent) or better by A.M. Best with the exception of one reinsurer. For that reinsurer, which is rated B++, a trust containing assets at 106% of reserves is maintained.
Healthcare Reform
The ACA was signed into law in March 2010 and legislates broad-based changes to the U.S. health care system. Due to the complexity of the health reform legislation, including yet to be promulgated implementing regulations, lack of interpretive guidance, and gradual implementation, the impact of the health reform legislation remains difficult to predict and quantify. In addition, we believe that any impact from the health reform legislation could potentially be mitigated by certain actions we may take in the future including modifying future Medicare Advantage bids to compensate for such changes. For example, the anticipation of additional revenues from Star bonuses or reduced CMS reimbursement rates are factored into the anticipated level of benefits included in our Medicare Advantage bids for the upcoming year.
The provisions of these new laws include the following key points, which are discussed further below:
- •
- reduced Medicare Advantage reimbursement rates, beginning in 2012;
- •
- implementation of a quality bonus for Star ratings, beginning in 2012;
- •
- accountable care organizations, beginning in 2012;
- •
- limitation on the federal tax deductibility of compensation earned by individuals for certain types of companies, beginning in 2013;
- •
- stipulated minimum medical loss ratios, beginning in 2014;
- •
- non-deductible health insurance industry fee, beginning in 2014; and
- •
- coding intensity adjustments, with mandatory minimums, beginning in 2014.
For further discussion, please see "Healthcare Reform" under Item 7—Management's Discussion and Analysis of Financial Condition and Results of Operations in this report.
Competition
The health insurance industry is highly competitive. We compete with numerous other health insurance companies and managed care organizations on a national, regional and local market basis, including United Healthcare, Humana, Anthem, including various "Blues" plans, Aetna and Cigna as well as other health maintenance organizations, preferred provider organizations, and other health care-related companies which provide a variety of services in the Medicare, Medicaid and commercial markets both on a capitated and fee for service basis. Most of our competitors have larger memberships and/or greater financial resources.
9
In addition, we compete with other managed care organizations for government healthcare program contracts, renewals of those government contracts, members and providers. In the Medicare managed care market, our primary competitors for contracts, members and providers are national and regional managed care organizations that serve Medicare recipients or provider-sponsored organizations, including the managed care companies listed above. We also compete with hospitals, sophisticated provider groups, payors, and management service organizations in the creation, administration, and management of ACOs. In the Medicaid market, our primary competitors are national, regional and local managed care organizations and other entities that provide disease management, medical management or behavioral health services.
Our ability to sell our products and to retain customers may be influenced by such factors as those described in the section entitled "Risk Factors" in this report.
Marketing and Distribution
We distribute our Medicare Advantage products through multiple channels including our career agency, independent agents, as well as through telephonic and Internet enrollment.
Geographical Distribution of Business
Through our insurance subsidiaries, we are licensed to market our Medicare and insurance products in all 50 states and the District of Columbia.
The following table shows the geographical distribution of the direct cash premium collected for our Medicare Advantage, Total Care and Traditional Insurance business (in thousands), as reported on a statutory basis to the regulatory authorities for the years ended December 31, 2014 and 2013:
| | 2014 | 2013 | |||||||||||||||||||||||||||||
|---|---|---|---|---|---|---|---|---|---|---|---|---|---|---|---|---|---|---|---|---|---|---|---|---|---|---|---|---|---|---|---|
State/Region | Medicare Advantage | Medicaid | Traditional | Total | % of Premium | Medicare Advantage | Medicaid | Traditional | Total | % of Premium | |||||||||||||||||||||
Texas | $ | 800,820 | $ | — | $ | 16,568 | $ | 817,388 | 47.1 | % | $ | 751,482 | $ | — | $ | 18,568 | $ | 770,050 | 41.3 | % | |||||||||||
New York | 293,105 | 178,417 | 18,771 | 490,293 | 27.2 | % | 328,236 | 12,787 | 21,606 | 362,629 | 19.4 | % | |||||||||||||||||||
Pennsylvania | 55,531 | — | 13,005 | 68,536 | 4.0 | % | 66,311 | — | 14,885 | 81,196 | 4.4 | % | |||||||||||||||||||
Indiana | 39,342 | — | 8,088 | 47,430 | 2.7 | % | 68,742 | — | 9,334 | 78,076 | 4.2 | % | |||||||||||||||||||
Virginia | 34,677 | — | 11,811 | 46,488 | 2.7 | % | 66,136 | — | 13,191 | 79,327 | 4.3 | % | |||||||||||||||||||
| | | | | | | | | | | | | | | | | | | | | | | | | | | | | | | | |
Subtotal | 1,223,475 | 178,417 | 68,243 | 1,470,135 | 83.7 | % | 1,280,907 | 12,787 | 77,584 | 1,371,278 | 73.6 | % | |||||||||||||||||||
All other | 142,497 | — | 139,607 | 282,104 | 16.3 | % | 332,314 | — | 162,656 | 494,970 | 26.4 | % | |||||||||||||||||||
| | | | | | | | | | | | | | | | | | | | | | | | | | | | | | | | |
Total | $ | 1,365,972 | $ | 178,417 | $ | 207,850 | $ | 1,752,239 | 100.0 | % | $ | 1,613,221 | $ | 12,787 | $ | 240,240 | $ | 1,866,248 | 100.0 | % | |||||||||||
| | | | | | | | | | | | | | | | | | | | | | | | | | | | | | | | |
| | | | | | | | | | | | | | | | | | | | | | | | | | | | | | | | |
| | | | | | | | | | | | | | | | | | | | | | | | | | | | | | | | |
Provider Arrangements. Our network providers deliver health care services to members enrolled in our Medicare Advantage coordinated care plans and Medicaid plans to which we provide services through a network of contracted providers, including physicians, behavioral health providers and other clinical providers, hospitals, a variety of outpatient facilities and the full range of ancillary provider services. The major ancillary services and facilities include:
- •
- ambulance services;
- •
- medical equipment services;
- •
- home health agencies;
- •
- home infusion providers;
- •
- mental health and substance abuse providers;
- •
- rehabilitation facilities;
10
- •
- skilled nursing facilities;
- •
- optical services; and
- •
- pharmacies.
We use a wide range of systems and processes to organize and deliver needed health care services to our members. The key steps in this process are:
- •
- the careful selection of primary care physicians to provide overall care management and care coordination of members;
- •
- development of a comprehensive panel of specialists usually selected by the primary care physicians;
- •
- contracting for the balance of needed services based on the preference and experience of the local physicians; and
- •
- arranging for the full range of medical management systems required to support the primary care and specialist physicians.
We employ health evaluation and assessment tools, quality improvement, care management and credentialing programs to ensure that we meet target goals relating to the provision of quality patient care by our providers. The major medical management systems are:
- •
- an inpatient hospitalist program at contracted hospitals;
- •
- selected authorization of target services;
- •
- referral management;
- •
- case management;
- •
- transition of care management;
- •
- in-home interventions;
- •
- focused chronic illness management;
- •
- transplant coordinator services; and
- •
- outpatient prescription drug management.
Investments
Our investment policy is to attempt to balance our portfolio duration to achieve investment returns consistent with the preservation of capital and maintenance of liquidity adequate to meet payment obligations of policy benefits and claims. We invest in assets permitted under the insurance laws of the various states in which we operate. These laws generally prescribe the nature, quality of and limitations on various types of investments that we may make. In addition, we establish our own internal policies, guidelines and constraints to provide additional granularity and conservatism to our investment process. Such guidelines are reviewed at least annually by our Chief Financial Officer and approved by the Investment Committee of the Board of Directors.
Reserves
We establish, and carry as liabilities in our financial statements prepared in accordance with generally accepted accounting principles, known as GAAP, and statutory accounting practices, actuarially determined reserves in accordance with applicable insurance regulations. For further
11
discussion, see Critical Accounting Policies in our Management's Discussion and Analysis of Financial Condition and Results of Operations elsewhere in this Annual Report on Form 10-K.
We calculate reserves together with premiums to be received on outstanding policies and contracts and interest at assumed rates on these amounts, which we believe to be sufficient to satisfy policy and contract obligations. Reserves for life insurance policies are determined using actuarial factors based on mortality tables and interest rates. Reserves for accident and health insurance policies (excluding Medicare Advantage and Medicaid policies) use prescribed morbidity tables based on our historical experience. For Medicare Advantage and Total Care policies, claims reserves are estimated using standard actuarial development methodologies. Under such methods, we take into consideration the historical lag between incurred date of claim and payment date of claim, membership changes, expected medical cost trend, changes in pending claims, amount of claims receipts, claims seasonality, changes in average risk profile, changes in laws, rules, regulations (including CMS coverage guidelines, where applicable) and benefit plan changes. We also maintain reserves for unearned premiums, for premium deposits, for claims that have been reported and are in the process of being paid or contested and for our estimate of claims that have been incurred but have not yet been reported.
We calculate the reserves reflected in our consolidated financial statements in accordance with GAAP. We determine these reserves based on our best estimates of mortality and morbidity, persistency, expenses and investment income. We use the net level premium method for all non-interest-sensitive products and the retrospective deposit method for interest-sensitive products. GAAP reserves differ from statutory reserves due to the use of different assumptions regarding mortality and morbidity, interest rates and the introduction of lapse assumptions into the GAAP reserve calculation.
When we acquire blocks of insurance policies or insurers owning blocks of policies, our assessment of the adequacy of the transferred policy liabilities is subject to risks and uncertainties. With acquired and existing businesses, we may from time to time need to increase our claims reserves significantly in excess of those previously estimated. An inadequate estimate of reserves could have a material adverse impact on our results of operations or financial condition.
Reinsurance
In the normal course of business, we reinsure portions of policies that we underwrite. We enter into reinsurance arrangements with unaffiliated reinsurance companies to limit our exposure on individual claims and to limit or eliminate risk on our non-core or underperforming blocks of business. Accordingly, we are party to various reinsurance agreements on our life and accident and health insurance risks. Our traditional accident and health insurance products are generally reinsured under quota share coinsurance treaties with unaffiliated reinsurers, while our life insurance risks are generally reinsured under either quota share coinsurance or yearly-renewable term treaties with unaffiliated reinsurers. Under quota share coinsurance treaties, we pay the reinsurer an agreed-upon percentage of all premiums and the reinsurer reimburses us that same percentage of any losses. In addition, the reinsurer pays us allowances to cover commissions, cost of administering the policies and premium taxes. Under yearly-renewable term treaties, the reinsurer receives premiums at an agreed upon rate for its share of the risk on a yearly-renewable term basis. We also use excess of loss reinsurance agreements for some policies to limit our loss in excess of specified thresholds. Our quota share coinsurance agreements are generally subject to cancellation on 90 days' notice as to future business, but policies reinsured prior to any cancellation remain reinsured as long as they remain in force. There is no assurance that if any of our reinsurance agreements were canceled we would be able to obtain other reinsurance arrangements on satisfactory terms.
We evaluate the financial condition of our reinsurers and monitor concentrations of credit risk to minimize our exposure to significant losses from reinsurer insolvencies. We must pay claims in the
12
event that a reinsurer to which we have ceded an insured claim fails to meet its obligations under the reinsurance agreement. As of December 31, 2014, all of our primary reinsurers were rated "A–" (Excellent) or better by A.M. Best with the exception of one reinsurer. For that reinsurer, which is rated B++, a trust containing assets at 106% of policy reserve levels is maintained for our benefit. We are not aware of any instances where any of our reinsurers have been unable to pay any policy claims on any reinsured business.
The table below details our gross annualized premium in force, the portion that we ceded to reinsurers and the net amount that we retained:
| | December 31, 2014 | December 31, 2013 | |||||||||||||||||||||||
|---|---|---|---|---|---|---|---|---|---|---|---|---|---|---|---|---|---|---|---|---|---|---|---|---|---|
| | Gross | Ceded | Net | Retained | Gross | Ceded | Net | Retained | |||||||||||||||||
| | ($ in millions) | ||||||||||||||||||||||||
Medicare Advantage | |||||||||||||||||||||||||
Southwest HMO | $ | 766.9 | $ | 1.8 | $ | 765.1 | 100 | % | $ | 698.2 | $ | 1.3 | $ | 696.9 | 100 | % | |||||||||
Other Core Networks | 334.4 | 0.4 | 334.0 | 100 | % | 377.7 | 0.6 | 377.1 | 100 | % | |||||||||||||||
| | | | | | | | | | | | | | | | | | | | | | | | | | |
Core Markets | 1,101.3 | 2.2 | 1,099.1 | 100 | % | 1,075.9 | 1.9 | 1,074.0 | 100 | % | |||||||||||||||
Non-Core Network | 167.1 | 0.5 | 166.6 | 100 | % | 218.1 | 0.3 | 217.8 | 100 | % | |||||||||||||||
Rural | 22.0 | — | 22.0 | 100 | % | 32.5 | 0.2 | 32.3 | 99 | % | |||||||||||||||
| | | | | | | | | | | | | | | | | | | | | | | | | | |
Sub total | 1,290.4 | 2.7 | 1,287.7 | 100 | % | 1,326.5 | 2.4 | 1,324.1 | 100 | % | |||||||||||||||
| | | | | | | | | | | | | | | | | | | | | | | | | | |
Medicaid | 178.3 | — | 178.3 | 100 | % | 153.3 | — | 153.3 | 100 | % | |||||||||||||||
Traditional Insurance | |||||||||||||||||||||||||
Medicare Supplement and Other Senior Health | 166.4 | 34.9 | 131.5 | 79 | % | 193.6 | 41.9 | 151.7 | 78 | % | |||||||||||||||
Accident & Sickness and Other | 25.7 | 0.6 | 25.1 | 98 | % | 28.9 | 0.6 | 28.3 | 98 | % | |||||||||||||||
Long Term Care | 23.2 | 8.8 | 14.4 | 62 | % | 23.8 | 6.7 | 17.1 | 72 | % | |||||||||||||||
| | | | | | | | | | | | | | | | | | | | | | | | | | |
Sub total | 215.3 | 44.3 | 171.0 | 79 | % | 246.3 | 49.2 | 197.1 | 80 | % | |||||||||||||||
| | | | | | | | | | | | | | | | | | | | | | | | | | |
Life Insurance and Annuity | 48.8 | 36.4 | 12.4 | 25 | % | 53.3 | 39.9 | 13.4 | 25 | % | |||||||||||||||
| | | | | | | | | | | | | | | | | | | | | | | | | | |
Total | $ | 1,732.8 | $ | 83.4 | $ | 1,649.4 | 95 | % | $ | 1,779.4 | $ | 91.5 | $ | 1,687.9 | 95 | % | |||||||||
| | | | | | | | | | | | | | | | | | | | | | | | | | |
| | | | | | | | | | | | | | | | | | | | | | | | | | |
| | | | | | | | | | | | | | | | | | | | | | | | | | |
Administration of Reinsured Blocks of Business
We are generally responsible for the administration of reinsured blocks of business including underwriting, issue, policy maintenance, rate management and claims adjudication and payment. In addition to reimbursement for commissions and premium taxes on the reinsured business, we also receive allowances from the reinsurers as compensation for our expense for such administration. With the sale of our previously-owned third party administrator (CHCS) to iGate, we continue to subcontract the administration of our accident and health and our retained life blocks of business to CHCS. Other blocks of business are administered by other third parties, including reinsurance partners.
Reinsurance of Medicare Advantage
We maintain excess of loss reinsurance on our Medicare Advantage HMO, PPO and PFFS products, which limits our per member risk. Our retention in 2014 is $300,000 of benefits and 10% in excess of the $300,000, except for one company, Select Care of Texas, for which our retention in 2014 is $350,000 of benefits and 10% in excess of the $350,000.
Reinsurance of Traditional Insurance
We have retained all new Medicare supplement business written after January 1, 2004. Under the existing coinsurance agreements for business written prior to 2004, which remain in effect for the life of
13
each policy reinsured, we reinsure a portion of the premiums, claims and commissions on a pro rata basis and receive additional expense allowances for policy issue and administration and premium taxes. The amounts reinsured under these agreements range from 25% to 100%. Depending on how the older reinsured business lapses, the overall percentage of business we retain may increase. As of December 31, 2014, the percentage of Medicare supplement business in force retained by us was 79%.
We retain 100% of the fixed benefit accident & sickness disability and hospital business issued in our Traditional Insurance segment. We reinsure our long-term care business on a 50% quota share basis, except for the acquired long-term care business in Constitution Life Insurance Company which is 100% retained. We have excess of loss reinsurance agreements to reduce our liability on individual risks for home health care policies to $125,000. For other long-term care policies issued, we have reinsurance agreements which cover 90% of the benefits on claims after two years and 100% of the benefits on claims after the third or fourth years depending upon the plan. We also have excess of loss reinsurance agreements with unaffiliated reinsurance companies on most of our major medical insurance policies to reduce the liability on individual risks to $325,000 per year.
Effective April 1, 2009, we reinsured substantially all of the net in force life and annuity business with Commonwealth under a 100% coinsurance treaty. In 2010 the annuity portion of this reinsurance transaction was commuted with Commonwealth and reinsured with Athene Life Re Ltd. There were certain blocks of life business in force at April 1, 2009 that are subject to separate coinsurance arrangements with other companies ranging from 75% to 90% that were not included in the transaction with Commonwealth. We retain 100% of senior life insurance products issued after March 31, 2009.
Underwriting Procedures
For our Medicare Advantage HMO, PPO, network-based PFFS, non-network (Rural) PFFS plans and Health Exchange business, pursuant to applicable regulations, we are not permitted to underwrite new enrollees. However, premiums received for these members are risk adjusted based on CMS adjustment policies reflecting the health status for each member. Rural and Health Exchange products were discontinued effective January 1, 2015.
For our Traditional Insurance business, for which we discontinued marketing and selling new products after June 1, 2012, we base the premium we charge, in part, on assumptions about expected mortality and morbidity experience. While we were writing new Traditional business, we followed detailed uniform underwriting procedures designed to assess and quantify various insurance risks before issuing life insurance policies and health insurance policies to individuals. We generally base these procedures on industry practices, reinsurer underwriting manuals and our prior underwriting experience.
Regulation
General
Our insurance and HMO companies along with certain other subsidiaries are subject to the state and local laws, regulations and supervision of the jurisdictions in which they are domiciled and licensed, as well as to federal laws and supervision. Those laws and regulations provide safeguards for policyholders and members, and do not exist to protect the interest of shareholders. Government agencies that oversee insurance and health care products and services generally have broad authority to issue regulations to interpret and enforce laws and rules. Changes in applicable laws and regulations are continually being considered, and the interpretation, enforcement, and application of existing laws and rules also change periodically, which could make it increasingly difficult to control medical costs, among other things. Therefore, future regulatory revisions could materially affect our operations and financial results.
14
We are subject to various governmental reviews, audits and investigations to verify our compliance with our contracts and applicable laws and regulations. For example, state departments of insurance audit our health plans and insurance companies for financial and contractual compliance. State departments of health audit our health plans for compliance with health services. The Centers for Medicare & Medicaid Services, also known as CMS, the Office of the Inspector General of Health and Human Services, the Department of Justice, the Department of Labor, the Government Accountability Office, the foregoing state equivalent agencies, state attorneys general, state departments of insurance and departments of health and Congressional committees may also conduct audits and investigations of us.
Medicare
Medicare is a federal program that provides eligible persons age 65 and over and certain eligible persons with disabilities under age 65 with a variety of hospital, prescription drug, and medical insurance benefits. Medicare members have the option to enroll in a Medicare Advantage health plan. Under Medicare Advantage, insurance companies and managed care organizations contract with CMS to provide benefits at least equivalent to the traditional fee-for-service Medicare program in exchange for a fixed monthly payment per member that varies based on the county in which a member resides as well as a member's demographics and health status. Medicare supplemental insurance, sometimes called Medigap is jointly regulated by the federal government and by state Departments of Insurance. In all but a few states, there are standard Medicare supplement plans.
The Medicare Part D drug benefit offers Medicare members the option to obtain covered outpatient prescription drug benefits either as a stand-alone plan or offered in conjunction with a Medicare Advantage health plan. Certain of our Medicare Advantage plans offer a Medicare Part D drug benefit.
The ACA made several changes to Medicare Advantage. Beginning in 2012, the Medicare Advantage "benchmark" rates began the transition to target Medicare fee-for-service cost benchmarks of 95%, 100%, 107.5% or 115% of the calculated Medicare fee-for-service costs. The transition period is 2, 4 or 6 years depending upon the applicable county. The counties are divided into quartiles based on each county's fee-for-service Medicare costs. We estimate that approximately 65% and 35%, respectively, of our January 1, 2015 membership resides in counties where the Medicare Advantage benchmark rate will equal 95% and 115%, respectively, of the calculated Medicare fee-for-service costs at the end of the 6 year transition period in 2017.
Implementation of quality bonus for Star ratings—Beginning in 2012, Medicare Advantage plans with an overall "Star rating" of three or more stars (out of five) based on 2011 performance were eligible for a "quality bonus" in their basic premium rates. For 2015 and beyond, plans must achieve an overall star rating of at least 4 stars to receive the quality bonus. Plans receiving Star bonus payments are required to use the additional dollars to provide "extra benefits" for the plans' enrollees, to comply with required minimum loss ratios, resulting in a competitive advantage for those plans rather than a direct financial impact. In addition, beginning in 2012, Medicare Advantage Star ratings affect the rebate percentage available for plans to provide additional member benefits (plans with quality ratings of 3.5 stars or above will have their rebate percentage increased from a base rate of 50% to 65% or 70%). In all cases, this rebate percentage is lower than the pre-ACA rebate percentage of 75%. Our Medicare Advantage plans for 2015 are rated from 3.0 to 4.0 stars out of 5.0, with approximately 86% of our membership now in plans rated 4 stars, which ratings were considered when preparing our bids to be submitted for 2015.
Notwithstanding continued efforts to improve or maintain our Star ratings and other quality measures, there can be no assurances that we will be successful in doing so. Accordingly, our plans may
15
not be eligible for full level quality bonuses or increased rebates, which could adversely affect the benefits such plans can offer, reduce membership, and reduce profit margins.
In addition, CMS has indicated that plans with a Star rating of less than 3.0 for three consecutive years may be subject to termination. While we do not currently have any plans with a rating below 3.0, our inability to maintain Star ratings of 3.0 or better for a sustained period of time could ultimately result in plan termination by CMS which could have a material adverse impact on our business, cash flows and results of operations. Also, the CMS Star ratings/quality scores may be used by CMS to pay bonuses to Medicare Advantage plans that enable those plans to offer improved benefits and/or better pricing. Furthermore, lower quality scores compared to our competitors may result in us losing potential new business in new markets or dissuading potential members from choosing our plan in markets in which we compete. Lower quality scores compared to our competitors could have a material adverse effect on our rate of growth.
Stipulated minimum MLRs—Beginning in 2014, the ACA stipulates a minimum medical loss ratio, or MLR, of 85% for Medicare Advantage plans. This MLR takes into account benefit costs, quality initiative expenses, the ACA fee and taxes. Financial and other penalties may result from failing to achieve the minimum MLR ratio. For the year ended December 31, 2014 our Medicare Advantage plans exceeded the minimum MLR, as defined by CMS. Complying with such minimum ratio by increasing our medical expenditures or refunding any shortfalls to the federal government could have a material adverse effect on our operating margins, results of operations, and our statutory required capital.
Non-deductible health insurance industry fee ("ACA Fee")—Beginning in 2014, the new healthcare reform legislation imposed an annual aggregate health insurance industry fee of $8.0 billion (with increasing annual amounts thereafter) on health insurance premiums, including Medicare Advantage premiums, that is not deductible for income tax purposes. As a result, our effective income tax rate increased in 2014, and will likely remain at a higher level in future years. Our share of the new fee is based on our pro rata percentage of premiums written during the preceding calendar year compared to the industry as a whole, calculated annually. This fee, first expensed and paid in 2014, adversely affects the profitability of our Medicare Advantage business and could have a material adverse effect on our results of operations. We paid a fee of $23.1 million in 2014, based on 2013 net written premiums and estimate that the fee to be paid in 2015, based on 2014 net written premiums, will be approximately $29 million. Pursuant to the guidance issued by the FASB in July 2011, for reporting in accordance with U.S generally accepted accounting principles (GAAP), the liability for the fee will be estimated and recorded in full once the entity provides qualifying health insurance in the corresponding period with a corresponding deferred cost that is to be amortized to expense on a straight-line basis over the applicable calendar year. For statutory reporting purposes, the fee will be expensed on January 1 in the year of payment, rather than amortized to expense over the year. The ACA fee is included in other operating costs; however, will be factored in when calculating the stipulated minimum MLR.
Accountable Care Organizations
The ACA established ACOs, as a tool to improve quality and lower costs through increased care coordination in the FFS program. CMS established the MSSP to facilitate coordination and cooperation among providers to improve the quality of care for Medicare fee-for-service beneficiaries and reduce unnecessary costs. To date, we have partnered with numerous groups of healthcare providers and currently participate in twenty-four active ACOs previously approved to participate in the MSSP. ACOs are entities that contract with CMS to serve the FFS population with the goal of better care for individuals, improved health for populations and lower costs. ACOs share savings with CMS to the extent that the actual costs of serving assigned beneficiaries are below certain trended benchmarks of such beneficiaries and certain quality performance measures are achieved. We provide a variety of services to the ACOs, including care coordination, analytics and reporting, technology and other
16
administrative services to enable these physicians and their associated healthcare providers to deliver better quality care, improved health and lower healthcare costs for their Medicare FFS patients.
As of December 31, 2014, we have incurred inception-to-date expenses of approximately $107 million, pre-tax, related to our ACO business, including our equity in the losses of our unconsolidated ACOs and have recognized our portion of shared savings revenues and expense reimbursements totaling approximately $13 million to date. We also expect to incur significant costs during 2015 and there can be no assurance that we will recoup any of these costs. Under the MSSP, CMS will not make any payments to ACOs for a measurement year until the second half of the following year, which will negatively impact our cash flows. In order to receive revenues from CMS under the MSSP, the ACO must meet certain minimum savings rates (i.e. save the federal government money) and meet certain quality measures. More specifically, an ACOs medical expenses for its assigned beneficiaries during a relevant measurement year must be below the benchmark established by CMS for such ACO. On the quality side, the MSSP requires ACOs to meet thirty-three quality measures, which CMS may vary from time to time. Notwithstanding our efforts, our ACOs may be unable to meet the required savings rates or may not satisfy the quality measures, which may result in our receiving no revenues and losing our substantial investment. In addition, as the MSSP is a new program, it presents challenges and risks associated with the timeliness and accuracy of data and interpretation of complex rules, which may impact the timing and amount of revenue we can recognize and could have a material adverse effect on our ability to recoup any of our investment in this new business. Further, there can be no assurance that we will maintain positive relations with each of our twenty-four ACO partners which may result in certain of the ACOs terminating our relationship, which will result in a potential loss of our investment.
In addition, CMS, the US Office of Inspector General, the Internal Revenue Service, the Federal Trade Commission, the US Department of Justice, and various states have adopted or are considering adopting new legislation, rules, regulations and guidance relating to formation and operation of ACOs. Such laws may, among other things, require ACOs to become subject to financial regulation such as maintaining deposits of assets with the states in which they operate, the filing of periodic reports with the insurance department and/or department of health, or holding certain licenses or certifications in the jurisdictions in which the ACOs operate. Failure to comply with legal or regulatory restrictions may result in CMS terminating an ACOs agreement with CMS and/or subjecting an ACO to loss of the right to engage in some or all business in a state, payment of fines or penalties, or may implicate federal and state fraud and abuse laws relating to anti-trust, physician fee-sharing arrangements, anti-kickback prohibitions or prohibited referrals, any of which may adversely affect our operations and/or profitability.
Medicaid
Medicaid is a joint federal and state program to provide medical assistance to low income persons and certain disabled persons. It is funded and regulated by both the state and federal governments, but it is primarily a state operated and state implemented program. Our programs under various state Medicaid programs subject us to the requirements of the state agencies responsible for overseeing the programs and the contracts that we sign often include provisions from the regulations of these state agencies. The federal government guarantees matching funds for qualifying Medicaid expenditures, based on a designated assistance percentage.
This annual assistance percentage, or FMAP, varies among states, with a floor of 50 percent. Each state establishes its own eligibility standards, benefit packages, payment rates and program administration for its Medicaid programs, subject to federal statutory and regulatory requirements. Some states administer managed care for their Medicaid program, others use fee-for-service and some maintain or have a combination of both. Common state-administered Medicaid programs are the Temporary Assistance for Needy Families program, or TANF, and a program for aged, blind or disabled, or ABD, Medicaid members. Numerous other programs exist and vary by state.
17
Fraud and abuse laws
Enforcement of health care fraud and abuse laws has become a top priority for the nation's law enforcement entities. The funding of these law enforcement efforts has increased dramatically in the past few years and is expected to continue. The focus of these efforts has been directed at participants in federal government health care programs such as Medicare and Medicaid.
Privacy laws
The use and disclosure of personal health information, personally identifiable information, and/or individually identifiable data by our business is regulated at federal and state levels. These laws and rules are subject to administrative interpretation. Various state laws address the use and maintenance of such data. Many state laws are derived from the privacy provisions in the Federal Gramm-Leach-Bliley Act, the Genetic Information Nondiscrimination Act, known as GINA, the Health Information Technology for Economic and Clinical Health Act of 2009, known as HITECH, and the Health Insurance Portability and Accountability Act of 1996, known as HIPAA.
Among other things, HIPAA mandates the following:
- •
- guaranteed availability and renewability of health insurance for specified employees and individuals;
- •
- limits on termination options and on the use of preexisting condition exclusions;
- •
- prohibitions against discriminating on the basis of health status; and
- •
- requirements which make it easier to continue coverage in cases where an employee is terminated or changes employers.
HIPAA also calls for the adoption of standards for the exchange of electronic health information and privacy requirements that govern the handling, use and disclosure of protected customer health information. Compliance with HIPAA and other privacy laws is far-reaching and complex and proper interpretation and practice under the law continue to evolve. Consequently, our efforts to measure, monitor and adjust our business practices to comply with these laws are ongoing. In 2013, the United States Department of Health and Human Services issued the omnibus final rule on HIPAA privacy, security, breach notification requirements and enforcement requirements under the HITECH Act, and a final regulation for required changes to the HIPAA Privacy Rule for the Genetic Information Nondiscrimination Act, or GINA. Our failure to comply with the omnibus final rule or the failure of our business associates to comply with HIPAA, the HITECH ACT, GINA, or other privacy regulations could cause us to incur civil or criminal penalties, including significant damage to our reputation.
USA PATRIOT Act
A portion of the USA PATRIOT Act applying to insurance companies became effective in mid-2004. Insurance companies are required to impose processes and procedures to thoroughly verify their agents, applicants, insureds, claimants and premium payers in an effort to prevent money laundering. Our family of companies has implemented measures to comply with the Office of Federal Asset Control requirements, whereby the names of customers and potential customers must be reviewed against a listing of known terrorists and money launderers. The identification verification requirement of the USA PATRIOT Act became final in 2005. In 2006, insurance companies were required to verify the identity of their applicants, insureds, and beneficiaries.
Consumer Protection Laws
We may participate in direct-to-consumer activities and are subject to emerging regulations applicable to on-line communications and other general consumer protection laws and regulations.
18
State and local regulation
Each of our insurance company and HMO subsidiaries is also subject to the regulations of and supervision by the insurance department and/ or departments of health of each of the jurisdictions in which they are admitted and authorized to transact business. These regulations cover, among other things:
- •
- the declaration and payment of dividends by our insurance company and HMO subsidiaries;
- •
- the setting of rates to be charged for some types of insurance;
- •
- the granting and revocation of licenses to transact business;
- •
- the licensing of agents;
- •
- the regulation and monitoring of market conduct and claims practices;
- •
- the approval of policy forms;
- •
- the establishment of reserve requirements;
- •
- investment restrictions;
- •
- the regulation of maximum allowable commission rates;
- •
- the mandating of some insurance benefits;
- •
- minimum capital and surplus levels; and
- •
- the form and accounting practices used to prepare statutory financial statements.
A failure to comply with legal or regulatory restrictions may subject the insurance company subsidiary or HMO subsidiary to a loss of a right to engage in some or all business in a state or states or an obligation to pay fines, penalties, or make restitution, which may adversely affect our profitability.
American Pioneer Life Insurance Company is a Florida domiciled insurance company. American Progressive Life & Health Insurance Company of New York is a New York domiciled insurance company. The Pyramid Life Insurance Company is a Kansas domiciled insurance company. Constitution Life Insurance Company and Marquette are Texas domiciled insurance companies. Effective December 31, 2013, our Union Bankers Insurance Company subsidiary was merged into Constitution Life Insurance Company. SelectCare of Texas, Inc. is licensed as an HMO in Texas, SelectCare Health Plans, Inc. is licensed as an HMO in Texas and Today's Options of New York, Inc. is licensed as a Prepaid Health Services Plan in New York. Collectively, our insurance subsidiaries and HMOs are licensed to sell health insurance, HMO products, life insurance and annuities in all 50 states and the District of Columbia.
Most jurisdictions mandate minimum benefit standards and loss ratios for accident and health insurance policies. We are generally required to maintain, with respect to our individual long-term care policies, minimum anticipated loss ratios over the entire period of coverage. With respect to our Medicare supplement policies, we are generally required to attain and maintain an actual loss ratio, after three years, of not less than 65 percent (75% for groups) of earned premium. We provide to the insurance departments of all states in which we conduct business annual calculations that demonstrate compliance with required loss ratio standards for Medicare supplement insurance. We prepare these calculations utilizing appropriate statutory assumptions. In the event we fail to maintain minimum mandated loss ratios, our insurance company subsidiaries could be required to provide retrospective premium refunds or prospective premium rate reductions. In addition, we actively review the loss ratio experience of our products and request approval for rate increases from the respective insurance departments when we determine they are needed. We cannot guarantee that we will receive the rate increases we request.
19
Every insurance company and HMO that is a member of an "insurance holding company system" generally is required to register with the insurance regulatory authority in its domicile state and file periodic reports concerning its relationships with its insurance holding company and with its affiliates. Material transactions between registered insurance companies or HMOs and members of the holding company system are required to be "fair and reasonable" and in some cases are subject to administrative approval. The books, accounts and records of each party are required to be maintained so as to clearly and accurately disclose the precise nature and details of any intercompany transactions.
Each of our insurance company and HMO subsidiaries is required to file detailed reports with the insurance department of each jurisdiction in which it is licensed to conduct business and its books and records are subject to examination by each licensing insurance department. In accordance with the insurance codes of their domiciliary states and the rules and practices of the NAIC, our insurance company and HMO subsidiaries are examined periodically by examiners of each company's domiciliary state with elective participation by representatives of the other states in which they are licensed to do business.
Many states require deposits of assets by insurance companies and HMOs for the protection either of policyholders in those states or for all policyholders. These deposited assets remain part of the total assets of the company. As of December 31, 2014 and 2013, we had securities with market values totaling $36.5 million and $42.6 million, respectively, on deposit with various state treasurers or custodians. These deposits must consist of securities that comply with the standards established by the particular state.
Certain of our subsidiaries are licensed in various states as a third party administrator, utilization review agent, or other similar entities. Those subsidiaries provide administrative and management services to our insurance and HMO companies. Those entities operate in states that regulate intercompany agreement, including the amounts that can be charged between affiliates for services, fiduciary bond amounts, utilization review processes, and claims payment processes.
Dividend Restrictions
Many of our subsidiaries operate in states that regulate the payment of dividends, loans, or other cash transfers to other affiliated entities including our parent company, Universal American Corp., and require minimum levels of equity as well as limit investments to approved securities. The amount of dividends that may be paid by these subsidiaries, without prior approval by state regulatory authorities, is limited based on the entity's level of statutory income and statutory capital and surplus.
Although minimum required levels of equity are largely based on premium volume, product mix, and the quality of assets held, minimum requirements vary significantly from state to state. As of December 31, 2014, our state regulated subsidiaries had aggregate statutory capital and surplus of approximately $350 million. Based on current estimates, we expect the aggregate amount of dividends that may be paid to our parent company in 2015 without prior approval by state regulatory authorities is approximately $27 million.
Risk-Based Capital and Minimum Capital Requirements
Risk-based capital requirements promulgated in each state take into account asset risks, interest rate risks, mortality and morbidity risks and other relevant risks with respect to the insurer's business and specify varying degrees of regulatory action to occur to the extent that an insurer does not meet the specified risk-based capital thresholds, with increasing degrees of regulatory scrutiny or intervention provided for companies in categories of lesser risk-based capital compliance. As of December 31, 2014, all of our U.S. insurance company subsidiaries and managed care affiliates maintained ratios of total adjusted capital to risk-based capital in excess of the authorized control level. However, should our insurance company subsidiaries' and managed care affiliates' risk-based capital positions decline in the
20
future, their ability to pay dividends, the need for capital contributions or the degree of regulatory supervision or control to which they are subjected might be affected.
Guaranty Association Assessments
Solvency or guaranty laws of most jurisdictions in which our insurance company subsidiaries do business may require them to pay assessments to fund policyholder losses or liabilities of unaffiliated insurance companies that become insolvent. These assessments may be deferred or forgiven under most solvency or guaranty laws if they would threaten an insurer's financial strength and, in most instances, may be offset against future premium taxes. Our insurance company subsidiaries provide for known and expected insolvency assessments based on information provided by the National Organization of Life & Health Guaranty Associations. Our insurance company subsidiaries have not incurred any significant costs of this nature. The likelihood and amount of any future assessments is unknown and is beyond our control.
Outsourcing Arrangements
We outsource certain processing and administration functions to third parties, subject to outsourcing agreements. The outsourced functions may include membership administration, call center operations, business process outsourcing, revenue management, marketing and pharmacy benefit management. In the future, it is possible that we may outsource additional functions or bring in-house one or more of these functions. A summary of our more significant arrangements is presented below.
Business Process Outsourcing
In connection with our 2010 sale of CHCS to iGate, we entered into a master services agreement covering the services iGate provides to us. These services include policy administration, underwriting, claims processing and other related processes primarily related to our Traditional lines of business. In addition, we continue to use iGate as a business outsource vendor to provide a range of business process services, including, data entry, member application intake and processing, data validation, mailroom imaging and scanning, paper-based and electronic claims adjudication and processing, and overflow labor support services for our Medicare Advantage operations. In addition, iGate also provides certain information technology support and programming. In the future, we may outsource additional services and business processes.
Membership Administration
We outsource the administrative information technology platform necessary to support our Medicare Advantage businesses to The Trizetto Group. We have entered into an annual support and license agreement, a master hosting services agreement and a consulting services agreement with Trizetto. These agreements collectively support the basic infrastructure surrounding the membership information for our Medicare Advantage and Medicaid businesses.
Pharmacy Benefit Management
We have entered into a multi-year pharmacy benefits management agreement with CVS Caremark which provides a range of pharmacy benefit management to our Medicare Advantage plans.
Employees
As of February 26, 2015, we employed approximately 1,500 employees, none of whom is represented by a labor union in such employment. We consider our relations with our employees to be good.
21
Additional Information
We were incorporated under the laws of the State of Delaware on December 22, 2011. Our common stock is listed on the NYSE under the ticker symbol "UAM." Our corporate headquarters are located at 44 South Broadway, White Plains, New York 10601 and our telephone number is (914) 934-5200.
Investors in our securities should carefully consider the risks described below and other information included in this report. This report contains both historical and forward-looking statements. We are making the forward-looking statements within the meaning of Section 27A of the Securities Act and Section 21E of the Exchange Act. We intend the forward-looking statements in this report or made by us elsewhere to be covered by the safe harbor provisions for forward-looking statements contained in the Private Securities Litigation Reform Act of 1995, and we are including this statement for purposes of complying with and relying upon these safe harbor provisions. We have based these forward-looking statements on our current expectations and projections about future events, trends and uncertainties. These forward-looking statements are not guarantees of future performance and are subject to risks, uncertainties and assumptions, including, among other things, the information discussed below. The risks and uncertainties described below are not the only ones that we face. Additional risks and uncertainties not presently known to us or that we currently believe to be immaterial also may adversely affect our business. In making these statements, except as required by applicable securities laws, we are not undertaking to address or update each factor in future filings or communications regarding our business or results. Our business is highly complicated, regulated and competitive with many different factors affecting results. If any of the following risks or uncertainties develops into actual events, this could significantly and adversely affect our business, prospects, financial condition and operating results. In that case, the trading price of our common stock could decline materially and investors in our securities could lose all or part of their investment.
The enactment of the Affordable Care Act and subsequent rules promulgated by CMS could have a material adverse effect on our business and financial results.
The Affordable Care Act, known as ACA, was signed into law in March 2010 and legislates broad-based changes to the U.S. health care system. Due to the complexity of the health reform legislation, including yet to be promulgated implementing regulations, lack of interpretive guidance, and gradual implementation, the impact of the health reform legislation remains difficult to predict and quantify. In addition, we believe that any impact from the health reform legislation could potentially be mitigated by certain actions we may take in the future including modifying future Medicare Advantage bids to compensate for such changes. For example, the anticipation of additional revenues from Star bonuses or reduced CMS reimbursement rates are factored into the anticipated level of benefits included in our Medicare Advantage bids for the upcoming year. However, we will need to dedicate significant resources and expense to complying with these new rules and there is a possibility that this new legislation could have a material adverse effect on our business, financial position and results of operations.
The provisions of these new laws include the following key points, which are discussed further below:
- •
- reduced Medicare Advantage reimbursement rates, beginning in 2012;
- •
- implementation of a quality bonus for Star Ratings beginning in 2012;
- •
- accountable care organizations, beginning in 2012;
- •
- limitation on the federal tax deductibility of compensation earned by individuals for certain types of companies, beginning in 2013;
22
- •
- stipulated minimum medical loss ratios, beginning in 2014;
- •
- non-deductible health insurance industry fee, beginning in 2014; and
- •
- coding intensity adjustments, with mandatory minimums beginning in 2014.
Reduced Medicare Advantage reimbursement rates—Beginning in 2012, the Medicare Advantage "benchmark" rates transition to target Medicare fee-for-service cost benchmarks of 95%, 100%, 107.5% or 115% of the calculated Medicare fee-for-service costs. The transition period is 2, 4 or 6 years depending upon the applicable county. The counties are divided into quartiles based on each county's fee-for-service Medicare costs. We estimate that approximately 65% of our current membership resides in counties where the Medicare Advantage benchmark rate will equal 95% of the calculated Medicare fee-for-service costs, with approximately 95% of these members having a 6-year transition period. Under the law, the premiums for such members transitioned to 95% of Medicare fee-for-service costs beginning in 2012. This followed the freezing of Medicare Advantage reimbursement rates in 2011 based on our 2010 levels.
Medicare Advantage payment benchmarks have been cut over the last several years, with additional funding reductions to be phased in as noted above. On February 20, 2015, CMS issued its 2016 45 Day Call Letter (the "45 Day Call Letter") detailing preliminary 2016 Medicare Advantage benchmark payment rates. As is customary, CMS has invited public comment on these preliminary rates before issuing its final rates for 2016 in April 2015. The 45 Day Call Letter proposes to reduce Medicare rates for 2016 and make other changes that could negatively impact our business. At this time, CMS is not implementing the proposed policy of excluding for risk adjustment purposes the diagnosis codes obtained from in-home health risk assessments unless such codes are subsequently validated by a clinical encounter with a qualified provider. If implemented, this change would have resulted in significant additional funding declines for the Company. We will continue to evaluate proposed changes detailed in the 45 Day Call Letter, some of which could result in further rate reductions that would adversely affect our plan benefit designs, market participation, growth prospects and earnings potential for our Medicare Advantage plans in the future.
To address these rate reductions, we may have to reduce benefits (to the extent permitted), increase member premiums, modify existing operations, reduce profit margins, or implement some combination of these actions. Such actions could have a material adverse effect on our business by:
- •
- Limiting our ability to maintain our current membership levels;
- •
- Making our products less competitive or attractive to prospective members;
- •
- Causing us to exit many service areas;
- •
- Causing us to increase member premiums, lower benefits or impose higher member contributions (e.g., copayments); and
- •
- Require more intensive medical and operating cost management in order to respond to the lower reimbursements.
Continued reductions of Medicare Advantage payment rates may result in Medicare Advantage being no longer economically viable for us in many markets. There can be no assurance that we will be able to execute successfully on these or other strategies to address changes in the Medicare Advantage program. There can be no assurance that we will be able to successfully address such rate freezes/reductions and failure to do so may result in a material adverse effect on our results of operations, financial position, and cash flows.
Implementation of quality bonus for Star Ratings—Beginning in 2012, Medicare Advantage plans with an overall "Star rating" of three or more stars (out of five) based on 2011 performance are eligible for a "quality bonus" in their basic premium rates. Plans receiving Star bonus payments are required to use
23
the additional dollars to provide "extra benefits" for the plans' enrollees to the extent necessary to maintain compliance with minimum loss ratio requirements resulting in a competitive advantage for those plans rather than a direct financial impact. In addition, beginning in 2012, Medicare Advantage Star ratings affect the rebate percentage available for plans to provide additional member benefits (plans with quality ratings of 3.5 stars or above will have their rebate percentage increased from a base rate of 50% to 65% or 70%). In all cases, this rebate percentage is lower than the pre-ACA rebate percentage of 75%. Beginning in 2015, in order to qualify for bonus payments, plans must have a 4 STAR rating or higher. Our Medicare Advantage plans for 2015 are rated from 3.0 to 4.0 stars out of 5.0, with approximately 86% of our membership now in plans rated 4 stars, which ratings were considered when preparing our bids to be submitted for 2015. Notwithstanding continued efforts to improve or maintain our Star ratings and other quality measures there can be no assurances that we will be successful in doing so. Accordingly, our plans may not be eligible for full level quality bonuses or increased rebates, which could adversely affect the benefits such plans can offer, reduce membership, and reduce profit margins.
In addition, CMS has indicated that plans with a Part C or Part D Star rating of less than 3.0 for three consecutive years may be subject to termination While we do not currently have any plans with a rating below 3.0, our inability to maintain Star ratings of 3.0 or better for a sustained period of time could ultimately result in plan termination by CMS which could have a material adverse impact on our business, cash flows and results of operations. Also, the CMS Star ratings/quality scores may be used by certain agencies to establish premium rates or, in the case of CMS, to pay bonuses to Medicare Advantage plans that enable those plans to offer improved benefits and/or better pricing. Furthermore, lower quality scores compared to our competitors may result in us losing potential new business in new markets or dissuading potential members from choosing our plan in markets in which we compete. Lower quality scores compared to our competitors could have a material adverse effect on our rate of growth.
Accountable Care Organizations—The ACA established Accountable Care Organizations, or ACOs, as a tool to improve quality and lower costs through increased care coordination in the Medicare fee for service program. CMS established the Medicare Shared Savings Program, or MSSP, to facilitate coordination and cooperation among providers to improve the quality of care for Medicare fee for service beneficiaries and reduce unnecessary costs. To date, we have partnered with numerous groups of healthcare providers and currently participate in twenty-four active ACOs previously approved to participate in the MSSP. ACOs are entities that contract with CMS to service the Medicare fee for service population with the goal of better care for individuals, improved health for populations and lower costs. ACOs share savings with CMS to the extent that the actual costs of serving assigned beneficiaries are below certain trended benchmarks of such beneficiaries and certain quality performance measures are achieved. We provide a variety of services to the ACOs, including care coordination, analytics and reporting, technology and other administrative services to enable these physicians and their associated healthcare providers to deliver better quality care, improved health and lower healthcare costs for their Medicare fee for service patients.
As of December 31, 2014, we have incurred inception to date expenses of approximately $107 million, pre tax, related to our ACO business, including our equity in the losses of our unconsolidated ACOs and have recognized our portion of shared savings revenues and expense reimbursements totaling approximately $13 million to date. We also expect to incur significant costs during 2015 and there can be no assurance that we will recoup any of these costs. Under the MSSP, CMS will not make any payments to ACOs for a measurement year until the second half of the following year, which will negatively impact our cash flows. In order to receive revenues from CMS under the MSSP, the ACO must meet certain minimum savings rates (i.e. save the federal government money) and meet certain quality measures. More specifically, an ACOs medical expenses for its assigned beneficiaries during a relevant measurement year must be below the benchmark established by CMS for such ACO. On the quality side, the MSSP requires ACOs to meet thirty three quality
24
measures, which CMS may vary from time to time. Notwithstanding our efforts, our ACOs may be unable to meet the required savings rates or may not satisfy the quality measures, which may result in our receiving no revenues and losing our substantial investment.
In addition, as the MSSP is a new program, it presents challenges and risks associated with the timeliness and accuracy of data and interpretation of complex rules, which may impact the timing and amount of revenue we can recognize and could have a material adverse effect on our ability to recoup any of our investment in this new business. Further, there can be no assurance that we will maintain positive relations with each of our ACO partners which may result in certain of the ACOs terminating our relationship, which will result in a potential loss of our investment. During 2014, we reduced the number of our ACOs based on a variety of factors, including the level of commitment by the physicians in the ACO and the likelihood of the ACO achieving shared savings and may further reduce the number of our ACOs in 2015.
In addition, CMS, the US Office of Inspector General, the Internal Revenue Service, the Federal Trade Commission, the US Department of Justice, and various states have adopted or are considering adopting new legislation, rules, regulations and guidance relating to formation and operation of ACOs. Such laws may, among other things, require ACOs to become subject to financial regulation such as maintaining deposits of assets with the states in which they operate, the filing of periodic reports with the insurance department and/or department of health, or holding certain licenses or certifications in the jurisdictions in which the ACOs operate. Failure to comply with legal or regulatory restrictions may result in CMS terminating an ACOs agreement with CMS and/or subjecting an ACO to loss of the right to engage in some or all business in a state, payment of fines or penalties, or may implicate federal and state fraud and abuse laws relating to anti-trust, physician fee-sharing arrangements, anti-kickback prohibitions or prohibited referrals, any of which may adversely affect our operations and/or profitability.
On December 8, 2014, CMS issued a proposed rule with respect to the MSSP detailing numerous changes and seeking comments and suggestions from stakeholders on various alternative program designs. While many of the changes relate to clarification of CMS policy, many of the proposed changes, including changes to the benchmark methodology, quality reporting, assignment of Medicare beneficiaries, and how CMS allocates savings and losses, may result in increased expenses to us and/or may result in adverse changes to our ACOs' benchmarks, ability to satisfy the quality measures and reporting, the number of Medicare beneficiaries assigned to our ACOs, or otherwise making some or all of our ACOs not economically viable resulting in the loss of our investment.
Stipulated Minimum MLRs—Beginning in 2014, the ACA stipulates a minimum medical loss ratio, or MLR, of 85% for Medicare Advantage plans. This MLR takes into account benefit costs, quality initiative expenses, the ACA fee and taxes. Financial and other penalties may result from failing to achieve the minimum MLR ratio. For the year ended December 31, 2014 our Medicare Advantage plans exceeded the minimum MLR, as defined by CMS. Complying with such minimum ratio by increasing our medical expenditures or refunding any shortfalls to the federal government could have a material adverse effect on our operating margins, results of operations, and our statutory required capital.
Non-deductible health insurance industry fee ("ACA Fee")—Beginning in 2014, the ACA imposed an annual aggregate health insurance industry fee of $8.0 billion (with increasing annual amounts thereafter) on health insurance premiums, including Medicare Advantage premiums, that is not deductible for income tax purposes. As a result, our effective income tax rate increased in 2014, and will remain at a higher level in future years. Our share of the new fee is based on our pro rata percentage of premiums written during the preceding calendar year compared to the industry as a whole, calculated annually. This fee, first expensed and paid in 2014, adversely affects the profitability of our Medicare Advantage business and could have a material adverse effect on our results of operations. Further, since the assessment is based on prior year premiums, we could be subject to the
25
industry fee if we exited business and have little or no premium during the current year. We paid a fee of $23.1 million in 2014, based on 2013 net written premiums and estimate that the fee to be paid in 2015, based on 2014 net written premiums, will be approximately $29 million. Pursuant to the guidance issued by the FASB in July 2011, for reporting in accordance with U.S generally accepted accounting principles, known as GAAP, the liability for the fee will be estimated and recorded in full once the entity provides qualifying health insurance in the corresponding period with a corresponding deferred cost that is to be amortized to expense on a straight line basis over the applicable calendar year. For statutory reporting purposes, the fee will be expensed on January 1 in the year of payment, rather than amortized to expense over the year. The ACA fee is included in other operating costs; however, will be factored in when calculating the stipulated minimum MLR.
Coding intensity adjustments—Under the ACA, the coding intensity adjustment instituted in 2010 became permanent, resulting in mandated minimum reductions in risk scores of 4.91% in 2014 increasing each year to 5.91% in 2018. These coding adjustments may adversely affect the level of payments from CMS to our Medicare Advantage plans.
Limitation on the federal tax deductibility of compensation earned by individuals—Beginning in 2013, with respect to services performed during 2010 and afterward, for health insurance companies, the federal tax deductibility of compensation is limited under Section 162(m)(6) of the Code to $500,000 per individual and will not contain an exception for "performance based compensation." In September 2014, the Internal Revenue Service issued final regulations on this compensation deduction limitation which provided additional information regarding the definition of a health insurance issuer. Based on our analysis of the final regulations, we no longer believe we are subject to the limitation. As a result, during the fourth quarter of 2014, we recorded a tax benefit of $3.2 million related to prior years and $1.7 million related to the first nine months of 2014. Prior to receiving the final regulations, our application of this limitation had increased our effective tax rate by approximately 60 basis points for the year ended December 31, 2013 and 200 basis points for the year ended December 31, 2012. However, there is a risk that the Internal Revenue Service or other regulators may disagree with our interpretation, which could result in higher taxes.
We are subject to extensive government regulation; compliance with laws and regulations is complex and expensive, and any violation of the laws and regulations applicable to us could reduce our revenues and profitability and otherwise adversely affect our operating results and/or impact our ability to participate in Government programs such as Medicare and Medicaid.
There is substantial federal and state governmental regulation of our business. Several laws and regulations adopted by the federal government, such as the ACA, the False Claims Act, the Sarbanes-Oxley Act of 2002, the Gramm-Leach-Bliley Act, the Health Insurance Portability and Accountability Act of 1996, which we refer to as HIPAA, the Health Information Technology for Economic and Clinical Health Act (HITECH Act), the MMA, the USA PATRIOT Act, anti-kickback laws, MIPPA and "Do Not Call" regulations, and their state equivalents have created administrative and compliance requirements for us. The requirements of these laws and regulations are continually evolving, and the cost of compliance may have an adverse effect on our operations and profitability. The evolution of existing laws, rules, or regulations, their enforcement, or changes in their application or interpretation, as well as new laws and regulations could materially and adversely affect our operations, financial position, or results of operations and may expose us to increased liability. As laws and regulations evolve, the costs of compliance, which are already significant, will tend to increase. If we fail to comply with existing or future applicable laws and regulations we could suffer civil, criminal or administrative penalties, including termination of our contracts with CMS. Different interpretations and enforcement policies of these laws and regulations could subject our current practices to allegations of impropriety or illegality, or could require us to make significant changes to our operations. In addition, we cannot predict the impact of future legislation and regulatory changes on our business or assure you that we will be able to obtain or maintain the regulatory approvals required to operate our business. In addition, we are subject to potential changes in the political environment that can affect public policy and can adversely affect the markets for our products.
26
Laws and regulations governing Medicare, Medicaid and other state and federal healthcare and insurance programs are complex and subject to significant interpretation. As part of the ACA, CMS, State regulatory agencies and other regulatory agencies have been exercising increased oversight and regulatory authority over our Medicare and other businesses. Compliance with such laws and regulations is subject to CMS audit, other governmental review and investigation and significant and complex interpretation. CMS audits our Medicare Advantage plans with regularity to ensure we are in compliance with applicable laws, rules, regulations and CMS instructions, including audits relating to proper coding of members. There can be no assurance that we will be found to be in compliance with all such laws, rules and regulations in connection with these audits, reviews and investigations, and at times we have been found to be out of compliance. Failure to be in compliance can subject us to significant regulatory action including significant fines, penalties, cancellation of contracts with governmental agencies or operating restrictions on our business, including, without limitation, suspension of our ability to market to and enroll new members in our Medicare plans, termination of our contracts with CMS, exclusion from Medicare and other state and federal healthcare programs and inability to expand into new markets or add new products within existing markets.
Certain of our subsidiaries provide products and services to various government agencies. As a government contractor, we are subject to the terms of the contracts we have with those agencies and applicable laws governing government contracts. As such, we may be subject to false claim act litigation (also known as qui tam litigation) brought by individuals who seek to sue on behalf of the government, alleging that the government contractor submitted false claims to the government. In 2014 and 2015, Innovative Resources Group, LLC ("IRG"), a subsidiary of APS Healthcare, resolved three false claims act matters relating to IRG's historical contracts in Missouri, Tennessee and Nevada. It is possible that IRG, other APS Healthcare subsidiaries or other Universal American companies could be the subject of additional false claims act investigations and litigation in the future that could have a material adverse effect on our business and results of operations.
Laws in each of the states in which we operate our health plans, insurance companies and other businesses also regulate our sales practices, operations, the scope of benefits, rate formulas, delivery systems, utilization review procedures, quality assurance, complaint systems, enrollment requirements, claim payments, marketing, and advertising. These state regulations generally require, among other things, prior approval or notice of new products, premium rates, benefit changes and specified material transactions, such as dividend payments, purchases or sales of assets, inter-company agreements, and the filing of various financial and operational reports.
We are also subject to various governmental reviews, audits and investigations to verify our compliance with our contracts and applicable laws and regulations. State departments of insurance routinely audit our health plans and insurance companies for financial and contractual compliance. State departments of health audit our health plans for compliance with health services. State attorneys general, CMS, the Office of the Inspector General of Health and Human Services, the Office of Personnel Management, the Department of Justice, the Department of Labor, the Government Accountability Office, state departments of insurance and departments of health and Congressional committees may also conduct audits and investigations of us. We have historically incurred, and expect to continue to incur, significant costs to respond to governmental reviews, audits and investigations, and we expect these costs to increase over time as regulation increases and becomes more complex and as regulatory agencies and Congressional committees become more sophisticated and thorough.
Any adverse review, audit or investigation, or changes in regulations resulting from the conclusion of reviews, audits or investigations, could result in:
- •
- repayment of amounts we have been paid pursuant to our government contracts;
- •
- imposition of civil or criminal penalties, fines or other sanctions on us;
27
- •
- loss of licensure or the right to participate in Medicare and other government-sponsored programs;
- •
- suspension of marketing and enrollment privileges;
- •
- damage to our reputation in various markets;
- •
- legislative or regulatory changes that affect our business and operations;
- •
- increased difficulty in marketing our products and services; and
- •
- prohibiting the expansion to new markets or the addition of new products in existing markets.
Any of these events could make it more difficult for us to sell our products and services, reduce our revenues and profitability and otherwise adversely affect our reputation and/or operating results. CMS from time to time releases proposed or amended rules, regulations, and guidance that, if adopted, would, among other things, place tighter restrictions on marketing processes relative to the Medicare Advantage program and Medicare prescription drug benefit program. Depending upon the final content of these regulations, if CMS proposes and adopts them, compliance with and enforcement of the regulations could have a material adverse effect on our results of operations.
We are also subject to a federal law commonly referred to as the "Anti-Kickback Statute." The Anti-Kickback Statute prohibits the payment or receipt of any "Remuneration" that is intended to induce referrals or the purchasing, leasing or ordering of any item or service that may be reimbursed, in whole or in part, under a Federal Health Care Program, such as Medicare. It also prohibits the payment or receipt of any remuneration that is intended to induce the recommendation of the purchasing, leasing or ordering of any such item or service. Violations of such statute could result in substantial monetary penalties and could also include exclusion from the Medicare program.
If we fail to effectively design and price our products properly and competitively, if the premiums and fees we charge are insufficient to cover the cost of health care services delivered to our members, or if our estimates of benefit expenses are inadequate, our profitability may be materially adversely affected.
We use a substantial portion of our revenues to pay the costs of health care services delivered to our members. These costs include claims payments, capitation payments to providers, and various other costs incurred to provide health insurance coverage to our members. These costs also include estimates of future payments to hospitals and others for medical care provided to our members. Our premiums for our Medicare Advantage business are fixed for one-year periods. Accordingly, costs we incur in excess of our benefit cost projections generally are not recovered in the contract year through higher premiums. We estimate the costs of our future benefit claims and other expenses using actuarial methods and assumptions based upon claim payment patterns, medical inflation, historical developments, including claim inventory levels and claim receipt patterns, and other relevant factors. We continually review estimates of future payments relating to benefit claims costs for services incurred in the current and prior periods and make necessary adjustments to our reserves. However, these estimates involve extensive judgment, and have considerable inherent variability that is sensitive to payment patterns and medical cost trends. The profitability of our risk-based products depends in large part on our ability to predict, price for and effectively manage medical costs. Many factors may and often do cause actual health care costs to exceed what was estimated and used to set our premiums. In addition, we have and may continue to pursue additional opportunities in the Medicaid risk business, which presents additional challenges around pricing and underwriting. Failure to adequately price our products or estimate medical costs may result in a material adverse effect on our business, cash flows and results of operations.
In addition, during the 2015 annual election period, we significantly grew our Medicare Advantage membership in our Northeast markets, increasing membership by approximately 27%. At this time, the full health status of these new members is not yet known, particularly in comparison to the assumptions
28
that we made in our 2015 bid. As a result, we may incur higher than expected medical expenses from these new members.
Reductions in funding for Medicare or Medicaid programs could materially reduce our profitability.
We generate a significant majority of our total revenue from the operation of our Medicare Advantage plans and various Medicaid programs. As a result, our revenue and profitability are dependent, in part, on government funding levels for all of these various programs. The rates paid to Medicare Advantage health plans like ours are established by contract, although the rates differ depending on a combination of factors, such as upper payment limits established by CMS, a member's health profile and status, age, gender, county or region, benefit mix, member eligibility categories and the plan's risk scores. Future Medicare rate levels and overall funding for Medicare, may be affected by continuing government efforts to contain and/or reduce overall medical expenses, including the 45 Day Call Letter described above, and other budgetary and fiscal constraints pursuant to the Budget Control Act of 2011 as a result of the failure of a bipartisan joint congressional committee to agree on certain spending cuts, known as "Sequestration". The government is continuously examining Medicare Advantage health plans like ours in comparison to Medicare fee-for-service payments, and this examination could result in a reduction in payments to Medicare Advantage health plans like ours. Changes in the Medicare program or Medicare funding may affect our ability to operate under the Medicare program or lead to reductions in the amount of reimbursement, elimination of coverage for some benefits or reductions in the number of persons enrolled in or eligible for Medicare or increases in member premium. In addition, the rates paid to us under contracts with Medicaid agencies may be negatively impacted by state budget and overall budgetary issues in the various states.
Failure to reduce our administrative operating costs could have a material adverse effect on our financial position, results of operations and cash flows.
The level of our administrative operating costs significantly affects our profitability. During 2014, our administrative expense ratio in our Medicare Advantage business was 12.0%. Beginning in 2014, Medicare Advantage plans are required to meet an 85% medical loss ratio and we are subject to a non-deductible insurance industry fee that was approximately 1.6% of premium for 2014. Thus, in order to generate meaningful earnings, we will need to reduce our administrative operating expenses from current levels. We are smaller than many of our competitors which makes it harder to reduce administrative operating expenses. Reducing administrative expenses has and may continue to require us to reduce our headcount, which can place significant strains on our operations. If we are unable to reduce our administrative operating expenses to better match our smaller size, or if we are unable to effectively manage operating our business with a reduced headcount, it could have a material adverse effect on our financial condition, results of operations and cash flows.
A significant portion of our revenues are tied to our Medicare businesses and regulated by CMS and if our government contracts are not renewed or are terminated, our business would be substantially impaired.
We earn a significant portion of our revenue from our Medicare Advantage businesses in which CMS is not only our largest customer but also our regulator. If we are unable to maintain a constructive relationship with CMS, our business could suffer materially. As a government contractor, we provide our Medicare Advantage benefits and other services through a limited number of contracts with federal government agencies. These contracts generally have terms of one to three years and are subject to non-renewal by the applicable agency. All of our government contracts are terminable for cause if we breach a material provision of the contract or violate relevant laws or regulations. In addition, a government agency may suspend our right to add new members if it finds deficiencies in our provider network or operations, as was the case for a significant portion of the 2011 selling season as a result of CMS sanctions. If we are unable to renew, or to successfully re-bid or compete for any of our government contracts, or if any of our contracts are terminated, our business could be substantially
29
impaired. If any of those circumstances were to occur, we would likely pursue one or more alternatives, such as
- •
- seeking to enter into contracts in other geographic markets;
- •
- seeking to enter into contracts for other services in our existing markets; or
- •
- seeking to acquire other businesses with existing government contracts;
If we were unable to do so, we could be forced to cease conducting business. In this event, our revenues and profits would decrease materially.
Competition in the healthcare industry is intense, and if we do not design and price our products properly and competitively, our membership and profitability could decline.
We operate in a highly competitive industry. Some of our competitors are more established with larger market share, more established reputations and brands and greater financial resources than we have in some markets. In addition, other companies may enter our markets in the future. Medicare Advantage plans are generally bid upon or renewed annually and our Medicaid contracts have various terms that can oftentimes be terminated early. We compete for members on the basis of the following and other factors:
- •
- price;
- •
- the size, location, quality and depth of provider networks;
- •
- benefits provided;
- •
- quality and extent of services; and
- •
- reputation.
In addition to the challenge of controlling health care costs, we face intense competitive pressure to contain premium prices. Factors such as business consolidations, strategic alliances, legislative reforms and marketing practices create pressure to contain premium rate increases, despite being faced with increasing medical costs. Premium increases, introduction of new product designs, our relationship with our providers in various markets, and our possible exit from or entrance into additional markets, among other issues, could also affect our membership levels.
We compete based on innovation and service, as well as on price and benefit offering. We may not be able to develop innovative products and services which are attractive to clients. Moreover, although we need to continue to expend significant resources to develop or acquire new products and services in the future, we may not be able to do so. We cannot be sure that we will continue to remain competitive, nor can we be sure that we will be able to market our products and services to clients successfully at current levels of profitability.
Consolidation within the industries in which we operate, as well as the acquisition of our competitors by larger companies (e.g., Cigna's acquisition of HealthSpring, WellPoint's acquisition of Amerigroup and Aetna's acquisition of Coventry), may lead to increased competition. Strategic combinations involving our competitors could have an adverse effect on our business or results of operations.
Our business strategy is evolving and may involve pursuing new lines of business or strategic transactions and investments, some of which may not be successful.
The healthcare industry in undergoing significant change and our business strategy is continuing to evolve to meet these changes. In order to profitably grow our business, we may need to expand into new lines of business, which may involve pursuing strategic transactions, including potential acquisitions of, or investments in, related or unrelated businesses and divestitures of existing businesses or assets. In
30
addition, we may pursue a merger or consolidation with a third party that results in a change in control, a sale or transfer of all or a portion of our assets or a purchase by a third party of our securities that may result in a minority or control investment by such third party.
For example, over the past several years we partnered with groups of providers to form ACOs and acquired APS Healthcare. Going forward, we may pursue additional opportunities in the dual eligible, Medicaid, commercial and healthcare exchange markets, among others, which may involve us providing capital and/or reinsurance to health plans. We may also pursue various strategic transactions with providers, IPAs and other provider groups, including acquisitions, joint ventures and other arrangements. Each of these opportunities may require the investment of significant capital and management attention. There can be no assurance that we will be successful with any of these potential new ventures and we could suffer significant losses as a result, as was the case with our acquisition of APS Healthcare, which could have a material adverse effect on our business, financial condition and results of operations.
We may finance future acquisitions, investments or opportunities through available cash, equity issuances or through the incurrence of additional indebtedness. Future acquisitions or investments, and the incurrence of additional indebtedness, could subject us to a number of risks, including, but not limited to:
- •
- the assumption of contingent liabilities;
- •
- potential losses from unanticipated litigation, undiscovered or undisclosed liabilities or unanticipated levels of claims, relating to either the pre- or post-acquisition periods;
- •
- risks and uncertainties associated with transaction counterparties;
- •
- the loss of key personnel and business relationships;
- •
- difficulties associated with assimilating and integrating new personnel, assets, intellectual property and operations of an acquired company or business;
- •
- the distraction of our management from existing programs and initiatives in pursuing such strategic transactions; and
- •
- where indebtedness is incurred, general risks associated with higher leverage, including increased debt service obligations, reduced liquidity and reduced access to capital markets.
In addition, any strategic transaction that we may pursue may not result in anticipated benefits to us and may result in unforeseen costs that, in each case, may adversely impact our financial condition and results of operations.
Changes in governmental regulation or legislative reform could increase our costs of doing business and adversely affect our profitability.
The federal government and the states in which we operate extensively regulate our various businesses. The laws and regulations governing our operations are generally intended to benefit and protect policyholders, health plan members and providers rather than shareholders. From time to time, Congress has considered various forms of "Patients' Bill of Rights" legislation, which, if adopted, could alter the treatment of coverage decisions under applicable federal employee benefits laws. There have also been legislative attempts at the state level to limit the preemptive effect of federal employee benefits laws on state laws. If adopted, these types of limitations could increase our liability exposure and could permit greater state regulation of our operations. The government agencies administering these laws and regulations have broad latitude to enforce them. These laws and regulations, along with the terms of our government contracts, regulate how we do business, what services we offer, and how we interact with our policyholders, members, providers and the public. Healthcare laws and regulations are subject to frequent change and differing interpretations.
31
In addition, changes in the political climate or in existing laws or regulations, or their interpretations, or the enactment of new laws or the issuance of new regulations could adversely affect our business by, among other things:
- •
- imposing additional license, registration, or capital reserve requirements;
- •
- increasing our administrative and other costs;
- •
- forcing us to undergo a corporate restructuring;
- •
- increasing mandated benefits without corresponding premium increases;
- •
- limiting our ability to engage in inter-company transactions with our affiliates and subsidiaries;
- •
- adversely affecting our ability to operate under the Medicare program and to continue to serve our members and attract new members;
- •
- changing the manners or the basis upon which CMS reinsures us or pays premium to us, or upon which our members pay premiums;
- •
- forcing us to alter or restructure our relationships with providers and agents;
- •
- restricting our ability to market our products;
- •
- increasing governmental regulation or provision of healthcare services;
- •
- requiring that health plan members have greater access to non-formulary drugs;
- •
- expanding the ability of health plan members to sue their plans;
- •
- requiring us to implement additional or different programs and systems; and
- •
- prohibiting us from participating in existing or future programs and systems.
While it is not possible to predict when and whether fundamental policy changes would occur, policy changes on the local, state and federal level could fundamentally change the dynamics of our industry, such as policy changes mandating a much larger role of the government in the health care arena. Changes in public policy could materially affect our profitability, our ability to retain or grow business, or our financial condition. State and federal governmental authorities are continually considering changes to laws and regulations applicable to us and are currently considering regulations relating to:
- •
- health insurance access and affordability;
- •
- disclosure of provider quality information;
- •
- electronic access to medical records;
- •
- formation of regional or national association health plans for small employers;
- •
- universal health coverage; and
- •
- disclosure of provider fee schedules and other data about payments to providers, sometimes called transparency.
All of these proposals could apply to us and could result in new regulations that increase the cost of our operations. Any of the foregoing legislative or regulatory changes could adversely affect our or our service providers' ability to negotiate rebate and administrative fee arrangements with manufacturers and have a material adverse effect on our business and results of operations.
Compliance with and enforcement of the existing and any proposed regulations could have a material adverse effect on our results of operations.
32
If we fail to properly maintain the integrity of our data and information systems and we sustain a cyber-attack or other data security or privacy breach, we could incur significant regulatory fines or penalties, significant damage to our reputation and our business and results of operations could be materially adversely affected.
Cybersecurity attacks and data security breaches have become increasingly common, particularly in the healthcare industry. While we take precautions to prevent such attacks, there can be no assurance that we will not be subject to an attack or breach in the future. Our business depends significantly on efficient, effective and secure information systems and the integrity and timeliness of the data we use to run our business. We have various information systems that support our operating segments. The information gathered and processed by our management information systems assists us in, among other things, marketing and sales tracking, underwriting, billing, claims processing, medical management, medical care cost and utilization trending, financial and management accounting, reporting, planning and analysis and e-commerce. These systems also support on-line customer service functions, provider and member administrative functions and support tracking and extensive analyses of medical expenses and outcome data.
Our information systems and applications require an ongoing commitment of significant resources to maintain, protect and enhance existing systems and develop new systems to keep pace with continuing changes in information processing technology, evolving industry and regulatory standards and changing customer preferences. If the information we rely upon to run our businesses were to be found to be inaccurate or unreliable, if we fail to properly maintain our information systems and data integrity, or if we fail to successfully update or expand processing capability or develop new capabilities to meet our business needs in a timely manner, we could have operational disruptions, have problems in determining medical cost estimates and establishing appropriate pricing, have customer and physician and other health care provider disputes, lose our ability to produce timely and accurate reports, have regulatory or other legal problems, have increases in operating and administrative expenses, lose existing customers, have difficulty in attracting new customers or in implementing our growth strategies, sustain losses due to fraud or suffer other adverse consequences.
To the extent we fail to maintain effective information systems, we may need to contract for these services with third-party management companies, which may be on less favorable terms to us and significantly disrupt our operations and information flow. In addition, we have outsourced the operation of our data centers to independent third parties and may from time to time obtain and/or outsource additional services or facilities from or to other independent third parties. Dependence on third parties for these services and facilities may make our operations vulnerable to their failure to perform as agreed. In addition, we could be subject to hackers or other forms of cyber-security attacks that bypass our information technology security systems. If a hacker or cyber-security attack were to be successful, we could be adversely affected due to the theft, destruction, loss, misappropriation or release of confidential data, operational or business delays resulting from the disruption of our systems, negative publicity resulting in reputational damage with our members, agents, providers, regulators and other stakeholders and significant fines, penalties and other costs.
Furthermore, our business requires the secure transmission of confidential information over public networks. Because of the confidential health information we store and transmit, security breaches could expose us to a risk of regulatory action, litigation, possible liability and loss. Our security measures may be inadequate to prevent security breaches, and our business operations and profitability would be adversely affected by cancellation of contracts, loss of members and potential criminal and civil sanctions if they are not prevented.
There can be no assurance that our process of improving existing systems, developing new systems to support our expanding operations, integrating new systems, protecting our proprietary information, and improving service levels will not be delayed or that additional systems issues will not arise in the
33
future. Failure to adequately protect and maintain the integrity of our information systems and data may result in a material adverse effect on our financial positions, results of operations and cash flows.
Our Traditional Insurance business is a closed block and the level of policy reserves, together with future premiums, may not be adequate to provide for future expected policy benefits and maintenance costs.
Our Traditional insurance segment reflects our closed block of insurance which includes Medicare supplement, other senior health insurance, specialty health insurance and life insurance, including a non-strategic closed block of approximately 11,500 long-term care insurance policies. Long-term care insurance policies are intended to protect the insured from the cost of long-term care services including those provided by nursing homes, assisted living facilities, and adult day care as well as home health care services. Our Traditional business is currently in run-off as we discontinued marketing and selling Traditional insurance products after June 1, 2012.
Our block of long-term care business continues to generate losses. We stopped selling new long-term care business at the end of 2004. Claims under long-term care products tend to be higher in dollar amount, longer in duration and incurred later in the life of the policy than other Traditional products, making the product difficult to price appropriately. We estimate costs associated with long-duration insurance policies, such as long-term care policies sold to individuals, for which some of the premium received in the earlier years is intended to pay anticipated benefits to be incurred in future years. These future policy benefit reserves are recognized on a net level premium method based on interest rates, mortality, morbidity, withdrawal and maintenance expense assumptions from published actuarial tables, as modified based upon actual experience. The assumptions used to determine the liability for future policy benefits are established and locked in at the time each contract is acquired and would only change if our expected future experience deteriorated to the point that the level of the liability, together with the present value of future gross premiums, are not adequate to provide for future expected policy benefits. Long-term care policies provide for long- duration coverage and, therefore, our actual claims experience will emerge many years after assumptions have been established. The risk of a deviation of the actual morbidity and mortality rates from those assumed in our reserves are particularly significant to our closed block of long-term care policies.
We monitor the loss experience of these long-term care policies, and, when necessary, apply for premium rate increases through a regulatory filing and approval process in the jurisdictions in which such products were sold. However, it is possible that we will not be able to obtain approval for premium rate increases from currently pending requests or from future requests. A significant amount of our in-force long-term care premium is in two states, New York and Florida. Historically, Florida has not approved our requests for rate increases for our long-term care business that we believe are warranted based on the underlying experience of that business. Additionally, many states are now requiring us to offer policyholders alternatives in lieu of rate increases, including reduced coverage or fully paid up policies. If we are unable to raise our premium rates because we fail to obtain approval in one or more jurisdictions, our financial results will be adversely affected. These policies contain guaranteed renewal features that make exiting unprofitable blocks of business difficult. Due to this feature, we cannot exit such business without regulatory approval, and accordingly, we may be required to continue to service those policies at a loss for an extended period of time. To the extent actual premium rate increases or loss experience vary from our acquisition date assumptions, adjustments to increase reserves could be required. There can be no assurance that rate increases we may seek will be approved by the applicable state regulators or, if approved, will be adequate to fully mitigate adverse loss experience. As a result of the inadequacy of the rates approved by Florida, among others, we were required to make a $15.5 million capital contribution to fund the statutory loss experience in our American Pioneer subsidiary.
The actuarial assumptions used to estimate reserves for long-term care policies are inherently uncertain due to the potential changes in trends in mortality, morbidity, persistency (the percentage of
34
policies remaining in-force) and interest rates. As a result, our long-term care reserves may be subject to material increases if these trends develop adversely to our expectations. We are evaluating strategic alternatives related to our Traditional insurance business, which includes our closed block of long-term care policies. Our long-term care business has and is expected to continue to generate losses, which has made disposing of this business challenging. While no decision has been made with respect to any course of action, if we were to divest this business, including a sale to an affiliate, it is likely that we would have to recognize a material loss on both a statutory and GAAP basis.
We perform loss recognition tests for our Traditional business at least annually in the fourth quarter, and more frequently if adverse events or changes in circumstances indicate that the level of the liability, together with the present value of future gross premiums, may not be adequate to provide for future expected policy benefits and maintenance costs. Based on the results of our loss recognition test in 2014, we determined the expected future premiums will be adequate to cover future claims expense, however, there can be no assurance they will continue to be sufficient in the future.
CMS's risk adjustment payment system, including the results of any RADV audits and budget neutrality factors, make our revenue and profitability difficult to predict and could result in material retroactive adjustments to our results of operations.
All of the Medicare Advantage programs we offer are subject to Congressional appropriation. As a result, our profitability is dependent, in large part, on continued funding for government healthcare programs at or above current levels. The reimbursement rates paid to health plans like ours by the federal government are established by contract, although the rates differ depending on a combination of factors such as a member's health status, age, gender, county or region, benefit mix, member eligibility categories, and the plans' risk scores.
CMS has implemented a risk adjustment model that apportions premiums paid to Medicare Advantage plans according to health severity. The risk adjustment model pays more for enrollees with predictably higher costs. Under this model, rates paid to Medicare Advantage plans are based on actuarially determined bids, which include a process whereby our prospective payments are based on a comparison of our beneficiaries' risk scores, derived from medical diagnoses, to those enrolled in the government's original Medicare program.
Under the risk adjustment methodology, all Medicare Advantage plans must capture, collect and submit the necessary diagnosis code information from inpatient and ambulatory treatment settings to CMS within prescribed deadlines. The CMS risk adjustment model uses this diagnosis data to calculate the risk adjusted premium payment to Medicare Advantage plans. We generally rely on providers to code their claim submissions with appropriate diagnoses, which we send to CMS as the basis for our payment received from CMS under the actuarial risk-adjustment model. We also rely on providers to appropriately document all medical data, including the diagnosis data submitted with claims. As a result of this process, it is difficult to predict with certainty our future revenue or profitability. CMS may also change the manner in which it calculates risk adjusted premium payments in ways that are adverse to us. For example, in the past, CMS proposed excluding for risk adjustment purposes the diagnosis codes obtained from in-home health risk assessments unless such codes are subsequently validated by a clinical encounter with a qualified provider. Over the past several years, we have utilized in-home health risk assessments for our Medicare Advantage members. Accordingly, if implemented, this change could have a material adverse effect on our payments from CMS and our results of operations. In addition, our own risk scores for any period may result in favorable or unfavorable adjustments to the payments we receive from CMS and our Medicare premium revenue. Because diagnosis coding is a manual process, there is the potential for human error in the recording of codings, and there can be no assurance that physicians, hospitals, and other health care providers are submitting accurate codings to us or that they will be successful in improving the accuracy of recording diagnosis code information and therefore our risk scores.
35
Beginning in 2008, CMS announced its intention to engage in a pilot program to more extensively audit a select group of Medicare Advantage plans in the area of hierarchical condition category, or HCC, coding for the determination of risk score revenue. These audits were labeled "Risk Adjustment Data Validation" audits, or RADV. RADV audits review medical record documentation in an attempt to validate provider coding practices and the presence of risk adjustment conditions which influence the calculation of premium payments to Medicare Advantage plans. On February 24, 2012, CMS released a final RADV audit and payment adjustment methodology which clarified many of the uncertainties arising from prior proposals. Under the final rule, CMS has indicated that it will now reduce the extrapolated contract level error rate found during the audits based on the error rate found in the Government's 'benchmark' audit data for Medicare fee-for-service population and is expected to be applied to the next round of RADV contract level audits to be conducted on 2011 premium payments. CMS will also continue with finalizing the results of its pre-2011 RADV audits, some of which may be announced in the near future. CMS has begun to conduct RADV audits of select Medicare Advantage plans and it is likely that one or more of our plans will be selected for future audits. CMS may discover coding errors during any RADV audits, which could require us to make significant payments to CMS or require significant payment adjustments, which could have a material adverse effect on our results of operations, financial position and cash flows.
Coincident with phase-in of the risk-adjustment methodology, CMS also adjusted payments to Medicare Advantage plans by a "budget neutrality" factor. CMS implemented the budget neutrality factor to prevent overall health plan payments from being reduced during the transition to the risk-adjustment payment model. CMS first developed the payment adjustments for budget neutrality in 2002 and began to use them with the 2003 payments. CMS began phasing out the budget neutrality adjustment in 2007 and fully eliminated it in 2011. The risk adjustment methodology and phase-out of the budget neutrality factor will reduce our plans' premiums unless our risk scores increase. We do not know if our risk scores will increase in the future or, if they do, that the increases will be large enough to offset the elimination of this adjustment. As a result of the CMS payment methodology described previously, the amount and timing of our CMS monthly premium payments per member may change materially, either favorably or unfavorably. In addition, the possibility exists that CMS may reduce revenues in the future for plans whose risk scores have increased significantly greater than the general Medicare average increase in risk scores. If our risk scores increase significantly greater than the general Medicare average increase, and CMS introduces this approach, it could adversely affect our results of operations.
On February 17, 2015, CMS issued a notice of continuation extending the timeline to February 16, 2016, for CMS to finalize rules regarding "overpayments" to Medicare Advantage plans. CMS' primary reasons for extending the time was the complexity of the rule and the scope of comments as well as CMS wanting more time to consult with HHS-OIG before finalizing this rule. While CMS delayed the issuance of the final rules regarding overpayments to Medicare Advantage plans, on February 18, 2015, CMS nonetheless issued a memo with guidance on reporting and returning Medicare Advantage identified overpayments to CMS. The four general categories of data submissions that have the potential to result in overpayments are (a) risk adjustment; (b) prescription drug event and direct and indirect remuneration; (c) low income premium subsidy for employer group waiver plans; and (d) other. The failure to report and return overpayments may result in potential liabilities under the False Claims Act and the imposition of other administrative penalties by CMS, which could adversely effect on our results of operations, financial position, or cash flows.
36
APS Healthcare's contracts with government agencies are tied to short-term customer contracts which are obtained through a complicated bidding process, may be terminated at the convenience of the governmental agencies, may be modified with limited notice, are subject to the availability of government funding and require us to comply with governmental regulations and policies.
We currently have contracts in the public sector with Medicaid programs in numerous states, which account for a significant portion of APS Healthcare's revenues. Contracts with governmental agencies are obtained primarily through a competitive bidding process which often is time consuming and complex and typically may be modified or terminated for the convenience of the government agency at any time. New or renewed contracts with governmental agencies are dependent upon the availability of government funding. We could fail to win contracts in the bidding process, or could lose contracts due to unilateral terminations by government agencies. Further, contracting with government agencies requires that we comply with various governmental regulations and policies; failure to comply could result in our being barred from obtaining future contracts with the applicable agency and substantial fines.
The majority of APS Healthcare's revenues are derived from Medicaid. In addition, most of APS Healthcare's contracts are terminable on short notice. As a result of fiscal budgetary and other issues, it is possible that Medicaid funding could be reduced, the counterparty to our Medicaid contracts (state or Medicaid agency) may delay payment to us for many months, or APS Healthcare's contracts could be terminated or amended in an adverse manner, which could have a material adverse effect on APS Healthcare's revenues and operating results.
APS Healthcare's contracts with clients generally provide for initial terms of one to three years, but oftentimes may be terminated early without cause. Several of APS' largest and most profitable contracts are up for renewal in 2015. In February 2015, we sold the APS Puerto Rico business to a third party. We expect APS Healthcare's revenues and profits to decrease during 2015 as compared to 2014. The termination of, or our inability to renew or extend, contracts with our clients could lead to decreased revenues and profitability. In addition, certain of the customer contracts contain performance guarantees of various kinds, including operational performance guarantees, guarantees relating to the achievement of health goals as demonstrated by population based clinical measures and guarantees relating to the reduction of overall health costs experienced by the client. Further, certain of the contracts contain liquidated damages provisions for nonperformance that can be assessed in significant amounts. Our failure to meet these performance guarantees could lead to reduced revenue and profitability.
Our results of operations will be adversely affected if our insurance premium rates are not adequate.
Our results of operations depend on our ability to charge and collect premiums sufficient to cover our health care costs, expenses of distribution and operations and provide a reasonable margin. Although we attempt to base the premiums we charge on our estimate of future health care costs, we may not be able to control the premiums we charge as a result of competition, government regulations and other factors. Our results of operations could be adversely affected if we are unable to set premium rates at appropriate levels or adjust premium rates in the event our health care costs increase.
We set the premium rates on our insurance policies based on facts and circumstances known at the time we issue the policies and on assumptions about numerous variables, such as:
- •
- the actuarial probability of a policyholder incurring a claim;
- •
- the severity and duration of the claim;
- •
- the mortality rate of our policyholder base;
- •
- the persistency or renewal rate of our policies in force;
37
- •
- our commission and policy administration expenses; and
- •
- the interest rate earned on our investment of premiums.
In setting premium rates, we consider historical claims information, industry statistics and other factors. We cannot be assured that the data and assumptions used at the time of establishing premium rates will prove to be correct and that premiums will be sufficient to cover benefits and expenses plus a reasonable margin.
For certain of our Traditional products, we can periodically file for rate increases, if our actual claims experience proves to be less favorable than we assumed. If we are unable to raise our premium rates, our net income may decrease. We generally cannot raise our premiums in any state unless we first obtain the approval of the insurance regulator in that state. We have not been able to obtain approvals for rate increases at the levels we have requested on our closed-block of long term care business, which has contributed to our incurring losses on this block. We review the adequacy of our accident and health premium rates regularly and file rate increases on our products when we believe permitted premium rates are too low. When determining whether to approve or disapprove our rate increase filings, the various state insurance departments take into consideration:
- •
- our actual claims experience compared to expected claims experience;
- •
- the block's credibility;
- •
- policy persistency, which means the percentage of policies that are in-force at specified intervals from the issue date compared to the total amount originally issued;
- •
- investment income; and
- •
- medical cost inflation.
If the regulators do not believe these factors warrant a rate increase, it is possible that we will not be able to obtain approval for premium rate increases from currently pending requests or requests filed in the future. If we are unable to raise our premium rates because we fail to obtain approval for rate increases in one or more states, our net income may decrease. If we are successful in obtaining regulatory approval to raise premium rates, the increased premium rates may cause existing policyholders to let their policies lapse. This would reduce our premium income in future periods. Increased lapse rates also could require us to expense all or a portion of the deferred policy costs relating to lapsed policies in the period in which those policies lapse, reducing our net income in that period. For example, we have not been successful in obtaining rate increases for certain portions of our long-term care block of business and there can be no assurance that our expected future premiums will be adequate to cover the future claims expense of this block of business.
The bidding process for our Medicare Advantage plans may adversely affect our profitability.
Payments for the Medicare Advantage health plans are based on a bidding process that may decrease the amount of premiums paid to us or cause us to increase the benefits we offer to our members. We are required to submit Medicare Advantage bids annually, approximately six months in advance of the corresponding benefit year. We attempt to use the best available member eligibility, claims and risk score data at the time of developing the bids. Furthermore, we make actuarial assumptions about the utilization of benefits in our plans and the impact of government regulations. However, these assumptions are subject to significant judgment and we cannot be assured that the data and assumptions used at the time of bid development will prove to be correct and that premiums will be sufficient to cover member benefits plus a reasonable margin. In addition, during the 2015 annual election period, we significantly grew our Medicare Advantage membership in our Northeast markets, increasing membership by approximately 27%. At this time, the full health status of these new members
38
is not yet known, particularly in comparison to the assumptions that we made in our 2015 bid. As a result, we may incur higher than expected medical expenses from these new members.
If our bid assumptions are too low and member claims are higher than anticipated, we could be required to expend significant unanticipated amounts which could have a material adverse effect on our business, profitability and results of operations.
Because our Medicare Advantage premiums, which generate most of our Medicare Advantage revenues, are fixed by contract, we are unable to increase our Medicare Advantage premiums during the contract term if our corresponding medical benefits expense exceeds our estimates which can adversely affect our results of operations.
Most of our Medicare Advantage revenues are generated by premiums consisting of fixed monthly payments per member. We use a significant portion of our revenues to pay the costs of health care services delivered to our members. The principal costs consist of claims payments, capitation payments and other costs incurred to provide health insurance coverage to our members. Generally, premiums in the health care business are fixed on an annual basis by contract, and we are obligated during the contract period to provide or arrange for the provision of healthcare services as established by the federal government.
We are unable to increase the premiums we receive under these contracts during the then-current term. If our medical expenses exceed our estimates, except in very limited circumstances, or as a result of risk score adjustments for member acuity, we generally cannot recover costs we incur in excess of our medical cost projections in the contract year through higher premiums. As a result, our profitability depends, to a significant degree, on our ability to adequately predict and effectively manage our medical expenses related to the provision of healthcare services. Accordingly, the failure to adequately predict and control medical expenses and to make reasonable estimates and maintain adequate accruals for incurred but not reported claims, known as IBNR, may have a material adverse effect on our financial condition, results of operations, or cash flows. If our estimates of reserves are inaccurate, our ability to take timely corrective actions or to otherwise establish appropriate premium pricing could be adversely affected. Failure to adequately price our products or to estimate sufficient medical claim reserves may result in a material adverse effect on our financial position, results of operations and cash flows. In addition, to the extent that CMS or Congress takes action to reduce the levels of payments to Medicare Advantage providers, our revenues would be adversely affected.
We estimate the costs of our future medical claims and other expenses using actuarial methods and assumptions based upon claim payment patterns, cost trends, product mix, seasonality, medical inflation, historical developments, such as claim inventory levels and claim receipt patterns, and other relevant factors. We continually review estimates of future payments relating to medical claims costs for services incurred in the current and prior periods and make necessary adjustments to our reserves. However, historically, our medical expenses as a percentage of premium revenue have fluctuated. The principal factors that may cause medical expenses to exceed our estimates are:
- •
- increased utilization of medical facilities and services and prescription drugs (e.g., new treatments or drugs such as those associated with treatments for Hepatitis C);
- •
- increased cost of services;
- •
- our membership mix;
- •
- variances in actual versus estimated levels of cost associated with new products, benefits or lines of business;
- •
- product changes or benefit level changes;
39
- •
- periodic renegotiation of hospital, physician and other provider contracts, or the consolidation of these entities;
- •
- membership in markets lacking adequate provider networks;
- •
- changes in the demographics of our members and medical trends affecting them;
- •
- termination of capitation arrangements resulting in the transfer of membership to fee-for-service arrangements or loss of membership;
- •
- the occurrence of acts of terrorism, public health epidemics or other wide spread health emergencies such as higher incidence of the flu, severe weather events or other catastrophes;
- •
- the introduction of new or costly treatments, specialty drugs (such as drugs to treat Hepatitis C) and technologies;
- •
- medical cost inflation or changes in the economy;
- •
- government mandated benefits or other regulatory changes; and
- •
- contractual disputes with hospitals, physicians and other providers
- •
- other unforeseen occurrences.
Because of the relatively high average age of the Medicare population, medical expenses for our Medicare Advantage plans may be particularly difficult to control. We may not be able to continue to manage these expenses effectively in the future. If our medical expenses increase, our profits could be reduced or we may not remain profitable.
We hold reserves for expected claims, which are estimated, and these estimates involve an extensive degree of judgment. If actual claims exceed reserve estimates, our results could be materially adversely affected.
Our benefits incurred expense reflects estimates of IBNR. We, together with our internal and external consulting actuaries, estimate our claim liabilities using actuarial methods based on historical data adjusted for payment patterns, cost trends, product mix, seasonality, utilization of healthcare services and other relevant factors. Actual conditions, however, could differ from those assumed in the estimation process, and those differences could be material. Due to the uncertainties associated with the factors used in these assumptions, the actual amount of benefit expense that we incur may be materially more or less than the amount of IBNR originally estimated, and materially different amounts could be reported in our financial statements for a particular period under different conditions or using different assumptions. We make adjustments, if necessary, to benefits incurred expense when the criteria used to determine IBNR change and when we ultimately determine actual claim costs. If our estimates of IBNR are inadequate in the future, our reported results of operations will be adversely affected. Further, our inability to estimate IBNR accurately may also affect our ability to take timely corrective actions or otherwise establish appropriate premium pricing, further exacerbating the extent of any adverse effect on our results.
Our reserves for future insurance policy benefits and claims on our Traditional business may prove to be inadequate, requiring us to increase liabilities and resulting in reduced net income and stockholders' equity.
We calculate and maintain reserves for the estimated future payment of claims to our insurance policyholders using the same actuarial assumptions that we use to set our premiums. For our traditional accident and health insurance business, we establish active life reserves for expected future policy benefits, plus a liability for due and unpaid claims, claims in the course of settlement, and incurred but not reported claims. Many factors can affect these reserves and liabilities, such as economic and social conditions, inflation, hospital and medical costs, changes in mortality, changes in persistency, changes in utilization, changes in state regulations, our ability to obtain rate increases, changes in doctrines of legal liability and extra-contractual damage awards. Therefore, we necessarily base our reserves and
40
liabilities on extensive estimates, assumptions and prior years' statistics. When we acquire other insurance companies or blocks of insurance, our assessment of the adequacy of acquired policy liabilities is subject to similar estimates and assumptions. Establishing reserves involves inherent uncertainties, and it is possible that actual claims could materially exceed our reserves and have a material adverse effect on our results of operations and financial condition. Our net income depends significantly upon the extent to which our actual claims experience is consistent with the assumptions we used in setting our reserves and pricing our policies. If our assumptions with respect to future claims are incorrect, and our reserves are insufficient to cover our actual losses and expenses, we would be required to increase our liabilities resulting in reduced net income, statutory surplus and stockholders' equity.
We may experience higher than expected loss ratios which could materially adversely affect our results of operations.
We may experience higher than expected loss ratios if health care costs exceed our estimates. Additionally, our experience may be subject to increased variability as our Traditional business continues to decline due to the run off of the in force business with no new business being added since we discontinued marketing and selling new Traditional business in June 2012. Factors that may cause health care costs to exceed our estimates include:
- •
- an increase in the cost of health care services and supplies, including pharmaceuticals;
- •
- higher than expected utilization of health care services;
- •
- antiselection, where we are left with less healthy policyholders;
- •
- periodic renegotiations of hospital, physician and other provider contracts;
- •
- the occurrence of catastrophic events, including epidemics and natural disasters;
- •
- general inflation or economic downturns;
- •
- new mandated benefits or other regulatory changes that increase our costs; and
- •
- other unforeseen occurrences.
We seek to take appropriate actions in an effort to reverse any upward trend in our loss ratios; however, we can make no assurances that these actions will be sufficient. We also cannot give assurance that our loss ratios will not continue to increase beyond what we currently anticipate, and any increases could materially adversely affect our results of operations.
In addition, medical liabilities in our financial statements include our estimated reserves for incurred but not reported and reported but not paid claims. The estimates for medical liabilities are made on an accrual basis. We believe that our reserves for medical liabilities are adequate, but we cannot assure you of this. Any adjustments to our medical liabilities could adversely affect our results of operations.
Compliance with the terms and conditions of our Corporate Integrity Agreements requires significant resources and, if we fail to comply, we could be subject to penalties or excluded from participation in government healthcare programs, which could have a material adverse effect on our financial condition and results of operations.
In September 2011, in connection with the settlement of a False Claims Act action involving the sales and marketing practices of our Wisconsin HMO Plans, we entered into a five-year Corporate Integrity Agreement with the Office of Inspector General of the United States Department of Health and Human Services ("HHS-OIG"). In addition, prior to our acquisition of APS Healthcare, in February 2011, Innovative Resource Group, LLC, one of the subsidiaries we acquired as part of the APS Healthcare transaction, entered into a five-year Corporate Integrity Agreement with HHS-OIG
41
relating to its Medicaid contract in the State of Georgia. The Corporate Integrity Agreements provide that we will, among other things, maintain a compliance program, including a corporate compliance officer, compliance officers and compliance committees, a code of conduct, comprehensive compliance policies, training and monitoring, a compliance hotline, an open door policy and a disciplinary process for compliance violations. The Corporate Integrity Agreements also require us to engage independent third parties to review compliance with our obligations under each of the Corporate Integrity Agreements and submit various reports to HHS-OIG. Failure to comply with the obligations under the Corporate Integrity Agreements could have material consequences for us including monetary penalties, exclusion from participation in federal healthcare programs and/or subject to prosecution, which could have a material adverse effect on our financial condition and results of operations.
We are required to comply with laws governing the transmission, security and privacy of health information that require significant compliance costs, and any failure to comply with these laws could result in material criminal and civil penalties.
Regulations under HIPAA require us to comply with standards regarding the exchange of health information within our company and with third parties, such as healthcare providers, business associates and our members. The HITECH Act broadened the scope of the privacy and security regulations of HIPAA and mandates individual notification in the event of certain breaches of individually identifiable health information and provides enhanced penalties for HIPAA violations. These regulations impose standards for common healthcare transactions, such as:
- •
- claims information, plan eligibility, and payment information;
- •
- unique identifiers for providers and employers;
- •
- security;
- •
- privacy; and
- •
- enforcement.
HIPAA also provides that to the extent that state laws impose stricter privacy standards than HIPAA privacy regulations, HIPAA does not preempt the state standards and laws.
Given the complexity of the HIPAA regulations, the possibility that the regulations may change, and the fact that the regulations are subject to changing and potentially conflicting interpretation, our ability to maintain compliance with the HIPAA requirements is uncertain and the costs of compliance are significant. Furthermore, a state's ability to promulgate stricter laws, and uncertainty regarding many aspects of state requirements, make compliance more difficult. To the extent that we submit electronic healthcare claims and payment transactions that do not comply with the electronic data transmission standards established under HIPAA, payments to us may be delayed or denied. Additionally, the costs of complying with any changes to the HIPAA regulations may have a negative impact on our operations. We could be subject to criminal penalties and civil sanctions for failing to comply with the HIPAA health information provisions, which could result in the incurrence of significant monetary penalties. In addition, our failure to comply with state health information laws that may be more restrictive than the regulations issued under HIPAA could result in additional penalties.
42
Compliance with HIPAA and other privacy regulations requires significant systems enhancements, training and administrative effort. HIPAA could also expose us to additional liability for violations by our business associates. A business associate is a person or entity, other than a member of our work force, who on behalf of us performs or assists in the performance of a function or activity involving the use or disclosure of individually identifiable health information, or provides legal, accounting, consulting, data aggregation, management, administrative, accreditation or financial services. Because we are ultimately responsible for many of the acts of our business associates, any failure of such third parties to comply with HIPAA or other privacy regulations could cause us to incur civil or criminal penalties, including significant damage to our reputation.
In 2013, the United States Department of Health and Human Services issued the omnibus final rule on HIPAA privacy, security, breach notification requirements and enforcement requirements under the HITECH Act, and a final regulation for required changes to the HIPAA Privacy Rule for the Genetic Information Nondiscrimination Act, or GINA. Our failure to comply with the omnibus final rule or the failure of our business associates to comply with HIPAA, the HITECH ACT, GINA, or other privacy regulations could cause us to incur civil or criminal penalties, including significant damage to our reputation.
Legal and regulatory investigations and actions are increasingly common in the insurance and managed care business and may result in financial losses and harm our reputation.
We face a significant risk of class action lawsuits and other litigation and regulatory investigations and actions in the ordinary course of operating our businesses. Due to the nature of our businesses, we are subject to a variety of legal and regulatory actions relating to our business operations, such as the design, management and offering of products and services. The following are examples of the types of potential litigation and regulatory investigations we face:
- •
- claims under the False Claims Act or State whistleblower statutes;
- •
- claims by government agencies, including CMS and state agencies with authority over that state's Medicaid program, relating to compliance with laws and regulations;
- •
- claims relating to sales or underwriting practices;
- •
- claims relating to the methodologies for calculating premiums;
- •
- claims relating to the denial or delay of health care benefit payments;
- •
- claims relating to claims payments and procedures;
- •
- additional premium charges for premiums paid on a periodic basis;
- •
- claims relating to the denial, delay or rescission of insurance coverage;
- •
- challenges to the use of software products used in running our business;
- •
- claims relating to provider marketing;
- •
- anti-kickback claims;
- •
- medical malpractice or negligence actions based on our medical necessity decisions or brought against us on the theory that we are liable for our providers' alleged malpractice or negligence;
- •
- medical malpractice or negligence actions related to the operation of our care management programs or in the operation of mental health clinics in Puerto Rico;
- •
- claims relating to product design;
- •
- allegations of anti-competitive and unfair business activities;
43
- •
- provider disputes over compensation and termination of provider contracts;
- •
- allegations of discrimination;
- •
- claims related to the failure to disclose business practices;
- •
- allegations of breaches of duties to members or customers;
- •
- allegations of infringement of intellectual property rights of third parties;
- •
- claims relating to inadequate or incorrect disclosure or accounting in our public filings;
- •
- allegations of agent misconduct;
- •
- claims related to deceptive trade practices;
- •
- claims related to the quality of our networks (e.g., credentialing) or the quality of medical services rendered by our providers (e.g., vicarious liability for medical services);
- •
- claims relating to suitability of annuity products; and
- •
- claims relating to customer audits and contract performance (including our contracts with CMS for our Medicare Advantage and ACO companies).
As a provider of health insurance, we are subject to the False Claims Act, which provides, in part, that the federal government may bring a lawsuit against any person or entity who it believes has knowingly presented, or caused to be presented, a false or fraudulent request for payment from the federal government, or who has made a false statement or used a false record to get a claim approved. Violations of the False Claims Act are punishable by treble damages and penalties of up to a specified dollar amount per false claim. In addition, a special provision under the False Claims Act allows a private person (for example, a "whistleblower" such as a disgruntled employee, competitor or member) to bring an action under the False Claims Act on behalf of the government alleging that an entity has defrauded the federal government and permits the private person to share in any settlement of, or judgment entered in, the lawsuit.
Plaintiffs in class action and other lawsuits against us may seek very large or indeterminate amounts, and punitive and treble damages, which may remain unknown for substantial periods of time. We are also subject to various regulatory inquiries, such as information requests, formal and informal inquiries, subpoenas and books and record examinations, from state and federal regulators and other authorities, including the Securities and Exchange Commission. A substantial legal liability or a significant regulatory action against us could have an adverse effect on our business, financial condition and results of operations.
We cannot predict the outcome of actions we face with certainty, and we have incurred and are incurring expenses in the defense of our past and current matters. We also may be subject to additional litigation in the future. Litigation could materially adversely affect our business or results of operations because of the costs of defending these cases, the costs of settlement or judgments against us, or the changes in our operations that could result from litigation. The defense of any these actions may be time-consuming and costly, and may distract our management's attention. In addition, we could suffer significant harm to our reputation, which could have an adverse effect on our business, financial condition and results of operations. As a result, we may incur significant expenses and may be unable to effectively operate our business.
Potential liabilities may not be covered by insurance or indemnity, insurers or indemnifying parties may dispute coverage or may be unable to meet their obligations or the amount of our insurance or indemnification coverage may be inadequate. In some cases, treble damages may be sought. In addition, some types of damages, such as punitive damages or damage for willful acts, may not be covered by insurance. The cost of business insurance coverage has increased, and may in the future
44
increase, significantly. Insurance coverage for all or some forms of liability may become unavailable or prohibitively expensive in the future. We cannot assure you that we will be able to obtain insurance coverage in the future, or that insurance will continue to be available on a cost-effective basis, if at all.
The health care industry continues to receive significant negative publicity regarding the public's perception of it. This publicity and public perception have been accompanied by increased litigation, in some cases resulting in large jury awards, legislative activity, regulation, and governmental review of industry practices.
These factors, as well as any negative publicity about us in particular, could adversely affect our ability to market our products or services and to attract and retain members, may adversely affect our relationship with providers, may require us to change our products or services, may increase the regulatory burdens under which we operate and may require us to pay large judgments or fines. Any combination of these factors could further increase our cost of doing business and adversely affect our financial position, results of operations and cash flows.
Our business may be materially adversely impacted by CMS's adoption of the new coding set for diagnoses.
ICD-9, the current system of assigning codes to diagnoses and procedures associated with hospital utilization in the United States was scheduled to be replaced by ICD-10 code sets on October 1, 2014. However, on April 1, 2014, ICD-10 implementation was delayed until at least October 1, 2015. Implementing the new coding set is complex and will require significant resources, in terms of both time and expense. If we do not adequately implement the new coding set, or if our network providers do not adequately transition to the new ICD-10 coding set, our business and results of operations may be materially adversely affected.
We rely on the accuracy of information provided by CMS regarding the eligibility of an individual to participate in our Medicare Advantage plans, the list of Medicare fee-for-service beneficiaries assigned to our ACOs, and any inaccuracies in those lists could cause CMS to recoup premium payments from us with respect to members who turn out not to be ours, or could cause us to pay benefits in respect of members who turn out not to be ours, which could reduce our revenue and profitability, or result in us expending resources in attempting to manage the care of such individuals.
Premium payments that we receive from CMS are based upon eligibility lists produced by federal and local governments. From time to time, CMS requires us to reimburse it for premiums that we received from CMS based on eligibility and dual-eligibility lists that CMS later discovers contained individuals who were not in fact residing in our service areas or eligible for any government-sponsored program or were eligible for a different premium category or a different program. We may have already provided services to these individuals and reimbursement of amounts paid on behalf of services provided to them may be unrecoverable. In addition to recoupment of premiums previously paid, we also face the risk that CMS could fail to pay us for members for whom we are entitled to payment. Our profitability would be reduced as a result of this failure to receive payment from CMS if we had made related payments to providers and were unable to recoup these payments from them.
Further, our ACOs receive periodic lists of beneficiaries that are assigned to the ACOs. These lists are based on claims experience for certain primary care services. Since CMS adjusts the lists of assigned beneficiaries from time to time, we may expend significant resources on individuals who are not in fact ultimately assigned to our ACOs. This may have a material adverse effect on our ACO business. Further, CMS provides our ACOs with certain historic and current data based on paid claims which is used for a variety of purposes, including, but not limited to, (a) used by CMS to (i) establish the benchmark for an ACO; (ii) calculate beneficiary assignment; and (iii) calculate shared savings; and (b) used by our ACOs to (i) track and trend current medical costs of assigned beneficiaries; (ii) project cost savings, if any, relative to the benchmark established by CMS; and (iii) stratify assigned
45
beneficiaries to identify those with chronic conditions who may benefit from care coordination activities. The failure of CMS to provide timely or accurate data or errors in our processing and evaluation of such data could have a material adverse effect on our ACO business.
If we are unable to develop and maintain satisfactory relationships with the providers of care to our members and ACO beneficiaries, our profitability could be adversely affected and we may be precluded from operating in some markets.
We contract with physicians, hospitals and other providers to deliver health care to our members. Our Medicare Advantage products, ACOs and certain Medicaid offerings encourage or require our customers to use these contracted providers. In some circumstances, these providers may share medical cost risk with us or have financial incentives to deliver quality medical services in a cost-effective manner. Our operations and profitability are significantly dependent upon our ability to not only enter into appropriate cost-effective contracts with hospitals, physicians and other healthcare providers that have convenient locations for our members in our geographic markets, but to maintain good working relationships with such providers. More specifically, the success of our ACO business is highly dependent on building and maintaining strong relationships with our ACO providers, and if the providers in our ACOs become dissatisfied with our performance or disengaged, it could have a material adverse effect on the results of our ACO business.
In addition, given the rapidly changing environment for healthcare providers, many providers are considering joining larger health systems, including hospitals, which could negatively impact our business. In the long term, our ability to contract successfully with a sufficiently large number of providers in a particular geographic market will affect the relative attractiveness of our Medicare Advantage, ACOs, and managed care products in that market. Any difficulty in contracting with providers in a market could preclude us from renewing or from entering our Medicare contracts in that market. We will be required to establish acceptable provider networks prior to entering new markets. We may be unable to maintain our relationships with our network providers or enter into agreements with providers in new markets on a timely basis or under favorable terms. In any particular market, providers could refuse to contract with us, demand to contract with us, demand higher payments, or take other actions that could result in higher health care costs for us, less desirable products for members, disruption of benefits to our members, or difficulty meeting regulatory or accreditation requirements. In some markets, some providers, particularly hospitals, physician specialty groups, physician/hospital organizations or multi-specialty physician groups, may have significant market positions and negotiating power. In addition, physicians, hospitals, independent practice associations and other groups of providers may compete directly with us. Such competition may impact our relationships with those or other providers, adversely affect our products, benefits, or pricing of such products, and may require us to incur additional costs to change our operations, and our results of operations, financial position and cash flows could be adversely affected.
In some situations, we have contracts with individual or groups of primary care physicians for a fixed, per-member-per-month fee under which physicians are paid an amount to provide all required medical services to our members. This type of contract is referred to as a "capitation" contract. The inability of providers to properly manage costs under these capitation arrangements can result in the financial instability of these providers and the termination of their relationship with us. In addition, payment or other disputes between a primary care provider and specialists with whom the primary care provider contracts can result in a disruption in the provision of services to our members or a reduction in the services available to our members. The financial instability or failure of a primary care provider to pay other providers for services rendered could lead those other providers to demand payment from us even though we have made our regular fixed payments to the primary provider. There can be no assurance that providers with whom we contract will properly manage the costs of services, maintain financial solvency or avoid disputes with other providers. In addition, there continues to be significant competition in our markets to employ, contract with or acquire physicians and physician practices which could make it difficult for us to maintain our current relationships. Any of these events could have an adverse effect on the provision of services to our members and our operations, resulting in loss of membership or higher healthcare costs or other adverse effects.
46
A reduction in the number of members in our Medicare Advantage plans could adversely affect our results of operations.
During the 2015 selling season, while we grew our Medicare Advantage membership in our core markets, our total membership declined as we exited certain non-core markets, primarily private fee for service and rural markets. We also experienced membership losses during prior years and exited other markets where we determined we could not positively impact the cost and quality of healthcare. In the future, we may choose to exit additional markets and may suffer membership losses. If we are unable to maintain and grow our membership levels, our business could deteriorate which could have a material adverse effect on our results of operations. A reduction in our membership could also make it more difficult to lower our administrative expense ratio to appropriate levels. The principal factors that could contribute to the loss of membership are:
- •
- regulatory changes, such as the 45 Day Call Letter issued in February 2015 by CMS and the final rule to be issued in April 2015, which may substantially reduce the benchmark reimbursement rates we receive from CMS and cause us to exit certain service areas;
- •
- regulatory changes, such as MIPPA, which resulted in the loss of approximately 60,000 members as of January 1, 2011;
- •
- regulatory actions, such as the CMS sanctions imposed in November 2010, which prevented us from marketing and enrolling new Medicare Advantage members for a significant portion of the 2011 selling season;
- •
- proposals by state health commissions, including the Texas Health and Human Services Commission, to assign Medicare dual-eligibles to Medicaid managed care organizations;
- •
- competition in premium or plan benefits from other health care benefit companies;
- •
- competition from physicians or other provider groups who may elect to form their own health plans;
- •
- poor Star Ratings relative to our competitors;
- •
- inability to develop and maintain satisfactory relationships with the providers of care to our members;
- •
- increases in our premiums or changes in our benefits provided;
- •
- our exit from a market or the termination of a health plan;
- •
- negative publicity and news coverage relating to our company or the managed health care industry generally;
- •
- insufficient distribution channels in a particular area;
- •
- general economic conditions that induce beneficiaries to cancel their coverage; and
- •
- catastrophic events, such as epidemics, natural disasters, man-made catastrophes and other unforeseen occurrences.
We derive a substantial portion of our Medicare Advantage HMO revenues and profits from Medicare Advantage HMO operations in Southeast Texas. Legislative actions, economic conditions or other factors that adversely affect those operations could materially reduce our revenues and profits.
We derive a substantial portion of our Medicare Advantage HMO revenues and profits from Medicare Advantage HMO operations in Southeast Texas. If we are unable to continue to operate in Southeast Texas, or if we must significantly curtail our current operations in any portion of Southeast Texas, our revenues will decrease materially. Our reliance on our operations in Southeast Texas could
47
cause our revenues and profitability to change suddenly and unexpectedly, depending on legislative and regulatory actions, economic conditions, competitive actions and similar factors.
We may experience higher than expected lapsation in our Medicare supplement business, reducing the revenues and profits for this business faster than anticipated.
We have in the past experienced higher than expected lapsation in our Medicare supplement business. We believe competitive pressure from other Medicare supplement companies and Medicare Advantage products, as well as the departure of some of our sales managers, and other factors, contributed to the level of lapsation. In addition, during 2012, we discontinued selling new Medicare Supplement products. This excess lapsation results in a faster than anticipated decline in this block of business and required us to accelerate the amortization of the deferred acquisition cost and present value of future profits assets associated with the business that lapsed. Continued higher than expected lapsation of our Medicare supplement business would reduce the revenues and profits for this business faster than anticipated.
Our business and its growth are subject to risks related to difficulties in the financial markets and general economic conditions.
Over the past several years, financial markets around the world experienced extreme disruption, including, among other things, extreme volatility in security prices, severely diminished liquidity and credit availability, rating downgrades and declining or indeterminate valuations of many investments and declines in real estate values. Governments took unprecedented actions intended to address these market conditions. While currently these conditions have not impaired our ability to access credit markets and finance our operations, largely because our financing has generally come from internal cash generation, there can be no assurance that there will not be a further deterioration in financial markets and confidence in major economies or that any deterioration in markets or confidence will not impair our ability to access credit markets and finance our operations.
These economic developments affect businesses such as ours in a number of ways, many of which we cannot predict. Among the potential effects could be further write-downs in the value of investments we hold and an inability to access credit markets should we require external financing. In addition, it is possible that economic conditions, and resulting budgetary concerns, could prompt the federal, state and local governments to make changes in the Medicare or Medicaid programs, which could adversely affect our results of operations. We are unable to predict the likely duration and severity of the current disruptions in financial markets and adverse economic conditions, or the effects these disruptions and conditions could have on us.
Failure to comply with covenants in our Credit Facility could materially and adversely affect us.
In 2012 we entered into a new Credit Facility which provided for a (i) $150 million term loan credit facility and (ii) a $75 million revolving credit facility. The Credit Facility contains customary restrictions, covenants, events of default and other terms, including financial covenants and we have granted the lenders a customary collateral package.
These restrictions and covenants may limit our ability to, among other things:
- •
- pay dividends and redeem our capital stock;
- •
- incur additional indebtedness;
- •
- create liens on our assets;
- •
- conduct material transactions with our affiliates except on an arm's length basis; and
48
- •
- acquire or dispose of assets or merge or consolidate with, or transfer all or substantially all our assets to, another person.
Under the Credit Facility, we are required to meet specified financial covenants as described above. We amended the Credit Facility in November 2013 to suspend certain financial covenants, including the consolidated leverage and debt service ratios, replacing them with total debt to capitalization and minimum liquidity ratios. These new financial covenants remained in effect through December 31, 2014. Effective January 1, 2015, the original financial covenants were reinstated. As of December 31, 2014, and throughout the entire amendment period, we were in compliance with all financial covenants, as amended. If we fail to maintain compliance with the financial covenants and are not able to obtain relief from any covenant violation, then an event of default could occur and the lenders could cease lending to us and accelerate the payments of our debt. Any such action by the lenders could materially and adversely affect us. The interests of our lenders may be different from ours and we may be unable to obtain our lenders' consent when and if needed, to engage in certain actions or obtain relief from any covenant violation. In addition, we may not be able to incur debt on terms acceptable to us. If we do not comply with the restrictions and covenants in the Credit Facility or any other debt instrument we may enter into, our results of operations, financial condition and ability to pay dividends will be harmed.
We may suffer losses due to fraudulent activity, which could adversely affect our financial condition and results of operation.
Traditional Medicare and Medicare Advantage plans have been subject to fraudulent activity perpetrated by actual and purported beneficiaries and providers, as well as others. In 2009, we incurred significant losses as a result of a fraudulent scheme or a group of similar fraudulent schemes. While we have undertaken efforts to prevent these schemes, there can be no assurance that we will not again become the target of fraud, or that we will detect fraud prior to incurring losses. The need to expend effort and construct infrastructure to combat fraud requires significant expenditures. These expenditures, and losses arising from any fraud that we suffer, could have a material adverse effect on our financial condition and results of operations.
The occurrence of natural or man-made disasters could adversely affect our financial condition and results of operation.
We are exposed to various risks arising out of natural disasters, such as:
- •
- earthquakes;
- •
- hurricanes;
- •
- floods, tornadoes;
- •
- pandemic health events such as avian influenza; and
- •
- man-made disasters, such as acts of terrorism, political instability and military actions.
For example, a natural or man-made disaster could lead to unexpected changes in persistency rates as policyholders and members who are affected by the disaster may be unable to meet their contractual obligations, such as payment of premiums on our insurance policies. The continued threat of terrorism and ongoing military actions may cause significant volatility in global financial markets, and a natural or man-made disaster could trigger an economic downturn in the areas directly or indirectly affected by the disaster. These consequences could, among other things, result in a decline in business and increased claims from those areas. Disasters also could disrupt communications and financial services and other aspects of public and private infrastructure, which could disrupt our normal business operations.
49
A natural or man-made disaster also could disrupt the operations of our counterparties or result in increased prices for the products and services they provide to us. In addition, a disaster could adversely affect the value of the assets in our investment portfolio if it affects companies' ability to pay principal or interest on their securities.
If we are unsuccessful in our acquisitions or dispositions it may have an adverse effect on our business, growth plans, financial condition and results of operations.
The rapid changes and complexity of our operations has placed, and will continue to place, significant demands on our management, operations systems, accounting systems, internal control systems and financial resources. As part of our strategy, we have pursued, and may continue to pursue, growth through acquisitions, joint ventures and similar strategic partnerships. Our acquisition of APS Healthcare has not been successful and during 2013 we recorded $189.4 million of asset impairment charges relating to APS Healthcare. Even though we are actively managing the current APS contracts and taking steps to bring APS to profitability, we expect APS Healthcare's revenues and profits to deteriorate in the near term, which may result in a further degradation of the remaining value of the business and an entire loss of our investment. From time to time, we may also seek to dispose of assets or businesses that no longer meet our strategic objectives.
These transactions involve numerous risks, some of which we have experienced in the past, such as:
- •
- difficulties in the integration of operations, technologies, products, systems and personnel of the acquired company;
- •
- diversion of financial and management resources from existing operations;
- •
- potential increases in policy lapses;
- •
- potential losses from unanticipated litigation, undiscovered or undisclosed liabilities or unanticipated levels of claims relating to either the pre- or post-acquisition periods;
- •
- inability to generate sufficient revenue to offset acquisition costs;
- •
- loss of key customer accounts;
- •
- loss of key provider contracts or renegotiation of existing contracts on less favorable terms; and
- •
- other systems and operational integration risks.
In addition, we generally are required to obtain regulatory approval from one or more governmental agencies when making acquisitions, dispositions or other strategic transactions, which may require a public hearing, regardless of whether we already operate a plan in the state in which the business to be acquired is located. We may be unable to comply with these regulatory requirements for an acquisition, disposition or other strategic transaction in a timely manner, or at all. Moreover, some sellers may insist on selling assets that we may not want, such as commercial lines of business, or transferring their liabilities to us as part of the sale of their companies or assets. Even if we identify suitable acquisition targets, we may be unable to complete acquisitions or obtain the necessary financing for acquisitions on terms favorable to us, or at all.
To the extent we complete a strategic transaction, we may be unable to realize the anticipated benefits from it because of operational factors or difficulties in integrating the following or other aspects of acquisitions with our existing businesses:
- •
- additional employees who are not familiar with our operations;
- •
- new provider networks, which may operate on terms different from our existing networks;
50
- •
- additional members, who may decide to transfer to other healthcare providers or health plans;
- •
- disparate information technology, claims processing and record keeping systems; and
- •
- accounting policies, some of which require a high degree of judgment or complex estimation processes, such as estimates of reserves, IBNR claims, valuation and accounting for goodwill and intangible assets, stock-based compensation and income tax matters.
For all of the above reasons, we may not be able to implement our acquisition strategy successfully, which could materially adversely affect our growth plans and on our business, financial condition and results of operations.
Furthermore, in the event of an acquisition or investment, you should be aware that we may issue stock that would dilute stock ownership, incur debt that would restrict our cash flow, assume liabilities, incur large and immediate write-offs, incur unanticipated costs, divert management's attention from our existing business, experience risks associated with entering markets in which we have no or limited prior experience, or lose key employees from the acquired entities or our historical business.
If our reinsurers fail to meet their financial obligations, it could require us to fund significant liabilities.
Like many insurance companies, we transfer exposure to certain risks to others through reinsurance arrangements. Under these arrangements, the reinsurers assume a portion of the premium on the reinsured business and are responsible for a portion of the losses and expenses on that business. At December 31, 2014, we had $635 million recoverable from reinsurers. When we obtain reinsurance, we are still liable for those transferred risks if the reinsurer cannot meet its obligations. From time to time, we have disputes with our reinsurers concerning, among other things, our compliance with the relevant reinsurance treaty or our administration of the underlying block of business. If these disputes are resolved unfavorably to us, it could result in substantial damages against us or, in some instances, termination of the underlying reinsurance treaty, which could have a material adverse effect on our Traditional business and our consolidated results of operations. In addition, the inability or failure of our reinsurers to meet their financial obligations may require us to increase liabilities, thereby reducing our net income and overall profitability.
Our reliance upon third party administrators and other outsourcing arrangements may disrupt or adversely affect our operations.
We depend, and may in the future increase our dependence, on independent third parties for significant portions of our operations, including pharmacy benefit administration, data center operations, data network, claims processing, enrollment, premium billing, call centers, voice communication services, data processing and payment and other systems-related support, among others. This dependence makes our operations vulnerable to the third parties' failure to perform adequately under the contract, due to internal or external factors. In the future, this dependence may increase as we may outsource additional areas of our business operations to additional vendors. There can be no assurance that any conversion or transition of business process functions from the Company to a vendor or between vendors will be seamless and, oftentimes, these projects result in significant operational challenges that cause financial difficulties. In addition, if our relationships with our outsourcing partners are significantly disrupted for any reason, we may not be able to find an alternative partner in a timely manner or on acceptable financial terms. As a result, we may not be able to meet the demands of our customers and, in turn, our business, cash flows, financial condition and results of operations may be harmed.
We have outsourced portions of the operation of several of our data centers, call centers and new business processing services to independent third parties and may from time to time obtain additional services or facilities from other independent third parties. Dependence on third parties for these
51
services and facilities may make our operations vulnerable to their failure to perform as agreed. Incorrect information from these entities could generate inaccurate or incomplete membership and payment reports concerning our Medicare eligibility and enrollment, and claims information used by CMS to determine plan benefit subsidies and risk corridor payments. This could cause us to incur additional expense to utilize additional resources to validate, reconcile and correct the information. We have not been able to independently test and verify some of these third party systems and data. There can be no assurance that future third party data will not disrupt or adversely affect our plans' relationships with our members or our results of operations. A change in service providers, or a move of services from internal operations to a third party, or a move of services from a third party to internal operations, could result in significant operational challenges, a decline in service quality and effectiveness, increased cost or less favorable contract terms, which could adversely affect our operating results. Some of our outsourced services are being performed offshore. CMS requires attestations from plans that utilize the services of offshore vendors as to the vendors' ability to perform delegated functions. Prevailing economic conditions and other circumstances could prevent our offshore vendors' ability to adequately perform as agreed, which would impair our ability to provide the requisite attestations to CMS and could have a material adverse effect on our results of operations and financial condition.
Our business may suffer if we are not able to hire and retain sufficient qualified personnel or if we lose our key personnel.
Our future success depends partly on the continued contribution of our senior management and other key employees. While we currently have employment agreements with certain key executives, these do not guarantee that the services of these executives will continue to be available to us. The loss of the services of any of our senior management, or other key employees could harm our business. In addition, recruiting and retaining the personnel we require to effectively compete in our markets may be difficult. If we fail to hire and retain qualified employees, we may not be able to maintain and expand our business.
We may be responsible for the actions of our independent and career agents, and restrictions on our ability to market would adversely affect our revenue.
In regulatory proceedings and reviews and other litigation, regulators and our members sometimes claim that agents failed to comply with applicable laws, regulations and rules, or acted improperly in other ways, and that we are responsible for the alleged failure. We could be liable for contractual and extra-contractual damages on these claims and other penalties, such as a suspension from marketing and enrolling new members. We cannot assure you that any future claim will not result in material liability in the future. Federal and state regulators increasingly scrutinize the marketing practices of insurers, such as Medicare Advantage plans and their marketing agents, and there is no guarantee that regulators will not continue to scrutinize the practices of our Medicare Advantage plans and our marketing agents, and that such practices will not expose us to liability.
We rely on our marketing and sales efforts for a significant portion of our premium revenue. The federal government and state governments in the states in which we currently operate permit marketing but impose strict requirements and limitations as to the types of marketing activities that we may conduct. If our marketing efforts were to be prohibited or curtailed, our ability to increase or sustain membership would be significantly harmed, which would adversely affect our revenue and results of operations.
Similarly, federal and state governments and regulatory agencies have placed an increased focus on the sales and marketing of private fee-for-service plans. Concerns over the growing number of market conduct complaints regarding improprieties in agents' sales activities of private fee-for-service plans have spawned stricter marketing standards by CMS relating to these plans and their agents. This
52
heightened focus on market conduct and stricter standards in the marketing and sales of private fee-for-service plans has required us to modify our systems, increase our costs and change our agent training requirements, which could result in a material adverse effect on our results of operations and financial condition.
We may not be able to compete successfully if we cannot recruit and retain insurance agents, which could materially adversely affect our business and ability to compete.
We distribute our products principally through career agents and independent agents who we recruit and train to market and sell our products. We also engage managing general agents from time to time to recruit agents and develop networks of agents in various states. Strong competition exists for sales agents. We compete with other insurance companies for productive agents, primarily on the basis of our financial position, support services, compensation and product features. It can be difficult to successfully compete for productive agents with larger insurance companies that have higher financial strength ratings than we do. Our business and ability to compete will suffer if we are unable to recruit and retain insurance agents or if we lose the services provided by our managing general agents.
A significant portion of our assets are invested in fixed income securities and other securities that are subject to market fluctuations, which have recently been intensified by general economic conditions.
A significant portion of our investment portfolio consists of fixed income securities and other investment securities. Our portfolio can be viewed on our web site,www.universalamerican.com, in the "Investors" section. Our reference to the web site in this report is not intended to, and does not, incorporate the information contained in the web site into this report.
The fair value of these assets and the investment income from these assets generally fluctuate depending on general economic and market conditions and these variations have been exacerbated in recent years by the ongoing adverse economic conditions. The fair value of our investments in fixed income securities generally increases or decreases in an inverse relationship with fluctuations in interest rates, while net investment income realized by us from future investments in fixed income securities will generally increase or decrease in a direct relationship with fluctuations in interest rates; in addition, these values and prospective income have been adversely affected by general economic conditions. Moreover, actual net investment income or cash flows from investments that carry prepayment risk, such as mortgage-backed and other asset-backed securities, may differ from those anticipated at the time of investment or at various financial statement dates as a result of interest rate fluctuations, general economic conditions and other factors.
Because our investment securities are classified as available for sale, we reflect changes in the fair value of these securities in our consolidated balance sheets. Therefore, interest rate fluctuations and changes in the values of securities we hold could adversely affect our results of operations and financial condition.
53
We may not have adequate intellectual property rights in our brand names for our health plans, and we may be unable to adequately enforce these rights.
Our success depends, in part, upon our ability to market our health plans under the brand names that we own or license. We may not have taken enforcement action to prevent infringement of our marks and may not have secured registrations of the other brand names that we use in our business. Unauthorized parties may attempt to copy or otherwise obtain and use our products or technology. Policing unauthorized use of our intellectual property is difficult, and we cannot be certain that the steps we have taken will prevent misappropriation of our intellectual property rights. Other businesses may have prior rights in our brand names or in similar names, which could cause market confusion or limit or prevent our ability to use these marks or prevent others from using similar marks. If we are unable to prevent others from using our brand names, or if others prohibit us from using them, our revenues could be adversely affected. Even if we are able to protect our intellectual property rights in our brands, we could incur significant costs in doing so.
Our results of operations and stockholders' equity could be materially adversely affected if we have an impairment of our intangible assets.
Due to our past acquisitions, goodwill and other intangible assets represent a significant portion of our total assets. As of December 31, 2014, we had goodwill and other intangible assets of approximately $87 million, or approximately 4% of our total assets as of such date. During 2013, certain events occurred and circumstances changed ultimately resulting in a $189 million impairment of goodwill and other assets relating to APS Healthcare.
In accordance with applicable accounting standards, we perform periodic assessments of our goodwill and other intangible assets to determine whether all or a portion of their carrying values may no longer be recoverable, in which case a charge to earnings may be necessary. This impairment testing requires us to make assumptions and judgments regarding the estimated fair value of our reporting units.
We test goodwill for impairment annually, as of October 1 of the current year, or more frequently if circumstances suggest that impairment may exist. During each quarter, we perform a review of certain key components of our valuation of our reporting units, including the operating performance of the reporting units compared to plan (which is the primary basis for the prospective financial information included in our annual goodwill impairment test), our weighted average cost of capital and our stock price and market capitalization.
We estimate the fair values of our reporting units using discounted cash flows, or other indicators of fair value, which include assumptions about a wide variety of internal and external factors. Significant assumptions used in the impairment analysis include financial projections of cash flow (including significant assumptions about operations and target capital requirements), long term growth rates for determining terminal value, and discount rates. Forecasts and long term growth rates used for our reporting units are consistent with, and use inputs from, our internal long term business plan and strategy. During our forecasting process, we assess revenue trends, medical cost trends, operating cost levels and target capital levels. Significant factors affecting these trends include changes in membership, premium yield, medical cost trends, contract renewal expectations and the impact and expectations of regulatory environments.
Although we believe that the financial projections used are reasonable and appropriate at the time made, the use of different assumptions and estimates could materially impact the analysis and resulting conclusions. In addition, due to the long term nature of the forecasts there is significant uncertainty inherent in those projections. That uncertainty is increased by the impact of healthcare reforms as discussed in Item 1, "Business—Regulation."
54
We use a range of discount rates that correspond to a market based weighted average cost of capital. Discount rates are determined for each reporting unit based on the implied risk inherent in their forecasts. This risk is evaluated using comparisons to market information such as peer company weighted average costs of capital and peer company stock prices in the form of revenue and earnings multiples. The most significant estimates in the discount rate determinations include the risk free rates and equity risk premium. Company specific adjustments to discount rates are subjective and thus are difficult to measure with certainty.
The passage of time and the availability of additional information regarding areas of uncertainty in regards to the reporting units' operations could cause these assumptions used in our analysis to change materially in the future. If our assumptions differ from actual, the estimates underlying our goodwill impairment tests could be adversely affected.
Future events that could have a negative impact on the levels of excess fair value over carrying value of our reporting units include, but are not limited to:
- •
- decreases in business growth;
- •
- the loss of significant contracts;
- •
- decreases in earnings projections;
- •
- increases in the weighted average cost of capital; and
- •
- increases in the amount of required capital for a reporting unit.
Negative changes in one or more of these factors, among others, could result in additional impairment charges.
Our ability to obtain funds from our regulated subsidiaries is restricted and our cash flows and liquidity may be adversely affected which could restrict our ability to pursue new opportunities.
Because we operate as a holding company, we are dependent upon dividends and administrative expense reimbursements from our subsidiaries to fund our obligations, such as payment of principal and interest on our debt obligations. These subsidiaries generally are regulated by state departments of insurance. Our health plan and insurance company subsidiaries are subject to laws and regulations that limit the amount of dividends and distributions they can pay us. These laws and regulations also limit the amount of management fees our subsidiaries may pay to our management subsidiaries and their other affiliates without prior notification to, or in some cases approval of, state regulators. If these regulators were to deny our subsidiaries' request to pay dividends to us, the funds available to us would be limited, which could harm our ability to implement our business strategy.
We are also required by law to maintain specific prescribed minimum amounts of capital in these subsidiaries. The levels of capitalization required depend primarily upon the volume of premium generated. A significant increase in premium volume will require additional capitalization from our parent company. In most states, we are required to seek prior approval by these state regulatory authorities before we transfer money or pay dividends that exceed specified amounts from these subsidiaries, or, in some states, any amount. The pre-approval and notice requirements vary from state to state, and the discretion of the state regulators, if any, in approving or disapproving a dividend is not always clearly defined. Subsidiaries that declare non-extraordinary dividends must usually provide notice to the regulators in advance of the intended distribution date. If the regulators were to deny or significantly restrict our subsidiaries' requests to pay dividends to us or to pay management and other fees to affiliates, the funds available to us would be limited, which could impair our ability to implement our business and growth strategy and satisfy our debt obligations, or we could be required to incur additional indebtedness to fund these strategies.
55
In addition, one or more of these states could increase the statutory capital level from time to time. States have also adopted risk-based capital requirements based on guidelines adopted by the National Association of Insurance Commissioners, which tend to be, although are not necessarily, higher than existing statutory capital requirements. Regardless of whether the states in which we operate maintain or adopt risk-based capital requirements, the state departments of insurance can require our subsidiaries to maintain minimum levels of statutory capital in excess of amounts required under the applicable state laws if they determine that maintaining additional statutory capital is in the best interests of our insureds. Any increases in these requirements could materially increase our reserve requirements. In addition, as we continue to expand our plan offerings in new states or pursue new business opportunities, such as our expansion of Medicare Advantage products and health plans in new markets, we may be required to maintain additional statutory capital reserves. In either case, our available funds could be materially reduced, which could harm our ability to implement our business strategy.
In the event that we are unable to provide sufficient capital to fund our debt obligations, our operations or financial position may be adversely affected.
Our stock price may be volatile and could drop precipitously and unexpectedly.
Our common stock is traded on the NYSE. The prices of publicly traded stocks often fluctuate. The price of our common stock may rise or fall dramatically without any change in our business performance. Specific issues and developments related to our company or those generally in the health care and insurance industries, the regulatory environment, the capital markets and the general economy may cause this volatility. The principal events and factors that may cause our stock price and trading volume to fluctuate include:
- •
- changes in the laws and regulations affecting our business;
- •
- the size of the public float of our common stock and the volume of trading and the general liquidity in the market for our common stock;
- •
- variations in our operating results;
- •
- changes in the market's expectations about our future operating results;
- •
- changes in financial estimates and recommendations by securities analysts concerning our company or the health care or insurance industries generally;
- •
- operating and stock price performance of other companies that investors may deem comparable;
- •
- news reports relating to trends in our markets;
- •
- acquisitions and financings by us or others in our industry, including news reports or perceptions regarding mergers and acquisitions activity; and
- •
- sales of substantial amounts of our common stock by our directors and executive officers or principal shareholders, or the perception that these sales could occur.
Future sales of our common stock may depress the market price of our common stock.
Certain significant shareholders collectively own approximately 38% of our outstanding common stock, which are not subject to lock-ups. In addition, certain of these shareholders have held their shares for many years and may be required to sell or distribute their shares pursuant to their fund documents or may desire to sell or distribute their shares and realize a profit on their investment. We have filed a shelf registration statement on behalf of such significant shareholders and they may sell some or all of their shares in the near future. If any of these significant shareholders sells or distributes substantial amounts of our common stock, or if it is perceived that such sales or distributions could occur, the market price of our common stock could decline.
56
Your percentage ownership in our company may be diluted in the future.
As with any publicly traded company, your percentage ownership in our company may be diluted in the future because of equity awards that we have granted and expect to grant to our directors, officers, employees and others. In addition, we may from time to time issue additional equity, including in connection with merger and acquisition transactions.
Downgrades in our debt ratings or insurance company financial strength ratings, should they occur, may adversely affect our business, financial condition and results of operations.
Increased public and regulatory concerns regarding the financial stability of insurance companies and health plans have resulted in consumers placing greater emphasis upon financial strength ratings. Claims paying ability, financial strength, and debt ratings by recognized rating organizations are increasingly important factors in establishing the competitive position of insurance companies and health plans. Ratings information is broadly disseminated and generally used throughout the industry. Our ability to expand and to attract new business is affected by the financial strength ratings assigned to our subsidiaries by independent industry rating agencies, such as A.M. Best Company, Inc. Some distributors such as financial institutions, unions, associations and affinity groups may not sell our products to these groups unless the rating of our subsidiary writing the business improves to at least an "A–." The lack of higher A.M. Best ratings for our subsidiaries could adversely affect sales of our products.
Our ratings affect both the cost and availability of future borrowings. Each of the rating agencies reviews its ratings periodically and there can be no assurance that current ratings will be maintained in the future. Our ratings reflect each rating agency's opinion of our financial strength, operating performance, and ability to meet our debt obligations or obligations to policyholders and members, but are not evaluations directed toward the protection of investors in our common stock and should not be relied upon as such. There is no assurance that the rating agencies will maintain our current ratings in the future. Any future downgrade in our ratings may cause our policyholders and members to lapse, and may cause some of our agents to sell less of our products or to cease selling our products altogether. A downgrade in our ratings may also limit our access to capital markets, increase the cost of debt, impair our ability to refinance debt and limit our capacity to support growth at our insurance subsidiaries. Increased lapse rates would reduce our premium revenue and net income. Thus, downgrades in our ratings, should they occur, may adversely affect our business, financial condition and results of operations.
Some of our shareholders, directors and executive officers may have interests that conflict with, are different from, or in addition to, the interests of our shareholders generally.
Some of our directors and executive officers have and may continue to have significant equity ownership in our company, employment, indemnification and severance benefit arrangements, potential rights to other benefits on a change in control and rights to ongoing indemnification and insurance that result in their having interests that may differ from the interests of our shareholders generally. The receipt of compensation or other benefits by our directors or executive officers in connection with any acquisition or disposition may make it more difficult to retain their services after the acquisition or disposition, or require the combined company to expend additional sums to continue to retain their services. In addition, we may enter into transactions, including the sale of stock or assets or similar transactions, with our shareholders, directors or executive officers that may raise a conflict of interest. Further, the current concentration of equity ownership may discourage acquisition transactions.
57
If we are unable to maintain effective internal controls over financial reporting, investors could lose confidence in the reliability of our financial statements, which could result in a decrease in the price of our common stock.
Because of our status as a public company, we are required to test our financial, internal, and management control systems to meet obligations imposed by the Sarbanes-Oxley Act of 2002. These control systems relate to our corporate governance, corporate control, internal audit, disclosure controls and procedures, and financial reporting and accounting systems. Our disclosure controls and procedures and our internal control over financial reporting may not prevent or detect all errors and all fraud. A control system, no matter how well designed and operated, can provide only reasonable, not absolute, assurance that the objectives of the control system are met. The design of a control system must reflect the fact that there are resource constraints, and the benefits of controls must be considered relative to their costs. Further, because of the inherent limitations in all control systems, no evaluation of controls can provide absolute assurance that misstatements due to error or fraud will not occur or that all control issues and instances of fraud, if any, within our company have been detected. Among these inherent limitations are the realities that judgments in decision-making can be faulty and that breakdowns can occur because of simple error or mistake. The individual acts of some persons or the collusion of two or more people can circumvent controls. The design of any system of controls is based in part on assumptions about the likelihood of future events, and there can be no assurance that any design will succeed in achieving its stated goals under all potential future conditions. Projections of any evaluation of controls effectiveness to future periods are subject to risks. Over time, controls may become inadequate because of changes in conditions or deterioration in the degree of compliance with policies or procedures.
If we conclude that we do not have effective internal controls over financial reporting or if our independent auditors are unable to conclude that our internal controls over financial reporting are effective, investors could lose confidence in the reliability of our financial statements, which could result in a decrease in the value of our common stock. Our assessment of our internal controls over financial reporting may also uncover material weaknesses, significant deficiencies or other issues with these controls that could also result in adverse investor reaction. These results may also subject us to adverse regulatory consequences.
ITEM 1B—UNRESOLVED STAFF COMMENTS
There are no unresolved comments from the Staff of the Securities and Exchange Commission regarding the registrant's periodic or current reports under the Act.
Our corporate headquarters are located in White Plains, New York. We also have offices in Lake Mary, Florida; Houston, Texas; Syracuse, New York; Brookfield, Wisconsin; Columbia, Maryland and Mechanicsburg, Pennsylvania. In addition, we maintain other smaller, local offices to support Medicaid contracts. Management considers its office facilities suitable and adequate for the current level of operations. Additional information regarding our lease obligations is included in Note 23—Commitments and Contingencies in the Notes to Consolidated Financial Statements included in this Annual Report on Form 10-K.
For information relating to litigation affecting us, please see Note 23—Commitments and Contingencies in the Notes to Consolidated Financial Statements of this Annual Report, which is incorporated into this Part I—Item 3—Legal Proceedings by reference.
ITEM 4—MINE SAFETY DISCLOSURES
N/A
58
ITEM 5—MARKET FOR REGISTRANT'S COMMON EQUITY, RELATED STOCKHOLDER MATTERS AND ISSUER PURCHASES OF EQUITY SECURITIES
Market Information
The following table sets forth the high and low closing sales prices for Universal American common stock on the NYSE National Market, as reported by the NYSE for the periods indicated.
| | Common Stock | ||||||
|---|---|---|---|---|---|---|---|
| | High | Low | |||||
2015 | |||||||
First Quarter (through March 20, 2015) | $ | 10.51 | $ | 8.78 | |||
2014 | |||||||
Fourth Quarter | $ | 9.38 | $ | 7.80 | |||
Third Quarter | $ | 8.65 | $ | 7.92 | |||
Second Quarter | $ | 8.38 | $ | 7.04 | |||
First Quarter | $ | 7.53 | $ | 6.65 | |||
The closing sale price of our common stock on March 20, 2015, as reported by the NYSE, was $10.51 per share.
Shareholders
As of the close of business on March 20, 2015, there were approximately 865 registered holders of record of our voting common stock and one holder of record for our nonvoting common stock.
Dividends
On August 1, 2013, the Board of Directors approved the payment of a special cash dividend of $1.60 per share, payable on August 19, 2013 to shareholders of record as of August 12, 2013. The total dividend payment was $142.1 million of which $139.9 million was paid on August 19, 2013. We also established a $2.2 million dividend payable liability to record amounts expected to be paid in the future to holders of our restricted stock as such shares vest. This liability was $1.2 million and $2.1 million at December 31, 2014 and 2013, respectively. In addition, pursuant to the terms of our 2011 Equity Award Plan, the exercise price on outstanding stock options was reduced by the amount of the dividend.
Issuer Purchases of Equity Securities
On August 1, 2013, our Board of Directors authorized the repurchase of up to $40 million of our outstanding common stock. Purchases may occur from time to time in the open market, in privately negotiated transactions, or otherwise as market conditions permit.
On March 28, 2014, we entered into a definitive agreement to repurchase six million shares of our voting common stock directly from funds associated with Capital Z Partners Management, LLC at a price of $6.03 per share. The transaction closed in May 2014. We used cash on hand to fund the repurchase of these shares.
Stock Performance Graph
The following graph compares the cumulative total shareholder return on our common stock with the cumulative total return of the New York Stock Exchange (NYSE) Composite Index, and the Dow Jones US Select Health Care Providers Index, to represent our peer group. The graph assumes an investment of $100 in each of our common stock, the NYSE Composite group, and the peer group on
59
May 2, 2011, the first day of trading for Universal American after the sale of our Medicare Part D business. The graph assumes that the value of the investment in our common stock and in the above referenced indices was $100 at May 2, 2011 and that all dividends were reinvested. The price of our common stock on May 2, 2011, on which the graph is based, was $9.33. The shareholder return shown on the following graph is not necessarily indicative of future performance.
Comparison of Cumulative Total Return Among
Universal American Corp. Common Stock,
New York Stock Exchange Composite Index, S&P 500 Index and
Peer Group
May 2, 2011 through December 31, 2014
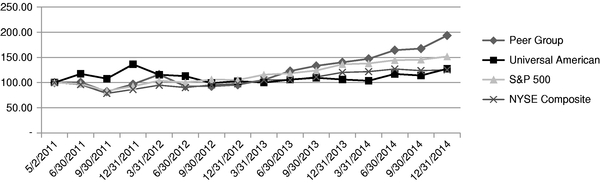
Note: The stock price performance included in this graph is not necessarily indicative of future stock price performance.
Recent Sales of Unregistered Securities
None.
Securities Authorized for Issuance under Equity Compensation Plans
The information regarding securities authorized for issuance under our equity compensation plans is disclosed in Item 12 "Security Ownership of Certain Beneficial Owners and Management and Related Stockholder Matters."
ITEM 6—SELECTED FINANCIAL DATA
The table below provides selected financial data and other operating information as of and for the five years ended December 31, 2014. We derived the selected financial data presented below from our audited financial statements. Our Medicare Part D business was sold in 2011 and reported as discontinued operations in the 2011 and 2010 selected financial data presented below. We have prepared the following data, other than statutory data, in conformity with U.S. generally accepted accounting principles. You should read this selected financial data together with our Consolidated Financial Statements and the Notes to Consolidated Financial Statements as well as the discussion
60
under the caption "Management's Discussion and Analysis of Financial Condition and Results of Operations."
| | For the Year Ended December 31, | |||||||||||||||
|---|---|---|---|---|---|---|---|---|---|---|---|---|---|---|---|---|
| | 2014 | 2013 | 2012 | 2011 | 2010 | |||||||||||
| | (in thousands, except per share data) | |||||||||||||||
Income Statement Data: | ||||||||||||||||
Net premium and policyholder fees earned | $ | 1,914,416 | $ | 2,001,309 | $ | 1,989,813 | $ | 2,221,369 | $ | 3,444,193 | ||||||
Net investment income | 33,713 | 36,737 | 42,397 | 47,425 | 39,886 | |||||||||||
Fee and other income | 93,075 | 104,657 | 128,683 | 15,810 | 10,748 | |||||||||||
Net realized (losses) gains | (1,382 | ) | 13,863 | 16,604 | 841 | 6,575 | ||||||||||
| | | | | | | | | | | | | | | | | |
Total revenues | 2,039,822 | 2,156,566 | 2,177,497 | 2,285,445 | 3,501,402 | |||||||||||
Total benefits, claims and expenses | 2,055,954 | 2,326,200 | 2,089,641 | 2,275,571 | 3,375,094 | |||||||||||
| | | | | | | | | | | | | | | | | |
(Loss) income from continuing operations before equity in losses of unconsolidated subsidiaries | (16,132 | ) | (169,634 | ) | 87,856 | 9,874 | 126,308 | |||||||||
Equity in losses of unconsolidated subsidiaries | (17,793 | ) | (33,602 | ) | (10,222 | ) | — | — | ||||||||
| | | | | | | | | | | | | | | | | |
(Loss) income from continuing operations before taxes | (33,925 | ) | (203,236 | ) | 77,634 | 9,874 | 126,308 | |||||||||
(Benefit from) provision for income taxes | (4,458 | ) | (10,910 | ) | 24,601 | 7,167 | 38,665 | |||||||||
| | | | | | | | | | | | | | | | | |
(Loss) income from continuing operations | (29,467 | ) | (192,326 | ) | 53,033 | 2,707 | 87,643 | |||||||||
| | | | | | | | | | | | | | | | | |
Discontinued operations: | ||||||||||||||||
(Loss) income from discontinued operations, net of taxes | — | — | — | (40,238 | ) | 104,240 | ||||||||||
Expenses of transactions, net of income taxes | — | — | — | (10,670 | ) | (2,622 | ) | |||||||||
| | | | | | | | | | | | | | | | | |
(Loss) income from discontinued operations | — | — | — | (50,908 | ) | 101,618 | ||||||||||
| | | | | | | | | | | | | | | | | |
Net (loss) income | $ | (29,467 | ) | $ | (192,326 | ) | $ | 53,033 | $ | (48,201 | ) | $ | 189,261 | |||
| | | | | | | | | | | | | | | | | |
| | | | | | | | | | | | | | | | | |
| | | | | | | | | | | | | | | | | |
(Loss) income per common share: | ||||||||||||||||
Basic: | ||||||||||||||||
Continuing operations | $ | (0.35 | ) | $ | (2.20 | ) | $ | 0.61 | $ | 0.03 | $ | 1.12 | ||||
Discontinued operations | — | — | — | (0.64 | ) | 1.30 | ||||||||||
| | | | | | | | | | | | | | | | | |
Net (loss) income | $ | (0.35 | ) | $ | (2.20 | ) | $ | 0.61 | $ | (0.61 | ) | $ | 2.42 | |||
| | | | | | | | | | | | | | | | | |
| | | | | | | | | | | | | | | | | |
| | | | | | | | | | | | | | | | | |
Diluted: | ||||||||||||||||
Continuing operations | $ | (0.35 | ) | $ | (2.20 | ) | $ | 0.61 | $ | 0.03 | $ | 1.11 | ||||
Discontinued operations | — | — | — | (0.63 | ) | 1.29 | ||||||||||
| | | | | | | | | | | | | | | | | |
Net (loss) income | $ | (0.35 | ) | $ | (2.20 | ) | $ | 0.61 | $ | (0.60 | ) | $ | 2.40 | |||
| | | | | | | | | | | | | | | | | |
| | | | | | | | | | | | | | | | | |
| | | | | | | | | | | | | | | | | |
61
| | As of December 31, | |||||||||||||||
|---|---|---|---|---|---|---|---|---|---|---|---|---|---|---|---|---|
| | 2014 | 2013 | 2012 | 2011 | 2010 | |||||||||||
| | | | | | (unaudited) | |||||||||||
| | (in thousands, except per share data) | |||||||||||||||
Balance Sheet Data: | ||||||||||||||||
Total cash and investments | $ | 1,008,352 | $ | 1,025,547 | $ | 1,294,571 | $ | 1,288,048 | $ | 1,423,131 | ||||||
Total assets | 2,025,298 | 2,101,666 | 2,531,299 | 2,357,816 | 3,628,185 | |||||||||||
Policyholder related liabilities | 1,115,785 | 1,161,454 | 1,153,773 | 1,178,097 | 1,321,206 | |||||||||||
Stockholders' equity | 614,465 | 664,899 | 1,012,497 | 940,363 | 1,465,997 | |||||||||||
Book value per share: | ||||||||||||||||
Basic | $ | 7.34 | $ | 7.49 | $ | 11.47 | $ | 11.54 | $ | 18.35 | ||||||
| | | | | | | | | | | | | | | | | |
| | | | | | | | | | | | | | | | | |
| | | | | | | | | | | | | | | | | |
Cash dividends per common share | $ | — | $ | 1.60 | $ | 1.00 | $ | — | $ | 2.00 | ||||||
| | | | | | | | | | | | | | | | | |
| | | | | | | | | | | | | | | | | |
| | | | | | | | | | | | | | | | | |
Data Reported to Regulators(1): | ||||||||||||||||
Statutory capital and surplus | $ | 345,422 | $ | 369,850 | $ | 564,380 | $ | 607,972 | $ | 887,740 | ||||||
Asset valuation reserve | 4,510 | 3,911 | 2,967 | 1,384 | 744 | |||||||||||
| | | | | | | | | | | | | | | | | |
Adjusted capital and surplus | $ | 349,932 | $ | 373,761 | $ | 567,347 | $ | 609,356 | $ | 888,484 | ||||||
| | | | | | | | | | | | | | | | | |
| | | | | | | | | | | | | | | | | |
| | | | | | | | | | | | | | | | | |
- (1)
- 2010 includes capital and surplus for Pennsylvania Life Insurance Company which was transferred to CVS Caremark in April 2011 in connection with the Medicare Part D sale. At the time of the transfer on April 29, 2011, Pennsylvania Life had capital and surplus of $231.4 million of which $184.4 million was included in the amount distributed to Universal American shareholders in connection with the sale.
ITEM 7—MANAGEMENT'S DISCUSSION AND ANALYSIS OF FINANCIAL CONDITION AND RESULTS OF OPERATIONS
Introduction
The following discussion and analysis presents a review of our financial condition as of December 31, 2014 and our results of operations for the years ended December 31, 2014, 2013 and 2012. As used in this report, except as otherwise indicated, references to the "Company," "Universal American," "we," "our," and "us" are to Universal American Corp., a Delaware corporation and its subsidiaries.
You should read the following analysis of our consolidated results of operations and financial condition in conjunction with the consolidated financial statements and related consolidated footnotes included in this Annual Report on Form 10-K. The following discussion contains forward-looking statements that involve risks, uncertainties and assumptions that could cause our actual results to differ materially from management's expectations. Factors that could cause such differences include those set forth under Part I, Item 1A—Risk Factors.
Overview
Universal American, through our family of healthcare companies, provides health benefits to people covered by Medicare and/or Medicaid. Our core strength is our ability to partner with providers, especially primary care physicians, to improve health outcomes while reducing cost in the Medicare population. We currently are focused on three main businesses:
- •
- Medicare Advantage: We serve the growing Medicare population by providing Medicare Advantage products to approximately 105,000 members as of January 1, 2015. Approximately 31% of the Medicare population in the United States is currently enrolled in Medicare Advantage plans; a type of Medicare health plan offered by private companies that contract with
62
- •
- Medicare Accountable Care Organizations: We believe there is an opportunity to address the high cost of health care for the majority of the Medicare population enrolled in traditional fee-for-service Medicare and have joined primarily with primary-care and multi-specialty provider groups to operate twenty-four Accountable Care Organizations, or ACOs, pursuant to the Medicare Shared Saving Program, known as the MSSP.
- •
- Medicaid. We also provide services to Medicaid agencies and health plans through APS Healthcare and through our Total Care Medicaid health plan serving approximately 40,000 members in upstate New York.
the federal government to provide enrollees with health insurance. Our current focus is to grow our Medicare Advantage business in Texas (especially Houston/Beaumont), upstate New York (especially the Syracuse area) and Maine, regions in which we have meaningful market positions.
Healthy Collaboration® Strategy
We have developed a successful primary care physician alignment strategy that we have branded as The Healthy Collaboration®. We work in collaboration with healthcare providers, especially primary care physicians, to help them assume and manage risk, in order to achieve measurably better quality and lower cost. Below are the key elements of the strategy:
- •
- We align incentives through gain sharing arrangements so that providers are each incented to assist members to achieve healthy outcomes.
- •
- We provide actionable data and analytics to providers and employ enabling technology to ensure that the right care is delivered at the right time in the right setting.
- •
- We engage the people we serve to help them make informed choices about their healthcare.
Emerging Opportunities in Healthcare
Senior Market Opportunity
We believe that attractive growth opportunities exist in providing health insurance to the growing senior market. At present, approximately 53 million Americans are eligible for Medicare, the Federal program that offers basic hospital and medical insurance to people over 65 years old and some disabled people under the age of 65. According to the U.S. Census Bureau, more than two million Americans turn 65 in the United States each year, and this number is expected to grow as the so-called baby boomers continue to turn 65. In addition, many large employers that traditionally provided medical and prescription drug coverage to their retirees have begun to curtail these benefits. Medicare Advantage continues to grow its share of the overall Medicare market and we believe is likely to continue to gain positive acceptance with consumers.
In 2014, we made a strategic decision to offer Medicare Advantage plans in markets where we can positively impact the cost and quality of healthcare through collaboration with providers. Accordingly, we reduced our footprint for 2015 and now offer plans in only three states (Texas, New York and Maine). In the Houston/Beaumont region, we currently maintain the leading market position with strong brand awareness, committed and aligned physician groups, and positive network presence. In upstate New York, we are in the process of converting this historically fee for service market into a more value-based system by introducing pay for performance to the primary care physicians in the region. We now have a complementary collection of businesses centered in upstate NY where we serve nearly 35,000 Medicare Advantage members, 17,000 FFS beneficiaries through our ACO, and 40,000 Medicaid lives through our Total Care plan. With these three programs, we are now the largest sponsor of government programs in central New York.
63
Medicare Advantage
Medicare Advantage—Texas: Universal American's largest Medicare Advantage market is Texas, primarily the Houston/Beaumont region and North Texas. We market our products using the Texan Plus® brand.
- •
- Our HMO plans are offered under contracts with CMS and provide all basic Medicare covered benefits with reduced member cost-sharing as well as additional supplemental benefits, including a defined prescription drug benefit. We built this coordinated care product around contracted networks of providers who, in cooperation with the health plan, coordinate an active medical management program. In addition to a monthly payment per member from CMS, the plan may collect a monthly premium from its members for specified products.
- •
- In connection with the HMOs, we operate separate Medicare Advantage Management Service Organizations that manage that business and affiliated Independent Physician Associations or IPAs. We participate in the net results derived from these affiliated IPAs.
Medicare Advantage—Northeast: Universal American's second largest market is upstate New York, primarily the ten counties that are considered part of the Syracuse market. Universal American markets its Medicare Advantage products using the Todays Options® brand. Enrollment in this market is generally supported by independent agents.
The products provided in our Northeast market include PPO and network PFFS plans.
- •
- Our PPO plans are provided under the name "Today's Options® PPO." They are offered under contracts with CMS and provide all basic Medicare covered benefits with reduced member cost-sharing as well as additional supplemental benefits, including a defined prescription drug benefit. This coordinated care product is built around contracted networks of providers who, in cooperation with the health plan, coordinate an active medical management program. In addition to a monthly payment per member from CMS, the plan may collect a monthly premium from its members for specified products.
- •
- Our Network PFFS plans, which are provided under the name "Today's Options®" are offered under contracts with CMS and provide enhanced health care benefits compared to traditional Medicare, subject to cost sharing and other limitations. Even though these plans allow the members more flexibility in the delivery of their health care services than other Medicare Advantage plans, we actively coordinate care for these members in a similar manner to our PPO and HMO plans. Some of these products include a defined prescription drug benefit. In addition to a fixed monthly payment per member from CMS, individuals in these plans may be required to pay a monthly premium in selected counties or for selected enhanced products.
Medicare Shared Savings—Accountable Care Organizations
The Patient Protection and Affordable Care Act and The Healthcare and Education Reconciliation Act of 2010, which we collectively refer to as the ACA, established Medicare Shared Savings ACOs as a tool to improve quality and lower costs through increased care coordination in the Medicare Fee-for-Service, or FFS, program, which covers the majority of Medicare recipients. CMS established the MSSP to facilitate coordination and cooperation among providers to improve the quality of care for FFS beneficiaries and reduce unnecessary costs. Eligible providers, hospitals, and suppliers may participate in the MSSP by creating or participating in an ACO.
The MSSP is designed to improve beneficiary outcomes and increase value of care by:
- •
- promoting accountability for the care of Medicare FFS beneficiaries;
- •
- requiring coordinated care for all services provided under Medicare FFS; and
64
- •
- encouraging investment in infrastructure and redesigned care processes.
The MSSP will reward ACOs that lower their health care costs while surpassing a minimum savings rate and meeting quality of care performance standards. Cost savings below the benchmark provided by CMS will be shared at least 50% with the ACOs. The minimum savings rate set by CMS varies depending on the number of patients assigned to the ACO, starting at 3.9% for ACOs with patients totaling 5,000 and grading to 2.0% for ACOs with patients totaling 10,000 or more.
CMS assigns a beneficiary to the preliminary roster of an ACO if the ACO physicians billed for a "plurality" of services during the calendar year preceding the performance period. A plurality means the ACO physicians provided a greater proportion of primary care services, measured in terms of allowed charges, than the physicians in any other ACO or Medicare-enrolled tax-identification number. CMS sets the benchmark for each ACO using the historical medical costs of the beneficiaries assigned to an ACO. At the end of the ACO performance period, CMS applies the same plurality definition but to a different time period, the actual performance period. CMS does not fully update the benchmark to reflect the new mix of beneficiaries assigned during the performance period. As a result, many beneficiaries originally assigned to an ACO at the beginning of a performance year (i.e. January 1) may no longer be on the ACOs roster at the end of a performance year (i.e. December 31) if they did not see a physician in the ACO during the performance year. As a result, many ACOs may experience a significant attrition of healthier patients in their ACO rosters that were included in the original benchmark set by CMS but had not received care during the performance period itself. This can have a significant adverse impact on an ACOs ability to achieve shared savings. Accordingly, it will be important for ACOs to ensure that all the assigned beneficiaries to an ACO continue to receive wellness and other services during the year to ensure they are assigned to the ACO at the end of the performance period. In 2015, CMS proposed new rules that will take effect for the 3-year period beginning on January 1, 2016. We expect the new rules to be finalized during 2015. In general, we believe the proposed new rules will enhance the overall attractiveness of the program.
At January 1, 2015, Universal American sponsors 24 ACOs in ten States, which include 3,800 participating providers and approximately 285,000 Medicare FFS beneficiaries covering more than $3 billion of medical spend. Certain of our ACOs overlap a portion of our Medicare Advantage footprint (Houston, Dallas and Syracuse) which capitalizes on our existing relationship with providers. The other ACOs have no overlap with existing operations, offering an opportunity for expansion into other products and services. We provide these ACOs with care coordination, analytics and reporting, technology and other administrative capabilities to enable participating providers to deliver better care and lower healthcare costs for their Medicare fee-for-service beneficiaries. We employ local market staff (operations and clinical) to drive physician and their staff engagement and care coordination improvements. During 2014, we reduced the number of our active ACOs based on a variety of factors, including the level of engagement by the physicians in the ACO and the likelihood of the ACO achieving shared savings. We may make further reductions in 2015.
During September 2014, we received notice that the ACOs we formed in partnership with primary care physicians and other healthcare professionals generated $66 million in total program savings for CMS, as part of the MSSP for the first performance year of the MSSP (2012 and 2013). Of our 30 ACOs with start dates in 2012 and 2013, the results showed that:
- •
- 3 ACOs, serving more than 56,000 Medicare beneficiaries and including our largest ACO in Houston, generated savings in excess of their Minimum Savings Rate and therefore, qualified to share those savings with CMS;
- •
- 11 ACOs, serving more than 120,000 Medicare beneficiaries, generated savings but fell below their Minimum Savings Rate required to share savings with CMS;
- •
- 8 ACOs were within 2 percent of their benchmark;
65
- •
- 8 ACOs were 2 percent or more above their benchmark; and
- •
- All ACOs met CMS's quality reporting standards.
The three ACOs qualifying for savings received payments of $20.4 million, part to be shared between the physicians of those ACOs and us and part to be used by us to reimburse a portion of the costs that we had incurred. Our share of these savings, including expense recovery, amounted to $13.4 million, which is reflected in equity in losses of unconsolidated subsidiaries in our consolidated statements of operations. We received these payments in October 2014. We did not recognize any shared savings revenue in 2013 or 2012.
The MSSP is relatively new and therefore has limited historical experience. This impacts our ability to accurately accumulate and interpret the data available for calculating the ACOs' shared savings. Therefore, we were not able to recognize revenue for the year ended December 31, 2013 until we received the final settlement results from CMS in September 2014. Similarly, we were not able to recognize revenue for the year ended December 31, 2014 in the 2014 financial statements. We expect that revenue, if any, for the program year ended December 31, 2014 will be reported in 2015 when the MSSP revenue is either known or estimable with reasonable certainty. Based on the ACO operating agreements, we bear all costs of the ACO operations until revenue is recognized. At that point, we share in up to 100% of the revenue to recover our costs incurred. Any remaining revenue is generally shared equally with our ACO provider partners.
Medicaid
Established in 1965, Medicaid is the largest publicly funded program in the United States, and provides health insurance to low-income families and individuals with disabilities. Authorized by Title XIX of the Social Security Act, Medicaid is an entitlement program funded jointly by the federal and state governments and administered by the states. The majority of funding is provided at the federal level. Each state establishes its own eligibility standards, benefit packages, payment rates and program administration within federal standards. Eligibility is based on a combination of household income and assets, often determined by an income level relative to the federal poverty level. Historically, children have represented the largest eligibility group. Our APS Healthcare segment provides a variety of healthcare services to Medicaid members in numerous states.
Due to the Medicaid expansion provisions under the ACA, CMS projects that Medicaid expenditures will increase from approximately $505 billion in 2014 to approximately $860 billion by 2022. In addition, as part of the Affordable Care Act, approximately 70 million people are expected to qualify for Medicaid in 2015.
A portion of Medicaid members are dual eligibles, low-income seniors and people with disabilities who are enrolled in both Medicaid and Medicare. Based on CMS, industry analyst and Kaiser Family Foundation data, we estimate there are approximately 10 million dual eligible enrollees with annual spending of approximately $400 billion. Only a small portion of the total spending on dual eligibles is administered by managed care organizations. Dual eligibles tend to consume more healthcare services due to their tendency to have more chronic health issues.
Total Care NY Medicaid Plan—On December 1, 2013, we acquired the Total Care Medicaid health plan. Total Care provides Medicaid managed care services to approximately 40,000 members in three counties in upstate New York that overlap with our existing Medicare Advantage footprint. Roughly 80% of its members are located in Onondaga County. In addition to the Medicaid program, Total Care also participates in the Child Health Plus program for low-income, uninsured children.
APS Healthcare—In March 2012, we acquired APS Healthcare. APS Healthcare provides a variety of healthcare services primarily to State Medicaid agencies and private health plans. In February 2015, we sold the APS Healthcare Puerto Rico business for $26.5 million. APS Puerto Rico provides
66
managed behavioral health services for the Government Health Plan Medicaid program under a contract that terminates on March 31, 2015.
Healthcare Reform
The ACA was signed into law in March 2010 and legislates broad-based changes to the U.S. health care system. Due to the complexity of the health reform legislation, including yet to be promulgated implementing regulations, lack of interpretive guidance, and gradual implementation, the impact of the health reform legislation remains difficult to predict and quantify. In addition, we believe that any impact from the health reform legislation could potentially be mitigated by certain actions we may take in the future including modifying future Medicare Advantage bids to compensate for such changes. For example, the anticipation of additional revenues from Star bonuses or reduced CMS reimbursement rates are factored into the anticipated level of benefits included in our Medicare Advantage bids for the upcoming year.
The provisions of these new laws include the following key points, which are discussed further below:
- •
- reduced Medicare Advantage reimbursement rates, beginning in 2012;
- •
- implementation of a quality bonus for Star ratings, beginning in 2012;
- •
- accountable care organizations, beginning in 2012;
- •
- limitation on the federal tax deductibility of compensation earned by individuals for certain types of companies, beginning in 2013;
- •
- stipulated minimum medical loss ratios, beginning in 2014;
- •
- non-deductible health insurance industry fee, beginning in 2014; and
- •
- coding intensity adjustments, with mandatory minimums, beginning in 2014.
Reduced Medicare Advantage reimbursement rates—The ACA made several changes to Medicare Advantage. Beginning in 2012, the Medicare Advantage "benchmark" rates began the transition to target Medicare fee-for-service cost benchmarks of 95%, 100%, 107.5% or 115% of the calculated Medicare fee-for-service costs. The transition period is 2, 4 or 6 years depending upon the applicable county. The counties are divided into quartiles based on each county's fee-for-service Medicare costs. We estimate that approximately 65% and 35%, respectively, of our January 1, 2015 membership resides in counties where the Medicare Advantage benchmark rate will equal 95% and 115%, respectively, of the calculated Medicare fee-for-service costs at the end of the 6 year transition period in 2017.
Medicare Advantage payment benchmarks have been cut over the last several years, with additional funding reductions to be phased in as noted above. On February 20, 2015, CMS issued its 2016 45 Day Call Letter (the "45 Day Call Letter") detailing preliminary 2016 Medicare Advantage benchmark payment rates. As is customary, CMS has invited public comment on these preliminary rates before issuing its final rates for 2016 in April 2015. The 45 Day Call Letter proposes to reduce Medicare rates for 2016 and make other changes that could negatively impact our business. At this time, CMS is not implementing the proposed policy of excluding for risk adjustment purposes the diagnosis codes obtained from in-home health risk assessments unless such codes are subsequently validated by a clinical encounter with a qualified provider. If implemented, this change would have resulted in significant additional funding declines for the Company. We will continue to evaluate proposed changes detailed in the 45 Day Call Letter, some of which could result in further rate reductions that would adversely affect our plan benefit designs, market participation, growth prospects and earnings potential for our Medicare Advantage plans in the future.
67
Implementation of quality bonus for Star ratings—Beginning in 2012, Medicare Advantage plans with an overall "Star rating" of three or more stars (out of five) based on 2011 performance were eligible for a "quality bonus" in their basic premium rates. For 2015 and beyond, plans must achieve an overall star rating of at least 4 stars to receive the quality bonus. Plans receiving Star bonus payments are required to use the additional dollars to provide "extra benefits" for the plans' enrollees, to comply with required minimum loss ratios, resulting in a competitive advantage for those plans rather than a direct financial impact. In addition, beginning in 2012, Medicare Advantage Star ratings affect the rebate percentage available for plans to provide additional member benefits (plans with quality ratings of 3.5 stars or above will have their rebate percentage increased from a base rate of 50% to 65% or 70%). In all cases, this rebate percentage is lower than the pre-ACA rebate percentage of 75%. Our Medicare Advantage plans for 2015 are rated from 3.0 to 4.0 stars out of 5.0, with approximately 86% of our membership now in plans rated 4 stars, which ratings were considered when preparing our bids to be submitted for 2015. A summary of our membership and related ratings as of January 1, 2015 is presented below:
Contract | Plan Name | Location | Members (000's) | 2015 Star Rating | |||||||
|---|---|---|---|---|---|---|---|---|---|---|---|
H4506 | Texan Plus HMO | Southeast Texas—Houston/Beaumont | 63.0 | 4.0 | |||||||
H2816 | Today's Options Network PFFS | Northeast—New York & Maine | 26.7 | 4.0 | |||||||
H2775 | Today's Options PPO | Northeast—New York & Maine | 10.9 | 3.5 | |||||||
H5656 | Texan Plus HMO | North Texas—Dallas | 4.0 | 3.0 | |||||||
| | | | | | | | | | | | |
| 104.6 | |||||||||||
| | | | | | | | | | | | |
| | | | | | | | | | | | |
| | | | | | | | | | | | |
Notwithstanding continued efforts to improve or maintain our Star ratings and other quality measures, there can be no assurances that we will be successful in doing so. Accordingly, our plans may not be eligible for full level quality bonuses or increased rebates, which could adversely affect the benefits such plans can offer, reduce membership, and reduce profit margins.
In addition, CMS has indicated that plans with a Star rating of less than 3.0 for three consecutive years may be subject to termination. While we do not currently have any plans with a rating below 3.0, our inability to maintain Star ratings of 3.0 or better for a sustained period of time could ultimately result in plan termination by CMS which could have a material adverse impact on our business, cash flows and results of operations. Also, the CMS Star ratings/quality scores may be used by CMS to pay bonuses to Medicare Advantage plans that enable those plans to offer improved benefits and/or better pricing. Furthermore, lower quality scores compared to our competitors may result in us losing potential new business in new markets or dissuading potential members from choosing our plan in markets in which we compete. Lower quality scores compared to our competitors could have a material adverse effect on our rate of growth.
Stipulated minimum MLRs—Beginning in 2014, the ACA stipulates a minimum medical loss ratio, or MLR, of 85% for Medicare Advantage plans. This MLR takes into account benefit costs, quality initiative expenses, the ACA fee and taxes. Financial and other penalties may result from failing to achieve the minimum MLR ratio. For the year ended December 31, 2014 our Medicare Advantage plans exceeded the minimum MLR, as defined by CMS. Complying with such minimum ratio by increasing our medical expenditures or refunding any shortfalls to the federal government could have a material adverse effect on our operating margins, results of operations, and our statutory required capital.
Non-deductible health insurance industry fee ("ACA Fee")—Beginning in 2014, the new healthcare reform legislation imposed an annual aggregate health insurance industry fee of $8.0 billion (with increasing annual amounts thereafter) on health insurance premiums, including Medicare Advantage
68
premiums, that is not deductible for income tax purposes. As a result, our effective income tax rate increased in 2014, and will likely remain at a higher level in future years. Our share of the new fee is based on our pro rata percentage of premiums written during the preceding calendar year compared to the industry as a whole, calculated annually. This fee, first expensed and paid in 2014, adversely affects the profitability of our Medicare Advantage business and could have a material adverse effect on our results of operations. We paid a fee of $23.1 million in 2014, based on 2013 net written premiums and estimate that the fee to be paid in 2015, based on 2014 net written premiums, will be approximately $29 million. Pursuant to the guidance issued by the FASB in July 2011, for reporting in accordance with U.S generally accepted accounting principles (GAAP), the liability for the fee will be estimated and recorded in full once the entity provides qualifying health insurance in the corresponding period with a corresponding deferred cost that is to be amortized to expense on a straight-line basis over the applicable calendar year. For statutory reporting purposes, the fee will be expensed on January 1 in the year of payment, rather than amortized to expense over the year. The ACA fee is included in other operating costs; however, will be factored in when calculating the stipulated minimum MLR.
Coding intensity adjustments—Under the ACA, the coding intensity adjustment instituted in 2010 became permanent, resulting in mandated minimum reductions in risk scores of 4.91% in 2014 increasing each year to 5.91% in 2018. These coding adjustments may adversely affect the level of payments from CMS to our Medicare Advantage plans.
Limitation on the federal tax deductibility of compensation earned by individuals—Beginning in 2013, with respect to services performed during 2010 and afterward, for health insurance companies, the federal tax deductibility of compensation is limited under Section 162(m)(6) of the Code to $500,000 per individual and will not contain an exception for "performance-based compensation." In September 2014, the Internal Revenue Service issued final regulations on this compensation deduction limitation which provided additional information regarding the definition of a health insurance issuer. Based on our analysis of the final regulations, we no longer believe we are subject to the limitation. As a result, during the fourth quarter of 2014, we recorded a tax benefit of $3.2 million related to prior years and $1.7 million related to the first nine months of 2014. Prior to receiving the final regulations, our application of this limitation had increased our effective tax rate by approximately 60 basis points for the year ended December 31, 2013 and 200 basis points for the year ended December 31, 2012. However, there is a risk that the Internal Revenue Service or other regulators may disagree with our interpretation, which could result in higher taxes.
Accountable Care Organizations—The ACA established Accountable Care Organizations, or ACOs, as a tool to improve quality and lower costs through increased care coordination in the Medicare fee-for- service program. CMS established the Shared Savings Program to facilitate coordination and cooperation among providers to improve the quality of care for Medicare fee-for-service beneficiaries and reduce unnecessary costs. To date, we have partnered with numerous groups of healthcare providers and currently participate in twenty-four active ACOs previously approved to participate in the MSSP. ACOs are entities that contract with CMS to serve the Medicare fee-for-service population with the goal of better care for individuals, improved health for populations and lower costs. ACOs share savings with CMS to the extent that the actual costs of serving assigned beneficiaries are below certain trended benchmarks of such beneficiaries and certain quality performance measures are achieved. We provide a variety of services to the ACOs, including care coordination, analytics and reporting, technology and other administrative services to enable these physicians and their associated healthcare providers to deliver better quality care, improved health and lower healthcare costs for their Medicare fee-for-service patients.
As of December 31, 2014, we have incurred inception-to-date expenses of approximately $107 million, pre-tax, related to our ACO business, including our equity in the losses of our unconsolidated ACOs and have recognized our portion of shared savings revenues and expense
69
reimbursements totaling approximately $13 million to date. We also expect to incur significant costs during 2015. Under the MSSP, CMS will not make any payments to ACOs for a measurement year until the second half of the following year, which will negatively impact our cash flows. In order to receive revenues from CMS under the MSSP, the ACO must meet certain minimum savings rates (i.e. save the federal government money) and meet certain quality measures. More specifically, an ACOs medical expenses for its assigned beneficiaries during a relevant measurement year must be below the benchmark established by CMS for such ACO. On the quality side, the MSSP requires ACOs to meet thirty-three quality measures, which CMS may vary from time to time. Notwithstanding our efforts, our ACOs may be unable to meet the required savings rates or may not satisfy the quality measures, which may result in our receiving no revenues and losing our substantial investment. In addition, as the MSSP is a new program, it presents challenges and risks associated with the timeliness and accuracy of data and interpretation of complex rules, which may impact the timing and amount of revenue we can recognize and could have a material adverse effect on our ability to recoup any of our investment in this new business. Further, there can be no assurance that we will maintain positive relations with each of our twenty-four ACO partners which may result in certain of the ACOs terminating our relationship, which will result in a potential loss of our investment.
In addition, CMS, the US Office of Inspector General, the Internal Revenue Service, the Federal Trade Commission, the US Department of Justice, and various states have adopted or are considering adopting new legislation, rules, regulations and guidance relating to formation and operation of ACOs. Such laws may, among other things, require ACOs to become subject to financial regulation such as maintaining deposits of assets with the states in which they operate, the filing of periodic reports with the insurance department and/or department of health, or holding certain licenses or certifications in the jurisdictions in which the ACOs operate. Failure to comply with legal or regulatory restrictions may result in CMS terminating an ACOs agreement with CMS and/or subjecting an ACO to loss of the right to engage in some or all business in a state, payment of fines or penalties, or may implicate federal and state fraud and abuse laws relating to anti-trust, physician fee-sharing arrangements, anti-kickback prohibitions or prohibited referrals, any of which may adversely affect our operations and/or profitability.
Stock Repurchase Plan
On August 1, 2013, our Board of Directors authorized the repurchase of up to $40 million of our outstanding common stock. Purchases may occur from time to time in the open market, in privately negotiated transactions, or otherwise as market conditions permit.
On March 28, 2014, we entered into a definitive agreement to repurchase six million shares of our voting common stock directly from funds associated with Capital Z Partners Management, LLC at a price of $6.03 per share. The transaction closed in May 2014. We used cash on hand to fund the repurchase of these shares.
70
Membership
The following table presents our membership in Medicare Advantage products:
| | January 31, 2015 | December 31, 2014 | December 31, 2013(1) | |||||||
|---|---|---|---|---|---|---|---|---|---|---|
| | (in thousands) | |||||||||
Membership | ||||||||||
Southwest HMO | 67.0 | 61.8 | 54.6 | |||||||
Northeast | 37.6 | 29.7 | 31.5 | |||||||
| | | | | | | | | | | |
Core Markets | 104.6 | 91.5 | 86.1 | |||||||
Non-Core Network(2) | — | 20.7 | 24.8 | |||||||
Rural(2) | — | 1.9 | 2.9 | |||||||
| | | | | | | | | | | |
Total Membership | 104.6 | 114.1 | 113.8 | |||||||
| | | | | | | | | | | |
| | | | | | | | | | | |
| | | | | | | | | | | |
- (1)
- Excludes 13,200 members in areas subject to 2014 Service Area Reductions. This includes 10,700 rural members whose plans were not renewed for 2014.
- (2)
- Non-Core Network and Rural markets were exited as of January 1, 2015.
Segment Overview
As a result of the growth of our ACOs and Total Care, we have modified the way we manage and report our business. Our Medicare Advantage and Traditional Insurance segments remain unchanged; however, we have split our ACO and Total Care businesses from the Corporate & Other segment to form two new segments—Management Services Organization ("MSO") and Medicaid, respectively. We will continue to report the activities of our holding company, the operations of APS Healthcare since its acquisition on March 2, 2012, and other ancillary operations in our Corporate & Other segment. See Note 24—Business Segment Information in the Notes to Consolidated Financial Statements for a description of our segments.
We report intersegment revenues and expenses on a gross basis in each of the operating segments but eliminate them in the consolidated results. These intersegment revenues and expenses affect the amounts reported on the individual financial statement line items, but we eliminate them in consolidation and they do not change income before taxes. The most significant items eliminated are intersegment revenue and expense relating to commissions earned by agency subsidiaries in our Corporate & Other segment from insurance subsidiaries in our Traditional segment and in 2013 for services provided by APS Healthcare to our Medicare Advantage segment.
71
Results of Operations—Consolidated Overview
The following table reflects income (loss) from each of our segments and contains a reconciliation to reported net (loss) income:
| | For the year ended December 31, | |||||||||
|---|---|---|---|---|---|---|---|---|---|---|
| | 2014 | 2013 | 2012 | |||||||
| | (in thousands) | |||||||||
Medicare Advantage(1) | $ | 47,800 | $ | 53,467 | $ | 92,775 | ||||
MSO(1) | (30,809 | ) | (41,588 | ) | (21,654 | ) | ||||
Medicaid(1) | 2,635 | (526 | ) | — | ||||||
Traditional Insurance(1) | 2,507 | 10,946 | 18,065 | |||||||
Corporate & Other(1) | (54,676 | ) | (239,398 | ) | (28,156 | ) | ||||
Net realized (losses) gains(1) | (1,382 | ) | 13,863 | 16,604 | ||||||
| | | | | | | | | | | |
(Loss) income before income taxes(1) | (33,925 | ) | (203,236 | ) | 77,634 | |||||
(Benefit from) provision for income taxes | (4,458 | ) | (10,910 | ) | 24,601 | |||||
| | | | | | | | | | | |
Net (loss) income | $ | (29,467 | ) | $ | (192,326 | ) | $ | 53,033 | ||
| | | | | | | | | | | |
| | | | | | | | | | | |
| | | | | | | | | | | |
(Loss) income per common share (diluted): | ||||||||||
Net (loss) income | $ | (0.35 | ) | $ | (2.20 | ) | $ | 0.61 | ||
| | | | | | | | | | | |
| | | | | | | | | | | |
| | | | | | | | | | | |
- (1)
- We evaluate the results of operations of our segments based on income (loss) before realized gains and losses and income taxes. We believe that realized gains and losses are not indicative of overall operating trends. This differs from U.S. generally accepted accounting principles, which reflects the effect of realized gains and losses and income taxes in the determination of net income (loss). The schedule above reconciles our segment income (loss), to net (loss) income in accordance with U.S. generally accepted accounting principles.
Years ended December 31, 2014 and 2013
Net loss for the year ended December 31, 2014 was $29.5 million, or $0.35 per diluted share, compared to net loss of $192.3 million, or $2.20 per diluted share, for the year ended December 31, 2013. These amounts include realized (losses) gains, net of taxes, of $(2.3) million, or $(0.03) per diluted share, and $9.0 million, or $0.10 per diluted share in 2014 and 2013, respectively. 2013 also includes asset impairment charges of $178.1 million, or $2.04 per diluted share related to APS Healthcare.
Our Medicare Advantage segment generated income before income taxes of $47.8 million for the year ended December 31, 2014, a decrease of $5.7 million compared to the year ended December 31, 2013. The decrease in earnings was driven by the new ACA fee of $22.9 million (effective in 2014), lower membership and lower net investment income; offset by an improved medical benefit ratio, or MBR, of 84.0% for the full year 2014 compared to 85.1% for 2013 and a decrease in our administrative expense ratio from 12.7% in 2013 to 12.0% in 2014. The year ended December 31, 2014, included $33.0 million of net favorable prior year items compared to $23.3 million for the year ended December 31, 2013.
Our MSO segment generated a loss before income taxes of $30.8 million for the year ended December 31, 2014; a decrease of $10.8 million compared to the year ended December 31, 2013. This improvement was driven by the receipt of $13.4 million of revenue in 2014 related to the initial ACO program period ended December 31, 2013, partially offset by an increase in ACO operating expenses as we had four new ACOs start up on January 1, 2014.
72
Our Medicaid segment generated income before income taxes of $2.6 million for the year ended December 31, 2014 compared to a loss of $0.5 million for the year ended December 31, 2013. This was due to 2013 consisting of only one month of activity that included approximately $0.6 million of acquisition related costs, as we acquired Total Care on December 1, 2013.
Our Traditional Insurance segment generated income before taxes of $2.5 million for 2014, a decrease of $8.4 million compared to 2013. The decrease in earnings is primarily driven by the reduction of business in-force combined with higher benefits ratios on our Specialty health lines which resulted in lower underwriting income. Additionally, operating expenses included higher consulting costs related to the transition and outsourcing of certain functions.
The loss before income taxes from our Corporate & Other segment decreased by $184.7 million for the year ended December 31, 2014 compared to 2013. This was primarily due to asset impairment charges related to APS Healthcare in 2013 totaling $189.4 million, improved profitability of our APS Healthcare business, corporate expense reduction initiatives and higher net investment income, partially offset by higher legal and settlement costs related to our non-core business, primarily APS Healthcare, Traditional Insurance and the New York Health Benefits Exchange, known as the Exchange.
Our effective tax rate was a benefit of 13.1% for 2014 compared with a benefit of 5.4% for 2013. The effective rate in 2014 differs from the expected benefit of the 35% federal rate due to non-recurring tax benefits (discussed below), net of permanent items, primarily the new ACA fee and preferred dividends, and foreign and state income taxes. The variance in the 2013 effective tax rate compared with the expected benefit of the 35% federal rate was driven by permanent items relating primarily to non-deductible goodwill impairment, the limitation on the deductibility of executive compensation for health insurers enacted in the ACA, interest on the mandatorily redeemable preferred stock, foreign and state income taxes and non-recurring tax expenses.
Income taxes include non-recurring tax benefits (expenses) of $5.8 million and ($1.2) million for the years ended December 31, 2014 and 2013, respectively. The 2014 benefit primarily relates to the reversal of executive compensation previously considered non-deductible under Code section 162(m)(6) that resulted in the recording of a $3.2 million benefit for amounts considered non-deductible in our prior year tax return, recording of $1.3 million of foreign tax credits related to APS Healthcare and a $0.7 million reserve release related to items on which the statute of limitations has expired. The 2013 expense primarily relates to the establishment of a valuation allowance against deferred tax assets principally related to foreign tax credits from our APS Puerto Rico subsidiary.
Years ended December 31, 2013 and 2012
Net loss for the year ended December 31, 2013 was $192.3 million, or $2.20 per diluted share, compared to net income of $53.0 million, or $0.61 per diluted share, for the year ended December 31, 2012. These amounts include asset impairment charges, net of taxes, of $178.1 million, or $2.04 per diluted share, in 2013 as well as realized investment gains, net of taxes, of $9.0 million, or $0.10 per diluted share, and $10.8 million, or $0.12 per diluted share in 2013 and 2012, respectively.
Our Medicare Advantage segment generated income before income taxes of $53.5 million for the year ended December 31, 2013, a decrease of $39.3 million compared to the year ended December 31, 2012. The decrease in earnings was driven by the medical benefit ratio increasing to 85.1% for the full year 2013 compared to 82.3% for 2012 partially offset by a decrease in our administrative expense ratio from 13.5% in 2012 to 12.7% in 2013. The year ended December 31, 2013, included $23.3 million of net favorable prior year items compared to $27.4 million for the year ended December 31, 2012.
Our MSO segment generated a loss before income taxes of $41.6 million for the year ended December 31, 2013, an increase of $19.9 million compared to 2012. This was due to increased operating costs, as there were thirty-one ACO entities in operation in 2013 compared to sixteen at
73
December 31, 2012 and only nine months of operations in 2012. We did not recognize any ACO revenue for the year ended December 31, 2013. Revenue for the initial program periods ending December 31, 2013 was reported in 2014.
Our Medicaid segment generated a loss before income taxes of $0.5 million for the year ended December 31, 2013 reflecting only one month of activity that included approximately $0.6 million of acquisition related costs. We acquired the Total Care Medicaid health plan on December 1, 2013.
Our Traditional Insurance segment generated income before taxes of $10.9 million for 2013, a decrease of $7.1 million compared to 2012. The decrease in earnings is driven by the reduction of business in-force which resulted in lower underwriting income and lower net investment income as well as higher consulting and outside services costs.
The loss before income taxes from our Corporate & Other segment increased by $211.2 million for the year ended December 31, 2013 compared to 2012. This was due primarily to asset impairment charges related to APS Healthcare totaling $189.4 million, as well as an increase in business development costs, legal costs related to APS Healthcare, restructuring charges and lower profitability of our APS Healthcare business.
Our effective tax rate on continuing operations was a benefit of 5.4% for 2013 compared with an expense of 31.7% for 2012. The variance in the 2013 effective tax rate compared with the expected benefit of the 35% federal rate was driven by permanent items relating primarily to non-deductible goodwill impairment, the limitation on the deductibility of executive compensation for health insurers enacted in the ACA, interest on the mandatorily redeemable preferred stock, foreign and state income taxes and non-recurring tax expenses. The effective tax rate in 2012 was favorably impacted by the recognition of certain state tax benefits, partially offset by permanent items, including non-deductible executive compensation and interest. During 2014, we determined that we are no longer subject to the limitation on the deductibility of executive compensation, and in 2014 we recorded a tax benefit related to these amounts that were not deducted in prior years. See Note 12—Income Taxes in the Notes to Consolidated Financial Statements for additional information.
Income taxes include non-recurring tax (expenses) benefits of ($1.2) million and $7.3 million for the years ended December 31, 2013 and 2012, respectively. The 2013 expense primarily related to the establishment of a valuation allowance against deferred tax assets primarily related to foreign tax credits of our APS Puerto Rico subsidiary. The 2012 benefit primarily relates to acceptance of amended returns for prior years that removed certain revenues from revenue-based state taxes that resulted in a reserve release of $2.6 million and the recording of a receivable of $3.6 million. In addition, the 2012 benefit includes a $1.2 million reserve release related to items on which the statute of limitations has expired.
74
Segment Results—Medicare Advantage
| | For the year ended December 31, | |||||||||
|---|---|---|---|---|---|---|---|---|---|---|
| | 2014 | 2013 | 2012 | |||||||
| | (in thousands) | |||||||||
Net premiums | $ | 1,393,444 | $ | 1,617,176 | $ | 1,619,336 | ||||
Net investment and other income | 15,931 | 18,745 | 23,414 | |||||||
| | | | | | | | | | | |
Total revenue | 1,409,375 | 1,635,921 | 1,642,750 | |||||||
| | | | | | | | | | | |
Medical expenses | 1,171,002 | 1,376,960 | 1,332,044 | |||||||
Amortization of intangible assets | 2,600 | 3,017 | 3,128 | |||||||
ACA fee | 22,910 | — | — | |||||||
Commissions and general expenses | 165,063 | 202,477 | 214,803 | |||||||
| | | | | | | | | | | |
Total benefits, claims and other deductions | 1,361,575 | 1,582,454 | 1,549,975 | |||||||
| | | | | | | | | | | |
Segment income before income taxes | $ | 47,800 | $ | 53,467 | $ | 92,775 | ||||
| | | | | | | | | | | |
| | | | | | | | | | | |
| | | | | | | | | | | |
Our Medicare Advantage segment includes the operations of our Medicare coordinated care HMO, PPO and Network PFFS Plans (collectively, the "Plans"). Our HMOs offer coverage to Medicare members primarily in Southeastern Texas, and the area surrounding Dallas/Ft. Worth. For 2015, we have not re-bid the PFFS contracts for our non-core markets, resulting in coverage to be provided to Medicare members in our markets in Southeastern Texas (especially Houston/Beaumont), the area surrounding Dallas/Ft. Worth, upstate New York and Maine.
Years ended December 31, 2014 and 2013
Our Medicare Advantage segment generated income before income taxes of $47.8 million for the year ended December 31, 2014, a decrease of $5.7 million compared to the year ended December 31, 2013. The decrease in earnings was driven by the new ACA fee of $22.9 million (effective in 2014), lower membership and lower net investment income; offset by an improved medical benefit ratio of 84.0% for the full year 2014 compared to 85.1% for 2013 and a decrease in our administrative expense ratio from 12.7% in 2013 to 12.0% in 2014. The year ended December 31, 2014, included $33.0 million of net favorable prior year items compared to $23.3 million for the year ended December 31, 2013.
Net premiums. Net premiums for the Medicare Advantage segment decreased by $223.7 million compared to the year ended December 31, 2013, primarily driven by lower membership in our non-core service areas as well as lower premium yield per member resulting from a change in membership mix. In 2014, net premiums included $14.6 million of favorable prior period items compared to $33.2 million of favorable prior period items in 2013.
Net investment and other income. Net investment and other income decreased $2.8 million primarily due to lower invested asset levels resulting from the payment of dividends to the parent in 2013.
Medical expenses. Medical expenses decreased by $206.6 million compared to the year ended December 31, 2013. The decrease was driven by lower membership and lower claims cost per member (as a result of exiting non-core markets that incurred higher claims cost per member) as well as favorable prior period items, resulting in a medical benefit ratio of 84.0% in 2014 compared with 85.1% in 2013. During 2014, medical expenses included $18.4 million of net favorable items related to prior periods, compared to $9.9 million of net unfavorable items related to prior periods in 2013.
Quality improvement initiative costs of $28.4 million in each of the years ended December 31, 2014 and 2013, respectively, are included in medical expenses in connection with the reporting of minimum medical loss ratios under the ACA. These costs were previously reported in commissions and
75
general expenses. The following table provides a breakdown of medical expenses and the related medical benefit ratios:
| | For the year ended December 31, | ||||||||||||
|---|---|---|---|---|---|---|---|---|---|---|---|---|---|
| | 2014 | 2013 | |||||||||||
| | ($ in thousands) | ||||||||||||
Quality Initiatives | $ | 28,365 | 2.0 | % | $ | 28,407 | 1.8 | % | |||||
Medical Benefits | 1,142,637 | 82.0 | % | 1,348,553 | 83.3 | % | |||||||
| | | | | | | | | | | | | | |
Total Benefits | $ | 1,171,002 | 84.0 | % | $ | 1,376,960 | 85.1 | % | |||||
| | | | | | | | | | | | | | |
| | | | | | | | | | | | | | |
| | | | | | | | | | | | | | |
Adjusting for the prior year items discussed above in premiums and medical expenses, for the year ended December 31, 2014, our medical benefit MBR, excluding quality initiative costs was 84.2%. Our medical benefit MBRs for the year ended December 31, 2014, as reported and revised to exclude prior year items, are summarized in the table below:
| | Reported | Revised | |||||
|---|---|---|---|---|---|---|---|
HMO | 81.2 | % | 82.4 | % | |||
Other Core Network | 81.1 | % | 83.7 | % | |||
| | | | | | | | |
Core | 81.2 | % | 82.7 | % | |||
Non-Core Network | 85.7 | % | 88.6 | % | |||
Rural | 96.6 | % | 98.8 | % | |||
| | | | | | | | |
Total Medicare Advantage | 82.0 | % | 84.2 | % | |||
| | | | | | | | |
| | | | | | | | |
| | | | | | | | |
ACA fee. The ACA fee for the year ended December 31, 2014 amounted to $22.9 million, or 1.6% of 2014 net premiums. The ACA fee is included in the calculation of minimum medical loss ratios under the ACA.
Commissions and general expenses. Commissions and general expenses for the year ended December 31, 2014 decreased $37.4 million compared to the year ended December 31, 2013, primarily due to cost reduction initiatives and lower membership. Our administrative expense ratio improved to 12.0% for the year ended December 31, 2014 from 12.7% in 2013 primarily as a result of our cost reduction efforts. Commissions and general expenses for the year ended December 31, 2013 were adjusted to exclude $28.4 million of quality initiative expenses, which have been reclassified to medical expenses to be consistent with 2014 classification, as discussed above.
Years ended December 31, 2013 and 2012
Our Medicare Advantage segment generated income before income taxes of $53.5 million for the year ended December 31, 2013, a decrease of $39.3 million compared to the year ended December 31, 2012. The decrease in earnings was driven by the medical benefit ratio increasing to 85.1% for the full year 2013 compared to 82.3% for 2012 partially offset by a decrease in our administrative expense ratio from 13.5% in 2012 to 12.7% in 2013. The year ended December 31, 2013, included $23.3 million of net favorable prior year items compared to $27.4 million for the year ended December 31, 2012.
Net premiums. Net premiums for the Medicare Advantage segment decreased by $2.2 million compared to the year ended December 31, 2012. In 2013, net premiums included $33.2 million of favorable prior period items compared to $34.4 million of favorable prior period items in 2012.
Net investment and other income. Net investment and other income decreased $4.7 million due to the payment of dividends to the parent in 2013 and the maturity of higher yielding assets with the proceeds being reinvested in lower yielding securities due to the low interest rate environment.
76
Medical expenses. Medical expenses increased by $44.9 million compared to the year ended December 31, 2012, increasing the medical benefit ratio to 85.1% for 2013 from 82.3% for 2012. During 2013, medical expenses included $9.9 million of net unfavorable items related to prior periods, compared to $7.0 million of net unfavorable items related to prior periods in 2012. 2013 medical expenses were also unfavorably impacted by an increase in inpatient and emergent care utilization in our non-HMO lines of business and an increase in the volume of large dollar claims in our HMO lines of business. In addition, $7.4 million, or 0.4% of the medical expense ratio, is related to the results of sequestration from the April—December period of 2013.
Quality improvement initiative costs of $28.4 million and $27.3 million in the years ended December 31, 2013 and 2012, respectively, are included in medical expenses in connection with the reporting of minimum medical loss ratios under the ACA. These costs were previously reported in commissions and general expenses. The following table provides a breakdown of medical expenses and the related medical benefit ratios:
| | For the year ended December 31, | ||||||||||||
|---|---|---|---|---|---|---|---|---|---|---|---|---|---|
| | 2013 | 2012 | |||||||||||
| | ($ in thousands) | ||||||||||||
Quality Initiatives | $ | 28,407 | 1.8 | % | $ | 27,297 | 1.7 | % | |||||
Medical Benefits | 1,348,553 | 83.3 | % | 1,304,747 | 80.6 | % | |||||||
| | | | | | | | | | | | | | |
Total Benefits | $ | 1,376,960 | 85.1 | % | $ | 1,332,044 | 82.3 | % | |||||
| | | | | | | | | | | | | | |
| | | | | | | | | | | | | | |
| | | | | | | | | | | | | | |
Adjusting for the prior year items discussed above in premiums and medical expenses, for the year ended December 31, 2013, our medical benefit MBR, excluding quality initiative costs was 86.3%.
Commissions and general expenses. Commissions and general expenses for the year ended December 31, 2013 decreased $12.3 million compared to the year ended December 31, 2012, primarily as the result of the decreased level of membership. Our administrative expense ratio improved to 12.7% for the year ended December 31, 2013 from 13.5% in 2012 primarily as a result of our cost reduction efforts. Commissions and general expenses for the years ended December 31, 2013 and 2012 were adjusted to exclude $28.4 million and $27.3 million, respectively, of quality initiative expenses, which have been reclassified to medical expenses to be consistent with 2014 classification, as discussed above.
Segment Results—Management Services Organization
The following table represents the operating results of our MSO segment, consolidating the ACOs in which we participate with the operations of our CHS subsidiary:
| | 2014 | 2013 | 2012 | |||||||
|---|---|---|---|---|---|---|---|---|---|---|
| | (in thousands) | |||||||||
Shared Savings Revenue(1): | ||||||||||
Gross Shared Savings | $ | 20,357 | $ | — | $ | — | ||||
ACO Partner Share | (6,982 | ) | — | — | ||||||
| | | | | | | | | | | |
Net Shared Savings Revenue | 13,375 | — | — | |||||||
Operating Expenses | 44,184 | 41,588 | 21,654 | |||||||
| | | | | | | | | | | |
Segment loss before income taxes | $ | (30,809 | ) | $ | (41,588 | ) | $ | (21,654 | ) | |
| | | | | | | | | | | |
| | | | | | | | | | | |
| | | | | | | | | | | |
- (1)
- Represents shared savings revenues received in 2014 related to program year 2012/2013.
77
Formerly included in our Corporate & Other segment, our MSO segment includes our CHS subsidiary, which collaborates with physicians and other healthcare professionals to operate ACOs under the MSSP. As of January 1, 2015 we sponsored twenty-four active ACOs in ten states previously approved for participation in the program by CMS. Based on data provided by CMS, these twenty-four ACOs currently include approximately 3,800 participating providers with approximately 285,000 assigned Medicare fee-for-service beneficiaries, both within and outside our current Medicare Advantage footprint, including southeast Texas and upstate New York. CHS provides these ACOs with care coordination, analytics and reporting, technology and other administrative capabilities to enable participating providers to deliver better care and lower healthcare costs for their Medicare fee-for-service beneficiaries. We have determined that we cannot consolidate the ACOs and therefore, include our share of their operating results in Equity in losses of unconsolidated subsidiaries on our Consolidated Statement of Operations. In the table above, we have presented our share of the results of the ACOs' revenues and expenses and combined that with the results of CHS so provide a better understanding of the results of operations.
The MSSP is relatively new and therefore has limited historical experience. This impacts our ability to accurately accumulate and interpret the data available for calculating the ACOs' shared savings. Therefore, we were not able to recognize revenue for the year ended December 31, 2013 until we received the final settlement results from CMS in September 2014. Similarly, we were not able to recognize revenue for the year ended December 31, 2014 in the 2014 financial statements. We expect that revenue, if any, for the program year ended December 31, 2014 will be reported in 2015 when the MSSP revenue is either known or estimable with reasonable certainty. Based on the ACO operating agreements, we bear all costs of the ACO operations until revenue is recognized. At that point, we share in up to 100% of the revenue to recover our costs incurred. Any remaining revenue is generally shared equally with our ACO provider partners.
Years ended December 31, 2014 and 2013
Our MSO segment generated a loss before income taxes of $30.8 million for the year ended December 31, 2014; a decrease of $10.8 million compared to the year ended December 31, 2013. This improvement was driven by the receipt of $13.4 million of revenue in 2014 related to the initial ACO program period ended December 31, 2013, partially offset by an increase in ACO operating expenses as we had four new ACOs start up on January 1, 2014.
During September 2014, we received notice that the ACOs we formed in partnership with primary care physicians and other healthcare professionals generated $66 million in total program savings for CMS, as part of the MSSP for program years 2012 and 2013. Of our 30 ACOs with start dates in 2012 and 2013, the results showed that:
- •
- 3 ACOs, serving more than 56,000 Medicare beneficiaries and including our largest ACO in Houston, generated savings in excess of their Minimum Savings Rate and therefore, qualified to share those savings with CMS;
- •
- 11 ACOs, serving more than 120,000 Medicare beneficiaries, generated savings but fell below their Minimum Savings Rate required to share savings with CMS;
- •
- 8 ACOs were within 2 percent of their benchmark;
- •
- 8 ACOs were 2 percent or more above their benchmark; and
- •
- All ACOs met CMS's quality reporting standards.
The 3 ACOs qualifying for savings received payments of $20.4 million, part to be paid to physicians and part to reimburse a portion of the costs that we have incurred. Our share of these savings, including expense recovery, amounted to $13.4 million, which is reflected in equity in losses of
78
unconsolidated subsidiaries in our consolidated statements of operations. We received these payments in October 2014. We did not recognize any shared savings revenue in 2013.
Years ended December 31, 2013 and 2012
Our MSO segment generated a loss before income taxes of $41.6 million for the year ended December 31, 2013, an increase of $19.9 million compared to 2012. This was due to increased operating costs, as there were thirty-one ACO entities in operation in 2013 compared to sixteen at December 31, 2012 and only nine months of operations in 2012. We did not recognize any ACO revenue for the years ended December 31, 2013 and 2012. Revenue for the initial program periods ending December 31, 2013 was reported in 2014.
Segment Results—Medicaid
| | For the year ended December 31, | ||||||
|---|---|---|---|---|---|---|---|
| | 2014 | 2013 | |||||
| | (in thousands) | ||||||
Net premiums | $ | 178,288 | $ | 12,771 | |||
Net investment and other income | 173 | — | |||||
| | | | | | | | |
Total revenue | 178,461 | 12,771 | |||||
| | | | | | | | |
Medical expenses | 160,826 | 11,684 | |||||
Amortization of intangible assets | 806 | 66 | |||||
ACA fee | 183 | — | |||||
Commissions and general expenses | 14,011 | 1,547 | |||||
| | | | | | | | |
Total benefits, claims and other deductions | 175,826 | 13,297 | |||||
| | | | | | | | |
Segment income (loss) before income taxes | $ | 2,635 | $ | (526 | ) | ||
| | | | | | | | |
| | | | | | | | |
| | | | | | | | |
On December 1, 2013, we acquired the Total Care Medicaid health plan. Total Care provides Medicaid managed care services to approximately 40,000 members in three counties in upstate New York that overlap with our existing Medicare Advantage footprint. Roughly 80% of its members are located in Onondaga County. In addition to the Medicaid program, Total Care also participates in the Child Health Plus program for low-income, uninsured children.
Years ended December 31, 2014 and 2013
Our Medicaid segment generated income before income taxes of $2.6 million for the year ended December 31, 2014 compared to a loss of $0.5 million for the year ended December 31, 2013. This was due to 2013 consisting of only one month of activity that included approximately $0.6 million of acquisition related costs.
79
Segment Results—Traditional Insurance
| | For the year ended December 31, | |||||||||
|---|---|---|---|---|---|---|---|---|---|---|
| | 2014 | 2013 | 2012 | |||||||
| | (in thousands) | |||||||||
Net premiums | $ | 185,947 | $ | 213,920 | $ | 241,904 | ||||
Net investment and other income | 17,854 | 19,284 | 20,963 | |||||||
| | | | | | | | | | | |
Total revenue | 203,801 | 233,204 | 262,867 | |||||||
| | | | | | | | | | | |
Policyholder benefits | 144,172 | 160,745 | 186,246 | |||||||
Change in deferred policy acquisition costs | 12,323 | 12,628 | 5,418 | |||||||
Commissions and general expenses, net of allowances | 44,799 | 48,885 | 53,138 | |||||||
| | | | | | | | | | | |
Total benefits, claims and other deductions | 201,294 | 222,258 | 244,802 | |||||||
| | | | | | | | | | | |
Segment income before income taxes | $ | 2,507 | $ | 10,946 | $ | 18,065 | ||||
| | | | | | | | | | | |
| | | | | | | | | | | |
| | | | | | | | | | | |
Our Traditional Insurance segment consists of three major lines of business. Senior Market includes Medicare supplement, senior dental and hospital indemnity products. Specialty Health includes disability, specified disease, hospital, surgical and long-term care products. Life Insurance includes senior life products. We discontinued marketing and selling Traditional insurance products after June 1, 2012.
Years ended December 31, 2014 and 2013
Our Traditional Insurance segment generated income before taxes of $2.5 million for 2014, a decrease of $8.4 million compared to 2013. The decrease in earnings is primarily driven by the reduction of business in-force combined with higher benefits ratios on our Specialty health lines which resulted in lower underwriting income. Additionally, operating expenses included higher consulting costs related to the transition and outsourcing of certain functions.
Net premiums. Net premium declined by $28.0 million, or 13.1%. This is the result of the continued effect of lapsation across all lines of business. The following tables detail premium for the segment by major lines of business:
| | Year ended December 31, | ||||||||||||||||||
|---|---|---|---|---|---|---|---|---|---|---|---|---|---|---|---|---|---|---|---|
| | 2014 | 2013 | |||||||||||||||||
| | Gross | Ceded | Net | Gross | Ceded | Net | |||||||||||||
| | (in thousands) | ||||||||||||||||||
Senior market | $ | 170,643 | $ | (35,858 | ) | $ | 134,785 | $ | 198,172 | $ | (41,999 | ) | $ | 156,173 | |||||
Specialty health | 44,741 | (6,336 | ) | 38,405 | 50,117 | (6,643 | ) | 43,474 | |||||||||||
Life insurance | 43,963 | (31,206 | ) | 12,757 | 48,209 | (33,936 | ) | 14,273 | |||||||||||
| | | | | | | | | | | | | | | | | | | | |
Total premium | $ | 259,347 | $ | (73,400 | ) | $ | 185,947 | $ | 296,498 | $ | (82,578 | ) | $ | 213,920 | |||||
| | | | | | | | | | | | | | | | | | | | |
| | | | | | | | | | | | | | | | | | | | |
| | | | | | | | | | | | | | | | | | | | |
Net investment income. Net investment income decreased by $1.4 million, primarily due to a lower invested asset base due to the payment of dividends to the parent in 2013 and the declining blocks of business.
Policyholder benefits. Policyholder benefits incurred declined by $16.6 million, or 10.3%, compared to 2013. This decline was principally due to the overall decline of insurance in-force, while medical trend was relatively stable. For 2014, the policyholder benefit ratio for senior market health was 68.9% compared with 67.2% in 2013, and for specialty health was 111.0% in 2014, compared with 107.4% in 2013.
80
Commissions and general expenses, net of allowances. Commissions and general expenses, net of allowances, decreased by $4.1 million from 2013. This decrease is primarily attributed to lower commissions on less insurance in-force as well as lower costs required to run a smaller book of business in-force, partially offset by higher consulting costs related to the transition and outsourcing of certain functions.
Years ended December 31, 2013 and 2012
Our Traditional Insurance segment generated income before taxes of $10.9 million for 2013, a decrease of $7.1 million compared to 2012. The decrease in earnings is driven by the reduction of business in-force which resulted in lower underwriting income and lower net investment income, as well as higher consulting and outside services costs.
Net premiums. Net premium declined by $28.0 million, or 11.6%. This is primarily the result of the continued effect of lapsation across all lines of business, but primarily driven by Medicare supplement. The following tables detail premium for the segment by major lines of business:
| | Year ended December 31, | ||||||||||||||||||
|---|---|---|---|---|---|---|---|---|---|---|---|---|---|---|---|---|---|---|---|
| | 2013 | 2012 | |||||||||||||||||
| | Gross | Ceded | Net | Gross | Ceded | Net | |||||||||||||
| | (in thousands) | ||||||||||||||||||
Medicare supplement | $ | 198,172 | $ | (41,999 | ) | $ | 156,173 | $ | 227,859 | $ | (49,375 | ) | $ | 178,484 | |||||
Specialty health | 50,117 | (6,643 | ) | 43,474 | 54,034 | (6,904 | ) | 47,130 | |||||||||||
Life insurance | 48,209 | (33,936 | ) | 14,273 | 53,735 | (37,445 | ) | 16,290 | |||||||||||
| | | | | | | | | | | | | | | | | | | | |
Total premium | $ | 296,498 | $ | (82,578 | ) | $ | 213,920 | $ | 335,628 | $ | (93,724 | ) | $ | 241,904 | |||||
| | | | | | | | | | | | | | | | | | | | |
| | | | | | | | | | | | | | | | | | | | |
| | | | | | | | | | | | | | | | | | | | |
Net investment income. Net investment income decreased by $1.2 million, primarily due to the maturity of higher yielding assets with the proceeds being reinvested in lower yielding securities because of the low interest rate environment, as well as a lower invested asset base due to the payment of dividends in 2013 and the declining blocks of business.
Policyholder benefits. Policyholder benefits incurred declined by $25.5 million, or 13.7%, compared to 2012. This decline was principally due to the overall decline of insurance in-force in the Senior Market and Specialty Health lines of business and a lower medical trend on Medicare supplement. For 2013, the policyholder benefit ratio for senior market health was 67.2% compared with 71.0% in 2012, and for specialty health was 107.4% in 2013, compared with 107.2% in 2012.
Change in deferred acquisition costs. The change in deferred acquisition costs increased $7.2 million compared to 2012. This was primarily caused by the lower capitalization in 2013 due to the decision to discontinue marketing and selling Traditional insurance products in mid-2012.
Commissions and general expenses, net of allowances. Commissions and general expenses, net of allowances, decreased by $4.2 million from 2012. This decrease is primarily attributed to the decision to stop marketing and selling Traditional insurance products and lower costs required to run a smaller book of business in-force partially offset by higher consulting and outside services costs.
81
Segment Results—Corporate & Other
The following table presents the primary components comprising the loss from the segment:
| | For the year ended December 31, | |||||||||
|---|---|---|---|---|---|---|---|---|---|---|
| | 2014 | 2013 | 2012 | |||||||
| | (in thousands) | |||||||||
Net premiums | $ | 156,737 | $ | 157,441 | $ | 128,574 | ||||
Net investment income | 3,114 | 560 | 261 | |||||||
Fee and other income | 92,800 | 112,099 | 135,739 | |||||||
| | | | | | | | | | | |
Total revenue | 252,651 | 270,100 | 264,574 | |||||||
| | | | | | | | | | | |
Claims and other benefits | 137,575 | 135,207 | 106,263 | |||||||
Amortization of intangible assets | 1,125 | 4,354 | 4,525 | |||||||
Interest expense | 6,979 | 6,562 | 6,238 | |||||||
Asset impairment charges | — | 189,443 | — | |||||||
Commissions and general expenses | 161,648 | 173,932 | 175,704 | |||||||
| | | | | | | | | | | |
Total benefits, claims and other deductions | 307,327 | 509,498 | 292,730 | |||||||
| | | | | | | | | | | |
Segment loss before income taxes | $ | (54,676 | ) | $ | (239,398 | ) | $ | (28,156 | ) | |
| | | | | | | | | | | |
| | | | | | | | | | | |
| | | | | | | | | | | |
Corporate & Other includes the activities of our holding company, the operations of APS Healthcare since its acquisition on March 2, 2012, our participation in the Exchange and other ancillary operations. We are not participating in the Exchange for 2015.
Years ended December 31, 2014 and 2013
The loss before income taxes from our Corporate & Other segment decreased by $184.7 million for the year ended December 31, 2014 compared to 2013. This was primarily due to asset impairment charges related to APS Healthcare in 2013 totaling $189.4 million, improved profitability of our APS Healthcare business, corporate expense reduction initiatives and higher net investment income, partially offset by higher legal and settlement costs related to our non-core business, primarily APS Healthcare, Traditional Insurance and our participation in the Exchange.
The following table details the loss before income taxes for our Corporate & Other segment:
| | For the year ended December 31, | ||||||
|---|---|---|---|---|---|---|---|
| | 2014 | 2013 | |||||
| | (in thousands) | ||||||
APS Healthcare | $ | 10,330 | $ | (4,082 | ) | ||
New York Health Benefits Exchange | (2,148 | ) | — | ||||
Interest expense | (6,979 | ) | (6,562 | ) | |||
Asset impairment charges | — | (189,443 | ) | ||||
Legal/settlement costs | (28,824 | ) | (6,223 | ) | |||
Corporate | (27,055 | ) | (33,088 | ) | |||
| | | | | | | | |
Total segment loss before income taxes | $ | (54,676 | ) | $ | (239,398 | ) | |
| | | | | | | | |
| | | | | | | | |
| | | | | | | | |
Net premiums. Net premiums decreased by $0.7 million for the year ended December 31, 2014 compared to 2013. This was due to a decrease of $2.0 million in APS Healthcare premiums due to a smaller block of risk business partially offset by $1.3 million related to the Exchange product we
82
launched in upstate New York on January 1, 2014. The following table details net premiums for our Corporate & Other segment:
| | For the year ended December 31, | ||||||
|---|---|---|---|---|---|---|---|
| | 2014 | 2013 | |||||
| | (in thousands) | ||||||
APS Healthcare | $ | 155,446 | $ | 157,441 | |||
New York Health Benefits Exchange | 1,291 | — | |||||
| | | | | | | | |
Total net premiums | $ | 156,737 | $ | 157,441 | |||
| | | | | | | | |
| | | | | | | | |
| | | | | | | | |
Net investment income. Net investment income for the year ended December 31, 2014 included $2.7 million related to a distribution received on a cost-method investment.
Fee and other income. Fee and other income decreased by $19.3 million for the year ended December 31, 2014 compared to 2013 primarily due to planned reductions in fee for service business at APS Healthcare and lower revenue in our corporate agencies. The following table details fee and other income for our Corporate & Other segment:
| | For the year ended December 31, | ||||||
|---|---|---|---|---|---|---|---|
| | 2014 | 2013 | |||||
| | (in thousands) | ||||||
APS Healthcare | $ | 87,971 | $ | 102,532 | |||
Corporate | 4,829 | 9,567 | |||||
| | | | | | | | |
Total fee and other income | $ | 92,800 | $ | 112,099 | |||
| | | | | | | | |
| | | | | | | | |
| | | | | | | | |
Claims and other benefits. Claims and other benefits increased by $2.3 million for the year ended December 31, 2014 compared to 2013, primarily due to the Exchange product we launched in upstate New York on January 1, 2014. The following table details claims and other benefits for our Corporate & Other segment:
| | For the year ended December 31, | ||||||
|---|---|---|---|---|---|---|---|
| | 2014 | 2013 | |||||
| | (in thousands) | ||||||
APS Healthcare | $ | 136,015 | $ | 135,207 | |||
New York Health Benefits Exchange | 1,560 | — | |||||
| | | | | | | | |
Total claims and other benefits | $ | 137,575 | $ | 135,207 | |||
| | | | | | | | |
| | | | | | | | |
| | | | | | | | |
Amortization of intangible assets. This represents the amortization of APS Healthcare intangible assets. The decrease is primarily due to prior year impairment of APS Healthcare intangible assets, resulting in a lower asset balance being amortized.
Asset impairment charges. During calendar year 2013, we recorded asset impairment charges related to APS Healthcare of $189.4 million, which included impairments to goodwill of $164.8 million, amortizing intangibles of $16.1 million and tangible assets of $8.5 million. For additional information, see Note 8—Goodwill and Other Intangible Assets in the Notes to Consolidated Financial Statements.
Commissions and general expenses. Total commissions and general expenses decreased by $12.3 million for the year ended December 31, 2014 compared to 2013. This was driven by a $30.8 million decrease at APS Healthcare primarily related to expense reduction initiatives and lower
83
levels of business. General corporate expenses increased $18.6 million compared with 2013, primarily related to higher legal and settlement costs related to our non-core business, primarily APS Healthcare, Traditional Insurance and the Exchange. The following table details commissions and general expenses for our Corporate & Other segment:
| | For the year ended December 31, | ||||||
|---|---|---|---|---|---|---|---|
| | 2014 | 2013 | |||||
| | (in thousands) | ||||||
APS Healthcare | $ | 93,715 | $ | 124,564 | |||
New York Health Benefits Exchange | 1,879 | — | |||||
Legal/settlement costs | 28,824 | 6,223 | |||||
Corporate | 37,230 | 43,145 | |||||
| | | | | | | | |
Total commissions and general expenses | $ | 161,648 | $ | 173,932 | |||
| | | | | | | | |
| | | | | | | | |
| | | | | | | | |
Years ended December 31, 2013 and 2012
The loss before income taxes from our Corporate & Other segment increased by $211.2 million for the year ended December 31, 2013 compared to 2012. This was due primarily to asset impairment charges related to APS Healthcare totaling $189.4 million, as well as an increase in business development costs, legal costs related to APS Healthcare, restructuring charges and lower profitability of our APS Healthcare business. The following table details the loss before income taxes for our Corporate & Other segment:
| | For the year ended December 31, | ||||||
|---|---|---|---|---|---|---|---|
| | 2013 | 2012 | |||||
| | (in thousands) | ||||||
APS Healthcare | $ | (4,082 | ) | $ | 711 | ||
Interest expense | (6,562 | ) | (6,238 | ) | |||
Asset impairment charges | (189,443 | ) | — | ||||
Legal/settlement costs | (6,223 | ) | — | ||||
Corporate | (33,088 | ) | (22,629 | ) | |||
| | | | | | | | |
Total segment loss before income taxes | $ | (239,398 | ) | $ | (28,156 | ) | |
| | | | | | | | |
| | | | | | | | |
| | | | | | | | |
Net premiums. Net premiums increased by $28.9 million for the year ended December 31, 2013 compared to 2012 due to 2013 including a full year of APS Healthcare results compared with ten months in 2012 as APS Healthcare was acquired on March 2, 2012.
Fee and other income. Fee and other income decreased by $23.6 million for the year ended December 31, 2013 compared to 2012 primarily due to lower levels of fee for service business at APS Healthcare, partially offset by including a full year of APS Healthcare results in 2013, compared with
84
ten months in 2012. The following table details fee and other income for our Corporate & Other segment:
| | For the year ended December 31, | ||||||
|---|---|---|---|---|---|---|---|
| | 2013 | 2012 | |||||
| | (in thousands) | ||||||
APS Healthcare | $ | 102,532 | $ | 122,676 | |||
Corporate | 9,567 | 13,063 | |||||
| | | | | | | | |
Total fee and other income | $ | 112,099 | $ | 135,739 | |||
| | | | | | | | |
| | | | | | | | |
| | | | | | | | |
Claims and other benefits. Claims and other benefits increased by $28.9 million for the year ended December 31, 2013 compared to 2012, due to 2013 including a full year of APS Healthcare results compared to ten months in 2012 as well as higher utilization levels in our APS Puerto Rico business.
Amortization of intangible assets. This represents the amortization of APS Healthcare intangible assets. The increase is primarily due to 2013 including a full year of APS Healthcare results compared to ten months in 2012.
Asset impairment charges. During calendar year 2013, we recorded asset impairment charges related to APS Healthcare of $189.4 million, which included impairments to goodwill of $164.8 million, amortizing intangibles of $16.1 million and tangible assets of $8.5 million. For additional information, see Note 8—Goodwill and Other Intangible Assets in the Notes to Consolidated Financial Statements.
Commissions and general expenses. Total commissions and general expenses decreased by $4.9 million for the year ended December 31, 2013 compared to 2012. This was driven by a $15.2 million decrease at APS Healthcare primarily related to expense reduction initiatives and lower levels of business. General corporate expenses increased $10.4 million compared with 2012, primarily related to business development activities, legal costs related to APS Healthcare and restructuring charges. The following table details commissions and general expenses for our Corporate & Other segment:
| | For the year ended December 31, | ||||||
|---|---|---|---|---|---|---|---|
| | 2013 | 2012 | |||||
| | (in thousands) | ||||||
APS Healthcare | $ | 124,564 | $ | 139,787 | |||
Legal/settlement costs | 6,223 | — | |||||
Corporate | 43,145 | 35,917 | |||||
| | | | | | | | |
Total commissions and general expenses | $ | 173,932 | $ | 175,704 | |||
| | | | | | | | |
| | | | | | | | |
| | | | | | | | |
85
Contractual Obligations and Commercial Commitments
Our contractual obligations as of December 31, 2014, are shown below.
| | Payments Due by Period | |||||||||||||||
|---|---|---|---|---|---|---|---|---|---|---|---|---|---|---|---|---|
Contractual Obligations | Total | 2015 | 2016 - 2017 | 2018 - 2019 | Thereafter | |||||||||||
| | (in thousands) | |||||||||||||||
Long-term Debt Obligations(1): | ||||||||||||||||
Series A mandatorily redeemable preferred shares | $ | 48,500 | $ | 3,400 | $ | 45,100 | $ | — | $ | — | ||||||
Loan payable | 108,472 | 17,081 | 91,391 | — | — | |||||||||||
Operating Lease Obligations | 29,784 | 9,813 | 12,896 | 4,619 | 2,456 | |||||||||||
Purchase Obligations(2) | 29,461 | 13,810 | 8,365 | 7,286 | — | |||||||||||
Policy-Related Liabilities(3): | ||||||||||||||||
Reserves and other policy liabilities—life | 39,485 | 3,474 | 3,826 | 3,409 | 28,776 | |||||||||||
Reserve for future policy benefits—health | 493,276 | 25,104 | 47,700 | 44,541 | 375,931 | |||||||||||
Policy and contract claims—health | 141,266 | 126,952 | 14,314 | — | — | |||||||||||
| | | | | | | | | | | | | | | | | |
Total | $ | 890,244 | $ | 199,634 | $ | 223,592 | $ | 59,855 | $ | 407,163 | ||||||
| | | | | | | | | | | | | | | | | |
| | | | | | | | | | | | | | | | | |
| | | | | | | | | | | | | | | | | |
- (1)
- These obligations include contractual interest, unused commitment fees and annual administrative fees and the table reflects scheduled maturities for contractual obligations existing as of December 31, 2014.
- (2)
- Reflects minimum obligations on our outsourcing contracts, See "Outsourcing Arrangements" in Part 1, Item 1 of this annual report on Form 10-K. The amount of service provided under the contracts and the levels of business processed affect our actual monthly payments. The above table includes only the minimum amounts required under the contracts. Based upon anticipated future service levels, we expect that our total actual payments for purchase obligations will exceed the amounts presented in the above schedule.
- (3)
- Our obligations for policy related liabilities represent those payments we expect to make on death, disability and health insurance claims and policy surrenders, net of amounts recovered from reinsurers. These projected values contain assumptions for future policy persistency, mortality and morbidity comparable with our historical experience. The distribution of payments for policy and contract claims reflects assumptions as to the timing of policyholders reporting claims for prior periods and the amounts of those claims. Actual amounts and timing of both future policy benefits and policy and contract claims may differ significantly from the estimates above. We anticipate that our reserves for policy liabilities and policy and contract claims, along with future net premiums, investment income and recoveries from our reinsurers will be sufficient to fund our policy related obligations. On our consolidated balance sheets in Part II, Item 8 of this annual report on Form 10-K, we report our policy related liabilities gross of amounts recoverable from reinsurers, which are reported as assets. We are obligated to pay claims in the event that a reinsurer fails to meet its obligations under the reinsurance agreements. However, as of December 31, 2014, all of our primary reinsurers were rated "A–"(Excellent) or better by A.M. Best with the exception of one reinsurer. For that reinsurer, which is not rated, a trust containing assets at 106% of policy reserve levels is maintained. We are not aware of any instances where any of our reinsurers have been unable to pay any policy claims on reinsured business. Therefore, we have presented our obligations in the table above net of amounts recoverable from reinsurers. Our obligations for policy related liabilities before amounts recovered from reinsurers amount to $1.6 billion.
86
Liquidity and Capital Resources
Sources and Uses of Liquidity to the Parent Company, Universal American Corp. We require cash at our parent company to support the operations and growth of our HMO, insurance and other subsidiaries, fund new business opportunities through acquisitions or otherwise and pay the operating expenses necessary to function as a holding company, as applicable insurance department regulations require us to bear our own expenses.
The parent company's ongoing sources and uses of liquidity are derived primarily from the following:
- •
- dividends from and capital contributions to our Insurance and HMO subsidiaries—During 2014, our Insurance and HMO subsidiaries paid $53.1 million in ordinary dividends to their holding companies. Based on current estimates, we expect the aggregate amount of dividends that may be paid to our parent company in 2015 without prior approval by state regulatory authorities is approximately $27 million. In addition, in 2014, we made an initial capital contribution of $1.6 million to a new HMO licensed subsidiary and a $15.5 million capital contribution to one of our Insurance subsidiaries, which was funded in February 2015.
- •
- loans from and interest payments to our Insurance subsidiaries to support investments in our ACO business—During 2013, our Insurance subsidiaries loaned $22 million to our parent company. During 2014, the parent company paid interest totaling $0.8 million to our Insurance subsidiaries.
- •
- the cash flows of our other subsidiaries, including our Medicare Advantage management service organization—Net cash flows available to our parent company amounted to approximately $13.9 million during 2014.
- •
- the cash flows of our ACO business and other growth initiatives—For 2014, we incurred losses of approximately $30.8 million, pre-tax, related to our ACO business. This includes 100% of program year 2014 operating expenses, net of our share of revenue related to program years 2012 and 2013, which amounted to $13.4 million. We received these revenue payments in October 2014.
- •
- payment of dividends to holders of our mandatorily redeemable preferred shares—In 2014, we paid $3.4 million of dividends to holders of our mandatorily redeemable preferred shares. The $40 million face value of those shares cannot be redeemed prior to 2017, unless there is a change of control of the Company.
- •
- payment of debt principal, interest and fees required under our 2012 Credit Facility—During 2014, we made interest payments totaling $2.8 million and other fee payments totaling $0.5 million. We were not required to make any principal payments as all scheduled 2014 principal payments, totaling $14.3 million, were prepaid in 2013, in connection with the amendment of our credit facility on November 4, 2013. Currently, there is a bullet payment of $74.9 million due in 2017. However, as a result of the recent subsidiary sale activity, under the 2012 Credit Facility, we have twelve months from receipt of the proceeds to either reinvest those proceeds or make a principal prepayment. If the proceeds are not reinvested, we would need to make prepayments totaling approximately $38 million by February 2016. We have elected to prepay $55 million on March 31, 2015, which will fulfill this obligation and provide additional restricted payment flexibility under the 2012 Credit Facility. We are required to ratably apply this prepayment and any other future prepayments through the remaining scheduled repayments, which would change the amount of the quarterly and bullet payments due through 2017.
- •
- working capital loans to our Medicaid HMO—Periodically, our parent company lends cash to our Medicaid HMO, Today's Options of New York, Inc., known as TONY, to bridge the timing
87
- •
- payment of certain corporate overhead costs and public company expenses, net of revenues which amounted to $30.7 million for the year ended December 31, 2014.
difference between claims payments and premium receipts from New York State Department of Health. These loans are immediately repaid upon receipt of premiums. As of December 31, 2014, TONY had an outstanding loan balance of $0.5 million due to the parent company.
In addition, the parent company from time-to-time engages in corporate finance activities that generate the following sources and uses of liquidity:
- •
- payment of dividends to shareholders—We do not currently pay a regular dividend to our shareholders, however, we have paid special dividends in the past, most recently in August 2013. Payment of any future dividends would be dependent upon an evaluation of excess capital, as discussed below.
- •
- repurchase of our common stock under our stock repurchase plan—On August 1, 2013, our Board of Directors authorized the repurchase of up to $40 million of our outstanding common stock. Purchases may occur from time to time in the open market, in privately negotiated transactions, or otherwise as market conditions permit. On May 13, 2014 we repurchased and retired six million shares of our common stock directly from funds associated with Capital Z Partners Management, LLC at a price of $6.03 per share. We used cash on hand to fund the repurchase of these shares.
- •
- proceeds from the sale of subsidiaries—During 2014, we completed the sale of TOOK, generating cash proceeds of $15.2 million plus a receivable of $0.3 million, which was settled in cash in 2015. Additionally, in December 2014, we completed the sale of SCOK for $1.9 million in cash. In February 2015 we completed the sale of our APS Healthcare Puerto Rico subsidiaries for $26.5 million in cash.
- •
- As of December 31, 2014, we had approximately $110 million of cash and investments in our parent company and unregulated subsidiaries.
We continually evaluate the potential use of any excess capital, which may include the following:
- •
- reinvestment in existing businesses;
- •
- acquisitions, investments or other strategic transactions;
- •
- return to shareholders through share repurchase, dividend or other means;
- •
- paydown of debt; or
- •
- other appropriate uses.
Any such use is dependent upon a variety of factors and there can be no assurance that any one or more of these uses will occur.
Sources and Uses of Liquidity of Our Subsidiaries
Insurance and HMO subsidiaries. We require cash at our insurance and HMO subsidiaries to meet our policy-related obligations and to pay operating expenses, including the cost of administration of the policies, and to maintain adequate capital levels. The primary sources of liquidity are premiums received from CMS and policyholders and investment income generated by our invested assets.
The National Association of Insurance Commissioners, known as the NAIC, imposes regulatory risk-based capital, known as RBC, requirements on insurance companies. The level of RBC is calculated and reported annually. A number of remedial actions could be enforced if a company's total adjusted capital is less than 200% of authorized control level RBC. However, we generally consider
88
target surplus to be 350% of authorized control level RBC. At December 31, 2014, all but one of our insurance subsidiaries had total adjusted capital in excess of our target of 350% of authorized control level RBC. One insurance company fell below our target surplus with a 240% ratio, but still has total adjusted capital in excess of the NAIC's 200%. Excess capital can be used by the insurance and HMO subsidiaries to make dividend payments to their respective holding companies, subject to certain restrictions, and from there to our parent company.
At December 31, 2014, we held cash and invested assets of approximately $871 million at our insurance and HMO subsidiaries that could readily be converted to cash. We believe that this level of liquidity is sufficient to meet our obligations and pay expenses.
In 2014, we made an initial capital contribution of $1.6 million to a new HMO licensed subsidiary and a $15.5 million capital contribution to one of our Insurance subsidiaries, which was funded in February 2015. Based on statutory capital and surplus levels at December 31, 2014, the aggregate amount of dividends that may be paid to our parent company during 2015 without prior approval by state regulatory authorities was approximately $27 million. During 2014, our insurance and HMO subsidiaries paid $53.1 million to their holding companies.
Medicare Advantage Management Service Organizations. The primary sources of liquidity for these subsidiaries are fees collected from affiliates for performing administrative, marketing and management services for our Medicare Advantage business. The primary uses of liquidity are the payments for salaries and expenses associated with providing these services. We believe the sources of cash for these subsidiaries will exceed scheduled uses of cash and result in amounts available to dividend to our parent company.
Total Care. We require cash at Total Care to pay claims and other benefits for our members, to pay operating expenses, to maintain adequate capital levels. The primary sources of liquidity are premiums received from the New York Department of Health and members. Total Care is required to maintain a contingent reserve equal to a percentage of premium that grades from 7.25% for 2013, ultimately to 12.5%. At December 31, 2014, Total Care had net worth in excess of the contingent reserve requirements.
APS Healthcare. The primary sources of liquidity for APS Healthcare are fees from its customers, including health plans, state agencies and related organizations for performing a range of healthcare services. The primary uses of liquidity are the payments for salaries and expenses associated with providing these services. We believe the sources of cash for APS Healthcare will not cover scheduled uses of cash and therefore APS Healthcare will continue to need to borrow funds from our parent company, to the extent such funding continues to be made available.
Investments. We invest primarily in fixed maturity securities of the U.S. Government and its agencies, U.S. state and local governments, mortgage-backed securities and corporate fixed maturity securities with investment grade ratings of BBB– or higher by S&P or Baa3 or higher by Moody's Investor Service. As of December 31, 2014, approximately 99% of our fixed income investment portfolio had investment grade ratings from S&P or Moody's.
At December 31, 2014, cash and cash equivalents represent approximately 13% of our total cash and invested assets. Approximately 25% of cash and invested assets were held in securities backed by the U.S. government or its agencies and the average credit quality of our total investment portfolio was AA–.
The average book yield of our total investment portfolio was 3.0% at December 31, 2014 and 3.3% at December 31, 2013. The decrease in our average book yield is principally driven by the greater percentage of our assets being held in lower yielding cash and cash equivalents as of December 31, 2014 versus the prior year end.
89
2012 Credit Facility. In connection with the acquisition of APS Healthcare, on March 2, 2012, we entered into a new credit facility (the "2012 Credit Facility") consisting of a five-year $150 million senior secured term loan and a $75 million senior secured revolving credit facility.
The 2012 Credit Facility contains customary representations and warranties as well as customary affirmative and negative covenants. Negative covenants include, among others, limitations on the incurrence of indebtedness, limitations on the incurrence of liens and limitations on acquisition, dispositions, investments and restricted payments. In addition, the 2012 Credit Facility contains certain financial covenants relating to minimum risk-based capital, consolidated leverage ratio, and consolidated debt service ratio. The 2012 Credit Facility also contains customary events of default. Upon the occurrence and during the continuance of an event of default, the Lenders may declare the outstanding advances and all other obligations under the 2012 Credit Facility immediately due and payable.
On November 4, 2013, we entered into an amendment to our 2012 Credit Facility. The amendment, which was effective beginning with the quarter ended September 30, 2013, suspends certain financial covenants, including the consolidated leverage and debt service ratios, replacing them with total debt to capitalization and minimum liquidity ratios. As of December 31, 2014, and throughout the entire amendment period, we were in compliance with all financial covenants, as amended. These new financial covenants terminated December 31, 2014 and effective January 1, 2015 the original financial covenants were reinstated.
In connection with the amendment, we had prepaid all scheduled 2013 and 2014 principal payments, including the final 2013 payment due December 31, 2013 of $3.6 million and all 2014 scheduled payments totaling $14.3 million. We also paid fees and expenses of approximately $0.5 million in 2013.
As a result of the recent subsidiary sale activity, under the 2012 Credit Facility, we have 12 months from receipt of the proceeds to either reinvest those proceeds or make a principal prepayment. If the proceeds are not reinvested, we would need to make prepayments totaling approximately $38 million by February 2016. We have elected to prepay $55 million on March 31, 2015, which will fulfill this obligation and provide additional restricted payment flexibility under the 2012 Credit Facility. We are required to ratably apply this prepayment and any other future prepayments through the remaining scheduled repayments which would change the amount of the quarterly and bullet payments through 2017.
Our obligations under the Credit Agreement are secured by a first priority security interest in 100% of the capital stock of our material subsidiaries and are also guaranteed by certain of our subsidiaries.
The 2012 Credit Facility bears interest at rates equal to, at our election, LIBOR or the base rate, plus an applicable margin that varies based on our consolidated leverage ratio from 1.75% to 2.50%, in the case of LIBOR loans, and from 0.75% to 1.50% in the case of base rate loans. Effective December 31, 2014, the interest rate on the term loan portion of the 2012 Credit Facility was 2.76% based on a spread of 2.50% above LIBOR.
We are required to pay a commitment fee on unused availability under the Revolving Facility that varies based on our consolidated leverage ratio, from 0.40% to 0.50% per year. As of the date of this report, we had not drawn on the Revolving Facility.
Critical Accounting Policies
Our consolidated financial statements have been prepared in accordance with U.S. Generally Accepted Accounting Principles, known as GAAP. The preparation of our financial statements in conformity with GAAP requires us to make estimates and assumptions that affect the amounts of
90
reported by us in our consolidated financial statements and the accompanying notes. Critical accounting policies are ones that require significant subjective or complex judgments, often as a result of the need to make estimates about the effect of matters that are inherently uncertain. These estimates are based on information available at the time the estimates are made, as well as anticipated future events. Actual results could differ materially from these estimates. We periodically evaluate our estimates, and as additional information becomes available or actual amounts become determinable, we may revise the recorded estimates and reflect them in operating results. We believe that the following accounting policies are critical, as they involve the most significant judgments and estimates used in the preparation of our consolidated financial statements:
- •
- policy-related liabilities and benefit expense recognition;
- •
- deferred policy acquisition costs;
- •
- goodwill and other intangible assets;
- •
- investment valuation;
- •
- recognition of premium revenues and policy benefits—Medicare products; and
- •
- income taxes.
Policy-related liabilities and benefit expense recognition
We calculate and maintain reserves for the estimated future payment of claims to our policyholders using actuarial assumptions that are consistent with actuarial assumptions we use in the pricing of our products. For our accident and health insurance business, we establish an active life reserve for expected future policy benefits, plus a liability for due and unpaid claims and incurred but not reported claims, known as IBNR. Benefit expenses are recognized in the period in which services are provided or claims are incurred and include an estimate of the cost of services and IBNR claims. Our net income depends upon the extent to which our actual claims experience is consistent with the assumptions we used in setting our reserves and pricing our policies. If our assumptions with respect to future claims are incorrect, and our reserves are insufficient to cover our actual losses and expenses, we would be required to increase our liabilities, resulting in reduced net income and stockholders' equity.
The following table presents a summary of our policy-related liabilities by category at December 31 (dollars in thousands):
| | Direct & Assumed | Net of Reserves Ceded to Reinsurers | |||||||||||||||||
|---|---|---|---|---|---|---|---|---|---|---|---|---|---|---|---|---|---|---|---|
| | | % of Total Policy Liabilities | | % of Total Policy Liabilities | |||||||||||||||
Liability Type | 2014 | 2013 | 2014 | 2013 | |||||||||||||||
Reserves and other policy liabilities—life | $ | 514,440 | 46 | % | $ | 532,077 | 46 | % | $ | 26,520 | $ | 23,325 | |||||||
Reserves for future policy benefits—health | 453,784 | 41 | % | 462,832 | 40 | % | 325,426 | 329,255 | |||||||||||
Policy and contract claims—health | 147,561 | 13 | % | 166,545 | 14 | % | 141,058 | 160,851 | |||||||||||
| | | | | | | | | | | | | | | | | | | | |
Total policy liabilities | $ | 1,115,785 | 100 | % | $ | 1,161,454 | 100 | % | $ | 493,004 | $ | 513,431 | |||||||
| | | | | | | | | | | | | | | | | | | | |
| | | | | | | | | | | | | | | | | | | | |
| | | | | | | | | | | | | | | | | | | | |
Reserves and other policy liabilities—life
Reserves and other policy liabilities—life represents the gross amount of liabilities on our life insurance business, including policyholder account balances on our investment and universal life-type policies, future policy benefit reserves on our traditional life insurance policies and policy and contract
91
claims on our life policies. We reinsure substantially all of our in force life insurance and annuity business under a 100% coinsurance treaty. A portion of our traditional business was not included in that reinsurance transaction, however much of that business is partially reinsured under separate treaties.
Policyholder account balances represent the balance that accrues to the benefit of the policyholder, otherwise known as the account value, as of the financial statement date. Account values increase to reflect additional deposits received and interest credited based on the account value. Account values decline to reflect surrenders and other withdrawals, including withdrawals relating to the cost of insurance and expense charges. We review the interest crediting rates periodically and adjust them with minimum levels below which the crediting rate cannot fall as we deem necessary. The liability for future policy benefits represents the present value of estimated future benefits to be paid to or on behalf of policyholders, less the future value of net premiums. We calculate this amount based on actuarially recognized methods using morbidity and mortality tables, which we modify to reflect our actual experience when appropriate. The liability for unpaid claims, which also reflects IBNR, reflects estimates of amounts to fully settle known reported claims as well as claims related to insured events that we estimate have been incurred, but have not yet been reported to us.
Our net retained reserves for life insurance products were $26.5 million, or 5% of our direct and assumed reserves for life insurance products, as of December 31, 2014. Our net retained reserves for life insurance products were $23.3 million, or 4% of our direct and assumed reserves for life insurance products, as of December 31, 2013.
Reserves for future policy benefits—health
Reserves for future policy benefits—health represents the present value of estimated future benefits to be paid to or on behalf of policyholders, less the future value of net premiums. We calculate this amount based on actuarially recognized methods using morbidity and mortality tables.
For our fixed benefit accident and sickness and our long-term care products, we establish a reserve for future policy benefits at the time we issue each policy based on the present value of future benefit payments less the present value of future premiums. We have ceased issuing new long-term care policies, although our current policies are renewable annually at the discretion of the policyholder, as evidenced by the policyholder continuing to make premium payments. At policy issuance, these reserves are recognized on a net level premium method based on interest rates, mortality, morbidity, and maintenance expense assumptions. Interest rates are based on our expected net investment returns on the investment portfolio supporting the reserves for these blocks of business. Mortality, a measure of expected death, and morbidity, a measure of health status, assumptions are based on published actuarial tables, modified based upon actual experience. The assumptions used to determine the liability for future policy benefits are established and locked in at the time each contract is issued and only change if our expected future experience deteriorates to the point that the level of the liability, together with the present value of future gross premiums, are not adequate to provide for future expected policy benefits and maintenance costs (i.e. the loss recognition date). Because these policies have long-term claim payout periods, there is a greater risk of significant variability in claims costs, either positive or negative. We perform loss recognition tests at least annually in the fourth quarter, and more frequently if adverse events or changes in circumstances indicate that the level of the liability, together with the present value of future gross premiums, may not be adequate to provide for future expected policy benefits and maintenance costs.
A portion of our reserves for long-term care products also reflect our estimates relating to members currently receiving benefits. We estimate these reserves primarily using recovery and mortality rates, as described above.
92
Policy and contract claims—health
The policy and contract claims liability for our health policies include a liability for unpaid claims, including claims in the course of settlement, as well as a liability for IBNR claims. Our liability for policy and contract claims—health by major product grouping is as follows:
| | Carrying Value at December 31, | ||||||||||||||||||
|---|---|---|---|---|---|---|---|---|---|---|---|---|---|---|---|---|---|---|---|
| | Direct and Assumed | Net of Reserves Ceded to Reinsurers | |||||||||||||||||
Policy and contract claims—health | 2014 | % of Total Policy Liabilities | 2013 | % of Total Policy Liabilities | 2014 | 2013 | |||||||||||||
| | ($ in thousands) | ||||||||||||||||||
Medicare Advantage—HMO | $ | 47,072 | 4 | % | $ | 47,152 | 4 | % | $ | 47,039 | $ | 47,149 | |||||||
Medicare Advantage—PFFS | 47,524 | 5 | % | 73,117 | 6 | % | 47,524 | 73,117 | |||||||||||
Medicaid—Total Care | 13,583 | 1 | % | 9,550 | 1 | % | 13,583 | 9,550 | |||||||||||
Traditional—Medicare supplement | 14,323 | 1 | % | 14,506 | 1 | % | 10,900 | 11,429 | |||||||||||
Traditional—Specialty health | 13,690 | 1 | % | 13,301 | 1 | % | 11,003 | 10,687 | |||||||||||
APS Healthcare | 11,369 | 1 | % | 8,919 | 1 | % | 11,009 | 8,919 | |||||||||||
| | | | | | | | | | | | | | | | | | | | |
Total policy and contract claims—health | $ | 147,561 | 13 | % | $ | 166,545 | 14 | % | $ | 141,058 | $ | 160,851 | |||||||
| | | | | | | | | | | | | | | | | | | | |
| | | | | | | | | | | | | | | | | | | | |
| | | | | | | | | | | | | | | | | | | | |
The following factors can affect these reserves and liabilities:
- •
- economic and social conditions;
- •
- inflation;
- •
- hospital and pharmaceutical costs;
- •
- changes in doctrines of legal liability;
- •
- premium rate increases;
- •
- extra-contractual damage awards; and
- •
- other factors affecting healthcare and insurance generally.
Therefore, we establish the reserves and liabilities based on extensive estimates, assumptions and prior years' statistics. When we acquire other insurance companies or blocks of insurance, our assessment of the adequacy of acquired policy liabilities is subject to similar estimates and assumptions. Establishing reserves involves inherent uncertainties, and it is possible that actual claims could materially exceed our reserves and have a material adverse effect on our results of operations and financial condition.
We develop our estimate for IBNR using actuarial methodologies and assumptions, primarily based upon historical claim payment and claim receipt patterns, as well as historical medical cost trends. Depending on the period for which we are estimating incurred claims, we apply a different method in determining our estimate. For aged service months (more than two or three months prior to the valuation date, depending on type of business), the key assumption we use in estimating our IBNR is that the completion factor pattern, adjusted for known changes in claim inventory levels and claim payment processes, remains consistent over a specified rolling period. This period, ranging from three to twelve months, is dependent on the type of business with respect to which we are estimating reserves or liabilities. Completion factors result from the calculation of the percentage of claims incurred during a given period that have historically been adjudicated as of the reporting period. For recent service months (either two or three months, depending on type of business), we estimate the incurred claims
93
primarily from a trend analysis based upon per member per month, known as PMPM, claims trends developed from our historical experience in the preceding months, adjusted for known changes in estimates of recent hospital and drug utilization data, provider contracting changes, changes in benefit levels, product mix, and seasonality.
We use the completion factor method for aged service months because the historical percentage of claims processed for those months is at a level sufficient to produce a consistently reliable result. Conversely, for the most recent service months of incurred claims, the volume of claims processed historically is not at a level sufficient to produce a reliable result, which therefore requires that we examine historical trend patterns as the primary method of evaluation. Because cumulative claims payment development often fluctuates widely close to the incurred date of claims, estimates for the most recent service months of incurred claims are based on emerging claims trend experience. The amounts above reflect the estimated potential medical and other expenses payable based upon assumptions used in determining the loss ratio for the pricing of our products.
Medical cost trends potentially are more volatile than other segments of the economy. The principal intrinsic drivers of medical cost trends are:
- •
- changes in the utilization of hospital facilities, physician services, prescription drugs, and new medical technologies, and
- •
- the inflationary effect on the cost per unit of each of these expense components.
Other external factors may impact medical cost trends, such as:
- •
- government-mandated benefits;
- •
- other regulatory changes;
- •
- an aging population;
- •
- natural disasters and other catastrophes; and
- •
- epidemics.
Factors internal to our company may also affect our ability to accurately predict estimates of historical completion factors or medical cost trends, such as:
- •
- claims processing cycle times;
- •
- changes in medical management practices; and
- •
- changes in provider contracts.
We consider all of these factors in estimating IBNR and in estimating the PMPM claims trend for purposes of determining the reserve for the most recent three months. Additionally, we continually prepare and review follow-up studies to assess the reasonableness of the estimates generated by our process and methods over time. We also consider the results of these studies in determining the reserve for the most recent three months. Each of these factors requires significant judgment by management.
94
Activity in the liability for policy and contract claims health is as follows:
| | For the years ended December 31, | ||||||
|---|---|---|---|---|---|---|---|
| | 2014 | 2013 | |||||
| | (in thousands) | ||||||
Balance at beginning of year | $ | 166,545 | $ | 156,558 | |||
Less reinsurance recoverable | (5,694 | ) | (4,811 | ) | |||
| | | | | | | | |
Net balance at beginning of year | 160,851 | 151,747 | |||||
| | | | | | | | |
Balances sold | (3,468 | ) | — | ||||
Incurred related to: | |||||||
Current year | 1,613,998 | 1,641,171 | |||||
Prior year development | (3,754 | ) | 5,926 | ||||
| | | | | | | | |
Total incurred | 1,610,244 | 1,647,097 | |||||
| | | | | | | | |
Paid related to: | |||||||
Current year | 1,487,386 | 1,480,332 | |||||
Prior year | 139,183 | 157,661 | |||||
| | | | | | | | |
Total paid | 1,626,569 | 1,637,993 | |||||
| | | | | | | | |
Net balance at end of year | 141,058 | 160,851 | |||||
Plus reinsurance recoverable | 6,503 | 5,694 | |||||
| | | | | | | | |
Balance at end of year | $ | 147,561 | $ | 166,545 | |||
| | | | | | | | |
| | | | | | | | |
| | | | | | | | |
The liability for policy and contract claims—health decreased from $166.5 million to $146.9 million during the year ended December 31, 2014. The decrease in the liability was primarily attributable to the decrease in IBNR for our Medicare Advantage business due to lower membership levels, including the effect of the sale of TOOK and SCOK.
The prior year development incurred in the table above represents (favorable) or unfavorable adjustments as a result of prior year claim estimates being settled or currently expected to be settled, for amounts that are different than originally anticipated. This prior year development occurs due to differences between the actual medical utilization and other components of medical cost trends, and actual claim processing and payment patterns compared to the assumptions for claims trend and completion factors used to estimate our claim liabilities.
The claim reserve balances at December 31, 2013 settled during 2014 for $3.8 million less than originally estimated. This prior year development represents 0.2% of the incurred claims recorded in 2013.
The claim reserve balances at December 31, 2012 settled during 2013 for $5.9 million more than originally estimated. This prior year development represents less than 0.4% of the incurred claims recorded in 2012.
Sensitivity Analysis
The following table illustrates the sensitivity of our health IBNR payable at December 31, 2014 to identified reasonably possible changes to the estimated weighted average completion factors and healthcare cost trend rates. However, it is possible that the actual completion factors and healthcare
95
cost trend rates will develop differently from our historical patterns and therefore could be outside of the ranges illustrated below.
| Completion Factor(1): | Claims Trend Factor(2): | ||||||||||
|---|---|---|---|---|---|---|---|---|---|---|---|
(Decrease) Increase in Factor | Increase (Decrease) in Net Health IBNR | (Decrease) Increase in Factor | (Decrease) Increase in Net Health IBNR | ||||||||
| ($ in thousands) | |||||||||||
| –3 | % | $ | 380 | –3 | % | $ | (5,121 | ) | |||
| –2 | % | 253 | –2 | % | (3,414 | ) | |||||
| –1 | % | 126 | –1 | % | (1,707 | ) | |||||
| 1 | % | (128 | ) | 1 | % | 1,705 | |||||
| 2 | % | (254 | ) | 2 | % | 3,411 | |||||
| 3 | % | (381 | ) | 3 | % | 5,116 | |||||
- (1)
- Reflects estimated potential changes in medical and other expenses payable, caused by changes in completion factors for incurred months prior to the most recent three months.
- (2)
- Reflects estimated potential changes in medical and other expenses payable, caused by changes in annualized claims trend used for the estimation of per member per month incurred claims for the most recent three months.
Deferred Policy Acquisition Costs
In accordance with ASU 2010-26, we defer costs of acquiring new business that are directly related to the successful acquisition or renewal of insurance contracts including the following:
- •
- incremental direct costs of a successful contract acquisition, such as non-level commissions; and
- •
- portions of employee salaries and benefits directly related to time spent performing specified acquisition activities for a contract that has been acquired;
- •
- other costs directly related to the specified acquisition activities that would not have been incurred had that contract acquisition transaction not occurred; and
- •
- advertising costs meeting the capitalization criteria for direct- response advertising.
The determination of deferability must be made on a contract-level basis. We refer to these costs as deferred acquisition costs or DAC.
For our net retained traditional life and health products, we amortize DAC in proportion to premium revenue using the same assumptions used in estimating the liabilities for future policy benefits in accordance with ASC 944,Financial Services—Insurance. Under ASC 944, any unamortized DAC relating to lapsed policies must be amortized as of the date of the lapse.
We test for the recoverability of DAC at least annually. To the extent that we determine that the present value of future policy premiums and investment income or the net present value of expected gross profits would not be adequate to recover the unamortized costs, we would write off the excess deferred policy acquisition costs. Based on our annual tests, we determined that DAC was recoverable in 2014 and 2013.
Goodwill and other intangible assets
Goodwill. Goodwill represents the amount of the purchase price in excess of the fair values assigned to the underlying identifiable net assets of acquired businesses. Goodwill is not amortized, but
96
is subject to an annual impairment test. ASC 350,Goodwill and Other Intangible Assets, requires that goodwill balances be reviewed for impairment at the reporting unit level at least annually or more frequently if events occur or circumstances change that would indicate that a triggering event, as defined in ASC 350, has occurred. A reporting unit is defined as an operating segment or one level below an operating segment. Our reporting units are equivalent to our operating segments. We have goodwill assigned to our Medicare Advantage reporting unit. The goodwill related to the acquisition of APS Healthcare was included in our Corporate & Other segment prior to being written off in 2013.
We test goodwill for impairment annually, as of October 1 of the current year, or more frequently if circumstances suggest that impairment may exist. During each quarter, we perform a review of certain key components of our valuation of our reporting units, including the operating performance of the reporting units compared to plan (which is the primary basis for the prospective financial information included in our annual goodwill impairment test), our weighted average cost of capital and our stock price and market capitalization.
We estimate the fair values of our reporting units using discounted cash flows or other indications of fair value, which include assumptions about a wide variety of internal and external factors. Significant assumptions used in the impairment analysis include financial projections of cash flow (including significant assumptions about operations and target capital requirements), long term growth rates for determining terminal value, and discount rates. Forecasts and long term growth rates used for our reporting units are consistent with, and use inputs from, our internal long term business plan and strategy. During our forecasting process, we assess revenue trends, medical cost trends, operating cost levels and target capital levels. Significant factors affecting these trends include changes in membership, premium yield, medical cost trends, contract renewal expectations and the impact and expectations of regulatory environments.
Although we believe that the financial projections used are reasonable and appropriate, the use of different assumptions and estimates could materially impact the analysis and resulting conclusions. In addition, due to the long term nature of the forecasts there is significant uncertainty inherent in those projections. That uncertainty is increased by the impact of healthcare reforms as discussed in Item 1, "Business—Regulation." For additional discussions regarding how the enactment or implementation of healthcare reforms and how other factors could affect our business and the related long term forecasts, see Item 1A, "Risk Factors" in Part I of this Annual Report on Form 10-K.
We use a range of discount rates that correspond to a market based weighted average cost of capital. Discount rates are determined for each reporting unit based on the implied risk inherent in their forecasts. This risk is evaluated using comparisons to market information such as peer company weighted average costs of capital and peer company stock prices in the form of revenue and earnings multiples. The most significant estimates in the discount rate determinations include the risk free rates and equity risk premium. Company specific adjustments to discount rates are subjective and thus are difficult to measure with certainty.
The passage of time and the availability of additional information regarding areas of uncertainty in regards to the reporting units' operations could cause these assumptions used in our analysis to change materially in the future. If our assumptions differ from actual, the estimates underlying our goodwill impairment tests could be adversely affected.
Future events that could have a negative impact on the levels of excess fair value over carrying value of our reporting units include, but are not limited to:
- •
- decreases in business growth;
- •
- the loss of significant contracts;
- •
- decreases in earnings projections;
97
- •
- increases in the weighted average cost of capital; and
- •
- increases in the amount of required capital for a reporting unit.
Negative changes in one or more of these factors, among others, could result in additional impairment charges.
To determine whether goodwill is impaired, we perform a multi-step impairment test. We perform a qualitative assessment of each reporting unit to determine whether facts and circumstances support a determination that their fair values are greater than their carrying values. If the qualitative analysis is not conclusive, or if we elect to proceed directly with quantitative testing, we will measure the fair values of the reporting units and compare them to their carrying values, including goodwill. If the fair value is less than the carrying value of the reporting unit, the second step of the impairment test is performed for the purposes of measuring the impairment. In this step, the fair value of the reporting unit is allocated to all of the assets and liabilities of the reporting unit to determine an implied goodwill value. This allocation is similar to a purchase price allocation performed in purchase accounting. If the carrying amount of the reporting unit goodwill exceeds the implied goodwill value, an impairment loss shall be recognized in an amount equal to that excess.
Changes in the carrying amounts of goodwill and intangible assets with indefinite lives (primarily trademarks and licenses) are shown below:
| | | | | Corporate & Other(2) | |||||||||||||||
|---|---|---|---|---|---|---|---|---|---|---|---|---|---|---|---|---|---|---|---|
| | Total, Net | Medicare Advantage(1) | Medicaid(1) | Gross | Accumulated write-offs | Net | |||||||||||||
| | (in thousands) | ||||||||||||||||||
Balance, January 1, 2013 | $ | 242,942 | $ | 77,459 | $ | — | 165,483 | $ | — | $ | 165,483 | ||||||||
Acquisitions(3) | 67 | — | 67 | — | — | — | |||||||||||||
Impairments(4) | (164,757 | ) | — | — | — | (164,757 | ) | (164,757 | ) | ||||||||||
Adjustments | (726 | ) | — | — | (726 | ) | — | (726 | ) | ||||||||||
| | | | | | | | | | | | | | | | | | | | |
Balance, December 31, 2013 | 77,526 | 77,459 | 67 | 164,757 | (164,757 | ) | — | ||||||||||||
Dispositions(5) | (4,198 | ) | (4,198 | ) | — | — | — | — | |||||||||||
Adjustments(6) | (67 | ) | — | (67 | ) | — | — | — | |||||||||||
| | | | | | | | | | | | | | | | | | | | |
Balance, December 31, 2014 | $ | 73,261 | $ | 73,261 | $ | — | $ | 164,757 | $ | (164,757 | ) | $ | — | ||||||
| | | | | | | | | | | | | | | | | | | | |
| | | | | | | | | | | | | | | | | | | | |
| | | | | | | | | | | | | | | | | | | | |
- (1)
- Represents both gross and net goodwill balances.
- (2)
- The goodwill in our Corporate & Other segment is associated with our APS Healthcare reporting units.
- (3)
- Represents goodwill recorded in connection with our December 1, 2014 acquisition of the assets of Total Care. See Note 5—Business Combinations.
- (4)
- Represents goodwill impairment charge related to APS Healthcare. See further discussion below.
- (5)
- Represents goodwill disposed of in connection with the sale of TOOK and SCOK of $3.8 million and $0.4 million, respectively. See Note 5—Business Combinations.
- (6)
- Represents a Total Care acquisition accounting adjustment to increase our estimated fair value of the provider networks with a corresponding adjustment to eliminate goodwill.
During the quarter ended December 31, 2014, we performed our annual assessment of goodwill based on information as of October 1, 2014. We determined based on our "Step 1" impairment test that our estimated fair value of our Medicare Advantage reporting unit was in excess of its carrying value by 70%. We do not have goodwill assigned to any other reporting units.
98
During the quarter ended June 30, 2013, certain events occurred and circumstances changed which indicated that it was more likely than not that goodwill for APS Healthcare was impaired, including the following:
- •
- APS Healthcare failed to win certain new contracts that had previously been anticipated;
- •
- APS Healthcare's Puerto Rico contract to provide managed behavioral health services under the Mi Salud program (the "APS Puerto Rico Contract"), which represented a significant portion of APS Healthcare's historical revenue was renewed, but at a lower rate than had previously been anticipated;
- •
- Certain of APS Healthcare's existing contracts were terminated, not renewed or we learned that they were likely to terminate in the next several months; and
- •
- Due to the general increase in interest rates during the second quarter, the discount rate used in the impairment analysis was increased by 50 basis points compared to the rate used in the prior impairment testing analysis.
Based on the foregoing, we performed an interim impairment review as of June 30, 2013, that included lowered expectations for future revenue growth and new business development and a higher discount rate. Based on the results of the step one impairment test, we determined that as of June 30, 2013 the carrying value of APS Healthcare exceeded its fair value. We then proceeded to the second step of the impairment test to estimate the implied fair value of the APS Healthcare goodwill. This implied fair value of goodwill is determined in the same manner as the amount of goodwill recognized in a business combination, that is, the estimated fair value of the reporting unit is allocated to all of the assets and liabilities of that unit (including any unrecognized intangible assets) as if the reporting unit had been acquired in a business combination and the estimated fair value was the purchase price paid. Based on the June 30, 2013 step two analysis, the carrying amount of the APS Healthcare goodwill exceeded its implied fair value, resulting in a pre-tax impairment charge of $91.7 million, which we allocated on a pro rata basis between taxable and non-taxable goodwill.
Additionally, during the fourth quarter of 2013, certain events occurred and circumstances changed which indicated that it was more likely than not that goodwill for APS Healthcare was further impaired, including the following:
- •
- We learned that the APS Puerto Rico Contract, which represents a significant portion of APS Healthcare's historical revenue, would terminate effective June 30, 2014 as a result of a new request for proposal, or RFP, being issued that would integrate behavioral health services and physical health services into one managed care contract. Additionally, the Commonwealth of Puerto Rico continues to experience deterioration in its economic environment and certain of the major rating agencies cut Puerto Rico's credit rating to junk status. In addition, we began to experience an increase in the cost of care of our Puerto Rico managed behavioral health business, which reduced the profitability of that business. We evaluated opportunities to participate in the new RFP but there could be no assurance that we would be successful, which, if we were not successful would end our participation in the Mi Salud program.
- •
- We learned that APS Healthcare was not going to be awarded a previously anticipated contract.
- •
- We learned that the anticipated membership to be serviced in another contract was significantly reduced; thereby lowering the future expected cash flows of that contract.
- •
- Substantially all of the services APS Healthcare had provided to Universal American's affiliates were discontinued. The affiliates replaced those services with their own direct staff.
We incorporated the impact of the above items into our projections for APS Healthcare for our annual assessment of goodwill as of October 1, 2014, that included lowered expectations for future
99
revenue growth and new business development. Based on the results of the step one impairment test, we determined that as of October 1, 2013 the carrying value of APS Healthcare exceeded its fair value. We then proceeded to the second step of the impairment test to estimate the implied fair value of the APS Healthcare goodwill. Based on the October 1, 2013 step two analysis, the carrying amount of the APS Healthcare goodwill exceeded its implied fair value, resulting in a pre-tax impairment charge of $73.0 million, representing the remaining goodwill for APS Healthcare. A portion of the goodwill was taxable, resulting in a tax benefit of approximately $0.9 million. Separately, we determined that the identified amortizing intangibles and other fixed assets were not fully recoverable and recorded additional impairments of $16.1 million and $8.5 million, respectively.
Valuation of acquired intangible assets. Business combinations accounted for as a purchase result in the allocation of the purchase consideration to the fair values of the assets and liabilities acquired, including the present value of future profits, establishing these fair values as the new accounting basis. We base the present value of future profits on an estimate of the cash flows of the insurance policies acquired, discounted to reflect the present value of those cash flows. The discount rate we select depends upon the general market conditions at the time of the acquisition and the inherent risk in the transaction. We allocate purchase consideration in excess of the fair value of net assets acquired, including the present value of future profits and other identified intangibles, for a specific acquisition, to goodwill. We perform the allocation of purchase price in the period in which we consummate the purchase.
Amortizing intangible assets. We must estimate and make assumptions regarding the useful life we assign to our amortizing intangible assets. Set forth below are our annual amortization policies for each of the main categories of amortizing intangible assets:
Description | Weighted Average Life (Years) | Amortization Basis | ||
|---|---|---|---|---|
Insurance policies acquired | 9 | The pattern of projected future cash flows for the policies acquired over the estimated weighted average life of the policies acquired | ||
Provider contracts | 4 - 10 | Straight line over the estimated weighted average life of the contracts | ||
Customers/membership acquired | 4 - 8 | Straight line over the estimated weighted average life of membership | ||
Software platform | 4 | Straight line over the estimated life of the software | ||
Trademarks/tradenames | 4.5 | Straight line over the estimated weighted average life of the trademarks/tradenames |
In accordance with ASC 350,Intangibles and Other, we periodically review amortizing intangible assets whenever adverse events or changes in circumstances indicate the carrying value of the asset may not be recoverable. In assessing recoverability, we must make assumptions regarding estimated future cash flows and other factors to determine if an impairment loss may exist, and, if so, estimate fair value. If these estimates or their related assumptions change in the future, we may be required to record impairment losses for these assets.
During our review of recoverability of amortizing intangible assets in the fourth quarter of 2013, we determined that undiscounted cash flows from our APS Healthcare reporting unit were less than the carrying value of our related APS Healthcare amortizing intangible assets, indicating that they were no longer fully recoverable and recorded an impairment charge. There were no other impairments of our amortizing intangible assets during 2014 or 2013. See additional discussion at Note 8—Goodwill and Other Intangible Assets in the Notes to Consolidated Financial Statements.
100
Investment Valuation
We have engaged an investment advisor to manage a portion of our portfolio, perform investment accounting and provide valuation services. Securities prices are obtained by the advisor from independent pricing vendors, which are chosen based on their ability to support and price specified asset classes following the procedures outlined in the valuation policy reviewed and approved by us. The following are examples of typical inputs used by third party pricing vendors:
- •
- reported trades;
- •
- benchmark yields;
- •
- issuer spreads;
- •
- bids;
- •
- offers; and
- •
- estimated cash flows and prepayment speeds.
Based on the typical trading volumes and the lack of quoted market prices for fixed maturities, third party pricing services will normally derive the security prices through recent reported trades for identical or similar securities making adjustments through the reporting date based upon available market observable information as outlined above. If there are no recent reported trades, the third party pricing services may use matrix or model processes to develop a security price where the pricing services develop future cash flow expectations based upon collateral performance, discounted at an estimated market rate. The pricing for mortgage-backed and asset-backed securities reflects estimates of the rate of future prepayments of principal over the remaining life of the securities. The pricing services derive these estimates based on the characteristics of the underlying structure and prepayment speeds previously experienced at the interest rate levels projected for the underlying collateral.
The investment advisor uses their own rules-based pricing system to evaluate the prices it receives from various pricing vendors to ensure the data adheres to certain vendor-to-vendor and day-to-day variance tolerances. Exceptions to the rules are monitored, investigated and challenged, as needed. We review and test the security pricing procedures used to value our fixed maturity portfolio on an ongoing basis. Our procedures include review of the investment valuation policy and understanding of the procedures used to obtain investment valuations and review of pricing controls at our investment advisor, including their Statements on Standards for Attestation Engagements 16 controls review report. We also test the prices provided by the advisor monthly by comparing the data to another independent pricing source and monitoring the change in prices from month to month and upon sale of the security. Significant changes or variances are investigated and explained. During the year ended December 31, 2014, we did not modify any price provided by the advisor.
We have also reviewed the advisor's pricing services' valuation methodologies and related sources, and have evaluated the various types of securities in our investment portfolio to determine an appropriate fair value hierarchy level based upon trading activity and the observability of market inputs. Based on the results of this evaluation and investment class analysis, we classified each price into Level 1, 2, or 3. We classified most prices provided by third party pricing services into Level 2 because the inputs used in pricing the securities are market observable.
Due to a general lack of transparency in the process that brokers use to develop prices, we classify most securities that have prices that are based on broker's prices as Level 3. We also classify internal model priced securities, primarily consisting of private placement asset-backed securities, as Level 3 because this model pricing reflects significant non-observable inputs.
We regularly evaluate the amortized cost of our investments compared to the fair value of those investments. We generally recognize impairments of securities when we consider a decline in fair value
101
below the amortized cost basis to be other-than-temporary. The evaluation includes the intent and ability to hold the security to recovery, and we consider it on an individual security basis, not on a portfolio basis. We generally recognize impairment losses for mortgage-backed and asset-backed securities when an adverse change in the amount or timing of estimated cash flows occurs, unless the adverse change is solely a result of changes in estimated market interest rates. We also recognized impairment losses when we determine declines in fair values based on quoted prices to be other-than-temporary.
The evaluation of impairment is a quantitative and qualitative process, which is subject to risks and uncertainties and is intended to determine whether we should recognize declines in the fair value of investments in current period earnings. The principal risks and uncertainties are:
- •
- changes in general economic conditions;
- •
- the issuer's financial condition or near term recovery prospects;
- •
- the effects of changes in interest rates or credit spreads; and
- •
- the recovery period.
Our accounting policy, which follows ASC 320-65-1, requires that we assess a decline in the value of a security below its cost or amortized cost basis to determine if the decline is other-than-temporary.
- •
- If we intend to sell a debt security, or it is more likely than not that we will be required to sell the debt security before recovery of its amortized cost basis, we recognize an other-than-temporary-impairment, or OTTI, in earnings equal to the entire difference between the debt security's amortized cost basis and its fair value.
- •
- If we do not intend to sell the debt security and it is not more likely than not that we will be required to sell the debt security before recovery of its amortized cost basis, but the present value of the cash flows expected to be collected is less than the amortized cost basis of the debt security (referred to as the credit loss), an OTTI is considered to have occurred. In this instance, we bifurcate the total OTTI into the amount related to the credit loss, which we recognize in earnings, with the remaining amount of the total OTTI attributed to other factors (referred to as the noncredit portion) recognized as a separate component in other comprehensive income.
After the recognition of an OTTI, we account for the debt security as if it had been purchased on the measurement date of the OTTI, with an amortized cost basis equal to the previous amortized cost basis less the OTTI recognized in earnings.
We have a security monitoring process overseen by our Investment Committee, consisting of investment and accounting professionals who identify securities that, due to specified characteristics, as described below, we subject to an enhanced analysis on a quarterly basis. We review our fixed maturity securities at least quarterly to determine if an other-than-temporary impairment is present based on specified quantitative and qualitative factors. The primary factors that we consider in evaluating whether a decline in value is other- than-temporary are:
- •
- the length of time and the extent to which the fair value has been or is expected to be less than cost or amortized cost;
- •
- the financial condition, credit rating and near-term prospects of the issuer;
- •
- whether the debtor is current on contractually obligated interest and principal payments; and
- •
- our intent and ability to retain the investment for a period of time sufficient to allow for recovery.
102
Each quarter, during this analysis, we assert our intent and ability to retain until recovery those securities we judge to be temporarily impaired. Once identified, we restrict trading on these securities unless subsequent information becomes available which would then alter our intent or ability to hold. The principal criteria are the deterioration in the issuer's creditworthiness, a change in regulatory requirements or a major business combination or major disposition.
Medicare Overview
Medicare is a federal health insurance program that provides Americans age 65 and over, and some disabled persons under the age of 65, certain hospital, medical and prescription drug benefits. The Medicare program consists of four parts, labeled Parts A - D.
Part A—Hospitalization benefits are provided under Part A. These benefits are financed largely through Social Security taxes. Members are not required to pay any premium for Part A benefits. However, they are still required to pay out-of-pocket deductibles and coinsurance.
Part B—Benefits for medically necessary services and supplies including outpatient care, doctor's services, physical or occupational therapists and additional home healthcare are provided under Part B. These benefits are financed through premiums paid to the federal government by those eligible members who choose to enroll in the program. The members are also required to pay out-of-pocket deductibles and coinsurance.
Part C—Under the Medicare Advantage program, private plans provide Medicare-covered healthcare benefits to enrollees and can include prescription drug coverage. Part C benefits are provided through private HMO, PPO and PFFS plans. An individual must have Medicare Part A and Part B in order to join a Medicare Advantage Plan.
Part D—Under Part D, prescription drug benefits may be provided by private Plans to individuals eligible for benefits under Part A and/or enrolled in Part B. These benefits are provided on both a stand-alone basis and also in connection with certain HMO, PPO and PFFS plans.
These programs are administered by CMS. These benefits are provided through HMO, PPO, PFFS and stand-alone Part D Plans in exchange for contractual risk-adjusted payments received from CMS. We contract with CMS under the Medicare program to provide a comprehensive array of health insurance and prescription drug benefits to Medicare eligible persons through our Medicare Advantage plans.
Premiums received pursuant to Medicare contracts with CMS are recorded as revenue in the month in which members are entitled to receive benefits. Premiums collected in advance are deferred. Receivables from CMS and Plan members are recorded net of estimated uncollectible amounts and are reported as due and unpaid premiums in the consolidated balance sheets. We routinely monitor the collectability of specific accounts, the aging of member premium receivables, historical retroactivity trends and prevailing and anticipated economic conditions.
Policy and contract claims include actual claims reported but not paid and estimates of healthcare services and prescription drug claims incurred but not reported. The estimated claims incurred but not reported are based upon current enrollment, historical claim receipt and payment patterns, historical medical cost trends and health service utilization statistics. These estimates and assumptions are derived from and are continually evaluated using per member per month trend analysis, claims trends developed from our historical experience in the preceding month (adjusted for known changes in estimates of recent hospital and drug utilization data), provider contracting changes, benefit level changes, product mix and seasonality. These estimates are based on information available at the time the estimates are made, as well as anticipated future events. Actual results could differ materially from these estimates. We periodically evaluate our estimates, and as additional information becomes
103
available or actual amounts become determinable, we may revise the recorded estimates and reflect them in operating results.
Membership. We analyze the membership for our Medicare HMO, PPO and Network PFFS plans (collectively, the "Plans") in our administrative system and reconcile to the enrollment provided by CMS. There are timing differences between the addition of a member to our administrative system and the approval, or accretion, of the member by CMS. Additionally, the monthly payments from CMS include adjustments to reflect changes in the status of membership as a result of retroactive terminations, additions, whether CMS is secondary to other insurance coverage or other changes. Current period membership, net premium, CMS subsidies and claims expense are adjusted to reflect retroactive changes in membership.
Medicare Risk Adjustment Provisions. CMS uses risk-adjusted rates per member to determine the monthly payments to Medicare Plans. CMS has implemented a risk adjustment model which apportions premiums paid to all health Plans according to health diagnoses. The risk adjustment model uses health status indicators, or risk scores, to improve the accuracy of payment. The CMS risk adjustment model pays more for members with increasing health severity. Under this risk adjustment methodology, diagnosis data from inpatient and ambulatory treatment settings are used by CMS to calculate the risk adjusted premium payment to Medicare Plans. The monthly risk-adjusted premium per member is determined by CMS based on normalized risk scores of each member from the prior year. Annually, CMS provides the updated risk scores to the Plans and revises premium rates prospectively, beginning with the July remittance for current Plan year members. CMS will also calculate the retroactive adjustments to premium related to the revised risk scores for the current year for current Plan year members and for the prior year for prior Plan year members.
Recognition of Premium Revenues and Policy Benefits—Medicare Plans. We receive monthly payments from CMS related to members in our Medicare coordinated care Plans. The recognition of the premium and cost reimbursement components under these Plans is described below:
CMS Direct Premium Subsidy. We receive a monthly premium from CMS based on the Plan year bid we submitted to CMS. The monthly payment is a risk-adjusted amount per member and is based upon the member's risk score status, as determined by CMS. The CMS premium is recognized over the contract period and reported as premium revenue. In addition, under Medicare Secondary Payer, or MSP provisions, the premium will be reduced by CMS if CMS has determined that it is secondary to other insurance coverage. Star rating quality bonus revenues are included in the CMS Direct Premium subsidy which is reported as premium revenue and recognized over the contract period.
Revenue Adjustments. The monthly CMS Direct Premium Subsidy is based upon the members' health status, which is determined by CMS, as more fully described above under "Medicare Risk Adjustment Provisions." All health benefit organizations that contract with CMS must capture, collect, and submit the necessary diagnosis code information to CMS within prescribed deadlines. Accordingly, we collect, capture, and submit the necessary and available diagnosis data to CMS within prescribed deadlines for our Plans. We estimate changes in CMS premiums related to revenue adjustments based upon the diagnosis data submitted to CMS and ultimately accepted by CMS. Risk scores are updated annually by CMS and reconciled to our estimated amounts by us with any adjustments recorded in premium revenue. Although such adjustments have not been considered to be material in the past, future adjustments could be material.
Member Premium. We receive a monthly premium from members based on the Plan year bid we submitted to CMS. The member premium, which is fixed for the entire Plan year, is recognized over the contract period and reported as premium revenue. We establish a reserve for member premium that is past due that reflects our estimate of the collectability of the member premium.
104
Low-Income Premium Subsidy. For qualifying low-income status, or LIS, members of our Plans with Part D benefits, CMS pays us for some or all of the LIS member's monthly premium. The CMS payment is dependent upon a member's income level which is determined by the Social Security Administration. Low-income premium is recognized over the contract period and reported as premium revenue.
Low-Income Cost Sharing Subsidy. For qualifying LIS members of our Plans with Part D benefits, CMS will reimburse the Plans for all or a portion of the LIS member's deductible, coinsurance and co-payment amounts above the out of pocket threshold for low income beneficiaries. Low-income cost sharing subsidies are paid by CMS prospectively as a fixed amount per member per month, and are determined based upon the Plan year bid we submitted to CMS. After the close of the annual Plan year, CMS reconciles actual experience to low-income cost sharing subsidies paid to the Plan and any differences are settled between CMS and the Plan. The low-income subsidy is accounted for as deposit accounting and therefore not recognized in operations.
Coverage Gap Discount Program. We receive advance payments from CMS as subsidies for members of our Plans with Part D coverage who reach the coverage gap. The Medicare Coverage Gap Discount Program, or CGDP, makes manufacturer discounts available to eligible Medicare members receiving applicable, covered Part D drugs, while in the coverage gap. In general, the discount on each applicable covered Part D drug is fifty percent of an amount equal to the negotiated price. Members will continue to receive these discounts and they will grow until the coverage gap is closed in 2020.
CGDP subsidies are paid by CMS as a fixed amount per member per month, and are determined based upon the Plan year bid we submitted to CMS. The subsidies made to Part D sponsors will be taken back equal to the amount of discounts invoiced to manufacturers. Manufacturers must pay the invoiced amounts to Part D sponsors within 15 days of receipt of invoice from CMS to offset the recouped amounts by CMS.
After the close of the annual Plan year, CMS reconciles the discount program subsidy payments to the cost based on the actual manufacturer discounts amounts made available to each Part D plan's enrollees under the Discount Program. The CGDP subsidy is accounted for as deposit accounting and therefore not recognized in operations.
Catastrophic Reinsurance. We receive payments from CMS for catastrophic reinsurance for members of our Plans with Part D benefits.
For the members of our HMO and PPO Plans with Part D benefits, CMS reimburses Plans for 80% of the drug costs after a member reaches his or her out of pocket catastrophic threshold through a catastrophic reinsurance subsidy. Catastrophic reinsurance subsidies are paid by CMS prospectively as a fixed amount per member per month, and are determined based upon the Plan year bid we submitted to CMS. After the close of the annual Plan year, CMS reconciles actual experience compared to catastrophic reinsurance subsidies paid to the Plan and any differences are settled between CMS and the Plan. The catastrophic reinsurance subsidy is accounted for as deposit accounting and therefore not recognized in operations.
For members of our PFFS Plans with Part D benefits, CMS makes prospective monthly catastrophic reinsurance payments to the Plans based on estimated average reinsurance payments to other Medicare Advantage—Prescription Drug (MA-PD) Plans that provide Part D benefits. Based upon the current guidelines from CMS, these Plans are at risk for the variance between their actual expense and the CMS payments. As a result, we do not follow deposit accounting for these payments.
CMS Risk Corridor Provisions for the Part D benefits of our HMO and PPO Plans. Premiums from CMS for members of our HMO and PPO Plans with Part D benefits are subject to risk corridor provisions. The CMS risk corridor calculation compares the target amount of prescription drug costs
105
(limited to costs under the standard coverage as defined by CMS) less rebates in our annual Plan bid (target amount) to actual experience. Variances of more than 5% above the target amount will result in CMS making additional payments to us, and variances of more than 5% below the target amount will require us to refund to CMS a portion of the premiums we received. Risk corridor payments due to or from CMS are estimated throughout the year and are recognized as adjustments to premium revenues and due and unpaid premiums. This estimate requires us to consider factors that may not be certain, including: membership, risk scores, prescription drug events, or PDEs, and rebates. After the close of the annual Plan year, CMS reconciles actual experience to the target amount and any differences are settled between CMS and the Plan.
Stipulated minimum MLRs—Beginning in 2014, the ACA stipulates a minimum medical loss ratio, or MLR, of 85% for Medicare Advantage plans. This MLR takes into account benefit costs, quality initiative expenses, the ACA fee and taxes. Financial and other penalties may result from failing to achieve the minimum MLR ratio. For the year ended December 31, 2014 our Medicare Advantage plans exceeded the minimum MLR, as defined by CMS.
Income Taxes
We use the liability method of accounting for income taxes. Under this method, we recognize deferred tax assets and liabilities for the future tax consequences attributable to differences between the financial statement carrying amounts of existing assets and liabilities and their respective tax bases. We measure deferred tax assets and liabilities using enacted tax rates that we expect to apply to taxable income in the years in which we expect those temporary differences to be recovered or settled. We recognize the effect on deferred tax assets and liabilities of a change in tax rates in income in the period that includes the enactment date of a change in tax rates.
We establish valuation allowances on our deferred tax assets for amounts that we determine will not be recoverable based upon our analysis of projected taxable income and our ability to implement prudent and feasible tax planning strategies. We recognize increases in these valuation allowances as deferred tax expense. We reflect portions of the valuation allowances subsequently determined to be no longer necessary as deferred tax benefits.
We record tax benefits when it is more likely than not that the tax return position taken with respect to a particular transaction will be sustained. A liability, if recorded, is not considered resolved until the statute of limitations for the relevant taxing authority to examine and challenge the tax position has expired, or the tax position is ultimately settled through examination, negotiation, or litigation. We classify interest and penalties associated with uncertain tax positions in our provision for income taxes.
We establish valuation allowances based on the consideration of both positive and negative evidence. We weigh such evidence through an analysis of future reversals of existing taxable temporary differences, future taxable income exclusive of reversing temporary differences and carryforwards, taxable income in prior carryback years, and our ability to implement prudent and feasible tax planning strategies.
In accordance with ASC Topic 740-10,Income Taxes (ASC 740), a valuation allowance is deemed necessary when, based on the weight of all the available evidence, it is more likely than not (a likelihood of more than 50%) that some portion or all of a deferred tax asset will not be realized. The future realization of the tax benefit depends on the existence of sufficient taxable income within the carryback and carryforward periods.
In our consideration of all the available evidence, we provided more weight to evidence that was more objectively verifiable. In 2014, significant weight was given to our cumulative income/loss position. Our cumulative loss position at December 31, 2014 was due in large part to the recognition of
106
cumulative ACO expenditures in excess of cumulative revenues for the 2013 and 2014 program years, the recognition of significant legal/settlement costs related to our non-core businesses, primarily APS Healthcare and Traditional Insurance and the recognition of the APS Healthcare goodwill impairment in 2013. While the Company is in a cumulative net loss position over the last three years from a financial reporting perspective, the Company has cumulative pre-tax income over the same period, after these adjustments are made, as shown in the following table:
| | | For the years ended December 31, | |||||||||||
|---|---|---|---|---|---|---|---|---|---|---|---|---|---|
| | Three Year Cumulative (Loss) income | ||||||||||||
| | 2014 | 2013 | 2012 | ||||||||||
| | (in thousands) | ||||||||||||
Pretax (loss) income | $ | (159,528 | ) | $ | (33,926 | ) | $ | (203,236 | ) | $ | 77,634 | ||
Adjustments: | |||||||||||||
APS Healthcare goodwill impairment | 164,757 | — | 164,757 | — | |||||||||
ACO losses | 94,051 | 30,809 | 41,588 | 21,654 | |||||||||
Legal/settlement costs | 35,047 | 28,824 | 6,223 | — | |||||||||
| | | | | | | | | | | | | | |
Adjusted pretax income | $ | 134,327 | $ | 25,707 | $ | 9,332 | $ | 99,288 | |||||
| | | | | | | | | | | | | | |
| | | | | | | | | | | | | | |
| | | | | | | | | | | | | | |
We believe that the negative evidence of our cumulative loss is not indicative of future projected income or our ability to realize the deferred tax assets existing as of December 31, 2014. The remaining deferred tax assets, for which a valuation allowance was not established, relate to amounts that can be realized through future reversals of existing taxable temporary differences, prudent and feasible tax planning strategies and the Company's estimates of future taxable income. Any 2014 U.S. tax losses can be carried back to 2012 subject to certain limitations.
The significant acquired tax attributes that create deferred tax assets include net operating loss and foreign tax credit carryforwards. To use the foreign tax credit carryforwards, two conditions must be met. There must be foreign source income and there must be taxable income after application of any loss carryforwards. Based upon reversing timing items and projected income we expect taxable income to be sufficient to utilize the entire operating loss carryforward. However, we do not expect to have sufficient foreign source income to fully utilize the acquired foreign tax credit carryforwards. Consequently, we established a valuation allowance of $0.8 million against the foreign tax credit carryforwards as of December 31, 2014.
Federal Income Taxation of the Company
For the year ended December 31, 2014, we will file a consolidated federal income tax return that includes most corporate subsidiaries but excludes any subsidiary that qualifies as a life insurance company or is taxed as a partnership under the Internal Revenue Code, as well as our subsidiaries domiciled in Puerto Rico. Subsidiaries that qualify as life insurance companies and partnerships will file separate federal income tax returns and the Puerto Rico subsidiaries will file tax returns in Puerto Rico. We will include the taxable income or loss from a subsidiary taxed as a partnership in the tax return of its corporate owner.
We carried valuation allowances on our deferred tax assets of $15.5 million at December 31, 2014 and, as reclassified, $11.3 million at December 31, 2013, primarily related to foreign tax credit carryforwards that we acquired in connection with our purchase of APS Healthcare in 2012, deferred tax assets of APS Healthcare's Puerto Rico subsidiaries, state net operating loss carryforwards and deferred income tax assets for various states.
107
Some of our U.S. insurance company subsidiaries are taxed as life insurance companies as provided in the Internal Revenue Code. The Omnibus Budget Reconciliation Act of 1990 amended the Internal Revenue Code to require a portion of the expenses incurred in selling insurance products be capitalized and amortized over a period of years, as opposed to an immediate deduction in the year incurred. Instead of measuring actual selling expenses, the amount capitalized for tax purposes is based on a percentage of premiums. In general, the capitalized amounts are subject to amortization over a ten-year period. Since this change only affects the timing of the deductions, it does not, assuming stability of income tax rates, affect the provisions for taxes reflected in our financial statements prepared in accordance with GAAP. However, by deferring deductions, the change has the effect of increasing our current tax expense and reducing statutory surplus.
At December 31, 2014, we had unrecognized tax benefits of $0.8 million, net of federal income tax, primarily related to refund claims filed in various state jurisdictions during 2010 and various pre-acquisition benefits related to APS Healthcare. During the years ended December 31, 2014, 2013 and 2012, we recognized $0.7 million, $1.3 million and $8.9 million, respectively, of refund claims filed in 2010.
We recognize interest and penalties related to unrecognized tax benefits in federal and state tax expense. During the year ended December 31, 2014, we recognized no such interest expense and penalties. During the years ended December 31, 2013 and 2012, we recognized $0.5 million and $0.6 million, respectively, of interest expense and penalties.
During the third quarter of 2014, the Internal Revenue Service issued updated tax regulations regarding the deduction and capitalization of expenditures related to tangible property. These regulations provide additional guidance on the application of IRC Sections 1.62(a), 263(a), 167 and 168. We have reviewed our tax policies and methods related to the capitalization and expensing of fixed assets, repairs and other expenditures related to these updated tax regulations. Our assessment indicates that its current tax methods appear to be materially consistent with the updated regulations. At this time we do not intend to request any accounting method changes that would require any material IRC Section 481(a) adjustments for tax year 2014. Additionally, the changes in the regulations are not expected to result in any material decrease or increase of our reserve for uncertain tax positions as required by ASC 740.
Effects of Recently Issued and Pending Accounting Pronouncements
A summary of recent and pending accounting pronouncements is provided in Note 4—Recent and Pending Accounting Pronouncements in the Notes to Consolidated Financial Statements in our Annual Report on Form 10-K.
ITEM 7A—QUANTITATIVE AND QUALITATIVE DISCLOSURES ABOUT MARKET RISK
In general, market risk to which we are subject relates to changes in interest rates that affect the market prices of our fixed income securities as well as the cost of our variable rate debt.
Investment Interest Rate Sensitivity
Our profitability could be affected if we were required to liquidate fixed income securities during periods of rising and/or volatile interest rates. We attempt to mitigate our exposure to adverse interest rate movements through a combination of active portfolio management, the use of interest rate derivatives and by staggering the maturities of our fixed income investments to assure sufficient liquidity to meet our obligations and to address reinvestment risk considerations. Our investment policy is to balance our portfolio duration to achieve investment returns consistent with the preservation of capital and to meet payment obligations of policy benefits and claims.
108
Some classes of mortgage-backed securities are subject to significant prepayment risk. In periods of declining interest rates, individuals may refinance higher rate mortgages to take advantage of the lower rates then available. We monitor and adjust our investment portfolio mix to mitigate this risk.
We regularly conduct various analyses to gauge the financial impact of changes in interest rate on our financial condition. The ranges selected in these analyses reflect our assessment as being reasonably possible over the succeeding twelve-month period. The magnitude of changes modeled in the accompanying analyses should not be construed as a prediction of future economic events, but rather, be treated as a simple illustration of the potential impact of such events on our financial results.
The sensitivity analysis of interest rate risk assumes an instantaneous shift in a parallel fashion across the yield curve, with scenarios of interest rates increasing and decreasing 100 and 200 basis points from their levels as of December 31, 2014, and with all other variables held constant. The following table summarizes the impact of the assumed changes in market interest rates at December 31, 2014. Due to the current low interest rate environment, when estimating the effect of market interest rate decreases on fair value we have set an interest rate floor of 0% and have not allowed interest rates to go negative.
| | December 31, 2014 | Effect of Change in Market Interest Rates on Fair Value of Fixed Income Portfolio as of December 31, 2014 | ||||||||||||||
|---|---|---|---|---|---|---|---|---|---|---|---|---|---|---|---|---|
| | Fair Value of Fixed Income Portfolio | 200 Basis Point Decrease | 100 Basis Point Decrease | 100 Basis Point Increase | 200 Basis Point Increase | |||||||||||
| | (in millions) | |||||||||||||||
| $ | 845.5 | $ | 49.1 | $ | 28.7 | $ | (31.0 | ) | $ | (61.9 | ) | |||||
Debt
We pay interest on our term loan based on LIBOR over one, two, three or six month interest periods. Due to the variable interest rate, we would be subject to higher interest costs if short-term interest rates rise. We regularly conduct various analyses to gauge the financial impact of changes in interest rates on our financial condition. The ranges selected in these analyses reflect our assessment as being reasonably possible over the succeeding twelve-month period. The magnitude of changes modeled in the accompanying analyses should not be construed as a prediction of future economic events, but rather, be treated as a simple illustration of the potential impact of such events on our financial results.
The sensitivity analysis of interest rate risk assumes scenarios involving increases or decreases in LIBOR of 100 and 200 basis points from their levels as of and for the year ended December 31, 2014, and with all other variables held constant. The following table summarizes the impact of changes in LIBOR. Due to the current low interest rate environment, when estimating the effect of LIBOR decreases on pre-tax income, we have set an interest rate floor of 0% and have not allowed LIBOR to go negative.
| | | | Effect of Change in LIBOR on Pre-tax Income for the year ended December 31, 2014 | ||||||||||||||||
|---|---|---|---|---|---|---|---|---|---|---|---|---|---|---|---|---|---|---|---|
| | | Weighted Average Balance Outstanding | |||||||||||||||||
Description of Floating Rate Debt | Weighted Average Interest Rate | 200 Basis Point Decrease(1) | 100 Basis Point Decrease(1) | 100 Basis Point Increase | 200 Basis Point Increase | ||||||||||||||
| | | (in millions) | |||||||||||||||||
Loan payable | 2.70 | % | $ | 103.4 | $ | 0.2 | $ | 0.2 | $ | (1.0 | ) | $ | (2.1 | ) | |||||
- (1)
- The LIBOR rate from January to December on our Loan payable was approximately 20 basis points and, for the purposes of this illustration, decreases in monthly rates over this period have been limited to this rate.
109
We have floating rate debt outstanding of $103.4 million as of December 31, 2014, which is exposed to rising interest rates. In addition, we had approximately $128.0 million of cash and cash equivalents as of December 31, 2014. Our exposure to rising interest costs on our debt would be partially mitigated by the increase in net investment income on our cash and cash equivalents.
The magnitude of changes reflected in the above analysis regarding interest rates should not be construed as a prediction of future economic events, but rather as an illustration of the potential impact of such events on our financial results.
ITEM 8—FINANCIAL STATEMENTS AND SUPPLEMENTARY DATA
The financial statements and supplementary schedules are listed in the accompanying Index to Consolidated Financial Statements and Financial Statement Schedules in this Annual Report on Form 10-K on Page F-1.
ITEM 9—CHANGES IN AND DISAGREEMENTS WITH ACCOUNTANTS ON ACCOUNTING AND FINANCIAL DISCLOSURE
None.
ITEM 9A—CONTROLS AND PROCEDURES
Disclosure Controls and Procedures
The Company maintains disclosure controls and procedures that are designed to ensure that information required to be disclosed in the reports that we file or submit under the Exchange Act, is recorded, processed, summarized and reported within the time periods specified in the SEC's rules and forms, and that such information is accumulated and communicated to management, including the Company's Chief Executive Officer and Chief Financial Officer, as appropriate, to allow timely decisions regarding required disclosures.
Inherent Limitations on Effectiveness of Controls
Our disclosure controls and procedures and our internal controls over financial reporting may not prevent or detect all errors and all fraud. A control system, no matter how well designed and operated, can provide only reasonable, not absolute, assurance that the objectives of the control system are met. The design of a control system must reflect the fact that there are resource constraints, and the benefits of controls must be considered relative to their costs. Further, because of the inherent limitations in all control systems, no evaluation of controls can provide absolute assurance that misstatements due to error or fraud will not occur or that all control issues and instances of fraud, if any, within Universal American have been detected. These inherent limitations include the realities that judgments in decision-making can be faulty and that breakdowns can occur because of simple error or mistake. Controls can also be circumvented by the individual acts of some persons or by collusion of two or more people. The design of any system of controls is based in part on assumptions about the likelihood of future events, and there can be no assurance that any design will succeed in achieving its stated goals under all potential future conditions. Projections of any evaluation of controls effectiveness to future periods are subject to risks. Over time, controls may become inadequate because of changes in conditions or deterioration in the degree of compliance with policies or procedures.
Evaluation of Effectiveness of Controls
An evaluation was carried out under the supervision and with the participation of the Company's management, including our Chief Executive Officer and Chief Financial Officer, of the effectiveness of the design and operation of our disclosure controls and procedures as of December 31, 2014. Based on
110
this evaluation, our Chief Executive Officer and Chief Financial Officer concluded that our disclosure controls and procedures were effective as of December 31, 2014, at a reasonable assurance level, to timely alert management to material information required to be included in our periodic filings with the Securities and Exchange Commission.
Management's Annual Report on Internal Control over Financial Reporting
Our management is responsible for establishing and maintaining adequate internal control over financial reporting (as defined in Rule 13a-15(f) under the Exchange Act). A company's internal control over financial reporting is a process designed to provide reasonable assurance regarding the reliability of financial reporting and the preparation of financial statements for external purposes in accordance with U.S. generally accepted accounting principles in the United States.
Because of its inherent limitations, internal control over financial reporting may not prevent or detect misstatements. Also, projections of any evaluation of effectiveness to future periods are subject to the risk that controls may become inadequate because of changes in conditions, or that the degree of compliance with the policies or procedures may deteriorate.
Management assessed our internal control over financial reporting as of December 31, 2014, the end of our fiscal year. Management based its assessment on criteria established in Internal Control—Integrated Framework issued by the Committee of Sponsoring Organizations of the Treadway Commission (1992 framework). Based on our assessment, we determined that, as of December 31, 2014, the Company's internal control over financial reporting was effective based on those criteria.
The effectiveness of our internal control over financial reporting as of December 31, 2014 has been audited by Ernst & Young LLP, an independent registered public accounting firm, as stated in their report which is included on page F-3 of our consolidated financial statements included in this Annual Report on Form 10-K.
Changes in Internal Control Over Financial Reporting
There were no changes in our internal controls over financial reporting during the quarter ended December 31, 2014 that have materially affected, or are reasonably likely to materially affect, our internal controls over financial reporting.
None.
111
ITEM 10—DIRECTORS, EXECUTIVE OFFICERS AND CORPORATE GOVERNANCE
The information required by Item 10 is incorporated into Part III of this Annual Report on Form 10-K by reference to our definitive Proxy Statement for the Annual Meeting of Stockholders which is expected to be held on May 28, 2015.
ITEM 11—EXECUTIVE COMPENSATION
The information required by Item 11 is incorporated into Part III of this Annual Report on Form 10-K by reference to our definitive Proxy Statement for the Annual Meeting of Stockholders which is expected to be held on May 28, 2015.
ITEM 12—SECURITY OWNERSHIP OF CERTAIN BENEFICIAL OWNERS AND MANAGEMENT AND RELATED STOCKHOLDER MATTERS
The information required by Item 12 is incorporated into Part III of this Annual Report on Form 10-K by reference to our definitive Proxy Statement for the Annual Meeting of Stockholders which is expected to be held on May 28, 2015.
ITEM 13—CERTAIN RELATIONSHIPS AND RELATED TRANSACTIONS, AND DIRECTOR INDEPENDENCE
The information required by Item 13 is incorporated into Part III of this Annual Report on Form 10-K by reference to our definitive Proxy Statement for the Annual Meeting of Stockholders which is expected to be held on May 28, 2015.
ITEM 14—PRINCIPAL ACCOUNTANT FEES AND SERVICES
The information required by Item 14 is incorporated into Part III of this Annual Report on Form 10-K by reference to our definitive Proxy Statement for the Annual Meeting of Stockholders which is expected to be held on May 28, 2015.
112
ITEM 15(a)—EXHIBITS AND FINANCIAL STATEMENT SCHEDULES
- 1
- Financial Statements
Consolidated Balance Sheets as of December 31, 2014 and 2013 | F-4 | |||
Consolidated Statements of Operations for the Three Years Ended December 31, 2014 | F-5 | |||
Consolidated Statements of Comprehensive (Loss) Income for the Three Years Ended December 31, 2014 | F-6 | |||
Consolidated Statements of Stockholders' Equity for the Three Years Ended December 31, 2014 | F-7 | |||
Consolidated Statements of Cash Flows for the Three Years Ended December 31, 2014 | F-8 | |||
Notes to Consolidated Financial Statements | F-9 |
- 2
- Financial Statement Schedules
Schedule I—Summary of Investments Other Than Investments in Related Parties | F-67 | |
Schedule II—Condensed Financial Information of Registrant | F-68 | |
Schedule III—Supplemental Insurance Information | F-75 | |
Schedule IV—Reinsurance (incorporated in Note 10 to the Consolidated Financial Statements) | ||
Schedule V—Valuation and Qualifying Accounts | F-76 |
- 3
- Exhibits
| 2.1 | Agreement and Plan of Merger, dated as of December 30, 2010, by and among Old Universal American, CVS Caremark Corporation and Ulysses Merger Sub, L.L.C. (filed as Exhibit 2.1 to the Company's Registration Statement on Form S-4 filed on March 9, 2011, and incorporated by reference herein). | ||
| 2.1.1 | Amendment to Agreement and Plan of Merger, dated as of March 30, 2011, by and among Old Universal American, CVS Caremark Corporation and Ulysses Merger Sub, L.L.C. (filled as Exhibit 2.4 to the Company's Amendment No. 1 to the Registration Statement on Form S-4 filed on March 31, 2011, and incorporated by reference herein). | ||
| 2.2 | Separation Agreement dated as of December 30, 2010, by and between Old Universal American, Ulysses Spin Corp. and, solely for the limited purposes specified herein, CVS Caremark Corporation (filed as Exhibit 2.2 to the Company's Registration Statement on Form S-4 filed on March 9, 2011, and incorporated by reference herein). | ||
| 2.2.1 | Amendment to Separation Agreement, dated as of March 8, 2011, by and among Old Universal American, the Company and, solely for the limited purposes specified herein, CVS Caremark Corporation (filed as Exhibit 2.3 to the Company's Registration Statement on Form S-4 filed on March 9, 2011, and incorporated by reference herein). | ||
| 2.3 | Agreement and Plan of Merger, dated as of January 11, 2012, by and among Universal American Corp., APS Merger Sub, Inc., Partners Healthcare Holdings, L.P. and Partners Healthcare Solutions, Inc. (filed as Exhibit 2.1 to the Company's Current Report on Form 8-K filed on January 18, 2012, and incorporated by reference herein). | ||
113
| 3.1 | Amended and Restated Certificate of Incorporation of the Company (filed as Exhibit 3.1 to the Company's Current Report on Form 8-K filed with the Commission on May 4, 2011, and incorporated by reference herein). | ||
| 3.2 | Amended and Restated By-Laws of the Company (filed as Exhibit 3.2 to the Company's Current Report on Form 8-K filed with the Commission on May 4, 2011, and incorporated by reference herein). | ||
| 4.1 | Certificate of Designation of the Series A Mandatorily Redeemable Preferred Shares (filed as Exhibit 4.1 to the Company's Current Report on Form 8-K filed on March 4, 2011, and incorporated by reference herein). | ||
| 4.2 | Certificate of Amendment to Certificate of Designation of the Series A Mandatorily Redeemable Preferred Shares (filed as Exhibit 4.1.2 to the Company's Registration Statement on Form S-4 filed on August 2, 2011, and incorporated by reference herein). | ||
| 4.3 | Registration Rights Agreement dated as of March 2, 2012, between Universal American Corp. and Partners Healthcare Solutions Holdings, L.P. (filed as Exhibit 4.2 to the Company's Current Report on Form 8-K filed on March 8, 2012 and incorporated by reference herein). | ||
| 4.4 | Letter Agreement dated March 2, 2012 between Universal American Corp. and Partners Healthcare Solutions Holdings, L.P. (filed as Exhibit 10.1 to the Company's Current Report on Form 8-K filed on March 8, 2012 and incorporated by reference herein). | ||
| 10.1 | Employment Agreement dated July 30, 1999, between Old Universal American and Richard A. Barasch (filed as Exhibit D to Old Universal American's Current Report on Form 8-K/A dated March 14, 2001, and incorporated by reference herein). | ||
| 10.2 | Employment Agreement dated July 30, 1999, between Old Universal American and Robert Waegelein (filed as Exhibit E to the Old Universal American's Current Report on Form 8-K/A dated March 14, 2001, and incorporated by reference herein). | ||
| 10.2.1 | Amendment to Employment Agreement, dated as of April 29, 2011, between Old Universal American and Robert Waegelein (filed as Exhibit 10.2.2 to the Company's Registration Statement on Form S-4 filed on July 15, 2011, and incorporated by reference herein). | ||
| 10.3 | Employment Agreement dated March 9, 2004, by and among the Old Universal American, Heritage Health Systems, Inc. and Theodore M. Carpenter, Jr. (filed as Exhibit 10.18 to Old Universal American's Current Report on Form 8-K dated January 18, 2007, and incorporated by reference herein). | ||
| 10.4 | Employment Agreement dated July 8, 2010 by and between Universal American Corp. and Anthony Wolk (filed as Exhibit 10.4 to the Company's Annual Report on Form 10-K filed on March 6, 2013 and incorporated by reference herein). | ||
| 10.5 | * | Employment Agreement dated March 4, 2013 by and between Universal American Corp. and Erin Page. | |
| 10.6 | * | Employment Agreement dated September 27, 2012 by and between Universal American Corp. and Steven H. Black. |
114
| 10.7 | Universal American Corp. 2011 Omnibus Equity Award Plan (filed as Exhibit 10.2 to the Company's Amendment No. 1 to the Registration Statement on Form S-4 filed on March 31, 2011, and incorporated by reference herein). | ||
| 10.8 | Form of Universal American Corp. 2011 Omnibus Equity Award Plan Employee Nonqualified Option Award Agreement (filed as Exhibit 10.4 to the Company's Registration Statement on Form S-4 filed on July 15, 2011, and incorporated by reference herein). | ||
| 10.9 | * | Form of Universal American Corp. 2011 Omnibus Equity Award Plan Employee Restricted Stock Award Agreement | |
| 10.10 | Indemnity Reinsurance Agreement between American Exchange Life Insurance Company (Ceding Company) and Commonwealth Annuity and Life Insurance Company (Reinsurer) effective as of April 1, 2009 (filed as Exhibit 10.2 to Old Universal American's Quarterly Report on Form 10-Q filed on October 30, 2009, and incorporated by reference herein). | ||
| 10.11 | Indemnity Reinsurance Agreement between Marquette National Life Insurance Company (Ceding Company) and Commonwealth Annuity and Life Insurance Company (Reinsurer) effective as of April 1, 2009 (filed as Exhibit 10.3 to Old Universal American's Quarterly Report on Form 10-Q filed on October 30, 2009, and incorporated by reference herein). | ||
| 10.12 | Indemnity Reinsurance Agreement between Pennsylvania Life Insurance Company (Ceding Company) and Commonwealth Annuity and Life Insurance Company (Reinsurer) effective as of April 1, 2009 (filed as Exhibit 10.4 to Old Universal American's Quarterly Report on Form 10-Q filed on October 30, 2009, and incorporated by reference herein). | ||
| 10.13 | Indemnity Reinsurance Agreement between American Pioneer Life Insurance Company (Ceding Company) and Commonwealth Annuity and Life Insurance Company (Reinsurer) effective as of April 1, 2009 (filed as Exhibit 10.5 to Old Universal American's Quarterly Report on Form 10-Q filed on October 30, 2009, and incorporated by reference herein). | ||
| 10.14 | Indemnity Reinsurance Agreement between American Progressive Life and Health Insurance Company of New York (Ceding Company) and First Allmerica Financial Life Insurance (Reinsurer) effective as of April 1, 2009 (filed as Exhibit 10.6 to Old Universal American's Quarterly Report on Form 10-Q filed on October 30, 2009, and incorporated by reference herein). | ||
| 10.15 | Indemnity Reinsurance Agreement between The Pyramid Life Insurance Company (Ceding Company) and Commonwealth Annuity and Life Insurance Company (Reinsurer) effective as of April 1, 2009 (filed as Exhibit 10.7 to Old Universal American's Quarterly Report on Form 10-Q filed on October 30, 2009, and incorporated by reference herein). | ||
| 10.16 | Indemnity Reinsurance Agreement between Union Bankers Insurance Company (Ceding Company) and Commonwealth Annuity and Life Insurance Company (Reinsurer) effective as of April 1, 2009 (filed as Exhibit 10.8 to Old Universal American's Quarterly Report on Form 10-Q filed on October 30, 2009, and incorporated by reference herein). | ||
115
| 10.17 | Tax Matters Agreement, dated April 29, 2011, by and among the Company, Old Universal American and CVS Caremark Corporation (filed as Exhibit 10.2 to the Company's Current Report on Form 8-k filed on May 5, 2011, and incorporated by reference herein). | ||
| 10.18 | Credit Agreement, dated as of March 2, 2012, by and among Universal American Corp., each lender from time to time party thereto, Bank of America, N.A., as Administrative Agent, Swing Line Lender and an L/C Issuer and Merrill Lynch, Pierce, Fenner & Smith Incorporated, Fifth Third Bank, Sun Trust Bank and U.S. Bank National Association as Joint Lead Arrangers, Joint Book Managers and Co-Syndication Agents (filed as Exhibit 10.2 to the Company's Current Report on Form 8-K filed on March 8, 2012 and incorporated by reference herein). | ||
| 10.19 | First Amendment to Credit Agreement, dated as of November 4, 2013, by and among Universal American Corp., each lender from time to time party thereto, Bank of America, N.A., as Administrative Agent, Swing Line Lender and an L/C Issuer and Merrill Lynch, Pierce, Fenner & Smith Incorporated, Fifth Third Bank, Sun Trust Bank and U.S. Bank National Association as Joint Lead Arrangers, Joint Book Managers and Co-Syndication Agents (filed as Exhibit 10.18 to the Company's Quarterly Report on Form 10-Q filed on November 7, 2013 and incorporated herein by reference). | ||
| 12.1 | * | Computation of Ratio of Earnings to Fixed Charges. | |
| 21.1 | * | List of Subsidiaries. | |
| 23.1 | * | Consent of Ernst & Young LLP. | |
| 31.1 | * | Certification of Chief Executive Officer, as required by Rule 13a-14(a) of the Securities Exchange Act of 1934. | |
| 31.2 | * | Certification of Chief Financial Officer, as required by Rule 13a-14(a) of the Securities Exchange Act of 1934. | |
| 32.1 | * | Certification of the Chief Executive Officer and Chief Financial Officer, as required by Rule 13a-14(b) of the Securities Exchange Act of 1934 and 18 U.S.C. Section 1350, as adopted pursuant to Section 906 of the Sarbanes-Oxley Act of 2002. | |
| 101.INS—XBRL | Instance Document. | ||
| 101.SCH—XBRL | Taxonomy Extension Schema Document. | ||
| 101.CAL—XBRL | Taxonomy Extension Calculation Linkbase Document. | ||
| 101.LAB—XBRL | Taxonomy Extension Label Linkbase Document. | ||
| 101.PRE—XBRL | Taxonomy Extension Presentation Linkbase Document. | ||
| 101.DEF—XBRL | Taxonomy Extension Definition Linkbase Document. |
- *
- Filed or furnished herewith.
116
Pursuant to the requirements of Section 13 or 15(d) of the Securities Exchange Act of 1934, the Registrant has duly caused this report to be signed on its behalf by the undersigned, thereunto duly authorized.
| UNIVERSAL AMERICAN CORP. | ||
March 30, 2015 | /s/ RICHARD A. BARASCH Richard A. Barasch Chairman of the Board and Chief Executive Officer |
Pursuant to the requirements of the Securities Exchange Act of 1934, this report has been signed below by the following persons on behalf of the registrant and in the following capacities and on the dates indicated.
Signature | Title | Date | ||
|---|---|---|---|---|
| /s/ RICHARD A. BARASCH Richard A. Barasch | Chairman of the Board, Chief Executive Officer and Director (Principal Executive Officer) | March 30, 2015 | ||
/s/ ROBERT A. WAEGELEIN Robert A. Waegelein | President and Chief Financial Officer (Principal Financial Officer and Principal Accounting Officer) | March 30, 2015 | ||
/s/ SALLY W. CRAWFORD Sally W. Crawford | Director | March 30, 2015 | ||
/s/ MATTHEW W. ETHERIDGE Matthew W. Etheridge | Director | March 30, 2015 | ||
/s/ MARK K. GORMLEY Mark K. Gormley | Director | March 30, 2015 | ||
/s/ MARK M. HARMELING Mark M. Harmeling | Director | March 30, 2015 | ||
/s/ PATRICK J. MCLAUGHLIN Patrick J. McLaughlin | Director | March 30, 2015 |
117
Signature | Title | Date | ||
|---|---|---|---|---|
| /s/ RICHARD C. PERRY Richard C. Perry | Director | March 30, 2015 | ||
/s/ THOMAS A. SCULLY Thomas A. Scully | Director | March 30, 2015 | ||
/s/ ROBERT A. SPASS Robert A. Spass | Director | March 30, 2015 | ||
/s/ GEORGE E. SPERZEL George E. Sperzel | Director | March 30, 2015 | ||
/s/ SEAN M. TRAYNOR Sean M. Traynor | Director | March 30, 2015 |
118
UNIVERSAL AMERICAN CORP. AND SUBSIDIARIES
INDEX TO CONSOLIDATED FINANCIAL STATEMENTS
CONSOLIDATED FINANCIAL STATEMENTS AND FINANCIAL STATEMENT SCHEDULES OF THE REGISTRANT: | ||||
Report of Independent Registered Public Accounting Firm | F-2 | |||
Report of Independent Registered Public Accounting Firm on Internal Control Over Financial Reporting | F-3 | |||
Consolidated Balance Sheets as of December 31, 2014 and 2013 | F-4 | |||
Consolidated Statements of Operations for the Three Years Ended December 31, 2014 | F-5 | |||
Consolidated Statements of Comprehensive (Loss) Income for the Three Years Ended December 31, 2014 | F-6 | |||
Consolidated Statements of Stockholders' Equity for the Three Years Ended December 31, 2014 | F-7 | |||
Consolidated Statements of Cash Flows for the Three Years Ended December 31, 2014 | F-8 | |||
Notes to Consolidated Financial Statements | F-9 | |||
Schedule I—Summary of Investments Other Than Investments in Related Parties | F-67 | |||
Schedule II—Condensed Financial Information of Registrant | F-68 | |||
Schedule III—Supplemental Insurance Information | F-75 | |||
Schedule IV—Reinsurance (incorporated in Note 10 to the Consolidated Financial Statements) | ||||
Schedule V—Valuation and Qualifying Accounts | F-76 |
Other schedules were omitted because they were not applicable.
F-1
Report of Independent Registered Public Accounting Firm
The Board of Directors and Stockholders of
Universal American Corp.
We have audited the accompanying consolidated balance sheets of Universal American Corp. and subsidiaries as of December 31, 2013 and 2012, and the related consolidated statements of operations, comprehensive (loss) income, stockholders' equity and cash flows for each of the three years in the period ended December 31, 2014. Our audits also included the financial statement schedules listed in the Index at Item 15(a). These financial statements and schedules are the responsibility of the Company's management. Our responsibility is to express an opinion on these financial statements and schedules based on our audits.
We conducted our audits in accordance with the standards of the Public Company Accounting Oversight Board (United States). Those standards require that we plan and perform the audit to obtain reasonable assurance about whether the financial statements are free of material misstatement. An audit includes examining, on a test basis, evidence supporting the amounts and disclosures in the financial statements. An audit also includes assessing the accounting principles used and significant estimates made by management, as well as evaluating the overall financial statement presentation. We believe that our audits provide a reasonable basis for our opinion.
In our opinion, the financial statements referred to above present fairly, in all material respects, the consolidated financial position of Universal American Corp. and subsidiaries at December 31, 2014 and 2013, and the consolidated results of their operations and their cash flows for each of the three years in the period ended December 31, 2014, in conformity with U.S. generally accepted accounting principles. Also, in our opinion, the related financial statement schedules, when considered in relation to the basic financial statements taken as a whole, present fairly in all material respects the information set forth therein.
We also have audited, in accordance with the standards of the Public Company Accounting Oversight Board (United States), Universal American Corp. and subsidiaries' internal control over financial reporting as of December 31, 2013, based on criteria established in Internal Control—Integrated Framework issued by the Committee of Sponsoring Organizations of the Treadway Commission (1992 framework) and our report dated March 30, 2015 expressed an unqualified opinion thereon.
| /s/ ERNST & YOUNG LLP | ||
New York, New York March 30, 2015 |
F-2
Report of Independent Registered Public Accounting Firm
on Internal Control Over Financial Reporting
The Board of Directors and Stockholders of
Universal American Corp.
We have audited Universal American Corp. and subsidiaries' internal control over financial reporting as of December 31, 2014, based on criteria established in Internal Control—Integrated Framework issued by the Committee of Sponsoring Organizations of the Treadway Commission (1992 framework) (the COSO criteria). Universal American Corp. and subsidiaries' management is responsible for maintaining effective internal control over financial reporting, and for its assessment of the effectiveness of internal control over financial reporting included in the accompanying Management's Annual Report on Internal Control Over Financial Reporting. Our responsibility is to express an opinion on the company's internal control over financial reporting based on our audit.
We conducted our audit in accordance with the standards of the Public Company Accounting Oversight Board (United States). Those standards require that we plan and perform the audit to obtain reasonable assurance about whether effective internal control over financial reporting was maintained in all material respects. Our audit included obtaining an understanding of internal control over financial reporting, assessing the risk that a material weakness exists, testing and evaluating the design and operating effectiveness of internal control based on the assessed risk, and performing such other procedures as we considered necessary in the circumstances. We believe that our audit provides a reasonable basis for our opinion.
A company's internal control over financial reporting is a process designed to provide reasonable assurance regarding the reliability of financial reporting and the preparation of financial statements for external purposes in accordance with generally accepted accounting principles. A company's internal control over financial reporting includes those policies and procedures that (1) pertain to the maintenance of records that, in reasonable detail, accurately and fairly reflect the transactions and dispositions of the assets of the company; (2) provide reasonable assurance that transactions are recorded as necessary to permit preparation of financial statements in accordance with generally accepted accounting principles, and that receipts and expenditures of the company are being made only in accordance with authorizations of management and directors of the company; and (3) provide reasonable assurance regarding prevention or timely detection of unauthorized acquisition, use, or disposition of the company's assets that could have a material effect on the financial statements.
Because of its inherent limitations, internal control over financial reporting may not prevent or detect misstatements. Also, projections of any evaluation of effectiveness to future periods are subject to the risk that controls may become inadequate because of changes in conditions, or that the degree of compliance with the policies or procedures may deteriorate.
In our opinion, Universal American Corp. and subsidiaries maintained, in all material respects, effective internal control over financial reporting as of December 31, 2014, based on the COSO criteria.
We also have audited, in accordance with the standards of the Public Company Accounting Oversight Board (United States), the consolidated balance sheets of Universal American Corp. and subsidiaries as of December 31, 2014 and 2013, and the related consolidated statements of operations, comprehensive (loss) income, stockholders' equity, and cash flows for each of the three years in the period ended December 31, 2014 of Universal American Corp. and subsidiaries and our report dated March 30, 2015 expressed an unqualified opinion thereon.
| /s/ ERNST & YOUNG LLP | ||
New York, New York March 30, 2015 |
F-3
UNIVERSAL AMERICAN CORP. AND SUBSIDIARIES
CONSOLIDATED BALANCE SHEETS
(in thousands, except share amounts)
| | December 31, 2014 | December 31, 2013 | |||||
|---|---|---|---|---|---|---|---|
ASSETS | |||||||
Investments: | |||||||
Fixed maturities available for sale, at fair value (amortized cost: 2014, $816,662; 2013, $913,453) | $ | 845,453 | $ | 933,398 | |||
Short-term investments | 8,994 | — | |||||
Other invested assets | 25,920 | 22,575 | |||||
| | | | | | | | |
Total investments | 880,367 | 955,973 | |||||
Cash and cash equivalents | 127,985 | 69,574 | |||||
Accrued investment income | 6,424 | 7,056 | |||||
Deferred policy acquisition costs | 77,814 | 90,136 | |||||
Reinsurance recoverables—life | 498,468 | 520,243 | |||||
Reinsurance recoverables—health | 136,805 | 142,749 | |||||
Due and unpaid premiums | 55,586 | 59,383 | |||||
Present value of future profits and other amortizing intangible assets | 14,010 | 20,331 | |||||
Goodwill and other indefinite lived intangible assets | 73,261 | 77,526 | |||||
Deferred income tax asset | 18,039 | 2,762 | |||||
Income taxes receivable | 31,085 | 45,392 | |||||
Other assets | 105,454 | 110,541 | |||||
| | | | | | | | |
Total assets | $ | 2,025,298 | $ | 2,101,666 | |||
| | | | | | | | |
| | | | | | | | |
| | | | | | | | |
LIABILITIES AND STOCKHOLDERS' EQUITY | |||||||
LIABILITIES | |||||||
Reserves and other policy liabilities—life | $ | 514,440 | $ | 532,077 | |||
Reserves for future policy benefits—health | 453,784 | 462,832 | |||||
Policy and contract claims—health | 147,561 | 166,545 | |||||
Premiums received in advance | 6,093 | 8,632 | |||||
Series A mandatorily redeemable preferred shares | 40,000 | 40,000 | |||||
Loan payable | 103,447 | 103,447 | |||||
Amounts due to reinsurers | 4,196 | 7,690 | |||||
Other liabilities | 141,312 | 115,544 | |||||
| | | | | | | | |
Total liabilities | 1,410,833 | 1,436,767 | |||||
| | | | | | | | |
Commitments and contingencies (Note 23) | |||||||
STOCKHOLDERS' EQUITY | |||||||
Preferred stock (Authorized: 40 million shares) | — | — | |||||
Common stock—voting (Authorized: 400 million shares; issued and outstanding: | |||||||
2014, 80.4 million shares; 2013, 85.5 million shares) | 804 | 855 | |||||
Common stock—non-voting (Authorized: 60 million shares; issued and outstanding: 3.3 million shares) | 33 | 33 | |||||
Additional paid-in capital | 667,026 | 693,329 | |||||
Accumulated other comprehensive income | 12,648 | 7,329 | |||||
Retained deficit | (66,046 | ) | (36,647 | ) | |||
| | | | | | | | |
Total stockholders' equity | 614,465 | 664,899 | |||||
| | | | | | | | |
Total liabilities and stockholders' equity | $ | 2,025,298 | $ | 2,101,666 | |||
| | | | | | | | |
| | | | | | | | |
| | | | | | | | |
See notes to consolidated financial statements.
F-4
UNIVERSAL AMERICAN CORP. AND SUBSIDIARIES
CONSOLIDATED STATEMENTS OF OPERATIONS
(in thousands, except per share amounts)
| | For the Years Ended December 31, | |||||||||
|---|---|---|---|---|---|---|---|---|---|---|
| | 2014 | 2013 | 2012 | |||||||
Revenues: | ||||||||||
Net premium and policyholder fees earned | $ | 1,914,416 | $ | 2,001,309 | $ | 1,989,813 | ||||
Net investment income | 33,713 | 36,737 | 42,397 | |||||||
Fee and other income | 93,075 | 104,657 | 128,683 | |||||||
Net realized (losses) gains | (1,382 | ) | 13,863 | 16,604 | ||||||
| | | | | | | | | | | |
Total revenues | 2,039,822 | 2,156,566 | 2,177,497 | |||||||
| | | | | | | | | | | |
Benefits, claims and expenses: | ||||||||||
Claims and other benefits | 1,613,576 | 1,684,596 | 1,624,553 | |||||||
Change in deferred policy acquisition costs | 12,322 | 12,629 | 5,418 | |||||||
Amortization of intangible assets | 4,870 | 7,843 | 8,132 | |||||||
Commissions | 29,458 | 36,250 | 43,472 | |||||||
Reinsurance commissions and expense allowances | 6,656 | 6,761 | 6,492 | |||||||
Interest expense | 6,214 | 6,487 | 6,235 | |||||||
Asset impairment charges | — | 189,443 | — | |||||||
Affordable Care Act fee | 23,130 | — | — | |||||||
Other operating costs and expenses | 359,728 | 382,191 | 395,339 | |||||||
| | | | | | | | | | | |
Total benefits, claims and expenses | 2,055,954 | 2,326,200 | 2,089,641 | |||||||
| | | | | | | | | | | |
(Loss) income before equity in losses of unconsolidated subsidiaries | (16,132 | ) | (169,634 | ) | 87,856 | |||||
Equity in losses of unconsolidated subsidiaries | (17,793 | ) | (33,602 | ) | (10,222 | ) | ||||
| | | | | | | | | | | |
(Loss) income before income taxes | (33,925 | ) | (203,236 | ) | 77,634 | |||||
(Benefit from) provision for income taxes | (4,458 | ) | (10,910 | ) | 24,601 | |||||
| | | | | | | | | | | |
Net (loss) income | $ | (29,467 | ) | $ | (192,326 | ) | $ | 53,033 | ||
| | | | | | | | | | | |
| | | | | | | | | | | |
| | | | | | | | | | | |
(Loss) income per common share: | ||||||||||
Basic | $ | (0.35 | ) | $ | (2.20 | ) | $ | 0.61 | ||
| | | | | | | | | | | |
| | | | | | | | | | | |
| | | | | | | | | | | |
Diluted | $ | (0.35 | ) | $ | (2.20 | ) | $ | 0.61 | ||
| | | | | | | | | | | |
| | | | | | | | | | | |
| | | | | | | | | | | |
Weighted average shares outstanding: | ||||||||||
Basic weighted average shares outstanding | 83,850 | 87,402 | 86,371 | |||||||
Effect of dilutive securities | — | — | 277 | |||||||
| | | | | | | | | | | |
Diluted weighted average shares outstanding | 83,850 | 87,402 | 86,648 | |||||||
| | | | | | | | | | | |
| | | | | | | | | | | |
| | | | | | | | | | | |
See notes to consolidated financial statements.
F-5
UNIVERSAL AMERICAN CORP. AND SUBSIDIARIES
CONSOLIDATED STATEMENTS OF COMPREHENSIVE (LOSS) INCOME
(in thousands)
| | For the years ended December 31, | |||||||||
|---|---|---|---|---|---|---|---|---|---|---|
| | 2014 | 2013 | 2012 | |||||||
Comprehensive (loss) income: | ||||||||||
Net (loss) income | $ | (29,467 | ) | $ | (192,326 | ) | $ | 53,033 | ||
Other comprehensive income (loss), net of income taxes: | ||||||||||
Unrealized gain (loss) on investments | 7,108 | (15,111 | ) | 33,236 | ||||||
Less: reclassification adjustment for gains included in net (loss) income | 822 | 9,011 | 10,793 | |||||||
| | | | | | | | | | | |
Change in net unrealized gain (loss) on securities available for sale | 6,286 | (24,122 | ) | 22,443 | ||||||
Change in long-term claim reserve adjustment | (967 | ) | 2,362 | (4,520 | ) | |||||
| | | | | | | | | | | |
Total other comprehensive income (loss) , net of income taxes | 5,319 | (21,760 | ) | 17,923 | ||||||
| | | | | | | | | | | |
Comprehensive (loss) income | $ | (24,148 | ) | $ | (214,086 | ) | $ | 70,956 | ||
| | | | | | | | | | | |
| | | | | | | | | | | |
| | | | | | | | | | | |
See notes to consolidated financial statements.
F-6
UNIVERSAL AMERICAN CORP. AND SUBSIDIARIES
CONSOLIDATED STATEMENTS OF STOCKHOLDERS' EQUITY
(in thousands)
| | Common Stock | | Accumulated Other Comprehensive Income | | | ||||||||||||||
|---|---|---|---|---|---|---|---|---|---|---|---|---|---|---|---|---|---|---|---|
| | Additional Paid-in Capital | Retained Earnings (Deficit) | | ||||||||||||||||
| | Voting | Non-Voting | Total | ||||||||||||||||
Balance at January 1, 2012 | $ | 782 | $ | 33 | $ | 738,029 | $ | 11,166 | $ | 190,353 | $ | 940,363 | |||||||
Net income | — | — | — | — | 53,033 | 53,033 | |||||||||||||
Other comprehensive income | — | — | — | 17,923 | — | 17,923 | |||||||||||||
Net issuance of common stock | 5 | — | 5,865 | — | — | 5,870 | |||||||||||||
Issuance of shares in connection with the acquisition of APS Healthcare | 63 | — | 74,451 | — | — | 74,514 | |||||||||||||
Stock-based compensation | — | — | 8,953 | — | — | 8,953 | |||||||||||||
Dividends to stockholders | — | — | — | — | (88,159 | ) | (88,159 | ) | |||||||||||
| | | | | | | | | | | | | | | | | | | | |
Balance at December 31, 2012 | 850 | 33 | 827,298 | 29,089 | 155,227 | 1,012,497 | |||||||||||||
Net loss | — | — | — | — | (192,326 | ) | (192,326 | ) | |||||||||||
Other comprehensive loss | — | — | — | (21,760 | ) | — | (21,760 | ) | |||||||||||
Net issuance of common stock | 5 | — | 3,716 | — | — | 3,721 | |||||||||||||
Stock-based compensation | — | — | 4,327 | — | — | 4,327 | |||||||||||||
Dividends to stockholders | — | — | (142,012 | ) | — | 452 | (141,560 | ) | |||||||||||
| | | | | | | | | | | | | | | | | | | | |
Balance at December 31, 2013 | 855 | 33 | 693,329 | 7,329 | (36,647 | ) | 664,899 | ||||||||||||
Net loss | — | — | — | — | (29,467 | ) | (29,467 | ) | |||||||||||
Other comprehensive income | — | — | — | 5,319 | — | 5,319 | |||||||||||||
Net issuance of common stock | 9 | — | 4,861 | — | — | 4,870 | |||||||||||||
Stock-based compensation | — | — | 4,658 | — | — | 4,658 | |||||||||||||
Dividends to stockholders | — | — | 298 | — | 68 | 366 | |||||||||||||
Share retirement | (60 | ) | — | (36,120 | ) | — | — | (36,180 | ) | ||||||||||
| | | | | | | | | | | | | | | | | | | | |
Balance at December 31, 2014 | $ | 804 | $ | 33 | $ | 667,026 | $ | 12,648 | $ | (66,046 | ) | $ | 614,465 | ||||||
| | | | | | | | | | | | | | | | | | | | |
| | | | | | | | | | | | | | | | | | | | |
| | | | | | | | | | | | | | | | | | | | |
See notes to consolidated financial statements.
F-7
UNIVERSAL AMERICAN CORP. AND SUBSIDIARIES
CONSOLIDATED STATEMENTS OF CASH FLOWS
(in thousands)
| | For the Years Ended December 31, | |||||||||
|---|---|---|---|---|---|---|---|---|---|---|
| | 2014 | 2013 | 2012 | |||||||
Operating activities: | ||||||||||
Net (loss) income | $ | (29,467 | ) | $ | (192,326 | ) | $ | 53,033 | ||
Adjustments to reconcile net (loss) income to cash provided by (used for) operating activities, net of balances acquired: | ||||||||||
Deferred income taxes | (18,247 | ) | (21,288 | ) | 8,724 | |||||
Net realized gains on investments | (1,266 | ) | (13,863 | ) | (16,604 | ) | ||||
Realized losses on sale of businesses | 2,648 | — | — | |||||||
Amortization of intangible assets | 4,870 | 7,843 | 8,132 | |||||||
Amortization of debt issuance costs | 1,752 | 1,423 | 1,162 | |||||||
Net amortization of bond premium | 4,837 | 6,353 | 6,391 | |||||||
Depreciation expense | 7,351 | 10,932 | 10,073 | |||||||
Stock based compensation expense | 10,047 | 8,057 | 9,319 | |||||||
Impairment of fixed assets | — | 8,549 | 415 | |||||||
Asset impairment charge | — | 180,862 | — | |||||||
Changes in operating assets and liabilities: | ||||||||||
Deferred policy acquisition costs | 12,322 | 12,629 | 5,418 | |||||||
Reserves and other policy liabilities—life | (17,637 | ) | (15,541 | ) | (14,271 | ) | ||||
Reserves for future policy benefits—health | (10,537 | ) | 16,869 | 108 | ||||||
Policy and contract claims—health | (15,517 | ) | 9,987 | (26,354 | ) | |||||
Reinsurance balances | 24,225 | 954 | 22,008 | |||||||
Due and unpaid/advance premium, net | 1,531 | (28,446 | ) | (6,867 | ) | |||||
Income taxes receivable | 15,224 | (8,965 | ) | 10,414 | ||||||
Other, net | 25,019 | (47,581 | ) | 10,998 | ||||||
| | | | | | | | | | | |
Cash provided by (used for) operating activities | 17,155 | (63,552 | ) | 82,099 | ||||||
Investing activities: | ||||||||||
Proceeds from sale, maturity, call, paydown or redemption of fixed maturity investments | 221,919 | 606,545 | 1,381,268 | |||||||
Cost of fixed maturity investments acquired | (138,207 | ) | (365,886 | ) | (1,320,523 | ) | ||||
Change in short-term investments | (8,994 | ) | 16,993 | (16,993 | ) | |||||
Purchase of business, net of cash acquired | — | (3,299 | ) | (137,747 | ) | |||||
Sale of businesses, net of cash sold | 12,882 | — | — | |||||||
Purchase of fixed assets | (5,002 | ) | (5,990 | ) | (10,791 | ) | ||||
Other investing activities | (2,848 | ) | (5,018 | ) | (12,289 | ) | ||||
| | | | | | | | | | | |
Cash provided by (used for) investing activities | 79,750 | 243,345 | (117,075 | ) | ||||||
Financing activities: | ||||||||||
Net proceeds from issuance of common and preferred stock, net of tax effect | (994 | ) | 370 | 5,870 | ||||||
Share retirement | (36,180 | ) | — | — | ||||||
Dividends paid to stockholders | (1,320 | ) | (141,371 | ) | (100,866 | ) | ||||
Principal payment on loan payable | — | (28,537 | ) | (18,016 | ) | |||||
Proceeds from the issuance of loan payable | — | — | 150,000 | |||||||
Payment of debt issue costs | — | (460 | ) | (5,772 | ) | |||||
| | | | | | | | | | | |
Cash (used for) provided by financing activities | (38,494 | ) | (169,998 | ) | 31,216 | |||||
| | | | | | | | | | | |
Net increase (decrease) in cash and cash equivalents | 58,411 | 9,795 | (3,760 | ) | ||||||
Cash and cash equivalents at beginning of year | 69,574 | 59,779 | 63,539 | |||||||
| | | | | | | | | | | |
Cash and cash equivalents at end of year | $ | 127,985 | $ | 69,574 | $ | 59,779 | ||||
| | | | | | | | | | | |
| | | | | | | | | | | |
| | | | | | | | | | | |
See notes to consolidated financial statements.
F-8
UNIVERSAL AMERICAN CORP. AND SUBSIDIARIES
NOTES TO CONSOLIDATED FINANCIAL STATEMENTS
1. ORGANIZATION AND COMPANY BACKGROUND
Except as otherwise indicated, references to the "Company," "Universal American," "we," "our," and "us" are to Universal American Corp., a Delaware corporation, and its subsidiaries.
Universal American is a specialty health and life insurance holding company with an emphasis on providing a broad array of health insurance and managed care products and services to people covered by Medicare and Medicaid. Collectively, our health plans and insurance company subsidiaries are licensed in all fifty states and in the District of Columbia and authorized to sell Medicare Advantage products, life, accident and health insurance and annuities and to provide comprehensive medical services through Medicaid.
Through our Medicare Advantage subsidiaries, we sell Medicare Coordinated Care Plan products, which we call HMOs, Medicare Coordinated Care products built around contracted networks of providers, which we call PPOs and Medicare Advantage private fee-for-service products, known as PFFS Plans. During 2014, we sold two of our non-core subsidiaries, Today's Options of Oklahoma, Inc., known as TOOK and SelectCare of Oklahoma, Inc., known as SCOK. For further discussion of this transaction, see Note 5—Business Combinations.
Our subsidiary, Collaborative Health Systems, LLC, also known as CHS, works with physicians and other healthcare professionals to operate Accountable Care Organizations, or ACOs, under the Medicare Shared Savings Program ("Shared Savings Program"). As of January 1, 2015 we had twenty-four active ACOs in ten states previously approved for participation in the program by the Centers for Medicare & Medicaid Services, known as CMS. Based on data provided by CMS, these twenty-four ACOs currently include approximately 3,800 participating providers with approximately 285,000 assigned Medicare fee-for-service beneficiaries, both within and outside our current Medicare Advantage footprint, including southeast Texas and upstate New York. CHS provides these ACOs with care coordination, analytics and reporting, technology and other administrative capabilities to enable participating providers to deliver better care and lower healthcare costs for their Medicare fee-for-service beneficiaries. During 2014, we reduced the number of our active ACOs based on a variety of factors, including the level of engagement by the physicians in the ACO and the likelihood of the ACO achieving shared savings. We may make further reductions in 2015. The Company provides funding to CHS to support the operating activities of CHS and the ACOs.
On December 1, 2013, we completed our acquisition of the assets of the Total Care Medicaid managed care plan, known as Total Care. Total Care is a Medicaid health plan in upstate New York, currently serving approximately 40,000 members in Syracuse and surrounding areas. For further discussion of this transaction, see Note 5—Business Combinations.
We discontinued marketing and selling Traditional insurance products, consisting of Medicare supplement products, fixed benefit accident and sickness insurance and senior life insurance after June 1, 2012. However, we continue to manage the block as the policies remain in force over the renewal period.
Our APS Healthcare subsidiaries provide specialty health services focused on behavioral health benefits, disease and condition management, and quality review and improvement services to government agencies, such as state Medicaid programs, commercial health plans, employers and unions. These services are provided on either an at-risk basis or an administrative services only basis. Behavioral health benefits are administered through APS Healthcare's provider network that consists of health care providers and facilities with which APS Healthcare directly or indirectly contracts to
F-9
UNIVERSAL AMERICAN CORP. AND SUBSIDIARIES
NOTES TO CONSOLIDATED FINANCIAL STATEMENTS (Continued)
1. ORGANIZATION AND COMPANY BACKGROUND (Continued)
provide the necessary treatment. APS Healthcare operates in the United States and Puerto Rico. On February 4, 2015, we completed the sale of our APS Healthcare Puerto Rico subsidiaries. For further discussion of this transaction, see Note 26—Subsequent Events.
2. BASIS OF PRESENTATION
We have prepared the accompanying Consolidated Financial Statements in conformity with U.S. generally accepted accounting principles, or U.S. GAAP, in accordance with Article 10 of the Securities and Exchange Commission's Regulation S-X, and consolidate the accounts of Universal American and its subsidiaries at December 31, 2014.
We have entered into agreements with various healthcare providers to establish ACOs. These ACOs were generally formed as Limited Liability Companies. We own a majority interest in our ACOs but do not consolidate them because we share the power to direct the activities of the ACOs that most significantly impact their performance. Our share of the income of an ACO is generally 50% and our share of losses of an ACO is generally 100%. In the event of losses, we have the right to receive 100% of subsequent profits until our losses are recovered. Any remaining revenue are generally shared at 50%.
The ACOs are considered variable interest entities, known as VIEs, under U.S. GAAP as these entities do not have sufficient equity to finance their own operations without additional financial support. We assess our contractual, ownership or other interests in a VIE to determine if our interest participates in the variability the VIE was designed to absorb and pass onto variable interest holders. We perform an ongoing qualitative assessment of our variable interests in VIEs to determine whether we have a controlling financial interest and would therefore be considered the primary beneficiary of the VIE. The power to direct the activities of the ACOs that most significantly impact their performance is shared between us and the healthcare providers that we have joined with to establish the ACOs pursuant to the structure of the Management Committee of each of the ACOs. Accordingly, we have determined that we are not the primary beneficiary of the ACOs, and therefore we cannot consolidate them. We account for our participation in the ACOs using the equity method. Gains and losses from our participation in the ACOs are reported as equity in losses of unconsolidated subsidiaries in the consolidated statements of operations. Our net investment in the ACOs is reported in other assets in the consolidated balance sheets.
For our insurance and health plan subsidiaries, U.S. GAAP differs from statutory accounting practices prescribed or permitted by regulatory authorities.
We have eliminated all material intercompany transactions and balances.
Subsequent events were evaluated through the date these consolidated financial statements were issued.
Use of Estimates: The preparation of our financial statements in conformity with U.S. GAAP requires us to make estimates and assumptions that affect the amounts reported by us in our Consolidated Financial Statements and the accompanying Notes. Critical accounting policies require significant subjective or complex judgments, often as a result of the need to make estimates about the effect of matters that are inherently uncertain. These estimates are based on information available at the time the estimates are made, as well as anticipated future events. Actual results could differ
F-10
UNIVERSAL AMERICAN CORP. AND SUBSIDIARIES
NOTES TO CONSOLIDATED FINANCIAL STATEMENTS (Continued)
2. BASIS OF PRESENTATION (Continued)
materially from these estimates. We periodically evaluate our estimates, and as additional information becomes available or actual amounts become determinable, we may revise the recorded estimates and reflect the revisions in our operating results. In our judgment, the accounts involving estimates and assumptions that are most critical to the preparation of our financial statements are policy related liabilities and expense recognition, deferred policy acquisition costs, goodwill and other intangible assets, investment valuation, revenue recognition, and income taxes. There have been no changes in our critical accounting policies during 2014.
Reclassifications: Beginning in 2014, in connection with the reporting of minimum medical loss ratios under the Affordable Care Act, we are reporting the costs of quality improvement initiatives in claims and other benefits in the consolidated statements of operations. Historically, these costs were reported in other operating costs and expenses. To maintain consistency with the new reporting classification, for the years ended December 31, 2013 and 2012, we have reclassified quality improvement initiative costs of $28.4 million and $27.3 million, respectively, from other operating costs and expenses to claims and other benefits in our consolidated statements of operations.
3. SUMMARY OF SIGNIFICANT ACCOUNTING POLICIES
Cash Equivalents: We consider all highly liquid investments that have maturities of three months or less at the date of purchase to be cash equivalents. Cash equivalents include such items as certificates of deposit, commercial paper, and money market funds.
Investments: The Company follows Accounting Standards Codification No. 320,Investments—Debt and Equity Securities, known as ASC 320. ASC 320 requires that debt and equity securities be classified into one of three categories and accounted for as follows:
- •
- Debt securities that we have the positive intent and the ability to hold to maturity are classified as "held to maturity" and reported at amortized cost;
- •
- Debt and equity securities that are held for current resale are classified as "trading securities" and reported at fair value, with unrealized gains and losses included in earnings; and
- •
- Debt and equity securities not classified as held to maturity or as trading securities are classified as "available for sale" and reported at fair value.
Unrealized gains and losses on available for sale securities are excluded from earnings and reported as accumulated other comprehensive income, unless the losses are determined to be other-than-temporary. This is reported net of tax, and the effect on long-term claim reserves and deferred policy acquisition costs in accordance with ASC 320-10-S99-2.
As of December 31, 2014 and 2013, we classified all fixed maturity securities as available for sale and carried them at fair value, with the unrealized gain or loss, net of tax, included in accumulated other comprehensive income. We carry short-term investments at cost, which approximates fair value. Other invested assets consist principally of cost-basis equity investments, equity securities, policy loans, mortgage loans and collateral loans. We carry cost-basis equity investments at the lower of cost or fair value and equity securities at fair value. We carry policy loans and mortgage loans at the unpaid principal balance. We carry collateral loans at the underlying value of their collateral which is the cash surrender value of life insurance.
F-11
UNIVERSAL AMERICAN CORP. AND SUBSIDIARIES
NOTES TO CONSOLIDATED FINANCIAL STATEMENTS (Continued)
3. SUMMARY OF SIGNIFICANT ACCOUNTING POLICIES (Continued)
The fair value for fixed maturity securities is largely determined by third party pricing services. The typical inputs that third party pricing services use are
- •
- reported trades;
- •
- benchmark yields;
- •
- issuer spreads;
- •
- bids;
- •
- offers; and
- •
- estimated cash flows and prepayment speeds.
Based on the typical trading volumes and the lack of quoted market prices for fixed maturities, third party pricing services will normally derive the security prices through recent reported trades for identical or similar securities making adjustments through the reporting date based upon available market observable information as outlined above. If there are no recent reported trades, the third party pricing services may use matrix or model processes to develop a security price where they develop future cash flow expectations based upon collateral performance and discount this at an estimated market rate. Included in the pricing for mortgage-backed and asset-backed securities are estimates of the rate of future prepayments of principal over the remaining life of the securities. Such estimates are derived based on the characteristics of the underlying structure and prepayment speeds previously experienced at the interest rate levels projected for the underlying collateral. Actual prepayment experience may vary from these estimates.
We regularly evaluate the amortized cost of our investments compared to the fair value of those investments. We generally recognize impairments of securities when we consider a decline in fair value below the amortized cost basis to be other-than-temporary. The evaluation includes the intent and ability to hold the security to recovery, and it is considered on an individual security basis, not on a portfolio basis. We generally recognize impairment losses for mortgage-backed and asset-backed securities when an adverse change in the amount or timing of estimated cash flows occurs, unless the adverse change is solely a result of changes in estimated market interest rates. We also recognize impairment losses when we determine declines in fair values based on quoted prices to be other-than-temporary.
The evaluation of impairment is a quantitative and qualitative process which is subject to risks and uncertainties and is intended to determine whether we should recognize declines in the fair value of investments in current period earnings. The principal risks and uncertainties are:
- •
- changes in general economic conditions;
- •
- the issuer's financial condition or near term recovery prospects;
- •
- the effects of changes in interest rates or credit spreads; and
- •
- the recovery period.
F-12
UNIVERSAL AMERICAN CORP. AND SUBSIDIARIES
NOTES TO CONSOLIDATED FINANCIAL STATEMENTS (Continued)
3. SUMMARY OF SIGNIFICANT ACCOUNTING POLICIES (Continued)
Our accounting policy, which follows ASC 320-10-65-1, requires that we assess a decline in the value of a security below its cost or amortized cost basis to determine if the decline is other-than-temporary.
- •
- If we intend to sell a debt security, or it is more likely than not that we will be required to sell the debt security before recovery of its amortized cost basis, we recognize an other-than-temporary-impairment, or OTTI, in earnings equal to the entire difference between the debt security's amortized cost basis and its fair value.
- •
- If we do not intend to sell the debt security and it is not more likely than not that we will be required to sell the debt security before recovery of its amortized cost basis, but the present value of the cash flows expected to be collected is less than the amortized cost basis of the debt security (referred to as the credit loss), an OTTI is considered to have occurred. In this instance, we bifurcate the total OTTI into the amount related to the credit loss, which we recognize in earnings, with the remaining amount of the total OTTI attributed to other factors (referred to as the noncredit portion) recognized as a separate component in other comprehensive income.
After the recognition of an OTTI, we account for the debt security as if it had been purchased on the measurement date of the OTTI, with an amortized cost basis equal to the previous amortized cost basis less the OTTI recognized in earnings.
We have a security monitoring process overseen by our Investment Committee, consisting of investment and accounting professionals who identify securities that, due to specified characteristics, as described below, we subject to an enhanced analysis on a quarterly basis. We review our fixed maturity securities at least quarterly to determine if an other-than-temporary impairment is present based on specified quantitative and qualitative factors. The primary factors that we consider in evaluating whether a decline in value is other-than-temporary are:
- •
- the length of time and the extent to which the fair value has been or is expected to be less than cost or amortized cost;
- •
- the financial condition, credit rating and near-term prospects of the issuer;
- •
- whether the debtor is current on contractually obligated interest and principal payments; and
- •
- our intent and ability to retain the investment for a period of time sufficient to allow for recovery.
Each quarter, during this analysis, we assert our intent and ability to retain until recovery those securities we judge to be temporarily impaired. Once identified, we restrict trading on these securities unless subsequent information becomes available which would then alter our intent or ability to hold. The principal criteria are the deterioration in the issuer's creditworthiness, a change in regulatory requirements or a major business combination or major disposition.
Realized investment gains and losses on the sale of securities are based on the specific identification method.
We generally record investment income when earned. We amortize premiums and discounts arising from the purchase of mortgage-backed and asset-backed securities into investment income over the estimated remaining term of the securities, adjusted for anticipated prepayments. We use the prospective method to account for the impact on investment income of changes in the estimated future
F-13
UNIVERSAL AMERICAN CORP. AND SUBSIDIARIES
NOTES TO CONSOLIDATED FINANCIAL STATEMENTS (Continued)
3. SUMMARY OF SIGNIFICANT ACCOUNTING POLICIES (Continued)
cash flows for these securities. We amortize premiums and discounts on other fixed maturity securities using the interest method over the remaining term of the security.
Interest Rate Swaps: Interest rate swaps involve the periodic exchange of cash flows with other parties, at specified intervals, calculated using agreed upon rates and notional principal amounts. We use interest rate swaps from time to time as part of our overall risk management strategy to efficiently reduce the duration, or sensitivity, of our fixed maturity investment portfolio fair value to a rise in interest rates. We terminated all outstanding interest rate swaps during 2013 and had no outstanding interest rate swaps at December 31, 2014, however, we may use interest rate swaps in the future.
Our swaps are designated as held for managing asset-related risks that do not qualify for hedge treatment. Because the swaps do not meet the criteria for hedge accounting, gains or losses resulting from changes in fair value are recognized currently in earnings. Their fair value is based on the present value of expected net cash flows as determined by the contract rate and the LIBOR forward rate curve on the valuation date. As a component of managing overall interest rate risk, such gains and losses are most appropriately considered in the context of changes in the unrealized gains and losses on the fixed maturity portfolio. The swaps are recorded at fair value in other assets in our consolidated balance sheets.
Deferred Policy Acquisition Costs: In accordance with ASU 2010-26, we defer costs that are directly related to the successful acquisition or renewal of insurance contracts including the following
- •
- incremental direct costs of a successful contract acquisition, such as non-level commissions;
- •
- portions of employee salaries and benefits directly related to time spent performing specified acquisition activities for a contract that has been acquired;
- •
- other costs directly related to the specified acquisition activities that would not have been incurred had that contract acquisition transaction not occurred; and
- •
- advertising costs meeting the capitalization criteria for direct- response advertising.
The determination of deferability must be made on a contract-level basis. We refer to these costs as deferred acquisition costs or DAC.
For our net retained traditional life and health products, we amortize DAC in proportion to premium revenue using the same assumptions used in estimating the liabilities for future policy benefits in accordance with ASC 944,Financial Services—Insurance. Under ASC 944, any unamortized DAC relating to lapsed policies must be amortized as of the date of the lapse.
We test for the recoverability of DAC at least annually. To the extent that we determine that the present value of future policy premiums would not be adequate to recover the unamortized costs, we would write off the excess deferred policy acquisition costs. Based on our annual tests, we determined that DAC was recoverable at December 31, 2014 and 2013.
Goodwill and other intangible assets:
Goodwill: Goodwill represents the amount of the purchase price in excess of the fair values assigned to the underlying identifiable net assets of acquired businesses. Goodwill is not amortized, but is subject to an annual impairment test. ASC 350,Goodwill and Other Intangible Assets, requires that
F-14
UNIVERSAL AMERICAN CORP. AND SUBSIDIARIES
NOTES TO CONSOLIDATED FINANCIAL STATEMENTS (Continued)
3. SUMMARY OF SIGNIFICANT ACCOUNTING POLICIES (Continued)
goodwill balances be reviewed for impairment at the reporting unit level at least annually or more frequently if events occur or circumstances change that would indicate that a triggering event, as defined in ASC 350, has occurred. A reporting unit is defined as an operating segment or one level below an operating segment. Our reporting units are equivalent to our operating segments. We have goodwill assigned to Medicare Advantage and APS Healthcare reporting units. The goodwill related to the acquisition of APS Healthcare was included in our Corporate & Other segment prior to being written off in 2013.
We test goodwill for impairment annually, as of October 1 of the current year, or more frequently if circumstances suggest that impairment may exist. During each quarter, we perform a review of certain key components of our valuation of our reporting units, including the operating performance of the reporting units compared to plan (which is the primary basis for the prospective financial information included in our annual goodwill impairment test), our weighted average cost of capital and our stock price and market capitalization.
We estimate the fair values of our reporting units using discounted cash flows or other indications of fair value, which include assumptions about a wide variety of internal and external factors. Significant assumptions used in the impairment analysis include financial projections of cash flow (including significant assumptions about operations and target capital requirements), long term growth rates for determining terminal value, and discount rates. Forecasts and long term growth rates used for our reporting units are consistent with, and use inputs from, our internal long term business plan and strategy. During our forecasting process, we assess revenue trends, medical cost trends, operating cost levels and target capital levels. Significant factors affecting these trends include changes in membership, premium yield, medical cost trends, contract renewal expectations and the impact and expectations of regulatory environments.
Although we believe that the financial projections used are reasonable and appropriate, the use of different assumptions and estimates could materially impact the analysis and resulting conclusions. In addition, due to the long term nature of the forecasts there is significant uncertainty inherent in those projections. That uncertainty is increased by the impact of healthcare reforms as discussed in Item 1, "Business—Regulation." For additional discussions regarding how the enactment or implementation of healthcare reforms and how other factors could affect our business and the related long term forecasts, see Item 1A, "Risk Factors" in Part I of this Annual Report on Form 10-K.
We use a range of discount rates that correspond to a market-based weighted average cost of capital. Discount rates are determined for each reporting unit based on the implied risk inherent in their forecasts. This risk is evaluated using comparisons to market information such as peer company weighted average costs of capital and peer company stock prices in the form of revenue and earnings multiples. The most significant estimates in the discount rate determinations include the risk free rates and equity risk premium. Company specific adjustments to discount rates are subjective and thus are difficult to measure with certainty.
The passage of time and the availability of additional information regarding areas of uncertainty in regards to the reporting units' operations could cause these assumptions used in our analysis to change materially in the future. If our assumptions differ from actual, the estimates underlying our goodwill impairment tests could be adversely affected.
F-15
UNIVERSAL AMERICAN CORP. AND SUBSIDIARIES
NOTES TO CONSOLIDATED FINANCIAL STATEMENTS (Continued)
3. SUMMARY OF SIGNIFICANT ACCOUNTING POLICIES (Continued)
Future events that could have a negative impact on the levels of excess fair value over carrying value of our reporting units include, but are not limited to:
- •
- decreases in business growth;
- •
- the loss of significant contracts;
- •
- decreases in earnings projections;
- •
- increases in the weighted average cost of capital; and
- •
- increases in the amount of required capital for a reporting unit.
Negative changes in one or more of these factors, among others, could result in additional impairment charges.
To determine whether goodwill is impaired, we perform a multi-step impairment test. We perform a qualitative assessment of each reporting unit to determine whether facts and circumstances support a determination that their fair values are greater than their carrying values. If the qualitative analysis is not conclusive, or if we elect to proceed directly with quantitative testing, we will measure the fair values of the reporting units and compare them to their carrying values, including goodwill. If the fair value is less than the carrying value of the reporting unit, the second step of the impairment test is performed for the purposes of measuring the impairment. In this step, the fair value of the reporting unit is allocated to all of the assets and liabilities of the reporting unit to determine an implied goodwill value. This allocation is similar to a purchase price allocation performed in purchase accounting. If the carrying amount of the reporting unit goodwill exceeds the implied goodwill value, an impairment loss shall be recognized in an amount equal to that excess.
During the quarter ended June 30, 2013, certain events occurred and circumstances changed which indicated that it was more likely than not that goodwill for APS Healthcare was impaired. Additional events occurred and circumstances further changed during the quarter ended December 31, 2013 which indicated that it was more likely than not that goodwill for APS Healthcare was further impaired. See Note 8—Goodwill and Other Intangible Assets for additional information.
Valuation of acquired intangible assets: Business combinations accounted for as a purchase result in the allocation of the purchase consideration to the fair values of the assets and liabilities acquired, including the present value of future profits and other identified intangibles, establishing these fair values as the new accounting basis. We base the fair values on an estimate of the cash flows of the identified intangible, discounted to reflect the present value of those cash flows. The discount rate we select depends upon the general market conditions at the time of the acquisition and the inherent risk in the transaction. We allocate purchase consideration in excess of the fair value of net assets acquired, including the present value of future profits and other identified intangibles, for a specific acquisition, to goodwill. We perform the allocation of purchase price in the period in which we consummate the purchase.
Amortizing intangible assets: We must estimate and make assumptions regarding the useful life we assign to our amortizing intangible assets. Set forth below are our annual amortization policies for each
F-16
UNIVERSAL AMERICAN CORP. AND SUBSIDIARIES
NOTES TO CONSOLIDATED FINANCIAL STATEMENTS (Continued)
3. SUMMARY OF SIGNIFICANT ACCOUNTING POLICIES (Continued)
of the main categories of amortizing intangible assets which have an unamortized balance at December 31, 2014:
Description | Weighted Average Life (Years) | Amortization Basis | ||
|---|---|---|---|---|
| Insurance policies acquired | 9 | The pattern of projected future cash flows for the policies acquired over the estimated weighted average life of the policies acquired | ||
| Provider contracts | 4 - 10 | Straight line over the estimated weighted average life of the contracts | ||
| Customers/membership acquired | 4 - 8 | Straight line over the estimated weighted average life of membership | ||
| Software platform | 4 | Straight line over the estimated life of the software | ||
| Trademarks/tradenames | 4.5 | Straight line over the estimated weighted average life of the trademarks/tradenames |
In accordance with ASC 350,Intangibles—Goodwill and Other, we periodically review amortizing intangible assets whenever adverse events or changes in circumstances indicate the carrying value of the asset may not be recoverable. In assessing recoverability, we must make assumptions regarding estimated future cash flows and other factors to determine if an impairment loss may exist, and, if so, estimate fair value. If these estimates or their related assumptions change in the future, we may be required to record impairment losses for these assets.
During our review of recoverability of amortizing intangible assets in the fourth quarter of 2013, we determined that undiscounted cash flows from our APS Healthcare reporting unit were less than the carrying value of our related APS Healthcare amortizing intangible assets, indicating that they were no longer fully recoverable and recorded an impairment. There were no other impairments of our amortizing intangible assets during 2014, 2013 or 2012. See additional discussion at Note 8—Goodwill and Other Intangible Assets.
Medicare Overview: Medicare is a federal health insurance program that provides Americans age 65 and over, and some disabled persons under the age of 65, certain hospital, medical and prescription drug benefits. The Medicare program consists of four parts, labeled Parts A - D.
Part A—Hospitalization benefits are provided under Part A. These benefits are financed largely through Social Security taxes. Members are not required to pay any premium for Part A benefits. However, they are still required to pay out-of-pocket deductibles and coinsurance.
Part B—Benefits for medically necessary services and supplies including outpatient care, doctor's services, physical or occupational therapists and additional home health care are provided under Part B. These benefits are financed through premiums paid to the federal government by those eligible members who choose to enroll in the program. The members are also required to pay out-of-pocket deductibles and coinsurance.
Part C—Under the Medicare Advantage program, private plans provide Medicare-covered health care benefits to enrollees and can include prescription drug coverage. Part C benefits are provided
F-17
UNIVERSAL AMERICAN CORP. AND SUBSIDIARIES
NOTES TO CONSOLIDATED FINANCIAL STATEMENTS (Continued)
3. SUMMARY OF SIGNIFICANT ACCOUNTING POLICIES (Continued)
through private HMO, PPO and PFFS plans. An individual must have Medicare Part A and Part B in order to join a Medicare Advantage Plan.
Part D—Under Part D, prescription drug benefits may be provided by private plans to individuals eligible for benefits under Part A and/or enrolled in Part B. These benefits are provided on both a stand-alone basis and also in connection with certain HMO, PPO and PFFS plans.
These programs are administered by CMS. These benefits are provided through HMO, PPO, PFFS and stand-alone Part D Plans in exchange for contractual risk-adjusted payments received from CMS. We contract with CMS under the Medicare program to provide a comprehensive array of health insurance and prescription drug benefits to Medicare eligible persons through our Medicare Advantage plans.
Premiums received pursuant to Medicare contracts with CMS are recorded as revenue in the month in which members are entitled to receive benefits. Premiums collected in advance are deferred. Receivables from CMS and Plan members are recorded net of estimated uncollectible amounts and are reported as due and unpaid premiums in the consolidated balance sheets. We routinely monitor the collectability of specific accounts, the aging of member premium receivables, historical retroactivity trends and prevailing and anticipated economic conditions.
Policy and contract claims include actual claims reported but not paid and estimates of health care services and prescription drug claims incurred but not reported. The estimated claims incurred but not reported are based upon current enrollment, historical claim receipt and payment patterns, historical medical cost trends and health service utilization statistics. These estimates and assumptions are derived from and are continually evaluated using per member per month trend analysis, claims trends developed from our historical experience in the preceding month (adjusted for known changes in estimates of recent hospital and drug utilization data), provider contracting changes, benefit level changes, product mix and seasonality. These estimates are based on information available at the time the estimates are made, as well as anticipated future events. Actual results could differ materially from these estimates. We periodically evaluate our estimates, and as additional information becomes available or actual amounts become determinable, we may revise the recorded estimates and reflect them in operating results.
Membership—We analyze the membership for our Medicare HMO, PPO and Network PFFS Plans (collectively, the "Plans") in our administrative system and reconcile to the enrollment provided by CMS. There are timing differences between the addition of a member to our administrative system and the approval, or accretion, of the member by CMS. Additionally, the monthly payments from CMS include adjustments to reflect changes in the status of membership as a result of retroactive terminations, additions, whether CMS is secondary to other insurance coverage or other changes. Current period membership, net premium, CMS subsidies and claims expense are adjusted to reflect retroactive changes in membership.
Medicare Risk Adjustment Provisions—CMS uses risk-adjusted rates per member to determine the monthly payments to Medicare Plans. CMS has implemented a risk adjustment model which apportions premiums paid to all health Plans according to health diagnoses. The risk adjustment model uses health status indicators, or risk scores, to improve the accuracy of payment. The CMS risk adjustment model pays more for members with increasing health severity. Under this risk adjustment methodology, diagnosis data from inpatient and ambulatory treatment settings are used by CMS to calculate the risk
F-18
UNIVERSAL AMERICAN CORP. AND SUBSIDIARIES
NOTES TO CONSOLIDATED FINANCIAL STATEMENTS (Continued)
3. SUMMARY OF SIGNIFICANT ACCOUNTING POLICIES (Continued)
adjusted premium payment to Medicare Plans. The monthly risk-adjusted premium per member is determined by CMS based on normalized risk scores of each member from the prior year. Annually, CMS provides the updated risk scores to the Plans and revises premium rates prospectively, beginning with the July remittance for current Plan year members. CMS will also calculate the retroactive adjustments to premium related to the revised risk scores for the current year for current Plan year members and for the prior year for prior Plan year members.
Recognition of Premium Revenues and Policy Benefits—Medicare Plans—We receive monthly payments from CMS related to members in our Medicare coordinated care Plans. The recognition of the premium and cost reimbursement components under these Plans is described below:
CMS Direct Premium Subsidy—We receive a monthly premium from CMS based on the Plan year bid we submitted to CMS. The monthly payment is a risk-adjusted amount per member and is based upon the member's risk score status, as determined by CMS. The CMS premium is recognized over the contract period and reported as premium revenue. In addition, under Medicare Secondary Payer, or MSP provisions, the premium will be reduced by CMS if CMS has determined that it is secondary to other insurance coverage. Star rating quality bonus revenues are included in the CMS Direct Premium subsidy which is reported as premium revenue and recognized over the contract period.
Revenue Adjustments—The monthly CMS Direct Premium Subsidy is based upon the members' health status, which is determined by CMS, as more fully described above under "Medicare Risk Adjustment Provisions." All health benefit organizations that contract with CMS must capture, collect, and submit the necessary diagnosis code information to CMS within prescribed deadlines. Accordingly, we collect, capture, and submit the necessary and available diagnosis data to CMS within prescribed deadlines for our Plans. We estimate changes in CMS premiums related to revenue adjustments based upon the diagnosis data submitted to CMS and ultimately accepted by CMS. Risk scores are updated annually by CMS and reconciled to our estimated amounts by us with any adjustments recorded in premium revenue. Although such adjustments have not been considered to be material in the past, future adjustments could be material.
Member Premium—On plans that have a member premium component, we bill a monthly premium to members based on the Plan year bid we submitted to CMS. The member premium, which is fixed for the entire Plan year, is recognized over the contract period and reported as premium revenue. We establish a reserve for member premium that is past due that reflects our estimate of the collectability of the member premium.
Low-Income Premium Subsidy—For qualifying low-income status, or LIS, members of our Plans with Part D benefits, CMS pays us for some or all of the LIS member's monthly pharmacy benefit premium. The CMS payment is dependent upon a member's income level which is determined by the Social Security Administration. Low-income premium is recognized over the contract period and reported as premium revenue.
Low-Income Cost Sharing Subsidy—For qualifying LIS members of our Plans with Part D benefits, CMS will reimburse the Plans for all or a portion of the LIS member's deductible, coinsurance and co-payment amounts for pharmacy benefits above the out of pocket threshold for low income beneficiaries. Low-income cost sharing subsidies are paid by CMS prospectively as a fixed amount per member per month, and are determined based upon the Plan year bid we submitted to CMS. After the
F-19
UNIVERSAL AMERICAN CORP. AND SUBSIDIARIES
NOTES TO CONSOLIDATED FINANCIAL STATEMENTS (Continued)
3. SUMMARY OF SIGNIFICANT ACCOUNTING POLICIES (Continued)
close of the annual Plan year, CMS reconciles actual experience to low-income cost sharing subsidies paid to the Plan and any differences are settled between CMS and the Plan. The low-income subsidy is accounted for as deposit accounting and therefore not recognized in operations.
Coverage Gap Discount Program—We receive advance payments from CMS as subsidies for members of our Plans with Part D coverage who reach the coverage gap. The Medicare Coverage Gap Discount Program, or CGDP, makes manufacturer discounts available to eligible Medicare beneficiaries receiving applicable covered Part D drugs while in the coverage gap. In general, the discount on each applicable covered Part D drug is fifty percent of an amount equal to the negotiated price. Members will continue to receive these discounts and they will grow until the coverage gap is closed in 2020.
CGDP subsidies are paid by CMS as a fixed amount per member per month, and are determined based upon the Plan year bid we submitted to CMS. The subsidies made to Part D sponsors will be taken back equal to the amount of discounts invoiced to manufacturers. Manufacturers must pay the invoiced amounts to Part D sponsors within 15 days of receipt of invoice from CMS to offset the recouped amounts by CMS.
After the close of the annual Plan year, CMS reconciles the discount program subsidy payments to the cost based on the actual manufacturer discounts amounts made available to each Part D Plan's enrollees under the Discount Program. The CGDP subsidy is accounted for as deposit accounting and therefore not recognized in operations.
Catastrophic Reinsurance—We receive payments from CMS for catastrophic reinsurance for members of our Plans with Part D benefits.
For the members of our HMO and PPO Plans with Part D benefits, CMS reimburses Plans for 80% of the drug costs after a member reaches his or her out of pocket catastrophic threshold through a catastrophic reinsurance subsidy. Catastrophic reinsurance subsidies are paid by CMS prospectively as a fixed amount per member per month, and are determined based upon the Plan year bid we submitted to CMS. After the close of the annual Plan year, CMS reconciles actual experience compared to catastrophic reinsurance subsidies paid to the Plan and any differences are settled between CMS and the Plan. The catastrophic reinsurance subsidy is accounted for as deposit accounting and therefore not recognized in operations.
For members of our PFFS Plans with Part D benefits, CMS makes prospective monthly catastrophic reinsurance payments to the Plans based on estimated average reinsurance payments to other Medicare Advantage—Prescription Drug (MA-PD) Plans that provide Part D benefits. Based upon the current guidelines from CMS, these Plans are at risk for the variance between their actual expense and the CMS payments. As a result, we do not follow deposit accounting for these payments.
CMS Risk Corridor Provisions for the Part D benefits of our HMO and PPO Plans —Premiums from CMS for members of our HMO and PPO Plans with Part D benefits are subject to risk corridor provisions. The CMS risk corridor calculation compares the target amount of prescription drug costs (limited to costs under the standard coverage as defined by CMS) less rebates in our annual Plan bid (target amount) to actual experience. Variances of more than 5% above the target amount will result in CMS making additional payments to us, and variances of more than 5% below the target amount will require us to refund a portion of the premiums we received to CMS. Risk corridor payments due to or from CMS are estimated throughout the year and are recognized as adjustments to premium revenues
F-20
UNIVERSAL AMERICAN CORP. AND SUBSIDIARIES
NOTES TO CONSOLIDATED FINANCIAL STATEMENTS (Continued)
3. SUMMARY OF SIGNIFICANT ACCOUNTING POLICIES (Continued)
and due and unpaid premiums. This estimate requires us to consider factors that may not be certain, including: membership, risk scores, prescription drug events, or PDEs, and rebates. After the close of the annual Plan year, CMS reconciles actual experience to the target amount and any differences are settled between CMS and the Plan.
Stipulated minimum MLRs—Beginning in 2014, The Patient Protection and Affordable Care Act, or ACA, stipulates a minimum medical loss ratio, or MLR, of 85% for Medicare Advantage plans. This MLR takes into account benefit costs, quality initiative expenses, the ACA fee and taxes. Financial and other penalties may result from failing to achieve the minimum MLR ratio. For the year ended December 31, 2014 our Medicare Advantage plans exceeded the minimum MLR, as defined by CMS.
Recognition of Premium Revenues and Policy Benefits for our Medicaid Business: Through Today's Options of New York, Inc., known as TONY, beginning in December 2013, we provide comprehensive health services to certain counties in upstate New York, under the name "Total Care." TONY serves an enrolled population comprised primarily of members of the Medical Assistance Program, known as Medicaid, and also participates in Child Health Plus and, through December 31, 2014, Family Health Plus programs for low-income, uninsured children and adults. We receive monthly premium on a per member basis for each month of a member's term of enrollment that is recognized as earned in the month to which it applies. The premium is calculated using actuarially predetermined premium groups based upon the age, sex and aid category of the member. Premium rates are subject to revision under the provision of the New York State regulation. Adjustments for such revisions are recognized in the fiscal year incurred. With respect to the Medicaid program, Medicaid-eligible persons living in the counties of operation can enroll in TONY. Medicaid and Family Health Plus eligibility is determined by agreement between the individual county's Department of Social Services and the New York State Department of Health. Premiums earned reflect the sum of monthly premium bills submitted by TONY to the New York State Department of Health for eligible enrollees. TONY may also enroll individuals eligible for Child Health Plus and receive monthly premiums for each enrollee.
TONY contracts with various hospitals, physicians, allied and ancillary providers of service and health centers for the provision of certain medical care services to its members. TONY compensates these providers on a fee- for-service or capitation basis for covered services. All amounts incurred by TONY under the aforementioned contracts are reported in claims and other benefits in our consolidated statements of operations. Estimates of payments to be made on claims reported and estimates of healthcare services rendered but not reported to us are included in policy and contract claims—health in our consolidated balance sheets. We initially establish these reserves based on past experience, and they are continuously reviewed and updated with any related adjustments recorded to current operations.
Recognition of Premium Revenues and Policy Benefits for our Traditional Accident & Health Insurance Products: Our traditional accident and health products include Medicare supplement, fixed benefit accident and sickness and other health, and long-term care products. These products are considered to be long-duration contracts in accordance with ASC 944-40,Financial Services—Insurance—Claim Costs and Liabilities for Future Policy Benefits, because they are largely guaranteed renewable (renewable at the option of the insured). For these products, we record premiums as revenue over the premium-paying periods of the contracts when due from policyholders. We recognize benefits and expenses associated with these policies over the current and anticipated renewal periods of the policies so as to result in recognition of profits over the life of the policies. We accomplish this association by recording a provision for future policy benefits and amortizing deferred policy acquisition costs.
F-21
UNIVERSAL AMERICAN CORP. AND SUBSIDIARIES
NOTES TO CONSOLIDATED FINANCIAL STATEMENTS (Continued)
3. SUMMARY OF SIGNIFICANT ACCOUNTING POLICIES (Continued)
The liability for future policy benefits for accident & health policies consists of active life reserves and the estimated present value of the remaining ultimate net cost of incurred claims. Active life reserves consist primarily of unearned premiums and additional contract reserves. At policy issuance, additional contract reserves are recognized on a net level premium method based on interest rates, mortality, morbidity, and maintenance expense assumptions. Interest rates are based on our expected net investment returns on the investment portfolio supporting the reserves for these blocks of business. Mortality, a measure of expected death, and morbidity, a measure of health status, assumptions are based on published actuarial tables, modified based upon actual experience. The assumptions used to determine the liability for future policy benefits are established and locked in at the time each contract is issued and only change if our expected future experience deteriorates to the point that the level of the liability, together with the present value of future gross premiums, are not adequate to provide for future expected policy benefits and maintenance costs (i.e. the loss recognition date).
We establish claim reserves for future payments not yet due on incurred claims, primarily relating to individual disability and long-term care insurance and group long-term disability insurance products. We initially establish these reserves based on past experience, and they are continuously reviewed and updated with any related adjustments recorded to current operations. Claim liabilities represent policy benefits due for unpaid claims, consisting primarily of claims in the course of settlement and a liability for incurred but not yet reported claims, known as IBNR.
There is a greater risk of significant variability in claims costs, either positive or negative for policies with long-term claim payout periods.
We perform loss recognition tests at least annually in the fourth quarter, and more frequently if adverse events or changes in circumstances indicate that the level of the liability, together with the present value of future gross premiums, may not be adequate to provide for future expected policy benefits and maintenance costs.
Our accounting for premium revenues and policy benefits, particularly a) the recognition of benefits and expenses associated with earned premiums as the related premiums are earned and b) the recording a liability for future policy benefits consisting of active life reserves and the estimated present value of the remaining ultimate net cost of incurred claims is as follows:
- •
- Premiums are recognized as revenue, net of reinsurance, over the period to which they relate. While these products are long-duration, they are typically one-year policies that are guaranteed renewable at the option of the insured. Therefore the annual premium is recorded as revenue over the policy period (one year), with any premium paid in advance recorded as a liability. Premiums due and unpaid are recorded as an asset. Changes in advance and due and unpaid premium, net of reinsurance, are reported in the net premium and policyholder fees earned line in our consolidated statements of operations.
- •
- Claims liabilities are accrued when events occur, including (i) claims in the course of settlement and (ii) incurred but not yet reported claims. The change in the claim liability, net of reinsurance, is reported in the claims and other benefits line in our consolidated statements of operations.
- •
- Active life reserves, or ALR, are established, consisting primarily of unearned premiums and additional contract reserves computed on the net level premium method. Additionally, claim reserves are established for the present value of future payments not yet due on incurred claims,
F-22
UNIVERSAL AMERICAN CORP. AND SUBSIDIARIES
NOTES TO CONSOLIDATED FINANCIAL STATEMENTS (Continued)
3. SUMMARY OF SIGNIFICANT ACCOUNTING POLICIES (Continued)
- •
- Expenses eligible for capitalization as deferred policy acquisition costs, such as commissions in excess of the ultimate commission and underwriting costs for successful contract acquisitions, are capitalized and amortized over the anticipated life of the policy.
or PVANYD. Changes in the ALR and the PVANYD, net of reinsurance, are reported in the claims and other benefits line in our consolidated statements of operations.
Recognition of Premium Revenues and Policy Benefits for Life Insurance Products: We have reinsured substantially all of our in- force life insurance and annuity business to the Commonwealth Annuity and Life Insurance Company, known as Commonwealth, and the First Allmerica Financial Life Insurance Company. This arrangement is discussed in more detail in Note 10—Reinsurance. This business is reinsured on a 100% quota share basis. The annuity portion of this reinsurance transaction was subsequently commuted with Commonwealth and reinsured with Athene Re, Ltd. We no longer sell these products. Revenues and benefits are reported net of amounts ceded, and therefore have no effect on our consolidated statements of operations; however, the reinsurance transaction resulted in a gain that was deferred and is being amortized over the estimated remaining life of the ceded business.
We have not been relieved of our legal liabilities on the policies reinsured therefore, ASC 944-20, Financial Services—Insurance—Insurance Activities, requires that we continue to report the liabilities on these policies during the run-off period of the underlying life insurance and annuity business. We also report a corresponding reinsurance recoverable from Commonwealth as an asset on our consolidated balance sheets. We determine the liability for policyholder account balances for universal life-type policies and investment products under ASC 944-20 following a "retrospective deposit" method. The retrospective deposit method establishes a liability for policy benefits at an amount determined by the account or contract balance that accrues to the benefit of the policyholder, which consists principally of policy account values before any applicable surrender charges. The liability for future policy benefits represents the present value of future benefits to be paid to or on behalf of policyholders, less the future value of net premiums and we calculate it based on actuarially recognized methods using morbidity and mortality tables, which we modify to reflect our actual experience when appropriate. The liability for unpaid claims, including IBNR, reflects estimates of amounts to fully settle known reported claims related to insured events that we estimate have occurred, but have not yet been reported to us.
The life business we retained is low face amount, simplified issue whole life business. We generally recognize premiums from these life policies as revenue when due, net of amounts ceded. We match benefits and expenses with this revenue so as to result in the recognition of profits over the life of the contracts. We accomplish this matching by recording a provision for future policy benefits and the deferral and subsequent amortization of policy acquisition costs. The liability for future policy benefits represents the present value of future benefits to be paid to or on behalf of policyholders, less the future value of net premiums and we calculate it based on actuarially recognized methods using morbidity and mortality tables, which we modify to reflect our actual experience when appropriate. The liability for unpaid claims, including IBNR, reflects estimates of amounts to fully settle known reported claims related to insured events that we estimate have occurred, but have not yet been reported to us.
Recognition of Revenues—APS Healthcare: Our APS Healthcare subsidiary provides specialty health services focused on behavioral health benefits, disease and condition management, and quality review and improvement. All of these services are designed to reduce health-related costs and enhance the health and quality of life of the members served. These services are provided to government agencies,
F-23
UNIVERSAL AMERICAN CORP. AND SUBSIDIARIES
NOTES TO CONSOLIDATED FINANCIAL STATEMENTS (Continued)
3. SUMMARY OF SIGNIFICANT ACCOUNTING POLICIES (Continued)
such as state Medicaid programs, commercial health plans, employers and unions. APS Healthcare provides these services on either an at-risk basis or an administrative services only, or ASO, basis.
On an at-risk basis, we participate in various capitation agreements with managed care organizations under which we assume all of the financial risk for mental health care services provided to the respective managed care organization's enrollees residing within a specified geographic area. Revenue for these services is recognized in the period in which the enrollees are entitled to receive such benefits, based on a fixed per member per month fee. Revenue related to such services is recorded as net premium and policyholder fees earned in the consolidated statements of operations. APS Healthcare's contract with the Puerto Rico Medicaid agency to provide managed behavioral health and other services, accounted for a significant portion of APS Healthcare's total revenues. The contract was scheduled to terminate on June 30, 2014, but was extended, by mutual agreement, through March 31, 2015. On February 4, 2015 we completed the sale of our APS Healthcare Puerto Rico subsidiaries. For further discussion of this transaction, see Note 26—Subsequent Events.
We also participate in various ASO arrangements under which we agree to provide administrative and management services in return for a fixed fee per member per month or per year. Under these agreements, we report administrative revenue in the period the related services are performed, based on the eligible enrollees for the period. Revenue from these ASO services is recorded as fee and other income in the consolidated statements of operations.
Some of our contracts include performance-based terms that provide for the refund of a portion of our fees to the customer if our programs do not achieve a targeted percentage reduction in the customer's healthcare costs and / or improvement in selected clinical and/or other criteria that focus on improving the health of the members, when compared to a baseline year. We perform periodic evaluation of our exposure to such performance-based provisions and record our best estimate of such exposure as a liability and a reduction of revenue. At December 31, 2014, we carried $0.1 million of liabilities related to performance-based provisions included in other liabilities in the accompanying consolidated balance sheets. We anticipate that these liabilities will fluctuate due to the level of performance-based fees in new contracts, the level or extent to which performance-based metrics are utilized or attained and the timing of final data reconciliation, which varies according to contract terms.
Recognition of Revenues—Accountable Care Organizations: The Medicare Shared Savings Program, or MSSP, is relatively new and therefore has limited historical experience. This impacts our ability to accurately accumulate and interpret the data available for calculating the ACOs' shared savings. Therefore, we were not able to recognize revenue for the year ended December 31, 2013 until we received the final settlement results from CMS in September 2014. Similarly, we were not able to recognize revenue for the year ended December 31, 2014 in the 2014 financial statements. We expect that revenue, if any, for the program year ended December 31, 2014 will be reported in 2015 when the MSSP revenue is either known or estimable with reasonable certainty. Based on the ACO operating agreements, we bear all costs of the ACO operations until revenue is recognized. At that point, we share in up to 100% of the revenue to recover our costs incurred. Any remaining revenue is generally shared equally with our ACO provider partners.
Affordable Care Act Fee: The Patient Protection and Affordable Care Act as amended by the Health Care and Education Reconciliation Act (the Acts) imposes an annual fee on health insurers (the "ACA fee") for each calendar year beginning on or after January 1, 2014. A health insurer's
F-24
UNIVERSAL AMERICAN CORP. AND SUBSIDIARIES
NOTES TO CONSOLIDATED FINANCIAL STATEMENTS (Continued)
3. SUMMARY OF SIGNIFICANT ACCOUNTING POLICIES (Continued)
portion of the annual fee is payable no later than September 30 of the applicable calendar year and is not tax deductible. The annual fee for the health insurance industry is allocated to individual health insurers based on the ratio of the amount of an entity's direct premiums written during the preceding calendar year to the amount of health insurance for any U.S. health risk that is written during the preceding calendar year. ASU 2011-06,Other Expenses, Fees Paid to the Federal Government by Health Insurers provides that the liability for the fee should be estimated and recorded in full once the entity provides qualifying health insurance in the corresponding period with a corresponding deferred cost that is to be amortized to expense on a straight-line basis over the applicable calendar year. We record the fee liability in other liabilities and the deferred cost in other assets in the consolidated balance sheets. The related expense is recorded as Affordable Care Act fee in the consolidated statements of operations. At December 31, 2014, the accrued liability and the deferred asset had a balance of $0.
Income Taxes: We use the liability method of accounting for income taxes. Under this method, we recognize deferred tax assets and liabilities for the future tax consequences attributable to differences between the financial statement carrying amounts of existing assets and liabilities and their respective tax bases. We measure deferred tax assets and liabilities using enacted tax rates that we expect to apply to taxable income in the years in which we expect those temporary differences to be recovered or settled. We recognize the effect on deferred tax assets and liabilities of a change in tax rates in income in the period that includes the enactment date of a change in tax rates.
We establish valuation allowances on our deferred tax assets for amounts that we determine will not be recoverable based upon our analysis of projected taxable income and our ability to implement prudent and feasible tax planning strategies. We recognize increases in these valuation allowances as deferred tax expense. We reflect portions of the valuation allowances subsequently determined to be no longer necessary as deferred tax benefits.
We record tax benefits when it is more likely than not that the tax return position taken with respect to a particular transaction will be sustained. A liability, if recorded, is not considered resolved until the statute of limitations for the relevant taxing authority to examine and challenge the tax position has expired, or the tax position is ultimately settled through examination, negotiation, or litigation. We classify interest and penalties associated with uncertain tax positions in our provision for income taxes.
Reinsurance: We report amounts recoverable under reinsurance contracts in total assets as reinsurance recoverables rather than netting those amounts against the related policy asset or liability. We account for the cost of reinsurance related to long-duration contracts over the life of the underlying reinsured policies using assumptions consistent with those used to account for the underlying policies.
Stock-Based Compensation: We have a stock-based incentive plan for our employees, non-employee directors, agents and others. Detailed information for activity in our stock plans can be found in Note 19—Stock-Based Compensation. In accordance with ASC 718,Compensation—Stock Compensation, we recognize compensation costs for share-based payments to employees and non-employee directors based on the grant date fair value of the award and permits them to amortize this fair value over the grantees' service period.
We determine stock-based compensation for non-employees based on guidance contained in ASC 505-50,Equity—Equity-Based Payments to Non- Employees. We expense the fair value of the awards over the vesting period of each award.
F-25
UNIVERSAL AMERICAN CORP. AND SUBSIDIARIES
NOTES TO CONSOLIDATED FINANCIAL STATEMENTS (Continued)
4. RECENTLY ISSUED AND PENDING ACCOUNTING PRONOUNCEMENTS
Revenue from Contracts with Customers: In May 2014, the Financial Accounting Standards Board issued Accounting Standards Update ("ASU") 2014-09, Revenue from Contracts with Customers, to clarify the principles for revenue recognition. Insurance contracts are excluded from the scope of the guidance, however, our non-insurance contract revenues, including fee income, will be subject to the new guidance.
The core principle of ASU 2014-09 is that an entity should recognize revenue to depict the transfer of promised goods or services to customers in an amount that reflects the consideration to which the entity expects to be entitled in exchange for those goods or services. The following steps are to be applied to achieve this core principle: (1) identify the contract(s) with a customer; (2) identify the performance obligations in the contract; (3) determine the transaction price; (4) allocate the transaction price to the performance obligations in the contract; and (5) recognize revenue when, or as, the entity satisfies a performance obligation.
ASU 2014-09 provides companies with two implementation methods. Companies can choose to apply the standard retrospectively to each prior reporting period presented or retrospectively with the cumulative effect of initially applying the standard recognized at the date of initial application. This guidance is effective for annual reporting periods beginning after December 15, 2016, including interim periods within that reporting period, and early application is not permitted. We do not expect adoption of this guidance to have a material impact on our financial position, results of operations or cash flows in future periods.
5. BUSINESS COMBINATIONS
Sale of SelectCare of Oklahoma
On December 31, 2014, we completed the sale of SCOK to Healthcare Investors, LLC. SCOK operated as a special needs HMO Medicare advantage plan in Oklahoma with approximately 120 members, representing approximately $3.2 million of annualized revenue. The purchase price at closing was $1.9 million and was settled in cash. At the date of sale, the carrying value of SCOK included $0.4 million of goodwill and indefinite-lived intangible assets that were disposed of in connection with the sale. The transaction resulted in a pre-tax realized loss of $0.6 million, or $0.5 million after taxes.
Sale of Today's Options of Oklahoma
On August 29, 2014, we completed the sale of TOOK to Momentum Health, LLC. TOOK operated an HMO Medicare Advantage plan in Oklahoma with approximately 5,800 members, representing approximately $63 million of annualized revenue. The purchase price was $15.5 million of which we received $15.2 million in cash at closing. The balance of $0.3 million is recorded as a receivable in other assets on the consolidated balance sheets and was settled in cash during the first quarter of 2015. At the date of sale, our carrying value of TOOK included $3.8 million of goodwill and $1.5 million of amortizing intangible assets that were disposed of in connection with the transaction. The transaction resulted in a pre-tax realized loss of $2.0 million, or $2.7 million after taxes.
F-26
UNIVERSAL AMERICAN CORP. AND SUBSIDIARIES
NOTES TO CONSOLIDATED FINANCIAL STATEMENTS (Continued)
5. BUSINESS COMBINATIONS (Continued)
Acquisition of Total Care
On December 1, 2013, we completed our acquisition of the assets of the Total Care Medicaid managed care plan, known as Total Care. The purchase price for the acquisition was $6.2 million in cash, of which $3.3 million was paid at closing. An estimated $2.9 million of contingent consideration was accrued at closing, to be paid in the future based on membership and quality improvements of the health plan. At closing, the excess of the purchase price over the tangible assets acquired, totaling $5.8 million was allocated to amortizing intangible assets, including customer relationships, provider networks and trade names, with estimated lives of 8 years. The balance of $0.1 million was allocated to goodwill.
During the first quarter of 2014, we made acquisition accounting adjustments to reflect a $0.1 million increase in our estimated fair value of the provider networks with a corresponding adjustment to eliminate goodwill. There have been no other adjustments to the fair value estimates made as of the acquisition date. During December 2014, $1.8 million of contingent consideration accrued at closing was paid to the seller, leaving an accrual of $1.1 million at December 31, 2014, which we expect to settle during 2015 and 2016.
6. INVESTMENTS
The amortized cost and fair value of fixed maturity investments are as follows:
| | December 31, 2014 | |||||||||||||||
|---|---|---|---|---|---|---|---|---|---|---|---|---|---|---|---|---|
Classification | Amortized Cost | Gross Unrealized Gains | Gross Unrealized Losses | Gross Unrealized OTTI(1) | Fair Value | |||||||||||
| | (in thousands) | |||||||||||||||
U.S. Treasury securities and U.S. Government obligations | $ | 57,264 | $ | 102 | $ | (42 | ) | $ | — | $ | 57,324 | |||||
Government sponsored agencies | 1,546 | 29 | (22 | ) | — | 1,553 | ||||||||||
Other political subdivisions | 52,104 | 1,412 | (40 | ) | — | 53,476 | ||||||||||
Corporate debt securities | 354,852 | 18,151 | (328 | ) | — | 372,675 | ||||||||||
Foreign debt securities | 74,126 | 2,583 | (297 | ) | — | 76,412 | ||||||||||
Residential mortgage-backed securities | 161,043 | 6,229 | (742 | ) | — | 166,530 | ||||||||||
Commercial mortgage-backed securities | 80,634 | 1,451 | (54 | ) | — | 82,031 | ||||||||||
Other asset-backed securities | 35,093 | 384 | (25 | ) | — | 35,452 | ||||||||||
| | | | | | | | | | | | | | | | | |
| $ | 816,662 | $ | 30,341 | $ | (1,550 | ) | $ | — | $ | 845,453 | ||||||
| | | | | | | | | | | | | | | | | |
| | | | | | | | | | | | | | | | | |
| | | | | | | | | | | | | | | | | |
F-27
UNIVERSAL AMERICAN CORP. AND SUBSIDIARIES
NOTES TO CONSOLIDATED FINANCIAL STATEMENTS (Continued)
6. INVESTMENTS (Continued)
| | December 31, 2013 | |||||||||||||||
|---|---|---|---|---|---|---|---|---|---|---|---|---|---|---|---|---|
Classification | Amortized Cost | Gross Unrealized Gains | Gross Unrealized Losses | Gross Unrealized OTTI(1) | Fair Value | |||||||||||
| | (in thousands) | |||||||||||||||
U.S. Treasury securities and U.S. Government obligations | $ | 53,687 | $ | 131 | $ | (67 | ) | $ | — | $ | 53,751 | |||||
Government sponsored agencies | 10,400 | 251 | (170 | ) | — | 10,481 | ||||||||||
Other political subdivisions | 65,104 | 919 | (512 | ) | — | 65,511 | ||||||||||
Corporate debt securities | 382,496 | 16,811 | (1,707 | ) | — | 397,600 | ||||||||||
Foreign debt securities | 92,044 | 3,141 | (769 | ) | — | 94,416 | ||||||||||
Residential mortgage-backed securities | 182,853 | 4,506 | (4,143 | ) | — | 183,216 | ||||||||||
Commercial mortgage-backed securities | 76,503 | 2,606 | (17 | ) | (37 | ) | 79,055 | |||||||||
Other asset-backed securities | 50,366 | 694 | (25 | ) | (1,667 | ) | 49,368 | |||||||||
| | | | | | | | | | | | | | | | | |
| $ | 913,453 | $ | 29,059 | $ | (7,410 | ) | $ | (1,704 | ) | $ | 933,398 | |||||
| | | | | | | | | | | | | | | | | |
| | | | | | | | | | | | | | | | | |
| | | | | | | | | | | | | | | | | |
- (1)
- Other-than-temporary impairments.
At December 31, 2014, gross unrealized losses on mortgage-backed and asset-backed securities totaled $0.8 million, consisting primarily of unrealized losses of $0.7 million on residential mortgage-backed securities. The fair values of our securities are depressed primarily due to changes in interest rates. We have evaluated these holdings, with input from our investment managers, and do not believe further other-than-temporary impairment to be warranted.
The amortized cost and fair value of fixed maturity investments at December 31, 2014 by contractual maturity are shown below. Expected maturities will differ from contractual maturities because borrowers may have the right to call or prepay obligations with or without call or prepayment penalties.
| | Amortized Cost | Fair Value | |||||
|---|---|---|---|---|---|---|---|
| | (in thousands) | ||||||
Due in 1 year or less | $ | 43,617 | $ | 44,091 | |||
Due after 1 year through 5 years | 251,474 | 260,978 | |||||
Due after 5 years through 10 years | 168,309 | 176,607 | |||||
Due after 10 years | 76,492 | 79,764 | |||||
Mortgage and asset-backed securities | 276,770 | 284,013 | |||||
| | | | | | | | |
| $ | 816,662 | $ | 845,453 | ||||
| | | | | | | | |
| | | | | | | | |
| | | | | | | | |
F-28
UNIVERSAL AMERICAN CORP. AND SUBSIDIARIES
NOTES TO CONSOLIDATED FINANCIAL STATEMENTS (Continued)
6. INVESTMENTS (Continued)
The fair value and unrealized loss as of December 31, 2014 and 2013 for fixed maturities, aggregated by investment category and length of time that individual securities have been in a continuous unrealized loss position, are shown below:
| | Less than 12 Months | 12 Months or Longer | Total | ||||||||||||||||
|---|---|---|---|---|---|---|---|---|---|---|---|---|---|---|---|---|---|---|---|
December 31, 2014 | Fair Value | Gross Unrealized Losses | Fair Value | Gross Unrealized Losses | Fair Value | Gross Unrealized Losses | |||||||||||||
| | (in thousands) | ||||||||||||||||||
U.S. Treasury securities and U.S. Government obligations | $ | 19,706 | $ | (16 | ) | $ | 7,484 | $ | (26 | ) | $ | 27,190 | $ | (42 | ) | ||||
Government sponsored agencies | — | — | 1,014 | (22 | ) | 1,014 | (22 | ) | |||||||||||
Other political subdivisions | 3,465 | (21 | ) | 1,476 | (19 | ) | 4,941 | (40 | ) | ||||||||||
Corporate debt securities | 34,812 | (188 | ) | 7,103 | (140 | ) | 41,915 | (328 | ) | ||||||||||
Foreign debt securities | 16,535 | (287 | ) | 2,041 | (10 | ) | 18,576 | (297 | ) | ||||||||||
Residential mortgage-backed securities | 327 | (1 | ) | 37,571 | (741 | ) | 37,898 | (742 | ) | ||||||||||
Commercial mortgage-backed securities | 15,526 | (54 | ) | — | — | 15,526 | (54 | ) | |||||||||||
Other asset-backed securities | 15,279 | (25 | ) | — | — | 15,279 | (25 | ) | |||||||||||
| | | | | | | | | | | | | | | | | | | | |
Total fixed maturities | $ | 105,650 | $ | (592 | ) | $ | 56,689 | $ | (958 | ) | $ | 162,339 | $ | (1,550 | ) | ||||
| | | | | | | | | | | | | | | | | | | | |
| | | | | | | | | | | | | | | | | | | | |
| | | | | | | | | | | | | | | | | | | | |
Total number of securities in an unrealized loss position | 87 | ||||||||||||||||||
| | | | | | | | | | | | | | | | | | | | |
| | | | | | | | | | | | | | | | | | | | |
| | | | | | | | | | | | | | | | | | | | |
| | Less than 12 Months | 12 Months or Longer | Total | ||||||||||||||||
|---|---|---|---|---|---|---|---|---|---|---|---|---|---|---|---|---|---|---|---|
December 31, 2013 | Fair Value | Gross Unrealized Losses and OTTI | Fair Value | Gross Unrealized Losses and OTTI | Fair Value | Gross Unrealized Losses and OTTI | |||||||||||||
| | (in thousands) | ||||||||||||||||||
U.S. Treasury securities and U.S. Government obligations | $ | 17,951 | $ | (67 | ) | $ | — | $ | — | $ | 17,951 | $ | (67 | ) | |||||
Government sponsored agencies | — | — | 1,911 | (170 | ) | 1,911 | (170 | ) | |||||||||||
Other political subdivisions | 26,733 | (335 | ) | 6,264 | (177 | ) | 32,997 | (512 | ) | ||||||||||
Corporate debt securities | 74,902 | (1,518 | ) | 5,559 | (189 | ) | 80,461 | (1,707 | ) | ||||||||||
Foreign debt securities | 17,561 | (705 | ) | 3,091 | (64 | ) | 20,652 | (769 | ) | ||||||||||
Residential mortgage-backed securities | 82,898 | (3,337 | ) | 10,348 | (806 | ) | 93,246 | (4,143 | ) | ||||||||||
Commercial mortgage-backed securities | 6,195 | (17 | ) | 1,079 | (37 | ) | 7,274 | (54 | ) | ||||||||||
Other asset-backed securities | 9,530 | (25 | ) | 5,333 | (1,667 | ) | 14,863 | (1,692 | ) | ||||||||||
| | | | | | | | | | | | | | | | | | | | |
Total fixed maturities | $ | 235,770 | $ | (6,004 | ) | $ | 33,585 | $ | (3,110 | ) | $ | 269,355 | $ | (9,114 | ) | ||||
| | | | | | | | | | | | | | | | | | | | |
| | | | | | | | | | | | | | | | | | | | |
| | | | | | | | | | | | | | | | | | | | |
Total number of securities in an unrealized loss position | 144 | ||||||||||||||||||
| | | | | | | | | | | | | | | | | | | | |
| | | | | | | | | | | | | | | | | | | | |
| | | | | | | | | | | | | | | | | | | | |
F-29
UNIVERSAL AMERICAN CORP. AND SUBSIDIARIES
NOTES TO CONSOLIDATED FINANCIAL STATEMENTS (Continued)
6. INVESTMENTS (Continued)
The decrease in fair values at December 31, 2014 compared to December 31, 2013, and the resulting decrease in the number of securities in an unrealized loss position, is due to an overall flattening of the yield curve during 2014, resulting in a decline in interest-related unrealized losses.
Net Investment Income and Realized Gains and Losses
The details of net investment income are as follows:
| | 2014 | 2013 | 2012 | |||||||
|---|---|---|---|---|---|---|---|---|---|---|
| | (in thousands) | |||||||||
Investment Income: | ||||||||||
Fixed maturities | $ | 31,727 | $ | 37,933 | $ | 43,622 | ||||
Cash and cash equivalents | 136 | 315 | 348 | |||||||
Other(1) | 3,477 | 623 | 744 | |||||||
| | | | | | | | | | | |
Gross investment income | 35,340 | 38,871 | 44,714 | |||||||
Investment expenses | (1,627 | ) | (2,134 | ) | (2,317 | ) | ||||
| | | | | | | | | | | |
Net investment income | $ | 33,713 | $ | 36,737 | $ | 42,397 | ||||
| | | | | | | | | | | |
| | | | | | | | | | | |
| | | | | | | | | | | |
- (1)
- 2014 includes distributions of $2.8 million on cost-method investments.
Gross realized gains and gross realized losses included in the consolidated statements of operations are as follows:
| | 2014 | 2013 | 2012 | |||||||
|---|---|---|---|---|---|---|---|---|---|---|
| | (in thousands) | |||||||||
Realized gains: | ||||||||||
Fixed maturities | $ | 2,937 | $ | 9,847 | $ | 15,058 | ||||
Interest rate swap | — | 9,927 | 3,436 | |||||||
Other | — | 49 | 119 | |||||||
| | | | | | | | | | | |
| 2,937 | 19,823 | 18,613 | ||||||||
| | | | | | | | | | | |
Realized losses: | ||||||||||
Fixed maturities, excluding OTTI(1) | (1,671 | ) | (5,392 | ) | (1,791 | ) | ||||
Realized losses on sale of businesses(2) | (2,648 | ) | — | — | ||||||
Other | — | (568 | ) | (218 | ) | |||||
| | | | | | | | | | | |
| (4,319 | ) | (5,960 | ) | (2,009 | ) | |||||
| | | | | | | | | | | |
Net realized (losses) gains | $ | (1,382 | ) | $ | 13,863 | $ | 16,604 | |||
| | | | | | | | | | | |
| | | | | | | | | | | |
| | | | | | | | | | | |
- (1)
- 2014 includes a realized loss of $1.2 million on the sale of our last remaining subprime security.
- (2)
- Represents losses realized upon the sales of TOOK and SCOK. For further discussion of these transactions, see Note 5—Business Combinations.
F-30
UNIVERSAL AMERICAN CORP. AND SUBSIDIARIES
NOTES TO CONSOLIDATED FINANCIAL STATEMENTS (Continued)
6. INVESTMENTS (Continued)
At December 31, 2014 and 2013, we held unrated or below-investment grade fixed maturity securities as follows:
| | 2014 | 2013 | |||||
|---|---|---|---|---|---|---|---|
| | ($ in thousands) | ||||||
Carrying value | $ | 7,575 | $ | 12,656 | |||
| | | | | | | | |
| | | | | | | | |
| | | | | | | | |
Percentage of total investments, cash and cash equivalents | 0.8 | % | 1.2 | % | |||
| | | | | | | | |
| | | | | | | | |
| | | | | | | | |
The largest investment in any one such below-investment grade security was $4.0 million, or 0.4% of total assets at December 31, 2014 and $5.3 million, or 0.5% of total assets at December 31, 2013. The decrease in the fair value of below-investment grade investments relates to sale of our one subprime security during 2014.
We had no non-income producing fixed maturity securities for the years ended December 31, 2014, 2013 and 2012.
We have reflected investments held by various states as security for our policyholders in our fixed maturity investments. These investments had carrying values of $36.5 million at December 31, 2014 and $42.6 million at December 31, 2013.
7. FAIR VALUE MEASUREMENTS
We carry fixed maturity investments, equity securities and interest rate swaps at fair value in our Consolidated Financial Statements. These fair value disclosures consist of information regarding the valuation of these financial instruments followed by the fair value measurement disclosure requirements ofFair Value Measurements and Disclosures Topic, ASC 820-10.
Fair Value Disclosures
The following section applies the ASC 820-10 fair value hierarchy and disclosure requirements to our financial instruments that we carry at fair value. ASC 820-10 establishes a fair value hierarchy that prioritizes the inputs in the valuation techniques used to measure fair value into three broad Levels, numbered 1, 2, and 3.
Level 1 observable inputs reflect quoted prices for identical assets or liabilities in active markets that we have the ability to access at the measurement date. We currently have no Level 1 securities.
Level 2 observable inputs, other than quoted prices included in Level 1, reflect the asset or liability or prices for similar assets and liabilities. Most debt securities are priced by vendors using observable inputs and we classify them within Level 2. Derivative instruments that are priced using models with observable market inputs, such as interest rate swap contracts, are also reflected as Level 2.
Level 3 valuations are derived from techniques in which one or more of the significant inputs, such as assumptions about risk, are unobservable. Generally, Level 3 securities are less liquid securities such as highly structured or lower quality asset-backed securities, known as ABS, and private placement securities. Because Level 3 fair values, by their nature, contain unobservable market inputs, as there is no observable market for these assets and liabilities, we must use considerable judgment to determine
F-31
UNIVERSAL AMERICAN CORP. AND SUBSIDIARIES
NOTES TO CONSOLIDATED FINANCIAL STATEMENTS (Continued)
7. FAIR VALUE MEASUREMENTS (Continued)
the Level 3 fair values. Level 3 fair values represent our best estimate of an amount that we could realize in a current market exchange absent actual market exchanges.
The following table presents our assets that we carry at fair value by ASC 820 hierarchy levels (in thousands):
| | Total | Level 1 | Level 2 | Level 3 | |||||||||
|---|---|---|---|---|---|---|---|---|---|---|---|---|---|
December 31, 2014 | |||||||||||||
Assets: | |||||||||||||
Fixed maturities, available for sale | $ | 845,453 | $ | — | $ | 845,179 | $ | 274 | |||||
Equity securities | 14,081 | — | 14,081 | — | |||||||||
| | | | | | | | | | | | | | |
Total assets | $ | 859,534 | $ | — | $ | 859,260 | $ | 274 | |||||
| | | | | | | | | | | | | | |
| | | | | | | | | | | | | | |
| | | | | | | | | | | | | | |
December 31, 2013 | |||||||||||||
Assets: | |||||||||||||
Fixed maturities, available for sale | $ | 933,398 | $ | — | $ | 931,106 | $ | 2,292 | |||||
Equity securities | 13,253 | — | 13,253 | — | |||||||||
| | | | | | | | | | | | | | |
Total assets | $ | 946,651 | $ | — | $ | 944,359 | $ | 2,292 | |||||
| | | | | | | | | | | | | | |
| | | | | | | | | | | | | | |
| | | | | | | | | | | | | | |
In many situations, inputs used to measure the fair value of an asset or liability position may fall into different levels of the fair value hierarchy. In these situations, we will determine the level in which the fair value falls based upon the lowest level input that is significant to the determination of the fair value.
Determination of fair values
The valuation methodologies used to determine the fair values of assets and liabilities under the "exit price" notion of ASC 820-10 reflect market participant objectives and are based on the application of the fair value hierarchy that prioritizes observable market inputs over unobservable inputs. We determine the fair value of our financial assets and liabilities based upon quoted market prices where available. The following is a discussion of the methodologies used to determine fair values for the financial instruments listed in the above table.
Valuation of Fixed Maturity Securities
We have engaged an investment advisor to manage a portion of our portfolio, perform investment accounting and provide valuation services. Securities prices are obtained by the advisor from independent pricing vendors, which are chosen based on their ability to support and price specified asset classes following the procedures outlined in the valuation policy reviewed and approved by us. The following are examples of typical inputs used by third party pricing vendors:
- •
- reported trades;
- •
- benchmark yields;
- •
- issuer spreads;
- •
- bids;
F-32
UNIVERSAL AMERICAN CORP. AND SUBSIDIARIES
NOTES TO CONSOLIDATED FINANCIAL STATEMENTS (Continued)
7. FAIR VALUE MEASUREMENTS (Continued)
- •
- offers; and
- •
- estimated cash flows and prepayment speeds.
Based on the typical trading volumes and the lack of quoted market prices for fixed maturities, third party pricing services will normally derive the security prices through recent reported trades for identical or similar securities making adjustments through the reporting date based upon available market observable information as outlined above. If there are no recent reported trades, the third party pricing services may use matrix or model processes to develop a security price where the pricing services develop future cash flow expectations based upon collateral performance, discounted at an estimated market rate. The pricing for mortgage-backed and asset-backed securities reflects estimates of the rate of future prepayments of principal over the remaining life of the securities. The pricing services derive these estimates based on the characteristics of the underlying structure and prepayment speeds previously experienced at the interest rate levels projected for the underlying collateral.
The investment advisor uses their own rules-based pricing system to evaluate the prices it receives from various pricing vendors to ensure the data adheres to certain vendor-to-vendor and day-to-day variance tolerances. Exceptions to the rules are monitored, investigated and challenged, as needed. We review and test the security pricing procedures used to value our fixed maturity portfolio on an ongoing basis. Our procedures include review of the investment valuation policy and understanding of the procedures used to obtain investment valuations and review of pricing controls at our investment advisor, including their SOC 1 internal controls review report. We also test the prices provided by the advisor monthly by comparing the data to another independent pricing source and monitoring the change in prices from month to month and upon sale of the security. Significant changes or variances are investigated and explained. During the year ended December 31, 2014, we did not modify any price provided by the advisor.
We have also reviewed the advisor's pricing services' valuation methodologies and related sources, and have evaluated the various types of securities in our investment portfolio to determine an appropriate fair value hierarchy level based upon trading activity and the observability of market inputs. Based on the results of this evaluation and investment class analysis, we classified each price into Level 1, 2, or 3. We classified most prices provided by third party pricing services into Level 2 because the inputs used in pricing the securities are market observable.
Due to a general lack of transparency in the process that brokers use to develop prices, we have classified most valuations that are based on broker's prices as Level 3. We may classify some valuations as Level 2 if we can corroborate the price. We have also classified internal model priced securities, primarily consisting of private placement asset-backed securities, as Level 3 because this model pricing includes significant non-observable inputs.
The following table presents the fair value of the significant asset sectors within the ASC 820 Level 3 securities:
| | December 31, 2014 | ||||||
|---|---|---|---|---|---|---|---|
| | Fair Value | % of Total Fair Value | |||||
| | ($ in thousands) | ||||||
Mortgage-backed and asset-backed securities | $ | 274 | 100.0 | % | |||
| | | | | | | | |
| | | | | | | | |
| | | | | | | | |
F-33
UNIVERSAL AMERICAN CORP. AND SUBSIDIARIES
NOTES TO CONSOLIDATED FINANCIAL STATEMENTS (Continued)
7. FAIR VALUE MEASUREMENTS (Continued)
Mortgage-backed and asset-backed securities represent private-placement securities that are thinly traded and priced using an internal model or modeled by independent brokers.
The following table provides a summary of changes in the fair value of our Level 3 financial assets:
| | For the years ended December 31, | ||||||
|---|---|---|---|---|---|---|---|
| | 2014 | 2013 | |||||
| | (in thousands) | ||||||
Fair value at beginning of year | $ | 2,292 | $ | 2,453 | |||
Calls | (1,494 | ) | — | ||||
Paydowns | (141 | ) | (150 | ) | |||
Unrealized gains included in AOCI(1)(2) | (385 | ) | (11 | ) | |||
Realized gain | 2 | — | |||||
| | | | | | | | |
Fair value at end of year | $ | 274 | $ | 2,292 | |||
| | | | | | | | |
| | | | | | | | |
| | | | | | | | |
- (1)
- AOCI: Accumulated other comprehensive income.
- (2)
- Unrealized gains/losses represent losses from changes in values of Level 3 financial instruments only for the periods in which the instruments are classified as Level 3.
Valuation of Equity Securities
We report equity securities at fair value in other assets in our consolidated balance sheets. Their fair value is based on quoted market prices, where available. For certain equity securities, quoted market prices for the identical security are not always available and the fair value is estimated by reference to similar securities for which quoted prices are available. These securities are designated Level 2.
Nonrecurring Fair Value Measurement—APS Healthcare Goodwill and Amortizing Intangible Assets
During the year ended December 31, 2013, we determined that the carrying amount of the APS Healthcare goodwill and amortizing intangible assets exceeded their implied fair value of $4.5 million. As a result, we recorded an impairment charge to write off the excess amounts. Because of the nature of the goodwill and amortizing intangible asset valuation processes, at December 31, 2013 we have classified these non-recurring fair value measurements as Level 3. For further details see Note 8—Goodwill and Other Intangible Assets.
F-34
UNIVERSAL AMERICAN CORP. AND SUBSIDIARIES
NOTES TO CONSOLIDATED FINANCIAL STATEMENTS (Continued)
8. GOODWILL AND OTHER INTANGIBLE ASSETS
Changes in the carrying amounts of goodwill and intangible assets with indefinite lives (primarily trademarks and licenses) are shown below:
| | | | | Corporate & Other(2) | |||||||||||||||
|---|---|---|---|---|---|---|---|---|---|---|---|---|---|---|---|---|---|---|---|
| | Total, Net | Medicare Advantage(1) | Medicaid(1) | Gross | Accumulated write-offs | Net | |||||||||||||
| | (in thousands) | ||||||||||||||||||
Balance, January 1, 2013 | $ | 242,942 | $ | 77,459 | $ | — | $ | 165,483 | $ | — | $ | 165,483 | |||||||
Acquisitions(3) | 67 | — | 67 | — | — | — | |||||||||||||
Impairments(4) | (164,757 | ) | — | — | — | (164,757 | ) | (164,757 | ) | ||||||||||
Adjustments | (726 | ) | — | — | (726 | ) | — | (726 | ) | ||||||||||
| | | | | | | | | | | | | | | | | | | | |
Balance, December 31, 2013 | 77,526 | 77,459 | 67 | 164,757 | (164,757 | ) | — | ||||||||||||
Dispositions(5) | (4,198 | ) | (4,198 | ) | — | — | — | — | |||||||||||
Adjustments(6) | (67 | ) | — | (67 | ) | — | — | — | |||||||||||
| | | | | | | | | | | | | | | | | | | | |
Balance, December 31, 2014 | $ | 73,261 | $ | 73,261 | $ | — | $ | 164,757 | $ | (164,757 | ) | $ | — | ||||||
| | | | | | | | | | | | | | | | | | | | |
| | | | | | | | | | | | | | | | | | | | |
| | | | | | | | | | | | | | | | | | | | |
- (1)
- Represents both gross and net goodwill balances.
- (2)
- The goodwill in our Corporate & Other segment is associated with our APS Healthcare reporting units.
- (3)
- Represents goodwill recorded in connection with our December 1, 2014 acquisition of the assets of Total Care. See Note 5—Business Combinations.
- (4)
- Represents goodwill impairment charge related to APS Healthcare. See further discussion below.
- (5)
- Represents goodwill disposed of in connection with the sale of TOOK and SCOK of $3.8 million and $0.4 million, respectively. See Note 5—Business Combinations.
- (6)
- Represents a Total Care acquisition accounting adjustment to increase our estimated fair value of the provider networks with a corresponding adjustment to eliminate goodwill.
We test goodwill for impairment annually based on information as of October 1 of the current year or more frequently if circumstances suggest that impairment may exist.
During the quarter ended December 31, 2014, we performed our annual assessment of goodwill based on information as of October 1, 2014. We determined based on our "Step 1" impairment test that our estimated fair value of our Medicare Advantage reporting unit was in excess of its carrying value by 70%. We do not have goodwill assigned to any other reporting units.
During the quarter ended June 30, 2013, certain events occurred and circumstances changed which indicated that it was more likely than not that goodwill for APS Healthcare was impaired, including the following:
- •
- APS Healthcare failed to win certain new contracts that had previously been anticipated;
- •
- APS Healthcare's Puerto Rico contract to provide managed behavioral health services under the Mi Salud program (the "APS Puerto Rico Contract"), which represented a significant portion of
F-35
UNIVERSAL AMERICAN CORP. AND SUBSIDIARIES
NOTES TO CONSOLIDATED FINANCIAL STATEMENTS (Continued)
8. GOODWILL AND OTHER INTANGIBLE ASSETS (Continued)
- •
- Certain of APS Healthcare's existing contracts were terminated, not renewed or we learned that they were likely to terminate in the next several months; and
- •
- Due to the general increase in interest rates during the second quarter, the discount rate used in the impairment analysis was increased by 50 basis points compared to the rate used in the prior impairment testing analysis.
APS Healthcare's historical revenue was renewed, but at a lower rate than had previously been anticipated;
Based on the foregoing, we performed an interim impairment review as of June 30, 2013 that included lowered expectations for future revenue growth and new business development and a higher discount rate. Based on the results of the step one impairment test, we determined that as of June 30, 2013 the carrying value of APS Healthcare exceeded its fair value. We then proceeded to the second step of the impairment test to estimate the implied fair value of the APS Healthcare goodwill. This implied fair value of goodwill is determined in the same manner as the amount of goodwill recognized in a business combination, that is, the estimated fair value of the reporting unit is allocated to all of the assets and liabilities of that unit (including any unrecognized intangible assets) as if the reporting unit had been acquired in a business combination and the estimated fair value was the purchase price paid. Based on the June 30, 2013 step two analysis, the carrying amount of the APS Healthcare goodwill exceeded its implied fair value, resulting in a pre-tax impairment charge of $91.7 million, which we allocated on a pro rata basis between taxable and non-taxable goodwill.
Additionally, during the fourth quarter of 2013, certain events occurred and circumstances changed which indicated that it was more likely than not that goodwill for APS Healthcare was further impaired, including the following:
- •
- We learned that the APS Puerto Rico Contract, which represents a significant portion of APS Healthcare's historical revenue, would terminate effective June 30, 2014 as a result of a new RFP being issued that would integrate behavioral health services and physical health services into one managed care contract. Additionally, the Commonwealth of Puerto Rico continued to experience deterioration in its economic environment and certain of the major rating agencies cut Puerto Rico's credit rating to junk status. In addition, we began to experience an increase in the cost of care of our Puerto Rico managed behavioral health business, which reduced the profitability of that business. We evaluated opportunities to participate in the new RFP but there could be no assurance that we would be successful, which, if we were not successful would end our participation in the Mi Salud program.
- •
- We learned that APS Healthcare was not going to be awarded a previously anticipated contract.
- •
- We learned that the anticipated membership to be serviced in another contract was significantly reduced, thereby lowering the future expected cash flows of that contract.
- •
- Substantially all of the services APS Healthcare had provided to non-APS Healthcare affiliates were discontinued. These affiliates replaced those services with their own direct staff.
We incorporated the impact of the above items into our projections for APS Healthcare for our annual assessment of goodwill as of October 1, 2013, that included lowered expectations for future revenue growth and new business development. Based on the results of the step one impairment test, we determined that as of October 1, 2013 the carrying value of APS Healthcare exceeded its fair value.
F-36
UNIVERSAL AMERICAN CORP. AND SUBSIDIARIES
NOTES TO CONSOLIDATED FINANCIAL STATEMENTS (Continued)
8. GOODWILL AND OTHER INTANGIBLE ASSETS (Continued)
We then proceeded to the second step of the impairment test to estimate the implied fair value of the APS Healthcare goodwill. Based on the October 1, 2013 step two analysis, the carrying amount of the APS Healthcare goodwill exceeded its implied fair value, resulting in a pre-tax impairment charge of $73.0 million, representing the remaining goodwill for APS Healthcare. A portion of the goodwill was taxable, resulting in a tax benefit of approximately $0.9 million. Separately, we determined that the identified amortizing intangibles and other fixed assets were not fully recoverable and recorded additional impairments of $16.1 million and $8.5 million, respectively (see below).
The following table shows the Company's acquired intangible assets that continue to be subject to amortization and the related accumulated amortization.
| | | December 31, 2014 | December 31, 2013 | |||||||||||||
|---|---|---|---|---|---|---|---|---|---|---|---|---|---|---|---|---|
| | Remaining Life (Years) | Value Assigned | Accumulated Amortization | Value Assigned | Accumulated Amortization | |||||||||||
| | | (in thousands) | ||||||||||||||
Medicare Advantage: | ||||||||||||||||
Membership base | 7 | $ | 23,988 | $ | 21,069 | $ | 23,988 | $ | 18,392 | |||||||
Provider contracts | 1 | 14,034 | 12,463 | 14,034 | 11,105 | |||||||||||
Non-compete | — | 1,425 | 1,425 | 1,425 | 1,342 | |||||||||||
Medicaid: | ||||||||||||||||
Customer relationships | 7 | 4,969 | 673 | 4,969 | 54 | |||||||||||
Provider contracts | 7 | 179 | 26 | 112 | 1 | |||||||||||
Trade name | 3 | 729 | 175 | 729 | 14 | |||||||||||
Traditional Insurance: | ||||||||||||||||
Policies in force—Health | 2 | 17,246 | 15,822 | 17,246 | 15,483 | |||||||||||
Corporate and Other: | ||||||||||||||||
APS Healthcare: | ||||||||||||||||
Customer relationships | 3 | 900 | 281 | 900 | 56 | |||||||||||
Software platform | 3 | 1,500 | 469 | 1,500 | 94 | |||||||||||
Provider contracts | 3 | 2,099 | 656 | 2,099 | 130 | |||||||||||
| | | | | | | | | | | | | | | | | |
Total | $ | 67,069 | $ | 53,059 | $ | 67,002 | $ | 46,671 | ||||||||
| | | | | | | | | | | | | | | | | |
| | | | | | | | | | | | | | | | | |
| | | | | | | | | | | | | | | | | |
The following table shows the changes in the amortizing intangible assets:
| | 2014 | 2013 | |||||
|---|---|---|---|---|---|---|---|
| | (in thousands) | ||||||
Balance, beginning of year | $ | 20,331 | $ | 38,469 | |||
Additions and adjustments(1) | 67 | 5,810 | |||||
Disposals(2) | (1,518 | ) | — | ||||
Impairment(3) | — | (16,105 | ) | ||||
Amortization | (4,870 | ) | (7,843 | ) | |||
| | | | | | | | |
Balance, end of year | $ | 14,010 | $ | 20,331 | |||
| | | | | | | | |
| | | | | | | | |
| | | | | | | | |
- (1)
- Represents intangible assets recorded in connection with our December 1, 2014 acquisition of the assets of Total Care. See Note 5—Business Combinations.
F-37
UNIVERSAL AMERICAN CORP. AND SUBSIDIARIES
NOTES TO CONSOLIDATED FINANCIAL STATEMENTS (Continued)
8. GOODWILL AND OTHER INTANGIBLE ASSETS (Continued)
- (2)
- Represents intangible assets disposed of in connection with the sale of TOOK.
- (3)
- Represents intangible asset impairment charge related to APS Healthcare. See further discussion below:
During our review of recoverability in the fourth quarter of 2013, we determined that undiscounted cash flows from our APS Healthcare reporting unit were less than the carrying value of our related APS Healthcare intangible assets, indicating that they were no longer fully recoverable. We recorded an impairment of $16.1 million at December 31, 2013, to adjust the assets to their estimated fair value of $4.5 million. In addition, we recorded an impairment of $8.5 million to adjust APS Healthcare fixed assets, primarily internally developed software, to their estimated fair value.
There were no other impairments of our amortizing intangible assets during 2014 or 2013.
Estimated future net amortization expense (in thousands) is as follows:
2015 | $ | 4,281 | ||
2016 | 3,003 | |||
2017 | 2,575 | |||
2018 | 1,272 | |||
2019 | 1,015 | |||
Thereafter | 1,864 | |||
| | | | | |
Total | $ | 14,010 | ||
| | | | | |
| | | | | |
| | | | | |
See Note 3—Summary of Significant Accounting Policies, for additional information regarding our calculation of goodwill and other intangible assets.
9. DEFERRED POLICY ACQUISITION COSTS
Details with respect to deferred policy acquisition costs are as follows:
| | 2014 | 2013 | |||||
|---|---|---|---|---|---|---|---|
| | (in thousands) | ||||||
Balance, beginning of year | $ | 90,136 | $ | 102,765 | |||
Capitalized costs, net of reinsurance commissions and allowances | 5,008 | 7,982 | |||||
Amortization | (17,330 | ) | (20,611 | ) | |||
| | | | | | | | |
Balance, end of year | $ | 77,814 | $ | 90,136 | |||
| | | | | | | | |
| | | | | | | | |
| | | | | | | | |
F-38
UNIVERSAL AMERICAN CORP. AND SUBSIDIARIES
NOTES TO CONSOLIDATED FINANCIAL STATEMENTS (Continued)
10. REINSURANCE
In the normal course of business, we reinsure portions of certain policies that we underwrite. We enter into reinsurance arrangements with unaffiliated reinsurance companies to limit our exposure on individual claims and to limit or eliminate risk on our non-core or underperforming blocks of business. Accordingly, we are party to various reinsurance agreements on our life and accident and health insurance risks. Our traditional accident and health insurance products are generally reinsured under quota share coinsurance treaties with unaffiliated insurers, while the life insurance risks are reinsured under either quota share coinsurance or yearly-renewable term treaties with unaffiliated insurers. Under quota share coinsurance treaties, we pay the reinsurer an agreed upon percentage of all premiums and the reinsurer reimburses us that same percentage of any losses. In addition, the reinsurer pays us certain allowances to cover commissions, the cost of administering the policies and premium taxes. Under yearly-renewable term treaties, the reinsurer receives premiums at an agreed upon rate for its share of the risk on a yearly-renewable term basis. We also use excess of loss reinsurance agreements for certain policies whereby we limit our loss in excess of specified thresholds. Our quota share coinsurance agreements are generally subject to cancellation on 90 days' notice for future business, but policies reinsured prior to cancellation remain reinsured as long as they remain in-force.
In connection with the 2011 sale of our Medicare Part D business to CVS Caremark, our previously owned insurance subsidiary, Pennsylvania Life Insurance Company, known as Pennsylvania Life, was also sold to CVS Caremark. Pennsylvania Life included a Medicare Part D business as well as portions of our traditional business. Prior to the closing of the sale such traditional business was reinsured by one of our subsidiaries.
We evaluate the financial condition of our reinsurers and monitor concentrations of credit risk to minimize our exposure to significant losses from reinsurer insolvencies. We are obligated to pay claims in the event that a reinsurer to whom we have ceded an insured claim fails to meet its obligations under the reinsurance agreement. We are also obligated to pay claims on the traditional business of Pennsylvania Life Insurance Company, the company that we sold to CVS Caremark in 2011, in the event that any of the third party reinsurers to whom Pennsylvania Life has ceded an insured claim fails to meet their obligations under the reinsurance agreement. As of December 31, 2014, Pennsylvania Life had approximately $162 million of amounts recoverable from reinsurers that are included in our consolidated balance sheets. We are not aware of any instances where any of our reinsurers have been unable to pay any policy claims on any reinsured business.
As of December 31, 2014, all of our primary reinsurers, as well as the primary first party reinsurers of Pennsylvania Life's traditional business, were rated "A–" (Excellent) or better by A.M. Best with the exception of one reinsurer. For that reinsurer, which is rated B++, a trust containing assets at 106% of reserves was established at the inception of the reinsurance agreement. The trust agreement requires that on an ongoing basis the trust assets be maintained at a minimum level of 100% of reserves. The reserves amounted to approximately $124.1 as of December 31, 2014.
We have several quota share reinsurance agreements in place with General Re Life Corporation, Hannover Life Re of America, Swiss Re Life & Health America, Wilton Reassurance Company, Athene Life Re Ltd., and Commonwealth Annuity & Life Insurance Company (and affiliates). These agreements cover various insurance products, including Medicare supplement, long-term care, life and annuity products and contain ceding percentages ranging between 15% and 100%.
F-39
UNIVERSAL AMERICAN CORP. AND SUBSIDIARIES
NOTES TO CONSOLIDATED FINANCIAL STATEMENTS (Continued)
10. REINSURANCE (Continued)
Life Insurance and Annuity Reinsurance Transaction: Effective April 1, 2009, we reinsured substantially all of the net in-force life and annuity business with Commonwealth under a 100% coinsurance treaty. During 2010, the annuity portion of this transaction was commuted with Commonwealth and reinsured with Athene. In accordance with ASC 944,Financial Services—Insurance Topic, reinsurance recoverables are to be reported as separate assets rather than as reductions of the related liabilities. The 2009 transaction resulted in a pre-tax gain of $17.6 million, which we have deferred and are amortizing over the estimated remaining life of the ceded block of business at the rate of approximately $1.2 million per year. At December 31, 2014, the unamortized balance was $10.9 million and is included in other liabilities in our consolidated balance sheets.
Reinsurance Premium: The following table provides a summary of premium ceded to our largest reinsurers:
| | 2014 | 2013 | 2012 | ||||||||||||||||
|---|---|---|---|---|---|---|---|---|---|---|---|---|---|---|---|---|---|---|---|
Reinsurer | Ceded Premium | %(1) | Ceded Premium | %(1) | Ceded Premium | %(1) | |||||||||||||
| | ($ in millions) | ||||||||||||||||||
Gen Re | $ | 25.0 | 1.3 | % | $ | 28.5 | 1.4 | % | $ | 31.6 | 1.5 | % | |||||||
Commonwealth and affiliates | 20.0 | 1.0 | % | 21.3 | 1.0 | % | 23.0 | 1.1 | % | ||||||||||
Hannover | 16.0 | 0.8 | % | 18.8 | 0.9 | % | 22.4 | 1.1 | % | ||||||||||
- (1)
- Percentages represent ceded amounts over the total direct and assumed premiums.
Reinsurance Recoverables: Amounts recoverable from our reinsurers are as follows:
| | 2014 | 2013 | |||||
|---|---|---|---|---|---|---|---|
| | (in thousands) | ||||||
Reinsurer | |||||||
Commonwealth and affiliates | $ | 204,836 | $ | 212,302 | |||
Pennsylvania Life(1) | 144,627 | 153,293 | |||||
Athene Life Re | 82,690 | 87,998 | |||||
Hannover | 18,680 | 22,335 | |||||
Swiss Re | 20,701 | 25,160 | |||||
Other life | 26,934 | 19,155 | |||||
| | | | | | | | |
Total life | 498,468 | 520,243 | |||||
| | | | | | | | |
Gen Re | 84,551 | 87,033 | |||||
Hannover | 19,710 | 19,314 | |||||
Pennsylvania Life(1) | 17,419 | 19,997 | |||||
Other health | 15,125 | 16,405 | |||||
| | | | | | | | |
Total health | 136,805 | 142,749 | |||||
| | | | | | | | |
Total | $ | 635,273 | $ | 662,992 | |||
| | | | | | | | |
| | | | | | | | |
| | | | | | | | |
- (1)
- Amounts represent recoverables from Pennsylvania Life's third party reinsurers, primarily Commonwealth and affiliates, Athene Life Re, Gen Re and Hannover, which are also included in our consolidated balance sheets.
F-40
UNIVERSAL AMERICAN CORP. AND SUBSIDIARIES
NOTES TO CONSOLIDATED FINANCIAL STATEMENTS (Continued)
10. REINSURANCE (Continued)
At December 31, 2014, the total amount recoverable from reinsurers of $635.3 million included $625.9 million recoverable on future policy benefits and unpaid claims, $6.8 million in funds held and $2.6 million for amounts due from reinsurers on paid claims, commissions and expense allowances net of premiums reinsured. At December 31, 2013, the total amount recoverable from reinsurers of $663.0 million included $652.1 million recoverable on future policy benefits and unpaid claims, $7.2 million in funds held and $3.7 million for amounts due from reinsurers on paid claims, commissions and expense allowances net of premiums reinsured.
Reinsurance Summary:
| | Year Ended December 31, | |||||||||
|---|---|---|---|---|---|---|---|---|---|---|
| | 2014 | 2013 | 2012 | |||||||
| | (in thousands) | |||||||||
Premiums | ||||||||||
Life insurance | $ | 37,625 | $ | 41,214 | $ | 45,736 | ||||
Accident and health | 1,903,849 | 1,989,656 | 1,978,564 | |||||||
| | | | | | | | | | | |
Total gross premiums | 1,941,474 | 2,030,870 | 2,024,300 | |||||||
| | | | | | | | | | | |
Ceded to other companies | ||||||||||
Life insurance | (31,206 | ) | (33,936 | ) | (37,445 | ) | ||||
Accident and health | (44,992 | ) | (51,163 | ) | (58,712 | ) | ||||
| | | | | | | | | | | |
Total ceded premiums | (76,198 | ) | (85,099 | ) | (96,157 | ) | ||||
| | | | | | | | | | | |
Assumed from other companies | ||||||||||
Life insurance | 6,338 | 6,995 | 7,999 | |||||||
Accident and health | 42,802 | 48,543 | 53,671 | |||||||
| | | | | | | | | | | |
Total assumed premium | 49,140 | 55,538 | 61,670 | |||||||
| | | | | | | | | | | |
Net amount | ||||||||||
Life insurance | 12,757 | 14,273 | 16,290 | |||||||
Accident and health | 1,901,659 | 1,987,036 | 1,973,523 | |||||||
| | | | | | | | | | | |
Total net premium | $ | 1,914,416 | $ | 2,001,309 | $ | 1,989,813 | ||||
| | | | | | | | | | | |
Percentage of assumed to net premium | ||||||||||
Life insurance | 50 | % | 49 | % | 49 | % | ||||
Accident and health | 2 | % | 2 | % | 3 | % | ||||
Total assumed to total net | 3 | % | 3 | % | 3 | % | ||||
Benefits and claims recovered | $ | 75,047 | $ | 95,527 | $ | 94,125 | ||||
| | | | | | | | | | | |
| | | | | | | | | | | |
| | | | | | | | | | | |
F-41
UNIVERSAL AMERICAN CORP. AND SUBSIDIARIES
NOTES TO CONSOLIDATED FINANCIAL STATEMENTS (Continued)
10. REINSURANCE (Continued)
| | As of December 31, | |||||||||
|---|---|---|---|---|---|---|---|---|---|---|
| | 2014 | 2013 | 2012 | |||||||
| | (in thousands) | |||||||||
Life insurance in-force | ||||||||||
Gross amount | $ | 1,189,738 | $ | 1,283,357 | $ | 1,374,431 | ||||
Ceded to other companies | (1,127,114 | ) | (1,215,728 | ) | (1,317,930 | ) | ||||
Assumed from other companies | 104,033 | 114,264 | 126,151 | |||||||
| | | | | | | | | | | |
Net amount | $ | 166,657 | $ | 181,893 | $ | 182,652 | ||||
| | | | | | | | | | | |
| | | | | | | | | | | |
| | | | | | | | | | | |
Percentage of assumed to net in-force | 62 | % | 63 | % | 69 | % | ||||
11. LIABILITIES FOR POLICY AND CONTRACT CLAIMS—HEALTH
Activity in the liability for policy and contract claims—health is as follows:
| | For the years ended December 31, | ||||||
|---|---|---|---|---|---|---|---|
| | 2014 | 2013 | |||||
| | (in thousands) | ||||||
Balance at beginning of year | $ | 166,545 | $ | 156,558 | |||
Less reinsurance recoverable | (5,694 | ) | (4,811 | ) | |||
| | | | | | | | |
Net balance at beginning of year | 160,851 | 151,747 | |||||
| | | | | | | | |
Balances sold | (3,468 | ) | — | ||||
Incurred related to: | |||||||
Current year | 1,613,998 | 1,641,171 | |||||
Prior year development | (3,754 | ) | 5,926 | ||||
| | | | | | | | |
Total incurred | 1,610,244 | 1,647,097 | |||||
| | | | | | | | |
Paid related to: | |||||||
Current year | 1,487,386 | 1,480,332 | |||||
Prior year | 139,183 | 157,661 | |||||
| | | | | | | | |
Total paid | 1,626,569 | 1,637,993 | |||||
| | | | | | | | |
Net balance at end of year | 141,058 | 160,851 | |||||
Plus reinsurance recoverable | 6,503 | 5,694 | |||||
| | | | | | | | |
Balance at end of year | $ | 147,561 | $ | 166,545 | |||
| | | | | | | | |
| | | | | | | | |
| | | | | | | | |
The liability for policy and contract claims—health decreased from $166.5 million to $147.6 million during the year ended December 31, 2014. The decrease in the liability was primarily attributable to the decrease in IBNR for our Medicare Advantage business due to lower membership levels, including the effect of the sale of TOOK and SCOK.
The prior year development incurred in the table above represents (favorable) or unfavorable adjustments as a result of prior year claim estimates being settled or currently expected to be settled, for amounts that are different than originally anticipated. This prior year development occurs due to differences between the actual medical utilization and other components of medical cost trends, and
F-42
UNIVERSAL AMERICAN CORP. AND SUBSIDIARIES
NOTES TO CONSOLIDATED FINANCIAL STATEMENTS (Continued)
11. LIABILITIES FOR POLICY AND CONTRACT CLAIMS—HEALTH (Continued)
actual claim processing and payment patterns compared to the assumptions for claims trend and completion factors used to estimate our claim liabilities.
The claim reserve balances at December 31, 2013 settled during 2014 for $3.8 million less than originally estimated. This prior year development represents 0.2% of the incurred claims recorded in 2013.
The claim reserve balances at December 31, 2012 settled during 2013 for $5.9 million more than originally estimated. This prior year development represents less than 0.4% of the incurred claims recorded in 2012.
12. INCOME TAXES
Our federal, state and foreign income tax (benefit) expense is as follows:
| | 2014 | 2013 | 2012 | |||||||
|---|---|---|---|---|---|---|---|---|---|---|
| | (in thousands) | |||||||||
Current—Federal | $ | 10,659 | $ | 7,800 | $ | 22,517 | ||||
Current—States | 76 | (1,085 | ) | (8,617 | ) | |||||
Current—Puerto Rico | 3,054 | 3,663 | 1,977 | |||||||
Deferred—Federal | (18,279 | ) | (22,335 | ) | 9,464 | |||||
Deferred—States | 32 | (723 | ) | (495 | ) | |||||
Deferred—Puerto Rico | — | 1,770 | (245 | ) | ||||||
| | | | | | | | | | | |
(Benefit from) provision for income taxes | $ | (4,458 | ) | $ | (10,910 | ) | $ | 24,601 | ||
| | | | | | | | | | | |
| | | | | | | | | | | |
| | | | | | | | | | | |
For the year ended December 31, 2014, we will file a consolidated federal income tax return that includes most corporate subsidiaries but excludes any subsidiary that qualifies as a life insurance company or is taxed as a partnership under the Internal Revenue Code, as well as our subsidiaries domiciled in Puerto Rico. Subsidiaries that qualify as life insurance companies and partnerships will file separate federal income tax returns and the Puerto Rico subsidiaries will file tax returns in Puerto Rico. We will include the taxable income or loss from a subsidiary taxed as a partnership in the tax return of its corporate owner.
F-43
UNIVERSAL AMERICAN CORP. AND SUBSIDIARIES
NOTES TO CONSOLIDATED FINANCIAL STATEMENTS (Continued)
12. INCOME TAXES (Continued)
A reconciliation of "expected" tax at 35% with our actual tax applicable to (loss) income before income taxes reported in the consolidated statements of operations is as follows:
| | 2014 | 2013 | 2012 | |||||||
|---|---|---|---|---|---|---|---|---|---|---|
| | (in thousands) | |||||||||
Expected tax (benefit) expense | $ | (11,874 | ) | $ | (71,133 | ) | $ | 27,172 | ||
State taxes, net of valuation allowances | 659 | 291 | 908 | |||||||
Foreign taxes | 1,173 | 668 | (257 | ) | ||||||
Change in valuation allowance | (252 | ) | 870 | — | ||||||
Examination and related adjustments | (1,740 | ) | (795 | ) | (6,565 | ) | ||||
Stock-based compensation (IRC 162(m) & (m)(6)) | (3,192 | ) | 1,272 | 1,660 | ||||||
Goodwill impairment | — | 55,581 | — | |||||||
ACA fee | 8,096 | — | — | |||||||
Preferred dividend | 1,254 | 1,254 | 1,254 | |||||||
Sale of subidiaries | 1,412 | — | — | |||||||
Other, net | 6 | 1,082 | 429 | |||||||
| | | | | | | | | | | |
Actual tax (benefit) expense | $ | (4,458 | ) | $ | (10,910 | ) | $ | 24,601 | ||
| | | | | | | | | | | |
| | | | | | | | | | | |
| | | | | | | | | | | |
Our effective tax rate was a benefit of 13.1% for 2014 compared with a benefit of 5.4% for 2013. The effective rate in 2014 differs from the expected benefit of the 35% federal rate due to non-recurring tax benefits (discussed below), net of permanent items, primarily the new ACA fee and preferred dividends, and foreign and state income taxes. The variance in the 2013 effective tax rate compared with the expected benefit of the 35% federal rate was driven by permanent items relating primarily to non-deductible goodwill impairment, the limitation on the deductibility of executive compensation for health insurers enacted in the Affordable Care Act, interest on the mandatorily redeemable preferred stock, foreign and state income taxes and non-recurring tax expenses.
Income taxes include non-recurring tax benefits (expenses) of $5.8 million and ($1.2) million for the years ended December 31, 2014 and 2013, respectively. The 2014 benefit primarily relates to the reversal of executive compensation previously considered non-deductible under Code section 162(m)(6) that resulted in the recording of a $3.2 million benefit for amounts considered non-deductible in our prior year tax return, recording of $1.3 million of foreign tax credits related to APS Healthcare and a $0.7 million reserve release related to items on which the statute of limitations has expired. The 2013 expense primarily relates to the establishment of a valuation allowance against deferred tax assets principally related to foreign tax credits from our APS Puerto Rico subsidiary.
In addition to federal and state income tax, our insurance company subsidiaries are subject to state premium taxes, which are included in other operating costs and expenses in the consolidated statements of operations.
Deferred income taxes reflect the net tax effects of temporary differences between the carrying value of assets and liabilities for financial reporting purposes and the amount used for income tax purposes. The Company has increased both the deferred tax asset and the valuation allowance for state net operating losses by $4.1 million as of December 31, 2013; no change in the net deferred tax asset
F-44
UNIVERSAL AMERICAN CORP. AND SUBSIDIARIES
NOTES TO CONSOLIDATED FINANCIAL STATEMENTS (Continued)
12. INCOME TAXES (Continued)
resulted from this reclassification. The tax effects of temporary differences that give rise to significant portions of the deferred tax assets and deferred tax liabilities are as follows:
| | 2014 | 2013 | |||||
|---|---|---|---|---|---|---|---|
| | (in thousands) | ||||||
Deferred tax assets: | |||||||
Net operating loss carryforwards | $ | 18,002 | $ | 14,255 | |||
Stock-based compensation | 8,205 | 5,762 | |||||
Investments | 1,762 | 1,799 | |||||
Credit carryforwards | 6,001 | 4,940 | |||||
Reserves and other policy liabilities | 3,817 | 2,648 | |||||
Accrued expenses and other liabilities | 20,753 | 15,587 | |||||
Other assets | 2,071 | 2,034 | |||||
| | | | | | | | |
Total gross deferred tax assets | 60,611 | 47,025 | |||||
Less valuation allowance | (15,466 | ) | (11,315 | ) | |||
| | | | | | | | |
Net deferred tax assets | 45,145 | 35,710 | |||||
Deferred tax liabilities: | |||||||
Deferred policy acquisition costs | (17,372 | ) | (23,871 | ) | |||
Present value of future profits and other intangible assets | (2,365 | ) | (4,275 | ) | |||
Unrealized gains on investments | (6,810 | ) | (3,946 | ) | |||
Other assets | (559 | ) | (856 | ) | |||
| | | | | | | | |
Total gross deferred tax liabilities | (27,106 | ) | (32,948 | ) | |||
| | | | | | | | |
Net deferred tax asset | $ | 18,039 | $ | 2,762 | |||
| | | | | | | | |
| | | | | | | | |
| | | | | | | | |
We establish valuation allowances based on the consideration of both positive and negative evidence. We weigh such evidence through an analysis of future reversals of existing taxable temporary differences, future taxable income exclusive of reversing temporary differences and carryforwards, taxable income in prior carryback years, and our ability to implement prudent and feasible tax planning strategies.
In accordance with ASC Topic 740-10,Income Taxes (ASC 740), a valuation allowance is deemed necessary when, based on the weight of the available evidence, it is more likely than not (a likelihood of more than 50%) that some portion or all of a deferred tax asset will not be realized. The future realization of the tax benefit depends on the existence of sufficient taxable income within the carryback and carryforward periods.
In our consideration of the available evidence, we provided more weight to evidence that was more objectively verifiable. In 2014, significant weight was given to our cumulative income/loss position. Our cumulative loss position at December 31, 2014 was due in large part to the recognition of cumulative ACO expenditures in excess of cumulative revenues for the 2013 and 2014 program years, the recognition of significant legal/settlement costs related to our non-core businesses, primarily APS Healthcare and Traditional Insurance and the recognition of the APS Healthcare goodwill impairment in 2013. While the Company is in a cumulative net loss position over the last three years from a
F-45
UNIVERSAL AMERICAN CORP. AND SUBSIDIARIES
NOTES TO CONSOLIDATED FINANCIAL STATEMENTS (Continued)
12. INCOME TAXES (Continued)
financial reporting perspective, the Company has cumulative pre-tax income over the same period, after these adjustments are made, as shown in the following table:
| | | For the years ended December 31, | |||||||||||
|---|---|---|---|---|---|---|---|---|---|---|---|---|---|
| | Three Year Cumulative (Loss) income | ||||||||||||
| | 2014 | 2013 | 2012 | ||||||||||
| | (in thousands) | ||||||||||||
Pretax (loss) income | $ | (159,528 | ) | $ | (33,926 | ) | $ | (203,236 | ) | $ | 77,634 | ||
Adjustments: | |||||||||||||
APS Healthcare goodwill impairment | 164,757 | — | 164,757 | — | |||||||||
ACO losses | 94,051 | 30,809 | 41,588 | 21,654 | |||||||||
Legal/settlement costs | 35,047 | 28,824 | 6,223 | — | |||||||||
| | | | | | | | | | | | | | |
Adjusted pretax income | $ | 134,327 | $ | 25,707 | $ | 9,332 | $ | 99,288 | |||||
| | | | | | | | | | | | | | |
| | | | | | | | | | | | | | |
| | | | | | | | | | | | | | |
We believe that the negative evidence of our cumulative loss is not indicative of future projected income or our ability to realize the deferred tax assets existing as of December 31, 2014. The remaining deferred tax assets, for which a valuation allowance was not established, relate to amounts that can be realized through future reversals of existing taxable temporary differences, prudent and feasible tax planning strategies and the Company's estimates of future taxable income. Any 2014 U.S. tax losses can be carried back to 2012 subject to certain limitations.
The significant acquired tax attributes that create deferred tax assets include net operating loss and foreign tax credit carryforwards. To use the foreign tax credit carryforwards, two conditions must be met. There must be foreign source income and there must be taxable income after application of any loss carryforwards. Based upon reversing timing items and projected income we expect taxable income to be sufficient to utilize the entire operating loss carryforward. However, we do not expect to have sufficient foreign source income to fully utilize the acquired foreign tax credit carryforwards. Consequently, we established a valuation allowance of $0.8 million against the foreign tax credit carryforwards as of December 31, 2014.
For state and foreign deferred tax assets an analysis was performed considering taxable unit (consolidated or separate filing) and taxing jurisdiction (federal, state or Puerto Rico). We established valuation allowances for several subsidiaries' state net operating losses, state deferred tax assets as well as for the deferred tax assets of our Puerto Rico subsidiaries for which we do not believe there is sufficient positive evidence to conclude that it is more likely than not that the Company will realize these deferred tax assets.
We carried valuation allowances on our deferred tax assets of $15.5 million at December 31, 2014 and, as reclassified, $11.3 million at December 31, 2013, primarily related to foreign tax credit carryforwards that we acquired in connection with our purchase of APS Healthcare in 2012, deferred tax assets of APS Healthcare's Puerto Rico subsidiaries, state net operating loss carryforwards and deferred income tax assets for various states.
At December 31, 2014, we have $3.3 million of foreign tax credit carryforwards that expire starting in 2015 through 2019 and $0.5 million of domestic and $2.3 million of Puerto Rico alternative minimum tax credits that do not expire. At December 31, 2014 we have net operating loss
F-46
UNIVERSAL AMERICAN CORP. AND SUBSIDIARIES
NOTES TO CONSOLIDATED FINANCIAL STATEMENTS (Continued)
12. INCOME TAXES (Continued)
carryforwards of $22.3 million acquired in connection with our purchase of APS Healthcare in 2012. The net operating loss carryforwards expire starting in 2023 through 2032.
A federal tax return, generally, is open for examination for three years from the date on which it is filed, or, if applicable, from the extended due date unless the statute is extended by mutual consent. In 2013, we entered into an agreement to extend the statute of limitations for our subsidiary, Worlco Management Services, Inc. of NY. We have not entered into any other agreement to extend the statute of limitations of any state tax return for any jurisdiction. During 2014, the IRS finished its examination of the Company's federal consolidated return for the period ending April 30, 2011 and associated net operating loss carryback claims resulting in an expected increase to carryback refund of $0.3 million; the overall carryback claim is subject to review by the Congressional Joint Committee on Taxation. Beginning in 2012, we participate in the Compliance Assurance Process under which the IRS performs a near-contemporaneous examination. Certain earlier returns remain open to the extent that net operating loss carry forwards were used or generated in those years. Also, various state tax returns remain open for examination under specific state statutes of limitation for an additional period of time.
Our unrecognized tax benefits at December 31, 2014 primarily relate to refund claims filed in various state jurisdictions during 2010 and the additional expected benefit from the April 30, 2011 federal return. We expect that a significant portion of the unrecognized state tax benefits will be resolved within the next twelve months based on the time frame in which we expect to actively pursue the collection of the refund claims filed in various state jurisdictions during 2010. Currently an estimate of the range of the possible collections cannot be made due to the uncertainty of the success of the collection efforts. A reconciliation of the beginning and ending amount of unrecognized tax benefits is as follows:
| | 2014 | 2013 | |||||
|---|---|---|---|---|---|---|---|
| | (in thousands) | ||||||
Balance as of January 1 | $ | 2,006 | $ | 5,195 | |||
Additions based on tax positions related to prior years | 300 | — | |||||
Subtractions based upon tax positions related to prior years | (732 | ) | — | ||||
Reduction for lapses in statute of limitations | (444 | ) | (3,189 | ) | |||
| | | | | | | | |
Balance as of December 31 | 1,130 | 2,006 | |||||
Federal income tax effect | (290 | ) | (588 | ) | |||
| | | | | | | | |
Balance, net of tax as of December 31 | $ | 840 | $ | 1,418 | |||
| | | | | | | | |
| | | | | | | | |
| | | | | | | | |
These unrecognized tax benefits, if recognized, will impact the effective tax rate. The unrecognized tax benefits relate to various state refund claims and various federal and state statute of limitation expirations. We recognize interest and penalties related to unrecognized tax benefits in federal and state tax expense. During the year ended December 31, 2014, we recognized no such interest expense and penalties. During the years ended December 31, 2013 and 2012, we recognized $0.5 million and $0.6 million, respectively, of interest expense and penalties. At both December 31, 2014 and 2013, the Company had approximately $0.3 million of interest and penalties accrued.
F-47
UNIVERSAL AMERICAN CORP. AND SUBSIDIARIES
NOTES TO CONSOLIDATED FINANCIAL STATEMENTS (Continued)
13. MANDATORILY REDEEMABLE PREFERRED SHARES
On April 29, 2011, in conjunction with the sale of our Medicare Part D business, Universal American issued an aggregate of $40 million of Series A Mandatorily Redeemable Preferred Shares (the "Series A Preferred Shares"), representing 1,600,000 shares with a par value of $0.01 per share and a liquidation preference of $25.00 per share. The Series A Preferred Shares pay cash dividends at the rate of 8.5% per annum and are mandatorily redeemable on the six year anniversary of the issue date. The proceeds from the sale of the Series A Preferred Shares were used to pay a portion of the existing indebtedness of the Company prior to the sale and transaction expenses. We did not retain any proceeds from the sale of the Series A Preferred Shares. At the closing of the sale of our Medicare Part D business, certain officers and directors of the Company collectively purchased an aggregate of $10 million of the Series A Preferred Shares.
In accordance with ASC 480,Distinguishing Liabilities from Equity, because the issuance of the Series A Preferred Shares imposes an obligation on us requiring the transfer of assets, specifically, cash, at the redemption date, the Series A Preferred Shares are reported as a liability on the consolidated balance sheets, with the related dividends reported as interest expense on the consolidated statements of operations. At December 31, 2014 and 2013 we had accrued $0.7 million of such dividends, recorded in other liabilities in the consolidated balance sheets.
Issue costs of approximately $1.1 million were capitalized in other assets and are being amortized over the six year term of the Series A Preferred Shares.
14. LOAN PAYABLE
2012 Credit Facility
In connection with the acquisition of APS Healthcare, on March 2, 2012, we entered into a credit facility (the "2012 Credit Facility") consisting of a five-year $150 million senior secured term loan and a $75 million senior secured revolving credit facility.
The 2012 Credit Facility contains customary representations and warranties as well as customary affirmative and negative covenants. Negative covenants include, among others, limitations on the incurrence of indebtedness, limitations on the incurrence of liens and limitations on acquisitions, dispositions, investments and restricted payments. In addition, the 2012 Credit Facility contains certain financial covenants relating to minimum risk-based capital, consolidated leverage ratio, and consolidated debt service ratio. The 2012 Credit Facility also contains customary events of default. Upon the occurrence and during the continuance of an event of default, the Lenders may declare the outstanding advances and all other obligations under the 2012 Credit Facility immediately due and payable.
Credit Facility Amendment
On November 4, 2013, we entered into an amendment to our 2012 Credit Facility. The amendment, which was effective beginning with the quarter ended September 30, 2013, suspended certain financial covenants, including the consolidated leverage and debt service ratios, replacing them with total debt to capitalization and minimum liquidity ratios. As of December 31, 2014, and throughout the entire amendment period, we were in compliance with all financial covenants, as amended. These new financial covenants terminated December 31, 2014 and effective January 1, 2015 the original financial covenants were reinstated.
F-48
UNIVERSAL AMERICAN CORP. AND SUBSIDIARIES
NOTES TO CONSOLIDATED FINANCIAL STATEMENTS (Continued)
14. LOAN PAYABLE (Continued)
In connection with the amendment, we prepaid all scheduled 2013 and 2014 principal payments, including the final 2013 payment due December 31, 2013 of $3.6 million and all 2014 scheduled payments totaling $14.3 million. We also paid fees and expenses of approximately $0.5 million, which we had capitalized in other assets and amortized over the term of the amendment.
Our obligations under the Credit Agreement are secured by a first priority security interest in 100% of the capital stock of the Company's material subsidiaries and are also guaranteed by certain of our subsidiaries.
The 2012 Credit Facility bears interest at rates equal to, at our election, LIBOR or the base rate, plus an applicable margin that varies based on our consolidated leverage ratio from 1.75% to 2.50%, in the case of LIBOR loans, and from 0.75% to 1.50% in the case of base rate loans. Effective December 31, 2014, the interest rate on the term loan portion of the 2012 Credit Facility was 2.76%, based on a spread of 2.50% above LIBOR.
We are required to pay a commitment fee on unused availability under the Revolving Facility that varies based on our consolidated leverage ratio, from 0.40% to 0.50% per year. As of the date of this report, we had not drawn on the Revolving Facility.
In connection with the 2012 Credit Facility, we incurred loan origination fees of approximately $5.8 million, which were capitalized and are being amortized on a straight-line basis, which does not differ significantly from the effective yield basis, over the life of the 2012 Credit Facility.
The following table reflects the schedule of principal payments remaining on the credit facility as of December 31, 2014, after giving effect to prepayments made to date and the November 2013 amendment:
| | 2012 Credit Facility (in thousands) | |||
|---|---|---|---|---|
2015 | $ | 14,269 | ||
2016 | 14,269 | |||
2017 | 74,909 | |||
| | | | | |
| $ | 103,447 | |||
| | | | | |
| | | | | |
| | | | | |
We are required to ratably apply any future prepayments through the remaining scheduled repayments.
Principal and Interest Payments
During the year ended December 31, 2014, we made interest payments totaling $2.8 million and other fee payments totaling $0.5 million. We were not required to make any principal payments as all scheduled 2014 principal payments, totaling $14.3 million, were prepaid in 2013, in connection with the amendment of our credit facility on November 4, 2013. Currently, there is a bullet payment of $74.9 million due in 2017. However, as a result of the recent dispositions discussed in Note 5—Business Combinations and Note 26—Subsequent Events, under the 2012 Credit Facility, we have twelve months from receipt of the proceeds to either reinvest those proceeds or make a principal prepayment. If the proceeds are not reinvested, we would need to make prepayments totaling approximately $38 million by
F-49
UNIVERSAL AMERICAN CORP. AND SUBSIDIARIES
NOTES TO CONSOLIDATED FINANCIAL STATEMENTS (Continued)
14. LOAN PAYABLE (Continued)
February 2016. We have elected to prepay $55 million on March 31, 2015, which will fulfill this obligation and provide additional restricted payment flexibility under the 2012 Credit Facility. We are required to ratably apply this prepayment and any other future prepayments through the remaining scheduled repayments, which would change the amount of the quarterly and bullet payments through 2017.
15. DISCLOSURES ABOUT FAIR VALUES OF FINANCIAL INSTRUMENTS
We used the following methods and assumptions estimate the fair value of each class of financial instruments for which it is practicable to estimate that value:
Fixed maturity investments available for sale: The fair value for fixed maturity securities is largely determined by third party pricing service market prices. Typical inputs used by third party pricing services include, but are not limited to:
- •
- reported trades,
- •
- benchmark yields,
- •
- issuer spreads,
- •
- bids,
- •
- offers and
- •
- estimated cash flows and prepayment speeds.
Based on the typical trading volumes and the lack of quoted market prices for fixed maturities, third party pricing services will normally derive the security prices through recent reported trades for identical or similar securities making adjustments through the reporting date based upon available market observable information as outlined above. If there are no recent reported trades, the third party pricing services may use matrix or model processes to develop a security price where they develop future cash flow expectations based upon collateral performance and discount these at an estimated market rate. The pricing for mortgage-backed and asset-backed securities reflects estimates of the rate of future prepayments of principal over the remaining life of the securities. These estimates are derived based on the characteristics of the underlying structure and prepayment speeds previously experienced at the interest rate levels projected for the underlying collateral. Actual prepayment experience may vary from these estimates.
Short-term investments and Cash and cash equivalents: For short-term investments and cash and cash equivalents, the carrying amount is a reasonable estimate of fair value.
Other invested assets: Other invested assets consists of cost-basis equity investments which are carried at the lower of cost or fair value, equity securities which are carried at their current fair value of $14.1 million, policy loans for which the carrying amount is a reasonable estimate of fair value, collateralized loans which are carried at the underlying collateral value, cash value of life insurance and mortgage loans which are carried at the aggregate unpaid balance. Other than the equity securities, the determination of fair value for these invested assets is not practical because there is no active trading market for such invested assets and therefore, the carrying value is a reasonable estimate of fair value.
F-50
UNIVERSAL AMERICAN CORP. AND SUBSIDIARIES
NOTES TO CONSOLIDATED FINANCIAL STATEMENTS (Continued)
15. DISCLOSURES ABOUT FAIR VALUES OF FINANCIAL INSTRUMENTS (Continued)
Investment contract liabilities: For annuity contracts, the carrying amount is the policyholder account value; estimated fair value equals the policyholder account value less surrender charges. These balances are 100% ceded.
Series A mandatorily redeemable preferred shares: For the Series A mandatorily redeemable preferred shares fair value represents the present value of contractual cash flows discounted at current market rates for securities of equivalent credit quality.
Loan payable: For the loan payable, fair value represents the present value of contractual cash flows discounted at current spreads for equivalent credit quality.
The estimated fair values of the Company's financial instruments are as follows:
| | 2014 | 2013 | |||||||||||
|---|---|---|---|---|---|---|---|---|---|---|---|---|---|
| | Carrying Amount | Fair Value | Carrying Amount | Fair Value | |||||||||
| | (in thousands) | ||||||||||||
Financial assets: | |||||||||||||
Fixed maturities available for sale | $ | 845,453 | $ | 845,453 | $ | 933,398 | $ | 933,398 | |||||
Short-term investments | 8,994 | 8,994 | — | — | |||||||||
Other invested assets | 25,920 | 25,920 | 22,575 | 22,575 | |||||||||
Cash and cash equivalents | 127,985 | 127,985 | 69,574 | 69,574 | |||||||||
Financial liabilities: | |||||||||||||
Investment contract liabilities | 126,946 | 126,685 | 137,465 | 136,855 | |||||||||
Series A mandatorily redeemable preferred shares | 40,000 | 41,571 | 40,000 | 41,985 | |||||||||
Loan payable | 103,447 | 103,059 | 103,447 | 101,637 | |||||||||
16. EARNINGS PER COMMON SHARE
Diluted EPS includes the dilutive effect of the unvested restricted stock and stock options outstanding during the year. We excluded 1.9 million and 5.2 million stock options from the computation of diluted EPS at December 31, 2013 and 2012, respectively, because they were antidilutive. There were no antidilutive stock options at December 31, 2014.
The calculation of the diluted loss per common share for the year ended December 31, 2014 and 2013 presented in the consolidated statements of operations excludes 0.6 million and 0.3 million of common stock equivalents from stock options and unvested restricted stock that are potentially dilutive because to include them would be antidilutive when reporting a net loss.
17. STOCKHOLDERS' EQUITY
Preferred Stock
We currently have 40 million shares of preferred stock authorized for issuance, of which 1.6 million shares of Series A Mandatorily Redeemable Preferred Shares are issued and outstanding at December 31, 2014 and 2013. These amounts are recorded as a liability on the consolidated balance sheets (see Note 13—Mandatorily Redeemable Preferred Shares).
F-51
UNIVERSAL AMERICAN CORP. AND SUBSIDIARIES
NOTES TO CONSOLIDATED FINANCIAL STATEMENTS (Continued)
17. STOCKHOLDERS' EQUITY (Continued)
Common Stock—Voting
We currently have 400 million shares of voting common stock, par value $0.01 per share authorized for issuance. Changes in the number of shares of common stock issued were as follows (in thousands):
| | 2014 | 2013 | |||||
|---|---|---|---|---|---|---|---|
Common stock issued, beginning of year | 85,492 | 84,963 | |||||
Net issuance of common stock | 909 | 520 | |||||
Exercise of stock options | 35 | 9 | |||||
Retired shares | (6,000 | ) | — | ||||
| | | | | | | | |
Common stock issued, end of year | 80,436 | 85,492 | |||||
| | | | | | | | |
| | | | | | | | |
| | | | | | | | |
On August 1, 2013, our Board of Directors approved a stock repurchase plan that authorized the repurchase of up to $40 million of our outstanding common stock. Purchases may occur from time to time in the open market, in privately negotiated transactions, or otherwise as market conditions permit.
On May 13, 2014 we repurchased and retired six million shares of our common stock directly from funds associated with Capital Z Partners Management, LLC at a price of $6.03 per share for total consideration of $36.2 million. We used cash on hand to fund the repurchase of these shares.
Common Stock—Non-Voting
We currently have 60 million shares of non-voting common stock, par value $0.01 per share authorized for issuance, of which 3.3 million shares are issued and outstanding at December 31, 2014, and 2013.
F-52
UNIVERSAL AMERICAN CORP. AND SUBSIDIARIES
NOTES TO CONSOLIDATED FINANCIAL STATEMENTS (Continued)
18. ACCUMULATED OTHER COMPREHENSIVE INCOME
The components of accumulated other comprehensive income, net of tax, are as follows (in thousands):
| | Net Unrealized Gains (Losses) on Investments Available for Sale | Gross Unrealized OTTI | Long-Term Claim Reserve Adjustment | Accumulated Other Comprehensive Income | |||||||||
|---|---|---|---|---|---|---|---|---|---|---|---|---|---|
December 31, 2014 | |||||||||||||
Balance as of January 1, 2014 | $ | 13,909 | $ | (1,107 | ) | $ | (5,473 | ) | $ | 7,329 | |||
Other comprehensive income before reclassifications | 6,001 | 1,107 | (967 | ) | 6,141 | ||||||||
Amounts reclassified from other comprehensive income | 822 | — | — | 822 | |||||||||
| | | | | | | | | | | | | | |
Net current-period other comprehensive income | 5,179 | 1,107 | (967 | ) | 5,319 | ||||||||
| | | | | | | | | | | | | | |
Balance as of December 31, 2014 | $ | 19,088 | $ | — | $ | (6,440 | ) | $ | 12,648 | ||||
| | | | | | | | | | | | | | |
| | | | | | | | | | | | | | |
| | | | | | | | | | | | | | |
December 31, 2013 | |||||||||||||
Balance as of January 1, 2013 | $ | 39,934 | $ | (3,010 | ) | $ | (7,835 | ) | $ | 29,089 | |||
Other comprehensive (loss) income before reclassifications | (17,014 | ) | 1,903 | 2,362 | (12,749 | ) | |||||||
Amounts reclassified from accumulated other comprehensive income | 9,011 | — | — | 9,011 | |||||||||
| | | | | | | | | | | | | | |
Net current-period other comprehensive loss | (26,025 | ) | 1,903 | 2,362 | (21,760 | ) | |||||||
| | | | | | | | | | | | | | |
Balance as of December 31, 2013 | $ | 13,909 | $ | (1,107 | ) | $ | (5,473 | ) | $ | 7,329 | |||
| | | | | | | | | | | | | | |
| | | | | | | | | | | | | | |
| | | | | | | | | | | | | | |
19. STOCK-BASED COMPENSATION
In 2011, we established the Universal American Corp. 2011 Omnibus Equity Award Plan (the "2011 Plan") to replace the 1998 Incentive Compensation Plan (the "1998 ICP"). The 2011 Plan is the sole active plan providing for the granting of various types of equity awards, including stock options, stock appreciation rights, restricted stock, restricted stock units, and other stock-based awards and/or performance compensation awards. The 2011 Plan is administered by the Compensation Committee of the Board of Directors. The aggregate number of shares of common stock available for awards under the 2011 Plan is 13,000,000. Universal American's stock-based compensation expense relates to the equity awards granted under the 2011 Plan as well as restricted stock and performance share awards that were granted under the 1998 ICP.
F-53
UNIVERSAL AMERICAN CORP. AND SUBSIDIARIES
NOTES TO CONSOLIDATED FINANCIAL STATEMENTS (Continued)
19. STOCK-BASED COMPENSATION (Continued)
Compensation expense, included in other operating costs and expenses, and the related tax benefit were as follows:
| | 2014 | 2013 | 2012 | |||||||
|---|---|---|---|---|---|---|---|---|---|---|
| | (in thousands) | |||||||||
Stock options | $ | 4,658 | $ | 4,330 | $ | 4,897 | ||||
Restricted stock awards | 5,389 | 3,727 | 4,422 | |||||||
| | | | | | | | | | | |
Total stock-based compensation expense | 10,047 | 8,057 | 9,319 | |||||||
Tax benefit recognized(1) | 5,994 | 1,743 | 2,144 | |||||||
| | | | | | | | | | | |
Stock-based compensation expense, net of tax | $ | 4,053 | $ | 6,314 | $ | 7,175 | ||||
| | | | | | | | | | | |
| | | | | | | | | | | |
| | | | | | | | | | | |
- (1)
- Tax benefit recognized in 2014, 2013 and 2012 includes the estimated effect of non-deductible compensation costs. The tax benefit recognized in 2014 also includes a benefit of $2.5 million from prior years that we previously estimated to be non-deductible. See Note 12—Income Taxes, for further discussion.
Stock Option Awards
We recognize compensation cost for share-based payments to employees, directors and other third parties based on the grant date fair value of the award, which we amortize over the grantees' service period in accordance with the provisions ofCompensation—Stock Compensation Topic, ASC 718-10. We use the Black-Scholes valuation model to value stock options.
We estimated the fair value for options granted during the period at the date of grant using a Black-Scholes option pricing model with the following range of assumptions:
| | For options granted | |||||
|---|---|---|---|---|---|---|
| | 2014 | 2013 | 2012 | |||
Weighted-average grant date fair value | $2.11 - $2.59 | $2.27 - $3.33 | $2.92 - $4.04 | |||
Risk free interest rates | 0.90% - 1.43% | 0.50% - 1.11% | 0.35% - 0.90% | |||
Dividend yields | 0.00% | 0.00% | 0.00% | |||
Expected volatility | 36.66% - 39.49% | 39.29% - 41.72% | 41.76% - 47.08% | |||
Expected lives of options (in years) | 3.75 | 3.75 | 2.5 - 3.75 | |||
We did not capitalize any cost of stock-based compensation. Future expense may vary based upon factors such as the number of awards granted by us and the then-current fair value of such awards.
F-54
UNIVERSAL AMERICAN CORP. AND SUBSIDIARIES
NOTES TO CONSOLIDATED FINANCIAL STATEMENTS (Continued)
19. STOCK-BASED COMPENSATION (Continued)
A summary of option activity for the year ended December 31, 2014 is set forth below:
Options | Options (in thousands) | Weighted Average Exercise Price | |||||
|---|---|---|---|---|---|---|---|
Outstanding at January 1, 2014 | 5,692 | $ | 7.37 | ||||
Granted | 1,742 | 7.22 | |||||
Exercised | (273 | ) | 6.88 | ||||
Forfeited or expired | (1,168 | ) | 7.34 | ||||
| | | | | | | | |
Outstanding at December 31, 2014 | 5,993 | $ | 7.36 | ||||
| | | | | | | | |
| | | | | | | | |
| | | | | | | | |
| | Shares Under Options | Weighted Average Exercise Price | Weighted Average Remaining Contractual Term | Aggregate Intrinsic Value Per Share(1) | Aggregate Intrinsic Value | |||||||||||
|---|---|---|---|---|---|---|---|---|---|---|---|---|---|---|---|---|
| | (in thousands) | | | | (in thousands) | |||||||||||
Options exercisable at December 31, 2014 | 2,342 | $ | 7.35 | 2.0 | $ | 1.93 | $ | 4,514 | ||||||||
Options vested and expected to vest at December 31, 2014(2) | 5,846 | $ | 7.36 | 2.7 | $ | 1.92 | $ | 11,248 | ||||||||
- (1)
- Computed based upon aggregate intrinsic value divided by shares under options.
- (2)
- The Company estimates forfeitures in accordance with ASC 718-10,Compensation—Stock Compensation.
The total intrinsic value of stock options (the amount by which the market price of the stock on the date of exercise exceeded the exercise price of the option) exercised during 2014, 2013 and 2012 were $0.3 million, $0.1 million and $0.1 million, respectively.
We received proceeds of $1.9 million, $0.6 million, and $0.2 million from the exercise of stock options during the years ended December 31, 2014, 2013, and 2012, respectively.
As of December 31, 2014, the total compensation cost related to non-vested awards not yet recognized was $7.1 million, which we expect to recognize over a weighted average period of 2.2 years.
Restricted Stock Awards
In accordance with our 2011 Equity Plan, we may grant restricted stock to employees, directors and other third parties. These awards generally vest ratably over a four-year period; however during the years ended December 31, 2014 and 2013 we paid a portion of the annual bonuses in the form of restricted stock. The 2014 and 2013 awards vest under certain circumstances on the one-year and two-year anniversary of the grant, respectively. We generally value restricted stock awards at an amount equal to the market price of our common stock on the date of grant. We recognize compensation expense for restricted stock awards on a straight line basis over the vesting period.
F-55
UNIVERSAL AMERICAN CORP. AND SUBSIDIARIES
NOTES TO CONSOLIDATED FINANCIAL STATEMENTS (Continued)
19. STOCK-BASED COMPENSATION (Continued)
A summary of our non-vested restricted stock awards for the year ended December 31, 2014 is set forth below:
Non-Vested Restricted Stock | Shares (in thousands) | Weighted Average Grant-Date Fair Value | |||||
|---|---|---|---|---|---|---|---|
Non-vested at January 1, 2014 | 1,333 | $ | 9.54 | ||||
Granted | 1,497 | 6.99 | |||||
Vested | (364 | ) | 9.94 | ||||
Forfeited | (469 | ) | 8.05 | ||||
| | | | | | | | |
Non-vested at December 31, 2014 | 1,997 | $ | 7.90 | ||||
| | | | | | | | |
| | | | | | | | |
| | | | | | | | |
The total fair value of shares of restricted stock vested during the years ended December 31, 2014, 2013 and 2012 was $2.7 million, $2.7 million and $1.2 million, respectively.
Tax Benefits of Stock-Based Compensation
ASC 718-10 requires us to report the benefits of tax deductions in excess of recognized compensation cost as a financing cash flow. We recognized $(1.0) million, $0.4 million and $4.0 million of financing cash flows for these excess tax deductions for years ended December 31, 2014, 2013 and 2012, respectively.
20. UNIVERSAL AMERICAN CORP. 401(k) SAVINGS PLAN
Effective April 1, 1992, we adopted the Universal American Corp. 401(k) Savings Plan. The 401(k) plan is a voluntary contributory plan under which employees may elect to defer compensation for federal income tax purposes under Section 401(k) of the Internal Revenue Code of 1986. The employee is entitled to participate in the 401(k) plan by contributing through payroll deductions up to 100% of the employee's compensation. The participating employee is not taxed on these contributions until they are distributed. Amounts credited to employee's accounts under the 401(k) plan are invested by the employer-appointed investment committee. Currently, we match employee contributions with our common stock in amounts equal to 100% of the employee's first 1% of contributions and 50% of the employee's next 4% of contributions to a maximum matching contribution of 3% of the employee's eligible compensation. Our matching contributions vest at the rate of 25% per plan year, starting at the end of the second year.
Participants have the option to transfer/reallocate at will, outside of blackout periods, both vested and unvested employer contributions invested in our common stock to any of the other investments available under the 401(k) plan. The 401(k) plan held 1.3 million shares of our common stock at December 31, 2014, which represented 14% of total plan assets and 1.3 million shares of our common stock at December 31, 2013, which represented 11% of total plan assets.
Generally, a participating employee is entitled to distributions from the 401(k) plan upon termination of employment, retirement, death or disability. 401(k) plan participants who qualify for distributions may receive a single lump sum, have the assets transferred to another qualified plan or individual retirement account, or receive a series of specified installment payments.
F-56
UNIVERSAL AMERICAN CORP. AND SUBSIDIARIES
NOTES TO CONSOLIDATED FINANCIAL STATEMENTS (Continued)
20. UNIVERSAL AMERICAN CORP. 401(k) SAVINGS PLAN (Continued)
In June 2013, we combined the Universal American Corp. 401(k) Savings Plan and the APS Healthcare 401(k) Savings Plan for its non-Puerto Rico employees into one new 401(k) Plan. Plan eligibility, company matching and vesting rates remain unchanged in accordance with the former Universal American Corp. 401(k) Savings Plan.
We made discretionary matching contributions under the 401(k) plan of $2.7 million in 2014, $2.5 million in 2013 and, excluding the former APS Healthcare Plan discussed above, we made contributions of $1.9 million in 2012.
APS Healthcare Puerto Rico Inc., a wholly owned subsidiary of APS Healthcare, sponsors its own 1165(e) defined contribution plan covering substantially all of its employees. Participants are allowed to contribute up to a maximum of $15,000 of their pretax salary, not exceeding the maximum deferral amount specified by Puerto Rico law. APS Healthcare Puerto Rico matches 50% of the first 6% of compensation that a participant contributes to the Plan. Employer matching contributions were $0.2 million and $0.1 million in 2014 and 2013, respectively and $0.1 million for the period from acquisition through December 31, 2012.
21. STATUTORY FINANCIAL DATA AND DIVIDEND RESTRICTIONS
Statutory Financial Data
Our insurance subsidiaries are required to maintain minimum amounts of statutory capital and surplus as required by regulatory authorities. However, substantially more than such minimum amounts are needed to meet statutory and administrative requirements of adequate capital and surplus to support the current level of our insurance subsidiaries' operations. Each of the insurance subsidiaries' statutory are at levels we believe are sufficient to support their currently anticipated levels of operation. Additionally, the National Association of Insurance Commissioners, known as NAIC, imposes regulatory risk-based capital, known as RBC, requirements on insurance companies. At December 31, 2014, all of our insurance subsidiaries maintained ratios of total adjusted capital to RBC in excess of the "authorized control level." The combined statutory capital and surplus, including asset valuation reserve, of the insurance subsidiaries totaled $255.9 million and $279.3 million at December 31, 2014 and 2013, respectively. For the years ended December 31, 2014, 2013 and 2012, the insurance subsidiaries generated statutory net (loss) income of $(3.1) million, $39.4 million and $43.4 million, respectively.
Our HMO companies are also required to maintain minimum amounts of capital and surplus, as required by regulatory authorities and are also subject to RBC requirements. At December 31, 2014, the statutory capital and surplus of each of our HMO affiliates exceeds its minimum requirement and its RBC is in excess of the "authorized control level." The statutory capital and surplus for our HMO affiliates was $94.0 million and $94.5 million at December 31, 2014 and 2013, respectively. Statutory net income for our HMO affiliates was $10.4 million, $14.2 million and $22.6 million for the years ended December 31, 2014, 2013 and 2012, respectively.
Based on current estimates, we expect the aggregate amount of dividends that may be paid to our parent company in 2015 without prior approval by state regulatory authorities is approximately $27 million.
F-57
UNIVERSAL AMERICAN CORP. AND SUBSIDIARIES
NOTES TO CONSOLIDATED FINANCIAL STATEMENTS (Continued)
21. STATUTORY FINANCIAL DATA AND DIVIDEND RESTRICTIONS (Continued)
Shareholder Dividend Restrictions
The payment of dividends to our shareholders is subject to the following restrictions:
- •
- the ability of our operating subsidiaries to pay dividends to our parent holding company, which is governed by state law;
- •
- provisions in our credit agreement which limit certain restricted payments, including dividends to shareholders; and
- •
- Delaware law, governing the payment of dividends, which provides that dividends can only be paid out of surplus.
22. OTHER OPERATIONAL DISCLOSURES
Restructuring Charges: Over the last several years, we have initiated and executed various restructuring plans, as discussed below.
Workforce Reduction—In 2014, we made the decision to exit certain non-core markets in our Medicare Advantage business, stopped our participation in several underperforming ACOs, chose not to rebid on certain APS Healthcare contracts and exited the New York Health Benefits Exchange, known as the Exchange. In addition to execution of the staff reduction plan put in place in late 2013, during the fourth quarter of 2014 we committed to further staff reductions across all segments continuing into 2015, resulting in a charge of $2.0 million.
In 2013, in order to reduce expense levels across the organization in response to lower levels of business in APS Healthcare and membership in our Medicare Advantage plans, in particular, and to help address the cost increase beginning in 2014 related to the Affordable Care Act's fee on certain health insurance premiums, a workforce reduction plan was developed for implementation in late 2013 and 2014. As a result, in the fourth quarter of 2013, we committed to a plan to reduce our workforce in targeted areas, resulting in a charge of $7.1 million in severance and other benefits related to this plan.
In connection with the March 2012 APS Healthcare acquisition, we reviewed the operations of both organizations, looking for opportunities to eliminate redundant functions and gain operating efficiencies. As a result, in the fourth quarter of 2012, we committed to a plan to reduce our workforce in targeted areas resulting in a charge of $4.1 million in severance and other benefits related to this plan.
In 2012, we launched our ACO business and began operations for thirty ACOs. In addition, during 2012, we expanded our Stars support for our Medicare Advantage business. As a result of these developments, we elected to retain certain staff that was previously targeted for workforce reduction to work on these new initiatives. As a result, approximately $2.3 million of the December 31, 2011 restructuring accrual was able to be released in 2012.
During 2014, we made payments of $4.5 million in connection with these restructuring programs, and have $3.7 million accrued at December 31, 2014, which we expect to pay in 2015.
New York Health Benefits Exchange Exit—During the fourth quarter of 2014, we made the decision to discontinue our participation in the Exchange, effective January 1, 2015. In connection with this
F-58
UNIVERSAL AMERICAN CORP. AND SUBSIDIARIES
NOTES TO CONSOLIDATED FINANCIAL STATEMENTS (Continued)
22. OTHER OPERATIONAL DISCLOSURES (Continued)
decision, at December 31, 2014, we accrued $0.8 million related to certain contractual charges we are committed to paying in 2015 related to the Exchange.
Facility Consolidation—We had several leased properties that were vacated in connection with the closure of our Career Agency operations in 2011, resulting in a charge of $250,000 related to our remaining lease obligations on those properties. We continue to amortize this balance against actual lease payments.
A summary of our restructuring liability balance as of December 31, 2014, 2013, and 2012 and restructuring activity for the years then ended is as follows:
| | Segment | January 1, Balance | Charge to Earnings(1) | Cash Paid | Non-cash | December 31, Balance | ||||||||||||
|---|---|---|---|---|---|---|---|---|---|---|---|---|---|---|---|---|---|---|
| | | (in thousands) | ||||||||||||||||
2014 | ||||||||||||||||||
Workforce reduction | Corporate & Other | $ | 6,246 | $ | 2,005 | $ | (4,521 | ) | $ | — | $ | 3,730 | ||||||
NY Exchange exit | Corporate & Other | — | 804 | — | — | 804 | ||||||||||||
Facility consolidation | Traditional | 222 | — | — | (116 | ) | 106 | |||||||||||
| | | | | | | | | | | | | | | | | | | |
Total | $ | 6,468 | $ | 2,809 | $ | (4,521 | ) | $ | (116 | ) | $ | 4,640 | ||||||
| | | | | | | | | | | | | | | | | | | |
| | | | | | | | | | | | | | | | | | | |
| | | | | | | | | | | | | | | | | | | |
2013 | ||||||||||||||||||
Workforce reduction | Corporate & Other | $ | 3,800 | $ | 7,209 | $ | (4,080 | ) | $ | (683 | ) | $ | 6,246 | |||||
Facility consolidation | Corporate & Other | 130 | — | — | (130 | ) | — | |||||||||||
Facility consolidation | Traditional | 334 | — | — | (112 | ) | 222 | |||||||||||
| | | | | | | | | | | | | | | | | | | |
Total | $ | 4,264 | $ | 7,209 | $ | (4,080 | ) | $ | (925 | ) | $ | 6,468 | ||||||
| | | | | | | | | | | | | | | | | | | |
| | | | | | | | | | | | | | | | | | | |
| | | | | | | | | | | | | | | | | | | |
2012 | ||||||||||||||||||
Workforce reduction | Corporate & Other | $ | 3,995 | $ | 4,109 | $ | (1,995 | ) | $ | (2,309 | ) | $ | 3,800 | |||||
Facility consolidation | Corporate & Other | 250 | — | — | (120 | ) | 130 | |||||||||||
Facility consolidation | Traditional | 443 | — | — | (109 | ) | 334 | |||||||||||
| | | | | | | | | | | | | | | | | | | |
Total | $ | 4,688 | $ | 4,109 | $ | (1,995 | ) | $ | (2,538 | ) | $ | 4,264 | ||||||
| | | | | | | | | | | | | | | | | | | |
| | | | | | | | | | | | | | | | | | | |
| | | | | | | | | | | | | | | | | | | |
- (1)
- Included in Other operating costs and expenses in our consolidated statements of operations.
Special Cash Dividend: On August 1, 2013, the Board of Directors approved the payment of a special cash dividend of $1.60 per share, payable on August 19, 2013 to shareholders of record as of August 12, 2013. The total dividend payment was $142.1 million of which $139.9 million was paid on August 19, 2013. We also established a $2.2 million dividend payable liability to record amounts expected to be paid in the future to holders of our restricted stock as such shares vest. This liability was $1.2 million and $2.1 million at December 31, 2014 and 2013, respectively, and is included in other liabilities in the consolidated balance sheets. In addition, pursuant to the terms of our 2011 Equity Award Plan, the exercise price on outstanding stock options was reduced by the amount of the dividend. This dividend is a liquidating dividend and was recorded as a reduction of additional paid-in capital.
Unconsolidated Subsidiaries: We account for our participation in the ACOs using the equity method. Gains and losses from our participation in the ACOs are reported as equity in losses of
F-59
UNIVERSAL AMERICAN CORP. AND SUBSIDIARIES
NOTES TO CONSOLIDATED FINANCIAL STATEMENTS (Continued)
22. OTHER OPERATIONAL DISCLOSURES (Continued)
unconsolidated subsidiaries in the consolidated statements of operations. Our net investment in the ACOs is reported in other assets in the consolidated balance sheets. During the years ended December 31, 2014, 2013 and 2012, we recognized $10.8 million, $33.6 million and $10.2 million, respectively, of losses from our ACO arrangements, primarily related to operating expenses and start-up costs.
During September 2014, we received notice that the ACOs we formed in partnership with primary care physicians and other healthcare professionals generated $66 million in total program savings for CMS, as part of the Medicare Shared Savings Program for the first performance year of the MSSP (2012 and 2013). Of our 30 ACOs with start dates in 2012 and 2013, the results showed that:
- •
- 3 ACOs, serving more than 56,000 Medicare beneficiaries and including our largest ACO in Houston, generated savings in excess of their Minimum Savings Rate and therefore, qualified to share those savings with CMS;
- •
- 11 ACOs, serving more than 120,000 Medicare beneficiaries, generated savings but fell below their Minimum Savings Rate required to share savings with CMS;
- •
- 8 ACOs were within 2 percent of their benchmark;
- •
- 8 ACOs were 2 percent or more above their benchmark; and
- •
- All ACOs met CMS's quality reporting standards.
The three ACOs qualifying for savings received payments of $20.4 million, part to be shared between the physicians of those ACOs and us and part to be used by us to reimburse a portion of the costs that we had incurred. Our share of these savings, including expense recovery, amounted to $13.4 million, which is reflected in equity in losses of unconsolidated subsidiaries in our consolidated statements of operations. We received these payments in October 2014. We did not recognize any shared savings revenue in 2013 or 2012.
�� For additional information on the ACOs, see Note 1—Organization and Company Background and Note 2—Basis of Presentation. The condensed financial information for 100% of our unconsolidated ACOs is as follows:
| | December 31, | ||||||
|---|---|---|---|---|---|---|---|
| | 2014 | 2013 | |||||
| | (in thousands) | ||||||
Total assets | $ | 152 | $ | — | |||
| | | | | | | | |
| | | | | | | | |
| | | | | | | | |
Total liabilities | $ | 56,091 | $ | 43,605 | |||
| | | | | | | | |
| | | | | | | | |
| | | | | | | | |
| | For the year ended December 31, | |||||||||
|---|---|---|---|---|---|---|---|---|---|---|
| | 2014 | 2013 | 2012 | |||||||
| | (in thousands) | |||||||||
Total revenue | $ | 20,357 | $ | — | $ | — | ||||
Total expenses | 31,168 | 33,602 | 10,222 | |||||||
| | | | | | | | | | | |
Loss | $ | (10,811 | ) | $ | (33,602 | ) | $ | (10,222 | ) | |
| | | | | | | | | | | |
| | | | | | | | | | | |
| | | | | | | | | | | |
F-60
UNIVERSAL AMERICAN CORP. AND SUBSIDIARIES
NOTES TO CONSOLIDATED FINANCIAL STATEMENTS (Continued)
22. OTHER OPERATIONAL DISCLOSURES (Continued)
Supplemental Cash Flow Information:
| | 2014 | 2013 | 2012 | |||||||
|---|---|---|---|---|---|---|---|---|---|---|
| | (in thousands) | |||||||||
Cash paid for interest | $ | 6,229 | $ | 6,609 | $ | 6,125 | ||||
| | | | | | | | | | | |
| | | | | | | | | | | |
| | | | | | | | | | | |
Cash (received) paid for income taxes | $ | (357 | ) | $ | 18,974 | $ | 4,372 | |||
| | | | | | | | | | | |
| | | | | | | | | | | |
| | | | | | | | | | | |
23. COMMITMENTS AND CONTINGENCIES
Legal Proceedings
In addition to the matters discussed below, we are also subject to a variety of legal proceedings, arbitrations, investigations, audits, claims and litigation, including claims under the False Claims Act and claims for benefits under insurance policies and claims by members, providers, customers, employees, regulators and other third parties. In some cases, plaintiffs seek punitive damages. It is not possible to accurately predict the outcome or estimate the resulting penalty, fine or other remedy that may result from any current or future legal proceeding, investigation, audit, claim or litigation. Nevertheless, the range of outcomes and losses could be significant and could have a material adverse effect on our consolidated financial position, results of operations, or cash flows.
On October 22, 2013, we filed a lawsuit in the United States District Court for the District of Delaware against funds affiliated with the private equity firm GTCR ("GTCR"), David Katz, a former managing director of GTCR, and former senior management of APS Healthcare (Gregory Scott, Jerome Vaccaro and John McDonough, all such defendants, collectively, the "Defendants"). The lawsuit, which alleges securities fraud, multiple material breaches of contract and common law fraud, seeks substantial damages, including punitive damages. The lawsuit arises out of our acquisition of APS Healthcare from GTCR in March 2012. The Defendants filed a motion to dismiss the complaint. In a decision issued on July 24, 2014, the court denied the motion with respect to the breach of contract claim. The court granted the motion with respect to the securities fraud claims and portions of the common law fraud claims on the ground that they did not provide enough detail about each Defendant's specific role in the alleged fraud. On September 22, 2014, the Company filed an Amended Complaint to provide additional details regarding each Defendant's role in the alleged fraud. We are awaiting a decision from the court on the Defendant's motion to dismiss.
Government Regulations
Laws and regulations governing Medicare, Medicaid and other state and federal healthcare and insurance programs are complex and subject to significant interpretation. As part of the ACA, CMS, State regulatory agencies and other regulatory agencies have been exercising increased oversight and regulatory authority over our Medicare and other businesses. Compliance with such laws and regulations is subject to CMS audit, other governmental review and investigation and significant and complex interpretation. CMS audits our Medicare Advantage plans with regularity to ensure we are in compliance with applicable laws, rules, regulations and CMS instructions. There can be no assurance that we will be found to be in compliance with all such laws, rules and regulations in connection with these audits, reviews and investigations, and at times we have been found to be out of compliance. Failure to be in compliance can subject us to significant regulatory action including significant fines,
F-61
UNIVERSAL AMERICAN CORP. AND SUBSIDIARIES
NOTES TO CONSOLIDATED FINANCIAL STATEMENTS (Continued)
23. COMMITMENTS AND CONTINGENCIES (Continued)
penalties, cancellation of contracts with governmental agencies or operating restrictions on our business, including, without limitation, suspension of our ability to market to and enroll new members in our Medicare plans, termination of our contracts with CMS, exclusion from Medicare and other state and federal healthcare programs and inability to expand into new markets or add new products within existing markets.
Certain of our subsidiaries provide products and services to various government agencies. As a government contractor, we are subject to the terms of the contracts we have with those agencies and applicable laws governing government contracts. As such, we may be subject to false claim act litigation (also known as qui tam litigation) brought by individuals who seek to sue on behalf of the government, alleging that the government contractor submitted false claims to the government. In 2014 and 2015, Innovative Resources Group, LLC ("IRG"), a subsidiary of APS Healthcare, resolved three false claims act matters relating to IRG's historical contracts in Missouri, Tennessee and Nevada. It is possible that IRG, other APS Healthcare subsidiaries or other Universal American companies could be the subject of additional false claims act investigations and litigation in the future that could have a material adverse effect on our business and results of operations.
Lease Obligations
We are obligated under lease agreements for our corporate headquarters located in White Plains, New York, as well as offices in Lake Mary, Florida; Houston, Texas; Syracuse, New York; Brookfield, Wisconsin; Columbia, Maryland and Mechanicsburg, Pennsylvania. In addition, we maintain other smaller, local offices to support Medicaid contracts. Rent expense was $12.4 million, $13.9 million, and $12.6 million for the years ended December 31, 2014, 2013 and 2012, respectively. Annual minimum rental commitments, subject to escalation, under non-cancelable operating lease (in thousands) are as follows:
2015 | $ | 9,813 | ||
2016 | 7,524 | |||
2017 | 5,372 | |||
2018 | 3,207 | |||
2019 | 1,412 | |||
Thereafter | 2,456 | |||
| | | | | |
Total | $ | 29,784 | ||
| | | | | |
| | | | | |
| | | | | |
24. BUSINESS SEGMENT INFORMATION
As a result of the growth of our ACOs and Total Care, we have modified the way we manage and report our business. Our Medicare Advantage and Traditional Insurance segments remain unchanged; however, we have split our ACO and Total Care businesses from the Corporate & Other segment to form two new segments—Management Services Organization, or MSO, and Medicaid, respectively. We will continue to report the activities of our holding company, the operations of APS Healthcare and other ancillary operations in our Corporate & Other segment. We have made reclassifications to confirm prior year amounts to the current year presentation.
F-62
UNIVERSAL AMERICAN CORP. AND SUBSIDIARIES
NOTES TO CONSOLIDATED FINANCIAL STATEMENTS (Continued)
24. BUSINESS SEGMENT INFORMATION (Continued)
A description of our business segments is as follows:
Medicare Advantage—The Medicare Advantage segment contains the operations of our initiatives in managed care for seniors.
- •
- HMO plans: Our HMO plans are offered under contracts with CMS and provide all basic Medicare covered benefits with reduced member cost-sharing as well as additional supplemental benefits, including a defined prescription drug benefit. We built this coordinated care product around contracted networks of providers who, in cooperation with the health plan, coordinate an active medical management program.
- •
- In connection with the HMOs, we operate separate Medicare Advantage Management Service Organizations, that manage that business and affiliated Independent Physician Associations or IPAs. We participate in the net results derived from these affiliated IPAs.
- •
- PPO plans: Our PPO plans are offered under contracts with CMS and provide all basic Medicare covered benefits with reduced member cost-sharing as well as additional supplemental benefits, including a defined prescription drug benefit. This coordinated care product is built around contracted networks of providers who, in cooperation with the health plan, coordinate an active medical management program.
- •
- PFFS Plans: Our PFFS plans are offered under contracts with CMS and provide enhanced health care benefits compared to traditional Medicare, subject to cost sharing and other limitations. These plans have limited provider network restrictions, which allow the members to have more flexibility in the delivery of their health care services than other Medicare Advantage plans with limited provider network restrictions. Some of these products include a defined prescription drug benefit.
MSO—Our MSO segment supports our physician partnerships in the development of value-based healthcare models, such as ACOs, with a variety of capabilities and resources including technology, analytics, clinical care coordination, regulatory compliance and program administration. This segment includes our CHS subsidiary and affiliated ACOs that were formerly included in our Corporate & Other segment. CHS works with physicians and other healthcare professionals to operate ACOs under the Medicare Shared Savings Program. As of January 1, 2015 we had twenty-four active ACOs in ten states previously approved for participation in the program by CMS. Based on data provided by CMS, these twenty-four ACOs currently include approximately 3,800 participating providers with approximately 285,000 assigned Medicare fee-for-service beneficiaries, both within and outside our current Medicare Advantage footprint, including southeast Texas and upstate New York. CHS provides these ACOs with care coordination, analytics and reporting, technology and other administrative capabilities to enable participating providers to deliver better care and lower healthcare costs for their Medicare fee-for-service beneficiaries. The Company provides funding to CHS to support the operating activities of CHS and the ACOs.
Medicaid—The Medicaid segment includes the operations of our Total Care Medicaid health plan, which we acquired on December 1, 2013. Formerly included in our Corporate & Other segment, Total Care provides Medicaid managed care services to approximately 40,000 members in upstate New York. Total Care also participates in Child Health Plus and Family Health Plus programs for low-income, uninsured children and adults.
F-63
UNIVERSAL AMERICAN CORP. AND SUBSIDIARIES
NOTES TO CONSOLIDATED FINANCIAL STATEMENTS (Continued)
24. BUSINESS SEGMENT INFORMATION (Continued)
Traditional Insurance—This segment consists of Medicare supplement and other senior health products, specialty health insurance products, primarily fixed benefit accident and sickness insurance and senior life insurance business, as well as long-term care, disability, major medical, universal life and fixed annuities. We discontinued marketing and selling new Traditional insurance products after June 1, 2012.
We report intersegment revenues and expenses on a gross basis in each of the operating segments but eliminate them in the consolidated results. These intersegment revenues and expenses affect the amounts reported on the individual financial statement line items, but we eliminate them in consolidation and they do not change income before taxes. The most significant items eliminated are intersegment revenue and expense relating to commissions earned by agency subsidiaries in our Corporate & Other segment from insurance subsidiaries in our Traditional segment and in 2013 for services provided by APS Healthcare to our Medicare Advantage segment.
Financial data by segment, with a reconciliation of segment revenues and segment income (loss) before income taxes to total revenue and (loss) income from continuing operations before income taxes in accordance with U.S. generally accepted accounting principles is as follows:
| | 2014 | 2013 | 2012 | ||||||||||||||||
|---|---|---|---|---|---|---|---|---|---|---|---|---|---|---|---|---|---|---|---|
| | Revenues | Income(Loss) Before Income Taxes | Revenues | Income(Loss) Before Income Taxes | Revenues | Income(Loss) Before Income Taxes | |||||||||||||
| | (in thousands) | ||||||||||||||||||
Medicare Advantage | $ | 1,409,375 | $ | 47,800 | $ | 1,635,921 | $ | 53,467 | $ | 1,642,750 | $ | 92,775 | |||||||
MSO | — | (30,809 | ) | — | (41,588 | ) | — | (21,654 | ) | ||||||||||
Medicaid | 178,461 | 2,635 | 12,771 | (526 | ) | — | — | ||||||||||||
Traditional Insurance | 203,801 | 2,507 | 233,204 | 10,946 | 262,867 | 18,065 | |||||||||||||
Corporate & Other | 252,651 | (54,676 | ) | 270,100 | (239,398 | ) | 264,574 | (28,156 | ) | ||||||||||
Intersegment revenues | (3,084 | ) | — | (9,293 | ) | — | (9,298 | ) | — | ||||||||||
Adjustments to segment amounts: | |||||||||||||||||||
Net realized (losses) gains(1) | (1,382 | ) | (1,382 | ) | 13,863 | 13,863 | 16,604 | 16,604 | |||||||||||
| | | | | | | | | | | | | | | | | | | | |
Total | $ | 2,039,822 | $ | (33,925 | ) | $ | 2,156,566 | $ | (203,236 | ) | $ | 2,177,497 | $ | 77,634 | |||||
| | | | | | | | | | | | | | | | | | | | |
| | | | | | | | | | | | | | | | | | | | |
| | | | | | | | | | | | | | | | | | | | |
- (1)
- We evaluate the results of operations of our segments based on income (loss) before realized gains and losses and income taxes. Management believes that realized gains and losses are not indicative of overall operating trends.
F-64
UNIVERSAL AMERICAN CORP. AND SUBSIDIARIES
NOTES TO CONSOLIDATED FINANCIAL STATEMENTS (Continued)
24. BUSINESS SEGMENT INFORMATION (Continued)
Identifiable assets by segment are as follows:
| | December 31, | ||||||
|---|---|---|---|---|---|---|---|
| | 2014 | 2013 | |||||
| | (in thousands) | ||||||
Medicare Advantage | $ | 376,235 | $ | 460,950 | |||
MSO | 32,511 | 5,789 | |||||
Medicaid | 37,745 | 25,677 | |||||
Traditional Insurance | 1,193,461 | 1,219,601 | |||||
Corporate & Other | 855,372 | 891,435 | |||||
Intersegment assets(1) | (470,026 | ) | (501,786 | ) | |||
| | | | | | | | |
Total assets | $ | 2,025,298 | $ | 2,101,666 | |||
| | | | | | | | |
| | | | | | | | |
| | | | | | | | |
- (1)
- Intersegment assets include the elimination of the parent holding company's investment in its subsidiaries as well as the elimination of other intercompany balances.
25. CONDENSED QUARTERLY RESULTS OF OPERATIONS (UNAUDITED)
The quarterly results of operations are presented below. Due to the use of weighted average shares outstanding when determining the denominator for earnings per share, the sum of the quarterly per common share amounts may not equal the full year per common share amounts.
| | For the Quarter Ended | ||||||||||||
|---|---|---|---|---|---|---|---|---|---|---|---|---|---|
2014 | December 31, | September 30, | June 30, | March 31, | |||||||||
| | (in thousands) | ||||||||||||
Total revenue | $ | 500,261 | $ | 507,519 | $ | 519,376 | $ | 512,666 | |||||
| | | | | | | | | | | | | | |
| | | | | | | | | | | | | | |
| | | | | | | | | | | | | | |
(Loss) income before income taxes | $ | (25,594 | ) | $ | 2,723 | $ | (9,059 | ) | $ | (1,995 | ) | ||
(Benefit from) provision for income taxes | (13,075 | ) | 4,813 | 749 | 3,055 | ||||||||
| | | | | | | | | | | | | | |
Net loss | $ | (12,519 | ) | $ | (2,090 | ) | $ | (9,808 | ) | $ | (5,050 | ) | |
| | | | | | | | | | | | | | |
| | | | | | | | | | | | | | |
| | | | | | | | | | | | | | |
Loss per common share: | |||||||||||||
Basic: | $ | (0.15 | ) | $ | (0.03 | ) | $ | (0.12 | ) | $ | (0.06 | ) | |
| | | | | | | | | | | | | | |
| | | | | | | | | | | | | | |
| | | | | | | | | | | | | | |
Diluted: | $ | (0.15 | ) | $ | (0.03 | ) | $ | (0.12 | ) | $ | (0.06 | ) | |
| | | | | | | | | | | | | | |
| | | | | | | | | | | | | | |
| | | | | | | | | | | | | | |
F-65
UNIVERSAL AMERICAN CORP. AND SUBSIDIARIES
NOTES TO CONSOLIDATED FINANCIAL STATEMENTS (Continued)
25. CONDENSED QUARTERLY RESULTS OF OPERATIONS (UNAUDITED) (Continued)
| | For the Quarter Ended | ||||||||||||
|---|---|---|---|---|---|---|---|---|---|---|---|---|---|
2013 | December 31, | September 30, | June 30, | March 31, | |||||||||
| | (in thousands) | ||||||||||||
Total revenue | $ | 539,168 | $ | 520,158 | $ | 533,976 | $ | 563,264 | |||||
| | | | | | | | | | | | | | |
| | | | | | | | | | | | | | |
| | | | | | | | | | | | | | |
(Loss) income before income taxes | $ | (112,702 | ) | $ | (19,072 | ) | $ | (94,106 | ) | $ | 22,644 | ||
(Benefit from) provision for income taxes | (10,935 | ) | (6,371 | ) | (2,290 | ) | 8,686 | ||||||
| | | | | | | | | | | | | | |
Net (loss) income | $ | (101,767 | ) | $ | (12,701 | ) | $ | (91,816 | ) | $ | 13,958 | ||
| | | | | | | | | | | | | | |
| | | | | | | | | | | | | | |
| | | | | | | | | | | | | | |
(Loss) earnings per common share: | |||||||||||||
Basic: | $ | (1.16 | ) | $ | (0.15 | ) | $ | (1.05 | ) | $ | 0.16 | ||
| | | | | | | | | | | | | | |
| | | | | | | | | | | | | | |
| | | | | | | | | | | | | | |
Diluted: | $ | (1.16 | ) | $ | (0.15 | ) | $ | (1.05 | ) | $ | 0.16 | ||
| | | | | | | | | | | | | | |
| | | | | | | | | | | | | | |
| | | | | | | | | | | | | | |
During the quarters ended December 31, 2013 and June 30, 2013, we recorded pre-tax asset impairment charges of $97.7 million and $91.7 million, respectively related to our APS Healthcare subsidiary. See Note 8—Goodwill and Other Intangible Assets for further discussion.
26. SUBSEQUENT EVENTS
Sale of APS Puerto Rico: On February 4, 2015, we completed the sale of our APS Healthcare Puerto Rico subsidiaries to an affiliate of the Metro Pavia Health System. APS Puerto Rico provides managed behavioral health services under the Government Health Plan Medicaid program under a contract that terminates on March 31, 2015 and had $151 million of revenue in 2014. The purchase price at closing was $26.5 million, which was settled in cash, and is subject to a balance sheet true-up. The transaction is expected to result in a pre-tax realized loss of approximately $0.6 million, or $0.4 million after taxes.
Loan prepayment: On March 26, 2015, we gave notice to the participants of our 2012 Credit Facility that we will make a $55 million principal prepayment on our term loan on March 31, 2015. This prepayment will fulfill our obligation to use the proceeds from our recent dispositions that were not reinvested and provide additional restricted payment flexibility under the 2012 Credit Facility. For further information on the recent dispositions and 2012 Credit Facility, see Note 5—Business Combinations and Note 14—Loan Payable, respectively.
F-66
Schedule I—Summary of Investments Other Than Investments in Related Parties
| | December 31, 2014 | ||||||||||||
|---|---|---|---|---|---|---|---|---|---|---|---|---|---|
Classification | Par Value | Amortized Cost | Fair Value | Carrying Value | |||||||||
| | (in thousands) | ||||||||||||
U.S. Treasury securities and obligations of U.S. Government | $ | 57,195 | $ | 57,264 | $ | 57,324 | $ | 57,324 | |||||
Government sponsored agencies | 1,500 | 1,546 | 1,553 | 1,553 | |||||||||
Other political subdivisions | 48,700 | 52,104 | 53,476 | 53,476 | |||||||||
Corporate debt securities | 349,273 | 354,852 | 372,675 | 372,675 | |||||||||
Foreign debt securities | 71,512 | 74,126 | 76,412 | 76,412 | |||||||||
Residential mortgage-backed securities | 157,268 | 161,043 | 166,530 | 166,530 | |||||||||
Commercial mortgage-backed securities | 78,172 | 80,634 | 82,031 | 82,031 | |||||||||
Other asset-backed securities | 34,575 | 35,093 | 35,452 | 35,452 | |||||||||
| | | | | | | | | | | | | | |
Sub-total | $ | 798,195 | $ | 816,662 | $ | 845,453 | 845,453 | ||||||
| | | | | | | | | | | | | | |
| | | | | | | | | | | | | | |
| | | | | | | | | | | | | | |
Short-term investments | 8,994 | ||||||||||||
Other invested assets | 25,920 | ||||||||||||
| | | | | | | | | | | | | | |
Total investments | $ | 880,367 | |||||||||||
| | | | | | | | | | | | | | |
| | | | | | | | | | | | | | |
| | | | | | | | | | | | | | |
| | December 31, 2013 | ||||||||||||
|---|---|---|---|---|---|---|---|---|---|---|---|---|---|
Classification | Par Value | Amortized Cost | Fair Value | Carrying Value | |||||||||
| | (in thousands) | ||||||||||||
U.S. Treasury securities and obligations of U.S. Government | $ | 53,675 | $ | 53,687 | $ | 53,751 | $ | 53,751 | |||||
Government sponsored agencies | 10,300 | 10,400 | 10,481 | 10,481 | |||||||||
Other political subdivisions | 59,465 | 65,104 | 65,511 | 65,511 | |||||||||
Corporate debt securities | 376,674 | 382,496 | 397,600 | 397,600 | |||||||||
Foreign debt securities | 89,309 | 92,044 | 94,416 | 94,416 | |||||||||
Residential mortgage-backed securities | 178,229 | 182,853 | 183,216 | 183,216 | |||||||||
Commercial mortgage-backed securities | 73,916 | 76,503 | 79,055 | 79,055 | |||||||||
Other asset-backed securities | 49,762 | 50,366 | 49,368 | 49,368 | |||||||||
| | | | | | | | | | | | | | |
Sub-total | $ | 891,330 | $ | 913,453 | $ | 933,398 | 933,398 | ||||||
| | | | | | | | | | | | | | |
| | | | | | | | | | | | | | |
| | | | | | | | | | | | | | |
Other invested assets | 22,575 | ||||||||||||
| | | | | | | | | | | | | | |
Total investments | $ | 955,973 | |||||||||||
| | | | | | | | | | | | | | |
| | | | | | | | | | | | | | |
| | | | | | | | | | | | | | |
F-67
Schedule II—Condensed Financial Information of Registrant
UNIVERSAL AMERICAN CORP.
(Parent Company)
CONDENSED BALANCE SHEETS
(in thousands)
| | December 31, 2014 | December 31, 2013 | |||||
|---|---|---|---|---|---|---|---|
ASSETS | |||||||
Cash and cash equivalents | $ | 103,298 | $ | 43,066 | |||
Investments | 4,905 | 53,887 | |||||
Short term investments | 2,000 | — | |||||
Investments in subsidiaries at equity | 651,555 | 706,430 | |||||
Due from affiliates | 9,137 | 11,492 | |||||
Deferred loan origination fees | 2,887 | 4,639 | |||||
Income tax receivable | 53,909 | 39,086 | |||||
Other assets | 12,754 | 9,446 | |||||
| | | | | | | | |
Total assets | $ | 840,445 | $ | 868,046 | |||
| | | | | | | | |
| | | | | | | | |
| | | | | | | | |
LIABILITIES AND STOCKHOLDERS' EQUITY | |||||||
Loan payable | $ | 103,447 | $ | 103,447 | |||
Series A mandatorily redeemable preferred shares | 40,000 | 40,000 | |||||
Loans payable to affiliates | 22,000 | 22,000 | |||||
Deferred income tax liability | 37,953 | 27,283 | |||||
Accounts payable and other liabilities | 21,144 | 7,265 | |||||
Dividends to Stockholders—Declared/Unpaid | 1,436 | 3,152 | |||||
| | | | | | | | |
Total liabilities | 225,980 | 203,147 | |||||
| | | | | | | | |
Total stockholders' equity | 614,465 | 664,899 | |||||
| | | | | | | | |
Total liabilities and stockholders' equity | $ | 840,445 | $ | 868,046 | |||
| | | | | | | | |
| | | | | | | | |
| | | | | | | | |
See notes to condensed financial statements.
F-68
UNIVERSAL AMERICAN CORP.
(Parent Company)
CONDENSED STATEMENTS OF OPERATIONS
(in thousands)
| | For the Years Ended December 31, | |||||||||
|---|---|---|---|---|---|---|---|---|---|---|
| | 2014 | 2013 | 2012 | |||||||
REVENUES: | ||||||||||
Surplus note investment income—affiliated | $ | — | $ | — | $ | 20,217 | ||||
Net investment income—unaffiliated | 2,537 | 436 | 197 | |||||||
Realized gains on investments | 897 | 8,271 | 6,600 | |||||||
| | | | | | | | | | | |
Total revenues | 3,434 | 8,707 | 27,014 | |||||||
| | | | | | | | | | | |
EXPENSES: | ||||||||||
Selling, general and administrative expenses | 37,131 | 33,485 | 20,886 | |||||||
Stock compensation expense | 10,047 | 7,778 | 9,242 | |||||||
Interest expense—mandatorily redeemable preferred shares | 6,999 | 6,562 | 6,238 | |||||||
| | | | | | | | | | | |
Total expenses | 54,177 | 47,825 | 36,366 | |||||||
| | | | | | | | | | | |
Loss before income tax benefit and equity in (losses) earnings of subsidiaries | (50,743 | ) | (39,118 | ) | (9,352 | ) | ||||
Income tax benefit | 23,885 | 11,062 | 423 | |||||||
| | | | | | | | | | | |
Loss before equity in (losses) earnings of subsidiaries | (26,858 | ) | (28,056 | ) | (8,929 | ) | ||||
Equity in (losses) earnings of subsidiaries, net of taxes | (2,609 | ) | (164,270 | ) | 61,962 | |||||
| | | | | | | | | | | |
Net (loss) income | $ | (29,467 | ) | $ | (192,326 | ) | $ | 53,033 | ||
| | | �� | | | | | | | | |
| | | | | | | | | | | |
| | | | | | | | | | | |
See notes to condensed financial statements.
F-69
UNIVERSAL AMERICAN CORP.
(Parent Company)
CONDENSED STATEMENTS OF CASH FLOWS
(in thousands)
| | For the Years Ended December 31, | |||||||||
|---|---|---|---|---|---|---|---|---|---|---|
| | 2014 | 2013 | 2012 | |||||||
Cash flows from operating activities: | ||||||||||
Net (loss) income | $ | (29,467 | ) | $ | (192,326 | ) | $ | 53,033 | ||
Adjustments to reconcile net (loss) income to net cash used for operating activities: | ||||||||||
Equity in net loss (income) of subsidiaries | 2,609 | 164,270 | (61,962 | ) | ||||||
Realized gains on investments | (897 | ) | (8,271 | ) | (6,600 | ) | ||||
Stock based compensation | 10,047 | 7,778 | 9,242 | |||||||
Amortization of deferred loan origination fees | 1,752 | 1,423 | 1,162 | |||||||
Change in amounts due to/from subsidiaries | 2,355 | (25,298 | ) | (33,561 | ) | |||||
Change in income taxes receivable | (14,823 | ) | (26,759 | ) | 25,692 | |||||
Deferred income taxes | 10,829 | 25,059 | 5,888 | |||||||
Change in other assets and liabilities | 11,018 | (649 | ) | (3,989 | ) | |||||
| | | | | | | | | | | |
Cash used for operating activities | (6,577 | ) | (54,773 | ) | (11,095 | ) | ||||
| | | | | | | | | | | |
Cash flows from investing activities: | ||||||||||
Proceeds from sale of fixed maturities | 67,459 | 8,271 | 6,600 | |||||||
Cost of fixed maturity investments acquired | (18,311 | ) | (52,544 | ) | — | |||||
Purchase of other invested assets | 275 | (725 | ) | — | ||||||
Net change in short-term investments | (2,000 | ) | 14,994 | (14,994 | ) | |||||
Redemption of surplus note due from affiliate | — | — | 60,000 | |||||||
Capital contributions to subsidiaries | (34,000 | ) | (11,500 | ) | (8,600 | ) | ||||
Dividends from subsidiaries | 91,880 | 243,400 | 58,900 | |||||||
Purchase of business | — | — | (147,737 | ) | ||||||
Purchase of agent advances from subsidiaries, net of collections | — | — | 5,600 | |||||||
| | | | | | | | | | | |
Cash provided by (used for) investing activities | 105,303 | 201,896 | (40,231 | ) | ||||||
| | | | | | | | | | | |
Cash flows from financing activities: | ||||||||||
Net proceeds from issuance of common stock | (994 | ) | 370 | 5,870 | ||||||
Loan from affiliates | — | 22,000 | — | |||||||
Purchase of treasury stock | (36,180 | ) | — | — | ||||||
Issuance of new debt | — | — | 150,000 | |||||||
Payment of debt issue costs | — | (460 | ) | (5,772 | ) | |||||
Principal repayment on debt | — | (28,537 | ) | (18,016 | ) | |||||
Dividends to stockholders | (1,320 | ) | (141,371 | ) | (100,866 | ) | ||||
| | | | | | | | | | | |
Cash (used for) provided by financing activities | (38,494 | ) | (147,998 | ) | 31,216 | |||||
| | | | | | | | | | | |
Net increase (decrease) in cash and cash equivalents | 60,232 | (875 | ) | (20,110 | ) | |||||
Cash and cash equivalents: | ||||||||||
At beginning of year | 43,066 | 43,941 | 64,051 | |||||||
| | | | | | | | | | | |
At end of year | $ | 103,298 | $ | 43,066 | $ | 43,941 | ||||
| | | | | | | | | | | |
| | | | | | | | | | | |
| | | | | | | | | | | |
Supplemental disclosure of cash flow information: | ||||||||||
Cash paid during the year for: | ||||||||||
Interest | $ | 6,999 | $ | 6,609 | $ | 6,125 | ||||
| | | | | | | | | | | |
| | | | | | | | | | | |
| | | | | | | | | | | |
Income taxes | $ | 22,512 | $ | 25,054 | $ | 16,160 | ||||
| | | | | | | | | | | |
| | | | | | | | | | | |
| | | | | | | | | | | |
See notes to condensed financial statements.
F-70
UNIVERSAL AMERICAN CORP.
(Parent Company)
NOTES TO CONDENSED FINANCIAL STATEMENTS
1. BASIS OF PRESENTATION
Except as otherwise indicated, references to the "Company," "Universal American," "we," "our," and "us" are to Universal American Corp., a Delaware corporation, and its subsidiaries.
Universal American is a specialty health and life insurance holding company with an emphasis on providing a broad array of health insurance and managed care products and services to people covered by Medicare and/or Medicaid.
In the parent company only financial statements, the parent company's investment in subsidiaries is stated at cost plus equity in undistributed earnings of subsidiaries since the date of acquisition less dividends paid to the parent company by the subsidiaries. The parent company's share of net (loss) income of its wholly owned unconsolidated subsidiaries is included in its net (loss) income using the equity method. These parent company only financial statements should be read in conjunction with the Company's consolidated financial statements.
2. MANDATORILY REDEEMABLE PREFERRED SHARES
On April 29, 2011, in conjunction with the sale of our Medicare Part D business, Universal American issued an aggregate of $40 million of Series A Mandatorily Redeemable Preferred Shares (the "Series A Preferred Shares"), representing 1,600,000 shares with a par value of $0.01 per share and a liquidation preference of $25.00 per share. The Series A Preferred Shares pay cash dividends at the rate of 8.5% per annum and are mandatorily redeemable on the six year anniversary of the issue date. The proceeds from the sale of the Series A Preferred Shares were used to pay a portion of the existing indebtedness of the Company prior to the sale and transaction expenses. We did not retain any proceeds from the sale of the Series A Preferred Shares. At the closing of the sale of our Medicare Part D business, certain officers and directors of the Company collectively purchased an aggregate of $10 million of the Series A Preferred Shares.
In accordance with ASC 480,Distinguishing Liabilities from Equity, because the issuance of the Series A Preferred Shares imposes an obligation on us requiring the transfer of assets, specifically, cash, at the redemption date, the Series A Preferred Shares are reported as a liability on the consolidated balance sheets, with the related dividends reported as interest expense on the consolidated statements of operations. At December 31, 2014 and 2013, we had accrued $0.7 million of such dividends, recorded in other liabilities in the consolidated balance sheets.
Issue costs of approximately $1.1 million were capitalized in other assets and are being amortized over the six year term of the Series A Preferred Shares.
3. LOAN PAYABLE
2012 Credit Facility
In connection with the acquisition of APS Healthcare, on March 2, 2012, we entered into a credit facility (the "2012 Credit Facility") consisting of a five-year $150 million senior secured term loan and a $75 million senior secured revolving credit facility.
The 2012 Credit Facility contains customary representations and warranties as well as customary affirmative and negative covenants. Negative covenants include, among others, limitations on the incurrence of indebtedness, limitations on the incurrence of liens and limitations on acquisitions,
F-71
UNIVERSAL AMERICAN CORP.
(Parent Company)
NOTES TO CONDENSED FINANCIAL STATEMENTS (Continued)
3. LOAN PAYABLE (Continued)
dispositions, investments and restricted payments. In addition, the 2012 Credit Facility contains certain financial covenants relating to minimum risk-based capital, consolidated leverage ratio, and consolidated debt service ratio. The 2012 Credit Facility also contains customary events of default. Upon the occurrence and during the continuance of an event of default, the Lenders may declare the outstanding advances and all other obligations under the 2012 Credit Facility immediately due and payable.
Credit Facility Amendment
On November 4, 2013, we entered into an amendment to our 2012 Credit Facility. The amendment, which was effective beginning with the quarter ended September 30, 2013, suspends certain financial covenants, including the consolidated leverage and debt service ratios, replacing them with total debt to capitalization and minimum liquidity ratios. As of December 31, 2014, and throughout the entire amendment period, we were in compliance with all financial covenants, as amended. These new financial covenants terminated December 31, 2014 and effective January 1, 2015 the original financial covenants were reinstated.
In connection with the amendment, we had prepaid all scheduled 2013 and 2014 principal payments, including the final 2013 payment due December 31, 2013 of $3.6 million and all 2014 scheduled payments totaling $14.3 million. We also paid fees and expenses of approximately $0.5 million, which we had capitalized in other assets and amortized over the term of the amendment.
Our obligations under the Credit Agreement are secured by a first priority security interest in 100% of the capital stock of the Company's material subsidiaries and are also guaranteed by certain of our subsidiaries.
The 2012 Credit Facility bears interest at rates equal to, at our election, LIBOR or the base rate, plus an applicable margin that varies based on our consolidated leverage ratio from 1.75% to 2.50%, in the case of LIBOR loans, and from 0.75% to 1.50% in the case of base rate loans. Effective December 31, 2014, the interest rate on the term loan portion of the 2012 Credit Facility was 2.76%, based on a spread of 2.50% above LIBOR.
We are required to pay a commitment fee on unused availability under the Revolving Facility that varies based on our consolidated leverage ratio, from 0.40% to 0.50% per year. As of the date of this report, we had not drawn on the Revolving Facility.
In connection with the 2012 Credit Facility, we incurred loan origination fees of approximately $5.8 million, which were capitalized and are being amortized on a straight-line basis, which does not differ significantly from the effective yield basis, over the life of the 2012 Credit Facility.
F-72
UNIVERSAL AMERICAN CORP.
(Parent Company)
NOTES TO CONDENSED FINANCIAL STATEMENTS (Continued)
3. LOAN PAYABLE (Continued)
The following table reflects the schedule of principal payments remaining on the credit facility as of December 31, 2013, after giving effect to prepayments made to date and the November 2013 amendment:
| | 2012 Credit Facility (in thousands) | |||
|---|---|---|---|---|
2015 | $ | 14,269 | ||
2016 | 14,269 | |||
2017 | 74,909 | |||
| | | | | |
| $ | 103,447 | |||
| | | | | |
| | | | | |
| | | | | |
We are required to ratably apply any future prepayments through the remaining scheduled repayments.
Principal and Interest Payments
During the year ended December 31, 2014, we made interest payments totaling $2.8 million and other fee payments totaling $0.5 million. We were not required to make any principal payments as all scheduled 2014 principal payments, totaling $14.3 million, were prepaid in 2013, in connection with the amendment of our credit facility on November 4, 2013. Currently, there is a bullet payment of $74.9 million due in 2017. However, as a result of the recent subsidiary sale activity, under the 2012 Credit Facility, we have twelve months from receipt of the proceeds to either reinvest those proceeds or make a principal prepayment. If the proceeds are not reinvested, we would need to make prepayments totaling approximately $38 million by February 2016. We have elected to prepay $55 million on March 31, 2015, which will fulfill this obligation and provide additional restricted payment flexibility under the 2012 Credit Facility. We are required to ratably apply this prepayment and any other future prepayments through the remaining scheduled repayments, which would change the amount of the quarterly and bullet payments through 2017.
4. LOANS FROM AFFILIATES
In the fourth quarter of 2013, we borrowed $13.0 million and $9.0 million from our insurance company subsidiaries, American Progressive and Pyramid Life, respectively, for general corporate purposes. Both accrue interest at 3.5% and will be paid quarterly. The American Progressive loan matures June 30, 2016 and the Pyramid Life loan matures December 31, 2016. Both are repayable at any time without penalty.
5. SPECIAL DIVIDEND
On August 1, 2013, the Board of Directors approved the payment of a special cash dividend of $1.60 per share, payable on August 19, 2013 to shareholders of record as of August 12, 2013. The total dividend payment was $142.1 million of which $139.9 million was paid on August 19, 2013. We also established a $2.2 million dividend payable liability to record amounts expected to be paid in the future to holders of our restricted stock as such shares vest. This liability was $2.1 million at December 31, 2013 and is included in accounts payable and other liabilities in the condensed balance sheets. In
F-73
UNIVERSAL AMERICAN CORP.
(Parent Company)
NOTES TO CONDENSED FINANCIAL STATEMENTS (Continued)
5. SPECIAL DIVIDEND (Continued)
addition, pursuant to the terms of our 2011 Equity Award Plan, the exercise price on outstanding stock options was reduced by the amount of the dividend. This dividend is a liquidating dividend and was recorded as a reduction of additional paid-in capital.
F-74
Schedule III—SUPPLEMENTAL INSURANCE INFORMATION
UNIVERSAL AMERICAN CORP.
(in thousands)
| | Deferred Acquisition Costs | Reserves for Future Policy Benefits | Unearned Premiums | Policy and Contract Claims | Net Premium Earned | Net Investment Income | Policyholder Benefits | Net Change in DAC | Other Operating Expense | |||||||||||||||||||
|---|---|---|---|---|---|---|---|---|---|---|---|---|---|---|---|---|---|---|---|---|---|---|---|---|---|---|---|---|
2014 | ||||||||||||||||||||||||||||
Medicare Advantage | $ | — | $ | — | $ | — | $ | 94,704 | $ | 1,393,444 | $ | 15,013 | $ | 1,171,002 | $ | — | $ | 190,572 | ||||||||||
MSO | — | — | — | — | — | — | — | — | 13,016 | |||||||||||||||||||
Medicaid | — | — | — | 13,583 | 178,288 | 173 | 160,827 | — | 15,000 | |||||||||||||||||||
Traditional Insurance | 77,814 | 957,638 | — | 38,599 | 185,947 | 16,184 | 144,172 | 12,322 | 44,800 | |||||||||||||||||||
Corporate & Other | — | — | — | 11,261 | 156,737 | 3,114 | 137,575 | — | 169,752 | |||||||||||||||||||
Intersegment and other adjustments | — | — | — | — | — | (771 | ) | — | — | (3,084 | ) | |||||||||||||||||
| | | | | | | | | | | | | | | | | | | | | | | | | | | | | |
Segment Total | $ | 77,814 | $ | 957,638 | $ | — | $ | 158,147 | $ | 1,914,416 | $ | 33,713 | $ | 1,613,576 | $ | 12,322 | $ | 430,056 | ||||||||||
| | | | | | | | | | | | | | | | | | | | | | | | | | | | | |
| | | | | | | | | | | | | | | | | | | | | | | | | | | | | |
| | | | | | | | | | | | | | | | | | | | | | | | | | | | | |
2013 | ||||||||||||||||||||||||||||
Medicare Advantage | $ | — | $ | — | $ | — | $ | 123,791 | $ | 1,617,176 | $ | 18,572 | $ | 1,376,960 | $ | — | $ | 205,494 | ||||||||||
MSO | — | — | — | — | — | — | — | — | 7,986 | |||||||||||||||||||
Medicaid | — | — | — | 9,550 | 12,771 | — | 11,684 | — | 1,613 | |||||||||||||||||||
Traditional Insurance | 90,136 | 982,749 | — | 39,968 | 213,920 | 17,671 | 160,745 | 12,629 | 48,885 | |||||||||||||||||||
Corporate & Other | — | — | — | 5,396 | 157,442 | 560 | 135,207 | — | 374,291 | |||||||||||||||||||
Intersegment and other adjustments | — | — | — | — | — | (66 | ) | — | — | (9,294 | ) | |||||||||||||||||
| | | | | | | | | | | | | | | | | | | | | | | | | | | | | |
Segment Total | $ | 90,136 | $ | 982,749 | $ | — | $ | 178,705 | $ | 2,001,309 | $ | 36,737 | $ | 1,684,596 | $ | 12,629 | $ | 628,975 | ||||||||||
| | | | | | | | | | | | | | | | | | | | | | | | | | | | | |
| | | | | | | | | | | | | | | | | | | | | | | | | | | | | |
| | | | | | | | | | | | | | | | | | | | | | | | | | | | | |
2012 | ||||||||||||||||||||||||||||
Medicare Advantage | $ | — | $ | — | $ | — | $ | 115,612 | $ | 1,619,336 | $ | 23,231 | $ | 1,332,044 | $ | — | $ | 217,931 | ||||||||||
MSO | — | — | — | — | — | — | — | — | 11,432 | |||||||||||||||||||
Medicaid | — | — | — | — | — | — | — | — | — | |||||||||||||||||||
Traditional Insurance | 102,765 | 983,762 | — | 45,577 | 241,904 | 18,905 | 186,246 | 5,418 | 53,138 | |||||||||||||||||||
Corporate & Other | — | — | — | 8,822 | 128,573 | 261 | 106,263 | — | 186,466 | |||||||||||||||||||
Intersegment and other adjustments | — | — | — | — | — | — | — | — | (9,297 | ) | ||||||||||||||||||
| | | | | | | | | | | | | | | | | | | | | | | | | | | | | |
Segment Total | $ | 102,765 | $ | 983,762 | $ | — | $ | 170,011 | $ | 1,989,813 | $ | 42,397 | $ | 1,624,553 | $ | 5,418 | $ | 459,670 | ||||||||||
| | | | | | | | | | | | | | | | | | | | | | | | | | | | | |
| | | | | | | | | | | | | | | | | | | | | | | | | | | | | |
| | | | | | | | | | | | | | | | | | | | | | | | | | | | | |
F-75
Universal American Corp.
Schedule V
Valuation and Qualifying Accounts
| | Balance Jan 1 | Charges/ (Recoveries) in Consolidated Statement of Operations | Write-offs Against Allowance | Acquisition and Other Adjs. | Balance Dec 31 | |||||||||||
|---|---|---|---|---|---|---|---|---|---|---|---|---|---|---|---|---|
| | (in thousands) | |||||||||||||||
2014 | ||||||||||||||||
Advances to agents(1) | $ | 56,985 | $ | (6,071 | ) | $ | (3,941 | ) | $ | — | $ | 46,973 | ||||
Other assets(2) | 27,898 | — | (8,118 | ) | (66 | ) | 19,714 | |||||||||
Valuation allowance for deferred taxes | 11,315 | 4,025 | — | 126 | 15,466 | |||||||||||
2013 | ||||||||||||||||
Advances to agents | $ | 56,975 | $ | 521 | $ | (511 | ) | $ | — | $ | 56,985 | |||||
Other assets(2) | 28,391 | 5,718 | (7,005 | ) | 794 | 27,898 | ||||||||||
Valuation allowance for deferred taxes | 7,366 | 4,349 | — | (400 | ) | 11,315 | ||||||||||
2012 | ||||||||||||||||
Advances to agents | $ | 57,731 | $ | — | $ | (1,145 | ) | $ | 389 | $ | 56,975 | |||||
Other assets(2) | 59,458 | 2,540 | (33,995 | ) | 388 | 28,391 | ||||||||||
Valuation allowance for deferred taxes | 1,888 | 2,360 | — | 3,118 | 7,366 | |||||||||||
- (1)
- Amount reported as recoveries in the consolidated statement of operations represents advances to agents previously written off.
- (2)
- Represents valuation account on receivables related to Medicare Advantage products.
F-76