Exhibit 99.2
POSTMEDIA NETWORK CANADA CORP.
INTERIM MANAGEMENT’S DISCUSSION AND ANALYSIS
FOR THE THREE AND NINE MONTHS ENDED MAY 31, 2012 AND 2011
MANAGEMENT’S DISCUSSION AND ANALYSIS
This management’s discussion and analysis of financial condition and results of operations of Postmedia Network Canada Corp. and its subsidiary Postmedia Network Inc. (collectively, “we”, “our”, “us”, or “Postmedia”) should be read in conjunction with the interim condensed consolidated financial statements and related notes of Postmedia for the three and nine months ended May 31, 2012 and 2011 and the interim condensed consolidated financial statements and related notes of Postmedia for the three months ended November 30, 2011 and 2010, as well as the annual audited consolidated financial statements and related notes of Postmedia for the year ended August 31, 2011 and the period ended August 31, 2010. The annual audited consolidated financial statements of Postmedia for the year ended August 31, 2011 and the period ended August 31, 2010, were prepared in accordance with Canadian generally accepted accounting principles – Part V (“Canadian GAAP”) and may not be comparable to the interim condensed consolidated financial statements of Postmedia for the three and nine months ended May 31, 2012 and 2011 which are prepared in accordance with International Financial Reporting Standards (”IFRS”) as issued by the International Accounting Standards Board, and International Accounting Standard (“IAS”) 34 – Interim Financial Reporting . For a detailed explanation of our transition to IFRS please refer to note 15 in the interim condensed consolidated financial statements for the three and nine months ended May 31, 2012 and 2011 and note 20 in the interim condensed consolidated financial statements for the three months ended November 30, 2011 and 2010. The interim condensed consolidated financial statements of Postmedia for the three and nine months ended May 31, 2012 and 2011, the interim condensed consolidated financial statements of Postmedia for the three months ended November 30, 2011 and 2010 and the annual audited consolidated financial statements of Postmedia for the year ended August 31, 2011 and the period ended August 31, 2010 are available on SEDAR at www.sedar.com and on the EDGAR system maintained by the U.S. Securities and Exchange Commission (“SEC”) at www.sec.gov.
This discussion contains statements that are not historical facts and are forward-looking statements. These statements are subject to a number of risks described in the section entitled “Risk Factors” contained in our annual management’s discussion and analysis for the year ended August 31, 2011 and the period ended August 31, 2010. Risks and uncertainties may cause actual results to differ materially from those contained in such forward-looking statements. Such statements reflect management’s current views and are based on certain assumptions. They are only estimates of future developments, and actual developments may differ materially from these statements due to a number of factors. Investors are cautioned not to place undue reliance on such forward-looking statements. No forward-looking statement is a guarantee of future results. We have tried, where possible, to identify such statements by using words such as “believe”, “expect”, “estimate”, “anticipate”, “will” and similar expressions in connection with any discussion of future operating or financial performance. Except as required by law, we undertake no obligation to publicly update or revise any forward-looking statements of information, whether written or oral, that may be as a result of new information, future events or otherwise.
All amounts are expressed in Canadian dollars unless otherwise noted. The interim condensed consolidated financial statements of Postmedia for the three and nine months ended May 31, 2012 and 2011 have been prepared in accordance with IFRS and IAS 34 – Interim Financial Reporting. In certain aspects US Generally Accepted Accounting Principles as applied in the United States (“US GAAP”) differ from IFRS. See “Differences between IFRS and US GAAP”.
This management’s discussion and analysis is dated July 10, 2012 and does not reflect changes or information subsequent to this date. Additional information in respect of Postmedia is available on SEDAR at www.sedar.com and EDGAR at www.sec.gov.
Transition to IFRS
Our financial statements are prepared in accordance with Canadian generally accepted accounting principles as set out in the Handbook of the Canadian Institute of Chartered Accountants – Part I (“CICA Handbook”). In 2010, the CICA Handbook was revised to incorporate IFRS, and require publicly accountable enterprises to apply such standards for years beginning on or after January 1, 2011. Accordingly, the interim condensed consolidated financial statements for the three and nine months ended May 31, 2012 and 2011 are prepared in accordance with IFRS and IAS 34.
The interim condensed consolidated financial statements for the three and nine months ended May 31, 2012 and 2011, have been prepared using the IFRS accounting policies we expect to adopt in our annual consolidated financial statements for the year ending August 31, 2012. The new significant accounting policies under IFRS are disclosed in note 3 of our interim condensed consolidated financial statements for the three months ended November 30, 2011 and 2010. In addition, note 15 of our interim condensed consolidated financial statements for the three and nine months ended May 31, 2012 and 2011 and note 20 of our interim condensed consolidated financial statements for the three months ended November 30, 2011 and 2010 include an explanation of the transition to IFRS from Canadian GAAP, including reconciliations to IFRS of the results previously reported under Canadian GAAP.
The following table reconciles Canadian GAAP to IFRS and adjusts for the presentation of discontinued operations for our consolidated statement of operations for the three months ended May 31, 2011:
| | | | | | | | | | | | | |
| | | Canadian GAAP | | | Discontinued operations | | | IFRS adjustments | | | IFRS | |
| | | | | | | | | | | | | |
| Revenues | | | | | | | | | | | | |
| Print advertising | | | 171,971 | | | | (26,370 | ) | | | - | | | | 145,601 | |
| Print circulation | | | 59,068 | | | | (3,741 | ) | | | - | | | | 55,327 | |
| Digital | | | 23,108 | | | | (1,031 | ) | | | - | | | | 22,077 | |
| Other | | | 5,045 | | | | (422 | ) | | | - | | | | 4,623 | |
| Total revenues | | | 259,192 | | | | (31,564 | ) | | | - | | | | 227,628 | |
| Expenses | | | | | | | | | | | | | | | | |
| Compensation | | | 108,915 | | | | (12,477 | ) | | | (637 | ) | | | 95,801 | |
| Newsprint | | | 15,734 | | | | (1,241 | ) | | | - | | | | 14,493 | |
| Distribution | | | 37,692 | | | | (5,107 | ) | | | - | | | | 32,585 | |
| Other operating | | | 45,578 | | | | (7,409 | ) | | | - | | | | 38,169 | |
| Operating income before depreciation, amortization and restructuring | | | 51,273 | | | | (5,330 | ) | | | 637 | | | | 46,580 | |
| Depreciation | | | 7,297 | | | | (528 | ) | | | - | | | | 6,769 | |
| Amortization | | | 11,271 | | | | (169 | ) | | | - | | | | 11,102 | |
| Restructuring and other items | | | 3,267 | | | | (311 | ) | | | (1,367 | ) | �� | | 1,589 | |
| Operating income | | | 29,438 | | | | (4,322 | ) | | | 2,004 | | | | 27,120 | |
| Interest expense | | | 19,584 | | | | (1,880 | ) | | | - | | | | 17,704 | |
| Loss on debt prepayment | | | 11,018 | | | | - | | | | - | | | | 11,018 | |
| Net financing expense relating to employee benefit plans | | | - | | | | (5 | ) | | | 848 | | | | 843 | |
| Loss on disposal of property and equipment | | | 115 | | | | - | | | | - | | | | 115 | |
| Loss on derivative financial instruments | | | 1,907 | | | | - | | | | - | | | | 1,907 | |
| Foreign currency exchange losses | | | 695 | | | | - | | | | - | | | | 695 | |
| Loss before income taxes | | | (3,881 | ) | | | (2,437 | ) | | | 1,156 | | | | (5,162 | ) |
| Provision for income taxes | | | - | | | | - | | | | - | | | | - | |
| Net loss from continuing operations | | | (3,881 | ) | | | (2,437 | ) | | | 1,156 | | | | (5,162 | ) |
| Net earnings from discontinued operations, net of tax of nil | | | - | | | | 2,437 | | | | - | | | | 2,437 | |
| Net loss attributable to equity holders of the Company | | | (3,881 | ) | | | - | | | | 1,156 | | | | (2,725 | ) |
The following table reconciles Canadian GAAP to IFRS and adjusts for the presentation of discontinued operations for our consolidated statement of operations for the nine months ended May 31, 2011:
| | | | | | | | | | | | | |
| | | Canadian GAAP | | | Discontinued operations | | | IFRS adjustments | | | IFRS | |
| | | | | | | | | | | | | |
| Revenues | | | | | | | | | | | | |
| Print advertising | | | 528,865 | | | | (77,228 | ) | | | - | | | | 451,637 | |
| Print circulation | | | 175,983 | | | | (11,104 | ) | | | - | | | | 164,879 | |
| Digital | | | 68,234 | | | | (2,384 | ) | | | - | | | | 65,850 | |
| Other | | | 15,705 | | | | (1,334 | ) | | | - | | | | 14,371 | |
| Total revenues | | | 788,787 | | | | (92,050 | ) | | | - | | | | 696,737 | |
| Expenses | | | | | | | | | | | | | | | | |
| Compensation | | | 324,447 | | | | (38,111 | ) | | | (2,565 | ) | | | 283,771 | |
| Newsprint | | | 48,070 | | | | (3,532 | ) | | | - | | | | 44,538 | |
| Distribution | | | 111,041 | | | | (15,142 | ) | | | - | | | | 95,899 | |
| Other operating | | | 138,084 | | | | (21,224 | ) | | | - | | | | 116,860 | |
| Operating income before depreciation, amortization and restructuring | | | 167,145 | | | | (14,041 | ) | | | 2,565 | | | | 155,669 | |
| Depreciation | | | 22,023 | | | | (1,679 | ) | | | - | | | | 20,344 | |
| Amortization | | | 34,494 | | | | (512 | ) | | | - | | | | 33,982 | |
| Restructuring and other items | | | 39,873 | | | | (3,466 | ) | | | (1,367 | ) | | | 35,040 | |
| Operating income | | | 70,755 | | | | (8,384 | ) | | | 3,932 | | | | 66,303 | |
| Interest expense | | | 62,126 | | | | (6,298 | ) | | | - | | | | 55,828 | |
| Loss on debt prepayment | | | 11,018 | | | | - | | | | - | | | | 11,018 | |
| Net financing expense relating to employee benefit plans | | | - | | | | (13 | ) | | | 2,544 | | | | 2,531 | |
| Loss on disposal of property and equipment | | | 112 | | | | 3 | | | | - | | | | 115 | |
| Loss on derivative financial instruments | | | 29,473 | | | | - | | | | - | | | | 29,473 | |
| Foreign currency exchange gains | | | (22,565 | ) | | | 2 | | | | - | | | | (22,563 | ) |
| Acquisition costs | | | 1,217 | | | | - | | | | - | | | | 1,217 | |
| Loss before income taxes | | | (10,626 | ) | | | (2,078 | ) | | | 1,388 | | | | (11,316 | ) |
| Provision for income taxes | | | - | | | | - | | | | - | | | | - | |
| Net loss from continuing operations | | | (10,626 | ) | | | (2,078 | ) | | | 1,388 | | | | (11,316 | ) |
| Net earnings from discontinued operations, net of tax of nil | | | - | | | | 2,078 | | | | - | | | | 2,078 | |
| Net loss attributable to equity holders of the Company | | | (10,626 | ) | | | - | | | | 1,388 | | | | (9,238 | ) |
The following table provides our fiscal 2011 quarterly and full year consolidated statements of operations, adjusted for the presentation of discontinued operations, under IFRS:
| | | Fiscal 2011 | |
| | | | Q1 | | | | Q2 | | | | Q3 | | | | Q4 | | | Total | |
| | | | | | | | | | | | | | | | | | | | |
| Revenues | | | | | | | | | | | | | | | | | | | |
| Print advertising | | | 169,197 | | | | 136,839 | | | | 145,601 | | | | 122,283 | | | | 573,920 | |
| Print circulation | | | 56,030 | | | | 53,522 | | | | 55,327 | | | | 54,417 | | | | 219,296 | |
| Digital | | | 22,937 | | | | 20,836 | | | | 22,077 | | | | 21,200 | | | | 87,050 | |
| Other | | | 5,935 | | | | 3,813 | | | | 4,623 | | | | 4,251 | | | | 18,622 | |
| Total revenues | | | 254,099 | | | | 215,010 | | | | 227,628 | | | | 202,151 | | | | 898,888 | |
| Expenses | | | | | | | | | | | | | | | | | | | - | |
| Compensation | | | 96,886 | | | | 91,084 | | | | 95,801 | | | | 84,745 | | | | 368,516 | |
| Newsprint | | | 16,654 | | | | 13,391 | | | | 14,493 | | | | 12,885 | | | | 57,423 | |
| Distribution | | | 32,819 | | | | 30,495 | | | | 32,585 | | | | 30,926 | | | | 126,825 | |
| Other operating | | | 38,558 | | | | 40,133 | | | | 38,169 | | | | 40,062 | | | | 156,922 | |
| Total operating expenses | | | 184,917 | | | | 175,103 | | | | 181,048 | | | | 168,618 | | | | 709,686 | |
| Operating income before depreciation, amortization and restructuring | | | 69,182 | | | | 39,907 | | | | 46,580 | | | | 33,533 | | | | 189,202 | |
| Depreciation | | | 7,140 | | | | 6,435 | | | | 6,769 | | | | 6,671 | | | | 27,015 | |
| Amortization | | | 11,464 | | | | 11,416 | | | | 11,102 | | | | 11,227 | | | | 45,209 | |
| Restructuring and other items | | | 21,239 | | | | 12,212 | | | | 1,589 | | | | 2,971 | | | | 38,011 | |
| Operating income | | | 29,339 | | | | 9,844 | | | | 27,120 | | | | 12,664 | | | | 78,967 | |
| Interest expense | | | 19,341 | | | | 18,783 | | | | 17,704 | | | | 16,456 | | | | 72,284 | |
| Loss on debt prepayment | | | - | | | | - | | | | 11,018 | | | | - | | | | 11,018 | |
| Net financing expense relating to employee benefit plans | | | 844 | | | | 844 | | | | 843 | | | | 440 | | | | 2,971 | |
| Loss on disposal of property and equipment | | | - | | | | - | | | | 115 | | | | 61 | | | | 176 | |
| Loss (gain) on derivative financial instruments | | | 12,950 | | | | 14,616 | | | | 1,907 | | | | (8,059 | ) | | | 21,414 | |
| Foreign currency exchange (gains) losses | | | (10,157 | ) | | | (13,101 | ) | | | 695 | | | | 4,604 | | | | (17,959 | ) |
| Acquisition costs | | | 1,787 | | | | (570 | ) | | | - | | | | - | | | | 1,217 | |
| Earnings (loss) before income taxes | | | 4,574 | | | | (10,728 | ) | | | (5,162 | ) | | | (838 | ) | | | (12,154 | ) |
| Provision for income taxes | | | - | | | | - | | | | - | | | | - | | | | - | |
| Net earnings (loss) from continuing operations | | | 4,574 | | | | (10,728 | ) | | | (5,162 | ) | | | (838 | ) | | | (12,154 | ) |
| Net earnings (loss) from discontinued operations, net of tax of nil | | | 1,431 | | | | (1,790 | ) | | | 2,437 | | | | 487 | | | | 2,565 | |
| Net earnings (loss) attributable to equity holders of the Company | | | 6,005 | | | | (12,518 | ) | | | (2,725 | ) | | | (351 | ) | | | (9,589 | ) |
Future Accounting Standards
The following accounting standards are issued but not yet effective. We have not yet assessed the impact of the standards or determined whether we will adopt any of the standards earlier than their current effective date.
IFRS 9 - Financial Instruments
IFRS 9 was issued in November 2009 and contains requirements for financial assets. This standard addresses classification and measurement of financial assets and replaces the multiple designation and measurement models in IAS 39 for debt instruments with a new mixed measurement model having only two categories: amortized cost and fair value through profit or loss. IFRS 9 also replaces the models for measuring equity instruments, and such instruments are either recognized at fair value through profit or loss or at fair value through other comprehensive income. Where such equity instruments are measured at fair value through other comprehensive income, dividends are recognized in profit or loss to the extent not clearly representing a return of investment; however, other gains and losses (including impairments) associated with such instruments remain in accumulated comprehensive income indefinitely.
Requirements for financial liabilities were added in October 2010 and they largely carry forward existing requirements in IAS 39 - Financial Instruments – Recognition and Measurement, except that fair value changes due to credit risk for liabilities designated at fair value through profit and loss would generally be recorded in other comprehensive income. This standard is required to be applied for annual periods beginning on or after January 1, 2015, with earlier adoption permitted.
IFRS 10 – Consolidated Financial Statements
IFRS 10 replaces SIC-12 Consolidation – Special Purposes Entities and parts of IAS 27 – Consolidated and Separate Financial Statements and introduces a new definition of control that is intended to provide more consistent guidance in the determination of whether control exists and whether or not an entity should be included within the consolidated financial statements. This standard is required to be applied for annual periods beginning on or after January 1, 2013, with earlier adoption permitted.
IFRS 13 - Fair Value Measurement
IFRS 13 is a comprehensive standard for fair value measurement and disclosure requirements for use across all IFRS standards. The new standard clarifies that fair value is the price that would be received to sell an asset, or paid to transfer a liability in an orderly transaction between market participants, at the measurement date. It also establishes disclosures about fair value measurement. Under existing IFRS, guidance on measuring and disclosing fair value is dispersed among the specific standards requiring fair value measurements and in many cases does not reflect a clear measurement basis or consistent disclosures. This standard is required to be applied for annual periods beginning on or after January 1, 2013, with earlier adoption permitted.
IAS 19 – Employee Benefits (Amended)
IAS 19 amendments include, among other changes, the immediate recognition of the actuarial gains and losses in other comprehensive income, the introduction of a net interest approach that replaces the expected return on plan assets and interest costs on the defined benefit obligation with a single net interest component and all past service costs are to be recognized in profit or loss when the employee benefit plan is amended. This standard is required to be applied for annual periods beginning on or after January 1, 2013, with earlier adoption permitted.
Additional IFRS Measures
We use operating income before depreciation, amortization and restructuring, as presented in the interim condensed consolidated financial statements for the three and nine months ended May 31, 2012 and 2011 and described in note 5 thereto, to assist in assessing our financial performance. Management and the Board of Directors of Postmedia use this measure to evaluate consolidated operating results as well as the results of its segments and to assess Postmedia’s ability to incur and service debt. In addition, this measure is used to make operating decisions as it is an indicator of how much cash is being generated by Postmedia and assists in determining the need for additional cost reductions, evaluation of personnel and resource allocation decisions. Finally, this measure is the primary measure, subject to certain required adjustments, used by our creditors to assess performance and compute financial maintenance covenants contained in Postmedia’s Senior Secured Term Loan Credit Facility (“Term Loan Facility”). Operating income before depreciation, amortization and restructuring is referred to as an additional IFRS measure and may not be comparable to similar measures presented by other companies.
Overview and Background
We are the largest publisher of English-language paid daily newspapers by circulation in Canada, according to the Newspapers Canada 2011 Circulation Data Report. Our English-language paid daily newspapers have, in total, the highest weekly print readership of English-language paid dailies belonging to each of the other media organizations in Canada, based on the NADbank 2011 survey data. Our business consists of news and information gathering and dissemination operations, with products offered in most of the major markets and a number of regional and local markets in Canada through a variety of daily newspapers, online, digital and mobile platforms. The combination of these distribution platforms provides readers with a variety of mediums through which to access and interact with our content. In addition, the breadth of our reach and the diversity of our content enable advertisers to reach their target audiences on a local, regional or national scale through the convenience of a single provider.
During the three months ended May 31, 2012, we amended our operating segments to reflect recent changes to the reporting structure and our management team. The Eastern newspapers operating segment and Western newspapers operating segment have been replaced with one operating segment, the Newspaper operating segment. Changes in reporting segments are to be applied retroactively; however there was no impact on our segment reporting as the Eastern and Western newspapers operating segments were previously aggregated to form one reportable segment for financial reporting purposes, the Newspaper segment. The Newspaper segment publishes daily and non-daily newspapers and operates the related newspaper websites. Its revenue is primarily from advertising and circulation. Postmedia has other business activities and an operating segment which is not separately reportable and are referred to collectively as the All other category. Revenue in the All other category primarily consists of advertising and subscription revenue from Infomart and the website canada.com.
On October 18, 2011, we entered into an asset purchase agreement with affiliates of Glacier Media Inc. (the “Transaction”) to sell substantially all of the assets and liabilities of the Lower Mainland Publishing Group, the Victoria Times Colonist and the Vancouver Island Newspaper Group, collectively herein referred to as the Disposed Properties, for a purchase price of $86.5 million. The Disposed Properties were all within the Newspaper segment. On November 30, 2011, we completed the Transaction and recorded a gain on the sale of the Disposed Properties of $17.1 million. In accordance with the terms and conditions of the Term Loan Facility, on November 30, 2011 the proceeds from the sale of the Disposed Properties were used to make a principal payment of US$84.6 million (CDN$86.5 million) on Tranche C of the Term Loan Facility. As a result of the Transaction we have presented the results of the Disposed Properties as discontinued operations and as such, the condensed consolidated statement of operations and condensed consolidated statement of comprehensive income for the three and nine months ended May 31, 2011 have been revised to reflect this change in presentation. The condensed consolidated statement of financial position as at August 31, 2011 and condensed consolidated statement of cash flows for the three and nine months ended May 31, 2011 have not been revised. Additional information on the Transaction is available in note 4 of the interim condensed consolidated financial statements for the three and nine months ended May 31, 2012 and 2011.
During the three and nine months ended May 31, 2012, we made total long-term debt repayments of $7.6 million (US$7.5 million) and $102.0 million (US$100.0 million), respectively, related to the Term Loan Facility. During the nine months ended May 31, 2012, we repurchased and retired US$6.4 million of the 12.5% Senior Secured Notes due 2018 (the “Notes”) for total cash consideration of $6.3 million (US$6.2 million). In conjunction with the retirement of the Notes during the nine months ended May 31, 2012, we settled a notional amount of US$10.0 million of the foreign currency interest rate swap associated with the Notes for cash consideration of $0.7 million. Aggregate long-term debt repayments related to the Term Loan Facility and the Notes since the completion of the acquisition of Canwest Limited Partnership in July 2010 total approximately $191 million.
On June 26, 2012, we entered into an asset purchase agreement to sell the land and building located at 1450 Don Mills Road in Don Mills, Ontario, for gross proceeds of approximately $24 million, subject to customary closing conditions and adjustments. The net proceeds will be used to repay a portion of the outstanding loans under Tranche C in accordance with the terms and conditions of the Term Loan Facility. We expect to realize a nominal gain on disposal. The agreement includes a lease-back of the property to Postmedia for 18 to 24 months. The transaction is expected to close in September 2012.
Key Factors Affecting Operating Results
Revenue is earned primarily from advertising, circulation and digital sources. Print advertising revenue is a function of the volume, or linage, of advertising sold and rates charged. Print circulation revenue is derived from home-delivery subscriptions for newspapers, single copy sales at retail outlets and vending machines and is a function of the number of newspapers sold and the average revenue per copy. Digital revenue is comprised of revenue from national and local display advertising on our newspaper and other websites, including canada.com, and advertising and subscription revenue generated through Infomart.
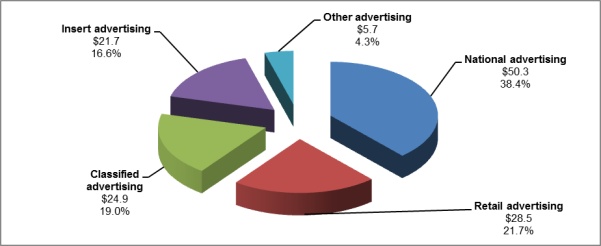
Print advertising revenue was $131.1 million for the three months ended May 31, 2012, representing 61.8% of total revenue. The following chart summarizes our print advertising revenue by category for the three months ended May 31, 2012 ($ in millions):
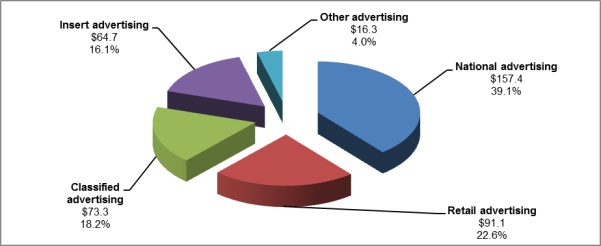
Print advertising revenue was $402.8 million for the nine months ended May 31, 2012, representing 62.8% of total revenue. The following chart summarizes our print advertising revenue by category for the nine months ended May 31, 2012 ($ in millions):
Print advertising is influenced by the overall strength of the economy. Over the last few years, significant print advertising declines have been driven by the economic downturn as well as structural changes in the industry which include a continuing shift in advertising dollars from newspaper advertising to advertising in other formats, including online and other digital platforms such as search and social media. We expect the print advertising market to remain challenging throughout the remainder of fiscal 2012. During the three and nine months ended May 31, 2012, we experienced print advertising revenue declines of 10.0% and 10.8%, respectively, as compared to the three and nine months ended May 31, 2011. The decline in print advertising revenue primarily relates to weakness in the national advertising category, which decreased 11.9% and 16.2% in the three and nine months ended May 31, 2012 as compared to the three and nine months ended May 31, 2011, respectively.
Print circulation revenue was $52.5 million and $158.0 million for the three and nine months ended May 31, 2012, representing 24.8% and 24.6% of total revenue for such periods, respectively. Declines in circulation volume have been experienced over the last few years and continued in the current quarter. Circulation volume decreases have been partially offset by price increases. We expect these trends to continue throughout the remainder of fiscal 2012.
Digital revenue was $23.6 million and $67.1 million for the three and nine months ended May 31, 2012, representing 11.1% and 10.5% of total revenue for such periods, respectively. Digital revenues increased 6.8% and 2.0%, respectively, in the three and nine months ended May 31, 2012 as compared to the same periods in the prior year. Increases in digital revenue are primarily a result of both increases in subscription revenue associated with Infomart and increases in local digital advertising revenue, partially offset by declines in national digital advertising revenue, including a decline of $1.0 million and $2.4 million for the three and nine months ended May 31, 2012, respectively, associated with a digital sales representation agreement that ended August 31, 2011. We continue to believe digital revenue represents a future growth opportunity for Postmedia and we continue to focus on many new initiatives in this area.
Our principal operating expenses consist of compensation, newsprint, and distribution expenses. These comprised 50.9%, 7.8% and 17.9%, respectively, of total operating expenses for the three months ended May 31, 2012, and 50.8%, 7.8% and 18.0%, respectively for the nine months ended May 31, 2012. We experienced declines in compensation expenses of 6.6% and 6.0%, in the three and nine months ended May 31, 2012 as compared to the three and nine months ended May 31, 2011. Newsprint consumption decreased 4.7% and 6.9%, in the three and nine months ended May 31, 2012, due to continued usage reduction efforts and lower newspaper circulation volume combined with relatively stable newsprint costs, resulting in an overall decrease in newsprint expense of 5.9% and 8.1% for the three and nine months ended May 31, 2012 as compared to the three and nine months ended May 31, 2011. Distribution expenses decreased 3.5% and 1.3% for the three and nine months ended May 31, 2012, respectively, as compared to the three and nine months ended May 31, 2011.
Restructuring and other items expense was $14.7 million and $22.3 million for the three and nine months ended May 31, 2012, and relates primarily to severance costs,which include both involuntary terminations and voluntary buyouts. We are currently implementing the initial phase of initiatives aimed at significantly reducing legacy newspaper infrastructure costs. Initiatives include the shutdown of our proprietary breaking news service, the expansion of our editorial services in Hamilton, Ontario, in order to accommodate centralized newspaper production services and the cancellation of Sunday editions at three of our daily newspapers. These and various other initiatives will be implemented during the fourth quarter of fiscal 2012 and the first quarter of fiscal 2013 and are expected to deliver $35 to $40 million in annualized cost savings. These savings represent the initial phase of a three year business transformation program that, in total, is expected to result in operating cost savings of 15% to 20%.
Our operating results are affected by variations in the cost and availability of newsprint. Newsprint is the principal raw material used in the production of our daily newspapers and other print publications. It is a commodity that is generally subject to price volatility. We take advantage of the purchasing power that comes with the large volume of newsprint we purchase, as well as our proximity to paper mills across Canada, to minimize our total newsprint expense. Changes in newsprint prices can significantly affect our operating results. A $50 per tonne increase or decrease in the price of newsprint would be expected to affect our operating expenses by approximately $4.0 million on an annualized basis. We expect newsprint prices to remain stable throughout the remainder of fiscal 2012.
Our distribution is primarily outsourced to third party suppliers. The key drivers of our distribution costs are fuel costs and circulation and insert volumes. We are working to reduce distribution costs and expect to see modest declines throughout the remainder of fiscal 2012.
Other Factors
Seasonality
Revenue has experienced, and is expected to continue to experience, significant seasonality due to seasonal advertising patterns and seasonal influences on media consumption habits. Typically, our advertising revenue is highest in the first and third fiscal quarters, while expenses are relatively constant throughout the fiscal year. These seasonal variations may lead to increased borrowing needs at certain points within the fiscal year.
Critical accounting estimates
The preparation of financial statements in accordance with IFRS requires our management to make estimates and assumptions that affect the reported amounts of our assets, liabilities, revenues and expenses, as well as the disclosure of contingent assets and liabilities. Our management bases its estimates and judgements on historical experience and other factors that are believed to be reasonable under the circumstances. Actual results could differ from those estimates under different assumptions or conditions. There are no significant changes in our accounting estimates since August 31, 2011 as described in our annual management’s discussion and analysis and annual audited consolidated financial statements for the year ended August 31, 2011 and the period ended August 31, 2010.
Operating Results
Postmedia’s operating results for the three months ended May 31, 2012 as compared to the three months ended May 31, 2011
| | | | | | | |
| | | 2012 | | | 2011 | |
| | | | | | | |
| Revenues | | | | | | |
| Print advertising | | | 131,077 | | | | 145,601 | |
| Print circulation | | | 52,484 | | | | 55,327 | |
| Digital | | | 23,584 | | | | 22,077 | |
| Other | | | 4,876 | | | | 4,623 | |
| Total revenues | | | 212,021 | | | | 227,628 | |
| Expenses | | | | | | | | |
| Compensation | | | 89,469 | | | | 95,801 | |
| Newsprint | | | 13,644 | | | | 14,493 | |
| Distribution | | | 31,456 | | | | 32,585 | |
| Other operating | | | 41,224 | | | | 38,169 | |
| Total operating expenses | | | 175,793 | | | | 181,048 | |
| Operating income before depreciation, amortization and restructuring | | | 36,228 | | | | 46,580 | |
| Depreciation | | | 6,585 | | | | 6,769 | |
| Amortization | | | 10,828 | | | | 11,102 | |
| Restructuring and other items | | | 14,730 | | | | 1,589 | |
| Operating income | | | 4,085 | | | | 27,120 | |
| Interest expense | | | 16,084 | | | | 17,704 | |
| Loss on debt prepayment | | | - | | | | 11,018 | |
| Net financing expense relating to employee benefit plans | | | 975 | | | | 843 | |
| Loss on disposal of property and equipment and intangible assets | | | 43 | | | | 115 | |
| (Gain) loss on derivative financial instruments | | | (9,836 | ) | | | 1,907 | |
| Foreign currency exchange losses | | | 8,956 | | | | 695 | |
| Loss before income taxes | | | (12,137 | ) | | | (5,162 | ) |
| Provision for income taxes | | | - | | | | - | |
| Net loss from continuing operations | | | (12,137 | ) | | | (5,162 | ) |
| Net earnings from discontinued operations, net of tax of nil | | | - | | | | 2,437 | |
| Net loss attributable to equity holders of the Company | | | (12,137 | ) | | | (2,725 | ) |
Revenue
Print advertising
Print advertising revenue decreased $14.5 million, or 10.0%, to $131.1 million for the three months ended May 31, 2012, as compared to the three months ended May 31, 2011. This decrease relates to most of our major categories of print advertising revenue, including decreases from national advertising of 11.9%, retail advertising of 8.3%, classified advertising of 14.4%, and insert advertising of 3.3%. The total print advertising linage and average line rate related to national, retail and classified advertising decreased 7.3% and 4.6% during the three months ended May 31, 2012, respectively, as compared to the three months ended May 31, 2011. Insert revenue decreases are primarily related to nominal volume decreases during the three months ended May 31, 2012 as compared to the three months ended May 31, 2011.
Print circulation
Print circulation revenue decreased $2.8 million, or 5.1%, to $52.5 million for the three months ended May 31, 2012, as compared to the three months ended May 31, 2011. Net paid circulation decreased 6.0% for the three months ended May 31, 2012, as compared to the three months ended May 31, 2011, offset partially by price increases, resulting in the 5.1% decrease in overall circulation revenue.
Digital
Digital revenue increased $1.5 million, or 6.8%, to $23.6 million for the three months ended May 31, 2012, as compared to the three months ended May 31, 2011. Growth in digital revenue is primarily a result of increases in revenue associated with Infomart of $0.9 million and increases in local digital advertising revenue of $2.1 million, partially offset by declines of $0.6 million in national digital advertising revenue and the loss of $1.0 million associated with a digital sales representation agreement that ended August 31, 2011.
Other
Other revenue increased $0.3 million, or 5.5%, to $4.9 million for the three months ended May 31, 2012, as compared to the three months ended May 31, 2011.
Operating expenses
Compensation
Compensation expenses decreased $6.3 million, or 6.6%, to $89.5 million for the three months ended May 31, 2012, as compared to the three months ended May 31, 2011. The decrease is the result of lower salary costs as a result of restructuring initiatives as well as a decrease in share-based compensation expense, combined with a reduction of expenses related to our short-term incentive plan awards.
Newsprint
Newsprint expenses decreased $0.8 million, or 5.9%, to $13.6 million for the three months ended May 31, 2012, as compared to the three months ended May 31, 2011. Newsprint expense decreases are primarily a result of both consumption decreases of 4.7% due to continued usage reduction efforts and lower newspaper circulation volume, combined with a decrease in newsprint cost per tonne of 1.2%.
Distribution
Distribution expenses decreased $1.1 million, or 3.5%, to $31.5 million for the three months ended May 31, 2012, as compared to the three months ended May 31, 2011. Decreases in distribution expenses are primarily a result of a reduction in newspaper circulation volumes, combined with ongoing cost savings initiatives.
Other operating
Other operating expenses increased $3.1 million, or 8.0%, for the three months ended May 31, 2012, as compared to the three months ended May 31, 2011. Increases in other operating expenses are primarily related to increased overhead, marketing and promotion, and legal expenses. In addition during the three months ended May 31, 2011 other operating expenses included a recovery to a previously recorded provision for certain claims asserted against us of $1.5 million.
Operating income before depreciation, amortization and restructuring
Operating income before depreciation, amortization and restructuring decreased $10.4 million, or 22.2%, to $36.2 million for the three months ended May 31, 2012, as compared to the three months ended May 31, 2011. The decrease relates primarily to decreases in revenue and increases in other operating expenses, partially offset by decreases in compensation, newsprint and distribution, all as discussed above.
Depreciation
Depreciation decreased $0.2 million, or 2.7%, to $6.6 million for the three months ended May 31, 2012, as compared to the three months ended May 31, 2011.
Amortization
Amortization decreased $0.3 million, or 2.5%, to $10.8 million for the three months ended May 31, 2012, as compared to the three months ended May 31, 2011.
Restructuring and other items
Restructuring and other items expense for the three months ended May 31, 2012 increased $13.1 million to $14.7 million as compared to the three months ended May 31, 2011. Restructuring and other items expense for the three months ended May 31, 2012 relates primarily to severance costs, which include both involuntary terminations and voluntary buyouts. Restructuring and other items expense for the three months ended May 31, 2011 included $3.2 million related to severance costs, which include both involuntary terminations and voluntary buyouts, a recovery of $2.6 million which represents curtailment gains in respect of our pension and post-retirement benefit plans related to such involuntary terminations and voluntary buyouts, and $1.0 millionof expenses relating to the preparation of a non-offering prospectus and expenses incurred to comply with our contractual obligation to make an exchange offer for the Notes that is registered with the SEC and management oversight expenses of our various restructuring initiatives.
Operating income
Operating income was $4.1 million for the three months ended May 31, 2012, as compared to $27.1 million for the three months ended May 31, 2011, as a result of the factors described above.
Interest expense
Interest expense decreased $1.6 million, or 9.2%, to $16.1 million for the three months ended May 31, 2012, as compared to the three months ended May 31, 2011. The decrease relates to a lower effective interest rate in the three months ended May 31, 2012 as a result of the refinancing of the Term Loan Facility on April 4, 2011 as well as the overall reduction in the Term Loan Facility due to principal repayments made throughout the year ended August 31, 2011 and the nine months ended May 31, 2012.
Loss on debt prepayment
During the three months ended May 31, 2011 we recorded a loss on debt prepayment of $11.0 million. This amount included cash costs of $1.4 million incurred on the prepayment of debt and a non-cash loss of $9.6 million of unamortized discounts and transaction costs related to the prepayment of the Term Loan Facility.
Net financing expense relating to employee benefit plans
Net financing expense relating to employee benefit plans increased $0.1 million to $1.0 million for the three months ended May 31, 2012, as compared to the three months ended May 31, 2011.
Loss on disposal of property and equipment and intangible assets
During the three months ended May 31, 2012, we disposed of intangible assets and realized a nominal loss. During the three months ended May 31, 2011, we disposed of property and equipment and realized a loss of $0.1 million.
(Gain) loss on derivative financial instruments
Gain on derivative financial instruments for the three months ended May 31, 2012 was $9.8 million as compared to a loss on derivative financial instruments of $1.9 million during the three months ended May 31, 2011. The gain for the three months ended May 31, 2012 includes a gain of $7.0 million related to a foreign currency interest rate swap that was not designated as a hedge and a gain of $3.7 million related to a variable prepayment option embedded derivative on the Notes, partially offset by net cash outflows of $0.9 million related to a contractual cash interest settlement on a fair value swap not designated as a hedge. The loss for the three months ended May 31, 2011 includes a loss of $1.0 million related to a foreign currency interest rate swap that was not designated as a hedge, net cash outflows of $1.3 million related to a contractual cash interest settlement on a fair value swap not designated as a hedge and a loss of $1.8 million which represents a payment made to amend the terms of our foreign currency interest rate swap that was not designated as a hedge partially offset by a gain of $2.2 million related to a variable prepayment option embedded derivative on the Notes.
Foreign currency exchange losses
Foreign currency exchange losses for the three months ended May 31, 2012 were $9.0 million as compared to $0.7 million during the three months ended May 31, 2011. For the three months ended May 31, 2012 foreign currency exchange losses consisted primarily of net realized losses of $0.2 million related to repayments of Tranche C of the Term Loan Facility and unrealized losses of $8.6 million related to the outstanding principal amount on Tranche C which is not subject to hedge accounting. For the three months ended May 31, 2011 foreign currency exchange losses consisted primarily of unrealized losses of $1.7 million and realized losses of $0.1 million related to the outstanding principal amount on Tranche C which is not subject to hedge accounting and realized losses of $0.7 million on a contractual principal settlement on the foreign currency interest rate swap which was not designated as a hedge partially offset by net realized gains of $1.9 million related to the US Tranche that was prepaid on April 4, 2011.
Loss before income taxes
Loss before income taxes increased $7.0 million to $12.1 million for the three months ended May 31, 2012, as compared to the three months ended May 31, 2011. The increase in loss before income taxes is primarily the result of the offset of decreased operating income, increased foreign currency exchange losses, decreased interest expense, the loss on debt prepayment in the three months ended May 31, 2011 and increased gains on derivative financial instruments, all as discussed above.
Provision for income taxes
We have not recorded a current or deferred tax expense or recovery for the three months ended May 31, 2012 and 2011. Current taxes recoverable result in an increase to our tax loss carryforward balances. The cumulative tax loss carryforward balances have not been recognized as a deferred tax asset on the statement of financial position in accordance with IFRS.
Net loss from continuing operations
Net loss from continuing operations was $12.1 million for the three months ended May 31, 2012, as compared to $5.2 million for the three months ended May 31, 2011 as a result of the factors described above in loss before income taxes.
Net earnings from discontinued operations
Net earnings from discontinued operations for the three months ended May 31, 2011 was $2.4 million. The Transaction was completed on November 30, 2011 and as a result there were no discontinued operations during the three months ended May 31, 2012.
Net loss attributable to equity holders of the Company
Net loss for the three months ended May 31, 2012 was $12.1 million as compared to a loss of $2.7 million for the three months ended May 31, 2011. The increase is due to an increase in net loss from continuing operations and a decrease in net earnings from discontinued operations, both as discussed above.
Postmedia’s operating results for the nine months ended May 31, 2012 as compared to the nine months ended May 31, 2011
| | | | | | | |
| | | 2012 | | | 2011 | |
| | | | | | | |
| Revenues | | | | | | |
| Print advertising | | | 402,830 | | | | 451,637 | |
| Print circulation | | | 157,954 | | | | 164,879 | |
| Digital | | | 67,139 | | | | 65,850 | |
| Other | | | 13,830 | | | | 14,371 | |
| Total revenues | | | 641,753 | | | | 696,737 | |
| Expenses | | | | | | | | |
| Compensation | | | 266,766 | | | | 283,771 | |
| Newsprint | | | 40,911 | | | | 44,538 | |
| Distribution | | | 94,654 | | | | 95,899 | |
| Other operating | | | 123,259 | | | | 116,860 | |
| Total operating expenses | | | 525,590 | | | | 541,068 | |
| Operating income before depreciation, amortization and restructuring | | | 116,163 | | | | 155,669 | |
| Depreciation | | | 19,564 | | | | 20,344 | |
| Amortization | | | 32,685 | | | | 33,982 | |
| Restructuring and other items | | | 22,341 | | | | 35,040 | |
| Operating income | | | 41,573 | | | | 66,303 | |
| Interest expense | | | 47,720 | | | | 55,828 | |
| Loss on debt prepayment | | | - | | | | 11,018 | |
| Net financing expense relating to employee benefit plans | | | 2,925 | | | | 2,531 | |
| Loss on disposal of property and equipment and intangible assets | | | 78 | | | | 115 | |
| (Gain) loss on derivative financial instruments | | | (15,260 | ) | | | 29,473 | |
| Foreign currency exchange (gains) losses | | | 15,034 | | | | (22,563 | ) |
| Acquisition costs | | | - | | | | 1,217 | |
| Loss before income taxes | | | (8,924 | ) | | | (11,316 | ) |
| Provision for income taxes | | | - | | | | - | |
| Net loss from continuing operations | | | (8,924 | ) | | | (11,316 | ) |
| Net earnings from discontinued operations, net of tax of nil | | | 14,053 | | | | 2,078 | |
| Net earnings (loss) attributable to equity holders of the Company | | | 5,129 | | | | (9,238 | ) |
Revenue
Print advertising
Print advertising revenue decreased $48.8 million, or 10.8%, to $402.8 million for the nine months ended May 31, 2012, as compared to the nine months ended May 31, 2011. This decrease relates to most of our major categories of print advertising revenue, including decreases from national advertising of 16.2%, retail advertising of 7.7%, classified advertising of 10.7%, and insert advertising of 3.4%. The total advertising linage and average line rate related to national, retail and classified advertising decreased 8.3% and 4.7% during the nine months ended May 31, 2012, respectively, as compared to the nine months ended May 31, 2011. Insert revenue decreases are primarily related to volume decreases of 2.0% during the nine months ended May 31, 2012 as compared to the nine months ended May 31, 2011.
Print circulation
Print circulation revenue decreased $6.9 million, or 4.2%, to $158.0 million for the nine months ended May 31, 2012, as compared to the nine months ended May 31, 2011. Net paid circulation decreased 7.0% for the nine months ended May 31, 2012, as compared to the nine months ended May 31, 2011, offset partially by price increases, resulting in the 4.2% decrease in overall circulation revenue.
Digital
Digital revenue increased $1.3 million, or 2.0%, to $67.1 million for the nine months ended May 31, 2012, as compared to the nine months ended May 31, 2011. Growth in digital revenue is primarily a result of increases in revenue associated with Infomart of $0.7 million and increases in local digital advertising revenue of $4.8 million, partially offset by declines of $2.0 million in national digital advertising revenue and the loss of $2.4 million associated with a digital sales representation agreement that ended August 31, 2011.
Other
Other revenue decreased $0.5 million, or 3.8%, to $13.8 million for the nine months ended May 31, 2012, as compared to the nine months ended May 31, 2011. The decrease is primarily due to the termination of a commercial printing contract in September 2010, partially offset by an increase in revenue related to post sale services being provided to the Disposed Properties.
Operating expenses
Compensation
Compensation expenses decreased $17.0 million, or 6.0%, to $266.8 million for the nine months ended May 31, 2012, as compared to the nine months ended May 31, 2011. The decrease is the result of lower salary costs as a result of restructuring initiatives as well as a decrease in share-based compensation expense, combined with a reduction of expenses related to our short-term incentive plan awards.
Newsprint
Newsprint expenses decreased $3.6 million, or 8.1%, to $40.9 million for the nine months ended May 31, 2012, as compared to the nine months ended May 31, 2011. Newsprint expense decreases are primarily a result of consumption decreases of 6.9% due to continued usage reduction efforts, outsourcing of our production at certain newspapers and lower newspaper circulation volume, combined with a decrease in newsprint cost per tonne of 1.3%.
Distribution
Distribution expenses decreased $1.2 million, or 1.3%, to $94.7 million for the nine months ended May 31, 2012, as compared to the nine months ended May 31, 2011. Decreases in distribution expenses are primarily a result of a reduction in newspaper circulation and insert volumes, combined with ongoing cost savings initiatives.
Other operating
Other operating expenses increased $6.4 million, or 5.5%, to $123.3 million for the nine months ended May 31, 2012, as compared to the nine months ended May 31, 2011. Increases in other operating expenses are primarily related to overhead, marketing and promotion, legal and regulatory costs associated with being a public company. In addition during the nine months ended May 31, 2011 other operating expenses included a recovery to a previously recorded provision for certain claims asserted against us of $1.5 million.
Operating income before depreciation, amortization and restructuring
Operating income before depreciation, amortization and restructuring decreased $39.5 million, or 25.4%, to $116.2 million for the nine months ended May 31, 2012, as compared to the nine months ended May 31, 2011. The decrease relates primarily to decreases in revenue and increases in other operating expenses, partially offset by decreases in compensation, newsprint and distribution, all as discussed above.
Depreciation
Depreciation decreased $0.8 million, or 3.8%, to $19.6 million for the nine months ended May 31, 2012, as compared to the nine months ended May 31, 2011.
Amortization
Amortization decreased $1.3 million, or 3.8%, to $32.7 million for the nine months ended May 31, 2012, as compared to the nine months ended May 31, 2011.
Restructuring and other items
Restructuring and other items expense for the nine months ended May 31, 2012 decreased $12.7 million to $22.3 million as compared to the nine months ended May 31, 2011. Restructuring and other items expense for the nine months ended May 31, 2012 relates primarily to severance costs, which include both involuntary terminations and voluntary buyouts. Restructuring and other items expense for the nine months ended May 31, 2011 included $35.3 million related to severance costs, which include both involuntary terminations and voluntary buyouts, a recovery of $2.6 million which represents curtailment gains in respect of our pension and post-retirement benefit plans related to such involuntary terminations and voluntary buyouts, and $2.3 million of expenses relating to the preparation of a non-offering prospectus and expenses incurred to comply with our contractual obligation to make an exchange offer for the Notes that is registered with the SEC and management oversight expenses of our various restructuring initiatives.
Operating income
Operating income was $41.6 million for the nine months ended May 31, 2012, as compared to $66.3 million for the nine months ended May 31, 2011, as a result of the factors described above.
Interest expense
Interest expense decreased $8.1 million, or 14.5%, to $47.7 million for the nine months ended May 31, 2012, as compared to the nine months ended May 31, 2011. The decrease relates to a lower effective interest rate in the nine months ended May 31, 2012 as a result of the refinancing of the Term Loan Facility on April 4, 2011 as well as the overall reduction in the Term Loan Facility due to principal repayments made throughout the year ended August 31, 2011 and the nine months ended May 31, 2012.
Loss on debt prepayment
During the nine months ended May 31, 2011 we recorded a loss on debt prepayment of $11.0 million. This amount included cash costs of $1.4 million incurred on the prepayment of debt and a non-cash loss of $9.6 million of unamortized discounts and transaction costs related to the prepayment of the Term Loan Facility.
Net financing expense relating to employee benefit plans
Net financing expense relating to employee benefit plans increased $0.4 million to $2.9 million for the nine months ended May 31, 2012, as compared to the nine months ended May 31, 2011.
Loss on disposal of property and equipment and intangible assets
During the nine months ended May 31, 2012, we disposed of property and equipment and intangible assets and realized a loss of $0.1 million. During the nine months ended May 31, 2011, we disposed of property and equipment and realized a loss of $0.1 million.
(Gain) loss on derivative financial instruments
Gain on derivative financial instruments for the nine months ended May 31, 2012 was $15.3 million as compared to a loss of $29.5 million during the nine months ended May 31, 2011. The gain for the nine months ended May 31, 2012 includes a gain of $11.0 million related to a foreign currency interest rate swap that was not designated as a hedge and a gain of $7.7 million related to a variable prepayment option embedded derivative on the Notes, partially offset by a loss of $0.7 million related to the settlement of a portion of a cash flow swap and net cash outflows of $2.8 million related to a contractual cash interest settlement on a fair value swap not designated as a hedge. The loss for the nine months ended May 31, 2011included a loss of $20.8 million related to a foreign currency interest rate swap that was not designated as a hedge, net cash outflows of $3.0 million related to a contractual cash interest settlement on a fair value swap not designated as a hedge, a loss of $1.8 million which represents a payment made to amend the terms of our foreign currency interest rate swap that was not designated as a hedge and loss of $3.9 million related to a variable prepayment option embedded derivative on the Notes.
Foreign currency exchange (gains) losses
Foreign currency exchange losses for the nine months ended May 31, 2012 were $15.0 million as compared to gains of $22.6 million during the nine months ended May 31, 2011. For the nine months ended May 31, 2012 foreign currency exchange losses consisted primarily of net realized losses of $4.0 million related to repayments of Tranche C of the Term Loan Facility, unrealized losses of $10.7 million related to the outstanding principal amount on Tranche C which is not subject to hedge accounting, realized losses of $0.8 million on contractual principal settlements on the foreign currency interest rate swap which is not designated as a hedge, partially offset by unrealized gains of $0.4 million related to the outstanding principal amount of the Notes which is not subject to hedge accounting. For the nine months ended May 31, 2011 foreign currency exchange gains consisted primarily of net realized gains of $26.9 million related to the US Tranche that was prepaid on April 4, 2011. Partially offsetting these gains were unrealized losses of $1.7 million and realized losses of $0.1 million related to the outstanding principal amount on Tranche C which is not subject to hedge accounting and realized losses of $1.6 million on contractual principal settlements on the foreign currency interest rate swap not designated as a hedge.
Acquisition costs
During the nine months ended May 31, 2011, we incurred additional net acquisition costs of $1.2 million related to the July 13, 2010 acquisition of the Canwest Limited Partnership. These costs were expensed as they were not directly related to either the issuance of debt or equity.
Loss before income taxes
Loss before income taxes was $8.9 million for the nine months ended May 31, 2012, as compared to $11.3 million for the nine months ended May 31, 2011. The decrease in loss before income taxes is primarily the result of the offset of decreased operating income, increased foreign currency exchange losses, decreased interest expense, the loss on debt prepayment in the nine months ended May 31, 2011, and increased gains on derivative financial instruments, all as discussed above.
Provision for income taxes
We have not recorded a current or deferred tax expense or recovery for the nine months ended May 31, 2012 and 2011. Current taxes recoverable result in an increase to our tax loss carryforward balances. The cumulative tax loss carryforward balances have not been recognized as a deferred tax asset on the statement of financial position in accordance with IFRS.
Net loss from continuing operations
Net loss from continuing operations was $8.9 million for the nine months ended May 31, 2012, as compared to $11.3 million for the nine months ended May 31, 2011 as a result of the factors described above in loss before income taxes.
Net earnings from discontinued operations
Net earnings from discontinued operations for the nine months ended May 31, 2012 was $14.1 million and includes a $17.1 million gain on sale of discontinued operations and an allocation of $6.4 million of interest expense representing an accelerated amortization of debt issuance costs related to the debt repayment of $86.5 million described earlier. The Transaction was completed on November 30, 2011, as a result there were no discontinued operations for the three months ended February 29, 2012 and May 31, 2012 and as such the earnings are not comparable to the net earnings from discontinued operations of $2.1 million for the nine months ended May 31, 2011.
Net earnings (loss) attributable to equity holders of the Company
Net earnings for the nine months ended May 31, 2012 was $5.1 million as compared to a net loss of $9.2 million for the nine months ended May 31, 2011. The increase in net earnings is due to the decrease in net loss from continuing operations and increase in net earnings from discontinued operations, both as discussed above.
Postmedia’s segment operations for the three and nine months ended May 31, 2012 as compared to the three and nine months ended May 31, 2011
| | | For the three | | | For the nine | |
| | | months ended | | | months ended | |
| | | May 31, | | | May 31, | |
| | | 2012 | | | 2011 | | | 2012 | | | 2011 | |
| | | | | | | | | | | | | |
| Revenues | | | | | | | | | | | | |
| Newspaper | | | 203,993 | | | | 219,272 | | | | 617,683 | | | | 670,381 | |
| All other | | | 9,099 | | | | 9,381 | | | | 27,079 | | | | 29,413 | |
| Intersegment elimination | | | (1,071 | ) | | | (1,025 | ) | | | (3,009 | ) | | | (3,057 | ) |
| | | | 212,021 | | | | 227,628 | | | | 641,753 | | | | 696,737 | |
| Operating expenses | | | | | | | | | | | | | | | | |
| Newspaper | | | 165,412 | | | | 168,297 | | | | 494,618 | | | | 502,572 | |
| All other | | | 6,542 | | | | 5,910 | | | | 18,682 | | | | 17,925 | |
| Corporate | | | 4,910 | | | | 7,866 | | | | 15,299 | | | | 23,628 | |
| Intersegment elimination | | | (1,071 | ) | | | (1,025 | ) | | | (3,009 | ) | | | (3,057 | ) |
| | | | 175,793 | | | | 181,048 | | | | 525,590 | | | | 541,068 | |
| Operating income before depreciation, amortization | | | | | | | | | | | | | | | | |
| and restructuring | | | | | | | | | | | | | | | | |
| Newspaper | | | 38,581 | | | | 50,975 | | | | 123,065 | | | | 167,809 | |
| All other | | | 2,557 | | | | 3,471 | | | | 8,397 | | | | 11,488 | |
| Corporate | | | (4,910 | ) | | | (7,866 | ) | | | (15,299 | ) | | | (23,628 | ) |
| | | | 36,228 | | | | 46,580 | | | | 116,163 | | | | 155,669 | |
Newspaper
Revenue for the Newspaper segment decreased $15.3 million and $52.7 million, or 7.0% and 7.9%, during the three and nine months ended May 31, 2012, respectively, as compared to the three and nine months ended May 31, 2011. The decreases in revenue are due to decreases in print advertising revenue of $14.5 million and $48.8 million for the three and nine months ended May 31, 2012 as compared to the three and nine months ended May 31, 2011, respectively, and decreases in print circulation revenue of $2.8 million and $6.9 million, respectively, both as discussed previously, partially offset by increases in digital revenue, which were primarily a result of increased newspaper digital advertising revenue. Newspaper digital advertising revenue increased $1.9 million and $3.7 million, or 14.5% and 9.6%, during the three and nine months ended May 31, 2012, respectively, as compared to the three and nine months ended May 31, 2011 primarily due to increases in local digital advertising revenue as discussed previously.
Operating expenses for the Newspaper segment decreased $2.9 million and $8.0 million, or 1.7% and 1.6%, during the three and nine months ended May 31, 2012, respectively, as compared to the three and nine months ended May 31, 2011. The $2.9 million decrease in operating expenses for the three months ended May 31, 2012 as compared to the three months ended May 31, 2011 is primarily due to a decrease in compensation expense of $3.2 million, newsprint expense decrease of $0.8 million, distribution expense decreases of $1.1 million, partially offset by an increase in centralized service cost allocations of $1.5 million and a recovery to a provision in the three months ended May 31, 2011 as discussed previously. The $8.0 million decrease in operating expenses for the nine months ended May 31, 2012 as compared to the nine months ended May 31, 2011 is primarily due to the impact of restructuring and cost reduction initiatives implemented during the year ended August 31, 2011. In particular compensation expense decreased $10.8 million, newsprint expense decreased $3.6 million and distribution decreased $1.2 million. Partially offsetting these decreases are increases in marketing and promotion of $0.5 million, increases in external printing of $1.1 million, an increase in centralized service cost allocations of $5.7 million and a recovery to a provision in the nine months ended May 31, 2011 as discussed previously.
Operating income before depreciation, amortization and restructuring for the Newspaper segment decreased $12.4 million and $44.7 million to $38.6 million and $123.1 million for the three and nine months ended May 31, 2012, respectively, as compared to the three and nine months ended May 31, 2011. The decrease is due to the decrease in revenue, partially offset by reduced operating expenses, both as described above.
All other
Operating income before depreciation, amortization and restructuring for the All other category decreased $0.9 million and $3.1 million to $2.6 million and $8.4 million for the three and nine months ended May 31, 2012, respectively, as compared to the three and nine months ended May 31, 2011. The decreases are primarily due to decreased digital advertising revenues of $1.2 million and $3.1 million in the three and nine months ended May 31, 2012, respectively, which were predominantly related to decreases in national digital advertising revenue.
Corporate
Corporate expenses decreased $3.0 million and $8.3 million to $4.9 million and $15.3 million for the three and nine months ended May 31, 2012, respectively, as compared to the three and nine months ended May 31, 2011. The decreases are primarily due to decreased compensation costs of $3.9 million and $9.8 million in the three and nine months ended May 31, 2012, respectively, primarily as a result of a decrease in share-based compensation expense and an increase in employee benefit plan cost allocations to the Newspaper segment, partially offset by increased legal and regulatory costs associated with being a public company.
Consolidated quarterly financial information
| | | | | | | | | | | | | | | | | | | | | | | | | | | | |
| | | Postmedia | | | Canwest Limited Partnership (2) |
| ($ in thousands of Canadian dollars, except per share information) | | Fiscal 2012 (1) | | | Fiscal 2011 (1) | | | Fiscal 2010 (3) | | Fiscal 2010 (3) |
| | | | Q3 | | | | Q2 | | | | Q1 | | | | Q4 | | | | Q3 | | | | Q2 | | | | Q1 | | | July 13, 2010 to August 31, 2010 | | June 1, 2010 to July 12, 2010 |
| Revenue | | | 212,021 | | | | 198,642 | | | | 231,090 | | | | 202,151 | | | | 227,628 | | | | 215,010 | | | | 254,099 | | | | 122,094 | | | | 119,229 | |
| | | | | | | | | | | | | | | | | | | | | | | | | | | | | | | | | | | | | |
| Net earnings (loss) from continuing operations | | | (12,137 | ) | | | (11,065 | ) | | | 14,278 | | | | (838 | ) | | | (5,162 | ) | | | (10,728 | ) | | | 4,574 | | | | n/a | (3) | | | n/a | (3)(5) |
| Net earnings (loss) per share from continuing operations | | | | | | | | | | | | | | | | | | | | | | | | | | | | | | | | | | | | |
| Basic | | $ | (0.30 | ) | | $ | (0.27 | ) | | $ | 0.35 | | | $ | (0.02 | ) | | $ | (0.13 | ) | | $ | (0.27 | ) | | $ | 0.11 | | | | n/a | (3) | | | n/a | (3)(5) |
| Diluted | | $ | (0.30 | ) | | $ | (0.27 | ) | | $ | 0.35 | | | $ | (0.02 | ) | | $ | (0.13 | ) | | $ | (0.27 | ) | | $ | 0.11 | | | | n/a | (3) | | | n/a | (3)(5) |
| | | | | | | | | | | | | | | | | | | | | | | | | | | | | | | | | | | | | |
| Net earnings (loss) attributible to equity holders of the Company | | | (12,137 | ) | | | (11,065 | ) | | | 28,331 | | | | (351 | ) | | | (2,725 | ) | | | (12,518 | ) | | | 6,005 | | | | (44,618 | ) | | | n/a | (4) |
| Net earnings (loss) per share attributible to equity holders of the Company | | | | | | | | | | | | | | | | | | | | | | | | | | | | | | | | | | | | |
| Basic | | $ | (0.30 | ) | | $ | (0.27 | ) | | $ | 0.70 | | | $ | (0.01 | ) | | $ | (0.07 | ) | | $ | (0.31 | ) | | $ | 0.15 | | | $ | (1.11 | ) | | | n/a | (5) |
| Diluted | | $ | (0.30 | ) | | $ | (0.27 | ) | | $ | 0.70 | | | $ | (0.01 | ) | | $ | (0.07 | ) | | $ | (0.31 | ) | | $ | 0.15 | | | $ | (1.11 | ) | | | n/a | (5) |
| | | | | | | | | | | | | | | | | | | | | | | | | | | | | | | | | | | | | |
| Cash flows from operating activities | | | 24,046 | | | | 16,045 | | | | 9,922 | | | | (5,187 | ) | | | 39,236 | | | | 9,185 | | | | (4,615 | ) | | | 17,502 | | | | n/a | (4) |
Notes:
| (1) | The historical consolidated quarterly financial information for Postmedia for Fiscal 2012 and Fiscal 2011 has been prepared in accordance with IFRS. |
| (2) | We have included historical consolidated quarterly financial information of Canwest Limited Partnership, prepared under Canadian GAAP, to provide quarterly historical financial data of the operations we acquired. However, Canwest Limited Partnership’s historical quarterly financial information is not comparable to our quarterly consolidated financial information and readers are cautioned that such information is not indicative of the future financial condition, results of operations, cash flows and the future development of our business. |
| (3) | The historical quarterly financial information for Postmedia and Canwest Limited Partnership for Fiscal 2010 has been prepared in accordance with Canadian GAAP and has not been restated for discontinued operations and as a result net earnings (loss) from continuing operations and net earnings (loss) per share from continuing operations have not been presented. |
| (4) | As Canwest Limited Partnership was under the liquidation basis of accounting for the period from June 1, 2010 to July 12, 2010, the supplementary financial information in note 5 of the audited financial statements of Canwest Limited Partnership did not include a provision for income taxes. As a result net earnings (loss) attributable to equity holders of the Company has not been presented for the period from June 1, 2010 to July 12, 2010 in the above table. Additionally, no cash flow information was prepared for Canwest Limited Partnership under the liquidation basis of accounting for the period from June 1, 2010 to July 12, 2010 and as a result cash flows from operating activities has not been presented for the period from June 1, 2010 to July 12, 2010 in the above table. |
| (5) | Net earnings (loss) per share has not been provided for the partnership units of Canwest Limited Partnership. |
Liquidity and capital resources
Our principal uses of funds are for working capital requirements, debt servicing and capital expenditures. Based on our current and anticipated level of operations, we believe that our cash on hand, cash flows from operations and available borrowings under our Term Loan Facility and asset-based revolving credit facility (“ABL Facility”) will enable us to meet our working capital, capital expenditures, debt servicing and other funding requirements for the foreseeable future. However, our ability to fund our working capital needs, debt payments and other obligations, and to comply with the financial covenants under our debt agreements, depends on our future operating performance and cash flows. There are a number of factors which may adversely affect our operating performance and our ability to meet these obligations. See “Key Factors Affecting Operating Results” above. Our cash flows from operating activities may be impacted by, among other things, the overall strength of the economy, competition from other newspapers and alternative forms of media and competition from alternative emerging technologies. In addition, in recent years there has been a growing shift in advertising dollars from newspaper advertising to other advertising formats, including online and other digital platforms such as search and social media. As a result of the challenging economy, we expect our capital expenditures for the year ending August 31, 2012 to be approximately $15 million to $20 million, as compared to the $32 million to $35 million estimated in our annual management’s discussion and analysis for the year ended August 31, 2011 and period ended August 31, 2010. Although we expect to fund our capital needs with our available cash, cash generated from operations and available borrowings under the ABL Facility, our indebtedness could adversely affect our financial condition and prevent us from fulfilling our obligations under our debt agreements. We regularly review financing alternatives and would consider refinancing existing indebtedness if we were able to achieve greater financial flexibility or reduce interest costs.
The financial covenants in the Term Loan Facility credit agreement are as follows:
| | · | The consolidated interest coverage ratio shall not at any time be less than 2.00 to 1.00; |
| | · | The consolidated total leverage ratio shall not exceed (a) 4.50 to 1.00 through November 29, 2012 and (b) 4.00 to 1.00 from November 30, 2012 through maturity; and |
| | · | The consolidated first lien indebtedness leverage ratio shall not exceed (a) 3.00 to 1.00 through November 29, 2012 and (b) 2.50 to 1.00 from November 30, 2012 through maturity. |
As at May 31, 2012, we were in compliance with all debt covenants and no amounts were drawn under the ABL Facility.
Sources of Cash
Cash flows from operating activities
Our principal sources of liquidity are cash flows from operating activities. For the three and nine months ended May 31, 2012, our cash flows from operating activities were inflows of $24.0 million and $50.0 million, respectively (2011 – $39.2 million and $43.8 million, respectively). Cash flows from operating activities decreased $15.2 million for the three months ended May 31, 2012, as compared to the three months ended May 31, 2011, due to declines in operating income partially offset by an increase in non-cash working capital. Cash flows from operating activities increased $6.2 million for the nine months ended May 31, 2012, as compared to the nine months ended May 31, 2011, due to increases in non-cash working capital, partially offset by declines in operating income. As at May 31, 2012 we had cash of $28.7 million (August 31, 2011 - $10.5 million) and our ABL facility was undrawn. Availability under the ABL facility as at May 31, 2012 was $32.9 million (August 31, 2011 - $37.3 million).
Cash flows from investing activities
For the three and nine months ended May 31, 2012, our cash flows from investing activities were outflows of $1.8 million and inflows of $76.6 million, respectively (2011 – outflows of $5.1 million and $12.0 million, respectively). The cash outflows from investing activities during the three and nine months ended May 31, 2012 include capital expenditures related to property and equipment of $1.7 million and $5.6 million, respectively (2011 - $3.3 million and $7.0 million, respectively) and intangible asset expenditures of $1.5 million and $5.2 million, respectively (2011 - $1.9 million and $6.2 million, respectively). The cash inflows during the three and nine months ended May 31, 2012, include the net proceeds from the sale of discontinued operations of $1.5 million and $87.3 million, respectively. In the three and nine months ended May 31, 2012, we received nominal proceeds on the sale of property and equipment and intangible assets (2011 - $0.1 million and $1.2 million, respectively).
Uses of Cash
Cash flows from financing activities
Cash flows from financing activities for the three and nine months ended May 31, 2012, were an outflow of $7.6 million and $108.3 million, respectively (2011 - $17.6 million and $41.0 million, respectively), and were related to our indebtedness as discussed below.
Indebtedness
As of May 31, 2012, we have amounts outstanding under the Term Loan Facility of US$240.0 million (August 31, 2011 - US$340.0 million). In addition, as at May 31, 2012, we have US$268.6 million of Notes outstanding (August 31, 2011 - US$275.0 million).
During the three months ended May 31, 2012 we made mandatory and optional principal repayments on our Term Loan Facility of $7.6 million (US$7.5 million) (2011 – $16.3 million (US$16.8 million). During the nine months ended May 31, 2012 we made mandatory and optional principal repayments on our Term Loan Facility of $102.0 million (US$100.0 million), which includes the required repayment due to the sale of the Disposed Properties described earlier in “Overview and Background” (2011 - $39.4 million (US$37.3 million and CDN$2.8 million). On April 4, 2011, we entered into an agreement to amend certain terms of the Term Loan Facility. As a result, amounts then outstanding under the Term Loan Facility including the US Tranche of $238.0 million (US$247.0 million) and the Canadian Tranche of $107.3 million were repaid and replaced with Tranche C. Tranche C was issued for US$365.0 million (CDN$351.7 million) at a discount of 0.25% for net proceeds of $350.8 million before financing fees of $5.0 million.
During the nine months ended May 31, 2012 we repurchased and retired US$6.4 million of the Notes for total cash consideration of $6.3 million (US$6.2 million). We did not retire any of the Notes during the nine months ended May 31, 2011.
During the three and nine months ended May 31, 2011 we made a payment on a capital lease of $1.8 million.
The following tables set out the principal and carrying amount of debt outstanding as at May 31, 2012 and August 31, 2011. The first column of the table translates our US dollar debt to the Canadian equivalent based on foreign exchange rates specified in our foreign currency swap agreements for swapped debt and at the closing foreign exchange rate on May 31, 2012 and August 31, 2011, respectively, for our non-swapped debt.
| | | | | | | | | | | | | |
| | | May 31, 2012 | |
| ($ in thousands of Canadian dollars) | | Principal translated at swapped or period end rates | | | Principal translated at period end exchange rates | | | Financing fees, discounts and other | | | Carrying Value | |
| Term loan - Tranche C (swapped) (US$180.3M) | | | 184,501 | | | | 186,181 | | | | 8,576 | | | | 177,605 | |
| Term loan - Tranche C (non-swapped) (US$59.7M) | | | 61,711 | | | | 61,711 | | | | 2,842 | | | | 58,869 | |
| Notes (swapped) (US$265.0M) | | | 274,275 | | | | 273,719 | | | | 9,072 | | | | 264,647 | |
| Notes (non-swapped) (US$3.6M) | | | 3,754 | | | | 3,754 | | | | 124 | | | | 3,630 | |
| | | | 524,241 | | | | 525,365 | | | | 20,614 | | | | 504,751 | |
| | | | | | | | | | | | | | | | | |
| | | | | | | | | | | | | | | | | |
| | | August 31, 2011 | |
| ($ in thousands of Canadian dollars) | | Principal translated at swapped or period end rates | | | Principal translated at period end exchange rates | | | Financing fees, discounts and other | | | Carrying Value | |
| Term loan - Tranche C (swapped) (US$228.1M) | | | 233,679 | | | | 223,426 | | | | 13,325 | | | | 210,101 | |
| Term loan - Tranche C (non-swapped) (US$111.9M) | | | 109,598 | | | | 109,598 | | | | 6,537 | | | | 103,061 | |
| Notes (swapped) (US$275.0M) | | | 284,625 | | | | 269,335 | | | | 10,199 | | | | 259,136 | |
| | | | 627,902 | | | | 602,359 | | | | 30,061 | | | | 572,298 | |
Financial position as at May 31, 2012 compared to August 31, 2011
| | | | | | | |
| ($ in thousands of Canadian dollars) | | May 31, 2012 | | | August 31, 2011 | |
| | | | | | | |
| Current assets | | | 151,937 | | | | 150,822 | |
| Total assets | | | 1,081,932 | | | | 1,180,243 | |
| Current liabilities | | | 156,232 | | | | 148,255 | |
| Total liabilities | | | 827,002 | | | | 864,963 | |
| Shareholders' equity | | | 254,930 | | | | 315,280 | |
The increase in our current assets at May 31, 2012 as compared to August 31, 2011 is due to an increase in cash, partially offset by the sale of the current assets of the Disposed Properties and a decrease in prepaid expenses and other assets. Total assets at May 31, 2012 increased compared to August 31, 2011, due to the increase in current assets and derivative financial instrument assets, partially offset by the sale of assets of the Disposed Properties and a reduction of carrying amounts for property and equipment and indefinite life intangible assets as a result of depreciation and amortization recorded during the nine months ended May 31, 2012. Current liabilities have increased due to increased accrued interest payable on the Notes as well as increased restructuring liabilities, partially offset by the sale of the current liabilities of the Disposed Properties. The decrease in total liabilities is due to principal repayments on long-term debt, decreases in the fair value of derivative financial instruments liabilities, partially offset by increases in other non-current liabilities due to an increase in the carrying value of our employee benefit plans, combined with the increase in current liabilities previously described.
Financial Instruments and Financial Instruments Risk Management
The financial instruments and financial risk management are the same as disclosed in the August 31, 2011 audited consolidated financial statements except as disclosed below.
Financial instruments
Derivative financial instruments
During the three and nine months ended May 31, 2012, we had principal exchanges of US$13.5 million and US$40.5 million, respectively, on our foreign currency interest rate swap associated with Tranche C that was not designated as a hedge, and as a result have a notional amount of US$139.5 million outstanding on this swap as at May 31, 2012 (August 31, 2011 – US$180.0 million).
During the three and nine months ended May 31, 2012, we had principal exchanges of US$2.8 million and US$7.4 million, respectively, on our foreign currency interest rate swap associated with Tranche C that was designated as a hedge, and as a result have a notional amount of US$40.8 million outstanding on this swap as at May 31, 2012 (August 31, 2011 – US$48.1 million)
During the nine months ended May 31, 2012, in conjunction with the retirement of a portion of the Notes as described under “Indebtedness” above, we settled notional US$10.0 million of our associated foreign currency interest rate swap that was designated as a hedge for cash consideration of $0.7 million and as a result have a notional amount of US$265.0 million outstanding on this swap as at May 31, 2012 (August 31, 2011 – US$275.0 million).
Financial risk management
Foreign currency risk
We have entered into transactions to reduce foreign currency risk exposure on our US dollar denominated debt. As of May 31, 2012, we had mitigated foreign currency risk on 88% of our US dollar denominated debt, meeting our goal of largely eliminating our exposure to foreign currency fluctuations on our US dollar denominated indebtedness (August 31, 2011 – 82%). As at May 31, 2012, we were still exposed to foreign currency risk on the non-swapped portion of Tranche C of US$59.7 million and the non-swapped portion of the Notes of US$3.6 million, representing 12% of our aggregate outstanding US dollar denominated indebtedness (August 31, 2011 – 18%).
Guarantees and Off-Balance Sheet Arrangements
We do not have any significant guarantees or off-balance sheet arrangements.
Contractual obligations and commitments
Our obligations under firm contractual arrangements, including commitments for future payments under capital lease arrangements, operating lease arrangements, pension funding agreements and swap agreements are not materially different from those discussed in our annual management’s discussion and analysis for the year ended August 31, 2011 and the period ended August 31, 2010 other than the effects of foreign exchange on our US dollar swap agreements. Our obligations under firm contractual arrangements related to debt agreements are not materially different from those discussed in our interim management’s discussion and analysis for the three months ended November 30, 2011 and 2010 other than the effects of foreign exchange on our US dollar debt agreements.
Differences between IFRS and US GAAP
The preceding discussion and analysis has been based upon financial statements prepared in accordance with IFRS, which differs in certain respects from US GAAP. The significant differences are discussed in detail in note 21 of our interim condensed consolidated financial statements for the three months ended November 30, 2011 and 2010 and in note 16 of our interim condensed consolidated financial statements for the three and nine months ended May 31, 2012 and 2011.
Internal Controls
Disclosure controls and procedures within the Company have been designed to provide reasonable assurance that all relevant information is identified to its management, including the Company’s Chief Executive Officer (“CEO”) and Chief Financial Officer (“CFO”), as appropriate, to allow required disclosures to be made in a timely fashion.
Internal controls over financial reporting have been designed by management, under the supervision of and with the participation of the Company’s CEO and CFO, to provide reasonable assurance regarding the reliability of the Company’s financial reporting and the preparation of financial statements for external purposes in accordance with IFRS.
The CEO and CFO of the Company have evaluated whether there were changes to the Company’s internal control over financial reporting during the three and nine months ended May 31, 2012 that have materially affected, or are reasonably likely to materially affect, the Company’s internal control over financial reporting. There were no changes identified during their evaluation. Furthermore, the Company has determined that there has been no material change in internal controls over financial reporting as a result of the adoption of IFRS.
Risk Factors
The risks relating to our business are described in the section entitled “Risk Factors” included in our annual management’s discussion and analysis for the year ended August 31, 2011 and period ended August 31, 2010, which section is incorporated by reference herein.
Share Capital
As at July 4, 2012 we had the following number of shares and options outstanding:
| | Class C voting shares | | | 1,301,430 | |
| | Class NC variable voting shares | | | 39,021,740 | |
| | Total shares outstanding | | | 40,323,170 | |
| | | | | | |
| | Total options and restricted share units outstanding (1) | | | 2,180,000 | |
(1) The total options and restricted share units outstanding are convertible into 2.1 million Class C voting shares and 0.1 million Class NC variable voting shares. The total options and restricted share units outstanding include 0.8 million options that are vested and 1.4 million options that are unvested.
26