UNITED STATES
SECURITIES AND EXCHANGE COMMISSION
Washington, D.C. 20549
FORM N-CSR
CERTIFIED SHAREHOLDER REPORT OF REGISTERED
MANAGEMENT INVESTMENT COMPANIES
Investment Company Act file number: 811-22538
Advisers Investment Trust
(Exact name of registrant as specified in charter)
50 S. LaSalle Street
Chicago, Illinois 60603
(Address of principal executive offices) (Zip code)
The Northern Trust Company
50 S. LaSalle Street
Chicago, Illinois 60603
(Name and address of agent for service)
Registrant’s telephone number, including area code: (855) 351-4583
Date of fiscal year end: September 30
Date of reporting period: March 31, 2022
Form N-CSR is to be used by management investment companies to file reports with the Commission not later than 10 days after the transmission to stockholders of any report that is required to be transmitted to stockholders under Rule 30e-1 under the Investment Company Act of 1940 (17 CFR 270.30e-1). The Commission may use the information provided on Form N-CSR in its regulatory, disclosure review, inspection, and policymaking roles.
A registrant is required to disclose the information specified by Form N-CSR, and the Commission will make this information public. A registrant is not required to respond to the collection of information contained in Form N-CSR unless the Form displays a currently valid Office of Management and Budget (“OMB”) control number. Please direct comments concerning the accuracy of the information collection burden estimate and any suggestions for reducing the burden to Secretary, Securities and Exchange Commission, 450 Fifth Street, NW, Washington, DC 20549-0609. The OMB has reviewed this collection of information under the clearance requirements of 44 U.S.C. § 3507.
Item 1. Reports to Stockholders.
(a) The following are copies of reports transmitted to shareholders pursuant to Rule 30e-1 under the Investment Company Act of 1940 (17 CFR 270.30e-1).

INDEPENDENT FRANCHISE PARTNERS
US EQUITY FUND
SEMI-ANNUAL REPORT
March 31, 2022
This report is submitted for the general information of the shareholders of the Fund. It is not authorized for
the distribution to prospective investors unless preceded or accompanied by an effective prospectus.
ADVISERS INVESTMENT TRUST
INDEPENDENT FRANCHISE PARTNERS US EQUITY FUND
TABLE OF CONTENTS
March 31, 2022 (Unaudited)
ADVISERS INVESTMENT TRUST
INDEPENDENT FRANCHISE PARTNERS US EQUITY FUND
SHAREHOLDER LETTER
March 31, 2022 (Unaudited)
Dear Shareholder:
We are pleased to present to shareholders the March 31, 2022 Semi-Annual Report for the Independent Franchise Partners US Equity Fund (the “Fund”), a series of the Advisers Investment Trust. This report contains the results of Fund operations for the six months ended March 31, 2022.
We appreciate the trust and confidence you have placed in us by choosing the Fund and its Investment Adviser, Independent Franchise Partners, LLP, and we look forward to continuing to serve your investing needs.
Sincerely,
| | | | |

| | 
| | |
Barbara J. Nelligan | | Sandeep Ghela | | |
President | | Chief Operating Officer | | |
Advisers Investment Trust | | Independent Franchise Partners, LLP | | |
1
ADVISERS INVESTMENT TRUST
INDEPENDENT FRANCHISE PARTNERS US EQUITY FUND
SCHEDULE OF INVESTMENTS
March 31, 2022 (Unaudited)
| | | | | | | | | | | | |
| | | Percentage
of Net
Assets | | | Shares | | | Value | |
COMMON STOCKS | | | 98.8% | | | | | | | | | |
Biotechnology | | | 4.2% | | | | | | | | | |
Corteva Inc. | | | | | | | 1,398,607 | | | $ | 80,391,930 | |
| | | | | | | | | | | | |
Commercial Services | | | 7.8% | | | | | | | | | |
Ritchie Bros. Auctioneers Inc. | | | | | | | 1,153,330 | | | | 68,081,070 | |
Terminix Global Holdings Inc.(a) | | | | | | | 792,443 | | | | 36,159,174 | |
TransUnion | | | | | | | 424,249 | | | | 43,841,892 | |
| | | | | | | | | | | | |
| | | | | | | | | | | 148,082,136 | |
| | | | | | | | | | | | |
Diversified Financials | | | 9.0% | | | | | | | | | |
Intercontinental Exchange Inc. | | | | | | | 577,299 | | | | 76,272,744 | |
S&P Global Inc. | | | | | | | 141,111 | | | | 57,880,910 | |
Western Union Co. | | | | | | | 2,006,384 | | | | 37,599,636 | |
| | | | | | | | | | | | |
| | | | | | | | | | | 171,753,290 | |
| | | | | | | | | | | | |
Diversified Support Services | | | 2.9% | | | | | | | | | |
IAA Inc.(a) | | | | | | | 1,447,942 | | | | 55,383,782 | |
| | | | | | | | | | | | |
Health Care Equipment & Supplies | | | 1.3% | | | | | | | | | |
Alcon Inc. | | | | | | | 317,746 | | | | 25,342,655 | |
| | | | | | | | | | | | |
Insurance | | | 4.2% | | | | | | | | | |
Aon PLC - Class A | | | | | | | 243,100 | | | | 79,160,653 | |
| | | | | | | | | | | | |
Internet Software & Services | | | 15.3% | | | | | | | | | |
Alphabet Inc. - Class A(a) | | | | | | | 24,862 | | | | 69,149,924 | |
Booking Holdings Inc.(a) | | | | | | | 37,410 | | | | 87,855,514 | |
eBay Inc. | | | | | | | 1,162,225 | | | | 66,549,003 | |
Zillow Group Inc. - Class A(a) | | | | | | | 165,087 | | | | 7,962,146 | |
Zillow Group Inc. - Class C(a) | | | | | | | 1,191,023 | | | | 58,705,524 | |
| | | | | | | | | | | | |
| | | | | | | | | | | 290,222,111 | |
| | | | | | | | | | | | |
IT Services | | | 1.4% | | | | | | | | | |
Accenture PLC - Class A | | | | | | | 78,584 | | | | 26,500,882 | |
| | | | | | | | | | | | |
Media | | | 13.0% | | | | | | | | | |
Fox Corp. - Class A | | | | | | | 2,198,133 | | | | 86,716,347 | |
News Corp. - Class A | | | | | | | 3,371,628 | | | | 74,681,560 | |
News Corp. - Class B | | | | | | | 1,509,703 | | | | 33,998,512 | |
World Wrestling Entertainment Inc. - Class A | | | | | | | 814,667 | | | | 50,867,807 | |
| | | | | | | | | | | | |
| | | | | | | | | | | 246,264,226 | |
| | | | | | | | | | | | |
Pharmaceuticals | | | 14.8% | | | | | | | | | |
Bristol-Myers Squibb Co. | | | | | | | 1,664,421 | | | | 121,552,666 | |
Johnson & Johnson | | | | | | | 444,507 | | | | 78,779,975 | |
Novartis AG - REG | | | | | | | 906,949 | | | | 79,746,341 | |
| | | | | | | | | | | | |
| | | | | | | | | | | 280,078,982 | |
| | | | | | | | | | | | |
Software | | | 12.5% | | | | | | | | | |
Electronic Arts Inc. | | | | | | | 535,204 | | | | 67,708,658 | |
Microsoft Corp. | | | | | | | 187,729 | | | | 57,878,728 | |
Oracle Corp. | | | | | | | 852,232 | | | | 70,505,154 | |
Salesforce Inc.(a) | | | | | | | 190,273 | | | | 40,398,763 | |
| | | | | | | | | | | | |
| | | | | | | | | | | 236,491,303 | |
| | | | | | | | | | | | |
See Notes to Financial Statements.
2
ADVISERS INVESTMENT TRUST
INDEPENDENT FRANCHISE PARTNERS US EQUITY FUND
SCHEDULE OF INVESTMENTS
March 31, 2022 (Unaudited)
| | | | | | | | | | | | |
| | | Percentage of Net Assets | | | Shares | | | Value | |
Tobacco | | | 8.6% | | | | | | | | | |
British American Tobacco PLC | | | | | | | 1,629,279 | | | $ | 68,371,965 | |
Philip Morris International Inc. | | | | | | | 1,001,609 | | | | 94,091,150 | |
| | | | | | | | | | | | |
| | | | | | | | | | | 162,463,115 | |
| | | | | | | | | | | | |
Toys/Games/Hobbies | | | 3.8% | | | | | | | | | |
Nintendo Co. Ltd. | | | | | | | 141,917 | | | | 71,891,091 | |
| | | | | | | | | | | | |
TOTAL COMMON STOCKS (Cost $1,361,829,750) | | | | | | | | | | | 1,874,026,156 | |
| | | | | | | | | | | | |
TOTAL INVESTMENTS
(Cost $1,361,829,750) | | | 98.8% | | | | | | | | 1,874,026,156 | |
NET OTHER ASSETS (LIABILITIES) | | | 1.2% | | | | | | | | 23,429,150 | |
| | | | | | | | | | | | |
NET ASSETS | | | 100.0% | | | | | | | $ | 1,897,455,306 | |
| | | | | | | | | | | | |
(a)Non-income producing security.
Abbreviations:
REG – Registered
At March 31, 2022, the Fund’s investments were concentrated in the following countries:
| | | | | | |
| | | | | Percentage | |
| | | Country Allocation | | of Net Assets | |
United States | | | | | 82.3 | % |
Switzerland | | | | | 5.5 | |
Japan | | | | | 3.8 | |
United Kingdom | | | | | 3.6 | |
Canada(b) | | | | | 3.6 | |
Total | | | | | 98.8 | % |
(b)Ritchie Bros. Auctioneers Inc. is incorporated in Canada; however, its primary listing is on the New York Stock Exchange (NYSE) in the United States. We therefore define Ritchie Bros. Auctioneers Inc. as a United States equity security, consistent with the terms set out in the prospectus.
See Notes to Financial Statements.
3
ADVISERS INVESTMENT TRUST
STATEMENT OF ASSETS & LIABILITIES
March 31, 2022 (Unaudited)
| | | | |
| | | Independent
Franchise Partners
US Equity Fund | |
Assets: | | | | |
Investments, at value (Cost: $1,361,829,750) | | $ | 1,874,026,156 | |
Cash | | | 19,094,447 | |
Receivable for dividends | | | 4,931,880 | |
Reclaims receivable | | | 2,462,404 | |
Receivable for investments sold | | | 1,436,786 | |
Prepaid expenses | | | 26,089 | |
| | | | |
Total Assets | | | 1,901,977,762 | |
| | | | |
Liabilities: | | | | |
Capital shares redeemed payable | | | 1,500,000 | |
Investment advisory fees payable | | | 955,646 | |
Accounting and Administration fees payable | | | 1,953,651 | |
Regulatory and Compliance fees payable | | | 20,662 | |
Risk Officer fees payable | | | 13,525 | |
Accrued expenses and other payables | | | 78,972 | |
| | | | |
Total Liabilities | | | 4,522,456 | |
| | | | |
Net Assets | | $ | 1,897,455,306 | |
| | | | |
Net assets | | $ | 1,897,455,306 | |
Shares of common stock outstanding | | | 87,719,587 | |
| | | | |
Net asset value per share | | $ | 21.63 | |
| | | | |
Net Assets: | | | | |
Paid in capital | | $ | 1,236,202,886 | |
Distributable earnings (loss) | | | 661,252,420 | |
| | | | |
Net Assets | | $ | 1,897,455,306 | |
| | | | |
| | | | | |
See Notes to Financial Statements.
4
ADVISERS INVESTMENT TRUST
STATEMENT OF OPERATIONS
For the six months ended March 31, 2022 (Unaudited)
| | | | |
| | | Independent
Franchise Partners
US Equity Fund | |
Investment Income: | | | | |
Dividend income (Net of foreign withholding tax of $661,547) | | $ | 19,465,503 | |
Operating expenses: | | | | |
Investment advisory | | | 5,987,028 | |
Accounting and Administration | | | 551,145 | |
Regulatory and Compliance | | | 87,277 | |
Trustees | | | 34,390 | |
Legal | | | 18,569 | |
Risk Officer | | | 15,025 | |
Other | | | 63,227 | |
| | | | |
Total expenses | | | 6,756,661 | |
| | | | |
Net investment income | | | 12,708,842 | |
| | | | |
Realized and Unrealized Gains (Losses) from Investment Activities: | | | | |
Net realized gains from investment transactions | | | 153,707,828 | |
Net realized gains from foreign currency transactions | | | 79,484 | |
Change in unrealized appreciation (depreciation) on investments | | | (86,740,882 | ) |
Change in unrealized appreciation (depreciation) on foreign currency | | | (26,534 | ) |
| | | | |
Net realized and unrealized gains from investment activities | | | 67,019,896 | |
| | | | |
Change in Net Assets Resulting from Operations | | $ | 79,728,738 | |
| | | | |
| | | | | |
See Notes to Financial Statements.
5
ADVISERS INVESTMENT TRUST
STATEMENTS OF CHANGES IN NET ASSETS
For the six months ended March 31, 2022 (Unaudited) and the year ended September 30, 2021
| | | | | | | | |
| | | Independent Franchise Partners
US Equity Fund | |
| | | 2022 | | | 2021 | |
Increase (decrease) in net assets: | | | | | | | | |
Operations: | | | | | | | | |
Net investment income | | $ | 12,708,842 | | | $ | 27,599,242 | |
Net realized gains (losses) from investment and foreign currency transactions | | | 153,787,312 | | | | 145,447,061 | |
Change in unrealized appreciation (depreciation) on investments and foreign currency | | | (86,767,416 | ) | | | 280,478,053 | |
| | | | | | | | |
Change in net assets resulting from operations | | | 79,728,738 | | | | 453,524,356 | |
| | | | | | | | |
Dividends paid to shareholders: | | | | | | | | |
From distributable earnings | | | (137,522,025 | ) | | | (212,970,649 | ) |
| | | | | | | | |
Total dividends paid to shareholders | | | (137,522,025 | ) | | | (212,970,649 | ) |
| | | | | | | | |
Capital Transactions: | | | | | | | | |
Proceeds from sale of shares | | | 44,902,926 | | | | 87,844,606 | |
Value of shares issued to shareholders in reinvestment of dividends | | | 131,436,175 | | | | 203,820,740 | |
Value of shares redeemed | | | (248,415,589 | ) | | | (182,818,970 | ) |
| | | | | | | | |
Change in net assets from capital transactions | | | (72,076,488 | ) | | | 108,846,376 | |
| | | | | | | | |
Change in net assets | | | (129,869,775 | ) | | | 349,400,083 | |
Net assets: | | | | | | | | |
Beginning of period | | | 2,027,325,081 | | | | 1,677,924,998 | |
| | | | | | | | |
End of period | | $ | 1,897,455,306 | | | $ | 2,027,325,081 | |
| | | | | | | | |
Share Transactions: | | | | | | | | |
Sold | | | 2,029,979 | | | | 4,116,944 | |
Reinvested | | | 6,238,072 | | | | 10,566,135 | |
Redeemed | | | (11,626,344 | ) | | | (8,677,118 | ) |
| | | | | | | | |
Change | | | (3,358,293 | ) | | | 6,005,961 | |
| | | | | | | | |
| | | | | | | | | |
See Notes to Financial Statements.
6
ADVISERS INVESTMENT TRUST
FINANCIAL HIGHLIGHTS
For the years indicated
| | | | | | | | | | | | | | | | | | | | | | | | |
| | | Independent Franchise Partners
US Equity Fund | |
| | | Six Months Ended
March 31, 2022 (Unaudited) | | | Year Ended
September 30, 2021 | | | Year Ended
September 30, 2020 | | | Year Ended
September 30, 2019 | | | Year Ended
September 30, 2018 | | | Year Ended
September 30, 2017 | |
Net asset value, beginning of period | | $ | 22.26 | | | $ | 19.72 | | | $ | 18.67 | | | $ | 18.55 | | | $ | 17.66 | | | $ | 16.21 | |
| | | | | | | | | | | | | | | | | | | | | | | | |
Income (loss) from operations: | | | | | | | | | | | | | | | | | | | | | | | | |
Net investment income | | | 0.14 | | | | 0.31 | | | | 0.37 | | | | 0.30 | | | | 0.28 | | | | 0.23 | |
Net realized and unrealized gains from investments | | | 0.73 | | | | 4.70 | | | | 2.72 | | | | 1.06 | | | | 1.51 | | | | 1.80 | |
| | | | | | | | | | | | | | | | | | | | | | | | |
Total from investment operations | | | 0.87 | | | | 5.01 | | | | 3.09 | | | | 1.36 | | | | 1.79 | | | | 2.03 | |
| | | | | | | | | | | | | | | | | | | | | | | | |
Less distributions paid: | | | | | | | | | | | | | | | | | | | | | | | | |
From net investment income | | | (0.26 | ) | | | (0.30 | ) | | | (0.37 | ) | | | (0.31 | ) | | | (0.24 | ) | | | (0.22 | ) |
From net realized gains on investments | | | (1.24 | ) | | | (2.17 | ) | | | (1.68 | ) | | | (0.93 | ) | | | (0.66 | ) | | | (0.36 | ) |
| | | | | | | | | | | | | | | | | | | | | | | | |
Total distributions paid | | | (1.50 | ) | | | (2.47 | ) | | | (2.05 | ) | | | (1.24 | ) | | | (0.90 | ) | | | (0.58 | ) |
| | | | | | | | | | | | | | | | | | | | | | | | |
Increase from redemption fees | | | — | (a) | | | — | (a) | | | 0.01 | | | | — | (a) | | | — | (a) | | | — | (a) |
| | | | | | | | | | | | | | | | | | | | | | | | |
Change in net asset value | | | (0.63 | ) | | | 2.54 | | | | 1.05 | | | | 0.12 | | | | 0.89 | | | | 1.45 | |
| | | | | | | | | | | | | | | | | | | | | | | | |
Net asset value, end of period | | $ | 21.63 | | | $ | 22.26 | | | $ | 19.72 | | | $ | 18.67 | | | $ | 18.55 | | | $ | 17.66 | |
| | | | | | | | | | | | | | | | | | | | | | | | |
Total return(b), (c) | | | 4.09 | % | | | 27.34 | % | | | 17.50 | %(d) | | | 8.67 | % | | | 10.34 | % | | | 12.99 | % |
Ratios/Supplemental data: | | | | | | | | | | | | | | | | | | | | | | | | |
Net assets, end of period (000’s) | | $ | 1,897,455 | | | $ | 2,027,325 | | | $ | 1,677,925 | | | $ | 2,128,522 | | | $ | 2,125,045 | | | $ | 1,929,030 | |
Ratio of net expenses to average net assets | | | 0.68 | %(e) | | | 0.72 | % | | | 0.76 | % | | | 0.76 | % | | | 0.76 | % | | | 0.77 | % |
Ratio of net investment income to average net assets | | | 1.27 | %(e) | | | 1.42 | % | | | 1.49 | % | | | 1.62 | % | | | 1.54 | % | | | 1.42 | % |
Ratio of gross expenses to average net assets | | | 0.68 | %(e) | | | 0.72 | % | | | 0.76 | % | | | 0.76 | %(f) | | | 0.76 | %(f) | | | 0.77 | % |
Portfolio turnover rate(b), (g) | | | 15.63 | % | | | 23.67 | % | | | 43.46 | % | | | 37.99 | % | | | 38.63 | % | | | 30.72 | % |
| | | | | | | | | | | | | | | | | | | | | | | | | |
| (a) | Redemption fees were less than $0.005 per share. |
| (b) | Not annualized for periods less than one year. |
| (c) | Total return excludes redemption fees. |
| (d) | During the period, the Adviser reimbursed the fund for a loss realized in connection with a trade error. Such payment represented 0.02% to the Fund’s total return. |
| (e) | Annualized for periods less than one year. |
| (f) | During the years shown, certain fees were reduced. If such fee reductions had not occurred, the ratio would have been as indicated. |
| (g) | Portfolio turnover rate includes applicable corporate action activity and securities trading as a result of investor subscription and redemption activity. |
See Notes to Financial Statements.
7
ADVISERS INVESTMENT TRUST
INDEPENDENT FRANCHISE PARTNERS US EQUITY FUND
NOTES TO FINANCIAL STATEMENTS
March 31, 2022 (Unaudited)
Advisers Investment Trust (the “Trust”) is a Delaware statutory trust operating under a Fourth Amended and Restated Agreement and Declaration of Trust (the “Trust Agreement”) dated March 10, 2022. The Trust was formerly an Ohio business trust, which commenced operations on December 20, 2011. On March 31, 2017, the Trust was converted to a Delaware statutory trust. As an open-end registered investment company, as defined in Financial Accounting Standards Board (“FASB”) Accounting Standards Update (“ASU”) 2013-08, the Trust follows accounting and reporting guidance under FASB Accounting Standards Codification (“ASC”) Topic 946, “Financial Services-Investment Companies”. The Trust Agreement permits the Board of Trustees (the “Trustees” or “Board”) to authorize and issue an unlimited number of shares of beneficial interest, at no par value, in separate series of the Trust. The Independent Franchise Partners US Equity Fund (the “IFP US Equity Fund” or “Fund”) is a series of the Trust. These financial statements and notes only relate to the IFP US Equity Fund.
The Fund is a non-diversified fund, meaning it may invest in a smaller number of companies than a diversified fund, and seeks to achieve an attractive long-term rate of return.
Under the Trust’s organizational documents, its officers and Trustees are indemnified against certain liabilities arising out of the performance of their duties to the Trust and Fund. In addition, in the normal course of business, the Trust enters into contracts with its vendors and others that provide for general indemnifications. The Fund’s maximum exposure under these arrangements is unknown, as this would involve future claims that may be made against the Fund.
| A. | Significant accounting policies are as follows: |
INVESTMENT VALUATION
Investments are recorded at fair value. Fair value is defined as the price that would be received to sell an asset or paid to transfer a liability in an orderly transaction between market participants at the measurement date. The valuation techniques employed by the Fund, as described below, maximize the use of observable inputs and minimize the use of unobservable inputs in determining fair value. These inputs are summarized in the following three broad levels:
| • | | Level 1 — quoted prices in active markets for identical assets |
| • | | Level 2 — other significant observable inputs (including quoted prices of similar securities, interest rates, prepayment speeds, credit risk, etc.) |
| • | | Level 3 — significant unobservable inputs (including the Fund’s own assumptions in determining the fair value of investments) |
The inputs or methodology used for valuing securities are not necessarily an indication of the risk associated with investing in those securities. For example, certain short-term debt securities may be valued using amortized cost. Generally, amortized cost approximates the current value of a security, but since this valuation is not obtained from a quoted price in an active market, such securities would be reflected as Level 2 in the fair value hierarchy.
Security prices are generally provided by an independent third party pricing service approved by the Trustees as of the close of the New York Stock Exchange, normally at 4:00 p.m. Eastern Time, each business day on which the share price of the Fund is calculated. Equity securities listed or traded on a primary exchange are valued at the closing price, if available, or the last sales price on the primary exchange. If no sale occurred on the valuation date, the securities will be valued at the latest quotations as of the close of the primary exchange. Investments in other open-end registered investment companies are valued at their respective net asset value as reported by such companies. In these types of situations, valuations are typically categorized as Level 1 in the fair value hierarchy.
Debt and other fixed income securities, if any, are generally valued at an evaluated price provided by an independent pricing source approved by the Trustees. To value debt securities, pricing services may use various pricing techniques, which take into account appropriate factors such as market activity, yield, quality, coupon rate, maturity, type of issue, trading characteristics, call features, credit
8
ADVISERS INVESTMENT TRUST
INDEPENDENT FRANCHISE PARTNERS US EQUITY FUND
NOTES TO FINANCIAL STATEMENTS
March 31, 2022 (Unaudited)
ratings and other data, as well as broker quotes. Short-term debt securities of sufficient credit quality that mature within sixty days may be valued at amortized cost, which approximates fair value. In each of these situations, valuations are typically categorized as Level 2 in the fair value hierarchy.
When the price of a security is not readily available or deemed unreliable (e.g., an approved pricing service does not provide a price, a furnished price is in error, certain stale prices, or an event occurs that materially affects the furnished price), the Fund’s Fair Value Committee may in good faith establish a fair value for that security in accordance with procedures established by and under the general supervision of the Trustees. In addition, fair value pricing may be used if events materially affecting the value of foreign securities occur between the time when the exchange on which they are traded closes and the time when the Fund’s net asset value is calculated. The Fund identifies possible fluctuations in international securities by monitoring the increase or decrease in the value of a designated benchmark index. In the event of an increase or decrease greater than predetermined levels, the Fund may use a systematic valuation model provided by an independent third party pricing service to fair value its international equity securities.
In the fair value situations noted above, while the Trust’s valuation policy is intended to result in a calculation of the Fund’s net asset value that fairly reflects security values as of the time of pricing, the Trust cannot ensure that fair values determined pursuant to these guidelines would accurately reflect the price that the Fund could obtain for a security if it were to dispose of that security as of the time of pricing (for instance, in a forced or distressed sale). The prices used by the Fund may differ from the value that would be realized if the securities were sold, and these differences could be material to the financial statements. Depending on the source and relative significance of the valuation inputs in these instances, the instruments may be classified as Level 2 or Level 3 in the fair value hierarchy.
The following is a summary of the valuation inputs used as of March 31, 2022 in valuing the Fund’s investments based upon the three fair value levels defined above:
| | | | | | | | | | | | | | | | |
| Fund | | Level 1 -
Quoted Prices | | | Level 2 -
Other Significant
Observable Inputs | | | Level 3 -
Significant
Unobservable Inputs | | | Total | |
| | |
Independent Franchise Partners US Equity Fund | | | | | | | | | | | | | | | | |
Common Stocks(1) | | $ | 1,874,026,156 | | | $ | — | | | $ | — | | | $ | 1,874,026,156 | |
| | | | |
Total Investments | | $ | 1,874,026,156 | | | $ | — | | | $ | — | | | $ | 1,874,026,156 | |
| | | | |
(1) See investment industries in the Schedule of Investments.
As of March 31, 2022, there were no Level 2 or Level 3 securities held by the Fund. There were no transfers to or from Level 3 during the six months ended March 31, 2022.
CURRENCY TRANSACTIONS
The Fund may engage in spot currency transactions for the purpose of foreign security settlement and operational processes. Changes in foreign currency exchange rates will affect the value of the Fund’s securities and the price of the Fund’s shares. Generally, when the value of the U.S. dollar rises in value relative to a foreign currency, an investment in that country loses value because that currency is worth fewer U.S. dollars. Devaluation of a currency by a country’s government or banking authority also may have a significant impact on the value of any investments denominated in that currency. Currency markets generally are not as regulated as securities markets.
INVESTMENT TRANSACTIONS AND INCOME
Investment transactions are accounted for no later than one business day after trade date. At financial reporting period ends, investments are reported as of the trade date. The Fund determines the gain or loss realized from investment transactions by using an identified cost basis method. Dividend income is recognized on the ex-dividend date. Dividends from foreign securities are recorded on the ex-dividend date, or as soon as the information is available.
9
ADVISERS INVESTMENT TRUST
INDEPENDENT FRANCHISE PARTNERS US EQUITY FUND
NOTES TO FINANCIAL STATEMENTS
March 31, 2022 (Unaudited)
EXPENSE ALLOCATIONS
Expenses directly attributable to a fund in the Trust are charged to that fund, while expenses that are attributable to more than one fund in the Trust are allocated among the applicable funds on a pro-rata basis to each adviser’s series of funds based on relative net assets or another reasonable basis.
DIVIDENDS AND DISTRIBUTIONS
The Fund intends to distribute substantially all of its net investment income as dividends to shareholders on an annual basis. The Fund intends to distribute its net realized long-term capital gains and its net realized short-term capital gains at least once a year.
Distributions from net investment income and from net realized capital gain are determined in accordance with Federal income tax regulations, which may differ from accounting principles generally accepted in the United States of America (“GAAP”). These “book/tax” differences are either considered temporary or permanent in nature. To the extent these differences are permanent in nature (e.g. treatment of certain dividend distributions, gains/losses, return of capital, etc.), such amounts are reclassified within the composition of net assets based on their federal tax-basis treatment; temporary differences do not require reclassification. Distributions to shareholders that exceed net investment income and net realized capital gains for tax purposes are reported as return of capital.
REDEMPTION FEES
The Fund will charge a redemption fee of up to 0.25% of the total redemption amount if you sell your shares, regardless of the length of time you have held your shares and subject to certain exceptions and limitations described in the prospectus. The redemption fee is paid directly to the Fund and is intended to encourage long-term investment in the Fund, to facilitate portfolio management and to avoid (or compensate the Fund for the impact of) transaction and other Fund expenses incurred as a result of shareholder redemptions. Redemption fees charged for the six months ended March 31, 2022 and year ended September 30, 2021 were $367,383 and $247,154, respectively, and are reflected within the value of shares redeemed on the Statements of Changes in Net Assets.
FEDERAL INCOME TAX INFORMATION
No provision is made for Federal income taxes as the Fund intends to qualify each year as a “regulated investment company” under Subchapter M of the Internal Revenue Code of 1986, as amended (the “Code”), and distribute substantially all of its net investment income and net realized capital gain in accordance with the Code.
As of March 31, 2022, the Fund did not have material uncertain tax positions that would require financial statement recognition or disclosure based on an evaluation of all open tax years for all major tax jurisdictions. The Fund’s Federal tax returns for the tax years ended September 30, 2018, 2019, 2020 and 2021 remain subject to examination by the Internal Revenue Service. Interest or penalties incurred, if any, on future unknown, uncertain tax positions taken by the Fund will be recorded as interest expense on the Statement of Operations.
Management is not aware of any tax positions for which it is reasonably possible that the total amounts of unrecognized tax benefits will change materially in the next 12 months.
USE OF ESTIMATES
The preparation of financial statements in conformity with GAAP requires management to make estimates and assumptions that affect the reported amounts of assets and liabilities and disclosure of contingent assets and liabilities at the date of the financial statements and the reported amounts of revenues and expenses during the reporting period. Actual results could differ from these estimates.
10
ADVISERS INVESTMENT TRUST
INDEPENDENT FRANCHISE PARTNERS US EQUITY FUND
NOTES TO FINANCIAL STATEMENTS
March 31, 2022 (Unaudited)
| B. | Fees and Transactions with Affiliates and Other Parties |
The Trust, on behalf of the Fund, has entered into an Investment Advisory Agreement (the “Agreement”) with Independent Franchise Partners, LLP (the “Adviser” or “IFP”) to provide investment management services to the Fund. Total fees incurred pursuant to the Agreement are reflected as “Investment advisory” fees on the Statement of Operations. Under the terms of the Agreement, and for the six months ended March 31, 2022, the Fund paid the Adviser a monthly fee based on the Fund’s daily net assets at the following annualized rates:
| | | | | | |
Adviser’s Assets Under Management(1) | | Scale Discount for Assets in each Range(1)
| | Annualized Rate(1)
| | Effective Overall Annual
Fee(1) |
| |
First $1 billion | | — | | 0.80% | | 0.80% |
$1 - 2 billion | | 0.10% | | 0.70% | | at $2 billion 0.75% |
$2 - 3 billion | | 0.20% | | 0.60% | | at $3 billion 0.70% |
$3 - 4 billion | | 0.30% | | 0.50% | | at $4 billion 0.65% |
$4 - 5 billion | | 0.40% | | 0.40% | | at $5 billion 0.60% |
Above $5 billion | | — | | — | | 0.60% |
| (1) | The Adviser’s total assets under management at the end of each calendar quarter are used to calculate the effective annual fee to be applied during the next calendar quarter. During the six months ended March 31, 2022, the effective annualized rate was 0.60% given the Adviser’s total assets under management were in excess of $5 billion during the period. Effective October 1, 2021 the Adviser reduced its management fee annualized rate by 0.04% for each asset tier. |
Foreside Financial Services, LLC (the “Distributor”) provides distribution services to the Fund pursuant to a distribution agreement with the Trust, on behalf of the Fund. Under its agreement with the Trust, the Distributor acts as an agent of the Trust in connection with the offering of the shares of the Fund on a continuous basis. The Adviser, at its own expense, pays the Distributor an annual $5,000 fee for these services and reimbursement for certain expenses incurred on behalf of the Fund.
The Northern Trust Company (“Northern Trust”) serves as the administrator, transfer agent, custodian and fund accounting agent for the Fund pursuant to written agreements between the Trust, on behalf of the Fund, and Northern Trust. The Fund has agreed to pay Northern Trust certain annual and transaction-based fees, a tiered basis-point fee based on the Fund’s daily net assets, subject to a minimum annual fee of $175,000 relating to these services, and reimburse for certain expenses incurred on behalf of the Fund as well as other charges for additional service activities. Total fees paid to Northern Trust pursuant to these agreements are reflected as “Accounting and Administration” fees on the Statement of Operations.
Foreside Fund Officer Services, LLC (“Foreside”) provides compliance and financial control services for the Fund pursuant to a written agreement with the Trust, on behalf of the Fund, including providing certain officers to the Fund. The Fund pays Foreside an annual base fee, a basis-point fee based on the Fund’s daily net assets and reimburses for certain expenses incurred on behalf of the Fund. Total fees paid to Foreside pursuant to these agreements are reflected as “Regulatory and Compliance” fees on the Statement of Operations.
Carne Global Financial Services (US) LLC (“Carne”) provides Risk Management and Oversight Services for the Fund pursuant to a written agreement between the Trust, on behalf of the Fund, and Carne, including providing the Risk Officer to the Fund to administer the Fund’s risk program and oversee the analysis of investment performance and performance of service providers. The Fund has agreed to pay Carne an annual fee of $30,000 for these services, and reimburse for certain expenses incurred on behalf of the Fund. Total fees paid to Carne pursuant to this agreement are reflected as “Risk Officer” fees on the Statement of Operations.
The officers of the Trust are affiliated with Foreside, Northern Trust, Carne or the Distributor and receive no compensation directly from the Fund for serving in their respective roles. The Trust paid each Independent Trustee compensation for their services based on an annual retainer of $125,000 and reimbursement for certain expenses. If there are more than six meetings in a year, additional meeting fees may apply. For the six months ended March 31, 2022, the aggregate Trustee compensation paid by the Trust was $222,750. The amount of total Trustee compensation and reimbursement of out-of-pocket expenses allocated from the Trust to the Fund is reflected as “Trustees” expenses on the Statement of Operations.
11
ADVISERS INVESTMENT TRUST
INDEPENDENT FRANCHISE PARTNERS US EQUITY FUND
NOTES TO FINANCIAL STATEMENTS
March 31, 2022 (Unaudited)
The Adviser has contractually agreed to waive fees or reimburse expenses to the extent necessary to limit total annual fund operating expenses (exclusive of brokerage costs, interest, taxes, dividends on short positions, litigation and indemnification expenses, fees and expenses associated with investments in underlying investment companies and extraordinary expenses) to 0.85% of the average daily net assets of the Fund until January 28, 2023. For the six months ended March 31, 2022, there were no expenses reduced by the Adviser. Any fees waived or expenses reimbursed during a fiscal year are not subject to repayment from the Fund to the Adviser in subsequent fiscal years.
| C. | Investment Transactions |
For the six months ended March 31, 2022, the aggregate costs of purchases and proceeds from sales of securities (excluding short-term investments) for the Fund were as follows:
| | | | | | | | |
| Fund | | Cost of Purchases | | | Proceeds from sales | |
| |
Independent Franchise Partners US Equity Fund | | $ | 305,481,187 | | | $ | 497,689,664 | |
As of March 31, 2022, the cost, gross unrealized appreciation and gross unrealized depreciation on investments, for Federal income tax purposes, were as follows:
| | | | | | | | | | | | | | | | |
| Fund | | Cost | | | Gross
Unrealized
Appreciation | | | Gross
Unrealized
(Depreciation) | | | Net Unrealized
Appreciation
(Depreciation) | |
| | |
Independent Franchise Partners US Equity Fund | | $ | 1,374,726,965 | | | $ | 534,370,727 | | | $ | (35,071,536) | | | $ | 499,299,191 | |
The tax character of distributions paid to shareholders during the latest tax years ended September 30, 2021 and September 30, 2020 for the Fund was as follows:
| | | | | | | | | | | | | | | | | | | | |
| Independent Franchise Partners US Equity Fund | | Ordinary Income | | | Net Long Term Gains | | | Total Taxable
Distributions | | | Tax Return of
Capital | | | Total Distributions
Paid | |
| | |
2021 | | $ | 43,931,463 | | | $ | 169,039,186 | | | $ | 212,970,649 | | | $ | — | | | $ | 212,970,649 | |
2020 | | | 36,780,971 | | | | 128,445,643 | | | | 165,226,614 | | | | — | | | | 165,226,614 | |
As of the latest tax year ended September 30, 2021, the components of accumulated earnings on a tax basis were as follows:
| | | | | | | | | | | | | | | | | | | | | | | | | | | | |
| Fund | | Undistributed
Ordinary Income | | | Undistributed Long
Term Capital
Gains | | | Accumulated
Earnings | | | Distributions
Payable | | | Accumulated
Capital and
Other Losses | | | Unrealized
Appreciation | | | Total
Accumulated
Earnings | |
| | |
Independent Franchise Partners US Equity Fund | | | $34,398,603 | | | | $99,342,212 | | | | $133,740,815 | | | | $ — | | | | $ — | | | | $585,304,892 | | | | $719,045,707 | |
At September 30, 2021, the latest tax year end, the Fund had no capital loss carry-forwards available to offset future net capital gains.
Certain shareholders in the Fund received securities rather than cash for their redemption amounts in accordance with the provisions of the Fund. These shareholders received securities with a fair value equal to the value of the number of shares they owned at the current net asset value at the redemption date.
In-kind withdrawals of $1,258,761 are reflected within the “Value of shares redeemed” on the Statements of Changes in Net Assets, and net gains of $466,945 on the securities distributed to shareholders are reflected within the “Net realized gains from investment transactions” on the Statement of Operations.
12
ADVISERS INVESTMENT TRUST
INDEPENDENT FRANCHISE PARTNERS US EQUITY FUND
NOTES TO FINANCIAL STATEMENTS
March 31, 2022 (Unaudited)
| F. | Concentration of Ownership Risk |
A significant portion of the Fund’s shares may be held in a limited number of shareholder accounts. To the extent that a shareholder or group of shareholders redeem a significant portion of the shares issued by the Fund, this could have a disruptive impact on the efficient implementation of the Fund’s investment strategy.
The global outbreak of COVID-19 has disrupted economies and markets, and the prolonged duration and economic impact is uncertain. These events can have a significant impact on the Fund’s operations and performance.
13
ADVISERS INVESTMENT TRUST
INDEPENDENT FRANCHISE PARTNERS US EQUITY FUND
ADDITIONAL INFORMATION
March 31, 2022 (Unaudited)
| A. | Summary of Fund Holdings as of March 31, 2022 |
| | | | |
| Market Exposure | |
| Equity Securities | | % of Net Assets | |
Internet Software & Services | | | 15.3 | % |
Pharmaceuticals | | | 14.8 | |
Media | | | 13.0 | |
Software | | | 12.5 | |
Diversified Financials | | | 9.0 | |
Tobacco | | | 8.6 | |
Commercial Services | | | 7.8 | |
Biotechnology | | | 4.2 | |
Insurance | | | 4.2 | |
Toys/Games/Hobbies | | | 3.8 | |
Diversified Support Services | | | 2.9 | |
IT Services | | | 1.4 | |
Health Care Equipment & Supplies | | | 1.3 | |
Total | | | 98.8 | % |
| | | | | |
| 5 Largest Security Positions | | | |
| Issuer | | | % of Net Assets | |
Bristol-Myers Squibb Co. | | | 6.4 | % |
Philip Morris International Inc. | | | 5.0 | |
Booking Holdings Inc. | | | 4.6 | |
Fox Corp. - Class A | | | 4.6 | |
Corteva Inc. | | | 4.2 | |
Total | | | 24.8 | % |
As a Fund shareholder, you may incur two types of costs: (1) transaction costs, including redemption fees; and (2) ongoing costs, including management fees and other Fund expenses. The examples below are intended to help you understand your ongoing costs (in dollars) of investing in the Fund and to compare these costs with the ongoing costs of investing in other mutual funds. Please note that the expenses shown in the tables are meant to highlight your ongoing costs only and do not reflect any transactional costs. Therefore, the examples are useful in comparing ongoing costs only and will not help you determine the relative total cost of owning different funds. In addition, if these transactional costs were included, your costs would have been higher.
The examples below are based on an investment of $1,000 invested at October 1, 2021 and held for the entire period through March 31, 2022.
The Actual Expense Example below provides information about actual account values and actual expenses. You may use this information, together with the amount you invested, to estimate the expenses that you paid over the period. Simply divide your account value by $1,000 (for example, an $8,600 account value divided by $1,000 = 8.6), then multiply the result by the number in the table under the heading entitled “Expenses Paid” to estimate the expenses you paid on your account during this period.
The Hypothetical Expense Example below provides information about hypothetical account values and hypothetical expenses based on the Fund’s actual expense ratio and an assumed rate of return of 5% per year before expenses, which is not the Fund’s actual return. The hypothetical account values and expenses may not be used to estimate the actual ending account balance or expenses you paid for the period. You may use this information to compare the ongoing costs of investing in the Fund and other funds. To do so, compare this 5% hypothetical example with the 5% hypothetical examples that appear in the shareholder reports of the other funds.
14
ADVISERS INVESTMENT TRUST
INDEPENDENT FRANCHISE PARTNERS US EQUITY FUND
ADDITIONAL INFORMATION
March 31, 2022 (Unaudited)
| | | | | | | | | | | | | | |
| | | | | Beginning Account | | | Ending Account | | | | |
| | | Expense | | Value | | | Value | | | Expenses Paid | |
| | | Ratio | | 10/1/2021 | | | 3/31/2022 | | | 10/1/21-3/31/22* | |
Actual | | 0.68% | | $ | 1,000.00 | | | $ | 1,040.90 | | | $ | 3.46 | |
Hypothetical | | 0.68% | | $ | 1,000.00 | | | $ | 1,021.54 | | | $ | 3.43 | |
| * | Expenses are calculated using the annualized expense ratio (as disclosed in the table), multiplied by the average account value for the period, multiplied by the number of days in the most recent half fiscal year (182), and divided by the number of days in the current year (365). |
| C. | Liquidity Risk Management Program |
To promote effective liquidity risk management throughout the fund industry and to enhance disclosure regarding fund liquidity and redemption practices, the U.S. Securities and Exchange Commission (the “SEC”) adopted Rule 22e-4 under the Investment Company Act of 1940, as amended. This Rule requires every registered open-end management company to establish a liquidity risk management program (the “LRMP”) that, among other things, provides for the assessment, management and review of liquidity risk, the classification of a fund’s portfolio investments into one of four liquidity buckets based upon the number of days that such investments may reasonably be expected to be converted into cash or otherwise disposed of without significantly impacting their price, the establishment of a highly liquid investment minimum where required, and the establishment of a 15% limitation on illiquid investments. Additionally, the SEC adopted Rule 30b1-10 and Form N-LIQUID, which generally requires a fund to notify the SEC when certain liquidity-related events occur.
The Trust’s Board of Trustees approved the appointment of the Adviser’s Programme Administrator Team as the administrator of the LRMP for the Fund on November 15, 2018. The Trust’s Board approved the Fund’s LRMP at its regular board meeting on March 6, 2019. At the Board’s regular meeting on March 9, 2022, the Trust’s Chief Compliance Officer and the Fund’s Adviser each provided a report to the Board on the operation and effectiveness of the LRMP. The Adviser manages liquidity risks associated with the Fund’s investments by monitoring cash and cash equivalents, the use of derivatives, the concentration of investments and the appropriateness of portfolio strategies for open-end funds, and by classifying every fund investment as either highly liquid, moderately liquid, less liquid or illiquid on at least a monthly basis. To assist with the classification of Fund investments, the Adviser has contracted with a third party provider of liquidity monitoring services. The Adviser supplies portfolio-level data and certain assumptions to this provider, which the provider uses to determine preliminary classifications. Once these preliminary classifications are received by the Adviser, the Adviser’s personnel review the information.
The LRMP effectively managed the Fund’s liquidity risks for the twelve-month period ended December 31, 2021. During this period, the Fund held no less than 50% of its total net assets in highly liquid investments. Because the Fund consisted primarily of highly liquid investments, no highly liquid investment minimum was required to be established for the Fund, and the Fund was well under its illiquid investment limitations. Additionally, no events that would require the filing of Form N-LIQUID occurred.
A description of the policies and procedures that the Fund uses to determine how to vote proxies relating to portfolio securities is available (i) without charge, upon request, by writing to the Fund at Independent Franchise Partners US Equity Fund c/o The Northern Trust Company, P.O. Box 4766, Chicago, Illinois 60680-4766 or by calling the Fund at 855-233-0437 (toll free); and (ii) on the U.S. Securities and Exchange Commission’s (the “SEC”) website at www.sec.gov. Information regarding how the Fund voted proxies relating to portfolio securities during the most recent 12-month period ended June 30 is available (i) without charge, by calling the Fund at 855-233-0437 (toll free); and (ii) on the SEC’s website at www.sec.gov.
The Fund files its complete schedule of portfolio holdings with the SEC for the first and third quarters of each fiscal year as an exhibit to its reports on Form N-PORT. The Fund’s Form N-PORT reports are available on the SEC’s website at www.sec.gov. The information on Form N-PORT is also available to shareholders upon written request or by calling the Fund at 855-233-0437 (toll free).
15
(This page has been intentionally left blank)
(This page has been intentionally left blank)
Investment Adviser
Independent Franchise Partners, LLP
Level 1, 10 Portman Square
London, W1H 6AZ
United Kingdom
Custodian
The Northern Trust Company
50 South LaSalle Street
Chicago, Illinois 60603
Independent Registered Public
Accounting Firm
PricewaterhouseCoopers LLP
One North Wacker Drive
Chicago, Illinois 60606
Legal Counsel
Thompson Hine LLP
41 South High Street, Suite 1700
Columbus, Ohio 43215-6101
Distributor
Foreside Financial Services, LLC
3 Canal Plaza, Suite 100
Portland, Maine 04101
For Additional Information, call
855-233-0437 or 312-557-7902
IFP 03/22

VONTOBEL U.S. EQUITY INSTITUTIONAL FUND
SEMI-ANNUAL REPORT
March 31, 2022
This report is submitted for the general information of the shareholders of the Fund. It is not authorized for the distribution to prospective investors unless preceded or accompanied by an effective prospectus.
ADVISERS INVESTMENT TRUST
VONTOBEL U.S. EQUITY INSTITUTIONAL FUND
TABLE OF CONTENTS
March 31, 2022 (Unaudited)
ADVISERS INVESTMENT TRUST
VONTOBEL U.S. EQUITY INSTITUTIONAL FUND
SCHEDULE OF INVESTMENTS
March 31, 2022 (Unaudited)
| | | | | | | | | | | | |
| | | |
| | | Percentage of Net Assets | | | Shares | | | Value | |
| |
COMMON STOCKS | | | 100.7% | | | | | | | | | |
Communication Services | | | 9.0% | | | | | | | | | |
Alphabet, Inc. - Class C(a) | | | | | | | 337 | | | $ | 941,238 | |
Comcast Corp. - Class A | | | | | | | 19,830 | | | | 928,440 | |
Walt Disney (The) Co.(a) | | | | | | | 1,671 | | | | 229,194 | |
| | | | | | | | | | | | |
| | | | | | | | | | | 2,098,872 | |
| | | | | | | | | | | | |
Consumer Discretionary | | | 15.6% | | | | | | | | | |
Amazon.com, Inc.(a) | | | | | | | 424 | | | | 1,382,219 | |
Booking Holdings, Inc.(a) | | | | | | | 234 | | | | 549,537 | |
Dollar General Corp. | | | | | | | 3,267 | | | | 727,332 | |
Home Depot (The), Inc. | | | | | | | 1,087 | | | | 325,372 | |
NIKE, Inc. - Class B | | | | | | | 2,266 | | | | 304,913 | |
Ross Stores, Inc. | | | | | | | 3,807 | | | | 344,381 | |
| | | | | | | | | | | | |
| | | | | | | | | | | 3,633,754 | |
| | | | | | | | | | | | |
Consumer Staples | | | 16.5% | | | | | | | | | |
Casey’s General Stores, Inc. | | | | | | | 3,678 | | | | 728,869 | |
Coca-Cola (The) Co. | | | | | | | 16,723 | | | | 1,036,826 | |
Mondelez International, Inc. - Class A | | | | | | | 15,639 | | | | 981,816 | |
PepsiCo, Inc. | | | | | | | 3,417 | | | | 571,938 | |
Walmart, Inc. | | | | | | | 3,517 | | | | 523,752 | |
| | | | | | | | | | | | |
| | | | | | | | | | | 3,843,201 | |
| | | | | | | | | | | | |
Financials | | | 9.2% | | | | | | | | | |
CME Group, Inc. | | | | | | | 4,439 | | | | 1,055,861 | |
Intercontinental Exchange Inc. | | | | | | | 3,687 | | | | 487,126 | |
Progressive (The) Corp. | | | | | | | 5,333 | | | | 607,909 | |
| | | | | | | | | | | | |
| | | | | | | | | | | 2,150,896 | |
| | | | | | | | | | | | |
Health Care | | | 16.4% | | | | | | | | | |
Abbott Laboratories | | | | | | | 2,736 | | | | 323,833 | |
Becton Dickinson and Co. | | | | | | | 2,745 | | | | 730,170 | |
Boston Scientific Corp.(a) | | | | | | | 16,360 | | | | 724,585 | |
Humana, Inc. | | | | | | | 841 | | | | 365,978 | |
Intuitive Surgical, Inc.(a) | | | | | | | 338 | | | | 101,968 | |
Johnson & Johnson | | | | | | | 3,136 | | | | 555,793 | |
UnitedHealth Group, Inc. | | | | | | | 1,991 | | | | 1,015,350 | |
| | | | | | | | | | | | |
| | | | | | | | | | | 3,817,677 | |
| | | | | | | | | | | | |
Industrials | | | 7.6% | | | | | | | | | |
Copart, Inc.(a) | | | | | | | 3,539 | | | | 444,038 | |
Graco, Inc. | | | | | | | 4,809 | | | | 335,283 | |
Otis Worldwide Corp. | | | | | | | 3,036 | | | | 233,620 | |
Ritchie Bros. Auctioneers Inc. | | | | | | | 6,817 | | | | 402,408 | |
United Parcel Service, Inc. - Class B | | | | | | | 1,688 | | | | 362,009 | |
| | | | | | | | | | | | |
| | | | | | | | | | | 1,777,358 | |
| | | | | | | | | | | | |
Information Technology | | | 23.6% | | | | | | | | | |
Adobe, Inc.(a) | | | | | | | 1,246 | | | | 567,703 | |
Keysight Technologies, Inc.(a) | | | | | | | 1,425 | | | | 225,107 | |
See Notes to Financial Statements.
1
ADVISERS INVESTMENT TRUST
VONTOBEL U.S. EQUITY INSTITUTIONAL FUND
SCHEDULE OF INVESTMENTS
March 31, 2022 (Unaudited)
| | | | | | | | | | | | |
| | | |
| | | Percentage of Net Assets | | | Shares | | | Value | |
| |
Mastercard, Inc. - Class A | | | | | | | 3,196 | | | $ | 1,142,187 | |
Microsoft Corp. | | | | | | | 4,557 | | | | 1,404,969 | |
PayPal Holdings, Inc.(a) | | | | | | | 3,963 | | | | 458,321 | |
ServiceNow, Inc.(a) | | | | | | | 823 | | | | 458,320 | |
Synopsys, Inc.(a) | | | | | | | 337 | | | | 112,312 | |
Teradyne, Inc. | | | | | | | 2,228 | | | | 263,416 | |
Visa, Inc. - Class A | | | | | | | 3,894 | | | | 863,572 | |
| | | | | | | | | | | | |
| | | | | | | | | | | 5,495,907 | |
| | | | | | | | | | | | |
Materials | | | 2.8% | | | | | | | | | |
Sherwin-Williams (The) Co. | | | | | | | 939 | | | | 234,393 | |
Vulcan Materials Co. | | | | | | | 2,273 | | | | 417,550 | |
| | | | | | | | | | | | |
| | | | | | | | | | | 651,943 | |
| | | | | | | | | | | | |
TOTAL COMMON STOCKS (Cost $17,809,623) | | | | | | | | | | | 23,469,608 | |
| | | | | | | | | | | | |
SHORT-TERM INVESTMENTS | | | 0.5% | | | | | | | | | |
Northern Institutional U.S. Government Select Portfolio – Shares Class, 0.17%(b) | | | | | | | 126,394 | | | | 126,394 | |
| | | | | | | | | | | | |
TOTAL SHORT-TERM INVESTMENTS (Cost $126,394) | | | | | | | | | | | 126,394 | |
| | | | | | | | | | | | |
TOTAL INVESTMENTS
(Cost $17,936,017) | | | 101.2% | | | | | | | | 23,596,002 | |
NET OTHER ASSETS (LIABILITIES) | | | (1.2% | ) | | | | | | | (288,759 | ) |
| | | | | | | | | | | | |
NET ASSETS | | | 100.0% | | | | | | | $ | 23,307,243 | |
| | | | | | | | | | | | |
(a)Non-income producing security.
(b)7-day current yield as of March 31, 2022 is disclosed.
At March 31, 2022, the Vontobel U.S. Equity Institutional Fund’s investments (excluding short-term investments) were domiciled in the following countries:
| | |
| CONCENTRATION BY COUNTRY | | % OF NET ASSETS |
United States | | 99.0% |
| |
All other countries less than 2% | | 1.7 |
Total | | 100.7% |
See Notes to Financial Statements.
2
ADVISERS INVESTMENT TRUST
STATEMENT OF ASSETS & LIABILITIES
March 31, 2022 (Unaudited)
| | | | |
| | | Vontobel U.S. Equity Institutional Fund | |
| |
Assets: | | | | |
Investments, at value (Cost: $17,936,017) | | $ | 23,596,002 | |
Receivable for dividends | | | 16,054 | |
Reclaims receivable | | | 2,768 | |
Receivable from investment adviser | | | 32,293 | |
Prepaid expenses | | | 20,631 | |
| | | | |
Total Assets | | | 23,667,748 | |
| | | | |
Liabilities: | | | | |
Accounting and Administration fees payable | | | 274,521 | |
Regulatory and Compliance fees payable | | | 24,247 | |
Accrued expenses and other payables | | | 61,737 | |
| | | | |
Total Liabilities | | | 360,505 | |
| | | | |
Net Assets | | $ | 23,307,243 | |
| | | | |
| |
Class I Shares: | | | | |
Net assets | | $ | 23,307,243 | |
Shares of common stock outstanding | | | 1,533,579 | |
| | | | |
Net asset value per share | | $ | 15.20 | |
| | | | |
Net Assets: | | | | |
Paid in capital | | $ | 16,609,984 | |
Distributable earnings (loss) | | | 6,697,259 | |
| | | | |
Net Assets | | $ | 23,307,243 | |
| | | | |
| | | | |
| |
See Notes to Financial Statements.
3
ADVISERS INVESTMENT TRUST
STATEMENT OF OPERATIONS
For the six months ended March 31, 2022 (Unaudited)
| | | | |
| | | Vontobel U.S. Equity Institutional Fund | |
| |
Investment Income: | | | | |
Dividend income (Net of foreign withholding tax of $813) | | $ | 143,014 | |
Operating expenses: | | | | |
Investment advisory | | | 60,617 | |
Accounting and Administration | | | 74,795 | |
Regulatory and Compliance | | | 74,795 | |
Audit fees | | | 16,407 | |
Trustees | | | 34,219 | |
Legal | | | 19,772 | |
Other | | | 29,040 | |
| | | | |
Total expenses before reductions | | | 309,645 | |
Expenses reduced by Adviser | | | (230,842 | ) |
| | | | |
Net expenses | | | 78,803 | |
| | | | |
Net investment income | | | 64,211 | |
| | | | |
Realized and Unrealized Gains (Losses) from Investment Activities: | | | | |
Net realized gains from investment transactions | | | 1,388,557 | |
Change in unrealized appreciation (depreciation) on investments | | | (646,609 | ) |
Change in unrealized appreciation (depreciation) on foreign currency | | | 1 | |
| | | | |
Net realized and unrealized gains from investment activities | | | 741,949 | |
| | | | |
Change in Net Assets Resulting from Operations | | $ | 806,160 | |
| | | | |
| | | | |
| |
See Notes to Financial Statements.
4
ADVISERS INVESTMENT TRUST
STATEMENTS OF CHANGES IN NET ASSETS
For the six months ended March 31, 2022 (Unaudited) and the year ended September 30, 2021
| | | | | | | | |
| | | Vontobel U.S. Equity Institutional Fund | |
| | | 2022 | | | 2021 | |
| |
Increase (decrease) in net assets: | | | | | | | | |
Operations: | | | | | | | | |
Net investment income | | $ | 64,211 | | | $ | 78,233 | |
Net realized gains (losses) from investment and foreign currency transactions | | | 1,388,557 | | | | 2,175,846 | |
Change in unrealized appreciation (depreciation) on investments and foreign currency | | | (646,608 | ) | | | 1,869,201 | |
| | | | | | | | |
Change in net assets resulting from operations | | | 806,160 | | | | 4,123,280 | |
| | | | | | | | |
Dividends paid to shareholders: | | | | | | | | |
From distributable earnings | | | (2,462,623 | ) | | | (566,599 | ) |
| | | | | | | | |
Total dividends paid to shareholders | | | (2,462,623 | ) | | | (566,599 | ) |
| | | | | | | | |
Capital Transactions (Class I Shares): | | | | | | | | |
Proceeds from sale of shares | | | 1,162,518 | | | | 1,231,588 | |
Value of shares issued to shareholders in reinvestment of dividends | | | 643,636 | | | | 112,305 | |
Value of shares redeemed | | | (845,198 | ) | | | (714,233 | ) |
| | | | | | | | |
Change in net assets from capital transactions | | | 960,956 | | | | 629,660 | |
| | | | | | | | |
Change in net assets | | | (695,507 | ) | | | 4,186,341 | |
Net assets: | | | | | | | | |
Beginning of period | | | 24,002,750 | | | | 19,816,409 | |
| | | | | | | | |
End of period | | $ | 23,307,243 | | | $ | 24,002,750 | |
| | | | | | | | |
Share Transactions (Class I Shares): | | | | | | | | |
Sold | | | 72,053 | | | | 75,600 | |
Reinvested | | | 41,022 | | | | 7,756 | |
Redeemed | | | (57,199 | ) | | | (45,096 | ) |
| | | | | | | | |
Change | | | 55,876 | | | | 38,260 | |
| | | | | | | | |
| | | | | | | |
| |
See Notes to Financial Statements.
5
ADVISERS INVESTMENT TRUST
FINANCIAL HIGHLIGHTS
For the periods indicated
| | | | | | | | | | | | | | | | | | | | |
| | | | |
Vontobel U.S. Equity Institutional Fund | | Six Months Ended March 31, 2022 (Unaudited) | | | Year Ended September 30, 2021 | | | Year Ended September 30, 2020 | | | Year Ended September 30, 2019 | | | Period Ended September 30, 2018(a) | |
| |
Net asset value, beginning of period | | $ | 16.24 | | | $ | 13.77 | | | $ | 12.35 | | | $ | 11.16 | | | $ | 10.00 | |
| | | | | | | | | | | | | | | | | | | | |
Income (loss) from investment operations: | | | | | | | | | | | | | | | | | | | | |
Net investment income(b) | | | 0.04 | | | | 0.05 | | | | 0.07 | | | | 0.09 | | | | 0.05 | |
Net realized and unrealized gains from investments and foreign currency | | | 0.55 | | | | 2.81 | | | | 1.58 | | | | 1.17 | | | | 1.11 | |
| | | | | | | | | | | | | | | | | | | | |
Total from investment operations | | | 0.59 | | | | 2.86 | | | | 1.65 | | | | 1.26 | | | | 1.16 | |
| | | | | | | | | | | | | | | | | | | | |
Less distributions paid: | | | | | | | | | | | | | | | | | | | | |
From net investment income | | | (0.06 | ) | | | (0.04 | ) | | | (0.09 | ) | | | (0.07 | ) | | | — | |
From net realized gains | | | (1.57 | ) | | | (0.35 | ) | | | (0.14 | ) | | | — | | | | — | |
| | | | | | | | | | | | | | | | | | | | |
Total distributions paid | | | (1.63 | ) | | | (0.39 | ) | | | (0.23 | ) | | | (0.07 | ) | | | — | |
| | | | | | | | | | | | | | | | | | | | |
Change in net asset value | | | (1.04 | ) | | | 2.47 | | | | 1.42 | | | | 1.19 | | | | 1.16 | |
| | | | | | | | | | | | | | | | | | | | |
Net asset value, end of period | | $ | 15.20 | | | $ | 16.24 | | | $ | 13.77 | | | $ | 12.35 | | | $ | 11.16 | |
| | | | | | | | | | | | | | | | | | | | |
Total return(c) | | | 3.34 | % | | | 21.18 | % | | | 13.47 | % | | | 11.46 | % | | | 11.60 | % |
Ratios/Supplemental data: | | | | | | | | | | | | | | | | | | | | |
Net assets, end of period (000’s) | | $ | 23,307 | | | $ | 24,003 | | | $ | 19,816 | | | $ | 15,921 | | | $ | 11,427 | |
Ratio of net expenses to average net assets(d) | | | 0.65 | % | | | 0.65 | % | | | 0.65 | % | | | 0.65 | % | | | 0.65 | % |
Ratio of net investment income to average net assets(d) | | | 0.53 | % | | | 0.34 | % | | | 0.54 | % | | | 0.82 | % | | | 0.84 | % |
Ratio of gross expenses to average net assets(d) | | | 2.55 | % | | | 2.61 | % | | | 3.33 | % | | | 3.15 | % | | | 2.93 | % |
Portfolio turnover rate(c) | | | 28.24 | % | | | 43.97 | % | | | 57.97 | % | | | 27.31 | % | | | 20.78 | % |
| | | | | | | | | | | | | | | | |
| |
| (a) | For the period from March 27, 2018, commencement of operations, to September 30, 2018. |
| (b) | Net investment income (loss) for the period ended was calculated using the average shares outstanding method. |
| (c) | Not annualized for periods less than one year. |
| (d) | Annualized for periods less than one year. |
See Notes to Financial Statements.
6
ADVISERS INVESTMENT TRUST
VONTOBEL U.S. EQUITY INSTITUTIONAL FUND
NOTES TO FINANCIAL STATEMENTS
March 31, 2022 (Unaudited)
Advisers Investment Trust (the “Trust”) is a Delaware statutory trust operating under a Fourth Amended and Restated Agreement and Declaration of Trust (the “Trust Agreement”) dated March 10, 2022. The Trust was formerly an Ohio business trust, which commenced operations on December 20, 2011. On March 31, 2017, the Trust was converted to a Delaware statutory trust. As an open-end registered investment company, as defined in Financial Accounting Standards Board (“FASB”) Accounting Standards Update (“ASU”) 2013-08, the Trust follows accounting and reporting guidance under FASB Accounting Standards Codification (“ASC”) Topic 946, “Financial Services – Investment Companies”. The Trust Agreement permits the Board of Trustees (the “Trustees” or “Board”) to authorize and issue an unlimited number of shares of beneficial interest, at no par value, in separate series of the Trust. The Vontobel U.S. Equity Institutional Fund (the “Fund”) is a series of the Trust and commenced operations on March 27, 2018. These financial statements and notes only relate to the Fund.
The Fund is a diversified fund. The investment objective of the Fund is to provide long-term capital appreciation.
Under the Trust’s organizational documents, its officers and Trustees are indemnified against certain liabilities arising out of the performance of their duties to the Trust and Fund. In addition, in the normal course of business, the Trust enters into contracts with its vendors and others that provide for general indemnifications. The Fund’s maximum exposure under these arrangements is unknown, as this would involve future claims that may be made against the Fund.
| A. | Significant accounting policies are as follows: |
INVESTMENT VALUATION
Investments are recorded at fair value. Fair value is defined as the price that would be received to sell an asset or paid to transfer a liability in an orderly transaction between market participants at the measurement date. The valuation techniques employed by the Fund, as described below, maximize the use of observable inputs and minimize the use of unobservable inputs in determining fair value. These inputs are summarized in the following three broad levels:
| • | | Level 1 — quoted prices in active markets for identical assets |
| • | | Level 2 — other significant observable inputs (including quoted prices of similar securities, interest rates, prepayment speeds, credit risk, etc.) |
| • | | Level 3 — significant unobservable inputs (including the Fund’s own assumptions in determining the fair value of investments) |
The inputs or methodology used for valuing securities are not necessarily an indication of the risk associated with investing in those securities. For example, certain short-term debt securities may be valued using amortized cost. Generally, amortized cost approximates the current value of a security, but since this valuation is not obtained from a quoted price in an active market, such securities would be reflected as Level 2 in the fair value hierarchy.
Security prices are generally provided by an independent third party pricing service approved by the Trustees as of the close of the New York Stock Exchange, normally at 4:00 p.m. Eastern Time, each business day on which the share price of the Fund is calculated. Equity securities listed or traded on a primary exchange are valued at the closing price, if available, or the last sales price on the primary exchange. If no sale occurred on the valuation date, the securities will be valued at the latest quotations as of the close of the primary exchange. Investments in other open-end registered investment companies are valued at their respective net asset value as reported by such companies. In these types of situations, valuations are typically categorized as Level 1 in the fair value hierarchy.
Debt and other fixed income securities, if any, are generally valued at an evaluated price provided by an independent pricing source approved by the Trustees. To value debt securities, pricing services may use various pricing techniques, which take into account appropriate factors such as market activity, yield, quality, coupon rate, maturity, type of issue, trading characteristics, call features, credit ratings and other data, as well as broker quotes. Short-term debt securities of sufficient credit quality that mature within sixty days may be valued at amortized cost, which approximates fair value. In each of these situations, valuations are typically categorized as Level 2 in the fair value hierarchy.
7
ADVISERS INVESTMENT TRUST
VONTOBEL U.S. EQUITY INSTITUTIONAL FUND
NOTES TO FINANCIAL STATEMENTS
March 31, 2022 (Unaudited)
When the price of a security is not readily available or deemed unreliable (e.g., an approved pricing service does not provide a price, a furnished price is in error, certain stale prices, or an event occurs that materially affects the furnished price), the Fund’s Fair Value Committee may in good faith establish a fair value for that security in accordance with procedures established by and under the general supervision of the Trustees. In addition, fair value pricing may be used if events materially affecting the value of foreign securities occur between the time when the exchange on which they are traded closes and the time when the Fund’s net asset value is calculated. The Fund identifies possible fluctuations in international securities by monitoring the increase or decrease in the value of a designated benchmark index. In the event of an increase or decrease greater than predetermined levels, the Fund may use a systematic valuation model provided by an independent third party pricing service to fair value its international equity securities.
In the fair value situations noted above, while the Trust’s valuation policy is intended to result in a calculation of the Fund’s net asset value that fairly reflects security values as of the time of pricing, the Trust cannot ensure that fair values determined pursuant to these guidelines would accurately reflect the price that the Fund could obtain for a security if it were to dispose of that security as of the time of pricing (for instance, in a forced or distressed sale). The prices used by the Fund may differ from the value that would be realized if the securities were sold, and these differences could be material to the financial statements. Depending on the source and relative significance of the valuation inputs in these instances, the instruments may be classified as Level 2 or Level 3 in the fair value hierarchy.
The following is a summary of the valuation inputs used as of March 31, 2022 in valuing the Fund’s investments based upon the three fair value levels defined above:
| | | | | | | | | | | | | | | | |
Fund | | Level 1 - Quoted Prices | | | Level 2 - Other Significant Observable Inputs | | | Level 3 - Significant Unobservable Inputs | | | Total | |
Vontobel U.S. Equity Institutional Fund | | | | | | | | | | | | | | | | |
Common Stocks* | | $ | 23,469,608 | | | $ | — | | | $ | — | | | $ | 23,469,608 | |
Short-Term Investments | | | 126,394 | | | | — | | | | — | | | | 126,394 | |
| | | | |
Total Investments | | $ | 23,596,002 | | | $ | — | | | $ | — | | | $ | 23,596,002 | |
| | | | |
*See additional categories in the Schedule of Investments.
As of March 31, 2022 there were no Level 2 or Level 3 securities held by the Fund. There were no transfers to or from Level 3 during the six months ended March 31, 2022.
CURRENCY TRANSACTIONS
The functional and reporting currency for the Fund is the U.S. dollar. The market values of foreign securities, currency holdings and other assets and liabilities are translated into U.S. dollars based on the current exchange rates each business day. Purchases and sales of securities and income and expense items denominated in foreign currencies are translated into U.S. dollars at the exchange rate in effect on the transaction date. The Fund does not separately report the effects of changes in foreign exchange rates from changes in market prices on securities held. Such changes are included in Net Realized and Unrealized Gains (and Losses) from Investment Activities on the Statements of Operations. The Fund may invest in foreign currency-denominated securities and may engage in foreign currency transactions either on a spot (cash) basis at the rate prevailing in the currency exchange market at the time or through a forward foreign currency contract. Realized foreign exchange gains or losses arising from sales of spot foreign currencies, currency gains or losses realized between the trade and settlement dates on securities transactions and the difference between the recorded amounts of dividends, interest, and foreign withholding taxes and the U.S. dollar equivalent of the amounts actually received or paid are included in Net realized gains (losses) from foreign currency transactions on the Statements of Operations. Net unrealized foreign exchange gains (losses) arising from changes in foreign exchange rates on foreign denominated assets and liabilities other than investments in securities held at the end of the reporting period are included in Change in unrealized appreciation (depreciation) on foreign currency on the Statement of Operations.
8
ADVISERS INVESTMENT TRUST
VONTOBEL U.S. EQUITY INSTITUTIONAL FUND
NOTES TO FINANCIAL STATEMENTS
March 31, 2022 (Unaudited)
The Fund may engage in spot currency transactions for the purpose of foreign security settlement and operational processes. Changes in foreign currency exchange rates will affect the value of the Fund’s securities and the price of the Fund’s shares. Generally, when the value of the U.S. dollar rises in value relative to a foreign currency, an investment in that country loses value because that currency is worth fewer U.S. dollars. Devaluation of a currency by a country’s government or banking authority also may have a significant impact on the value of any investments denominated in that currency. Currency markets generally are not as regulated as securities markets.
INVESTMENT TRANSACTIONS AND INCOME
Investment transactions are accounted for no later than one business day after trade date. For financial reporting purposes, investments are reported as of the trade date. The Fund determines the gain or loss realized from investment transactions by using an identified cost basis method. Interest income is recognized on an accrual basis and includes, where applicable, the amortization of premium or accretion of discount. Dividend income is recognized on the ex-dividend date. Dividends from foreign securities are recorded on the ex-dividend date, or as soon as the information is available.
EXPENSE ALLOCATIONS
Expenses directly attributable to a fund in the Trust are charged to that fund, while expenses that are attributable to more than one fund in the Trust are allocated among the applicable funds on a pro-rata basis to each adviser’s series of funds based on relative net assets or another reasonable basis.
DIVIDENDS AND DISTRIBUTIONS
The Fund intends to distribute substantially all of its net investment income as dividends to shareholders on an annual basis. The Fund intends to distribute its net realized long-term capital gains and its net realized short-term capital gains at least once a year.
Distributions from net investment income and from net realized capital gain are determined in accordance with Federal income tax regulations, which may differ from accounting principles generally accepted in the United States of America (“GAAP”). These “book/tax” differences are either considered temporary or permanent in nature. To the extent these differences are permanent in nature (e.g. treatment of certain dividend distributions, gains/losses, return of capital, etc.), such amounts are reclassified within the composition of net assets based on their federal tax-basis treatment; temporary differences do not require reclassification. Distributions to shareholders that exceed net investment income and net realized capital gains for tax purposes are reported as return of capital.
FEDERAL INCOME TAX INFORMATION
No provision is made for Federal income taxes as the Fund intends to qualify each year as a “regulated investment company” under Subchapter M of the Internal Revenue Code of 1986, as amended (the “Code”), and distribute substantially all of its net investment income and net realized capital gain in accordance with the Code.
As of March 31, 2022, the Fund did not have uncertain tax positions that would require financial statement recognition or disclosure based on an evaluation of all open tax years for all major tax jurisdictions. The Fund’s tax return for the tax years ended September 30, 2021, 2020, 2019 and 2018 remain subject to examination by the Internal Revenue Service. Interest or penalties incurred, if any, on future unknown, uncertain tax positions taken by the Fund will be recorded as interest expense on the Statement of Operations.
Management is not aware of any tax positions for which it is reasonably possible that the total amounts of unrecognized tax benefits will change materially in the next 12 months.
USE OF ESTIMATES
The preparation of financial statements in conformity with GAAP requires management to make estimates and assumptions that affect the reported amounts of assets and liabilities and disclosure of contingent assets and liabilities at the date of the financial statements and the reported amounts of revenues and expenses during the reporting period. Actual results could differ from these estimates.
9
ADVISERS INVESTMENT TRUST
VONTOBEL U.S. EQUITY INSTITUTIONAL FUND
NOTES TO FINANCIAL STATEMENTS
March 31, 2022 (Unaudited)
OTHER RISKS
The global outbreak of COVID-19 has disrupted economies and markets, and the prolonged duration and economic impact is uncertain. These events can have a significant impact to a Fund’s operations and performance.
| B. | Fees and Transactions with Affiliates and Other Parties |
The Trust, on behalf of the Fund, has entered into an Amended and Restated Investment Advisory Agreement (the “Agreement”) with Vontobel Asset Management, Inc. (the “Adviser” or “Vontobel”) to provide investment advisory services to the Fund. Under the terms of the Agreement, the Fund pays the Adviser an annual fee based on the Fund’s daily net assets as set forth in the following table. The total fees incurred by the Fund pursuant to the Agreement is reflected as “Investment advisory” fees on the Statement of Operations. In addition, the Adviser has contractually agreed to waive fees and reimburse expenses to the extent that Total Annual Operating Expenses (exclusive of brokerage and other transaction expenses relating to the purchase or sale of portfolio investments, interest, taxes, short sale dividends and financing costs associated with the use of the cash proceeds on securities sold short, litigation and indemnification expenses, expenses associated with the investments in underlying investment companies and extraordinary expenses) exceed the rates in the table below.
| | | | | | | | | | |
Fund | | Class | | | Advisory Fee | | Expense Limitation | |
Vontobel U.S. Equity Institutional Fund | | | Class I | | | 0.50% on First $500 million | | | 0.65% | |
| | | | | | 0.45% on assets over $500 million | | | | |
The expense limitation agreement is effective until January 28, 2023 for the Fund at which time it will be subject to automatic renewal upon the effective date of the annual update to the the Fund’s registration statement. If it becomes unnecessary for the Adviser to waive fees or make reimbursements, the Adviser may recapture any of its prior waivers or reimbursements for a period not to exceed three years from the date on which the waiver or reimbursement was made to the extent that such a recapture does not cause the Total Annual Fund Operating Expenses (exclusive of brokerage and other transaction expenses relating to the purchase or sale of portfolio investments, interest, taxes, short sale dividends and financing costs associated with the use of the cash proceeds on securities sold short, litigation and indemnification expenses, expenses associated with the investments in underlying investment companies and extraordinary expenses) to exceed the current expense limitation at the time of repayment or the applicable expense limitation that was in effect at the time of the waiver or reimbursement. The agreement to waive fees and reimburse expenses may be terminated by the Board at any time and will terminate automatically upon termination of the Agreement.
10
ADVISERS INVESTMENT TRUST
VONTOBEL U.S. EQUITY INSTITUTIONAL FUND
NOTES TO FINANCIAL STATEMENTS
March 31, 2022 (Unaudited)
For the six months ended March 31, 2022, the Fund incurred advisory fees payable to Vontobel, expense waivers/reimbursements from Vontobel and paid expense recoupments to Vontobel as follows:
| | | | | | | | | | | | |
Fund | | Advisory Fee to Vontobel | | | Expenses Reduced by Vontobel | | | Advisory Fees Recouped by Vontobel | |
|
Vontobel U.S. Equity Institutional Fund | | $ | 60,617 | | | $ | 230,842 | | | $ | — | |
The balances of recoverable expenses to Vontobel by the Fund at March 31, 2022 were as follows:
| | | | | | | | |
For the: | | Expiring | | | | Vontobel | |
|
Year Ended September 30, 2019 | | September 30, 2022 | | | | $ | 308,332 | |
Year Ended September 30, 2020 | | September 30, 2023 | | | | | 467,284 | |
Year Ended September 30, 2021 | | September 30, 2024 | | | | | 444,141 | |
Six months ended March 31, 2022 | | September 30, 2025 | | | | | 230,842 | |
| | | | | | | | |
Balances of Recoverable Expenses to the Adviser | | | | | | $ | 1,450,599 | |
| | | | | | | | |
Foreside Financial Services, LLC (the “Distributor”) provides distribution services to the Fund pursuant to a distribution agreement with the Trust, on behalf of the Fund. Under its agreement with the Trust, the Distributor acts as an agent of the Trust in connection with the offering of the shares of the Fund on a continuous basis. The Adviser, at its own expense, pays the Distributor $50,000 annually and reimburses for certain out-of-pocket expenses incurred on behalf of the Fund.
The Northern Trust Company (“Northern Trust”) serves as the administrator, transfer agent, custodian, and fund accounting agent for the Fund pursuant to written agreements with the Trust, on behalf of the Fund. The Fund has agreed to pay Northern Trust a tiered basis-point fee based on the Fund’s daily net assets, and certain per account and transaction charges. The Fund is subject to a minimum annual fee of $150,000 relating to these services, and reimbursement for certain expenses incurred on behalf of the Fund, as well as other charges for additional service activities. Total fees paid to Northern Trust pursuant to these agreements are reflected as “Accounting and Administration” fees on the Statement of Operations.
Foreside Fund Officer Services, LLC (“Foreside”) provides compliance and financial control services for the Fund pursuant to a written agreement with the Trust, on behalf of the Fund, including providing certain officers to the Fund. The Fund has agreed to pay Foreside a tiered basis-point fee based on the Fund’s daily net assets, subject to an overall minimum annual fee of $150,000 for these services, and reimburse for certain expenses incurred on behalf of the Fund. Total fees paid to Foreside pursuant to these agreements are reflected as “Regulatory and Compliance” fees on the Statement of Operations.
The officers of the Trust are affiliated with Foreside, Northern Trust, or the Distributor and receive no compensation directly from the Fund for serving in their respective roles. The Trust paid each Trustee who is not an “interested persons,” as that term is defined in the 1940 Act (each, an “Independent Trustee” and, collectively, the “Independent Trustees”) compensation for their services based on an annual retainer of $125,000 and reimbursement for certain expenses. If there are more than six meetings in a year, additional meeting fees may apply. For the six months ended March 31, 2022, the aggregate Trustee compensation paid by the Trust was $222,750. The amount of total Trustee compensation and reimbursement of out-of-pocket expenses allocated from the Trust to the Fund is reflected as “Trustees” expenses on the Statement of Operations.
| C. | Investment Transactions |
For the six months ended March 31, 2022, the aggregate costs of purchases and proceeds from sales of securities (excluding short-term investments) for the Fund were as follows:
| | | | | | | | |
| Fund | | Cost of Purchases | | | Proceeds from sales | |
Vontobel U.S. Equity Institutional Fund | | $ | 6,721,755 | | | $ | 7,843,004 | |
11
ADVISERS INVESTMENT TRUST
VONTOBEL U.S. EQUITY INSTITUTIONAL FUND
NOTES TO FINANCIAL STATEMENTS
March 31, 2022 (Unaudited)
As of March 31, 2022, the cost, gross unrealized appreciation and gross unrealized depreciation on investments, for Federal income tax purposes, were as follows:
| | | | | | | | | | | | | | | | |
Fund | | Cost | | | Gross Unrealized Appreciation | | | Gross Unrealized (Depreciation) | | | Net Unrealized Appreciation (Depreciation) | |
| |
Vontobel U.S. Equity Institutional Fund | | $ | 18,051,384 | | | $ | 5,784,779 | | | $ | (240,161 | ) | | $ | 5,544,618 | |
The difference between the tax cost of portfolio investments and the financial statement cost is primarily due to wash sale loss deferrals.
The tax character of distributions paid to shareholders during the latest tax years ended September 30, 2021 and September 30, 2020 for the Fund were as follows:
| | | | | | | | | | | | | | | | | | | | |
Vontobel U.S. Equity Institutional Fund | | Ordinary Income | | | Net Long Term Gains | | | Total Taxable Distributions | | | Tax Return of Capital | | | Total Distributions Paid | |
| |
2021 | | $ | 94,303 | | | $ | 472,296 | | | $ | 566,599 | | | $ | — | | | $ | 566,599 | |
2020 | | | 130,710 | | | | 169,732 | | | | 300,442 | | | | — | | | | 300,442 | |
As of the latest tax year ended September 30, 2021, the components of accumulated earnings on a tax basis were as follows:
| | | | | | | | | | | | | | | | | | | | | | | | | | | | |
Fund | | Undistributed Ordinary Income | | | Undistributed Long Term Capital Gains | | | Accumulated Earnings | | | Distributions Payable | | | Accumulated Capital and Other Losses | | | Unrealized Appreciation | | | Total Accumulated Earnings | |
| |
Vontobel U.S. Equity Institutional Fund | | | $530,253 | | | | $1,564,906 | | | | $2,095,159 | | | | $ — | | | | $ — | | | | $6,258,563 | | | | $8,353,722 | |
| E. | Concentration by Ownership |
A significant portion of the Fund’s shares may be held in a limited number of shareholder accounts including in certain omnibus or institutional accounts which typically hold shares for the benefit of other underlying investors. To the extent that a shareholder or group of shareholders redeem a significant portion of the shares issued by the Fund, this could have a disruptive impact on the efficient implementation of the Fund’s investment strategy.
12
ADVISERS INVESTMENT TRUST
VONTOBEL U.S. EQUITY INSTITUTIONAL FUND
ADDITIONAL INFORMATION
March 31, 2022 (Unaudited)
| A. | Summary of Fund Holdings as of March 31, 2022 |
Vontobel U.S. Equity Institutional Fund
| | | | |
| Market Exposure | |
| |
| Equity Securities | | % of Net Assets | |
Diversified Financial Services | | | 15.2 | % |
Internet | | | 12.3 | |
Retail | | | 11.4 | |
Software | | | 10.9 | |
Beverages | | | 6.9 | |
Healthcare-Services | | | 5.9 | |
Pharmaceuticals | | | 5.5 | |
Media | | | 5.0 | |
Healthcare-Products | | | 4.9 | |
Food | | | 4.2 | |
Commercial Services | | | 3.7 | |
Insurance | | | 2.6 | |
Machinery-Diversified | | | 2.5 | |
Distribution/Wholesale | | | 1.9 | |
Building Materials | | | 1.8 | |
| | | | |
| | | | |
| Market Exposure | |
| |
| Equity Securities | | % of Net Assets | |
Transportation | | | 1.6 | % |
Apparel | | | 1.3 | |
Semiconductors | | | 1.1 | |
Chemicals | | | 1.0 | |
Electronics | | | 1.0 | |
Total | | | 100.7 | % |
| | | | |
|
| 5 Largest Security Positions | |
| |
| Issuer | | % of Net Assets | |
Microsoft Corp. | | | 6.0 | % |
Amazon.com, Inc. | | | 6.0 | |
Mastercard, Inc. - Class A | | | 4.9 | |
CME Group, Inc. | | | 4.5 | |
Coca-Cola (The) Co. | | | 4.5 | |
Total | | | 25.9 | % |
| | | | |
As a Fund shareholder, you may incur two types of costs: (1) transaction costs, and (2) ongoing costs, including management fees and other Fund expenses. The examples below are intended to help you understand your ongoing costs (in dollars) of investing in the Fund and to compare these costs with the ongoing costs of investing in other mutual funds. Please note that the expenses shown in the tables are meant to highlight your ongoing costs only and do not reflect any transactional costs. Therefore, the examples are useful in comparing ongoing costs only and will not help you determine the relative total cost of owning different funds. In addition, if these transactional costs were included, your costs would have been higher.
The examples below are based on an investment of $1,000 invested at October 1, 2021 and held for the entire period through March 31, 2022.
The Actual Expense Example below provides information about actual account values and actual expenses. You may use this information, together with the amount you invested, to estimate the expenses that you paid over the period. Simply divide your account value by $1,000 (for example, an $8,600 account value divided by $1,000 = 8.6), then multiply the result by the number in the table under the heading entitled “Expenses Paid” to estimate the expenses you paid on your account during this period.
The Hypothetical Expense Example below provides information about hypothetical account values and hypothetical expenses based on the Fund’s actual expense ratio and an assumed rate of return of 5% per year before expenses, which is not the Fund’s actual return. The hypothetical account values and expenses may not be used to estimate the actual ending account balance or expenses you paid for the period. You may use this information to compare the ongoing costs of investing in the Fund and other funds. To do so, compare this 5% hypothetical example with the 5% hypothetical examples that appear in the shareholder reports of the other funds.
13
ADVISERS INVESTMENT TRUST
VONTOBEL U.S. EQUITY INSTITUTIONAL FUND
ADDITIONAL INFORMATION
March 31, 2022 (Unaudited)
| | | | | | | | | | | | | | | | |
| | | Expense
Ratio | | | Beginning Account
Value
10/1/2021 | | | Ending Account
Value
3/31/2022 | | | Expenses Paid
10/1/21-3/31/22* | |
Actual | | | 0.65 | % | | $ | 1,000.00 | | | $ | 1,033.40 | | | $ | 3.30 | |
Hypothetical | | | 0.65 | % | | $ | 1,000.00 | | | $ | 1,021.69 | | | $ | 3.28 | |
*Actual expenses are calculated using each Fund’s annualized expense ratio (as disclosed in the table), multiplied by the average account value for the period, multiplied by the actual number of operational days in the most recent half fiscal year (182), and divided by the number of days in the current year (365).
| C. | Board Approval of Investment Advisory Agreement |
Section 15 of the Investment Company Act of 1940 (the “1940 Act”) requires that the Agreement be approved by a majority of the Board, including a majority of the Independent Trustees. It is the duty of the Board to request as much information as is reasonably necessary to evaluate the terms of the Agreement to determine whether the Agreement is fair to the Fund and its shareholders. The Board considered and approved the Agreement for the Fund at an in-person meeting held on March 9, 2022.
The Board requested, and the Adviser provided, both written and oral reports containing information and data related to the following: (i) the nature, extent, and quality of the services provided by the Adviser to the Fund; (ii) the investment performance of the Fund and the Adviser; (iii) the costs of the services to be provided and the profits to be realized by the Adviser from its relationship with the Fund; (iv) the extent to which economies of scale will be realized as the Fund grows; and (v) whether the fee levels reflect these economies of scale to the benefit of the Fund’s shareholders.
The Board examined the nature, extent, and quality of the advisory services provided by the Adviser. The Board considered the terms of the Agreement, information and reports provided by the Adviser regarding its business, personnel and operations, and advisory services provided to the Fund. The Board reviewed the Adviser’s investment philosophy and portfolio construction process, the Adviser’s compliance program, pending material litigation, insurance coverage, business continuity program, and information security practices. The Board noted that, as set forth in the reports provided by the Adviser, there had been no material compliance issues or concerns raised or encountered since the last renewal of the Agreement and that there had been no material compliance issues in the past 36 months with respect to the Fund or any other fund managed by the Adviser. Taking into account the personnel involved in servicing the Fund, as well as the materials provided by the Adviser, the Board expressed satisfaction with the quality, extent, and nature of the services received from the Adviser.
The Board reviewed the investment performance of the Fund and compared the Fund’s since inception and one-year performance through December 31, 2021, to the performance of the Fund’s benchmark and a peer group of funds drawn from the Fund’s Morningstar Category. The Board reviewed the methodology used to select the peer group of funds. The Board also reviewed the performance of another pooled vehicle and a separately managed account advised by the Adviser with similar investment mandates for one-year, five-years and ten-years periods through December 31, 2021. After considering the information presented to it, the Board expressed satisfaction with the performance of the Fund and the Adviser.
The Board reviewed the cost of services provided and the profits realized by the Adviser, including assertions related to compensation and profitability. The Board discussed the advisory fee paid by the Fund and the total operating expenses of the Fund. The Board noted that the Adviser received a management fee of 0.50% of average daily net assets of the Fund. The Board reviewed the investment advisory fee paid by the Fund in comparison to the investment advisory fees paid by the funds within the Fund’s peer group and in the Fund’s Morningstar category, noting that the fee paid by the Fund was less than the average fee paid by its peers and by funds in the Morningstar category. The Board then considered the expense cap in place for the Fund, noting that the Adviser had contractually agreed to waive fees and or reimburse expenses to limit total annual fund operating expenses to 0.65% of average daily net assets. After considering the comparative data provided by the Adviser, the Board concluded that the advisory fee and expense ratio were reasonable.
14
ADVISERS INVESTMENT TRUST
VONTOBEL U.S. EQUITY INSTITUTIONAL FUND
ADDITIONAL INFORMATION
March 31, 2022 (Unaudited)
The Board examined the profitability of the Adviser’s relationship with the Fund and considered the information provided by the Adviser. Among other things, the Board considered the overall financial condition and profitability of the Adviser and representations made thereto and the overall importance of the Fund’s relationship to the Adviser’s business strategy. The Board concluded that, based on both the written and oral reports provided by the Adviser, the Fund was not yet profitable for the Adviser given the Fund’s limited history of operations and asset size.
In considering the economies of scale for the Fund, the Board considered the marketing and distribution plans for the Fund, the Fund’s capacity, and the Fund’s breakeven point. The Board considered the Adviser’s representations that it believed that breakpoints were not necessary at this time as the Fund was priced competitively. The Board recognized that the Adviser and its affiliates may derive other benefits from their relationship with the Fund, noting that, among other things, any brokerage commissions generated by the Fund’s investment activity would contribute to the Adviser’s soft-dollar commission pool. Additionally, the Board noted that the Adviser may enjoy enhanced name recognition as an adviser in the Trust, which may facilitate the procurement of additional mandates.
In its deliberations, the Board did not identify any particular factor or factors that were all-important or controlling; and each Trustee assigned different weights to the various factors considered.
| D. | Board Review of Liquidity Risk Management Program |
To promote effective liquidity risk management throughout the fund industry and to enhance disclosure regarding fund liquidity and redemption practices, the U.S. Securities and Exchange Commission (the “SEC”) adopted Rule 22e-4 under the 1940 Act. This Rule requires every registered open-end management company to establish a liquidity risk management program (the “LRMP”) that, among other things, provides for the assessment, management and review of liquidity risk, the classification of a fund’s portfolio investments into one of four liquidity buckets based upon the number of days that such investments may reasonably be expected to be converted into cash or otherwise disposed of without significantly impacting their price, the establishment of a highly liquid investment minimum where required, and the establishment of a 15% limitation on illiquid investments. Additionally, the SEC adopted Rule 30b1-10 and Form N-LIQUID, which generally requires a fund to notify the SEC when certain liquidity-related events occur.
The Trust’s Board approved the appointment of the Adviser’s Liquidity Management Group as the administrator of the LRMP for the Fund on March 6, 2019.TheTrust’s Board approved the Fund’s LRMP at its regular board meeting on September 11, 2019.At the Board’s regular meeting on March 9, 2022, the Trust’s Chief Compliance Officer and the Adviser each provided a report to the Board on the operation and effectiveness of the LRMP. The Adviser manages liquidity risks associated with the Fund’s investments by monitoring cash and cash equivalents, the use of derivatives, the concentration of investments and the appropriateness of portfolio strategies for open-end funds, and by classifying every fund investment as either highly liquid, moderately liquid, less liquid or illiquid on at least a monthly basis. To assist with the classification of Fund investments, the Adviser has contracted with a third party provider of liquidity monitoring services. The Adviser supplies portfolio-level data and certain assumptions to this provider, which the provider uses to determine preliminary classifications. Once these preliminary classifications are received by the Adviser, the Adviser’s personnel review the information.
The LRMP effectively managed the Fund’s liquidity risks for the period ended December 31, 2021. During this period, the Fund held no less than 50% of its total net assets in highly liquid investments. Because the Fund consisted primarily of highly liquid investments, no highly liquid investment minimum was required to be established for the Fund, and the Fund was well under its illiquid investment limitations. Additionally, no events that would require the filing of Form N-LIQUID occurred.
Investors may obtain a copy of the proxy voting policies and procedures by writing to the Trust in the name of the Fund c/o The Northern Trust Company, P.O. Box 4766, Chicago, Illinois 60680-4766 or by calling the Fund at 866-252-5393 (toll free) or 312-630-6583. Information about how the Fund voted proxies relating to portfolio securities during the most recent 12-month period ending June 30th is available without charge, upon request, by calling the Trust at 866-252-5393 (toll free) or 312-630-6583 and on the SEC’s website at www.sec.gov.
15
ADVISERS INVESTMENT TRUST
VONTOBEL U.S. EQUITY INSTITUTIONAL FUND
ADDITIONAL INFORMATION
March 31, 2022 (Unaudited)
The Fund files its complete schedule of portfolio holdings with the SEC for the first and third quarters of each fiscal year as an exhibit to its reports on Form N-PORT. The Fund’s Form N-PORT reports are available on the SEC’s website at www.sec.gov. The information on Form N-PORT is also available to shareholders upon written request or by calling the Fund at 866-252-5393 (toll free).
16
(This page has been intentionally left blank)
Investment Adviser
Vontobel Asset Management, Inc.
1540 Broadway
38th Floor
New York, New York 10036
Custodian
The Northern Trust Company
50 South LaSalle Street
Chicago, Illinois 60603
Independent Registered
Public Accounting Firm
Ernst & Young LLP
5 Times Square
New York, New York 10036
Legal Counsel
Thompson Hine LLP
41 South High Street, Suite 1700
Columbus, Ohio 43215-6101
Distributor
Foreside Financial Services, LLC
3 Canal Plaza, Suite 100
Portland, Maine 04101
For Additional Information, call
866-252-5393 (toll free) or 312-630-6583
VON 03/22
March 31, 2022

This report is submitted for the general information of the shareholders of the Funds. It is not authorized for the distribution to prospective investors unless preceded or accompanied by an effective prospectus.
Advisers Investment Trust
State Farm Funds
Table of Contents
March 31, 2022 (Unaudited)
Before investing, consider the Funds’ investment objectives, risks, charges and expenses. Contact The Northern Trust Company at 866-342-2418 (toll free) or 312-557-7940 for a prospectus or summary prospectus containing this and other information. Read it carefully.
Investors may obtain a copy of the proxy voting policies and procedures by writing to Advisers Investment Trust in the name of the respective Fund c/o The Northern Trust Company, P.O. Box 4766, Chicago, Illinois 60680-4766 or by calling the Fund at 866-342-2418 (toll free) or 312-557-7940. Information about how the Funds voted proxies relating to portfolio securities for each 12 month period ending June 30 is available without charge, upon request, by calling 866-342-2418 (toll free) or 312-557-7940 and on the U.S. Securities and Exchange Commission’s (the “SEC”) website at www.sec.gov.
The Funds file their respective complete schedule of portfolio holdings with the SEC for the first and third quarters of each fiscal year as an exhibit to their respective reports on Form N-PORT. The Funds’ Form N-PORT reports are available on the SEC’s website at www.sec.gov. The information on Form N-PORT is also available to shareholders upon written request or by calling 866-342-2418 (toll free) or 312-557-7940.
ADVISERS INVESTMENT TRUST
STATE FARM FUNDS
MESSAGE TO SHAREHOLDERS
March 31, 2022
Dear Shareholders,
Thank you for investing with State Farm Funds®. We are pleased to present the Semi-Annual Report for the 6-month period ended March 31, 2022, for the State Farm Growth Fund, State Farm Balanced Fund, State Farm Interim Fund, and the State Farm Municipal Bond Fund (the “State Farm Funds” or the “Funds”), each a series of Advisers Investment Trust. We encourage your review and consideration of the entire report.
State Farm Investment Management Corp., the Investment Adviser, has consistently maintained a long-term, disciplined approach to managing investment risk and providing competitive investment products that can help you, our valued shareholder, with your investment goals.1 We believe that remaining focused on your long-term goals and maintaining an appropriate asset allocation mix are important elements in pursuing investment success.2
We appreciate the trust and confidence you have placed in us, and we look forward to continuing to serve your investing needs.
| | | | |
| | Sincerely, | | |
| | 
| | |
| | Joe R. Monk Jr. | | |
| | Senior Vice President | | |
| | State Farm Investment Management Corp. | | |
| 1 | Investing involves risk, including potential for loss. |
| 2 | Asset allocation does not assure a profit or protect against loss. |
1
ADVISERS INVESTMENT TRUST
STATE FARM GROWTH FUND
SCHEDULE OF INVESTMENTS
March 31, 2022 (Unaudited)
| | | | | | | | |
| | | Shares | | | Value | |
Common Stocks (98.73%) | | | | | | | | |
Banking (2.19%) | | | | | | | | |
Bank of America Corp. | | | 153,200 | | | $ | 6,314,904 | |
Citigroup Inc. | | | 148,000 | | | | 7,903,200 | |
First Republic Bank | | | 30,000 | | | | 4,863,000 | |
JPMorgan Chase & Co. | | | 60,700 | | | | 8,274,624 | |
M&T Bank Corp. | | | 78,100 | | | | 13,237,950 | |
U.S. Bancorp | | | 58,621 | | | | 3,115,706 | |
Wells Fargo & Co. | | | 2,250,100 | | | | 109,039,846 | |
| | | | | | | | |
| | | | | | | 152,749,230 | |
| | | | | | | | |
Consumer Discretionary Products (1.77%) | | | | | |
Ford Motor Co. | | | 530,200 | | | | 8,965,682 | |
Gentex Corp. | | | 114,900 | | | | 3,351,633 | |
HNI Corp. | | | 1,439,200 | | | | 53,322,360 | |
NIKE Inc., Class B | | | 19,800 | | | | 2,664,288 | |
Tapestry Inc. | | | 310,200 | | | | 11,523,930 | |
Tesla Inc.(a) | | | 40,600 | | | | 43,750,560 | |
| | | | | | | | |
| | | | | | | 123,578,453 | |
| | | | | | | | |
Consumer Discretionary Services (0.76%) | | | | | |
Domino’s Pizza Inc. | | | 22,000 | | | | 8,954,220 | |
McDonald’s Corp. | | | 12,600 | | | | 3,115,728 | |
Service Corp. International | | | 131,200 | | | | 8,635,584 | |
Starbucks Corp. | | | 335,800 | | | | 30,547,726 | |
Yum! Brands Inc. | | | 18,000 | | | | 2,133,540 | |
| | | | | | | | |
| | | | | | | 53,386,798 | |
| | | | | | | | |
Consumer Staple Products (6.26%) | | | | | |
Altria Group Inc. | | | 538,000 | | | | 28,110,500 | |
Coca-Cola Co., The | | | 884,100 | | | | 54,814,200 | |
Colgate-Palmolive Co. | | | 466,300 | | | | 35,359,529 | |
Hershey Co., The | | | 58,600 | | | | 12,694,518 | |
Kellogg Co. | | | 179,400 | | | | 11,569,506 | |
McCormick & Co. Inc. | | | 857,200 | | | | 85,548,560 | |
PepsiCo Inc. | | | 496,000 | | | | 83,020,480 | |
Philip Morris International Inc. | | | 46,400 | | | | 4,358,816 | |
Procter & Gamble Co., The | | | 801,555 | | | | 122,477,604 | |
| | | | | | | | |
| | | | | | | 437,953,713 | |
| | | | | | | | |
Financial Services (1.00%) | | | | | |
American Express Co. | | | 38,600 | | | | 7,218,200 | |
BlackRock Inc. | | | 15,600 | | | | 11,921,052 | |
Credit Acceptance Corp.(a) | | | 5,000 | | | | 2,751,850 | |
GATX Corp. | | | 34,000 | | | | 4,193,220 | |
Intercontinental Exchange Inc. | | | 1,300 | | | | 171,756 | |
Janus Henderson Group PLC | | | 285,300 | | | | 9,991,206 | |
Northern Trust Corp. | | | 20,600 | | | | 2,398,870 | |
OneMain Holdings Inc. | | | 189,200 | | | | 8,969,972 | |
Virtu Financial Inc., Class A | | | 607,100 | | | | 22,596,262 | |
| | | | | | | | |
| | | | | | | 70,212,388 | |
| | | | | | | | |
Health Care (19.45%) | | | | | |
Abbott Laboratories | | | 847,500 | | | | 100,310,100 | |
AbbVie Inc. | | | 612,600 | | | | 99,308,586 | |
Agilent Technologies Inc. | | | 548,071 | | | | 72,526,235 | |
Amgen Inc. | | | 176,485 | | | | 42,677,603 | |
Bristol-Myers Squibb Co. | | | 18,800 | | | | 1,372,964 | |
| | | | | | | | |
| | | Shares | | | Value | |
Common Stocks (Cont.) | | | | | | | | |
Health Care (Cont.) | | | | | | | | |
Chemed Corp. | | | 20,500 | | | $ | 10,384,275 | |
Eli Lilly & Co. | | | 960,500 | | | | 275,058,385 | |
Gilead Sciences Inc. | | | 148,100 | | | | 8,804,545 | |
IQVIA Holdings Inc.(a) | | | 48,100 | | | | 11,121,201 | |
Johnson & Johnson | | | 2,481,600 | | | | 439,813,968 | |
Merck & Co. Inc. | | | 122,450 | | | | 10,047,022 | |
Organon & Co. | | | 28,275 | | | | 987,646 | |
Pfizer Inc. | | | 2,239,031 | | | | 115,914,635 | |
QIAGEN NV(a) | | | 206,000 | | | | 10,094,000 | |
Regeneron Pharmaceuticals Inc.(a) | | | 18,700 | | | | 13,060,454 | |
Thermo Fisher Scientific Inc. | | | 5,200 | | | | 3,071,380 | |
UnitedHealth Group Inc. | | | 23,600 | | | | 12,035,292 | |
Zoetis Inc. | | | 705,696 | | | | 133,087,209 | |
| | | | | | | | |
| | | | | | | 1,359,675,500 | |
| | | | | | | | |
Industrial Products (5.33%) | | | | | | | | |
3M Co. | | | 135,000 | | | | 20,098,800 | |
Caterpillar Inc. | | | 892,521 | | | | 198,871,529 | |
Deere & Co. | | | 2,900 | | | | 1,204,834 | |
Donaldson Co. Inc. | | | 49,713 | | | | 2,581,596 | |
Emerson Electric Co. | | | 126,400 | | | | 12,393,520 | |
Illinois Tool Works Inc. | | | 652,500 | | | | 136,633,500 | |
Westinghouse Air Brake Technologies Corp. | | | 11,311 | | | | 1,087,779 | |
| | | | | | | | |
| | | | | | | 372,871,558 | |
| | | | | | | | |
Industrial Services (1.27%) | | | | | | | | |
CH Robinson Worldwide Inc. | | | 8,600 | | | | 926,306 | |
Cintas Corp. | | | 11,800 | | | | 5,019,602 | |
Expeditors International of Washington Inc. | | | 92,900 | | | | 9,583,564 | |
H&R Block Inc. | | | 153,700 | | | | 4,002,348 | |
JB Hunt Transport Services Inc. | | | 64,400 | | | | 12,930,876 | |
Landstar System Inc. | | | 60,100 | | | | 9,064,883 | |
Old Dominion Freight Line Inc. | | | 28,600 | | | | 8,542,248 | |
Union Pacific Corp. | | | 35,100 | | | | 9,589,671 | |
United Parcel Service Inc., Class B | | | 115,900 | | | | 24,855,914 | |
Waste Management Inc. | | | 25,600 | | | | 4,057,600 | |
| | | | | | | | |
| | | | | | | 88,573,012 | |
| | | | | | | | |
Insurance (1.12%) | | | | | | | | |
Allstate Corp., The | | | 14,400 | | | | 1,994,544 | |
Aon PLC, Class A | | | 39,600 | | | | 12,894,948 | |
Assurant Inc. | | | 71,900 | | | | 13,073,577 | |
Chubb Ltd. | | | 46,700 | | | | 9,989,130 | |
Erie Indemnity Co., Class A | | | 10,000 | | | | 1,761,300 | |
Hanover Insurance Group Inc., The | | | 90,300 | | | | 13,501,656 | |
Travelers Cos. Inc., The | | | 66,700 | | | | 12,188,091 | |
W.R. Berkley Corp. | | | 28,200 | | | | 1,877,838 | |
Willis Towers Watson PLC | | | 46,700 | | | | 11,031,474 | |
| | | | | | | | |
| | | | | | | 78,312,558 | |
| | | | | | | | |
Materials (10.02%) | | | | | | | | |
Air Products and Chemicals Inc. | | | 830,000 | | | | 207,425,300 | |
AptarGroup Inc. | | | 438,205 | | | | 51,489,087 | |
Corteva Inc. | | | 27,375 | | | | 1,573,515 | |
| | |
| 2 | | See accompanying notes to financial statements. |
ADVISERS INVESTMENT TRUST
STATE FARM GROWTH FUND
SCHEDULE OF INVESTMENTS (continued)
March 31, 2022 (Unaudited)
| | | | | | | | |
| | | Shares | | | Value | |
Common Stocks (Cont.) | | | | | | | | |
Materials (Cont.) | | | | | | | | |
Dow Inc. | | | 26,244 | | | $ | 1,672,268 | |
DuPont de Nemours Inc. | | | 18,693 | | | | 1,375,431 | |
Ecolab Inc. | | | 53,200 | | | | 9,392,992 | |
International Flavors &
Fragrances Inc. | | | 537,141 | | | | 70,542,728 | |
Newmont Corp. | | | 199,500 | | | | 15,850,275 | |
Nucor Corp. | | | 531,200 | | | | 78,962,880 | |
Olin Corp. | | | 8,400 | | | | 439,152 | |
Rio Tinto PLC Sponsored ADR | | | 822,000 | | | | 66,088,800 | |
Sherwin-Williams Co., The | | | 19,200 | | | | 4,792,704 | |
Vulcan Materials Co. | | | 1,039,200 | | | | 190,901,040 | |
| | | | | | | | |
| | | | | | | 700,506,172 | |
| | | | | | | | |
Media (10.09%) | | | | | | | | |
Activision Blizzard Inc. | | | 72,100 | | | | 5,775,931 | |
Alphabet Inc., Class A(a) | | | 74,935 | | | | 208,420,462 | |
Alphabet Inc., Class C(a) | | | 5,916 | | | | 16,523,329 | |
Charter Communications Inc.,
Class A(a) | | | 19,000 | | | | 10,364,880 | |
Comcast Corp., Class A | | | 42,900 | | | | 2,008,578 | |
Interpublic Group of Cos. Inc., The | | | 544,500 | | | | 19,302,525 | |
Meta Platforms Inc., Class A(a) | | | 124,170 | | | | 27,610,441 | |
New York Times Co., The, Class A | | | 247,100 | | | | 11,327,064 | |
Nexstar Media Group Inc., Class A | | | 49,700 | | | | 9,367,456 | |
Omnicom Group Inc. | | | 93,400 | | | | 7,927,792 | |
Sirius XM Holdings Inc. | | | 1,026,400 | | | | 6,794,768 | |
VeriSign Inc.(a) | | | 40,500 | | | | 9,009,630 | |
Walt Disney Co., The(a) | | | 2,609,840 | | | | 357,965,655 | |
World Wrestling Entertainment Inc., Class A | | | 204,500 | | | | 12,768,980 | |
| | | | | | | | |
| | | | | | | 705,167,491 | |
| | | | | | | | |
Oil & Gas (3.99%) | | | | | | | | |
Antero Midstream Corp. | | | 951,700 | | | | 10,344,979 | |
APA Corp. | | | 219,200 | | | | 9,059,536 | |
Chevron Corp. | | | 1,060,000 | | | | 172,599,800 | |
Devon Energy Corp. | | | 124,100 | | | | 7,338,033 | |
Diamondback Energy Inc. | | | 24,500 | | | | 3,358,460 | |
EOG Resources Inc. | | | 79,000 | | | | 9,419,170 | |
Exxon Mobil Corp. | | | 131,600 | | | | 10,868,844 | |
Halliburton Co. | | | 3,100 | | | | 117,397 | |
Marathon Oil Corp. | | | 106,500 | | | | 2,674,215 | |
Occidental Petroleum Corp. | | | 197,500 | | | | 11,206,150 | |
Targa Resources Corp. | | | 173,100 | | | | 13,063,857 | |
Texas Pacific Land Corp. | | | 11,400 | | | | 15,414,054 | |
Williams Cos. Inc., The | | | 411,700 | | | | 13,754,897 | |
| | | | | | | | |
| | | | | | | 279,219,392 | |
| | | | | | | | |
Real Estate (1.52%) | | | | | | | | |
American Tower Corp. | | | 35,800 | | | | 8,993,676 | |
AvalonBay Communities Inc. | | | 14,700 | | | | 3,651,039 | |
Essex Property Trust Inc. | | | 24,600 | | | | 8,498,808 | |
Extra Space Storage Inc. | | | 43,400 | | | | 8,923,040 | |
Highwoods Properties Inc. | | | 340,700 | | | | 15,583,618 | |
Iron Mountain Inc. | | | 359,300 | | | | 19,908,813 | |
Lamar Advertising Co., Class A | | | 122,500 | | | | 14,232,050 | |
| | | | | | | | |
| | | Shares | | | Value | |
Common Stocks (Cont.) | | | | | | | | |
Real Estate (Cont.) | | | | | | | | |
Mid-America Apartment Communities Inc. | | | 17,300 | | | $ | 3,623,485 | |
Public Storage | | | 37,200 | | | | 14,518,416 | |
Rayonier Inc. | | | 199,700 | | | | 8,211,664 | |
SL Green Realty Corp. | | | 0 | | | | 2 | |
| | | | | | | | |
| | | | | | | 106,144,611 | |
| | | | | | | | |
Renewable Energy (0.05%) | | | | | | | | |
Enphase Energy Inc.(a) | | | 18,400 | | | | 3,712,752 | |
| | | | | | | | |
Retail & Wholesale - Discretionary (1.73%) | | | | | |
Amazon.com Inc.(a) | | | 11,130 | | | | 36,283,243 | |
AutoZone Inc.(a) | | | 5,700 | | | | 11,654,106 | |
Bath & Body Works Inc. | | | 22,400 | | | | 1,070,720 | |
Best Buy Co. Inc. | | | 51,100 | | | | 4,644,990 | |
Copart Inc.(a) | | | 12,700 | | | | 1,593,469 | |
Dick’s Sporting Goods Inc. | | | 7,700 | | | | 770,154 | |
Etsy Inc.(a) | | | 600 | | | | 74,568 | |
Home Depot Inc., The | | | 102,047 | | | | 30,545,729 | |
Lowe’s Cos. Inc. | | | 10,600 | | | | 2,143,214 | |
O’Reilly Automotive Inc.(a) | | | 19,500 | | | | 13,356,720 | |
Williams-Sonoma Inc. | | | 130,700 | | | | 18,951,500 | |
| | | | | | | | |
| | | | | | | 121,088,413 | |
| | | | | | | | |
Retail & Wholesale - Staples (7.25%) | | | | | |
Archer-Daniels-Midland Co. | | | 3,291,354 | | | | 297,077,612 | |
Costco Wholesale Corp. | | | 18,900 | | | | 10,883,565 | |
Target Corp. | | | 62,600 | | | | 13,284,972 | |
Walmart Inc. | | | 1,248,700 | | | | 185,956,404 | |
| | | | | | | | |
| | | | | | | 507,202,553 | |
| | | | | | | | |
Software & Services (5.90%) | | | | | | | | |
Accenture PLC, Class A | | | 48,500 | | | | 16,355,655 | |
Adobe Inc.(a) | | | 8,116 | | | | 3,697,812 | |
ANSYS Inc.(a) | | | 27,700 | | | | 8,798,905 | |
Automatic Data Processing Inc. | | | 109,900 | | | | 25,006,646 | |
CACI International Inc., Class A(a) | | | 15,300 | | | | 4,609,278 | |
CDK Global Inc. | | | 261,500 | | | | 12,729,820 | |
CDW Corp. | | | 35,100 | | | | 6,279,039 | |
Cerner Corp. | | | 32,100 | | | | 3,003,276 | |
Intuit Inc. | | | 35,900 | | | | 17,262,156 | |
Jack Henry & Associates Inc. | | | 5,300 | | | | 1,044,365 | |
Mastercard Inc., Class A | | | 42,564 | | | | 15,211,522 | |
Microsoft Corp. | | | 701,169 | | | | 216,177,415 | |
NortonLifeLock Inc. | | | 543,300 | | | | 14,408,316 | |
Paychex Inc. | | | 93,400 | | | | 12,746,298 | |
Roper Technologies Inc. | | | 25,700 | | | | 12,136,311 | |
Verisk Analytics Inc. | | | 45,000 | | | | 9,658,350 | |
Visa Inc., Class A | | | 123,712 | | | | 27,435,610 | |
Western Union Co., The | | | 300,000 | | | | 5,622,000 | |
| | | | | | | | |
| | | | | | | 412,182,774 | |
| | | | | | | | |
Technology Hardware & Semiconductors (17.93%) | | | | | |
Advanced Micro Devices Inc.(a) | | | 116,400 | | | | 12,727,176 | |
Apple Inc. | | | 5,017,768 | | | | 876,152,470 | |
Applied Materials Inc. | | | 10,500 | | | | 1,383,900 | |
| | |
| See accompanying notes to financial statements. | | 3 |
ADVISERS INVESTMENT TRUST
STATE FARM GROWTH FUND
SCHEDULE OF INVESTMENTS (continued)
March 31, 2022 (Unaudited)
| | | | | | | | |
| | | Shares | | | Value | |
Common Stocks (Cont.) | | | | | | | | |
Technology Hardware & Semiconductors (Cont.) | |
ASML Holding NV NY Reg. Shares | | | 334,733 | | | $ | 223,578,213 | |
Broadcom Inc. | | | 27,000 | | | | 17,001,360 | |
Cisco Systems Inc. | | | 34,600 | | | | 1,929,296 | |
Corning Inc. | | | 1,284,600 | | | | 47,414,586 | |
HP Inc. | | | 456,100 | | | | 16,556,430 | |
Intel Corp. | | | 17,500 | | | | 867,300 | |
Microchip Technology Inc. | | | 58,600 | | | | 4,403,204 | |
NVIDIA Corp. | | | 66,300 | | | | 18,090,618 | |
QUALCOMM Inc. | | | 15,600 | | | | 2,383,992 | |
Texas Instruments Inc. | | | 169,007 | | | | 31,009,404 | |
| | | | | | | | |
| | | | | | | 1,253,497,949 | |
| | | | | | | | |
Telecommunications (0.15%) | | | | | | | | |
Verizon Communications Inc. | | | 204,700 | | | | 10,427,418 | |
| | | | | | | | |
| | |
Utilities (0.95%) | | | | | | | | |
American Water Works Co. Inc. | | | 71,500 | | | | 11,835,395 | |
Dominion Energy Inc. | | | 139,500 | | | | 11,853,315 | |
Duke Energy Corp. | | | 102,766 | | | | 11,474,852 | |
IDACORP Inc. | | | 76,200 | | | | 8,790,432 | |
PPL Corp. | | | 78,500 | | | | 2,241,960 | |
Public Service Enterprise Group Inc. | | | 99,300 | | | | 6,951,000 | |
Southern Co., The | | | 50,700 | | | | 3,676,257 | |
WEC Energy Group Inc. | | | 94,700 | | | | 9,452,007 | |
| | | | | | | | |
| | | | | | | 66,275,218 | |
| | | | | | | | |
Total Common Stocks (cost $1,913,304,236) | | | | | | | 6,902,737,953 | |
| | | | | | | | |
| | |
| | | Principal
amount | | | Value | |
U.S. Treasury Obligations (0.07%) | | | | | |
U.S. Treasury Bill 0.290%, 06/30/2022(b),(c) | | $ | 5,235,000 | | | | 5,228,309 | |
| | | | | | | | |
Total U.S. Treasury Obligations (cost $5,231,236) | | | | | | | 5,228,309 | |
| | | | | | | | |
| | |
| | | Shares | | | Value | |
Short-term Investments (1.09%) | | | | | |
Northern Institutional Treasury Portfolio (Premier Class), 0.12%(d) | | | 75,926,499 | | | | 75,926,499 | |
| | | | | | | | |
Total Short-term Investments (cost $75,926,499) | | | | 75,926,499 | |
| | | | | | | | |
TOTAL INVESTMENTS (99.89%) (cost $1,994,461,971) | | | | 6,983,892,761 | |
OTHER ASSETS, NET
OF LIABILITIES (0.11%) | | | | 8,000,012 | |
| | | | | | | | |
NET ASSETS (100.00%) | | | $ | 6,991,892,773 | |
| | | | | | | | |
| (a) | Non-income producing security. |
| (b) | Security pledged as collateral to cover margin requirements for open futures contracts. |
| (c) | Discount rate at the time of purchase. |
| (d) | Rate shown is the 7-day yield as of March 31, 2022. |
PLC – Public Limited Company
ADR – American Depositary Receipt
At March 31, 2022, the Fund had open futures contracts as follows:
| | | | | | | | | | | | | | | | | | |
Description | | Number of
Contracts | | Expiration
Date | | | Trading
Currency | | | Notional
Amount | | | Unrealized
Appreciation
(Depreciation)* | |
Long Contracts | |
E-Mini S&P 500 | | 229 | | | 6/17/2022 | | | | USD | | | | 51,877,088 | | | | $3,992,121 | |
*Includes cumulative appreciation/depreciation on futures contracts. Only the current day’s variation margin is reported within the Statements of Assets and Liabilities.
| | |
| 4 | | See accompanying notes to financial statements. |
ADVISERS INVESTMENT TRUST
STATE FARM BALANCED FUND
SCHEDULE OF INVESTMENTS
March 31, 2022 (Unaudited)
| | | | | | | | |
| | | Shares | | | Value | |
Common Stocks (71.65%) | | | | | | | | |
Banking (1.91%) | | | | | | | | |
Bank of America Corp. | | | 31,900 | | | $ | 1,314,918 | |
Citigroup Inc. | | | 1,000 | | | | 53,400 | |
First Republic Bank | | | 11,000 | | | | 1,783,100 | |
JPMorgan Chase & Co. | | | 14,700 | | | | 2,003,904 | |
M&T Bank Corp. | | | 24,300 | | | | 4,118,850 | |
U.S. Bancorp | | | 14,245 | | | | 757,122 | |
Wells Fargo & Co. | | | 735,000 | | | | 35,618,100 | |
| | | | | | | | |
| | | | | | | 45,649,394 | |
| | | | | | | | |
Consumer Discretionary Products (0.54%) | | | | | |
Gentex Corp. | | | 23,300 | | | | 679,661 | |
HNI Corp. | | | 160,000 | | | | 5,928,000 | |
NIKE Inc., Class B | | | 1,000 | | | | 134,560 | |
Tapestry Inc. | | | 77,800 | | | | 2,890,270 | |
Tesla Inc.(a) | | | 3,100 | | | | 3,340,560 | |
| | | | | | | | |
| | | | | | | 12,973,051 | |
| | | | | | | | |
Consumer Discretionary Services (0.55%) | | | | | |
Domino’s Pizza Inc. | | | 5,100 | | | | 2,075,751 | |
McDonald’s Corp. | | | 1,900 | | | | 469,832 | |
Service Corp. International | | | 35,000 | | | | 2,303,700 | |
Starbucks Corp. | | | 84,100 | | | | 7,650,577 | |
Yum! Brands Inc. | | | 4,600 | | | | 545,238 | |
| | | | | | | | |
| | | | | | | 13,045,098 | |
| | | | | | | | |
Consumer Staple Products (4.87%) | | | | | |
Altria Group Inc. | | | 43,600 | | | | 2,278,100 | |
Coca-Cola Co., The | | | 177,257 | | | | 10,989,934 | |
Colgate-Palmolive Co. | | | 27,300 | | | | 2,070,159 | |
Hershey Co., The | | | 16,200 | | | | 3,509,406 | |
Kellogg Co. | | | 132,500 | | | | 8,544,925 | |
Nestle SA Sponsored ADR | | | 69,700 | | | | 9,067,970 | |
PepsiCo Inc. | | | 46,400 | | | | 7,766,432 | |
Philip Morris International Inc. | | | 1,900 | | | | 178,486 | |
Procter & Gamble Co., The | | | 473,400 | | | | 72,335,520 | |
| | | | | | | | |
| | | | | | | 116,740,932 | |
| | | | | | | | |
Financial Services (0.36%) | | | | | | | | |
American Express Co. | | | 17,600 | | | | 3,291,200 | |
BlackRock Inc. | | | 3,700 | | | | 2,827,429 | |
Credit Acceptance Corp.(a) | | | 1,200 | | | | 660,444 | |
GATX Corp. | | | 9,900 | | | | 1,220,967 | |
Intercontinental Exchange Inc. | | | 500 | | | | 66,060 | |
Northern Trust Corp. | | | 5,200 | | | | 605,540 | |
| | | | | | | | |
| | | | | | | 8,671,640 | |
| | | | | | | | |
Health Care (12.53%) | | | | | | | | |
Abbott Laboratories | | | 143,875 | | | | 17,029,045 | |
AbbVie Inc. | | | 50,000 | | | | 8,105,500 | |
Agilent Technologies Inc. | | | 143,787 | | | | 19,027,334 | |
Amgen Inc. | | | 70,750 | | | | 17,108,765 | |
Bristol-Myers Squibb Co. | | | 2,300 | | | | 167,969 | |
Chemed Corp. | | | 4,800 | | | | 2,431,440 | |
Eli Lilly & Co. | | | 213,800 | | | | 61,225,906 | |
Gilead Sciences Inc. | | | 37,000 | | | | 2,199,650 | |
IQVIA Holdings Inc.(a) | | | 10,600 | | | | 2,450,826 | |
| | | | | | | | |
| | | Shares | | | Value | |
Common Stocks (Cont.) | | | | | | | | |
Health Care (Cont.) | | | | | | | | |
Johnson & Johnson | | | 417,700 | | | $ | 74,028,971 | |
Merck & Co. Inc. | | | 75,900 | | | | 6,227,595 | |
Organon & Co. | | | 10,320 | | | | 360,477 | |
Pfizer Inc. | | | 728,140 | | | | 37,695,808 | |
QIAGEN NV(a) | | | 48,300 | | | | 2,366,700 | |
Regeneron Pharmaceuticals Inc.(a) | | | 4,800 | | | | 3,352,416 | |
Thermo Fisher Scientific Inc. | | | 900 | | | | 531,585 | |
UnitedHealth Group Inc. | | | 5,300 | | | | 2,702,841 | |
Zoetis Inc. | | | 229,495 | | | | 43,280,462 | |
| | | | | | | | |
| | | | | | | 300,293,290 | |
| | | | | | | | |
Industrial Products (5.08%) | | | | | | | | |
3M Co. | | | 62,100 | | | | 9,245,448 | |
Caterpillar Inc. | | | 262,400 | | | | 58,467,968 | |
Deere & Co. | | | 41,002 | | | | 17,034,691 | |
Donaldson Co. Inc. | | | 49,317 | | | | 2,561,032 | |
Emerson Electric Co. | | | 71,700 | | | | 7,030,185 | |
Illinois Tool Works Inc. | | | 130,600 | | | | 27,347,640 | |
Westinghouse Air Brake Technologies Corp. | | | 676 | | | | 65,011 | |
| | | | | | | | |
| | | | | | | 121,751,975 | |
| | | | | | | | |
Industrial Services (0.79%) | | | | | | | | |
Cintas Corp. | | | 2,900 | | | | 1,233,631 | |
Expeditors International of Washington Inc. | | | 19,900 | | | | 2,052,884 | |
JB Hunt Transport Services Inc. | | | 16,000 | | | | 3,212,640 | |
Landstar System Inc. | | | 12,400 | | | | 1,870,292 | |
Old Dominion Freight Line Inc. | | | 7,100 | | | | 2,120,628 | |
Union Pacific Corp. | | | 12,066 | | | | 3,296,552 | |
United Parcel Service Inc., Class B | | | 21,300 | | | | 4,567,998 | |
Waste Management Inc. | | | 3,800 | | | | 602,300 | |
| | | | | | | | |
| | | | | | | 18,956,925 | |
| | | | | | | | |
Insurance (0.81%) | | | | | | | | |
Allstate Corp., The | | | 5,100 | | | | 706,401 | |
Aon PLC, Class A | | | 9,900 | | | | 3,223,737 | |
Assurant Inc. | | | 18,900 | | | | 3,436,587 | |
Berkshire Hathaway Inc., Class B, Class B(a) | | | 200 | | | | 70,582 | |
Chubb Ltd. | | | 12,900 | | | | 2,759,310 | |
Hanover Insurance Group Inc., The | | | 20,100 | | | | 3,005,352 | |
Travelers Cos. Inc., The | | | 17,600 | | | | 3,216,048 | |
W.R. Berkley Corp. | | | 7,050 | | | | 469,459 | |
Willis Towers Watson PLC | | | 11,000 | | | | 2,598,420 | |
| | | | | | | | |
| | | | | | | 19,485,896 | |
| | | | | | | | |
Materials (8.64%) | | | | | | | | |
Air Products and Chemicals Inc. | | | 230,000 | | | | 57,479,300 | |
AptarGroup Inc. | | | 107,000 | | | | 12,572,500 | |
Corteva Inc. | | | 5,022 | | | | 288,665 | |
Dow Inc. | | | 39,352 | | | | 2,507,509 | |
DuPont de Nemours Inc. | | | 6,215 | | | | 457,300 | |
Ecolab Inc. | | | 12,000 | | | | 2,118,720 | |
| | |
| See accompanying notes to financial statements. | | 5 |
ADVISERS INVESTMENT TRUST
STATE FARM BALANCED FUND
SCHEDULE OF INVESTMENTS (continued)
March 31, 2022 (Unaudited)
| | | | | | | | |
| | | Shares | | | Value | |
Common Stocks (Cont.) | | | | | | | | |
Materials (Cont.) | | | | | | | | |
International Flavors & Fragrances Inc. | | | 120,088 | | | $ | 15,771,157 | |
Newmont Corp. | | | 52,100 | | | | 4,139,345 | |
Nucor Corp. | | | 436,800 | | | | 64,930,320 | |
Rio Tinto PLC Sponsored ADR | | | 200,000 | | | | 16,080,000 | |
Sherwin-Williams Co., The | | | 4,700 | | | | 1,173,214 | |
Vulcan Materials Co. | | | 160,200 | | | | 29,428,740 | |
| | | | | | | | |
| | | | | | | 206,946,770 | |
| | | | | | | | |
Media (10.36%) | | | | | | | | |
Alphabet Inc., Class A(a) | | | 29,487 | | | | 82,013,668 | |
Alphabet Inc., Class C(a) | | | 3,559 | | | | 9,940,251 | |
Charter Communications Inc.,
Class A(a) | | | 3,700 | | | | 2,018,424 | |
Comcast Corp., Class A | | | 25,700 | | | | 1,203,274 | |
Meta Platforms Inc., Class A(a) | | | 59,630 | | | | 13,259,327 | |
New York Times Co., The, Class A | | | 42,000 | | | | 1,925,280 | |
Sirius XM Holdings Inc. | | | 467,100 | | | | 3,092,202 | |
VeriSign Inc.(a) | | | 11,300 | | | | 2,513,798 | |
Walt Disney Co., The(a) | | | 941,595 | | | | 129,149,170 | |
World Wrestling Entertainment Inc., Class A | | | 51,300 | | | | 3,203,172 | |
| | | | | | | | |
| | | | | | | 248,318,566 | |
| | | | | | | | |
Oil & Gas (3.28%) | | | | | | | | |
APA Corp. | | | 41,200 | | | | 1,702,796 | |
Chevron Corp. | | | 288,000 | | | | 46,895,040 | |
Devon Energy Corp. | | | 10,900 | | | | 644,517 | |
Enbridge Inc. | | | 54,858 | | | | 2,528,405 | |
Exxon Mobil Corp. | | | 274,000 | | | | 22,629,660 | |
Texas Pacific Land Corp. | | | 2,400 | | | | 3,245,064 | |
Williams Cos. Inc., The | | | 26,900 | | | | 898,729 | |
| | | | | | | | |
| | | | | | | 78,544,211 | |
| | | | | | | | |
Real Estate (0.86%) | | | | | | | | |
American Tower Corp. | | | 8,100 | | | | 2,034,882 | |
AvalonBay Communities Inc. | | | 2,400 | | | | 596,088 | |
Essex Property Trust Inc. | | | 7,900 | | | | 2,729,292 | |
Extra Space Storage Inc. | | | 11,300 | | | | 2,323,280 | |
Iron Mountain Inc. | | | 89,800 | | | | 4,975,818 | |
Lamar Advertising Co., Class A | | | 30,800 | | | | 3,578,344 | |
Mid-America Apartment Communities Inc. | | | 5,000 | | | | 1,047,250 | |
Public Storage | | | 8,200 | | | | 3,200,296 | |
| | | | | | | | |
| | | | | | | 20,485,250 | |
| | | | | | | | |
Retail & Wholesale - Discretionary (1.12%) | |
Amazon.com Inc.(a) | | | 2,590 | | | | 8,443,270 | |
AutoZone Inc.(a) | | | 1,500 | | | | 3,066,870 | |
Copart Inc.(a) | | | 3,700 | | | | 464,239 | |
Home Depot Inc., The | | | 20,260 | | | | 6,064,426 | |
Lowe’s Cos. Inc. | | | 1,600 | | | | 323,504 | |
O’Reilly Automotive Inc.(a) | | | 5,300 | | | | 3,630,288 | |
Williams-Sonoma Inc. | | | 32,800 | | | | 4,756,000 | |
| | | | | | | | |
| | | | | | | 26,748,597 | |
| | | | | | | | |
| | | | | | | | |
| | | Shares | | | Value | |
Common Stocks (Cont.) | | | | | | | | |
Retail & Wholesale - Staples (4.50%) | | | | | |
Archer-Daniels-Midland Co. | | | 882,861 | | | $ | 79,687,034 | |
Costco Wholesale Corp. | | | 5,000 | | | | 2,879,250 | |
Target Corp. | | | 17,600 | | | | 3,735,072 | |
Walmart Inc. | | | 144,043 | | | | 21,450,883 | |
| | | | | | | | |
| | | | | | | 107,752,239 | |
| | | | | | | | |
Software & Services (4.38%) | | | | | | | | |
Accenture PLC, Class A | | | 12,300 | | | | 4,147,929 | |
Adobe Inc.(a) | | | 1,800 | | | | 820,116 | |
ANSYS Inc.(a) | | | 6,600 | | | | 2,096,490 | |
Automatic Data Processing Inc. | | | 38,600 | | | | 8,783,044 | |
CACI International Inc., Class A(a) | | | 3,800 | | | | 1,144,788 | |
CDK Global Inc. | | | 65,500 | | | | 3,188,540 | |
CDW Corp. | | | 7,900 | | | | 1,413,231 | |
Intuit Inc. | | | 8,700 | | | | 4,183,308 | |
Mastercard Inc., Class A | | | 11,139 | | | | 3,980,856 | |
Microsoft Corp. | | | 179,321 | | | | 55,286,457 | |
NortonLifeLock Inc. | | | 136,100 | | | | 3,609,372 | |
Paychex Inc. | | | 21,400 | | | | 2,920,458 | |
Roper Technologies Inc. | | | 5,800 | | | | 2,738,934 | |
Verisk Analytics Inc. | | | 11,600 | | | | 2,489,708 | |
Visa Inc., Class A | | | 30,930 | | | | 6,859,346 | |
Western Union Co., The | | | 73,600 | | | | 1,379,264 | |
| | | | | | | | |
| | | | | | | 105,041,841 | |
| | | | | | | | |
Technology Hardware & Semiconductors (10.28%) | |
Advanced Micro Devices Inc.(a) | | | 5,500 | | | | 601,370 | |
Apple Inc. | | | 1,179,104 | | | | 205,883,349 | |
ASML Holding NV NY Reg. Shares | | | 14,821 | | | | 9,899,391 | |
Broadcom Inc. | | | 6,700 | | | | 4,218,856 | |
Cisco Systems Inc. | | | 9,500 | | | | 529,720 | |
Corning Inc. | | | 372,300 | | | | 13,741,593 | |
HP Inc. | | | 114,000 | | | | 4,138,200 | |
Intel Corp. | | | 4,900 | | | | 242,844 | |
NVIDIA Corp. | | | 6,600 | | | | 1,800,876 | |
QUALCOMM Inc. | | | 4,300 | | | | 657,126 | |
Texas Instruments Inc. | | | 24,373 | | | | 4,471,958 | |
| | | | | | | | |
| | | | | | | 246,185,283 | |
| | | | | | | | |
Telecommunications (0.11%) | | | | | | | | |
Verizon Communications Inc. | | | 51,390 | | | | 2,617,807 | |
| | | | | | | | |
Utilities (0.68%) | | | | | | | | |
AES Corp., The | | | 25,100 | | | | 645,823 | |
American Water Works Co. Inc. | | | 16,300 | | | | 2,698,139 | |
Dominion Energy Inc. | | | 29,700 | | | | 2,523,609 | |
Duke Energy Corp. | | | 28,833 | | | | 3,219,493 | |
IDACORP Inc. | | | 21,500 | | | | 2,480,240 | |
Public Service Enterprise Group Inc. | | | 27,200 | | | | 1,904,000 | |
Southern Co., The | | | 10,800 | | | | 783,108 | |
WEC Energy Group Inc. | | | 21,300 | | | | 2,125,953 | |
| | | | | | | | |
| | | | | | | 16,380,365 | |
| | | | | | | | |
Total Common Stocks (cost $429,964,452) | | | | | | | 1,716,589,130 | |
| | | | | | | | |
| | |
| 6 | | See accompanying notes to financial statements. |
ADVISERS INVESTMENT TRUST
STATE FARM BALANCED FUND
SCHEDULE OF INVESTMENTS (continued)
March 31, 2022 (Unaudited)
| | | | | | | | |
| | | Principal
amount | | | Value | |
Corporate Bonds (11.04%) | | | | | |
Aerospace & Defense (0.48%) | | | | | |
Boeing (The) Co. | | | | | | | | |
2.850%, 10/30/2024 | | $ | 1,000,000 | | | $ | 995,436 | |
General Dynamics Corp. | | | | | | | | |
2.375%, 11/15/2024 | | | 500,000 | | | | 497,911 | |
Raytheon Technologies Corp. | | | | | |
3.150%, 12/15/2024 | | | 1,000,000 | | | | 1,004,375 | |
Northrop Grumman Corp. | | | | | |
2.930%, 01/15/2025 | | | 1,000,000 | | | | 1,002,227 | |
Lockheed Martin Corp. | | | | | | | | |
2.900%, 03/01/2025 | | | 1,000,000 | | | | 1,006,039 | |
Precision Castparts Corp. | | | | | |
3.250%, 06/15/2025 | | | 1,000,000 | | | | 1,011,341 | |
Boeing (The) Co. | | | | | | | | |
2.250%, 06/15/2026 | | | 500,000 | | | | 472,604 | |
General Dynamics Corp. | | | | | | | | |
2.125%, 08/15/2026 | | | 500,000 | | | | 484,326 | |
Raytheon Technologies Corp. | | | | | |
3.125%, 05/04/2027 | | | 1,000,000 | | | | 1,002,981 | |
General Dynamics Corp. | | | | | | | | |
2.625%, 11/15/2027 | | | 500,000 | | | | 492,169 | |
Northrop Grumman Corp. | | | | | | | | |
3.250%, 01/15/2028 | | | 1,000,000 | | | | 1,000,045 | |
General Dynamics Corp. | | | | | | | | |
3.750%, 05/15/2028 | | | 1,200,000 | | | | 1,231,677 | |
Raytheon Technologies Corp. | | | | | |
2.250%, 07/01/2030 | | | 1,500,000 | | | | 1,389,379 | |
| | | | | | | | |
| | | | | | | 11,590,510 | |
| | | | | | | | |
Apparel & Textile Products (0.06%) | | | | | |
NIKE, Inc. | | | | | | | | |
2.250%, 05/01/2023 | | | 500,000 | | | | 500,143 | |
2.375%, 11/01/2026 | | | 1,000,000 | | | | 979,499 | |
| | | | | | | | |
| | | | | | | 1,479,642 | |
| | | | | | | | |
Asset Management (0.05%) | | | | | |
Charles Schwab (The) Corp. | | | | | |
3.750%, 04/01/2024 | | | 1,140,000 | | | | 1,159,344 | |
| | | | | | | | |
| | | | | | | | |
Automotive (0.21%) | | | | | | | | |
Toyota Motor Credit Corp. | | | | | | | | |
2.900%, 04/17/2024 | | | 1,000,000 | | | | 1,005,823 | |
American Honda Finance Corp. | | | | | |
2.300%, 09/09/2026 | | | 1,000,000 | | | | 967,011 | |
Toyota Motor Credit Corp. | | | | | | | | |
3.050%, 01/11/2028 | | | 1,000,000 | | | | 991,992 | |
American Honda Finance Corp. | | | | | |
3.500%, 02/15/2028 | | | 1,000,000 | | | | 1,010,355 | |
Toyota Motor Credit Corp. | | | | | | | | |
3.650%, 01/08/2029 | | | 1,000,000 | | | | 1,021,199 | |
| | | | | | | | |
| | | | | | | 4,996,380 | |
| | | | | | | | |
Banking (0.55%) | | | | | | | | |
U.S. Bancorp | | | | | | | | |
3.700%, 01/30/2024 | | | 500,000 | | | | 510,861 | |
| | | | | | | | |
| | | Principal
amount | | | Value | |
Corporate Bonds (Cont.) | | | | | | | | |
Banking (Cont.) | | | | | | | | |
Bank of Nova Scotia (The) | | | | | | | | |
3.400%, 02/11/2024 | | $ | 250,000 | | | $ | 253,359 | |
JPMorgan Chase & Co. | | | | | | | | |
3.625%, 05/13/2024 | | | 500,000 | | | | 509,987 | |
3.125%, 01/23/2025 | | | 1,000,000 | | | | 1,005,161 | |
PNC Bank N.A. | | | | | | | | |
3.250%, 06/01/2025 | | | 500,000 | | | | 505,054 | |
JPMorgan Chase & Co. | | | | | | | | |
3.300%, 04/01/2026 | | | 1,000,000 | | | | 1,007,924 | |
Wells Fargo & Co. | | | | | | | | |
3.000%, 04/22/2026 | | | 1,000,000 | | | | 990,286 | |
U.S. Bancorp | | | | | | | | |
2.375%, 07/22/2026 | | | 1,000,000 | | | | 975,077 | |
Wells Fargo & Co. | | | | | | | | |
3.000%, 10/23/2026 | | | 1,500,000 | | | | 1,479,134 | |
U.S. Bancorp | | | | | | | | |
3.150%, 04/27/2027 | | | 1,000,000 | | | | 1,006,894 | |
PNC Bank N.A. | | | | | | | | |
3.100%, 10/25/2027 | | | 1,000,000 | | | | 998,105 | |
U.S. Bancorp | | | | | | | | |
3.900%, 04/26/2028 | | | 1,000,000 | | | | 1,026,619 | |
Wells Fargo & Co. | | | | | | | | |
4.150%, 01/24/2029 | | | 1,000,000 | | | | 1,037,251 | |
Bank of America Corp. (Variable,
U.S. SOFR + 1.25%)(b) | | | | | | | | |
3.974%, 02/07/2030 | | | 1,000,000 | | | | 1,016,140 | |
JPMorgan Chase & Co. (Variable,
ICE LIBOR USD 3M + 1.21%)(b) | | | | | | | | |
2.580%, 04/22/2032 | | | 1,000,000 | | | | 916,153 | |
| | | | | | | | |
| | | | | | | 13,238,005 | |
| | | | | | | | |
Beverages (0.46%) | | | | | | | | |
PepsiCo, Inc. | | | | | | | | |
3.600%, 03/01/2024 | | | 1,000,000 | | | | 1,022,517 | |
3.500%, 07/17/2025 | | | 1,000,000 | | | | 1,023,504 | |
2.850%, 02/24/2026 | | | 1,000,000 | | | | 1,006,989 | |
Coca-Cola (The) Co. | | | | | | | | |
2.900%, 05/25/2027 | | | 500,000 | | | | 495,101 | |
PepsiCo, Inc. | | | | | | | | |
3.000%, 10/15/2027 | | | 1,500,000 | | | | 1,511,228 | |
Coca-Cola (The) Co. | | | | | | | | |
2.125%, 09/06/2029 | | | 1,000,000 | | | | 942,059 | |
PepsiCo, Inc. | | | | | | | | |
1.400%, 02/25/2031 | | | 1,500,000 | | | | 1,311,417 | |
Coca-Cola (The) Co. | | | | | | | | |
2.000%, 03/05/2031 | | | 3,000,000 | | | | 2,745,360 | |
1.375%, 03/15/2031 | | | 1,000,000 | | | | 866,452 | |
| | | | | | | | |
| | | | | | | 10,924,627 | |
| | | | | | | | |
Biotechnology & Pharmaceuticals (1.00%) | |
Merck & Co., Inc. | | | | | | | | |
2.800%, 05/18/2023 | | | 2,000,000 | | | | 2,015,496 | |
Novartis Capital Corp. | | | | | | | | |
3.400%, 05/06/2024 | | | 1,500,000 | | | | 1,527,099 | |
| | |
| See accompanying notes to financial statements. | | 7 |
ADVISERS INVESTMENT TRUST
STATE FARM BALANCED FUND
SCHEDULE OF INVESTMENTS (continued)
March 31, 2022 (Unaudited)
| | | | | | | | |
| | | Principal
amount | | | Value | |
Corporate Bonds (Cont.) | | | | | | | | |
Biotechnology & Pharmaceuticals (Cont.) | |
Pfizer, Inc. | | | | | | | | |
3.400%, 05/15/2024 | | $ | 1,000,000 | | | $ | 1,019,835 | |
Amgen, Inc. | | | | | | | | |
3.625%, 05/22/2024 | | | 1,000,000 | | | | 1,018,689 | |
Eli Lilly & Co. | | | | | | | | |
2.750%, 06/01/2025 | | | 472,000 | | | | 469,914 | |
AstraZeneca PLC | | | | | | | | |
3.375%, 11/16/2025 | | | 1,000,000 | | | | 1,014,589 | |
Novartis Capital Corp. | | | | | | | | |
3.000%, 11/20/2025 | | | 1,000,000 | | | | 1,005,102 | |
Johnson & Johnson | | | | | | | | |
2.450%, 03/01/2026 | | | 500,000 | | | | 497,314 | |
Amgen, Inc. | | | | | | | | |
2.600%, 08/19/2026 | | | 1,000,000 | | | | 985,676 | |
Eli Lilly & Co. | | | | | | | | |
3.100%, 05/15/2027 | | | 500,000 | | | | 499,929 | |
AstraZeneca PLC | | | | | | | | |
3.125%, 06/12/2027 | | | 1,000,000 | | | | 1,006,377 | |
Amgen, Inc. | | | | | | | | |
3.200%, 11/02/2027 | | | 1,000,000 | | | | 1,005,984 | |
Johnson & Johnson | | | | | | | | |
2.900%, 01/15/2028 | | | 2,000,000 | | | | 2,006,165 | |
GlaxoSmithKline Capital, Inc. | | | | | |
3.875%, 05/15/2028 | | | 2,000,000 | | | | 2,088,183 | |
Sanofi | | | | | | | | |
3.625%, 06/19/2028 | | | 1,500,000 | | | | 1,544,293 | |
Merck & Co., Inc. | | | | | | | | |
3.400%, 03/07/2029 | | | 1,000,000 | | | | 1,022,670 | |
Eli Lilly & Co. | | | | | | | | |
3.375%, 03/15/2029 | | | 407,000 | | | | 417,200 | |
Pfizer, Inc. | | | | | | | | |
3.450%, 03/15/2029 | | | 1,000,000 | | | | 1,028,568 | |
Bristol-Myers Squibb Co. | | | | | | | | |
3.400%, 07/26/2029 | | | 619,000 | | | | 630,010 | |
Merck & Co., Inc. | | | | | | | | |
1.450%, 06/24/2030 | | | 500,000 | | | | 443,933 | |
AstraZeneca PLC | | | | | | | | |
1.375%, 08/06/2030 | | | 1,000,000 | | | | 871,431 | |
Johnson & Johnson | | | | | | | | |
1.300%, 09/01/2030 | | | 2,000,000 | | | | 1,780,895 | |
| | | | | | | | |
| | | | | | | 23,899,352 | |
| | | | | | | | |
Cable & Satellite (0.08%) | | | | | | | | |
Comcast Corp. | | | | | | | | |
2.350%, 01/15/2027 | | | 1,000,000 | | | | 972,357 | |
1.500%, 02/15/2031 | | | 1,000,000 | | | | 871,301 | |
| | | | | | | | |
| | | | | | | 1,843,658 | |
| | | | | | | | |
Chemicals (0.34%) | | | | | | | | |
Linde, Inc. | | | | | | | | |
3.200%, 01/30/2026 | | | 1,000,000 | | | | 1,005,473 | |
Ecolab, Inc. | | | | | | | | |
2.700%, 11/01/2026 | | | 1,000,000 | | | | 988,496 | |
3.250%, 12/01/2027 | | | 1,500,000 | | | | 1,525,109 | |
| | | | | | | | |
| | | Principal
amount | | | Value | |
Corporate Bonds (Cont.) | | | | | | | | |
Chemicals (Cont.) | | | | | | | | |
PPG Industries, Inc. | | | | | | | | |
3.750%, 03/15/2028 | | $ | 2,000,000 | | | $ | 2,045,682 | |
E.I. du Pont de Nemours and Co. | | | | | |
2.300%, 07/15/2030 | | | 1,000,000 | | | | 930,624 | |
Ecolab, Inc. | | | | | | | | |
1.300%, 01/30/2031 | | | 2,000,000 | | | | 1,725,188 | |
| | | | | | | | |
| | | | | | | 8,220,572 | |
| | | | | | | | |
Diversified Industrials (0.33%) | | | | | | | | |
Emerson Electric Co. | | | | | | | | |
3.150%, 06/01/2025 | | | 1,000,000 | | | | 1,009,164 | |
3M Co. | | | | | | | | |
3.000%, 08/07/2025 | | | 1,000,000 | | | | 1,003,696 | |
Dover Corp. | | | | | | | | |
3.150%, 11/15/2025 | | | 1,000,000 | | | | 996,356 | |
3M Co. | | | | | | | | |
2.250%, 09/19/2026 | | | 500,000 | | | | 486,062 | |
Honeywell International, Inc. | | | | | |
2.500%, 11/01/2026 | | | 2,000,000 | | | | 1,972,852 | |
3M Co. | | | | | | | | |
3.375%, 03/01/2029 | | | 1,000,000 | | | | 1,016,850 | |
Honeywell International, Inc. | | | | | |
1.950%, 06/01/2030 | | | 500,000 | | | | 461,665 | |
Emerson Electric Co. | | | | | | | | |
1.950%, 10/15/2030 | | | 1,000,000 | | | | 905,124 | |
| | | | | | | | |
| | | | | | | 7,851,769 | |
| | | | | | | | |
E-Commerce Discretionary (0.04%) | | | | | |
Amazon.com, Inc. | | | | | | | | |
3.150%, 08/22/2027 | | | 1,000,000 | | | | 1,012,825 | |
| | | | | | | | |
Electric Utilities (2.28%) | | | | | | | | |
Public Service Electric and Gas Co. | | | | | |
2.375%, 05/15/2023 | | | 2,000,000 | | | | 2,002,136 | |
Florida Power & Light Co. | | | | | | | | |
2.750%, 06/01/2023 | | | 2,000,000 | | | | 2,014,190 | |
PacifiCorp | | | | | | | | |
2.950%, 06/01/2023 | | | 1,000,000 | | | | 1,001,496 | |
Pacific Gas and Electric Co. | | | | | | | | |
3.250%, 06/15/2023 | | | 1,000,000 | | | | 998,194 | |
Consumers Energy Co. | | | | | | | | |
3.375%, 08/15/2023 | | | 1,000,000 | | | | 1,007,469 | |
San Diego Gas & Electric Co. | | | | | |
3.600%, 09/01/2023 | | | 2,000,000 | | | | 2,026,657 | |
Duke Energy Ohio, Inc. | | | | | | | | |
3.800%, 09/01/2023 | | | 1,000,000 | | | | 1,013,258 | |
Public Service Co. of New Hampshire | | | | | | | | |
3.500%, 11/01/2023 | | | 500,000 | | | | 505,890 | |
Delmarva Power & Light Co. | | | | | | | | |
3.500%, 11/15/2023 | | | 1,000,000 | | | | 1,011,044 | |
Alabama Power Co. | | | | | | | | |
3.550%, 12/01/2023 | | | 1,000,000 | | | | 1,012,330 | |
Virginia Electric and Power Co. | | | | | |
3.450%, 02/15/2024 | | | 1,000,000 | | | | 1,010,470 | |
| | |
| 8 | | See accompanying notes to financial statements. |
ADVISERS INVESTMENT TRUST
STATE FARM BALANCED FUND
SCHEDULE OF INVESTMENTS (continued)
March 31, 2022 (Unaudited)
| | | | | | | | |
| | | Principal
amount | | | Value | |
Corporate Bonds (Cont.) | | | | | |
Electric Utilities (Cont.) | | | | | |
Potomac Electric Power Co. | | | | | | | | |
3.600%, 03/15/2024 | | $ | 1,000,000 | | | $ | 1,013,479 | |
DTE Electric Co. | | | | | | | | |
3.650%, 03/15/2024 | | | 2,000,000 | | | | 2,034,584 | |
Florida Power & Light Co. | | | | | | | | |
3.250%, 06/01/2024 | | | 1,000,000 | | | | 1,012,874 | |
Interstate Power and Light Co. | | | | | |
3.250%, 12/01/2024 | | | 1,000,000 | | | | 1,004,407 | |
DTE Electric Co. | | | | | | | | |
3.375%, 03/01/2025 | | | 1,000,000 | | | | 1,007,100 | |
Arizona Public Service Co. | | | | | | | | |
3.150%, 05/15/2025 | | | 500,000 | | | | 499,453 | |
Pacific Gas and Electric Co. | | | | | | | | |
3.500%, 06/15/2025 | | | 1,000,000 | | | | 975,735 | |
3.450%, 07/01/2025 | | | 500,000 | | | | 487,725 | |
Duke Energy Progress LLC | | | | | | | | |
3.250%, 08/15/2025 | | | 1,000,000 | | | | 1,005,867 | |
Louisville Gas and Electric Co. | | | | | |
3.300%, 10/01/2025 | | | 1,000,000 | | | | 1,004,682 | |
Florida Power & Light Co. | | | | | | | | |
3.125%, 12/01/2025 | | | 1,000,000 | | | | 1,007,008 | |
Virginia Electric and Power Co. | | | | | |
3.150%, 01/15/2026 | | | 1,000,000 | | | | 1,001,373 | |
Georgia Power Co. | | | | | | | | |
3.250%, 04/01/2026 | | | 1,000,000 | | | | 1,003,313 | |
San Diego Gas & Electric Co. | | | | | |
2.500%, 05/15/2026 | | | 1,000,000 | | | | 979,279 | |
NSTAR Electric Co. | | | | | | | | |
2.700%, 06/01/2026 | | | 1,000,000 | | | | 973,274 | |
Commonwealth Edison Co. | | | | | | | | |
2.550%, 06/15/2026 | | | 1,000,000 | | | | 982,040 | |
Evergy Kansas Central, Inc. | | | | | | | | |
2.550%, 07/01/2026 | | | 1,000,000 | | | | 977,667 | |
CenterPoint Energy Houston Electric LLC | | | | | | | | |
2.400%, 09/01/2026 | | | 500,000 | | | | 484,527 | |
Duke Energy Carolinas LLC | | | | | | | | |
2.950%, 12/01/2026 | | | 1,000,000 | | | | 997,428 | |
AEP Transmission Co. LLC | | | | | | | | |
3.100%, 12/01/2026 | | | 500,000 | | | | 498,758 | |
Evergy Kansas Central, Inc. | | | | | | | | |
3.100%, 04/01/2027 | | | 1,000,000 | | | | 996,142 | |
Public Service Electric and Gas Co. | | | | | |
3.000%, 05/15/2027 | | | 500,000 | | | | 495,605 | |
NSTAR Electric Co. | | | | | | | | |
3.200%, 05/15/2027 | | | 1,000,000 | | | | 1,001,206 | |
Appalachian Power Co. | | | | | | | | |
3.300%, 06/01/2027 | | | 1,000,000 | | | | 1,005,384 | |
Union Electric Co. | | | | | | | | |
2.950%, 06/15/2027 | | | 1,000,000 | | | | 985,467 | |
Commonwealth Edison Co. | | | | | | | | |
2.950%, 08/15/2027 | | | 500,000 | | | | 492,896 | |
Wisconsin Power and Light Co. | | | | | | | | |
3.050%, 10/15/2027 | | | 1,000,000 | | | | 992,361 | |
| | | | | | | | |
| | | Principal
amount | | | Value | |
Corporate Bonds (Cont.) | | | | | | | | |
Electric Utilities (Cont.) | | | | | | | | |
Pacific Gas and Electric Co. | | | | | | | | |
3.300%, 12/01/2027 | | $ | 1,000,000 | | | $ | 943,351 | |
Southern California Edison Co. | | | | | |
3.650%, 03/01/2028 | | | 1,000,000 | | | | 998,467 | |
Virginia Electric and Power Co. | | | | | |
3.800%, 04/01/2028 | | | 1,000,000 | | | | 1,023,597 | |
Public Service Electric and Gas Co. | | | | | |
3.700%, 05/01/2028 | | | 1,000,000 | | | | 1,018,002 | |
Ameren Illinois Co. | | | | | | | | |
3.800%, 05/15/2028 | | | 1,000,000 | | | | 1,026,176 | |
Indiana Michigan Power Co. | | | | | | | | |
3.850%, 05/15/2028 | | | 1,000,000 | | | | 1,018,772 | |
AEP Texas, Inc. | | | | | | | | |
3.950%, 06/01/2028 | | | 1,000,000 | | | | 1,020,346 | |
Pacific Gas and Electric Co. | | | | | | | | |
3.750%, 07/01/2028 | | | 500,000 | | | | 478,512 | |
Duke Energy Ohio, Inc. | | | | | | | | |
3.650%, 02/01/2029 | | | 1,000,000 | | | | 1,016,454 | |
Union Electric Co. | | | | | | | | |
3.500%, 03/15/2029 | | | 1,000,000 | | | | 1,014,752 | |
MidAmerican Energy Co. | | | | | | | | |
3.650%, 04/15/2029 | | | 2,000,000 | | | | 2,055,703 | |
Interstate Power and Light Co. | | | | | |
2.300%, 06/01/2030 | | | 500,000 | �� | | | 455,813 | |
Alabama Power Co. | | | | | | | | |
1.450%, 09/15/2030 | | | 1,500,000 | | | | 1,300,840 | |
Public Service Co. of Colorado | | | | | |
1.875%, 06/15/2031 | | | 3,000,000 | | | | 2,666,102 | |
| | | | | | | | |
| | | | | | | 54,559,655 | |
| | | | | | | | |
Electrical Equipment (0.09%) | | | | | | | | |
ABB Finance U.S.A., Inc. | | | | | | | | |
3.800%, 04/03/2028 | | | 1,000,000 | | | | 1,032,104 | |
Rockwell Automation, Inc. | | | | | | | | |
3.500%, 03/01/2029 | | | 1,000,000 | | | | 1,031,995 | |
| | | | | | | | |
| | | | | | | 2,064,099 | |
| | | | | | | | |
Electricity & Gas Marketing & Trading (0.17%) | |
PECO Energy Co. | | | | | | | | |
3.150%, 10/15/2025 | | | 1,000,000 | | | | 1,003,790 | |
Consolidated Edison Co. of New York, Inc. | | | | | |
2.900%, 12/01/2026 | | | 500,000 | | | | 491,756 | |
3.125%, 11/15/2027 | | | 1,000,000 | | | | 990,657 | |
3.800%, 05/15/2028 | | | 1,000,000 | | | | 1,024,730 | |
Evergy Metro, Inc. | | | | | | | | |
2.250%, 06/01/2030 | | | 500,000 | | | | 458,491 | |
| | | | | | | | |
| | | | | | | 3,969,424 | |
| | | | | | | | |
Food (0.46%) | | | | | | | | |
General Mills, Inc. | | | | | | | | |
3.650%, 02/15/2024 | | | 1,000,000 | | | | 1,014,722 | |
J.M. Smucker (The) Co. | | | | | | | | |
3.500%, 03/15/2025 | | | 1,000,000 | | | | 1,012,455 | |
| | |
| See accompanying notes to financial statements. | | 9 |
ADVISERS INVESTMENT TRUST
STATE FARM BALANCED FUND
SCHEDULE OF INVESTMENTS (continued)
March 31, 2022 (Unaudited)
| | | | | | | | |
| | | Principal
amount | | | Value | |
Corporate Bonds (Cont.) | | | | | | | | |
Food (Cont.) | | | | | | | | |
Hershey (The) Co. | | | | | | | | |
3.200%, 08/21/2025 | | $ | 1,000,000 | | | $ | 1,004,516 | |
2.300%, 08/15/2026 | | | 1,000,000 | | | | 977,200 | |
General Mills, Inc. | | | | | | | | |
3.200%, 02/10/2027 | | | 1,000,000 | | | | 991,665 | |
Kellogg Co. | | | | | | | | |
3.400%, 11/15/2027 | | | 1,000,000 | | | | 997,949 | |
J.M. Smucker (The) Co. | | | | | | | | |
3.375%, 12/15/2027 | | | 1,500,000 | | | | 1,498,290 | |
Campbell Soup Co. | | | | | | | | |
4.150%, 03/15/2028 | | | 1,000,000 | | | | 1,024,584 | |
General Mills, Inc. | | | | | | | | |
4.200%, 04/17/2028 | | | 1,000,000 | | | | 1,044,147 | |
Kellogg Co. | | | | | | | | |
4.300%, 05/15/2028 | | | 1,000,000 | | | | 1,034,808 | |
2.100%, 06/01/2030 | | | 500,000 | | | | 448,762 | |
| | | | | | | | |
| | | | | | | 11,049,098 | |
| | | | | | | | |
Gas & Water Utilities (0.20%) | | | | | |
Southern California Gas Co. | | | | | |
3.200%, 06/15/2025 | | | 500,000 | | | | 501,327 | |
2.600%, 06/15/2026 | | | 1,000,000 | | | | 975,455 | |
Atmos Energy Corp. | | | | | | | | |
3.000%, 06/15/2027 | | | 1,000,000 | | | | 993,063 | |
Southwest Gas Corp. | | | | | | | | |
3.700%, 04/01/2028 | | | 1,000,000 | | | | 995,363 | |
Atmos Energy Corp. | | | | | | | | |
2.625%, 09/15/2029 | | | 1,000,000 | | | | 951,941 | |
Southwest Gas Corp. | | | | | | | | |
2.200%, 06/15/2030 | | | 500,000 | | | | 437,586 | |
| | | | | | | | |
| | | | | | | 4,854,735 | |
| | | | | | | | |
Household Products (0.47%) | | | | | |
Colgate-Palmolive Co. | | | | | | | | |
2.100%, 05/01/2023 | | | 2,000,000 | | | | 1,995,955 | |
Unilever Capital Corp. | | | | | | | | |
3.100%, 07/30/2025 | | | 1,000,000 | | | | 1,008,435 | |
Kimberly-Clark Corp. | | | | | | | | |
3.050%, 08/15/2025 | | | 1,000,000 | | | | 1,008,443 | |
Procter & Gamble (The) Co. | | | | | |
2.700%, 02/02/2026 | | | 500,000 | | | | 500,843 | |
Kimberly-Clark Corp. | | | | | | | | |
2.750%, 02/15/2026 | | | 1,000,000 | | | | 998,220 | |
Unilever Capital Corp. | | | | | | | | |
2.000%, 07/28/2026 | | | 500,000 | | | | 481,518 | |
2.900%, 05/05/2027 | | | 500,000 | | | | 496,617 | |
Clorox (The) Co. | | | | | | | | |
3.100%, 10/01/2027 | | | 500,000 | | | | 496,382 | |
Unilever Capital Corp. | | | | | | | | |
3.500%, 03/22/2028 | | | 1,000,000 | | | | 1,023,914 | |
Clorox (The) Co. | | | | | | | | |
3.900%, 05/15/2028 | | | 1,000,000 | | | | 1,018,006 | |
Estee Lauder (The) Cos., Inc. | | | | | |
2.375%, 12/01/2029 | | | 1,000,000 | | | | 952,590 | |
| | | | | | | | |
| | | Principal
amount | | | Value | |
Corporate Bonds (Cont.) | | | | | | | | |
Household Products (Cont.) | | | | | | | | |
Unilever Capital Corp. | | | | | | | | |
1.375%, 09/14/2030 | | $ | 500,000 | | | $ | 431,957 | |
Estee Lauder (The) Cos., Inc. | | | | | |
1.950%, 03/15/2031 | | | 1,000,000 | | | | 907,178 | |
| | | | | | | | |
| | | | | | | 11,320,058 | |
| | | | | | | | |
Institutional Financial Services (0.27%) | |
Bank of New York Mellon (The) Corp. | | | | | |
3.650%, 02/04/2024 | | | 1,000,000 | | | | 1,017,570 | |
State Street Corp. | | | | | | | | |
3.300%, 12/16/2024 | | | 1,000,000 | | | | 1,009,915 | |
3.550%, 08/18/2025 | | | 500,000 | | | | 508,715 | |
Bank of New York Mellon (The) Corp. | | | | | |
2.800%, 05/04/2026 | | | 500,000 | | | | 501,139 | |
State Street Corp. | | | | | | | | |
2.650%, 05/19/2026 | | | 1,000,000 | | | | 988,796 | |
Bank of New York Mellon (The) Corp. | | | | | |
2.450%, 08/17/2026 | | | 500,000 | | | | 491,752 | |
3.400%, 01/29/2028 | | | 2,000,000 | | | | 2,027,845 | |
| | | | | | | | |
| | | | | | | 6,545,732 | |
| | | | | | | | |
Internet Media & Services (0.08%) | | | | | |
Alphabet, Inc. | | | | | | | | |
3.375%, 02/25/2024 | | | 1,000,000 | | | | 1,020,902 | |
1.998%, 08/15/2026 | | | 1,000,000 | | | | 974,625 | |
| | | | | | | | |
| | | | | | | 1,995,527 | |
| | | | | | | | |
Leisure Facilities & Services (0.09%) | | | | | |
McDonald’s Corp. | | | | | | | | |
3.250%, 06/10/2024 | | | 1,000,000 | | | | 1,011,516 | |
3.800%, 04/01/2028 | | | 1,000,000 | | | | 1,028,886 | |
| | | | | | | | |
| | | | | | | 2,040,402 | |
| | | | | | | | |
Machinery (0.31%) | | | | | | | | |
Caterpillar, Inc. | | | | | | | | |
3.400%, 05/15/2024 | | | 1,000,000 | | | | 1,016,661 | |
John Deere Capital Corp. | | | | | | | | |
3.350%, 06/12/2024 | | | 1,500,000 | | | | 1,523,636 | |
Caterpillar Financial Services Corp. | | | | | |
3.250%, 12/01/2024 | | | 1,000,000 | | | | 1,015,108 | |
Eaton Corp. | | | | | | | | |
3.103%, 09/15/2027 | | | 1,000,000 | | | | 1,001,473 | |
John Deere Capital Corp. | | | | | | | | |
3.050%, 01/06/2028 | | | 1,000,000 | | | | 991,277 | |
Caterpillar, Inc. | | | | | | | | |
2.600%, 09/19/2029 | | | 1,000,000 | | | | 971,429 | |
John Deere Capital Corp. | | | | | | | | |
2.450%, 01/09/2030 | | | 1,000,000 | | | | 955,786 | |
| | | | | | | | |
| | | | | | | 7,475,370 | |
| | | | | | | | |
| | |
| 10 | | See accompanying notes to financial statements. |
ADVISERS INVESTMENT TRUST
STATE FARM BALANCED FUND
SCHEDULE OF INVESTMENTS (continued)
March 31, 2022 (Unaudited)
| | | | | | | | |
| | | Principal
amount | | | Value | |
Corporate Bonds (Cont.) | | | | | | | | |
Medical Equipment & Devices (0.21%) | |
Stryker Corp. | | | | | | | | |
3.375%, 05/15/2024 | | $ | 1,000,000 | | | $ | 1,011,575 | |
Abbott Laboratories | | | | | | | | |
2.950%, 03/15/2025 | | | 1,000,000 | | | | 1,006,661 | |
Stryker Corp. | | | | | | | | |
3.500%, 03/15/2026 | | | 1,000,000 | | | | 1,011,321 | |
3.650%, 03/07/2028 | | | 1,000,000 | | | | 1,016,755 | |
Thermo Fisher Scientific, Inc. | | | | | | | | |
2.600%, 10/01/2029 | | | 1,000,000 | | | | 953,287 | |
| | | | | | | | |
| | | | | | | 4,999,599 | |
| | | | | | | | |
Oil & Gas Producers (0.55%) | | | | | |
Chevron Corp. | | | | | | | | |
3.191%, 06/24/2023 | | | 1,000,000 | | | | 1,010,843 | |
TotalEnergies Capital Canada Ltd. | | | | | |
2.750%, 07/15/2023 | | | 500,000 | | | | 502,059 | |
Exxon Mobil Corp. | | | | | | | | |
3.176%, 03/15/2024 | | | 2,000,000 | | | | 2,027,988 | |
2.709%, 03/06/2025 | | | 1,000,000 | | | | 999,210 | |
Shell International Finance B.V. | | | | | |
3.250%, 05/11/2025 | | | 1,000,000 | | | | 1,010,852 | |
Chevron Corp. | | | | | | | | |
3.326%, 11/17/2025 | | | 1,000,000 | | | | 1,014,141 | |
TransCanada PipeLines Ltd. | | | | | |
4.875%, 01/15/2026 | | | 1,000,000 | | | | 1,051,072 | |
Shell International Finance B.V. | | | | | |
2.875%, 05/10/2026 | | | 1,000,000 | | | | 1,002,025 | |
TransCanada PipeLines Ltd. | | | | | |
4.250%, 05/15/2028 | | | 1,000,000 | | | | 1,038,979 | |
TotalEnergies Capital International S.A. | | | | | |
3.455%, 02/19/2029 | | | 1,000,000 | | | | 1,015,684 | |
Exxon Mobil Corp. | | | | | | | | |
3.482%, 03/19/2030 | | | 1,000,000 | | | | 1,026,274 | |
Shell International Finance B.V. | | | | | |
2.750%, 04/06/2030 | | | 1,000,000 | | | | 969,993 | |
Equinor ASA | | | | | | | | |
2.375%, 05/22/2030 | | | 500,000 | | | | 471,936 | |
| | | | | | | | |
| | | | | | | 13,141,056 | |
| | | | | | | | |
Oil & Gas Services & Equipment (0.12%) | | | | | |
Schlumberger Investment S.A. | | | | | |
3.650%, 12/01/2023 | | | 1,000,000 | | | | 1,016,148 | |
Baker Hughes Holdings LLC/Baker Hughes Co-Obligor, Inc. | | | | | |
3.337%, 12/15/2027 | | | 1,000,000 | | | | 994,151 | |
Schlumberger Investment S.A. | | | | | |
2.650%, 06/26/2030 | | | 1,000,000 | | | | 946,844 | |
| | | | | | | | |
| | | | | | | 2,957,143 | |
| | | | | | | | |
Retail - Consumer Staples (0.23%) | | | | | |
Walmart, Inc. | | | | | | | | |
2.550%, 04/11/2023 | | | 1,000,000 | | | | 1,005,990 | |
3.300%, 04/22/2024 | | | 500,000 | | | | 508,415 | |
| | | | | | | | |
| | | Principal
amount | | | Value | |
Corporate Bonds (Cont.) | | | | | | | | |
Retail - Consumer Staples (Cont.) | | | | | |
Costco Wholesale Corp. | | | | | | | | |
2.750%, 05/18/2024 | | $ | 1,000,000 | | | $ | 1,007,138 | |
Target Corp. | | | | | | | | |
3.500%, 07/01/2024 | | | 1,000,000 | | | | 1,022,350 | |
2.500%, 04/15/2026 | | | 1,000,000 | | | | 993,765 | |
Costco Wholesale Corp. | | | | | | | | |
3.000%, 05/18/2027 | | | 1,000,000 | | | | 1,006,109 | |
| | | | | | | | |
| | | | | | | 5,543,767 | |
| | | | | | | | |
Retail - Discretionary (0.21%) | | | | | | | | |
Home Depot (The), Inc. | | | | | | | | |
3.350%, 09/15/2025 | | | 1,000,000 | | | | 1,016,833 | |
Lowe’s Cos., Inc. | | | | | | | | |
3.375%, 09/15/2025 | | | 1,000,000 | | | | 1,009,924 | |
Home Depot (The), Inc. | | | | | | | | |
3.000%, 04/01/2026 | | | 1,000,000 | | | | 1,007,991 | |
Lowe’s Cos., Inc. | | | | | | | | |
2.500%, 04/15/2026 | | | 1,000,000 | | | | 975,023 | |
TJX (The) Cos., Inc. | | | | | | | | |
2.250%, 09/15/2026 | | | 1,000,000 | | | | 971,385 | |
| | | | | | | | |
| | | | | | | 4,981,156 | |
| | | | | | | | |
Semiconductors (0.27%) | | | | | | | | |
Texas Instruments, Inc. | | | | | | | | |
2.250%, 05/01/2023 | | | 3,000,000 | | | | 3,001,316 | |
Intel Corp. | | | | | | | | |
3.700%, 07/29/2025 | | | 1,000,000 | | | | 1,024,183 | |
2.600%, 05/19/2026 | | | 1,000,000 | | | | 991,844 | |
QUALCOMM, Inc. | | | | | | | | |
3.250%, 05/20/2027 | | | 1,000,000 | | | | 1,012,961 | |
Texas Instruments, Inc. | | | | | | | | |
2.900%, 11/03/2027 | | | 500,000 | | | | 501,415 | |
| | | | | | | | |
| | | | | | | 6,531,719 | |
| | | | | | | | |
Software (0.12%) | | | | | | | | |
Oracle Corp. | | | | | | | | |
2.650%, 07/15/2026 | | | 1,000,000 | | | | 958,891 | |
Microsoft Corp. | | | | | | | | |
2.400%, 08/08/2026 | | | 500,000 | | | | 495,815 | |
3.300%, 02/06/2027 | | | 500,000 | | | | 512,882 | |
Oracle Corp. | | | | | | | | |
3.250%, 11/15/2027 | | | 1,000,000 | | | | 971,140 | |
| | | | | | | | |
| | | | | | | 2,938,728 | |
| | | | | | | | |
Technology Hardware (0.17%) | | | | | |
Apple, Inc. | | | | | | | | |
3.000%, 02/09/2024 | | | 2,000,000 | | | | 2,024,250 | |
Cisco Systems, Inc. | | | | | | | | |
3.625%, 03/04/2024 | | | 1,000,000 | | | | 1,023,478 | |
3.500%, 06/15/2025 | | | 500,000 | | | | 511,203 | |
2.950%, 02/28/2026 | | | 500,000 | | | | 503,753 | |
| | | | | | | | |
| | | | | | | 4,062,684 | |
| | | | | | | | |
| | |
| See accompanying notes to financial statements. | | 11 |
ADVISERS INVESTMENT TRUST
STATE FARM BALANCED FUND
SCHEDULE OF INVESTMENTS (continued)
March 31, 2022 (Unaudited)
| | | | | | | | |
| | | Principal
amount | | | Value | |
Corporate Bonds (Cont.) | | | | | | | | |
Technology Services (0.30%) | | | | | |
Automatic Data Processing, Inc. | | | | | |
3.375%, 09/15/2025 | | $ | 1,000,000 | | | $ | 1,021,633 | |
Visa, Inc. | | | | | | | | |
3.150%, 12/14/2025 | | | 1,000,000 | | | | 1,011,492 | |
Mastercard, Inc. | | | | | | | | |
2.950%, 11/21/2026 | | | 500,000 | | | | 503,328 | |
RELX Capital, Inc. | | | | | | | | |
4.000%, 03/18/2029 | | | 1,000,000 | | | | 1,025,744 | |
S&P Global, Inc. | | | | | | | | |
2.500%, 12/01/2029 | | | 1,000,000 | | | | 947,726 | |
International Business Machines Corp. | | | | | |
1.950%, 05/15/2030 | | | 600,000 | | | | 545,910 | |
RELX Capital, Inc. | | | | | | | | |
3.000%, 05/22/2030 | | | 500,000 | | | | 477,717 | |
S&P Global, Inc. | | | | | | | | |
1.250%, 08/15/2030 | | | 1,000,000 | | | | 861,572 | |
Visa, Inc. | | | | | | | | |
1.100%, 02/15/2031 | | | 1,000,000 | | | | 857,731 | |
| | | | | | | | |
| | | | | | | 7,252,853 | |
| | | | | | | | |
Telecommunications (0.23%) | | | | | |
AT&T, Inc. | | | | | | | | |
1.650%, 02/01/2028 | | | 2,000,000 | | | | 1,822,216 | |
Vodafone Group PLC | | | | | | | | |
4.375%, 05/30/2028 | | | 1,000,000 | | | | 1,045,746 | |
Verizon Communications, Inc. | | | | | |
4.329%, 09/21/2028 | | | 1,012,000 | | | | 1,067,533 | |
3.875%, 02/08/2029 | | | 1,000,000 | | | | 1,040,340 | |
AT&T, Inc. | | | | | | | | |
4.350%, 03/01/2029 | | | 500,000 | | | | 529,109 | |
| | | | | | | | |
| | | | | | | 5,504,944 | |
| | | | | | | | |
Transportation & Logistics (0.55%) | | | | | |
Union Pacific Corp. | | | | | | | | |
2.750%, 04/15/2023 | | | 500,000 | | | | 502,477 | |
Norfolk Southern Corp. | | | | | | | | |
3.850%, 01/15/2024 | | | 1,000,000 | | | | 1,015,893 | |
Burlington Northern Santa Fe LLC | | | | | |
3.750%, 04/01/2024 | | | 1,000,000 | | | | 1,018,247 | |
Union Pacific Corp. | | | | | | | | |
3.250%, 08/15/2025 | | | 500,000 | | | | 502,319 | |
Canadian National Railway Co. | | | | | |
2.750%, 03/01/2026 | | | 2,000,000 | | | | 1,981,165 | |
Union Pacific Corp. | | | | | | | | |
2.750%, 03/01/2026 | | | 1,000,000 | | | | 993,592 | |
Norfolk Southern Corp. | | | | | | | | |
2.900%, 06/15/2026 | | | 500,000 | | | | 493,795 | |
United Parcel Service, Inc. | | | | | | | | |
2.400%, 11/15/2026 | | | 500,000 | | | | 488,059 | |
Union Pacific Corp. | | | | | | | | |
3.000%, 04/15/2027 | | | 1,000,000 | | | | 1,005,183 | |
Norfolk Southern Corp. | | | | | | | | |
3.150%, 06/01/2027 | | | 500,000 | | | | 496,263 | |
| | | | | | | | |
| | | Principal
amount | | | Value | |
Corporate Bonds (Cont.) | | | | | |
Transportation & Logistics (Cont.) | | | | | |
United Parcel Service, Inc. | | | | | | | | |
3.050%, 11/15/2027 | | $ | 2,000,000 | | | $ | 2,018,699 | |
Union Pacific Corp. | | | | | | | | |
3.950%, 09/10/2028 | | | 1,000,000 | | | | 1,049,231 | |
3.700%, 03/01/2029 | | | 500,000 | | | | 514,397 | |
United Parcel Service, Inc. | | | | | | | | |
2.500%, 09/01/2029 | | | 1,000,000 | | | | 961,764 | |
| | | | | | | | |
| | | | | | | 13,041,084 | |
| | | | | | | | |
Wholesale - Consumer Staples (0.06%) | | | | | |
Sysco Corp. | | | | | | | | |
3.300%, 07/15/2026 | | | 1,000,000 | | | | 1,004,452 | |
3.250%, 07/15/2027 | | | 500,000 | | | | 497,291 | |
| | | | | | | | |
| | | | | | | 1,501,743 | |
| | | | | | | | |
Total Corporate Bonds (cost $266,948,355) | | | | | | | 264,547,260 | |
| | | | | | | | |
Foreign Government Bonds (0.08%) | | | | | |
Province of Quebec Canada | | | | | |
2.500%, 04/20/2026 | | | 1,000,000 | | | | 990,112 | |
Province of Ontario Canada | | | | | |
2.500%, 04/27/2026 | | | 1,000,000 | | | | 992,766 | |
| | | | | | | | |
Total Foreign Government Bonds (cost $1,997,082) | | | | 1,982,878 | |
| | | | | | | | |
Agency Securities (c) (0.64%) | | | | | |
Federal Farm Credit Banks | | | | | | | | |
1.990%, 03/17/2031 | | | 500,000 | | | | 461,011 | |
1.125%, 01/06/2025 | | | 2,000,000 | | | | 1,927,679 | |
| | |
Federal Home Loan Banks | | | | | | | | |
2.875%, 09/13/2024 | | | 5,000,000 | | | | 5,047,751 | |
1.000%, 06/26/2026 | | | 3,000,000 | | | | 2,817,473 | |
0.400%, 06/28/2024 | | | 255,000 | | | | 243,584 | |
| |
Federal National Mortgage Association | | | | | |
0.250%, 05/22/2023 | | | 3,000,000 | | | | 2,942,557 | |
0.250%, 07/10/2023 | | | 526,000 | | | | 513,932 | |
0.875%, 08/05/2030 | | | 1,500,000 | | | | 1,309,775 | |
| | | | | | | | |
Total Agency Securities (cost $15,993,967) | | | | | | | 15,263,762 | |
| | | | | | | | |
U.S. Treasury Obligations (15.58%) | | | | | |
U.S. Treasury Bill | | | | | | | | |
0.310%, 06/30/2022(d),(e) | | | 1,010,000 | | | | 1,008,709 | |
| | |
U.S. Treasury Notes | | | | | | | | |
0.250%, 04/15/2023 | | | 5,000,000 | | | | 4,923,242 | |
0.125%, 04/30/2023 | | | 5,000,000 | | | | 4,911,719 | |
0.125%, 05/15/2023 | | | 5,000,000 | | | | 4,904,883 | |
0.125%, 05/31/2023 | | | 5,000,000 | | | | 4,897,852 | |
0.125%, 06/30/2023 | | | 5,000,000 | | | | 4,887,305 | |
0.125%, 07/31/2023 | | | 5,000,000 | | | | 4,874,023 | |
2.500%, 08/15/2023 | | | 3,000,000 | | | | 3,017,227 | |
| | |
| 12 | | See accompanying notes to financial statements. |
ADVISERS INVESTMENT TRUST
STATE FARM BALANCED FUND
SCHEDULE OF INVESTMENTS (continued)
March 31, 2022 (Unaudited)
| | | | | | | | |
| | | Principal
amount | | | Value | |
U.S. Treasury Obligations (Cont.) | | | | | |
U.S. Treasury Notes (Cont.) | | | | | |
0.125%, 08/31/2023 | | $ | 5,000,000 | | | $ | 4,864,453 | |
0.125%, 09/15/2023 | | | 5,000,000 | | | | 4,858,008 | |
0.125%, 10/15/2023 | | | 5,000,000 | | | | 4,845,898 | |
0.375%, 10/31/2023 | | | 5,000,000 | | | | 4,859,766 | |
2.750%, 11/15/2023 | | | 10,000,000 | | | | 10,083,594 | |
0.125%, 12/15/2023 | | | 5,000,000 | | | | 4,823,437 | |
0.125%, 01/15/2024 | | | 5,000,000 | | | | 4,811,133 | |
0.875%, 01/31/2024 | | | 3,000,000 | | | | 2,923,594 | |
0.125%, 02/15/2024 | | | 5,000,000 | | | | 4,801,367 | |
1.500%, 02/29/2024 | | | 3,000,000 | | | | 2,956,289 | |
0.250%, 03/15/2024 | | | 5,000,000 | | | | 4,803,125 | |
2.250%, 03/31/2024 | | | 4,000,000 | | | | 3,994,531 | |
0.375%, 04/15/2024 | | | 5,000,000 | | | | 4,802,734 | |
2.500%, 05/15/2024 | | | 5,000,000 | | | | 5,010,351 | |
0.250%, 05/15/2024 | | | 5,000,000 | | | | 4,779,102 | |
2.000%, 06/30/2024 | | | 5,000,000 | | | | 4,954,102 | |
0.375%, 07/15/2024 | | | 5,000,000 | | | | 4,772,266 | |
2.375%, 08/15/2024 | | | 5,000,000 | | | | 4,988,476 | |
0.375%, 08/15/2024 | | | 5,000,000 | | | | 4,761,719 | |
0.375%, 09/15/2024 | | | 3,000,000 | | | | 2,850,117 | |
0.625%, 10/15/2024 | | | 5,000,000 | | | | 4,772,852 | |
1.500%, 10/31/2024 | | | 5,000,000 | | | | 4,878,125 | |
2.250%, 11/15/2024 | | | 5,000,000 | | | | 4,968,945 | |
0.750%, 11/15/2024 | | | 3,000,000 | | | | 2,867,461 | |
1.000%, 12/15/2024 | | | 3,000,000 | | | | 2,883,047 | |
1.125%, 01/15/2025 | | | 4,000,000 | | | | 3,851,562 | |
2.000%, 02/15/2025 | | | 15,000,000 | | | | 14,789,062 | |
1.500%, 02/15/2025 | | | 2,500,000 | | | | 2,429,883 | |
1.750%, 03/15/2025 | | | 5,000,000 | | | | 4,894,141 | |
0.500%, 03/31/2025 | | | 5,000,000 | | | | 4,710,352 | |
0.375%, 04/30/2025 | | | 5,000,000 | | | | 4,681,836 | |
0.250%, 05/31/2025 | | | 5,000,000 | | | | 4,653,516 | |
0.250%, 06/30/2025 | | | 5,000,000 | | | | 4,645,117 | |
0.250%, 07/31/2025 | | | 5,068,600 | | | | 4,699,147 | |
2.000%, 08/15/2025 | | | 5,000,000 | | | | 4,911,523 | |
0.250%, 08/31/2025 | | | 5,000,000 | | | | 4,626,172 | |
0.250%, 09/30/2025 | | | 5,000,000 | | | | 4,618,750 | |
0.250%, 10/31/2025 | | | 5,000,000 | | | | 4,609,961 | |
0.375%, 11/30/2025 | | | 5,000,000 | | | | 4,622,656 | |
0.375%, 01/31/2026 | | | 5,000,000 | | | | 4,606,836 | |
0.750%, 08/31/2026 | | | 2,000,000 | | | | 1,853,672 | |
0.875%, 09/30/2026 | | | 5,000,000 | | | | 4,654,100 | |
1.250%, 11/30/2026 | | | 5,000,000 | | | | 4,730,664 | |
1.250%, 12/31/2026 | | | 2,000,000 | | | | 1,889,609 | |
1.500%, 01/31/2027 | | | 3,000,000 | | | | 2,866,875 | |
2.250%, 02/15/2027 | | | 5,000,000 | | | | 4,947,656 | |
1.875%, 02/28/2027 | | | 2,000,000 | | | | 1,946,406 | |
2.500%, 03/31/2027 | | | 5,000,000 | | | | 5,010,937 | |
0.375%, 07/31/2027 | | | 5,000,000 | | | | 4,483,008 | |
2.750%, 02/15/2028 | | | 10,000,000 | | | | 10,154,687 | |
2.375%, 05/15/2029 | | | 28,000,000 | | | | 27,919,063 | |
1.625%, 08/15/2029 | | | 18,000,000 | | | | 17,069,766 | |
1.500%, 02/15/2030 | | | 26,000,000 | | | | 24,375,000 | |
0.875%, 11/15/2030 | | | 3,000,000 | | | | 2,656,523 | |
1.125%, 02/15/2031 | | | 10,000,000 | | | | 9,029,297 | |
1.625%, 05/15/2031 | | | 6,000,000 | | | | 5,648,906 | |
| | | | | | | | |
| | | Principal
amount | | | Value | |
U.S. Treasury Obligations (Cont.) | | | | | |
U.S. Treasury Notes (Cont.) | | | | | |
1.250%, 08/15/2031 | | $ | 6,250,000 | | | $ | 5,681,641 | |
1.375%, 11/15/2031 | | | 6,000,000 | | | | 5,505,000 | |
1.875%, 02/15/2032 | | | 6,500,000 | | | | 6,242,031 | |
| | | | | | | | |
Total U.S. Treasury Obligations (cost $388,774,227) | | | | 373,354,807 | |
| | | | | | | | |
| | |
| | | Shares | | | Value | |
Short-term Investments (1.18%) | | | | | |
Northern Institutional Treasury Portfolio (Premier Class), 0.12%(f) | | | 28,279,490 | | | | 28,279,490 | |
| | | | | | | | |
Total Short-term Investments (cost $28,279,490) | | | | 28,279,490 | |
| | | | | | | | |
TOTAL INVESTMENTS (100.17%) (cost $1,131,957,573) | | | | 2,400,017,327 | |
| |
OTHER LIABILITIES, NET OF ASSETS ((0.17)%) | | | | (4,127,757) | |
| | | | | | | | |
NET ASSETS (100.00%) | | | | | | $ | 2,395,889,570 | |
| | | | | | | | |
| (a) | Non-income producing security. |
| (b) | Floating rate security. The rate presented is the rate in effect at March 31, 2022, and the related index and spread are shown parenthetically for each security. |
| (c) | The obligations of these U.S. Government-sponsored entities are neither issued nor guaranteed by the United States Treasury. On September 6, 2008, the Federal Housing Finance Agency placed the Federal National Mortgage Association (“Fannie Mae”) and the Federal Home Loan Mortgage Corp. (“Freddie Mac”) into conservatorship. The United States Treasury has put in place a set of financing agreements to help ensure that these entities continue to meet their obligations to holders of bonds they have issued or guaranteed. |
| (d) | Security pledged related to the Fund’s investments in futures contracts during the period. As of March 31, 2022, the Fund did not hold any open futures contracts. |
| (e) | Discount rate at the time of purchase. |
| (f) | Rate shown is the 7-day yield as of March 31, 2022. |
ADR – American Depositary Receipt
PLC – Public Limited Company
LLC – Limited Liability Company
ASA – Aksjeselskap (Norway: usb Stock Company)
| | |
| See accompanying notes to financial statements. | | 13 |
ADVISERS INVESTMENT TRUST
STATE FARM INTERIM FUND
SCHEDULE OF INVESTMENTS
March 31, 2022 (Unaudited)
| | | | | | | | |
| | | Principal
amount | | | Value | |
U.S. Treasury Obligations (99.44%) | | | | | |
U.S. Treasury Notes | | | | | | | | |
0.250%, 04/15/2023 | | $ | 3,000,000 | | | $ | 2,953,945 | |
0.125%, 04/30/2023 | | | 4,493,000 | | | | 4,413,671 | |
1.625%, 04/30/2023 | | | 3,000,000 | | | | 2,994,609 | |
0.125%, 05/15/2023 | | | 4,000,000 | | | | 3,923,906 | |
1.625%, 05/31/2023 | | | 3,190,000 | | | | 3,179,782 | |
0.250%, 06/15/2023 | | | 3,000,000 | | | | 2,941,406 | |
0.125%, 06/30/2023 | | | 4,978,000 | | | | 4,865,801 | |
1.375%, 06/30/2023 | | | 4,595,000 | | | | 4,561,973 | |
0.125%, 07/15/2023 | | | 4,500,000 | | | | 4,392,246 | |
0.125%, 07/31/2023 | | | 5,500,000 | | | | 5,361,426 | |
1.250%, 07/31/2023 | | | 3,250,000 | | | | 3,216,357 | |
2.500%, 08/15/2023 | | | 5,000,000 | | | | 5,028,711 | |
0.125%, 08/15/2023 | | | 3,100,000 | | | | 3,018,504 | |
0.125%, 08/31/2023 | | | 4,978,000 | | | | 4,843,050 | |
1.375%, 08/31/2023 | | | 4,500,000 | | | | 4,455,352 | |
0.125%, 09/15/2023 | | | 3,000,000 | | | | 2,914,805 | |
1.375%, 09/30/2023 | | | 5,000,000 | | | | 4,944,727 | |
0.250%, 09/30/2023 | | | 4,907,000 | | | | 4,770,716 | |
0.125%, 10/15/2023 | | | 5,000,000 | | | | 4,845,898 | |
0.375%, 10/31/2023 | | | 4,900,000 | | | | 4,762,570 | |
1.625%, 10/31/2023 | | | 3,500,000 | | | | 3,470,605 | |
2.875%, 10/31/2023 | | | 2,000,000 | | | | 2,021,328 | |
0.250%, 11/15/2023 | | | 6,000,000 | | | | 5,813,906 | |
0.500%, 11/30/2023 | | | 4,583,000 | | | | 4,454,640 | |
2.125%, 11/30/2023 | | | 3,866,000 | | | | 3,860,563 | |
0.125%, 12/15/2023 | | | 3,390,000 | | | | 3,270,291 | |
2.250%, 12/31/2023 | | | 1,757,000 | | | | 1,756,725 | |
0.125%, 01/15/2024 | | | 3,935,000 | | | | 3,786,362 | |
2.250%, 01/31/2024 | | | 4,201,000 | | | | 4,196,569 | |
0.875%, 01/31/2024 | | | 4,084,000 | | | | 3,979,986 | |
2.750%, 02/15/2024 | | | 5,000,000 | | | | 5,038,281 | |
0.125%, 02/15/2024 | | | 4,812,000 | | | | 4,620,836 | |
2.125%, 02/29/2024 | | | 2,681,000 | | | | 2,671,365 | |
0.250%, 03/15/2024 | | | 2,440,000 | | | | 2,343,925 | |
2.125%, 03/31/2024 | | | 3,000,000 | | | | 2,987,461 | |
2.000%, 04/30/2024 | | | 4,300,000 | | | | 4,267,078 | |
0.250%, 05/15/2024 | | | 6,000,000 | | | | 5,734,922 | |
2.500%, 05/15/2024 | | | 4,513,000 | | | | 4,522,343 | |
2.000%, 06/30/2024 | | | 2,500,000 | | | | 2,477,051 | |
1.750%, 06/30/2024 | | | 2,000,000 | | | | 1,971,094 | |
0.375%, 07/15/2024 | | | 5,000,000 | | | | 4,772,266 | |
1.750%, 07/31/2024 | | | 4,000,000 | | | | 3,937,500 | |
2.375%, 08/15/2024 | | | 7,000,000 | | | | 6,983,867 | |
0.375%, 08/15/2024 | | | 6,875,000 | | | | 6,547,363 | |
1.250%, 08/31/2024 | | | 5,000,000 | | | | 4,858,398 | |
1.500%, 09/30/2024 | | | 5,000,000 | | | | 4,882,227 | |
0.625%, 10/15/2024 | | | 5,908,000 | | | | 5,639,601 | |
1.500%, 10/31/2024 | | | 3,500,000 | | | | 3,414,688 | |
2.250%, 10/31/2024 | | | 2,500,000 | | | | 2,484,961 | |
2.250%, 11/15/2024 | | | 5,410,000 | | | | 5,376,399 | |
0.750%, 11/15/2024 | | | 4,425,000 | | | | 4,229,505 | |
1.500%, 11/30/2024 | | | 3,000,000 | | | | 2,922,422 | |
2.125%, 11/30/2024 | | | 1,000,000 | | | | 990,234 | |
1.000%, 12/15/2024 | | | 4,100,000 | | | | 3,940,164 | |
2.250%, 12/31/2024 | | | 3,022,000 | | | | 3,001,460 | |
1.750%, 12/31/2024 | | | 2,000,000 | | | | 1,959,844 | |
| | | | | | | | |
| | | Principal
amount | | | Value | |
U.S. Treasury Obligations (Cont.) | | | | | |
U.S. Treasury Notes (Cont.) | | | | | | | | |
1.125%, 01/15/2025 | | $ | 3,707,000 | | | $ | 3,569,436 | |
1.375%, 01/31/2025 | | | 4,165,000 | | | | 4,036,796 | |
2.000%, 02/15/2025 | | | 5,592,000 | | | | 5,513,363 | |
1.500%, 02/15/2025 | | | 3,735,000 | | | | 3,630,245 | |
1.125%, 02/28/2025 | | | 2,395,000 | | | | 2,302,287 | |
1.750%, 03/15/2025 | | | 3,502,000 | | | | 3,427,856 | |
0.500%, 03/31/2025 | | | 2,000,000 | | | | 1,884,141 | |
2.125%, 05/15/2025 | | | 6,657,000 | | | | 6,575,868 | |
2.750%, 06/30/2025 | | | 3,000,000 | | | | 3,019,922 | |
2.000%, 08/15/2025 | | | 11,390,000 | | | | 11,188,450 | |
0.250%, 09/30/2025 | | | 4,500,000 | | | | 4,156,875 | |
2.250%, 11/15/2025 | | | 10,500,000 | | | | 10,392,949 | |
2.625%, 12/31/2025 | | | 10,000,000 | | | | 10,035,547 | |
2.625%, 01/31/2026 | | | 7,000,000 | | | | 7,026,523 | |
1.625%, 02/15/2026 | | | 6,000,000 | | | | 5,799,844 | |
0.500%, 02/28/2026 | | | 700,000 | | | | 647,172 | |
2.250%, 03/31/2026 | | | 5,000,000 | | | | 4,947,461 | |
2.375%, 04/30/2026 | | | 1,000,000 | | | | 994,180 | |
1.625%, 05/15/2026 | | | 9,000,000 | | | | 8,683,945 | |
1.875%, 06/30/2026 | | | 5,500,000 | | | | 5,360,781 | |
1.875%, 07/31/2026 | | | 6,338,000 | | | | 6,175,589 | |
0.750%, 08/31/2026 | | | 9,212,000 | | | | 8,538,013 | |
1.375%, 08/31/2026 | | | 4,000,000 | | | | 3,812,500 | |
1.625%, 09/30/2026 | | | 5,511,000 | | | | 5,306,275 | |
0.875%, 09/30/2026 | | | 3,500,000 | | | | 3,257,870 | |
1.125%, 10/31/2026 | | | 7,357,000 | | | | 6,920,178 | |
1.625%, 10/31/2026 | | | 4,275,000 | | | | 4,115,355 | |
1.250%, 11/30/2026 | | | 6,485,000 | | | | 6,135,671 | |
1.250%, 12/31/2026 | | | 5,580,000 | | | | 5,272,010 | |
1.500%, 01/31/2027 | | | 6,896,000 | | | | 6,589,990 | |
1.875%, 02/28/2027 | | | 8,222,000 | | | | 8,001,676 | |
2.500%, 03/31/2027 | | | 5,000,000 | | | | 5,010,938 | |
| | | | | | | | |
Total U.S. Treasury Obligations (cost $408,624,210) | | | | | | | 393,905,391 | |
| | | | | | | | |
| | |
| | | Shares | | | Value | |
Short-term Investments (0.04%) | | | | | | | | |
Northern Institutional Treasury Portfolio (Premier Class), 0.12%(a) | | | 174,620 | | | | 174,620 | |
| | | | | | | | |
Total Short-term Investments (cost $174,620) | | | | | | | 174,620 | |
| | | | | | | | |
TOTAL INVESTMENTS (99.48%) (cost $408,798,830) | | | | | | | 394,080,011 | |
OTHER ASSETS, NET OF LIABILITIES (0.52%) | | | | | | | 2,040,407 | |
| | | | | | | | |
NET ASSETS (100.00%) | | | | | | $ | 396,120,418 | |
| | | | | | | | |
| (a) | Rate shown is the 7-day yield as of March 31, 2022. |
| | |
| 14 | | See accompanying notes to financial statements. |
ADVISERS INVESTMENT TRUST
STATE FARM MUNICIPAL BOND FUND
SCHEDULE OF INVESTMENTS
March 31, 2022 (Unaudited)
| | | | | | | | | | | | | | | | |
| | | Coupon
rate | | | Maturity
date | | | Principal
amount | | | Value | |
Long-term Municipal Bond (96.13%) | | | | | | | | | | | | | | | | |
Alabama (1.46%) | | | | | | | | | | | | | | | | |
City of Athens, Alabama, Electric Revenue Warrants | | | 3.250% | | | | 06/01/2025 | | | $ | 600,000 | | | $ | 614,046 | |
City of Athens, Alabama, Electric Revenue Warrants | | | 3.500% | | | | 06/01/2026 | | | | 220,000 | | | | 226,599 | |
City of Athens, Alabama, Electric Revenue Warrants | | | 3.750% | | | | 06/01/2027 | | | | 645,000 | | | | 667,662 | |
City of Athens, Alabama, Water and Sewer Revenue Refunding Warrants | | | 3.000% | | | | 05/01/2028 | | | | 980,000 | | | | 1,010,432 | |
City of Athens, Alabama, Electric Revenue Warrants | | | 4.000% | | | | 06/01/2028 | | | | 665,000 | | | | 691,916 | |
Madison Water and Wastewater Board Revenue Refunding Bonds | | | 4.000% | | | | 12/01/2028 | | | | 2,165,000 | | | | 2,288,043 | |
City of Athens, Alabama, Water and Sewer Revenue Refunding Warrants | | | 3.130% | | | | 05/01/2029 | | | | 1,010,000 | | | | 1,041,265 | |
Madison Water and Wastewater Board Revenue Refunding Bonds | | | 4.000% | | | | 12/01/2035 | | | | 215,000 | | | | 233,878 | |
Madison Water and Wastewater Board Revenue Refunding Bonds | | | 4.000% | | | | 12/01/2036 | | | | 310,000 | | | | 336,890 | |
Mountain Brook Board of Education, General Obligation Bonds, Series A | | | 3.000% | | | | 03/01/2037 | | | | 505,000 | | | | 508,471 | |
Madison Water and Wastewater Board Revenue Refunding Bonds | | | 4.000% | | | | 12/01/2037 | | | | 270,000 | | | | 292,929 | |
Black Belt Energy Gas District Revenue Bonds, Gas Project No. 7-S(a),(b) | | | 4.000% | | | | 10/01/2052 | | | | 1,500,000 | | | | 1,562,880 | |
| | | | | | | | | | | | | | | | |
| | | | | | | | | | | | | | | 9,475,011 | |
| | | | | | | | | | | | | | | | |
| | | | |
Alaska (1.75%) | | | | | | | | | | | | | | | | |
Municipality of Anchorage, Alaska, General Obligation Bonds, Series A | | | 3.250% | | | | 09/01/2028 | | | | 1,095,000 | | | | 1,144,665 | |
Municipality of Anchorage, Alaska, General Obligation Bonds, Series B | | | 3.250% | | | | 09/01/2028 | | | | 1,050,000 | | | | 1,097,624 | |
Municipality of Anchorage, Alaska, General Obligation Bonds, Series A | | | 3.500% | | | | 09/01/2029 | | | | 1,390,000 | | | | 1,464,271 | |
Municipality of Anchorage, Alaska, General Obligation Bonds, Series B | | | 3.500% | | | | 09/01/2029 | | | | 1,090,000 | | | | 1,148,242 | |
Municipality of Anchorage, Alaska, General Obligation Bonds, Series A | | | 3.500% | | | | 09/01/2030 | | | | 1,440,000 | | | | 1,513,712 | |
Municipality of Anchorage, Alaska, General Obligation Bonds, Series B | | | 3.500% | | | | 09/01/2030 | | | | 1,125,000 | | | | 1,182,588 | |
Borough of Matanuska-Susitna, Alaska, General Obligation Bonds, Series A | | | 5.000% | | | | 08/01/2031 | | | | 1,225,000 | | | | 1,275,137 | |
Alaska Housing Finance Corporation Revenue Bonds, Series B-2 | | | 5.000% | | | | 12/01/2032 | | | | 1,000,000 | | | | 1,174,817 | |
Municipality of Anchorage, Alaska, General Obligation Bonds, Series C | | | 4.000% | | | | 09/01/2036 | | | | 1,190,000 | | | | 1,317,497 | |
| | | | | | | | | | | | | | | | |
| | | | | | | | | | | | | | | 11,318,553 | |
| | | | | | | | | | | | | | | | |
| | | | |
Arizona (1.66%) | | | | | | | | | | | | | | | | |
Pima County Unified School District No. 1 Tucson, General Obligation Refunding Bonds | | | 5.000% | | | | 07/01/2022 | | | | 1,000,000 | | | | 1,009,414 | |
County of Pima, Arizona, Sewer System Revenue Bonds, Series A (Prerefunded to 07-01-2022 @ 100)(c) | | | 5.000% | | | | 07/01/2023 | | | | 1,060,000 | | | | 1,070,161 | |
Maricopa County Elementary School District No. 79 Litchfield Elementary, General Obligation Bonds, Project of 2009, Series A | | | 5.000% | | | | 07/01/2023 | | | | 1,000,000 | | | | 1,008,026 | |
Maricopa County Unified School District No. 69 Paradise Valley, General Obligation Bonds, Project of 2009, Series A | | | 3.000% | | | | 07/01/2023 | | | | 1,255,000 | | | | 1,276,272 | |
Maricopa County Union High School District No. 210 Phoenix, General Obligation Bonds, Series A | | | 4.000% | | | | 07/01/2024 | | | | 1,165,000 | | | | 1,172,967 | |
County of Pima, Arizona, General Obligation Bonds, Series A | | | 4.000% | | | | 07/01/2026 | | | | 2,000,000 | | | | 2,013,530 | |
Pima County Unified School District No. 10 Amphitheater, Arizona, General Obligation Bonds, Project of 2007, Series D | | | 5.000% | | | | 07/01/2026 | | | | 555,000 | | | | 577,153 | |
Maricopa County Unified School District No. 93 Cave Creek, Arizona, General Obligation Bonds, Project of 2014, Series A | | | 4.000% | | | | 07/01/2027 | | | | 1,100,000 | | | | 1,164,199 | |
Pima County Unified School District No. 10 Amphitheater, Arizona, General Obligation Bonds, Project of 2007, Series D | | | 5.000% | | | | 07/01/2027 | | | | 400,000 | | | | 415,363 | |
Maricopa County Union High School District No. 213 Tempe, General Obligation Refunding Bonds | | | 3.000% | | | | 07/01/2028 | | | | 1,000,000 | | | | 1,027,859 | |
| | | | | | | | | | | | | | | | |
| | | | | | | | | | | | | | | 10,734,944 | |
| | | | | | | | | | | | | | | | |
| | | | |
Arkansas (2.32%) | | | | | | | | | | | | | | | | |
University of Arkansas Revenue Refunding Bonds | | | 3.000% | | | | 11/01/2024 | | | | 2,315,000 | | | | 2,375,090 | |
City of Little Rock, Arkansas, General Obligation Refunding Bonds | | | 2.750% | | | | 03/01/2025 | | | | 185,000 | | | | 185,083 | |
State of Arkansas, General Obligation Refunding Bonds | | | 4.000% | | | | 06/01/2027 | | | | 3,000,000 | | | | 3,127,740 | |
University of Arkansas Revenue Bonds (Prerefunded to 11-01-2024 @ 100)(c) | | | 5.000% | | | | 11/01/2028 | | | | 365,000 | | | | 392,716 | |
Rogers School District No. 30, General Obligation Refunding Bonds | | | 3.130% | | | | 02/01/2030 | | | | 2,880,000 | | | | 2,885,640 | |
| | |
| See accompanying notes to financial statements. | | 15 |
ADVISERS INVESTMENT TRUST
STATE FARM MUNICIPAL BOND FUND
SCHEDULE OF INVESTMENTS (continued)
March 31, 2022 (Unaudited)
| | | | | | | | | | | | | | | | |
| | | Coupon
rate | | | Maturity
date | | | Principal
amount | | | Value | |
Long-term Municipal Bond (Cont.) | | | | | | | | | | | | | | | | |
Arkansas (Cont.) | | | | | | | | | | | | | | | | |
University of Arkansas Revenue Bonds (Prerefunded to 11-01-2024 @ 100)(c) | | | 5.000% | | | | 11/01/2030 | | | $ | 785,000 | | | $ | 844,608 | |
Rogers School District No. 30, General Obligation Refunding Bonds | | | 3.000% | | | | 02/01/2033 | | | | 5,115,000 | | | | 5,196,189 | |
| | | | | | | | | | | | | | | | |
| | | | | | | | | | | | | | | 15,007,066 | |
| | | | | | | | | | | | | | | | |
| | | | |
California (5.94%) | | | | | | | | | | | | | | | | |
Atascadero Unified School District, General Obligation Bonds, Election of 2010, Series B | | | 5.000% | | | | 08/01/2025 | | | | 225,000 | | | | 240,759 | |
Atascadero Unified School District, General Obligation Bonds, Election of 2010, Series B | | | 5.000% | | | | 08/01/2027 | | | | 1,080,000 | | | | 1,152,076 | |
East Side Union High School District, General Obligation Refunding Bonds | | | 3.500% | | | | 08/01/2027 | | | | 1,000,000 | | | | 1,047,695 | |
Newark Unified School District, General Obligation Bonds, Election of 2011, Series C | | | 3.000% | | | | 08/01/2028 | | | | 750,000 | | | | 774,272 | |
Santee School District, General Obligation Refunding Bonds | | | 3.500% | | | | 08/01/2028 | | | | 1,565,000 | | | | 1,629,301 | |
Campbell Union High School District, General Obligation Refunding Bonds | | | 3.250% | | | | 08/01/2029 | | | | 1,965,000 | | | | 2,029,749 | |
City of La Mesa, California, General Obligation Refunding Bonds | | | 3.500% | | | | 08/01/2029 | | | | 1,190,000 | | | | 1,247,645 | |
Santee School District, General Obligation Refunding Bonds | | | 3.500% | | | | 08/01/2029 | | | | 1,725,000 | | | | 1,789,965 | |
Sonoma County Junior College District, General Obligation Refunding Bonds | | | 3.250% | | | | 08/01/2029 | | | | 2,835,000 | | | | 2,943,327 | |
City of La Mesa, California, General Obligation Refunding Bonds | | | 4.000% | | | | 08/01/2030 | | | | 540,000 | | | | 578,974 | |
Marin Community College District, General Obligation Bonds, Election of 2016, Series A (Prerefunded to 08-01-2026 @ 100)(c) | | | 4.000% | | | | 08/01/2030 | | | | 1,095,000 | | | | 1,186,738 | |
Sonoma County Junior College District, General Obligation Bonds, Election of 2014, Series A | | | 4.000% | | | | 08/01/2030 | | | | 1,600,000 | | | | 1,715,479 | |
Sequoia Union High School District, General Obligation Bonds, Election of 2014 | | | 3.000% | | | | 07/01/2031 | | | | 3,000,000 | | | | 3,081,201 | |
City of La Mesa, California, General Obligation Refunding Bonds | | | 4.000% | | | | 08/01/2031 | | | | 400,000 | | | | 428,528 | |
Redondo Beach Unified School District, General Obligation Refunding Bonds, Election of 2008, Series D | | | 3.000% | | | | 08/01/2031 | | | | 750,000 | | | | 772,070 | |
City of La Mesa, California, General Obligation Refunding Bonds | | | 4.000% | | | | 08/01/2032 | | | | 500,000 | | | | 535,234 | |
Redondo Beach Unified School District, General Obligation Refunding Bonds, Election of 2008, Series D | | | 3.000% | | | | 08/01/2032 | | | | 750,000 | | | | 771,180 | |
Tustin Unified School District, General Obligation Refunding Bonds | | | 4.000% | | | | 08/01/2032 | | | | 510,000 | | | | 551,097 | |
Antioch Unified School District, General Obligation Bonds, Election of 2008, Series E | | | 4.000% | | | | 08/01/2033 | | | | 385,000 | | | | 417,769 | |
Tustin Unified School District, General Obligation Refunding Bonds | | | 4.000% | | | | 08/01/2033 | | | | 550,000 | | | | 593,463 | |
Tustin Unified School District, General Obligation Refunding Bonds | | | 4.000% | | | | 08/01/2033 | | | | 600,000 | | | | 647,414 | |
Antioch Unified School District, General Obligation Bonds, Election of 2008, Series E | | | 3.000% | | | | 08/01/2034 | | | | 2,000,000 | | | | 2,032,035 | |
Central Unified School District, General Obligation Bonds, Election of 2016, Series C | | | 3.000% | | | | 08/01/2034 | | | | 380,000 | | | | 387,807 | |
Kentfield School District, General Obligation Bonds, Election of 2014, Series B | | | 5.000% | | | | 08/01/2034 | | | | 200,000 | | | | 217,792 | |
State of California, General Obligation Bonds | | | 5.000% | | | | 12/01/2034 | | | | 1,000,000 | | | | 1,195,434 | |
Los Angeles Unified School District, California, General Obligation Bonds | | | 5.000% | | | | 07/01/2035 | | | | 2,000,000 | | | | 2,430,559 | |
Antioch Unified School District, General Obligation Bonds, Election of 2008, Series E | | | 3.000% | | | | 08/01/2035 | | | | 1,150,000 | | | | 1,167,401 | |
Central Unified School District, General Obligation Bonds, Election of 2016, Series C | | | 3.000% | | | | 08/01/2035 | | | | 300,000 | | | | 304,702 | |
Gavilan Joint Community College District, General Obligation Bonds, Series B | | | 3.000% | | | | 08/01/2035 | | | | 1,000,000 | | | | 1,008,253 | |
Kentfield School District, General Obligation Bonds, Election of 2014, Series B | | | 5.000% | | | | 08/01/2035 | | | | 355,000 | | | | 385,985 | |
Antioch Unified School District, General Obligation Bonds, Election of 2008, Series E | | | 3.000% | | | | 08/01/2036 | | | | 600,000 | | | | 606,859 | |
Contra Costa Community College District, General Obligation Bonds, Election of 2014, Series C | | | 3.000% | | | | 08/01/2036 | | | | 1,875,000 | | | | 1,874,709 | |
Gavilan Joint Community College District, General Obligation Bonds, Series B | | | 3.000% | | | | 08/01/2036 | | | | 1,000,000 | | | | 999,845 | |
Kentfield School District, General Obligation Bonds, Election of 2014, Series B | | | 5.000% | | | | 08/01/2036 | | | | 400,000 | | | | 434,243 | |
Central Unified School District, General Obligation Bonds, Election of 2016, Series C | | | 3.000% | | | | 08/01/2037 | | | | 755,000 | | | | 744,767 | |
Kentfield School District, General Obligation Bonds, Election of 2014, Series B | | | 5.000% | | | | 08/01/2037 | | | | 500,000 | | | | 541,969 | |
| | | | | | | | | | | | | | | | |
| | | | | | | | | | | | | | | 38,466,296 | |
| | | | | | | | | | | | | | | | |
| | | | |
Colorado (3.19%) | | | | | | | | | | | | | | | | |
Arapahoe County School District No. 5 Cherry Creek, General Obligation Bonds, Series B | | | 3.000% | | | | 12/15/2023 | | | | 3,300,000 | | | | 3,328,733 | |
El Paso County School District No. 20 Academy, General Obligation Refunding Bonds | | | 4.000% | | | | 12/15/2025 | | | | 1,000,000 | | | | 1,053,345 | |
Garfield Pitkin & Eagle Counties School District No. RE-1 Roaring Fork, General Obligation Refunding Bonds, Series B | | | 2.500% | | | | 12/15/2027 | | | | 3,000,000 | | | | 3,035,027 | |
Eagle River Water and Sanitation District, General Obligation Bonds | | | 4.000% | | | | 12/01/2030 | | | | 465,000 | | | | 498,319 | |
Gunnison Watershed School District No. RE-1J, General Obligation Refunding Bonds, Series A (Prerefunded to 12-01-2024 @ 100)(c) | | | 4.000% | | | | 12/01/2031 | | | | 1,000,000 | | | | 1,053,731 | |
Parker Water & Sanitation District Revenue Refunding Bonds | | | 5.000% | | | | 11/01/2033 | | | | 515,000 | | | | 636,188 | |
| | |
| 16 | | See accompanying notes to financial statements. |
ADVISERS INVESTMENT TRUST
STATE FARM MUNICIPAL BOND FUND
SCHEDULE OF INVESTMENTS (continued)
March 31, 2022 (Unaudited)
| | | | | | | | | | | | | | |
| | | Coupon
rate | | Maturity
date | | | Principal
amount | | | Value | |
Long-term Municipal Bond (Cont.) | | | | | | | | | | | | | | |
Colorado (Cont.) | | | | | | | | | | | | | | |
Town of Estes Park Colorado Power & Communications Enterprise Revenue Refunding Bonds, Series A | | 4.000% | | | 11/01/2034 | | | $ | 1,805,000 | | | $ | 1,974,281 | |
Clear Creek School District No. RE-1, General Obligation Bonds | | 5.000% | | | 12/01/2034 | | | | 650,000 | | | | 790,036 | |
Ouray County School District No. R-2 Ridgway, General Obligation Bonds | | 5.000% | | | 12/01/2034 | | | | 545,000 | | | | 659,809 | |
Adams 12 Five Star Schools, General Obligation Refunding Bonds, Series B | | 5.000% | | | 12/15/2034 | | | | 2,500,000 | | | | 2,806,186 | |
Town of Estes Park Colorado Power & Communications Enterprise Revenue Refunding Bonds, Series A | | 4.000% | | | 11/01/2035 | | | | 980,000 | | | | 1,070,907 | |
Clear Creek School District No. RE-1, General Obligation Bonds | | 4.000% | | | 12/01/2035 | | | | 1,410,000 | | | | 1,581,237 | |
Town of Estes Park Colorado Power & Communications Enterprise Revenue Refunding Bonds, Series A | | 4.000% | | | 11/01/2036 | | | | 1,000,000 | | | | 1,091,721 | |
City of Westminster, Colorado Water and Wastewater Utility Enterprise Water and Wastewater Revenue Bonds, Series 2019 | | 4.000% | | | 12/01/2036 | | | | 1,000,000 | | | | 1,107,137 | |
| | | | | | | | | | | | | | |
| | | | | | | | | | | | | 20,686,657 | |
| | | | | | | | | | | | | | |
| | | | |
Connecticut (0.87%) | | | | | | | | | | | | | | |
Connecticut State Health & Educational Facilities Authority Revenue Refunding Bonds, Series A(b),(d) | | 2.000% | | | 07/01/2042 | | | | 5,700,000 | | | | 5,625,498 | |
| | | | | | | | | | | | | | |
| | | | |
Florida (3.79%) | | | | | | | | | | | | | | |
County of Lee County Water & Sewer Revenue Bonds, Series A (Prerefunded to 10-01-2023 @ 100)(c) | | 5.000% | | | 10/01/2026 | | | | 400,000 | | | | 419,234 | |
City of Pembroke Pines, Florida, General Obligation Refunding Bonds | | 5.000% | | | 09/01/2031 | | | | 2,100,000 | | | | 2,303,461 | |
Florida Municipal Loan Council Revenue Bonds, Series A | | 3.000% | | | 08/01/2032 | | | | 520,000 | | | | 523,797 | |
City of Miami Beach, Florida, Water & Sewer Revenue Refunding Bonds | | 4.000% | | | 09/01/2032 | | | | 540,000 | | | | 583,398 | |
County of Lee County Water & Sewer Revenue Bonds, Series A (Prerefunded to 10-01-2023 @ 100)(c) | | 5.000% | | | 10/01/2032 | | | | 750,000 | | | | 786,063 | |
Collier County Water-Sewer District Revenue Bonds | | 3.000% | | | 07/01/2033 | | | | 5,080,000 | | | | 5,198,667 | |
Florida Municipal Loan Council Revenue Bonds, Series A | | 3.250% | | | 08/01/2033 | | | | 535,000 | | | | 546,352 | |
City of Miami Beach, Florida, Water & Sewer Revenue Refunding Bonds | | 5.000% | | | 09/01/2033 | | | | 750,000 | | | | 855,035 | |
Florida Municipal Loan Council Revenue Bonds, Series A | | 4.000% | | | 08/01/2034 | | | | 555,000 | | | | 604,296 | |
City of Miami Beach, Florida, Water & Sewer Revenue Refunding Bonds | | 5.000% | | | 09/01/2034 | | | | 750,000 | | | | 854,625 | |
City of Tampa, Florida, Revenue Refunding Bonds | | 5.000% | | | 04/01/2035 | | | | 1,000,000 | | | | 1,143,223 | |
Florida Department of Management Services, Certificate of Participation | | 3.000% | | | 11/01/2035 | | | | 1,000,000 | | | | 1,004,914 | |
City of Tampa, Florida, Revenue Refunding Bonds | | 5.000% | | | 04/01/2036 | | | | 1,600,000 | | | | 1,827,617 | |
JEA Water & Sewer System Revenue Refunding Bonds, Series A | | 3.000% | | | 10/01/2036 | | | | 5,000,000 | | | | 4,939,808 | |
Broward County, Florida, Water & Sewer Utility Revenue Bonds, Series A | | 4.000% | | | 10/01/2038 | | | | 1,150,000 | | | | 1,271,028 | |
Broward County, Florida, Water & Sewer Utility Revenue Bonds, Series A | | 4.000% | | | 10/01/2039 | | | | 1,500,000 | | | | 1,653,671 | |
| | | | | | | | | | | | | | |
| | | | | | | | | | | | | 24,515,189 | |
| | | | | | | | | | | | | | |
| | | | |
Georgia (0.89%) | | | | | | | | | | | | | | |
Bartow County Development Authority Revenue Refunding Bonds(e) | | 1.800% | | | 09/01/2029 | | | | 1,000,000 | | | | 903,411 | |
Harris County School District, General Obligation Bonds | | 3.000% | | | 03/01/2035 | | | | 250,000 | | | | 251,191 | |
Forsyth County Water & Sewerage Authority Revenue Refunding Bonds | | 3.000% | | | 04/01/2035 | | | | 1,000,000 | | | | 1,010,509 | |
Classic Center Authority for Clarke County Revenue Bonds | | 4.000% | | | 05/01/2037 | | | | 400,000 | | | | 443,298 | |
Main Street Natural Gas Inc., Gas Supply Revenue Bonds, Series A(b),(f) | | 4.000% | | | 07/01/2052 | | | | 3,000,000 | | | | 3,178,273 | |
| | | | | | | | | | | | | | |
| | | | | | | | | | | | | 5,786,682 | |
| | | | | | | | | | | | | | |
| | | | |
Hawaii (0.09%) | | | | | | | | | | | | | | |
County of Hawaii, General Obligation Bonds, Series A (Prerefunded to 09-01-2022 @ 100)(c) | | 5.000% | | | 09/01/2031 | | | | 575,000 | | | | 584,131 | |
| | | | | | | | | | | | | | |
| | | | |
Idaho (1.19%) | | | | | | | | | | | | | | |
Nez Perce County Independent School District No 1., General Obligation Bonds | | 4.000% | | | 09/15/2031 | | | | 2,880,000 | | | | 3,107,618 | |
Boise State University Revenue Bonds, Series A | | 4.000% | | | 04/01/2032 | | | | 445,000 | | | | 482,388 | |
Idaho State University Revenue Bonds | | 4.000% | | | 04/01/2032 | | | | 265,000 | | | | 287,128 | |
Boise State University Revenue Refunding Bonds, Series A | | 3.000% | | | 04/01/2033 | | | | 545,000 | | | | 550,862 | |
Idaho State University Revenue Bonds | | 4.000% | | | 04/01/2033 | | | | 180,000 | | | | 194,716 | |
| | |
| See accompanying notes to financial statements. | | 17 |
ADVISERS INVESTMENT TRUST
STATE FARM MUNICIPAL BOND FUND
SCHEDULE OF INVESTMENTS (continued)
March 31, 2022 (Unaudited)
| | | | | | | | | | | | | | |
| | | Coupon
rate | | Maturity
date | | | Principal
amount | | | Value | |
Long-term Municipal Bond (Cont.) | | | | | | | | | | | | | | |
Idaho (Cont.) | | | | | | | | | | | | | | |
Idaho Health Facilities Authority Revenue Refunding Bonds | | 4.000% | | | 03/01/2034 | | | $ | 400,000 | | | $ | 432,802 | |
Boise State University Revenue Bonds, Series A | | 5.000% | | | 04/01/2034 | | | | 240,000 | | | | 274,678 | |
Boise State University Revenue Refunding Bonds, Series A | | 3.000% | | | 04/01/2034 | | | | 310,000 | | | | 312,932 | |
Idaho State University Revenue Bonds | | 4.000% | | | 04/01/2034 | | | | 255,000 | | | | 275,541 | |
Boise State University Revenue Bonds, Series A | | 5.000% | | | 04/01/2035 | | | | 250,000 | | | | 285,875 | |
Boise State University Revenue Refunding Bonds, Series A | | 3.000% | | | 04/01/2035 | | | | 300,000 | | | | 302,484 | |
Idaho State University Revenue Bonds | | 4.000% | | | 04/01/2035 | | | | 175,000 | | | | 188,329 | |
University of Idaho Revenue Refunding Bonds, Series A | | 5.000% | | | 04/01/2035 | | | | 420,000 | | | | 503,216 | |
Idaho State University Revenue Bonds | | 4.000% | | | 04/01/2036 | | | | 200,000 | | | | 215,067 | |
Boise State University Revenue Refunding Bonds, Series A | | 3.000% | | | 04/01/2037 | | | | 310,000 | | | | 311,940 | |
| | | | | | | | | | | | | | |
| | | | | | | | | | | | | 7,725,576 | |
| | | | | | | | | | | | | | |
| | | | |
Illinois (1.34%) | | | | | | | | | | | | | | |
DeWitt Ford & Livingston Etc. Counties Community College District No. 540 Heartland, General Obligation Refunding Bonds | | 3.000% | | | 12/01/2032 | | | | 1,500,000 | | | | 1,518,470 | |
County of Sangamon, Illinois, General Obligation Refunding Bonds | | 3.000% | | | 12/15/2033 | | | | 800,000 | | | | 793,625 | |
Cook County Community Consolidated School District No. 64 Park Ridge-Niles, General Obligation Bonds | | 3.000% | | | 12/01/2034 | | | | 1,000,000 | | | | 1,000,148 | |
Sangamon County School District No. 186 Springfield, General Obligation Bonds | | 3.000% | | | 02/01/2035 | | | | 1,000,000 | | | | 966,287 | |
Lake County Community Consolidated School District No. 73 Hawthorn, General Obligation Bonds | | 4.000% | | | 01/01/2038 | | | | 2,000,000 | | | | 2,174,593 | |
Illinois State Toll Highway Authority Revenue Bonds, Series A | | 4.000% | | | 01/01/2039 | | | | 1,000,000 | | | | 1,067,726 | |
Cook County Community Consolidated School District No. 65 Evanston Revenue Bonds(g) | | 5.000% | | | 12/01/2039 | | | | 1,000,000 | | | | 1,163,670 | |
| | | | | | | | | | | | | | |
| | | | | | | | | | | | | 8,684,519 | |
| | | | | | | | | | | | | | |
| | | | |
Indiana (4.20%) | | | | | | | | | | | | | | |
Perry Township Multi School Building Corporation Revenue Bonds | | 5.000% | | | 01/15/2026 | | | | 1,190,000 | | | | 1,312,694 | |
Perry Township Multi School Building Corporation Revenue Bonds | | 5.000% | | | 07/15/2026 | | | | 1,105,000 | | | | 1,230,842 | |
East Noble School Building Corporation Revenue Bonds | | 2.000% | | | 01/15/2027 | | | | 1,205,000 | | | | 1,202,142 | |
Hamilton Southeastern Consolidated School Building Corporation Revenue Bonds, Series G | | 4.000% | | | 07/15/2027 | | | | 1,190,000 | | | | 1,260,203 | |
Hamilton Southeastern Consolidated School Building Corporation Revenue Bonds, Series G | | 4.500% | | | 07/15/2028 | | | | 500,000 | | | | 536,554 | |
New Albany-Floyd County School Building Corporation Revenue Bonds | | 4.000% | | | 07/15/2028 | | | | 500,000 | | | | 544,211 | |
Warsaw Multi-School Building Corporation Revenue Bonds | | 4.000% | | | 07/15/2028 | | | | 1,000,000 | | | | 1,064,734 | |
City of West Lafayette, Indiana, Sewer Revenue Bonds | | 3.750% | | | 07/01/2029 | | | | 220,000 | | | | 230,129 | |
New Albany-Floyd County School Building Corporation Revenue Bonds | | 4.000% | | | 07/15/2029 | | | | 2,000,000 | | | | 2,169,567 | |
Valparaiso Multi-Schools Building Corporation Revenue Bonds | | 5.000% | | | 07/15/2029 | | | | 3,000,000 | | | | 3,302,427 | |
City of West Lafayette, Indiana, Sewer Revenue Bonds | | 4.000% | | | 07/01/2030 | | | | 750,000 | | | | 796,443 | |
Munster School Building Corporation Revenue Bonds | | 3.380% | | | 01/15/2031 | | | | 1,095,000 | | | | 1,148,369 | |
Duneland School Building Corporation Revenue Bonds | | 4.000% | | | 01/15/2032 | | | | 1,000,000 | | | | 1,125,011 | |
Munster School Building Corporation Revenue Bonds | | 4.000% | | | 07/15/2032 | | | | 2,285,000 | | | | 2,478,875 | |
Indiana Finance Authority Revenue Refunding Bonds, Series A | | 5.000% | | | 02/01/2033 | | | | 1,500,000 | | | | 1,806,827 | |
City of Fort Wayne, Indiana, Waterworks Utility Revenue Bonds, Series A | | 3.000% | | | 12/01/2033 | | | | 650,000 | | | | 657,412 | |
City of Lebanon, Indiana, Sewage Works Revenue Bonds | | 4.000% | | | 07/01/2034 | | | | 865,000 | | | | 918,605 | |
Hamilton Southeastern Consolidated School Building Corporation Revenue Bonds | | 5.000% | | | 07/15/2034 | | | | 335,000 | | | | 382,098 | |
City of Fort Wayne, Indiana, Waterworks Utility Revenue Bonds, Series A | | 3.000% | | | 12/01/2034 | | | | 675,000 | | | | 684,048 | |
City of Lebanon, Indiana, Sewage Works Revenue Bonds | | 4.000% | | | 07/01/2035 | | | | 895,000 | | | | 947,321 | |
Hamilton Southeastern Consolidated School Building Corporation Revenue Bonds | | 5.000% | | | 07/15/2035 | | | | 600,000 | | | | 682,431 | |
City of Fort Wayne, Indiana, Waterworks Utility Revenue Bonds, Series A | | 3.000% | | | 12/01/2035 | | | | 700,000 | | | | 708,791 | |
Hamilton Southeastern Consolidated School Building Corporation Revenue Bonds | | 5.000% | | | 07/15/2036 | | | | 700,000 | | | | 794,409 | |
Tippecanoe Valley Akron School Building Corporation Revenue Bonds | | 5.000% | | | 07/15/2039 | | | | 1,000,000 | | | | 1,188,875 | |
| | | | | | | | | | | | | | |
| | | | | | | | | | | | | 27,173,018 | |
| | | | | | | | | | | | | | |
| | | | |
Iowa (2.63%) | | | | | | | | | | | | | | |
Johnston Community School District, General Obligation Refunding Bonds (Prerefunded to 06-01-2023 @ 100)(c) | | 3.000% | | | 06/01/2025 | | | | 2,370,000 | | | | 2,403,455 | |
County of Grundy, Iowa, General Obligation Refunding Bonds | | 3.000% | | | 06/01/2026 | | | | 1,130,000 | | | | 1,131,294 | |
| | |
| 18 | | See accompanying notes to financial statements. |
ADVISERS INVESTMENT TRUST
STATE FARM MUNICIPAL BOND FUND
SCHEDULE OF INVESTMENTS (continued)
March 31, 2022 (Unaudited)
| | | | | | | | | | | | | | |
| | | Coupon
rate | | Maturity
date | | | Principal
amount | | | Value | |
Long-term Municipal Bond (Cont.) | | | | | | | | | | | | | | |
Iowa (Cont.) | | | | | | | | | | | | | | |
Johnston Community School District, General Obligation Refunding Bonds (Prerefunded to 06-01-2023 @ 100)(c) | | 3.000% | | | 06/01/2026 | | | $ | 2,445,000 | | | $ | 2,479,513 | |
County of Grundy, Iowa, General Obligation Refunding Bonds | | 3.000% | | | 06/01/2027 | | | | 1,175,000 | | | | 1,176,093 | |
Des Moines Metropolitan Wastewater Reclamation Authority Revenue Refunding Bonds, Series E | | 3.000% | | | 06/01/2027 | | | | 1,610,000 | | | | 1,628,393 | |
Waukee Community School District, General Obligation Refunding Bonds, Series B | | 2.000% | | | 06/01/2027 | | | | 2,100,000 | | | | 2,101,039 | |
City of Cedar Rapids Water Revenue Refunding Bonds, Series D | | 3.000% | | | 06/01/2029 | | | | 950,000 | | | | 979,774 | |
City of Council Bluffs, Iowa, General Obligation Refunding Bonds | | 3.000% | | | 06/01/2029 | | | | 1,050,000 | | | | 1,082,908 | |
City of West Des Moines, Iowa, General Obligation Bonds, Series D | | 3.000% | | | 06/01/2031 | | | | 1,770,000 | | | | 1,804,584 | |
Kirkwood Community College, General Obligation Refunding Bonds | | 4.000% | | | 06/01/2033 | | | | 1,275,000 | | | | 1,382,061 | |
Woodbury County Law Enforcement Center Authority Revenue Bonds | | 4.000% | | | 06/01/2034 | | | | 795,000 | | | | 864,765 | |
| | | | | | | | | | | | | | |
| | | | | | | | | | | | | 17,033,879 | |
| | | | | | | | | | | | | | |
| | | | |
Kansas (2.33%) | | | | | | | | | | | | | | |
Johnson County Unified School District No. 233 Olathe, General Obligation Bonds, Series A (Prerefunded to 09-01-2024 @ 100)(c) | | 3.000% | | | 09/01/2026 | | | | 2,740,000 | | | | 2,808,623 | |
Johnson County Unified School District No. 233 Olathe, General Obligation Bonds, Series A (Prerefunded to 09-01-2024 @ 100)(c) | | 3.000% | | | 09/01/2027 | | | | 1,490,000 | | | | 1,527,317 | |
Johnson County Unified School District No. 512 Shawnee Mission, General Obligation Refunding Bonds, Series A | | 3.000% | | | 10/01/2027 | | | | 1,000,000 | | | | 1,030,739 | |
Johnson County Water District No. 1 Revenue Refunding Bonds, Series A | | 3.000% | | | 01/01/2032 | | | | 2,500,000 | | | | 2,558,401 | |
State of Kansas Department of Transportation Revenue Bonds, Series A | | 5.000% | | | 09/01/2033 | | | | 5,000,000 | | | | 5,694,766 | |
City of Manhattan, Kansas, General Obligation Refunding Bonds, Series A | | 4.000% | | | 11/01/2033 | | | | 440,000 | | | | 488,196 | |
City of Manhattan, Kansas, General Obligation Refunding Bonds, Series A | | 4.000% | | | 11/01/2034 | | | | 455,000 | | | | 504,266 | |
City of Manhattan, Kansas, General Obligation Refunding Bonds, Series A | | 3.000% | | | 11/01/2035 | | | | 475,000 | | | | 489,946 | |
| | | | | | | | | | | | | | |
| | | | | | | | | | | | | 15,102,254 | |
| | | | | | | | | | | | | | |
| | | | |
Kentucky (3.08%) | | | | | | | | | | | | | | |
Northern Kentucky Water District Revenue Bonds, Series A | | 4.000% | | | 02/01/2028 | | | | 1,110,000 | | | | 1,142,895 | |
City of Owensboro, Kentucky, Water Revenue Refunding Bonds | | 3.250% | | | 09/15/2029 | | | | 1,735,000 | | | | 1,777,450 | |
Lexington-Fayette Urban County Government, General Obligation Bonds, Series A | | 3.000% | | | 10/01/2029 | | | | 1,060,000 | | | | 1,091,045 | |
City of Owensboro, Kentucky, Water Revenue Refunding Bonds | | 3.380% | | | 09/15/2030 | | | | 1,800,000 | | | | 1,851,503 | |
Lexington-Fayette Urban County Government, General Obligation Bonds, Series A | | 3.130% | | | 10/01/2030 | | | | 1,095,000 | | | | 1,129,732 | |
Northern Kentucky Water District Revenue Refunding Bonds | | 3.000% | | | 02/01/2031 | | | | 3,660,000 | | | | 3,765,994 | |
City of Owensboro, Kentucky, Water Revenue Refunding Bonds | | 3.500% | | | 09/15/2031 | | | | 1,860,000 | | | | 1,904,489 | |
Kenton County School District Finance Corporation Revenue Bonds | | 2.000% | | | 12/01/2031 | | | | 1,565,000 | | | | 1,404,237 | |
Glasgow Independent School District Finance Corporation Revenue Bonds | | 5.000% | | | 02/01/2032 | | | | 1,000,000 | | | | 1,197,429 | |
Kenton County School District Finance Corporation Revenue Bonds | | 2.000% | | | 02/01/2032 | | | | 1,770,000 | | | | 1,581,313 | |
City of Bowling Green, Kentucky, Water & Sewer System Revenue Bonds | | 3.000% | | | 06/01/2033 | | | | 3,115,000 | | | | 3,126,857 | |
| | | | | | | | | | | | | | |
| | | | | | | | | | | | | 19,972,944 | |
| | | | | | | | | | | | | | |
| | | | |
Louisiana (0.17%) | | | | | | | | | | | | | | |
Jefferson Parish Consolidated Waterworks District No. 2 Revenue Refunding Bonds | | 4.000% | | | 02/01/2035 | | | | 1,000,000 | | | | 1,097,868 | |
| | | | | | | | | | | | | | |
| | | | |
Maine (0.89%) | | | | | | | | | | | | | | |
Maine Municipal Bond Bank Revenue Refunding Bonds, Series D | | 3.000% | | | 11/01/2031 | | | | 3,000,000 | | | | 3,059,833 | |
Maine State Housing Authority Revenue Refunding Bonds, Series 1 | | 5.000% | | | 06/15/2034 | | | | 2,265,000 | | | | 2,678,551 | |
| | | | | | | | | | | | | | |
| | | | | | | | | | | | | 5,738,384 | |
| | | | | | | | | | | | | | |
| | | | |
Maryland (0.84%) | | | | | | | | | | | | | | |
County of Montgomery, Maryland, General Obligation Bonds, Series B | | 3.000% | | | 12/01/2028 | | | | 2,000,000 | | | | 2,028,855 | |
County of Caroline, Maryland, General Obligation Refunding Bonds | | 3.000% | | | 01/15/2032 | | | | 1,150,000 | | | | 1,173,542 | |
State of Maryland, General Obligation Bonds, Series A | | 5.000% | | | 08/01/2034 | | | | 1,850,000 | | | | 2,263,152 | |
| | | | | | | | | | | | | | |
| | | | | | | | | | | | | 5,465,549 | |
| | | | | | | | | | | | | | |
| | |
| See accompanying notes to financial statements. | | 19 |
ADVISERS INVESTMENT TRUST
STATE FARM MUNICIPAL BOND FUND
SCHEDULE OF INVESTMENTS (continued)
March 31, 2022 (Unaudited)
| | | | | | | | | | | | | | |
| | | Coupon
rate | | Maturity
date | | | Principal
amount | | | Value | |
Long-term Municipal Bond (Cont.) | | | | | | | | | | | | | | |
Massachusetts (0.31%) | | | | | | | | | | | | | | |
Town of Northbridge, Massachusetts, General Obligation Bonds | | 3.000% | | | 06/01/2032 | | | $ | 1,000,000 | | | $ | 1,017,883 | |
Town of Swampscott, Massachusetts, General Obligation Bonds | | 3.000% | | | 03/01/2034 | | | | 1,000,000 | | | | 1,014,426 | |
| | | | | | | | | | | | | | |
| | | | | | | | | | | | | 2,032,309 | |
| | | | | | | | | | | | | | |
| | | | |
Michigan (4.56%) | | | | | | | | | | | | | | |
Plymouth-Canton Community School District, General Obligation Refunding Bonds, Series A | | 5.000% | | | 05/01/2022 | | | | 450,000 | | | | 451,407 | |
Plymouth-Canton Community School District, General Obligation Refunding Bonds, Series A (Prerefunded to 05-01-2022 @ 100)(c) | | 5.000% | | | 05/01/2025 | | | | 1,260,000 | | | | 1,263,930 | |
Hudsonville Public Schools, General Obligation Refunding Bonds | | 4.000% | | | 05/01/2026 | | | | 1,290,000 | | | | 1,321,737 | |
Plymouth-Canton Community School District, General Obligation Bonds, Series A (Prerefunded to 05-01-2023 @ 100)(c) | | 4.000% | | | 05/01/2026 | | | | 3,850,000 | | | | 3,947,633 | |
Plymouth-Canton Community School District, General Obligation Refunding Bonds, Series A (Prerefunded to 05-01-2022 @ 100)(c) | | 4.000% | | | 05/01/2026 | | | | 2,300,000 | | | | 2,305,455 | |
East Grand Rapids Public School District, General Obligation Refunding Bonds, Series A (Prerefunded to 05-01-2024 @ 100)(c) | | 5.000% | | | 05/01/2027 | | | | 1,000,000 | | | | 1,061,320 | |
Hamilton Community School District, General Obligation Refunding Bonds | | 4.000% | | | 05/01/2027 | | | | 500,000 | | | | 529,663 | |
Mattawan Consolidated School District, General Obligation Bonds, Series I (Prerefunded to 05-01-2025 @ 100)(c) | | 5.000% | | | 05/01/2027 | | | | 1,005,000 | | | | 1,094,762 | |
East Grand Rapids Public School District, General Obligation Refunding Bonds, Series A (Prerefunded to 05-01-2024 @ 100)(c) | | 5.000% | | | 05/01/2028 | | | | 765,000 | | | | 811,910 | |
Hamilton Community School District, General Obligation Refunding Bonds | | 4.000% | | | 05/01/2028 | | | | 300,000 | | | | 317,338 | |
Mattawan Consolidated School District, General Obligation Bonds, Series I (Prerefunded to 05-01-2025 @ 100)(c) | | 5.000% | | | 05/01/2028 | | | | 600,000 | | | | 653,589 | |
Zeeland Public Schools, General Obligation Bonds, Series A | | 5.000% | | | 05/01/2029 | | | | 700,000 | | | | 757,942 | |
Zeeland Public Schools, General Obligation Bonds, Series A | | 5.000% | | | 05/01/2030 | | | | 1,100,000 | | | | 1,193,102 | |
St Louis Public Schools, General Obligation Bonds | | 4.000% | | | 05/01/2032 | | | | 1,610,000 | | | | 1,782,302 | |
City of Grosse Pointe, Michigan, General Obligation Bonds | | 4.000% | | | 10/01/2032 | | | | 595,000 | | | | 646,858 | |
City of Grosse Pointe, Michigan, General Obligation Bonds | | 4.000% | | | 10/01/2033 | | | | 630,000 | | | | 684,035 | |
City of Grosse Pointe, Michigan, General Obligation Bonds | | 4.000% | | | 10/01/2034 | | | | 670,000 | | | | 726,741 | |
Lowell Area Schools, General Obligation Bonds | | 4.000% | | | 05/01/2035 | | | | 400,000 | | | | 439,926 | |
Rockford Public Schools, General Obligation Bonds, Series I | | 4.000% | | | 05/01/2035 | | | | 1,755,000 | | | | 1,914,683 | |
Grosse Pointe Public School System, General Obligation Refunding Bonds | | 5.000% | | | 05/01/2036 | | | | 1,635,000 | | | | 1,891,963 | |
Lowell Area Schools, General Obligation Bonds | | 4.000% | | | 05/01/2036 | | | | 865,000 | | | | 951,172 | |
West Bloomfield School District, General Obligation Bonds | | 3.000% | | | 05/01/2036 | | | | 3,825,000 | | | | 3,778,502 | |
Portage Public Schools, General Obligation Bonds | | 3.000% | | | 11/01/2038 | | | | 1,000,000 | | | | 979,007 | |
| | | | | | | | | | | | | | |
| | | | | | | | | | | | | 29,504,977 | |
| | | | | | | | | | | | | | |
| | | | |
Minnesota (3.44%) | | | | | | | | | | | | | | |
Minnetonka Independent School District No. 276, General Obligation Refunding Bonds, Series I (Prerefunded to 02-01-2023 @ 100)(c) | | 2.380% | | | 02/01/2025 | | | | 2,805,000 | | | | 2,822,575 | |
Minnetonka Independent School District No. 276, General Obligation Refunding Bonds, Series I (Prerefunded to 02-01-2023 @ 100)(c) | | 3.000% | | | 02/01/2026 | | | | 1,000,000 | | | | 1,012,437 | |
Shakopee Independent School District No. 720, General Obligation Bonds, Series A(c) | | 3.250% | | | 02/01/2026 | | | | 3,860,000 | | | | 3,952,997 | |
Minnetonka Independent School District No. 276, General Obligation Refunding Bonds, Series I (Prerefunded to 02-01-2023 @ 100)(c) | | 3.000% | | | 02/01/2027 | | | | 1,590,000 | | | | 1,609,776 | |
North St Paul-Maplewood-Oakdale Independent School District No. 622, General Obligation Refunding Bonds, Series A | | 2.000% | | | 02/01/2031 | | | | 3,000,000 | | | | 2,798,295 | |
City of Eagan, Minnesota, General Obligation Bonds, Series A | | 3.250% | | | 02/01/2032 | | | | 1,245,000 | | | | 1,277,983 | |
Big Lake Independent School District No. 727, General Obligation Bonds, Series A | | 3.000% | | | 02/01/2033 | | | | 570,000 | | | | 581,404 | |
North St. Paul-Maplewood-Oakdale Independent School District No. 622, General Obligation Bonds, Series B | | 3.000% | | | 02/01/2034 | | | | 3,300,000 | | | | 3,371,987 | |
Red Rock Central Independent School District No. 2884, General Obligation Bonds, Series A | | 3.000% | | | 02/01/2034 | | | | 1,000,000 | | | | 1,027,872 | |
City of Minneapolis, Minnesota, General Obligation Bonds | | 3.000% | | | 12/01/2035 | | | | 2,000,000 | | | | 2,048,852 | |
Norwood Young America Independent School District No. 108, General Obligation Bonds, Series A | | 3.000% | | | 02/01/2037 | | | | 760,000 | | | | 765,179 | |
| | |
| 20 | | See accompanying notes to financial statements. |
ADVISERS INVESTMENT TRUST
STATE FARM MUNICIPAL BOND FUND
SCHEDULE OF INVESTMENTS (continued)
March 31, 2022 (Unaudited)
| | | | | | | | | | | | | | |
| | | Coupon
rate | | Maturity
date | | | Principal
amount | | | Value | |
Long-term Municipal Bond (Cont.) | | | | | | | | | | | | | | |
Minnesota (Cont.) | | | | | | | | | | | | | | |
Blooming Prairie Independent School District No. 756, General Obligation Refunding Bonds, Series A | | 3.000% | | | 02/01/2038 | | | $ | 435,000 | | | $ | 436,989 | |
Red Lake County Central Independent School District No. 2906, General Obligation Bonds (School District Credit Program)(g) | | 4.000% | | | 02/01/2039 | | | | 500,000 | | | | 544,466 | |
| | | | | | | | | | | | | | |
| | | | | | | | | | | | | 22,250,812 | |
| | | | | | | | | | | | | | |
| | | | |
Mississippi (1.25%) | | | | | | | | | | | | | | |
Madison County School District, Mississippi, General Obligation Refunding Bonds | | 4.000% | | | 04/15/2022 | | | | 2,480,000 | | | | 2,482,335 | |
State of Mississippi, General Obligation Bonds, Series F | | 3.000% | | | 11/01/2026 | | | | 3,000,000 | | | | 3,097,554 | |
Mississippi Development Bank Revenue Bonds | | 4.250% | | | 12/01/2028 | | | | 2,305,000 | | | | 2,486,104 | |
| | | | | | | | | | | | | | |
| | | | | | | | | | | | | 8,065,993 | |
| | | | | | | | | | | | | | |
| | | | |
Missouri (1.84%) | | | | | | | | | | | | | | |
Fort Zumwalt School District, General Obligation Refunding Bonds | | 4.000% | | | 03/01/2027 | | | | 465,000 | | | | 482,661 | |
Fort Zumwalt School District, General Obligation Refunding Bonds | | 4.000% | | | 03/01/2028 | | | | 400,000 | | | | 414,963 | |
Fort Zumwalt School District, General Obligation Refunding Bonds | | 4.000% | | | 03/01/2029 | | | | 425,000 | | | | 440,979 | |
Liberty Public School District No. 53, General Obligation Bonds | | 4.000% | | | 03/01/2033 | | | | 1,000,000 | | | | 1,064,353 | |
Liberty Public School District No. 53, General Obligation Bonds | | 4.000% | | | 03/01/2034 | | | | 2,500,000 | | | | 2,655,100 | |
St. Charles County School District No. R-IV Wentzville, General Obligation Refunding Bonds | | 4.000% | | | 03/01/2034 | | | | 3,000,000 | | | | 3,224,066 | |
City of Columbia Water & Electric System Revenue Refunding Bonds, Series B | | 3.000% | | | 10/01/2035 | | | | 2,520,000 | | | | 2,589,562 | |
Jackson County Reorganized School District No. 7, General Obligation Bonds | | 5.000% | | | 03/01/2036 | | | | 1,000,000 | | | | 1,055,073 | |
| | | | | | | | | | | | | | |
| | | | | | | | | | | | | 11,926,757 | |
| | | | | | | | | | | | | | |
| | | | |
Montana (3.22%) | | | | | | | | | | | | | | |
Hellgate School District No. 4, General Obligation Bonds | | 3.500% | | | 06/15/2025 | | | | 860,000 | | | | 894,721 | |
Hellgate School District No. 4, General Obligation Bonds | | 5.000% | | | 06/15/2032 | | | | 945,000 | | | | 1,057,516 | |
Missoula High School District No. 1, General Obligation Bonds | | 4.000% | | | 07/01/2032 | | | | 1,010,000 | | | | 1,079,215 | |
Hellgate School District No. 4, General Obligation Bonds | | 5.000% | | | 06/15/2033 | | | | 1,005,000 | | | | 1,123,103 | |
Flathead County School District No. 44 Whitefish, General Obligation Bonds | | 4.000% | | | 07/01/2033 | | | | 520,000 | | | | 556,934 | |
Lewis & Clark County K-12 School District No. 9 East Helena, General Obligation Bonds | | 4.500% | | | 07/01/2033 | | | | 560,000 | | | | 625,946 | |
Hellgate School District No. 4, General Obligation Bonds | | 5.000% | | | 06/15/2034 | | | | 505,000 | | | | 563,824 | |
Cascade County High School District A Great Falls, General Obligation Bonds | | 5.000% | | | 07/01/2034 | | | | 725,000 | | | | 823,694 | |
Flathead County School District No. 44 Whitefish, General Obligation Bonds | | 4.000% | | | 07/01/2034 | | | | 565,000 | | | | 604,536 | |
Flathead County School District No. 6 Columbia Falls, General Obligation Bonds | | 4.000% | | | 07/01/2034 | | | | 1,000,000 | | | | 1,089,981 | |
Lewis & Clark County K-12 School District No. 9 East Helena, General Obligation Bonds | | 5.000% | | | 07/01/2034 | | | | 805,000 | | | | 922,066 | |
Hellgate School District No. 4, General Obligation Bonds | | 5.250% | | | 06/15/2035 | | | | 880,000 | | | | 991,768 | |
Flathead County School District No. 44 Whitefish, General Obligation Bonds | | 4.000% | | | 07/01/2035 | | | | 845,000 | | | | 903,351 | |
Flathead County School District No. 6 Columbia Falls, General Obligation Bonds | | 4.000% | | | 07/01/2035 | | | | 750,000 | | | | 816,589 | |
Lewis & Clark County K-12 School District No. 9 East Helena, General Obligation Bonds | | 5.000% | | | 07/01/2035 | | | | 1,925,000 | | | | 2,203,079 | |
Montana State Board of Regents Revenue Refunding Bonds | | 3.000% | | | 11/15/2035 | | | | 3,660,000 | | | | 3,684,500 | |
Broadwater County K-12 School District No. 1 Townsend, General Obligation Bonds | | 3.000% | | | 07/01/2036 | | | | 750,000 | | | | 745,690 | |
Flathead County School District No. 44 Whitefish, General Obligation Bonds | | 4.000% | | | 07/01/2036 | | | | 585,000 | | | | 624,933 | |
Flathead County School District No. 6 Columbia Falls, General Obligation Bonds | | 4.000% | | | 07/01/2036 | | | | 965,000 | | | | 1,049,682 | |
Broadwater County K-12 School District No. 1 Townsend, General Obligation Bonds | | 3.000% | | | 07/01/2037 | | | | 465,000 | | | | 461,516 | |
| | | | | | | | | | | | | | |
| | | | | | | | | | | | | 20,822,644 | |
| | | | | | | | | | | | | | |
| | | | |
Nebraska (0.98%) | | | | | | | | | | | | | | |
Gretna Public Schools, General Obligation Refunding Bonds | | 3.000% | | | 12/15/2024 | | | | 145,000 | | | | 148,906 | |
Gretna Public Schools, General Obligation Refunding Bonds | | 4.000% | | | 12/15/2025 | | | | 180,000 | | | | 192,882 | |
City of Columbus, Nebraska, Combined Utilities System Revenue Refunding Bonds | | 4.000% | | | 12/15/2028 | | | | 150,000 | | | | 163,187 | |
Gretna Public Schools, General Obligation Refunding Bonds (Prerefunded to 12-15-2025 @ 100)(c) | | 5.000% | | | 12/15/2028 | | | | 250,000 | | | | 276,491 | |
City of Columbus, Nebraska, Combined Utilities System Revenue Refunding Bonds | | 4.000% | | | 12/15/2029 | | | | 250,000 | | | | 271,393 | |
Gretna Public Schools, General Obligation Refunding Bonds (Prerefunded to 12-15-2025 @ 100)(c) | | 5.000% | | | 12/15/2029 | | | | 260,000 | | | | 287,550 | |
| | |
| See accompanying notes to financial statements. | | 21 |
ADVISERS INVESTMENT TRUST
STATE FARM MUNICIPAL BOND FUND
SCHEDULE OF INVESTMENTS (continued)
March 31, 2022 (Unaudited)
| | | | | | | | | | | | | | |
| | | Coupon
rate | | Maturity
date | | | Principal
amount | | | Value | |
Long-term Municipal Bond (Cont.) | | | | | | | | | | | | | | |
Nebraska (Cont.) | | | | | | | | | | | | | | |
City of Columbus, Nebraska, Combined Utilities System Revenue Refunding Bonds | | 4.000% | | | 12/15/2030 | | | $ | 325,000 | | | $ | 352,204 | |
Grand Island Public Schools, General Obligation Bonds (Prerefunded to 12-15-2024 @ 100)(c) | | 5.000% | | | 12/15/2030 | | | | 700,000 | | | | 755,498 | |
Grand Island Public Schools, General Obligation Bonds (Prerefunded to 12-15-2024 @ 100)(c) | | 5.000% | | | 12/15/2032 | | | | 565,000 | | | | 609,795 | |
City of Lincoln Sanitary Sewer Revenue Bonds | | 3.000% | | | 06/15/2034 | | | | 1,105,000 | | | | 1,141,151 | |
City of Lincoln Sanitary Sewer Revenue Bonds | | 3.000% | | | 06/15/2035 | | | | 1,140,000 | | | | 1,172,311 | |
City of La Vista, Nebraska, General Obligation Bonds | | 3.000% | | | 09/15/2041 | | | | 1,000,000 | | | | 986,042 | |
| | | | | | | | | | | | | | |
| | | | | | | | | | | | | 6,357,410 | |
| | | | | | | | | | | | | | |
Nevada (0.95%) | | | | | | | | | | | | | | |
Nevada System of Higher Education Revenue Refunding Bonds | | 4.000% | | | 07/01/2030 | | | | 3,045,000 | | | | 3,230,796 | |
Clark County School District G.O. Limited Bonds, Series B (BAM Insured) | | 3.000% | | | 06/15/2038 | | | | 3,000,000 | | | | 2,949,305 | |
| | | | | | | | | | | | | | |
| | | | | | | | | | | | | 6,180,101 | |
| | | | | | | | | | | | | | |
New Jersey (1.48%) | | | | | | | | | | | | | | |
South Brunswick Township Board of Education, General Obligation Refunding Bonds | | 4.000% | | | 12/01/2022 | | | | 750,000 | | | | 753,203 | |
Madison Borough Board of Education, General Obligation Refunding Bonds, Series B | | 3.000% | | | 12/15/2022 | | | | 600,000 | | | | 606,782 | |
Madison Borough Board of Education, General Obligation Refunding Bonds, Series B (Prerefunded to 12-15-2022 @ 100)(c) | | 4.000% | | | 12/15/2023 | | | | 465,000 | | | | 473,680 | |
Hopewell Valley Regional School District, General Obligation Bonds | | 3.500% | | | 01/15/2027 | | | | 3,330,000 | | | | 3,452,737 | |
Livingston Township School District, General Obligation Refunding Bonds | | 4.000% | | | 07/15/2029 | | | | 1,000,000 | | | | 1,054,437 | |
Township of Moorestown, New Jersey, General Obligation Bonds | | 4.000% | | | 01/15/2030 | | | | 1,140,000 | | | | 1,156,368 | |
Hopewell Valley Regional School District, General Obligation Bonds | | 4.000% | | | 01/15/2032 | | | | 2,000,000 | | | | 2,084,352 | |
| | | | | | | | | | | | | | |
| | | | | | | | | | | | | 9,581,559 | |
| | | | | | | | | | | | | | |
New Mexico (3.42%) | | | | | | | | | | | | | | |
Santa Fe Public School District, General Obligation Bonds | | 3.000% | | | 08/01/2022 | | | | 2,000,000 | | | | 2,012,262 | |
County of Bernalillo, New Mexico, General Obligation Refunding Bonds, Series A | | 2.000% | | | 08/15/2023 | | | | 1,030,000 | | | | 1,034,871 | |
County of Bernalillo, New Mexico, General Obligation Refunding Bonds, Series A | | 2.250% | | | 08/15/2024 | | | | 1,050,000 | | | | 1,055,797 | |
County of Bernalillo, New Mexico, General Obligation Bonds | | 3.000% | | | 08/15/2025 | | | | 1,235,000 | | | | 1,253,343 | |
City of Santa Fe, New Mexico, General Obligation Bonds | | 4.000% | | | 08/01/2026 | | | | 225,000 | | | | 231,279 | |
City of Santa Fe, New Mexico, General Obligation Bonds | | 4.000% | | | 08/01/2027 | | | | 700,000 | | | | 718,883 | |
Las Cruces School District No. 2, General Obligation Bonds, Series C | | 3.250% | | | 08/01/2027 | | | | 900,000 | | | | 933,369 | |
Rio Rancho Public School District No. 94, General Obligation Bonds, Series A | | 3.000% | | | 08/01/2027 | | | | 1,515,000 | | | | 1,559,069 | |
City of Santa Fe, New Mexico, General Obligation Bonds | | 4.000% | | | 08/01/2028 | | | | 725,000 | | | | 744,557 | |
Las Cruces School District No. 2, General Obligation Bonds, Series C | | 3.500% | | | 08/01/2028 | | | | 900,000 | | | | 936,979 | |
Rio Rancho Public School District No. 94, General Obligation Bonds, Series A | | 3.130% | | | 08/01/2028 | | | | 1,515,000 | | | | 1,559,134 | |
City of Santa Fe, New Mexico, General Obligation Bonds | | 4.000% | | | 08/01/2029 | | | | 750,000 | | | | 770,132 | |
Santa Fe Public School District, General Obligation Bonds | | 3.630% | | | 08/01/2029 | | | | 3,075,000 | | | | 3,246,183 | |
Santa Fe Public School District, General Obligation Bonds | | 4.000% | | | 08/01/2030 | | | | 1,000,000 | | | | 1,068,338 | |
Albuquerque Municipal School District No. 12, General Obligation Bonds | | 5.000% | | | 08/01/2034 | | | | 1,800,000 | | | | 2,042,281 | |
Albuquerque Municipal School District No. 12, General Obligation Bonds | | 5.000% | | | 08/01/2035 | | | | 2,600,000 | | | | 2,947,500 | |
| | | | | | | | | | | | | | |
| | | | | | | | | | | | | 22,113,977 | |
| | | | | | | | | | | | | | |
New York (2.65%) | | | | | | | | | | | | | | |
Triborough Bridge & Tunnel Authority Revenue Refunding Bonds, Series C-2 | | 3.000% | | | 05/15/2032 | | | | 2,250,000 | | | | 2,303,813 | |
New York State Environmental Facilities Corporation Revenue Refunding Bonds | | 5.000% | | | 08/15/2032 | | | | 1,000,000 | | | | 1,230,878 | |
Port Authority of New York & New Jersey Revenue Bonds, Series 179 | | 5.000% | | | 12/01/2032 | | | | 3,000,000 | | | | 3,156,322 | |
New York City Housing Development Corporation Revenue Bonds | | 2.750% | | | 11/01/2033 | | | | 1,500,000 | | | | 1,419,870 | |
New York City Municipal Water Finance Authority Revenue Refunding Bonds, Series EE | | 5.000% | | | 06/15/2034 | | | | 3,000,000 | | | | 3,632,161 | |
State of New York Mortgage Agency Revenue Refunding Bonds, Series 220 | | 2.400% | | | 10/01/2034 | | | | 1,000,000 | | | | 915,726 | |
New York City Water & Sewer System Revenue Bonds, Series DD | | 5.000% | | | 06/15/2035 | | | | 2,500,000 | | | | 2,656,651 | |
New York State Housing Finance Agency Affordable Housing Variable Sustainability Revenue Bonds, Series J (SonyMA Insured)(b),(h) | | 1.100% | | | 11/01/2061 | | | | 2,000,000 | | | | 1,861,914 | |
| | | | | | | | | | | | | | |
| | | | | | | | | | | | | 17,177,335 | |
| | | | | | | | | | | | | | |
| | |
| 22 | | See accompanying notes to financial statements. |
ADVISERS INVESTMENT TRUST
STATE FARM MUNICIPAL BOND FUND
SCHEDULE OF INVESTMENTS (continued)
March 31, 2022 (Unaudited)
| | | | | | | | | | | | | | |
| | | Coupon
rate | | Maturity
date | | | Principal
amount | | | Value | |
Long-term Municipal Bond (Cont.) | | | | | | | | | | | | | | |
North Carolina (2.56%) | | | | | | | | | | | | | | |
City of Salisbury, North Carolina, Combined Enterprise System Revenue Refunding Bonds | | 5.000% | | | 02/01/2026 | | | $ | 1,960,000 | | | $ | 2,174,921 | |
Buncombe County Metropolitan Sewerage District Revenue Refunding Bonds | | 4.000% | | | 07/01/2027 | | | | 1,210,000 | | | | 1,243,230 | |
City of Salisbury, North Carolina, Combined Enterprise System Revenue Refunding Bonds | | 5.000% | | | 02/01/2028 | | | | 890,000 | | | | 1,028,187 | |
City of Gastonia, North Carolina, Combined Utilities System Revenue Bonds | | 5.000% | | | 05/01/2028 | | | | 700,000 | | | | 763,693 | |
City of Salisbury, North Carolina, Combined Enterprise System Revenue Refunding Bonds | | 5.000% | | | 02/01/2029 | | | | 935,000 | | | | 1,097,571 | |
City of Gastonia, North Carolina, Combined Utilities System Revenue Bonds | | 5.000% | | | 05/01/2029 | | | | 265,000 | | | | 288,741 | |
City of Salisbury, North Carolina, Combined Enterprise System Revenue Refunding Bonds | | 5.000% | | | 02/01/2030 | | | | 500,000 | | | | 596,401 | |
City of Salisbury, North Carolina, Combined Enterprise System Revenue Refunding Bonds | | 5.000% | | | 02/01/2031 | | | | 500,000 | | | | 592,524 | |
County of Union, North Carolina, Enterprise System Revenue Bonds | | 3.000% | | | 06/01/2031 | | | | 2,850,000 | | | | 2,912,422 | |
North Carolina Housing Finance Agency Revenue Bonds(g) | | 3.050% | | | 01/01/2032 | | | | 1,580,000 | | | | 1,571,217 | |
County of Forsyth, North Carolina, General Obligation Bonds, Series B | | 3.000% | | | 03/01/2032 | | | | 1,000,000 | | | | 1,036,013 | |
City of Salisbury, North Carolina, Combined Enterprise System Revenue Refunding Bonds | | 5.000% | | | 02/01/2033 | | | | 750,000 | | | | 885,747 | |
City of Salisbury, North Carolina, Combined Enterprise System Revenue Refunding Bonds | | 5.000% | | | 02/01/2035 | | | | 1,000,000 | | | | 1,178,164 | |
City of Salisbury, North Carolina, Combined Enterprise System Revenue Refunding Bonds | | 5.000% | | | 02/01/2037 | | | | 1,000,000 | | | | 1,175,741 | |
| | | | | | | | | | | | | | |
| | | | | | | | | | | | | 16,544,572 | |
| | | | | | | | | | | | | | |
North Dakota (1.31%) | | | | | | | | | | | | | | |
City of Bismarck, North Dakota, General Obligation Refunding Bonds, Series L | | 3.130% | | | 05/01/2028 | | | | 845,000 | | | | 855,981 | |
City of Bismarck, North Dakota, General Obligation Refunding Bonds, Series L | | 3.250% | | | 05/01/2029 | | | | 835,000 | | | | 846,466 | |
Bismarck Public School District No. 1, General Obligation Bonds | | 3.130% | | | 05/01/2030 | | | | 1,695,000 | | | | 1,745,275 | |
City of Bismarck, North Dakota, General Obligation Refunding Bonds, Series M | | 3.130% | | | 05/01/2031 | | | | 1,015,000 | | | | 1,041,326 | |
City of Bismarck, North Dakota, General Obligation Refunding Bonds, Series M | | 3.130% | | | 05/01/2032 | | | | 1,060,000 | | | | 1,076,259 | |
City of Fargo, North Dakota, General Obligation Refunding Bonds, Series A | | 3.000% | | | 05/01/2033 | | | | 1,350,000 | | | | 1,368,743 | |
City of Fargo, North Dakota, General Obligation Refunding Bonds, Series A | | 3.000% | | | 05/01/2034 | | | | 1,550,000 | | | | 1,569,954 | |
| | | | | | | | | | | | | | |
| | | | | | | | | | | | | 8,504,004 | |
| | | | | | | | | | | | | | |
Ohio (4.52%) | | | | | | | | | | | | | | |
Cincinnati City School District, General Obligation Refunding Bonds | | 5.250% | | | 12/01/2022 | | | | 1,000,000 | | | | 1,025,928 | |
Lake County Community College District, General Obligation Bonds, Series A | | 3.000% | | | 12/01/2025 | | | | 660,000 | | | | 681,958 | |
Lake Local School District/Stark County, General Obligation Bonds | | 3.000% | | | 12/01/2025 | | | | 190,000 | | | | 191,232 | |
Lake County Community College District, General Obligation Bonds, Series A | | 3.000% | | | 12/01/2026 | | | | 355,000 | | | | 369,168 | |
Northwest Local School District/Hamilton & Butler Counties, General Obligation Bonds | | 5.000% | | | 12/01/2027 | | | | 175,000 | | | | 183,560 | |
Perrysburg Exempted Village School District, General Obligation Bonds (Prerefunded to 12-01- 2024 @ 100)(c) | | 4.000% | | | 12/01/2027 | | | | 1,250,000 | | | | 1,313,839 | |
Lakewood City School District, General Obligation Bonds, Series A (Prerefunded to 11-01- 2022 @ 100)(c) | | 5.000% | | | 11/01/2028 | | | | 1,000,000 | | | | 1,021,530 | |
Bellbrook-Sugarcreek Local School District, General Obligation Refunding Bonds | | 4.000% | | | 12/01/2028 | | | | 1,565,000 | | | | 1,667,956 | |
Northwest Local School District/Hamilton & Butler Counties, General Obligation Bonds (Prerefunded to 12-01-2023 @ 100)(c) | | 5.000% | | | 12/01/2028 | | | | 225,000 | | | | 236,648 | |
Fairfield City School District, General Obligation Bonds (Prerefunded to 11-01-2023 @ 100)(c) | | 5.000% | | | 11/01/2029 | | | | 800,000 | | | | 840,295 | |
Northwest Local School District/Hamilton & Butler Counties, General Obligation Bonds (Prerefunded to 12-01-2023 @ 100)(c) | | 5.000% | | | 12/01/2029 | | | | 200,000 | | | | 210,354 | |
Fairfield City School District, General Obligation Bonds (Prerefunded to 11-01-2023 @ 100)(c) | | 5.000% | | | 11/01/2030 | | | | 1,335,000 | | | | 1,402,242 | |
Lakewood City School District, General Obligation Bonds, Series B | | 4.000% | | | 11/01/2030 | | | | 235,000 | | | | 255,156 | |
Hudson City School District, Ohio, General Obligation Bonds | | 4.000% | | | 12/01/2030 | | | | 750,000 | | | | 798,401 | |
Northwest Local School District/Hamilton & Butler Counties, General Obligation Bonds | | 4.000% | | | 12/01/2030 | | | | 365,000 | | | | 376,205 | |
Lakewood City School District, General Obligation Bonds, Series B | | 4.000% | | | 11/01/2031 | | | | 220,000 | | | | 238,270 | |
Hudson City School District, Ohio, General Obligation Bonds | | 4.000% | | | 12/01/2031 | | | | 350,000 | | | | 371,873 | |
American Municipal Power-Ohio Inc., Revenue Refunding Bonds, Prairie State Energy Campus | | 5.000% | | | 02/15/2032 | | | | 2,000,000 | | | | 2,344,071 | |
Lakewood City School District, General Obligation Bonds, Series A (Prerefunded to 11-01- 2022 @ 100)(c) | | 5.000% | | | 11/01/2032 | | | | 1,500,000 | | | | 1,532,296 | |
Lakewood City School District, General Obligation Bonds, Series B | | 4.000% | | | 11/01/2032 | | | | 220,000 | | | | 237,912 | |
City of Marysville, Ohio, Water System Revenue Bonds | | 4.000% | | | 12/01/2032 | | | | 315,000 | | | | 330,493 | |
Cuyahoga Community College District, General Obligation Bonds | | 4.000% | | | 12/01/2032 | | | | 1,750,000 | | | | 1,860,079 | |
Hudson City School District, Ohio, General Obligation Bonds | | 4.000% | | | 12/01/2032 | | | | 375,000 | | | | 398,130 | |
Lakewood City School District, General Obligation Bonds, Series B | | 4.000% | | | 11/01/2033 | | | | 370,000 | | | | 399,523 | |
| | |
| See accompanying notes to financial statements. | | 23 |
ADVISERS INVESTMENT TRUST
STATE FARM MUNICIPAL BOND FUND
SCHEDULE OF INVESTMENTS (continued)
March 31, 2022 (Unaudited)
| | | | | | | | | | | | | | |
| | | Coupon
rate | | Maturity
date | | | Principal
amount | | | Value | |
Long-term Municipal Bond (Cont.) | | | | | | | | | | | | | | |
Ohio (Cont.) | | | | | | | | | | | | | | |
City of Marysville, Ohio, Water System Revenue Bonds | | 4.000% | | | 12/01/2033 | | | $ | 235,000 | | | $ | 246,266 | |
Dublin City School District, General Obligation Bonds, Series A | | 4.000% | | | 12/01/2033 | | | | 500,000 | | | | 553,467 | |
Hudson City School District, Ohio, General Obligation Bonds | | 4.000% | | | 12/01/2033 | | | | 400,000 | | | | 424,509 | |
Worthington City School District, General Obligation Bonds | | 4.000% | | | 12/01/2033 | | | | 790,000 | | | | 866,790 | |
Cuyahoga Community College District, General Obligation Bonds | | 4.000% | | | 12/01/2034 | | | | 1,000,000 | | | | 1,058,021 | |
Dublin City School District, General Obligation Bonds, Series A | | 4.000% | | | 12/01/2034 | | | | 500,000 | | | | 552,910 | |
Hudson City School District, Ohio, General Obligation Bonds | | 4.000% | | | 12/01/2034 | | | | 875,000 | | | | 927,901 | |
City of Marysville, Ohio, Water System Revenue Bonds | | 4.000% | | | 12/01/2035 | | | | 1,870,000 | | | | 1,951,524 | |
Dublin City School District, General Obligation Bonds, Series A | | 4.000% | | | 12/01/2035 | | | | 500,000 | | | | 552,458 | |
Worthington City School District, General Obligation Bonds | | 4.000% | | | 12/01/2035 | | | | 475,000 | | | | 520,223 | |
Miami University Oxford Revenue Refunding Bonds, Series A | | 4.000% | | | 09/01/2036 | | | | 2,000,000 | | | | 2,195,564 | |
Dublin City School District, General Obligation Bonds, Series A | | 4.000% | | | 12/01/2036 | | | | 1,000,000 | | | | 1,103,955 | |
| | | | | | | | | | | | | | |
| | | | | | | | | | | | | 29,240,707 | |
| | | | | | | | | | | | | | |
Oklahoma (1.42%) | | | | | | | | | | | | | | |
City of Tulsa, Oklahoma, General Obligation Bonds | | 4.000% | | | 03/01/2023 | | | | 2,500,000 | | | | 2,504,384 | |
City of Tulsa, Oklahoma, General Obligation Bonds | | 3.000% | | | 04/01/2028 | | | | 3,000,000 | | | | 3,038,704 | |
Grand River Dam Authority Revenue Bonds, Series A | | 5.000% | | | 06/01/2031 | | | | 1,835,000 | | | | 1,948,905 | |
Edmond Public Works Authority Revenue Bonds | | 5.000% | | | 07/01/2032 | | | | 1,500,000 | | | | 1,703,415 | |
| | | | | | | | | | | | | | |
| | | | | | | | | | | | | 9,195,408 | |
| | | | | | | | | | | | | | |
Oregon (1.11%) | | | | | | | | | | | | | | |
State of Oregon, General Obligation Refunding Bonds, Series J | | 2.800% | | | 06/01/2025 | | | | 155,000 | | | | 157,661 | |
Clackamas County School District No. 12 North Clackamas, General Obligation Refunding Bonds (Prerefunded to 06-15-2024 @ 100)(c) | | 5.000% | | | 06/15/2028 | | | | 2,500,000 | | | | 2,667,381 | |
Deschutes County Administrative School District No. 1 Bend-La Pine, General Obligation Bonds | | 3.000% | | | 06/15/2035 | | | | 2,865,000 | | | | 2,886,043 | |
Tri-County Metropolitan Transportation District of Oregon Revenue Bonds, Series A | | 3.000% | | | 09/01/2037 | | | | 1,500,000 | | | | 1,488,682 | |
| | | | | | | | | | | | | | |
| | | | | | | | | | | | | 7,199,767 | |
| | | | | | | | | | | | | | |
Pennsylvania (2.07%) | | | | | | | | | | | | | | |
Township of Upper St. Clair, Pennsylvania, General Obligation Refunding Bonds, Series A | | 4.000% | | | 06/01/2028 | | | | 340,000 | | | | 366,279 | |
Township of Upper St. Clair, Pennsylvania, General Obligation Refunding Bonds, Series A | | 4.000% | | | 06/01/2029 | | | | 305,000 | | | | 327,816 | |
County of Northampton, Pennsylvania, General Obligation Refunding Bonds, Series B (Prerefunded to 10-01-2022 @ 100)(c) | | 5.000% | | | 10/01/2030 | | | | 1,500,000 | | | | 1,528,101 | |
West View Municipal Authority Water Revenue Bonds (Prerefunded to 11-15-2024 @ 100)(c) | | 5.000% | | | 11/15/2031 | | | | 1,365,000 | | | | 1,471,981 | |
Pennsylvania Housing Finance Agency Revenue Bonds, Series 137 | | 2.200% | | | 04/01/2033 | | | | 2,785,000 | | | | 2,553,387 | |
Pennsylvania Housing Finance Agency Revenue Bonds, Series 138A | | 2.700% | | | 04/01/2033 | | | | 1,500,000 | | | | 1,396,822 | |
County of Jefferson, Pennsylvania, General Obligation Refunding Bonds | | 3.000% | | | 12/15/2033 | | | | 400,000 | | | | 403,310 | |
Twin Valley School District, General Obligation Bonds, Series B | | 3.000% | | | 04/01/2034 | | | | 1,300,000 | | | | 1,287,485 | |
County of Jefferson, Pennsylvania, General Obligation Refunding Bonds | | 3.000% | | | 12/15/2035 | | | | 800,000 | | | | 804,733 | |
County of Jefferson, Pennsylvania, General Obligation Refunding Bonds | | 3.000% | | | 12/15/2037 | | | | 770,000 | | | | 764,097 | |
Millcreek Township School District, General Obligation Bonds | | 3.000% | | | 09/15/2038 | | | | 2,500,000 | | | | 2,504,869 | |
| | | | | | | | | | | | | | |
| | | | | | | | | | | | | 13,408,880 | |
| | | | | | | | | | | | | | |
Rhode Island (0.11%) | | | | | | | | | | | | | | |
Rhode Island Housing and Mortgage Finance Corporation Revenue Bonds, Series 76-A | | 2.200% | | | 10/01/2033 | | | | 780,000 | | | | 705,657 | |
| | | | | | | | | | | | | | |
South Carolina (1.64%) | | | | | | | | | | | | | | |
Fort Mill School District No. 4, General Obligation Refunding Bonds, Series A | | 4.000% | | | 03/01/2023 | | | | 2,315,000 | | | | 2,338,521 | |
Town of Fort Mill Water & Sewer System Revenue Bonds | | 3.500% | | | 12/01/2027 | | | | 380,000 | | | | 388,832 | |
Town of Fort Mill Water & Sewer System Revenue Bonds | | 4.000% | | | 12/01/2028 | | | | 520,000 | | | | 538,434 | |
City of Columbia Waterworks & Sewer System Revenue Refunding Bonds, Series B | | 4.000% | | | 02/01/2029 | | | | 1,045,000 | | | | 1,123,775 | |
Spartanburg Sanitary Sewer District Revenue Refunding Bonds, Series B (Prerefunded to 03- 01-2023 @ 100)(c) | | 5.000% | | | 03/01/2030 | | | | 2,160,000 | | | | 2,227,501 | |
Town of Fort Mill Water & Sewer System Revenue Bonds | | 4.000% | | | 12/01/2030 | | | | 535,000 | | | | 552,760 | |
| | |
| 24 | | See accompanying notes to financial statements. |
ADVISERS INVESTMENT TRUST
STATE FARM MUNICIPAL BOND FUND
SCHEDULE OF INVESTMENTS (continued)
March 31, 2022 (Unaudited)
| | | | | | | | | | | | | | |
| | | Coupon
rate | | Maturity
date | | | Principal
amount | | | Value | |
Long-term Municipal Bond (Cont.) | | | | | | | | | | | | | | |
South Carolina (Cont.) | | | | | | | | | | | | | | |
City of Columbia Waterworks & Sewer System Revenue Bonds, Series A | | 3.000% | | | 02/01/2035 | | | $ | 1,750,000 | | | $ | 1,762,832 | |
Center for Arts & Health Sciences Public Facilities Corporation Revenue Bonds | | 4.000% | | | 10/01/2036 | | | | 1,500,000 | | | | 1,663,138 | |
| | | | | | | | | | | | | | |
| | | | | | | | | | | | | 10,595,793 | |
| | | | | | | | | | | | | | |
Tennessee (0.80%) | | | | | | | | | | | | | | |
City of Knoxville Water System Revenue Refunding Bonds, Series BB | | 3.000% | | | 03/01/2025 | | | | 1,170,000 | | | | 1,181,497 | |
County of Washington, Tennessee, General Obligation Bonds, Series A | | 3.000% | | | 06/01/2030 | | | | 935,000 | | | | 963,840 | |
County of Washington, Tennessee, General Obligation Bonds, Series B | | 3.000% | | | 06/01/2030 | | | | 850,000 | | | | 876,219 | |
Harpeth Valley Utilities District of Davidson and Williamson Counties Revenue Bonds | | 5.000% | | | 09/01/2031 | | | | 1,065,000 | | | | 1,131,708 | |
City of Memphis Electric System Revenue Bonds, Series A | | 3.000% | | | 12/01/2035 | | | | 1,000,000 | | | | 1,008,225 | |
| | | | | | | | | | | | | | |
| | | | | | | | | | | | | 5,161,489 | |
| | | | | | | | | | | | | | |
Texas (2.92%) | | | | | | | | | | | | | | |
Eanes Independent School District, General Obligation Bonds, Series A | | 3.500% | | | 08/01/2026 | | | | 1,670,000 | | | | 1,727,401 | |
State of Texas, General Obligation Bonds, Series A | | 3.000% | | | 08/01/2027 | | | | 2,325,000 | | | | 2,394,143 | |
Trinity River Authority Central Regional Wastewater System Revenue Refunding Bonds | | 3.000% | | | 08/01/2031 | | | | 1,500,000 | | | | 1,556,310 | |
Upper Brushy Creek Water Control and Improvement District, General Obligation Bonds | | 3.000% | | | 08/15/2031 | | | | 1,000,000 | | | | 1,014,449 | |
City of Laredo, Texas, Waterworks & Sewer System Revenue Bonds | | 5.000% | | | 03/01/2032 | | | | 250,000 | | | | 286,783 | |
State of Texas, General Obligation Refunding Bonds, Series B | | 2.250% | | | 08/01/2032 | | | | 750,000 | | | | 715,177 | |
Lake Travis Independent School District, General Obligation Refunding Bonds | | 4.000% | | | 02/15/2033 | | | | 1,000,000 | | | | 1,071,759 | |
City of Laredo, Texas, Waterworks & Sewer System Revenue Bonds | | 5.000% | | | 03/01/2033 | | | | 200,000 | | | | 229,117 | |
Gregory-Portland Independent School District, Texas, General Obligation Bonds, Series A | | 4.000% | | | 02/15/2034 | | | | 1,565,000 | | | | 1,592,778 | |
City of Laredo, Texas, Waterworks & Sewer System Revenue Bonds | | 4.000% | | | 03/01/2034 | | | | 280,000 | | | | 303,489 | |
Gregory-Portland Independent School District, Texas, General Obligation Bonds, Series A | | 4.000% | | | 02/15/2035 | | | | 2,710,000 | | | | 2,756,694 | |
City of Laredo, Texas, Waterworks & Sewer System Revenue Bonds | | 4.000% | | | 03/01/2035 | | | | 200,000 | | | | 216,587 | |
City of Beaumont, Texas, Waterworks & Sewer System Revenue Refunding Bonds, Series A | | 4.000% | | | 09/01/2035 | | | | 1,515,000 | | | | 1,668,408 | |
City of Laredo, Texas, Waterworks & Sewer System Revenue Bonds | | 4.000% | | | 03/01/2036 | | | | 325,000 | | | | 351,714 | |
Fort Bend Grand Parkway Toll Road Authority Revenue Refunding Bonds, Series A | | 3.000% | | | 03/01/2038 | | | | 1,500,000 | | | | 1,454,839 | |
County of Bexar, Texas, General Obligation Bonds | | 3.000% | | | 06/15/2039 | | | | 1,550,000 | | | | 1,538,539 | |
| | | | | | | | | | | | | | |
| | | | | | | | | | | | | 18,878,187 | |
| | | | | | | | | | | | | | |
Utah (0.95%) | | | | | | | | | | | | | | |
Snyderville Basin Special Recreation District, General Obligation Bonds, Series A | | 3.000% | | | 12/15/2025 | | | | 1,260,000 | | | | 1,293,160 | |
Central Utah Water Conservancy District Revenue Refunding Bonds, Series B | | 4.000% | | | 10/01/2033 | | | | 2,500,000 | | | | 2,702,963 | |
Jordan Valley Water Conservancy District Revenue Refunding Bonds, Series B | | 4.000% | | | 10/01/2033 | | | | 1,000,000 | | | | 1,075,851 | |
Jordan Valley Water Conservancy District Revenue Refunding Bonds, Series B | | 4.000% | | | 10/01/2034 | | | | 1,000,000 | | | | 1,074,787 | |
| | | | | | | | | | | | | | |
| | | | | | | | | | | | | 6,146,761 | |
| | | | | | | | | | | | | | |
Vermont (0.55%) | | | | | | | | | | | | | | |
City of Burlington, Vermont, General Obligation Bonds, Series A | | 5.000% | | | 11/01/2032 | | | | 175,000 | | | | 203,357 | |
City of Burlington, Vermont, General Obligation Bonds, Series A | | 5.000% | | | 11/01/2033 | | | | 190,000 | | | | 220,642 | |
City of Burlington, Vermont, General Obligation Bonds, Series A | | 5.000% | | | 11/01/2034 | | | | 255,000 | | | | 295,834 | |
City of Burlington, Vermont, General Obligation Bonds, Series B | | 5.000% | | | 11/01/2034 | | | | 410,000 | | | | 475,655 | |
City of Burlington, Vermont, General Obligation Bonds, Series A | | 5.000% | | | 11/01/2035 | | | | 265,000 | | | | 307,187 | |
City of Burlington, Vermont, General Obligation Bonds, Series B | | 5.000% | | | 11/01/2035 | | | | 435,000 | | | | 504,250 | |
City of Burlington, Vermont, General Obligation Bonds, Series B | | 5.000% | | | 11/01/2036 | | | | 910,000 | | | | 1,053,997 | |
City of Burlington, Vermont, General Obligation Bonds, Series A | | 5.000% | | | 11/01/2037 | | | | 440,000 | | | | 509,435 | |
| | | | | | | | | | | | | | |
| | | | | | | | | | | | | 3,570,357 | |
| | | | | | | | | | | | | | |
Virginia (0.60%) | | | | | | | | | | | | | | |
Loudoun County Sanitation Authority Revenue Refunding Bonds (Prerefunded to 01-01- 2023 @ 100)(c) | | 4.000% | | | 01/01/2027 | | | | 650,000 | | | | 662,414 | |
| | |
| See accompanying notes to financial statements. | | 25 |
ADVISERS INVESTMENT TRUST
STATE FARM MUNICIPAL BOND FUND
SCHEDULE OF INVESTMENTS (continued)
March 31, 2022 (Unaudited)
| | | | | | | | | | | | | | |
| | | Coupon
rate | | Maturity
date | | | Principal
amount | | | Value | |
Long-term Municipal Bond (Cont.) | | | | | | | | | | | | | | |
Virginia (Cont.) | | | | | | | | | | | | | | |
County of Stafford, Virginia, General Obligation Bonds | | 4.000% | | | 07/01/2030 | | | $ | 1,205,000 | | | $ | 1,238,517 | |
Virginia Public School Authority Revenue Bonds, Series D (Prerefunded to 08-01-2022 @ 100)(c) | | 4.000% | | | 08/01/2030 | | | | 2,000,000 | | | | 2,019,254 | |
| | | | | | | | | | | | | | |
| | | | | | | | | | | | | 3,920,185 | |
| | | | | | | | | | | | | | |
Washington (6.42%) | | | | | | | | | | | | | | |
Walla Walla County School District No. 250 College Place, General Obligation Bonds(c) | | 4.000% | | | 12/01/2024 | | | | 1,875,000 | | | | 1,884,039 | |
City of Spokane, Washington, General Obligation Bonds | | 3.000% | | | 12/01/2025 | | | | 1,295,000 | | | | 1,328,313 | |
King County School District No 414 Lake Washington, General Obligation Refunding Bonds | | 3.500% | | | 12/01/2025 | | | | 2,000,000 | | | | 2,108,844 | |
State of Washington, General Obligation Refunding Bonds, Series A | | 4.000% | | | 07/01/2026 | | | | 2,500,000 | | | | 2,565,484 | |
Clark County School District No. 98 Hockinson, General Obligation Bonds | | 4.000% | | | 12/01/2027 | | | | 1,090,000 | | | | 1,154,537 | |
City of Camas, Washington, Water & Sewer Revenue Refunding Bonds | | 4.000% | | | 12/01/2028 | | | | 1,050,000 | | | | 1,117,550 | |
City of Tacoma, Washington, Sewer Revenue Refunding Bonds, Series A | | 3.250% | | | 12/01/2028 | | | | 350,000 | | | | 364,818 | |
King County School District No 414 Lake Washington, General Obligation Refunding Bonds | | 4.000% | | | 12/01/2028 | | | | 1,000,000 | | | | 1,071,920 | |
Public Utility District No. 1 of Cowlitz County, Washington, Revenue Refunding Bonds | | 5.000% | | | 09/01/2029 | | | | 1,000,000 | | | | 1,050,649 | |
City of Camas, Washington, Water & Sewer Revenue Refunding Bonds | | 3.130% | | | 12/01/2029 | | | | 2,000,000 | | | | 2,073,844 | |
City of Tacoma Solid Waste Utility Revenue Refunding Bonds, Series B | | 5.000% | | | 12/01/2029 | | | | 1,525,000 | | | | 1,693,055 | |
Clark County Public Utility District No. 1 Revenue Refunding Bonds | | 5.000% | | | 01/01/2030 | | | | 985,000 | | | | 1,033,441 | |
Energy Northwest Revenue Refunding Bonds | | 5.000% | | | 07/01/2030 | | | | 5,000,000 | | | | 5,447,604 | |
Public Utility District No. 1 of Cowlitz County, Washington, Revenue Refunding Bonds | | 5.000% | | | 09/01/2030 | | | | 2,100,000 | | | | 2,205,558 | |
King County School District No 414 Lake Washington, General Obligation Bonds | | 4.000% | | | 12/01/2033 | | | | 5,000,000 | | | | 5,394,424 | |
King County School District No. 405 Bellevue, General Obligation Bonds | | 3.000% | | | 12/01/2033 | | | | 5,095,000 | | | | 5,173,607 | |
Kitsap County School District No. 303 Bainbridge Island, General Obligation Bonds, Series A | | 4.000% | | | 12/01/2033 | | | | 840,000 | | | | 905,839 | |
Clark County Public Utility District No. 1 Revenue Refunding Bonds | | 5.000% | | | 01/01/2034 | | | | 1,010,000 | | | | 1,126,511 | |
Kitsap County School District No. 303 Bainbridge Island, General Obligation Bonds, Series A | | 4.000% | | | 12/01/2034 | | | | 510,000 | | | | 549,203 | |
Yakima & Kittitas Counties School District No. 119 Selah, General Obligation Bonds | | 4.380% | | | 12/01/2034 | | | | 1,040,000 | | | | 1,158,313 | |
Lakehaven Water & Sewer District Revenue Bonds | | 3.000% | | | 10/01/2035 | | | | 700,000 | | | | 709,288 | |
Okanogan County Public Utility District No. 1 Revenue Bonds, Series A | | 4.000% | | | 12/01/2035 | | | | 500,000 | | | | 546,171 | |
Okanogan County Public Utility District No. 1 Revenue Bonds, Series A | | 4.000% | | | 12/01/2037 | | | | 800,000 | | | | 872,586 | |
| | | | | | | | | | | | | | |
| | | | | | | | | | | | | 41,535,598 | |
| | | | | | | | | | | | | | |
West Virginia (0.66%) | | | | | | | | | | | | | | |
Monongalia County Board of Education, General Obligation Refunding Bonds (Prerefunded to 05-01-2022 @ 100)(c) | | 4.000% | | | 05/01/2025 | | | | 1,105,000 | | | | 1,107,579 | |
Braxton County Board of Education, General Obligation Refunding Bonds | | 4.000% | | | 05/01/2026 | | | | 250,000 | | | | 266,673 | |
Braxton County Board of Education, General Obligation Refunding Bonds | | 2.250% | | | 05/01/2026 | | | | 125,000 | | | | 125,841 | |
Monongalia County Board of Education, General Obligation Refunding Bonds (Prerefunded to 05-01-2022 @ 100)(c) | | 4.000% | | | 05/01/2026 | | | | 2,180,000 | | | | 2,185,088 | |
Braxton County Board of Education, General Obligation Refunding Bonds | | 5.000% | | | 05/01/2027 | | | | 515,000 | | | | 575,450 | |
| | | | | | | | | | | | | | |
| | | | | | | | | | | | | 4,260,631 | |
| | | | | | | | | | | | | | |
Wisconsin (5.76%) | | | | | | | | | | | | | | |
Milwaukee Metropolitan Sewerage District, General Obligation Refunding Bonds, Series C | | 2.500% | | | 10/01/2024 | | | | 2,000,000 | | | | 2,029,281 | |
Muskego-Norway School District, General Obligation Bonds | | 3.000% | | | 04/01/2026 | | | | 2,495,000 | | | | 2,579,334 | |
Ellsworth Community School District, Wisconsin, General Obligation Bonds (Prerefunded to 04-01-2024 @ 100)(c) | | 4.000% | | | 04/01/2027 | | | | 340,000 | | | | 354,138 | |
Ellsworth Community School District, Wisconsin, General Obligation Bonds (Prerefunded to 04-01-2024 @ 100)(c) | | 4.000% | | | 04/01/2028 | | | | 275,000 | | | | 286,435 | |
Ellsworth Community School District, Wisconsin, General Obligation Bonds (Prerefunded to 04-01-2024 @ 100)(c) | | 4.000% | | | 04/01/2029 | | | | 400,000 | | | | 416,633 | |
Central Brown County Water Authority Revenue Refunding Bonds, Series A | | 5.000% | | | 11/01/2029 | | | | 1,000,000 | | | | 1,070,720 | |
Wisconsin-Dells School District, General Obligation Bonds | | 3.130% | | | 03/01/2030 | | | | 1,595,000 | | | | 1,624,581 | |
Central Brown County Water Authority Revenue Refunding Bonds, Series A | | 5.000% | | | 11/01/2030 | | | | 2,000,000 | | | | 2,141,439 | |
City of Fond Du Lac, Wisconsin, General Obligation Refunding Bonds, Series A | | 2.000% | | | 03/01/2031 | | | | 895,000 | | | | 821,120 | |
County of Waupaca, Wisconsin, General Obligation Bonds, Series A | | 3.250% | | | 03/01/2031 | | | | 1,160,000 | | | | 1,196,340 | |
| | |
| 26 | | See accompanying notes to financial statements. |
ADVISERS INVESTMENT TRUST
STATE FARM MUNICIPAL BOND FUND
SCHEDULE OF INVESTMENTS (continued)
March 31, 2022 (Unaudited)
| | | | | | | | | | | | | | | | |
| | | Coupon
rate | | | Maturity
date | | | Principal
amount | | | Value | |
Long-term Municipal Bond (Cont.) | | | | | | | | | | | | | | | | |
Wisconsin (Cont.) | | | | | | | | | | | | | | | | |
Wisconsin-Dells School District, General Obligation Bonds | | | 3.250% | | | | 03/01/2031 | | | $ | 1,395,000 | | | $ | 1,427,683 | |
Burlington Area School District, General Obligation Bonds | | | 3.130% | | | | 04/01/2031 | | | | 1,000,000 | | | | 1,018,777 | |
D. C. Everest Area School District, General Obligation Bonds | | | 3.380% | | | | 04/01/2031 | | | | 3,900,000 | | | | 4,018,451 | |
Poynette School District, General Obligation Bonds | | | 3.000% | | | | 04/01/2031 | | | | 850,000 | | | | 863,021 | |
Western Technical College District, General Obligation Bonds, Series C(g) | | | 4.000% | | | | 04/01/2031 | | | | 1,000,000 | | | | 1,092,921 | |
City of Muskego, Wisconsin, General Obligation Refunding Bonds, Series A | | | 4.000% | | | | 06/01/2031 | | | | 300,000 | | | | 324,272 | |
Central Brown County Water Authority Revenue Refunding Bonds, Series A | | | 5.000% | | | | 11/01/2031 | | | | 2,200,000 | | | | 2,355,583 | |
Burlington Area School District, General Obligation Bonds | | | 3.250% | | | | 04/01/2032 | | | | 1,120,000 | | | | 1,146,362 | |
Hamilton School District, Wisconsin, General Obligation Bonds | | | 3.250% | | | | 04/01/2032 | | | | 3,390,000 | | | | 3,485,728 | |
Poynette School District, General Obligation Bonds | | | 3.130% | | | | 04/01/2032 | | | | 1,520,000 | | | | 1,546,970 | |
Western Technical College District, General Obligation Refunding Bonds, Series F | | | 3.000% | | | | 04/01/2032 | | | | 2,240,000 | | | | 2,275,834 | |
City of Muskego, Wisconsin, General Obligation Refunding Bonds, Series A | | | 4.000% | | | | 06/01/2032 | | | | 675,000 | | | | 728,588 | |
City of Muskego, Wisconsin, General Obligation Refunding Bonds, Series A | | | 4.000% | | | | 06/01/2034 | | | | 1,390,000 | | | | 1,494,050 | |
Sun Prairie Area School District, Wisconsin, General Obligation Refunding Bonds | | | 3.000% | | | | 03/01/2035 | | | | 1,405,000 | | | | 1,420,040 | |
Sun Prairie Area School District, Wisconsin, General Obligation Refunding Bonds | | | 3.000% | | | | 03/01/2036 | | | | 1,535,000 | | | | 1,550,353 | |
| | | | | | | | | | | | | | | | |
| | | | | | | | | | | | | | | 37,268,654 | |
| | | | | | | | | | | | | | | | |
Total Long-term Municipal Bond (cost $622,252,907) | | | | | | | | | | | | | | | 622,344,542 | |
| | | | | | | | | | | | | | | | |
| | | | |
| | | | | | | | | Shares | | | Value | |
Short-term Investments (3.32%) | | | | | | | | | | | | | | | | |
Northern Institutional Treasury Portfolio (Premier Class), 0.12%(i) | | | | | | | | | | | 21,470,629 | | | | 21,470,629 | |
| | | | | | | | | | | | | | | | |
Total Short-term Investments (cost $21,470,629) | | | | | | | | | | | | | | | 21,470,629 | |
| | | | | | | | | | | | | | | | |
TOTAL INVESTMENTS (99.45%) (cost $643,723,536) | | | | | | | | | | | | | | | 643,815,171 | |
OTHER ASSETS, NET OF LIABILITIES (0.55%) | | | | | | | | | | | | | | | 3,580,446 | |
| | | | | | | | | | | | | | | | |
NET ASSETS (100.00%) | | | | | | | | | | | | | | $ | 647,395,617 | |
| | | | | | | | | | | | | | | | |
| (a) | Security has converted to a fixed rate as of December 9, 2021, and will continue at a fixed rate going forward. |
| (b) | Rate shown is fixed until mandatory tender date of July 1, 2026. |
| (c) | Advanced Refunded Bonds are backed by an escrow or trust containing U.S. Government, U.S. Government Agency or other securities to support the timely payment of principal and interest. |
| (d) | Security has converted to a fixed rate as of July 1, 2016, and will continue ar a fixed rate going forward. |
| (e) | Security has converted to a fixed rate as of November 19, 2021, and will continue at a fixed rate going forward. |
| (f) | Security has converted to a fixed rate as of November 30, 2021, and will continue at a fixed rate going forward. |
| (g) | When issued security. Coupon rate was not in effect at March 31, 2022. |
| (h) | Security has converted to a fixed rate as of December 16, 2021, and will continue at a fixed rate going forward. |
| (i) | Rate shown is the 7-day yield as of March 31, 2022. |
| | |
| See accompanying notes to financial statements. | | 27 |
ADVISERS INVESTMENT TRUST
STATE FARM FUNDS
STATEMENTS OF ASSETS AND LIABILITIES
March 31, 2022 (Unaudited)
| | | | | | | | | | | | | | | | |
| | | State Farm
Growth Fund | | | State Farm
Balanced Fund | | | State Farm
Interim Fund | | | State Farm
Municipal Bond Fund | |
| | | | |
Assets | | | | | | | | | | | | | | | | |
Investments in securities at identified cost | | $ | 1,994,461,971 | | | | 1,131,957,573 | | | | 408,798,830 | | | | 643,723,536 | |
| | | | | | | | | | | | | | | | |
Investments in securities at market value | | $ | 6,983,892,761 | | | | 2,400,017,327 | | | | 394,080,011 | | | | 643,815,171 | |
Foreign currency (Cost: $0, $404, $0, and $0, respectively) | | | — | | | | 404 | | | | — | | | | — | |
Receivables: | | | | | | | | | | | | | | | | |
Dividends and interest | | | 9,385,083 | | | | 5,445,008 | | | | 1,192,723 | | | | 5,787,485 | |
Reclaims | | | 1,168,123 | | | | 384,478 | | | | — | | | | — | |
Securities sold | | | — | | | | 9,868,555 | | | | 10,321,421 | | | | 2,829,760 | |
Shares of the Fund sold | | | 2,435,663 | | | | 574,644 | | | | 101,025 | | | | — | |
Prepaid expenses | | | 290,650 | | | | 109,398 | | | | 22,552 | | | | 17,314 | |
| | | | | | | | | | | | | | | | |
Total assets | | | 6,997,172,280 | | | | 2,416,399,814 | | | | 405,717,732 | | | | 652,449,730 | |
| | | | | | | | | | | | | | | | |
| | | | |
Liabilities and Net Assets | | | | | | | | | | | | | | | | |
Distributions to shareholders | | | — | | | | — | | | | 1,959 | | | | 245,254 | |
Payables: | | | | | | | | | | | | | | | | |
Securities purchased | | | — | | | | 19,163,223 | | | | 8,448,238 | | | | 4,386,525 | |
Shares of the Fund redeemed | | | 1,842,537 | | | | 267,458 | | | | 864,331 | | | | 70,474 | |
Investment advisory fees | | | 576,424 | | | | 220,390 | | | | 41,495 | | | | 61,669 | |
Accounting and Administration fees | | | 1,900,735 | | | | 749,814 | | | | 180,770 | | | | 211,517 | |
Trustees’ fees and expenses | | | 2,303 | | | | 1,383 | | | | 685 | | | | 940 | |
Regulatory and Compliance fees | | | 85,640 | | | | 37,255 | | | | 4,307 | | | | 7,045 | |
Registration fees | | | 24,564 | | | | 4,887 | | | | 210 | | | | 331 | |
Variation margin on futures contracts | | | 747,113 | | | | — | | | | — | | | | — | |
Accrued expenses and other payables | | | 100,191 | | | | 65,834 | | | | 55,319 | | | | 70,358 | |
| | | | | | | | | | | | | | | | |
Total liabilities | | | 5,279,507 | | | | 20,510,244 | | | | 9,597,314 | | | | 5,054,113 | |
| | | | | | | | | | | | | | | | |
Net assets applicable to shares outstanding of common stock | | $ | 6,991,892,773 | | | | 2,395,889,570 | | | | 396,120,418 | | | | 647,395,617 | |
| | | | | | | | | | | | | | | | |
Fund shares outstanding (no par value, unlimited number of shares authorized) | | | 65,415,664 | | | | 27,486,018 | | | | 40,705,323 | | | | 77,070,715 | |
Net asset value, offering price and redemption price per share | | $ | 106.88 | | | | 87.17 | | | | 9.73 | | | | 8.40 | |
| | | | | | | | | | | | | | | | |
| | | | |
Analysis of Net Assets | | | | | | | | | | | | | | | | |
Paid-in-capital | | $ | 1,998,527,535 | | | | 1,097,418,698 | | | | 411,422,316 | | | | 648,114,654 | |
Total distributable earnings (loss) | | | 4,993,365,238 | | | | 1,298,470,872 | | | | (15,301,898 | ) | | | (719,037 | ) |
| | | | | | | | | | | | | | | | |
Net assets applicable to shares outstanding | | $ | 6,991,892,773 | | | | 2,395,889,570 | | | | 396,120,418 | | | | 647,395,617 | |
| | | | | | | | | | | | | | | | |
| | |
| 28 | | See accompanying notes to financial statements. |
ADVISERS INVESTMENT TRUST
STATE FARM FUNDS
STATEMENTS OF OPERATIONS
6-month period ended March 31, 2022 (Unaudited)
| | | | | | | | | | | | | | | | |
| | | State Farm
Growth Fund | | | State Farm
Balanced Fund | | | State Farm
Interim
Fund | | | State Farm
Municipal Bond Fund | |
Investment Income: | | | | | | | | | | | | | | | | |
Dividends | | $ | 58,096,987 | | | | 14,121,903 | | | | 169 | | | | 2,677 | |
Interest | | | 3,107 | | | | 6,132,855 | | | | 2,104,626 | | | | 8,508,625 | |
| | | | | | | | | | | | | | | | |
| | | 58,100,094 | | | | 20,254,758 | | | | 2,104,795 | | | | 8,511,302 | |
Less: foreign withholding taxes | | | (91,690 | ) | | | (15,891 | ) | | | — | | | | — | |
| | | | | | | | | | | | | | | | |
Total investment income | | | 58,008,404 | | | | 20,238,867 | | | | 2,104,795 | | | | 8,511,302 | |
Expenses: | | | | | | | | | | | | | | | | |
Investment advisory fees | | | 3,447,187 | | | | 1,324,169 | | | | 253,754 | | | | 376,455 | |
Accounting and Administration fees | | | 1,542,636 | | | | 607,260 | | | | 146,979 | | | | 173,354 | |
Trustees’ fees and expenses | | | 46,392 | | | | 15,812 | | | | 2,488 | | | | 4,146 | |
Insurance fees | | | 6,421 | | | | 2,310 | | | | 446 | | | | 703 | |
Regulatory and Compliance fees | | | 166,499 | | | | 56,111 | | | | 9,905 | | | | 16,113 | |
Registration fees | | | 44,010 | | | | 20,443 | | | | 16,689 | | | | 17,485 | |
Other | | | 122,893 | | | | 71,584 | | | | 40,830 | | | | 41,098 | |
| | | | | | | | | | | | | | | | |
Total expenses | | | 5,376,038 | | | | 2,097,689 | | | | 471,091 | | | | 629,354 | |
Less: expense reductions from Adviser | | | (1,239,375 | ) | | | (412,384 | ) | | | (132,755 | ) | | | (81,783 | ) |
| | | | | | | | | | | | | | | | |
Net expenses | | | 4,136,663 | | | | 1,685,305 | | | | 338,336 | | | | 547,571 | |
| | | | | | | | | | | | | | | | |
Net investment income | | | 53,871,741 | | | | 18,553,562 | | | | 1,766,459 | | | | 7,963,731 | |
| | | | |
Realized and unrealized gain (loss): | | | | | | | | | | | | | | | | |
Net realized gain (loss) on sales of investments | | | (29,666,020 | ) | | | 33,901,089 | | | | (415,904 | ) | | | (810,541 | ) |
Net realized gain (loss) on futures contracts | | | (2,558,532 | ) | | | (399,643 | ) | | | — | | | | — | |
Change in net unrealized appreciation (depreciation) on investments and foreign currency transactions | | | 606,694,356 | | | | 76,459,829 | | | | (18,933,702 | ) | | | (36,399,777 | ) |
Change in net unrealized appreciation (depreciation) on futures contracts | | | 5,742,158 | | | | 590,638 | | | | — | | | | — | |
| | | | | | | | | | | | | | | | |
Net realized and unrealized gain (loss) on investments | | | 580,211,962 | | | | 110,551,913 | | | | (19,349,606 | ) | | | (37,210,318 | ) |
| | | | | | | | | | | | | | | | |
Net change in net assets resulting from operations | | $ | 634,083,703 | | | | 129,105,475 | | | | (17,583,147 | ) | | | (29,246,587 | ) |
| | | | | | | | | | | | | | | | |
| | |
| See accompanying notes to financial statements. | | 29 |
ADVISERS INVESTMENT TRUST
STATE FARM FUNDS
STATEMENTS OF CHANGES IN NET ASSETS
| | | | | | | | | | | | | | |
| | | | | State Farm
Growth Fund | |
6-month period ended March 31, 2022 (Unaudited), 10-month period ended September 30, 2021 and year ended November 30, 2020 | | | | 2022 | | | 2021(a) | | | 2020 | |
From operations: | | | | | | | | | | | | | | |
Net investment income | | | | $ | 53,871,741 | | | | 99,275,839 | | | | 122,110,348 | |
Net realized gain (loss) | | | | | (32,224,552 | ) | | | 880,314,306 | | | | 50,580,861 | |
Change in net unrealized appreciation or depreciation | | | | | 612,436,514 | | | | 54,068,781 | | | | 495,954,432 | |
| | | | | | | | | | | | | | |
Net change in net assets resulting from operations | | | | | 634,083,703 | | | | 1,033,658,926 | | | | 668,645,641 | |
Distributions to shareholders from: | | | | | | | | | | | | | | |
Distributable earnings (Net investment income, Net realized gain) | | | | | (925,339,359 | ) | | | (167,458,952 | ) | | | (181,531,414 | ) |
| | | | | | | | | | | | | | |
Total distributions to shareholders | | | | | (925,339,359 | ) | | | (167,458,952 | ) | | | (181,531,414 | ) |
From Fund share transactions: | | | | | | | | | | | | | | |
Proceeds from shares sold | | | | | 152,207,086 | | | | 242,938,509 | | | | 245,052,230 | |
Reinvestment of distributions | | | | | 865,282,742 | | | | 156,291,906 | | | | 170,226,604 | |
Less payments for shares redeemed | | | | | (323,313,136 | ) | | | (496,221,789 | ) | | | (585,160,917 | ) |
| | | | | | | | | | | | | | |
Net increase (decrease) in net assets from Fund share transactions | | | | | 694,176,692 | | | | (96,991,374 | ) | | | (169,882,083 | ) |
| | | | | | | | | | | | | | |
Total increase (decrease) in net assets | | | | | 402,921,036 | | | | 769,208,600 | | | | 317,232,144 | |
| | | | | | | | | | | | | | |
Net assets: | | | | | | | | | | | | | | |
Beginning of period | | | | | 6,588,971,737 | | | | 5,819,763,137 | | | | 5,502,530,993 | |
| | | | | | | | | | | | | | |
End of period | | | | $ | 6,991,892,773 | | | | 6,588,971,737 | | | | 5,819,763,137 | |
| | | | | | | | | | | | | | |
| | | | |
Share Information | | | | | | | | | | | | | | |
Sold | | | | | 1,374,490 | | | | 2,218,847 | | | | 2,888,825 | |
Issued in reinvestment of distributions | | | | | 8,136,180 | | | | 1,504,514 | | | | 1,943,120 | |
Redeemed | | | | | (2,912,918 | ) | | | (4,519,526 | ) | | | (6,785,766 | ) |
| | | | | | | | | | | | | | |
Net increase (decrease) | | | | | 6,597,752 | | | | (796,165 | ) | | | (1,953,821 | ) |
| | | | | | | | | | | | | | |
(a) As part of the Reorganization, the annual reporting period was adjusted to end September 30 instead of the previous November 30 end date.
| | |
| 30 | | See accompanying notes to financial statements. |
ADVISERS INVESTMENT TRUST
STATE FARM FUNDS
STATEMENTS OF CHANGES IN NET ASSETS (continued)
| | | | | | | | | | | | | | | | | | | | | | | | | | | | | | | | | | |
State Farm
Balanced Fund | | | State Farm Interim Fund | | | State Farm
Municipal Bond Fund | |
| | | | | | | | |
| 2022 | | | 2021(a) | | | 2020 | | | 2022 | | | 2021(a) | | | 2020 | | | 2022 | | | 2021(a) | | | 2020 | |
| | | | | | | | | | | | | | | | | | | | | | | | | | | | | | | | | | |
| | 18,553,562 | | | | 38,230,087 | | | | 47,326,599 | | | | 1,766,459 | | | | 4,057,462 | | | | 5,811,934 | | | | 7,963,731 | | | | 14,240,907 | | | | 18,120,053 | |
| | 33,501,446 | | | | 235,855,423 | | | | 17,222,752 | | | | (415,904 | ) | | | 445,382 | | | | (4,405 | ) | | | (810,541 | ) | | | 677,242 | | | | 671,779 | |
| | 77,050,467 | | | | 17,813,122 | | | | 163,695,182 | | | | (18,933,702 | ) | | | (8,360,259 | ) | | | 9,183,914 | | | | (36,399,777 | ) | | | (12,352,315 | ) | | | 18,059,864 | |
| | | | | | | | | | | | | | | | | | | | | | | | | | | | | | | | | | |
| | 129,105,475 | | | | 291,898,632 | | | | 228,244,533 | | | | (17,583,147 | ) | | | (3,857,415 | ) | | | 14,991,443 | | | | (29,246,587 | ) | | | 2,565,834 | | | | 36,851,696 | |
| | | | | | | | | | | | | | | | | | | | | | | | | | | | | | | | | | |
| | (196,746,433 | ) | | | (62,452,726 | ) | | | (55,983,773 | ) | | | (1,988,014 | ) | | | (4,057,461 | ) | | | (5,811,934 | ) | | | (8,641,116 | ) | | | (14,912,673 | ) | | | (18,438,528 | ) |
| | | | | | | | | | | | | | | | | | | | | | | | | | | | | | | | | | |
| | (196,746,433 | ) | | | (62,452,726 | ) | | | (55,983,773 | ) | | | (1,988,014 | ) | | | (4,057,461 | ) | | | (5,811,934 | ) | | | (8,641,116 | ) | | | (14,912,673 | ) | | | (18,438,528 | ) |
| | | | | | | | | | | | | | | | | | | | | | | | | | | | | | | | | | |
| | 69,547,383 | | | | 112,042,679 | | | | 133,601,946 | | | | 49,958,066 | | | | 92,251,211 | | | | 272,566,071 | | | | 26,227,096 | | | | 53,524,197 | | | | 78,430,037 | |
| | 187,363,170 | | | | 59,348,012 | | | | 53,290,330 | | | | 1,972,092 | | | | 3,977,917 | | | | 5,716,538 | | | | 7,142,452 | | | | 12,426,596 | | | | 15,338,456 | |
| | (153,603,214 | ) | | | (291,674,445 | ) | | | (229,868,707 | ) | | | (83,212,754 | ) | | | (136,512,953 | ) | | | (142,990,378 | ) | | | (51,229,587 | ) | | | (91,470,624 | ) | | | (82,077,036 | ) |
| | | | | | | | | | | | | | | | | | | | | | | | | | | | | | | | | | |
| | 103,307,339 | | | | (120,283,754 | ) | | | (42,976,431 | ) | | | (31,282,596 | ) | | | (40,283,825 | ) | | | 135,292,231 | | | | (17,860,039 | ) | | | (25,519,831 | ) | | | 11,691,457 | |
| | | | | | | | | | | | | | | | | | | | | | | | | | | | | | | | | | |
| | 35,666,381 | | | | 109,162,152 | | | | 129,284,329 | | | | (50,853,757 | ) | | | (48,198,701 | ) | | | 144,471,740 | | | | (55,747,742 | ) | | | (37,866,670 | ) | | | 30,104,625 | |
| | | | | | | | | | | | | | | | | | | | | | | | | | | | | | | | | | |
| | | | | | | | | | | | | | | | | | | | | | | | | | | | | | | | | | |
| | 2,360,223,189 | | | | 2,251,061,037 | | | | 2,121,776,708 | | | | 446,974,175 | | | | 495,172,876 | | | | 350,701,136 | | | | 703,143,359 | | | | 741,010,029 | | | | 710,905,404 | |
| | | | | | | | | | | | | | | | | | | | | | | | | | | | | | | | | | |
| | 2,395,889,570 | | | | 2,360,223,189 | | | | 2,251,061,037 | | | | 396,120,418 | | | | 446,974,175 | | | | 495,172,876 | | | | 647,395,617 | | | | 703,143,359 | | | | 741,010,029 | |
| | | | | | | | | | | | | | | | | | | | | | | | | | | | | | | | | | |
| | | | | | | | |
| | | | | | | | | | | | | | | | | | | | | | | | | | | | | | | | | | |
| | 781,053 | | | | 1,269,269 | | | | 1,807,747 | | | | 4,989,952 | | | | 8,956,788 | | | | 26,310,110 | | | | 2,989,777 | | | | 5,955,927 | | | | 8,786,824 | |
| | 2,137,142 | �� | | | 696,524 | | | | 717,928 | | | | 196,998 | | | | 387,700 | | | | 552,545 | | | | 817,354 | | | | 1,386,283 | | | | 1,714,383 | |
| | (1,718,253 | ) | | | (3,245,420 | ) | | | (3,118,768 | ) | | | (8,307,543 | ) | | | (13,296,342 | ) | | | (13,820,577 | ) | | | (5,857,388 | ) | | | (10,195,898 | ) | | | (9,318,579 | ) |
| | | | | | | | | | | | | | | | | | | | | | | | | | | | | | | | | | |
| | 1,199,942 | | | | (1,279,627 | ) | | | (593,093 | ) | | | (3,120,593 | ) | | | (3,951,854 | ) | | | 13,042,078 | | | | (2,050,257 | ) | | | (2,853,688 | ) | | | 1,182,628 | |
| | | | | | | | | | | | | | | | | | | | | | | | | | | | | | | | | | |
| | |
| See accompanying notes to financial statements. | | 31 |
ADVISERS INVESTMENT TRUST
STATE FARM FUNDS
FINANCIAL HIGHLIGHTS
The financial highlights table is intended to help you understand the financial performance of each Fund for the past five years. Because each Fund is a continuation of its respective Predecessor Fund, each of which was a series of State Farm Associates’ Funds Trust, the following financial information includes results of each Fund’s respective Predecessor Fund. Certain information reflects financial results for a single Fund share. The total returns within each table represent the rate that an investor would have earned (or lost) on an investment in the Fund (assuming reinvestment of all dividends and distributions).
STATE FARM GROWTH FUND
(For a share outstanding throughout each period)
| | | | | | | | | | | | | | | | | | | | | | | | | | | | |
| | | 6-month period ended | | | | | | | | | | | | | | | | | |
| | | March 31, | | 10-month period ended | | | |
| | | 2022 | | September 30, | | Year ended November 30, | |
| | | (Unaudited) | | 2021 | | 2020 | | | 2019 | | | 2018 | | | 2017 | | | 2016 | |
Net asset value, beginning of period | | | $ 112.02 | | | | 97.62 | | | | 89.37 | | | | 81.06 | | | | 80.41 | | | | 70.41 | | | | 73.38 | |
| | | | | | | |
Income from Investment Operations | | | | | | | | | | | | | | | | | | | | | | | | | | | | |
Net investment income(a) | | | 0.86 | | | | 1.67 | | | | 1.99 | | | | 2.13 | | | | 1.93 | | | | 1.84 | | | | 1.75 | |
Net gain (loss) on investments (both realized and unrealized) | | | 9.94 | | | | 15.56 | | | | 9.22 | | | | 9.30 | | | | 1.51 | | | | 10.50 | | | | 4.15 | |
| | | | | | | | | | | | | | | | | | | | | | | | | | | | |
Total from invesment operations | | | 10.80 | | | | 17.23 | | | | 11.21 | | | | 11.43 | | | | 3.44 | | | | 12.34 | | | | 5.90 | |
| | | | | | | | | | | | | | | | | | | | | | | | | | | | |
| | | | | | | |
Less Distributions | | | | | | | | | | | | | | | | | | | | | | | | | | | | |
Net investment income | | | (1.03 | ) | | | (1.97 | ) | | | (2.11 | ) | | | (2.09 | ) | | | (1.90 | ) | | | (1.78 | ) | | | (1.76 | ) |
Net realized gain | | | (14.91 | ) | | | (0.86 | ) | | | (0.85 | ) | | | (1.03 | ) | | | (0.89 | ) | | | (0.56 | ) | | | (7.11 | ) |
| | | | | | | | | | | | | | | | | | | | | | | | | | | | |
Total distributions | | | (15.94 | ) | | | (2.83 | ) | | | (2.96 | ) | | | (3.12 | ) | | | (2.79 | ) | | | (2.34 | ) | | | (8.87 | ) |
| | | | | | | | | | | | | | | | | | | | | | | | | | | | |
Net asset value, end of period | | | $ 106.88 | | | | 112.02 | | | | 97.62 | | | | 89.37 | | | | 81.06 | | | | 80.41 | | | | 70.41 | |
| | | | | | | | | | | | | | | | | | | | | | | | | | | | |
| | | | | | | |
Total Return | | | 9.71 | %(b) | | | 17.89 | %(b) | | | 12.96 | % | | | 14.91 | % | | | 4.41 | % | | | 17.91 | % | | | 9.54 | % |
| | | | | | | |
Ratios/Supplemental Data | | | | | | | | | | | | | | | | | | | | | | | | | | | | |
Net assets, end of period (millions) | | | $6,991.9 | | | | 6,589.0 | | | | 5,819.8 | | | | 5,502.5 | | | | 4,992.6 | | | | 4,960.5 | | | | 4,296.6 | |
| | | | | | | |
Average net asset ratios | | | | | | | | | | | | | | | | | | | | | | | | | | | | |
Expenses, net of waivers and reimbursements | | | 0.12 | %(c) | | | 0.12 | %(c) | | | 0.12 | % | | | 0.12 | % | | | 0.12 | % | | | 0.12 | % | | | 0.12 | % |
Expenses, gross of waivers and reimburements | | | 0.16 | %(c) | | | 0.13 | %(c) | | | 0.12 | % | | | 0.12 | % | | | 0.12 | % | | | 0.12 | % | | | 0.12 | % |
Net investment income, net of waivers and reimbursements | | | 1.56 | %(c) | | | 1.81 | %(c) | | | 2.29 | % | | | 2.62 | % | | | 2.42 | % | | | 2.46 | % | | | 2.59 | % |
| | | | | | | |
Portfolio turnover rate | | | 13 | %(b) | | | 23 | %(b),(d),(e) | | | 0 | % | | | 1 | % | | | 0 | %(f) | | | 1 | % | | | 0 | % |
| (a) | Average shares outstanding for the period were used to calculate net investment income per share. |
| (b) | Not annualized for periods that are less than a full year. |
| (c) | Determined on an annualized basis. |
| (d) | The portfolio turnover rate excludes securities delivered from processing redemptions in-kind. |
| (e) | The portfolio turnover rate increased due to certain investment activity in connection with the Reorganization of the Fund from the State Farm Associates’ Fund Trust into the Advisers Investment Trust. |
| (f) | Portfolio turnover rate rounds to less than 1% for the year ended November 30, 2018. |
| | |
| 32 | | See accompanying notes to financial statements. |
ADVISERS INVESTMENT TRUST
STATE FARM FUNDS
FINANCIAL HIGHLIGHTS (continued)
STATE FARM BALANCED FUND
(For a share outstanding throughout each period)
| | | | | | | | | | | | | | | | | | | | | | | | | | | | |
| | | 6-month period ended | | | | | | | | | | | | | | | | | |
| | | March 31, | | 10-month period ended | | | |
| | | 2022 | | September 30, | | Year ended November 30, | |
| | | (Unaudited) | | 2021 | | 2020 | | | 2019 | | | 2018 | | | 2017 | | | 2016 | |
Net asset value, beginning of period | | | $ 89.79 | | | | 81.66 | | | | 75.35 | | | | 68.52 | | | | 68.84 | | | | 63.19 | | | | 66.38 | |
| | | | | | | |
Income from Investment Operations | | | | | | | | | | | | | | | | | | | | | | | | | | | | |
Net investment income(a) | | | 0.69 | | | | 1.41 | | | | 1.69 | | | | 1.81 | | | | 1.70 | | | | 1.65 | | | | 1.63 | |
Net gain (loss) on investments (both realized and unrealized) | | | 4.30 | | | | 9.03 | | | | 6.62 | | | | 7.30 | | | | (0.03 | ) | | | 5.75 | | | | 1.76 | |
| | | | | | | | | | | | | | | | | | | | | | | | | | | | |
Total from invesment operations | | | 4.99 | | | | 10.44 | | | | 8.31 | | | | 9.11 | | | | 1.67 | | | | 7.40 | | | | 3.39 | |
| | | | | | | | | | | | | | | | | | | | | | | | | | | | |
| | | | | | | |
Less Distributions | | | | | | | | | | | | | | | | | | | | | | | | | | | | |
Net investment income | | | (0.86 | ) | | | (1.68 | ) | | | (1.78 | ) | | | (1.79 | ) | | | (1.68 | ) | | | (1.63 | ) | | | (1.69 | ) |
Net realized gain | | | (6.75 | ) | | | (0.63 | ) | | | (0.22 | ) | | | (0.49 | ) | | | (0.31 | ) | | | (0.12 | ) | | | (4.89 | ) |
| | | | | | | | | | | | | | | | | | | | | | | | | | | | |
Total distributions | | | (7.61 | ) | | | (2.31 | ) | | | (2.00 | ) | | | (2.28 | ) | | | (1.99 | ) | | | (1.75 | ) | | | (6.58 | ) |
| | | | | | | | | | | | | | | | | | | | | | | | | | | | |
Net asset value, end of period | | | $ 87.17 | | | | 89.79 | | | | 81.66 | | | | 75.35 | | | | 68.52 | | | | 68.84 | | | | 63.19 | |
| | | | | | | | | | | | | | | | | | | | | | | | | | | | |
| | | | | | | |
Total Return | | | 5.51 | %(b) | | | 12.95 | %(b) | | | 11.31 | % | | | 13.82 | % | | | 2.49 | % | | | 11.93 | % | | | 5.83 | % |
| | | | | | | |
Ratios/Supplemental Data | | | | | | | | | | | | | | | | | | | | | | | | | | | | |
Net assets, end of period (millions) | | | $2,395.9 | | | | 2,360.2 | | | | 2,251.1 | | | | 2,121.8 | | | | 1,935.4 | | | | 1,951.1 | | | | 1,766.3 | |
| | | | | | | |
Average net asset ratios | | | | | | | | | | | | | | | | | | | | | | | | | | | | |
Expenses, net of waivers and reimbursements | | | 0.14 | %(c) | | | 0.13 | %(c) | | | 0.14 | % | | | 0.13 | % | | | 0.13 | % | | | 0.13 | % | | | 0.13 | % |
Expenses, gross of waivers and reimburements | | | 0.17 | %(c) | | | 0.14 | %(c) | | | 0.14 | % | | | 0.13 | % | | | 0.13 | % | | | 0.13 | % | | | 0.13 | % |
Net investment income, net of waivers and reimbursements | | | 1.54 | %(c) | | | 1.90 | %(c) | | | 2.27 | % | | | 2.59 | % | | | 2.50 | % | | | 2.52 | % | | | 2.63 | % |
| | | | | | | |
Portfolio turnover rate | | | 11 | %(b) | | | 22 | %(b),(d),(e) | | | 3 | % | | | 4 | % | | | 5 | % | | | 4 | % | | | 4 | % |
| (a) | Average shares outstanding for the period were used to calculate net investment income per share. |
| (b) | Not annualized for periods that are less than a full year. |
| (c) | Determined on an annualized basis. |
| (d) | The portfolio turnover rate excludes securities delivered from processing redemptions in-kind. |
| (e) | The portfolio turnover rate increased due to certain investment activity in connection with the Reorganization of the Fund from the State Farm Associates’ Fund Trust into the Advisers Investment Trust. |
| | |
| See accompanying notes to financial statements. | | 33 |
ADVISERS INVESTMENT TRUST
STATE FARM FUNDS
FINANCIAL HIGHLIGHTS (continued)
STATE FARM INTERIM FUND
(For a share outstanding throughout each period)
| | | | | | | | | | | | | | | | | | | | | | | | | | | | |
| | | 6-month period ended | | | | | | | | | | | | | | | | | |
| | | March 31, | | 10-month period ended | | | | | | |
| | | 2022 | | September 30, | | Year ended November 30, | |
| | | | | | | |
| | | (Unaudited) | | 2021 | | 2020 | | | 2019 | | | 2018 | | | 2017 | | | 2016 | |
Net asset value, beginning of period | | | $ 10.20 | | | | 10.36 | | | | 10.10 | | | | 9.76 | | | | 9.87 | | | | 9.92 | | | | 9.99 | |
| | | | | | | |
Income from Investment Operations | | | | | | | | | | | | | | | | | | | | | | | | | | | | |
Net investment income | | | 0.04 | | | | 0.09 | | | | 0.14 | | | | 0.17 | | | | 0.14 | | | | 0.12 | | | | 0.12 | |
Net gain (loss) on investments (both realized and unrealized) | | | (0.46 | ) | | | (0.16 | ) | | | 0.26 | | | | 0.34 | | | | (0.11 | ) | | | (0.05 | ) | | | (0.07 | ) |
| | | | | | | | | | | | | | | | | | | | | | | | | | | | |
Total from invesment operations | | | (0.42 | ) | | | (0.07 | ) | | | 0.40 | | | | 0.51 | | | | 0.03 | | | | 0.07 | | | | 0.05 | |
| | | | | | | | | | | | | | | | | | | | | | | | | | | | |
| | | | | | | |
Less Distributions | | | | | | | | | | | | | | | | | | | | | | | | | | | | |
Net investment income | | | (0.04 | ) | | | (0.09 | ) | | | (0.14 | ) | | | (0.17 | ) | | | (0.14 | ) | | | (0.12 | ) | | | (0.12 | ) |
Net realized gain | | | (0.01 | ) | | | — | | | | — | | | | — | | | | — | | | | — | | | | — | |
| | | | | | | | | | | | | | | | | | | | | | | | | | | | |
Total distributions | | | (0.05 | ) | | | (0.09 | ) | | | (0.14 | ) | | | (0.17 | ) | | | (0.14 | ) | | | (0.12 | ) | | | (0.12 | ) |
| | | | | | | | | | | | | | | | | | | | | | | | | | | | |
Net asset value, end of period | | | $ 9.73 | | | | 10.20 | | | | 10.36 | | | | 10.10 | | | | 9.76 | | | | 9.87 | | | | 9.92 | |
| | | | | | | | | | | | | | | | | | | | | | | | | | | | |
| | | | | | | |
Total Return | | | (4.16 | )%(a) | | | (0.71 | )%(a) | | | 4.02 | % | | | 5.26 | % | | | 0.33 | % | | | 0.71 | % | | | 0.45 | % |
| | | | | | | |
Ratios/Supplemental Data | | | | | | | | | | | | | | | | | | | | | | | | | | | | |
Net assets, end of period (millions) | | | $396.1 | | | | 447.0 | | | | 495.2 | | | | 350.7 | | | | 337.9 | | | | 360.4 | | | | 396.3 | |
| | | | | | | |
Average net asset ratios | | | | | | | | | | | | | | | | | | | | | | | | | | | | |
Expenses, net of waivers and reimbursements | | | 0.16 | %(b) | | | 0.16 | %(b) | | | 0.16 | % | | | 0.17 | % | | | 0.17 | % | | | 0.16 | % | | | 0.16 | % |
Expenses, gross of waivers and reimburements | | | 0.22 | %(b) | | | 0.18 | %(b) | | | 0.16 | % | | | 0.17 | % | | | 0.17 | % | | | 0.16 | % | | | 0.16 | % |
Net investment income, net of waivers and reimbursements | | | 0.84 | %(b) | | | 1.02 | %(b) | | | 1.38 | % | | | 1.71 | % | | | 1.45 | % | | | 1.21 | % | | | 1.15 | % |
| | | | | | | |
Portfolio turnover rate | | | 22 | %(a) | | | 36 | %(a) | | | 20 | % | | | 20 | % | | | 16 | % | | | 13 | % | | | 13 | % |
| (a) | Not annualized for periods that are less than a full year. |
| (b) | Determined on an annualized basis. |
| | |
| 34 | | See accompanying notes to financial statements. |
ADVISERS INVESTMENT TRUST
STATE FARM FUNDS
FINANCIAL HIGHLIGHTS (continued)
STATE FARM MUNICIPAL BOND FUND
(For a share outstanding throughout each period)
| | | | | | | | | | | | | | | | | | | | | | | | | | | | |
| | | 6-month period ended | | | | | | | | | | | | | | | | | |
| | | March 31, | | 10-month period ended | | | | | | |
| | | 2022 | | September 30, | | Year ended November 30, | |
| | | (Unaudited) | | 2021 | | 2020 | | | 2019 | | | 2018 | | | 2017 | | | 2016 | |
Net asset value, beginning of period | | | $ 8.89 | | | | 9.04 | | | | 8.80 | | | | 8.44 | | | | 8.61 | | | | 8.53 | | | | 8.80 | |
| | | | | | | |
Income from Investment Operations | | | | | | | | | | | | | | | | | | | | | | | | | | | | |
Net investment income | | | 0.10 | | | | 0.18 | | | | 0.23 | | | | 0.24 | | | | 0.25 | | | | 0.26 | | | | 0.26 | |
Net gain (loss) on investments (both realized and unrealized) | | | (0.48 | ) | | | (0.14 | ) | | | 0.24 | | | | 0.36 | | | | (0.17 | ) | | | 0.08 | | | | (0.27 | ) |
| | | | | | | | | | | | | | | | | | | | | | | | | | | | |
Total from invesment operations | | | (0.38 | ) | | | 0.04 | | | | 0.47 | | | | 0.60 | | | | 0.08 | | | | 0.34 | | | | (0.01 | ) |
| | | | | | | | | | | | | | | | | | | | | | | | | | | | |
Less Distributions | | | | | | | | | | | | | | | | | | | | | | | | | | | | |
Net investment income | | | (0.10 | ) | | | (0.18 | ) | | | (0.23 | ) | | | (0.24 | ) | | | (0.25 | ) | | | (0.26 | ) | | | (0.26 | ) |
Net realized gain(a) | | | (0.01 | ) | | | (0.01 | ) | | | — | | | | — | | | | — | | | | — | | | | — | |
| | | | | | | | | | | | | | | | | | | | | | | | | | | | |
Total distributions | | | (0.11 | ) | | | (0.19 | ) | | | (0.23 | ) | | | (0.24 | ) | | | (0.25 | ) | | | (0.26 | ) | | | (0.26 | ) |
| | | | | | | | | | | | | | | | | | | | | | | | | | | | |
Net asset value, end of period | | | $ 8.40 | | | | 8.89 | | | | 9.04 | | | | 8.80 | | | | 8.44 | | | | 8.61 | | | | 8.53 | |
| | | | | | | | | | | | | | | | | | | | | | | | | | | | |
| | | | | | | |
Total Return | | | (4.32 | )%(b) | | | 0.37 | %(b) | | | 5.40 | % | | | 7.19 | % | | | 0.99 | % | | | 3.99 | % | | | (0.16 | )% |
| | | | | | | |
Ratios/Supplemental Data | | | | | | | | | | | | | | | | | | | | | | | | | | | | |
Net assets, end of period (millions) | | | $647.4 | | | | 703.1 | | | | 741.0 | | | | 710.9 | | | | 675.4 | | | | 698.6 | | | | 704.1 | |
| | | | | | | |
Average net asset ratios | | | | | | | | | | | | | | | | | | | | | | | | | | | | |
Expenses, net of waivers and reimbursements | | | 0.16 | %(c) | | | 0.17 | %(c) | | | 0.16 | % | | | 0.16 | % | | | 0.16 | % | | | 0.15 | % | | | 0.16 | % |
Expenses, gross of waivers and reimburements | | | 0.18 | %(c) | | | 0.18 | %(c) | | | 0.16 | % | | | 0.16 | % | | | 0.16 | % | | | 0.15 | % | | | 0.16 | % |
Net investment income, net of waivers and reimbursements | | | 2.33 | %(c) | | | 2.34 | %(c) | | | 2.53 | % | | | 2.74 | % | | | 2.93 | % | | | 2.98 | % | | | 2.95 | % |
| | | | | | | |
Portfolio turnover rate | | | 18 | %(b) | | | 11 | %(b) | | | 10 | % | | | 14 | % | | | 12 | % | | | 9 | % | | | 7 | % |
| (a) | Net realized gain distributions represent less than $0.01 per share for the years ended November 30, 2020, 2019 and 2018. |
| (b) | Not annualized for periods that are less than a full year. |
| (c) | Determined on an annualized basis. |
| | |
| See accompanying notes to financial statements. | | 35 |
ADVISERS INVESTMENT TRUST
STATE FARM FUNDS
NOTES TO FINANCIAL STATEMENTS
March 31, 2022 (Unaudited)
Advisers Investment Trust (the “Trust” or “AIT”) is a Delaware statutory trust operating under a Fourth Amended and Restated Agreement and Declaration of Trust (the “Trust Agreement”) dated March 10, 2022. The Trust was formerly an Ohio business trust, which commenced operations on December 20, 2011. On March 31, 2017, the Trust was converted to a Delaware statutory trust. As an open-end registered investment company, as defined in Financial Accounting Standards Board (“FASB”) Accounting Standards Update (“ASU”) 2013-08, the Trust follows accounting and reporting guidance under FASB Accounting Standards Codification (“ASC”) Topic 946, “Financial Services-Investment Companies.” The Trust Agreement permits the Board of Trustees (the “Trustees” or “Board”) to authorize and issue an unlimited number of shares of beneficial interest, at no par value, in separate series of the Trust. The State Farm Growth Fund, the State Farm Balanced Fund, the State Farm Interim Fund, and the State Farm Municipal Bond Fund (referred to individually as a “Fund” and collectively as the “Funds” or the “State Farm Funds”) are each a diversified fund and are each a series of the Trust. These financial statements and notes only relate to the State Farm Funds.
Under the Trust’s organizational documents, its officers and Trustees are indemnified against certain liabilities arising out of the performance of their duties to the Trust and Funds. In addition, in the normal course of business, the Trust enters into contracts with its vendors and others that provide for general indemnifications. The Funds’ maximum exposure under these arrangements is unknown, as this would involve future claims that may be made against the Funds.
Prior to August 23, 2021, each State Farm Fund operated as a series of State Farm Associates’ Funds Trust (each a “Predecessor Fund” and together the “Predecessor Funds”). On August 23, 2021 the Predecessor Funds were reorganized into the Trust, pursuant to an Agreement and Plan of Reorganization approved by the State Farm Associates’ Funds’ Board of Trustees on March 11, 2021 and by the Predecessor Funds’ shareholders on June 17, 2021 (each a “Reorganization” and collectively, the “Reorganizations”).
At the time of the Reorganizations, each Predecessor Fund transferred all of its assets to its corresponding State Farm Fund in exchange for shares of the corresponding State Farm Fund and the assumption of all of the liabilities of the Predecessor Fund by the corresponding State Farm Fund. Upon closing of the Reorganizations, holders of a Predecessor Fund’s shares received shares of the corresponding State Farm Fund’s shares. The Reorganizations were tax-free for U.S federal income tax purposes.
Prior to the Reorganization, the State Farm Funds had no net assets or operations in the Trust, and therefore, activity shown in the Statements of Operations, Statements of Changes in Net Assets and Financial Highlights prior to the Reorganization represents the operations and changes in net assets of each Predecessor Fund. The cost basis of the investments transferred from each Predecessor Fund was carried forward to the corresponding Fund for accounting and tax purposes.
As part of the Reorganization, the Board approved a September 30 fiscal year end for each State Farm Fund. Prior to the Reorganization, the Predecessor Funds had a November 30 fiscal year end.
1. Investment Objective
The State Farm Growth Fund (the “Growth Fund”) seeks long-term growth of capital, which may be supplemented by income. For information on the specific strategies of the Growth Fund, please refer to the Fund’s Prospectus.
The State Farm Balanced Fund (the “Balanced Fund”) seeks long-term growth of capital while providing some current income. For information on the specific strategies of the Balanced Fund, please refer to the Fund’s Prospectus.
The State Farm Interim Fund (the “Interim Fund”) seeks to provide investment results approximating the performance of the Bloomberg Barclays 1-5 Year U.S. Treasury Index. For information on the specific strategies of the Interim Fund, please refer to the Fund’s Prospectus.
The State Farm Municipal Bond Fund (the “Municipal Bond Fund”) seeks as high rate of income exempt from federal income taxes as is consistent with prudent investment management. For information on the specific strategies of the Municipal Bond Fund, please refer to the Fund’s Prospectus.
2. Significant Accounting Policies
Investment Valuation
All investments in securities are recorded at their fair value. For more information see Note 3 Investment Valuation.
When-Issued Securities
The Municipal Bond Fund may purchase municipal bonds on a “when-issued” basis. Delivery and payment for these securities may be a month or more after the purchase date, during which time such securities are subject to market fluctuations. The Municipal Bond Fund identifies and holds specific liquid assets with a market value at least equal to the amount of the when-issued purchase commitments in order to ensure that it can meet those commitments. It is possible that the securities will never be issued and the commitment cancelled. At March 31, 2022, the Municipal Bond Fund
36
ADVISERS INVESTMENT TRUST
STATE FARM FUNDS
NOTES TO FINANCIAL STATEMENTS (continued)
March 31, 2022 (Unaudited)
had commitments of $4,386,525 (representing 0.68% of net assets) for when-issued securities. These commitments are included within the Payable for Securities Purchased line on the Statements of Assets and Liabilities.
Futures Contracts
Certain Funds invest in stock index futures contracts for hedging purposes, to increase total return (i.e., for speculative purposes) or to maintain liquidity to meet potential shareholder redemptions, to invest cash balances or dividends or to minimize trading costs. When used as a hedge, a Fund may sell a futures contract in order to offset a decrease in the fair value of its portfolio securities that might otherwise result from a market decline. A Fund may do so either to hedge the value of its portfolio securities as a whole, or to protect against declines occurring prior to sales of securities in the value of the securities to be sold. Conversely, a Fund may purchase a futures contract as a hedge in anticipation of purchases of securities. In addition, a Fund may utilize futures contracts in anticipation of changes in the composition of its portfolio holdings. A Fund bears the market risk arising from changes in the value of these financial instruments. At the time a Fund enters into a futures contract, it is generally required to make a margin deposit with the custodian of a specified amount of liquid assets. Futures are marked-to-market each day with the change in value reflected in the unrealized gains or losses. Risk may arise as a result of the potential inability of the counterparties to meet the terms of their contracts. Credit risk is mitigated to the extent that the exchange on which a particular futures contract is traded assumes the risk of a counterparty defaulting on its obligations under the contract. The Statements of Operations include any realized gains or losses on closed futures contracts in Net realized gain (loss) on futures contracts, and any unrealized gains or losses on open futures contracts in Change in net unrealized appreciation (depreciation) on futures contracts.
Further information on the impact of these positions on the Funds’ financial statements can be found in Note 7.
Currency Transactions
The functional and reporting currency for the Funds is the U.S. dollar. The market values of foreign securities, currency holdings and other assets and liabilities are translated into U.S. dollars based on the current exchange rates each business day. Purchases and sales of securities and income and expense items denominated in foreign currencies are translated into U.S. dollars at the exchange rate in effect on the transaction date. The Funds do not separately report the effects of changes in foreign exchange rates from changes in market prices on securities held. Such changes are included in Net realized and unrealized gains (losses) from investment activities on the Statements of Operations.
Investment Transactions and Income
Investment transactions are accounted for no later than one business day after trade date. For financial reporting purposes, investments are reported as of the trade date. The Funds determine the gain or loss realized from investment transactions by using an identified cost basis method. Interest income is recognized on an accrual basis and includes, where applicable, the amortization of premium or accretion of discount. Dividend income is recognized on the ex-dividend date. Dividends from foreign securities are recorded on the ex-dividend date, or as soon as the information is available.
Expense Allocations
Expenses directly attributable to a fund in the Trust are charged to that fund, while expenses that are attributable to more than one fund in the Trust are allocated among the applicable funds on a pro-rata basis, based on relative net assets, or another reasonable basis.
Dividends and Distributions
Each Fund intends to distribute substantially all of its net investment income as dividends to its shareholders on an annual basis. The Growth Fund and Balanced Fund declare and pay dividends, and capital gain distributions, if any, at least annually. The Interim Fund and Municipal Bond Fund declare dividends daily and pay them monthly on the last business day of the month. Shares of the Interim Fund and Municipal Bond Fund begin to earn dividends on the day after they are purchased. The Interim Fund and Municipal Bond Fund distribute net realized capital gain, if any, at least annually.
The Funds intend to distribute their net realized long-term capital gains and their net realized short-term capital gains at least once a year.
Distributions from net investment income and from net realized capital gain are determined in accordance with Federal income tax regulations, which may differ from accounting principles generally accepted in the United States of America (“GAAP”).These “book/tax” differences are either considered temporary or permanent in nature. To the extent these differences are permanent in nature (e.g. treatment of certain dividend distributions, gains/losses, return of capital, etc.), such amounts are reclassified within the composition of net assets based on their federal tax-basis treatment; temporary differences do not require reclassification. Distributions to shareholders that exceed net investment income and net realized capital gains for tax purposes are reported as return of capital.
Federal Income Tax Information
No provision is made for Federal income taxes as the Fund intends to qualify each year as a “regulated investment company” under Subchapter M of the Internal Revenue Code of 1986, as amended (the “Code”), and distribute substantially all of its net investment income and net realized capital gain in accordance with the Code.
37
ADVISERS INVESTMENT TRUST
STATE FARM FUNDS
NOTES TO FINANCIAL STATEMENTS (continued)
March 31, 2022 (Unaudited)
The Funds analyzed all open tax years, as defined by the Statute of Limitations, for all major jurisdictions that remain subject to examination. The Funds’ Federal tax returns for the tax years ended November 30, 2018 through November 30, 2020 and September 30, 2021, as applicable, remain subject to examination by the Internal Revenue Service. Interest or penalties incurred, if any, on future unknown or uncertain tax positions taken by the Funds will be recorded as interest expense on the Statements of Operations.
Management is not aware of any tax positions for which it is reasonably possible that the total amounts of unrecognized tax benefits will significantly change in the next twelve months.
Use of Estimates
The preparation of financial statements in conformity with GAAP requires management to make estimates and assumptions that affect the reported amounts of assets and liabilities and disclosure of contingent assets and liabilities at the date of the financial statements and the reported amounts of revenues and expenses during the reporting period. Actual results could differ from these estimates.
3. Investment Valuation
Investments are recorded at fair value. Fair value is defined as the price that would be received to sell an asset or paid to transfer a liability in an orderly transaction between market participants at the measurement date. The valuation techniques employed by the Funds, as described below, maximize the use of observable inputs and minimize the use of unobservable inputs in determining fair value. These inputs are summarized in the following three broad levels:
| | ● | | Level 1 - quoted prices in active markets for identical assets |
| | ● | | Level 2 - other significant observable inputs (including quoted prices of similar securities, interest rates, prepayment speeds, credit risk, etc.) |
| | ● | | Level 3 - significant unobservable inputs (including the Fund’s own assumptions in determining the fair value of investments) |
The inputs or methodology used for valuing securities are not necessarily an indication of the risk associated with investing in those securities. For example, certain short-term debt securities may be valued using amortized cost. Generally, amortized cost approximates the current value of a security, but since this valuation is not obtained from a quoted price in an active market, such securities would be reflected as Level 2 in the fair value hierarchy.
Security prices are generally provided by an independent third party pricing service approved by the Trustees as of the close of the New York Stock Exchange, normally at 4:00 p.m. Eastern Time, each business day on which the share price of the Funds are calculated. Equity securities listed or traded on a primary exchange are valued at the closing price, if available, or the last sales price on the primary exchange. If no sale occurred on the valuation date, the securities will be valued at the latest quotations as of the close of the primary exchange. Investments in other open-end registered investment companies are valued at their respective net asset value as reported by such companies. In these types of situations, valuations are typically categorized as Level 1 in the fair value hierarchy.
Debt and other fixed income securities, if any, are generally valued at an evaluated price provided by an independent pricing source approved by the Trustees. To value debt securities, pricing services may use various pricing techniques, which take into account appropriate factors such as market activity, yield, quality, coupon rate, maturity, type of issue, trading characteristics, call features, credit ratings and other data, as well as broker quotes. Short-term debt securities of sufficient credit quality that mature within sixty days may be valued at amortized cost, which approximates fair value. In each of these situations, valuations are typically categorized as Level 2 in the fair value hierarchy.
When the price of a security is not readily available or deemed unreliable (e.g., an approved pricing service does not provide a price, a furnished price is in error, certain stale prices, or an event occurs that materially affects the furnished price), a Fund’s Fair Value Committee may in good faith establish a fair value for that security in accordance with procedures established by and under the general supervision of the Trustees. In addition, fair value pricing may be used if events materially affecting the value of foreign securities occur between the time when the exchange on which they are traded closes and the time when a Funds’ net asset value is calculated.
In the fair value situations noted above, while the Trust’s valuation policy is intended to result in a calculation of each Fund’s net asset value that fairly reflects security values as of the time of pricing, the Trust cannot ensure that fair values determined pursuant to these guidelines would accurately reflect the price that the Fund could obtain for a security if it were to dispose of that security as of the time of pricing (for instance, in a forced or distressed sale). The prices used by the Funds may differ from the value that would be realized if the securities were sold, and these differences could be material to the financial statements. Depending on the source and relative significance of the valuation inputs in these instances, the instruments may be classified as Level 2 or Level 3 in the fair value hierarchy.
38
ADVISERS INVESTMENT TRUST
STATE FARM FUNDS
NOTES TO FINANCIAL STATEMENTS (continued)
March 31, 2022 (Unaudited)
The following is a summary of the valuation inputs used as of March 31, 2022 in valuing each Fund’s investments based upon the three fair value levels defined above:
| | | | | | | | | | | | | | | | |
Fund | | Level 1 | | | Level 2 | | | Level 3 | | | Total | |
| | | | |
State Farm Growth Fund | | | | | | | | | | | | | | | | |
Investments in Securities: | | | | | | | | | | | | | | | | |
Common Stocks (a) | | $ | 6,902,737,953 | | | $ | — | | | | $— | | | $ | 6,902,737,953 | |
U.S. Treasury Obligations | | | — | | | | 5,228,309 | | | | — | | | | 5,228,309 | |
Short-term Investments | | | 75,926,499 | | | | — | | | | — | | | | 75,926,499 | |
| | | | | | | | | | | | | | | | |
Total Investments in Securities | | | 6,978,664,452 | | | | 5,228,309 | | | | — | | | | 6,983,892,761 | |
| | | | | | | | | | | | | | | | |
| | | | |
Other Financial Instruments | | | | | | | | | | | | | | | | |
Assets: | | | | | | | | | | | | | | | | |
Futures Contracts | | | 3,992,121 | | | | — | | | | — | | | | 3,992,121 | |
| | | | |
State Farm Balanced Fund | | | | | | | | | | | | | | | | |
Investments in Securities: | | | | | | | | | | | | | | | | |
Common Stocks (a) | | | 1,716,589,130 | | | | — | | | | — | | | | 1,716,589,130 | |
Corporate Bonds (a) | | | — | | | | 264,547,260 | | | | — | | | | 264,547,260 | |
Foreign Government Bonds | | | — | | | | 1,982,878 | | | | — | | | | 1,982,878 | |
Agency Securities | | | — | | | | 15,263,762 | | | | — | | | | 15,263,762 | |
U.S. Treasury Obligations | | | — | | | | 373,354,807 | | | | — | | | | 373,354,807 | |
Short-term Investments | | | 28,279,490 | | | | — | | | | — | | | | 28,279,490 | |
| | | | | | | | | | | | | | | | |
Total Investments in Securities | | | 1,744,868,620 | | | | 655,148,707 | | | | — | | | | 2,400,017,327 | |
| | | | | | | | | | | | | | | | |
| | | | |
State Farm Interim Fund | | | | | | | | | | | | | | | | |
Investments in Securities: | | | | | | | | | | | | | | | | |
U.S. Treasury Obligations | | | — | | | | 393,905,391 | | | | — | | | | 393,905,391 | |
Short-term Investments | | | 174,620 | | | | — | | | | — | | | | 174,620 | |
| | | | | | | | | | | | | | | | |
Total Investments in Securities | | | 174,620 | | | | 393,905,391 | | | | — | | | | 394,080,011 | |
| | | | | | | | | | | | | | | | |
| | | | |
State Farm Municipal Bond Fund | | | | | | | | | | | | | | | | |
Investments in Securities: | | | | | | | | | | | | | | | | |
Long-term Municipal Bonds | | | — | | | | 622,344,542 | | | | — | | | | 622,344,542 | |
Short-term Investments | | | 21,470,629 | | | | — | | | | — | | | | 21,470,629 | |
| | | | | | | | | | | | | | | | |
Total Investments in Securities | | | 21,470,629 | | | | 622,344,542 | | | | — | | | | 643,815,171 | |
| | | | | | | | | | | | | | | | |
(a) Industry classification is disclosed in the Schedules of Investments.
As of March 31, 2022 there were no Level 3 securities held by the Funds. There were no transfers to or from Level 3 during the 6-month period ended March 31, 2022.
4. Federal Income Tax
As of March 31, 2022, each Fund’s aggregate unrealized gains and losses for all investments based on cost for federal income tax purposes were as follows:
| | | | | | | | | | | | | | | | |
Fund | | Cost of Investments for
Federal Tax Purposes | | | Gross Unrealized
Appreciation | | | Gross Unrealized
(Depreciation) | | | Net Unrealized
Appreciation (Depreciation) | |
| | | | |
State Farm Growth Fund | | | $1,994,246,282 | | | | $5,038,583,780 | | | | $(44,945,180) | | | | $4,993,638,600 | |
State Farm Balanced Fund | | | 1,131,946,329 | | | | 1,298,310,559 | | | | (30,239,561) | | | | 1,268,070,998 | |
State Farm Interim Fund | | | 408,801,279 | | | | 292,389 | | | | (15,013,657) | | | | (14,721,268) | |
State Farm Municipal Bond Fund | | | 643,723,536 | | | | 9,833,193 | | | | (9,741,558) | | | | 91,635 | |
39
ADVISERS INVESTMENT TRUST
STATE FARM FUNDS
NOTES TO FINANCIAL STATEMENTS (continued)
March 31, 2022 (Unaudited)
As of September 30, 2021, the following Funds had unused capital loss carryforwards available for federal income tax purposes to be applied against future capital gains realized after September 30, 2021, if any. Future capital loss carryforward utilization in any given year may be subject to Internal Revenue Code limitations. If not applied, the capital losses will carryforward indefinitely as follows:
| | | | | | | | |
| | | | | Unused Non Expiring Capital Loss Carryforwards |
| | | | |
Fund | | Loss Carryforwards Utilized in 2021 | | Short-term | | Long-term | | Total |
| | | | |
State Farm Interim Fund | | $391,003 | | $— | | $— | | $— |
As of September 30, 2021, in accordance with federal tax regulations, the components of distributable earnings on a tax basis were as follows:
| | | | | | | | | | | | | | | | | | | | |
Fund | | Undistributed
Tax Exempt Income | | Undistributed
Ordinary Income | | | Undistributed
Long-term Gain | | | Unrealized
Appreciation
(Depreciation) | | | Accumulated
Capital and
Other Losses | | Total | |
| | | | | | |
State Farm Growth Fund | | $— | | | $37,277,625 | | | | $864,612,987 | | | | $4,382,730,281 | | | $— | | $ | 5,284,620,893 | |
State Farm Balanced Fund | | — | | | 16,490,642 | | | | 158,024,614 | | | | 1,191,596,573 | | | — | | | 1,366,111,829 | |
State Farm Interim Fund | | — | | | — | | | | 54,380 | | | | 4,214,883 | | | — | | | 4,269,263 | |
State Farm Municipal Bond Fund | | 13 | | | 28,676 | | | | 648,565 | | | | 36,491,412 | | | — | | | 37,168,666 | |
As of September 30, 2021, reclassifications within the composition of net assets based on their federal tax-basis treatment were as follows:
| | | | | | | | |
Fund | | Paid-in-Capital | | | Distributable Earnings | |
| | |
State Farm Growth Fund | | | $13,049,107 | | | | $(13,049,107) | |
State Farm Balanced Fund | | | 74,315,364 | | | | (74,315,364) | |
State Farm Municipal Bond Fund | | | (137,802) | | | | 137,802 | |
The tax character of distributions was designated as follows for the fiscal periods ended September 30, 2021, November 30, 2020 and November 30, 2019:
| | | | | | | | | | | | | | | | |
2021 | | Tax-Exempt Income | | | Ordinary Income | | | Long-term Capital Gain | | | Total | |
| | | | |
State Farm Growth Fund | | | $ — | | | | $116,584,350 | | | | $50,874,602 | | | $ | 167,458,952 | |
State Farm Balanced Fund | | | — | | | | 45,173,359 | | | | 17,279,367 | | | | 62,452,726 | |
State Farm Interim Fund | | | — | | | | 4,057,461 | | | | — | | | | 4,057,461 | |
State Farm Municipal Bond Fund | | | 14,224,490 | | | | 16,404 | | | | 671,779 | | | | 14,912,673 | |
| | | | | | | | | | | | | | | | |
2020 | | Tax-Exempt Income | | | Ordinary Income | | | Long-term Capital Gain | | | Total | |
| | | | |
State Farm Growth Fund | | | $ — | | | | $129,137,348 | | | | $52,394,066 | | | $ | 181,531,414 | |
State Farm Balanced Fund | | | — | | | | 49,929,057 | | | | 6,054,716 | | | | 55,983,773 | |
State Farm Interim Fund | | | — | | | | 5,811,934 | | | | — | | | | 5,811,934 | |
State Farm Municipal Bond Fund | | | 18,201,882 | | | | 56,101 | | | | 180,545 | | | | 18,438,528 | |
| | | | | | | | | | | | | | | | |
2019 | | Tax-Exempt Income | | | Ordinary Income | | | Long-term Capital Gain | | | Total | |
| | | | |
State Farm Growth Fund | | | $ — | | | | $128,727,664 | | | | $63,216,446 | | | $ | 191,944,110 | |
State Farm Balanced Fund | | | — | | | | 50,441,287 | | | | 13,866,844 | | | | 64,308,131 | |
State Farm Interim Fund | | | — | | | | 5,786,711 | | | | — | | | | 5,786,711 | |
State Farm Municipal Bond Fund | | | 18,893,462 | | | | 257,110 | | | | 204,284 | | | | 19,354,856 | |
40
ADVISERS INVESTMENT TRUST
STATE FARM FUNDS
NOTES TO FINANCIAL STATEMENTS (continued)
March 31, 2022 (Unaudited)
5. Fees and Transactions with Affiliates and Other Parties
Investment Adviser
The Trust, on behalf of the Funds, has entered into an Investment Advisory Agreement (the “Advisory Agreement”) with State Farm Investment Management Corp. (the “Adviser” or “State Farm”) to provide investment advisory services to the Funds, including oversight of Northern Trust Investments, Inc. (the “Sub-Adviser” or “NTI”). Total fees incurred pursuant to the Advisory Agreement are reflected as “Investment advisory” fees on the Statements of Operations. Under the terms of the Advisory Agreement, the Funds pay the Adviser a monthly fee based on each Fund’s daily net assets at the following annualized rates:
| | |
Fund | | Management Fee
(as percentage of average daily net assets) |
| |
State Farm Growth Fund | | 0.10% |
State Farm Balanced Fund | | 0.11% |
State Farm Interim Fund | | 0.12% |
State Farm Municipal Bond Fund | | 0.11% |
The Advisory Agreement will continue for an initial term of two years, and on a year-to-year basis thereafter, provided that continuance is approved at least annually by specific approval of the Board or by vote of the holders of a majority of the outstanding voting securities of each Fund. In either event, it must also be approved by a majority of the Trustees who are neither parties to the Advisory Agreement nor interested persons, as defined in the Investment Company Act of 1940, as amended (the “1940 Act”), at a meeting called for the purpose of voting on such approval. The Advisory Agreement may be terminated at any time without the payment of any penalty by the Board or by vote of a majority of the outstanding voting securities of a Fund on not more than 60 days’ written notice to the Adviser. In the event of its assignment, the Advisory Agreement will terminate automatically.
Expense Limitation Agreement
The Adviser has contractually agreed to waive fees and reimburse expenses to the extent that total annual operating expenses (excluding brokerage costs, interest, taxes, dividends, litigation and indemnification expenses, expenses associated with investments in underlying investment companies, and extraordinary expenses) exceed the rates specified in the table below:
| | |
Fund | | Expense Limitation |
| |
State Farm Growth Fund | | 0.12% |
State Farm Balanced Fund | | 0.14% |
State Farm Interim Fund | | 0.16% |
State Farm Municipal Bond Fund | | 0.16% |
The expense limitation agreement is effective until January 28, 2025 for the Funds at which time it will be subject to automatic renewal upon the effective date of the Funds’ registration statement. If it becomes unnecessary for the Adviser to waive fees or make reimbursements, the Adviser may recapture any of its prior waivers or reimbursements for a period not to exceed three years from the date on which the waiver or reimbursement was made to the extent that such a recapture does not cause the total annual fund operating expenses (excluding brokerage costs, interest, taxes, dividends and other expenses in connection with the short sale of securities, litigation and indemnification expenses, expenses associated with investments in underlying investment companies, and extraordinary expenses) to exceed the lesser of the current expense limitation or the applicable expense limitation that was in effect at the time of the waiver or reimbursement. The agreement to waive fees and reimburse expenses may be terminated by the Board at any time and will terminate automatically upon termination of the Advisory Agreement.
41
ADVISERS INVESTMENT TRUST
STATE FARM FUNDS
NOTES TO FINANCIAL STATEMENTS (continued)
March 31, 2022 (Unaudited)
The balances of recoverable expenses to State Farm by Funds at March 31, 2022 were as follows:
| | | | | | | | | | | | |
| | | Expiring |
Fund | | 2022 | | | 2023 | | | 2024 | | 2025 |
State Farm Growth Fund | | | $— | | | | $— | | | $267,169 | | $1,219,521 |
State Farm Balanced Fund | | | — | | | | — | | | 99,813 | | 405,461 |
State Farm Interim Fund | | | — | | | | — | | | 41,335 | | 131,543 |
State Farm Municipal Bond Fund | | | — | | | | — | | | 28,333 | | 79,808 |
Investment Sub-Adviser
NTI serves as the Sub-Adviser to the Funds. For its services to the Funds, NTI does not directly receive a fee from the Funds. NTI receives a fee from the Adviser which is computed and accrued daily and paid monthly as follows:
| | |
| | | Management Fee |
Fund | | (as percentage of average daily net assets) |
State Farm Growth Fund | | 0.085% |
State Farm Balanced Fund | | 0.08% |
State Farm Interim Fund | | 0.075% |
State Farm Municipal Bond Fund | | 0.08% |
The Sub-Adviser is responsible for the day-to-day investment management of the Funds’ assets, including making investment decisions and placing orders for the purchase and sale of securities for the Funds directly with the issuers or with brokers or dealers selected by the Sub-Adviser in its discretion. The investment advisory services of the Sub-Adviser are not exclusive under the terms of its sub-advisory agreement. The Sub-Adviser is free to render investment advisory services to others. The Sub-Adviser also furnishes to the Adviser and to the Board, which has overall responsibility for the business and affairs of the Trust, periodic reports on its services, and the investment performance of the Funds.
Distribution Agreement
Foreside Financial Services, LLC (the “Distributor”), provides distribution services to the Funds pursuant to a distribution agreement with the Trust. Under its agreement with the Trust, the Distributor acts as an agent of the Trust in connection with the offering of the shares of the Funds on a continuous basis. The Distributor has no obligation to sell any specific quantity of Fund shares. The Distributor, and its officers, have no role in determining each Fund’s investment policies or which securities to buy or sell. The Adviser, at its own expense, pays the Distributor a fee for distribution-related services.
Custody, Transfer Agency, and Fund Administration and Accounting Services Agreements with the Northern Trust Company
The Northern Trust Company (“Northern Trust”) serves as the administrator, transfer agent, custodian, and fund accounting agent for the Funds pursuant to written agreements between the Trust, on behalf of the Funds, and Northern Trust. The Funds have agreed to pay Northern Trust certain annual and transaction-based fees, a tiered basis-point fee based on each Fund’s daily net assets, subject to a minimum annual fee relating to these services, and reimburse for certain expenses incurred on behalf of the Funds as well as other charges for additional service activities. Total fees paid to Northern Trust pursuant to these agreements are reflected as “Accounting and Administration” fees on the Statements of Operations.
Services Agreement with Foreside Fund Officer Services, LLC
Foreside Fund Officer Services, LLC (“Foreside”) provides compliance and financial control Services for the Funds pursuant to a written agreement with the Trust on behalf of the Funds, including providing certain officers to the Funds. The Funds pay Foreside an annual base fee, a basis-point fee based on each Fund’s daily net assets and reimburses for certain expenses incurred on behalf of the Fund. Total fees paid to Foreside pursuant to these agreements are reflected as “Regulatory and Compliance” fees on the Statements of Operations.
Trustee Compensation
Officers of the Trust receive no compensation directly from the Funds for serving in their respective roles. The Trust has no retirement or pension plans. The Trust pays an annual retainer of $125,000 and reimbursement for certain expenses to Trustees who are not interested persons of the Trust (“Independent Trustees”). If there are more than six meetings in a year, additional meeting fees may apply. For the 6-month period ended March 31, 2022, the aggregate Independent Trustee compensation paid by the Trust was $222,750. The amount of total Trustee compensation and reimbursement of out-of pocket expenses allocated from the Trust to the Funds are reflected as “Trustees’ fees and expenses” on the Statements of Operations.
42
ADVISERS INVESTMENT TRUST
STATE FARM FUNDS
NOTES TO FINANCIAL STATEMENTS (continued)
March 31, 2022 (Unaudited)
6. Investment Transactions
For the 6-month period ended March 31, 2022, investment transactions (exclusive of futures contracts and short-term instruments) were as follows:
| | | | | | | | |
Fund | | Purchases (excluding U.S.
Government Obligations) | | Sales/Maturities (excluding U.S.
Government Obligations) | | Purchases of U.S.
Government Obligations | | Sales/Maturities of U.S.
Government Obligations |
State Farm Growth Fund | | $861,242,587 | | $1,055,488,583 | | $ — | | $ — |
State Farm Balanced Fund | | 176,149,198 | | 272,883,694 | | 82,674,310 | | 56,147,261 |
State Farm Interim Fund | | — | | — | | 90,483,095 | | 120,184,984 |
| State Farm Municipal Bond Fund | | 119,999,782 | | 140,987,124 | | — | | — |
7. Derivative Instruments
Information concerning the types of derivatives in which the Funds invest, the objectives for using them and their related risks can be found in Note 2.
Below are the types of derivatives by primary risk exposure as presented in the Statements of Assets and Liabilities as of March 31, 2022:
| | | | | | | | | | |
| | | | | Assets | | Liabilities |
Fund | | Contract Type | | Statements of
Assets Location | | Value | | Statements of
Liabilities Location | | Value |
State Farm Growth Fund | | Equity risk | | Net Assets - Net unrealized
appreciation | | $3,992,121 | | Net Assets - Net unrealized
depreciation | | $— |
The following tables set forth, by primary risk exposure, the Funds’ realized gains (losses) and change in unrealized appreciation (depreciation) by type of derivative contract for the 6-month period ended March 31, 2022:
| | | | | | | | |
| | | | | Amount of Realized Gain (Loss) on Derivative Contracts | |
Fund | | Contract Type | | Statements of Operations Location | | Value | |
State Farm Growth Fund | | Equity risk | | Net realized gain (loss) on futures contracts | | | $(2,558,532) | |
State Farm Balanced Fund | | Equity risk | | Net realized gain (loss) on futures contracts | | | (399,643) | |
| | | | | | | | |
| | | | | Change in Unrealized Appreciation (Depreciation) on Derivative Contracts | |
Fund | | Contract Type | | Statements of Operations Location | | Value | |
State Farm Growth Fund | | Equity risk | | Change in net unrealized appreciation (depreciation) on futures contracts | | | $5,742,158 | |
State Farm Balanced Fund | | Equity risk | | Change in net unrealized appreciation (depreciation) on futures contracts | | | 590,638 | |
Volume of derivative activity for the 6-month period ended March 31, 2022:*
| | | | |
| | | Equity Contracts |
Fund | | Number of Trades | | Average Notional Amount |
State Farm Growth Fund | | 11 | | $26,159,556 |
State Farm Balanced Fund | | 10 | | 7,065,926 |
| | * | Activity for the fiscal year is measured by number of trades during the fiscal year and average notional amount for futures equity contracts. |
8. Principal Investment Risks
Investing in a Fund may involve certain risks including, but not limited to, those described below. Please refer to the Funds’ prospectus and statement of additional information for more information on risks associated with investing in the Funds.
43
ADVISERS INVESTMENT TRUST
STATE FARM FUNDS
NOTES TO FINANCIAL STATEMENTS (continued)
March 31, 2022 (Unaudited)
Management Risk
The assessment by the Funds’ Sub-Adviser of the securities to be purchased or sold by the Funds may prove incorrect, resulting in losses or poor performance, even in a rising market. This may be as a result of the factors used by the Sub-Adviser in building a multifactor quantitative model. Whenever a model is used, there is also a risk that the model will not work as planned. In addition, there may be periods when quality investing is out of favor and during which time the Funds’ performance may suffer.
Market Risk
The risk that the value of the Funds’ investments may increase or decrease in response to expected, real or perceived economic, political or financial events in the U.S. or global markets. The frequency and magnitude of such changes in value cannot be predicted. The increasing interconnectivity between global economies and financial markets increases the likelihood that events or conditions in one region or financial market may adversely impact issuers in a different country, region or financial market. Securities in the Funds’ portfolio may underperform due to inflation (or expectations for inflation), interest rates, global demand for particular products or resources, natural disasters, pandemics (including COVID-19), epidemics, terrorism, regulatory events and governmental or quasi-governmental actions.
Tracking Risk
The Funds’ Sub-Adviser invests in fixed income securities to try to duplicate the investment composition and performance of the Bloomberg Index. There is a risk that the Funds’ performance may vary substantially from the performance of the Bloomberg Index as a result of share purchases and redemptions, transaction costs, expenses and other factors.
Liquidity Risk
The Sub-Adviser to the Funds may have difficulty selling securities the Funds hold at the time it would like to sell, and at the value the Funds have placed on those securities.
High Yield Risk
High yield securities and unrated securities of similar credit quality (securities rated below investment grade, commonly known as “junk bonds”) are subject to greater levels of credit, call, and liquidity risks. High yield securities are considered primarily speculative with respect to the issuer’s continuing ability to make principal and interest payments and may be more volatile than higher-rated securities of similar maturity.
Long-term Ownership Strategy Risk
The Funds’ investment approach generally emphasizes buying and holding securities over long periods. As such, the Funds could continue to hold certain securities through adverse cycles for those securities rather than selling them, which could cause the Funds to underperform compared to a fund that has invested in similar securities but actively shifts its portfolio assets to take advantage of market opportunities and that does not seek reduced portfolio turnover.
Tax Risk
The Funds’ long-term ownership strategy historically has resulted in a low rate of turnover in its portfolio. Therefore, the Funds have accumulated a large amount of unrealized capital gains, and distribution of such gains to shareholders may be larger than the capital gain distributions made by other similar mutual funds. As a result, unless you are purchasing shares of the Funds through a tax-advantaged account (such as an IRA), buying shares at a time when the Funds have unrealized gains might eventually cost you money in taxes.
Large Cap Risk
The risk that returns on investments in stocks of large companies could trail the returns on investments in stocks of smaller and mid-sized companies.
Mid Cap Stock Risk
The risk that stocks of mid-sized companies may be subject to more abrupt or erratic market movements than stocks of larger, more established companies, and may lack sufficient market liquidity. Generally, the smaller the company size, the greater the risk.
Interest Rate Risk
The risk that during periods of rising interest rates, the Funds’ yield (and the market value of its securities) will tend to be lower than prevailing market rates; in periods of falling interest rates, the Funds’ yield (and the market value of its securities) will tend to be higher. Securities with longer maturities tend to be more sensitive to changes in interest rates, causing them to be more volatile than securities with shorter maturities. Securities with shorter maturities tend to provide lower returns and be less volatile than securities with longer maturities.
44
ADVISERS INVESTMENT TRUST
STATE FARM FUNDS
NOTES TO FINANCIAL STATEMENTS (continued)
March 31, 2022 (Unaudited)
Prepayment (or Call) Risk
The risk that an issuer could exercise its right to pay principal on an obligation held by the Funds (such as an asset-backed security) earlier than expected. The exercise of such right may result in a decreased rate of return and a decline in value of those obligations and, accordingly, a decline in the Fund’s NAV.
U.S. Government Securities Risk
The risk that the U.S. government will not provide financial support to its agencies, instrumentalities or sponsored enterprises if it is not obligated to do so by law. Certain U.S. government securities purchased by the Funds are neither issued nor guaranteed by the U.S. Treasury and, therefore, may not be backed by the full faith and credit of the United States.
Municipal Securities Risks
The municipal market can be significantly affected by adverse tax, legislative, political or public health changes and the financial condition of issuers of municipal securities. In recent years an increasing number of municipal issuers have defaulted on obligations, been downgraded or commenced insolvency proceedings. The Funds may be more sensitive to adverse economic, business, political or public health developments if it invests more than 25% of its assets in the debt securities of similar projects (such as those relating to education, health care, housing, transportation, and utilities), industrial development bonds, or in particular types of municipal securities (such as general obligation bonds, private activity bonds and moral obligation bonds). While interest earned on municipal securities is generally not subject to federal tax, any interest earned on taxable municipal securities is fully taxable at the federal level and may be subject to tax at the state level. Municipal securities may be fully or partially backed or enhanced by the taxing authority of a local government, by the current or anticipated revenues from a specific project or specific assets, or by the credit of, or liquidity enhancement provided by, a private issuer. Special factors, such as legislative changes, and state and local economic and business developments, may adversely affect the yield and/or value of the Fund’s investments in municipal securities. For example, the novel coronavirus (COVID-19) has significantly stressed the financial resources of many municipal issuers, which may impair a municipal issuer’s ability to meet its financial obligations and could adversely impact the value of its bonds, which in turn could negatively impact the performance of the Funds. The secondary market for municipal obligations also tends to be less well developed and less liquid than many other securities markets, which may limit the Funds’ ability to sell its municipal obligations at attractive prices.
Credit (or Default) Risk
The risk that the inability or unwillingness of an issuer or a counterparty to meet its principal or interest payments or other financial obligations will adversely affect the value of the Funds’ investments and their returns. The credit quality of a debt security or of the issuer of a debt security held by the Funds could deteriorate rapidly, which may impair the Funds’ liquidity or cause a deterioration in the Funds’ NAV.
Debt Extension Risk
The risk that an issuer will exercise its right to pay principal on an obligation held by the Funds later than expected. Under these circumstances, the value of the obligation will decrease.
Inflation Risk
The risk that the value of the assets or income from an investment will be worth less in the future as inflation decreases the value of money.
Income Risk
The risk that the income from the bonds the Funds holds will decline. This risk applies when the Funds invest the proceeds from new share sales, or from matured or called bonds, at market interest rates that are below the portfolio’s current earnings rate.
Valuation Risk
The risk that the sale price the Funds could receive for a portfolio security may differ from the Funds’ valuation of the security, particularly for securities that trade in low volume or volatile markets or that are valued using a fair value methodology. Fair valuation of the Funds’ investments involves subjective judgment. The Funds’ ability to value their investments may be impacted by technological issues and/or errors by pricing services or other third-party service providers. In addition, the value of the securities in the Funds’ portfolios may change on days when shareholders will not be able to purchase or sell the Funds’ shares.
Stock Index Futures Risk
The risk arising from the Funds’ use of futures and includes: the risk that there will be imperfect correlation between the change in market value of the Funds’ securities and the price of futures contracts; the possible inability of the Funds to close a futures contract when desired; losses due to
45
ADVISERS INVESTMENT TRUST
STATE FARM FUNDS
NOTES TO FINANCIAL STATEMENTS (continued)
March 31, 2022 (Unaudited)
unanticipated market movements, which potentially are unlimited; and the possible inability of the Funds’ investment sub-adviser to correctly predict the direction of securities prices, interest rates, currency exchange rates and other economic factors.
46
ADVISERS INVESTMENT TRUST
STATE FARM FUNDS
PORTFOLIO SUMMARY
March 31, 2022 (Unaudited)
State Farm Growth Fund
Fund Composition*
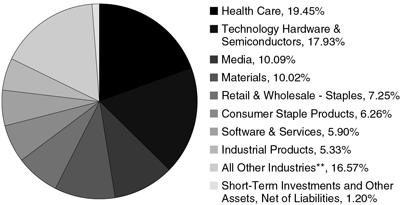
| | * | Illustrated by Industry and based on total net assets as of March 31, 2022. Please refer to the Schedule of Investments in this report for details concerning Fund holdings. | |
| | ** | Represents 9 other industries, each of which represents less than 5% of total net assets. | |
State Farm Balanced Fund
Fund Composition*
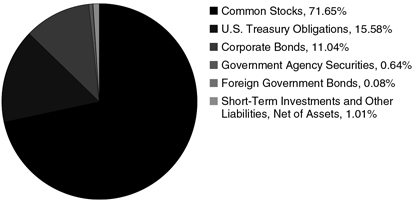
| | * | Illustrated by Type of Security and based on total net assets as of March 31, 2022. Please refer to the Schedule of Investments in this report for details concerning Fund holdings. | |
47
ADVISERS INVESTMENT TRUST
STATE FARM FUNDS
PORTFOLIO SUMMARY (continued)
March 31, 2022 (Unaudited)
State Farm Interim Fund
Fund Composition*
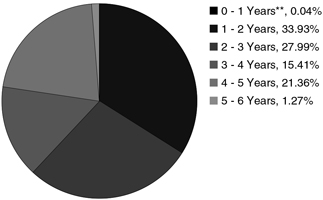
| | * | Illustrated by Maturity and based on total investments as of March 31, 2022. Please refer to the Schedule of Investments in this report for details concerning Fund holdings. | |
| | ** | Includes a 0.04% allocation to the Northern Institutional Treasury Portfolio Fund (Premier Class). | |
State Farm Municipal Bond Fund
Fund Composition*
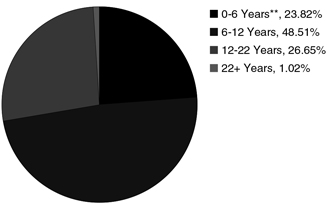
| | * | Illustrated by Maturity and based on total investments as of March 31, 2022. Please refer to the Schedule of Investments in this report for details concerning Fund holdings. | |
| | ** | Includes a 3.33% allocation to the Northern Institutional Treasury Portfolio Fund (Premier Class). | |
48
ADVISERS INVESTMENT TRUST
STATE FARM FUNDS
EXPENSE EXAMPLES
March 31, 2022 (Unaudited)
As a Fund shareholder, you may incur two types of costs: (1) transaction costs, and (2) ongoing costs, including management fees and other Fund expenses. The examples below are intended to help you understand your ongoing costs (in dollars) of investing in the Funds and to compare these costs with the ongoing costs of investing in other mutual funds. Please note that the expenses shown in the tables are meant to highlight your ongoing costs only and do not reflect any transactional costs. Therefore, the examples are useful in comparing ongoing costs only and will not help you determine the relative total cost of owning different funds. In addition, if these transactional costs were included, your costs would have been higher.
The examples below are based on an investment of $1,000 invested at October 1, 2021 and held for the entire period through March 31, 2022.
The Actual Expense Example below provides information about actual account values and actual expenses. You may use this information, together with the amount you invested, to estimate the expenses that you paid over the period. Simply divide your account value by $1,000 (for example, an $8,600 account value divided by $1,000 = 8.6), then multiply the result by the number in the table under the heading entitled “Expenses Paid” to estimate the expenses you paid on your account during this period.
The Hypothetical Expense Example below provides information about hypothetical account values and hypothetical expenses based on a Funds’ actual expense ratio and an assumed rate of return of 5% per year before expenses, which is not a Funds’ actual return. The hypothetical account values and expenses may not be used to estimate the actual ending account balance or expenses you paid for the period. You may use this information to compare the ongoing costs of investing in the Funds and other funds. To do so, compare this 5% hypothetical example with the 5% hypothetical examples that appear in the shareholder reports of the other funds.
| | | | | | | | | | | | | | | | |
| | | | | | | | | Annualized Expense | | | | |
| | | | | | | | | Ratio Based | | | Expenses Paid | |
| | | Beginning | | | Ending | | | on the Period | | | During Period | |
| | | Account Value | | | Account Value | | | October 1, 2021 to | | | October 1, 2021 to | |
| | | October 1, 2021 | | | March 31, 2022 | | | March 31, 2022 | | | March 31, 2022* | |
State Farm Growth Fund | | | | | | | | | | | | | | | | |
| | | | |
Actual | | | $1,000.00 | | | | $1,097.10 | | | | 0.12% | | | | $0.63 | |
| | | | |
Hypothetical (5% return before expenses) | | | $1,000.00 | | | | $1,024.33 | | | | 0.12% | | | | $0.61 | |
State Farm Balanced Fund | | | | | | | | | | | | | | | | |
| | | | |
Actual | | | $1,000.00 | | | | $1,055.10 | | | | 0.14% | | | | $0.72 | |
| | | | |
Hypothetical (5% return before expenses) | | | $1,000.00 | | | | $1,024.23 | | | | 0.14% | | | | $0.71 | |
State Farm Interim Fund | | | | | | | | | | | | | | | | |
| | | | |
Actual | | | $1,000.00 | | | | $ 958.40 | | | | 0.16% | | | | $0.78 | |
| | | | |
Hypothetical (5% return before expenses) | | | $1,000.00 | | | | $1,024.13 | | | | 0.16% | | | | $0.81 | |
State Farm Municipal Bond Fund | | | | | | | | | | | | | | | | |
| | | | |
Actual | | | $1,000.00 | | | | $ 956.80 | | | | 0.16% | | | | $0.78 | |
| | | | |
Hypothetical (5% return before expenses) | | | $1,000.00 | | | | $1,024.13 | | | | 0.16% | | | | $0.81 | |
| * | Expenses are calculated using the applicable Fund’s annualized expense ratio (as disclosed in the table), multiplied by the average account value for the period, multiplied by the number of days in the most recent half fiscal year (182), and divided by the number of days in the current year (365). |
49
ADVISERS INVESTMENT TRUST
STATE FARM FUNDS
LIQUIDITY RISK MANAGEMENT PROGRAM
March 31, 2022 (Unaudited)
To promote effective liquidity risk management throughout the fund industry and to enhance disclosure regarding fund liquidity and redemption practices, the U.S. Securities and Exchange Commission (the “SEC”) adopted Rule 22e-4 under the 1940 Act. This Rule requires every registered open-end management company to establish a liquidity risk management program (the “LRMP”) that, among other things, provides for the assessment, management and review of liquidity risk, the classification of a fund’s portfolio investments into one of four liquidity buckets based upon the number of days that such investments may reasonably be expected to be converted into cash or otherwise disposed of without significantly impacting their price, the establishment of a highly liquid investment minimum where required, and the establishment of a 15% limitation on illiquid investments. Additionally, the SEC adopted Rule 30b1-10 and Form N-LIQUID, which generally requires a fund to notify the SEC when certain liquidity-related events occur.
The Trust’s Board approved the appointment of the Adviser’s Committee as the administrator of the LRMP for the Funds on June 10, 2021. The Trust’s Board approved the Funds’ LRMP at its regular board meeting on March 11, 2021. At the Board’s regular meeting on March 10, 2022, the Trust’s Chief Compliance Officer and the Adviser each provided a report to the Board on the operation and effectiveness of the LRMP. The Adviser manages liquidity risks associated with the Funds’ investments by monitoring cash and cash equivalents, the use of derivatives, the concentration of investments and the appropriateness of portfolio strategies for open-end funds, and by classifying every fund investment as either highly liquid, moderately liquid, less liquid or illiquid on at least a monthly basis. To assist with the classification of Fund investments, the Adviser has contracted with a third party provider of liquidity monitoring services. The Adviser supplies portfolio-level data and certain assumptions to this provider, which the provider uses to determine preliminary classifications. Once these preliminary classifications are received by the Adviser, the Adviser’s personnel review the information.
The LRMP effectively managed the Funds’ liquidity risks for the period ended December 31, 2021. During this period, each Fund held no less than 50% of its total net assets in highly liquid investments. Because the Funds consisted primarily of highly liquid investments, no highly liquid investment minimum was required to be established for the Funds, and the Funds were well under their illiquid investment limitations. Additionally, no events that would require the filing of Form N-LIQUID occurred.
50
STATE FARM FUNDS
(Series of the Advisers Investment Trust)
NOTICE OF PRIVACY POLICY & PRACTICES
SAFEGUARDING PRIVACY
The Funds recognizes and respects the privacy concerns and expectations of our customers1. We are committed to maintaining the privacy and security of the personal confidential information we collect about you. We provide this notice so that you will know what kinds of information we collect and the circumstances in which that information may be disclosed to third parties.
INFORMATION WE COLLECT AND SOURCES OF INFORMATION
We collect nonpublic personal information about our customers from the following sources:
| ● | | Account Applications and other forms, which may include a customer’s name, address, social security number, and information about a customer’s investment goals and risk tolerance; |
| ● | | Account History, including information about the transactions and balances in a customer’s account(s); and |
| ● | | Correspondences including written, telephonic or electronic between a customer and the Funds or service providers to the Funds. |
INFORMATION WE SHARE WITH SERVICE PROVIDERS
The Funds may disclose all non-public personal information we collect, as described above, to companies that perform services on our behalf, including those that assist us in responding to inquiries, processing transactions, preparing and mailing account statements and other forms of shareholder services, provided they use the information solely for these purposes and they enter into a confidentiality agreement regarding the information. The Funds also may disclose non-public personal information as otherwise permitted by law.
SAFEGUARDING CUSTOMER INFORMATION
We will safeguard, according to federal standards of security and confidentiality, any non-public personal information our customers share with us.
We require service providers to the Funds:
| ● | | to maintain policies and procedures designed to assure only appropriate access to, and use of information about customers of the Funds; and |
| ● | | to maintain physical, electronic and procedural safeguards that comply with federal standards to guard nonpublic personal information of customers of the Funds. |
We will adhere to the policies and practices described in this notice regardless of whether you are a current or former shareholder of the Funds.
1 For purposes of this notice, the term “customer” or “customers” include individuals who provide nonpublic personal information to the Funds, but do not invest in Fund shares.
51
[THIS PAGE INTENTIONALLY LEFT BLANK]
[THIS PAGE INTENTIONALLY LEFT BLANK]
[THIS PAGE INTENTIONALLY LEFT BLANK]
Investment Adviser
State Farm Investment Management Corp.
One State Farm Plaza, B-2
Bloomington, IL 61710
Investment Sub-Adviser
Northern Trust Investments, Inc.
50 South LaSalle Street
Chicago, IL 60603
Custodian
The Northern Trust Company
50 South LaSalle Street
Chicago, IL 60603
Independent Registered Public
Accounting Firm
PricewaterhouseCoopersLLP
One North Wacker
Chicago, IL 60606
Legal Counsel
Thompson Hine LLP
41 South High Street, Suite 1700
Columbus, OH 43215-6101
Distributor
Foreside Financial Services, LLC
3 Canal Plaza, Suite 100
Portland, ME 04101
For Additional Information, call
866-342-2418 (toll free) or 312-557-7940
SF 3/22

RIVER CANYON TOTAL RETURN
BOND FUND
SEMI-ANNUAL REPORT
March 31, 2022
This report is submitted for the general information of the shareholders of the Fund. It is not authorized for the distribution to prospective investors unless preceded or accompanied by an effective prospectus.
ADVISERS INVESTMENT TRUST
RIVER CANYON TOTAL RETURN BOND FUND
TABLE OF CONTENTS
March 31, 2022 (Unaudited)
ADVISERS INVESTMENT TRUST
RIVER CANYON TOTAL RETURN BOND FUND
SHAREHOLDER LETTER
March 31, 2022 (Unaudited)
Dear Shareholder:
We are pleased to present to shareholders the March 31, 2022 Semi-Annual Report for the River Canyon Total Return Bond Fund (the “Fund”), a series of the Advisers Investment Trust. This report contains the results of Fund operations for the six months ended March 31, 2022.
We appreciate the trust and confidence you have placed in us by choosing the Fund and its Investment Adviser, River Canyon Fund Management LLC, and we look forward to continuing to serve your investing needs.
Sincerely,

Barbara J. Nelligan
President
Advisers Investment Trust
1
ADVISERS INVESTMENT TRUST
RIVER CANYON TOTAL RETURN BOND FUND
SCHEDULE OF INVESTMENTS
March 31, 2022 (Unaudited)
| | | | | | | | | | | | |
| | | Percentage of Net Assets | | | Principal Amount | | | Value | |
ASSET-BACKED SECURITIES | | | 10.0% | | | | | | | | | |
Project Silver Series 2019-1 (a)
3.97%, 07/15/44 | | | | | | $ | 3,656,707 | | | $ | 3,256,936 | |
Horizon Aircraft Finance I Ltd. Series 2018-1 (a)
4.46%, 12/15/38 | | | | | | | 4,654,642 | | | | 4,283,299 | |
Conseco Finance Corp. Series 1998-8 (b)
6.98%, 09/01/30 | | | | | | | 3,283,325 | | | | 3,181,549 | |
Business Jet Securities LLC Series 2021-1A (a)
2.92%, 04/15/36 | | | | | | | 2,243,359 | | | | 2,087,265 | |
Business Jet Securities LLC Series 2021-1A (a)
5.07%, 04/15/36 | | | | | | | 2,378,700 | | | | 2,239,920 | |
Oasis Securitization Funding LLC Series 2021-1A (a)
2.58%, 02/15/33 | | | | | | | 957,877 | | | | 955,272 | |
Barings CLO Ltd. Series 2019-2A
(Floating, ICE LIBOR USD 3M + 3.40%, 3.40% Floor) (a)(c)
3.64%, 04/15/36 | | | | | | | 2,000,000 | | | | 1,985,505 | |
MAPS Ltd. Series 2019-1A (a)
4.46%, 03/15/44 | | | | | | | 1,448,698 | | | | 1,351,114 | |
Madison Park Funding XLV Ltd. Series 2020-45A
(Floating, ICE LIBOR USD 3M + 3.15%, 3.15% Floor) (a)(c)
3.39%, 07/15/34 | | | | | | | 1,500,000 | | | | 1,488,643 | |
Sound Point CLO XXX Ltd. Series 2021-2A
(Floating, ICE LIBOR USD 3M + 3.35%, 3.35% Floor) (a)(c)
3.61%, 07/25/34 | | | | | | | 4,000,000 | | | | 3,999,935 | |
Skyline Aircraft Series 2006-S3 (d)
6.17%, 08/17/33 | | | | | | | 5,051,749 | | | | 4,744,378 | |
Sound Point CLO XXXI Ltd. Series 2021-3A
(Floating, ICE LIBOR USD 3M + 3.25%, 3.25% Floor) (a)(c)
3.38%, 10/25/34 | | | | | | | 2,750,000 | | | | 2,729,524 | |
Clsec Holdings 22t LLC Series 2021-1
6.17%, 05/11/37 | | | | | | | 14,814,626 | | | | 13,123,880 | |
ICG U.S. CLO Ltd. Series 2020-1A
(Floating, ICE LIBOR USD 3M + 3.60%, 3.60% Floor) (a)(c)
3.72%, 01/20/35 | | | | | | | 3,000,000 | | | | 2,983,136 | |
KKR CLO Ltd. Series 37A
(Floating, ICE LIBOR USD 3M + 3.35%, 3.35% Floor) (a)(c)
3.60%, 01/20/35 | | | | | | | 5,000,000 | | | | 4,999,484 | |
NRZ Excess Spread-Collateralized Notes Series 2021-GTN1 (a)
3.47%, 11/25/26 | | | | | | | 13,567,477 | | | | 12,989,489 | |
Oasis Securitization Funding LLC Series 2021-2A (a)
2.14%, 10/15/33 | | | | | | | 10,849,686 | | | | 10,733,841 | |
Sound Point CLO XXVII Ltd. Series 2020-2A
(Floating, ICE LIBOR USD 3M + 3.35%, 3.35% Floor) (a)(c)
3.61%, 10/25/34 | | | | | | | 5,000,000 | | | | 4,999,919 | |
| | | | | | | | | | | | |
TOTAL ASSET-BACKED SECURITIES
(Cost $85,453,313) | | | | | | | | | | | 82,133,089 | |
| | | | | | | | | | | | |
See Notes to Financial Statements.
2
ADVISERS INVESTMENT TRUST
RIVER CANYON TOTAL RETURN BOND FUND
SCHEDULE OF INVESTMENTS
March 31, 2022 (Unaudited)
| | | | | | | | | | | | |
| | | Percentage of Net Assets | | | Principal Amount | | | Value | |
BANK DEBTS | | | 0.4% | | | | | | | | | |
Mallinckrodt International Finance S.A.
3.00%, 02/28/22 | | | | | | $ | 3,000,000 | | | $ | 2,984,070 | |
| | | | | | | | | | | | |
TOTAL BANK DEBTS
(Cost $2,962,500) | | | | | | | | | | | 2,984,070 | |
| | | | | | | | | | | | |
MORTGAGE-BACKED SECURITIES | | | 25.7% | | | | | | | | | |
PRIVATE | | | 16.8% | | | | | | | | | |
Home Equity | | | 4.3% | | | | | | | | | |
Countrywide Asset-Backed Certificates Series 2006-S3
(Step to 6.61% on 5/25/22) (e)(f)
6.04%, 06/25/21 | | | | | | | 26 | | | | 621,810 | |
CWHEQ Home Equity Loan Trust Series 2006-S2
5.84%, 07/25/27 | | | | | | | 272,073 | | | | 195,893 | |
CWHEQ Home Equity Loan Trust Series 2006-S5 (f)
5.75%, 06/25/35 | | | | | | | 49 | | | | 1,843,370 | |
Home Equity Mortgage Trust Series 2006-1
(Floating, ICE LIBOR USD 1M + 0.60%, 0.40% Floor) (c)
0.66%, 05/25/36 | | | | | | | 2,731,000 | | | | 2,377,677 | |
Home Equity Mortgage Trust Series 2006-1
(Floating, ICE LIBOR USD 1M + 0.50%, 0.50% Floor) (c)
0.96%, 05/25/36 | | | | | | | 2,695,000 | | | | 2,471,244 | |
Home Equity Mortgage Trust Series 2006-1
(Step to 5.76% on 4/25/22) (e)
5.80%, 05/25/36 | | | | | | | 493,211 | | | | 471,570 | |
Home Equity Mortgage Trust Series 2006-3
(Floating, ICE LIBOR USD 1M + 0.46%, 0.46% Floor) (c)
0.92%, 09/25/36 | | | | | | | 2,708,000 | | | | 5,553 | |
Home Equity Mortgage Trust Series 2006-3
(Step to 5.97% on 1/25/34) (e)
5.97%, 09/25/36 | | | | | | | 2,984,471 | | | | 2,749,825 | |
Home Equity Mortgage Trust Series 2006-3
(Step to 6.08% on 7/25/33) (e)
6.09%, 09/25/36 | | | | | | | 4,976,000 | | | | 1,906,150 | |
Home Equity Mortgage Trust Series 2006-4
(Floating, ICE LIBOR USD 1M + 0.50%, 0.50% Floor) (c)
0.96%, 11/25/36 | | | | | | | 1,354,000 | | | | 1,745 | |
Home Equity Mortgage Trust Series 2006-4
(Floating, ICE LIBOR USD 1M + 0.61%, 0.61% Floor) (c)
3.99%, 11/25/36 | | | | | | | 4,391,000 | | | | 128 | |
Home Equity Mortgage Trust Series 2006-4 (g)
6.17%, 11/25/36 | | | | | | | 5,258,267 | | | | 5,033,457 | |
Home Equity Mortgage Trust Series 2006-4 (g)
6.23%, 11/25/36 | | | | | | | 3,943,796 | | | | 1,942,467 | |
Home Equity Mortgage Trust Series 2006-5
(Floating, ICE LIBOR USD 1M + 0.40%, 0.40% Floor) (c)
0.86%, 01/25/37 | | | | | | | 325,277 | | | | 46,874 | |
Home Equity Mortgage Trust Series 2006-5
(Step to 2.66% on 2/25/37) (e)
6.00%, 01/25/37 | | | | | | | 8,361,006 | | | | 7,740,504 | |
See Notes to Financial Statements.
3
ADVISERS INVESTMENT TRUST
RIVER CANYON TOTAL RETURN BOND FUND
SCHEDULE OF INVESTMENTS
March 31, 2022 (Unaudited)
| | | | | | | | | | | | |
| | | Percentage of Net Assets | | | Principal Amount | | | Value | |
Indymac Residential Mortgage-Backed Trust Series 2005-L3
(Floating, ICE LIBOR USD 1M + 0.44%, 0.44% Floor) (c)
0.90%, 12/25/38 | | | | | | $ | 1,196,606 | | | $ | 879,505 | |
JP Morgan Resecuritization Trust Series 2009-7 (a)(b)
7.00%, 09/27/37 | | | | | | | 9,593,084 | | | | 5,326,995 | |
Residential Asset Securitization Trust Series 2006-A6
(Floating, 5.90% - ICE LIBOR USD 1M, 5.90% Cap) (c)(h)
5.44%, 07/25/36 | | | | | | | 11,912,498 | | | | 2,163,462 | |
| | | | | | | | | | | | |
Total Home Equity
(Cost $34,184,100) | | | | | | | | | | | 35,778,229 | |
| | | | | | | | | | | | |
Commercial Mortgage-Backed Securities | | | 12.5% | | | | | | | | | |
CSMC Series 2021-BRIT
(Floating, ICE LIBOR USD 1M + 3.46%, 3.71% Floor) (a)(c)
3.86%, 05/15/23 | | | | | | | 56,521,000 | | | | 54,290,732 | |
CSMC Series 2022-CNTR (i)
0.00%, 01/15/24 | | | | | | | 50,000,000 | | | | 48,567,910 | |
| | | | | | | | | | | | |
Total Commercial Mortgage-Backed Securities
(Cost $105,780,205) | | | | | | | | | | | 102,858,642 | |
| | | | | | | | | | | | |
U.S. GOVERNMENT AGENCIES | | | 8.9% | | | | | | | | | |
FREMF Mortgage Trust Series 2019-KF59
(Floating, ICE LIBOR USD 1M + 6.00%, 6.00% Floor) (a)(c)
6.24%, 02/25/29 | | | | | | | 36,814,897 | | | | 37,326,119 | |
Government National Mortgage Association Series 2021-205 (c)(h)
3.15%, 11/20/51 | | | | | | | 196,137,095 | | | | 12,387,078 | |
Government National Mortgage Association Series 2021-70 (b)(h)
0.68%, 04/16/63 | | | | | | | 318,055,640 | | | | 23,196,688 | |
| | | | | | | | | | | | |
TOTAL U.S. GOVERNMENT AGENCIES
(Cost $74,923,707) | | | | | | | | | | | 72,909,885 | |
| | | | | | | | | | | | |
TOTAL MORTGAGE-BACKED SECURITIES
(Cost $214,888,012) | | | | | | | | | | | 211,546,756 | |
| | | | | | | | | | | | |
U.S. TREASURY OBLIGATIONS | | | 33.4% | | | | | | | | | |
U.S. Treasury Bill (j)
0.13%, 04/26/22 | | | | | | | 275,000,000 | | | | 274,974,934 | |
| | | | | | | | | | | | |
TOTAL U.S. TREASURY OBLIGATIONS
(Cost $274,973,073) | | | | | | | | | | | 274,974,934 | |
| | | | | | | | | | | | |
MUNICIPAL BONDS | | | 4.1% | | | | | | | | | |
GDB Debt Recovery Authority of Commonwealth Puerto Rico Taxable Revenue Bond (k)
7.50%, 08/20/40 | | | | | | | 35,477,576 | | | | 33,260,227 | |
| | | | | | | | | | | | |
TOTAL MUNICIPAL BONDS
(Cost $31,980,626) | | | | | | | | | | | 33,260,227 | |
| | | | | | | | | | | | |
See Notes to Financial Statements.
4
ADVISERS INVESTMENT TRUST
RIVER CANYON TOTAL RETURN BOND FUND
SCHEDULE OF INVESTMENTS
March 31, 2022 (Unaudited)
| | | | | | | | | | | | |
| | | Percentage of Net Assets | | | Shares | | | Value | |
SHORT-TERM INVESTMENTS | | | 14.6% | | | | | | | | | |
Northern Institutional Treasury Portfolio (Premier Class), 0.12%(l) | | | | | | | 120,198,503 | | | $ | 120,198,503 | |
| | | | | | | | | | | | |
TOTAL SHORT-TERM INVESTMENTS
(Cost $120,198,503) | | | | | | | | | | �� | 120,198,503 | |
| | | | | | | | | | | | |
TOTAL INVESTMENTS
(Cost $730,456,027) | | | 88.2% | | | | | | | | 725,097,579 | |
| | | | | | | | | | | | |
NET OTHER ASSETS (LIABILITIES) | | | 11.8% | | | | | | | | 97,281,543 | |
| | | | | | | | | | | | |
NET ASSETS | | | 100.0% | | | | | | | $ | 822,379,122 | |
| | | | | | | | | | | | |
(a)Securities purchased in a transaction exempt from registration under Rule 144A of the Securities Act of 1933. These securities may not be publicly traded without registration under the Securities Act of 1933. The value of these securities is determined by valuations supplied by a pricing service or brokers.
(b)Variable or floating rate security, the interest rate of which adjusts periodically based on changes in current interest rates and prepayments on the underlying pool of assets.
(c)Floating rate security. The rate presented is the rate in effect at March 31, 2022, and the related index and spread are shown parenthetically for each security.
(d)Security valued pursuant to Level 3 unobservable inputs.
(e)Step coupon bond. Rate as of March 31, 2022 is disclosed.
(f)FGIC insured bond in which the current value primarily relates to pending insurance payments.
(g)The interest rate on this certificate may increase 0.50% per annum after the first possible optional termination date.
(h)Interest only security
(i)Zero coupon bond.
(j)Discount rate at the time of purchase.
(k)Security is a payment in-kind bond, and unless otherwise noted in the description of the security, pays its entire coupon on an in-kind basis.
(l)7-day current yield as of March 31, 2022 is disclosed.
Abbreviations:
CLO – Collateralized Loan Obligation
See Notes to Financial Statements.
5
ADVISERS INVESTMENT TRUST
STATEMENT OF ASSETS & LIABILITIES
March 31, 2022 (Unaudited)
| | |
| | | River Canyon Total Return Bond Fund |
Assets: | | |
Investments, at value (Cost: $730,456,027) | | $ 725,097,579 |
Receivable for interest | | 2,353,493 |
Receivable for dividends | | 7,492 |
Receivable for investments sold | | 144,587,279 |
Receivable for capital shares sold | | 1,138,819 |
Prepaid expenses | | 54,097 |
| | |
Total Assets | | 873,238,759 |
| | |
Liabilities: | | |
Securities purchased payable | | 2,962,500 |
Capital shares redeemed payable | | 46,308,910 |
Investment advisory fees payable | | 523,262 |
Accounting and Administration fees payable | | 881,763 |
Accrued expenses and other payables | | 183,202 |
| | |
Total Liabilities | | 50,859,637 |
| | |
Net Assets | | $ 822,379,122 |
| | |
| |
Institutional Shares: | | |
Net assets | | $ 822,379,122 |
Shares of common stock outstanding | | 77,063,134 |
| | |
Net asset value per share | | $ 10.67 |
| | |
| |
Net Assets: | | |
Paid in capital | | $ 861,872,310 |
Distributable earnings (loss) | | (39,493,188) |
| | |
Net Assets | | $ 822,379,122 |
| | |
See Notes to Financial Statements.
6
ADVISERS INVESTMENT TRUST
STATEMENT OF OPERATIONS
For the six months ended March 31, 2022 (Unaudited)
| | | | |
| | | River Canyon Total Return Bond Fund | |
| |
Investment Income: | | | | |
Dividend income | | $ | 171,263 | |
Interest income | | | 24,670,713 | |
| | | | |
Total investment income | | | 24,841,976 | |
| | | | |
Operating expenses: | | | | |
Investment advisory | | | 3,464,065 | |
Accounting and Administration | | | 437,358 | |
Regulatory and Compliance | | | 209,745 | |
Trustees | | | 34,390 | |
Legal | | | 21,796 | |
Interest expense | | | 9,806 | |
Other | | | 104,495 | |
| | | | |
Total expenses before reductions | | | 4,281,655 | |
Expenses reduced by Adviser | | | (807,780 | ) |
| | | | |
Net expenses | | | 3,473,875 | |
| | | | |
Net investment income | | | 21,368,101 | |
| | | | |
Realized and Unrealized Losses from Investment Activities: | | | | |
Net realized losses from investment transactions | | | (30,987,680 | ) |
Change in unrealized appreciation (depreciation) on investments | | | (17,343,199 | ) |
| | | | |
Net realized and unrealized losses from investment activities | | | (48,330,879 | ) |
| | | | |
Change in Net Assets Resulting from Operations | | $ | (26,962,778 | ) |
| | | | |
| | | | |
| |
See Notes to Financial Statements.
7
ADVISERS INVESTMENT TRUST
STATEMENTS OF CHANGES IN NET ASSETS
For the six months ended March 31, 2022 (Unaudited) and the year ended September 30, 2021
| | | | | | | | |
| | | River Canyon | |
| | | Total Return Bond Fund | |
| | | 2022 | | | 2021 | |
| |
Increase (decrease) in net assets: | | | | | | | | |
Operations: | | | | | | | | |
Net investment income | | $ | 21,368,101 | | | $ | 14,687,938 | |
Net realized gains (losses) from investment transactions | | | (30,987,680 | ) | | | (3,492,012 | ) |
Change in unrealized appreciation (depreciation) on investments | | | (17,343,199 | ) | | | 14,237,200 | |
| | | | | | | | |
Change in net assets resulting from operations | | | (26,962,778 | ) | | | 25,433,126 | |
| | | | | | | | |
Dividends paid to shareholders: | | | | | | | | |
From distributable earnings | | | (19,992,805 | ) | | | (19,000,650 | ) |
| | | | | | | | |
Total dividends paid to shareholders | | | (19,992,805 | ) | | | (19,000,650 | ) |
| | | | | | | | |
Capital Transactions: | | | | | | | | |
Proceeds from sale of shares | | | 616,589,210 | | | | 789,780,365 | |
Value of shares issued to shareholders in reinvestment of dividends | | | 17,970,381 | | | | 15,939,141 | |
Value of shares redeemed | | | (633,878,724 | ) | | | (109,800,387 | ) |
| | | | | | | | |
Change in net assets from capital transactions | | | 680,867 | | | | 695,919,119 | |
| | | | | | | | |
Change in net assets | | | (46,274,716 | ) | | | 702,351,595 | |
Net assets: | | | | | | | | |
Beginning of year | | | 868,653,838 | | | | 166,302,243 | |
| | | | | | | | |
End of year | | $ | 822,379,122 | | | $ | 868,653,838 | |
| | | | | | | | |
Share Transactions: | | | | | | | | |
Sold | | | 55,877,025 | | | | 71,245,080 | |
Reinvested | | | 1,640,669 | | | | 1,444,402 | |
Redeemed | | | (58,463,136 | ) | | | (9,908,796 | ) |
| | | | | | | | |
Change | | | (945,442 | ) | | | 62,780,686 | |
| | | | | | | | |
| | | | | | | | |
| |
See Notes to Financial Statements.
8
ADVISERS INVESTMENT TRUST
FINANCIAL HIGHLIGHTS
For the periods indicated
| | | | | | | | | | | | | | | | | | | | | | | | |
| | | River Canyon | |
| | | Total Return Bond Fund | |
| | | Six Months Ended | | | Year Ended | | | Year Ended | | | Year Ended | | | Year Ended | | | Year Ended | |
| | | March 31, | | | September 30, | | | September 30, | | | September 30, | | | September 30, | | | September 30, | |
| | | 2022 | | | 2021 | | | 2020 | | | 2019 | | | 2018 | | | 2017 | |
| | | (Unaudited) | | | | | | | | | | | | | | | | |
| |
Net asset value, beginning of period | | $ | 11.14 | | | $ | 10.92 | | | $ | 11.17 | | | $ | 10.41 | | | $ | 10.35 | | | $ | 10.23 | |
| | | | | | | | | | | | | | | | | | | | | | | | |
Income (loss) from operations: | | | | | | | | | | | | | | | | | | | | | | | | |
Net investment income | | | 0.02 | | | | 0.40 | | | | 0.33 | | | | 0.24 | | | | 0.46 | | | | 0.38 | |
Net realized and unrealized gains (losses) from investments | | | (0.69 | ) | | | 0.46 | | | | 0.02 | | | | 0.79 | | | | 0.05 | | | | 0.25 | |
| | | | | | | | | | | | | | | | | | | | | | | | |
Total from investment operations | | | (0.67 | ) | | | 0.86 | | | | 0.35 | | | | 1.03 | | | | 0.51 | | | | 0.63 | |
| | | | | | | | | | | | | | | | | | | | | | | | |
Less distributions paid: | | | | | | | | | | | | | | | | | | | | | | | | |
From net investment income | | | 0.20 | | | | (0.40 | ) | | | (0.35 | ) | | | (0.27 | ) | | | (0.45 | ) | | | (0.39 | ) |
From net realized gains on investments | | | — | | | | (0.24 | ) | | | (0.25 | ) | | | — | | | | — | | | | (0.12 | ) |
| | | | | | | | | | | | | | | | | | | | | | | | |
Total distributions paid | | | 0.20 | | | | (0.64 | ) | | | (0.60 | ) | | | (0.27 | ) | | | (0.45 | ) | | | (0.51 | ) |
| | | | | | | | | | | | | | | | | | | | | | | | |
Change in net asset value | | | (0.47 | ) | | | 0.22 | | | | (0.25 | ) | | | 0.76 | | | | 0.06 | | | | 0.12 | |
| | | | | | | | | | | | | | | | | | | | | | | | |
Net asset value, end of period | | $ | 10.67 | | | $ | 11.14 | | | $ | 10.92 | | | $ | 11.17 | | | $ | 10.41 | | | $ | 10.35 | |
| | | | | | | | | | | | | | | | | | | | | | | | |
Total return(a) | | | (2.44 | %) | | | 8.10 | % | | | 3.20 | % | | | 10.16 | % | | | 5.00 | % | | | 6.41 | % |
Ratios/Supplemental data: | | | | | | | | | | | | | | | | | | | | | | | | |
Net assets, end of period (000’s) | | $ | 822,379 | | | $ | 868,654 | | | $ | 166,302 | | | $ | 115,186 | | | $ | 26,278 | | | $ | 28,635 | |
Ratio of net expenses to average net assets(b) | | | 0.65 | %(c) | | | 0.66 | %(c) | | | 0.65 | % | | | 0.65 | % | | | 0.65 | % | | | 0.65 | % |
Ratio of net investment income to average net assets(b) | | | 4.01 | % | | | 3.51 | % | | | 3.02 | % | | | 2.60 | % | | | 4.39 | % | | | 3.81 | % |
Ratio of gross expenses to average net assets(b), (d) | | | 0.80 | % | | | 0.88 | % | | | 1.06 | % | | | 1.48 | % | | | 2.43 | % | | | 1.98 | % |
Portfolio turnover rate(a) | | | 55.34 | % | | | 55.64 | % | | | 44.82 | % | | | 30.46 | % | | | 46.78 | % | | | 47.85 | % |
| | | | | | | | | | | | | | | | | | | | | | | | |
| |
| (a) | Not annualized for periods less than one year. |
| (b) | Annualized for periods less than one year. |
| (c) | Expenses include interest expense on reverse repurchase agreements of less than 0.005% and 0.01% for six months ended March 31, 2022 and for the year ended September 30, 2021, respectively, which is excluded from the Fund’s contractual expense limit. |
| (d) | During the years shown, certain fees were reduced. If such fee reductions had not occurred, the ratio would have been as indicated. |
See Notes to Financial Statements.
9
ADVISERS INVESTMENT TRUST
RIVER CANYON TOTAL RETURN BOND FUND
NOTES TO FINANCIAL STATEMENTS
March 31, 2022 (Unaudited)
Advisers Investment Trust (the “Trust”) is a Delaware statutory trust operating under a Fourth Amended and Restated Agreement and Declaration of Trust (the “Trust Agreement”) dated March 10, 2022. The Trust was formerly an Ohio business trust, which commenced operations on December 20, 2011. On March 31, 2017, the Trust was converted to a Delaware statutory trust. As an open-end registered investment company, as defined in Financial Accounting Standards Board (“FASB”) Accounting Standards Update (“ASU”) 2013-08, the Trust follows accounting and reporting guidance under FASB Accounting Standards Codification (“ASC”) Topic 946, “Financial Services-Investment Companies”. The Trust Agreement permits the Board of Trustees (the “Trustees” or “Board”) to authorize and issue an unlimited number of shares of beneficial interest, at no par value, in separate series of the Trust. The River Canyon Total Return Bond Fund (the “Fund”) is a series of the Trust, and the Fund’s Institutional Shares class commenced operations on December 30, 2014. Prior to April 6, 2015 shares of the Fund were not registered under the Securities Act of 1933, as amended (the “1933 Act”). During that time, investments in the Fund were made only by individuals or entities that were “accredited investors” within the meaning of Regulation D under the 1933 Act, and shares were issued solely in private placement transactions that did not involve any “public offering” within the meaning of Section 4(a)(2) of the 1933 Act. Effective April 6, 2015, the Fund became publicly available for investment.
The investment objective of the Fund is to seek to maximize total return. The Fund has been managed as a diversified fund pursuant to Section 5(b) of the Investment Company Act of 1940, as amended, (the “1940 Act”) since July 2018. Effective April 26, 2021, the Fund determined to continue to be managed as a diversified fund.
Under the Trust’s organizational documents, its officers and Trustees are indemnified against certain liabilities arising out of the performance of their duties to the Trust and Fund. In addition, in the normal course of business, the Trust enters into contracts with its vendors and others that provide for general indemnifications. The Fund’s maximum exposure under these arrangements is unknown, as this would involve future claims that may be made against the Fund.
| A. | Significant accounting policies are as follows: |
INVESTMENT VALUATION
Investments are recorded at fair value. Fair value is defined as the price that would be received to sell an asset or paid to transfer a liability in an orderly transaction between market participants at the measurement date. The valuation techniques employed by the Fund, as described below, maximize the use of observable inputs and minimize the use of unobservable inputs in determining fair value. These inputs are summarized in the following three broad levels:
• Level 1 —quoted prices in active markets for identical assets
• Level 2 —other significant observable inputs (including quoted prices of similar securities, interest rates, prepayment speeds, credit risk, etc.)
• Level 3 —significant unobservable inputs (including the Fund’s own assumptions in determining the fair value of investments)
The inputs or methodology used for valuing securities are not necessarily an indication of the risk associated with investing in those securities. For example, certain short-term debt securities may be valued using amortized cost. Generally, amortized cost approximates the current value of a security, but since this valuation is not obtained from a quoted price in an active market, such securities would be reflected as Level 2 in the fair value hierarchy.
Security prices are generally provided by an independent third party pricing service approved by the Trustees as of the close of the New York Stock Exchange, normally at 4:00 p.m. Eastern Time, each business day on which the share price of the Fund is calculated.
Debt and other fixed income securities are generally valued at an evaluated price provided by an independent pricing source approved by the Trustees. To value debt securities, pricing services may use various pricing techniques which take into account appropriate factors such as market activity, yield, quality, coupon rate, maturity, type of issue, trading characteristics, call features, credit ratings and other data, as well as broker quotes. Short-term debt securities of sufficient credit quality that mature within sixty days may be valued at amortized cost, which approximates fair value. In each of these situations, valuations are typically categorized as Level 2 in the fair value hierarchy.
10
ADVISERS INVESTMENT TRUST
RIVER CANYON TOTAL RETURN BOND FUND
NOTES TO FINANCIAL STATEMENTS
March 31, 2022 (Unaudited)
Equity securities listed or traded on a primary exchange are valued at the closing price, if available, or the last sales price on the primary exchange. If no sale occurred on the valuation date, the securities will be valued at the latest quotations as of the close of the primary exchange. Investments in other open-end registered investment companies are valued at their respective net asset value as reported by such companies. In these types of situations, valuations are typically categorized as a Level 1 in the fair value hierarchy.
When the price of a security is not readily available or deemed unreliable (e.g., an approved pricing service does not provide a price, a furnished price is in error, certain stale prices, or an event occurs that materially affects the furnished price), the Fund’s Fair Value Committee may in good faith establish a fair value for that security in accordance with procedures established by and under the general supervision of the Trustees.
In the fair value situations as noted above, while the Trust’s valuation policy is intended to result in a calculation of the Fund’s net asset value that fairly reflects security values as of the time of pricing, the Trust cannot ensure that fair values determined pursuant to these guidelines would accurately reflect the price that the Fund could obtain for a security if it were to dispose of that security as of the time of pricing (for instance, in a forced or distressed sale). The prices used by the Fund may differ from the value that would be realized if the securities were sold, and these differences could be material to the financial statements. Depending on the source and relative significance of the valuation inputs in these instances, the instruments may be classified as Level 2 or Level 3 in the fair value hierarchy.
The following is a summary of the valuation inputs used as of March 31, 2022 in valuing the Fund’s investments based upon the three fair value levels defined above:
| | | | | | | | | | | | | | | | |
| | | Level 1 - Quoted
Prices | | | Level 2 - Other Significant
Observable Inputs | | | Level 3 - Significant
Unobservable Inputs | | | Total | |
Assets: | | | | | | | | | | | | | | | | |
Investments in Securities: | | | | | | | | | | | | | | | | |
Asset-Backed Securities | | $ | — | | | $ | 77,388,711 | | | $ | 4,744,378 | | | $ | 82,133,089 | |
Bank Debts | | | — | | | | 2,984,070 | | | | — | | | | 2,984,070 | |
Mortgage-Backed Securities | | | — | | | | 211,546,756 | | | | — | | | | 211,546,756 | |
U.S. Treasury Obligations | | | — | | | | 274,974,934 | | | | — | | | | 274,974,934 | |
Municipal Bonds | | | — | | | | 33,260,227 | | | | — | | | | 33,260,227 | |
Short-Term Investments | | | 120,198,503 | | | | — | | | | — | | | | 120,198,503 | |
| | | | |
Total Assets – Investment in Securities | | $ | 120,198,503 | | | $ | 600,154,698 | | | $ | 4,744,378 | | | $ | 725,097,579 | |
| | | | |
Total Investments | | $ | 120,198,503 | | | $ | 600,154,698 | | | $ | 4,744,378 | | | $ | 725,097,579 | |
| | | | |
The Level 3 securities noted above were held during the period ended March 31, 2022. The value of these securities compared to the total Fund net assets is not material and, therefore, the reconciliation of Level 3 securities and related valuation techniques are not disclosed.
FORWARD COMMITMENTS
The Fund may contract to purchase securities for a fixed price at a transaction date beyond the customary settlement period (i.e., “when issued,” “delayed delivery,” “forward commitment,” or “TBA transaction”) consistent with the Fund’s ability to manage its investment portfolio. No interest will be earned by the Fund on such purchases until the securities are delivered, however the market value may change prior to delivery. When the Fund makes a commitment to purchase a security on a forward commitment basis, cash or liquid securities equal to the amount of such Fund’s commitments will be reserved for payment of the commitment.
The Fund may enter into TBA sale commitments to help manage portfolio duration, hedge its positions or to sell mortgage-backed securities it owns under delayed delivery arrangements. Proceeds of TBA sale commitments are not received until the contractual settlement date. During the time a TBA sale commitment is outstanding, equivalent deliverable securities, or an offsetting TBA purchase commitment deliverable on or before the sale commitment date, are held as “cover” for the transaction.
11
ADVISERS INVESTMENT TRUST
RIVER CANYON TOTAL RETURN BOND FUND
NOTES TO FINANCIAL STATEMENTS
March 31, 2022 (Unaudited)
Unsettled TBA sale (purchase) commitments are valued at the current market value of the underlying securities. The contract is adjusted to market value daily and the change in market value is recorded by the Fund as an unrealized gain or loss. If the TBA sale (purchase) commitment is closed through the acquisition of an offsetting purchase (sale) commitment, the Fund realizes a gain or loss from the sale of the securities based upon the unit price established at the date the commitment was entered.
REVERSE REPURCHASE AGREEMENTS
The Fund may enter into reverse repurchase agreements. In a reverse repurchase agreement, the Fund delivers securities in exchange for cash to a counterparty, with a simultaneous agreement to repurchase the same or substantially same securities at an agreed upon price and date. The Fund is entitled to receive principal and interest payments, if any, made on the securities delivered to the counterparty during the term of the agreement. Cash received in exchange for the securities delivered will accrue interest to be paid by the Fund to the counterparty and is recorded as a component of interest expense on the Statement of Operations. The Fund will earmark and reserve Fund assets, in cash or liquid securities, in an amount at least equal to its purchase obligations under the agreements. As of March 31, 2022, there were no reverse repurchase agreements held by the Fund.
INVESTMENT TRANSACTIONS AND INCOME
Investment transactions are accounted for no later than one business day after trade date. For financial reporting purposes, investments are reported as of the trade date. The Fund determines the gain or loss realized from investment transactions by using an identified cost basis method. Interest income is recognized on an accrual basis and includes, where applicable, the amortization of premium or accretion of discount. Dividend income is recognized on the ex-dividend date.
EXPENSE ALLOCATIONS
Expenses directly attributable to a fund in the Trust are charged to that fund, while expenses that are attributable to more than one fund in the Trust are allocated among the applicable funds on a pro-rata basis to each adviser’s series of funds based on relative net assets or another reasonable basis.
DIVIDENDS AND DISTRIBUTIONS
The Fund intends to distribute substantially all of its net investment income as dividends to shareholders on a monthly basis. The Fund intends to distribute its net realized long-term capital gains and its net realized short-term capital gains at least once a year.
Distributions from net investment income and from net realized capital gain are determined in accordance with Federal income tax regulations, which may differ from accounting principles generally accepted in the United States of America (“GAAP”). These “book/tax” differences are either considered temporary or permanent in nature. To the extent these differences are permanent in nature (e.g. treatment of certain dividend distributions, gains/losses, return of capital, etc.), such amounts are reclassified within the composition of net assets based on their federal tax-basis treatment; temporary differences do not require reclassification. Distributions to shareholders that exceed net investment income and net realized capital gains for tax purposes are reported as return of capital.
FEDERAL INCOME TAX INFORMATION
No provision is made for Federal income taxes as the Fund intends to qualify each year as a “regulated investment company” under Subchapter M of the Internal Revenue Code of 1986, as amended (the “Code”), and distribute substantially all of its net investment income and net realized capital gain in accordance with the Code.
As of March 31, 2022, the Fund did not have uncertain tax positions that would require financial statement recognition or disclosure based on an evaluation of all open tax years for all major tax jurisdictions. The Fund’s tax return for the tax years ended September 30, 2021, 2020, 2019 and 2018 remain subject to examination by the Internal Revenue Service. Interest or penalties incurred, if any, on future unknown, uncertain tax positions taken by the Fund will be recorded as interest expense on the Statement of Operations.
12
ADVISERS INVESTMENT TRUST
RIVER CANYON TOTAL RETURN BOND FUND
NOTES TO FINANCIAL STATEMENTS
March 31, 2022 (Unaudited)
Management is not aware of any tax positions for which it is reasonably possible that the total amounts of unrecognized tax benefits will change materially in the next 12 months.
USE OF ESTIMATES
The preparation of financial statements in conformity with GAAP requires management to make estimates and assumptions that affect the reported amounts of assets and liabilities and disclosure of contingent assets and liabilities at the date of the financial statements and the reported amounts of revenues and expenses during the reporting period. Actual results could differ from these estimates.
| B. | Fees and Transactions with Affiliates and Other Parties |
River Canyon Fund Management LLC (the “Adviser” or “River Canyon”) serves as the investment adviser to the Fund. Under the terms of the Trust’s Investment Advisory Agreement (the “Agreement”) with the Adviser, the Fund paid the Adviser a fee computed and accrued daily and paid monthly at the annual rate of 0.65% of average daily net assets. Total fees incurred pursuant to the Agreement are reflected as “Investment advisory” fees on the Statement of Operations.
Foreside Financial Services, LLC (the “Distributor”) provides distribution services to the Fund pursuant to a distribution agreement with the Trust, on behalf of the Fund. Under its agreement with the Trust, the Distributor acts as an agent of the Trust in connection with the offering of the shares of the Fund on a continuous basis. The Adviser, at its own expense, pays the Distributor an annual $25,000 fee for these services and reimbursement for certain expenses incurred on behalf of the Fund.
The Northern Trust Company (“Northern Trust”) serves as the administrator, transfer agent, custodian and fund accounting agent for the Fund pursuant to written agreements between the Trust, on behalf of the Fund, and Northern Trust. The Fund has agreed to pay Northern Trust a tiered basis-point fee based on the Fund’s daily net assets, subject to a minimum annual fee of $150,000 relating to these services, as well as other charges for additional service activities. Total fees paid to Northern Trust pursuant to these agreements are reflected as “Accounting and Administration” fees on the Statement of Operations.
Foreside Fund Officer Services, LLC (“Foreside”) provides compliance and financial control services for the Fund pursuant to a written agreement with the Trust, on behalf of the Fund, including providing certain officers to the Fund. The Fund pays Foreside an annual asset-based fee, a basis-point fee based on the Fund’s daily net assets, subject to an overall annual minimum fee of $125,000 for these services, and reimburses for certain expenses incurred on behalf of the Fund. Total fees paid to Foreside pursuant to these agreements are reflected as “Regulatory and Compliance” fees on the Statement of Operations.
The officers of the Trust are affiliated with Foreside, Northern Trust, or the Distributor and receive no compensation directly from the Fund for serving in their respective roles. The Trust paid each Trustee who is not an “interested person,” as that term is defined in the 1940 Act (each, an “Independent Trustee” and, collectively, the “Independent Trustees”) compensation for their services based on an annual retainer of $125,000 and reimbursement for certain expenses. If there are more than six meetings in a year, additional meeting fees may apply. For the six months ended March 31, 2022, the aggregate Trustee compensation paid by the Trust was $222,750. The amount of total Trustee compensation and reimbursement of out-of-pocket expenses allocated from the Trust to the Fund is reflected as “Trustees” expenses on the Statement of Operations.
The Adviser has contractually agreed to waive fees or reimburse expenses to the extent necessary to limit total annual fund operating expenses (exclusive of brokerage costs, interest, taxes, dividend expense on short positions, litigation and indemnification expenses, expenses associated with investments in underlying investment companies and extraordinary expenses) to 0.65% of the average daily net assets of the Fund until January 28, 2023. If it becomes unnecessary for the Adviser to waive fees or make reimbursements, the Adviser may recapture any of its prior waivers or reimbursements for a period not to exceed three years from the date in which the waiver or reimbursement was made to the extent that such a recapture does not cause the Total Annual Fund Operating Expenses (exclusive of brokerage costs, interest, taxes, dividend expense on short positions, litigation and indemnification expenses, expenses associated with
13
ADVISERS INVESTMENT TRUST
RIVER CANYON TOTAL RETURN BOND FUND
NOTES TO FINANCIAL STATEMENTS
March 31, 2022 (Unaudited)
investments in underlying investment companies and extraordinary expenses) to exceed the applicable expense limitation in effect at the time of repayment or the applicable expense limitation that was in effect at the time of the waiver or reimbursement. The agreement to waive fees and reimburse expenses may be terminated by the Board at any time and will terminate automatically upon termination of the Agreement.
For the six months ended March 31, 2022, the Fund incurred advisory fees payable to River Canyon, expense waivers/reimbursements from River Canyon, and paid expense recoupments to River Canyon as follows:
| | | | | | | | | | | | |
| Fund | | Advisory
Fee to
River Canyon | | | Expenses Reduced by River Canyon | | | Advisory Fees
Recouped
by River Canyon | |
|
River Canyon Total Return Bond Fund | | $ | 3,464,065 | | | $ | 807,780 | | | $ | — | |
The balances of recoverable expenses to River Canyon by the Fund at March 31, 2022 were as follows:
| | | | | | | | |
| For the: | | Expiring | | | | River Canyon | |
|
Year Ended September 30, 2019 | | September 30, 2022 | | | | $ | 451,131 | |
Year Ended September 30, 2020 | | September 30, 2023 | | | | | 569,246 | |
Year Ended September 30, 2021 | | September 30, 2024 | | | | | 932,666 | |
Six months ended March 31, 2022 | | September 30, 2025 | | | | | 807,780 | |
| | | | | | | | |
Balances of Recoverable Expenses to the Adviser | | | | | | $ | 2,760,823 | |
| | | | | | | | |
| C. | Investment Transactions |
For the six months ended March 31, 2022, the aggregate costs of purchases and proceeds from sales of securities (excluding short-term investments) for the Fund were as follows:
| | | | | | | | |
| Fund | | Cost of Purchases | | | Proceeds from sales | |
|
River Canyon Total Return Bond Fund | | $ | 485,309,066 | | | $ | 906,903,726 | |
As of March 31, 2022, the cost, gross unrealized appreciation and gross unrealized depreciation on investments, for Federal income tax purposes, were as follows:
| | | | | | | | | | | | | | | | |
| Fund | | Cost | | | Gross Unrealized Appreciation | | | Gross Unrealized (Depreciation) | | | Net Unrealized Appreciation (Depreciation) | |
| |
River Canyon Total Return Bond Fund | | $ | 732,244,907 | | | $ | 3,062,916 | | | $ | (10,210,244 | ) | | $ | (7,147,328 | ) |
The tax character of distributions paid to shareholders during the latest tax years ended September 30, 2021 and September 30, 2020 for the Fund was as follows:
| | | | | | | | | | | | | | | | | | | | |
| River Canyon Total Return Bond Fund | | Ordinary Income | | | Net Long
Term Gains | | | Total Taxable
Distributions | | | Tax Return
of Capital | | | Total Distributions Paid | |
| |
2021 | | $ | 16,999,791 | | | $ | 2,000,859 | | | $ | 19,000,650 | | | $ | — | | | $ | 19,000,650 | |
2020 | | | 4,996,188 | | | | 2,521,248 | | | | 7,517,436 | | | | — | | | | 7,517,436 | |
14
ADVISERS INVESTMENT TRUST
RIVER CANYON TOTAL RETURN BOND FUND
NOTES TO FINANCIAL STATEMENTS
March 31, 2022 (Unaudited)
As of the tax year ended September 30, 2021, the components of accumulated earnings on a tax basis were as follows:
| | | | | | | | | | | | | | | | | | | | | | | | | | | | |
| Fund | | Undistributed
Ordinary Income | | | Undistributed Long
Term Capital
Gains | | | Accumulated
Earnings | | | Distributions
Payable | | | Accumulated
Capital and
Other Losses | | | Unrealized
Appreciation | | | Total
Accumulated
Earnings | |
| |
River Canyon Total Return Bond Fund | | | $252,639 | | | | $ — | | | | $252,639 | | | | $ — | | | | $(3,503,184 | ) | | | $10,712,940 | | | | $7,462,395 | |
As of the tax year ended September 30, 2021, capital losses incurred by the Fund are carried forward indefinitely under the provisions of the Regulated Investment Company Modernization Act of 2010 and are as follows:
| | | | | | | | |
| Fund | | Short-Term
Capital Loss
Carry-Forward | | | Long-Term
Capital Loss
Carry-Forward | |
|
River Canyon Total Return Bond Fund | | $ | 3,503,184 | | | $ | — | |
| E. | Concentration of Ownership |
A significant portion of the Fund’s shares may be held in a limited number of shareholder accounts. To the extent that a shareholder or group of shareholders redeem a significant portion of the shares issued by the Fund, this could have a disruptive impact on the efficient implementation of the Fund’s investment strategy.
The global outbreak of COVID-19 has disrupted economies and markets, and the prolonged duration and economic impact is uncertain. These events can have a significant impact on the Fund’s operations and performance.
Instruments in which the Fund invest may pay interest at floating rates based on the London Interbank Offered Rate (“LIBOR”) or may be subject to interest caps or floors based on LIBOR. In 2017, the head of the United Kingdom’s Financial Conduct Authority announced a desire to phase out the use of LIBOR by the end of 2021. The phase out of the three-, six- and twelve-month U.S. dollar LIBOR settings has been delayed until mid-2023, but all other LIBOR settings, including the one-week and two-month U.S. dollar LIBOR settings were phased out on December 31, 2021. The Fund may have investments linked to other interbank offered rates, such as the Euro Overnight Index Average (“EONIA”), which may also cease to be published. Various financial industry groups have begun planning for the transition away from LIBOR, but there are challenges to converting certain securities and transactions to a new reference rate (e.g., the Secured Overnight Financing Rate (“SOFR”), which is intended to replace the U.S. dollar LIBOR). Neither the effect of the LIBOR transition process nor its ultimate success can yet be known. Abandonment of LIBOR and the transition of a new reference rate could have adverse impacts on newly issued financial instruments and existing financial instruments which reference LIBOR and lead to significant short-term and long-term uncertainty, market instability and illiquidity in markets for instruments whose terms currently include LIBOR. While some existing LIBOR-based instruments may contemplate a scenario where LIBOR is no longer available by providing for an alternative rate-setting methodology, there may be significant uncertainty regarding the effectiveness of any such alternative methodologies to replicate LIBOR. Not all existing LIBOR-based instruments may have alternative rate-setting provisions and there remains uncertainty regarding the willingness and ability of issuers to add alternative rate-setting provisions in certain existing instruments. In addition, a liquid market for newly-issued instruments that use a reference rate other than LIBOR still may be developing. All of the aforementioned may adversely affect the Funds’ performance or NAV.
15
ADVISERS INVESTMENT TRUST
RIVER CANYON TOTAL RETURN BOND FUND
ADDITIONAL INFORMATION
March 31, 2022 (Unaudited)
| A. | Security Allocation as of March 31, 2022 |
| | | | |
| Market Exposure | |
|
| Securities | | % of Net Assets | |
|
U.S. Treasury Obligations | | | 33.4 | |
Mortgage-Backed Securities | | | 25.7 | |
Asset-Backed Securities | | | 10.0 | |
Municipal Bonds | | | 4.1 | |
Bank Debts | | | 0.4 | |
|
Total | | | 73.6 | % |
|
| | | | |
| 5 Largest Security Positions | |
|
| Issuer | | % of Net Assets | |
|
U.S. Treasury Bill
0.13%, 4/26/22 | | | 33.4 | % |
CSMC Series 2021-BRIT
3.86%, 5/15/23 | | | 6.6 | |
CSMC Series 2022-CNTR
0.00%, 1/15/24 | | | 5.9 | |
FREMF Mortgage Trust Series 2019-KF59
6.24%, 2/25/29 | | | 4.5 | |
GDB Debt Recovery Authority of Commonwealth Puerto Rico Taxable Revenue Bond
7.50%, 8/20/40 | | | 4.1 | |
|
Total | | | 54.5 | % |
|
As a Fund shareholder, you may incur two types of costs: (1) transaction costs, and (2) ongoing costs, including management fees and other Fund expenses. The examples below are intended to help you understand your ongoing costs (in dollars) of investing in the Fund and to compare these costs with the ongoing costs of investing in other mutual funds. Please note that the expenses shown in the tables are meant to highlight your ongoing costs only and do not reflect any transactional costs. Therefore, the examples are useful in comparing ongoing costs only and will not help you determine the relative total cost of owning different funds. In addition, if these transactional costs were included, your costs would have been higher.
The examples below are based on an investment of $1,000 invested at October 1, 2021 and held for the entire period through March 31, 2022.
The Actual Expense Example below provides information about actual account values and actual expenses. You may use this information, together with the amount you invested, to estimate the expenses that you paid over the period. Simply divide your account value by $1,000 (for example, an $8,600 account value divided by $1,000 = 8.6), then multiply the result by the number in the table under the heading entitled “Expenses Paid” to estimate the expenses you paid on your account during this period.
The Hypothetical Expense Example below provides information about hypothetical account values and hypothetical expenses based on the Fund’s actual expense ratio and an assumed rate of return of 5% per year before expenses, which is not the Fund’s actual return. The hypothetical account values and expenses may not be used to estimate the actual ending account balance or expenses you paid for the period. You may use this information to compare the ongoing costs of investing in the Fund and other funds. To do so, compare this 5% hypothetical example with the 5% hypothetical examples that appear in the shareholder reports of the other funds.
| | | | | | | | | | | | | | |
| | | Expense
Ratio | | Beginning Account
Value 10/1/2021 | | | Ending Account
Value 3/31/2022 | | | Expenses Paid
10/1/21-3/31/22* | |
| |
Actual | | 0.65% | | $ | 1,000.00 | | | $ | 975.60 | | | $ | 3.20 | |
Hypothetical | | 0.65% | | $ | 1,000.00 | | | $ | 1,021.69 | | | $ | 3.28 | |
| * | Expenses are calculated using the annualized expense ratio (as disclosed in the table), multiplied by the average account value for the period, multiplied by the number of days in the most recent half fiscal year (182), and divided by the number of days in the current year (365). |
16
ADVISERS INVESTMENT TRUST
RIVER CANYON TOTAL RETURN BOND FUND
ADDITIONAL INFORMATION
March 31, 2022 (Unaudited)
| C. | Board Approval of Investment Advisory Agreement |
Section 15 of the 1940 Act requires that the Agreement between the Trust and the Adviser with respect to the Fund be approved by a majority of the Board including a majority of the Independent Trustees. It is the duty of the Board to request as much information as is reasonably necessary to evaluate the terms of the Agreement to determine whether the Agreement is fair to the Fund and its shareholders. The Board considered and approved the Agreement for the Fund at a meeting held on December 16, 2021.
The Board requested, and the Adviser provided, both written and oral reports containing information and data related to the following: (i) the nature, extent, and quality of the services provided by the Adviser to the Fund; (ii) the investment performance of the Fund and the Adviser (iii) the costs of the services to be provided and the profits to be realized by the Adviser from its relationship with the Fund; (iv) the extent to which economies of scale will be realized as the Fund grows; and (v) whether the fee levels reflect these economies of scale to the benefit of the Fund’s shareholders.
The Board examined the nature, extent, and quality of the advisory services provided by the Adviser. The Board considered the terms of the Agreement, information and reports provided by the Adviser regarding its business, personnel and operations, and advisory services provided to the Fund. The Board reviewed the Adviser’s investment philosophy and portfolio construction processes, the Adviser’s compliance program, pending material litigation (if any), insurance coverage, business continuity program, and information security practices. The Board noted that, as set forth in the reports provided by the Adviser, there had been no material compliance issues or concerns raised or encountered since the last renewal of the Agreement and that there had been no material compliance issues in the past 36 months with respect to the Fund or any other fund managed by the Adviser. The Board then considered key risks associated with the Fund and ways in which those risks were mitigated. Taking into account the personnel involved in servicing the Fund, as well as the materials provided by the Adviser, the Board expressed satisfaction with the quality, extent, and nature of the services received from the Adviser.
The Board reviewed the investment performance for the Fund and examined the selected peer group and benchmark for the Fund. The Board reviewed the Fund’s performance compared to its peer group for one-year, three-year, and since-inception periods through September 30, 2021. The Board also reviewed the performance of other funds and accounts advised or sub-advised by the Adviser with similar investment mandates for one-year, three-year, and since inception periods through September 30, 2021. After considering the information presented to it, the Board expressed satisfaction with the performance of the Fund and the Adviser.
The Board reviewed the cost of services provided and the profits realized by the Adviser, including assertions related to compensation and profitability. The Board discussed the advisory fee paid by the Fund and the total operating expenses of the Fund. The Board noted that the Adviser received a management fee of 0.65% of average daily net assets of the Fund. The Board reviewed the investment advisory fees paid by the Fund in comparison to the investment advisory fees paid by the funds within the appropriate peer group, noting that the fees paid by the Fund were competitive with the fees paid by its peers. The Board then considered the expense cap in place for the Fund, noting that the Adviser had contractually agreed to waive fees and or reimburse expenses to limit total annual fund operating expenses to 0.65% of average daily net assets. After considering the comparative data provided by the Adviser, the Board concluded that the advisory fees and expense ratios were reasonable.
The Board examined the profitability of the Adviser’s relationship with the Fund and considered the information provided by the Adviser. Among other things, the Board considered the overall financial condition and profitability of the Adviser and representations made thereto and overall importance of the Fund’s relationship to the Adviser’s business strategy. The Board concluded that, based on both the written and oral reports provided by the Adviser, the profit margin was reasonable.
In considering the economies of scale for the Fund, the Board considered the marketing and distribution plans for the Fund, the Fund’s capacity, and the Fund’s breakeven point. The Board noted that, other than the investment advisory fee, the Adviser derived no other fees or monetary benefits from the Fund.
In its deliberations, the Board did not identify any particular factor or factors that were all-important or controlling; and each Trustee assigned different weights to various factors considered.
17
ADVISERS INVESTMENT TRUST
RIVER CANYON TOTAL RETURN BOND FUND
ADDITIONAL INFORMATION
March 31, 2022 (Unaudited)
| D. | Board Review of Liquidity Risk Management Program |
To promote effective liquidity risk management throughout the fund industry and to enhance disclosure regarding fund liquidity and redemption practices, the U.S. Securities and Exchange Commission (the “SEC”) adopted Rule 22e-4 under the 1940 Act. This Rule requires every registered open-end management company to establish a liquidity risk management program (the “LRMP”) that, among other things, provides for the assessment, management and review of liquidity risk, the classification of a fund’s portfolio investments into one of four liquidity buckets based upon the number of days that such investments may reasonably be expected to be converted into cash or otherwise disposed of without significantly impacting their price, the establishment of a highly liquid investment minimum where required, and the establishment of a 15% limitation on illiquid investments. Additionally, the SEC adopted Rule 30b1-10 and Form N-LIQUID, which generally requires a fund to notify the SEC when certain liquidity-related events occur.
The Trust’s Board approved the appointment of the Adviser’s Committee as the administrator of the LRMP for the Fund on March 6, 2019. The Trust’s Board approved the Fund’s LRMP at its regular board meeting on September 11, 2019. At the Board’s regular meeting on March 9, 2022, the Trust’s Chief Compliance Officer and the Adviser each provided a report to the Board on the operation and effectiveness of the LRMP. The Adviser manages liquidity risks associated with the Fund’s investments by monitoring cash and cash equivalents, the use of derivatives, the concentration of investments and the appropriateness of portfolio strategies for open-end funds, and by classifying every fund investment as either highly liquid, moderately liquid, less liquid or illiquid on at least a monthly basis. To assist with the classification of Fund investments, the Adviser has contracted with a third party provider of liquidity monitoring services. The Adviser supplies portfolio-level data and certain assumptions to this provider, which the provider uses to determine preliminary classifications. Once these preliminary classifications are received by the Adviser, the Adviser’s personnel review the information.
The LRMP effectively managed the Fund’s liquidity risks for the year ended December 31, 2021. During this period, the Fund held no less than 50% of its total net assets in highly liquid investments. Because the Fund consisted primarily of highly liquid investments, no highly liquid investment minimum was required to be established for the Fund, and the Fund was well under its illiquid investment limitations. Additionally, no events that would require the filing of Form N-LIQUID occurred.
Investors may obtain a copy of the proxy voting policies and procedures by writing to the Trust in the name of the Fund c/o The Northern Trust Company, P.O. Box 4766, Chicago, Illinois 60680-4766 or by calling the Fund at 800-245-0371 (toll free) or 312-557-0164. Information about how the Fund voted proxies relating to portfolio securities for each 12 month period ending June 30 is available without charge, upon request, by calling the Trust at 800-245-0371 (toll free) or 312-557-0164 and on the SEC website at www.sec.gov.
The Fund files its complete schedule of portfolio holdings with the SEC for the first and third quarters of each fiscal year as an exhibit to its reports on Form N-PORT. The Fund’s Form N-PORT reports are available on the SEC’s website at www.sec.gov. The information on Form N-PORT is also available to shareholders upon written request or by calling the Fund at 800-245-0371 (toll free).
18
(This page has been intentionally left blank)
(This page has been intentionally left blank)
(This page has been intentionally left blank)
Investment Adviser
River Canyon Fund Management LLC
2728 North Harwood Street, 2nd Floor
Dallas, Texas 75201
Custodian
The Northern Trust Company
50 South LaSalle Street
Chicago, Illinois 60603
Independent Registered
Public Accounting Firm
Deloitte & Touche LLP
111 S. Wacker Drive
Chicago, Illinois 60606
Legal Counsel
Thompson Hine LLP
41 South High Street, Suite 1700
Columbus, Ohio 43215-6101
Distributor
Foreside Financial Services, LLC
3 Canal Plaza, Suite 100
Portland, Maine 04101
For Additional Information, call
800-245-0371 (toll free) or 312-557-0164
RC 03/22

NTAM TREASURY ASSETS FUND
SEMI-ANNUAL REPORT
MARCH 31, 2022
This report is submitted for the general information of the shareholders of the Fund. It is not authorized for the distribution to prospective investors unless preceded or accompanied by an effective prospectus.
ADVISERS INVESTMENT TRUST
NTAM TREASURY ASSETS FUND
TABLE OF CONTENTS
March 31, 2022 (Unaudited)
ADVISERS INVESTMENT TRUST
NTAM TREASURY ASSETS FUND
SCHEDULE OF INVESTMENTS
March 31, 2022 (Unaudited)
| | | | | | | | | | | | |
| | | Percentage | | | Principal | | | | |
| | | of Net | | | Amount | | | Value | |
| | | Assets | | | (000s) | | | (000s) | |
U.S. TREASURY OBLIGATIONS | | | 40.1% | | | | | | | | | |
U.S. Treasury Bills | | | 3.4% | | | | | | | | | |
0.07%, 5/26/22(a) | | | | | | | $ 35,000 | | | $ | 34,996 | |
0.08%, 5/26/22(a) | | | | | | | 35,000 | | | | 34,996 | |
0.09%, 6/2/22(a) | | | | | | | 35,000 | | | | 34,995 | |
0.16%, 6/23/22(a) | | | | | | | 50,000 | | | | 49,982 | |
0.21%, 6/30/22(a) | | | | | | | 25,000 | | | | 24,987 | |
0.27%, 7/14/22(a) | | | | | | | 30,000 | | | | 29,976 | |
1.04%, 9/29/22(a) | | | | | | | 15,000 | | | | 14,921 | |
0.39%, 12/29/22(a) | | | | | | | 25,000 | | | | 24,926 | |
0.62%, 1/26/23(a) | | | | | | | 15,000 | | | | 14,923 | |
0.64%, 1/26/23(a) | | | | | | | 15,000 | | | | 14,921 | |
| | | | | | | | | | | | |
| | | | | | | | | | | 279,623 | |
| | | | | | | | | | | | |
U.S. Treasury Floating Rate Notes | | | 16.3% | | | | | | | | | |
0.08%, 4/1/22(b) | | | | | | | 187,000 | | | | 187,042 | |
0.09%, 4/1/22(b) | | | | | | | 80,000 | | | | 79,998 | |
0.10%, 4/1/22(b) | | | | | | | 395,000 | | | | 395,013 | |
0.10%, 4/1/22(b) | | | | | | | 369,000 | | | | 369,169 | |
0.27%, 4/1/22(b) | | | | | | | 65,730 | | | | 65,731 | |
0.55%, 4/1/22(b) | | | | | | | 246,805 | | | | 246,811 | |
| | | | | | | | | | | | |
| | | | | | | | | | | 1,343,764 | |
| | | | | | | | | | | | |
U.S. Treasury Notes | | | 20.4% | | | | | | | | | |
2.25%, 4/15/22 | | | | | | | 5,000 | | | | 5,004 | |
1.75%, 5/15/22 | | | | | | | 82,920 | | | | 83,090 | |
2.13%, 5/15/22 | | | | | | | 97,000 | | | | 97,243 | |
1.75%, 5/31/22 | | | | | | | 19,100 | | | | 19,153 | |
1.88%, 5/31/22 | | | | | | | 185,280 | | | | 185,833 | |
1.75%, 6/15/22 | | | | | | | 10,000 | | | | 10,035 | |
0.13%, 6/30/22 | | | | | | | 115,000 | | | | 115,014 | |
2.13%, 6/30/22 | | | | | | | 60,000 | | | | 60,306 | |
1.75%, 7/15/22 | | | | | | | 15,000 | | | | 15,072 | |
0.13%, 7/31/22 | | | | | | | 75,000 | | | | 74,905 | |
1.63%, 8/15/22 | | | | | | | 20,000 | | | | 20,115 | |
1.75%, 9/30/22 | | | | | | | 35,000 | | | | 35,287 | |
0.13%, 10/31/22 | | | | | | | 110,000 | | | | 110,015 | |
1.88%, 10/31/22 | | | | | | | 45,000 | | | | 45,454 | |
2.00%, 10/31/22 | | | | | | | 125,000 | | | | 126,349 | |
1.63%, 11/15/22 | | | | | | | 185,000 | | | | 186,720 | |
0.13%, 11/30/22 | | | | | | | 125,000 | | | | 124,977 | |
2.00%, 11/30/22 | | | | | | | 5,000 | | | | 5,061 | |
0.13%, 12/31/22 | | | | | | | 145,000 | | | | 144,628 | |
1.50%, 1/15/23 | | | | | | | 25,000 | | | | 25,093 | |
0.13%, 1/31/23 | | | | | | | 40,000 | | | | 39,692 | |
1.75%, 1/31/23 | | | | | | | 30,000 | | | | 30,158 | |
2.38%, 1/31/23 | | | | | | | 30,000 | | | | 30,309 | |
See Notes to Financial Statements.
1
ADVISERS INVESTMENT TRUST
NTAM TREASURY ASSETS FUND
SCHEDULE OF INVESTMENTS
March 31, 2022 (Unaudited)
| | | | | | | | | | | | |
| | | Percentage | | | Principal | | | | |
| | | of Net | | | Amount | | | Value | |
| | | Assets | | | (000s) | | | (000s) | |
| | | |
2.00%, 2/15/23 | | | | | | $ | 35,000 | | | $ | 35,281 | |
| | | |
0.13%, 2/28/23 | | | | | | | 25,000 | | | | 24,789 | |
| | | |
2.63%, 2/28/23 | | | | | | | 10,000 | | | | 10,133 | |
| | | |
0.13%, 3/31/23 | | | | | | | 20,000 | | | | 19,778 | |
| | | |
1.50%, 3/31/23 | | | | | | | 5,000 | | | | 5,013 | |
| | | | | | | | | | | | |
| | | |
| | | | | | | | | | | 1,684,507 | |
| | | | | | | | | | | | |
TOTAL U.S. TREASURY OBLIGATIONS (Cost $3,307,894) | | | | | | | | | | | 3,307,894 | |
| | | | | | | | | | | | |
REPURCHASE AGREEMENTS | | | 59.8 | % | | | | | | | | |
BNP Paribas S.A., dated 3/31/22, repurchase price $400,003, 0.30%, 4/1/22(c) | | | | | | | 400,000 | | | | 400,000 | |
Citigroup Global Markets, Inc., dated 3/31/22, repurchase price $451,190, 0.30%, 4/1/22(d) | | | | | | | 451,186 | | | | 451,186 | |
Federal Reserve Bank of New York, dated 3/31/22, repurchase price $4,079,034, 0.30%, 4/1/22(e) | | | | | | | 4,079,000 | | | | 4,079,000 | |
| | | | | | | | | | | | |
TOTAL REPURCHASE AGREEMENTS (Cost $4,930,186) | | | | | | | | | | | 4,930,186 | |
| | | | | | | | | | | | |
TOTAL INVESTMENTS
(Cost $8,238,080) | | | 99.9 | % | | | | | | | 8,238,080 | |
NET OTHER ASSETS (LIABILITIES) | | | 0.1 | % | | | | | | | 5,861 | |
| | | | | | | | | | | | |
NET ASSETS | | | 100.0 | % | | | | | | $ | 8,243,941 | |
| | | | | | | | | | | | |
| (a) | Discount rate at the time of purchase. |
| (b) | Variable rate security. Rate as of March 31, 2022 is disclosed. Maturity date represents the next interest reset date. The security’s legal final maturity date is longer than the reset date. Securities with longer maturity dates have a greater sensitivity to changes in liquidity, interest rate risk and/or credit risk. |
| (c) | The nature and terms of the collateral received for the repurchase agreements are as follows: |
| | | | | | | | | | |
| | | Value | | | Coupon | | | Maturity |
| BNP Paribas S.A. | | (000s) | | | Rates | | | Dates |
U.S. Treasury Bills | | $ | 310 | | | | 0.00% | | | 4/21/22 — 5/5/22 |
U.S. Treasury Bonds | | $ | 133,669 | | | | 0.00% — 6% | | | 1/15/25 — 5/15/51 |
U.S. Treasury Notes | | $ | 274,021 | | | | 0.13% — 3.13% | | | 1/31/23 — 11/15/28 |
Total | | $ | 408,000 | | | | | | | |
| (d) | The nature and terms of the collateral received for the repurchase agreements are as follows: |
| | | | | | | | | | |
| | | Value | | | Coupon | | | Maturity |
| Citigroup Global Markets, Inc. | | (000s) | | | Rates | | | Dates |
U.S. Treasury Bonds | | $ | 459,000 | | | | 0.13% — 4.38% | | | 2/15/38 — 2/15/51 |
U.S. Treasury Notes | | $ | 1,210 | | | | 1.13% — 2.50% | | | 2/28/27 — 3/31/27 |
Total | | $ | 460,210 | | | | | | | |
| (e) | The nature and terms of the collateral received for the repurchase agreements are as follows: |
| | | | | | | | |
| | | Value | | | Coupon | | Maturity |
| Federal Reserve Bank of New York | | (000s) | | | Rates | | Dates |
U.S. Treasury Notes | | $ | 4,079,000 | | | 0.13% — 2.75% | | 9/30/22 — 8/15/27 |
At March 31, 2022 the asset allocations for the NTAM Treasury Assets Fund were:
| | | | |
| Asset Allocation (Unaudited) | | % of Net Assets | |
U.S. Treasury Bills | | | 3.4 | % |
U.S. Treasury Floating Rate Notes | | | 16.3 | |
U.S. Treasury Notes | | | 20.4 | |
Repurchase Agreements | | | 59.8 | |
| |
Total | | | 99.9 | % |
See Notes to Financial Statements.
2
ADVISERS INVESTMENT TRUST
STATEMENT OF ASSETS & LIABILITIES
March 31, 2022 (Unaudited)
| | | | |
Amounts in thousands | | NTAM Treasury Assets Fund | |
Assets: | | | | |
Investments, at value (Cost: $3,307,894) | | $ | 3,307,894 | |
Repurchase agreements, cost equals fair value | | | 4,930,186 | |
Receivable for interest | | | 7,359 | |
Receivable from investment adviser | | | 362 | |
Prepaid expenses | | | 51 | |
| | | | |
Total Assets | | | 8,245,852 | |
| | | | |
Liabilities: | | | | |
Distributions payable to shareholders | | | 917 | |
Investment advisory fees payable | | | 513 | |
Accounting and Administration fees payable | | | 394 | |
Regulatory and Compliance fees payable | | | 59 | |
Accrued expenses and other payable | | | 28 | |
| | | | |
Total Liabilities | | | 1,911 | |
| | | | |
Net Assets | | $ | 8,243,941 | |
| | | | |
Net assets | | $ | 8,243,941 | |
Shares of common stock outstanding | | | 8,244,052 | |
| | | | |
Net asset value per share | | $ | 1.00 | |
| | | | |
Net Assets: | | | | |
Paid in capital | | $ | 8,243,998 | |
Distributable earnings | | | (57 | ) |
| | | | |
Net Assets | | $ | 8,243,941 | |
| | | | |
See Notes to Financial Statements.
3
ADVISERS INVESTMENT TRUST
STATEMENT OF OPERATIONS
For the six months ended March 31, 2022 (Unaudited)
| | | | |
Amounts in thousands | | NTAM Treasury Assets Fund | |
Investment Income: | | | | |
Interest income | | $ | 4,261 | |
Operating expenses: | | | | |
Investment advisory | | | 4,158 | |
Accounting and Administration | | | 490 | |
Regulatory and Compliance | | | 182 | |
Trustees | | | 34 | |
Other | | | 83 | |
| | | | |
Total expenses | | | 4,947 | |
Expenses reduced by Adviser | | | (2,095 | ) |
| | | | |
Net expenses | | | 2,852 | |
| | | | |
Net investment income | | | 1,409 | |
| | | | |
Realized Gains from Investment Activities: | | | | |
Net realized gains from investment transactions | | | 26 | |
| | | | |
Net realized gains from investment activities | | | 26 | |
| | | | |
Change in Net Assets Resulting from Operations | | $ | 1,435 | |
| | | | |
See Notes to Financial Statements.
4
ADVISERS INVESTMENT TRUST
STATEMENTS OF CHANGES IN NET ASSETS
For the six months ended March 31, 2022 (Unaudited) and the year ended September 30, 2021
| | | | | | | | |
| | | NTAM Treasury Assets Fund | |
Amounts in thousands | | March 31, 2022 | | | September 30, 2021 | |
Increase (decrease) in net assets: | | | | | | | | |
Operations: | | | | | | | | |
Net investment income | | $ | 1,409 | | | $ | 1,623 | |
Net realized gains from investment transactions | | | 26 | | | | 75 | |
| | | | | | | | |
Change in net assets resulting from operations | | | 1,435 | | | | 1,698 | |
| | | | | | | | |
Dividends paid to shareholders: | | | | | | | | |
From distributable earnings | | | (1,466 | ) | | | (2,359 | ) |
| | | | | | | | |
Total dividends paid to shareholders | | | (1,466 | ) | | | (2,359 | ) |
| | | | | | | | |
Capital Transactions: | | | | | | | | |
Proceeds from sale of shares | | | 2,312,000 | | | | 4,042,800 | |
Value of shares issued to shareholders in reinvestment of dividends | | | 613 | | | | 2,856 | |
Value of shares redeemed | | | (1,798,000 | ) | | | (3,328,476 | ) |
| | | | | | | | |
Change in net assets from capital transactions | | | 514,613 | | | | 717,180 | |
| | | | | | | | |
Change in net assets | | | 514,582 | | | | 716,519 | |
Net assets: | | | | | | | | |
Beginning of period | | | 7,729,359 | | | | 7,012,840 | |
| | | | | | | | |
End of period | | $ | 8,243,941 | | | $ | 7,729,359 | |
| | | | | | | | |
Share Transactions | | | | | | | | |
Sold | | | 2,312,000 | | | | 4,042,800 | |
Reinvested | | | 613 | | | | 2,856 | |
Redeemed | | | (1,798,000 | ) | | | (3,328,476 | ) |
| | | | | | | | |
Change | | | 514,613 | | | | 717,180 | |
| | | | | | | | |
See Notes to Financial Statements.
5
ADVISERS INVESTMENT TRUST
FINANCIAL HIGHLIGHTS
For the periods indicated
| | | | | | | | | | | | | | | | | | | | |
| | | NTAM Treasury Assets Fund | |
| | | Six Months Ended | | | Year Ended | | | Year Ended | | | Year Ended | | | Period Ended | |
| | | March 31, 2022, | | | September 30, | | | September 30, | | | September 30, | | | September 30, | |
| | | (Unaudited) | | | 2021 | | | 2020 | | | 2019 | | | 2018(a) | |
Net asset value, beginning of period | | $ | 1.00 | | | $ | 1.00 | | | $ | 1.00 | | | $ | 1.00 | | | $ | 1.00 | |
| | | | | | | | | | | | | | | | | | | | |
Income (loss) from operations: | | | | | | | | | | | | | | | | | | | | |
Net investment income | | | — | (b) | | | — | (b) | | | 0.01 | | | | 0.02 | | | | 0.01 | |
Net realized gains from investments(b) | | | — | | | | — | | | | — | | | | — | | | | — | |
| | | | | | | | | | | | | | | | | | | | |
Total from investment operations | | | — | | | | — | | | | 0.01 | | | | 0.02 | | | | 0.01 | |
| | | | | | | | | | | | | | | | | | | | |
Less distributions paid: | | | | | | | | | | | | | | | | | | | | |
From net investment income | | | (— | )(b) | | | (— | )(b) | | | (0.01 | ) | | | (0.02 | ) | | | (0.01 | ) |
From net realized gains on investments | | | (— | )(b) | | | (— | )(b) | | | (— | )(b) | | | (— | )(b) | | | — | |
| | | | | | | | | | | | | | | | | | | | |
Total distributions paid | | | — | | | | — | | | | (0.01 | ) | | | (0.02 | ) | | | (0.01 | ) |
| | | | | | | | | | | | | | | | | | | | |
Change in net asset value | | | — | | | | — | | | | — | | | | — | | | | — | |
| | | | | | | | | | | | | | | | | | | | |
Net asset value, end of period | | $ | 1.00 | | | $ | 1.00 | | | $ | 1.00 | | | $ | 1.00 | | | $ | 1.00 | |
| | | | | | | | | | | | | | | | | | | | |
Total return(c) | | | 0.02 | % | | | 0.03 | % | | | 1.06 | % | | | 2.28 | % | | | 0.88 | % |
Ratios/Supplemental data: | | | | | | | | | | | | | | | | | | | | |
Net assets, end of period (000’s) | | $ | 8,243,941 | | | $ | 7,729,359 | | | $ | 7,012,840 | | | $ | 8,037,595 | | | $ | 7,929,722 | |
Ratio of net expenses to average net assets(d) | | | 0.08 | % | | | 0.07 | % | | | 0.10 | % | | | 0.10 | % | | | 0.10 | % |
Ratio of net investment income to average net assets(d) | | | 0.04 | % | | | 0.02 | % | | | 0.93 | % | | | 2.25 | % | | | 1.81 | % |
Ratio of gross expenses to average net assets(d), (e) | | | 0.14 | % | | | 0.13 | % | | | 0.13 | % | | | 0.13 | % | | | 0.13 | % |
| (a) | For the period from April 4, 2018, commencement of operations, to September 30, 2018. |
| (b) | Amount is less than $0.005 per share. |
| (c) | Not annualized for periods less than one year. |
| (d) | Annualized for periods less than one year. |
| (e) | During the period shown, certain fees were reduced. If such fee reductions had not occurred, the ratio would have been as indicated. |
See Notes to Financial Statements.
6
ADVISERS INVESTMENT TRUST
NTAM TREASURY ASSETS FUND
NOTES TO FINANCIAL STATEMENTS
March 31, 2022 (Unaudited)
Advisers Investment Trust (the “Trust”) is a Delaware statutory trust operating under a Fourth Amended and Restated Agreement and Declaration of Trust (the “Trust Agreement”) dated March 10, 2022. The Trust was formerly an Ohio business trust, which commenced operations on December 20, 2011. On March 31, 2017, the Trust was converted to a Delaware statutory trust. As an open-end registered investment company, as defined in Financial Accounting Standards Board (“FASB”) Accounting Standards Update (“ASU”) 2013-08, the Trust follows accounting and reporting guidance under FASB Accounting Standards Codification (“ASC”) Topic 946, “Financial Services-Investment Companies”. The Trust Agreement permits the Board of Trustees (the “Trustees” or “Board”) to authorize and issue an unlimited number of shares of beneficial interest, at no par value, in separate series of the Trust. The NTAM Treasury Assets Fund (the “Fund”) is a series of the Trust, and commenced operations on April 4, 2018. Shares of the Fund are not registered under the Securities Act of 1933, as amended (the “1933 Act”). Investments in the Fund may be made only by individuals or entities that were “accredited investors” within the meaning of Regulation D under the 1933 Act.
The Fund is a diversified fund. The investment objective of the Fund is to seek to maximize current income to the extent consistent with the preservation of capital and maintenance of liquidity by investing its net assets, under normal market conditions, exclusively in United States (“U.S.”) Treasury securities and related repurchase agreements and other securities that limit their investments to, or are backed by, U.S. Treasury securities.
The Fund operates as a “government money market fund” under Rule 2a-7 of the Investment Company Act of 1940, as amended (the “1940 Act”).
Under the Trust’s organizational documents, its officers and Trustees are indemnified against certain liabilities arising out of the performance of their duties to the Trust and Fund. In addition, in the normal course of business, the Trust enters into contracts with its vendors and others that provide for general indemnifications. The Fund’s maximum exposure under these arrangements is unknown, as this would involve future claims that may be made against the Fund.
| A. | Significant accounting policies are as follows: |
INVESTMENT VALUATION
Investments are recorded at amortized cost, which approximates fair value. Under this method, investments purchased at a discount or premium are valued by accruing or amortizing the difference between the original purchase price and maturity value of the issue over the period to effective maturity. If amortized cost does not approximate fair value, such securities will be fair valued in good faith by the Fund’s Fair Value Committee in accordance with procedures established by and under the general supervision of the Trustees.
The following is a summary of the valuation inputs used as of March 31, 2022 in valuing the Fund’s investments based upon the three fair value levels as follows:
• Level 1 —quoted prices in active markets for identical assets
• Level 2 —other significant observable inputs (including quoted prices of similar securities, interest rates, prepayment speeds, credit risk, etc.)
• Level 3 —significant unobservable inputs (including the Fund’s own assumptions in determining the fair value of investments)
| | | | | | | | | | | | | | | | |
| Amounts in thousands | | Level 1 -
Quoted Prices | | | Level 2 -
Other Significant
Observable Inputs | | | Level 3 - Significant
Unobservable Inputs | | | Total | |
Investments held by the NTAM Treasury Assets Fund* | | $ | — | | | $ | 8,238,080 | | | $ | — | | | $ | 8,238,080 | |
| | | | |
| *See | additional categories in the Schedule of Investments |
7
ADVISERS INVESTMENT TRUST
NTAM TREASURY ASSETS FUND
NOTES TO FINANCIAL STATEMENTS
March 31, 2022 (Unaudited)
As of March 31, 2022, there were no Level 1 or Level 3 securities held by the Fund. There were no transfers to or from Level 3 during the period ended March 31, 2022.
REPURCHASE AGREEMENTS
The Fund may enter into repurchase agreements under the terms of a master repurchase agreement by which it purchases securities for cash from a seller and agrees to resell those securities to the same seller at a specific price within a specified time or with an indefinite life and a liquidity feature which allows the Fund to resell the security quarterly. The interest rate on such repurchase agreements resets daily. During the term of a repurchase agreement, the fair value of the underlying collateral, including accrued interest, is required to equal or exceed the fair value of the repurchase agreement. The Fund is subject to credit risk on repurchase agreements to the extent that the counterparty fails to perform under the agreement and the value of the collateral received falls below the agreed repurchase price. If the seller defaults and the value of the collateral declines or if bankruptcy proceedings are commenced with respect to the seller of the security, realization of collateral by the Fund may be delayed or limited. The Fund has entered into such repurchase agreements at March 31, 2022, as reflected in the accompanying Schedule of Investments.
| | | | | | | | | | | | |
Amounts in thousands | | Gross Amounts not Offset in the Statement of Assets and Liabilities | |
| | | Gross Amounts of Assets | | | | | | | |
| | | Presented in Statements of | | | Financial | | | Net | |
Counterparty | | Assets and Liabilities �� | | | Instruments* | | | Amount | |
BNP Paribas S.A | | $ | 400,000 | | | $ | (400,000 | ) | | $ | — | |
Citigroup Global Markets, Inc. | | | 451,186 | | | | (451,186 | ) | | | — | |
Federal Reserve Bank of New York | | | 4,079,000 | | | | (4,079,000 | ) | | | — | |
| | | | |
| | $ | 4,930,186 | | | $ | (4,930,186 | ) | | $ | — | |
| | | | |
*Collateral received is reflected up to the fair market value of the repurchase agreement.
INVESTMENT TRANSACTIONS AND INCOME
Investment transactions are accounted for no later than one business day after trade date. For financial reporting purposes, investments are reported as of the trade date. The Fund determines the gain or loss realized from investment transactions by using an identified cost basis method. Interest income is recognized on an accrual basis and includes, where applicable, the amortization of premium or accretion of discount.
EXPENSE ALLOCATIONS
Expenses directly attributable to a fund in the Trust are charged to that fund, while expenses that are attributable to more than one fund in the Trust are allocated among the applicable funds on a pro-rata basis to each adviser’s series of funds based on relative net assets or another reasonable basis.
DIVIDENDS AND DISTRIBUTIONS
Dividends from net income are declared daily and paid monthly by the Fund to its shareholders. Net income includes the interest accrued on the Fund’s assets less estimated expenses. The Fund’s net realized short-term capital gains, if any, are distributed at least annually.
Distributions from net investment income and from net realized capital gain are determined in accordance with Federal income tax regulations, which may differ from accounting principles generally accepted in the United States of America (“GAAP”). These “book/tax” differences are either considered temporary or permanent in nature. To the extent these differences are permanent in nature (e.g. treatment of certain dividend distributions, gains/losses, return of capital etc.), such amounts are reclassified within the composition of net assets based on their federal tax-basis treatment; temporary differences do not require reclassification. Distributions to shareholders that exceed net investment income and net realized capital gains for tax purposes are reported as return of capital.
8
ADVISERS INVESTMENT TRUST
NTAM TREASURY ASSETS FUND
NOTES TO FINANCIAL STATEMENTS
March 31, 2022 (Unaudited)
FEDERAL INCOME TAX INFORMATION
No provision is made for Federal income taxes as the Fund intends to qualify each year as a “regulated investment company” under Subchapter M of the Internal Revenue Code of 1986, as amended (the “Code”), and distribute substantially all of its net investment income and net realized capital gain in accordance with the Code.
As of March 31, 2022, the Fund did not have uncertain tax positions that would require financial statement recognition or disclosure based on an evaluation of all open tax years for all major tax jurisdictions. The Fund’s Federal tax returns for the tax years ended September 30, 2021, 2020, 2019, and 2018 remain subject to examination by the Internal Revenue Service. Interest or penalties incurred, if any, on future unknown or uncertain tax positions taken by the Fund will be recorded as interest expense on the Statement of Operations.
Management is not aware of any tax positions for which it is reasonably possible that the total amounts of unrecognized tax benefits will change materially in the next 12 months.
USE OF ESTIMATES
The preparation of financial statements in conformity with GAAP requires management to make estimates and assumptions that affect the reported amounts of assets and liabilities and disclosure of contingent assets and liabilities at the date of the financial statements and the reported amounts of revenues and expenses during the reporting period. Actual results could differ from these estimates.
B. Fees and Transactions with Affiliates and Other Parties
The Trust, on behalf of the Fund, has entered into an Investment Advisory Agreement (the “Agreement”) with Northern Trust Investments, Inc. (the “Adviser” or “NTI”) to provide investment management services to the Fund. Total fees incurred pursuant to the Agreement are reflected as “Investment advisory” fees on the Statement of Operations. Under the terms of the Agreement, the Fund pays the Adviser a monthly fee based on the Fund’s daily net assets at the annualized rate of 0.11%.
Foreside Financial Services, LLC (the “Placement Agent”) provides private placement services to the Fund pursuant to a placement agent agreement with the Trust, on behalf of the Fund. Under its agreement with the Trust, the Placement Agent acts as an agent of the Trust in connection with the offering of the shares of the Fund on a private placement basis to eligible investors only. The Adviser, at its own expense, pays the Placement Agent an asset-based fee, which is calculated and billed monthly, for these services and reimbursement for certain expenses incurred on behalf of the Fund.
The Northern Trust Company (“Northern Trust”), an affiliate to NTI, serves as the administrator, transfer agent, custodian, and fund accounting agent for the Fund pursuant to written agreements between the Trust, on behalf of the Fund, and Northern Trust. The Fund agreed to pay Northern Trust certain annual and transaction-based fees, a tiered basis-point fee based on the Fund’s daily net assets, and reimburse for certain expenses incurred on behalf of the Fund. Total fees paid to Northern Trust pursuant to these agreements are reflected as “Accounting and Administration” fees on the Statement of Operations.
Foreside Fund Officer Services, LLC (“Foreside”) provides compliance and financial control services for the Fund pursuant to a written agreement with the Trust, on behalf of the Fund, including providing certain officers to the Fund. The Fund pays Foreside an annual base fee, a basis-point fee based on the Fund’s daily net assets and reimburses for certain expenses incurred on behalf of the Fund. Total fees paid to Foreside pursuant to these agreements are reflected as “Regulatory and Compliance” fees on the Statement of Operations.
The officers of the Trust are affiliated with Foreside, Northern Trust, or the Placement Agent and receive no compensation directly from the Fund for serving in their respective roles. The Trust paid each Trustee who is not an “interested persons,” as that term is defined in the 1940 Act (each, an “Independent Trustee” and, collectively, the “Independent Trustees”) compensation for their services based on an annual retainer of $125,000 and reimbursement for certain expenses. If there are more than six meetings in a year, additional meeting fees may apply. For the six months ended March 31, 2022, the aggregate Trustee compensation paid by the Trust was $222,750. The amount of total Trustee compensation and reimbursement of out-of-pocket expenses allocated from the Trust to the Fund is reflected as “Trustees” expenses on the Statement of Operations.
9
ADVISERS INVESTMENT TRUST
NTAM TREASURY ASSETS FUND
NOTES TO FINANCIAL STATEMENTS
March 31, 2022 (Unaudited)
The Adviser has contractually agreed to waive fees or reimburse expenses to the extent necessary to limit total annual fund operating expenses (exclusive of the compensation paid to each Trustee of the Trust that is not an “interested person” as that term is defined in the Investment Company Act of 1940 (“Independent Trustee”), expenses associated with an Independent Trustee’s attendance at Board of Trustees meetings and other Trust related travel, expenses of third party consultants engaged by the Board of Trustees, any membership dues paid to the Investment Company Institute and Mutual Fund Directors Forum, brokerage costs, interest, taxes, dividends, litigation and indemnification expenses, expenses associated with the investments in underlying investment companies and extraordinary expenses) to 0.10% of the average daily net assets of the Fund until January 28, 2023. If it becomes unnecessary for the Adviser to waive fees or make reimbursements, the Adviser may recapture any of its prior waivers or reimbursements for a period not to exceed three fiscal years from the date on which the waiver or reimbursement was made to the extent that such a recapture does not cause the Total Annual Fund Operating Expenses (exclusive of the compensation paid to each Trustee of the Trust that is not an “interested person” as that term is defined in the Investment Company Act of 1940 (“Independent Trustee”), expenses associated with an Independent Trustee’s attendance at Board of Trustees meetings and other Trust related travel, expenses of third party consultants engaged by the Board of Trustees, any membership dues paid to the Investment Company Institute and Mutual Fund Directors Forum, brokerage costs, interest, taxes, dividends, litigation and indemnification expenses, expenses associated with the investments in underlying investment companies and extraordinary expenses) to exceed the applicable expense limitation in effect at the time of repayment or the applicable expense limitation that was in effect at the time of the waiver or reimbursement. The agreement to waive fees and reimburse expenses may be terminated by the Board at any time and will terminate automatically upon termination of the Agreement.
The Adviser may reimburse additional expenses or waive all or a portion of the management fee of the Fund from time to time, including to avoid a negative yield, and such amounts are not subject to recoupment in future periods. Any such additional expense reimbursement or waiver would be voluntary and could be implemented, increased or decreased or discontinued at any time. During the six months ended March 31, 2022, the Adviser reimbursed additional expense of $975,477 in order to avoid a negative yield. This amount is included in “Expenses Reduced by the Adviser” in the Statement of Operations.
For the six months ended March 31, 2022, the Fund incurred advisory fees payable to NTI, expense waivers and/or reimbursements from NTI, and paid expense recoupments to NTI, as follows:
| | | | | | | | | | | | |
Amounts in thousands | | Advisory Fee to NTI | | | Expenses Reduced by NTI | | Advisory Fees Recouped by NTI | |
NTAM Treasury Assets Fund | | $ | 4,158 | | | $ 2,095 | | $ | — | |
The balances of recoverable expenses to NTI by the Fund at March 31, 2022 were as follows (in thousands):
| | | | | | | | |
For the: | | Expiring | | | NTAM Treasury Assets Fund | |
Period ended September 30, 2019 | | | September 30, 2022 | | | $ | 2,246 | |
Year ended September 30, 2020 | | | September 30, 2023 | | | | 2,108 | |
Year ended September 30, 2021 | | | September 30, 2024 | | | | 2,217 | |
Six months March 31, 2022 | | | September 30, 2025 | | | | 1,119 | |
| | | | | | | | |
Balances of Recoverable Expenses to the Adviser | | | | | | | 7,690 | |
| | | | | | | | |
C. Other Risks
The global outbreak of COVID-19 has disrupted economies and markets, and the prolonged duration and economic impact is uncertain. These events can have a significant impact on the Fund’s operations and performance.
10
ADVISERS INVESTMENT TRUST
NTAM TREASURY ASSETS FUND
NOTES TO FINANCIAL STATEMENTS
March 31, 2022 (Unaudited)
D. Federal Income Tax
As of March 31, 2022, the cost, gross unrealized appreciation and gross unrealized depreciation on investments, for Federal income tax purposes, were as follows:
| | | | | | | | | | | | | | | | |
Amounts in thousands | | Cost | | | Gross Unrealized Appreciation | | | Gross Unrealized (Depreciation) | | | Net Unrealized Appreciation (Depreciation) | |
NTAM Treasury Assets Fund | | $ | 8,238,080 | | | $ | — | | | $ | — | | | $ | — | |
The tax character of distributions paid to shareholders during the latest tax periods ended September 30, 2021 and September 30, 2020 for the Fund were as follows:
| | | | | | | | | | | | | | | | | | | | |
Amounts in thousands | | Ordinary Income | | | Net Long Term Gains | | Total Taxable Distributions Paid | | | Tax Return of Capital | | Total Distributions Paid | |
2021 | | $ | 2,856 | | | $ — | | $ | 2,856 | | | $ — | | $ | 2,856 | |
2020 | | | 87,018 | | | — | | | 87,018 | | | — | | | 87,018 | |
As of the latest tax year ended September 30, 2021, the components of accumulated earnings on a tax basis were as follows:
| | | | | | | | | | | | | | | | | | | | | | | | | | | | |
Amounts in thousands | | Undistributed Ordinary Income | | | Undistributed Long-Term Capital Gains | | | Accumulated Earnings | | | Distributions Payable | | | Accumulated Capital and Other Losses | | | Unrealized Depreciation | | | Total Accumulated Earnings | |
NTAM Treasury Assets Fund | | | $ 122 | | | | $ — | | | | $ 122 | | | | $ (64) | | | | $ | (84) | | | $ — | | | | $ | (26) |
At September 30, 2021, capital losses incurred by the Fund are carried forward indefinitely under the provisions of the Regulated Investment Company Modernization Act of 2010 are as follows:
| | | | | | | | |
Amounts in thousands | | Short-Term Capital Loss Carry-Forward | | Long-Term Capital Loss Carry-Forward | |
NTAM Treasury Assets Fund | | $ (84) | | $ | — | |
11
ADVISERS INVESTMENT TRUST
NTAM TREASURY ASSETS FUND
ADDITIONAL INFORMATION
March 31, 2022 (Unaudited)
A. Expense Examples
As a Fund shareholder, you may incur two types of costs: (1) transaction costs, and (2) ongoing costs, including management fees and other Fund expenses. The examples below are intended to help you understand your ongoing costs (in dollars) of investing in the Fund and to compare these costs with the ongoing costs of investing in other mutual funds. Please note that the expenses shown in the tables are meant to highlight your ongoing costs only and do not reflect any transactional costs. Therefore, the examples are useful in comparing ongoing costs only and will not help you determine the relative total cost of owning different funds. In addition, if these transactional costs were included, your costs would have been higher.
The examples below are based on an investment of $1,000 invested at October 1, 2021 and held for the entire period through March 31, 2022.
The Actual Expense Example below provides information about actual account values and actual expenses. You may use this information, together with the amount you invested, to estimate the expenses that you paid over the period. Simply divide your account value by $1,000 (for example, an $8,600 account value divided by $1,000 = 8.6), then multiply the result by the number in the table under the heading entitled “Expenses Paid” to estimate the expenses you paid on your account during this period.
The Hypothetical Expense Example below provides information about hypothetical account values and hypothetical expenses based on the Fund’s actual expense ratio and an assumed rate of return of 5% per year before expenses, which is not the Fund’s actual return. The hypothetical account values and expenses may not be used to estimate the actual ending account balance or expenses you paid for the period. You may use this information to compare the ongoing costs of investing in the Fund and other funds. To do so, compare this 5% hypothetical example with the 5% hypothetical examples that appear in the shareholder reports of the other funds.
| | | | | | | | | | | | | | |
| | | Expense
Ratio | | Beginning Account
Value 10/1/2021 | | | Ending Account
Value 3/31/2022 | | | Expenses Paid
10/1/21-3/31/22* | |
Actual | | 0.08% | | $ | 1,000.00 | | | $ | 1,000.20 | | | $ | 0.40 | |
Hypothetical | | 0.08% | | $ | 1,000.00 | | | $ | 1,024.53 | | | $ | 0.40 | |
* Expenses are calculated using the annualized expense ratio (as disclosed in the table), multiplied by the average account value for the period, multiplied by the number of days in the most recent half fiscal year (182), and divided by the number of days in the current year (365).
B. Board Approval of Investment Advisory Agreement
Section 15 of the 1940 Act requires that the Investment Advisory Agreement be approved by a majority the Board of Trustees of the Trust (the “Board”), including a majority of the Independent Trustees. It is the duty of the Board to request as much information as is reasonably necessary to evaluate the terms of the Investment Advisory Agreement to determine whether the agreement is fair to the Fund and its shareholders. The Board considered and approved the Investment Advisory Agreement for the Fund at an in-person meeting held on March 10, 2022.
The Board requested, and the Adviser provided, both written and oral reports containing information and data related to the following: (i) the nature, extent, and quality of the services provided by the Adviser to the Fund; (ii) the investment performance of the Fund and the Adviser; (iii) the costs of the services to be provided and the profits to be realized by the Adviser from its relationship with the Fund; (iv) the extent to which economies of scale will be realized as the Fund grows; and (v) whether the fee levels reflect these economies of scale to the benefit of the Fund’s shareholders.
The Board examined the nature, extent and quality of the advisory services provided by the Adviser. The Board considered the terms of the Agreement, information and reports provided by the Adviser on its personnel and operations, and the Adviser’s experience in managing the investment strategy of the Fund. The Board reviewed the Adviser’s investment philosophy and portfolio construction process and the Adviser’s compliance program, pending litigation, insurance coverage, business continuity program, and information security practices.
12
ADVISERS INVESTMENT TRUST
NTAM TREASURY ASSETS FUND
ADDITIONAL INFORMATION
March 31, 2022 (Unaudited)
The Board noted that the Adviser was affiliated with the Trust’s fund administrator, transfer agent, and fund accountant as those services are provided by The Northern Trust Company. Taking into account the personnel involved in servicing the Fund as well as the materials and services provided by the Adviser, the Board expressed satisfaction with the quality, extent, and nature of the services received from the Adviser.
The Board reviewed the investment performance of the Fund and compared the Fund’s performance through December 31, 2021 to the Fund’s benchmark and to a peer group of funds with investment objectives and strategies similar to that of the Fund. The Board reviewed the peer group which was drawn from Lipper Institutional U.S. Treasury Money Market Funds as further refined by assets under management and other criteria. After considering the information presented to it, the Board expressed satisfaction with the performance of the Fund and the Adviser.
The Board considered the cost of services provided and the profits realized by the Adviser and, among other things, discussed the Adviser’s assertions related to profitability. The Board then reviewed the advisory fee paid by the Fund and the total operating expenses of the Fund. The Board noted the Adviser received a management fee of 0.11% of the average daily net assets of the Fund noting that the fee was generally in-line with the Fund’s peer group and the Lipper Institutional Money Market Funds average. Turning to total annual operating expenses, the Board noted that under the Expense Limitation Agreement, the Adviser had contractually agreed to waive fees and/or reimburse expenses to the extent necessary to limit the total annual operating expenses to 0.10% annually. Among other factors considered when reviewing the advisory fee and the expense limitation was the fact that the Fund was not publicly marketed, but rather was privately placed. The Board concluded that the advisory fee and expense ratios were reasonable.
The Board considered the profitability of the Adviser’s relationship with the Fund. Referring to information provided by the Adviser, the Board determined that the profit earned by the Adviser for management of the Fund was not excessive.
In considering the economies of scale for the Fund, the Board considered that the Fund was a private placement and the size and scale had remained similar to its launch size. The Board determined the investment advisory fee to be appropriate and reasonable for the Fund at its size and scale and that no additional economies of scale were anticipated.
The Board considered that the Adviser may derive ancillary benefits from its management of the Fund and again considered that the Adviser was affiliated with the Fund’s administrator, transfer agent, and fund accountant.
In its deliberations, the Board did not identify any particular factor or factors that were all-important or controlling; and each Trustee assigned different weights to the various factors considered.
C. Other Information
A description of the policies and procedures that the Fund uses to determine how to vote proxies relating to portfolio securities is available (i) without charge, upon request, by writing to the Fund at NTAM Treasury Assets Fund c/o The Northern Trust Company, P.O. Box 4766, Chicago, Illinois 60680-4766 or by calling the Fund at 855-351-4583 (toll free); and (ii) on the U.S. Securities and Exchange Commission’s (the “SEC”) website at www.sec.gov. Information regarding how the Fund voted proxies relating to portfolio securities during the most recent 12-month period ended June 30 is available (i) without charge, by calling the Fund at 855-351-4583 (toll free); and (ii) on the SEC’s website at www.sec.gov.
The Fund files its complete Schedule of Portfolio Holdings with the SEC each month on Form N-MFP, which is available without charge on the SEC’s website at www.sec.gov. The Fund makes portfolio holdings information available to shareholders at https://www.northerntrust.com/united-states/what-we-do/investment-management/northern-funds/ntam-treasury-assets-fund.
13
Investment Adviser
Northern Trust Investments, Inc.
50 South LaSalle Street
Chicago, Illinois 60603
Custodian
The Northern Trust Company
50 South LaSalle Street
Chicago, Illinois 60603
Independent Registered
Public Accounting Firm
Deloitte & Touche LLP
111 S. Wacker Drive
Chicago, Illinois 60606
Legal Counsel
Thompson Hine LLP
41 South High Street, Suite 1700
Columbus, Ohio 43215-6101
Placement Agent
Foreside Financial Services, LLC
3 Canal Plaza, Suite 100
Portland, Maine 04101
For Additional Information, call
855-351-4583 (toll free)
NT 03/22
(b) Not applicable
Item 2. Code of Ethics.
Not applicable – only for annual reports.
Item 3. Audit Committee Financial Expert.
Not applicable – only for annual reports.
Item 4. Principal Accountant Fees and Services.
Not applicable – only for annual reports.
Item 5. Audit Committee of Listed Registrants.
Not applicable.
Item 6. Investments.
| (a) | The Schedule of Investments in securities of unaffiliated issuers is included in the report to shareholders filed under Item 1 of this Form. |
Item 7. Disclosure of Proxy Voting Policies and Procedures for Closed-End Management Investment Companies.
Not applicable.
Item 8. Portfolio Managers of Closed-End Management Investment Companies.
Not applicable.
Item 9. Purchases of Equity Securities by Closed-End Management Investment Company and Affiliated Purchasers.
Not applicable.
Item 10. Submission of Matters to a Vote of Security Holders.
Not applicable.
Item 11. Controls and Procedures.
| | (a) | The registrant’s principal executive officer and principal financial officer have concluded, based on their evaluation of the registrant’s disclosure controls and procedures as conducted within 90 days of the filing date of this report, that these disclosure controls and procedures are adequately designed and are operating effectively to ensure that information required to be disclosed by the registrant on Form N-CSR is recorded, processed, summarized and reported within the time periods specified in the U.S. Securities and Exchange Commission’s rules and forms. |
| | (b) | There were no changes in the registrant’s internal control over financial reporting (as defined in Rule 30a-3(d) under the Investment Company Act of 1940) that occurred during the period covered by this report that have materially affected or are reasonably likely to materially affect, the registrant’s internal control over financial reporting. |
Item 12. Disclosure of Securities Lending Activities for Closed-End Management Investment Companies.
Not applicable.
Item 13. Exhibits.
| (a)(1) | Not applicable – only for annual reports. |
SIGNATURES
Pursuant to the requirements of the Securities Exchange Act of 1934 and the Investment Company Act of 1940, the registrant has duly caused this report to be signed on its behalf by the undersigned, thereunto duly authorized.
Advisers Investment Trust
| | |
| By: | | /s/ Troy A. Sheets |
| | Troy A. Sheets |
| | Treasurer and Principal Financial Officer |
| |
| Date: | | June 3, 2022 |
Pursuant to the requirements of the Securities Exchange Act of 1934 and the Investment Company Act of 1940, this report has been signed below by the following persons on behalf of the registrant and in the capacities and on the dates indicated.
| | |
| By: | | /s/ Barbara J. Nelligan |
| | Barbara J. Nelligan |
| | President and Principal Executive Officer |
| |
| Date: | | June 3, 2022 |
| | |
| By: | | /s/ Troy A. Sheets |
| | Troy A. Sheets |
| | Treasurer and Principal Financial Officer |
| |
| Date: | | June 3, 2022 |