Continued Growth and Security Acceleration
Q2 2021 Key Highlights1
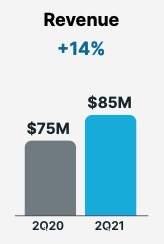
•Top-line growth of 14% year-over-year with revenue of $85 million, net of a $1.2 million deferred revenue write-down related to purchase accounting adjustments from the Signal Sciences acquisition
•GAAP gross margin of 52.6%, down from 60.2% in Q2 2020; non-GAAP gross margin2 of 57.6%, which excludes stock-based compensation and amortization of acquired intangible assets, down from 61.7% in Q2 2020
•GAAP operating loss of $57 million, compared to GAAP operating loss of $14 million for Q2 2020; non-GAAP operating loss2 of $18 million, which excludes stock-based compensation, amortization of acquired intangible assets and acquisition-related costs, compared to non-GAAP operating income2 of $2 million for Q2 2020
•GAAP basic and diluted net loss per share of $0.51, compared to GAAP basic and diluted net loss per share of $0.14 for Q2 2020; non-GAAP basic and diluted net loss per share2 of $0.15, compared to non-GAAP basic and diluted net income per share2 of $0.02 for Q2 2020
•Capital expenditures3 of $5 million, or 5% of revenue
Key Metrics1
•Continued enterprise customer growth and expansion:
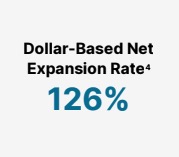
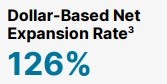
▪Dollar-Based Net Expansion Rate (DBNER)4 of 126%, compared to 141%5 in Q1 2021
▪Net Retention Rate (NRR)6 of 93%, compared to 110%5 in Q1 2021
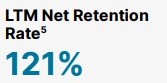
◦Last-twelve-month (LTM) NRR7 of 121%, compared to 135%5 in Q1 2021
▪Total customer count increased to 2,581 from 2,4585 in Q1 2021
◦Enterprise customer count8 of 408, up from 3955 in Q1 2021
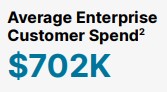
▪Average enterprise customer spend9 of approximately $702,000, essentially flat from $705,0005 in Q1 2021
▪Enterprise customers8 generated 89% of our trailing twelve-month total revenue, in both Q15 and Q2 2021
____________________________________________
1 The contribution of Signal Sciences, following our acquisition of them, has been consolidated into our second quarter 2021 financial information.
2 For a reconciliation of non-GAAP financial measures to their corresponding GAAP measures, please refer to the reconciliation table at the end of this letter.
3 Capital Expenditures are defined as cash used for purchases of property and equipment and capitalized internal-use software, as reflected in our statement of cash flows.
4 We calculate Dollar-Based Net Expansion Rate by dividing the revenue for a given period from customers who remained customers as of the last day of the given period (the “current” period) by the revenue from the same customers for the same period measured one year prior (the “base” period). The revenue included in the current period excludes revenue from (i) customers that churned after the end of the base period and (ii) new customers that entered into a customer agreement after the end of the base period.
5 This metric has been updated to reflect the inclusion of legacy Signal Sciences customers in the calculation.
6 Net Retention Rate measures the net change in monthly revenue from existing customers in the last month of the period (the “current" period month) compared to the last month of the same period one year prior (the “prior" period month). The revenue included in the current period month includes revenue from (i) revenue contraction due to billing decreases or customer churn, (ii) revenue expansion due to billing increases, but excludes revenue from new customers. We calculate Net Retention Rate by dividing the revenue from the current period month by the revenue in the prior period month.
7 Our LTM Net Retention Rate, intended to be supplemental to our Net Retention Rate, was 137% for the period ended December 31, 2020. We calculate LTM Net Retention Rate by dividing the total customer revenue for the prior twelve-month period (“prior 12-month period”) ending at the beginning of the last twelve-month period (“LTM period”) minus revenue contraction due to billing decreases or customer churn, plus revenue expansion due to billing increases during the LTM period from the same customers by the total prior 12-month period revenue. We believe the LTM Net Retention Rate is supplemental as it removes some of the volatility that is inherent in a usage-based business model.
8 Enterprise customers are defined as those spending $100,000 or more in a twelve-month period. Includes Signal Sciences customers (who were not previously Fastly customers) that are counted as enterprise customers if they have had revenue in excess of $75,000 during the previous 9-month period since the acquisition.
9 Calculated based on trailing twelve-months.
To Our Shareholders
During the second quarter, we managed through a significant outage that impacted our Q2 results. We have a couple of customers, one of them being a top 10 customer, that have yet to return their traffic to the platform. We also had several customers delay their launch of new projects, which will delay the timing of traffic coming onto our platform. The outage and these delays will have an impact on our Q3 and full year outlook.
Global Outage
On June 8, our network experienced a global outage affecting nearly all customers. The outage resulted from an undiscovered software bug that was triggered by a valid customer configuration change. We detected the bug within one minute and returned 95% of our network to normal within 49 minutes, but our customers were negatively impacted. As a result, we saw traffic volumes decrease and issued credits to customers following the incident. Given the usage-based nature of our business model, this resulted in an impact to our Q2 results, and we expect to see a downstream impact on revenue from the outage in the near-to medium-term as we work with our customers to bring back their traffic to normal levels. We continue to implement significant measures to ensure increased resiliency for our customers and their users, and we continue to engage with our customers to regain their confidence in Fastly.
Timing Uncertainties
Separately, several customers delayed the deployment of new traffic onto our platform. We believe that this traffic will come onto the network in 2021, but later than we had originally forecasted.
We are confident in our ability to address issues related to the outage and customer timing in the near-term, but these factors have impacted our outlook for the second half of 2021.
The Path Forward
On the operations front, we have two new seasoned executives to drive our sales and finance organizations. Brett Shirk joined as our Chief Revenue Officer in Q1 and is growing Fastly’s global sales organization into a scalable and repeatable sales machine, while strengthening customer and partner relationships. Ron Kisling is joining as our Chief Financial Officer, later this month, bringing experience in scaling public companies through rapid growth.
Despite the challenges we experienced in the last quarter, our mission of fueling and securing the modern digital experience remains strong and relevant. We are confident that our operational rigor, a security-led GTM motion, and expansion of our Compute@Edge capabilities will drive value for our customers and shareholders. In particular, our integrated security offerings are gaining traction in the market, resulting in a strong pipeline with new customers and expansion of our sales engagements with existing customers.
Our customers and our own engineering teams are revealing the expansive power and potential of Compute@Edge, tapping into functionality that goes well beyond improving website performance and experiences. Businesses like Launch Darkly and GraphCDN, as well as Fastly’s own engineering teams are building and rearchitecting products. By adopting Compute@Edge technology, companies like this will have the ability to develop entire businesses at high velocity to continue fueling the modern digital experience.
Securing the Edge
As our partnerships evolve we will continue to broaden our product availability through various channels. Our next-generation WAF (formerly Signal Sciences) became available for customers to purchase via the Amazon AWS Marketplace, representing an important new route to market through channel partnerships. This is a great example of how our refreshed go-to-market strategy is creating growth opportunities. We also recently announced the achievement of a significant integration milestone with the Signal Sciences agent entering beta on the Fastly edge cloud. The combined precision of the Signal Sciences technology with the scale of the Fastly edge cloud gives customers a powerful solution to detect and defend against attacks, and is a compelling differentiator for Fastly in the market.
Finally, we also introduced our first managed security offering — Fastly Response Security Service. This offering gives customers 24/7 access to experts in our Customer Security Operations Center, and an industry-leading, 15-minute response time for critical security incidents. Providing this security expertise and assistance will help our customers better prepare for and respond to attacks and other malicious activity keeping their business and users secure.
Unleashing the Power of Edge Computing
We continue to progress against our Compute@Edge roadmap, adding features and capabilities to further support our customers, including support for JavaScript and local testing. We have also leveraged Compute@Edge to bring Nearline Cache to the cloud market more quickly to build a stronger feature set. As a result, we will continue to leverage Compute@Edge to drive highly differentiated and high-velocity product development.
Building a Dominant Global Edge Platform
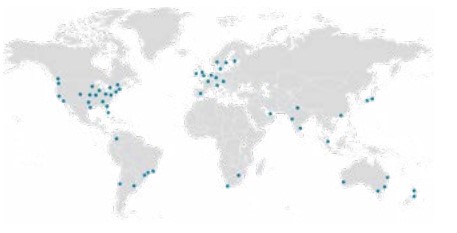
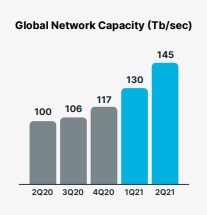
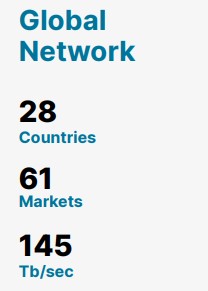
As of Q2 2021, we reached over 145 Tbps of global capacity. This quarter, we entered three new markets — in Lima, Munich, and Ghana — now totaling 61 global markets. We aim to continue our expansion globally in 2021 while remaining focused on the safety of our employees and vendors.
Securing Customer Wins Globally
This quarter, as a result of cross-sell and up-sell opportunities in Compute@Edge and Security, we saw new business wins and our customers across multiple verticals continue to expand their usage. Key customer highlights include:
•Gaming – A large gaming platform leveraged Fastly’s Nearline Cache feature as an elegant solution to virtually eliminate S3 origin egress costs while fitting seamlessly into its established workflow. Due to this, Fastly was able to capture a greater share of wallet within this customer’s multi CDN approach.
•Education – An edtech customer, OpenSesame, required API security and a stronger WAF solution. Given our strong relationship and the ability to purchase through a single unified contract, they were excited to replace their incumbent provider with our next-gen WAF.
•Financial Services – Paychex, an innovative software-as-a-service technology and mobility provider for payroll, benefits, human resources, and insurance, chose Fastly’s next-gen WAF when they saw how easy it was to manage, deploy, and how well it protected them. Additionally, Zopa, a UK-based neobank, having been a Fastly customer since 2019 added Compute@Edge to its engagement with us leveraging it to drive new initiatives.
•Ecommerce – An Ecommerce online platform that is transforming accessibility to high fashion has chosen to leverage our security portfolio while replacing their incumbent legacy providers. They chose Fastly to quickly scale and improve their overall digital experience while keeping their ecommerce payments platform secure.
•Travel – A multinational online travel booking service, which operates in 40 countries and is based in Europe, chose Fastly’s VCL edge logic to replace their legacy configurations during their digital transformation to GCP. As a newly minted GCP partner they instantly fell in love with our terraform integration, real-time logging, CDN management through API, and instant deployment.
Combined Customer Growth and While Driving our Land and Expand Strategy
Going forward, we will report all of our customer metrics on a combined basis, including both Fastly and Signal Sciences. We have included the new combined metrics, for all quarters since the acquisition, below.
Our customer count grew from 2,4581 in Q1 2021 to 2,581 in Q2 2021. We also saw increased engagement and further expansion of our enterprise customer base2 (defined as those spending $100,000 or more in a twelve-month period). Enterprise customer count2 grew to 408 from 3951 in the previous quarter. While our average enterprise customer spend2 of $702,000 was essentially flat from $705,0001 in the last quarter, it now reflects the combined Fastly and Signal Sciences enterprise customer spend. As Signal Sciences enterprise customers’ average spend is lower than that of Fastly, the inclusion of Signal Sciences in the calculation reflects a lower combined average. Additionally, our Dollar-Based Net Expansion Rate (DBNER)3 which measures the change in revenue from existing customers over a twelve-month period remains solid at 126%. Our DBNER highlights the continued strength of our platform and relationships with our enterprise customers2, generating 89% of our trailing twelve-month total revenue, in both Q11 and Q2 2021.
We delivered a Net Retention Rate4 (NRR) of 93% in Q2 2021 (121%5 on a last-twelve-month (LTM) basis). We believe the LTM NRR removes some of the volatility that is inherent in a usage-based business model. We measure NRR in addition to DBNER in an effort to provide insight into our customer base in a similar fashion to what is commonly found with traditional SaaS companies. DBNER differs from NRR in that DBNER only includes existing customers that have been on the platform at least 13 months, and excludes churn.
____________________________________________
1 This metric has been updated to reflect the inclusion of legacy Signal Sciences customers in the calculation.
2 Enterprise customers are defined as those spending $100,000 or more in a twelve-month period. Includes Signal Sciences customers (who were not previously Fastly customers) that are counted as enterprise customers if they have had revenue in excess of $75,000 during the previous 9-month period since the acquisition.
3 We calculate Dollar-Based Net Expansion Rate by dividing the revenue for a given period from customers who remained customers as of the last day of the given period (the “current” period) by the revenue from the same customers for the same period measured one year prior (the “base” period). The revenue included in the current period excludes revenue from (i) customers that churned after the end of the base period and (ii) new customers that entered into a customer agreement after the end of the base period.
4 Net Retention Rate measures the net change in monthly revenue from existing customers in the last month of the period (the “current" period month) compared to the last month of the same period one year prior (the “prior" period month). The revenue included in the current period month includes revenue from (i) revenue contraction due to billing decreases or customer churn, (ii) revenue expansion due to billing increases, but excludes revenue from new customers. We calculate Net Retention Rate by dividing the revenue from the current period month by the revenue in the prior period month.
5 Our LTM Net Retention Rate, intended to be supplemental to our Net Retention Rate, was 137% for the period ended December 31, 2020. We calculate LTM Net Retention Rate by dividing the total customer revenue for the prior twelve-month period (“prior 12-month period”) ending at the beginning of the last twelve-month period (“LTM period”) minus revenue contraction due to billing decreases or customer churn, plus revenue expansion due to billing increases during the LTM period from the same customers by the total prior 12-month period revenue. We believe the LTM Net Retention Rate is supplemental as it removes some of the volatility that is inherent in a usage-based business model.
Financial Discussion
Q2 2021 Performance
Revenue
Total revenue for Q2 2021 increased 14% year-over-year to $85 million, net of a $1.2 million deferred revenue write-down associated with the acquisition of Signal Sciences. As noted above, revenue growth was driven by the acquisition of Signal Sciences and the further adoption of our modern edge platform and products.
Customer Count
As of June 30, 2021, 4081 of our 2,581 customers were enterprise customers1, which accounted for 89% of our trailing twelve-month total revenue.
Gross Margin
GAAP gross margin was 52.6% for Q2 2021, down from 60.2% in the same quarter a year ago. Excluding stock-based compensation and amortization of acquired intangible assets, our non-GAAP gross margin2 was 57.6% for Q2 2021, compared to 61.7% in the same quarter a year ago. The decrease in gross margin reflects our continued investment in infrastructure and capacity in anticipation of customer demand. Additionally, our GAAP gross margin also reflects the amortization of acquired intangibles from our acquisition of Signal Sciences in the fourth quarter of 2020.
____________________________________________
1 Enterprise customers are defined as those spending $100,000 or more in a twelve-month period. Includes Signal Sciences customers (who were not previously Fastly customers) that are counted as enterprise customers if they have had revenue in excess of $75,000 during the previous 9-month period since the acquisition.
2 For a reconciliation of non-GAAP financial measures to their corresponding GAAP measures, please refer to the reconciliation table at the end of this letter.
Expenses
Our total operating expenses were $102 million in Q2 2021, or 120% of revenue, up from $59 million, or 80% in Q2 2020. The increase in expense can primarily be attributed to the personnel added as a result of the Signal Sciences acquisition, as well as other acquisition related costs. Additional personnel related investments were also made to support continued growth and innovation.
Research and development expenses were $30 million in Q2 2021, or 36% of revenue, up from $17 million, or 22% of revenue in Q2 2020. Sales and marketing expenses were $36 million in Q2 2021, representing 43% of revenue, up from $25 million, or 33% of revenue in Q2 2020. General and administrative expenses were $35 million in Q2 2021, or 42% of revenue, up from $18 million, or 24% of revenue in Q2 2020.
We generated a GAAP operating loss for Q2 2021 of $57 million, or 68% of revenue, compared to GAAP operating loss of $14 million, or 19% of revenue in Q2 2020. Excluding stock-based compensation, amortization of acquired intangible assets, and acquisition-related expenses, our non-GAAP operating loss1 for Q2 2021 was $18 million, or 21% of revenue, compared to non-GAAP operating income1 of $2 million, or 2% of revenue in Q2 2020.
Net Loss
Net loss for Q2 2021 was $58 million, or a $0.51 loss per basic and diluted shares, compared to $14 million or a $0.14 loss per basic and diluted shares in Q2 2020. Non-GAAP net loss1 for Q2 2021 was $17 million, or a $0.15 loss per basic and diluted shares1, compared to $2 million or a $0.02 income per basic and diluted shares1 in Q2 2020. For a reconciliation of non-GAAP financial measures to their corresponding GAAP measures, please refer to the reconciliation table at the end of this letter.
Balance Sheet, Capital Expenditures, and Cash Flow
We ended Q2 2021 with $1.1 billion in cash, restricted cash, and investments, including those classified as long-term. Cash used in operations was $17 million in the quarter, compared to $9 million last year. Capital expenditures, or cash used for purchases of property and equipment and capitalized internal-use software, were $5 million in Q2 2021, representing 5% of total revenue in Q2 2021. Free Cash Flow was ($22) million in Q2 2021. For additional Information, please refer to the free cash flow table at the end of this letter.
____________________________________________
1 For a reconciliation of non-GAAP financial measures to their corresponding GAAP measures, please refer to the reconciliation table at the end of this letter.
Q3 and Full-Year 2021 Business Outlook
Our 2021 outlook reflects revenue impacts from the outage in June, the timing of customer traffic ramping on our platform, and anticipated renewals. Our expected operating profile reflects our continued investment for future growth, along with the impact of the Signal Sciences acquisition. Similar to last year’s approach, our revenue guidance is based on the visibility that we have today, and given our usage-based business model, we expect to gain additional visibility as the year progresses.
| | | | | | | | | | | |
| | Q3 2021 | Full Year 2021 |
Total Revenue | | $82 - $85 million | $340 - $350 million |
| Non-GAAP Operating Loss | | ($23) - ($19) million | ($75) - ($65) million |
Non-GAAP Net Loss Per Share 1,2 | | ($0.21) - ($0.18) | ($0.65) - ($0.57) |
____________________________________________
1 Assumes weighted average basic shares outstanding of 116.9 million in Q3 2021 and 115.5 million for the full year 2021.
2 Non-GAAP Net Loss per share calculation is full-year Non-GAAP Net Loss divided by weighted average basic shares for the full-year.
We believe we have a tremendous opportunity to invest in our edge cloud mission this year and plan to do so to position Fastly for future growth. As we have said before, we will continue to invest in our network in a disciplined manner, keeping long-term profitability in mind. We continue to expect capital expenditures as a percentage of revenue to be approximately 12% to 14% of revenue ⏤ similar to full-year 2020. Long-term, we expect capital expenditures to approach 10% of revenue on a calendar year basis.
A reconciliation of non-GAAP guidance measures to corresponding GAAP measures for our Q3 and Full Year 2021 Business Outlook is not available on a forward-looking basis without unreasonable effort due to the uncertainty regarding, and the potential variability of many of these costs and expenses that may be incurred in the future. We have provided a reconciliation of GAAP to non-GAAP financial measures for Q2 2021 in the reconciliation table at the end of this letter.
Combined Customer Stats Appendix
The following prior period metrics have been revised to reflect the inclusion of Signal Sciences in the calculation of these metrics, since the acquisition on October 1, 2020. | | | | | | | | | | | | | | |
| | Q4 2020 | Q1 2021 | Q2 2021 |
| Dollar-Based Net Expansion Rate (DBNER) | | 144% | 141% | 126% |
| Net Retention Rate (NRR) | | 116% | 110% | 93% |
| Last-twelve-month (LTM) NRR | | 137% | 135% | 121% |
| Total Customer Count | | 2,326 | 2,458 | 2,581 |
| Enterprise Customer Count | | 378 | 395 | 408 |
| Average Enterprise Customer Spend | | $681,000 | $705,000 | $702,000 |
Quarterly Conference Call
We will host a live Q&A session at 2:00 p.m. PT / 5:00 p.m. ET on Wednesday, August 4, 2021 to discuss these financial results. To participate in the live call, please dial (833) 968-2077 (U.S. / Canada) or (236) 714-2139 (international) and provide conference ID 3096376. A live webcast of the call will be available at https://investors.fastly.com and will be archived on our site following the call.
In closing, I want to thank all of our stakeholders — specifically our investors, customers and employees — for their commitment to the edge cloud we’ve built and will continue to iterate on. On the heels of an outage is never a place we want to be at Fastly, but I’m incredibly proud of our team’s enduring dedication to our customer-first mindset and desire to build and deliver a more trustworthy Internet for all. While reflecting on our response to the outage, I feel confident when I say Fastly has never been so committed to supporting the most important content on the Internet.
We look forward to your questions on our call this afternoon.
Sincerely,
Joshua Bixby
CEO
Forward-Looking Statements
This letter to shareholders contains forward-looking statements within the meaning of Section 27A of the Securities Act of 1933, as amended (the "Securities Act"), and Section 21E of the Securities Exchange Act of 1934, as amended, about us and our industry that involve substantial risks and uncertainties. Forward-looking statements generally relate to future events or Fastly's future financial or operating performance. In some cases, you can identify forward-looking statements because they contain words such as "may," "will," "should," "expects," "plans," "anticipates,” “going to,” "could," "intends," "target," "projects," "contemplates," "believes," "estimates," "predicts," "potential," or "continue," or the negative of these words or other similar terms or expressions that concern Fastly's expectations, strategy, priorities, plans, or intentions. Forward-looking statements in this letter to shareholders include, but are not limited to, statements regarding Fastly’s future financial and operating performance, including its outlook and guidance; the impact of the outage and delayed deployment of new traffic onto Fastly’s platform; Fastly's strategies, product and business plans, including its ability to scale and further invest in the business to expand its edge cloud platform; the abilities of Fastly’s personnel; statements regarding the integration and success of Signal Sciences; statements regarding Fastly's investments in revenue, marketing and demand generation, and the impact of such investments on its business; statements regarding the performance of Fastly's platform, including its ability to augment capacity safely, drive efficiency, and support continued growth; statements regarding Fastly's expectations regarding the expansion of its customer base, including anticipated enterprise customer deals, the growth and usage of its customers, and continued demand for future products from the combined Signal Sciences portfolio. Fastly's expectations and beliefs regarding these matters may not materialize, and actual results in future periods are subject to risks and uncertainties that could cause actual results to differ materially from those projected. These risks include the possibility that: Fastly is unable to attract and retain customers; Fastly's existing customers and partners do not maintain or increase usage of Fastly's platform; Fastly's platform and product features do not meet expectations, including due to defects, interruptions, security breaches, delays in performance or other similar problems; Fastly is unable to adapt to meet evolving market and customer demands and rapid technological change; Fastly is unable to comply with modified or new industry standards, laws and regulations; Fastly is unable to generate sufficient revenues to achieve or sustain profitability; Fastly’s limited operating history makes it difficult to evaluate its prospects and future operating results; Fastly is unable to effectively manage its growth; and Fastly is unable to compete effectively. The forward-looking statements contained in this shareholder letter are also subject to other risks and uncertainties, including those more fully described in Fastly’s Quarterly Report on Form 10-Q for the quarter ended March 31, 2021, and additional information that will be set forth on Fastly's Quarterly Report on Form 10-Q for the quarter ended June 30, 2021 and other filings and reports that we may file from time to time with the SEC. The forward-looking statements in this letter to shareholders are based on information available to Fastly as of the date hereof, and Fastly disclaims any obligation to update any forward-looking statements, except as required by law.
Non-GAAP Financial Measures
To supplement our condensed consolidated financial statements, which are prepared and presented in accordance with accounting principles generally accepted in the United States ("GAAP"), the Company uses the following non-GAAP measures of financial performance: non-GAAP gross profit, non-GAAP gross margin, non-GAAP operating loss, non-GAAP net loss, non-GAAP basic and diluted net loss per common share, non-GAAP research and development, non-GAAP sales and marketing, non-GAAP general and administrative, free cash flow and adjusted EBITDA. The presentation of this additional financial information is not intended to be considered in isolation from, as a substitute for, or superior to, the financial information prepared and presented in accordance with GAAP. These non-GAAP measures have limitations in that they do not reflect all of the amounts associated with our results of operations as determined in accordance with GAAP. In addition, these non-GAAP financial measures may be different from the non-GAAP financial measures used by other companies. These non-GAAP measures should only be used to evaluate our results of operations in conjunction with the corresponding GAAP measures. Management compensates for these limitations by reconciling these non-GAAP financial measures to the most comparable GAAP financial measures within our earnings releases.
Non-GAAP gross profit, non-GAAP gross margin, non-GAAP operating loss, Non-GAAP net loss and non-GAAP basic and diluted net loss per common share differ from GAAP, non-GAAP research and development, non-GAAP sales and marketing, and non-GAAP general and administrative differ from GAAP in that they exclude stock-based compensation expense, amortization of acquired intangibles assets, acquisition-related expenses and amortization of debt discount and issuance costs.
Adjusted EBITDA: excludes stock-based compensation expense, depreciation and other amortization expenses, amortization of acquired intangibles assets, amortization of debt discount and issuance costs, acquisition-related expenses, interest income, interest expense, other expense, (net), and income taxes.
Acquisition-related Expense: consists of one-time expenses related to the acquisition related activities. Management considers its operating results without the one-time acquisition-related expense when evaluating its ongoing non-GAAP performance and its ongoing adjusted EBITDA performance because these charges are one-time and may not be reflective of our core business, ongoing operating results, or future outlook.
Amortization of Acquired Intangible Assets: consists of non-cash charges that can be affected by the timing and magnitude of asset purchases and acquisitions. Amortization of acquired intangible assets is included in the following cost and expense line items of our GAAP presentation: cost of revenue and sales and marketing. Management considers its operating results without the amortization expense of our acquired intangible assets when evaluating its ongoing non-GAAP performance and its ongoing adjusted EBITDA performance because these charges are non-cash expenses that can be affected by the timing and magnitude of asset purchases and acquisitions and may not be reflective of our core business, ongoing operating results, or future outlook.
Amortization of Debt Discount and Issuance Costs: consists primarily of amortization expense related to our debt obligations. Management considers its adjusted EBITDA results without this activity when evaluating its ongoing performance because it is not believed by management to be reflective of our core business, ongoing operating results or future outlook.
Capital Expenditures: cash used for purchases of property and equipment and capitalized internal-use software, as reflected in our statement of cash flows.
Depreciation and Other Amortization Expense: consists of non-cash charges that can be affected by the timing and magnitude of asset purchases. Depreciation and amortization expense is included in the following cost and expense line items of our GAAP presentation: cost of revenue, research and development, sales and marketing, and general and administrative. Management considers its operating results without the depreciation and other amortization expense when evaluating its ongoing adjusted EBITDA performance because these charges are non-cash expenses that can be affected by the timing and magnitude of asset purchases and may not be reflective of our core business, ongoing operating results, or future outlook.
Free Cash Flow: calculated as net cash used in operating activities less capital expenditures.
Interest Expense: consists primarily of interest expense related to our debt instruments. Management considers its operating results without total interest expense when evaluating its ongoing adjusted EBITDA performance because it is not believed by management to be reflective of our core business, ongoing operating results or future outlook.
Interest Income: consists primarily of interest income related to our marketable securities. Management considers its adjusted EBITDA results without this activity when evaluating its ongoing performance because it is not believed by management to be reflective of our core business, ongoing operating results or future outlook.
Income Taxes: consists of expenses recognized related to state and foreign income taxes. Management considers its adjusted EBITDA results without these charges when evaluating its ongoing performance because it is not believed by management to be reflective of our core business, ongoing operating results or future outlook.
Non-GAAP Operating Loss: calculated as GAAP revenue less non-GAAP cost of revenue and non-GAAP operating expenses.
Other Expense (Income), Net: consists primarily of foreign currency transaction gains and losses. Management considers its operating results without other expense, net when evaluating its ongoing adjusted EBITDA performance because it is not believed by management to be reflective of our core business, ongoing operating results or future outlook.
Stock-based Compensation Expense: consists of expenses for stock options, restricted stock units, performance awards, restricted stock awards and Employee Stock Purchase Plan ("ESPP") under our equity incentive plans. Stock-based compensation is included in the following cost and expense line items of our GAAP presentation: cost of revenue, research and development, sales and marketing, and general and administrative.
Although stock-based compensation is an expense for the Company and is viewed as a form of compensation, management excludes stock-based compensation from our non-GAAP measures and adjusted EBITDA results for purposes of evaluating our continuing operating performance primarily because it is a non-cash expense not believed by management to be reflective of our core business, ongoing operating results, or future outlook. In addition, the value of some stock-based instruments is determined using formulas that incorporate variables, such as market volatility, that are beyond our control.
Management believes these non-GAAP financial measures and adjusted EBITDA serve as useful metrics for our management and investors because they enable a better understanding of the long-term performance of our core business and facilitate comparisons of our operating results over multiple periods and to those of peer companies, and when taken together with the corresponding GAAP financial measures and our reconciliations, enhance investors' overall understanding of our current financial performance.
In the financial tables below, the Company provides a reconciliation of the most comparable GAAP financial measure to the historical non-GAAP financial measures used in this shareholder letter.
Condensed Consolidated Statements of Operations
(in thousands, except per share amounts, unaudited)
| | | | | | | | | | | | | | | | | | | | | | | | | | |
| | Three months ended
June 30, | | Six months ended
June 30, |
| | 2021 | | 2020 | | 2021 | | 2020 |
| Revenue | | $ | 85,026 | | | $ | 74,663 | | | $ | 169,878 | | | $ | 137,587 | |
| Cost of revenue | | 40,320 | | | 29,697 | | | 77,814 | | | 56,962 | |
| Gross profit | | 44,706 | | | 44,966 | | | 92,064 | | | 80,625 | |
| Operating expenses: | | | | | | | | |
| Research and development | | 30,346 | | | 16,655 | | | 59,334 | | | 30,953 | |
| Sales and marketing | | 36,334 | | | 24,680 | | | 71,206 | | | 43,848 | |
| General and administrative | | 35,494 | | | 18,069 | | | 68,955 | | | 32,238 | |
| Total operating expenses | | 102,174 | | | 59,404 | | | 199,495 | | | 107,039 | |
| Loss from operations | | (57,468) | | | (14,438) | | | (107,431) | | | (26,414) | |
| Interest income | | 276 | | | 378 | | | 450 | | | 1,097 | |
| Interest expense | | (1,436) | | | (371) | | | (2,097) | | | (687) | |
| Other income (expense), net | | 178 | | | (53) | | | 114 | | | 349 | |
| Loss before income taxes | | (58,450) | | | (14,484) | | | (108,964) | | | (25,655) | |
| Income tax expense (benefit) | | (155) | | | (24) | | | 14 | | | 795 | |
| Net loss | | $ | (58,295) | | | $ | (14,460) | | | $ | (108,978) | | | $ | (26,450) | |
| Net loss per share attributable to common stockholders, basic and diluted | | $ | (0.51) | | | $ | (0.14) | | | $ | (0.95) | | | $ | (0.27) | |
| Weighted-average shares used in computing net loss per share attributable to common stockholders, basic and diluted | | 115,326 | | | 99,835 | | | 114,733 | | | 97,618 | |
__________
(1)Includes stock-based compensation expense as follows:
| | | | | | | | | | | | | | | | | | | | | | | | | | |
| | Three months ended June 30 | | Six months ended June 30, |
| | 2021 | | 2020 | | 2021 | | 2020 |
| Cost of revenue | | $ | 1,828 | | | $ | 1,090 | | | $ | 3,014 | | | $ | 1,705 | |
| Research and development | | 8,634 | | | 4,053 | | | 16,592 | | | 5,724 | |
| Sales and marketing | | 5,631 | | | 7,076 | | | 10,639 | | | 8,559 | |
| General and administrative | | 17,333 | | | 4,062 | | | 34,019 | | | 6,622 | |
| Total | | $ | 33,426 | | | $ | 16,281 | | | $ | 64,264 | | | $ | 22,610 | |
Condensed Consolidated Balance Sheets
(in thousands)
| | | | | | | | | | | | | | |
| | As of June 30, 2021 | | As of December 31, 2020 |
| | (unaudited) | | (audited) |
| ASSETS | | | | |
| Current assets: | | | | |
| Cash and cash equivalents | | $ | 687,986 | | | $ | 62,900 | |
| Marketable securities, current | | 241,744 | | | 131,283 | |
| Accounts receivable, net of allowance for credit losses | | 56,065 | | | 50,258 | |
| Restricted cash | | 87 | | | 87 | |
| Prepaid expenses and other current assets | | 22,222 | | | 16,728 | |
| Total current assets | | 1,008,104 | | | 261,256 | |
| Marketable securities, non current | | 173,227 | | | 20,448 | |
| Property and equipment, net | | 116,471 | | | 95,979 | |
| Operating right-of-use assets | | 62,630 | | | 60,019 | |
| Goodwill | | 635,646 | | | 635,590 | |
| Intangible assets, net | | 113,215 | | | 121,742 | |
| Other assets | | 27,578 | | | 24,917 | |
| Total assets | | $ | 2,136,871 | | | $ | 1,219,951 | |
| LIABILITIES AND STOCKHOLDERS’ EQUITY | | | | |
| Current liabilities: | | | | |
| Accounts payable | | $ | 10,202 | | | $ | 9,150 | |
| Accrued expenses | | 28,609 | | | 34,334 | |
| Finance lease liabilities, current | | 14,773 | | | 11,033 | |
| Operating lease liabilities, current | | 19,713 | | | 19,895 | |
| Other current liabilities | | 29,735 | | | 19,677 | |
| Total current liabilities | | 103,032 | | | 94,089 | |
| Long-term debt | | 931,385 | | | — | |
| Finance lease liabilities, noncurrent | | 19,685 | | | 14,707 | |
| Operating lease liabilities, noncurrent | | 47,177 | | | 44,890 | |
| Other long-term liabilities | | 6,502 | | | 4,400 | |
| Total liabilities | | 1,107,781 | | | 158,086 | |
| Stockholders’ equity: | | | | |
| Class A and Class B common stock | | 2 | | | 2 | |
| Additional paid-in capital | | 1,426,520 | | | 1,350,050 | |
| Accumulated other comprehensive income (loss) | | (261) | | | 6 | |
| Accumulated deficit | | (397,171) | | | (288,193) | |
| Total stockholders’ equity | | 1,029,090 | | | 1,061,865 | |
| Total liabilities and stockholders’ equity | | $ | 2,136,871 | | | $ | 1,219,951 | |
Condensed Consolidated Statements of Cash Flows
(in thousands, unaudited)
| | | | | | | | | | | | | | | | | | | | | | | | | | |
| | Three months ended
June 30, | | Six months ended
June 30, |
| | 2021 | | 2020 | | 2021 | | 2020 |
| Cash flows from operating activities: | | | | | | | | |
| Net loss | | $ | (58,295) | | | $ | (14,460) | | | $ | (108,978) | | | $ | (26,450) | |
| Adjustments to reconcile net loss to net cash used in operating activities: | | | | | | | | |
| Depreciation expense | | 6,927 | | | 4,693 | | | 13,346 | | | 9,372 | |
| Amortization of intangible assets | | 5,257 | | | 36 | | | 10,620 | | | 72 | |
| Amortization of right-of-use assets and other | | 6,303 | | | 5,239 | | | 12,660 | | | 10,188 | |
| Amortization of debt discount and issuance costs | | 937 | | | 19 | | | 1,269 | | | 38 | |
| Amortization of deferred contract costs | | 1,535 | | | 788 | | | 2,946 | | | 1,481 | |
| Stock-based compensation | | 33,426 | | | 16,281 | | | 64,264 | | | 22,610 | |
| Provision for credit losses | | 225 | | | 866 | | | (195) | | | 1,016 | |
| Interest paid on finance leases | | (405) | | | (149) | | | (735) | | | (268) | |
| Loss on disposals of property and equipment | | — | | | — | | | 27 | | | — | |
| Other adjustments | | 749 | | | 208 | | | 813 | | | (304) | |
| Changes in operating assets and liabilities: | | | | | | | | |
| Accounts receivable | | (3,927) | | | (16,180) | | | (5,612) | | | (22,211) | |
| Prepaid expenses and other current assets | | (3,814) | | | (835) | | | (5,494) | | | (1,983) | |
| Other assets | | (2,137) | | | (2,676) | | | (5,089) | | | (4,769) | |
| Accounts payable | | (1,957) | | | (1,748) | | | 162 | | | 1,364 | |
| Accrued expenses | | (3,080) | | | 4,121 | | | (3,835) | | | 2,626 | |
| Operating lease liabilities | | (6,491) | | | (4,141) | | | (12,856) | | | (8,413) | |
| Other liabilities | | 7,733 | | | (843) | | | 8,804 | | | (336) | |
| Net cash used in operating activities | | (17,014) | | | (8,781) | | | (27,883) | | | (15,967) | |
| Cash flows from investing activities: | | | | | | | | |
| Purchases of marketable securities | | (269,537) | | | (56,187) | | | (333,868) | | | (56,187) | |
| Sales of marketable securities | | — | | | — | | | 12,497 | | | — | |
| Maturities of marketable securities | | 31,750 | | | 23,501 | | | 57,253 | | | 44,901 | |
| Purchases of property and equipment | | (2,934) | | | (2,072) | | | (11,013) | | | (12,241) | |
| Capitalized internal-use software | | (1,691) | | | (744) | | | (2,680) | | | (2,181) | |
| Purchases of intangible assets | | (2,093) | | | (1,811) | | | (2,093) | | | (1,811) | |
| Net cash used in investing activities | | (244,505) | | | (37,313) | | | (279,904) | | | (27,519) | |
| Cash flows from financing activities: | | | | | | | | |
| Proceeds from follow-on public offering, net of underwriting fees | | — | | | 274,896 | | | — | | | 274,896 | |
| Payments of costs related to initial public offering | | — | | | (173) | | | — | | | (173) | |
| Issuance of convertible note, net of issuance costs | | — | | | — | | | 930,775 | | | — | |
| Refunds (Payments) of other debt issuance costs | | — | | | — | | | (1,351) | | | — | |
| Repayments of finance lease liabilities | | (3,628) | | | (1,307) | | | (6,579) | | | (2,900) | |
| Proceeds from employee stock purchase plan | | 1,493 | | | 2,031 | | | 4,564 | | | 4,164 | |
| Proceeds from exercise of vested stock options | | 2,886 | | | 5,657 | | | 5,605 | | | 8,831 | |
| Net cash provided by financing activities | | 751 | | | 281,104 | | | 933,014 | | | 284,818 | |
| Effects of exchange rate changes on cash, cash equivalents, and restricted cash | | (29) | | | (93) | | | (141) | | | (56) | |
| Net increase (decrease) in cash, cash equivalents, and restricted cash | | (260,797) | | | 234,917 | | | 625,086 | | | 241,276 | |
| Cash, cash equivalents, and restricted cash at beginning of period | | 949,763 | | | 92,588 | | | 63,880 | | | 86,229 | |
| Cash, cash equivalents, and restricted cash at end of period | | $ | 688,966 | | | $ | 327,505 | | | $ | 688,966 | | | $ | 327,505 | |
| Reconciliation of cash, cash equivalents, and restricted cash as shown in the statements of cash flows: | | | | | | | | |
| Cash and cash equivalents | | 687,986 | | | 257,418 | | | 687,986 | | | 257,418 | |
| Restricted cash | | 87 | | | 70,087 | | | 87 | | | 70,087 | |
| Restricted cash included in other assets | | 893 | | | — | | | 893 | | | — | |
| Total cash, cash equivalents, and restricted cash | | $ | 688,966 | | | $ | 327,505 | | | $ | 688,966 | | | $ | 327,505 | |
Free Cash Flow
(in thousands, unaudited)
| | | | | | | | | | | | | | | | | | | | | | | | | | | | | | | | | | | | | | | | | | | | |
| | Quarter ended | | Year ended | | Quarter ended |
| | Q1 2020 | | Q2 2020 | | Q3 2020 | | Q4 2020 | | FY2020 | | Q1 2021 | | Q2 2021 |
| | | | | | | | | | | | | | |
| Cash flow provided by (used in) operations | | $ | (7,186) | | | $ | (8,781) | | | $ | 27,200 | | | $ | (31,149) | | | $ | (19,916) | | | $ | (10,869) | | | $ | (17,014) | |
Capital expenditures(1),(2) | | (11,606) | | | (2,816) | | | (13,262) | | | (8,016) | | | (35,700) | | | (9,068) | | | (4,625) | |
Free Cash Flow(2) | | $ | (18,792) | | | $ | (11,597) | | | $ | 13,938 | | | $ | (39,165) | | | $ | (55,616) | | | $ | (19,937) | | | $ | (21,639) | |
__________
(1)Capital Expenditures are defined as cash used for purchases of property and equipment and capitalized internal-use software, as reflected in our statement of cash flows.
(2)As disclosed in our form 10-K filed on March 1, 2021, we reduced our capital expenditures previously reported by $1.7 million for the year ended December 31, 2020. The quarterly and year-to-date capital expenditure and free cash flow amounts in the table for fiscal year 2020 have been adjusted for this change which was not previously reflected in our quarterly filings on Form 10-Q.
Reconciliation of GAAP to Non-GAAP Financial Measures
(in thousands, unaudited)
| | | | | | | | | | | | | | | | | | | | | | | | | | |
| | Three months ended
June 30, | | Six months ended
June 30, |
| | 2021 | | 2020 | | 2021 | | 2020 |
| Gross Profit | | | | | | | | |
| GAAP gross profit | | $ | 44,706 | | | $ | 44,966 | | | $ | 92,064 | | | $ | 80,625 | |
| Stock-based compensation—Cost of revenue | | 1,828 | | | 1,090 | | | 3,014 | | | 1,705 | |
| Amortization of acquired intangible assets | | 2,475 | | | — | | | 4,950 | | | — | |
| Non-GAAP gross profit | | $ | 49,009 | | | $ | 46,056 | | | $ | 100,028 | | | $ | 82,330 | |
| GAAP gross margin | | 52.6 | % | | 60.2 | % | | 54.2 | % | | 60.2 | % |
| Non-GAAP gross margin | | 57.6 | % | | 61.7 | % | | 58.9 | % | | 59.8 | % |
| | | | | | | | |
| Research and development | | | | | | | | |
| GAAP research and development | | $ | 30,346 | | | $ | 16,655 | | | $ | 59,334 | | | $ | 30,953 | |
| Stock-based compensation | | (8,634) | | | (4,053) | | | (16,592) | | | (5,724) | |
| Non-GAAP research and development | | $ | 21,712 | | | $ | 12,602 | | | $ | 42,742 | | | $ | 25,229 | |
| | | | | | | | |
| Sales and marketing | | | | | | | | |
| GAAP sales and marketing | | $ | 36,334 | | | $ | 24,680 | | | $ | 71,206 | | | $ | 43,848 | |
| Stock-based compensation | | (5,631) | | | (7,076) | | | (10,639) | | | (8,559) | |
| Amortization of acquired intangible assets | | (2,709) | | | — | | | (5,525) | | | — | |
| Non-GAAP sales and marketing | | $ | 27,994 | | | $ | 17,604 | | | $ | 55,042 | | | $ | 35,289 | |
| | | | | | | | |
| General and administrative | | | | | | | | |
| GAAP general and administrative | | $ | 35,494 | | | $ | 18,069 | | | $ | 68,955 | | | $ | 32,238 | |
| Stock-based compensation | | (17,333) | | | (4,062) | | | (34,019) | | | (6,622) | |
| Acquisition-related expenses | | (1,298) | | | — | | | (2,227) | | | — | |
| Non-GAAP general and administrative | | $ | 16,863 | | | $ | 14,007 | | | $ | 32,709 | | | $ | 25,616 | |
| | | | | | | | |
| Operating loss | | | | | | | | |
| GAAP operating loss | | $ | (57,468) | | | $ | (14,438) | | | $ | (107,431) | | | $ | (26,414) | |
| Stock-based compensation | | 33,426 | | | 16,281 | | | 64,264 | | | 22,610 | |
| Amortization of acquired intangible assets | | 5,184 | | | — | | | 10,475 | | | — | |
| Acquisition-related expenses | | 1,298 | | | — | | | 2,227 | | | — | |
| Non-GAAP operating loss | | $ | (17,560) | | | $ | 1,843 | | | $ | (30,465) | | | $ | (3,804) | |
| | | | | | | | |
| Net loss | | | | | | | | |
| GAAP net loss | | $ | (58,295) | | | $ | (14,460) | | | $ | (108,978) | | | $ | (26,450) | |
| Stock-based compensation | | 33,426 | | | 16,281 | | | 64,264 | | | 22,610 | |
| Amortization of acquired intangible assets | | 5,184 | | | — | | | 10,475 | | | — | |
| Amortization of debt discount and issuance costs | | 993 | | | — | | | 993 | | | — | |
| Acquisition-related expenses | | 1,298 | | | — | | | 2,227 | | | — | |
| Non-GAAP net income (loss) | | $ | (17,394) | | | $ | 1,821 | | | $ | (31,019) | | | $ | (3,840) | |
| | | | | | | | |
| Non-GAAP net income (loss) per common share—basic and diluted | | $ | (0.15) | | | $ | 0.02 | | | $ | (0.27) | | | $ | (0.04) | |
| Weighted average basic and diluted common shares | | 115,326 | | 99,835 | | 114,733 | | 97,618 |
| | | | | | | | |
| | | | | | | | | | | | | | | | | | | | | | | | | | |
| | Three months ended
June 30, | | Six months ended
June 30, |
| | 2021 | | 2020 | | 2021 | | 2020 |
| Adjusted EBITDA | | | | | | | | |
| GAAP net loss | | $ | (58,295) | | | $ | (14,460) | | | $ | (108,978) | | | $ | (26,450) | |
| Stock-based compensation | | 33,426 | | | 16,281 | | | 64,264 | | | 22,610 | |
| Depreciation and other amortization | | 7,000 | | | 4,729 | | | 13,491 | | | 9,444 | |
| Amortization of acquired intangible assets | | 5,184 | | | — | | | 10,475 | | | — | |
| Amortization of debt discount and issuance costs | | 993 | | | — | | | 993 | | | — | |
| Interest income | | (276) | | | (378) | | | (450) | | | (1,097) | |
| Interest expense | | 1,436 | | | 371 | | | 2,097 | | | 687 | |
| Other expense (income), net | | (178) | | | 53 | | | (114) | | | (349) | |
| Income tax expense (income) | | (155) | | | (24) | | | 14 | | | 795 | |
| Acquisition-related expenses | | 1,298 | | | — | | | 2,227 | | | — | |
| Adjusted EBITDA | | $ | (9,567) | | | $ | 6,572 | | | $ | (15,981) | | | $ | 5,640 | |