UNITED STATES
SECURITIES AND EXCHANGE COMMISSION
Washington, D.C. 20549
FORM N-CSR
CERTIFIED SHAREHOLDER REPORT OF REGISTERED MANAGEMENT INVESTMENT COMPANIES
Investment Company Act file number 811-22550
Name of Fund: BlackRock Preferred Partners LLC
Fund Address: 100 Bellevue Parkway, Wilmington, DE 19809
Name and address of agent for service: John M. Perlowski, Chief Executive Officer, BlackRock Preferred Partners
LLC, 55 East 52nd Street, New York, NY 10055
Registrant’s telephone number, including area code: (800) 882-0052, Option 4
Date of fiscal year end: 03/31/2013
Date of reporting period: 09/30/2012
Item 1 – Report to Stockholders
2
| | |
 | | September 30, 2012 |
|
Semi-Annual Report (Unaudited) |
BlackRock Preferred Partners LLC
| | | | |
| | Not FDIC Insured § No Bank Guarantee § May Lose Value | | |
| | | | | | |
| | | | | | | |
| 2 | | BLACKROCK PREFERRED PARTNERS LLC | | SEPTEMBER 30, 2012 | | |
Dear Member
This report reflects your fund’s reporting period ended September 30, 2012. The following review is intended to provide you with additional market perspective over the past 12 months.
Late in the summer of 2011, financial markets were upended by sovereign debt turmoil in the United States and Europe as well as growing concerns about the future of the global economy. Investor confidence had crumbled. However, the fourth quarter of 2011 brought improving economic data and more concerted efforts among European leaders toward stemming the region’s debt crisis, gradually drawing investors back to the markets. Improving sentiment carried over into early 2012 as investors felt some relief from the world’s financial woes. Volatility abated and risk assets (including stocks, commodities and high yield bonds) moved boldly higher through the first two months of 2012, while climbing Treasury yields pressured higher-quality fixed income assets.
Markets reversed course in the spring when Europe’s debt problems boiled over once again. High levels of volatility returned as political instability in Greece threatened the country’s membership in the eurozone. Spain faced severe deficit issues while the nation’s banks clamored for liquidity. Yields on Spanish and Italian government debt rose to levels deemed unsustainable. European leaders conferred and debated vehemently over the need for fiscal integration among the 17 nations comprising the euro currency bloc as a means to resolve the crisis for the long term.
Alongside the drama in Europe, investors were discouraged by gloomy economic reports from various parts of the world. A slowdown in China, a key powerhouse for global growth, became particularly worrisome. In the United States, disappointing jobs reports dealt a crushing blow to investor sentiment. Risk assets sold off in the second quarter as investors again retreated to safe haven assets.
Despite ongoing concerns about the health of the global economy and the debt crisis in Europe, most asset classes enjoyed a robust summer rally powered mainly by expectations for policy stimulus from central banks in Europe and the United States. Although global economic data continued to be mixed, the spate of downside surprises seen in the second quarter had receded and, outside of Europe, the risk of recession largely subsided. Additionally, in response to growing debt pressures, the European Central Bank allayed investors’ fears by stating its conviction to hold the eurozone together. Early in September, the European Central Bank announced a plan to purchase sovereign debt in the eurozone’s most troubled nations. Later that month, the US Federal Reserve announced its long-awaited - and surprisingly aggressive – stimulus program, committing to purchase $40 billion of agency mortgage-backed securities per month until the US economy exhibits enough strength to sustain real growth and improving labor market conditions. These central bank actions boosted risk assets globally as investors increased their risk appetites in their search for higher returns.
All asset classes performed well for the 12-month period ended September 30, 2012, with particularly strong returns from US stocks and high yield bonds. For the six-month period ended September 30, 2012, fixed income investments outperformed equities. US Treasury bonds posted exceptional gains by historical standards and outperformed investment-grade corporate bonds and tax-exempt municipals. High yield bonds also generated solid returns. US stocks finished the six-month period with modest gains, while international and emerging market stocks lagged other asset classes amid ongoing uncertainty. Near-zero short term interest rates continued to keep yields on money market securities near their all-time lows.
The financial world is more uncertain than ever, but there are new avenues of opportunity – new ways to invest and new markets in which to invest. We believe it’s our responsibility to help investors adapt to today’s new world of investing and build the portfolios these times require. We encourage you to visit www.blackrock.com/newworld for more information.
Sincerely,

Rob Kapito
President, BlackRock Advisors, LLC

“The financial world is more uncertain than ever, but there are new avenues of opportunity.”
Rob Kapito
President, BlackRock Advisors, LLC
Total Returns as of September 30, 2012
| | | | | | | | | | | | | | | | |
| | | | | 6-month | | | | 12-month | | |
US large cap equities (S&P 500® Index) | | | | | | 3.43 | % | | | | | | 30.20 | % | | |
US small cap equities (Russell 2000® Index) | | | | | | 1.60 | | | | | | | 31.91 | | | |
International equities (MSCI Europe, Australasia, Far East Index) | | | | | | (0.70 | ) | | | | | | 13.75 | | | |
Emerging market equities (MSCI Emerging Markets Index) | | | | | | (1.84 | ) | | | | | | 16.93 | | | |
3-month Treasury bill (BofA Merrill Lynch 3-Month US Treasury Bill Index) | | | | | | 0.06 | | | | | | | 0.07 | | | |
US Treasury securities (BofA Merrill Lynch 10- Year US Treasury Index) | | | | | | 6.78 | | | | | | | 5.66 | | | |
US investment grade bonds (Barclays US Aggregate Bond Index) | | | | | | 3.68 | | | | | | | 5.16 | | | |
Tax-exempt municipal bonds (S&P Municipal Bond Index) | | | | | | 4.50 | | | | | | | 8.84 | | | |
US high yield bonds (Barclays US Corporate High Yield 2% Issuer Capped Index) | | | | | | 6.40 | | | | | | | 19.35 | | | |
HFRI Fund of Funds Composite Index | | | | | | 0.05 | | | | | | | 2.93 | | | |
Past performance is no guarantee of future results. Index performance is shown for illustrative purposes only. You cannot invest directly in an index.
| | | | | | |
| | | | | | | |
| | THIS PAGE NOT PART OF YOUR FUND REPORT | | | | 3 |
| | |
| | |
Fund Summary as of September 30, 2012 | | |
BlackRock Preferred Partners LLC’s (the “Fund”) investment objective is to seek total return. Over an investment cycle, the Fund expects to achieve net returns commensurate with the long-term return on equities with less volatility and a relatively low degree of correlation to the equity markets. The Fund seeks to achieve its investment objective by investing directly or indirectly in private funds or other pooled investment vehicles or accounts organized outside the United States (“Portfolio Funds”) generally believed not to be highly correlated with the Standard & Poor’s 500 Index over a long-term horizon. The Fund may also invest directly in securities (other than those of Portfolio Funds) or other financial instruments.
No assurance can be given that the Fund’s investment objective will be achieved.
|
Portfolio Management Commentary |
How did the Fund perform?
| — | | For the six-month period ended September 30, 2012, the Fund returned 1.38% based on net asset value. For the same period, the return on the Fund’s benchmark, the HFRI Fund of Funds Composite Index was 0.05%. |
Underlying Fund Strategies
| | — | | The Fund invests in a portfolio of hedge funds as a means to gain exposure to various types of investment strategies in five major categories including fundamental long/short, relative value, event-driven, directional trading and direct sourcing strategies. |
| | — | | Fundamental long/short strategies involve buying or selling predominantly corporate securities believed to be over- or under-priced relative to their potential value. Investment strategies in this category include long and short equity- or credit-based strategies, which emphasize a fundamental valuation framework, and equity active value strategies, where an active role is taken to enhance corporate value. |
| | — | | Relative value strategies seek to profit from the mispricing of financial instruments relative to each other or historical norms. These strategies utilize quantitative and qualitative analyses to identify securities or spreads between securities that deviate from their theoretical fair value and/or historical norms. |
| | — | | Event-driven strategies concentrate on companies that are subject to corporate events such as mergers, acquisitions, restructurings, spinoffs, shareholder activism or other special situations that alter a company’s financial structure or operating strategy. The intended goal of these strategies is to profit when the price of a security changes to reflect more accurately the likelihood and potential impact of the occurrence, or non-occurrence, of the event. |
| | — | | Directional trading seeks to profit in changes from macro-level exposures, such as broad securities markets, interest rates, exchange rates and commodities. Examples include global macro strategies that express macroeconomic views based on analysis of fundamental factors and managed futures strategies, which select futures instruments based typically on systematic technical analysis. |
| | — | | Direct sourcing strategies seek to garner profits from areas of the market that are underserved by traditional financial institutions by entering into direct transactions to provide financing to institutions or individuals. Typically, these strategies rely on a manager’s ability to source or access privately structured deals as well as fundamental research specific to each respective deal. |
What factors influenced performance?
| — | | The largest contribution to positive performance during the period came from the Fund’s exposure to fundamental long/short strategies which garnered profits due to mispriced equity and credit securities. Also having a positive impact was exposure to a number of event-driven strategies that benefited from increased corporate activity, such as reorganizations, post-reorganizational activity, mergers and bankruptcies. |
| — | | Detracting from performance was the Fund’s exposure to directional trading strategies, which struggled as markets rallied and retreated in broad strokes, creating a difficult environment for following short- and
long-term trends. |
Describe recent portfolio activity.
| — | | During the period, the Fund added positions in Peak6 Performance Fund Ltd., which seeks to profit from inefficiencies in the options market, and Myriad Opportunities Offshore Fund Limited, a multi-strategy fund seeking convertible arbitrage, long/short equity and credit and event-driven opportunities with a focus in Asian markets. Near the end of the period, the Fund fully redeemed its shares of Taconic Opportunity Offshore Fund. Elsewhere in the portfolio, changes in position sizes resulted from the allocation of new cash inflows from Fund subscriptions. In the aggregate, the Fund’s position changes over the period resulted in decreased exposure to fundamental long/short, event-driven and directional trading strategies, increased exposure to relative value strategies and the introduction of hedge funds that pursue direct sourcing strategies as a component of their overall investment program. |
Describe portfolio positioning at period end.
| — | | At period end, the Fund held broad exposure across a spectrum of different hedge fund strategies. For purposes of financial reporting, the hedge funds in which the Fund invests are categorized based on their largest underlying strategy exposure. In this regard, the categories of investment strategies as a percentage of the Fund’s long term investments are: fundamental long/short 52%, event driven 24%, relative value 12% and directional trading 12%. However, notwithstanding their categorization for financial reporting purposes, many of these hedge funds provide additional exposure to multiple types of underlying strategies. Based on such underlying strategy exposures, the Fund held 51% of its investments in fundamental long/short strategies (24% focused on equity markets and 27% focused on credit markets), 19% in relative value strategies, 17% in event-driven strategies, 10% in directional trading strategies and 3% in direct sourcing strategies. |
The views expressed reflect the opinions of BlackRock as of the date of this report and are subject to change based on changes in market, economic or other conditions. These views are not intended to be a forecast of future events and are no guarantee of future results.
| | | | | | |
| | | | | | | |
| 4 | | BLACKROCK PREFERRED PARTNERS LLC | | SEPTEMBER 30, 2012 | | |
| | |
| | |
Fund Summary as of September 30, 2012 | | |
|
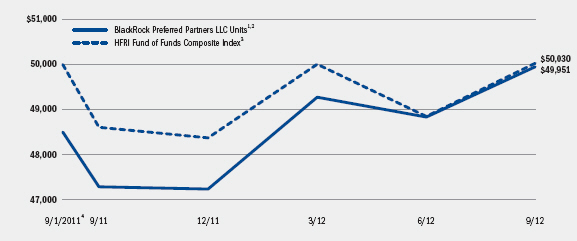
Total Return Based on a $50,000 Investment |
| | |
| | 
|
| |
| | 1 Assuming maximum sales charges, if any, transaction costs and other operating expenses, including investment advisory fees. |
| |
| | 2 Under normal market conditions, the Fund will invest, in varying proportions, across a number of portfolio strategies, including but not limited to hedge fund strategies and cash strategies. The Fund may also invest directly in securities (other than those of Portfolio Funds) or other financial instruments selected by the Advisors. |
| |
| | 3 This index represents funds of hedge funds that invest with multiple hedge fund managers focused on absolute return strategies. This equal-weighted index includes funds of hedge funds tracked by Hedge Fund Research Inc. and is revised several times each month to reflect updated hedge fund return information. For performance presented as of any given month, estimated values of underlying funds are used to build the index until valuations are finalized (generally on a 5-month lag although the time period may vary). This index is a proxy for the performance of the universe of funds of hedge funds focused on absolute return strategies. Returns are net of fees. |
| |
| | 4 Commencement of operations. |
|
Performance Summary for the Period Ended September 30, 2012 |
| | | | | | | | | | | | | | | | | | | | | | | | | |
| | | | | Average Annual Total Returns5 |
| | | | | 1 Year | | Since Inception6 |
| | | 6-Month
Total Returns | | w/o sales
charge | | w/sales
charge | | w/o sales
charge | | w/sales
charge |
BlackRock Preferred Partners LLC Units | | | | 1.38 | % | | | | 5.64 | % | | | | 2.47 | % | | | | 2.78 | % | | | | (0.08 | )% |
HFRI Fund of Funds Composite Index | | | | 0.05 | | | | | 2.93 | | | | | N/A | | | | | 0.06 | | | | | N/A | |
| | 5 | Assuming maximum sales charges, if any. Average annual total returns with and without sales charges reflect reductions for distribution fees. |
| | 6 | The Fund commenced operations on September 1, 2011. |
N/A - Not applicable as index does not have a sales charge.
Past performance is not indicative of future results.
BlackRock Preferred Partners LLC Units incur a maximum initial sales charge of 3.00%, an annual distribution fee of 0.75% and an annual management fee of 0.75%.
Performance information reflects past performance and does not guarantee future results. Current performance may be lower or higher than the performance data quoted. Performance results do not reflect the deduction of taxes that a Member would pay on Fund distributions or the repurchase of Fund Units. The Fund charges a 2% early repurchase fee for Members who tender their Units in connection with a tender offer with a valuation date that is prior to the business day immediately preceding the one-year anniversary of the Member’s purchase of the respective
Units. Performance data does not reflect this potential fee. Figures shown in the performance table assume reinvestment of all dividends and distributions, if any, at net asset value on the payable date. Investment return and the principal value of Units will fluctuate so that Units, when and if repurchased pursuant to a tender offer, if any, may be worth more or less than their original cost.
The Fund’s investment advisor waived and/or reimbursed a portion of the Fund’s expenses during the periods described above. Without such waiver and/or reimbursement, the Fund’s performance would have been lower.
| | | | | | |
| | | | | | | |
| | BLACKROCK PREFERRED PARTNERS LLC | | SEPTEMBER 30, 2012 | | 5 |
| | |
| | |
Fund Summary as of September 30, 2012 | | |
The following charts show the ten largest holdings and investment strategies as a percentage of the Fund’s total investments:
| | | | | |
| Portfolio Holdings | | 9/30/12 |
One William Street Capital Offshore Fund, Ltd | | 8% |
Claren Road Credit Fund, Ltd | | 8 |
D.E. Shaw Oculus International Fund | | 7 |
Magnetar Capital Fund II, Ltd | | 7 |
Pentwater Event Fund, Ltd | | 7 |
Scout Capital Fund, Ltd | | 6 |
Peak6 Performance Fund, Ltd | | 5 |
Myriad Opportunities Offshore Fund, Ltd | | 5 |
HBK Offshore Fund II LP | | 4 |
Aristeia International, Ltd | | 4 |
| | |
| Investment Strategies | | 9/30/12 |
Fundamental Long/Short. | | 52% |
Event Driven | | 24 |
Relative Value | | 12 |
Directional Trading | | 12 |
The table below summarizes the changes in the Fund’s monthly net asset value per Unit:
| | | | | | | | | | |
| | | 9/30/12 | | 3/31/12 | | Change | | High | | Low |
Net Asset Value | | $10.30 | | $10.16 | | 1.38% | | $10.30 | | $10.05 |
|
Disclosure of Expenses for Continuously Offered Closed-End Funds |
Members of the Fund may incur the following charges: (a) expenses related to transactions, including sales charges and early withdrawal fees; and (b) operating expenses, including advisory fees, distribution fees, and other Fund expenses. The expense example shown below (which is based on a hypothetical investment of $1,000 invested on April 1, 2012 and held through September 30, 2012) is intended to assist members both in calculating operating expenses based on an investment in the Fund and in comparing these operating expenses with similar costs of investing in other funds.
The table provides information about actual account values and actual expenses. In order to estimate the expenses a member paid during the period covered by this report, members can divide their account value by $1,000 and then multiply the result by the number under the heading entitled “Expenses Paid During the Period.”
The table also provides information about hypothetical account values and hypothetical expenses based on the Fund’s actual expense ratio and an assumed rate of return of 5% per year before expenses, which is not the Fund’s actual return. The hypothetical account values and expenses may not be used to estimate the actual ending account balance or expenses you paid for the period. In order to assist members in comparing the ongoing expenses of investing in the Fund and other funds, compare the 5% hypothetical example with the 5% hypothetical examples that appear in other funds’ member reports.
The expenses shown in the table are intended to highlight members’ ongoing costs only and do not reflect any transactional expenses, such as sales charges or early withdrawal fees. Therefore, the hypothetical examples are useful in comparing ongoing expenses only, and will not help members determine the relative total expenses of owning different funds. If these transactional expenses were included, member expenses would have been higher.
| | | | | | | | | | | | | | |
| | | Actual | | Hypothetical2 | | |
| | | Beginning
Account Value
April 1, 2012 | | Ending
Account Value
September 30, 2012 | | Expenses Paid
During the Period1 | | Beginning
Account Value
April 1, 2012 | | Ending
Account Value
September 30, 2012 | | Expenses Paid
During the Period1 | | Annualized
Expense
Ratio |
BlackRock Preferred | | | | | | | | | | | | | | |
Partners LLC | | $1,000.00 | | $1,013.80 | | $10.07 | | $1,000.00 | | $1,015.00 | | $10.08 | | 2.00% |
| | 1 | Expenses are equal to the annualized expense ratio, multiplied by the average account value over the period, multiplied by 183/365 (to reflect the one-half year period shown). Annualized expense ratio does not include expenses incurred indirectly as a result of investments in Portfolio Funds. |
| | 2 | Hypothetical 5% annual return before expenses is calculated by pro rating the number of days in the most recent fiscal half year divided by 365. |
| | | | | | |
| | | | | | | |
| 6 | | BLACKROCK PREFERRED PARTNERS LLC | | SEPTEMBER 30, 2012 | | |
| | |
| | |
Schedule of Investments September 30, 2012 (Unaudited) | | (Percentages shown are based on Members’ Capital) |
| | | | | | |
| Portfolio Funds | | | | Value | |
Directional Trading – 11.0% | | | | | | |
D.E. Shaw Oculus International Fund, Liquidity Class | | | | $ | 2,937,983 | |
Fortress Asia Macro Fund Ltd., Class A: | | | | | | |
Series 04-2012 | | | | | 1,249,609 | |
Series 06-2012 | | | | | 469,933 | |
| | | | | | |
| | | | | 4,657,525 | |
| |
| | | | | | |
| | | | | | |
Event Driven – 22.3% | | | | | | |
Davidson Kempner International (BVI), Ltd., Class C, Tranche 3, Series 01-2012 | | | | | 1,389,535 | |
HBK Offshore Fund II LP, Class A, Sub-Class A1 | | | | | 1,761,444 | |
Peak6 Performance Fund, Ltd., Class A-NV-U: | | | | | | |
Series 04-2012 | | | | | 1,361,250 | |
Series 05-2012 | | | | | 292,125 | |
Series 08-2012 | | | | | 218,160 | |
Pentwater Event Fund, Ltd., Class F-NV-U: | | | | | | |
Initial Series | | | | | 1,645,832 | |
Series 02-2012 | | | | | 116,688 | |
Series 03-2012 | | | | | 555,111 | |
Series 04-2012 | | | | | 108,299 | |
Series 05-2012 | | | | | 105,067 | |
Series 06-2012 | | | | | 132,851 | |
York Investment, Ltd., Class D: | | | | | | |
Series 09-2011 | | | | | 1,095,330 | |
Series 05-2012 | | | | | 249,643 | |
Series 06-2012 | | | | | 359,755 | |
| | | | | | |
| | | | | 9,391,090 | |
| |
| | | | | | |
| | | | | | |
Fundamental Long/Short – 49.2% | | | | | | |
BG Fund, Class B | | | | | 1,554,872 | |
Brigade Leveraged Capital Structures Offshore, Ltd.: | | | | | | |
Series 09-2011 NV | | | | | 1,093,805 | |
Series 02-2012 NV | | | | | 103,219 | |
Series 03-2012 NV | | | | | 257,280 | |
Series 06-2012 NV | | | | | 253,866 | |
Claren Road Credit Fund, Ltd., Class A: | | | | | | |
Series 32 | | | | | 1,041,961 | |
Series 69 | | | | | 171,872 | |
Series 70 | | | | | 646,832 | |
Series 71 | | | | | 476,279 | |
Series 72 | | | | | 301,535 | |
Series 73 | | | | | 199,795 | |
Series 74 | | | | | 146,999 | |
Series 76 | | | | | 196,976 | |
Conatus Capital Overseas Ltd., Class A, Sub-Class 1: | | | | | | |
Series 09-2011 | | | | | 1,110,950 | |
Series 06-2012 | | | | | 258,518 | |
Glenview Capital Partners (Cayman), Ltd., Series G/84 | | | | | 1,298,054 | |
King Street Capital, Ltd., Class A Series 03 | | | | | 798,205 | |
Myriad Opportunities Offshore Fund, Ltd., Class B: | | | | | | |
Series 40 | | | | | 1,072,931 | |
Series 40A | | | | | 610,457 | |
Series 40B | | | | | 152,114 | |
| | | | | | |
| Portfolio Funds | | | | Value | |
Fundamental Long/Short (concluded) | | | | | | |
Oak Hill Credit Alpha Fund (Offshore), Ltd., Class A, Series 09-2011 | | | | $ | 1,066,478 | |
One William Street Capital Offshore Fund, Ltd., Class CC: | |
Series 09-2011-AA | | | | | 1,882,410 | |
Series 02-2012 | | | | | 112,243 | |
Series 03-2012 | | | | | 607,238 | |
Series 04-2012 | | | | | 217,933 | |
Series 06-2012 | | | | | 268,328 | |
Series 08-2012 | | | | | 261,007 | |
Scout Capital Fund, Ltd., Class B: | | | | | | |
Series NV-3 | | | | | 1,471,011 | |
Series NV-10 | | | | | 717,587 | |
Standard Pacific Capital Offshore, Ltd., Class B,
Series B-1 | | | | | 1,386,652 | |
Standard Pacific Pan-Asia Fund, Ltd., Series A: | | | | | | |
Sub-Series 02-2011 | | | | | 856,766 | |
Sub-Series 04-2012 | | | | | 152,157 | |
| | | | | | |
| | | | | 20,746,330 | |
| |
| | | | | | |
| | | | | | |
Relative Value – 11.1% | | | | | | |
Aristeia International, Ltd., Class A: | | | | | | |
Series A-NV | | | | | 1,188,160 | |
Series 05-2012 | | | | | 304,882 | |
Series 06-2012 | | | | | 256,685 | |
Magnetar Capital Fund II, Ltd., Class A: | | | | | | |
Series 25 | | | | | 1,860,057 | |
Series 47 | | | | | 329,402 | |
Series 50 | | | | | 107,231 | |
Series 52 | | | | | 210,673 | |
Series 58 | | | | | 261,741 | |
Series 62 | | | | | 156,146 | |
| | | | | | |
| | | | | 4,674,977 | |
| |
Total Investments (Cost $37,485,691) – 93.6% | | | | | 39,469,922 | |
Other Assets Less Liabilities – 6.4% | | | | | 2,714,870 | |
| | | | | | |
Members’ Capital – 100.0% | | | | $ | 42,184,792 | |
| | | | | | |
| | | | | | |
See Notes to Financial Statements. |
| | | | | | | |
| | BLACKROCK PREFERRED PARTNERS LLC | | SEPTEMBER 30, 2012 | | 7 |
| | |
| | |
Schedule of Investments (continued) | | |
| — | | Fair Value Measurements – Various inputs are used in determining the fair value of investments. These inputs to valuation techniques are categorized into a disclosure hierarchy consisting of three broad levels for financial statement purposes as follows: |
| | — | | Level 1 – unadjusted price quotations in active markets/exchanges for identical assets and liabilities that the Fund has the ability to access; |
| | — | | Level 2 – other observable inputs (including, but not limited to: quoted prices for similar assets or liabilities in markets that are active, quoted prices for identical or similar assets or liabilities in markets that are not active, inputs other than quoted prices that are observable for the assets or liabilities (such as interest rates, yield curves, volatilities, prepayment speeds, loss severities, credit risks and default rates) or other market–corroborated inputs). If the reporting entity has the ability to redeem its investment with the Portfolio Funds at the net asset value per share (or its equivalent) at the measurement date or within the near term and there are no other liquidity restrictions, the Fund’s investment in the Portfolio Fund will be considered Level 2. |
| | — | | Level 3 – unobservable inputs based on the best information available in the circumstances, to the extent observable inputs are not available (including the Fund’s own assumptions used in determining the fair value of investments). Investments in Portfolio Funds that are currently subject to liquidity restrictions that will not be lifted in the near term will be considered Level 3. |
The hierarchy gives the highest priority to unadjusted quoted prices in active markets for identical assets or liabilities (Level 1 measurements) and the lowest priority to unobservable inputs (Level 3 measurements). Accordingly, the degree of judgment exercised in determining fair value is greatest for instruments categorized in Level 3.
The Fund’s investments in Portfolio Funds not otherwise traded on an active exchange are classified within Level 2 or Level 3 of the fair value hierarchy as the value of these interests are primarily based on the respective net asset value reported by management of each Portfolio Fund rather than actual market transactions and other observable market data. The determination of whether such investment will be classified in Level 2 or Level 3 will be based upon the ability to redeem such investment within a reasonable period of time (within 90 days of the period end and any other month-end). If an investment in a Portfolio Fund may be redeemed within 90 days of the period end and any other month-end, and the fair value of the investment is based on information provided by management of the Portfolio Funds, it is classified as Level 2; in all other cases it is classified as Level 3. Changes in redemption features may result in transfers into or out of an assigned level within the disclosure hierarchy. The categorization of a value determined for investments is based on the pricing transparency of the investment and is not necessarily an indication of the risks associated with investing in those securities. For information about the Fund’s policy regarding valuation of investments and other significant accounting policies, please refer to Note 1 of the Notes to Financial Statements.
The following table summarizes the Fund’s investments categorized in the disclosure hierarchy as of September 30, 2012:
| | | | | | | | | | | | | | | | |
| |
| | | Level 1 | | | Level 2 | | | Level 3 | | | Total | |
| |
Assets: | | | | | | | | | | | | | | | | |
Investments: | | | | | | | | | | | | | | | | |
Portfolio Funds:1 | | | | | | | | | | | | | | | | |
Directional Trading | | | – | | | $ | 1,719,542 | | | $ | 2,937,983 | | | $ | 4,657,525 | |
Event Driven | | | – | | | | 3,094,263 | | | | 6,296,827 | | | | 9,391,090 | |
Fundamental Long/Short | | | – | | | | 2,621,350 | | | | 18,124,980 | | | | 20,746,330 | |
Relative Value | | | – | | | | 1,749,727 | | | | 2,925,250 | | | | 4,674,977 | |
| |
Total | | | – | | | $ | 9,184,882 | | | $ | 30,285,040 | | | $ | 39,469,922 | |
| | | | |
| 1 | In determining the classification of investments in Portfolio Funds included in the table above, no consideration was given to the classification of securities held by each underlying Portfolio Fund. |
Certain of the Fund’s assets are held at carrying amount, which approximates fair value for financial statement purposes. As of September 30, 2012, cash of $1,882,558 is categorized as Level 1 within the disclosure hierarchy.
There were no transfers between Level 1 and Level 2 during the six months ended September 30, 2012.
| | | | | | |
See Notes to Financial Statements. |
| | | | | | | |
| 8 | | BLACKROCK PREFERRED PARTNERS LLC | | SEPTEMBER 30, 2012 | | |
| | |
| | |
Schedule of Investments (concluded) | | |
A reconciliation of Level 3 investments is presented when the Fund had a significant amount of Level 3 investments at the beginning and/or end of the period in relation to members’ capital. The following table is a reconciliation of Level 3 investments:
| | | | | | | | | | | | | | | | | | | | |
| |
| Assets: | | Directional
Trading | | | Event
Driven | | | Fundamental Long/ Short | | | Relative Value | | | Total | |
| |
Opening
Balance,
as of March 31, 2012 | | $ | 2,179,127 | | | $ | 3,594,243 | | | $ | 14,586,656 | | | $ | 2,403,103 | | | $ | 22,763,129 | |
Transfers
into
Level 3 | | | – | | | | – | | | | – | | | | – | | | | – | |
Transfers
out of
Level 31 | | | – | | | | – | | | | (1,037,925 | ) | | | – | | | | (1,037,925 | ) |
Accrued
discounts/
premiums | | | – | | | | – | | | | – | | | | – | | | | – | |
Net realized
gain
(loss) | | | – | | | | – | | | | 70,801 | | | | – | | | | 70,801 | |
Net change
in
unrealized appreciation/
depreciation2 | | | 108,856 | | | | 202,584 | | | | 376,249 | | | | 122,147 | | | | 809,836 | |
Purchases | | | 650,000 | | | | 2,500,000 | | | | 5,450,000 | | | | 400,000 | | | | 9,000,000 | |
Sales | | | – | | | | – | | | | (1,320,801 | ) | | | – | | | | (1,320,801 | ) |
| | | | |
Closing Balance,
as of September 30, 2012 | | $ | 2,937,983 | | | $ | 6,296,827 | | | $ | 18,124,980 | | | $ | 2,925,250 | | | $ | 30,285,040 | |
| | | | |
| | 1 | As of March 31, 2012, certain investments were subject to liquidity restrictions that would not be lifted in the near term. As of September 30, 2012, these liquidity restrictions were lifted for these investments. As a result, as of September 30, 2012, investments with a beginning of period value of $1,037,925 transferred from Level 3 to Level 2 in the disclosure hierarchy. |
| | 2 | Included in the related net change in unrealized appreciation/depreciation in the Statement of Operations. The change in unrealized appreciation/depreciation on investments still held as of September 30, 2012 was $850,601. |
| | | | | | |
See Notes to Financial Statements. |
| | | | | | | |
| | BLACKROCK PREFERRED PARTNERS LLC | | SEPTEMBER 30, 2012 | | 9 |
| | |
| | |
Statement of Assets, Liabilities and Members’ Capital | | |
| | | | |
| September 30, 2012 (Unaudited) | | | |
Assets | | | | |
Investments in Portfolio Funds at value (cost – $37,485,691) | | $ | 39,469,922 | |
Cash | | | 1,882,558 | |
Redemptions receivable | | | 1,557,742 | |
Receivable from advisor | | | 140,299 | |
Prepaid expenses | | | 81 | |
| | | | |
Total assets | | | 43,050,602 | |
| | | | |
| | | | |
Liabilities | | | | |
Capital contributions received in advance | | | 700,000 | |
Advisory fees payable | | | 77,462 | |
Distribution fees payable | | | 77,462 | |
Officer’s and Directors’ fees payable | | | 2,440 | |
Other accrued expenses payable | | | 8,446 | |
| | | | |
Total liabilities | | | 865,810 | |
| | | | |
Members’ Capital | | $ | 42,184,792 | |
| | | | |
| | | | |
Members’ Capital Consists of | | | | |
Paid-in capital | | $ | 40,923,700 | |
Accumulated net investment loss | | | (544,782 | ) |
Undistributed net realized loss | | | (178,357 | ) |
Net unrealized appreciation/depreciation | | | 1,984,231 | |
| | | | |
Members’ Capital | | $ | 42,184,792 | |
| | | | |
| | | | |
Net Asset Value | | | | |
Based on members’ capital of $42,184,792 and 4,095,445 units outstanding | | $ | 10.30 | |
| | | | |
See Notes to Financial Statements.
| | | | | | |
| | | | | | | |
| 10 | | BLACKROCK PREFERRED PARTNERS LLC | | SEPTEMBER 30, 2012 | | |
| | | | |
| Six Months Ended September 30, 2012 (Unaudited) | | | |
Investment Income | | | | |
Dividends | | $ | 1,301 | |
| | | | |
| | | | |
Expenses | | | | |
Investment advisory | | | 145,928 | |
Distribution | | | 145,928 | |
Offering costs | | | 193,625 | |
Professional | | | 130,000 | |
Administration | | | 34,644 | |
Printing | | | 10,000 | |
Officer and Directors | | | 2,500 | |
Miscellaneous | | | 21,871 | |
| | | | |
Total expenses | | | 684,496 | |
Less expenses reimbursed by advisor | | | (300,412 | ) |
| | | | |
Total expenses after fees waived and reimbursed | | | 384,084 | |
| | | | |
Net investment loss | | | (382,783 | ) |
| | | | |
| | | | |
Realized and Unrealized Gain (Loss) | | | | |
Net realized loss from investments | | | (178,357 | ) |
Net change in unrealized appreciation/depreciation on investments | | | 1,169,213 | |
| | | | |
Total realized and unrealized gain | | | 990,856 | |
| | | | |
Net Increase in Members’ Capital Resulting from Operations | | $ | 608,073 | |
| | | | |
See Notes to Financial Statements.
| | | | | | |
| | | | | | | |
| | BLACKROCK PREFERRED PARTNERS LLC | | SEPTEMBER 30, 2012 | | 11 |
| | |
| | |
Statements of Changes in Members’ Capital | | |
| | | | | | | | |
| Increase (Decrease) in Members’ Capital: | | Six Months Ended
September 30, 2012
(Unaudited) | | | Period
September 1,
20111 to
March 31, 2012 | |
Operations | | | | | | | | |
Net investment loss | | $ | (382,783 | ) | | $ | (303,670 | ) |
Net realized gain (loss) | | | (178,357 | ) | | | 38,371 | |
Net change in unrealized appreciation/depreciation | | | 1,169,213 | | | | 815,018 | |
| | | | |
Net increase in members’ capital resulting from operations | | | 608,073 | | | | 549,719 | |
| | | | |
| | | | | | | | |
Capital Transactions | | | | | | | | |
Proceeds from the issuance of units (excluding capital contributions received in advance) | | | 10,507,000 | | | | 30,520,000 | |
| | | | |
| | | | | | | | |
Members’ Capital | | | | | | | | |
Total increase in members’ capital | | | 11,115,073 | | | | 31,069,719 | |
Beginning of period | | | 31,069,719 | | | | – | |
| | | | |
End of period | | $ | 42,184,792 | | | $ | 31,069,719 | |
| | | | |
Accumulated net investment loss | | $ | (544,782 | ) | | $ | (161,999 | ) |
| | | | |
| 1 | Commencement of operations. Reflects activity prior to September 1, 2011, related to the initial seeding of the Fund. |
See Notes to Financial Statements.
| | | | | | |
| | | | | | | |
| 12 | | BLACKROCK PREFERRED PARTNERS LLC | | SEPTEMBER 30, 2012 | | |
| | | | |
Six Months Ended September 30, 2012 (Unaudited) | | | | |
Cash Provided by (Used for) Operating Activities | | | | |
Net increase in members’ capital resulting from operations | | $ | 608,073 | |
Adjustments to reconcile net increase in members’ capital resulting from operations to net cash provided by (used for) operating activities: | | | | |
Decrease in investments in Portfolio Funds paid in advance | | | 3,600,000 | |
Increase in redemptions receivable | | | (459,371 | ) |
Decrease in receivable from advisor | | | 149,310 | |
Decrease in prepaid expenses | | | 450 | |
Decrease in offering costs payable | | | (32,281 | ) |
Increase in distribution fees payable | | | 58,019 | |
Increase in officer’s and directors’ fees payable | | | 1,063 | |
Decrease in other accrued expenses payable | | | (145,815 | ) |
Net realized loss from investments | | | 178,357 | |
Net change in unrealized appreciation/depreciation on investments | | | (1,169,213 | ) |
Purchases of long-term investments | | | (12,727,711 | ) |
Proceeds from sales of long-term investments | | | 3,303,663 | |
| | | | |
Cash provided by (used for) operating activities | | | (6,635,456 | ) |
| | | | |
| | | | |
Cash Provided by (Used for) Financing Activities | | | | |
Cash receipts from issuance of units (excluding capital contributions received in advance) | | | 6,672,000 | |
Capital contributions received in advance | | | 700,000 | |
Cash receipts for offering costs | | | 193,625 | |
| | | | |
Cash provided by (used for) financing activities | | | 7,565,625 | |
| | | | |
| | | | |
Cash | | | | |
Net increase in cash | | | 930,169 | |
Cash at beginning of period | | | 952,389 | |
| | | | |
Cash at end of period | | $ | 1,882,558 | |
| | | | |
| | | | | | |
See Notes to Financial Statements. |
| | | | | | | |
| | BLACKROCK PREFERRED PARTNERS LLC | | SEPTEMBER 30, 2012 | | 13 |
| | | | | | | | |
| | | Six Months Ended September 30, 2012 (Unaudited) | | | Period September 1, 20111 to March 31, 2012 | |
Per Unit Operating Performance | | | | | | | | |
Net asset value, beginning of period | | $ | 10.16 | | | $ | 10.00 | 2 |
Net investment loss3 | | | (0.10 | ) | | | (0.11 | ) |
Net realized and unrealized gain | | | 0.24 | | | | 0.27 | �� |
Net increase from investment operations | | | 0.14 | | | | 0.16 | |
Net asset value, end of period | | $ | 10.30 | | | $ | 10.16 | |
| | | | | | | | |
Total Investment Return4 | | | | | | | | |
Based on net asset value | | | 1.38 | %5 | | | 1.60 | %5 |
| | | | | | | | |
Ratios to Average Members’ Capital | | | | | | | | |
Total expenses | | | 3.53 | %6,7 | | | 5.84 | %6,7,8 |
Total expenses after fees waived and reimbursed | | | 2.00 | %6,7 | | | 2.00 | %6,7 |
Net investment loss | | | (2.00 | )%6,7 | | | (2.00 | )%6,7 |
| | | | | | | | |
Supplemental Data | | | | | | | | |
Members’ capital, end of period (000) | | $ | 42,185 | | | $ | 31,070 | |
Portfolio turnover | | | 9 | % | | | 4 | % |
| | | | | | | | |
| | 1 | Commencement of operations. Reflects activity prior to September 1, 2011, related to the initial seeding of the Fund. This information includes the initial investment by BlackRock HoldCo 2, Inc., a wholly owned subsidiary of BlackRock, Inc. |
| | 2 | Net asset value, beginning of period, reflects a deduction of $0.30 per unit sales charges from initial offering price of $10.30 per unit. |
| | 3 | Based on average units outstanding. |
| | 4 | Where applicable, total investment returns exclude the effects of any sales charges and include the reinvestment of dividends and distributions. The Fund is a continuously offered closed-end fund, the units of which are offered at net asset value. No secondary market for the Fund’s units exists. |
| | 5 | Aggregate total investment return. |
| | 6 | Ratios do not include expenses incurred indirectly as a result of investments in Portfolio Funds of approximately 5.53% for the six months ended September 30, 2012 and 6.07% for the period September 1, 2011 to March 31, 2012. |
| | 8 | Organization expenses were not annualized in the calculation of expense ratios. If these ratios were annualized, the total expenses would have been 6.63%. |
| | | | | | |
See Notes to Financial Statements. |
| | | | | | | |
| 14 | | BLACKROCK PREFERRED PARTNERS LLC | | SEPTEMBER 30, 2012 | | |
| | |
| | |
Notes to Financial Statements | | |
1. Organization and Significant Accounting Policies:
BlackRock Preferred Partners LLC (the “Fund”) is registered under the Investment Company Act of 1940, as amended (the “1940 Act”) as a continuously offered, non diversified, closed-end management investment company. The Fund is organized as a Delaware limited liability company. The Fund’s financial statements are prepared in conformity with accounting principles generally accepted in the United States of America (“US GAAP”), which may require management to make estimates and assumptions that affect the reported amounts and disclosures in the financial statements. Actual results may differ from those estimates. The Fund continuously offers one class of limited liability company interests (“Units”), which may be sold to certain eligible investors with a front-end sales charge of up to 3.00%.
Prior to commencement of operations on September 1, 2011, the Fund had no operations other than those relating to organizational matters and the sale of 10,000 Units on August 15, 2011 to BlackRock HoldCo 2, Inc., a wholly owned subsidiary of BlackRock, Inc. (“BlackRock”) for $100,000.
The following is a summary of significant accounting policies followed by the Fund:
Valuation of Portfolio Funds: US GAAP defines fair value as the price the Fund would receive to sell an asset or pay to transfer a liability in an orderly transaction between market participants at the measurement date. The Fund will invest in Portfolio Funds selected by and unaffiliated with BlackRock Advisors, LLC (the “Advisor”), an indirect wholly owned subsidiary of BlackRock. Managers of Portfolio Funds or their respective administrators typically provide unaudited Portfolio Fund valuations monthly. It is anticipated that these unaudited values will be prepared in accordance with US GAAP and will, in effect, be the fair value of each Portfolio Fund’s assets less such Portfolio Fund’s liabilities (the net asset value). In some cases, estimated unaudited values are provided before final unaudited values. The Advisor will rely primarily on such estimated unaudited values or final unaudited values, to the extent they are the most reliable and relevant indication of value of interests in the Portfolio Funds. The Advisor will give weight to such valuations and other factors and considerations set forth below and in the written policies and procedures (“BlackRock Global Valuation Procedures”) that the Fund’s Board of Directors (the “Board”) has approved for purposes of determining the fair value of securities held by the Fund, as deemed appropriate in each case.
In instances where unaudited estimated or final values may not be available, or where such unaudited estimated or final values are determined not to be the most reliable and relevant indication of value of an interest in a Portfolio Fund (as further discussed below), additional factors that may be relevant in determining the value of an interest in a Portfolio Fund include (1) changes in the valuation of hedge fund indices, (2) publicly available information regarding a Portfolio Fund’s underlying portfolio companies or investments, (3) the price at which recent subscriptions and redemptions of such Portfolio Fund interests were offered, (4) relevant news and other sources, (5) significant market events and
(6) information provided to the Advisor or the Fund by a Portfolio Fund, or the failure to provide such information as agreed to in the Portfolio Fund’s offering materials or other agreements with the Fund. In circumstances where, taking into account the factors and considerations set forth above and in the Valuation Procedures, the Advisor has reason to believe that a value provided by a Portfolio Fund is not the most reliable and relevant indication of the value of an interest in the Portfolio Fund, the Advisor may adjust such reported value to reflect the fair value of the interest in the Portfolio Fund. Likewise, in circumstances where a Portfolio Fund does not provide a valuation as contemplated above, the factors and considerations set forth above and in the Valuation Procedures may be the only indicators of the value of an interest in a Portfolio Fund and the Advisor will use such factors, together with other valuation methodologies set forth in the Valuation Procedures that may be relevant, to estimate the fair value of its interest in such a Portfolio Fund. In circumstances where the Advisor determines to adjust the values reported by Portfolio Funds, or in circumstances where Portfolio Funds do not provide valuations as contemplated above (collectively, “Adjusted Fair Values”), such valuations will be subject to review and approval by the internal valuation committee of the Advisor and its registered investment advisory affiliates (“Valuation Committee”).
Investment Transactions and Investment Income: For financial reporting purposes, investment transactions are recorded on the dates the transactions are entered into (the trade dates). Realized gains and losses on investment transactions are determined on the identified cost basis. Dividend income is recorded on the ex-dividend dates.
Dividends and Distributions: Dividends from net investment income and distributions of capital gains are declared and paid annually. The portion of distributions that exceeds a Fund’s current and accumulated earnings and profits, which are measured on a tax basis, will constitute a nontaxable return of capital. Distributions in excess of a Fund’s taxable income and net capital gains, but not in excess of a Fund’s earnings and profits, will be taxable to shareholders as ordinary income and will not constitute a nontaxable return of capital. The character and timing of dividends and distributions are determined in accordance with federal income tax regulations, which may differ from US GAAP.
Income Taxes: It is the Fund’s policy to comply with the requirements of the Internal Revenue Code of 1986, as amended, applicable to regulated investment companies and to distribute substantially all of its taxable income to its members. Therefore, no federal income tax provision is required.
The Fund files US federal and various state and local tax returns. No income tax returns are currently under examination. The statue of limitations on the Fund’s US federal tax return remains open for the period ended March 31, 2012. Management does not believe there are any uncertain tax positions that require recognition of a tax liability.
Recent Accounting Standards: In December 2011, the FASB issued guidance that will expand current disclosure requirements on the offsetting of certain assets and liabilities. The new disclosures will be required for investments and derivative financial instruments subject to master
| | | | | | |
| | | | | | | |
| | BLACKROCK PREFERRED PARTNERS LLC | | SEPTEMBER 30, 2012 | | 15 |
| | |
| | |
Notes to Financial Statements (continued) | | |
netting or similar agreements which are eligible for offset in the Statements of Assets, Liabilities and Members’ Capital and will require an entity to disclose both gross and net information about such investments and transactions in the financial statements. The guidance is effective for financial statements with fiscal years beginning on or after January 1, 2013, and interim periods within those fiscal years. Management is evaluating the impact of this guidance on the Fund’s financial statement disclosures.
Offering Costs: Offering costs associated with the establishment of the Fund are amortized over a
12-month period beginning with the commencement of operations.
Other: Expenses directly related to the Fund are charged to the Fund. Other operating expenses shared by several funds are pro rated among those funds on the basis of relative members’ capital or other appropriate methods.
The Fund has an arrangement with its custodian whereby fees may be reduced by credits earned on uninvested cash balances, which, if applicable, are shown as fees paid indirectly in the Statement of Operations. The custodian imposes fees on overdrawn cash balances, which can be offset by accumulated credits earned or may result in additional custody charges.
2. Investment Advisory Agreements and Other Transactions with Affiliates:
The PNC Financial Services Group, Inc. (“PNC”) is the largest stockholder and is an affiliate, for 1940 Act purposes, of BlackRock, Inc. (“BlackRock”).
The Fund entered into an Investment Advisory Agreement with the Advisor to provide investment advisory services. The Fund pays the Advisor an annual fee accrued monthly and payable quarterly in arrears, in an amount equal to 0.75% of the Fund’s month-end members’ capital.
The Advisor has entered into a separate sub-advisory agreement with BlackRock Financial Management, Inc. (“BFM”), an affiliate of the Advisor. The Advisor pays BFM for services it provides, a monthly fee that is a percentage of the investment advisory fees paid by the Fund to the Advisor.
The Fund has entered into an expense limitation agreement in which the Advisor has agreed to reimburse certain operating and other expenses of the Fund in order to limit certain expenses to 0.50% per annum of the Fund’s average members’ capital (the “Expense Cap”). Expenses covered by the Expense Cap include all of the Fund’s expenses other than those expressly excluded by the Expense Cap Agreement as follows: (1)
the investment management fee, (2) interest expense, if any, (3) expenses incurred directly or indirectly by the Fund as a result of expenses related to investing in, or incurred by, a Portfolio Fund or other permitted investment, (4) any trading-related expenses, including, but not limited to, clearing costs and commissions, (5) dividends on short sales, if any, (6) any extraordinary expenses not incurred in the ordinary course of the Fund’s business (including, without limitation, litigation expenses) and (7) if applicable, the distribution fees paid to BlackRock Investments, LLC (“BRIL”) or financial intermediaries.
If the Fund has received a waiver or reimbursement from the Adviser within the preceding two fiscal years and the Fund’s operating expenses are less than the expense limit for the Fund, the Advisor is entitled to be reimbursed by the Fund up to the lesser of (a) the amount of fees waived or expenses reimbursed during those prior two fiscal years under the agreement and (b) the amount by which the expense limit for the Fund exceeds the operating expenses of the Fund for the current fiscal year, provided that: (1) the Fund has more than $50 million in assets for the fiscal year and (2) the Advisor or an affiliate continues to serve as the Fund’s investment advisor or administrator. In the event the expense limit for the Fund is changed subsequent to a fiscal year in which the Advisor becomes entitled to reimbursement for fees waived or reimbursed, the amount available to reimburse the Advisor shall be calculated by reference to the expense limit for the Fund in effect at the time the Advisor became entitled to receive such reimbursement, rather than the subsequently changed expense limit for the Fund.
On September 30, 2012, the amounts subject to possible future recoupment under the expense limitation agreement were $714,180, which will expire March 31, 2014, and $300,412, which will expire March 31, 2015.
The Fund entered into a Distribution Agreement with BRIL, an affiliate of the Advisor. Pursuant to a Distribution Plan approved by the Fund’s Board, the Fund pays BRIL ongoing distribution fees. The fees are accrued monthly and paid quarterly in arrears at an annual rate equal to 0.75% of the Fund’s month-end members’ capital.
Certain officers and/or directors of the Fund are officers and/or directors of BlackRock or its affiliates. The Fund reimburses the Advisor for compensation paid to the Fund’s Chief Compliance Officer.
3. Investments:
Purchases and sales of investments, excluding
short-term securities, for the six months ended September 30, 2012 were $12,727,711 and $3,306,344, respectively.
| | | | | | |
| | | | | | | |
| 16 | | BLACKROCK PREFERRED PARTNERS LLC | | SEPTEMBER 30, 2012 | | |
| | |
| | |
Notes to Financial Statements (continued) | | |
4. Investments in Portfolio Funds:
Information reflecting the Fund’s investments in Portfolio Funds as of September 30, 2012 is summarized below. The Fund is not able to obtain complete investment holding details of each of the Portfolio Funds held within the Fund’s portfolio in order to determine whether the Fund’s proportionate share of any investments held by a Portfolio Fund exceeds 5% of the members’ capital of the Fund as of September 30, 2012.
| | | | | | | | | | |
| Investment | | Value | | | % of Fund’s Members’ Capital | | Primary Geographical Locations* | | Redemptions Permitted** |
Directional Trading | | | | | | | | | | |
D.E. Shaw Oculus International Fund, Liquidity Class | | $ | 2,937,983 | | | 7.0% | | Latin America, North America, PacRim Developed, Western Europe | | Quarterly |
Fortress Asia Macro Fund Ltd., Class A: | | | | | | | | | | |
Series 04-2012 | | | 1,249,609 | | | 2.9 | | Global, North America, | | |
Series 06-2012 | | | 469,933 | | | 1.1 | | PacRim Developed, PacRim Emerging | | Quarterly |
Event Driven | | | | | | | | | | |
Davidson Kempner International (BVI), Ltd., Class C, Tranche 3, Series 01-2012 | | | 1,389,535 | | | 3.3 | | Africa/Mid East, Central/South Asia, North America, PacRim Developed, PacRim Emerging, Western Europe | | Quarterly |
HBK Offshore Fund II LP, Class A, Sub-Class A1 | | | 1,761,444 | | | 4.2 | | Eastern Europe, Latin America, North America, PacRim Developed, PacRim Emerging, Western Europe | | Quarterly |
Peak6 Performance Fund, Ltd., Class A-NV-U: | | | | | | | | | | |
Series 04-2012 | | | 1,361,250 | | | 3.2 | | North America | | Quarterly |
Series 05-2012 | | | 292,125 | | | 0.7 | | | | |
Series 08-2012 | | | 218,160 | | | 0.5 | | | | |
Pentwater Event Fund, Ltd., Class F-NV-U: | | | | | | | | | | |
Initial Series | | | 1,645,832 | | | 3.9 | | North America, PacRim Developed, Western Europe | | Monthly |
Series 02-2012 | | | 116,688 | | | 0.3 | | | | |
Series 03-2012 | | | 555,111 | | | 1.3 | | | | |
Series 04-2012 | | | 108,299 | | | 0.3 | | | | |
Series 05-2012 | | | 105,067 | | | 0.2 | | | | |
Series 06-2012 | | | 132,851 | | | 0.3 | | | | |
York Investment, Ltd., Class D: | | | | | | | | | | |
Series 09-2011 | | | 1,095,330 | | | 2.6 | | North America, Western Europe | | Quarterly |
Series 05-2012 | | | 249,643 | | | 0.6 | | | | |
Series 06-2012 | | | 359,755 | | | 0.9 | | | | |
Fundamental Long/Short | | | | | | | | | | |
BG Fund, Class B | | | 1,554,872 | | | 3.7 | | North America, PacRim Developed, Western Europe | | Monthly |
Brigade Leveraged Capital Structures Offshore, Ltd.: | | | | | | | | | | |
Series 09-2011 NV | | | 1,093,805 | | | 2.6 | | North America, PacRim Developed, Western Europe | | Quarterly |
Series 02-2012 NV | | | 103,219 | | | 0.3 | | | | |
Series 03-2012 NV | | | 257,280 | | | 0.6 | | | | |
Series 06-2012 NV | | | 253,866 | | | 0.6 | | | | |
Claren Road Credit Fund, Ltd., Class A: | | | | | | | | | | |
Series 32 | | | 1,041,961 | | | 2.5 | | North America, Western Europe | | Quarterly |
Series 69 | | | 171,872 | | | 0.4 | | | | |
Series 70 | | | 646,832 | | | 1.5 | | | | |
Series 71 | | | 476,279 | | | 1.1 | | | | |
Series 72 | | | 301,535 | | | 0.7 | | | | |
Series 73 | | | 199,795 | | | 0.5 | | | | |
Series 74 | | | 146,999 | | | 0.4 | | | | |
Series 76 | | | 196,976 | | | 0.5 | | | | |
| | | | | | |
| | | | | | | |
| | BLACKROCK PREFERRED PARTNERS LLC | | SEPTEMBER 30, 2012 | | 17 |
| | |
| | |
Notes to Financial Statements (continued) | | |
4. Investments in Portfolio Funds (continued):
| | | | | | | | | | | | | | | | | |
| Investment | | Value | | % of Fund’s
Members’
Capital | | Primary Geographical Locations* | | Redemptions
Permitted** |
Fundamental Long/Short (continued) | | | | | | | | | | | |
Conatus Capital Overseas Ltd., Class A, Sub-Class 1: | | | | | | | | | | | |
Series 09-2011 | | | $ | 1,110,950 | | | 2.6% | | North America, Western Europe | | Quarterly |
Series 06-2012 | | | | 258,518 | | | 0.6 | | | | |
Glenview Capital Partners (Cayman), Ltd., Series G/84 | | | | 1,298,054 | | | 3.1 | | North America, Western Europe | | Quarterly |
King Street Capital, Ltd., Class A, Series 03 | | | | 798,205 | | | 1.9 | | PacRim Developed, Western Europe | | Quarterly |
Myriad Opportunities Offshore Fund, Ltd., Class B: | | | | | | | | | | | |
Series 40 | | | | 1,072,931 | | | 2.5 | | Central/South Asia, PacRim Developed, PacRim Emerging | | Quarterly |
Series 40A | | | | 610,457 | | | 1.4 | | | | |
Series 40B | | | | 152,114 | | | 0.4 | | | | |
Oak Hill Credit Alpha Fund (Offshore), Ltd., Class A, Series 09-2011 | | | | 1,066,478 | | | 2.5 | | Latin America, North America, PacRim Developed, Western Europe | | Quarterly |
One William Street Capital Offshore Fund, Ltd., Class CC: | | | | | | | | | | | |
Series 09-2011-AA | | | | 1,882,410 | | | 4.5 | | North America | | Quarterly |
Series 02-2012 | | | | 112,243 | | | 0.3 | | | | |
Series 03-2012 | | | | 607,238 | | | 1.4 | | | | |
Series 04-2012 | | | | 217,933 | | | 0.5 | | | | |
Series 06-2012 | | | | 268,328 | | | 0.6 | | | | |
Series 08-2012 | | | | 261,007 | | | 0.6 | | | | |
Scout Capital Fund, Ltd., Class B: | | | | | | | | | | | |
Series NV-3 | | | | 1,471,011 | | | 3.5 | | Latin America, North America, Western Europe | | Quarterly |
Series NV-10 | | | | 717,587 | | | 1.7 | | | | |
Standard Pacific Capital Offshore, Ltd., Class B, Series B-1 | | | | 1,386,652 | | | 3.3 | | Central/South Asia, Eastern Europe, Latin America, North America, PacRim Developed, Western Europe | | Quarterly |
Standard Pacific Pan-Asia Fund, Ltd., Series A: | | | | | | | | | | | |
Sub-Series 02-2011 | | | | 856,766 | | | 2.0 | | Central/South Asia, PacRim Developed, | | |
Sub-Series 04-2012 | | | | 152,157 | | | 0.4 | | PacRim Emerging | | Quarterly |
Relative Value | | | | | | | | | | | |
Aristeia International, Ltd., Class A: | | | | | | | | | | | |
Series A-NV | | | | 1,188,160 | | | 2.8 | | North America, Western Europe | | Quarterly |
Series 05-2012 | | | | 304,882 | | | 0.7 | | | | |
Series 06-2012 | | | | 256,685 | | | 0.6 | | | | |
Magnetar Capital Fund II, Ltd., Class A: | | | | | | | | | | | |
Series 25 | | | | 1,860,057 | | | 4.4 | | North America, Western Europe | | Quarterly |
Series 47 | | | | 329,402 | | | 0.8 | | | | |
Series 50 | | | | 107,231 | | | 0.3 | | | | |
Series 52 | | | | 210,673 | | | 0.5 | | | | |
Series 58 | | | | 261,741 | | | 0.6 | | | | |
Series 62 | | | | 156,146 | | | 0.4 | | | | |
Total | | | $ | 39,469,922 | | | 93.6% | | | | |
* Primary Geographic Locations refer to information of which the Fund is aware regarding the geographical allocation of the investments held by the Portfolio Funds in which the Fund invests. The Fund does not have or obtain sufficient portfolio holdings information with respect to the Portfolio Funds to monitor such positions on a look through basis. The information regarding the geographical allocation of investments held by the Portfolio Funds is derived from periodic information provided to the Fund by the managers of such Portfolio Funds. The information in this table represents only information that has been made available to the Fund with respect to investments held by the Portfolio Funds as of September 30, 2012. This information has not been independently verified by the Fund and may not be representative of the current geographical allocation of investments held by the Portfolio Funds since such Portfolio Funds are actively managed and this information is generally provided by the Portfolio Funds on a delayed basis after the date of such information.
** Redemptions Permitted reflects general redemption terms for each Portfolio Fund and excludes any temporary liquidity restrictions.
| | | | | | |
| | | | | | | |
| 18 | | BLACKROCK PREFERRED PARTNERS LLC | | SEPTEMBER 30, 2012 | | |
| | |
| | |
Notes to Financial Statements (continued) | | |
The agreements related to investments in Portfolio Funds provide for compensation to the investment managers/general partners of such Portfolio Funds in the form of management fees generally ranging from 1% to 3% (per annum) of members’ capital and incentive fees/allocations generally ranging from 15% to 25% of the net profits earned. The Portfolio Funds’ management fees and incentive fees/allocations are included in the net increase in members’ capital resulting from operations in the Statement of Operations.
The table below summarizes the fair value and other pertinent liquidity information of the underlying Portfolio Funds by class:
| | | | | | | | | | | | | | | | | | |
| Major Category | | Fair Value | | | Illiquid
Investments (1) | | Gates (2) | | | Lock-ups (3) | | | Redemption
Frequency (4) | | Redemption
Notice Period (4) |
Directional Trading (a) | | $ | 4,657,525 | | | – | | $ | 2,448,221 | | | | – | | | Quarterly | | 30-75 Days |
Event Driven (b) | | | 9,391,090 | | | – | | | 1,942,343 | | | $ | 1,871,536 | | | Monthly/Quarterly | | 30-90 Days |
Fundamental Long/Short (c) | | | 20,746,330 | | | – | | | 1,975,280 | | | | 17,326,774 | | | Monthly/Quarterly | | 45-90 Days |
Relative Value (d) | | | 4,674,977 | | | – | | | 2,559,594 | | | | – | | | Quarterly | | 60-90 Days |
Total | | $ | 39,469,922 | | | – | | $ | 8,925,438 | | | $ | 19,198,310 | | | | | |
(1) Represents private investment funds that cannot be voluntarily redeemed by the Fund at any time. This includes: (i) private investment funds that are liquidating and making distribution payments as their underlying assets are sold, (ii) suspended redemptions/withdrawals, and (iii) side pocket holdings. These types of investments may be realized within 1 to 3 years or longer from September 30, 2012, depending on the specific investment and market conditions. This does not include private investment funds with gates and lockups, which are noted above.
(2) Represents investor level and enacted fund level gates, which are limitations on the amount of a Portfolio Fund’s net assets that may be redeemed in any one redemption cycle.
(3) Represents investments that cannot be redeemed without a fee due to a lock-up provision. The lock-up period for these investments ranged from 6 to 12 months at September 30, 2012.
(4) Redemption frequency and redemption notice period reflect general redemption terms, and exclude liquidity restrictions noted above.
(a) Investment strategies within this category seek to profit from buying and/or selling securities or financial instruments with a primary focus on seeking to profit primarily from changes in macro-level exposures, such as broad securities markets, interest rates, exchange rates, or commodity prices. The application of the Valuation Procedures to investments in this category did not result in any Adjusted Fair Values as of September 30, 2012. Thus, the fair values of the investments in this category are based on the net asset values provided by management of the Portfolio Funds.
(b) Investment strategies within this category concentrate on companies that are, or may be, subject to extraordinary corporate events such as mergers, acquisitions, restructurings, spin-offs, shareholder activisim or other special situations that alter a company’s financial structure or operating strategy. The application of the Valuation Procedures to investments in this category did not result in any Adjusted Fair Values as of September 30, 2012. Thus, the fair values of the investments in this category are based on the net asset values provided by management of the Portfolio Funds.
(c) Investment strategies within this category involve buying and/or selling a security or financial instrument believed to be significantly under- or over-priced by the market in relation to its potential value. The application of the Valuation Procedures to investments in this category did not result in any Adjusted Fair Values as of September 30, 2012. Thus, the fair values of the investments in this category are based on the net asset values provided by management of the Portfolio Funds.
(d) Investment strategies within this category seek to profit from the mispricing of related financial instruments. This discipline utilizes quantitative and qualitative analysis to identify securities or spreads between securities that deviate from their theoretical fair value and/or historical norms. The application of the Valuation Procedures to investments in this category did not result in any Adjusted Fair Values as of September 30, 2012. Thus, the fair values of the investments in this category are based on the net asset values provided by management of the Portfolio Funds.
The Fund had no unfunded capital commitments as of September 30, 2012.
| | | | | | |
| | | | | | | |
| | BLACKROCK PREFERRED PARTNERS LLC | | SEPTEMBER 30, 2012 | | 19 |
| | |
| | |
Notes to Financial Statements (continued) | | |
5. Income Tax Information:
As of September 30, 2012, gross unrealized appreciation and gross unrealized depreciation based on cost for federal income tax purposes. were as follows:
| | | | |
Tax cost | | $ | 38,614,851 | |
| | | | |
Gross unrealized appreciation | | $ | 1,131,040 | |
Gross unrealized depreciation | | | (275,969 | ) |
| | | | |
Net unrealized appreciation | | $ | 855,071 | |
| | | | |
6. Market and Credit Risk:
The Fund’s investments in Portfolio Funds involve varying degrees of interest rate risk, credit and counterparty risk, and market, industry or geographic concentration risks for the Fund. While BlackRock monitors these risks, the varying degrees of transparency into and potential illiquidity of the securities in the Portfolio Funds may hinder BlackRock’s ability to effectively manage and mitigate these risks.
The Portfolio Funds in which the Fund is invested utilize a wide variety of financial instruments in their trading strategies including over-the-counter (“OTC”) options, financial futures contracts, forward contracts and swap agreements, and securities sold but not yet purchased. Several of these financial instruments contain varying degrees of off-balance sheet risk where the maximum potential loss on a particular financial instrument may be in excess of the amounts recorded on each Portfolio Fund’s balance sheet. The Portfolio Funds are required to account for all investments on a fair value basis, and recognize changes in unrealized gains and losses in their statements of operations. In determining the fair values for these financial instruments, the Portfolio Funds will make estimates about future interest rates, default probabilities, volatilities and other pricing factors. These estimates of fair value could differ from actual results.
The Fund’s maximum exposure to market risks of the Portfolio Funds is limited to amounts included in the Fund’s investments in Portfolio Funds recorded as assets on the Statement of Assets, Liabilities and Members’ Capital.
The Fund is designed primarily for long term investors and an investment in the Fund’s Units should be considered to be illiquid. The Fund’s Units are not and will not be listed for trading on a securities exchange. Members may not be able to sell their Units as it is unlikely that a secondary market for the Units will develop or, if a secondary market does develop, members may be able to sell their Units only at substantial discounts from net asset value. Additionally, transfers of Units generally may not be effected without the express written consent of the Board. The Fund may, but is not obligated to, conduct tender offers to repurchase outstanding Units. If the Fund does conduct tender offers, it may be required to sell its more liquid, higher quality portfolio securities to purchase Units that are tendered, which may increase risks for remaining members and increase Fund expenses.
7. Liquidity Risk:
The Portfolio Funds invest in securities and investments with various degrees of liquidity and as such the Fund is subject to certain redemption/withdrawal provisions, in accordance with the Portfolio Funds’ offering agreements.
Certain of the Fund’s Portfolio Funds have the ability to suspend redemptions/withdrawals, and restrict redemptions/withdrawals through the creation of side pockets. At September 30, 2012, none of the Fund’s members’ capital were subject to Portfolio Funds that had suspended redemptions/withdrawals (including those Portfolio Funds undergoing liquidation); and none of the Fund’s members’ capital were invested directly in side pockets maintained by Portfolio Funds. The Fund’s ability to liquidate its investment in Portfolio Funds that had imposed such provisions may be adversely impacted. In such cases, until the Fund is permitted to liquidate its interest in the Portfolio Fund, the Fund’s residual interest remains subject to continued exposure to changes in valuations.
The Fund may also invest in closed-end investments that may not permit redemptions/withdrawals or in Portfolio Funds that impose an initial “lockup” period before a redemption/withdrawal can be made. In addition, certain of the Fund’s Portfolio Funds have the ability to impose redemption gates, and in so doing, may reduce the Fund’s requested redemption/withdrawal below the requested amount.
8. Capital Shares Transactions:
Units issued and outstanding during the period September 1, 2011 to March 31, 2012 increased 2,490,000 as a result of Units sold to BlackRock Holdco 2, Inc. and 557,023 as a result of Units sold to other eligible investors. During the six months ended September 30, 2012, units issued and outstanding remained the same for BlackRock Holdco 2, Inc. and increased 1,038,422 as a result of Units sold to other eligible investors. At September 30, 2012, 2,500,000 Units were owned by BlackRock Holdco 2, Inc., an affiliate of the Fund.
Units are offered at closings, for purchase as of the first business day of each month or at such other times as determined in the discretion of the Board.
The Fund may choose to conduct quarterly tender offers for up to 15% of its net asset value at the time in the sole discretion of its Board. In a tender offer, the Fund repurchases outstanding Units at the Fund’s net asset value on the valuation date for the tender offer, which would generally be expected to be the last business day of March, June, September or December. In any given year, the Advisor may or may not recommend to the Board that the Fund conduct tender offers. Accordingly, there may be years in which no tender offer is made. Units will not be redeemable at an investor’s option nor will they be exchangeable for shares of any other fund. On June 27, 2012, the Fund commenced a tender offer of 535,127 Units. However, no Members tendered their Units. On September 27, 2012, the Fund commenced a tender offer for 613,361 Units. However, no Members tendered their Units.
| | | | | | |
| | | | | | | |
| 20 | | BLACKROCK PREFERRED PARTNERS LLC | | SEPTEMBER 30, 2012 | | |
| | |
| | |
Notes to Financial Statements (concluded) | | |
A 2.00% early repurchase fee payable to the Fund will be charged to any member that tenders its Units to the Fund in connection with a tender offer with a valuation date that is prior to the business day immediately preceding the one-year anniversary of the member’s purchase of the respective Units. This early repurchase fee would apply separately to each purchase of Units made by a member. The purpose of the 2.00% early repurchase fee is to reimburse the Fund for the costs incurred in liquidating investments in the Fund’s portfolio in order to honor the member’s repurchase request and to discourage short-term investments which are generally disruptive to the Fund’s investment program.
9. Subsequent Events:
Management has evaluated the impact of all subsequent events on the Fund through the date the financial statements were issued and has determined that there were no subsequent events requiring adjustment or additional disclosure in the financial statements.
| | | | | | |
| | | | | | | |
| | BLACKROCK PREFERRED PARTNERS LLC | | SEPTEMBER 30, 2012 | | 21 |
Richard E. Cavanagh, Chairman of the Board and Director
Karen P. Robards, Vice Chairperson of the Board, Chairperson of the Audit Committee and Director
Paul L. Audet, Director
Michael J. Castellano, Director and Member of the Audit Committee
Frank J. Fabozzi, Director and Member of the Audit Committee
Kathleen F. Feldstein, Director
James T. Flynn, Director and Member of the Audit Committee
Henry Gabbay, Director
Jerrold B. Harris, Director
R. Glenn Hubbard, Director
W. Carl Kester, Director and Member of the Audit Committee
John M. Perlowski, President and Chief Executive Officer
Anne Ackerley, Vice President
Brendan Kyne, Vice President
Robert W. Crothers, Vice President1
Neal Andrews, Chief Financial Officer
Jay Fife, Treasurer
Brian Kindelan, Chief Compliance Officer and Anti-Money Laundering Officer
Janey Ahn, Secretary2
Investment Advisor
BlackRock Advisors, LLC
Wilmington, DE 19809
Sub-Advisor
BlackRock Financial Management, Inc.
New York, NY 10055
Accounting Agent, Administrator and Transfer Agent
BNY Mellon Investment Servicing (US) Inc.
Wilmington, DE 19809
Custodian
The Bank of New York Mellon
New York, NY 10286
Distributor
BlackRock Investments, LLC
New York, NY 10022
Legal Counsel
Skadden, Arps, Slate, Meagher & Flom LLP
New York, NY 10036
Independent Registered Public Accounting Firm
Deloitte & Touche LLP
Philadelphia, PA 19103
Address of the Fund
100 Bellevue Parkway
Wilmington, DE 19809
| | 1 | Effective May 22, 2012, Robert W. Crothers became Vice President of the Fund. |
| | 2 | Effective May 22, 2012, Ira P. Shapiro resigned as Secretary of the Fund and Janey Ahn became Secretary of the Fund. |
The Fund is currently distributed by BlackRock Investments, LLC. You should consider the investment objectives, risks, charges and expenses of the Fund carefully before investing. The Fund’s prospectus contains this and other information and is available at www.blackrock.com or by calling (800) 441-7762 or from your financial advisor. The prospectus should be read carefully before investing.
| | | | | | |
| | | | | | | |
| 22 | | BLACKROCK PREFERRED PARTNERS LLC | | SEPTEMBER 30, 2012 | | |
Quarterly and monthly performance, semi-annual and annual reports and other information regarding the Fund may be found under “Alternative Investments” on BlackRock’s website, which can be accessed at http://www.blackrock.com. This reference to BlackRock’s website is intended to provide public access to information regarding the Fund and does not, and is not intended to, incorporate BlackRock’s website into this report.
Electronic Delivery
Electronic copies of most financial reports and prospectuses are available on the Fund’s websites or shareholders can sign up for e-mail notifications of quarterly statements, annual and semi-annual reports and prospectuses by enrolling in the Fund’s electronic delivery program.
Shareholders Who Hold Accounts with Investment Advisors, Banks or Brokerages
Please contact your financial advisor. Please note that not all investment advisors, banks or brokerages may offer this service.
Householding
The Fund will mail only one copy of shareholder documents, including annual and semi-annual reports and proxy statements, to shareholders with multiple accounts at the same address. This practice is commonly called “householding” and it is intended to reduce expenses and eliminate duplicate mailings of shareholder documents. Mailings of your shareholder documents may be householded indefinitely unless you instruct us otherwise. If you do not want the mailing of these documents
to be combined with those for other members of your household, please contact the Fund at (800) 441-7762.
Availability of Quarterly Schedule of Investments
The Fund files its complete schedule of portfolio holdings with the Securities and Exchange Commission’s (the “SEC”) for the first and third quarters of each fiscal year on Form N-Q. The Fund’s Forms N-Q are available on the SEC’s website at http://www.sec.gov and may also be reviewed and copied at the SEC’s Public Reference Room in Washington, D.C. Information on the operation of the Public Reference Room may be obtained by calling (800) SEC-0330. The Fund’s Forms N-Q may also be obtained upon request and without charge by calling (800) 441-7762.
Availability of Proxy Voting Policies and Procedures
A description of the policies and procedures that the Fund uses to determine how to vote proxies relating to portfolio securities is available (1) without charge, upon request, by calling (800) 441-7762; (2) at http://www.blackrock.com; (3) on the SEC’s website at http:// www.sec.gov.
Availability of Proxy Voting Record
Information about how the Fund votes proxies relating to securities held in the Fund’s portfolios during the most recent 12-month period ended June 30 is available upon request and without charge (1) at http:// www.blackrock.com or by calling (800) 441-7762 and (2) on the SEC’s website at http://www.sec.gov.
|
| BlackRock Privacy Principles |
BlackRock is committed to maintaining the privacy of its current and former fund investors and individual clients (collectively, “Clients”) and to safeguarding their non-public personal information. The following information is provided to help you understand what personal information BlackRock collects, how we protect that information and why in certain cases we share such information with select parties.
If you are located in a jurisdiction where specific laws, rules or regulations require BlackRock to provide you with additional or different privacy-related rights beyond what is set forth below, then BlackRock will comply with those specific laws, rules or regulations.
BlackRock obtains or verifies personal non-public information from and about you from different sources, including the following: (i) information we receive from you or, if applicable, your financial intermediary, on applications, forms or other documents; (ii) information about your transactions with us, our affiliates, or others; (iii) information we receive from a consumer reporting agency; and (iv) from visits to our websites.
BlackRock does not sell or disclose to non-affiliated third parties any non-public personal information about its Clients, except as permitted by law or as is necessary to respond to regulatory requests or to service Client accounts. These non-affiliated third parties are required to protect the confidentiality and security of this information and to use it only for its intended purpose.
We may share information with our affiliates to service your account or to provide you with information about other BlackRock products or services that may be of interest to you. In addition, BlackRock restricts access to non-public personal information about its Clients to those BlackRock employees with a legitimate business need for the information. BlackRock maintains physical, electronic and procedural safeguards that are designed to protect the non-public personal information of its Clients, including procedures relating to the proper storage and disposal of such information.
| | | | | | |
| | | | | | | |
| | BLACKROCK PREFERRED PARTNERS LLC | | SEPTEMBER 30, 2012 | | 23 |
| | |
| This report is transmitted to shareholders only. It is not a prospectus. Past performance results shown in this report should not be considered a representation of future performance. Statements and other information herein are as dated and are subject to change. | |  |
| | |
| Prefp-9/12-SAR | |  |
| | |
| Item 2 – | | Code of Ethics – Not Applicable to this semi-annual report |
| |
Item 3 – | | Audit Committee Financial Expert – Not Applicable to this semi-annual report |
| |
| Item 4 – | | Principal Accountant Fees and Services – Not Applicable to this semi-annual report |
| |
| Item 5 – | | Audit Committee of Listed Registrants – Not Applicable to this semi-annual report |
| |
Item 6 – | | Investments (a) The registrant’s Schedule of Investments is included as part of the Report to Stockholders filed under Item 1 of this Form. (b) Not Applicable due to no such divestments during the semi-annual period covered since the previous Form N-CSR filing. |
| |
Item 7 – | | Disclosure of Proxy Voting Policies and Procedures for Closed-End Management Investment Companies – Not Applicable to this semi-annual report |
| |
Item 8 – | | Portfolio Managers of Closed-End Management Investment Companies |
| | (a) Not Applicable to this semi-annual report (b) As of the date of this filing, there have been no changes in any of the portfolio managers identified in the most recent annual report on Form N-CSR. |
| |
Item 9 – | | Purchases of Equity Securities by Closed-End Management Investment Company and Affiliated Purchasers – Not Applicable |
| |
Item 10 – | | Submission of Matters to a Vote of Security Holders – There have been no material changes to these procedures. |
| |
Item 11 – | | Controls and Procedures |
| |
| | (a) – The registrant’s principal executive and principal financial officers, or persons performing similar functions, have concluded that the registrant’s disclosure controls and procedures (as defined in Rule 30a-3(c) under the Investment Company Act of 1940, as amended (the “1940 Act”)) are effective as of a date within 90 days of the filing of this report based on the evaluation of these controls and procedures required by Rule 30a-3(b) under the 1940 Act and Rule 13a-15(b) under the Securities Exchange Act of 1934, as amended. |
| |
| | (b) – There were no changes in the registrant’s internal control over financial reporting (as defined in Rule 30a-3(d) under the 1940 Act) that occurred during the second fiscal quarter of the period covered by this report that have materially affected, or are reasonably likely to materially affect, the registrant’s internal control over financial reporting. |
| |
Item 12 – | | Exhibits attached hereto |
| |
| | (a)(1) – Code of Ethics – Not Applicable to this semi-annual report |
| |
| | (a)(2) – Certifications – Attached hereto |
| |
| | (a)(3) – Not Applicable |
| |
| | (b) – Certifications – Attached hereto |
3
Pursuant to the requirements of the Securities Exchange Act of 1934 and the Investment Company Act of 1940, the registrant has duly caused this report to be signed on its behalf by the undersigned, thereunto duly authorized.
| | |
BlackRock Preferred Partners LLC |
| |
By: | | /s/ John M. Perlowski |
| | John M. Perlowski |
| | Chief Executive Officer (principal executive officer) of |
| | BlackRock Preferred Partners LLC |
| |
Date: | | December 4, 2012 |
Pursuant to the requirements of the Securities Exchange Act of 1934 and the Investment Company Act of 1940, this report has been signed below by the following persons on behalf of the registrant and in the capacities and on the dates indicated.
| | |
By: | | /s/ John M. Perlowski |
| | John M. Perlowski |
| | Chief Executive Officer (principal executive officer) of |
| | BlackRock Preferred Partners LLC |
| |
Date: | | December 4, 2012 |
| |
By: | | /s/ Neal J. Andrews |
| | Neal J. Andrews |
| | Chief Financial Officer (principal financial officer) of |
| | BlackRock Preferred Partners LLC |
| |
Date: | | December 4, 2012 |
4