UNITED STATES
SECURITIES AND EXCHANGE COMMISSION
Washington, D.C. 20549
FORM N-CSR
CERTIFIED SHAREHOLDER REPORT OF REGISTERED MANAGEMENT INVESTMENT COMPANIES
Investment Company Act file number: 811-22550
Name of Fund: BlackRock Preferred Partners LLC
Fund Address: 100 Bellevue Parkway, Wilmington, DE 19809
| Name | and address of agent for service: John M. Perlowski, Chief Executive Officer, BlackRock Preferred Partners LLC, 55 East 52nd Street, New York, NY 10055 |
Registrant’s telephone number, including area code: (800) 882-0052, Option 4
Date of fiscal year end: 03/31/2016
Date of reporting period: 09/30/2015
Item 1 – Report to Stockholders
SEPTEMBER 30, 2015
| | | | |
SEMI-ANNUAL REPORT (UNAUDITED) | | | | BLACKROCK® |
BlackRock Preferred Partners LLC
| | |
| Not FDIC Insured ¡ May Lose Value ¡ No Bank Guarantee | | |
| | | | |
| | | | Page | |
The Markets in Review | | | 3 | |
Semi-Annual Report: | | | | |
Fund Summary | | | 4 | |
Financial Statements: | | | | |
Schedule of Investments | | | 7 | |
Statement of Assets, Liabilities and Members’ Capital | | | 9 | |
Statement of Operations | | | 10 | |
Statements of Changes in Members’ Capital | | | 11 | |
Statement of Cash Flows | | | 12 | |
Financial Highlights | | | 13 | |
Notes to Financial Statements | | | 14 | |
Disclosure of Investment Advisory Agreement | | | 22 | |
Officers and Directors | | | 27 | |
Additional Information | | | 28 | |
| | | | | | |
| | | 
| | Shareholders can sign up for e-mail notifications of quarterly statements, annual and semi-annual shareholder reports and prospectuses by enrolling in the electronic delivery program. Electronic copies of shareholder reports and prospectuses are also available on BlackRock’s website. TO ENROLL IN ELECTRONIC DELIVERY: Shareholders Who Hold Accounts with Investment Advisors, Banks or Brokerages: Please contact your financial advisor. Please note that not all investment advisors, banks or brokerages may offer this service. Shareholders Who Hold Accounts Directly with BlackRock: 1. Access the BlackRock website at blackrock.com 2. Select “Access Your Account” 3. Next, select “eDelivery” in the “Related Resources” box and follow the sign-up instructions | | |
| | | | | | |
| 2 | | BLACKROCK PREFERRED PARTNERS LLC | | SEPTEMBER 30, 2015 | | |
Dear Member,
This report reflects your Fund’s reporting period ended September 30, 2015. The following review is intended to provide you with additional market perspective over the past 12 months.
Diverging monetary policies and shifting economic outlooks across regions were the overarching themes driving financial markets during the 12-month period ended September 30, 2015. U.S. economic growth was picking up considerably in the fourth quarter of 2014, while the broader global economy showed signs of slowing. Investors favored the stability of U.S. assets despite expectations that the Federal Reserve (the “Fed”) would eventually be inclined to raise short-term interest rates. International markets struggled even as the European Central Bank and the Bank of Japan eased monetary policy. Oil prices plummeted in late 2014 due to a global supply-and-demand imbalance, fueling a sell-off in energy-related assets and emerging markets. Investors piled into U.S. Treasury bonds as their persistently low yields had become attractive as compared to the even lower yields on international sovereign debt.
Equity markets reversed in early 2015, with international markets outperforming the United States as global risks temporarily abated and the U.S. economy hit a soft patch amid a harsh winter and a west coast port strike. High valuations took their toll on U.S. stocks, while bond yields fell to extreme lows. (Bond prices rise as yields fall.) In contrast, economic reports in Europe and Asia began to improve, and accommodative policies from central banks in those regions helped international equities rebound. Oil prices stabilized, providing some relief for emerging market stocks, although a stronger U.S. dollar posed another significant headwind for the asset class.
U.S. economic growth regained momentum in the second quarter, helping U.S. stocks resume an upward path; however, the improving data underscored the likelihood that the Fed would raise short-term rates before the end of 2015 and bond yields moved swiftly higher. The month of June brought a sharp, but temporary, sell-off across most asset classes as Greece’s long-brewing debt troubles came to an impasse. These concerns abated when the Greek parliament passed a series of austerity and reform measures in July. But the market’s calm was short-lived. Signs of weakness in China’s economy sparked extreme levels of volatility in Chinese equities despite policymakers’ attempts to stabilize the market.
Higher volatility spread through markets globally in the third quarter as further evidence of deceleration in China stoked worries about overall global growth. Weakening demand caused oil prices to slide once again, igniting another steep sell-off in emerging markets. Global volatility spiked higher as investors speculated whether the Fed would raise rates at its September meeting. News that the rate hike had been postponed brought little relief in the markets as the central bank’s decision reinforced investors’ concerns about the state of the global economy. Global equities and high yield bonds broadly declined, while higher quality assets, including U.S. Treasury bonds, municipal bonds and investment grade credit benefited from investors seeking shelter amid global uncertainty.
At BlackRock, we believe investors need to think globally, extend their scope across a broad array of asset classes and be prepared to move freely as market conditions change over time. We encourage you to talk with your financial advisor and visit blackrock.com for further insight about investing in today’s markets.
Sincerely,

Rob Kapito
President, BlackRock Advisors, LLC

Rob Kapito
President, BlackRock Advisors, LLC
| | | | | | | | |
| Total Returns as of September 30, 2015 | |
| | | 6-month | | | 12-month | |
U.S. large cap equities
(S&P 500® Index) | | | (6.18 | )% | | | (0.61 | )% |
U.S. small cap equities
(Russell 2000® Index) | | | (11.55 | ) | | | 1.25 | |
International equities
(MSCI Europe, Australasia,
Far East Index) | | | (9.68 | ) | | | (8.66 | ) |
Emerging market
equities (MSCI Emerging
Markets Index) | | | (17.33 | ) | | | (19.28 | ) |
3-month Treasury bill
(BofA Merrill Lynch
3-Month U.S. Treasury
Bill Index) | | | 0.02 | | | | 0.02 | |
U.S. Treasury securities
(BofA Merrill Lynch
10-Year U.S. Treasury Index) | | | (0.21 | ) | | | 6.03 | |
U.S. investment-grade
bonds (Barclays U.S.
Aggregate Bond Index) | | | (0.47 | ) | | | 2.94 | |
Tax-exempt municipal
bonds (S&P Municipal
Bond Index) | | | 0.70 | | | | 3.00 | |
U.S. high yield bonds
(Barclays U.S. Corporate
High Yield 2% Issuer
Capped Index) | | | (4.82 | ) | | | (3.40 | ) |
HFRI Fund of Funds
Composite Index | | | (3.47 | ) | | | (0.12 | ) |
|
| Past performance is no guarantee of future results. Index performance is shown for illustrative purposes only. You cannot invest directly in an index. | |
| | | | | | |
| | | THIS PAGE NOT PART OF YOUR FUND REPORT | | | | 3 |
| | |
| Fund Summary as of September 30, 2015 | | |
BlackRock Preferred Partners LLC’s (the “Fund”) investment objective is to seek total return. Over an investment cycle, the Fund expects to achieve net returns commensurate with the long-term return on equities with less volatility and a relatively low degree of correlation to the equity markets. The Fund seeks to achieve its investment objective by investing directly or indirectly in private funds or other pooled investment vehicles or accounts organized outside the United States (“Portfolio Funds”) generally believed not to be highly correlated with the Standard & Poor’s 500 Index over a long-term horizon. The Fund may also invest directly in securities (other than those of Portfolio Funds) or other financial instruments.
No assurance can be given that the Fund’s investment objective will be achieved.
|
| Portfolio Management Commentary |
How did the Fund perform?
| • | | For the six-month period ended September 30, 2015, the Fund returned (5.02)% based on net asset value. For the same period, the Fund’s benchmark, the HFRI Fund of Funds Composite Index, returned (3.47)%. |
Underlying Fund Strategies
| • | | The Fund invests in a portfolio of hedge funds as a means to gain exposure to various types of investment strategies in five major categories including fundamental long/short, relative value, event-driven, directional trading and direct sourcing strategies. |
| • | | Fundamental long/short strategies involve buying or selling predominantly corporate securities believed to be over- or underpriced relative to their potential value. Investment strategies in this category include long and short equity- or credit-based strategies, which emphasize a fundamental valuation framework, and equity active value strategies, where an active role is taken to enhance corporate value. |
| • | | Relative value strategies seek to profit from the mispricing of financial instruments relative to each other or historical norms. These strategies utilize quantitative and qualitative analyses to identify securities or spreads between securities that deviate from their theoretical fair value and/or historical norms. |
| • | | Event-driven strategies concentrate on companies that are subject to corporate events such as mergers, acquisitions, restructurings, spin-offs, shareholder activism or other special situations that alter a company’s financial structure or operating strategy. The intended goal of these strategies is to profit when the price of a security changes to reflect more accurately the likelihood and potential impact of the occurrence, or non-occurrence, of the event. |
| • | | Directional trading strategies seek to profit in changes from macro-level exposures, such as broad securities markets, interest rates, exchange rates and commodities. Examples include global macro strategies that express macroeconomic views based on analysis of fundamental factors and managed futures strategies, which select futures instruments based typically on systematic technical analysis. |
| • | | Direct sourcing strategies seek to garner profits from areas of the market that are underserved by traditional financial institutions by entering into direct transactions to provide financing to institutions or individuals. Typically, these strategies rely on a manager’s ability to source or access privately structured deals as well as fundamental research specific to each respective deal. |
What factors influenced performance?
| • | | The Fund’s exposure to event driven, fundamental long/short and directional trading strategies detracted from performance. Within event driven strategies, positions in a number of event-driven corporate activity strategies, such as reorganizations, post-reorganizational activity, mergers and bankruptcies, were the largest detractors from performance. Within fundamental long/short strategies, the most significant detractors were individual positions in stocks and bonds in the health care, technology, energy and industrial sectors. Within directional trading strategies, exposures to technical equity and commodity models, systematic futures and value models were the largest detractors. |
| • | | The Fund’s exposure to relative value strategies, which earned profits from trading equity statistical, volatility arbitrage rates and futures sub-strategies, contributed positively to performance for the period. |
Describe recent portfolio activity.
| • | | The Fund added one new position during the period, Ellington Quantitative Macro Fund, Ltd., which employs a directional trading and global macro strategy. |
| • | | In the aggregate, the Fund’s position changes over the period resulted in increased exposure to directional trading, a slight increase in fundamental long/short equity strategies and a decreased exposure to event driven strategies. |
Describe portfolio positioning at period end.
| • | | At period end, the Fund held broad exposure across a spectrum of different hedge fund strategies. For purposes of financial reporting, the underlying hedge funds are categorized based on their primary underlying strategy exposure. In this regard, the categories of investment strategies as a percentage of the Fund’s long-term investments are 37% fundamental long/short strategies, 26% relative value, 21% directional trading and 16% event-driven. |
| • | | However, notwithstanding their categorization for financial reporting purposes, many of these hedge funds provide exposure to multiple types of underlying strategies. Based on such underlying strategy exposures, the Fund held 45% of its investments in fundamental long/short, 21% in relative value, 18% in directional trading, 15% in event-driven and 1% in direct sourcing strategies. |
The views expressed reflect the opinions of BlackRock as of the date of this report and are subject to change based on changes in market, economic or other conditions. These views are not intended to be a forecast of future events and are no guarantee of future results.
| | | | | | |
| 4 | | BLACKROCK PREFERRED PARTNERS LLC | | SEPTEMBER 30, 2015 | | |
|
| Total Return Based on a $50,000 Investment |
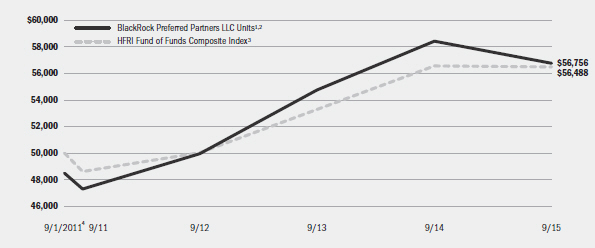
| | 1 | Assuming maximum sales charges, if any, transaction costs and other operating expenses, including investment advisory fees. |
| | 2 | Under normal market conditions, the Fund will invest, in varying proportions, across a number of portfolio strategies, including but not limited to hedge fund strategies and cash strategies. The Fund may also invest directly in securities (other than those of Portfolio Funds) or other financial instruments selected by the Advisor. |
| | 3 | This index represents funds of hedge funds that invest with multiple hedge fund managers focused on absolute return strategies. This equal-weighted index includes funds of hedge funds tracked by Hedge Fund Research Inc. and is revised several times each month to reflect updated hedge fund return information. For performance presented as of any given month, estimated values of underlying funds are used to build the index until valuations are finalized (generally on a 5-month lag although the time period may vary). This index is a proxy for the performance of the universe of funds of hedge funds focused on absolute return strategies. Returns are net of fees. |
| | 4 | Commencement of operations. |
| | | | | | | | | | |
| Performance Summary for the Period Ended September 30, 2015 |
| | | | | Average Annual Total Returns5 |
| | | | | 1 Year | | Since Inception6 |
| | | 6-Month
Total Returns | | w/o sales
charge | | w/ sales
charge | | w/o sales
charge | | w/ sales
charge |
BlackRock Preferred Partners LLC Units | | (5.02)% | | (2.85)% | | (5.77)% | | 3.93% | | 3.16% |
HFRI Fund of Funds Composite Index | | (3.47) | | (0.12) | | N/A | | 3.03 | | N/A |
| | 5 | | Assuming maximum sales charges, if any. Average annual total returns with and without sales charges reflect reductions for distribution fees. |
| | 6 | | The Fund commenced operations on September 1, 2011. |
| | | | N/A—Not applicable as index does not have a sales charge. |
| | | | Past performance is not indicative of future results. |
BlackRock Preferred Partners LLC Units incur a maximum initial sales charge of 3.00%, an annual distribution fee of 0.75% and an annual management fee of 0.75%.
Performance information reflects past performance and does not guarantee future results. Current performance may be lower or higher than the performance data quoted. Performance results do not reflect the deduction of taxes that a Member would pay on Fund distributions or the repurchase of Fund Units. A 2.00% early repurchase fee payable to the Fund may be charged to a member that tenders its Units to the Fund in connection with a tender offer with a valuation date that is prior to the one-year anniversary of the member’s purchase of the respective Units. This early repurchase fee would apply separately to each purchase of Units made by a member. The purpose of the 2.00% early repurchase fee is to reimburse the Fund for the costs incurred in liquidating investments in the Fund’s portfolio in order to honor the member’s repurchase
request and to discourage short-term investments which are generally disruptive to the Fund’s investment program. The Fund may, in its sole discretion, waive the early repurchase fee under certain circumstances described in the Fund’s prospectus. Performance data does not reflect this potential fee. Figures shown in the performance table assume reinvestment of all distributions, if any, at net asset value on the payable date. Investment return and the principal value of Units will fluctuate so that Units, when and if repurchased pursuant to a tender offer, may be worth more or less than their original cost.
The Fund’s investment advisor, BlackRock Advisors LLC (the “Advisor”), waived and/or reimbursed a portion of the Fund’s expenses during the periods described above. Without such waiver and/or reimbursement, the Fund’s performance would have been lower.
See “General Information” at the end of this report for where additional information can be obtained.
| | | | | | |
| | | BLACKROCK PREFERRED PARTNERS LLC | | SEPTEMBER 30, 2015 | | 5 |
| | |
| Ten Largest Holdings | | Percent of
Total Investments |
| | | | |
Myriad Opportunities Offshore Fund, Ltd., Class B, Series 40 | | | 8 | % |
Pentwater Event Fund, Ltd., Class F-NV-U, Initial Series | | | 7 | |
Graticule Asia Macro Fund L.P. (FKA Fortress Asia Macro Fund Ltd.), Class A, Series 05-2011 | | | 6 | |
Citadel Global Fixed Income Fund, Ltd., Class A | | | 6 | |
D.E. Shaw Oculus International Fund, Liquidity Class | | | 5 | |
Anchor Bolt Offshore Fund Ltd., Class A1, Series 1 | | | 5 | |
Stratus Feeder LP, Series 1.5 | | | 5 | |
BG Fund, Class D | | | 5 | |
Glenview Capital Partners (Cayman), Ltd., Class G/84 | | | 4 | |
Panning Overseas Fund, Ltd., Series A-1, Initial Series | | | 4 | |
| | |
| Investment Strategies1 | | Percent of
Total Investments |
| | | | |
Fundamental Long/Short | | | 37 | % |
Relative Value | | | 26 | |
Directional Trading | | | 21 | |
Event Driven | | | 16 | |
| | 1 | | The Fund does not make direct allocations to the Direct Sourcing strategy due to the limited liquidity of this strategy. However, the Fund may occasionally have indirect exposure to the strategy through multi-strategy managers, who may have a small allocation to the strategy. |
The table below summarizes the changes in the Fund’s monthly net asset value per Unit:
| | | | | | | | | | | | | | | | | | | | | | | | | |
| | | 9/30/15 | | 3/31/15 | | Change | | High | | | | Low | |
Net Asset Value | | $10.04 | | $10.57 | | (5.01)% | | $10.66 | | | | $10.04 | |
|
| Disclosure of Expenses for Continuously Offered Closed-End Funds |
Members of the Fund may incur the following charges: (a) transactional expenses, such as sales charges and early repurchase fees; and (b) operating expenses, including investment advisory fees, distribution fees, and other fund expenses. The expense example shown below (which is based on a hypothetical investment of $1,000 invested on April 1, 2015 and held through September 30, 2015) is intended to assist members both in calculating expenses based on an investment in the Fund and in comparing these expenses with similar costs of investing in other funds.
The expense example provides information about actual account values and actual expenses. In order to estimate the expenses a member paid during the period covered by this report, members can divide their account value by $1,000 and then multiply the result by the number under the heading entitled “Expenses Paid During the Period.”
The expense example also provides information about hypothetical account values and hypothetical expenses based on the Fund’s actual
expense ratio and an assumed rate of return of 5% per year before expenses, which is not the Fund’s actual return. The hypothetical account values and expenses may not be used to estimate the actual ending account balance or expenses you paid for the period. In order to assist members in comparing the ongoing expenses of investing in the Fund and other funds, compare the 5% hypothetical example with the 5% hypothetical examples that appear in member reports of other funds.
The expenses shown in the expense example are intended to highlight members’ ongoing costs only and do not reflect any transactional expenses, such as sales charges or early repurchase fees. Therefore, the hypothetical examples are useful in comparing ongoing expenses only, and will not help members determine the relative total expenses of owning different funds. If these transactional expenses were included, member expenses would have been higher.
| | | | | | | | | | | | | | |
| | | Actual | | Hypothetical3 | | |
| | | Beginning
Account Value
April 1, 2015 | | Ending
Account Value
September 30, 2015 | | Expenses Paid
During the Period2 | | Beginning
Account Value
April 1, 2015 | | Ending
Account Value
September 30, 2015 | | Expenses Paid
During the Period2 | | Annualized
Expense
Ratio |
| BlackRock Preferred Partners LLC | | $1,000.00 | | $949.80 | | $9.78 | | $1,000.00 | | $1,015.04 | | $10.10 | | 2.00% |
| | 2 | | Expenses are equal to the annualized expense ratio, multiplied by the average account value over the period, multiplied by 183/366 (to reflect the one-half year period shown). Annualized expense ratio does not include expenses incurred indirectly as a result of investments in Portfolio Funds. |
| | 3 | | Hypothetical 5% annual return before expenses is calculated by prorating the number of days in the most recent fiscal half year divided by 366. |
| | | | | | |
| 6 | | BLACKROCK PREFERRED PARTNERS LLC | | SEPTEMBER 30, 2015 | | |
| | | | |
| Schedule of Investments September 30, 2015 (Unaudited) | | | (Percentages shown are based on Members’ Capital) | |
| | | | |
| | | | |
| Portfolio Funds | | Value | |
Directional Trading — 20.5% | | | | |
D.E. Shaw Oculus International Fund, Liquidity Class | | $ | 3,521,011 | |
Ellington Quantitative Macro Fund Ltd., Class A, Founder Series | | | 1,565,684 | |
Graticule Asia Macro Fund L.P. (FKA Fortress Asia Macro Fund Ltd.), Class A: | | | | |
Series 05-2011 | | | 4,187,358 | |
Series 02-2014 | | | 1,038,017 | |
QMS Diversified Global Macro Offshore Fund Ltd., Class NV: | | | | |
Series 01-2014 | | | 2,287,318 | |
Series 02-2014 | | | 629,259 | |
Series 03-2014 | | | 315,247 | |
| | | | |
| | | | 13,543,894 | |
| | | | |
| Event Driven — 16.2% | | | |
Aristeia International, Ltd., Class A: | | | | |
Series A NV | | | 1,486,926 | |
Series 02-2014 | | | 314,752 | |
Series 03-2014 | | | 222,233 | |
Jet Capital Concentrated Offshore Fund, Ltd., Class E, Non-Voting Shares, Series 1, 06-2011 | | | 2,681,339 | |
King Street Capital, Ltd., Class S, Series 53 | | | 12 | |
Pentwater Event Fund, Ltd., Class F-NV-U, Initial Series | | | 4,616,351 | |
York Investment, Ltd., Class D-U: | | | | |
Series 1 | | | 1,093,545 | |
Series 2-2014 | | | 323,885 | |
| | | | |
| | | | 10,739,043 | |
| | | | |
| Fundamental Long/Short — 37.3% | | | |
Anchor Bolt Offshore Fund Ltd., Class A1, Series 1 | | | 3,362,627 | |
Blue Harbour Strategic Value Partners Offshore, Ltd., Class 1,
Series 09-2014 | | | 2,382,609 | |
Glenview Capital Partners (Cayman), Ltd., Class G/84 | | | 2,764,162 | |
Hitchwood Capital Fund Ltd., Series A1: | | | | |
07/2014 | | | 2,438,085 | |
11/2014 | | | 364,973 | |
Myriad Opportunities Offshore Fund, Ltd., Class B, Series 40 | | | 5,132,282 | |
One William Street Capital Offshore Fund, Ltd., Class DD: | | | | |
Initial Series AA | | | 1,964,438 | |
Series 01-2014 | | | 396,069 | |
Series 02-2014 | | | 335,264 | |
Panning Overseas Fund, Ltd., Series A-1, Initial Series | | | 2,758,292 | |
Pelham Long/Short Fund, Ltd., Class A | | | 2,739,156 | |
| | | | |
| | | | 24,637,957 | |
| | | | |
| | | | |
| | | | |
| Portfolio Funds | | Value | |
Relative Value — 25.4% | | | | |
Achievement Fund, Ltd. (FKA Peak6 Achievement Fund, Ltd.), Class E, Non-Voting Shares: | | | | |
Initial Series | | $ | 1,870,569 | |
Series 02-2014 | | | 206,689 | |
BG Fund, Class D | | | 3,048,900 | |
Citadel Global Fixed Income Fund, Ltd., Class A | | | 3,822,210 | |
Magnetar Capital Fund II, Ltd., Class G: | | | | |
Series 14 | | | 679,847 | |
Series 15 | | | 206,101 | |
Series 16 | | | 169,431 | |
Series 17 | | | 229,876 | |
Series 18 | | | 430,547 | |
Series 19 | | | 228,564 | |
Series 21 | | | 283,982 | |
Series 22 | | | 116,347 | |
Pine River Liquid Rates Fund, Ltd., Class Q-A, Series 29 | | | 2,141,370 | |
Stratus Feeder LP, Series 1.5 | | | 3,330,964 | |
| | | | |
| | | | 16,765,397 | |
Total Investments (Cost $56,896,206) — 99.4% | | | 65,686,291 | |
Other Assets Less Liabilities — 0.6% | | | 413,643 | |
| | | | |
Members’ Capital — 100.0% | | $ | 66,099,934 | |
| | | | |
See Notes to Financial Statements.
| | | | | | |
| | | BLACKROCK PREFERRED PARTNERS LLC | | SEPTEMBER 30, 2015 | | 7 |
| | |
| Schedule of Investments (concluded) | | |
|
| Fair Value Hierarchy as of Period End |
Various inputs are used in determining the fair value of investments. For information about the Fund’s policy regarding valuation of investments, refer to the Notes to Financial Statements.
The following tables summarize the Fund’s investments categorized in the disclosure hierarchy:
| | | | | | | | | | | | | | | | | | | | |
| | | Level 1 | | | | Level 2 | | | | | Level 3 | | | | | Total | |
Assets: | | | | | | | | | | | | | | | | | | | | |
Investments: | | | | | | | | | | | | | | | | | | | | |
Portfolio Funds:1 | | | | | | | | | | | | | | | | | | | | |
Directional Trading | | — | | | | $ | 10,022,883 | | | | | $ | 3,521,011 | | | | | $ | 13,543,894 | |
Event Driven | | — | | | | | 6,122,680 | | | | | | 4,616,363 | | | | | | 10,739,043 | |
Fundamental Long/Short | | — | | | | | 11,312,456 | | | | | | 13,325,501 | | | | | | 24,637,957 | |
Relative Value | | — | | | | | 8,521,234 | | | | | | 8,244,163 | | | | | | 16,765,397 | |
| | | |
Total | | — | | | | $ | 35,979,253 | | | | | $ | 29,707,038 | | | | | $ | 65,686,291 | |
| | | |
| | 1 | | In determining the classification of investments in Portfolio Funds included in the table above, no consideration was given to the classification of securities held by each underlying Portfolio Fund. |
The Fund may hold assets in which the fair value approximates the carrying amount for financial statement purposes. As of period end, cash of $1,387,378 is categorized as Level 1 within the disclosure hierarchy.
During the six months ended September 30, 2015, there were no transfers between Level 1 and Level 2.
A reconciliation of Level 3 investments is presented when the Fund had a significant amount of Level 3 investments at the beginning and/or end of the period in relation to members’ capital. The following table is a reconciliation of Level 3 investments for which significant unobservable inputs were used in determining fair value:
| | | | | | | | | | | | | | | | | | | | | | | | | | | | |
| Assets: | | Directional
Trading | | | | | Event Driven | | | | | Fundamental
Long/Short | | | | | Relative
Value | | | | | Total | |
Opening Balance, as of March 31, 2015 | | $ | 3,648,760 | | | | | $ | 5,705,951 | | | | | $ | 20,426,014 | | | | | $ | 10,619,148 | | | | | $ | 40,399,873 | |
Transfers into Level 3 | | | — | | | | | | — | | | | | | — | | | | | | — | | | | | | — | |
Transfers out of Level 31 | | | — | | | | | | — | | | | | | (5,574,140 | ) | | | | | — | | | | | | (5,574,140 | ) |
Accrued discounts/premiums | | | — | | | | | | — | | | | | | — | | | | | | — | | | | | | — | |
Net realized gain (loss) | | | — | | | | | | 104,351 | | | | | | 288,740 | | | | | | 136,261 | | | | | | 529,352 | |
Net change in unrealized appreciation/depreciation2,3 | | | (127,749 | ) | | | | | (890,961 | ) | | | | | (478,356 | ) | | | | | (252,192 | ) | | | | | (1,749,258 | ) |
Purchases | | | — | | | | | | — | | | | | | 250,000 | | | | | | 425,000 | | | | | | 675,000 | |
Sales | | | — | | | | | | (302,978 | ) | | | | | (1,586,757 | ) | | | | | (2,684,054 | ) | | | | | (4,573,789 | ) |
| | | | |
Closing Balance, as of September 30, 2015 | | $ | 3,521,011 | | | | | $ | 4,616,363 | | | | | $ | 13,325,501 | | | | | $ | 8,244,163 | | | | | $ | 29,707,038 | |
| | | | |
Net change in unrealized appreciation/depreciation on investments still held at September 30, 20153 | | $ | (127,749 | ) | | | | $ | (786,610 | ) | | | | $ | (189,616 | ) | | | | $ | (115,931 | ) | | | | $ | (1,219,906 | ) |
| | | | |
| | 1 | | As of March 31, 2015, certain investments were subject to liquidity restrictions that would not be lifted in the near term. During the six months ended September 30, 2015, these liquidity restrictions were lifted for these investments. As a result, investments with a beginning of period value of $5,574,140 transferred from Level 3 to Level 2 in the disclosure hierarchy. |
| | 2 | | Included in the related net change in unrealized appreciation (depreciation) in the Statement of Operations. |
| | 3 | | Any difference between net change in unrealized appreciation (depreciation) and net change in unrealized appreciation (depreciation) on investments still held at September 30, 2015 is generally due to investments no longer held or categorized as Level 3 at period end. |
See Notes to Financial Statements.
| | | | | | |
| 8 | | BLACKROCK PREFERRED PARTNERS LLC | | SEPTEMBER 30, 2015 | | |
| | |
| Statement of Assets, Liabilities and Members’ Capital | | |
| | | | |
| September 30, 2015 (Unaudited) | | | |
| | | | |
| Assets | | | | |
Investments in Portfolio Funds at value (cost — $56,896,206) | | $ | 65,686,291 | |
Cash | | | 1,387,378 | |
Receivables: | | | | |
Investments in Portfolio Funds sold | | | 3,547,055 | |
Investment advisor | | | 40,421 | |
Prepaid expenses | | | 172 | |
| | | | |
Total assets | | | 70,661,317 | |
| | | | |
| | | | |
| Liabilities | | | | |
Capital contributions received in advance | | | 50,000 | |
Payables: | | | | |
Repurchase offer | | | 4,024,856 | |
Distribution fees | | | 88,347 | |
Investment advisory fees | | | 132,710 | |
Officer’s and Directors’ fees | | | 2,665 | |
Other accrued expenses | | | 262,805 | |
| | | | |
Total liabilities | | | 4,561,383 | |
| | | | |
Members’ Capital | | $ | 66,099,934 | |
| | | | |
| | | | |
| Members’ Capital Consists of | | | | |
Paid-in capital | | $ | 67,418,785 | |
Accumulated net investment loss | | | (10,252,945 | ) |
Undistributed net realized gain | | | 144,009 | |
Net unrealized appreciation (depreciation) | | | 8,790,085 | |
| | | | |
Members’ Capital | | $ | 66,099,934 | |
| | | | |
| | | | |
| Net Asset Value | | | | |
Based on members’ capital of $66,099,934 and 6,585,350 Units outstanding | | $ | 10.04 | |
| | | | |
See Notes to Financial Statements.
| | | | | | |
| | | BLACKROCK PREFERRED PARTNERS LLC | | SEPTEMBER 30, 2015 | | 9 |
| | | | |
| Six Months Ended September 30, 2015 (Unaudited) | | | |
| | | | |
| Investment Income | | | | |
| | | | |
| Expenses | | | | |
Investment advisory | | $ | 274,626 | |
Distribution | | | 274,626 | |
Professional | | | 182,788 | |
Miscellaneous | | | 50,151 | |
Administration | | | 32,767 | |
Printing | | | 28,023 | |
Officer and Directors | | | 4,500 | |
| | | | |
Total expenses | | | 847,481 | |
Less fees waived and/or reimbursed by advisor | | | (115,194 | ) |
| | | | |
Total expenses after fees waived and/or reimbursed | | | 732,287 | |
| | | | |
Net investment loss | | | (732,287 | ) |
| | | | |
| | | | |
| Realized and Unrealized Gain (Loss) | | | | |
Net realized gain from investments | | | 1,125,161 | |
Net change in unrealized appreciation (depreciation) on investments | | | (4,116,566 | ) |
| | | | |
Total realized and unrealized loss | | | (2,991,405 | ) |
| | | | |
Net Decrease in Members’ Capital Resulting from Operations | | $ | (3,723,692 | ) |
| | | | |
See Notes to Financial Statements.
| | | | | | |
| 10 | | BLACKROCK PREFERRED PARTNERS LLC | | SEPTEMBER 30, 2015 | | |
| | |
| Statements of Changes in Members’ Capital | | |
| | |
| | | | | | | | |
| Increase (Decrease) in Members’ Capital: | | Six Months Ended
September 30, 2015
(Unaudited) | | | Year Ended
March 31, 2015 | |
| | | | | | | | |
| Operations | | | | | | | | |
Net investment loss | | $ | (732,287 | ) | | $ | (1,617,345 | ) |
Net realized gain | | | 1,125,161 | | | | 2,914,612 | |
Net change in unrealized appreciation (depreciation) | | | (4,116,566 | ) | | | 2,214,155 | |
| | | | |
Net increase (decrease) in members’ capital resulting from operations | | | (3,723,692 | ) | | | 3,511,422 | |
| | | | |
| | | | | | | | |
| Distributions to Members From1 | | | | | | | | |
Net investment income | | | — | | | | (3,158,141 | ) |
| | | | |
| | | | | | | | |
| Capital Transactions | | | | | | | | |
Proceeds from the issuance of Units (excluding capital contributions received in advance) | | | 3,002,000 | | | | 13,618,268 | |
Reinvestment of distributions | | | — | | | | 2,531,706 | |
Repurchase of Units resulting from tender offers | | | (8,054,900 | ) | | | (20,159,424 | ) |
| | | | |
Net decrease in members’ capital derived from capital transactions | | | (5,052,900 | ) | | | (4,009,450 | ) |
| | | | |
| | | | | | | | |
| Repurchase Fees | | | | | | | | |
Repurchase fees | | | — | | | | 41,116 | |
| | | | |
| | | | | | | | |
| Members’ Capital | | | | | | | | |
Total decrease in members’ capital | | | (8,776,592 | ) | | | (3,615,053 | ) |
Beginning of period | | | 74,876,526 | | | | 78,491,579 | |
| | | | |
End of period | | $ | 66,099,934 | | | $ | 74,876,526 | |
| | | | |
Accumulated net investment loss, end of period | | $ | (10,252,945 | ) | | $ | (9,520,658 | ) |
| | | | |
| | 1 | | Distributions for annual periods determined in accordance with federal income tax regulations. |
See Notes to Financial Statements.
| | | | | | |
| | | BLACKROCK PREFERRED PARTNERS LLC | | SEPTEMBER 30, 2015 | | 11 |
| | | | |
| Six Months Ended September 30, 2015 (Unaudited) | | | |
| | | | |
| Cash Provided by Operating Activities | | | | |
Net decrease in members’ capital resulting from operations | | $ | (3,723,692 | ) |
Adjustments to reconcile net decrease in members’ capital resulting from operations to net cash provided by operating activities: | | | | |
Proceeds from sales of long-term investments | | | 8,887,716 | |
Purchases of long-term investments | | | (2,675,000 | ) |
(Increase) decrease in assets: | | | | |
Receivables: | | | | |
From the investment advisor | | | 25,803 | |
Prepaid expenses | | | 1,032 | |
Increase (decrease) in liabilities: | | | | |
Payables: | | | | |
Distribution fees | | | 38,389 | |
Investment advisory fees | | | (15,000 | ) |
Officer’s and Directors’ fees | | | 994 | |
Other accrued expenses | | | 67,393 | |
Net realized (gain) loss on investments | | | (1,125,161 | ) |
Net change in unrealized (gain) loss on investments | | | 4,116,566 | |
| | | | |
Net cash provided by operating activities | | | 5,599,040 | |
| | | | |
| | | | |
| Cash Used for Financing Activities | | | | |
Capital contributions received in advance | | | (575,000 | ) |
Proceeds from issuance of Units | | | 3,002,000 | |
Payments on Units repurchased | | | (8,985,807 | ) |
| | | | |
Net cash used for financing activities | | | (6,558,807 | ) |
| | | | |
| | | | |
| Cash | | | | |
Net decrease in cash | | | (959,767 | ) |
Cash at beginning of period | | | 2,347,145 | |
| | | | |
Cash at end of period | | $ | 1,387,378 | |
| | | | |
See Notes to Financial Statements.
| | | | | | |
| 12 | | BLACKROCK PREFERRED PARTNERS LLC | | SEPTEMBER 30, 2015 | | |
| | | | | | | | | | | | | | | | | | | | |
| | | Six Months
Ended
September 30,
2015 | | | Year Ended March 31, | | | Period
September 1,
20111 to
March 31, | |
| | | (Unaudited) | | | 2015 | | | 2014 | | | 2013 | | | 2012 | |
| | | | | | | | | | | | | | | | | | | | |
| Per Unit Operating Performance | | | | | | | | | | | | | | | | | | | | |
Net asset value, beginning of period | | $ | 10.57 | | | $ | 10.52 | | | $ | 10.59 | | | $ | 10.16 | | | $ | 10.00 | 2 |
| | | | |
Net investment loss3 | | | (0.11 | ) | | | (0.22 | ) | | | (0.22 | ) | | | (0.20 | ) | | | (0.11 | ) |
Net realized and unrealized gain (loss)4 | | | (0.42 | ) | | | 0.68 | | | | 0.98 | | | | 1.02 | | | | 0.27 | |
| | | | |
Net increase (decrease) from investment operations | | | (0.53 | ) | | | 0.46 | | | | 0.76 | | | | 0.82 | | | | 0.16 | |
| | | | |
Distributions from net investment income5 | | | — | | | | (0.41 | ) | | | (0.83 | ) | | | (0.39 | ) | | | — | |
| | | | |
Net asset value, end of period | | $ | 10.04 | | | $ | 10.57 | | | $ | 10.52 | | | $ | 10.59 | | | $ | 10.16 | |
| | | | |
| | | | | | | | | | | | | | | | | | | | |
| Total Return6 | | | | | | | | | | | | | | | | | | | | |
Based on net asset value | | | (5.02 | )%7 | | | 4.51 | % | | | 7.31 | % | | | 8.12 | % | | | 1.60 | %7 |
| | | | |
| | | | | | | | | | | | | | | | | | | | |
| Ratios to Average Members’ Capital8 | | | | | | | | | | | | | | | | | | | | |
Total expenses | | | 2.30 | %9 | | | 2.22 | % | | | 2.37 | % | | | 3.34 | % | | | 5.84 | %9,10 |
| | | | |
Total expenses after fees waived and/or reimbursed | | | 2.00 | %9 | | | 2.00 | % | | | 2.00 | % | | | 2.00 | % | | | 2.00 | %9 |
| | | | |
Net investment loss | | | (2.00 | )%9 | | | (2.00 | )% | | | (2.00 | )% | | | (2.00 | )% | | | (2.00 | )%9 |
| | | | |
| | | | | | | | | | | | | | | | | | | | |
| Supplemental Data | | | | | | | | | | | | | | | | | | | | |
Members’ capital, end of period (000) | | $ | 66,100 | | | $ | 74,877 | | | $ | 78,492 | | | $ | 53,761 | | | $ | 31,070 | |
| | | | |
Portfolio turnover rate | | | 4 | % | | | 19 | % | | | 15 | % | | | 25 | % | | | 4 | % |
| | | | |
| | 1 | | Commencement of operations. Reflects activity prior to September 1, 2011, related to the initial seeding of the Fund. This information includes the initial investment by BlackRock HoldCo 2, Inc., a wholly owned subsidiary of BlackRock, Inc. |
| | 2 | | Net asset value, beginning of period, reflects a deduction of $0.30 per unit sales charges from initial offering price of $10.30 per unit. |
| | 3 | | Based on average units outstanding. |
| | 4 | | Includes repurchase fees, which are less than $0.005 per unit. |
| | 5 | | Distributions for annual periods determined in accordance with federal income tax regulations. |
| | 6 | | Where applicable, excludes the effects of any sales charges and assumes the reinvestment of distributions. The Fund is a continuously offered closed-end fund, the units of which are offered at net asset value. No secondary market for the Fund’s units exists. |
| | 7 | | Aggregate total return. |
| | 8 | | Ratios do not include expenses incurred indirectly as a result of investments in Portfolio Funds of approximately: |
| | | | | | | | | | |
| | | Six Months
Ended
September 30, 2015 | | Year Ended March 31, | | Period
September 1,
20111 to
March 31, |
| | | (Unaudited) | | 2015 | | 2014 | | 2013 | | 2012 |
Investments in Portfolio Funds | | 5.67% | | 5.44% | | 6.87% | | 7.40% | | 6.07% |
| | 10 | | Organization expenses were not annualized in the calculation of expense ratios. If these ratios were annualized, the total expenses would have been 6.63%. |
See Notes to Financial Statements.
| | | | | | |
| | | BLACKROCK PREFERRED PARTNERS LLC | | SEPTEMBER 30, 2015 | | 13 |
| | |
| Notes to Financial Statements (Unaudited) | | |
1. Organization:
BlackRock Preferred Partners LLC (the “Fund”) is registered under the Investment Company Act of 1940, as amended (the “1940 Act”) as a continuously offered, non-diversified, closed-end management investment company. The Fund is organized as a Delaware limited liability company. The Fund continuously offers one class of limited liability company interests (“Units”), which may be sold to certain eligible investors with a front-end sales charge of up to 3.00%.
2. Significant Accounting Policies:
The financial statements are prepared in conformity with accounting principles generally accepted in the United States of America (“U.S. GAAP”), which may require management to make estimates and assumptions that affect the reported amounts of assets and liabilities in the financial statements and the reported amounts of increases and decreases in members’ capital from operations during the reporting period. Actual results could differ from those estimates. The Fund is considered an investment company under U.S. GAAP and follows the accounting and reporting guidance applicable to investment companies. Below is a summary of significant accounting policies:
Investment Transactions and Investment Income: For financial reporting purposes, investment transactions are recorded on the dates the transactions are entered into (the trade dates). Realized gains and losses on investment transactions are determined on the identified cost basis. Dividend income is recorded on the ex-dividend date.
Distributions: Distributions from net investment income and capital gains are declared and paid annually. The character and timing of distributions are determined in accordance with federal income tax regulations, which may differ from U.S. GAAP.
Recent Accounting Standard: In April 2015, the Financial Accounting Standards Board issued “Disclosures for Investments in Certain Entities that Calculate Net Asset Value per Share” which eliminates the requirement to categorize investments within the fair value hierarchy for which fair value is based on the NAV per share when no quoted market value is available. The new guidance will also require revised disclosures regarding these investments. The guidance is effective for fiscal years beginning after December 15, 2015 and interim periods within those fiscal years. Management is evaluating the impact of this guidance on the Fund’s financial statement disclosures.
Indemnifications: In the normal course of business, the Fund enters into contracts that contain a variety of representations that provide general indemnification. The Fund’s maximum exposure under these arrangements is unknown because it involves future potential claims against the Fund, which cannot be predicted with any certainty.
Other: Expenses directly related to the Fund are charged to the Fund. Other operating expenses shared by several funds are prorated among those funds on the basis of relative members’ capital or other appropriate methods.
The Fund has an arrangement with its custodian whereby fees may be reduced by credits earned on uninvested cash balances, which, if applicable, are shown as fees paid indirectly in the Statement of Operations. The custodian imposes fees on overdrawn cash balances, which can be offset by accumulated credits earned or may result in additional custody charges.
3. Investment Valuation and Fair Value Measurements:
Investment Valuation Policies: The Fund’s investments are valued at fair value (also referred to as “market value” within the financial statements) as of the close of trading on the New York Stock Exchange (“NYSE”) (generally 4:00 p.m., Eastern time). U.S. GAAP defines fair value as the price the Fund would receive to sell an asset or pay to transfer a liability in an orderly transaction between market participants at the measurement date. The Board has adopted and approved written policies and procedures (the “Valuation Procedures”) for the purpose of determining the value of securities held by the Fund, including the fair value of the Fund’s investments in interests in private funds or other pooled investment vehicles (collectively the “Portfolio Funds”), and has delegated to the internal valuation committee of the Advisor and its registered investment advisory affiliates (the “Global Valuation Committee”) the responsibility for the day-to-day oversight of the valuation of the Fund’s investments pursuant to the Valuation Procedures. The Fund will invest in Portfolio Funds selected by and unaffiliated with BlackRock Advisors, LLC (the “Advisor”), an indirect wholly-owned subsidiary of BlackRock, Inc. (“BlackRock”).
In valuing interests in Portfolio Funds, the Advisor, under the supervision of the Fund’s Board of Directors (the “Board”), considers all relevant information to determine the price that the Fund might reasonably expect to receive from the current sale (or redemption in the case of a Portfolio Fund whose interests carry redemption rights) of the interest in the Portfolio Fund in an arm’s-length transaction. In general, the Advisor will rely primarily on any actual or estimated (as applicable) unaudited values provided by the Portfolio Fund manager to the extent such unaudited values are received in a timely fashion and are believed to be the most reliable and relevant indication of the value of interests in such Portfolio Fund. It is anticipated that these unaudited values will be prepared in accordance with U.S. GAAP and will, in effect, be the fair value of each Portfolio Fund’s assets, less such Portfolio Fund’s liabilities (the net asset value). In some cases, estimated unaudited values are provided before final unaudited values. The Advisor will rely primarily on such estimated unaudited values or final unaudited values, to the extent they are the most reliable and relevant indication of value of
| | | | | | |
| 14 | | BLACKROCK PREFERRED PARTNERS LLC | | SEPTEMBER 30, 2015 | | |
| | |
| Notes to Financial Statements (continued) | | |
interests in the Portfolio Funds. The Advisor will give weight to such valuations and any other factors and considerations set forth in the Valuation Procedures as deemed appropriate in each case. The Fund will only invest in Portfolio Funds that comply with U.S. GAAP and that provide annual audited financial statements. In general, the Advisor will, prior to investing in any Portfolio Fund, and periodically thereafter, assess such Portfolio Fund’s valuation policies and procedures for appropriateness in light of the Fund’s obligation to fair value its assets under the 1940 Act and pursuant to U.S. GAAP for investment companies and will assess the overall reasonableness of the information provided by such Portfolio Fund. As part of this assessment, the Advisor may also evaluate, among other things, a Portfolio Fund’s practices in respect of creating “side pockets” and such Portfolio Fund’s valuation policies and procedures in respect of any such “side pockets.” The Advisor will also review any other information available to it, including reports by independent auditors, fund administrators, if any, and/or other third parties.
In instances where unaudited estimated or final values may not be available, or where such unaudited estimated or final values are determined not to be the most reliable and relevant indication of value of an interest in a Portfolio Fund (as further discussed below), additional factors that may be relevant in determining the value of an interest in a Portfolio Fund, in addition to those other factors and considerations set forth in the Valuation Procedures, include (1) changes in the valuation of hedge fund indices, (2) publicly available information regarding a Portfolio Fund’s underlying portfolio companies or investments, (3) the price at which recent subscriptions and redemptions of such Portfolio Fund interests were offered, (4) relevant news and other sources, (5) significant market events and (6) information provided to the Advisor or the Fund by a Portfolio Fund, or the failure to provide such information as agreed to in the Portfolio Fund’s offering materials or other agreements with the Fund.
In circumstances where, taking into account the factors and considerations set forth above and in the Valuation Procedures, the Advisor has reason to believe that a value provided by a Portfolio Fund is not the most reliable and relevant indication of the value of an interest in the Portfolio Fund, the Advisor may adjust such reported value to reflect the fair value of the interest in the Portfolio Fund. Likewise, in circumstances where a Portfolio Fund does not provide a valuation as contemplated above, the factors and considerations set forth above and in the Valuation Procedures may be the only indicators of the value of an interest in a Portfolio Fund and the Advisor will use such factors, together with other valuation methodologies set forth in the Valuation Procedures that may be relevant, to estimate the fair value of its interest in a Portfolio Fund. In circumstances where the Advisor determines to adjust the values reported by Portfolio Funds, or in circumstances where the Portfolio Funds do not provide valuations as contemplated above (such circumstances being collectively referred to as “Adjusted Fair Values”), such valuations will be subject to review and approval by the Global Valuation Committee or its delegate as outlined in the Valuation Procedures. The Board reviews all fair value determinations at its regularly scheduled meetings and also reviews the Valuation Procedures on a regular basis. As of September 30, 2015, the Advisor did not adjust any values received for the Portfolio Funds.
Fair Value Hierarchy: Various inputs are used in determining the fair value of investments. These inputs to valuation techniques are categorized into a fair value hierarchy consisting of three broad levels for financial statement purposes as follows:
| • | | Level 1 — unadjusted price quotations in active markets/exchanges for identical assets or liabilities that the Fund has the ability to access. |
| • | | Level 2 — other observable inputs (including, but not limited to, quoted prices for similar assets or liabilities in markets that are active, quoted prices for identical or similar assets or liabilities in markets that are not active, inputs other than quoted prices that are observable for the assets or liabilities (such as interest rates, yield curves, volatilities, prepayment speeds, loss severities, credit risks and default rates) or other market–corroborated inputs). If the reporting entity has the ability to redeem its investment with the Portfolio Funds at the net asset value per share (or its equivalent) at the measurement date or within the near term and there are no other liquidity restrictions, the Fund’s investment in the Portfolio Fund will be considered Level 2. |
| • | | Level 3 — unobservable inputs based on the best information available in the circumstances, to the extent observable inputs are not available (including the Fund’s own assumptions used in determining the fair value of investments. Investments in Portfolio Funds that are currently subject to liquidity restrictions that will not be lifted in the near term will be considered Level 3. |
The Fund’s investments in Portfolio Funds not otherwise traded on an active exchange are classified within Level 2 or Level 3 of the fair value hierarchy as the value of these interests are primarily based on the respective net asset value reported by management of each Portfolio Fund rather than actual market transactions and other observable market data. The determination of whether such investment will be classified in Level 2 or Level 3 will be based upon the ability to redeem such investment within a reasonable period of time (within 90 days of the period end and any other month-end). If an investment in a Portfolio Fund may be redeemed within 90 days of the period end and any other month-end, and the fair value of the investment is based on information provided by management of the Portfolio Funds and has not been adjusted by BlackRock Advisors LLC, it is classified as Level 2; in all other cases it is classified as Level 3. Changes in redemption features may result in transfers into or out of an assigned level within the disclosure hierarchy. For information about the Fund’s policy regarding valuation of investments, refer to Note 2 of the Notes to Financial Statements.
| | | | | | |
| | | BLACKROCK PREFERRED PARTNERS LLC | | SEPTEMBER 30, 2015 | | 15 |
| | |
| Notes to Financial Statements (continued) | | |
4. Investments in Portfolio Funds:
Information reflecting the Fund’s investments in Portfolio Funds as of September 30, 2015 is summarized below. The Fund is not able to obtain complete investment holding details of each of the Portfolio Funds held within the Fund’s portfolio in order to determine whether the Fund’s proportionate share of any investments held by a Portfolio Fund exceeds 5% of the members’ capital of the Fund as of September 30, 2015.
| | | | | | | | | | |
| Investment | | Value | | | % of Fund’s
Members’
Capital | | Primary Geographic Locations* | | Redemptions
Permitted** |
Directional Trading | | | | | | | | | | |
D.E. Shaw Oculus International Fund, Liquidity Class | | $ | 3,521,011 | | | 5.3% | | Latin America, North America, PacRim Developed, Western Europe | | Quarterly |
Ellington Quantitative Macro Fund Ltd., Class A, Founder Series | | | 1,565,684 | | | 2.4 | | North America | | Monthly |
Graticule Asia Macro Fund L.P. (Fortress Asia Macro Fund Ltd.), Class A: | | | | | | | | | | |
Series 05-2011 | | | 4,187,358 | | | 6.3 | | Global | | Quarterly |
Series 02-2014 | | | 1,038,017 | | | 1.6 | | | | |
QMS Diversified Global Macro Offshore Fund Ltd, Class NV: | | | | | | | | | | |
Series 01-2014 | | | 2,287,318 | | | 3.5 | | Global | | Monthly |
Series 02-2014 | | | 629,259 | | | 0.9 | | | | |
Series 03-2014 | | | 315,247 | | | 0.5 | | | | |
Event Driven | | | | | | | | | | |
Aristeia International, Ltd., Class A: | | | | | | | | | | |
Series A NV | | | 1,486,926 | | | 2.2 | | North America, Western Europe | | Quarterly |
Series 02-2014 | | | 314,752 | | | 0.5 | | | | |
Series 03-2014 | | | 222,233 | | | 0.3 | | | | |
Jet Capital Concentrated Offshore Fund, Ltd., Class E, Non-Voting Shares, Series 1, 06-2011 | | | 2,681,339 | | | 4.1 | | Africa/Mid East, Central/South Asia, Eastern Europe | | Monthly |
King Street Capital, Ltd., Class S, Series 53 | | | 12 | | | 0.0 | | PacRim Developed, Western Europe | | Quarterly |
Pentwater Event Fund, Ltd., Class F-NV-U, Initial Series | | | 4,616,351 | | | 7.0 | | North America, PacRim Developed, Western Europe | | Monthly |
York Investment, Ltd., Class D-U: | | | | | | | | North America, Western Europe | | Quarterly |
Series 1 | | | 1,093,545 | | | 1.6 | | | | |
Series 2-2014 | | | 323,885 | | | 0.5 | | | | |
Fundamental Long/Short | | | | | | | | | | |
Anchor Bolt Offshore Fund Ltd., Class A1, Series1 | | | 3,362,627 | | | 5.1 | | Global | | Quarterly |
Blue Harbour Strategic Value Partners Offshore, Ltd., Class 1,
Series 09-2014 | | | 2,382,609 | | | 3.6 | | North America | | Annually |
Glenview Capital Partners (Cayman), Ltd., Series G/84 | | | 2,764,162 | | | 4.2 | | North America, Western Europe | | Quarterly |
Hitchwood Capital Fund Ltd., Series A1: | | | | | | | | | | |
07/2014 | | | 2,438,085 | | | 3.7 | | Global | | Quarterly |
11/2014 | | | 364,973 | | | 0.5 | | | | |
Myriad Opportunities Offshore Fund, Ltd., Class B, Series 40 | | | 5,132,282 | | | 7.8 | | Central/South Asia, PacRim Developed, PacRim Emerging | | Quarterly |
One William Street Capital Offshore Fund, Ltd., Class DD: | | | | | | | | | | |
Initial Series AA | | | 1,964,438 | | | 3.0 | | North America | | Quarterly |
Series 01-2014 | | | 396,069 | | | 0.6 | | | | |
Series 02-2014 | | | 335,264 | | | 0.5 | | | | |
Panning Overseas Fund, Ltd., Series A-1, Initial Series | | | 2,758,292 | | | 4.2 | | North America, Western Europe | | Quarterly |
Pelham Long/Short Fund, Ltd., Class A | | | 2,739,156 | | | 4.1 | | Western Europe | | Monthly |
| | | | | | |
| 16 | | BLACKROCK PREFERRED PARTNERS LLC | | SEPTEMBER 30, 2015 | | |
| | |
| Notes to Financial Statements (continued) | | |
| | | | | | | | | | |
| Investment | | Value | | | % of Fund’s
Members’
Capital | | Primary Geographic Locations* | | Redemptions
Permitted** |
Relative Value | | | | | | | | | | |
Achievement Fund, Ltd. (FKA Peak6 Achievement Fund, Ltd.), Class E, | | | | | | | | | | |
Non-Voting Shares: | | | | | | | | | | |
Initial Series | | $ | 1,870,569 | | | 2.8% | | North America, Western Europe | | Monthly |
Series 02-2014 | | | 206,689 | | | 0.3 | | | | |
BG Fund, Class D | | | 3,048,900 | | | 4.6 | | North America, PacRim Developed, Western Europe | | Monthly |
Citadel Global Fixed Income Fund, Ltd., Class A | | | 3,822,210 | | | 5.8 | | North America, Western Europe | | Monthly |
Magnetar Capital Fund II, Ltd., Class G: | | | | | | | | | | |
Series 14 | | | 679,847 | | | 1.0 | | North America, Western Europe | | Quarterly |
Series 15 | | | 206,101 | | | 0.3 | | | | |
Series 16 | | | 169,431 | | | 0.3 | | | | |
Series 17 | | | 229,876 | | | 0.4 | | | | |
Series 18 | | | 430,547 | | | 0.7 | | | | |
Series 19 | | | 228,564 | | | 0.4 | | | | |
Series 21 | | | 283,982 | | | 0.4 | | | | |
Series 22 | | | 116,347 | | | 0.2 | | | | |
Pine River Liquid Rates Fund, Ltd., Class Q-A, Series 29 | | | 2,141,370 | | | 3.2 | | North America, PacRim Developed, Western Europe | | Monthly |
Stratus Feeder LP, Series 1.5 | | | 3,330,964 | | | 5.0 | | North America | | Monthly |
Total | | $ | 65,686,291 | | | 99.4% | | | | |
* Primary Geographic Locations is based upon information of which the Fund is aware regarding the geographic allocations of the investments held by the Portfolio Funds in which the Fund invests. The Fund does not have sufficient portfolio holdings information with respect to the Portfolio Funds to monitor such positions on a look through basis. The information regarding the geographic allocation of investments held by the Portfolio Funds is derived from periodic information provided to the Fund by the managers of such Portfolio Funds. The information in this table represents only information that has been made available to the Fund with respect to investments held by the Portfolio Funds as of September 30, 2015. This information has not been independently verified by the Fund and may not be representative of the current geographic allocation of investments held by the Portfolio Funds since such Portfolio Funds are actively managed and this information is generally provided by the Portfolio Funds on a delayed basis after the date of such information.
** Redemptions Permitted reflects general redemption terms for each Portfolio Fund and excludes any temporary liquidity restrictions.
The agreements related to investments in Portfolio Funds provide for compensation to the investment managers/general partners of such Portfolio Funds in the form of management fees generally ranging from 1% to 3% (per annum) of members’ capital and incentive fees/allocations generally ranging from 15% to 25% of the net profits earned. The Portfolio Funds’ management fees and incentive fees/allocations are included in net change in unrealized appreciation/depreciation on investments in the Statement of Operations.
The table below summarizes the fair value and other pertinent liquidity information of the underlying Portfolio Funds by class:
| | | | | | | | | | | | | | | | | | |
| Major Category | | Fair Value | | | Illiquid
Investments (1) | | Gates (2) | | | Lock-ups (3) | | | Redemption
Frequency (4) | | Redemption
Notice Period (4) |
Relative Value (a) | | $ | 16,765,397 | | | — | | $ | 4,918,305 | | | $ | 2,077,258 | | | Monthly, Quarterly | | 30-90 Days |
Fundamental Long/Short (b) | | | 24,637,957 | | | — | | | 3,849,212 | | | | 8,300,506 | | | Monthly, Quarterly, Annually | | 45-90 Days |
Event Driven (c) | | | 10,739,043 | | | $12 | | | 1,154,088 | | | | — | | | Monthly, Quarterly | | 30-90 Days |
Directional Trading (d) | | | 13,543,894 | | | — | | | 2,934,059 | | | | — | | | Monthly, Quarterly | | 30-75 Days |
Total | | $ | 65,686,291 | | | $12 | | $ | 12,855,664 | | | $ | 10,377,764 | | | | | |
| | | | | | | | |
(1) Represents private investment funds that cannot be voluntarily redeemed by the Fund at any time. This includes: (i) private investment funds that are liquidating and making distribution payments as their underlying assets are sold, (ii) suspended redemptions/withdrawals, and (iii) side pocket holdings. These types of investments may be realized within 1 to 3 years from September 30, 2015, depending on the specific investment and market conditions. This does not include private investment funds with gates and lockups, which are noted above.
(2) Represents the portion of the Portfolio Funds for which there are investor level gates, which are not otherwise included as illiquid investments.
| | | | | | |
| | | BLACKROCK PREFERRED PARTNERS LLC | | SEPTEMBER 30, 2015 | | 17 |
| | |
| Notes to Financial Statements (continued) | | |
(3) Represents investments that cannot be redeemed without a fee due to a lock-up provision, which are not otherwise included as illiquid investments or investments with gates. The lock-up period for these investments ranged from 6 to 23 months at September 30, 2015.
(4) Redemption frequency and redemption notice period reflect general redemption terms, and exclude liquidity restrictions noted above.
(a) Relative value strategies seek to profit from the mispricing of financial instruments relative to each other or historical norms. These strategies utilize quantitative and qualitative analyses to identify securities or spreads between securities that deviate from their theoretical fair value and/or historical norms. The application of the Valuation Procedures to investments in this category did not result in any Adjusted Fair Values as of September 30, 2015. The fair values of the investments in this category have been estimated based on the net asset values provided by management of the Portfolio Funds.
(b) Fundamental long/short strategies involve buying or selling predominantly corporate securities believed to be over- or underpriced relative to their potential value. Investment strategies in this category include long and short equity- or credit-based strategies, which emphasize a fundamental valuation framework, and equity active value strategies, where an active role is taken to enhance corporate value. The application of the Valuation Procedures to investments in this category did not result in any Adjusted Fair Values as of September 30, 2015. The fair values of the investments in this category have been estimated based on the net asset values provided by management of the Portfolio Funds.
(c) Event-driven strategies concentrate on companies that are subject to corporate events such as mergers, acquisitions, restructurings, spin-offs, shareholder activism or other special situations that alter a company’s financial structure or operating strategy. The intended goal of these strategies is to profit when the price of a security changes to reflect more accurately the likelihood and potential impact of the occurrence, or nonoccurrence, of the event. The application of the Valuation Procedures to investments in this category did not result in any Adjusted Fair Values as of September 30, 2015. The fair values of the investments in this category have been estimated based on the net asset values provided by management of the Portfolio Funds.
(d) Directional trading seeks to profit in changes from macro-level exposures, such as broad securities markets, interest rates, exchange rates and commodities. Examples include global macro strategies that express macroeconomic views based on analysis of fundamental factors and managed futures strategies, which select futures instruments based typically on systematic technical analysis. The application of the Valuation Procedures to investments in this category did not result in any Adjusted Fair Values as of September 30, 2015. The fair values of the investments in this category have been estimated based on the net asset values provided by management of the Portfolio Funds.
The Fund had no unfunded capital commitments as of September 30, 2015.
5. Investment Advisory Agreement and Other Transactions with Affiliates:
The PNC Financial Services Group, Inc. is the largest stockholder and an affiliate of BlackRock, for 1940 Act purposes.
The Fund entered into an Investment Advisory Agreement with the Advisor to provide investment advisory services. The Fund pays the Advisor an annual fee accrued monthly and payable quarterly in arrears, in an amount equal to 0.75% of the Fund’s month-end members’ capital.
The Fund has entered into an expense limitation agreement (“Expense Agreement”) in which the Advisor has agreed to reimburse certain operating and other expenses of the Fund in order to limit certain expenses to 0.50% per annum of the Fund’s average month-end members’ capital (the “Expense Cap”). Expenses covered by the Expense Cap include all of the Fund’s expenses other than those expressly excluded by the Expense Agreement as follows: (i) the investment management fee, (ii) interest expense, if any, (iii) expenses incurred directly or indirectly by the Fund as a result of expenses related to investing in, or incurred by, a Portfolio Fund or other permitted investment, (iv) any trading-related expenses, including, but not limited to, clearing costs and commissions, (v) dividends on short sales, if any, (vi) any extraordinary expenses not incurred in the ordinary course of the Fund’s business (including, without limitation, litigation expenses) and (vii) if applicable, the distribution fees paid to BlackRock Investments, LLC (“BRIL”) or financial intermediaries.
If the Fund has received a waiver or reimbursement from the Advisor within the prior two fiscal years and the Fund’s operating expenses are less than the expense limit for the Fund, the Advisor is entitled to be reimbursed by the Fund up to the lesser of (a) the amount of fees waived or expenses reimbursed during those prior two fiscal years under the agreement and (b) the amount by which the expense limit for the Fund exceeds the operating expenses of the Fund for the current fiscal year, provided that: (1) the Fund has more than $50 million in assets for the fiscal year and (2) the Advisor or an affiliate continues to serve as the Fund’s investment advisor or administrator. In the event the expense limit for the Fund is changed subsequent to a fiscal year in which the Advisor becomes entitled to reimbursement for fees waived or reimbursed, the amount available to reimburse the Advisor shall be calculated by reference to the expense limit for the Fund in effect at the time the Advisor became entitled to receive such reimbursement, rather than the subsequently changed expense limit for the Fund.
| | | | | | |
| 18 | | BLACKROCK PREFERRED PARTNERS LLC | | SEPTEMBER 30, 2015 | | |
| | |
| Notes to Financial Statements (continued) | | |
On September 30, 2015, the amounts subject to possible future recoupment under the expense limitation agreement were as follows:
| | | | | | |
| | | 2016 | | 2017 | | 2018 |
Expiring March 31, | | $242,757 | | $172,537 | | $115,194 |
The Fund entered into a Distribution Agreement with BRIL, an affiliate of the Advisor. Pursuant to a Distribution Plan approved by the Fund’s Board, the Fund pays BRIL ongoing distribution fees. The fees are accrued monthly and paid quarterly in arrears at an annual rate equal to 0.75% of the Fund’s month-end members’ capital.
Certain officers and/or directors of the Fund are officers and/or directors of BlackRock or its affiliates. The Fund reimburses the Advisor for a portion of the compensation paid to the Fund’s Chief Compliance Officer, which is included in officers and directors in the Statement of Operations.
6. Purchases and Sales:
For the six months ended September 30, 2015, purchases and sales of investments, excluding short-term securities, were $2,675,000 and $8,473,789, respectively.
7. Income Tax Information:
It is the Fund’s policy to comply with the requirements of the Internal Revenue Code of 1986, as amended, applicable to regulated investment companies, and to distribute substantially all of its taxable income to its members. Therefore, no federal income tax provision is required.
The Fund files U.S. federal and various state and local tax returns. No income tax returns are currently under examination. The statute of limitations on the Fund’s U.S. federal tax returns remains open for each of the four periods ended March 31, 2015. The statutes of limitations on the Fund’s state and local tax returns may remain open for an additional year depending upon the jurisdiction.
Management has analyzed tax laws and regulations and their application to the Fund as of September 30, 2015, inclusive of the open tax years, and does not believe there are any uncertain tax positions that require recognition of a tax liability in the Fund’s financial statements.
As of March 31, 2015, the Fund had capital loss carryforwards, with no expiration dates, available to offset future realized capital gains of $857,621.
As of September 30, 2015, gross unrealized appreciation and depreciation based on cost for federal income tax purposes were as follows:
| | | | |
Tax cost | | $ | 69,994,312 | |
| | | | |
Gross unrealized appreciation | | | — | |
Gross unrealized depreciation | | $ | (4,308,021 | ) |
| | | | |
Net unrealized depreciation | | $ | (4,308,021 | ) |
| | | | |
8. Principal Risks:
The Fund’s investments in Portfolio Funds involve varying degrees of interest rate risk, credit and counterparty risk, and market, industry or geographic concentration risks for the Fund. While BlackRock monitors these risks, the varying degrees of transparency into and potential illiquidity of the securities in the Portfolio Funds may hinder BlackRock’s ability to effectively manage and mitigate these risks.
The Fund may, from time to time, allocate a significant percentage of its assets to Portfolio Funds with certain investment strategies. As of September 30, 2015, the Fund allocated a significant percentage of its assets to Portfolio Funds that employ fundamental long/short strategies and relative value strategies. Fundamental long/short strategies involve the risk of significant losses to Portfolio Funds (and thus the Fund) if the Portfolio Fund manager’s analysis regarding the valuation of the securities is incorrect or based on inaccurate information. In addition, long and short positions may or may not be related. If the long and short positions are not related, it is possible to have investment losses in both the long and short sides of the portfolio. In the event that the perceived mispricings underlying one or more trading positions were to fail to converge toward, or were to diverge further from, expected relationships, the Portfolio Fund may incur significant losses, which could impact the value of the Fund. Fundamental long-short strategies may also expose Portfolio Funds (and thus the Fund) to risks relating to leverage, portfolio turnover, concentration of the Portfolio Fund’s investment portfolio and short-selling. Relative value strategies involve the risk that such strategy may fail to profit fully or at all or may suffer a loss or a greater loss due to a failure of the component position prices to converge or diverge as anticipated. In addition, a reduction in the volatility and market inefficiencies that create relative value opportunities may limit the Portfolio Funds’ ability to engage in relative value strategies and adversely affect the value of such Portfolio Funds (and thus the Fund).
| | | | | | |
| | | BLACKROCK PREFERRED PARTNERS LLC | | SEPTEMBER 30, 2015 | | 19 |
| | |
| Notes to Financial Statements (continued) | | |
The Portfolio Funds in which the Fund is invested utilize a wide variety of financial instruments in their trading strategies including over-the-counter options, financial futures contracts, forward contracts and swap agreements, and securities sold but not yet purchased. Several of these financial instruments contain varying degrees of off-balance sheet risk where the maximum potential loss on a particular financial instrument may be in excess of the amounts recorded on each Portfolio Fund’s balance sheet. The Portfolio Funds are required to account for all investments on a fair value basis, and recognize changes in unrealized gains and losses in their statements of operations. In determining the fair values for these financial instruments, the Portfolio Funds will make estimates about future interest rates, default probabilities, volatilities and other pricing factors. These estimates of fair value could differ from actual results.
The Fund’s maximum exposure to market risks of the Portfolio Funds is limited to amounts included in the Fund’s investments in Portfolio Funds recorded as assets on the Statement of Assets, Liabilities and Members’ Capital.
The Fund is designed primarily for long term investors and an investment in the Fund’s Units should be considered to be illiquid. The Fund’s Units are not and will not be listed for trading on a securities exchange. Members may not be able to sell their Units as it is unlikely that a secondary market for the Units will develop or, if a secondary market does develop, members may be able to sell their Units only at substantial discounts from net asset value. Additionally, transfers of Units generally may not be effected without the express written consent of the Board or it’s delegate. The Fund may, but is not obligated to, conduct tender offers to repurchase outstanding Units. If the Fund does conduct tender offers, it may be required to sell its more liquid, higher quality portfolio securities to purchase Units that are tendered, which may increase risks for remaining members and increase Fund expenses.
The Portfolio Funds invest in securities and investments with various degrees of liquidity and as such the Fund is subject to certain redemption/ withdrawal provisions, in accordance with the Portfolio Funds’ offering agreements.
Certain of the Fund’s Portfolio Funds may utilize leverage. The cumulative effect of the use of leverage by Portfolio Funds in a market that moves adversely to such Portfolio Funds could result in a substantial loss to the Fund, which would be greater than if the Portfolio Funds were not leveraged. Leverage increases the risk and volatility of Portfolio Funds and, as a consequence, the Fund’s risk and volatility.
Certain of the Fund’s Portfolio Funds have the ability to suspend redemptions/withdrawals, and restrict redemptions/withdrawals through the creation of side pockets. The Fund’s ability to liquidate its investment in Portfolio Funds that had imposed such provisions may be adversely impacted. In such cases, until the Fund is permitted to liquidate its interest in the Portfolio Fund, any interest the Fund retains in such Portfolio Fund remains subject to continued exposure to changes in valuations.
The Fund also invests in closed-end investments that may not permit redemptions/withdrawals or in Portfolio Funds that impose an initial “lockup” period before a redemption/withdrawal can be made. In addition, certain of the Fund’s Portfolio Funds have the ability to impose redemption gates, and in so doing, may reduce the Fund’s requested redemption/withdrawal below the requested amount. The amount of the Fund’s assets subject to lockups and gates is described in Note 3.
9. Capital Transactions:
For the year ended March 31, 2015, Units issued and outstanding decreased 375,144 as a result of Units repurchased in tender offers. For the six months ended September 30, 2015, Units issued and outstanding decreased 499,952 as a result of Units repurchased in tender offers. At September 30, 2015, 485,980 Units were owned by BlackRock Holdco 2, Inc., an affiliate of the Fund.
Units are offered at closings, for purchase as of the first business day of each month or at such other times as determined in the discretion of the Board.
The Fund may choose to conduct quarterly tender offers for up to 15% of its net asset value at the time in the sole discretion of its Board. In a tender offer, the Fund repurchases outstanding Units at the Fund’s net asset value on the valuation date for the tender offer, which would generally be the last business day of March, June, September or December. In any given year, the Advisor may or may not recommend to the Board that the Fund conduct tender offers. Accordingly, there may be years in which no tender offer is made. Therefore, Units will not be redeemable at an investor’s option nor will they be exchangeable for shares of any other fund.
| | | | | | |
| 20 | | BLACKROCK PREFERRED PARTNERS LLC | | SEPTEMBER 30, 2015 | | |
| | |
| Notes to Financial Statements (concluded) | | |
Tender offers were as follows:
| | | | | | | | | | |
Commencement Date1 | | Valuation Date | | Units Offered
to Repurchase | | | Tendered
Units | |
| June 28, 2013 | | September 30, 2013 | | | 816,555 | | | | 20,420 | |
| September 27, 2013 | | December 31, 2013 | | | 866,423 | | | | 407,864 | |
| December 26, 2013 | | March 31, 2014 | | | 989,446 | | | | 330,000 | |
| March 27, 2014 | | June 30, 2014 | | | 1,144,353 | | | | 581,318 | |
| June 27, 2014 | | September 30, 2014 | | | 1,169,187 | | | | 430,411 | |
| September 26, 2014 | | December 31, 2014 | | | 1,134,890 | | | | 423,950 | |
| December 29, 2014 | | March 31, 2015 | | | 1,121,250 | | | | 468,852 | |
| March 27, 2015 | | June 30, 2015 | | | 1,127,088 | | | | 386,390 | |
| June 29, 2015 | | September 30, 2015 | | | 1,076,435 | | | | — | 2 |
| September 29, 2015 | | December 31, 2015 | | | 1,042,852 | | | | — | 2 |
| | 1 | | Date the tender offer period begins. |
| | 2 | | The number of tendered Units will be included in each of the Fund’s final amendments to its Schedule TO related to each tender offer. Each final amendment will be filed with the Securities and Exchange Commission (“SEC”) upon payment of the final proceeds. The proceeds are paid in accordance with the terms and dates described in each Schedule TO filed with the SEC (typically an initial payment of approximately 90% within 45 days and the balance within 90 days from the tender offer’s valuation date). |
Tendered Unit amounts are shown as repurchase of Units resulting from tender offers in the Statements of Changes in Members’ Capital.
A 2.00% early repurchase fee payable to the Fund will be charged to any member that tenders its Units to the Fund in connection with a tender offer with a valuation date that is prior to the one-year anniversary of the member’s purchase of the respective Units. The purpose of the 2.00% early repurchase fee is to reimburse the Fund for the costs incurred in liquidating investments in the Fund’s portfolio in order to honor the member’s repurchase request and to discourage short-term investments which are generally disruptive to the Fund’s investment program. This early repurchase fee would apply separately to each purchase of Units made by a member.
The Fund may, in its sole discretion, waive the early repurchase fee under certain circumstances described in the Fund’s prospectus.
10. Subsequent Events:
Management has evaluated the impact of all subsequent events on the Fund through the date the financial statements were issued and has determined that there were no subsequent events requiring adjustment or additional disclosure
| | | | | | |
| | | BLACKROCK PREFERRED PARTNERS LLC | | SEPTEMBER 30, 2015 | | 21 |
| | |
| Disclosure of Investment Advisory Agreement | | |
The Board of Directors (the “Board,” the members of which are referred to as “Board Members”) of BlackRock Preferred Partners LLC (the “Fund”) met in person on April 30, 2015 (the “April Meeting”) and June 11-12, 2015 (the “June Meeting”) to consider the approval of the Fund’s investment advisory agreement (the “Advisory Agreement”) with BlackRock Advisors, LLC (the “Manager”), the Fund’s investment advisor. The Manager is also referred to herein as “BlackRock.”
Activities and Composition of the Board
On the date of the April and June Meetings, the Board consisted of eleven individuals, nine of whom were not “interested persons” of the Fund as defined in the Investment Company Act of 1940 (the “1940 Act”) (the “Independent Board Members”). The Board Members are responsible for the oversight of the operations of the Fund and perform the various duties imposed on the directors of investment companies by the 1940 Act. The Independent Board Members have retained independent legal counsel to assist them in connection with their duties. The Chairman of the Board is an Independent Board Member. The Board has established six standing committees: an Audit Committee, a Governance and Nominating Committee, a Compliance Committee, a Performance Oversight Committee, an Executive Committee, and a Leverage Committee, each of which is chaired by an Independent Board Member and composed of Independent Board Members (except for the Executive Committee and the Leverage Committee, each of which also has one interested Board Member).
The Advisory Agreement
Pursuant to the 1940 Act, the Board is required to consider the continuation of the Advisory Agreement on an annual basis. The Board has four quarterly meetings per year, each extending over two days, a fifth one-day meeting to consider specific information surrounding the consideration of renewing the Advisory Agreement and additional in-person and telephonic meetings as needed. In connection with this year-long deliberative process, the Board assessed, among other things, the nature, extent and quality of the services provided to the Fund by BlackRock, BlackRock’s personnel and affiliates, including, as applicable, investment management services, administrative, and shareholder services; the oversight of fund service providers; marketing services; risk oversight; compliance; and ability to meet applicable legal and regulatory requirements.
The Board, acting directly and through its committees, considers at each of its meetings, and from time to time as appropriate, factors that are relevant to its annual consideration of the renewal of the Advisory Agreement, including the services and support provided by BlackRock to the Fund and its members. Among the matters the Board considered were: (a) investment performance for one-year, three-year, five-year and/or since inception periods, as applicable, against its custom benchmark and other performance metrics, as well as senior management’s and portfolio managers’ analysis of the reasons for any over-performance or underperformance relative to its custom benchmark and performance metrics; (b) fees, including advisory, administration, if applicable, and other amounts paid to BlackRock and its affiliates by the Fund for services such as call center; (c) Fund operating expenses and how BlackRock allocates expenses to the Fund; (d) the resources devoted to, risk oversight of, and compliance reports relating to, implementation of the Fund’s investment objective, policies and restrictions, and meeting new regulatory requirements; (e) the Fund’s compliance with its compliance policies and procedures; (f) the nature, cost and character of non-investment management services provided by BlackRock and its affiliates; (g) BlackRock’s and other service providers’ internal controls and risk and compliance oversight mechanisms; (h) BlackRock’s implementation of the proxy voting policies approved by the Board; (i) the use of brokerage commissions and execution quality of portfolio transactions; (j) BlackRock’s implementation of the Fund’s valuation and liquidity procedures; (k) an analysis of management fees for products with similar investment mandates across the open-end fund, closed-end fund and institutional account product channels, as applicable, and the similarities and differences between these products and the services provided as compared to the Fund; (l) BlackRock’s compensation methodology for its investment professionals and the incentives it creates, along with investment professionals’ investments in the fund(s) they manage; and (m) periodic updates on BlackRock’s business.
The Board has engaged in an ongoing strategic review with BlackRock of opportunities to consolidate funds and of BlackRock’s commitment to investment performance. BlackRock also furnished information to the Board in response to specific questions. These questions covered issues such as: BlackRock’s profitability; investment performance; funds trading at a discount; subadvisory and advisory relationships with other clients (including mutual funds sponsored by third parties); fund size; portfolio manager’s investments in the funds they manage; and management fee levels and breakpoints. The Board further discussed with BlackRock: BlackRock’s management structure; portfolio turnover; BlackRock’s portfolio manager compensation and performance accountability; marketing support for the funds; services provided to the funds by BlackRock affiliates; and BlackRock’s oversight of relationships with third party service providers.
Board Considerations in Approving the Advisory Agreement
The Approval Process: Prior to the April Meeting, the Board requested and received materials specifically relating to the Advisory Agreement. The Board is continuously engaged in a process with its independent legal counsel and BlackRock to review the nature and scope of the information provided to
| | | | | | |
| 22 | | BLACKROCK PREFERRED PARTNERS LLC | | SEPTEMBER 30, 2015 | | |
| | |
| Disclosure of Investment Advisory Agreement (continued) | | |
better assist its deliberations. The materials provided in connection with the April Meeting included (a) information independently compiled and prepared by Lipper, Inc. (“Lipper”) on Fund fees and expenses as compared with a peer group of funds as determined by Lipper (“Expense Peers”) and the investment performance of the Fund as compared with its custom benchmark and certain performance metrics; (b) information on the profits realized by BlackRock and its affiliates pursuant to the Advisory Agreement and a discussion of fall-out benefits to BlackRock and its affiliates; (c) a general analysis provided by BlackRock concerning investment management fees charged to other clients, such as institutional clients, sub-advised mutual funds, and open-end funds, under similar investment mandates, as applicable; (d) review of non-management fees; (e) the existence, impact and sharing of potential economies of scale; (f) a summary of aggregate amounts paid by the Fund to BlackRock and (g) if applicable, a comparison of management fees to similar BlackRock closed-end funds, as classified by Lipper.
At the April Meeting, the Board reviewed materials relating to its consideration of the Advisory Agreement. As a result of the discussions that occurred during the April Meeting, and as a culmination of the Board’s year-long deliberative process, the Board presented BlackRock with questions and requests for additional information. BlackRock responded to these requests with additional written information in advance of the June Meeting.
At the June Meeting, the Board, including the Independent Board Members, unanimously approved the continuation of the Advisory Agreement between the Manager and the Fund for a one-year term ending June 30, 2016. In approving the continuation of the Advisory Agreement, the Board considered: (a) the nature, extent and quality of the services provided by BlackRock; (b) the investment performance of the Fund and BlackRock; (c) the advisory fee and the cost of the services and profits to be realized by BlackRock and its affiliates from their relationship with the Fund; (d) the Fund’s costs to investors compared to the costs of Expense Peers and performance compared to the relevant performance comparison as previously discussed; (e) the sharing of potential economies of scale; (f) fall-out benefits to BlackRock and its affiliates as a result of its relationship with the Fund; and (g) other factors deemed relevant by the Board Members.
The Board also considered other matters it deemed important to the approval process, such as payments made to BlackRock or its affiliates relating to the distribution of Fund units, services related to the valuation and pricing of Fund portfolio holdings, direct and indirect benefits to BlackRock and its affiliates from their relationship with the Fund and advice from independent legal counsel with respect to the review process and materials submitted for the Board’s review. The Board noted the willingness of BlackRock personnel to engage in open, candid discussions with the Board. The Board did not identify any particular information as determinative, and each Board Member may have attributed different weights to the various items considered.
A. Nature, Extent and Quality of the Services Provided by BlackRock:
The Board, including the Independent Board Members, reviewed the nature, extent and quality of services provided by BlackRock, including the investment advisory services and the resulting performance of the Fund. Throughout the year, the Board compared Fund performance to the performance of a relevant benchmark and performance metrics. The Board met with BlackRock’s senior management personnel responsible for investment activities, including the senior investment officers. The Board also reviewed the materials provided by the Fund’s portfolio management team discussing the Fund’s performance and the Fund’s investment objective(s), strategies and outlook.
The Board considered, among other factors, with respect to BlackRock: the number, education and experience of investment personnel generally and the Fund’s portfolio management team; BlackRock’s research capabilities; investments by portfolio managers in the funds they manage; portfolio trading capabilities; use of technology; commitment to compliance; credit analysis capabilities; risk analysis and oversight capabilities; and the approach to training and retaining portfolio managers and other research, advisory and management personnel. The Board engaged in a review of BlackRock’s compensation structure with respect to the Fund’s portfolio management team and BlackRock’s ability to attract and retain high-quality talent and create performance incentives.
In addition to advisory services, the Board considered the quality of the administrative and other non-investment advisory services provided to the Fund. BlackRock and its affiliates provide the Fund with certain services (in addition to any such services provided to the Fund by third parties) and officers and other personnel as are necessary for the operations of the Fund. In particular, BlackRock and its affiliates provide the Fund with the following administrative services including, among others: (i) preparing disclosure documents, such as the prospectus and the statement of additional information in connection with the initial and continuous public offering and periodic shareholder reports; (ii) oversight of daily accounting and pricing; (iii) preparing periodic filings with regulators; (iv) overseeing and coordinating the activities of other service providers; (v) organizing Board meetings and preparing the materials for such Board meetings; (vi) providing legal and compliance support; (vii) furnishing analytical and other support to assist the Board in its consideration of strategic issues such as the merger, consolidation or repurposing of certain closed-end funds; and (viii) performing other administrative functions necessary for the operation of the Fund, such as tax reporting, fulfilling regulatory filing requirements and call center services. The Board reviewed the structure and duties of BlackRock’s fund administration, shareholder services, legal and compliance departments and considered BlackRock’s policies and procedures for assuring compliance with applicable laws and regulations.
| | | | | | |
| | | BLACKROCK PREFERRED PARTNERS LLC | | SEPTEMBER 30, 2015 | | 23 |
| | |
| Disclosure of Investment Advisory Agreement (continued) | | |
B. The Investment Performance of the Fund and BlackRock:
The Board, including the Independent Board Members, also reviewed and considered the performance history of the Fund. In preparation for the April Meeting, the Board worked with its independent legal counsel, BlackRock and Lipper to develop a template for an analysis of the Fund’s performance. In connection with its review, the Board received and reviewed information provided by BlackRock regarding the investment performance of the Fund as compared with its custom benchmark and certain performance metrics. The Board was provided with a description of the customized benchmark used by BlackRock to prepare the information regarding the Fund’s performance. The Board and its Performance Oversight Committee regularly review, and meet with Fund management to discuss, the performance of the Fund throughout the year.
In evaluating performance, the Board recognized that the performance data reflects a snapshot of a period or as of a particular date and that selecting a different performance period could produce significantly different results. Further, the Board recognized that it is possible that long-term performance can be adversely affected by even one period of significant underperformance so that a single investment decision or theme has the ability to affect long-term performance disproportionately.
The Board noted that for the one-year, three-year and since-inception periods reported, the Fund underperformed, exceeded and exceeded, respectively, its customized benchmark. BlackRock believes that performance relative to the customized benchmark is an appropriate performance metric for the Fund. The Board also noted a comparison of Fund performance relative to certain other performance metrics that reflect the Fund’s performance in light of its outcome-oriented objective. BlackRock believes that these additional performance metrics are appropriate given the Fund’s objective.
C. Consideration of the Advisory/Management Fees and the Cost of the Services and Profits to be Realized by BlackRock and its Affiliates from their Relationship with the Fund:
The Board, including the Independent Board Members, reviewed the Fund’s contractual management fee rate compared with the other funds in its Lipper category. The contractual management fee rate represents a combination of the advisory fee and any administrative fees, before taking into account any reimbursements or fee waivers. The Board also compared the Fund’s total expense ratio, as well as its actual management fee rate as a percentage of total assets, to those of other funds in its Lipper category. The total expense ratio represents a fund’s total net operating expenses, including any 12b-1 or non 12b-1 service fees, but excluding any investment related expenses. The total expense ratio gives effect to any expense reimbursements or fee waivers that benefit a fund, and the actual management fee rate gives effect to any management fee reimbursements or waivers that benefit a fund. The Board considered the services provided and the fees charged by BlackRock and its affiliates to other types of clients with similar investment mandates, as applicable, including institutional accounts and sub-advised mutual funds.
The Board received and reviewed statements relating to BlackRock’s financial condition. The Board reviewed BlackRock’s profitability methodology and was also provided with a profitability analysis that detailed the revenues earned and the expenses incurred by BlackRock for services provided to the Fund. The Board reviewed BlackRock’s profitability with respect to the Fund and other funds the Board currently oversees for the year ended December 31, 2014 compared to available aggregate profitability data provided for the prior two years. The Board reviewed BlackRock’s profitability with respect to certain other U.S. fund complexes managed by the Manager and/or its affiliates. The Board reviewed BlackRock’s assumptions and methodology of allocating expenses in the profitability analysis, noting the inherent limitations in allocating costs among various advisory products. The Board recognized that profitability may be affected by numerous factors including, among other things, fee waivers and expense reimbursements by the Manager, the types of funds managed, precision of expense allocations and business mix. As a result, calculating and comparing profitability at individual fund levels is difficult.
The Board noted that, in general, individual fund or product line profitability of other advisors is not publicly available. The Board reviewed BlackRock’s overall operating margin, in general, compared to that of certain other publicly-traded asset management firms. The Board considered the differences between BlackRock and these other firms, including the contribution of technology at BlackRock, BlackRock’s expense management, and the relative product mix.
In addition, the Board considered the cost of the services provided to the Fund by BlackRock, and BlackRock’s and its affiliates’ profits relating to the management of the Fund and the other funds advised by BlackRock and its affiliates. As part of its analysis, the Board reviewed BlackRock’s methodology in allocating its costs to the management of the Fund. The Board may periodically receive and review information from independent third parties as part of its annual evaluation. BlackRock retained an independent third party to evaluate its cost allocation methodologies in the context of BlackRock’s 1940 Act Fund business. The Board considered the results of that evaluation in connection with BlackRock’s profitability reporting. The Board also considered whether BlackRock has the financial resources necessary to attract and retain high quality investment management personnel to perform its obligations under the Advisory Agreement and to continue to provide the high quality of services that is expected by the Board. The Board further considered factors including but not limited to BlackRock’s commitment of time, assumption of risk and liability profile in servicing the
| | | | | | |
| 24 | | BLACKROCK PREFERRED PARTNERS LLC | | SEPTEMBER 30, 2015 | | |
| | |
| Disclosure of Investment Advisory Agreement (continued) | | |
Fund in contrast to what is required of BlackRock with respect to other products with similar investment mandates across the open-end fund, ETF, closed-end fund, sub-advised mutual fund and institutional account product channels, as applicable.
The Board noted that the Fund’s contractual management fee rate ranked in the first quartile, and that the actual management fee rate and total expense ratio ranked in the second and third quartiles, respectively, relative to the Fund’s Expense Peers. The Board determined that the Fund’s total expense ratio was appropriate in light of the median total expense ratio paid by the Fund’s Expense Peers. The Fund has entered into an expense limitation agreement in which BlackRock has agreed to reimburse certain operating and other expenses of the Fund in order to limit certain expenses, to a specified amount, of the Fund’s average members’ capital.
The Board also received and considered information relating to the Fund’s distribution arrangements, and in particular that the Fund would pay an ongoing distribution fee at the annual rate of 0.75% of the Fund’s month-end net asset value to its distributor, BlackRock Investments, LLC, an affiliate of BlackRock (the “Distributor”). The Board noted that the Distributor generally would pay substantially all of these ongoing fees to financial intermediaries hired by the Distributor to distribute shares of the Fund, but that the Distributor may, in certain circumstances, retain all or a portion of the ongoing distribution fee. In evaluating the benefit of these fees to the Distributor and its affiliates (including BlackRock), the Board noted that: (i) the Distributor generally would not retain these fees, but rather generally would pay them to third-party financial intermediaries; and (ii) these fees would be paid pursuant to a plan of distribution adopted in conformity with Rule 12b-1 under the 1940 Act. The Board also recognized that BlackRock or BlackRock’s affiliates may make additional payments to third-party financial intermediaries from their own assets to promote the distribution of the Fund’s shares and noted BlackRock’s and the Distributor’s view that such payments are made from their own resources, including their legitimate profits, and do not constitute an indirect use of Fund assets for distribution purposes. Upon evaluating these distribution arrangements, the Board concluded that these ongoing distribution fees did not result in a material benefit to the Distributor and its affiliates (including BlackRock).
Additionally, the Board noted that the Fund’s investment program entailed investing in a portfolio of hedge funds. As a result of this investment program, the Board recognized that Fund members would pay two layers of expense – one set of expenses would be borne indirectly and arise from the Fund’s status as an investor in hedge funds, and the other set of expenses would be borne directly by the members as investors in the Fund. The Board noted the level of indirect expenses members would bear as a result of the Fund’s status as a hedge fund investor, noting that hedge fund management fees were generally expected to range between 1% and 3% (annualized) of the hedge fund’s average net asset value and that hedge fund performance allocations or fees were generally expected to range between 15% and 25% of the hedge fund’s net profits. The Board noted that these fees and expenses were a necessary component of the Fund’s investment program, that they would generally fluctuate from year to year and that the BlackRock’s fees were appropriately calibrated in light of these indirect expenses.
D. Economies of Scale:
The Board, including the Independent Board Members, considered the extent to which economies of scale might be realized as the assets of the Fund increase. The Board also considered the extent to which the Fund benefits from such economies and whether there should be changes in the advisory fee rate or breakpoint structure in order to enable the Fund to participate in these economies of scale, for example through the use of breakpoints in the advisory fee based upon the asset level of the Fund.
The Board noted that unlike most closed-end funds that generally do not experience substantial growth after the initial public offering, the Fund’s units are continuously offered and have the potential for growth beyond initial projections used in establishing the Fund’s fee structure. The Board, to the extent it was able to identify any actual or potential economies of scale, considered whether any actual or potential economies of scale were being realized and concluded that the Fund’s fee structure, at this time, appropriately reflected any actual or potential economies of scale presently being realized. The Board noted that it would continue to consider the realization of economies of scale as the Fund grows and in subsequent Board meetings.
E. Other Factors Deemed Relevant by the Board Members:
The Board, including the Independent Board Members, also took into account other ancillary or “fall-out” benefits that BlackRock or its affiliates may derive from their respective relationships with the Fund, both tangible and intangible, such as BlackRock’s ability to leverage its investment professionals who manage other portfolios and risk management personnel, an increase in BlackRock’s profile in the investment advisory community, and the engagement of BlackRock’s affiliates as service providers to the Fund, including securities lending and cash management services. The Board also considered BlackRock’s overall operations and its efforts to expand the scale of, and improve the quality of, its operations. The Board also noted that BlackRock may use and benefit from third party research obtained by soft dollars generated by certain registered fund transactions to assist in managing all or a number of its other client accounts. The Board further noted that it had considered the investment by BlackRock’s funds in exchange traded funds (i.e., ETFs) without any offset against the management fees payable by the funds to BlackRock.
| | | | | | |
| | | BLACKROCK PREFERRED PARTNERS LLC | | SEPTEMBER 30, 2015 | | 25 |
| | |
| Disclosure of Investment Advisory Agreement (concluded) | | |
In connection with its consideration of the Advisory Agreement, the Board also received information regarding BlackRock’s brokerage and soft dollar practices. The Board received reports from BlackRock which included information on brokerage commissions and trade execution practices throughout the year.
The Board also considered the various notable initiatives and projects BlackRock performed in connection with its closed-end fund product line. These initiatives included the redemption of AMPS for the BlackRock closed-end funds with AMPS outstanding; developing equity shelf programs; efforts to eliminate product overlap with fund mergers; ongoing services to manage leverage that has become increasingly complex; share repurchases and other support initiatives for certain BlackRock funds; and continued communications efforts with shareholders, fund analysts and financial advisers. With respect to the latter, the Independent Board Members noted BlackRock’s continued commitment to supporting the secondary market for the common shares of its closed-end funds through a comprehensive secondary market communication program designed to raise investor and analyst awareness and understanding of closed-end funds. BlackRock’s support services included, among other things: continuing communications concerning the redemption efforts related to AMPS; sponsoring and participating in conferences; communicating with closed-end fund analysts covering the BlackRock funds throughout the year; providing marketing and product updates for the closed-end funds; and maintaining and enhancing its closed-end fund website.
Conclusion
The Board, including the Independent Board Members, unanimously approved the continuation of the Advisory Agreement between the Manager and the Fund for a one-year term ending June 30, 2016. Based upon its evaluation of all of the aforementioned factors in their totality, the Board, including the Independent Board Members, was satisfied that the terms of the Advisory Agreement were fair and reasonable and in the best interest of the Fund and its members. In arriving at its decision to approve the Advisory Agreement, the Board did not identify any single factor or group of factors as, all-important or controlling, but considered all factors together, and different Board Members may have attributed different weights to the various factors considered. The Independent Board Members were also assisted by the advice of independent legal counsel in making this determination. The contractual fee arrangements for the Fund reflect the results of several years of review by the Board Members and predecessor Board Members, and discussions between such Board Members (and predecessor Board Members) and BlackRock. As a result, the Board Members’ conclusions may be based in part on their consideration of these arrangements in prior years.
| | | | | | |
| 26 | | BLACKROCK PREFERRED PARTNERS LLC | | SEPTEMBER 30, 2015 | | |
Richard E. Cavanagh, Chairman of the Board and Director
Karen P. Robards, Vice Chairperson of the Board,
Chairperson of the Audit Committee and Director
Michael J. Castellano, Director and Member of the Audit Committee
Frank J. Fabozzi, Director and Member of the Audit Committee
Kathleen F. Feldstein, Director
James T. Flynn, Director and Member of the Audit Committee
Jerrold B. Harris, Director
R. Glenn Hubbard, Director
W. Carl Kester, Director and Member of the Audit Committee
Barbara Novick, Director
John M. Perlowski, Director, President and Chief Executive Officer
Jonathan Diorio, Vice President
Neal Andrews, Chief Financial Officer
Jay Fife, Treasurer
Charles Park, Chief Compliance Officer
and Anti-Money Laundering Officer
Janey Ahn, Secretary
Effective September 18, 2015, Robert W. Crothers resigned as a Vice President of the Fund and Jonathan Diorio became a Vice President of the Fund.
| | | | | | |
| | | | |
Investment Advisor BlackRock Advisors, LLC Wilmington, DE 19809 | | Custodian The Bank of New York Mellon New York, NY 10286 | | Distributor BlackRock Investments, LLC New York, NY 10022 | | Address of the Fund 100 Bellevue Parkway Wilmington, DE 19809 |
| | | | | | |
Legal Counsel Skadden, Arps, Slate, Meagher & Flom LLP Boston, MA 02116 | | Independent Registered Public Accounting Firm Deloitte & Touche LLP Philadelphia, PA 19103 | | Accounting Agent and Administrator BNY Mellon Investment Servicing (US) Inc. Wilmington, DE 19809 | | Transfer Agent BNY Mellon Investment Servicing (US) Inc. Westborough, MA 01581 |
The Fund is currently distributed by BlackRock Investments, LLC. You should consider the investment objectives, risks, charges and expenses of the Fund carefully before investing. The Fund’s prospectus contains this and other information and is available at www.blackrock.com or by calling (800) 441-7762 or from your financial advisor. The prospectus should be read carefully before investing.
| | | | | | |
| | | BLACKROCK PREFERRED PARTNERS LLC | | SEPTEMBER 30, 2015 | | 27 |
During the period, there were no material changes in the Fund’s investment objectives or policies or the Fund’s charter or by-laws that were not approved by the shareholders or in the principal risk factors associated with investment in the Fund. There have been no changes in the persons who are primarily responsible for the day-to-day management of the Fund’s portfolio.
The Fund calculates its NAV as of the close of business on the last Business Day of each calendar month, within approximately 25 calendar days after the last Business Day of such month, and at such other times as the Board may determine. Members desiring to obtain the Fund’s most recently calculated NAV may contact the Fund’s administrator, The Bank of New York Mellon, at 1-866-211-4521. The Fund’s most recently calculated NAV can also be obtained by visiting www.blackrock.com/funds and clicking on “Alternative Investments.”
Electronic Delivery
Members can sign up for e-mail notifications of quarterly statements, annual and semi-annual shareholder reports and prospectuses by enrolling in the electronic delivery program. Electronic copies of shareholder reports are available on BlackRock’s website.
To enroll in electronic delivery:
Shareholders Who Hold Accounts with Investment Advisors, Banks or Brokerages:
Please contact your financial advisor. Please note that not all investment advisors, banks or brokerages may offer this service.
Householding
The Fund will mail only one copy of shareholder documents, including annual and semi-annual reports and proxy statements, to shareholders with multiple accounts at the same address. This practice is commonly called “householding” and is intended to reduce expenses and eliminate duplicate mailings of shareholder documents. Mailings of your shareholder documents may be householded indefinitely unless you instruct us otherwise. If you do not want the mailing of these documents to be combined with those for other members of your household, please call the Fund at (800) 882-0052.
Availability of Quarterly Schedule of Investments
The Fund files its complete schedule of portfolio holdings with the Securities and Exchange Commission (the “SEC”) for the first and third quarters of each fiscal year on Form N-Q. The Fund’s Forms N-Q are available on the SEC’s website at http://www.sec.gov and may also be reviewed and copied at the SEC’s Public Reference Room in Washington, D.C. Information on how to access documents on the SEC’s website without charge may be obtained by calling (800) SEC-0330. The Fund’s Forms N-Q may also be obtained upon request and without charge by calling (800) 882-0052.
Availability of Proxy Voting Policies and Procedures
A description of the policies and procedures that the Fund uses to determine how to vote proxies relating to portfolio securities is available upon request and without charge (1) by calling (800) 882-0052; (2) at http://www.blackrock.com; and (3) on the SEC’s website at http://www.sec.gov.
Availability of Proxy Voting Record
Information about how the Fund voted proxies relating to securities held in the Fund’s portfolios during the most recent 12-month period ended September 30 is available upon request and without charge (1) at www.blackrock.com; or by calling (800) 882-0052; and (2) on the SEC’s website at http://www.sec.gov.
| | | | | | |
| 28 | | BLACKROCK PREFERRED PARTNERS LLC | | SEPTEMBER 30, 2015 | | |
| | |
| Additional Information (concluded) | | |
|
| BlackRock Privacy Principles |
BlackRock is committed to maintaining the privacy of its current and former fund investors and individual clients (collectively, “Clients”) and to safeguarding their non-public personal information. The following information is provided to help you understand what personal information BlackRock collects, how we protect that information and why in certain cases we share such information with select parties.
If you are located in a jurisdiction where specific laws, rules or regulations require BlackRock to provide you with additional or different privacy-related rights beyond what is set forth below, then BlackRock will comply with those specific laws, rules or regulations.
BlackRock obtains or verifies personal non-public information from and about you from different sources, including the following: (i) information we receive from you or, if applicable, your financial intermediary, on applications, forms or other documents; (ii) information about your transactions with us, our affiliates, or others; (iii) information we receive from a consumer reporting agency; and (iv) from visits to our websites.
BlackRock does not sell or disclose to non-affiliated third parties any non-public personal information about its Clients, except as permitted by law or as is necessary to respond to regulatory requests or to service Client accounts. These non-affiliated third parties are required to protect the confidentiality and security of this information and to use it only for its intended purpose.
We may share information with our affiliates to service your account or to provide you with information about other BlackRock products or services that may be of interest to you. In addition, BlackRock restricts access to non-public personal information about its Clients to those BlackRock employees with a legitimate business need for the information. BlackRock maintains physical, electronic and procedural safeguards that are designed to protect the non-public personal information of its Clients, including procedures relating to the proper storage and disposal of such information.
| | | | | | |
| | | BLACKROCK PREFERRED PARTNERS LLC | | SEPTEMBER 30, 2015 | | 29 |
| | |
This report is intended for current holders. It is not a prospectus. Past performance results shown in this report should not be considered a representation of future performance. Statements and other information herein are as dated and are subject to change. | |  |
| | |
Prefp-9/15-SAR | |  |
| | |
Item 2 – | | Code of Ethics – Not Applicable to this semi-annual report |
| | |
Item 3 – | | Audit Committee Financial Expert – Not Applicable to this semi-annual report |
| | |
Item 4 – | | Principal Accountant Fees and Services – Not Applicable to this semi-annual report |
| | |
Item 5 – | | Audit Committee of Listed Registrants – Not Applicable to this semi-annual report |
| | |
Item 6 – | | Investments |
| | (a) The registrant’s Schedule of Investments is included as part of the Report to Stockholders filed under Item 1 of this Form. |
| | (b) Not Applicable due to no such divestments during the semi-annual period covered since the previous Form N-CSR filing. |
| | |
Item 7 – | | Disclosure of Proxy Voting Policies and Procedures for Closed-End Management Investment Companies – Not Applicable to this semi-annual report |
| | |
Item 8 – | | Portfolio Managers of Closed-End Management Investment Companies |
| | (a) Not Applicable to this semi-annual report |
| | (b) As of the date of this filing, there have been no changes in any of the portfolio managers identified in the most recent annual report on Form N-CSR. |
| | |
Item 9 – | | Purchases of Equity Securities by Closed-End Management Investment Company and Affiliated Purchasers – Not Applicable |
| | |
Item 10 – | | Submission of Matters to a Vote of Security Holders – There have been no material changes to these procedures. |
| | |
Item 11 – | | Controls and Procedures |
| | |
| | (a) – The registrant’s principal executive and principal financial officers, or persons performing similar functions, have concluded that the registrant’s disclosure controls and procedures (as defined in Rule 30a-3(c) under the Investment Company Act of 1940, as amended (the “1940 Act”)) are effective as of a date within 90 days of the filing of this report based on the evaluation of these controls and procedures required by Rule 30a-3(b) under the 1940 Act and Rule 13a-15(b) under the Securities Exchange Act of 1934, as amended. |
| | |
| | (b) – There were no changes in the registrant’s internal control over financial reporting (as defined in Rule 30a-3(d) under the 1940 Act) that occurred during the second fiscal quarter of the period covered by this report that have materially affected, or are reasonably likely to materially affect, the registrant’s internal control over financial reporting. |
| | |
Item 12 – | | Exhibits attached hereto |
| | |
| | (a)(1) – Code of Ethics – Not Applicable to this semi-annual report |
| | |
| | (a)(2) – Certifications – Attached hereto |
| | |
| | (a)(3) – Not Applicable |
| | |
| | (b) – Certifications – Attached hereto |
2
Pursuant to the requirements of the Securities Exchange Act of 1934 and the Investment Company Act of 1940, the registrant has duly caused this report to be signed on its behalf by the undersigned, thereunto duly authorized.
BlackRock Preferred Partners LLC
| | |
| By: | | /s/ John M. Perlowski |
| | John M. Perlowski |
| | Chief Executive Officer (principal executive officer) of BlackRock Preferred Partners LLC |
Date: December 2, 2015
Pursuant to the requirements of the Securities Exchange Act of 1934 and the Investment Company Act of 1940, this report has been signed below by the following persons on behalf of the registrant and in the capacities and on the dates indicated.
| | |
| By: | | /s/ John M. Perlowski |
| | John M. Perlowski |
| | Chief Executive Officer (principal executive officer) of BlackRock Preferred Partners LLC |
Date: December 2, 2015
| | |
| By: | | /s/ Neal J. Andrews |
| | Neal J. Andrews |
| | Chief Financial Officer (principal financial officer) of BlackRock Preferred Partners LLC |
Date: December 2, 2015
3