UNITED STATES
SECURITIES AND EXCHANGE COMMISSION
Washington, D.C. 20549
FORM N-CSR
CERTIFIED SHAREHOLDER REPORT OF REGISTERED MANAGEMENT
INVESTMENT COMPANIES
Investment Company Act file number: 811-22550
Name of Fund: BlackRock Preferred Partners LLC
Fund Address: 100 Bellevue Parkway, Wilmington, DE 19809
Name and address of agent for service: John M. Perlowski, Chief Executive Officer, BlackRock Preferred Partners LLC, 55 East 52nd Street, New York, NY 10055
Registrant’s telephone number, including area code: (800) 882-0052, Option 4
Date of fiscal year end: 03/31/2015
Date of reporting period: 03/31/2015
Item 1 – Report to Stockholders
MARCH 31, 2015
BlackRock Preferred Partners LLC
| | |
| Not FDIC Insured ¡ May Lose Value ¡ No Bank Guarantee | | |

Dear Member,
This report reflects your Fund’s reporting period ended March 31, 2015. The following review is intended to provide you with additional market perspective over the past 12 months.
Market volatility has remained low from a long-term perspective, but increased over the course of 2014 amid higher valuations in risk assets (such as equities and high yield bonds), geopolitical risks, uneven global economic growth and uncertainty around policy moves from the world’s largest central banks. As the U.S. Federal Reserve (the “Fed”) gradually reduced its bond buying program (which ultimately ended in October 2014), U.S. interest rates surprisingly trended lower and stock prices forged ahead despite high valuations on the back of a multi-year bull market. Geopolitical tensions intensified in Ukraine and the Middle East and oil prices became highly volatile in the middle of the summer, stoking worries about economic growth outside the United States. As the U.S. economy continued to show steady improvement, the stronger data caused concern among investors that the Fed would raise short-term rates sooner than previously anticipated. The U.S. dollar appreciated and global credit markets tightened, ultimately putting a strain on investor flows, and financial markets broadly weakened in the third quarter.
U.S. economic growth picked up considerably in the fourth quarter while the broader global economy showed signs of slowing. U.S. markets significantly outperformed international markets even as the European Central Bank (“ECB”) and the Bank of Japan eased monetary policy, which drove further strengthening in the U.S. dollar. Oil prices plummeted in the fourth quarter due to a global supply-and-demand imbalance, sparking a selloff in energy-related assets and stress in emerging markets. Fixed income investors piled into U.S. Treasuries as their persistently low yields became relatively attractive as compared to international sovereign debt.
Equity markets reversed in the first quarter of 2015 and U.S. stocks underperformed international markets, notably Europe and Japan, but also emerging markets. Investors had held high expectations for the U.S. economy, but after a harsh winter, first-quarter data disappointed and high valuations took their toll on U.S. stocks. Meanwhile, economic reports in Europe and Asia easily beat investors’ very low expectations for those economies, and accommodative policies from global central banks helped international equities rebound. The ECB’s asset purchase program (announced in January and commenced in March) was the largest in scale and effect on the markets. Overall, market volatility decreased in the first quarter as global risks abated, with a ceasefire in Ukraine and an improving outlook for Greece’s continued membership in the Eurozone.
At BlackRock, we believe investors need to think globally, extend their scope across a broad array of asset classes and be prepared to move freely as market conditions change over time. We encourage you to talk with your financial advisor and visit blackrock.com for further insight about investing in today’s markets.
Sincerely,

Rob Kapito
President, BlackRock Advisors, LLC

Rob Kapito
President, BlackRock Advisors, LLC
| | | | | | | | |
| Total Returns as of March 31, 2015 | |
| | | 6-month | | | 12-month | |
U.S. large cap equities
(S&P 500® Index) | | | 5.93 | % | | | 12.73 | % |
U.S. small cap equities
(Russell 2000® Index) | | | 14.46 | | | | 8.21 | |
International equities
(MSCI Europe, Australasia, Far East Index) | | | 1.13 | | | | (0.92 | ) |
Emerging market equities
(MSCI Emerging Markets
Index) | | | (2.37 | ) | | | 0.44 | |
3-month Treasury bill
(BofA Merrill Lynch
3-Month U.S. Treasury
Bill Index) | | | 0.01 | | | | 0.03 | |
U.S. Treasury securities
(BofA Merrill Lynch
10- Year U.S. Treasury Index) | | | 6.25 | | | | 9.88 | |
U.S. investment grade
bonds (Barclays U.S.
Aggregate Bond Index) | | | 3.43 | | | | 5.72 | |
Tax-exempt municipal
bonds (S&P Municipal Bond Index) | | | 2.29 | | | | 6.60 | |
U.S. high yield bonds
(Barclays U.S. Corporate
High Yield 2% Issuer Capped Index) | | | 1.50 | | | | 2.00 | |
HFRI Fund of Funds Composite Index | | | 3.50 | | | | 5.39 | |
|
Past performance is no guarantee of future results. Index performance is shown for illustrative purposes only. You cannot invest directly in an index. | |
| | | | | | |
| | | THIS PAGE NOT PART OF YOUR FUND REPORT | | | | 3 |
| | |
| Fund Summary as of March 31, 2015 | | |
BlackRock Preferred Partners LLC’s (the “Fund”) investment objective is to seek total return. Over an investment cycle, the Fund expects to achieve net returns commensurate with the long-term return on equities with less volatility and a relatively low degree of correlation to the equity markets. The Fund seeks to achieve its investment objective by investing directly or indirectly in private funds or other pooled investment vehicles or accounts organized outside the United States (“Portfolio Funds”) generally believed not to be highly correlated with the Standard & Poor’s 500 Index over a long-term horizon. The Fund may also invest directly in securities (other than those of Portfolio Funds) or other financial instruments.
No assurance can be given that the Fund’s investment objective will be achieved.
|
| Portfolio Management Commentary |
How did the Fund perform?
| Ÿ | | For the 12-month period ended March 31, 2015, the Fund returned 4.51% based on net asset value. For the same period, the Fund’s benchmark, the HFRI Fund of Funds Composite Index, returned 5.39%. |
Underlying Fund Strategies
| Ÿ | | The Fund invests in a portfolio of hedge funds as a means to gain exposure to various types of investment strategies in five major categories including fundamental long/short, relative value, event-driven, directional trading and direct sourcing strategies. |
| Ÿ | | Fundamental long/short strategies involve buying or selling predominantly corporate securities believed to be over- or underpriced relative to their potential value. Investment strategies in this category include long and short equity- or credit-based strategies, which emphasize a fundamental valuation framework, and equity active value strategies, where an active role is taken to enhance corporate value. |
| Ÿ | | Relative value strategies seek to profit from the mispricing of financial instruments relative to each other or historical norms. These strategies utilize quantitative and qualitative analyses to identify securities or spreads between securities that deviate from their theoretical fair value and/or historical norms. |
| Ÿ | | Event-driven strategies concentrate on companies that are subject to corporate events such as mergers, acquisitions, restructurings, spin-offs, shareholder activism or other special situations that alter a company’s financial structure or operating strategy. The intended goal of these strategies is to profit when the price of a security changes to reflect more accurately the likelihood and potential impact of the occurrence, or non-occurrence, of the event. |
| Ÿ | | Directional trading strategies seek to profit in changes from macro-level exposures, such as broad securities markets, interest rates, exchange rates and commodities. Examples include global macro strategies that express macroeconomic views based on analysis of fundamental factors and managed futures strategies, which select futures instruments based typically on systematic technical analysis. |
| Ÿ | | Direct sourcing strategies seek to garner profits from areas of the market that are underserved by traditional financial institutions by entering into direct transactions to provide financing to institutions or individuals. Typically, these strategies rely on a manager’s ability to source or access privately structured deals as well as fundamental research specific to each respective deal. |
What factors influenced performance?
| Ÿ | | The Fund’s exposure to directional trading strategies made the largest contribution to positive performance during the period. The strategies capitalized on increased technical and directional trading opportunities, particularly during the latter half of the period. |
| Ÿ | | Fundamental long/short strategies were the second-largest contributor to the Fund’s performance, with equity selection and credit strategies adding value within the category. Exposure to a number of event-driven strategies that benefited from increased corporate activity, such as reorganizations, post-reorganizational activity, mergers and bankruptcies, also had a positive impact on performance. |
| Ÿ | | The Fund’s exposure to relative value strategies detracted from performance. |
Describe recent portfolio activity.
| Ÿ | | The Fund added Blue Harbour Strategic Value Partners Offshore, Ltd. (Fundamental Long/Short), Hitchwood Capital Fund, Ltd. (Fundamental Long/Short), Pine River Liquid Rates Fund, Ltd. (Relative Value) and Stratus Feeder LP (Relative Value). The Fund also redeemed Alphabet Offshore, Ltd. (Relative Value), Brigade Leveraged Capital Structures Offshore, Ltd. (Fundamental Long/Short) and Claren Road Credit Fund, Ltd. (Fundamental Long/Short). |
| Ÿ | | In the aggregate, the Fund’s position changes resulted in increased exposure to fundamental long/short and directional trading strategies and slight decreases in exposure to relative value and direct sourcing strategies. |
Describe portfolio positioning at period end.
| Ÿ | | At period end, the Fund held broad exposure across a spectrum of different hedge fund strategies. For purposes of financial reporting, the underlying hedge funds are categorized based on their primary underlying strategy exposure. In this regard, the categories of investment strategies as a percentage of the Fund’s long term investments are 37% fundamental long/short strategies, 24% relative value, 21% event driven and 18% directional trading. |
| Ÿ | | However, notwithstanding their categorization for financial reporting purposes, many of these hedge funds provide exposure to multiple types of underlying strategies. Based on such underlying strategy exposures, the Fund held 45% of its investments in fundamental long/short, 21% in relative value, 17% in event driven, 16% in directional trading and 1% in direct sourcing strategies. |
The views expressed reflect the opinions of BlackRock as of the date of this report and are subject to change based on changes in market, economic or other conditions. These views are not intended to be a forecast of future events and are no guarantee of future results.
| | | | | | |
| 4 | | BLACKROCK PREFERRED PARTNERS LLC | | MARCH 31, 2015 | | |
|
| Total Return Based on a $50,000 Investment |
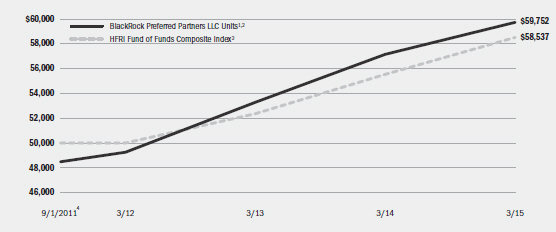
| | 1 | Assuming maximum sales charges, if any, transaction costs and other operating expenses, including investment advisory fees. |
| | 2 | Under normal market conditions, the Fund will invest, in varying proportions, across a number of portfolio strategies, including but not limited to hedge fund strategies and cash strategies. The Fund may also invest directly in securities (other than those of Portfolio Funds) or other financial instruments selected by the Advisor. |
| | 3 | This index represents funds of hedge funds that invest with multiple hedge fund managers focused on absolute return strategies. This equal-weighted index includes funds of hedge funds tracked by Hedge Fund Research Inc. and is revised several times each month to reflect updated hedge fund return information. For performance presented as of any given month, estimated values of underlying funds are used to build the index until valuations are finalized (generally on a 5-month lag although the time period may vary). This index is a proxy for the performance of the universe of funds of hedge funds focused on absolute return strategies. Returns are net of fees. |
| | 4 | Commencement of operations. |
| | | | | | | | | | |
| Performance Summary for the Period Ended March 31, 2015 |
| | | | | | | | | | | | | | | | | | | | |
| | | | | | Average Annual Total Returns5 | |
| | | | | | 1 Year | | | Since Inception6 | |
| | | 6-Month
Total Returns | | | w/o sales
charge | | | w/sales
charge | | | w/o sales
charge | | | w/sales
charge | |
BlackRock Preferred Partners LLC Units | | | 2.28 | % | | | 4.51 | % | | | 1.38 | % | | | 6.00 | % | | | 5.10 | % |
HFRI Fund of Funds Composite Index | | | 3.50 | | | | 5.39 | | | | N/A | | | | 4.50 | | | | N/A | |
| | 5 | Assuming maximum sales charges, if any. Average annual total returns with and without sales charges reflect reductions for distribution fees. |
| | 6 | The Fund commenced operations on September 1, 2011. |
| | | N/A—Not applicable as index does not have a sales charge. |
| | | Past performance is not indicative of future results. |
BlackRock Preferred Partners LLC Units incur a maximum initial sales charge of 3.00%, an annual distribution fee of 0.75% and an annual management fee of 0.75%.
Performance information reflects past performance and does not guarantee future results. Current performance may be lower or higher than the performance data quoted. Performance results do not reflect the deduction of taxes that a Member would pay on Fund distributions or the repurchase of Fund Units. A 2.00% early repurchase fee payable to the Fund may be charged to a member that tenders its Units to the Fund in connection with a tender offer with a valuation date that is prior to the one-year anniversary of the member’s purchase of the respective Units. This early repurchase fee would apply separately to each purchase of Units made by a member. The purpose of the 2.00% early repurchase fee is to reimburse the Fund for the costs incurred in liquidating investments in the Fund’s portfolio in order to honor the member’s repurchase request and to discourage short-term investments which are generally
disruptive to the Fund’s investment program. The Fund may, in its sole discretion, waive the early repurchase fee under certain circumstances described in the Fund’s prospectus. Performance data does not reflect this potential fee. Figures shown in the performance table assume reinvestment of all distributions, if any, at net asset value on the payable date. Investment return and the principal value of Units will fluctuate so that Units, when and if repurchased pursuant to a tender offer, may be worth more or less than their original cost.
The Fund’s investment advisor, BlackRock Advisors LLC (the “Advisor”), waived and/or reimbursed a portion of the Fund’s expenses during the periods described above. Without such waiver and/or reimbursement, the Fund’s performance would have been lower.
See “General Information” at the end of this report for where additional information can be obtained.
| | | | | | |
| | | BLACKROCK PREFERRED PARTNERS LLC | | MARCH 31, 2015 | | 5 |
The following charts show the ten largest holdings and investment strategies as a percentage of the Fund’s total investments:
| | |
| Portfolio Holdings | | Percent of
Total Investments |
| | | | |
Pentwater Event Fund, Ltd., Class F-NV-U | | | 8 | % |
Myriad Opportunities Offshore Fund, Ltd., Class B | | | 7 | |
Citadel Global Fixed Income Fund, Ltd., Class A | | | 7 | |
Graticule Asia Macro Fund L.P. (FKA Fortress Asia Macro Fund Ltd.), Class A, Series 05-2011 | | | 6 | |
Anchor Bolt Offshore Fund Ltd., Class A1 | | | 5 | |
D.E. Shaw Oculus International Fund, Liquidity Class | | | 5 | |
Jet Capital Concentrated Offshore Fund, Ltd., Class E | | | 5 | |
Panning Overseas Fund, Ltd., Series A-1 | | | 4 | |
Glenview Capital Partners (Cayman), Ltd., Class G/84 | | | 4 | |
QMS Diversified Global Macro Offshore Fund Ltd., Class NV, Series 01-2014 | | | 4 | |
| | |
| Investment Strategies1 | | Percent of
Total Investments |
| | | | |
Fundamental Long/Short | | | 37 | % |
Relative Value | | | 24 | |
Event Driven | | | 21 | |
Directional Trading | | | 18 | |
| | 1 | | The Fund does not make direct allocations to the Direct Sourcing strategy due to the limited liquidity of this strategy. However, the Fund may occasionally have indirect exposure to the strategy through multi-strategy managers, who may have a small allocation to direct lending and reinsurance. |
The table below summarizes the changes in the Fund’s monthly net asset value per Unit:
| | | | | | | | | | | | |
| | | 3/31/15 | | 3/31/14 | | Change | | | High | | Low |
Net Asset Value | | $10.57 | | $10.52 | | | 0.48 | % | | $10.75 | | $10.29 |
|
| Disclosure of Expenses for Continuously Offered Closed-End Funds |
Members of the Fund may incur the following charges: (a) transactional expenses, such as sales charges and early repurchase fees; and (b) operating expenses, including investment advisory fees, distribution fees, and other Fund expenses. The expense example shown below (which is based on a hypothetical investment of $1,000 invested on October 1, 2014 and held through March 31, 2015) is intended to assist members both in calculating expenses based on an investment in the Fund and in comparing these expenses with similar costs of investing in other funds.
The expense example provides information about actual account values and actual expenses. In order to estimate the expenses a member paid during the period covered by this report, members can divide their account value by $1,000 and then multiply the result by the number under the heading entitled “Expenses Paid During the Period.”
The expense example also provides information about hypothetical account values and hypothetical expenses based on the Fund’s actual
expense ratio and an assumed rate of return of 5% per year before expenses, which is not the Fund’s actual return. The hypothetical account values and expenses may not be used to estimate the actual ending account balance or expenses you paid for the period. In order to assist members in comparing the ongoing expenses of investing in the Fund and other funds, compare the 5% hypothetical example with the 5% hypothetical examples that appear in member reports of other funds.
The expenses shown in the expense example are intended to highlight members’ ongoing costs only and do not reflect any transactional expenses, such as sales charges or early repurchase fees. Therefore, the hypothetical examples are useful in comparing ongoing expenses only, and will not help members determine the relative total expenses of owning different funds. If these transactional expenses were included, member expenses would have been higher.
| | | | | | | | | | | | | | | | | | | | | | | | | | | | |
| | | Actual | | | Hypothetical3 | | | | |
| | | Beginning
Account Value
October 1, 2014 | | | Ending
Account Value
March 31, 2015 | | | Expenses Paid
During the
Period2 | | | Beginning
Account
Value
October 1, 2014 | | | Ending
Account Value
March 31, 2015 | | | Expenses Paid
During the Period2 | | | Annualized
Expense
Ratio | |
BlackRock Preferred | | | | | | | | | | | | | | | | | | | | | | | | | | | | |
Partners LLC | | $ | 1,000.00 | | | $ | 1,022.80 | | | $ | 10.09 | | | $ | 1,000.00 | | | $ | 1,014.96 | | | $ | 10.05 | | | | 2.00 | % |
| | 2 | Expenses are equal to the annualized expense ratio, multiplied by the average account value over the period, multiplied by 182/365 (to reflect the one-half year period shown). Annualized expense ratio does not include expenses incurred indirectly as a result of investments in Portfolio Funds. |
| | 3 | Hypothetical 5% annual return before expenses is calculated by prorating the number of days in the most recent fiscal half year divided by 365. |
| | | | | | |
| 6 | | BLACKROCK PREFERRED PARTNERS LLC | | MARCH 31, 2015 | | |
| | |
| Schedule of Investments March 31, 2015 | | (Percentages shown are based on Members’ Capital) |
| | |
| | | | |
| Portfolio Funds | | Value | |
Directional Trading — 17.8% | | | | |
D.E. Shaw Oculus International Fund, Liquidity Class | | $ | 3,648,760 | |
Graticule Asia Macro Fund L.P. (FKA Fortress Asia Macro Fund Ltd.),
Class A: | | | | |
Series 05-2011 | | | 4,329,499 | |
Series 02-2014 | | | 1,073,302 | |
QMS Diversified Global Macro Offshore Fund Ltd., Class NV: | | | | |
Series 01-2014 | | | 3,191,226 | |
Series 02-2014 | | | 696,127 | |
Series 03-2014 | | | 348,747 | |
| | | | |
| | | | 13,287,661 | |
| |
| | | | | |
Event Driven — 20.6% | | | | |
Aristeia International, Ltd., Class A: | | | | |
Series A NV | | | 2,578,494 | |
Series 02-2014 | | | 320,581 | |
Series 03-2014 | | | 226,351 | |
Jet Capital Concentrated Offshore Fund, Ltd., Class E, Non-Voting Shares, Series 1, 06-2011 | | | 3,382,613 | |
King Street Capital, Ltd., Class S, Series 53 | | | 2,818 | |
Pentwater Event Fund, Ltd., Class F-NV-U, Initial Series | | | 5,703,133 | |
York Investment, Ltd., Class D-U: | | | | |
Series 1 | | | 2,818,035 | |
Series 2-2014 | | | 386,406 | |
| | | | |
| | | | 15,418,431 | |
| |
| | | | | |
Fundamental Long/Short — 36.6% | | | | |
Anchor Bolt Offshore Fund Ltd., Class A1, Series 1 | | | 3,690,930 | |
Blue Harbour Strategic Value Partners Offshore, Ltd., Class 1,
Series 09-2014 | | | 2,618,701 | |
Glenview Capital Partners (Cayman), Ltd., Class G/84 | | | 3,297,927 | |
Hitchwood Capital Fund Ltd., Series A1: | | | | |
07/2014 | | | 2,570,621 | |
11/2014 | | | 384,818 | |
Myriad Opportunities Offshore Fund, Ltd., Class B, Series 40 | | | 5,570,604 | |
One William Street Capital Offshore Fund, Ltd., Class AA: | | | | |
Initial Series AA | | | 2,675,132 | |
Series 01-2014 | | | 390,805 | |
Series 02-2014 | | | 330,809 | |
Panning Overseas Fund, Ltd., Series A-1, Initial Series | | | 3,357,410 | |
Pelham Long/Short Fund, Ltd., Class A | | | 2,527,114 | |
| | | | |
| | | | 27,414,871 | |
| |
| | | | | |
| | | | |
| Portfolio Funds | | Value | |
Relative Value — 24.5% | | | | |
Achievement Fund, Ltd. (FKA Peak6 Achievement Fund, Ltd.), Class E, Non-Voting Shares: | | | | |
Initial Series | | $ | 3,034,533 | |
Series 02-2014 | | | 218,912 | |
BG Fund, Class D | | | 3,188,487 | |
Citadel Global Fixed Income Fund, Ltd., Class A | | | 4,961,796 | |
Magnetar Capital Fund II, Ltd., Class G: | | | | |
Series 14 | | | 292,714 | |
Series 15 | | | 217,581 | |
Series 16 | | | 178,868 | |
Series 17 | | | 377,334 | |
Series 18 | | | 454,528 | |
Series 19 | | | 241,295 | |
Series 20 | | | 218,959 | |
Series 21 | | | 299,800 | |
Series 22 | | | 122,828 | |
Pine River Liquid Rates Fund, Ltd., Class Q-A, Series 29 | | | 2,040,198 | |
Stratus Feeder LP, Series 1.5 | | | 2,507,750 | |
| | | | |
| | | | 18,355,583 | |
Total Investments (Cost $61,569,895) — 99.5% | | | 74,476,546 | |
Other Assets Less Liabilities — 0.5% | | | 399,980 | |
| | | | |
Members’ Capital — 100.0% | | $ | 74,876,526 | |
| | | | |
See Notes to Financial Statements.
| | | | | | |
| | | BLACKROCK PREFERRED PARTNERS LLC | | MARCH 31, 2015 | | 7 |
| | |
| Schedule of Investments (continued) | | |
|
| Notes to Schedule of Investments |
| Ÿ | | Fair Value Measurements — Various inputs are used in determining the fair value of investments. These inputs to valuation techniques are categorized into a disclosure hierarchy consisting of three broad levels for financial statement purposes. The hierarchy gives the highest priority to unadjusted quoted prices in active markets for identical assets or liabilities (Level 1 measurements) and the lowest priority to unobservable inputs (Level 3 measurements). Accordingly, the degree of judgment exercised in determining fair value is greatest for instruments categorized in Level 3. The inputs used to measure fair value may fall into different levels of the fair value hierarchy. In such cases, for disclosure purposes, the fair value hierarchy classification is determined based on the lowest level input that is significant to the fair value measurement in its entirety. The categorization of a value determined for investments is based on the pricing transparency of the investment and is not necessarily an indication of the risks associated with investing in those securities. The three levels of the fair value hierarchy are as follows: |
| | Ÿ | | Level 1 — unadjusted quoted prices in active markets/exchanges for identical assets or liabilities that the Fund has the ability to access. |
| | Ÿ | | Level 2 — other observable inputs (including, but not limited to, quoted prices for similar assets or liabilities in markets that are active, quoted prices for identical or similar assets or liabilities in markets that are not active, inputs other than quoted prices that are observable for the assets or liabilities (such as interest rates, yield curves, volatilities, prepayment speeds, loss severities, credit risks and default rates) or other market–corroborated inputs). If the reporting entity has the ability to redeem its investment with the Portfolio Funds at the net asset value per share (or its equivalent) at the measurement date or within the near term and there are no other liquidity restrictions, the Fund’s investment in the Portfolio Fund will be considered
Level 2. |
| | Ÿ | | Level 3 — unobservable inputs based on the best information available in the circumstances, to the extent observable inputs are not available (including the Fund’s own assumptions used in determining the fair value of investments). Investments in Portfolio Funds that are currently subject to liquidity restrictions that will not be lifted in the near term will be considered Level 3. |
The Fund’s investments in Portfolio Funds not otherwise traded on an active exchange are classified within Level 2 or Level 3 of the fair value hierarchy as the value of these interests are primarily based on the respective net asset value reported by management of each Portfolio Fund rather than actual market transactions and other observable market data. The determination of whether such investment will be classified in Level 2 or Level 3 will be based upon the ability to redeem such investment within a reasonable period of time (within 90 days of the period end and any other month-end). If an investment in a Portfolio Fund may be redeemed within 90 days of the period end and any other month-end, and the fair value of the investment is based on information provided by management of the Portfolio Funds and has not been adjusted by BlackRock Advisors LLC, it is classified as Level 2; in all other cases it is classified as Level 3. Changes in redemption features may result in transfers into or out of an assigned level within the disclosure hierarchy. For information about the Fund’s policy regarding valuation of investments, refer to Note 2 of the Notes to Financial Statements.
As of March 31, 2015, the following table summarizes the Fund’s investments categorized in the disclosure hierarchy:
| | | | | | | | | | | | | | |
| | | Level 1 | | Level 2 | | | Level 3 | | | Total | |
Assets: | | | | | | | | | | | | | | |
Investments: | | | | | | | | | | | | | | |
Portfolio Funds:1 | | | | | | | | | | | | | | |
Directional Trading | | — | | $ | 9,638,901 | | | $ | 3,648,760 | | | $ | 13,287,661 | |
Event Driven | | — | | | 9,712,480 | | | | 5,705,951 | | | | 15,418,431 | |
Fundamental Long/Short | | — | | | 6,988,857 | | | | 20,426,014 | | | | 27,414,871 | |
Relative Value | | — | | | 7,736,435 | | | | 10,619,148 | | | | 18,355,583 | |
Total | | — | | $ | 34,076,673 | | | $ | 40,399,873 | | | $ | 74,476,546 | |
| | | |
| 1 | In determining the classification of investments in Portfolio Funds included in the table above, no consideration was given to the classification of securities held by each underlying Portfolio Fund. |
The Fund may hold assets in which the fair value approximates the carrying amount for financial statement purposes. As of March 31, 2015, cash of $2,347,145 is categorized as Level 1 within the disclosure hierarchy.
During the year ended March 31, 2015, there were no transfers between Level 1 and Level 2.
See Notes to Financial Statements.
| | | | | | |
| 8 | | BLACKROCK PREFERRED PARTNERS LLC | | MARCH 31, 2015 | | |
| | |
| Schedule of Investments (concluded) | | |
A reconciliation of Level 3 investments is presented when the Fund had a significant amount of Level 3 investments at the beginning and/or end of the year in relation to members’ capital. The following table is a reconciliation of Level 3 investments:
| | | | | | | | | | | | | | | | | | | | |
| Assets: | | Directional
Trading | | | Event Driven | | | Fundamental
Long/Short | | | Relative Value | | | Total | |
Opening Balance, as of March 31, 2014 | | $ | 3,101,731 | | | $ | 10,083,924 | | | $ | 20,956,086 | | | $ | 13,041,251 | | | $ | 47,182,992 | |
Transfers into Level 3 | | | — | | | | — | | | | — | | | | — | | | | — | |
Transfers out of Level 31 | | | — | | | | (3,816,568 | ) | | | (7,359,809 | ) | | | — | | | | (11,176,377 | ) |
Accrued discounts/premiums | | | — | | | | — | | | | — | | | | — | | | | — | |
Net realized gain (loss) | | | — | | | | 369,090 | | | | 888,926 | | | | 491,724 | | | | 1,749,740 | |
Net change in unrealized appreciation/depreciation2,3 | | | 547,029 | | | | 369,693 | | | | 1,140,811 | | | | (1,103,862 | ) | | | 953,671 | |
Purchases | | | — | | | | — | | | | 8,900,000 | | | | 1,621,429 | | | | 10,521,429 | |
Sales | | | — | | | | (1,300,188 | ) | | | (4,100,000 | ) | | | (3,431,394 | ) | | | (8,831,582 | ) |
| | | | |
Closing Balance, as of March 31, 2015 | | $ | 3,648,760 | | | $ | 5,705,951 | | | $ | 20,426,014 | | | $ | 10,619,148 | | | $ | 40,399,873 | |
| | | | |
Net change in unrealized appreciation/depreciation on investments still held at
March 31, 20153 | | $ | 547,029 | | | $ | 738,783 | | | $ | 2,029,737 | | | $ | (612,138 | ) | | $ | 2,703,411 | |
| | | | |
| 1 | As of March 31, 2014, certain investments were subject to liquidity restrictions that would not be lifted in the near term. As of March 31, 2015, these liquidity restrictions were lifted for these investments. As a result, as of March 31, 2015 investments with a beginning of year value of $11,176,377 transferred from Level 3 to Level 2 in the disclosure hierarchy. |
| 2 | Included in the related net change in unrealized appreciation/depreciation in the Statement of Operations. |
| 3 | Any difference between Net change in unrealized appreciation/depreciation and Net change in unrealized appreciation/depreciation on investments still held at March 31, 2015 is generally due to investments no longer held or categorized as Level 3 at period end. |
See Notes to Financial Statements.
| | | | | | |
| | | BLACKROCK PREFERRED PARTNERS LLC | | MARCH 31, 2015 | | 9 |
| | |
| Statement of Assets, Liabilities and Members’ Capital | | |
| | | | |
| March 31, 2015 | | | |
| | | | |
| Assets | | | | |
Investments in Portfolio Funds at value (cost — $61,569,895) | | $ | 74,476,546 | |
Cash | | | 2,347,145 | |
Investments in Portfolio Funds sold receivable | | | 3,960,921 | |
Receivable from advisor | | | 66,224 | |
Prepaid expenses | | | 1,204 | |
| | | | |
Total assets | | | 80,852,040 | |
| | | | |
| | | | |
| Liabilities | | | | |
Capital contributions received in advance | | | 625,000 | |
Repurchase offer payable | | | 4,955,763 | |
Advisory fees payable | | | 147,710 | |
Distribution fees payable | | | 49,958 | |
Officer’s and Directors’ fees payable | | | 1,671 | |
Other accrued expenses payable | | | 195,412 | |
| | | | |
Total liabilities | | | 5,975,514 | |
| | | | |
Members’ Capital | | $ | 74,876,526 | |
| | | | |
| | | | |
| Members’ Capital Consists of | | | | |
Paid-in capital | | $ | 72,471,685 | |
Accumulated net investment loss | | | (9,520,658 | ) |
Accumulated net realized loss | | | (981,152 | ) |
Net unrealized appreciation/depreciation | | | 12,906,651 | |
| | | | |
Members’ Capital | | $ | 74,876,526 | |
| | | | |
| | | | |
| Net Asset Value | | | | |
Based on members’ capital of $74,876,526 and 7,085,302 Units outstanding | | $ | 10.57 | |
| | | | |
See Notes to Financial Statements.
| | | | | | |
| 10 | | BLACKROCK PREFERRED PARTNERS LLC | | MARCH 31, 2015 | | |
Year Ended March 31, 2015
| | | | |
| | | | |
| Investment Income | | | | |
Dividends | | | — | |
| | | | |
| | | | |
| Expenses | | | | |
Investment advisory | | $ | 606,531 | |
Distribution | | | 606,531 | |
Professional | | | 333,372 | |
Administration | | | 64,161 | |
Printing | | | 56,047 | |
Officer and Directors | | | 8,825 | |
Miscellaneous | | | 114,415 | |
| | | | |
Total expenses | | | 1,789,882 | |
Less fees waived and/or reimbursed by advisor | | | (172,537 | ) |
| | | | |
Total expenses after fees waived and/or reimbursed | | | 1,617,345 | |
| | | | |
Net investment loss | | | (1,617,345 | ) |
| | | | |
| | | | |
| Realized and Unrealized Gain (Loss) | | | | |
Net realized gain from investments | | | 2,914,612 | |
Net change in unrealized appreciation/depreciation on investments | | | 2,214,155 | |
| | | | |
Total realized and unrealized gain | | | 5,128,767 | |
| | | | |
Net Increase in Members’ Capital Resulting from Operations | | $ | 3,511,422 | |
| | | | |
See Notes to Financial Statements.
| | | | | | |
| | | BLACKROCK PREFERRED PARTNERS LLC | | MARCH 31, 2015 | | 11 |
| | |
| Statements of Changes in Members’ Capital | | |
| | | | | | | | |
| | | Year Ended March 31, | |
| Increase (Decrease) in Members’ Capital: | | 2015 | | | 2014 | |
| | | | | | | | |
| Operations | | | | | | | | |
Net investment loss | | $ | (1,617,345 | ) | | $ | (1,361,446 | ) |
Net realized gain | | | 2,914,612 | | | | 988,557 | |
Net change in unrealized appreciation/depreciation | | | 2,214,155 | | | | 5,178,197 | |
| | | | |
Net increase in members’ capital resulting from operations | | | 3,511,422 | | | | 4,805,308 | |
| | | | |
| | | | | | | | |
| Distributions to Members From1 | | | | | | | | |
Net investment income | | | (3,158,141 | ) | | | (5,583,421 | ) |
| | | | |
| | | | | | | | |
| Capital Transactions | | | | | | | | |
Proceeds from the issuance of Units (excluding capital contributions received in advance) | | | 13,618,268 | | | | 28,854,561 | |
Reinvestment of distributions | | | 2,531,706 | | | | 5,535,097 | |
Repurchase of Units resulting from tender offers | | | (20,159,424 | ) | | | (8,885,171 | ) |
| | | | |
Net increase (decrease) in members’ capital derived from capital transactions | | | (4,009,450 | ) | | | 25,504,487 | |
| | | | |
| | | | | | | | |
| Repurchase Fees | | | | | | | | |
Repurchase fees | | | 41,116 | | | | 3,924 | |
| | | | |
| | | | | | | | |
| Members’ Capital | | | | | | | | |
Total increase (decrease) in members’ capital | | | (3,615,053 | ) | | | 24,730,298 | |
Beginning of year | | | 78,491,579 | | | | 53,761,281 | |
| | | | |
End of year | | $ | 74,876,526 | | | $ | 78,491,579 | |
| | | | |
Accumulated net investment loss, end of year | | $ | (9,520,658 | ) | | $ | (8,080,355 | ) |
| | | | |
| | 1 | Distributions for annual periods determined in accordance with federal income tax regulations. |
See Notes to Financial Statements.
| | | | | | |
| 12 | | BLACKROCK PREFERRED PARTNERS LLC | | MARCH 31, 2015 | | |
| | | | |
| Year Ended March 31, 2015 | | | |
| | | | |
| Cash Provided by Operating Activities | | | | |
Net increase in members’ capital resulting from operations | | $ | 3,511,422 | |
Adjustments to reconcile net increase in members’ capital resulting from operations to net cash provided by operating activities: | | | | |
Decrease in investments in Portfolio Funds paid in advance | | | 1,450,000 | |
Increase in receivable from advisor | | | (46,060 | ) |
Increase in prepaid expenses | | | (187 | ) |
Increase in investment advisory fees payable | | | 46,005 | |
Decrease in distribution fees payable | | | (51,747 | ) |
Increase in Officer’s and Directors’ fees payable | | | 1,330 | |
Increase in other accrued expenses payable | | | 57,254 | |
Net realized (gain) loss on investments | | | (2,914,612 | ) |
Net change in unrealized (gain) loss on investments | | | (2,214,155 | ) |
Purchases of long-term investments | | | (14,900,000 | ) |
Proceeds from sales of long-term investments | | | 20,764,317 | |
| | | | |
Net cash provided by operating activities | | | 5,703,567 | |
| | | | |
| | | | |
| Cash Used for Financing Activities | | | | |
Capital contributions received in advance | | | 625,000 | |
Proceeds from issuance of Units | | | 10,925,888 | |
Payments on Units repurchased | | | (18,675,261 | ) |
Proceeds from repurchase fees | | | 41,116 | |
Cash dividends paid to members | | | (626,435 | ) |
| | | | |
Net cash used for financing activities | | | (7,709,692 | ) |
| | | | |
| | | | |
| Cash | | | | |
Net decrease in cash | | | (2,006,125 | ) |
Cash at beginning of year | | | 4,353,270 | |
| | | | |
Cash at end of year | | $ | 2,347,145 | |
| | | | |
| | | | |
| Non-Cash Financing Activities | | | | |
Units issued in reinvestment of distributions | | $ | 2,531,706 | |
| | | | |
See Notes to Financial Statements.
| | | | | | |
| | | BLACKROCK PREFERRED PARTNERS LLC | | MARCH 31, 2015 | | 13 |
| | | | | | | | | | | | | | | | |
| | | | | | | | | | | | Period
September 1,
20111 to
March 31, 2012 | |
| | | Year Ended March 31, | | |
| | | 2015 | | | 2014 | | | 2013 | | |
| | | | | | | | | | | | | | | | |
| Per Unit Operating Performance | | | | | | | | | | | | | | | | |
Net asset value, beginning of period | | $ | 10.52 | | | $ | 10.59 | | | $ | 10.16 | | | $ | 10.00 | 2 |
| | | | |
Net investment loss3 | | | (0.22 | ) | | | (0.22 | ) | | | (0.20 | ) | | | (0.11 | ) |
Net realized and unrealized gain4 | | | 0.68 | | | | 0.98 | | | | 1.02 | | | | 0.27 | |
| | | | |
Net increase from investment operations | | | 0.46 | | | | 0.76 | | | | 0.82 | | | | 0.16 | |
| | | | |
Distributions from net investment income5 | | | (0.41 | ) | | | (0.83 | ) | | | (0.39 | ) | | | — | |
| | | | |
Net asset value, end of period | | $ | 10.57 | | | $ | 10.52 | | | $ | 10.59 | | | $ | 10.16 | |
| | | | |
| | | | | | | | | | | | | | | | |
| Total Return6 | | | | | | | | | | | | | | | | |
Based on net asset value | | | 4.51 | % | | | 7.31 | % | | | 8.12 | % | | | 1.60 | %7 |
| | | | |
| | | | | | | | | | | | | | | | |
| Ratios to Average Members’ Capital | | | | | | | | | | | | | | | | |
Total expenses | | | 2.22 | %8 | | | 2.37 | %8 | | | 3.34 | %8 | | | 5.84 | %8,9,10 |
| | | | |
Total expenses after fees waived and/or reimbursed | | | 2.00 | %8 | | | 2.00 | %8 | | | 2.00 | %8 | | | 2.00 | %8,9 |
| | | | |
Net investment loss | | | (2.00 | )%8 | | | (2.00 | )%8 | | | (2.00 | )%8 | | | (2.00 | )%8,9 |
| | | | |
| | | | | | | | | | | | | | | | |
| Supplemental Data | | | | | | | | | | | | | | | | |
Members’ capital, end of period (000) | | $ | 74,877 | | | $ | 78,492 | | | $ | 53,761 | | | $ | 31,070 | |
| | | | |
Portfolio turnover rate | | | 19 | % | | | 15 | % | | | 25 | % | | | 4 | % |
| | | | |
| | 1 | Commencement of operations. Reflects activity prior to September 1, 2011, related to the initial seeding of the Fund. This information includes the initial investment by BlackRock HoldCo 2, Inc., a wholly owned subsidiary of BlackRock, Inc. |
| | 2 | Net asset value, beginning of period, reflects a deduction of $0.30 per unit sales charges from initial offering price of $10.30 per unit. |
| | 3 | Based on average units outstanding. |
| | 4 | Includes repurchase fees, which are less than $0.005 per unit. |
| | 5 | Distributions for annual periods determined in accordance with federal income tax regulations. |
| | 6 | Where applicable, excludes the effects of any sales charges and assumes the reinvestment of distributions. The Fund is a continuously offered closed-end fund, the units of which are offered at net asset value. No secondary market for the Fund’s units exists. |
| | 7 | Aggregate total return. |
| | 8 | Ratios do not include expenses incurred indirectly as a result of investments in Portfolio Funds of approximately 5.44% for the year ended March 31, 2015, 6.87% for the year ended March 31, 2014, 7.40% for the year ended March 31, 2013 and 6.07% for the period September 1, 2011 to March 31, 2012. |
| | 10 | Organization expenses were not annualized in the calculation of expense ratios. If these ratios were annualized, the total expenses would have been 6.63%. |
See Notes to Financial Statements.
| | | | | | |
| 14 | | BLACKROCK PREFERRED PARTNERS LLC | | MARCH 31, 2015 | | |
| | |
| Notes to Financial Statements | | |
1. Organization:
BlackRock Preferred Partners LLC (the “Fund”) is registered under the Investment Company Act of 1940, as amended (the “1940 Act”) as a continuously offered, non-diversified, closed-end management investment company. The Fund is organized as a Delaware limited liability company. The Fund continuously offers one class of limited liability company interests (“Units”), which may be sold to certain eligible investors with a front-end sales charge of up to 3.00%.
2. Significant Accounting Policies:
The Fund’s financial statements are prepared in conformity with accounting principles generally accepted in the United States of America (“U.S. GAAP”), which may require management to make estimates and assumptions that affect the reported amounts of assets and liabilities in the financial statements and the reported amounts of increases and decreases in members’ capital from operations during the reporting period. Actual results could differ from those estimates. The following is a summary of significant accounting policies followed by the Fund:
Valuation: The Fund’s investments are valued at fair value as of the close of trading on the New York Stock Exchange (“NYSE”) (generally 4:00 p.m., Eastern time). U.S. GAAP defines fair value as the price the Fund would receive to sell an asset or pay to transfer a liability in an orderly transaction between market participants at the measurement date. The Board has adopted and approved written policies and procedures (the “Valuation Procedures”) for the purpose of determining the value of securities held by the Fund, including the fair value of the Fund’s investments in interests in private funds or other pooled investment vehicles (collectively the “Portfolio Funds”), and has delegated to the internal valuation committee of the Advisor and its registered investment advisory affiliates (the “Global Valuation Committee”) the responsibility for the day-to-day oversight of the valuation of the Fund’s investments pursuant to the Valuation Procedures. The Fund will invest in Portfolio Funds selected by and unaffiliated with BlackRock Advisors, LLC (the “Advisor”), an indirect wholly-owned subsidiary of BlackRock, Inc. (“BlackRock”).
In valuing interests in Portfolio Funds, the Advisor, under the supervision of the Fund’s Board of Directors (the “Board”), considers all relevant information to determine the price that the Fund might reasonably expect to receive from the current sale (or redemption in the case of a Portfolio Fund whose interests carry redemption rights) of the interest in the Portfolio Fund in an arm’s-length transaction. In general, the Advisor will rely primarily on any actual or estimated (as applicable) unaudited values provided by the Portfolio Fund manager to the extent such unaudited values are received in a timely fashion and are believed to be the most reliable and relevant indication of the value of interests in such Portfolio Fund. It is anticipated that these unaudited values will be prepared in accordance with U.S. GAAP and will, in effect, be the fair value of each Portfolio Fund’s assets, less such Portfolio Fund’s liabilities (the net asset value). In some cases, estimated unaudited values are provided before final unaudited values. The Advisor will rely primarily on such estimated unaudited values or final unaudited values, to the extent they are the most reliable and relevant indication of value of interests in the Portfolio Funds. The Advisor will give weight to such valuations and any other factors and considerations set forth in the Valuation Procedures as deemed appropriate in each case. The Fund will only invest in Portfolio Funds that comply with U.S. GAAP and that provide annual audited financial statements. In general, the Advisor will, prior to investing in any Portfolio Fund, and periodically thereafter, assess such Portfolio Fund’s valuation policies and procedures for appropriateness in light of the Fund’s obligation to fair value its assets under the 1940 Act and pursuant to U.S. GAAP for investment companies and will assess the overall reasonableness of the information provided by such Portfolio Fund. As part of this assessment, the Advisor may also evaluate, among other things, a Portfolio Fund’s practices in respect of creating “side pockets” and such Portfolio Fund’s valuation policies and procedures in respect of any such “side pockets.” The Advisor will also review any other information available to it, including reports by independent auditors, fund administrators, if any, and/or other third parties.
In instances where unaudited estimated or final values may not be available, or where such unaudited estimated or final values are determined not to be the most reliable and relevant indication of value of an interest in a Portfolio Fund (as further discussed below), additional factors that may be relevant in determining the value of an interest in a Portfolio Fund, in addition to those other factors and considerations set forth in the Valuation Procedures, include (1) changes in the valuation of hedge fund indices, (2) publicly available information regarding a Portfolio Fund’s underlying portfolio companies or investments, (3) the price at which recent subscriptions and redemptions of such Portfolio Fund interests were offered, (4) relevant news and other sources, (5) significant market events and (6) information provided to the Advisor or the Fund by a Portfolio Fund, or the failure to provide such information as agreed to in the Portfolio Fund’s offering materials or other agreements with the Fund.
In circumstances where, taking into account the factors and considerations set forth above and in the Valuation Procedures, the Advisor has reason to believe that a value provided by a Portfolio Fund is not the most reliable and relevant indication of the value of an interest in the Portfolio Fund, the Advisor may adjust such reported value to reflect the fair value of the interest in the Portfolio Fund. Likewise, in circumstances where a Portfolio Fund does not provide a valuation as contemplated above, the factors and considerations set forth above and in the Valuation Procedures may be the only indicators of the value of an interest in a Portfolio Fund and the Advisor will use such factors, together with other valuation methodologies set forth in the Valuation Procedures that may be relevant, to estimate the fair value of its interest in a Portfolio Fund. In circumstances where the Advisor determines to adjust the values reported by Portfolio Funds, or in circumstances where the Portfolio Funds do not provide valuations as contemplated above
| | | | | | |
| | | BLACKROCK PREFERRED PARTNERS LLC | | MARCH 31, 2015 | | 15 |
| | |
| Notes to Financial Statements (continued) | | |
(such circumstances being collectively referred to as “Adjusted Fair Values”), such valuations will be subject to review and approval by the Global Valuation Committee or its delegate as outlined in the Valuation Procedures. The Board reviews all fair value determinations at its regularly scheduled meetings and also reviews the Valuation Procedures on a regular basis. As of March 31, 2015, the Advisor did not adjust any values received for the Portfolio Funds.
Investment Transactions and Investment Income: For financial reporting purposes, investment transactions are recorded on the dates the transactions are entered into (the trade dates). Realized gains and losses on investment transactions are determined on the identified cost basis. Dividend income is recorded on the ex-dividend date.
Distributions: Distributions from net investment income and capital gains are declared and paid annually. The character and timing of distributions are determined in accordance with federal income tax regulations, which may differ from U.S. GAAP.
Recent Accounting Standard: In April 2015, the Financial Accounting Standards Board issued “Disclosures for Investments in Certain Entities that Calculate Net Asset Value per Share” which eliminates the requirement to categorize investments within the fair value hierarchy for which fair value is based on the NAV per share when no quoted market value is available. The new guidance will also require revised disclosures regarding these investments. The guidance is effective for fiscal years beginning after December 15, 2015 and interim periods within those fiscal years. Management is evaluating the impact of this guidance on the Fund’s financial statement disclosures.
Other: Expenses directly related to the Fund are charged to the Fund. Other operating expenses shared by several funds are prorated among those funds on the basis of relative members’ capital or other appropriate methods.
The Fund has an arrangement with its custodian whereby fees may be reduced by credits earned on uninvested cash balances, which, if applicable, are shown as fees paid indirectly in the Statement of Operations. The custodian imposes fees on overdrawn cash balances, which can be offset by accumulated credits earned or may result in additional custody charges.
3. Investments in Portfolio Funds:
Information reflecting the Fund’s investments in Portfolio Funds as of March 31, 2015 is summarized below. The Fund is not able to obtain complete investment holding details of each of the Portfolio Funds held within the Fund’s portfolio in order to determine whether the Fund’s proportionate share of any investments held by a Portfolio Fund exceeds 5% of the members’ capital of the Fund as of March 31, 2015.
| | | | | | | | | | | | |
| Investment | | Value | | | % of Fund’s
Members’
Capital | | | Primary Geographic Locations* | | Redemptions
Permitted** |
Directional Trading | | | | | | | | | | | | |
| | | | | | | | | | Latin America, North America, PacRim Developed, | | |
D.E. Shaw Oculus International Fund, Liquidity Class | | $ | 3,648,760 | | | | 4.9 | % | | Western Europe | | Quarterly |
Graticule Asia Macro Fund L.P. (Fortress Asia Macro Fund Ltd.), Class A: | | | | | | | | | | | | |
Series 05-2011 | | | 4,329,499 | | | | 5.8 | | | Global | | Quarterly |
Series 02-2014 | | | 1,073,302 | | | | 1.4 | | | | | |
QMS Diversified Global Macro Offshore Fund Ltd, Class NV: | | | | | | | | | | | | |
Series 01-2014 | | | 3,191,226 | | | | 4.3 | | | Global | | Monthly |
Series 02-2014 | | | 696,127 | | | | 0.9 | | | | | |
Series 03-2014 | | | 348,747 | | | | 0.5 | | | | | |
Event Driven | | | | | | | | | | | | |
Aristeia International, Ltd., Class A: | | | | | | | | | | | | |
Series A NV | | | 2,578,494 | | | | 3.5 | | | North America, Western Europe | | Quarterly |
Series 02-2014 | | | 320,581 | | | | 0.4 | | | | | |
Series 03-2014 | | | 226,351 | | | | 0.3 | | | | | |
Jet Capital Concentrated Offshore Fund, Ltd., Class E, Non-Voting Shares, Series 1, 06-2011 | | | 3,382,613 | | | | 4.5 | | | Africa/Mid East, Central/South Asia, Eastern Europe | | Monthly |
King Street Capital, Ltd., Class S, Series 53 | | | 2,818 | | | | 0.0 | | | PacRim Developed, Western Europe | | Quarterly |
Pentwater Event Fund, Ltd., Class F-NV-U, Initial Series | | | 5,703,133 | | | | 7.6 | | | North America, PacRim Developed, Western Europe | | Monthly |
York Investment, Ltd., Class D-U: | | | | | | | | | | North America, Western Europe | | Quarterly |
Series 1 | | | 2,818,035 | | | | 3.8 | | | | | |
Series 2-2014 | | | 386,406 | | | | 0.5 | | | | | |
| | | | | | |
| 16 | | BLACKROCK PREFERRED PARTNERS LLC | | MARCH 31, 2015 | | |
| | |
| Notes to Financial Statements (continued) | | |
| | | | | | | | | | | | |
| Investment | | Value | | | % of Fund’s
Members’
Capital | | | Primary Geographic Locations* | | Redemptions
Permitted** |
Fundamental Long/Short | | | | | | | | | | | | |
Anchor Bolt Offshore Fund Ltd., Class A1, Series1 | | $ | 3,690,930 | | | | 4.9 | % | | Global | | Quarterly |
Blue Harbour Strategic Value Partners Offshore, Ltd., Class 1, Series 09-2014 | | | 2,618,701 | | | | 3.5 | | | North America | | Annually |
Glenview Capital Partners (Cayman), Ltd., Series G/84 | | | 3,297,927 | | | | 4.4 | | | North America, Western Europe | | Quarterly |
Hitchwood Capital Fund Ltd., Series A1: | | | | | | | | | | | | |
07/2014 | | | 2,570,621 | | | | 3.4 | | | Global | | Quarterly |
11/2014 | | | 384,818 | | | | 0.5 | | | | | |
Myriad Opportunities Offshore Fund, Ltd., Class B, Series 40 | | | 5,570,604 | | | | 7.5 | | | Central/South Asia, PacRim Developed, PacRim Emerging | | Quarterly |
One William Street Capital Offshore Fund, Ltd., Class AA: | | | | | | | | | | | | |
Initial Series AA | | | 2,675,132 | | | | 3.6 | | | North America | | Quarterly |
Series 01-2014 | | | 390,805 | | | | 0.5 | | | | | |
Series 02-2014 | | | 330,809 | | | | 0.4 | | | | | |
Panning Overseas Fund, Ltd., Series A-1, Initial Series | | | 3,357,410 | | | | 4.5 | | | North America, Western Europe | | Quarterly |
Pelham Long/Short Fund, Ltd., Class A | | | 2,527,114 | | | | 3.4 | | | Western Europe | | Monthly |
Relative Value | | | | | | | | | | | | |
Achievement Fund, Ltd. (FKA Peak6 Achievement Fund, Ltd.), Class E, Non-Voting Shares: | | | | | | | | | | | | |
Initial Series | | | 3,034,533 | | | | 4.1 | | | North America, Western Europe | | Monthly |
Series 02-2014 | | | 218,912 | | | | 0.3 | | | | | |
BG Fund, Class D | | | 3,188,487 | | | | 4.3 | | | North America, PacRim Developed, Western Europe | | Monthly |
Citadel Global Fixed Income Fund, Ltd., Class A | | | 4,961,796 | | | | 6.6 | | | North America, Western Europe | | Monthly |
Magnetar Capital Fund II, Ltd., Class G: | | | | | | | | | | | | |
Series 14 | | | 292,714 | | | | 0.4 | | | North America, Western Europe | | Quarterly |
Series 15 | | | 217,581 | | | | 0.3 | | | | | |
Series 16 | | | 178,868 | | | | 0.2 | | | | | |
Series 17 | | | 377,334 | | | | 0.5 | | | | | |
Series 18 | | | 454,528 | | | | 0.6 | | | | | |
Series 19 | | | 241,295 | | | | 0.3 | | | | | |
Series 20 | | | 218,959 | | | | 0.3 | | | | | |
Series 21 | | | 299,800 | | | | 0.4 | | | | | |
Series 22 | | | 122,828 | | | | 0.2 | | | | | |
Pine River Liquid Rates Fund, Ltd., Class Q-A, Series 29 | | | 2,040,198 | | | | 2.7 | | | North America, PacRim Developed, Western Europe | | Monthly |
Stratus Feeder LP, Series 1.5 | | | 2,507,750 | | | | 3.3 | | | North America | | Monthly |
Total | | $ | 74,476,546 | | | | 99.5 | % | | | | |
| | | | | | | | |
| * | Primary Geographic Locations is based upon information of which the Fund is aware regarding the geographic allocations of the investments held by the Portfolio Funds in which the Fund invests. The Fund does not have sufficient portfolio holdings information with respect to the Portfolio Funds to monitor such positions on a look through basis. The information regarding the geographic allocation of investments held by the Portfolio Funds is derived from periodic information provided to the Fund by the managers of such Portfolio Funds. The information in this table represents only information that has been made available to the Fund with respect to investments held by the Portfolio Funds as of March 31, 2015. This information has not been independently verified by the Fund and may not be representative of the current geographic allocation of investments held by the Portfolio Funds since such Portfolio Funds are actively managed and this information is generally provided by the Portfolio Funds on a delayed basis after the date of such information. |
| ** | Redemptions Permitted reflects general redemption terms for each Portfolio Fund and excludes any temporary liquidity restrictions. |
| | | | | | |
| | | BLACKROCK PREFERRED PARTNERS LLC | | MARCH 31, 2015 | | 17 |
| | |
| Notes to Financial Statements (continued) | | |
The agreements related to investments in Portfolio Funds provide for compensation to the investment managers/general partners of such Portfolio Funds in the form of management fees generally ranging from 1% to 3% (per annum) of members’ capital and incentive fees/allocations generally ranging from 15% to 25% of the net profits earned. The Portfolio Funds’ management fees and incentive fees/allocations are included in net change in unrealized appreciation/depreciation on investments in the Statement of Operations.
The table below summarizes the fair value and other pertinent liquidity information of the underlying Portfolio Funds by class:
| | | | | | | | | | | | | | | | | | | | |
| Major Category | | Fair Value | | | Illiquid
Investments (1) | | | Gates (2) | | | Lock-ups (3) | | | Redemption Frequency (4) | | Redemption
Notice Period (4) |
Relative Value (a) | | $ | 18,355,583 | | | | — | | | $ | 5,824,815 | | | $ | 3,253,445 | | | Monthly, Quarterly | | 30-90 Days |
Fundamental Long/Short (b) | | | 27,414,871 | | | | — | | | | 6,696,011 | | | | 8,101,254 | | | Monthly, Quarterly, Annually | | 45-90 Days |
Event Driven (c) | | | 15,418,431 | | | $ | 2,818 | | | | 1,425,783 | | | | — | | | Monthly, Quarterly | | 30-90 Days |
Directional Trading (d) | | | 13,287,661 | | | | — | | | | 3,040,512 | | | | — | | | Monthly, Quarterly | | 30-75 Days |
Total | | $ | 74,476,546 | | | $ | 2,818 | | | $ | 16,987,121 | | | $ | 11,354,699 | | | | | |
| | | | | | | | |
(1) Represents private investment funds that cannot be voluntarily redeemed by the Fund at any time. This includes: (i) private investment funds that are liquidating and making distribution payments as their underlying assets are sold, (ii) suspended redemptions/withdrawals, and (iii) side pocket holdings. These types of investments may be realized within 1 to 3 years from March 31, 2015, depending on the specific investment and market conditions. This does not include private investment funds with gates and lockups, which are noted above.
(2) Represents the portion of the Portfolio Funds for which there are investor level gates, which are not otherwise included as illiquid investments.
(3) Represents investments that cannot be redeemed without a fee due to a lock-up provision, which are not otherwise included as illiquid investments or investments with gates. The lock-up period for these investments ranged from 6 to 23 months at March 31, 2015.
(4) Redemption frequency and redemption notice period reflect general redemption terms, and exclude liquidity restrictions noted above.
(a) Relative value strategies seek to profit from the mispricing of financial instruments relative to each other or historical norms. These strategies utilize quantitative and qualitative analyses to identify securities or spreads between securities that deviate from their theoretical fair value and/or historical norms. The application of the Valuation Procedures to investments in this category did not result in any Adjusted Fair Values as of March 31, 2015. The fair values of the investments in this category have been estimated based on the net asset values provided by management of the Portfolio Funds.
(b) Fundamental long/short strategies involve buying or selling predominantly corporate securities believed to be over- or underpriced relative to their potential value. Investment strategies in this category include long and short equity- or credit-based strategies, which emphasize a fundamental valuation framework, and equity active value strategies, where an active role is taken to enhance corporate value. The application of the Valuation Procedures to investments in this category did not result in any Adjusted Fair Values as of March 31, 2015. The fair values of the investments in this category have been estimated based on the net asset values provided by management of the Portfolio Funds.
(c) Event-driven strategies concentrate on companies that are subject to corporate events such as mergers, acquisitions, restructurings, spin-offs, shareholder activism or other special situations that alter a company’s financial structure or operating strategy. The intended goal of these strategies is to profit when the price of a security changes to reflect more accurately the likelihood and potential impact of the occurrence, or nonoccurrence, of the event. The application of the Valuation Procedures to investments in this category did not result in any Adjusted Fair Values as of March 31, 2015. The fair values of the investments in this category have been estimated based on the net asset values provided by management of the Portfolio Funds.
(d) Directional trading seeks to profit in changes from macro-level exposures, such as broad securities markets, interest rates, exchange rates and commodities. Examples include global macro strategies that express macroeconomic views based on analysis of fundamental factors and managed futures strategies, which select futures instruments based typically on systematic technical analysis. The application of the Valuation Procedures to investments in this category did not result in any Adjusted Fair Values as of March 31, 2015. The fair values of the investments in this category have been estimated based on the net asset values provided by management of the Portfolio Funds.
The Fund had no unfunded capital commitments as of March 31, 2015.
| | | | | | |
| 18 | | BLACKROCK PREFERRED PARTNERS LLC | | MARCH 31, 2015 | | |
| | |
| Notes to Financial Statements (continued) | | |
4. Investment Advisory Agreement and Other Transactions with Affiliates:
The PNC Financial Services Group, Inc. is the largest stockholder and an affiliate of BlackRock, for 1940 Act purposes.
The Fund entered into an Investment Advisory Agreement with the Advisor to provide investment advisory services. The Fund pays the Advisor an annual fee accrued monthly and payable quarterly in arrears, in an amount equal to 0.75% of the Fund’s month-end members’ capital.
The Advisor had entered into a separate sub-advisory agreement with BlackRock Financial Management, Inc. (“BFM”), an affiliate of the Advisor. The Advisor paid BFM for services it provided, a monthly fee that is a percentage of the investment advisory fees paid by the Fund to the Advisor. Effective July 1, 2014, the sub-advisory agreement with BFM expired.
The Fund has entered into an expense limitation agreement (“Expense Agreement”) in which the Advisor has agreed to reimburse certain operating and other expenses of the Fund in order to limit certain expenses to 0.50% per annum of the Fund’s average month-end members’ capital (the “Expense Cap”). Expenses covered by the Expense Cap include all of the Fund’s expenses other than those expressly excluded by the Expense Agreement as follows: (i) the investment management fee, (ii) interest expense, if any, (iii) expenses incurred directly or indirectly by the Fund as a result of expenses related to investing in, or incurred by, a Portfolio Fund or other permitted investment, (iv) any trading-related expenses, including, but not limited to, clearing costs and commissions, (v) dividends on short sales, if any, (vi) any extraordinary expenses not incurred in the ordinary course of the Fund’s business (including, without limitation, litigation expenses) and (vii) if applicable, the distribution fees paid to BlackRock Investments, LLC (“BRIL”) or financial intermediaries.
If the Fund has received a waiver or reimbursement from the Advisor within the prior two fiscal years and the Fund’s operating expenses are less than the expense limit for the Fund, the Advisor is entitled to be reimbursed by the Fund up to the lesser of (a) the amount of fees waived or expenses reimbursed during those prior two fiscal years under the agreement and (b) the amount by which the expense limit for the Fund exceeds the operating expenses of the Fund for the current fiscal year, provided that: (1) the Fund has more than $50 million in assets for the fiscal year and (2) the Advisor or an affiliate continues to serve as the Fund’s investment advisor or administrator. In the event the expense limit for the Fund is changed subsequent to a fiscal year in which the Advisor becomes entitled to reimbursement for fees waived or reimbursed, the amount available to reimburse the Advisor shall be calculated by reference to the expense limit for the Fund in effect at the time the Advisor became entitled to receive such reimbursement, rather than the subsequently changed expense limit for the Fund.
On March 31, 2015, the amounts subject to possible future recoupment under the expense limitation agreement were as follows:
| | | | | | |
| | | 2015 | | 2016 | | 2017 |
Expiring March 31, | | $600,838 | | $242,757 | | $172,537 |
The Fund entered into a Distribution Agreement with BRIL, an affiliate of the Advisor. Pursuant to a Distribution Plan approved by the Fund’s Board, the Fund pays BRIL ongoing distribution fees. The fees are accrued monthly and paid quarterly in arrears at an annual rate equal to 0.75% of the Fund’s month-end members’ capital.
Certain officers and/or directors of the Fund are officers and/or directors of BlackRock or its affiliates. The Fund reimburses the Advisor for a portion of the compensation paid to the Fund’s Chief Compliance Officer, which is included in officers and directors in the Statement of Operations.
5. Purchases and Sales:
For the year ended March 31, 2015, purchases and sales of investments, excluding short-term securities, were $14,900,000 and $23,474,417, respectively.
6. Income Tax Information:
It is the Fund’s policy to comply with the requirements of the Internal Revenue Code of 1986, as amended, applicable to regulated investment companies, and to distribute substantially all of its taxable income to its members. Therefore, no federal income tax provision is required.
The Fund files U.S. federal and various state and local tax returns. No income tax returns are currently under examination. The statute of limitations on the Fund’s U.S. federal tax returns remains open for each of the four periods ended March 31, 2015. The statutes of limitations on the Fund’s state and local tax returns may remain open for an additional year depending upon the jurisdiction.
Management has analyzed tax laws and regulations and their application to the Fund as of March 31, 2015, and does not believe there are any uncertain tax positions that require recognition of a tax liability in the Fund’s financial statements.
| | | | | | |
| | | BLACKROCK PREFERRED PARTNERS LLC | | MARCH 31, 2015 | | 19 |
| | |
| Notes to Financial Statements (continued) | | |
U.S. GAAP requires that certain components of members’ capital be adjusted to reflect permanent differences between financial and tax reporting. These reclassifications have no effect on members’ capital or net asset values per unit. As of March 31, 2015, the following permanent differences attributable to the sale of stock of passive foreign investment companies were reclassified to the following accounts:
| | | | |
Accumulated net investment loss | | $ | 3,335,183 | |
Accumulated net realized loss | | $ | (3,335,183 | ) |
The tax character of distributions paid was as follows:
| | | | | | | | |
| | | 3/31/15 | | | 3/31/14 | |
Ordinary income | | $ | 3,158,141 | | | $ | 5,583,421 | |
As of March 31, 2015, the tax components of accumulated net earnings were as follows:
| | | | |
Undistributed ordinary income | | $ | 3,577,448 | |
Capital loss carryforwards | | | (857,621 | ) |
Net unrealized losses1 | | | (191,455 | ) |
Qualified late-year losses2 | | | (123,531 | ) |
| | | | |
Total | | $ | 2,404,841 | |
| | | | |
| | 1 | The difference between book-basis and tax-basis net unrealized losses was attributable primarily to the realization for tax purposes of unrealized gains on investments in passive foreign investment companies. |
| | 2 | The Fund has elected to defer certain qualified late-year losses and recognize such losses in the next taxable year. |
As of March 31, 2015, the Fund had capital loss carryforwards, with no expiration dates, available to offset future realized capital gains of $857,621.
As of March 31, 2015, gross unrealized appreciation and depreciation based on cost for federal income tax purposes were as follows:
| | | | |
Tax cost | | $ | 74,668,001 | |
| | | | |
Gross unrealized appreciation | | | — | |
Gross unrealized depreciation | | $ | (191,455 | ) |
| | | | |
Net unrealized depreciation | | $ | (191,455 | ) |
| | | | |
7. Principal Risks:
The Fund’s investments in Portfolio Funds involve varying degrees of interest rate risk, credit and counterparty risk, and market, industry or geographic concentration risks for the Fund. While BlackRock monitors these risks, the varying degrees of transparency into and potential illiquidity of the securities in the Portfolio Funds may hinder BlackRock’s ability to effectively manage and mitigate these risks.
The Portfolio Funds in which the Fund is invested utilize a wide variety of financial instruments in their trading strategies including over-the-counter options, financial futures contracts, forward contracts and swap agreements, and securities sold but not yet purchased. Several of these financial instruments contain varying degrees of off-balance sheet risk where the maximum potential loss on a particular financial instrument may be in excess of the amounts recorded on each Portfolio Fund’s balance sheet. The Portfolio Funds are required to account for all investments on a fair value basis, and recognize changes in unrealized gains and losses in their statements of operations. In determining the fair values for these financial instruments, the Portfolio Funds will make estimates about future interest rates, default probabilities, volatilities and other pricing factors. These estimates of fair value could differ from actual results.
The Fund’s maximum exposure to market risks of the Portfolio Funds is limited to amounts included in the Fund’s investments in Portfolio Funds recorded as assets on the Statement of Assets, Liabilities and Members’ Capital.
The Fund is designed primarily for long term investors and an investment in the Fund’s Units should be considered to be illiquid. The Fund’s Units are not and will not be listed for trading on a securities exchange. Members may not be able to sell their Units as it is unlikely that a secondary market for the Units will develop or, if a secondary market does develop, members may be able to sell their Units only at substantial discounts from net asset value. Additionally, transfers of Units generally may not be effected without the express written consent of the Board or it’s delegate. The Fund may, but is not obligated to, conduct tender offers to repurchase outstanding Units. If the Fund does conduct tender offers, it may be required to sell its more liquid, higher quality portfolio securities to purchase Units that are tendered, which may increase risks for remaining members and increase Fund expenses.
| | | | | | |
| 20 | | BLACKROCK PREFERRED PARTNERS LLC | | MARCH 31, 2015 | | |
| | |
| Notes to Financial Statements (continued) | | |
The Portfolio Funds invest in securities and investments with various degrees of liquidity and as such the Fund is subject to certain redemption/ withdrawal provisions, in accordance with the Portfolio Funds’ offering agreements.
Certain of the Fund’s Portfolio Funds have the ability to suspend redemptions/withdrawals, and restrict redemptions/withdrawals through the creation of side pockets. The Fund’s ability to liquidate its investment in Portfolio Funds that had imposed such provisions may be adversely impacted. In such cases, until the Fund is permitted to liquidate its interest in the Portfolio Fund, any interest the Fund retains in such Portfolio Fund remains subject to continued exposure to changes in valuations.
The Fund also invests in closed-end investments that may not permit redemptions/withdrawals or in Portfolio Funds that impose an initial “lockup” period before a redemption/withdrawal can be made. In addition, certain of the Fund’s Portfolio Funds have the ability to impose redemption gates, and in so doing, may reduce the Fund’s requested redemption/withdrawal below the requested amount. The amount of the Fund’s assets subject to lockups and gates is described in Note 3.
8. Capital Transactions:
For the year ended March 31, 2014, Units issued and outstanding increased 1,851,526 as a result of Units sold and 532,221 for reinvestment of distributions. For the year ended March 31, 2015, Units issued and outstanding decreased 375,144 as a result of Units repurchased in tender offers. At March 31, 2015, 969,980 Units were owned by BlackRock Holdco 2, Inc., an affiliate of the Fund.
Units are offered at closings, for purchase as of the first business day of each month or at such other times as determined in the discretion of the Board.
The Fund may choose to conduct quarterly tender offers for up to 15% of its net asset value at the time in the sole discretion of its Board. In a tender offer, the Fund repurchases outstanding Units at the Fund’s net asset value on the valuation date for the tender offer, which would generally be the last business day of March, June, September or December. In any given year, the Advisor may or may not recommend to the Board that the Fund conduct tender offers. Accordingly, there may be years in which no tender offer is made. Therefore, Units will not be redeemable at an investor’s option nor will they be exchangeable for shares of any other fund.
Tender offers were as follows:
| | | | | | | | | | | | | | | | |
Commencement Date1 | | | | Valuation Date | | | | Units Offered to Repurchase | | | | | Tendered Units | |
June 28, 2013 | | | | September 30, 2013 | | | | | 816,555 | | | | | | 20,420 | |
September 27, 2013 | | | | December 31, 2013 | | | | | 866,423 | | | | | | 407,864 | |
December 26, 2013 | | | | March 31, 2014 | | | | | 989,446 | | | | | | 330,000 | |
March 27, 2014 | | | | June 30, 2014 | | | | | 1,144,353 | | | | | | 581,318 | |
June 27, 2014 | | | | September 30, 2014 | | | | | 1,169,187 | | | | | | 430,411 | |
September 26, 2014 | | | | December 31, 2014 | | | | | 1,134,890 | | | | | | 423,825 | |
December 29, 2014 | | | | March 31, 2015 | | | | | 1,134,890 | | | | | | — | 2 |
March 27, 2015 | | | | June 30, 2015 | | | | | 1,127,088 | | | | | | — | 2 |
| | 1 | Date the tender offer period begins. |
| | 2 | The number of tendered Units will be included in each of the Fund’s final amendments to its Schedule TO related to each tender offer. Each final amendment will be filed with the Securities and Exchange Commission (“SEC”) upon payment of the final proceeds. The proceeds are paid in accordance with the terms and dates described in each Schedule TO filed with the SEC (typically an initial payment of approximately 90% within 45 days and the balance within 90 days from the tender offer’s valuation date). |
Tendered Unit amounts are shown as repurchase of Units resulting from tender offers in the Statements of Changes in Members’ Capital.
A 2.00% early repurchase fee payable to the Fund will be charged to any member that tenders its Units to the Fund in connection with a tender offer with a valuation date that is prior to the one-year anniversary of the member’s purchase of the respective Units. The purpose of the 2.00% early repurchase fee is to reimburse the Fund for the costs incurred in liquidating investments in the Fund’s portfolio in order to honor the member’s repurchase request and to discourage short-term investments which are generally disruptive to the Fund’s investment program. This early repurchase fee would apply separately to each purchase of Units made by a member.
The Fund may, in its sole discretion, waive the early repurchase fee under certain circumstances described in the Fund’s prospectus.
| | | | | | |
| | | BLACKROCK PREFERRED PARTNERS LLC | | MARCH 31, 2015 | | 21 |
| | |
| Notes to Financial Statements (concluded) | | |
9. Subsequent Events:
Management has evaluated the impact of all subsequent events on the Fund through the date the financial statements were issued and has determined that there were no subsequent events requiring adjustment or additional disclosure in the financial statements.
| | | | | | |
| 22 | | BLACKROCK PREFERRED PARTNERS LLC | | MARCH 31, 2015 | | |
| | |
| Report of Independent Registered Public Accounting Firm | | |
To the Board of Directors and Members of BlackRock Preferred Partners LLC:
We have audited the accompanying statement of assets and liabilities and members’ capital of BlackRock Preferred Partners LLC (the “Fund”), including the schedule of investments, as of March 31, 2015, and the related statement of operations and statement of cash flows for the year then ended, the statements of changes in members’ capital for each of the two years in the period then ended and the financial highlights for the periods presented. These financial statements and financial highlights are the responsibility of the Fund’s management. Our responsibility is to express an opinion on these financial statements and financial highlights based on our audits.
We conducted our audits in accordance with the standards of the Public Company Accounting Oversight Board (United States). Those standards require that we plan and perform the audit to obtain reasonable assurance about whether the financial statements and financial highlights are free of material misstatement. The Fund is not required to have, nor were we engaged to perform, an audit of its internal control over financial reporting. Our audits included consideration of internal control over financial reporting as a basis for designing audit procedures that are appropriate in the circumstances, but not for the purpose of expressing an opinion on the effectiveness of the Fund’s internal control over financial reporting. Accordingly, we express no such opinion. An audit also includes examining, on a test basis, evidence supporting the amounts and disclosures in the financial statements, assessing the accounting principles used and significant estimates made by management, as well as evaluating the overall financial statement presentation. Our procedures included confirmation of portfolio funds owned as of March 31, 2015, by correspondence with the portfolio funds’ third party investment advisor or administrator. We believe that our audits provides a reasonable basis for our opinion.
In our opinion, such financial statements and financial highlights referred to above present fairly, in all material respects, the financial position of BlackRock Preferred Partners LLC as of March 31, 2015, the results of its operations and cash flows for the year then ended, the changes in its members’ capital for each of the two years in the period then ended, and the financial highlights for the periods presented, in conformity with accounting principles generally accepted in the United States of America.
Deloitte & Touche LLP
Philadelphia, Pennsylvania
May 22, 2015
| | | | | | |
| | | BLACKROCK PREFERRED PARTNERS LLC | | MARCH 31, 2015 | | 23 |
| | |
| Automatic Dividend Reinvestment Plan | | |
Unless the registered owner of Units elects to receive cash by contacting the Plan Administrator, all dividends declared for a Member’s Units in the Fund will be automatically reinvested by The Bank of New York Mellon (the “Plan Administrator”), administrator for Members in administering the Fund’s Dividend Reinvestment Plan (the “Plan”), in additional Units of the Fund. Members who elect not to participate in the Plan will receive all dividends and other distributions in cash paid by check mailed directly to the Member of record (or, if the Units are held in street or other nominee name, then to such nominee) by The Bank of New York Mellon, as dividend disbursing agent. You may elect not to participate in the Plan and to receive all dividends in cash by contacting The Bank of New York Mellon, as dividend disbursing agent, at the address set forth below. Participation in the Plan is completely voluntary and may be terminated or resumed at any time without penalty by notice if received and processed by the Plan Administrator prior to the dividend record date; otherwise such termination or resumption will be effective with respect to any subsequently declared dividend or other distribution. Some brokers may automatically elect to receive cash on your behalf and may re-invest that cash in additional Units of the Fund for you. If you wish for all dividends declared on your Units of the Fund to be automatically reinvested pursuant to the Plan, please contact your broker.
The Plan Administrator will open an account for each Member under the Plan in the same name in which such Member’s Units are registered. Whenever the Fund declares a dividend or other distribution (together, a “Dividend”) payable in cash, non-participants in the Plan will receive cash and participants in the Plan will receive the equivalent in Units. The Units will be acquired by the Plan Administrator for the participants’ accounts through receipt of additional unissued but authorized Units from the Fund (“Newly Issued Units”).
The Plan Administrator will invest the Dividend amount in Newly Issued Units on behalf of the participants. The number of Newly Issued Units to be credited to each participant’s account will be determined by dividing the dollar amount of the Dividend by the net asset value per Unit as of the last Business Day of the calendar month in which the payment date occurs. Units will be issued to Plan participants in accordance with the Fund’s regular monthly subscription cycle as described herein.
The Plan Agent will maintain all Members’ accounts in the Plan and furnish written confirmation of all transactions in the accounts, including information needed by Members for tax records. Units in the account of each Plan participant will be held by the Plan Agent on behalf of the Plan participant, and each Member proxy will include those Units received pursuant to the Plan. The Plan Administrator will forward all proxy solicitation materials to participants and vote proxies for Units held under the Plan in accordance with the instructions of the participants.
In the case of Members such as banks, brokers or nominees which hold Units for others who are the beneficial owners, the Plan Administrator will administer the Plan on the basis of the number of Units certified from time to time by the record Member’s name and held for the account of beneficial owners who participate in the Plan.
There will be no charges with respect to Units issued directly by the Fund as a result of dividends or capital gains distributions payable either in Units or in cash. The Plan Administrator’s fees for the handling of the reinvestment of dividends and distributions will be paid by the Fund. The automatic reinvestment of Dividends will not relieve participants of any federal, state or local income tax that may be payable (or required to be withheld) on such dividends. The Fund reserves the right to amend or terminate the Plan. There is no direct service charge to participants with regard to purchases in the Plan; however, the Fund reserves the right to amend the Plan to include a service charge payable by the participants.
All correspondence concerning the Plan should be directed to the Plan Administrator at BNY Mellon Alternative Investments, c/o Investor Services, 400 Bellevue Parkway, 2nd Floor (19C-0204), Wilmington, DE 19809; or by calling 1-866-211-4521.
| | | | | | |
| 24 | | BLACKROCK PREFERRED PARTNERS LLC | | MARCH 31, 2015 | | |
| | | | | | | | | | |
Name, Address1, and Year of Birth | | Position(s)
Held with
Fund | | Length of Time Served as a Director | | Principal Occupation(s) During Past Five Years | | Number of BlackRock-
Advised Registered
Investment Companies
(“RICs”) Consisting of
Investment Portfolios
(“Portfolios”) Overseen | | Public
Directorships |
| Non-Interested Directors2 | | |
Richard E. Cavanagh 1946 | | Chairman of the Board and Director | | Since 2011 | | Trustee, Aircraft Finance Trust from 1999 to 2009; Director, The Guardian Life Insurance Company of America since 1998; Director, Arch Chemical (chemical and allied products) from 1999 to 2011; Trustee, Educational Testing Service from 1997 to 2009 and Chairman thereof from 2005 to 2009; Senior Advisor, The Fremont Group since 2008 and Director thereof since 1996; Faculty Member/Adjunct Lecturer, Harvard University since 2007; President and Chief Executive Officer, The Conference Board, Inc. (global business research organization) from 1995 to 2007. | | 76 RICs consisting of 76 Portfolios | | None |
Karen P. Robards 1950 | | Vice Chairperson of the Board, Chairperson of the Audit Committee and Director | | Since 2011 | | Partner of Robards & Company, LLC (financial advisory firm) since 1987; Co-founder and Director of the Cooke Center for Learning and Development (a not-for-profit organization) since 1987; Director of Care Investment Trust, Inc. (health care real estate investment trust) from 2007 to 2010; Investment Banker at Morgan Stanley from 1976 to 1987. | | 76 RICs consisting of 76 Portfolios | | AtriCure, Inc. (medical devices); Greenhill & Co., Inc. |
Michael J. Castellano 1946 | | Director and Member of the Audit Committee | | Since 2011 | | Chief Financial Officer of Lazard Group LLC from 2001 to 2011; Chief Financial Officer of Lazard Ltd from 2004 to 2011; Director, Support Our Aging Religious (non-profit) since 2009; Director, National Advisory Board of Church Management at Villanova University since 2010. Trustee, Domestic Church Media Foundation since 2012; Director, CircleBlack Inc. (financial technology company) since 2015. | | 76 RICs consisting of 76 Portfolios | | None |
Frank J. Fabozzi3 1948 | | Director and Member of the Audit Committee | | Since 2011 | | Editor of and Consultant for The Journal of Portfolio Management since 2006; Professor of Finance, EDHEC Business School since 2011; Visiting Professor, Princeton University from 2013 to 2014; Professor in the Practice of Finance and Becton Fellow, Yale University School of Management from 2006 to 2011. | | 109 RICs consisting of 232 Portfolios | | None |
Kathleen F. Feldstein 1941 | | Director | | Since 2011 | | President of Economics Studies, Inc. (private economic consulting firm) since 1987; Chair, Board of Trustees, McLean Hospital from 2000 to 2008 and Trustee Emeritus thereof since 2008; Member of the Board of Partners Community Healthcare, Inc. from 2005 to 2009; Member of the Corporation of Partners HealthCare since 1995; Trustee, Museum of Fine Arts, Boston since 1992; Member of the Visiting Committee to the Harvard University Art Museum since 2003; Director, Catholic Charities of Boston since 2009. | | 76 RICs consisting of 76 Portfolios | | The McClatchy Company (publishing) |
James T. Flynn 1939 | | Director and Member of the Audit Committee | | Since 2011 | | Chief Financial Officer of JPMorgan & Co., Inc. from 1990 to 1995. | | 76 RICs consisting of 76 Portfolios | | None |
Jerrold B. Harris 1942 | | Director | | Since 2011 | | Trustee, Ursinus College from 2000 to 2012; Director, Waterfowl Chesapeake (conservation) since 2014; Director, Ducks Unlimited, Inc. (conservation) since 2013 ; Director, Troemner LLC (scientific equipment) since 2000; Director of Delta Waterfowl Foundation from 2010 to 2012; President and Chief Executive Officer, VWR Scientific Products Corporation from 1990 to 1999. | | 76 RICs consisting of 76 Portfolios | | BlackRock Kelso Capital Corp. (business development company) |
| | | | | | |
| | | BLACKROCK PREFERRED PARTNERS LLC | | MARCH 31, 2015 | | 25 |
| | |
| Officers and Directors (continued) | | |
| | | | | | | | | | |
Name, Address1, and Year of Birth | | Position(s) Held with Fund | | Length of Time Served as a Director | | Principal Occupation(s) During Past Five Years | | Number of BlackRock-
Advised Registered
Investment Companies
(“RICs”) Consisting of
Investment Portfolios
(“Portfolios”) Overseen | | Public
Directorships |
| Non-Interested Directors2 (concluded) | | |
R. Glenn Hubbard 1958 | | Director | | Since 2011 | | Dean, Columbia Business School since 2004; Faculty member, Columbia Business School since 1988. | | 76 RICs consisting of 76 Portfolios | | ADP (data and information services); Metropolitan Life Insurance Company (insurance) |
W. Carl Kester 1951 | | Director and Member of the Audit Committee | | Since 2011 | | George Fisher Baker Jr. Professor of Business Administration, Harvard Business School since 2008. Deputy Dean for Academic Affairs from 2006 to 2010; Chairman of the Finance Unit, 2005 to 2006; Senior Associate Dean and Chairman of the MBA Program from 1999 to 2005; Member of the faculty of Harvard Business School since 1981. | | 76 RICs consisting of 76 Portfolios | | None |
| | 1 The address of each Director and Officer is c/o BlackRock, Inc., Park Avenue Plaza 55 East 52nd Street New York, NY 10055. 2 Independent Directors serve until their resignation, removal or death, or until December 31 of the year in which they turn 74. The maximum age limitation may be waived as to any Director by action of a majority of the Directors upon finding good cause thereof. The Board of Directors has unanimously approved extending the mandatory retirement age for Mr. Flynn until December 31, 2015, which the Board believes is in the best interest of Members. 3 Dr. Fabozzi is also a board member of the BlackRock Equity-Liquidity Complex. |
| Interested Directors4 | | |
John M. Perlowski 1964 | | Director, President and Chief Executive Officer | | 2014 to present (Director); 2011 to present (President and Chief Executive Officer) | | Managing Director of BlackRock, Inc. since 2009; Head of Global Fund Services since 2009; Managing Director and Chief Operating Officer of the Global Product Group at Goldman Sachs Asset Management, L.P. from 2003 to 2009; Treasurer of Goldman Sachs Mutual Funds from 2003 to 2009 and Senior Vice President thereof from 2007 to 2009; Director of Goldman Sachs Offshore Funds from 2002 to 2009; Director of Family Resource Network (charitable foundation) since 2009. | | 104 RICs consisting of 174 Portfolios | | None |
Barbara G. Novick 1960 | | Director | | Since 2014 | | Vice Chairman of BlackRock, Inc. since 2006; Chair of BlackRock’s Government Relations Steering Committee since 2009; head of the Global Client Group of BlackRock, Inc. from 1988 to 2008. | | 109 RICs consisting of 232 Portfolios | | None |
| | 4 Mr. Perlowski and Ms. Novick are both “interested persons,” as defined in the 1940 Act, of the Fund based on their positions with BlackRock and its affiliates. Mr. Perlowski and Ms. Novick are also board members of a complex of BlackRock registered open-end funds. Mr. Perlowski is a board member of the BlackRock Equity-Bond Complex and Ms. Novick is a board member of the BlackRock Equity-Liquidity Complex. Interested Directors of the BlackRock Closed-End Complex serve until their resignation, removal or death, or until December 31 of the year in which they turn 72. The maximum age limitation may be waived as to any Director by action of a majority of the Directors upon finding good cause thereof. |
| | | | | | |
| 26 | | BLACKROCK PREFERRED PARTNERS LLC | | MARCH 31, 2015 | | |
| | |
| Officers and Directors (concluded) | | |
| | | | | | |
Name, Address1, and Year of Birth | | Position(s) Held with
Fund | | Length of Time
Served | | Principal Occupation(s) During Past Five Years |
| Fund Officers2 | | | | | | |
John M. Perlowski 1964 | | Director, President and Chief Executive Officer | | 2014 to present (Director); 2011 to present (President and Chief Executive Officer) | | Managing Director of BlackRock, Inc. since 2009; Head of Global Fund Services since 2009; Managing Director and Chief Operating Officer of the Global Product Group at Goldman Sachs Asset Management, L.P. from 2003 to 2009; Treasurer of Goldman Sachs Mutual Funds from 2003 to 2009 and Senior Vice President thereof from 2007 to 2009; Director of Goldman Sachs Offshore Funds from 2002 to 2009; Director of Family Resource Network (charitable foundation) since 2009. |
Robert W. Crothers 1981 | | Vice President | | Since 2012 | | Director of BlackRock since 2011; Vice President of BlackRock from 2008 to 2010. |
Neal Andrews 1966 | | Chief Financial Officer | | Since 2011 | | Managing Director of BlackRock since 2006; Senior Vice President and Line of Business Head of Fund Accounting and Administration at PNC Global Investment Servicing (U.S.) Inc. from 1992 to 2006. |
Jay Fife 1970 | | Treasurer | | Since 2011 | | Managing Director of BlackRock since 2007; Director of BlackRock in 2006; Assistant Treasurer of MLIM and Fund Asset Management, L.P. advised funds from 2005 to 2006; Director of MLIM Fund Services Group from 2001 to 2006. |
Charles Park 1967 | | Chief Compliance Officer | | Since 2014 | | Anti-Money Laundering Compliance Officer for the BlackRock Funds in the Equity-Bond Complex, the Equity-Liquidity Complex and the Closed-End Complex from 2014 to 2015; Chief Compliance Officer of BlackRock Advisors, LLC and the BlackRock-advised Funds in the Equity-Bond Complex, the Equity-Liquidity Complex and the Closed-End Complex since 2014; Principal of and Chief Compliance Officer for iShares® Delaware Trust Sponsor LLC since 2012 and BlackRock Fund Advisors (“BFA”) since 2006; Chief Compliance Officer for the BFA-advised iShares exchange traded funds since 2006; Chief Compliance Officer for BlackRock Asset Management International Inc. since 2012. |
Fernanda Piedra 1969 | | Anti-Money Laundering Compliance Officer | | Since 2015 | | Director of BlackRock, Inc. since 2014; Anti-Money Laundering Compliance Officer and Regional Head of Financial Crime for the Americas at BlackRock, Inc. since 2014; Head of Regulatory Changes and Remediation for the Asset Wealth Management Division of Deutsche Bank from 2010 to 2014; Director of Goldman Sachs (Anti-Money Laundering/Suspicious Activities Group) from 2004 to 2010. |
Janey Ahn 1975 | | Secretary | | Since 2012 | | Director of BlackRock since 2009; Vice President of BlackRock from 2008 to 2009; Assistant Secretary of the Funds from 2008 to 2012. |
| | 1 The address of each Director and Officer is c/o BlackRock, Inc., Park Avenue Plaza, 55 East 52nd Street New York, NY 10055. 2 Officers of the Fund serve at the pleasure of the Board. |
Effective December 31, 2014, Paul L. Audet and Henry Gabbay resigned as Directors of the Fund. Effective December 31, 2014, Barbara G. Novick and John M. Perlowski were appointed to serve as Directors of the Fund.
Effective March 1, 2015, Charles Park resigned as Anti-Money Laundering Compliance Officer of the Fund. Effective March 1, 2015, Fernanda Piedra was appointed to serve as Anti-Money Laundering Compliance Officer of the Fund.
| | | | | | |
| | | | |
Investment Advisor BlackRock Advisors, LLC Wilmington, DE 19809 | | Custodian The Bank of New York Mellon New York, NY 10286 | | Distributor BlackRock Investments, LLC New York, NY 10022 | | Address of the Fund 100 Bellevue Parkway Wilmington, DE 19809 |
| | | | | | |
Legal Counsel Skadden, Arps, Slate, Meagher & Flom LLP New York, NY 10036 | | Independent Registered Public
Accounting Firm Deloitte & Touche LLP Philadelphia, PA 19103 | | Accounting Agent and Administrator BNY Mellon Investment Servicing (US) Inc. Wilmington, DE 19809 | | Transfer Agent BNY Mellon Investment Servicing (US) Inc. Westborough, MA 01581 |
The Fund is currently distributed by BlackRock Investments, LLC. You should consider the investment objectives, risks, charges and expenses of the Fund carefully before investing. The Fund’s prospectus contains this and other information and is available at www.blackrock.com or by calling (800) 441-7762 or from your financial advisor. The prospectus should be read carefully before investing.
| | | | | | |
| | | BLACKROCK PREFERRED PARTNERS LLC | | MARCH 31, 2015 | | 27 |
During the period, there were no material changes in the Fund’s investment objectives or policies or the Fund’s charter or by-laws that were not approved by the shareholders or in the principal risk factors associated with investment in the Fund. There have been no changes in the persons who are primarily responsible for the day-to-day management of the Fund’s portfolio.
The Fund calculates its NAV as of the close of business on the last Business Day of each calendar month, within approximately 25 calendar days after the last Business Day of such month, and at such other times as the Board may determine. Members desiring to obtain the Fund’s most recently calculated NAV may contact the Fund’s administrator, The Bank of New York Mellon, at 1-866-211-4521. The Fund’s most recently calculated NAV can also be obtained by visiting www.blackrock.com/funds and clicking on “Alternative Investments.”
Electronic Delivery
Members can sign up for e-mail notifications of quarterly statements, annual and semi-annual shareholder reports and prospectuses by enrolling in the electronic delivery program. Electronic copies of shareholder reports are available on BlackRock’s website.
To enroll in electronic delivery:
Shareholders Who Hold Accounts with Investment Advisors, Banks or Brokerages:
Please contact your financial advisor. Please note that not all investment advisors, banks or brokerages may offer this service.
Householding
The Fund will mail only one copy of shareholder documents, including annual and semi-annual reports and proxy statements, to shareholders with multiple accounts at the same address. This practice is commonly called “householding” and is intended to reduce expenses and eliminate duplicate mailings of shareholder documents. Mailings of your shareholder documents may be householded indefinitely unless you instruct us otherwise. If you do not want the mailing of these documents to be combined with those for other members of your household, please call the Fund at
(800) 441-7762.
Availability of Quarterly Schedule of Investments
The Fund files its complete schedule of portfolio holdings with the Securities and Exchange Commission (the “SEC”) for the first and third quarters of each fiscal year on Form N-Q. The Fund’s Forms N-Q are available on the SEC’s website at http://www.sec.gov and may also be reviewed and copied at the SEC’s Public Reference Room in Washington, D.C. Information on how to access documents on the SEC’s website without charge may be obtained by calling (800) SEC-0330. The Fund’s Forms N-Q may also be obtained upon request and without charge by calling
(800) 441-7762.
Availability of Proxy Voting Policies and Procedures
A description of the policies and procedures that the Fund uses to determine how to vote proxies relating to portfolio securities is available (1) without charge, upon request, by calling (800) 441-7762; (2) at http://www.blackrock.com; (3) on the SEC’s website at http://www.sec.gov.
Availability of Proxy Voting Record
Information about how the Fund votes proxies relating to securities held in the Fund’s portfolios during the most recent period ended September 30 is available upon request and without charge (1) at http://www.blackrock.com or by calling (800) 441-7762 and (2) on the SEC’s website at
http:// www.sec.gov.
|
| BlackRock Privacy Principles |
BlackRock is committed to maintaining the privacy of its current and former fund investors and individual clients (collectively, “Clients”) and to safeguarding their non-public personal information. The following information is provided to help you understand what personal information BlackRock collects, how we protect that information and why in certain cases we share such information with select parties.
If you are located in a jurisdiction where specific laws, rules or regulations require BlackRock to provide you with additional or different privacy-related rights beyond what is set forth below, then BlackRock will comply with those specific laws, rules or regulations.
| | | | | | |
| 28 | | BLACKROCK PREFERRED PARTNERS LLC | | MARCH 31, 2015 | | |
| | |
| Additional Information (concluded) | | |
BlackRock obtains or verifies personal non-public information from and about you from different sources, including the following: (i) information we receive from you or, if applicable, your financial intermediary, on applications, forms or other documents; (ii) information about your transactions with us, our affiliates, or others; (iii) information we receive from a consumer reporting agency; and (iv) from visits to our websites.
BlackRock does not sell or disclose to non-affiliated third parties any non-public personal information about its Clients, except as permitted by law or as is necessary to respond to regulatory requests or to service Client accounts. These non-affiliated third parties are required to protect the confidentiality and security of this information and to use it only for its intended purpose.
We may share information with our affiliates to service your account or to provide you with information about other BlackRock products or services that may be of interest to you. In addition, BlackRock restricts access to non-public personal information about its Clients to those BlackRock employees with a legitimate business need for the information. BlackRock maintains physical, electronic and procedural safeguards that are designed to protect the non-public personal information of its Clients, including procedures relating to the proper storage and disposal of such information.
| | | | | | |
| | | BLACKROCK PREFERRED PARTNERS LLC | | MARCH 31, 2015 | | 29 |
| | |
This report is intended for current holders. It is not a prospectus. Past performance results shown in this report should not be considered a representation of future performance. Statements and other information herein are as dated and are subject to change. | | 
|
| | |
Prefp-3/15-AR | |  |
| | |
| |
| Item 2 – | | Code of Ethics – The registrant (or the “Fund”) has adopted a code of ethics, as of the end of the period covered by this report, applicable to the registrant’s principal executive officer, principal financial officer, principal accounting officer or controller, or persons performing similar functions. During the period covered by this report, the code of ethics was amended to update certain information and to make other non-material changes. During the period covered by this report, there have been no waivers granted under the code of ethics. A copy of the code of ethics is available without charge at www.blackrock.com. |
| |
| Item 3 – | | Audit Committee Financial Expert – The registrant’s board of directors (the “board of directors”), has determined that (i) the registrant has the following audit committee financial experts serving on its audit committee and (ii) each audit committee financial expert is independent: |
| |
| | Michael Castellano |
| | Frank J. Fabozzi James T. Flynn W. Carl Kester Karen P. Robards |
| |
| | The registrant’s board of directors has determined that W. Carl Kester and Karen P. Robards qualify as financial experts pursuant to Item 3(c)(4) of Form N-CSR. |
| |
| | Prof. Kester has a thorough understanding of generally accepted accounting principles, financial statements and internal control over financial reporting as well as audit committee functions. Prof. Kester has been involved in providing valuation and other financial consulting services to corporate clients since 1978. Prof. Kester’s financial consulting services present a breadth and level of complexity of accounting issues that are generally comparable to the breadth and complexity of issues that can reasonably be expected to be raised by the registrant’s financial statements. |
| |
| | Ms. Robards has a thorough understanding of generally accepted accounting principles, financial statements and internal control over financial reporting as well as audit committee functions. Ms. Robards has been President of Robards & Company, a financial advisory firm, since 1987. Ms. Robards was formerly an investment banker for more than 10 years where she was responsible for evaluating and assessing the performance of companies based on their financial results. Ms. Robards has over 30 years of experience analyzing financial statements. She also is a member of the audit committee of one publicly held company and a non-profit organization. |
| |
| | Under applicable securities laws, a person determined to be an audit committee financial expert will not be deemed an “expert” for any purpose, including without limitation for the purposes of Section 11 of the Securities Act of 1933, as a result of being designated or identified as an audit committee financial expert. The designation or identification as an audit committee financial expert does not impose on such person any duties, obligations, or liabilities greater than the duties, obligations, and liabilities imposed on such person as a member of the audit committee and board of directors in the absence of such designation or identification. The designation or identification of a person as an audit committee financial expert does not affect the duties, obligations, or liability of any other member of the audit committee or board of directors. |
2
| | |
| Item 4 – | | Principal Accountant Fees and Services |
| |
| | The following table presents fees billed by Deloitte & Touche LLP (“D&T”) in each of the last two fiscal years for the services rendered to the Fund: |
| | | | | | | | | | | | | | | | |
| | | (a) Audit Fees | | (b) Audit-Related Fees1 | | (c) Tax Fees2 | | (d) All Other Fees3 |
| Entity Name | | Current Fiscal Year
End | | Previous
Fiscal Year
End | | Current Fiscal Year
End | | Previous
Fiscal Year
End | | Current Fiscal Year
End | | Previous
Fiscal Year
End | | Current Fiscal Year
End | | Previous
Fiscal Year
End |
BlackRock Preferred Partners LLC | | $50,513 | | $45,263 | | $16,000 | | $16,000 | | $15,147 | | $14,850 | | $0 | | $0 |
| | |
| |
| | The following table presents fees billed by D&T that were required to be approved by the registrant’s audit committee (the “Committee”) for services that relate directly to the operations or financial reporting of the Fund and that are rendered on behalf of BlackRock Advisors, LLC (“Investment Adviser” or “BlackRock”) and entities controlling, controlled by, or under common control with BlackRock (not including any sub-adviser whose role is primarily portfolio management and is subcontracted with or overseen by another investment adviser) that provide ongoing services to the Fund (“Fund Service Providers”): |
| | | | |
| | | Current Fiscal Year End | | Previous Fiscal Year End |
| (b) Audit-Related Fees1 | | $0 | | $0 |
| (c) Tax Fees2 | | $0 | | $0 |
| (d) All Other Fees3 | | $2,391,000 | | $2,555,000 |
1 The nature of the services includes assurance and related services reasonably related to the performance of the audit of financial statements not included in Audit Fees.
2 The nature of the services includes tax compliance, tax advice and tax planning.
3 Aggregate fees borne by BlackRock in connection with the review of compliance procedures and attestation thereto performed by D&T with respect to all of the registered closed-end funds and some of the registered open-end funds advised by BlackRock.
(e)(1) Audit Committee Pre-Approval Policies and Procedures:
The Committee has adopted policies and procedures with regard to the pre-approval of services. Audit, audit-related and tax compliance services provided to the registrant on an annual basis require specific pre-approval by the Committee. The Committee also must approve other non-audit services provided to the registrant and those non-audit services provided to the Investment Adviser and Fund Service Providers that relate directly to the operations and the financial reporting of the registrant. Certain of these non-audit services that the Committee believes are (a) consistent with the SEC’s auditor independence rules and (b) routine and recurring services that will not impair the independence of the independent accountants may be approved by the Committee without consideration on a specific case-by-case basis (“general pre-approval”). The term of any general pre-approval is 12 months from the date of the pre-approval, unless the Committee provides for a different period. Tax or other non-audit services provided to the registrant which have a direct impact on the operations or financial reporting of the registrant will only be deemed pre-approved provided that any individual project does not exceed $10,000 attributable to the registrant or $50,000 per project. For this purpose, multiple projects will be aggregated to determine if they exceed the previously mentioned cost levels.
Any proposed services exceeding the pre-approved cost levels will require specific pre-approval by the Committee, as will any other services not subject to general pre-approval (e.g., unanticipated but permissible services). The Committee is informed of each service approved
3
subject to general pre-approval at the next regularly scheduled in-person board meeting. At this meeting, an analysis of such services is presented to the Committee for ratification. The Committee may delegate to the Committee Chairman the authority to approve the provision of and fees for any specific engagement of permitted non-audit services, including services exceeding pre-approved cost levels.
(e)(2) None of the services described in each of Items 4(b) through (d) were approved by the Committee pursuant to the de minimis exception in paragraph (c)(7)(i)(C) of Rule 2-01 of Regulation S-X.
(f) Not Applicable
(g) The aggregate non-audit fees paid to the accountant for services rendered by the accountant to the registrant, the Investment Adviser and the Fund Service Providers were:
| | | | |
| Entity Name | | Current Fiscal Year End | | Previous Fiscal Year End |
BlackRock Preferred Partners LLC | | $15,147 | | $14,850 |
Additionally, SSAE 16 Review (Formerly, SAS No. 70) fees for the current and previous fiscal years of $2,391,000 and $2,555,000, respectively, were billed by D&T to the Investment Adviser.
(h) The Committee has considered and determined that the provision of non-audit services that were rendered to the Investment Adviser, and the Fund Service Providers that were not pre-approved pursuant to paragraph (c)(7)(ii) of Rule 2-01 of Regulation S-X is compatible with maintaining the principal accountant’s independence.
| | | | |
Item 5 – | | Audit Committee of Listed Registrants |
| | |
| | (a) | | The following individuals are members of the registrant’s separately-designated standing audit committee established in accordance with Section 3(a)(58)(A) of the Securities Exchange Act of 1934
(15 U.S.C. 78c(a)(58)(A)): |
| | |
| | | | Michael Castellano Frank J. Fabozzi James T. Flynn W. Carl Kester Karen P. Robards |
| | |
| | (b) | | Not Applicable |
| |
Item 6 – | | Investments |
| | (a) The registrant’s Schedule of Investments is included as part of the Report to Stockholders filed under Item 1 of this Form. |
4
| | | | |
| | (b) Not Applicable due to no such divestments during the semi-annual period covered since the previous Form N-CSR filing. |
| |
Item 7 – | | Disclosure of Proxy Voting Policies and Procedures for Closed-End Management Investment Companies – The board of directors has delegated the voting of proxies for the Fund’s portfolio securities to the Investment Adviser pursuant to the Investment Adviser’s proxy voting guidelines. Under these guidelines, the Investment Adviser will vote proxies related to Fund securities in the best interests of the Fund and its stockholders. From time to time, a vote may present a conflict between the interests of the Fund’s stockholders, on the one hand, and those of the Investment Adviser, or any affiliated person of the Fund or the Investment Adviser, on the other. In such event, provided that the Investment Adviser’s Equity Investment Policy Oversight Committee, or a sub-committee thereof (the “Oversight Committee”) is aware of the real or potential conflict or material non-routine matter and if the Oversight Committee does not reasonably believe it is able to follow its general voting guidelines (or if the particular proxy matter is not addressed in the guidelines) and vote impartially, the Oversight Committee may retain an independent fiduciary to advise the Oversight Committee on how to vote or to cast votes on behalf of the Investment Adviser’s clients. If the Investment Adviser determines not to retain an independent fiduciary, or does not desire to follow the advice of such independent fiduciary, the Oversight Committee shall determine how to vote the proxy after consulting with the Investment Adviser’s Portfolio Management Group and/or the Investment Adviser’s Legal and Compliance Department and concluding that the vote cast is in its client’s best interest notwithstanding the conflict. A copy of the Fund’s Proxy Voting Policy and Procedures are attached as Exhibit 99.PROXYPOL. Information on how the Fund voted proxies relating to portfolio securities during the most recent 12-month period ended June 30 is available without charge, (i) at www.blackrock.com and (ii) on the SEC’s website at http://www.sec.gov. |
| |
Item 8 – | | Portfolio Managers of Closed-End Management Investment Companies – as of March 31, 2015. |
| | |
| | (a)(1) | | The Fund is managed by a team of investment professionals comprised of Edward Rzeszowski, Managing Director at BlackRock, and Nicholas Sideratos, Managing Director at BlackRock. Messrs. Rzeszowski and Sideratos are jointly responsible for the day-to-day management of the registrant’s portfolio, which includes setting the registrant’s overall investment strategy, overseeing the management of the registrant and selection of its investments. Messrs. Rzeszowski and Sideratos have each been members of the registrant’s portfolio management team since the Fund’s inception in 2011. |
| | |
| Portfolio Manager | | Biography |
| Edward Rzeszowski | | Managing Director of BlackRock since 2007; Director of BlackRock, in 2006. |
| Nicholas Sideratos | | Managing Director of BlackRock since 2007; Principal of Quellos from 2006 to 2007. |
(a)(2) As of March 31, 2015:
5
| | | | | | | | | | | | |
| | | (ii) Number of Other Accounts Managed and Assets by Account Type | | (iii) Number of Other Accounts and Assets for Which Advisory Fee is Performance-Based |
(i) Name of Portfolio Manager | | Other Registered Investment Companies | | Other Pooled Investment Vehicles | | Other Accounts | | Other Registered Investment Companies | | Other Pooled Investment Vehicles | | Other Accounts |
| Edward Rzeszowski | | 1 | | 6 | | 0 | | 0 | | 0 | | 0 |
| | | $102.9 Million | | $1.79 Billion | | $0 | | $0 | | $0 | | $0 |
| Nicholas Sideratos | | 0 | | 12 | | 1 | | 0 | | 0 | | 0 |
| | | $0 | | $1.76 Billion | | $314.5 Million | | $0 | | $0 | | $0 |
(iv) Potential Material Conflicts of Interest
BlackRock has built a professional working environment, firm-wide compliance culture and compliance procedures and systems designed to protect against potential incentives that may favor one account over another. BlackRock has adopted policies and procedures that address the allocation of investment opportunities, execution of portfolio transactions, personal trading by employees and other potential conflicts of interest that are designed to ensure that all client accounts are treated equitably over time. Nevertheless, BlackRock furnishes investment management and advisory services to numerous clients in addition to the Fund, and BlackRock may, consistent with applicable law, make investment recommendations to other clients or accounts (including accounts which are hedge funds or have performance or higher fees paid to BlackRock, or in which portfolio managers have a personal interest in the receipt of such fees), which may be the same as or different from those made to the Fund. In addition, BlackRock, Inc., its affiliates and significant shareholders and any officer, director, shareholder or employee may or may not have an interest in the securities whose purchase and sale BlackRock recommends to the Fund. BlackRock, Inc., or any of its affiliates or significant shareholders, or any officer, director, shareholder, employee or any member of their families may take different actions than those recommended to the Fund by BlackRock with respect to the same securities. Moreover, BlackRock may refrain from rendering any advice or services concerning securities of companies of which any of BlackRock, Inc.’s (or its affiliates’ or significant shareholders’) officers, directors or employees are directors or officers, or companies as to which BlackRock, Inc. or any of its affiliates or significant shareholders or the officers, directors and employees of any of them has any substantial economic interest or possesses material non-public information. Certain portfolio managers also may manage accounts whose investment strategies may at times be opposed to the strategy utilized for a fund. It should also be noted that Messrs. Rzeszowski and Sideratos may be managing hedge fund and/or long only accounts, or may be part of a team managing hedge fund and/or long only accounts, subject to incentive fees. Messrs. Rzeszowski and Sideratos may therefore be entitled to receive a portion of any incentive fees earned on such accounts.
As a fiduciary, BlackRock owes a duty of loyalty to its clients and must treat each client fairly. When BlackRock purchases or sells securities for more than one account, the trades must be allocated in a manner consistent with its fiduciary duties. BlackRock attempts to allocate investments in a fair and equitable manner among client accounts, with no account receiving preferential treatment. To this end, BlackRock, Inc. has adopted policies that are intended to ensure reasonable efficiency in client transactions and provide BlackRock with sufficient
6
flexibility to allocate investments in a manner that is consistent with the particular investment discipline and client base, as appropriate.
(a)(3) As of March 31, 2015:
Portfolio Manager Compensation Overview
The discussion below describes the portfolio managers’ compensation as of March 31, 2015.
BlackRock’s financial arrangements with its portfolio managers, its competitive compensation and its career path emphasis at all levels reflect the value senior management places on key resources. Compensation may include a variety of components and may vary from year to year based on a number of factors. The principal components of compensation include a base salary, a performance-based discretionary bonus, participation in various benefits programs and one or more of the incentive compensation programs established by BlackRock.
Base compensation. Generally, portfolio managers receive base compensation based on their position with the firm.
Discretionary Incentive Compensation
Discretionary incentive compensation is a function of several components: the performance of BlackRock, Inc., the performance of the portfolio manager’s group within BlackRock, the investment performance, including risk-adjusted returns, of the firm’s assets under management or supervision by that portfolio manager, and the individual’s performance and contribution to the overall performance of these portfolios and BlackRock. Among other things, BlackRock’s Chief Investment Officers make a subjective determination with respect to each portfolio manager’s compensation based on the performance of the Funds and other accounts managed by each portfolio manager. Performance of multi-asset class funds is generally measured on a pre-tax basis over various time periods including 1-, 3- and 5- year periods, as applicable. With respect to these portfolio managers, such benchmarks for the Fund and other accounts are:
| | |
| Portfolio Manager | | Applicable Benchmarks |
| Edward Rzeszowski | | HFRI Fund of Funds Composite Index and Bank of America Merrill Lynch 3-Month U.S. Treasury Bill Index |
| Nicholas Sideratos | | HFRI Fund of Funds Composite Index |
Distribution of Discretionary Incentive Compensation. Discretionary incentive compensation is distributed to portfolio managers in a combination of cash and BlackRock, Inc. restricted stock units which vest ratably over a number of years. For some portfolio managers, discretionary incentive compensation is also distributed in deferred cash awards that notionally track the returns of select BlackRock investment products they manage and that vest ratably over a number of years. The BlackRock, Inc. restricted stock units, upon vesting, will be settled in
7
BlackRock, Inc. common stock. Typically, the cash portion of the discretionary incentive compensation, when combined with base salary, represents more than 60% of total compensation for the portfolio managers. Paying a portion of discretionary incentive compensation in BlackRock, Inc. stock puts compensation earned by a portfolio manager for a given year “at risk” based on BlackRock’s ability to sustain and improve its performance over future periods. Providing a portion of discretionary incentive compensation in deferred cash awards that notionally track the BlackRock investment products they manage provides direct alignment with investment product results.
Long-Term Incentive Plan Awards — From time to time long-term incentive equity awards are granted to certain key employees to aid in retention, align their interests with long-term shareholder interests and motivate performance. Equity awards are generally granted in the form of BlackRock, Inc. restricted stock units that, once vested, settle in BlackRock, Inc. common stock. The portfolio managers of this Fund have unvested long-term incentive awards.
Deferred Compensation Program — A portion of the compensation paid to eligible United States-based BlackRock employees may be voluntarily deferred at their election for defined periods of time into an account that tracks the performance of certain of the firm’s investment products. Any portfolio manager who is either a managing director or director at BlackRock with compensation above a specified threshold is eligible to participate in the deferred compensation program.
Other Compensation Benefits. In addition to base salary and discretionary incentive compensation, portfolio managers may be eligible to receive or participate in one or more of the following:
Incentive Savings Plans — BlackRock, Inc. has created a variety of incentive savings plans in which BlackRock, Inc. employees are eligible to participate, including a 401(k) plan, the BlackRock Retirement Savings Plan (RSP), and the BlackRock Employee Stock Purchase Plan (ESPP). The employer contribution components of the RSP include a company match equal to 50% of the first 8% of eligible pay contributed to the plan capped at $5,000 per year, and a company retirement contribution equal to 3-5% of eligible compensation up to the Internal Revenue Service limit ($265,000 for 2015). The RSP offers a range of investment options, including registered investment companies and collective investment funds managed by the firm. BlackRock, Inc. contributions follow the investment direction set by participants for their own contributions or, absent participant investment direction, are invested into a target date fund that corresponds to, or is closest to, the year in which the participant attains age 65. The ESPP allows for investment in BlackRock, Inc. common stock at a 5% discount on the fair market value of the stock on the purchase date. Annual participation in the ESPP is limited to the purchase of 1,000 shares of common stock or a dollar value of $25,000 based on its fair market value on the purchase date. All of the eligible portfolio managers are eligible to participate in these plans.
(a)(4) Beneficial Ownership of Securities – As of March 31, 2015.
| | |
| Portfolio Manager | | Dollar Range of Equity Securities of the Fund Beneficially Owned |
Edward Rzeszowski | | None |
Nicholas Sideratos | | None |
8
| | |
| | (b) Not Applicable |
| |
| Item 9 – | | Purchases of Equity Securities by Closed-End Management Investment Company and Affiliated Purchasers – Not Applicable due to no such purchases during the period covered by this report. |
| |
| Item 10 – | | Submission of Matters to a Vote of Security Holders – There have been no material changes to these procedures. |
| |
| Item 11 – | | Controls and Procedures |
| |
| | (a) – The registrant’s principal executive and principal financial officers, or persons performing similar functions, have concluded that the registrant’s disclosure controls and procedures (as defined in Rule 30a-3(c) under the Investment Company Act of 1940, as amended (the “1940 Act”)) are effective as of a date within 90 days of the filing of this report based on the evaluation of these controls and procedures required by
Rule 30a-3(b) under the 1940 Act and Rule 13a-15(b) under the Securities Exchange Act of 1934, as amended. |
| |
| | (b) – There were no changes in the registrant’s internal control over financial reporting (as defined in
Rule 30a-3(d) under the 1940 Act) that occurred during the second fiscal quarter of the period covered by this report that have materially affected, or are reasonably likely to materially affect, the registrant’s internal control over financial reporting. |
| |
| Item 12 – | | Exhibits attached hereto |
| |
| | (a)(1) – Code of Ethics – See Item 2 |
| |
| | (a)(2) – Certifications – Attached hereto |
| |
| | (a)(3) – Not Applicable |
| |
| | (b) – Certifications – Attached hereto |
9
Pursuant to the requirements of the Securities Exchange Act of 1934 and the Investment Company Act of 1940, the registrant has duly caused this report to be signed on its behalf by the undersigned, thereunto duly authorized.
BlackRock Preferred Partners LLC
| | | | |
| By: | | /s/ John M. Perlowski | | |
| | John M. Perlowski | | |
| | Chief Executive Officer (principal executive officer) of | | |
| | BlackRock Preferred Partners LLC | | |
Date: June 2, 2015
Pursuant to the requirements of the Securities Exchange Act of 1934 and the Investment Company Act of 1940, this report has been signed below by the following persons on behalf of the registrant and in the capacities and on the dates indicated.
| | | | |
| By: | | /s/ John M. Perlowski | | |
| | John M. Perlowski | | |
| | Chief Executive Officer (principal executive officer) of | | |
| | BlackRock Preferred Partners LLC | | |
Date: June 2, 2015
| | | | |
| By: | | /s/ Neal J. Andrews | | |
| | Neal J. Andrews | | |
| | Chief Financial Officer (principal financial officer) of | | |
| | BlackRock Preferred Partners LLC | | |
Date: June 2, 2015
10