UNITED STATES
SECURITIES AND EXCHANGE COMMISSION
Washington, D.C. 20549
FORM N-CSR
CERTIFIED SHAREHOLDER REPORT OF REGISTERED
MANAGEMENT INVESTMENT COMPANIES
Investment Company Act file number 811-22548
Wall Street EWM Funds Trust
(Exact name of registrant as specified in charter)
55 E. 52nd Street
New York, NY 10055
(Address of principal executive offices) (Zip code)
Frederick Taylor, President
Wall Street EWM Funds Trust
55 E. 52nd Street
New York, NY 10055
(Name and address of agent for service)
(800) 443-4693
Registrant's telephone number, including area code
Date of fiscal year end: December 31, 2017
Date of reporting period: June 30, 2017
Item 1. Reports to Stockholders.
SEMI-ANNUAL REPORTJune 30, 2017
EVERCORE EQUITY FUND
SHAREHOLDER LETTER
Dear Shareholders,
For the first six months of 2017, the Evercore Equity Fund gained 11.09%. The S&P 500 Index was up 9.34% for the same period.
The recent strong relative and absolute results have been broad based. Unlike the first six months of 2016 where our sector underweighting in Consumer Staples and Utilities hurt our performance, our sector exposure generally helped in the first six months of 2017. With respect to contribution to return; Blackstone, Amazon and American Tower were the largest contributors while Autozone, Schlumberger, and Synchrony Financial were the most significant detractors.
After a difficult start to 2016, we refocused on our process which had generated good results in the past and were confident would do so in the future. It is gratifying to see that the Fund has generated very solid results for our shareholders in the year to date 2017.
At June 30th, the Fund had assets of $127 million and 38 positions. The five largest positions making up 18% of the portfolio were; Alphabet, United Health, Blackstone, CBRE and ThermoFisher Scientific.
Sincerely,
| Timothy Evnin | Charles Ryan |
| Portfolio Manager | Portfolio Manager |
| | |
| Michael Seppelt | |
| Portfolio Manager | |
This report must be preceded or accompanied by a prospectus.
Definitions: The S&P 500 Index is a market-capitalization weighted index that includes the 500 most widely held common stocks. It is not possible to invest directly in an index.
Mutual fund investing involves risk. Principal loss is possible. The Fund may invest in smaller and medium capitalization companies, which involves additional risks such as limited liquidity and greater volatility than large capitalization companies. The Fund may invest in foreign securities which involve political, economic and currency risks, greater volatility and differences in accounting methods.
Opinions expressed are subject to change, are not intended to be a forecast of future events, a guarantee of future results, nor investment advice. Fund holdings are subject to change and should not be considered a recommendation to buy or sell any security. Please see the schedule of investments section in this report for a full listing of the Fund’s holdings.
The Evercore Equity Fund is distributed by Quasar Distributors, LLC.
EVERCORE EQUITY FUND
SCHEDULE OF INVESTMENTS
June 30, 2017 (Unaudited)
| | | Shares | | | Value | |
| | | | | | | |
| COMMON STOCKS – 97.1% | | | | | | |
| | | | | | | |
| Chemicals – 3.1% | | | | | | |
| Celanese Corp. | | | 41,600 | | | $ | 3,949,504 | |
| | | | | | | | | |
| Containers & Packaging – 3.0% | | | | | | | | |
| WestRock Co. | | | 66,500 | | | | 3,767,890 | |
| | | | | | | | | |
| Diversified – 2.1% | | | | | | | | |
| 3M Co. | | | 13,000 | | | | 2,706,470 | |
| | | | | | | | | |
| Drugs – 2.7% | | | | | | | | |
| Allergan PLC (a) | | | 14,400 | | | | 3,500,496 | |
| | | | | | | | | |
| Electrical Equipment – 4.7% | | | | | | | | |
| A.O. Smith Corp. | | | 53,600 | | | | 3,019,288 | |
| Roper Industries, Inc. | | | 12,800 | | | | 2,963,584 | |
| | | | | | | | 5,982,872 | |
| | | | | | | | | |
| Energy Equipment & Services – 3.7% | | | | | | | | |
| Core Laboratories NV (a) | | | 22,800 | | | | 2,308,956 | |
| Schlumberger Ltd. (a) | | | 35,700 | | | | 2,350,488 | |
| | | | | | | | 4,659,444 | |
| | | | | | | | | |
| Financial Services – 15.3% | | | | | | | | |
| BlackRock, Inc. | | | 6,350 | | | | 2,682,303 | |
| East West Bancorp, Inc. | | | 54,500 | | | | 3,192,610 | |
| LendingClub Corp. (b) | | | 265,000 | | | | 1,460,150 | |
| Mastercard, Inc. | | | 33,000 | | | | 4,007,850 | |
| Synchrony Financial | | | 109,000 | | | | 3,250,380 | |
| The Blackstone Group LP | | | 142,000 | | | | 4,735,700 | |
| | | | | | | | 19,328,993 | |
| | | | | | | | | |
| Food Products – 2.5% | | | | | | | | |
| Lamb Weston Holdings, Inc. | | | 71,000 | | | | 3,126,840 | |
| | | | | | | | | |
| Forest Products – 3.0% | | | | | | | | |
| Weyerhaeuser Co. – REIT | | | 112,500 | | | | 3,768,750 | |
| | | | | | | | | |
| Health Care Services – 7.2% | | | | | | | | |
| Thermo Fisher Scientific, Inc. | | | 25,000 | | | | 4,361,750 | |
| UnitedHealth Group, Inc. | | | 26,000 | | | | 4,820,920 | |
| | | | | | | | 9,182,670 | |
| | | | | | | | | |
| Insurance – 2.8% | | | | | | | | |
| Chubb Ltd. (a) | | | 24,900 | | | | 3,619,962 | |
| | | | | | | | | |
| Machinery – 1.7% | | | | | | | | |
| Welbilt, Inc. (b) | | | 112,000 | | | | 2,111,200 | |
| | | | | | | | | |
| Office Equipment – 2.8% | | | | | | | | |
| Apple, Inc. | | | 24,700 | | | | 3,557,294 | |
| | | | | | | | | |
| Property Management – 3.6% | | | | | | | | |
| CBRE Group, Inc. – | | | | | | | | |
| Class A (b) | | | 124,000 | | | | 4,513,600 | |
| | | | | | | | | |
| Retail – 2.3% | | | | | | | | |
| TJX Companies, Inc. | | | 40,000 | | | | 2,886,800 | |
| | | | | | | | | |
| Semiconductors – 5.3% | | | | | | | | |
| NXP Semiconductors NV (a)(b) | | | 30,000 | | | | 3,283,500 | |
| Texas Instruments, Inc. | | | 45,000 | | | | 3,461,850 | |
| | | | | | | | 6,745,350 | |
| | | | | | | | | |
| Services – 9.4% | | | | | | | | |
| Accenture PLC – Class A (a) | | | 26,300 | | | | 3,252,784 | |
| Alphabet, Inc. – Class A (b) | | | 2,000 | | | | 1,859,360 | |
| Alphabet, Inc. – Class C (b) | | | 3,257 | | | | 2,959,734 | |
| Amazon.com, Inc. (b) | | | 3,950 | | | | 3,823,600 | |
| | | | | | | | 11,895,478 | |
| | | | | | | | | |
| Software – 7.6% | | | | | | | | |
| Adobe Systems, Inc. (b) | | | 21,100 | | | | 2,984,384 | |
| Ansys, Inc. (b) | | | 23,800 | | | | 2,895,984 | |
| Microsoft Corp. | | | 54,700 | | | | 3,770,471 | |
| | | | | | | | 9,650,839 | |
| | | | | | | | | |
| Specialty Retail – 11.4% | | | | | | | | |
| AutoNation, Inc. (b) | | | 53,000 | | | | 2,234,480 | |
| AutoZone, Inc. (b) | | | 5,300 | | | | 3,023,438 | |
| Dorman Products, Inc. (b) | | | 32,000 | | | | 2,648,640 | |
| Home Depot, Inc. | | | 25,000 | | | | 3,835,000 | |
| Nike, Inc. – Class B | | | 45,000 | | | | 2,655,001 | |
| | | | | | | | 14,396,559 | |
| | | | | | | | | |
| Telecommunications – 2.9% | | | | | | | | |
| American Tower Corp. – REIT | | | 27,500 | | | | 3,638,800 | |
| | | | | | | | | |
| TOTAL COMMON STOCKS | | | | | | | | |
| (Cost $78,717,247) | | | | | | | 122,989,811 | |
The accompanying notes are an integral part of these financial statements.
EVERCORE EQUITY FUND
SCHEDULE OF INVESTMENTS (continued)
June 30, 2017 (Unaudited)
| | | Shares | | | Value | |
| | | | | | | |
| SHORT TERM INVESTMENT – 3.0% | | | | | | |
| | | | | | | |
| Money Market Fund – 3.0% | | | | | | |
| Invesco Government & | | | | | | |
| Agency Portfolio, | | | | | | |
| Institutional Class, 0.89% (c) | | | 3,705,697 | | | $ | 3,705,697 | |
| TOTAL SHORT TERM | | | | | | | | |
| INVESTMENT | | | | | | | | |
| (Cost $3,705,697) | | | | | | | 3,705,697 | |
| TOTAL INVESTMENTS | | | | | | | | |
| (Cost $82,422,944) – 100.1% | | | | | | | 126,695,508 | |
| Liabilities in Excess | | | | | | | | |
| of Other Assets – (0.1)% | | | | | | | (68,845 | ) |
| TOTAL NET | | | | | | | | |
| ASSETS – 100.0% | | | | | | $ | 126,626,663 | |
| (a) | Foreign Domiciled |
| (b) | Non-income producing security |
| (c) | The rate shown is the annualized seven-day effective yield as of June 30, 2017. |
REIT – Real Estate Investment Trust
The accompanying notes are an integral part of these financial statements.
EVERCORE EQUITY FUND
STATEMENT OF ASSETS AND LIABILITIES
June 30, 2017 (Unaudited)
| ASSETS: | | | |
| Investments, at value (cost $82,422,944) | | $ | 126,695,508 | |
| Receivable for fund shares sold | | | 20,335 | |
| Dividends receivable | | | 64,979 | |
| Interest receivable | | | 2,275 | |
| Prepaid expenses | | | 18,569 | |
| Total Assets | | | 126,801,666 | |
| | | | | |
| LIABILITIES: | | | | |
| Payable for fund shares redeemed | | | 31,258 | |
| Investment advisory fee payable (Note 4) | | | 72,953 | |
| Accrued expenses and other payables | | | 70,792 | |
| Total Liabilities | | | 175,003 | |
| NET ASSETS | | $ | 126,626,663 | |
| | | | | |
| NET ASSETS CONSIST OF: | | | | |
| Capital Stock | | $ | 81,608,049 | |
| Net unrealized appreciation on investments | | | 44,272,564 | |
| Undistributed net investment income | | | 136,437 | |
| Undistributed net realized | | | | |
| gain on investments | | | 609,613 | |
| TOTAL NET ASSETS | | $ | 126,626,663 | |
| | | | | |
| Shares outstanding (unlimited shares | | | | |
| authorized, no par value) | | | 8,099,989 | |
| NET ASSET VALUE, OFFERING AND | | | | |
| REDEMPTION PRICE PER SHARE | | $ | 15.63 | |
EVERCORE EQUITY FUND
STATEMENT OF OPERATIONS
For the six months ended June 30, 2017 (Unaudited)
| INVESTMENT INCOME: | | | |
| Dividend income | | $ | 757,495 | |
| Less: foreign taxes withheld | | | (3,778 | ) |
| Total investment income | | | 753,717 | |
| | | | | |
| EXPENSES: | | | | |
| Investment advisory fees (Note 4) | | | 452,365 | |
| Fund administration and accounting fees | | | 71,339 | |
| Legal fees | | | 27,889 | |
| Transfer agent fees and expenses | | | 19,713 | |
| Trustees’ fees and expenses | | | 19,087 | |
| Federal and state registration fees | | | 16,208 | |
| Insurance expense | | | 10,761 | |
| Audit and tax fees | | | 7,684 | |
| Reports to shareholders | | | 3,521 | |
| Custody fees | | | 3,340 | |
| Total expenses before | | | | |
| expense reimbursement | | | 631,907 | |
| Expenses reimbursed by Adviser (Note 4) | | | (28,753 | ) |
| Net expenses | | | 603,154 | |
| NET INVESTMENT INCOME | | | 150,563 | |
| | | | | |
| REALIZED AND UNREALIZED | | | | |
| GAIN ON INVESTMENTS: | | | | |
| Net realized gain on | | | | |
| investment transactions | | | 1,341,181 | |
| Change in unrealized appreciation | | | | |
| on investments | | | 11,232,950 | |
| Net realized and unrealized gain | | | | |
| on investments | | | 12,574,131 | |
| NET INCREASE IN NET ASSETS | | | | |
| RESULTING FROM OPERATIONS | | $ | 12,724,694 | |
The accompanying notes are an integral part of these financial statements.
EVERCORE EQUITY FUND
STATEMENTS OF CHANGES IN NET ASSETS
| | | For the | | | For the | |
| | | Six Months | | | Year | |
| | | Ended | | | Ended | |
| | | June 30, | | | December 31, | |
| | | 2017 | | | 2016 | |
| | | Unaudited | | | | |
| OPERATIONS: | | | | | | |
| Net investment income | | $ | 150,563 | | | $ | 172,366 | |
| Net realized gain (loss) on | | | | | | | | |
| investment transactions | | | 1,341,181 | | | | (341,395 | ) |
| Change in | | | | | | | | |
| unrealized appreciation | | | | | | | | |
| on investments | | | 11,232,950 | | | | 6,262,425 | |
| Net increase in | | | | | | | | |
| net assets resulting | | | | | | | | |
| from operations | | | 12,724,694 | | | | 6,093,396 | |
| | | | | | | | | |
| CAPITAL SHARE | | | | | | | | |
| TRANSACTIONS: | | | | | | | | |
| Proceeds from shares sold | | | 5,732,179 | | | | 11,690,280 | |
| Cost of shares redeemed | | | (6,445,820 | ) | | | (12,340,780 | ) |
| Reinvested distributions | | | — | | | | 156,820 | |
| Net decrease in net assets | | | | | | | | |
| resulting from capital | | | | | | | | |
| share transactions | | | (713,641 | ) | | | (493,680 | ) |
| | | | | | | | | |
| DISTRIBUTIONS TO | | | | | | | | |
| SHAREHOLDERS FROM: | | | | | | | | |
| Net investment income | | | — | | | | (211,400 | ) |
| Net realized gain | | | — | | | | (126,836 | ) |
| Total distributions | | | | | | | | |
| to shareholders | | | — | | | | (338,236 | ) |
| | | | | | | | | |
| TOTAL INCREASE IN | | | | | | | | |
| NET ASSETS | | | 12,011,053 | | | | 5,261,480 | |
| | | | | | | | | |
| NET ASSETS: | | | | | | | | |
| Beginning of period | | | 114,615,610 | | | | 109,354,130 | |
| End of period | | $ | 126,626,663 | | | $ | 114,615,610 | |
| | | | | | | | | |
| UNDISTRIBUTED NET | | | | | | | | |
| INVESTMENT | | | | | | | | |
| INCOME (LOSS) | | $ | 136,437 | | | $ | (14,126 | ) |
EVERCORE EQUITY FUND
NOTES TO FINANCIAL STATEMENTS
June 30, 2017 (Unaudited)
1. Organization
The Evercore Equity Fund (the “Fund”) is the sole series of Wall Street EWM Funds Trust (the “Trust”). The Trust was organized as a Delaware statutory trust on April 12, 2011. The Trust is registered under the Investment Company Act of 1940 (the “1940 Act”), as amended, as an open-end management investment company. The Fund is a diversified series with its own investment objectives and policies within the Trust. The Fund seeks to produce growth of capital by investing principally in a diversified portfolio of growth-oriented common stocks. As a secondary objective, the Fund seeks realization of current income through the receipt of interest or dividends from investments by investing in dividend paying securities. The Fund is the successor in interest to The Wall Street Fund, Inc. (the “Predecessor Fund”). On September 15, 2014, the shareholders of the Predecessor Fund approved the reorganization of the Predecessor Fund into the Fund, and effective as of the close of business on October 1, 2014, the assets and liabilities of the Predecessor Fund were transferred to the Fund in exchange for shares of the Fund. Prior, to the reorganization, the Fund had no assets or operations. Since the Fund’s investment objectives and policies are the same in all material respects as the Predecessor Fund’s, and since the Fund has engaged Evercore Wealth Management, LLC, the investment adviser that previously provided services to the Predecessor Fund, the Fund has adopted the prior performance and financial history of the Predecessor Fund. On March 1, 2016, the Fund’s name changed from “The Wall Street Fund” to “Evercore Equity Fund.” The Fund is an investment company and accordingly follows the investment company accounting and reporting guidance of the Financial Accounting Standards Board (“FASB”) Accounting Standards Board Codification Topic 946 Financial Services – Investment Companies.
2. Significant Accounting Policies
The following is a summary of significant accounting policies consistently followed by the Fund in the preparation of its financial statements. These policies are in conformity with accounting principles generally accepted in the United States of America, which require management to make estimates and assumptions that affect the reported amounts of assets and liabilities and disclosure of contingent assets and liabilities at the date of the financial statements and the reported results of operations during the reporting period. Actual results could differ from those estimates and assumptions.
(a) Investment Valuation – Securities which are traded on a national stock exchange are valued at the last sale price on the securities exchange on which such securities are primarily traded. Securities traded on the over-the-counter market and
The accompanying notes are an integral part of these financial statements.
EVERCORE EQUITY FUND
NOTES TO FINANCIAL STATEMENTS (continued)
June 30, 2017 (Unaudited)
listed securities for which there were no transactions are valued at the mean between the closing bid and asked prices. Debt securities are valued at the mean price furnished by a national pricing service, subject to review by the Fund’s investment adviser and determination of the appropriate price whenever a furnished price is significantly different from the previous day’s furnished price. Investments in open-end mutual funds (other than exchange-traded funds) are valued at their respective net asset values on the valuation date. Securities for which market quotations are not readily available and other assets are valued at fair value as determined in good faith by the Fund’s investment adviser pursuant to procedures approved by and under supervision of the Fund’s Board of Trustees.
Generally accepted accounting principles require disclosures regarding the valuation inputs and techniques used to measure fair value and any changes in such valuation inputs and techniques. The various inputs used in determining the value of each of the Fund’s investments are summarized in the following three broad categories:
| Level 1 – | Unadjusted quoted prices in active markets for identical assets or liabilities that the Fund has the ability to access. |
| | |
| Level 2 – | Observable inputs other than quoted prices included in Level 1 that are observable for the asset or liability, either directly or indirectly. These inputs may include quoted prices for the identical instrument on an inactive market, prices for similar instruments, interest rates, prepayment speeds, credit risk, yield curves, default rates and similar data. |
| | |
| Level 3 – | Unobservable inputs for the asset or liability, to the extent relevant observable inputs are not available, representing the Fund’s own assumptions about the assumptions a market participant would use in valuing the asset or liability, and would be based on the best information available. |
The valuation levels are not necessarily an indication of the risk associated with investing in these investments. As of June 30, 2017, the Fund’s investments were classified as follows:
| | | | | | | | | | | | Total | |
| | | Level 1 | | | Level 2 | | | Level 3 | | | Fair Value | |
| Common | | | | | | | | | | | | |
| Stocks* | | $ | 122,989,811 | | | $ | — | | | $ | — | | | $ | 122,989,811 | |
| Short-Term | | | | | | | | | | | | | | | | |
| Investment | | | 3,705,697 | | | | — | | | | — | | | | 3,705,697 | |
| Total | | | | | | | | | | | | | | | | |
| Investments | | $ | 126,695,508 | | | $ | — | | | $ | — | | | $ | 126,695,508 | |
| * | Please refer to the Schedule of Investments for further industry breakout. |
Transfers between levels are recognized at the end of the reporting period. During the six months ended June 30, 2017, the Fund did not have any transfers between valuation levels or invest in any Level 3 securities.
(b) Federal Income and Excise Taxes – The Fund intends to meet the requirements of the Internal Revenue Code applicable to regulated investment companies and to distribute substantially all net investment company taxable income and net capital gains to shareholders in a manner which results in no tax cost to the Fund. Therefore, no federal income or excise tax provision is recorded.
The Fund has adopted financial reporting rules regarding recognition and measurement of tax positions taken or expected to be taken on a tax return. Management has reviewed all open tax years and concluded that there is no impact on the Fund’s net assets and no tax liability resulting from unrecognized tax benefits relating to uncertain income tax positions taken or expected to be taken on a tax return.
(c) Distributions to Shareholders – Dividends from net investment income and distributions of net realized capital gain, if any, will be declared and paid at least annually. Distributions to shareholders are recorded on the ex-dividend date. The Fund may periodically make reclassifications among certain of its capital accounts as a result of the recognition and characterization of certain income and capital gain distributions determined annually in accordance with federal tax regulations which may differ from generally accepted accounting principles.
(d) Securities Transactions and Investment Income – Investment transactions are recorded on the trade date for financial statement purposes. Realized gains and losses on sales of securities are calculated on the basis of identified cost. Dividend income is recognized on the ex-dividend date and interest income is recognized on an accrual basis. Acquisition and market discounts and premiums are amortized over the life of the security. Withholding taxes on foreign dividends have been provided for in accordance with the Fund’s understanding of the applicable country’s tax rules and regulations.
Distributions received from the Fund’s investments in real estate investment trusts (“REITs”) and master limited partnerships (“MLPs”) may be characterized as ordinary income, net capital gain, or a return of capital. The proper characterization of REIT and MLP distributions is generally not known until after the end of each calendar year. The Fund must use estimates in reporting the character of their income and distributions for financial statement purposes. Due to the nature of REIT and MLP investments, a portion of the distributions received by the Fund’s shareholders may represent a return of capital.
EVERCORE EQUITY FUND
NOTES TO FINANCIAL STATEMENTS (continued)
June 30, 2017 (Unaudited)
3. Investment Transactions
The aggregate purchases and sales of securities for the six months ended June 30, 2017, excluding short-term investments, were $8,279,133 and $8,443,973, respectively. There were no purchases or sales of long-term U.S. government securities.
4. Investment Adviser
The Fund has entered into an Investment Advisory Agreement with Evercore Wealth Management, LLC (the “Adviser”), with whom certain trustees and officers of the Fund are also officers and directors of the investment adviser. Pursuant to this Agreement, the Adviser is entitled to receive a management fee, calculated daily and payable monthly, at an annual rate of 0.75% of the Fund’s average daily net assets.
The Adviser has contractually agreed to waive its management fee and reimburse the Fund’s other expenses to the extent necessary to ensure that the total annual operating expenses (excluding all federal, state and local taxes, interest, dividends and interest on short positions, acquired fund fees and expenses, brokerage commissions and other costs incurred in connection with the purchase and sale of securities and extraordinary items) do not exceed 1.00% of the Fund’s average daily net assets. Fees waived and expenses reimbursed by the Adviser may be recouped by the Adviser for a period of three fiscal years following the fiscal period during which such waiver or reimbursement was made if such recoupment can be achieved without exceeding the expense limit in effect at the time the waiver and reimbursement occurred. As of June 30, 2017, the Adviser did not recoup any previously waived expenses. This expense limitation agreement will continue in effect until September 30, 2017. Waived fees and reimbursed expenses subject to potential recovery by year of expiration are as follows:
| | Expiration | | Amount | |
| | 2017 | | $ | 261,698 | |
| | 2018 | | $ | 74,720 | |
| | 2019 | | $ | 79,066 | |
| | 2020 | | $ | 28,753 | |
5. Shares of Common Stock
Transactions in shares of common stock were as follows:
| | | Six Months Ended | | | Year Ended | |
| | | June 30, 2017 | | | December 31, 2016 | |
| Shares Sold | | | 380,426 | | | | 911,393 | |
| Shares Redeemed | | | (429,168 | ) | | | (933,869 | ) |
| Shares Reinvested | | | — | | | | 11,098 | |
| Net Decrease | | | (48,742 | ) | | | (11,378 | ) |
| Shares Outstanding: | | | | | | | | |
| Beginning of Period | | | 8,148,731 | | | | 8,160,109 | |
| End of Period | | | 8,099,989 | | | | 8,148,731 | |
6. Tax Information
As of December 31, 2016, the Fund’s most recently completed fiscal year end, the components of accumulated earnings on a tax basis were as follows:
| Cost of Investments | | $ | 82,137,081 | |
| Gross unrealized appreciation | | $ | 35,920,418 | |
| Gross unrealized depreciation | | | (3,359,796 | ) |
| Net unrealized appreciation | | | 32,560,622 | |
| Undistributed ordinary income | | | 172,303 | |
| Undistributed short-term capital gain | | | — | |
| Total distributable earnings | | | 172,303 | |
| Other accumulated loss | | | (439,005 | ) |
| Total accumulated earnings | | $ | 32,293,920 | |
The basis of investments for tax and financial reporting purposes differs principally due to the deferral of losses on wash sales.
There were no distributions paid during the six months ended June 30, 2017.
The tax character of distributions paid during the years ended December 31, 2016 and 2015 were as follows:
| | | 2016 | | | 2015 | |
| Ordinary Income | | $ | 338,236 | | | $ | 695,695 | |
| Long Term Capital Gain | | $ | — | | | $ | 4,466,232 | |
The Fund intends to utilize provisions of the federal income tax laws which allow it to carry a realized capital loss forward and offset such losses against any future realized capital gains. At December 31, 2016, the Fund had short-term and long-term capital loss carryovers of $97,048 and $341,957, respectively, which will be permitted to be carried over for an unlimited period.
7. Guarantees and Indemnifications
In the normal course of business, the Fund enters into contracts with its service providers that contain general indemnification clauses. The Fund’s maximum exposure under these arrangements is unknown as this would involve future claims against the Fund that have not yet occurred. Based on experience, the Fund expects the risk of loss to be remote.
EVERCORE EQUITY FUND
FINANCIAL HIGHLIGHTS
Selected per share data is based on a share of common stock outstanding throughout each period
| | | Six Months | | | | | | | | | | | | | | | | | | | | | | | | | | | | | | | |
| | | Ended | | | | | | | | | | | | | | | | | | | | | | | | | | | | | | | |
| | | June 30, | | | Year Ended December 31, | |
| | | 2017 | | | 2016 | | | 2015 | | | 2014 | | | 2013 | | | 2012 | | | 2011 | | | 2010 | | | 2009 | | | 2008 | | | 2007 | |
| | | (Unaudited) | | | | | | | | | | | | | | | | | | | | | | | | | | | | | | | |
| Per Share Data: | | | | | | | | | | | | | | | | | | | | | | | | | | | | | | | | | |
| Net asset value, | |
| beginning of period | | $ | 14.07 | | | $ | 13.40 | | | $ | 14.39 | | | $ | 13.23 | | | $ | 9.84 | | | $ | 8.99 | | | $ | 8.93 | | | $ | 7.76 | | | $ | 5.79 | | | $ | 9.88 | | | $ | 8.78 | |
| | |
| Income from investment operations: | |
| | | | | | | | | | | | | | | | | | | | | | | | | | | | | | | | | | | | | | | | | | | | | |
Net investment income (loss)(1) | | | 0.02 | | | | 0.02 | | | | 0.04 | | | | 0.02 | | | | 0.02 | | | | 0.01 | | | | 0.04 | | | | (0.01 | ) | | | (0.02 | ) | | | (0.02 | ) | | | (0.03 | ) |
| Net realized and unrealized | |
| gains (losses) on investments | | | 1.54 | | | | 0.69 | | | | (0.37 | ) | | | 2.07 | | | | 3.68 | | | | 0.87 | | | | 0.02 | | | | 1.18 | | | | 1.99 | | | | (4.01 | ) | | | 1.51 | |
| Total from investment operations | | | 1.56 | | | | 0.71 | | | | (0.33 | ) | | | 2.09 | | | | 3.70 | | | | 0.88 | | | | 0.06 | | | | 1.17 | | | | 1.97 | | | | (4.03 | ) | | | 1.48 | |
| | |
| Less distributions: | |
| | |
| Distributions from net | |
| investment income | | | — | | | | (0.03 | ) | | | (0.04 | ) | | | (0.02 | ) | | | (0.03 | ) | | | (0.03 | ) | | | — | | | | — | | | | — | | | | — | | | | — | |
| Distributions from net realized | |
| gains from security transactions | | | — | | | | (0.01 | ) | | | (0.62 | ) | | | (0.91 | ) | | | (0.28 | ) | | | — | | | | — | | | | — | | | | — | | | | (0.06 | ) | | | (0.38 | ) |
| Total distributions | | | — | | | | (0.04 | ) | | | (0.66 | ) | | | (0.93 | ) | | | (0.31 | ) | | | (0.03 | ) | | | — | | | | — | | | | — | | | | (0.06 | ) | | | (0.38 | ) |
| Net asset value, end of period | | $ | 15.63 | | | $ | 14.07 | | | $ | 13.40 | | | $ | 14.39 | | | $ | 13.23 | | | $ | 9.84 | | | $ | 8.99 | | | $ | 8.93 | | | $ | 7.76 | | | $ | 5.79 | | | $ | 9.88 | |
| Total return | | | 11.09 | % | | | 5.31 | % | | | (2.30 | %) | | | 15.74 | % | | | 37.65 | % | | | 9.77 | % | | | 0.67 | % | | | 15.08 | % | | | 34.02 | % | | | (41.02 | %) | | | 16.92 | % |
| | |
| Supplemental data and ratios: | |
| | | | | | | | | | | | | | | | | | | | | | | | | | | | | | | | | | | | | | | | | | | | | |
| Net assets, end of period (in 000’s) | | $ | 126,627 | | | $ | 114,616 | | | $ | 109,354 | | | $ | 97,184 | | | $ | 78,048 | | | $ | 54,216 | | | $ | 28,051 | | | $ | 20,394 | | | $ | 12,209 | | | $ | 10,594 | | | $ | 19,310 | |
| Ratio of operating expenses to | |
| average net assets, | | | | | | | | | | | | | | | | | | | | | | | | | | | | | | | | | | | | | | | | | | | | |
| before reimbursements | | | 1.05 | % | | | 1.07 | % | | | 1.07 | % | | | 1.29 | % | | | 1.25 | % | | | 1.32 | % | | | 1.47 | % | | | 2.08 | % | | | 1.98 | % | | | 1.76 | % | | | 1.60 | % |
| Ratio of operating expenses to | |
| average net assets, | | | | | | | | | | | | | | | | | | | | | | | | | | | | | | | | | | | | | | | | | | | | |
| net of reimbursements | | | 1.00 | % | | | 1.00 | % | | | 1.00 | % | | | 1.00 | % | | | 1.00 | % | | | 1.00 | % | | | 1.00 | % | | | 1.63 | % | | | 1.95 | % | | | 1.76 | % | | | 1.60 | % |
| Ratio of net investment income | |
| (loss) to average net assets, | |
| before reimbursements | | | 0.20 | % | | | 0.08 | % | | | 0.27 | % | | | (0.14 | %) | | | (0.10 | %) | | | 0.05 | % | | | (0.04 | %) | | | (0.64 | %) | | | (0.34 | %) | | | (0.22 | %) | | | (0.34 | %) |
| Ratio of net investment income | |
| (loss) to average net assets, | |
| net of reimbursement | | | 0.25 | % | | | 0.16 | % | | | 0.34 | % | | | 0.15 | % | | | 0.15 | % | | | 0.37 | % | | | 0.43 | % | | | (0.19 | %) | | | (0.31 | %) | | | (0.22 | %) | | | (0.34 | %) |
| Portfolio turnover rate | | | 6.98 | % | | | 22.60 | % | | | 23.52 | % | | | 21.53 | % | | | 36.65 | % | | | 84.10 | % | | | 88.29 | % | | | 42.58 | % | | | 49.44 | % | | | 58.78 | % | | | 65.26 | % |
__________
| (1) | Net investment income (loss) per share is calculated using ending balances prior to consideration of adjustments for permanent book and tax differences. |
The accompanying notes are an integral part of these financial statements.
EVERCORE EQUITY FUND
EXPENSE EXAMPLE
For the Six Months Ended June 30, 2017 (Unaudited)
As a shareholder of the Fund, you incur ongoing costs, including management fees and other Fund expenses. If you invest through a financial intermediary, you may also incur additional costs such as a transaction fee charged on the purchase or sale of the Fund or an asset-based management fee. This Example is intended to help you understand your ongoing costs (in dollars) of investing in the Fund and to compare these costs with the ongoing costs of investing in other mutual funds.
The Example is based on an investment of $1,000 invested at the beginning of the period and held for the entire period from January 1, 2017 to June 30, 2017.
Actual Expenses
The first line of the table below provides information about actual account values and actual expenses. You may use the information in this line, together with the amount you invested, to estimate the expenses you paid over the period. Simply divide your account value by $1,000 (for example, an $8,600 account value divided by $1,000 = 8.6), then multiply the result by the number in the first line under the heading entitled “Expenses Paid During Period” to estimate the expenses you paid on your account during the period.
Hypothetical Example for Comparison Purposes
The second line of the table below provides information about hypothetical account values and hypothetical expenses based on the Fund’s actual expense ratios and an assumed rate of return of 5% per year before expenses, which is not the Fund’s actual return. The hypothetical account values and expenses may not be used to estimate the actual ending account balance or expenses you paid for the period. You may use this information to compare the ongoing costs of investing in the Fund and other funds. To do so, compare this 5% hypothetical example with the 5% hypothetical examples that appear in the shareholder reports of the other funds.
Please note that the expenses shown in the table are meant to highlight your ongoing costs only and do not reflect any costs that may be associated with investing in the Fund through a financial intermediary. Therefore, the second line of the table is useful in comparing the ongoing costs only, and will not help you determine the relative total costs of owning different funds. In addition, if any costs associated with investing through a financial intermediary were included, your costs would have been higher.
| | | | Expenses |
| | | | Paid |
| | Beginning | Ending | During |
| | Account | Account | Period(1) |
| | Value | Value | 1/1/17 – |
| | 1/1/17 | 6/30/17 | 6/30/17 |
| | | | |
Actual(2) | $1,000.00 | $1,110.90 | $5.23 |
| | | | |
| Hypothetical (5% return | | | |
| before expenses) | 1,000.00 | 1,019.84 | 5.01 |
| (1) | Expenses are equal to the Fund’s annualized expense ratio of 1.00% for the six-months ended June 30, 2017, multiplied by the average account value over the period, multiplied by 181/365 to reflect the one-half year period. |
| | |
| (2) | Based on the actual returns for the six-month period ended June 30, 2017 of 11.09%. |
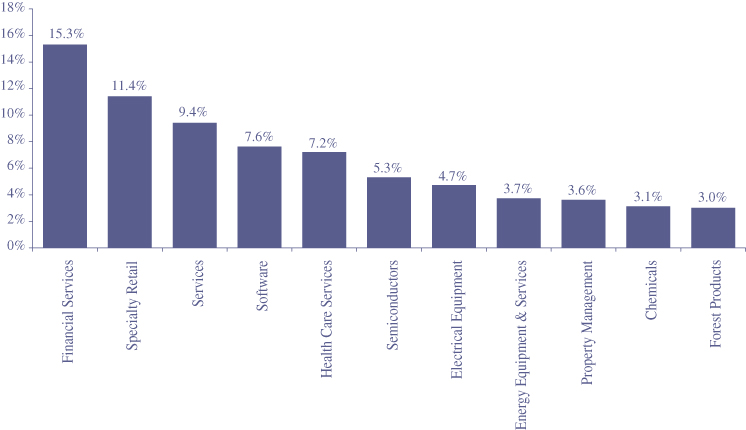
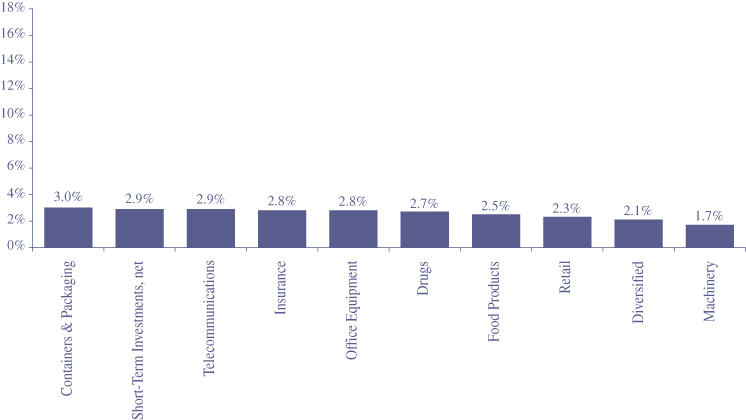
EVERCORE EQUITY FUND
ALLOCATION OF PORTFOLIO ASSETS
(Calculated as a percentage of net assets)
June 30, 2017 (Unaudited)
ADDITIONAL INFORMATION
June 30, 2017 (Unaudited)
Availability of Proxy Voting Information
Information regarding how the Fund votes proxies relating to portfolio securities is available without charge upon request by calling toll-free at (800) 443-4693 or by accessing the Fund’s website at www.evercorewealthfunds.com and the SEC’s website at www.sec.gov. Information regarding how the Fund voted proxies relating to portfolio securities during the most recent 12 month period ended June 30 is available on the SEC’s website at www.sec.gov or by calling the toll-free number listed above.
Availability of Fund Portfolio Information
The Fund files its complete schedule of portfolio holdings with the SEC for the first and third quarters of each fiscal year on Form N-Q, which is available on the SEC’s website at www.sec.gov, or by calling the Fund at (800) 443-4693. The Fund’s Form N-Q may be reviewed and copied at the SEC’s Public Reference Room in Washington, D.C. For information on the Public Reference Room call 1- 800-SEC-0330. In addition, the Fund will make its portfolio holdings information publicly available by posting the information at www.evercorewealthfunds.com on a monthly basis.
TRUSTEES
Frederick Taylor, Chairman
Laird I. Grant
Katharine Plourde
OFFICERS
Frederick Taylor, President
Ruth Calaman, Executive Vice President,
Secretary & Chief Compliance Officer
John Rendinaro,
Executive Vice President & Treasurer
INVESTMENT ADVISOR
Evercore Wealth Management, LLC.
55 E. 52nd Street
23rd Floor
New York, New York 10055
CUSTODIAN
U.S. Bank, N.A.
1555 North Rivercenter Drive, Suite 302
Milwaukee, Wisconsin 53212
ADMINISTRATOR, TRANSFER AGENT,
DIVIDEND PAYING AGENT &
SHAREHOLDER SERVICING AGENT
U.S. Bancorp Fund Services, LLC
615 E. Michigan Street
P.O. Box 701
Milwaukee, Wisconsin 53201
INDEPENDENT REGISTERED
PUBLIC ACCOUNTING FIRM
Cohen & Company, Ltd.
1350 Euclid Avenue, Suite 800
Cleveland, Ohio 44115
DISTRIBUTOR
Quasar Distributors, LLC
777 E. Wisconsin Ave.
Milwaukee, Wisconsin 53202
EVERCORE EQUITY FUND
55 E. 52nd Street
23rd Floor
New York, New York 10055
(800) 443-4693
http://www.evercorewealthfunds.com
Item 2. Code of Ethics.
Not applicable for semi-annual reports.
Item 3. Audit Committee Financial Expert.
Not applicable for semi-annual reports.
Item 4. Principal Accountant Fees and Services.
Not applicable for semi-annual reports.
Item 5. Audit Committee of Listed Registrants.
Not applicable to registrants who are not listed issuers (as defined in Rule 10A-3 under the Securities Exchange Act of 1934).
Item 6. Investments.
Schedule of Investments is included as part of the report to shareholders filed under Item 1 of this Form.
Item 7. Disclosure of Proxy Voting Policies and Procedures for Closed-End Management Investment Companies.
Not applicable to open-end investment companies.
Item 8. Portfolio Managers of Closed-End Management Investment Companies.
Not applicable to open-end investment companies.
Item 9. Purchases of Equity Securities by Closed‑End Management Investment Company and Affiliated Purchasers.
Not applicable to open-end investment companies.
Item 10. Submission of Matters to a Vote of Security Holders.
Not Applicable.
Item 11. Controls and Procedures.
| (a) | The Registrant’s President and Treasurer have reviewed the Registrant's disclosure controls and procedures (as defined in Rule 30a-3(c) under the Investment Company Act of 1940 (the “Act”)) as of a date within 90 days of the filing of this report, as required by Rule 30a-3(b) under the Act and Rules 13a-15(b) or 15d‑15(b) under the Securities Exchange Act of 1934. Based on their review, such officers have concluded that the disclosure controls and procedures are effective in ensuring that information required to be disclosed in this report is appropriately recorded, processed, summarized and reported and made known to them by others within the Registrant and by the Registrant’s service provider. |
| (b) | There were no changes in the Registrant's internal control over financial reporting (as defined in Rule 30a-3(d) under the Act) that occurred during the second fiscal quarter of the period covered by this report that has materially affected, or is reasonably likely to materially affect, the Registrant's internal control over financial reporting. |
Item 12. Exhibits.
| (a) | (1) Any code of ethics or amendment thereto, that is the subject of the disclosure required by Item 2, to the extent that the registrant intends to satisfy Item 2 requirements through filing an exhibit. Not applicable for semi-annual reports. |
(2) A separate certification for each principal executive and principal financial officer pursuant to Section 302 of the Sarbanes-Oxley Act of 2002. Filed herewith.
(3) Any written solicitation to purchase securities under Rule 23c‑1 under the Act sent or given during the period covered by the report by or on behalf of the registrant to 10 or more persons. Not applicable to open-end investment companies.
| (b) | Certifications pursuant to Section 906 of the Sarbanes‑Oxley Act of 2002. Furnished herewith. |
SIGNATURES
Pursuant to the requirements of the Securities Exchange Act of 1934 and the Investment Company Act of 1940, the registrant has duly caused this report to be signed on its behalf by the undersigned, thereunto duly authorized.
(Registrant) Wall Street EWM Funds Trust
By (Signature and Title)* /s/Frederick Taylor
Frederick Taylor, President
Date September 5, 2017
Pursuant to the requirements of the Securities Exchange Act of 1934 and the Investment Company Act of 1940, this report has been signed below by the following persons on behalf of the registrant and in the capacities and on the dates indicated.
By (Signature and Title)* /s/Frederick Taylor
Frederick Taylor, President
Date September 5, 2017
By (Signature and Title)* /s/John J. Rendinaro
John J. Rendinaro, Treasurer
Date September 5, 2017
* Print the name and title of each signing officer under his or her signature.