united states
securities and exchange commission
washington, d.c. 20549
form n-csr
certified shareholder report of registered management
investment companies
Investment Company Act file number 811-22554
Vertical Capital Income Fund
(Exact name of registrant as specified in charter)
80 Arkay Drive, Hauppauge, NY 11788
(Address of principal executive offices) (Zip code)
Richard Malinowski, Gemini Fund Services, LLC
17605 Wright Street, Omaha, Nebraska, 68130
(Name and address of agent for service)
Registrant's telephone number, including area code: 631-470-2734
Date of fiscal year end: 9/30
Date of reporting period: 9/30/16
Item 1. Reports to Stockholders.
| | | |
| | | |
| | | |
| | | |
| | | |
| | | |
| | | |
| | | |
| | Vertical Capital Income Fund | |
| | Cusip: 92535C104 | |
| | VCAPX | |
| | | |
| | | |
| | | |
| | | |
| | Annual Report | |
| | September 30, 2016 | |
| | | |
| | | |
| | | |
| | | |
| | | |
| | | |
| | | |
| | | |
| | | |
| | | |
| | | |
| | | |
| | | |
| | Investor Information: 1-866-277-VCIF | |
| | | |
| | | |
| | | |
| | | |
| | | |
| | | |
| | | |
| | | |
| | | |
| | | |
| | | |
| | This report and the financial statements contained herein are submitted for the general information of shareholders and are not authorized for distribution to prospective investors unless preceded or accompanied by an effective prospectus. Nothing contained herein is to be considered an offer of sale or solicitation of an offer to buy shares of the Vertical Capital Income Fund. Such offering is made only by prospectus, which includes details as to offering price and other material information. | |
| | | |
| | Distributed by Northern Lights Distributors, LLC
Member FINRA | |
| | | |
| | | |
| | | |
| | | |
March 21, 2017
Dear Shareholders:
We are pleased to report the completion of another successful year for the Vertical Capital Income Fund (the “Fund”). Consistent with our investment objective to seek income, the Fund once again made continuous monthly distributions for each of the last twelve months of its fiscal year ending September 30, 2016. During the same period, the Fund produced a total return (load waived) of 15.10% compared to one of its key benchmarks, the Barclays Capital Mortgage Backed Securities Index (the “Barclays Index”), which had a total return of 3.61%. Including the maximum load of 4.50%, the Fund had a total return of 9.94%. Since inception the Fund has produced a cumulative total return of 9.74% (load waived) and 8.69% (including the maximum load). This compares to 2.60% for the Barclays Index. The SEC Annual Yield was 1.72% as measured on September 30, 2016.
Investment Strategy
The Fund’s investment strategy is to purchase performing first lien residential mortgages at a discount to their unpaid principal balances (UPB). The Fund’s current distributions are supported from the receipt of monthly interest payments, after payment of the Fund’s operating expenses. The Fund’s annual total return includes its current earnings plus any unrealized gains or losses in the estimated value of the Fund’s investments, or realized gains or losses when a loan is paid off or sold for more, or less, than its carrying value.
The Fund continues to have ample acquisition opportunities as these are generated, in part, from new purchase mortgage originations, refinance originations, loan modifications, short-term loans and, in part, from trading activity among secondary market participants. At the end of 2016 the one-to-four family residences market in which the Fund invests had $10.2 trillion of outstanding loans, of which $837 billion were owned by non-institutional or government-related holders. Total originations were almost $1.9 trillion in 2016 and are generally expected to decrease to about $1.6 trillion, a number that’s in line with historical stabilized market levels. New purchase originations in 2017 are estimated to increase by 10% as the U.S. continues to have strong household formation coupled with future job and wage growth and continuing home price appreciation, whereas refinance originations are estimated to be lower as interest rates are expected to rise .
During the fiscal year we acquired 148 loans with the following average characteristics: 79.7% price to UPB, 63.0% loan to value, 4.5% coupon, 5.7% effective rate and a FICO score of 665. Each of these metrics compares favorably to the portfolio averages as a whole as of September 30, 2016: 80.1% price to UPB, 73.5% price to updated real estate value, 4.2% coupon, 5.5% effective rate and a FICO score of 663. We attribute the improvement in acquisition metrics to our constant search for new selling relationships and buying opportunities and our strict adherence to an investment process that results in acquiring only the most attractive risk-adjusted loans at price levels where we want to own them.
Macroeconomic and Housing Market Outlook
Economic growth continues to advance at a slow but positive pace, generally in the 2% range; with wage growth slightly higher at 2.5%. Inflation has been a concern of the Federal Reserve and most experts assume that the Fed will raise short-term interest rates two to four times during 2017. The Fed is also expected to decrease the size of its balance sheet which could impact its purchases of mortgage-backed securities and longer term Treasuries, a significant factor in the marketplace since the economic downturn. There is also a continued shortage of housing, especially at the affordable end of the market, that will not be remedied during 2017, so we are confident that we will continue to see ample investment opportunities at attractive prices going forward.
Fund Results of Operations and Liquidity
The Fund continued its track record of making continuous monthly cash dividends that were fully covered by operating earnings; and, like prior years, ended the year in a positive net working capital position. The Fund raised $44.4 million from the sale of equity shares, including the DRIP, and obtained another $22.1 million from loans sales and loan prepayments. The Fund invested $23.3 million in new investments and funded redemptions totaling $36.1 million.
In conclusion, we are pleased with the Fund’s performance for the fiscal year and believe there are many reasons to be optimistic about the future.
We thank you for your investment in Vertical Capital Income Fund.
Regards,
Robert J. Chapman
Chairman of the Board of Trustees and Co-Portfolio Manager
David Aisner
Co-Portfolio Manager
| Vertical Capital Income Fund |
| PERFORMANCE OF A $10,000 INVESTMENT (Unaudited) |
| Since Inception through September 30, 2016* |
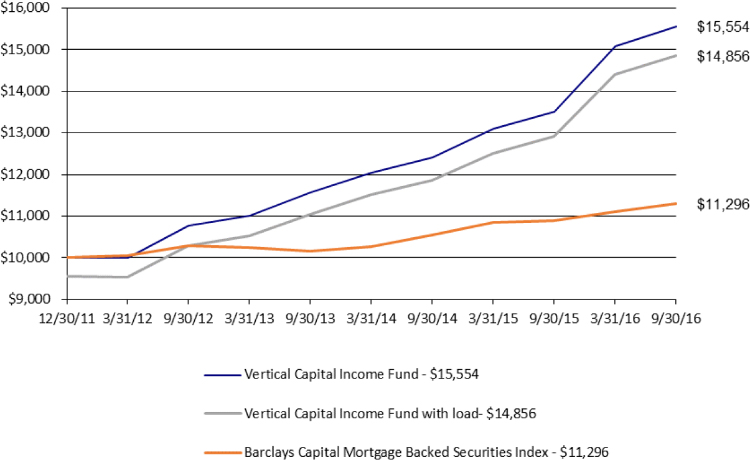
| | | One Year | | Since Inception* |
| The Vertical Capital Income Fund | | 15.10% | | 9.74% |
| The Vertical Capital Income Fund with load | | 9.94% | | 8.68% |
| Barclays Capital Mortgage Backed Securities Index | | 3.61% | | 2.60% |
| | | | | |
| * | The Fund commenced operations on December 30, 2011. The performance of the Fund is based on average annual returns. |
The Barclays Capital Mortgage Backed Securities Index is an unmanaged index composed of securities backed by mortgage pools of Ginnie Mae, Freddie Mac and Fannie Mae. Investors can not invest directly in an index or benchmark.
Past performance is not predictive of future results. The investment return and principal value of an investment will fluctuate. An investor’s shares, when redeemed, may be worth more or less than the original cost. Total return is calculated assuming reinvestment of all dividends and distributions. Total returns would have been lower had the Adviser not waived its fees and reimbursed a portion of the Fund’s expenses. The Fund’s total gross annual operating expenses, is 2.67% per the December 18, 2015 Prospectus. The graph does not reflect the deduction of taxes that a shareholder would have to pay on Fund distributions or the redemption of the Fund shares. For performance information current to the most recent month -end,please call 1-866-277-VCIF.
| PORTFOLIO COMPOSITION** (Unaudited) |
| | | | |
| | | | |
| Mortgage Notes | | | 99.8 | % |
| Other Investments | | | 0.2 | % |
| | | | 100.0 | % |
| | | | | |
| ** Based on Investments at Value as of September 30, 2016. |
| Vertical Capital Income Fund |
| PORTFOLIO OF INVESTMENTS |
| September 30, 2016 |
| Principal | | | | | Loan Type | | Interest Rate | | Maturity | | Value | |
| | | | | MORTGAGE NOTES - 93.2% | | | | | | | | | | |
| $ | 120,108 | | | Loan ID 200003 | | Fixed | | 7.250% | | 9/1/2035 | | $ | 111,716 | |
| | 270,086 | | | Loan ID 200004 | | Fixed | | 7.990% | | 10/1/2036 | | | 283,590 | |
| | 69,619 | | | Loan ID 200006 | | ARM | | 7.990% | | 1/1/2036 | | | 73,100 | |
| | 51,127 | | | Loan ID 200008 | | ARM | | 4.250% | | 3/28/2035 | | | 53,683 | |
| | 51,369 | | | Loan ID 200012 | | ARM | | 9.800% | | 7/1/2037 | | | 44,547 | |
| | 56,984 | | | Loan ID 200013 | | Fixed | | 5.250% | | 9/1/2040 | | | 55,765 | |
| | 38,401 | | | Loan ID 200015 | | Fixed | | 7.000% | | 8/1/2030 | | | 11,993 | |
| | 39,779 | | | Loan ID 200016 | | ARM | | 10.375% | | 1/1/2031 | | | 41,768 | |
| | 53,446 | | | Loan ID 200018 | | Fixed | | 7.000% | | 1/1/2033 | | | 52,736 | |
| | 61,290 | | | Loan ID 200019 | | Fixed | | 5.000% | | 12/1/2036 | | | 53,736 | |
| | 77,385 | | | Loan ID 200020 | | Fixed | | 5.630% | | 7/1/2033 | | | 81,254 | |
| | 100,651 | | | Loan ID 200023 | | Fixed | | 5.875% | | 12/1/2050 | | | 83,276 | |
| | 134,130 | | | Loan ID 200025 | | ARM | | 3.375% | | 3/1/2034 | | | 140,837 | |
| | 205,980 | | | Loan ID 200026 | | Interest Only | | 4.750% | | 1/1/2050 | | | 109,730 | |
| | 228,102 | | | Loan ID 200028 | | Interest Only | | 4.750% | | 6/1/2050 | | | 202,177 | |
| | 217,913 | | | Loan ID 200029 | | Fixed | | 6.310% | | 7/1/2037 | | | 167,714 | |
| | 279,709 | | | Loan ID 200031 | | Fixed | | 5.000% | | 1/1/2051 | | | 293,695 | |
| | 338,589 | | | Loan ID 200032 | | Fixed | | 3.130% | | 1/1/2051 | | | 327,260 | |
| | 561,834 | | | Loan ID 200035 | | Fixed | | 4.000% | | 11/1/2050 | | | 445,110 | |
| | 66,954 | | | Loan ID 200036 | | Fixed | | 7.940% | | 1/12/2034 | | | 70,302 | |
| | 164,743 | | | Loan ID 200037 | | Fixed | | 7.800% | | 5/1/2035 | | | 172,980 | |
| | 121,768 | | | Loan ID 200041 | | Fixed | | 4.875% | | 8/1/2039 | | | 127,856 | |
| | 41,678 | | | Loan ID 200042 | | Fixed | | 7.000% | | 12/1/2037 | | | 43,762 | |
| | 63,243 | | | Loan ID 200043 | | Fixed | | 6.125% | | 7/1/2039 | | | 66,405 | |
| | 121,293 | | | Loan ID 200045 | | Fixed | | 5.625% | | 12/1/2038 | | | 127,358 | |
| | 38,441 | | | Loan ID 200046 | | Fixed | | 8.000% | | 7/1/2027 | | | 38,441 | |
| | 53,344 | | | Loan ID 200048 | | Fixed | | 5.500% | | 8/1/2039 | | | 56,011 | |
| | 89,285 | | | Loan ID 200051 | | Fixed | | 8.150% | | 11/1/2034 | | | 25,802 | |
| | 158,684 | | | Loan ID 200052 | | Fixed | | 5.125% | | 5/1/2040 | | | 166,618 | |
| | 61,149 | | | Loan ID 200053 | | Fixed | | 5.000% | | 9/1/2042 | | | 30,967 | |
| | 56,042 | | | Loan ID 200054 | | Fixed | | 8.250% | | 3/1/2039 | | | 58,844 | |
| | 83,863 | | | Loan ID 200055 | | Fixed | | 10.000% | | 1/5/2036 | | | 88,056 | |
| | 127,883 | | | Loan ID 200057 | | ARM | | 3.125% | | 10/1/2036 | | | 107,431 | |
| | 59,855 | | | Loan ID 200059 | | Fixed | | 6.000% | | 8/1/2039 | | | 29,931 | |
| | 35,135 | | | Loan ID 200060 | | Fixed | | 5.750% | | 8/1/2039 | | | 36,892 | |
| | 31,141 | | | Loan ID 200061 | | Fixed | | 5.750% | | 7/1/2024 | | | 32,698 | |
| | 26,553 | | | Loan ID 200065 | | ARM | | 7.500% | | 1/1/2037 | | | 27,880 | |
| | 222,319 | | | Loan ID 200072 | | Fixed | | 0.000% | | 2/1/2051 | | | 233,435 | |
| | 168,535 | | | Loan ID 200073 | | Fixed | | 0.000% | | 2/1/2026 | | | 176,962 | |
| | 157,266 | | | Loan ID 200074 | | Fixed | | 0.000% | | 2/1/2031 | | | 165,129 | |
| | 205,360 | | | Loan ID 200075 | | Fixed | | 4.250% | | 2/1/2042 | | | 215,629 | |
| | 171,640 | | | Loan ID 200076 | | Fixed | | 4.250% | | 12/1/2041 | | | 139,416 | |
| | 73,524 | | | Loan ID 200077 | | Fixed | | 3.750% | | 8/1/2042 | | | 76,169 | |
| | 32,748 | | | Loan ID 200078 | | Fixed | | 7.000% | | 8/1/2036 | | | 32,296 | |
| | | | | | | | | | | | | | | |
The accompanying notes are an integral part of these financial statements.
| Vertical Capital Income Fund |
| PORTFOLIO OF INVESTMENTS (Continued) |
| September 30, 2016 |
| Principal | | | | | Loan Type | | Interest Rate | | Maturity | | Value | |
| | | | | MORTGAGE NOTES (Continued) - 93.2 % | | | | | | | | | | |
| $ | 135,816 | | | Loan ID 200079 | | Fixed | | 2.000% | | 8/1/2049 | | $ | 44,252 | |
| | 138,151 | | | Loan ID 200081 | | Fixed | | 2.000% | | 9/1/2037 | | | 45,100 | |
| | 68,203 | | | Loan ID 200082 | | Fixed | | 8.250% | | 4/1/2040 | | | 62,001 | |
| | 187,530 | | | Loan ID 200084 | | Fixed | | 7.000% | | 3/1/2039 | | | 164,198 | |
| | 198,242 | | | Loan ID 200086 | | Fixed | | 3.000% | | 11/1/2050 | | | 108,975 | |
| | 224,564 | | | Loan ID 200087 | | Fixed | | 5.000% | | 3/1/2051 | | | 145,347 | |
| | 124,118 | | | Loan ID 200088 | | Fixed | | 7.000% | | 6/1/2039 | | | 108,460 | |
| | 269,541 | | | Loan ID 200089 | | Fixed | | 2.000% | | 3/1/2052 | | | 174,693 | |
| | 274,810 | | | Loan ID 200090 | | Fixed | | 2.000% | | 11/1/2036 | | | 65,571 | |
| | 285,613 | | | Loan ID 200091 | | Fixed | | 2.000% | | 11/1/2051 | | | 210,696 | |
| | 260,658 | | | Loan ID 200092 | | Fixed | | 3.380% | | 5/1/2036 | | | 169,709 | |
| | 135,491 | | | Loan ID 200093 | | Fixed | | 5.000% | | 2/1/2038 | | | 134,705 | |
| | 234,518 | | | Loan ID 200094 | | ARM | | 3.375% | | 9/1/2037 | | | 165,679 | |
| | 380,584 | | | Loan ID 200100 | | Fixed | | 5.000% | | 7/1/2037 | | | 347,249 | |
| | 74,405 | | | Loan ID 200102 | | Fixed | | 8.250% | | 3/1/2040 | | | 67,833 | |
| | 185,410 | | | Loan ID 200105 | | Fixed | | 3.000% | | 12/1/2050 | | | 82,614 | |
| | 156,474 | | | Loan ID 200106 | | Fixed | | 2.000% | | 2/1/2052 | | | 68,255 | |
| | 442,886 | | | Loan ID 200107 | | Fixed | | 2.000% | | 7/1/2052 | | | 216,056 | |
| | 186,255 | | | Loan ID 200108 | | Fixed | | 3.000% | | 6/1/2047 | | | 146,328 | |
| | 113,456 | | | Loan ID 200110 | | Fixed | | 8.250% | | 8/1/2039 | | | 115,352 | |
| | 206,929 | | | Loan ID 200111 | | Fixed | | 6.000% | | 11/1/2050 | | | 60,433 | |
| | 305,250 | | | Loan ID 200112 | | Fixed | | 3.000% | | 9/1/2049 | | | 93,509 | |
| | 125,790 | | | Loan ID 200114 | | Fixed | | 3.000% | | 10/1/2051 | | | 73,738 | |
| | 407,184 | | | Loan ID 200115 | | Fixed | | 2.000% | | 11/1/2051 | | | 133,872 | |
| | 148,031 | | | Loan ID 200116 | | Fixed | | 7.125% | | 3/1/2039 | | | 130,003 | |
| | 405,886 | | | Loan ID 200125 | | Fixed | | 2.000% | | 5/1/2051 | | | 206,177 | |
| | 126,161 | | | Loan ID 200126 | | Fixed | | 8.250% | | 8/1/2039 | | | 128,444 | |
| | 141,983 | | | Loan ID 200127 | | Fixed | | 5.000% | | 8/1/2039 | | | 46,875 | |
| | 72,965 | | | Loan ID 200128 | | Fixed | | 3.000% | | 7/1/2037 | | | 34,625 | |
| | 461,304 | | | Loan ID 200129 | | Fixed | | 4.625% | | 3/1/2052 | | | 353,853 | |
| | 34,420 | | | Loan ID 200131 | | Fixed | | 3.875% | | 11/1/2027 | | | 35,847 | |
| | 229,514 | | | Loan ID 200133 | | Fixed | | 3.490% | | 1/1/2043 | | | 235,478 | |
| | 185,457 | | | Loan ID 200134 | | Fixed | | 3.750% | | 12/1/2042 | | | 192,712 | |
| | 124,256 | | | Loan ID 200135 | | Fixed | | 4.375% | | 12/1/2042 | | | 130,469 | |
| | 231,095 | | | Loan ID 200136 | | Fixed | | 2.875% | | 10/1/2027 | | | 226,886 | |
| | 127,523 | | | Loan ID 200137 | | Fixed | | 4.500% | | 9/1/2042 | | | 133,899 | |
| | 46,219 | | | Loan ID 200139 | | Fixed | | 4.625% | | 5/1/2027 | | | 48,530 | |
| | 79,694 | | | Loan ID 200141 | | Fixed | | 4.250% | | 2/1/2042 | | | 83,679 | |
| | 127,773 | | | Loan ID 200143 | | Fixed | | 3.000% | | 2/1/2037 | | | 127,741 | |
| | 391,425 | | | Loan ID 200145 | | Fixed | | 2.000% | | 8/1/2051 | | | 252,578 | |
| | 100,089 | | | Loan ID 200152 | | ARM | | 3.750% | | 9/1/2037 | | | 89,976 | |
| | 98,693 | | | Loan ID 200154 | | Fixed | | 11.050% | | 9/1/2037 | | | 103,628 | |
| | 54,116 | | | Loan ID 200156 | | Fixed | | 8.130% | | 9/19/2032 | | | 45,952 | |
| | 122,981 | | | Loan ID 200157 | | Fixed | | 3.750% | | 1/1/2043 | | | 119,567 | |
| | | | | | | | | | | | | | | |
The accompanying notes are an integral part of these financial statements.
| Vertical Capital Income Fund |
| PORTFOLIO OF INVESTMENTS (Continued) |
| September 30, 2016 |
| Principal | | | | | Loan Type | | Interest Rate | | Maturity | | Value | |
| | | | | MORTGAGE NOTES (Continued) - 93.2 % | | | | | | | | | | |
| $ | 158,032 | | | Loan ID 200158 | | Fixed | | 3.625% | | 12/1/2042 | | $ | 146,456 | |
| | 183,360 | | | Loan ID 200159 | | Fixed | | 3.750% | | 6/1/2042 | | | 190,277 | |
| | 127,920 | | | Loan ID 200160 | | Fixed | | 3.250% | | 2/1/2043 | | | 129,098 | |
| | 470,129 | | | Loan ID 200161 | | Fixed | | 3.875% | | 11/1/2041 | | | 490,891 | |
| | 226,738 | | | Loan ID 200162 | | Fixed | | 3.875% | | 7/1/2042 | | | 236,629 | |
| | 120,169 | | | Loan ID 200163 | | Fixed | | 4.000% | | 1/1/2042 | | | 125,794 | |
| | 199,369 | | | Loan ID 200165 | | Fixed | | 4.375% | | 12/1/2041 | | | 209,337 | |
| | 118,538 | | | Loan ID 200166 | | Fixed | | 4.000% | | 2/1/2032 | | | 123,922 | |
| | 124,794 | | | Loan ID 200168 | | Fixed | | 3.750% | | 10/1/2042 | | | 128,667 | |
| | 24,282 | | | Loan ID 200169 | | Fixed | | 6.923% | | 9/1/2034 | | | 25,497 | |
| | 142,095 | | | Loan ID 200172 | | Fixed | | 7.250% | | 2/1/2037 | | | 148,795 | |
| | 91,918 | | | Loan ID 200174 | | Fixed | | 7.340% | | 4/1/2037 | | | 96,514 | |
| | 53,298 | | | Loan ID 200175 | | Fixed | | 9.600% | | 5/1/2037 | | | 55,750 | |
| | 55,325 | | | Loan ID 200177 | | Fixed | | 8.000% | | 1/11/2022 | | | 58,091 | |
| | 18,586 | | | Loan ID 200179 | | Fixed | | 7.250% | | 7/27/2019 | | | 19,515 | |
| | 112,483 | | | Loan ID 200181 | | Fixed | | 7.500% | | 6/1/2041 | | | 118,107 | |
| | 84,792 | | | Loan ID 200182 | | Fixed | | 8.750% | | 10/10/2016 | | | 89,032 | |
| | 74,760 | | | Loan ID 200184 | | Fixed | | 4.375% | | 12/1/2042 | | | 69,929 | |
| | 28,472 | | | Loan ID 200185 | | Fixed | | 5.375% | | 6/1/2042 | | | 29,896 | |
| | 54,291 | | | Loan ID 200186 | | Fixed | | 5.125% | | 8/1/2042 | | | 57,005 | |
| | 152,059 | | | Loan ID 200188 | | Fixed | | 3.875% | | 2/1/2043 | | | 158,545 | |
| | 170,535 | | | Loan ID 200189 | | Fixed | | 4.125% | | 8/1/2042 | | | 179,061 | |
| | 338,645 | | | Loan ID 200190 | | Fixed | | 3.625% | | 11/1/2042 | | | 350,076 | |
| | 131,689 | | | Loan ID 200191 | | Fixed | | 4.125% | | 11/1/2042 | | | 138,274 | |
| | 166,035 | | | Loan ID 200194 | | Fixed | | 4.750% | | 9/1/2041 | | | 174,337 | |
| | 269,388 | | | Loan ID 200195 | | Fixed | | 3.875% | | 3/1/2042 | | | 281,101 | |
| | 101,511 | | | Loan ID 200196 | �� | Fixed | | 4.500% | | 1/1/2043 | | | 106,586 | |
| | 39,541 | | | Loan ID 200197 | | Fixed | | 4.750% | | 11/1/2042 | | | 41,518 | |
| | 41,373 | | | Loan ID 200198 | | Fixed | | 5.250% | | 10/1/2042 | | | 43,441 | |
| | 291,418 | | | Loan ID 200199 | | Fixed | | 4.000% | | 9/1/2042 | | | 304,423 | |
| | 248,214 | | | Loan ID 200200 | | Fixed | | 3.875% | | 9/1/2042 | | | 227,271 | |
| | 56,086 | | | Loan ID 200201 | | Fixed | | 5.125% | | 8/1/2041 | | | 58,890 | |
| | 59,757 | | | Loan ID 200202 | | Fixed | | 4.375% | | 12/1/2042 | | | 62,745 | |
| | 24,287 | | | Loan ID 200206 | | Fixed | | 3.990% | | 12/1/2042 | | | 25,246 | |
| | 49,635 | | | Loan ID 200208 | | Fixed | | 4.250% | | 1/1/2043 | | | 52,116 | |
| | 209,788 | | | Loan ID 200209 | | Fixed | | 3.875% | | 8/1/2042 | | | 218,984 | |
| | 88,557 | | | Loan ID 200210 | | Fixed | | 4.625% | | 5/1/2043 | | | 92,985 | |
| | 136,218 | | | Loan ID 200212 | | Fixed | | 3.875% | | 2/1/2042 | | | 124,645 | |
| | 287,472 | | | Loan ID 200213 | | Fixed | | 4.125% | | 1/1/2038 | | | 268,345 | |
| | 56,943 | | | Loan ID 200214 | | Fixed | | 5.750% | | 7/1/2039 | | | 59,790 | |
| | 116,498 | | | Loan ID 200216 | | Fixed | | 5.750% | | 9/1/2039 | | | 117,031 | |
| | 146,441 | | | Loan ID 200217 | | Fixed | | 5.250% | | 7/1/2040 | | | 153,763 | |
| | 76,153 | | | Loan ID 200218 | | Fixed | | 4.250% | | 12/1/2041 | | | 44,079 | |
| | 201,954 | | | Loan ID 200219 | | Fixed | | 4.250% | | 4/1/2043 | | | 212,052 | |
| | | | | | | | | | | | | | | |
The accompanying notes are an integral part of these financial statements.
| Vertical Capital Income Fund |
| PORTFOLIO OF INVESTMENTS (Continued) |
| September 30, 2016 |
| Principal | | | | | Loan Type | | Interest Rate | | Maturity | | Value | |
| | | | | MORTGAGE NOTES (Continued) - 93.2 % | | | | | | | | | | |
| $ | 217,212 | | | Loan ID 200220 | | Fixed | | 3.875% | | 5/1/2043 | | $ | 200,208 | |
| | 167,310 | | | Loan ID 200221 | | Fixed | | 4.250% | | 4/1/2043 | | | 174,777 | |
| | 211,383 | | | Loan ID 200224 | | Fixed | | 4.000% | | 7/1/2043 | | | 201,211 | |
| | 83,010 | | | Loan ID 200226 | | Fixed | | 5.250% | | 7/1/2041 | | | 87,161 | |
| | 51,652 | | | Loan ID 200228 | | Fixed | | 4.625% | | 8/1/2042 | | | 54,234 | |
| | 164,714 | | | Loan ID 200229 | | Fixed | | 3.750% | | 7/1/2042 | | | 169,075 | |
| | 148,297 | | | Loan ID 200230 | | Fixed | | 3.500% | | 2/1/2043 | | | 150,259 | |
| | 132,404 | | | Loan ID 200231 | | Fixed | | 3.625% | | 12/1/2042 | | | 119,986 | |
| | 69,662 | | | Loan ID 200232 | | Fixed | | 3.875% | | 8/1/2042 | | | 72,703 | |
| | 175,517 | | | Loan ID 200233 | | Fixed | | 2.990% | | 11/1/2027 | | | 174,538 | |
| | 94,590 | | | Loan ID 200235 | | Fixed | | 3.750% | | 12/1/2042 | | | 98,134 | |
| | 319,336 | | | Loan ID 200238 | | ARM | | 3.625% | | 7/1/2035 | | | 166,474 | |
| | 120,389 | | | Loan ID 200243 | | Fixed | | 3.750% | | 4/1/2043 | | | 122,392 | |
| | 28,470 | | | Loan ID 200244 | | Fixed | | 5.000% | | 5/1/2042 | | | 29,893 | |
| | 205,112 | | | Loan ID 200245 | | Fixed | | 3.875% | | 3/1/2043 | | | 213,875 | |
| | 92,878 | | | Loan ID 200286 | | Fixed | | 4.500% | | 7/1/2043 | | | 97,522 | |
| | 101,891 | | | Loan ID 200287 | | Fixed | | 4.375% | | 7/1/2043 | | | 106,986 | |
| | 342,351 | | | Loan ID 200288 | | Fixed | | 4.375% | | 11/1/2041 | | | 359,469 | |
| | 348,136 | | | Loan ID 200289 | | Fixed | | 5.500% | | 9/1/2043 | | | 365,543 | |
| | 294,143 | | | Loan ID 200290 | | Fixed | | 4.250% | | 4/1/2043 | | | 308,850 | |
| | 181,771 | | | Loan ID 200294 | | Fixed | | 3.875% | | 2/1/2043 | | | 188,951 | |
| | 259,262 | | | Loan ID 200295 | | Fixed | | 3.875% | | 6/1/2043 | | | 269,726 | |
| | 209,364 | | | Loan ID 200296 | | Fixed | | 3.250% | | 2/1/2043 | | | 211,239 | |
| | 181,414 | | | Loan ID 200297 | | Fixed | | 3.375% | | 10/1/2042 | | | 184,594 | |
| | 197,088 | | | Loan ID 200299 | | Fixed | | 3.625% | | 10/1/2042 | | | 203,042 | |
| | 119,288 | | | Loan ID 200300 | | Fixed | | 8.400% | | 10/20/2037 | | | 125,253 | |
| | 103,052 | | | Loan ID 200302 | | Fixed | | 9.875% | | 10/1/2035 | | | 92,902 | |
| | 72,230 | | | Loan ID 200303 | | Fixed | | 5.250% | | 10/1/2032 | | | 45,252 | |
| | 142,239 | | | Loan ID 200304 | | Fixed | | 7.250% | | 10/1/2033 | | | 149,351 | |
| | 250,929 | | | Loan ID 200305 | | Fixed | | 7.000% | | 3/1/2036 | | | 211,594 | |
| | 725,239 | | | Loan ID 200306 | | Fixed | | 4.870% | | 5/1/2049 | | | 718,294 | |
| | 48,698 | | | Loan ID 200307 | | Fixed | | 6.500% | | 7/1/2031 | | | 48,698 | |
| | 111,246 | | | Loan ID 200308 | | ARM | | 6.750% | | 5/1/2035 | | | 38,256 | |
| | 210,821 | | | Loan ID 200309 | | Fixed | | 2.000% | | 12/1/2048 | | | 185,588 | |
| | 133,642 | | | Loan ID 200312 | | Fixed | | 9.000% | | 4/1/2039 | | | 121,674 | |
| | 46,987 | | | Loan ID 200313 | | Fixed | | 8.500% | | 3/1/2028 | | | 34,080 | |
| | 63,304 | | | Loan ID 200314 | | Fixed | | 8.000% | | 3/1/2040 | | | 36,515 | |
| | 311,377 | | | Loan ID 200315 | | ARM | | 3.750% | | 6/1/2037 | | | 145,763 | |
| | 74,726 | | | Loan ID 200317 | | Fixed | | 7.000% | | 9/1/2032 | | | 78,462 | |
| | 295,845 | | | Loan ID 200318 | | Fixed | | 6.500% | | 10/1/2036 | | | 301,484 | |
| | 548,976 | | | Loan ID 200324 | | Fixed | | 5.500% | | 11/1/2037 | | | 239,733 | |
| | 555,352 | | | Loan ID 200325 | | Fixed | | 6.000% | | 5/1/2042 | | | 217,674 | |
| | 77,680 | | | Loan ID 200326 | | Fixed | | 8.375% | | 10/1/2036 | | | 81,564 | |
| | 150,749 | | | Loan ID 200327 | | Fixed | | 6.790% | | 10/26/2036 | | | 158,286 | |
| | | | | | | | | | | | | | | |
The accompanying notes are an integral part of these financial statements.
| Vertical Capital Income Fund |
| PORTFOLIO OF INVESTMENTS (Continued) |
| September 30, 2016 |
| Principal | | | | | Loan Type | | Interest Rate | | Maturity | | Value | |
| | | | | MORTGAGE NOTES (Continued) - 93.2 % | | | | | | | | | | |
| $ | 254,591 | | | Loan ID 200330 | | Fixed | | 7.000% | | 8/1/2037 | | $ | 264,986 | |
| | 102,866 | | | Loan ID 200332 | | Fixed | | 5.775% | | 10/1/2037 | | | 108,009 | |
| | 91,324 | | | Loan ID 200334 | | Fixed | | 7.000% | | 1/1/2033 | | | 95,890 | |
| | 272,762 | | | Loan ID 200335 | | Fixed | | 2.000% | | 11/1/2052 | | | 206,466 | |
| | 119,538 | | | Loan ID 200336 | | Fixed | | 7.000% | | 12/1/2042 | | | 37,174 | |
| | 45,405 | | | Loan ID 200337 | | Fixed | | 7.000% | | 10/1/2034 | | | 47,675 | |
| | 53,257 | | | Loan ID 200338 | | ARM | | 10.500% | | 8/1/2029 | | | 55,920 | |
| | 162,490 | | | Loan ID 200339 | | Fixed | | 2.000% | | 10/1/2033 | | | 157,637 | |
| | 34,625 | | | Loan ID 200340 | | Fixed | | 7.000% | | 3/1/2030 | | | 36,356 | |
| | 292,715 | | | Loan ID 200341 | | Fixed | | 7.000% | | 8/1/2035 | | | 206,277 | |
| | 63,342 | | | Loan ID 200348 | | Fixed | | 6.500% | | 7/1/2038 | | | 65,011 | |
| | 239,681 | | | Loan ID 200349 | | Fixed | | 7.000% | | 1/1/2037 | | | 158,340 | |
| | 58,380 | | | Loan ID 200350 | | Fixed | | 7.500% | | 3/1/2029 | | | 61,299 | |
| | 73,054 | | | Loan ID 200352 | | Fixed | | 7.000% | | 8/1/2030 | | | 53,961 | |
| | 43,094 | | | Loan ID 200355 | | ARM | | 8.500% | | 7/1/2032 | | | 40,241 | |
| | 133,863 | | | Loan ID 200358 | | Fixed | | 3.000% | | 4/1/2025 | | | 106,099 | |
| | 29,364 | | | Loan ID 200360 | | ARM | | 3.000% | | 1/1/2025 | | | 28,504 | |
| | 71,703 | | | Loan ID 200361 | | Fixed | | 7.500% | | 1/1/2034 | | | 75,289 | |
| | 110,763 | | | Loan ID 200362 | | Fixed | | 5.000% | | 6/1/2045 | | | 62,575 | |
| | 147,324 | | | Loan ID 200363 | | Fixed | | 6.000% | | 3/1/2049 | | | 110,233 | |
| | 67,426 | | | Loan ID 200366 | | Fixed | | 6.250% | | 1/1/2033 | | | 67,426 | |
| | 180,573 | | | Loan ID 200368 | | Fixed | | 4.500% | | 4/1/2036 | | | 189,601 | |
| | 264,934 | | | Loan ID 200369 | | Fixed | | 6.000% | | 4/1/2044 | | | 278,180 | |
| | 61,179 | | | Loan ID 200373 | | Fixed | | 7.000% | | 12/1/2036 | | | 53,464 | |
| | 75,703 | | | Loan ID 200374 | | ARM | | 7.000% | | 5/1/2034 | | | 75,703 | |
| | 429,105 | | | Loan ID 200376 | | Fixed | | 2.900% | | 6/1/2053 | | | 336,222 | |
| | 80,755 | | | Loan ID 200377 | | ARM | | 3.500% | | 10/1/2036 | | | 29,207 | |
| | 231,751 | | | Loan ID 200378 | | Fixed | | 5.500% | | 5/1/2045 | | | 216,312 | |
| | 185,709 | | | Loan ID 200380 | | Fixed | | 4.220% | | 4/1/2049 | | | 163,599 | |
| | 290,725 | | | Loan ID 200381 | | Fixed | | 4.780% | | 6/1/2037 | | | 258,806 | |
| | 392,204 | | | Loan ID 200383 | | Fixed | | 5.030% | | 12/1/2046 | | | 390,936 | |
| | 296,844 | | | Loan ID 200384 | | Fixed | | 5.000% | | 11/1/2047 | | | 257,775 | |
| | 146,523 | | | Loan ID 200385 | | Fixed | | 8.250% | | 1/1/2040 | | | 153,850 | |
| | 223,156 | | | Loan ID 200386 | | Fixed | | 6.000% | | 3/1/2041 | | | 164,154 | |
| | 75,300 | | | Loan ID 200387 | | Fixed | | 4.000% | | 6/1/2039 | | | 64,728 | |
| | 194,944 | | | Loan ID 200388 | | Fixed | | 4.000% | | 3/1/2051 | | | 95,273 | |
| | 121,781 | | | Loan ID 200389 | | Fixed | | 4.820% | | 8/1/2047 | | | 109,908 | |
| | 201,907 | | | Loan ID 200390 | | Fixed | | 4.780% | | 4/16/2047 | | | 181,991 | |
| | 176,265 | | | Loan ID 200391 | | Fixed | | 4.000% | | 1/13/2035 | | | 168,039 | |
| | 67,526 | | | Loan ID 200392 | | Fixed | | 10.000% | | 6/5/2034 | | | 65,261 | |
| | 105,026 | | | Loan ID 200393 | | Fixed | | 5.070% | | 8/1/2037 | | | 89,908 | |
| | 129,525 | | | Loan ID 200394 | | Fixed | | 7.150% | | 8/1/2037 | | | 135,212 | |
| | 78,880 | | | Loan ID 200395 | | Fixed | | 4.860% | | 4/1/2047 | | | 70,329 | |
| | 73,345 | | | Loan ID 200396 | | Fixed | | 10.000% | | 2/1/2036 | | | 77,012 | |
| | | | | | | | | | | | | | | |
The accompanying notes are an integral part of these financial statements.
| Vertical Capital Income Fund |
| PORTFOLIO OF INVESTMENTS (Continued) |
| September 30, 2016 |
| Principal | | | | | Loan Type | | Interest Rate | | Maturity | | Value | |
| | | | | MORTGAGE NOTES (Continued) - 93.2 % | | | | | | | | | | |
| $ | 115,112 | | | Loan ID 200397 | | ARM | | 9.375% | | 9/1/2037 | | $ | 120,868 | |
| | 136,984 | | | Loan ID 200398 | | Fixed | | 4.800% | | 2/1/2037 | | | 122,106 | |
| | 79,193 | | | Loan ID 200399 | | Fixed | | 4.980% | | 6/1/2037 | | | 62,298 | |
| | 52,682 | | | Loan ID 200403 | | Fixed | | 8.300% | | 10/15/2032 | | | 55,316 | |
| | 57,715 | | | Loan ID 200404 | | Fixed | | 8.100% | | 5/1/2037 | | | 60,601 | |
| | 99,222 | | | Loan ID 200405 | | Fixed | | 4.870% | | 12/1/2035 | | | 95,465 | |
| | 117,087 | | | Loan ID 200406 | | Fixed | | 4.875% | | 10/1/2051 | | | 116,080 | |
| | 235,441 | | | Loan ID 200407 | | Fixed | | 6.500% | | 4/1/2042 | | | 245,606 | |
| | 202,871 | | | Loan ID 200408 | | Fixed | | 6.000% | | 4/1/2039 | | | 169,761 | |
| | 346,714 | | | Loan ID 200409 | | Fixed | | 6.000% | | 2/1/2049 | | | 279,865 | |
| | 106,470 | | | Loan ID 200411 | | Fixed | | 8.275% | | 6/1/2037 | | | 111,794 | |
| | 311,225 | | | Loan ID 200412 | | Fixed | | 5.500% | | 6/1/2045 | | | 194,829 | |
| | 183,512 | | | Loan ID 200416 | | Fixed | | 4.670% | | 8/1/2053 | | | 135,978 | |
| | 71,377 | | | Loan ID 200417 | | Fixed | | 7.000% | | 5/1/2035 | | | 74,945 | |
| | 56,763 | | | Loan ID 200418 | | Fixed | | 4.000% | | 6/1/2035 | | | 53,573 | |
| | 166,277 | | | Loan ID 200419 | | Fixed | | 4.000% | | 12/19/2035 | | | 168,651 | |
| | 168,020 | | | Loan ID 200420 | | Fixed | | 4.225% | | 4/10/2038 | | | 158,604 | |
| | 76,859 | | | Loan ID 200421 | | Fixed | | 7.710% | | 8/1/2037 | | | 77,100 | |
| | 136,719 | | | Loan ID 200422 | | Fixed | | 3.830% | | 8/1/2053 | | | 100,571 | |
| | 130,816 | | | Loan ID 200423 | | Fixed | | 4.500% | | 6/1/2043 | | | 122,104 | |
| | 113,539 | | | Loan ID 200424 | | Fixed | | 4.000% | | 9/1/2028 | | | 118,641 | |
| | 252,980 | | | Loan ID 200427 | | Fixed | | 3.625% | | 3/1/2043 | | | 261,188 | |
| | 227,131 | | | Loan ID 200430 | | Fixed | | 3.625% | | 7/1/2043 | | | 233,820 | |
| | 190,108 | | | Loan ID 200431 | | Fixed | | 4.625% | | 7/1/2043 | | | 199,614 | |
| | 308,629 | | | Loan ID 200432 | | Fixed | | 4.875% | | 5/1/2043 | | | 324,061 | |
| | 130,025 | | | Loan ID 200433 | | Fixed | | 4.250% | | 8/1/2043 | | | 136,526 | |
| | 161,282 | | | Loan ID 200434 | | Fixed | | 5.250% | | 10/1/2043 | | | 169,346 | |
| | 199,939 | | | Loan ID 200435 | | Fixed | | 4.625% | | 11/1/2052 | | | 196,711 | |
| | 215,015 | | | Loan ID 200436 | | Fixed | | 3.750% | | 4/1/2043 | | | 222,440 | |
| | 332,446 | | | Loan ID 200437 | | Fixed | | 5.625% | | 10/1/2043 | | | 349,069 | |
| | 44,675 | | | Loan ID 200439 | | Fixed | | 5.000% | | 8/1/2041 | | | 44,675 | |
| | 195,216 | | | Loan ID 200441 | | Fixed | | 6.000% | | 4/1/2045 | | | 161,943 | |
| | 443,090 | | | Loan ID 200442 | | Fixed | | 5.000% | | 12/1/2043 | | | 248,893 | |
| | 273,414 | | | Loan ID 200443 | | Fixed | | 3.000% | | 7/1/2049 | | | 213,621 | |
| | 259,036 | | | Loan ID 200444 | | Fixed | | 4.380% | | 11/1/2038 | | | 195,016 | |
| | 162,980 | | | Loan ID 200445 | | Fixed | | 5.250% | | 2/1/2039 | | | 171,129 | |
| | 52,655 | | | Loan ID 200447 | | Fixed | | 5.875% | | 11/4/2034 | | | 55,288 | |
| | 79,125 | | | Loan ID 200448 | | Interest Only | | 5.750% | | 5/1/2042 | | | 54,028 | |
| | 126,833 | | | Loan ID 200449 | | Fixed | | 5.000% | | 7/1/2041 | | | 133,174 | |
| | 362,911 | | | Loan ID 200451 | | Fixed | | 6.250% | | 7/1/2038 | | | 381,056 | |
| | 134,495 | | | Loan ID 200452 | | Fixed | | 3.000% | | 11/1/2041 | | | 101,690 | |
| | 16,303 | | | Loan ID 200453 | | ARM | | 6.250% | | 3/1/2026 | | | 17,118 | |
| | 241,893 | | | Loan ID 200456 | | Fixed | | 2.000% | | 11/1/2038 | | | 223,963 | |
| | 210,252 | | | Loan ID 200457 | | Fixed | | 5.750% | | 12/10/2030 | | | 220,764 | |
| | | | | | | | | | | | | | | |
The accompanying notes are an integral part of these financial statements.
| Vertical Capital Income Fund |
| PORTFOLIO OF INVESTMENTS (Continued) |
| September 30, 2016 |
| Principal | | | | | Loan Type | | Interest Rate | | Maturity | | Value | |
| | | | | MORTGAGE NOTES (Continued) - 93.2 % | | | | | | | | | | |
| $ | 190,148 | | | Loan ID 200460 | | Fixed | | 7.000% | | 7/1/2041 | | $ | 199,656 | |
| | 385,770 | | | Loan ID 200462 | | Fixed | | 6.000% | | 7/1/2045 | | | 322,210 | |
| | 157,764 | | | Loan ID 200463 | | Fixed | | 6.000% | | 3/1/2037 | | | 37,636 | |
| | 411,571 | | | Loan ID 200464 | | ARM | | 8.750% | | 8/1/2037 | | | 154,637 | |
| | 246,912 | | | Loan ID 200465 | | Fixed | | 6.500% | | 7/1/2037 | | | 239,242 | |
| | 449,658 | | | Loan ID 200466 | | Fixed | | 7.000% | | 7/1/2037 | | | 442,798 | |
| | 359,059 | | | Loan ID 200467 | | Fixed | | 5.500% | | 9/1/2044 | | | 314,007 | |
| | 105,113 | | | Loan ID 200468 | | Fixed | | 5.625% | | 12/1/2044 | | | 85,874 | |
| | 130,014 | | | Loan ID 200469 | | Fixed | | 6.500% | | 7/1/2037 | | | 111,118 | |
| | 293,233 | | | Loan ID 200473 | | Fixed | | 4.000% | | 12/1/2042 | | | 250,604 | |
| | 243,244 | | | Loan ID 200474 | | Fixed | | 5.750% | | 11/1/2050 | | | 255,406 | |
| | 169,436 | | | Loan ID 200475 | | Fixed | | 5.450% | | 7/1/2049 | | | 177,908 | |
| | 192,427 | | | Loan ID 200476 | | Fixed | | 6.000% | | 9/1/2050 | | | 198,184 | |
| | 214,884 | | | Loan ID 200477 | | Fixed | | 4.125% | | 12/1/2028 | | | 224,580 | |
| | 113,209 | | | Loan ID 200482 | | Fixed | | 4.375% | | 11/1/2028 | | | 118,870 | |
| | 106,348 | | | Loan ID 200483 | | Fixed | | 4.375% | | 11/1/2028 | | | 111,665 | |
| | 75,488 | | | Loan ID 200485 | | Fixed | | 4.125% | | 2/1/2043 | | | 79,262 | |
| | 251,317 | | | Loan ID 200486 | | Fixed | | 3.500% | | 1/1/2043 | | | 257,497 | |
| | 470,674 | | | Loan ID 200487 | | Fixed | | 6.000% | | 3/1/2037 | | | 203,725 | |
| | 160,331 | | | Loan ID 200488 | | Fixed | | 4.250% | | 1/1/2044 | | | 153,876 | |
| | 115,572 | | | Loan ID 200489 | | Fixed | | 4.000% | | 3/1/2043 | | | 109,299 | |
| | 80,611 | | | Loan ID 200490 | | Fixed | | 4.000% | | 11/1/2028 | | | 84,308 | |
| | 206,743 | | | Loan ID 200491 | | Fixed | | 5.500% | | 10/1/2039 | | | 206,743 | |
| | 122,250 | | | Loan ID 200492 | | Fixed | | 4.000% | | 1/1/2043 | | | 127,875 | |
| | 66,026 | | | Loan ID 200493 | | Fixed | | 4.500% | | 12/1/2025 | | | 69,327 | |
| | 278,897 | | | Loan ID 200494 | | Fixed | | 4.625% | | 10/1/2043 | | | 292,842 | |
| | 202,744 | | | Loan ID 200496 | | Fixed | | 3.875% | | 2/1/2043 | | | 210,952 | |
| | 325,599 | | | Loan ID 200497 | | Fixed | | 3.250% | | 4/1/2043 | | | 329,073 | |
| | 273,313 | | | Loan ID 200499 | | Fixed | | 4.250% | | 1/1/2043 | | | 286,859 | |
| | 220,627 | | | Loan ID 200500 | | Fixed | | 5.875% | | 2/1/2037 | | | 226,087 | |
| | 151,897 | | | Loan ID 200501 | | Fixed | | 7.250% | | 12/1/2037 | | | 159,492 | |
| | 191,591 | | | Loan ID 200502 | | Fixed | | 5.000% | | 5/1/2052 | | | 116,834 | |
| | 386,640 | | | Loan ID 200504 | | Fixed | | 3.375% | | 3/1/2043 | | | 392,732 | |
| | 74,765 | | | Loan ID 200507 | | Fixed | | 4.500% | | 9/1/2042 | | | 78,504 | |
| | 248,238 | | | Loan ID 200508 | | Fixed | | 2.000% | | 10/1/2040 | | | 199,462 | |
| | 305,490 | | | Loan ID 200509 | | Fixed | | 2.000% | | 12/1/2052 | | | 120,356 | |
| | 335,105 | | | Loan ID 200514 | | Fixed | | 3.000% | | 4/1/2047 | | | 334,958 | |
| | 100,238 | | | Loan ID 200515 | | Fixed | | 8.250% | | 2/1/2039 | | | 105,250 | |
| | 392,642 | | | Loan ID 200516 | | Fixed | | 5.250% | | 2/1/2046 | | | 142,289 | |
| | 104,345 | | | Loan ID 200517 | | Fixed | | 8.000% | | 5/1/2039 | | | 105,480 | |
| | 204,217 | | | Loan ID 200518 | | Fixed | | 3.000% | | 12/1/2050 | | | 181,169 | |
| | 316,291 | | | Loan ID 200519 | | Fixed | | 3.000% | | 11/1/2049 | | | 312,494 | |
| | 67,952 | | | Loan ID 200520 | | Fixed | | 3.260% | | 7/1/2053 | | | 46,899 | |
| | 120,605 | | | Loan ID 200524 | | Fixed | | 3.500% | | 6/1/2043 | | | 123,811 | |
| | | | | | | | | | | | | | | |
The accompanying notes are an integral part of these financial statements.
| Vertical Capital Income Fund |
| PORTFOLIO OF INVESTMENTS (Continued) |
| September 30, 2016 |
| Principal | | | | | Loan Type | | Interest Rate | | Maturity | | Value | |
| | | | | MORTGAGE NOTES (Continued) - 93.2 % | | | | | | | | | | |
| $ | 286,381 | | | Loan ID 200525 | | Fixed | | 3.250% | | 12/1/2042 | | $ | 284,041 | |
| | 112,139 | | | Loan ID 200527 | | Fixed | | 4.500% | | 12/1/2043 | | | 117,746 | |
| | 137,646 | | | Loan ID 200528 | | Fixed | | 4.375% | | 2/1/2044 | | | 144,529 | |
| | 398,614 | | | Loan ID 200529 | | Fixed | | 4.625% | | 2/1/2044 | | | 418,544 | |
| | 32,647 | | | Loan ID 200530 | | Fixed | | 5.375% | | 2/1/2044 | | | 34,280 | |
| | 175,413 | | | Loan ID 200531 | | Fixed | | 4.625% | | 11/1/2043 | | | 184,184 | |
| | 112,794 | | | Loan ID 200532 | | Fixed | | 3.250% | | 7/1/2043 | | | 111,974 | |
| | 59,057 | | | Loan ID 200536 | | Fixed | | 3.750% | | 10/1/2042 | | | 41,589 | |
| | 122,691 | | | Loan ID 200537 | | Fixed | | 4.500% | | 3/1/2042 | | | 117,486 | |
| | 93,238 | | | Loan ID 200538 | | Fixed | | 4.750% | | 1/1/2043 | | | 97,900 | |
| | 84,826 | | | Loan ID 200540 | | Fixed | | 3.875% | | 2/1/2043 | | | 88,428 | |
| | 57,601 | | | Loan ID 200543 | | ARM | | 7.250% | | 2/1/2037 | | | 6,994 | |
| | 57,806 | | | Loan ID 200545 | | Fixed | | 4.375% | | 2/1/2029 | | | 60,696 | |
| | 122,432 | | | Loan ID 200546 | | Fixed | | 5.375% | | 12/1/2043 | | | 128,554 | |
| | 170,011 | | | Loan ID 200548 | | Fixed | | 5.250% | | 2/1/2044 | | | 178,511 | |
| | 135,367 | | | Loan ID 200550 | | Fixed | | 3.750% | | 3/1/2043 | | | 140,133 | |
| | 221,157 | | | Loan ID 200555 | | Fixed | | 4.375% | | 1/1/2044 | | | 232,214 | |
| | 119,491 | | | Loan ID 200560 | | Fixed | | 5.750% | | 5/1/2035 | | | 125,466 | |
| | 226,155 | | | Loan ID 200561 | | Fixed | | 6.375% | | 12/1/2036 | | | 218,438 | |
| | 139,675 | | | Loan ID 200564 | | Fixed | | 4.875% | | 5/1/2039 | | | 137,388 | |
| | 533,865 | | | Loan ID 200565 | | Interest Only | | 4.000% | | 6/1/2037 | | | 472,685 | |
| | 378,729 | | | Loan ID 200566 | | Fixed | | 6.500% | | 7/1/2047 | | | 187,986 | |
| | 133,066 | | | Loan ID 200567 | | Fixed | | 3.375% | | 5/1/2043 | | | 135,466 | |
| | 99,856 | | | Loan ID 200569 | | Fixed | | 5.125% | | 2/1/2044 | | | 104,848 | |
| | 430,147 | | | Loan ID 200570 | | Fixed | | 3.625% | | 6/1/2043 | | | 443,537 | |
| | 137,204 | | | Loan ID 200571 | | Fixed | | 4.500% | | 7/1/2043 | | | 144,064 | |
| | 166,554 | | | Loan ID 200572 | | Fixed | | 4.375% | | 3/1/2044 | | | 174,882 | |
| | 96,726 | | | Loan ID 200573 | | Fixed | | 3.750% | | 9/1/2042 | | | 99,920 | |
| | 131,064 | | | Loan ID 200574 | | Fixed | | 4.875% | | 1/1/2044 | | | 137,617 | |
| | 179,238 | | | Loan ID 200577 | | Fixed | | 3.125% | | 4/1/2028 | | | 179,879 | |
| | 184,896 | | | Loan ID 200578 | | Fixed | | 4.750% | | 8/1/2040 | | | 194,141 | |
| | 48,954 | | | Loan ID 200579 | | Fixed | | 4.875% | | 5/1/2042 | | | 50,997 | |
| | 176,661 | | | Loan ID 200580 | | Fixed | | 4.125% | | 11/1/2041 | | | 169,417 | |
| | 38,919 | | | Loan ID 200581 | | Fixed | | 4.750% | | 9/1/2042 | | | 40,280 | |
| | 375,223 | | | Loan ID 200582 | | Fixed | | 4.000% | | 11/1/2042 | | | 347,942 | |
| | 87,018 | | | Loan ID 200583 | | Fixed | | 3.625% | | 9/1/2027 | | | 89,788 | |
| | 351,090 | | | Loan ID 200584 | | Fixed | | 3.375% | | 4/1/2043 | | | 309,102 | |
| | 171,378 | | | Loan ID 200585 | | Fixed | | 4.000% | | 6/1/2046 | | | 158,040 | |
| | 329,737 | | | Loan ID 200586 | | Fixed | | 3.500% | | 1/1/2043 | | | 338,229 | |
| | 253,707 | | | Loan ID 200588 | | Fixed | | 3.750% | | 5/1/2042 | | | 263,653 | |
| | 61,058 | | | Loan ID 200590 | | Fixed | | 4.125% | | 7/1/2042 | | | 54,387 | |
| | 102,618 | | | Loan ID 200591 | | Fixed | | 4.875% | | 3/1/2043 | | | 107,749 | |
| | 98,997 | | | Loan ID 200592 | | Fixed | | 4.375% | | 6/1/2042 | | | 103,946 | |
| | 67,647 | | | Loan ID 200593 | | Fixed | | 3.875% | | 6/1/2042 | | | 70,279 | |
| | | | | | | | | | | | | | | |
The accompanying notes are an integral part of these financial statements.
| Vertical Capital Income Fund |
| PORTFOLIO OF INVESTMENTS (Continued) |
| September 30, 2016 |
| Principal | | | | | Loan Type | | Interest Rate | | Maturity | | Value | |
| | | | | MORTGAGE NOTES (Continued) - 93.2 % | | | | | | | | | | |
| $ | 228,939 | | | Loan ID 200594 | | Fixed | | 4.250% | | 4/1/2043 | | $ | 239,132 | |
| | 39,668 | | | Loan ID 200597 | | Fixed | | 5.625% | | 2/1/2044 | | | 41,651 | |
| | 136,472 | | | Loan ID 200598 | | Fixed | | 4.625% | | 2/1/2044 | | | 143,296 | |
| | 121,060 | | | Loan ID 200599 | | Fixed | | 4.125% | | 2/1/2043 | | | 126,930 | |
| | 199,069 | | | Loan ID 200600 | | Fixed | | 4.625% | | 4/1/2044 | | | 209,023 | |
| | 109,609 | | | Loan ID 200601 | | Fixed | | 4.000% | | 3/1/2043 | | | 114,772 | |
| | 185,840 | | | Loan ID 200602 | | Fixed | | 3.750% | | 3/1/2043 | | | 192,874 | |
| | 71,213 | | | Loan ID 200603 | | Fixed | | 4.125% | | 6/1/2043 | | | 74,377 | |
| | 73,983 | | | Loan ID 200604 | | Fixed | | 3.500% | | 1/1/2043 | | | 75,853 | |
| | 141,501 | | | Loan ID 200605 | | Fixed | | 4.875% | | 11/1/2043 | | | 136,637 | |
| | 129,080 | | | Loan ID 200606 | | Fixed | | 3.625% | | 12/1/2042 | | | 133,412 | |
| | 219,314 | | �� | Loan ID 200607 | | Fixed | | 2.875% | | 11/1/2027 | | | 216,983 | |
| | 136,634 | | | Loan ID 200608 | | Fixed | | 4.125% | | 11/1/2043 | | | 130,903 | |
| | 57,183 | | | Loan ID 200611 | | Fixed | | 4.625% | | 5/1/2043 | | | 60,042 | |
| | 126,722 | | | Loan ID 200612 | | Fixed | | 4.500% | | 2/1/2043 | | | 133,022 | |
| | 206,552 | | | Loan ID 200613 | | Fixed | | 3.369% | | 1/1/2043 | | | 210,565 | |
| | 104,166 | | | Loan ID 200614 | | Fixed | | 5.000% | | 1/1/2044 | | | 109,375 | |
| | 102,602 | | | Loan ID 200615 | | Fixed | | 4.250% | | 8/1/2043 | | | 107,732 | |
| | 341,009 | | | Loan ID 200616 | | Fixed | | 4.875% | | 2/1/2044 | | | 358,060 | |
| | 93,334 | | | Loan ID 200617 | | Fixed | | 4.750% | | 9/1/2043 | | | 50,312 | |
| | 129,806 | | | Loan ID 200618 | | Fixed | | 4.375% | | 5/1/2042 | | | 136,296 | |
| | 230,741 | | | Loan ID 200620 | | Fixed | | 4.250% | | 10/1/2043 | | | 217,153 | |
| | 133,090 | | | Loan ID 200621 | | Fixed | | 3.625% | | 1/1/2043 | | | 136,424 | |
| | 74,004 | | | Loan ID 200623 | | Fixed | | 4.375% | | 12/1/2042 | | | 77,705 | |
| | 256,095 | | | Loan ID 200624 | | Fixed | | 4.125% | | 4/1/2043 | | | 268,703 | |
| | 117,444 | | | Loan ID 200626 | | Fixed | | 4.500% | | 10/1/2043 | | | 111,374 | |
| | 132,458 | | | Loan ID 200627 | | Fixed | | 4.250% | | 10/1/2043 | | | 139,080 | |
| | 76,268 | | | Loan ID 200628 | | Fixed | | 3.250% | | 2/1/2028 | | | 77,059 | |
| | 155,212 | | | Loan ID 200629 | | Fixed | | 4.375% | | 9/1/2043 | | | 149,640 | |
| | 166,595 | | | Loan ID 200630 | | Fixed | | 5.250% | | 9/1/2043 | | | 174,925 | |
| | 293,005 | | | Loan ID 200631 | | Fixed | | 3.250% | | 6/1/2043 | | | 296,949 | |
| | 345,410 | | | Loan ID 200632 | | Fixed | | 5.250% | | 5/1/2044 | | | 362,681 | |
| | 225,847 | | | Loan ID 200633 | | Fixed | | 5.125% | | 5/1/2044 | | | 237,140 | |
| | 233,147 | | | Loan ID 200634 | | Fixed | | 4.375% | | 1/1/2044 | | | 244,804 | |
| | 105,490 | | | Loan ID 200635 | | Fixed | | 3.750% | | 5/1/2029 | | | 108,053 | |
| | 196,174 | | | Loan ID 200636 | | Fixed | | 3.750% | | 2/1/2053 | | | 205,983 | |
| | 188,740 | | | Loan ID 200638 | | Fixed | | 3.875% | | 3/1/2043 | | | 158,397 | |
| | 170,260 | | | Loan ID 200641 | | Fixed | | 5.250% | | 4/1/2044 | | | 178,773 | |
| | 146,130 | | | Loan ID 200642 | | Fixed | | 5.000% | | 3/1/2044 | | | 134,763 | |
| | 169,345 | | | Loan ID 200644 | | Fixed | | 4.750% | | 3/1/2044 | | | 177,812 | |
| | 118,419 | | | Loan ID 200645 | | Fixed | | 5.000% | | 4/1/2044 | | | 124,340 | |
| | 118,578 | | | Loan ID 200647 | | Fixed | | 4.250% | | 1/1/2044 | | | 124,507 | |
| | 154,561 | | | Loan ID 200648 | | Fixed | | 4.750% | | 3/1/2044 | | | 162,289 | |
| | 143,172 | | | Loan ID 200649 | | Fixed | | 4.375% | | 3/1/2044 | | | 148,614 | |
| | | | | | | | | | | | | | | |
The accompanying notes are an integral part of these financial statements.
| Vertical Capital Income Fund |
| PORTFOLIO OF INVESTMENTS (Continued) |
| September 30, 2016 |
| Principal | | | | | Loan Type | | Interest Rate | | Maturity | | Value | |
| | | | | MORTGAGE NOTES (Continued) - 93.2 % | | | | | | | | | | |
| $ | 130,180 | | | Loan ID 200650 | | Fixed | | 4.875% | | 5/1/2044 | | $ | 125,652 | |
| | 263,025 | | | Loan ID 200651 | | Fixed | | 3.625% | | 7/1/2043 | | | 270,699 | |
| | 170,911 | | | Loan ID 200652 | | Fixed | | 4.125% | | 5/1/2038 | | | 119,066 | |
| | 353,255 | | | Loan ID 200653 | | Fixed | | 4.000% | | 4/1/2053 | | | 365,882 | |
| | 279,649 | | | Loan ID 200654 | | Fixed | | 5.125% | | 2/1/2041 | | | 156,077 | |
| | 141,247 | | | Loan ID 200655 | | Fixed | | 3.375% | | 5/1/2043 | | | 143,403 | |
| | 153,774 | | | Loan ID 200656 | | Fixed | | 6.875% | | 7/1/2037 | | | 72,339 | |
| | 145,984 | | | Loan ID 200657 | | Fixed | | 4.875% | | 8/1/2051 | | | 153,283 | |
| | 285,784 | | | Loan ID 200659 | | Fixed | | 4.000% | | 3/1/2053 | | | 219,418 | |
| | 183,323 | | | Loan ID 200660 | | Fixed | | 5.875% | | 3/1/2038 | | | 192,489 | |
| | 212,768 | | | Loan ID 200662 | | Fixed | | 5.000% | | 3/1/2044 | | | 223,406 | |
| | 69,283 | | | Loan ID 200663 | | Fixed | | 4.750% | | 5/1/2044 | | | 72,747 | |
| | 276,915 | | | Loan ID 200664 | | Fixed | | 4.750% | | 4/1/2044 | | | 290,760 | |
| | 271,522 | | | Loan ID 200665 | | Fixed | | 5.299% | | 12/1/2046 | | | 142,518 | |
| | 217,454 | | | Loan ID 200666 | | Fixed | | 5.890% | | 8/26/2035 | | | 152,888 | |
| | 303,996 | | | Loan ID 200668 | | Fixed | | 3.625% | | 4/1/2043 | | | 314,262 | |
| | 156,135 | | | Loan ID 200669 | | Fixed | | 5.250% | | 4/1/2044 | | | 163,942 | |
| | 64,274 | | | Loan ID 200670 | | Fixed | | 4.375% | | 2/1/2029 | | | 66,859 | |
| | 238,699 | | | Loan ID 200671 | | Fixed | | 4.625% | | 8/1/2043 | | | 249,292 | |
| | 158,837 | | | Loan ID 200672 | | Fixed | | 3.750% | | 7/1/2043 | | | 161,753 | |
| | 310,932 | | | Loan ID 200674 | | Fixed | | 4.500% | | 5/1/2044 | | | 301,123 | |
| | 283,982 | | | Loan ID 200675 | | Fixed | | 5.125% | | 4/1/2044 | | | 298,181 | |
| | 123,753 | | | Loan ID 200677 | | Fixed | | 3.625% | | 5/1/2028 | | | 127,587 | |
| | 468,670 | | | Loan ID 200678 | | Fixed | | 4.375% | | 2/1/2044 | | | 492,104 | |
| | 255,988 | | | Loan ID 200679 | | Fixed | | 5.000% | | 4/1/2044 | | | 205,583 | |
| | 191,034 | | | Loan ID 200682 | | Fixed | | 4.875% | | 5/1/2044 | | | 173,619 | |
| | 214,261 | | | Loan ID 200683 | | Fixed | | 4.500% | | 4/1/2044 | | | 224,975 | |
| | 127,015 | | | Loan ID 200684 | | Fixed | | 4.875% | | 4/1/2044 | | | 133,365 | |
| | 231,268 | | | Loan ID 200685 | | Fixed | | 4.875% | | 5/1/2044 | | | 242,831 | |
| | 184,491 | | | Loan ID 200688 | | Fixed | | 4.250% | | 3/1/2053 | | | 116,974 | |
| | 135,305 | | | Loan ID 200689 | | Fixed | | 4.375% | | 12/1/2043 | | | 126,543 | |
| | 226,662 | | | Loan ID 200690 | | Fixed | | 4.250% | | 4/1/2044 | | | 236,455 | |
| | 288,628 | | | Loan ID 200691 | | Fixed | | 4.500% | | 5/1/2044 | | | 303,059 | |
| | 245,442 | | | Loan ID 200692 | | Fixed | | 4.625% | | 7/1/2044 | | | 257,714 | |
| | 107,631 | | | Loan ID 200694 | | Fixed | | 4.500% | | 9/1/2043 | | | 113,013 | |
| | 48,869 | | | Loan ID 200696 | | Fixed | | 3.750% | | 10/1/2042 | | | 50,790 | |
| | 136,614 | | | Loan ID 200697 | | Fixed | | 4.500% | | 1/1/2044 | | | 129,759 | |
| | 189,088 | | | Loan ID 200699 | | Fixed | | 4.125% | | 7/1/2044 | | | 196,726 | |
| | 94,476 | | | Loan ID 200700 | | Fixed | | 4.250% | | 2/1/2044 | | | 98,933 | |
| | 168,618 | | | Loan ID 200701 | | Fixed | | 4.750% | | 6/1/2044 | | | 177,049 | |
| | 97,641 | | | Loan ID 200704 | | Fixed | | 4.375% | | 3/1/2043 | | | 102,476 | |
| | 134,353 | | | Loan ID 200705 | | Fixed | | 4.625% | | 4/1/2044 | | | 141,070 | |
| | 103,587 | | | Loan ID 200706 | | Fixed | | 4.990% | | 6/1/2044 | | | 108,767 | |
| | 100,720 | | | Loan ID 200707 | | Fixed | | 4.875% | | 2/1/2044 | | | 105,756 | |
| | | | | | | | | | | | | | | |
The accompanying notes are an integral part of these financial statements.
| Vertical Capital Income Fund |
| PORTFOLIO OF INVESTMENTS (Continued) |
| September 30, 2016 |
| Principal | | | | | Loan Type | | Interest Rate | | Maturity | | Value | |
| | | | | MORTGAGE NOTES (Continued) - 93.2 % | | | | | | | | | | |
| $ | 133,716 | | | Loan ID 200708 | | Fixed | | 4.875% | | 2/1/2044 | | $ | 140,402 | |
| | 51,489 | | | Loan ID 200709 | | Fixed | | 4.375% | | 4/1/2043 | | | 54,064 | |
| | 116,807 | | | Loan ID 200710 | | Fixed | | 4.500% | | 7/1/2044 | | | 103,002 | |
| | 116,802 | | | Loan ID 200711 | | Fixed | | 3.750% | | 7/1/2043 | | | 118,849 | |
| | 217,476 | | | Loan ID 200712 | | Fixed | | 3.875% | | 2/1/2044 | | | 200,225 | |
| | 98,131 | | | Loan ID 200713 | | Fixed | | 4.250% | | 12/1/2043 | | | 102,526 | |
| | 605,673 | | | Loan ID 200714 | | Fixed | | 4.175% | | 11/1/2036 | | | 532,498 | |
| | 211,169 | | | Loan ID 200716 | | ARM | | 3.507% | | 8/1/2037 | | | 136,498 | |
| | 143,465 | | | Loan ID 200720 | | ARM | | 3.500% | | 4/1/2042 | | | 102,076 | |
| | 186,281 | | | Loan ID 200721 | | Fixed | | 3.000% | | 8/1/2037 | | | 146,239 | |
| | 191,871 | | | Loan ID 200725 | | Fixed | | 7.000% | | 7/1/2037 | | | 95,766 | |
| | 149,993 | | | Loan ID 200726 | | Fixed | | 4.125% | | 9/1/2037 | | | 98,967 | |
| | 172,927 | | | Loan ID 200727 | | Fixed | | 2.625% | | 7/1/2037 | | | 166,044 | |
| | 340,902 | | | Loan ID 200729 | | ARM | | 3.625% | | 11/1/2037 | | | 186,621 | |
| | 446,642 | | | Loan ID 200730 | | ARM | | 3.125% | | 9/1/2036 | | | 282,922 | |
| | 199,990 | | | Loan ID 200732 | | Fixed | | 4.125% | | 9/1/2027 | | | 178,928 | |
| | 233,025 | | | Loan ID 200733 | | Fixed | | 3.750% | | 12/1/2042 | | | 241,973 | |
| | 245,029 | | | Loan ID 200734 | | ARM | | 3.375% | | 4/1/2044 | | | 254,559 | |
| | 102,846 | | | Loan ID 200735 | | Fixed | | 4.500% | | 6/1/2044 | | | 107,988 | |
| | 145,589 | | | Loan ID 200736 | | Fixed | | 4.750% | | 5/1/2044 | | | 131,664 | |
| | 143,573 | | | Loan ID 200737 | | Fixed | | 4.750% | | 5/1/2044 | | | 100,516 | |
| | 592,951 | | | Loan ID 200738 | | Fixed | | 4.125% | | 6/1/2044 | | | 622,411 | |
| | 355,714 | | | Loan ID 200739 | | Fixed | | 4.625% | | 8/1/2044 | | | 343,488 | |
| | 132,641 | | | Loan ID 200740 | | Fixed | | 4.875% | | 6/1/2044 | | | 139,273 | |
| | 179,073 | | | Loan ID 200742 | | Fixed | | 4.250% | | 4/1/2043 | | | 179,037 | |
| | 193,944 | | | Loan ID 200744 | | Fixed | | 3.625% | | 6/1/2043 | | | 199,952 | |
| | 124,119 | | | Loan ID 200745 | | Fixed | | 3.250% | | 6/1/2043 | | | 123,897 | |
| | 335,586 | | | Loan ID 200747 | | Fixed | | 4.125% | | 5/1/2043 | | | 351,677 | |
| | 454,857 | | | Loan ID 200748 | | Fixed | | 4.750% | | 12/1/2043 | | | 477,599 | |
| | 155,202 | | | Loan ID 200749 | | Fixed | | 4.750% | | 9/1/2043 | | | 162,962 | |
| | 245,562 | | | Loan ID 200750 | | Fixed | | 4.750% | | 5/1/2044 | | | 257,840 | |
| | 171,903 | | | Loan ID 200752 | | Fixed | | 4.750% | | 10/1/2043 | | | 66,996 | |
| | 60,406 | | | Loan ID 200753 | | Fixed | | 5.250% | | 5/1/2044 | | | 59,187 | |
| | 226,216 | | | Loan ID 200754 | | Fixed | | 4.750% | | 8/1/2044 | | | 237,527 | |
| | 56,340 | | | Loan ID 200755 | | Fixed | | 4.250% | | 6/1/2043 | | | 58,618 | |
| | 192,129 | | | Loan ID 200756 | | Fixed | | 4.875% | | 11/1/2043 | | | 175,319 | |
| | 128,266 | | | Loan ID 200759 | | Fixed | | 3.750% | | 6/1/2043 | | | 131,560 | |
| | 174,945 | | | Loan ID 200760 | | Fixed | | 3.750% | | 6/1/2043 | | | 181,328 | |
| | 304,669 | | | Loan ID 200762 | | Fixed | | 3.875% | | 5/1/2042 | | | 317,671 | |
| | 155,512 | | | Loan ID 200763 | | Fixed | | 4.250% | | 11/1/2043 | | | 148,831 | |
| | 206,870 | | | Loan ID 200765 | | Fixed | | 4.875% | | 11/1/2043 | | | 216,000 | |
| | 499,913 | | | Loan ID 200766 | | Fixed | | 3.625% | | 12/1/2042 | | | 516,694 | |
| | 138,743 | | | Loan ID 200770 | | Fixed | | 4.000% | | 5/1/2043 | | | 109,666 | |
| | 176,662 | | | Loan ID 200771 | | Fixed | | 4.500% | | 4/1/2043 | | | 170,149 | |
| | | | | | | | | | | | | | | |
The accompanying notes are an integral part of these financial statements.
| Vertical Capital Income Fund |
| PORTFOLIO OF INVESTMENTS (Continued) |
| September 30, 2016 |
| Principal | | | | | Loan Type | | Interest Rate | | Maturity | | Value | |
| | | | | MORTGAGE NOTES (Continued) - 93.2 % | | | | | | | | | | |
| $ | 250,072 | | | Loan ID 200772 | | Fixed | | 3.750% | | 3/1/2043 | | $ | 259,868 | |
| | 58,638 | | | Loan ID 200773 | | Fixed | | 3.750% | | 10/1/2043 | | | 47,360 | |
| | 208,176 | | | Loan ID 200774 | | Fixed | | 3.875% | | 7/1/2043 | | | 216,838 | |
| | 45,087 | | | Loan ID 200775 | | Fixed | | 4.250% | | 4/1/2043 | | | 47,342 | |
| | 82,358 | | | Loan ID 200776 | | Fixed | | 4.250% | | 3/1/2044 | | | 86,010 | |
| | 54,123 | | | Loan ID 200777 | | Fixed | | 4.750% | | 6/1/2044 | | | 50,795 | |
| | 144,398 | | | Loan ID 200779 | | Fixed | | 4.625% | | 8/1/2044 | | | 151,618 | |
| | 169,347 | | | Loan ID 200781 | | Fixed | | 4.625% | | 9/1/2044 | | | 177,195 | |
| | 141,690 | | | Loan ID 200783 | | Fixed | | 4.750% | | 9/1/2044 | | | 139,179 | |
| | 115,782 | | | Loan ID 200785 | | Fixed | | 4.500% | | 8/1/2044 | | | 121,571 | |
| | 229,451 | | | Loan ID 200786 | | Fixed | | 4.625% | | 7/1/2044 | | | 222,069 | |
| | 43,595 | | | Loan ID 200787 | | Fixed | | 4.750% | | 9/1/2044 | | | 45,298 | |
| | 192,235 | | | Loan ID 200788 | | Fixed | | 3.625% | | 12/1/2028 | | | 196,545 | |
| | 131,728 | | | Loan ID 200789 | | Fixed | | 3.750% | | 9/1/2044 | | | 122,696 | |
| | 152,947 | | | Loan ID 200790 | | Fixed | | 4.250% | | 8/1/2044 | | | 160,594 | |
| | 205,253 | | | Loan ID 200791 | | Fixed | | 4.875% | | 6/1/2044 | | | 215,515 | |
| | 365,060 | | | Loan ID 200792 | | Fixed | | 3.375% | | 1/1/2043 | | | 237,813 | |
| | 370,347 | | | Loan ID 200793 | | Fixed | | 2.000% | | 10/1/2051 | | | 152,293 | |
| | 234,344 | | | Loan ID 200794 | | Fixed | | 3.000% | | 4/1/2050 | | | 56,481 | |
| | 94,760 | | | Loan ID 200795 | | Fixed | | 6.750% | | 8/1/2036 | | | 91,121 | |
| | 71,993 | | | Loan ID 200796 | | Fixed | | 2.170% | | 12/1/2053 | | | 46,695 | |
| | 419,521 | | | Loan ID 200797 | | Fixed | | 4.000% | | 6/1/2052 | | | 365,269 | |
| | 59,706 | | | Loan ID 200799 | | Fixed | | 4.000% | | 2/5/2053 | | | 59,085 | |
| | 61,199 | | | Loan ID 200800 | | Fixed | | 4.000% | | 1/1/2053 | | | 33,311 | |
| | 215,485 | | | Loan ID 200802 | | Fixed | | 7.000% | | 1/1/2042 | | | 69,716 | |
| | 360,995 | | | Loan ID 200803 | | Fixed | | 2.250% | | 11/1/2050 | | | 143,237 | |
| | 155,198 | | | Loan ID 200805 | | Fixed | | 4.000% | | 7/1/2050 | | | 112,720 | |
| | 158,720 | | | Loan ID 200806 | | Fixed | | 5.000% | | 8/1/2049 | | | 90,954 | |
| | 296,269 | | | Loan ID 200807 | | Fixed | | 3.460% | | 7/1/2047 | | | 219,896 | |
| | 58,500 | | | Loan ID 200808 | | Fixed | | 3.000% | | 11/1/2050 | | | 21,936 | |
| | 116,908 | | | Loan ID 200809 | | Fixed | | 4.000% | | 4/1/2050 | | | 49,719 | |
| | 139,127 | | | Loan ID 200810 | | Fixed | | 4.000% | | 1/1/2050 | | | 81,863 | |
| | 111,160 | | | Loan ID 200811 | | Fixed | | 4.000% | | 4/1/2050 | | | 76,375 | |
| | 272,825 | | | Loan ID 200813 | | Fixed | | 2.000% | | 12/1/2049 | | | 118,785 | |
| | 242,361 | | | Loan ID 200814 | | Fixed | | 8.250% | | 7/1/2039 | | | 254,479 | |
| | 314,241 | | | Loan ID 200815 | | Fixed | | 2.000% | | 3/1/2053 | | | 154,802 | |
| | 282,365 | | | Loan ID 200817 | | Fixed | | 4.000% | | 1/1/2050 | | | 185,594 | |
| | 54,490 | | | Loan ID 200818 | | Fixed | | 3.490% | | 8/1/2051 | | | 45,315 | |
| | 264,687 | | | Loan ID 200819 | | Fixed | | 2.000% | | 9/1/2053 | | | 116,784 | |
| | 135,322 | | | Loan ID 200820 | | Fixed | | 4.000% | | 7/1/2044 | | | 139,961 | |
| | 211,074 | | | Loan ID 200821 | | Fixed | | 4.250% | | 8/1/2044 | | | 221,627 | |
| | 320,302 | | | Loan ID 200822 | | Fixed | | 4.750% | | 1/1/2042 | | | 336,317 | |
| | 82,356 | | | Loan ID 200823 | | Fixed | | 4.250% | | 9/1/2044 | | | 85,698 | |
| | 223,742 | | | Loan ID 200824 | | Fixed | | 4.250% | | 8/1/2044 | | | 208,871 | |
| | | | | | | | | | | | | | | |
The accompanying notes are an integral part of these financial statements.
| Vertical Capital Income Fund |
| PORTFOLIO OF INVESTMENTS (Continued) |
| September 30, 2016 |
| Principal | | | | | Loan Type | | Interest Rate | | Maturity | | Value | |
| | | | | MORTGAGE NOTES (Continued) - 93.2 % | | | | | | | | | | |
| $ | 107,268 | | | Loan ID 200826 | | Fixed | | 4.375% | | 9/1/2044 | | $ | 112,186 | |
| | 188,088 | | | Loan ID 200827 | | Fixed | | 3.875% | | 6/1/2044 | | | 191,652 | |
| | 236,979 | | | Loan ID 200828 | | Fixed | | 4.375% | | 7/1/2044 | | | 222,292 | |
| | 250,138 | | | Loan ID 200829 | | Fixed | | 4.375% | | 7/1/2043 | | | 262,645 | |
| | 211,819 | | | Loan ID 200830 | | ARM | | 2.875% | | 7/1/2044 | | | 193,570 | |
| | 80,384 | | | Loan ID 200831 | | Fixed | | 4.250% | | 10/1/2044 | | | 83,629 | |
| | 344,500 | | | Loan ID 200832 | | Fixed | | 4.250% | | 10/1/2044 | | | 327,890 | |
| | 360,377 | | | Loan ID 200833 | | Fixed | | 4.250% | | 1/1/2043 | | | 378,396 | |
| | 162,180 | | | Loan ID 200834 | | Fixed | | 4.125% | | 7/1/2043 | | | 170,173 | |
| | 330,977 | | | Loan ID 200835 | | Fixed | | 5.000% | | 8/1/2043 | | | 347,526 | |
| | 332,454 | | | Loan ID 200837 | | Fixed | | 4.625% | | 8/1/2044 | | | 349,076 | |
| | 185,092 | | | Loan ID 200838 | | Fixed | | 3.750% | | 8/1/2044 | | | 170,108 | |
| | 237,191 | | | Loan ID 200839 | | Fixed | | 5.000% | | 5/1/2044 | | | 249,051 | |
| | 183,322 | | | Loan ID 200842 | | Fixed | | 4.250% | | 8/1/2044 | | | 189,124 | |
| | 362,090 | | | Loan ID 200843 | | Fixed | | 4.750% | | 10/1/2043 | | | 380,195 | |
| | 306,613 | | | Loan ID 200844 | | Fixed | | 4.500% | | 7/1/2043 | | | 321,944 | |
| | 206,057 | | | Loan ID 200846 | | Fixed | | 4.375% | | 11/1/2043 | | | 196,743 | |
| | 183,789 | | | Loan ID 200847 | | Fixed | | 4.750% | | 10/1/2044 | | | 192,978 | |
| | 178,998 | | | Loan ID 200848 | | Fixed | | 2.000% | | 6/1/2051 | | | 130,200 | |
| | 146,203 | | | Loan ID 200850 | | Fixed | | 3.000% | | 6/1/2051 | | | 59,936 | |
| | 619,116 | | | Loan ID 200852 | | Fixed | | 2.868% | | 2/1/2053 | | | 521,836 | |
| | 113,245 | | | Loan ID 200853 | | Fixed | | 4.818% | | 4/1/2037 | | | 83,608 | |
| | 105,590 | | | Loan ID 200854 | | Fixed | | 2.500% | | 4/1/2053 | | | 95,383 | |
| | 225,349 | | | Loan ID 200855 | | ARM | | 3.839% | | 7/1/2037 | | | 174,419 | |
| | 213,579 | | | Loan ID 200856 | | Fixed | | 6.000% | | 6/1/2042 | | | 98,001 | |
| | 244,616 | | | Loan ID 200857 | | Fixed | | 2.125% | | 7/1/2040 | | | 107,845 | |
| | 268,284 | | | Loan ID 200858 | | Fixed | | 2.000% | | 1/1/2053 | | | 213,250 | |
| | 245,032 | | | Loan ID 200859 | | Fixed | | 2.170% | | 12/1/2052 | | | 107,837 | |
| | 169,265 | | | Loan ID 200860 | | Fixed | | 2.000% | | 3/1/2052 | | | 69,803 | |
| | 431,255 | | | Loan ID 200861 | | Fixed | | 2.000% | | 6/1/2054 | | | 362,685 | |
| | 156,654 | | | Loan ID 200862 | | Fixed | | 2.748% | | 8/1/2050 | | | 88,925 | |
| | 253,206 | | | Loan ID 200863 | | Fixed | | 2.000% | | 7/1/2052 | | | 207,902 | |
| | 266,138 | | | Loan ID 200864 | | Fixed | | 3.000% | | 1/1/2037 | | | 172,231 | |
| | 210,887 | | | Loan ID 200865 | | Fixed | | 3.060% | | 11/1/2053 | | | 164,093 | |
| | 268,854 | | | Loan ID 200866 | | Fixed | | 2.000% | | 5/1/2053 | | | 242,922 | |
| | 114,782 | | | Loan ID 200867 | | Fixed | | 2.370% | | 9/1/2053 | | | 82,320 | |
| | 389,632 | | | Loan ID 200872 | | Fixed | | 3.200% | | 8/1/2050 | | | 314,700 | |
| | 201,081 | | | Loan ID 200873 | | Fixed | | 3.525% | | 11/1/2053 | | | 139,719 | |
| | 215,412 | | | Loan ID 200874 | | Fixed | | 2.000% | | 11/1/2047 | | | 87,806 | |
| | 572,329 | | | Loan ID 200875 | | Fixed | | 2.000% | | 5/1/2054 | | | 441,898 | |
| | 201,430 | | | Loan ID 200876 | | ARM | | 3.125% | | 5/1/2035 | | | 184,822 | |
| | 394,307 | | | Loan ID 200877 | | Fixed | | 4.750% | | 9/1/2042 | | | 348,903 | |
| | 136,878 | | | Loan ID 200878 | | Fixed | | 4.000% | | 7/1/2050 | | | 105,761 | |
| | 193,731 | | | Loan ID 200880 | | Fixed | | 4.250% | | 6/1/2043 | | | 193,731 | |
| | | | | | | | | | | | | | | |
The accompanying notes are an integral part of these financial statements.
| Vertical Capital Income Fund |
| PORTFOLIO OF INVESTMENTS (Continued) |
| September 30, 2016 |
| Principal | | | | | Loan Type | | Interest Rate | | Maturity | | Value | |
| | | | | MORTGAGE NOTES (Continued) - 93.2 % | | | | | | | | | | |
| $ | 177,487 | | | Loan ID 200882 | | Fixed | | 5.125% | | 9/1/2043 | | $ | 186,361 | |
| | 86,022 | | | Loan ID 200883 | | Fixed | | 3.375% | | 5/1/2028 | | | 87,343 | |
| | 175,054 | | | Loan ID 200885 | | Fixed | | 4.875% | | 10/1/2044 | | | 180,934 | |
| | 96,782 | | | Loan ID 200886 | | Fixed | | 4.250% | | 10/1/2044 | | | 99,142 | |
| | 254,711 | | | Loan ID 200887 | | Fixed | | 4.750% | | 9/1/2044 | | | 267,446 | |
| | 239,212 | | | Loan ID 200888 | | Fixed | | 4.500% | | 9/1/2044 | | | 226,038 | |
| | 135,724 | | | Loan ID 200890 | | Fixed | | 4.375% | | 11/1/2044 | | | 125,676 | |
| | 209,057 | | | Loan ID 200891 | | Fixed | | 4.250% | | 10/1/2044 | | | 217,237 | |
| | 256,876 | | | Loan ID 200892 | | Fixed | | 3.750% | | 9/1/2043 | | | 232,491 | |
| | 224,848 | | | Loan ID 200893 | | Fixed | | 5.000% | | 11/1/2043 | | | 236,091 | |
| | 99,237 | | | Loan ID 200894 | | Fixed | | 5.000% | | 10/1/2043 | | | 104,199 | |
| | 227,978 | | | Loan ID 200895 | | Fixed | | 3.875% | | 11/1/2043 | | | 237,593 | |
| | 196,861 | | | Loan ID 200897 | | Fixed | | 4.750% | | 10/1/2044 | | | 143,421 | |
| | 222,207 | | | Loan ID 200898 | | Fixed | | 4.250% | | 10/1/2043 | | | 112,075 | |
| | 375,931 | | | Loan ID 200900 | | Fixed | | 4.375% | | 9/1/2044 | | | 365,781 | |
| | 667,346 | | | Loan ID 200902 | | Fixed | | 4.250% | | 9/1/2044 | | | 700,713 | |
| | 253,174 | | | Loan ID 200904 | | Fixed | | 5.125% | | 9/1/2044 | | | 250,240 | |
| | 405,188 | | | Loan ID 200905 | | Fixed | | 5.375% | | 9/1/2044 | | | 425,448 | |
| | 316,641 | | | Loan ID 200906 | | Fixed | | 4.875% | | 2/1/2035 | | | 332,473 | |
| | 354,917 | | | Loan ID 200907 | | ARM | | 3.500% | | 8/1/2047 | | | 308,152 | |
| | 106,772 | | | Loan ID 200908 | | Fixed | | 4.000% | | 6/1/2049 | | | 110,514 | |
| | 116,375 | | | Loan ID 200909 | | Fixed | | 4.870% | | 3/1/2046 | | | 122,194 | |
| | 205,283 | | | Loan ID 200910 | | Fixed | | 3.300% | | 4/1/2053 | | | 117,701 | |
| | 150,092 | | | Loan ID 200911 | | Fixed | | 3.380% | | 9/1/2053 | | | 75,938 | |
| | 723,314 | | | Loan ID 200912 | | Interest Only | | 4.500% | | 3/1/2037 | | | 643,802 | |
| | 60,075 | | | Loan ID 200913 | | Fixed | | 4.250% | | 5/1/2047 | | | 52,858 | |
| | 152,641 | | | Loan ID 200914 | | Fixed | | 2.875% | | 12/1/2047 | | | 151,950 | |
| | 95,987 | | | Loan ID 200916 | | Fixed | | 4.000% | | 10/1/2037 | | | 97,662 | |
| | 161,159 | | | Loan ID 200917 | | Fixed | | 4.875% | | 1/1/2051 | | | 169,217 | |
| | 514,211 | | | Loan ID 200918 | | Fixed | | 3.875% | | 10/1/2035 | | | 459,201 | |
| | 553,014 | | | Loan ID 200919 | | Fixed | | 3.000% | | 8/1/2045 | | | 482,084 | |
| | 99,142 | | | Loan ID 200921 | | ARM | | 3.500% | | 7/1/2051 | | | 104,099 | |
| | 427,233 | | | Loan ID 200922 | | Fixed | | 3.340% | | 9/1/2053 | | | 392,185 | |
| | 435,778 | | | Loan ID 200923 | | Fixed | | 3.750% | | 12/1/2036 | | | 380,696 | |
| | 512,234 | | | Loan ID 200924 | | Fixed | | 5.500% | | 9/1/2051 | | | 449,909 | |
| | 465,963 | | | Loan ID 200925 | | Fixed | | 4.000% | | 4/1/2055 | | | 488,047 | |
| | 333,867 | | | Loan ID 200927 | | Fixed | | 3.000% | | 8/1/2038 | | | 334,602 | |
| | 125,071 | | | Loan ID 200928 | | Fixed | | 4.800% | | 12/1/2036 | | | 131,324 | |
| | 164,169 | | | Loan ID 200929 | | Fixed | | 4.625% | | 1/1/2043 | | | 172,377 | |
| | 244,240 | | | Loan ID 200930 | | Fixed | | 3.000% | | 12/1/2050 | | | 189,605 | |
| | 392,258 | | | Loan ID 200931 | | Fixed | | 4.250% | | 12/1/2052 | | | 317,778 | |
| | 307,897 | | | Loan ID 200933 | | Fixed | | 4.250% | | 3/1/2043 | | | 323,292 | |
| | 116,827 | | | Loan ID 200934 | | Fixed | | 3.810% | | 1/1/2043 | | | 121,314 | |
| | 181,454 | | | Loan ID 200935 | | Fixed | | 3.875% | | 4/1/2043 | | | 189,160 | |
| | | | | | | | | | | | | | | |
The accompanying notes are an integral part of these financial statements.
| Vertical Capital Income Fund |
| PORTFOLIO OF INVESTMENTS (Continued) |
| September 30, 2016 |
| Principal | | | | | Loan Type | | Interest Rate | | Maturity | | Value | |
| | | | | MORTGAGE NOTES (Continued) - 93.2 % | | | | | | | | | | |
| $ | 199,197 | | | Loan ID 200936 | | Fixed | | 4.000% | | 5/1/2042 | | $ | 208,492 | |
| | 176,917 | | | Loan ID 200938 | | Fixed | | 4.125% | | 4/1/2043 | | | 184,832 | |
| | 124,262 | | | Loan ID 200939 | | Fixed | | 4.170% | | 5/1/2042 | | | 130,475 | |
| | 203,315 | | | Loan ID 200940 | | Fixed | | 3.250% | | 2/1/2043 | | | 205,351 | |
| | 118,572 | | | Loan ID 200941 | | Fixed | | 3.780% | | 1/1/2043 | | | 123,024 | |
| | 284,791 | | | Loan ID 200942 | | Fixed | | 4.000% | | 4/1/2043 | | | 298,299 | |
| | 106,170 | | | Loan ID 200944 | | Fixed | | 4.500% | | 2/1/2044 | | | 109,491 | |
| | 143,515 | | | Loan ID 200945 | | Fixed | | 5.125% | | 4/1/2044 | | | 150,691 | |
| | 294,054 | | | Loan ID 200947 | | Fixed | | 4.000% | | 2/1/2043 | | | 307,545 | |
| | 131,514 | | | Loan ID 200948 | | Fixed | | 4.625% | | 12/1/2042 | | | 128,769 | |
| | 287,084 | | | Loan ID 200949 | | Fixed | | 3.875% | | 4/1/2043 | | | 299,600 | |
| | 185,624 | | | Loan ID 200952 | | Fixed | | 3.875% | | 1/1/2043 | | | 193,418 | |
| | 120,207 | | | Loan ID 200953 | | Fixed | | 3.750% | | 12/1/2042 | | | 122,363 | |
| | 386,835 | | | Loan ID 200954 | | Fixed | | 3.625% | | 1/1/2043 | | | 399,035 | |
| | 336,903 | | | Loan ID 200955 | | Fixed | | 3.250% | | 5/1/2043 | | | 341,104 | |
| | 265,727 | | | Loan ID 200956 | | Fixed | | 5.000% | | 8/1/2051 | | | 279,013 | |
| | 170,860 | | | Loan ID 200957 | | Fixed | | 3.875% | | 6/1/2043 | | | 178,201 | |
| | 98,277 | | | Loan ID 200958 | | Fixed | | 3.875% | | 6/1/2043 | | | 102,086 | |
| | 427,365 | | | Loan ID 200959 | | Fixed | | 4.000% | | 11/1/2042 | | | 448,056 | |
| | 383,457 | | | Loan ID 200960 | | Fixed | | 3.500% | | 1/1/2043 | | | 392,403 | |
| | 181,967 | | | Loan ID 200961 | | Fixed | | 4.750% | | 6/1/2043 | | | 191,066 | |
| | 210,691 | | | Loan ID 200962 | | Fixed | | 4.250% | | 10/1/2044 | | | 218,070 | |
| | 120,221 | | | Loan ID 200963 | | Fixed | | 4.750% | | 9/1/2044 | | | 116,402 | |
| | 360,887 | | | Loan ID 200964 | | Fixed | | 3.750% | | 7/1/2043 | | | 374,540 | |
| | 209,739 | | | Loan ID 200965 | | Fixed | | 4.125% | | 11/1/2044 | | | 191,808 | |
| | 148,874 | | | Loan ID 200966 | | Fixed | | 4.875% | | 7/1/2044 | | | 142,842 | |
| | 96,729 | | | Loan ID 200968 | | Fixed | | 4.250% | | 11/1/2044 | | | 88,188 | |
| | 368,915 | | | Loan ID 200969 | | Fixed | | 4.875% | | 8/1/2043 | | | 387,361 | |
| | 135,442 | | | Loan ID 200972 | | Fixed | | 4.750% | | 2/1/2044 | | | 142,214 | |
| | 156,903 | | | Loan ID 200974 | | Fixed | | 4.250% | | 10/1/2044 | | | 162,130 | |
| | 58,200 | | | Loan ID 200975 | | Fixed | | 4.750% | | 12/1/2044 | | | 61,110 | |
| | 357,587 | | | Loan ID 200977 | | Fixed | | 4.875% | | 9/1/2044 | | | 375,466 | |
| | 180,874 | | | Loan ID 200980 | | Fixed | | 4.250% | | 11/1/2044 | | | 185,391 | |
| | 213,448 | | | Loan ID 200983 | | Fixed | | 4.375% | | 8/1/2044 | | | 221,897 | |
| | 155,470 | | | Loan ID 200984 | | Fixed | | 5.000% | | 10/1/2043 | | | 163,244 | |
| | 263,975 | | | Loan ID 200985 | | Fixed | | 4.250% | | 12/1/2044 | | | 249,878 | |
| | 156,254 | | | Loan ID 200986 | | Fixed | | 4.250% | | 12/1/2044 | | | 164,067 | |
| | 116,292 | | | Loan ID 200987 | | Fixed | | 4.625% | | 10/1/2044 | | | 121,964 | |
| | 222,853 | | | Loan ID 200989 | | Fixed | | 3.750% | | 6/1/2029 | | | 215,173 | |
| | 290,338 | | | Loan ID 200992 | | Fixed | | 4.125% | | 5/1/2043 | | | 304,855 | |
| | 172,500 | | | Loan ID 200993 | | Fixed | | 2.004% | | 7/15/2049 | | | 152,681 | |
| | 205,397 | | | Loan ID 200994 | | Fixed | | 4.125% | | 5/1/2053 | | | 203,273 | |
| | 200,393 | | | Loan ID 200995 | | Fixed | | 2.750% | | 5/1/2047 | | | 121,436 | |
| | 57,563 | | | Loan ID 200996 | | Fixed | | 2.500% | | 8/1/2048 | | | 41,784 | |
| | | | | | | | | | | | | | | |
The accompanying notes are an integral part of these financial statements.
| Vertical Capital Income Fund |
| PORTFOLIO OF INVESTMENTS (Continued) |
| September 30, 2016 |
| Principal | | | | | Loan Type | | Interest Rate | | Maturity | | Value | |
| | | | | MORTGAGE NOTES (Continued) - 93.2% | | | | | | | | | | |
| $ | 99,599 | | | Loan ID 200997 | | Fixed | | 2.000% | | 3/1/2051 | | $ | 72,116 | |
| | 369,822 | | | Loan ID 200998 | | Fixed | | 3.875% | | 12/1/2050 | | | 341,301 | |
| | 98,153 | | | Loan ID 200999 | | Fixed | | 4.250% | | 4/1/2044 | | | 98,153 | |
| | 74,795 | | | Loan ID 201000 | | Fixed | | 5.125% | | 2/1/2039 | | | 73,257 | |
| | 107,698 | | | Loan ID 201001 | | Fixed | | 7.413% | | 9/1/2037 | | | 43,773 | |
| | 33,348 | | | Loan ID 201002 | | Fixed | | 0.000% | | 10/1/2024 | | | 35,015 | |
| | 132,966 | | | Loan ID 201005 | | Fixed | | 4.750% | | 7/1/2041 | | | 139,614 | |
| | 44,242 | | | Loan ID 201006 | | Fixed | | 6.875% | | 3/1/2038 | | | 46,454 | |
| | 83,521 | | | Loan ID 201007 | | Fixed | | 7.125% | | 4/1/2037 | | | 87,697 | |
| | 78,595 | | | Loan ID 201008 | | Fixed | | 7.125% | | 10/1/2038 | | | 82,525 | |
| | 72,916 | | | Loan ID 201009 | | Fixed | | 0.000% | | 4/1/2033 | | | 76,561 | |
| | 82,394 | | | Loan ID 201010 | | Fixed | | 5.500% | | 4/1/2039 | | | 82,394 | |
| | 44,454 | | | Loan ID 201011 | | Fixed | | 0.000% | | 2/1/2023 | | | 46,676 | |
| | 47,153 | | | Loan ID 201012 | | Fixed | | 7.500% | | 12/1/2038 | | | 49,511 | |
| | 57,310 | | | Loan ID 201013 | | Fixed | | 7.500% | | 12/1/2038 | | | 50,905 | |
| | 94,788 | | | Loan ID 201014 | | Fixed | | 0.000% | | 2/1/2033 | | | 99,527 | |
| | 17,107 | | | Loan ID 201015 | | Fixed | | 0.000% | | 3/29/2021 | | | 17,955 | |
| | 108,867 | | | Loan ID 201016 | | Fixed | | 6.500% | | 2/1/2036 | | | 111,537 | |
| | 26,971 | | | Loan ID 201017 | | Fixed | | 0.000% | | 4/1/2032 | | | 28,320 | |
| | 318,928 | | | Loan ID 201018 | | Fixed | | 6.750% | | 6/1/2037 | | | 334,874 | |
| | 100,670 | | | Loan ID 201019 | | ARM | | 2.875% | | 2/1/2037 | | | 105,704 | |
| | 99,469 | | | Loan ID 201020 | | Fixed | | 0.000% | | 10/1/2034 | | | 104,443 | |
| | 105,838 | | | Loan ID 201021 | | Fixed | | 6.870% | | 8/1/2047 | | | 111,130 | |
| | 81,774 | | | Loan ID 201022 | | ARM | | 3.125% | | 5/1/2037 | | | 65,350 | |
| | 145,668 | | | Loan ID 201023 | | Fixed | | 6.450% | | 2/1/2036 | | | 124,531 | |
| | 100,986 | | | Loan ID 201024 | | Fixed | | 9.000% | | 3/1/2037 | | | 106,036 | |
| | 188,790 | | | Loan ID 201025 | | ARM | | 2.875% | | 1/1/2042 | | | 180,123 | |
| | 82,606 | | | Loan ID 201026 | | Fixed | | 7.750% | | 12/1/2035 | | | 47,428 | |
| | 107,716 | | | Loan ID 201027 | | Fixed | | 9.538% | | 3/1/2037 | | | 113,102 | |
| | 171,735 | | | Loan ID 201028 | | Fixed | | 4.625% | | 4/1/2044 | | | 180,322 | |
| | 105,503 | | | Loan ID 201030 | | Fixed | | 5.000% | | 7/1/2042 | | | 110,778 | |
| | 144,446 | | | Loan ID 201032 | | Fixed | | 4.500% | | 11/1/2044 | | | 107,567 | |
| | 291,788 | | | Loan ID 201033 | | Fixed | | 4.125% | | 12/1/2044 | | | 302,815 | |
| | 104,837 | | | Loan ID 201035 | | Fixed | | 4.375% | | 9/1/2044 | | | 63,302 | |
| | 98,616 | | | Loan ID 201036 | | Fixed | | 4.375% | | 12/1/2044 | | | 93,729 | |
| | 70,106 | | | Loan ID 201037 | | Fixed | | 8.250% | | 7/1/2039 | | | 73,611 | |
| | 112,620 | | | Loan ID 201038 | | Fixed | | 8.250% | | 5/1/2039 | | | 59,755 | |
| | 462,886 | | | Loan ID 201039 | | ARM | | 4.500% | | 10/1/2045 | | | 292,013 | |
| | 279,729 | | | Loan ID 201040 | | Fixed | | 3.000% | | 11/1/2045 | | | 212,198 | |
| | 92,214 | | | Loan ID 201041 | | Fixed | | 3.750% | | 11/1/2052 | | | 76,363 | |
| | 119,377 | | | Loan ID 201043 | | Fixed | | 4.000% | | 4/1/2039 | | | 113,587 | |
| | 186,605 | | | Loan ID 201044 | | Fixed | | 4.870% | | 3/29/2037 | | | 195,935 | |
| | 113,886 | | | Loan ID 201045 | | Fixed | | 2.000% | | 7/1/2037 | | | 105,668 | |
| | 267,655 | | | Loan ID 201046 | | Fixed | | 2.000% | | 4/1/2053 | | | 203,911 | |
| | | | | | | | | | | | | | | |
The accompanying notes are an integral part of these financial statements.
| Vertical Capital Income Fund |
| PORTFOLIO OF INVESTMENTS (Continued) |
| September 30, 2016 |
| Principal | | | | | Loan Type | | Interest Rate | | Maturity | | Value | |
| | | | | MORTGAGE NOTES (Continued) - 93.2 % | | | | | | | | | | |
| $ | 110,337 | | | Loan ID 201047 | | Fixed | | 3.000% | | 4/1/2053 | | $ | 83,163 | |
| | 176,205 | | | Loan ID 201048 | | Fixed | | 2.000% | | 4/1/2052 | | | 125,083 | |
| | 488,685 | | | Loan ID 201049 | | Fixed | | 2.000% | | 4/1/2052 | | | 325,704 | |
| | 651,716 | | | Loan ID 201050 | | Fixed | | 2.000% | | 8/1/2053 | | | 399,180 | |
| | 275,156 | | | Loan ID 201051 | | Fixed | | 3.174% | | 9/1/2053 | | | 229,742 | |
| | 130,646 | | | Loan ID 201052 | | Fixed | | 3.000% | | 4/1/2053 | | | 59,726 | |
| | 66,327 | | | Loan ID 201053 | | Fixed | | 3.860% | | 7/1/2053 | | | 57,071 | |
| | 215,529 | | | Loan ID 201054 | | Fixed | | 2.400% | | 5/17/2050 | | | 196,237 | |
| | 603,507 | | | Loan ID 201056 | | Fixed | | 2.000% | | 7/1/2054 | | | 553,379 | |
| | 171,141 | | | Loan ID 201057 | | Fixed | | 2.000% | | 1/1/2050 | | | 155,768 | |
| | 139,047 | | | Loan ID 201058 | | Fixed | | 2.500% | | 8/1/2037 | | | 102,474 | |
| | 136,656 | | | Loan ID 201059 | | Fixed | | 2.000% | | 4/1/2053 | | | 126,804 | |
| | 117,126 | | | Loan ID 201060 | | ARM | | 3.375% | | 7/1/2035 | | | 76,880 | |
| | 87,990 | | | Loan ID 201061 | | Fixed | | 4.000% | | 3/1/2050 | | | 59,573 | |
| | 121,841 | | | Loan ID 201062 | | Fixed | | 3.100% | | 4/1/2047 | | | 120,872 | |
| | 126,883 | | | Loan ID 201063 | | Fixed | | 4.000% | | 9/1/2047 | | | 110,079 | |
| | 51,340 | | | Loan ID 201064 | | Fixed | | 2.000% | | 12/1/2052 | | | 41,789 | |
| | 217,106 | | | Loan ID 201065 | | Fixed | | 3.000% | | 7/1/2037 | | | 170,596 | |
| | 235,032 | | | Loan ID 201066 | | Fixed | | 4.250% | | 12/1/2046 | | | 246,784 | |
| | 444,133 | | | Loan ID 201067 | | Fixed | | 4.750% | | 1/1/2044 | | | 434,095 | |
| | 303,790 | | | Loan ID 201068 | | Fixed | | 5.250% | | 5/1/2044 | | | 318,979 | |
| | 70,478 | | | Loan ID 201069 | | Fixed | | 4.625% | | 12/1/2044 | | | 73,155 | |
| | 628,929 | | | Loan ID 201070 | | Fixed | | 4.250% | | 2/1/2045 | | | 657,872 | |
| | 181,044 | | | Loan ID 201071 | | Fixed | | 4.625% | | 11/1/2044 | | | 172,114 | |
| | 119,855 | | | Loan ID 201072 | | Fixed | | 3.500% | | 3/1/2028 | | | 98,168 | |
| | 50,129 | | | Loan ID 201073 | | Fixed | | 3.125% | | 4/1/2023 | | | 50,130 | |
| | 97,742 | | | Loan ID 201075 | | Fixed | | 4.375% | | 10/1/2044 | | | 101,867 | |
| | 129,557 | | | Loan ID 201076 | | Fixed | | 3.500% | | 12/1/2042 | | | 130,610 | |
| | 138,013 | | | Loan ID 201077 | | Fixed | | 3.625% | | 7/1/2044 | | | 124,877 | |
| | 268,228 | | | Loan ID 201081 | | ARM | | 3.000% | | 10/1/2044 | | | 275,455 | |
| | 125,708 | | | Loan ID 201082 | | Fixed | | 3.875% | | 12/1/2044 | | | 114,247 | |
| | 373,769 | | | Loan ID 201083 | | Fixed | | 5.375% | | 2/1/2044 | | | 187,315 | |
| | 231,187 | | | Loan ID 201084 | | Fixed | | 5.000% | | 8/1/2038 | | | 242,746 | |
| | 149,822 | | | Loan ID 201086 | | Fixed | | 4.625% | | 11/1/2044 | | | 144,295 | |
| | 273,958 | | | Loan ID 201089 | | Fixed | | 4.000% | | 8/1/2044 | | | 229,927 | |
| | 255,789 | | | Loan ID 201090 | | Fixed | | 3.625% | | 11/1/2044 | | | 262,014 | |
| | 162,092 | | | Loan ID 201091 | | Fixed | | 4.125% | | 1/1/2045 | | | 151,165 | |
| | 261,620 | | | Loan ID 201092 | | Fixed | | 5.250% | | 4/1/2046 | | | 274,701 | |
| | 139,883 | | | Loan ID 201093 | | Fixed | | 4.125% | | 9/1/2043 | | | 72,194 | |
| | 154,450 | | | Loan ID 201094 | | Fixed | | 4.550% | | 3/1/2044 | | | 147,654 | |
| | 237,828 | | | Loan ID 201095 | | Fixed | | 3.875% | | 8/1/2044 | | | 223,480 | |
| | 240,063 | | | Loan ID 201097 | | Fixed | | 3.990% | | 1/1/2045 | | | 217,860 | |
| | 149,950 | | | Loan ID 201099 | | Fixed | | 2.875% | | 3/1/2030 | | | 141,865 | |
| | 99,113 | | | Loan ID 201100 | | Fixed | | 4.125% | | 7/1/2043 | | | 104,069 | |
| | | | | | | | | | | | | | | |
The accompanying notes are an integral part of these financial statements.
| Vertical Capital Income Fund |
| PORTFOLIO OF INVESTMENTS (Continued) |
| September 30, 2016 |
| Principal | | | | | Loan Type | | Interest Rate | | Maturity | | Value | |
| | | | | MORTGAGE NOTES (Continued) - 93.2 % | | | | | | | | | | |
| $ | 356,029 | | | Loan ID 201101 | | Fixed | | 4.625% | | 3/1/2045 | | $ | 336,121 | |
| | 158,205 | | | Loan ID 201103 | | ARM | | 2.875% | | 5/1/2044 | | | 161,986 | |
| | 162,984 | | | Loan ID 201104 | | Fixed | | 4.375% | | 4/1/2045 | | | 152,946 | |
| | 299,329 | | | Loan ID 201105 | | Fixed | | 4.250% | | 11/1/2044 | | | 313,420 | |
| | 81,623 | | | Loan ID 201107 | | Fixed | | 5.150% | | 2/1/2036 | | | 80,397 | |
| | 154,167 | | | Loan ID 201108 | | Fixed | | 4.750% | | 2/1/2054 | | | 149,072 | |
| | 542,238 | | | Loan ID 201110 | | ARM | | 3.875% | | 4/1/2037 | | | 351,485 | |
| | 162,271 | | | Loan ID 201111 | | Fixed | | 4.000% | | 4/1/2050 | | | 86,188 | |
| | 252,960 | | | Loan ID 201112 | | Fixed | | 4.750% | | 8/1/2037 | | | 226,397 | |
| | 79,070 | | | Loan ID 201113 | | Fixed | | 5.750% | | 12/1/2052 | | | 83,023 | |
| | 110,936 | | | Loan ID 201114 | | Fixed | | 8.087% | | 5/1/2054 | | | 68,664 | |
| | 514,669 | | | Loan ID 201115 | | Fixed | | 4.000% | | 2/1/2051 | | | 481,040 | |
| | 82,756 | | | Loan ID 201116 | | Fixed | | 4.250% | | 10/1/2052 | | | 38,246 | |
| | 129,773 | | | Loan ID 201117 | | Fixed | | 4.500% | | 11/1/2037 | | | 89,964 | |
| | 247,582 | | | Loan ID 201118 | | Fixed | | 2.000% | | 11/1/2054 | | | 135,960 | |
| | 131,536 | | | Loan ID 201119 | | Fixed | | 4.000% | | 5/1/2034 | | | 133,341 | |
| | 53,912 | | | Loan ID 201120 | | Fixed | | 4.500% | | 4/1/2037 | | | 47,807 | |
| | 93,687 | | | Loan ID 201121 | | Fixed | | 3.000% | | 10/1/2037 | | | 69,318 | |
| | 86,639 | | | Loan ID 201122 | | Fixed | | 4.750% | | 11/1/2048 | | | 83,942 | |
| | 174,190 | | | Loan ID 201123 | | Fixed | | 3.000% | | 7/1/2054 | | | 46,892 | |
| | 252,361 | | | Loan ID 201124 | | Fixed | | 4.750% | | 4/1/2040 | | | 221,206 | |
| | 440,026 | | | Loan ID 201126 | | Fixed | | 6.500% | | 4/1/2049 | | | 236,591 | |
| | 82,790 | | | Loan ID 201127 | | ARM | | 2.750% | | 4/1/2037 | | | 26,844 | |
| | 279,677 | | | Loan ID 201128 | | Fixed | | 2.000% | | 10/1/2036 | | | 153,148 | |
| | 160,663 | | | Loan ID 201129 | | Fixed | | 4.875% | | 6/1/2051 | | | 156,064 | |
| | 123,838 | | | Loan ID 201130 | | Fixed | | 4.850% | | 2/1/2038 | | | 123,838 | |
| | 120,586 | | | Loan ID 201131 | | Fixed | | 5.353% | | 5/1/2053 | | | 109,553 | |
| | 171,612 | | | Loan ID 201132 | | Fixed | | 3.000% | | 7/1/2037 | | | 128,787 | |
| | 154,252 | | | Loan ID 201133 | | Fixed | | 2.000% | | 6/1/2051 | | | 116,028 | |
| | 200,530 | | | Loan ID 201134 | | Fixed | | 2.000% | | 10/1/2053 | | | 141,215 | |
| | 533,991 | | | Loan ID 201135 | | Fixed | | 2.000% | | 6/1/2051 | | | 430,889 | |
| | 526,947 | | | Loan ID 201136 | | Fixed | | 2.000% | | 2/1/2036 | | | 458,641 | |
| | 292,190 | | | Loan ID 201137 | | Fixed | | 2.000% | | 12/1/2052 | | | 221,612 | |
| | 60,419 | | | Loan ID 201138 | | Fixed | | 4.250% | | 3/1/2034 | | | 50,730 | |
| | 164,122 | | | Loan ID 201139 | | Fixed | | 2.000% | | 11/1/2053 | | | 125,535 | |
| | 159,519 | | | Loan ID 201140 | | Fixed | | 4.870% | | 1/1/2038 | | | 154,931 | |
| | 143,843 | | | Loan ID 201141 | | Fixed | | 2.000% | | 5/1/2052 | | | 107,632 | |
| | 450,559 | | | Loan ID 201142 | | Fixed | | 2.000% | | 9/1/2035 | | | 356,782 | |
| | 91,059 | | | Loan ID 201143 | | Fixed | | 2.000% | | 11/1/2037 | | | 84,684 | |
| | 103,175 | | | Loan ID 201144 | | Fixed | | 3.000% | | 9/1/2045 | | | 90,960 | |
| | 230,500 | | | Loan ID 201145 | | Fixed | | 4.375% | | 4/1/2051 | | | 219,508 | |
| | 133,567 | | | Loan ID 201146 | | Fixed | | 4.875% | | 8/1/2054 | | | 120,002 | |
| | 110,605 | | | Loan ID 201147 | | Fixed | | 2.000% | | 11/1/2051 | | | 90,177 | |
| | 98,568 | | | Loan ID 201148 | | Fixed | | 3.950% | | 10/1/2042 | | | 92,036 | |
| | | | | | | | | | | | | | | |
The accompanying notes are an integral part of these financial statements.
| Vertical Capital Income Fund |
| PORTFOLIO OF INVESTMENTS (Continued) |
| September 30, 2016 |
| Principal | | | | | Loan Type | | Interest Rate | | Maturity | | Value | |
| | | | | MORTGAGE NOTES (Continued) - 93.2 % | | | | | | | | | | |
| $ | 279,690 | | | Loan ID 201149 | | Fixed | | 5.719% | | 6/1/2051 | | $ | 215,765 | |
| | 103,463 | | | Loan ID 201150 | | Fixed | | 2.000% | | 7/1/2037 | | | 93,066 | |
| | 479,473 | | | Loan ID 201152 | | Fixed | | 2.000% | | 8/1/2050 | | | 411,065 | |
| | 250,771 | | | Loan ID 201153 | | Fixed | | 4.000% | | 6/1/2050 | | | 182,833 | |
| | 62,272 | | | Loan ID 201154 | | ARM | | 3.500% | | 11/1/2041 | | | 65,386 | |
| | 96,306 | | | Loan ID 201155 | | Fixed | | 2.000% | | 11/1/2053 | | | 63,890 | |
| | 64,918 | | | Loan ID 201156 | | Fixed | | 4.000% | | 4/1/2050 | | | 47,009 | |
| | 292,248 | | | Loan ID 201157 | | Fixed | | 4.000% | | 3/1/2055 | | | 305,966 | |
| | 296,999 | | | Loan ID 201158 | | Fixed | | 2.000% | | 8/1/2052 | | | 239,794 | |
| | 71,364 | | | Loan ID 201159 | | Fixed | | 2.000% | | 6/1/2039 | | | 23,301 | |
| | 204,091 | | | Loan ID 201160 | | Fixed | | 4.000% | | 10/1/2049 | | | 114,951 | |
| | 297,316 | | | Loan ID 201161 | | Fixed | | 3.000% | | 6/1/2054 | | | 157,685 | |
| | 143,746 | | | Loan ID 201162 | | Fixed | | 2.125% | | 12/1/2052 | | | 95,870 | |
| | 384,451 | | | Loan ID 201163 | | Fixed | | 4.000% | | 12/1/2049 | | | 187,858 | |
| | 166,362 | | | Loan ID 201164 | | Fixed | | 3.000% | | 11/1/2051 | | | 136,128 | |
| | 114,490 | | | Loan ID 201165 | | Fixed | | 4.750% | | 1/1/2044 | | | 120,215 | |
| | 120,160 | | | Loan ID 201166 | | Fixed | | 2.000% | | 12/1/2054 | | | 99,501 | |
| | 438,189 | | | Loan ID 201168 | | Fixed | | 2.000% | | 4/1/2052 | | | 350,466 | |
| | 110,773 | | | Loan ID 201169 | | Fixed | | 5.934% | | 9/1/2037 | | | 105,063 | |
| | 67,991 | | | Loan ID 201170 | | Fixed | | 4.365% | | 7/1/2037 | | | 55,101 | |
| | 69,755 | | | Loan ID 201171 | | Fixed | | 2.000% | | 5/1/2051 | | | 55,464 | |
| | 104,885 | | | Loan ID 201172 | | Fixed | | 4.000% | | 6/1/2050 | | | 82,232 | |
| | 109,641 | | | Loan ID 201173 | | Fixed | | 2.000% | | 11/1/2047 | | | 26,249 | |
| | 148,956 | | | Loan ID 201174 | | Fixed | | 4.750% | | 1/1/2053 | | | 146,877 | |
| | 64,594 | | | Loan ID 201175 | | Fixed | | 4.000% | | 9/1/2044 | | | 56,940 | |
| | 135,646 | | | Loan ID 201176 | | Fixed | | 4.250% | | 8/1/2053 | | | 128,876 | |
| | 269,053 | | | Loan ID 201177 | | Fixed | | 2.000% | | 7/1/2046 | | | 223,354 | |
| | 308,265 | | | Loan ID 201178 | | Fixed | | 3.193% | | 6/1/2051 | | | 129,145 | |
| | 302,516 | | | Loan ID 201179 | | Fixed | | 3.000% | | 5/1/2051 | | | 175,559 | |
| | 419,345 | | | Loan ID 201180 | | Fixed | | 2.000% | | 6/1/2053 | | | 357,908 | |
| | 319,672 | | | Loan ID 201181 | | Fixed | | 4.500% | | 4/1/2034 | | | 292,122 | |
| | 51,475 | | | Loan ID 201182 | | Fixed | | 3.290% | | 3/1/2034 | | | 41,257 | |
| | 135,752 | | | Loan ID 201183 | | Fixed | �� | 2.375% | | 10/1/2052 | | | 103,658 | |
| | 64,134 | | | Loan ID 201184 | | Fixed | | 4.000% | | 6/1/2049 | | | 67,080 | |
| | 261,114 | | | Loan ID 201185 | | Fixed | | 5.760% | | 10/1/2053 | | | 274,169 | |
| | 82,720 | | | Loan ID 201187 | | Fixed | | 2.000% | | 11/1/2048 | | | 45,673 | |
| | 626,909 | | | Loan ID 201188 | | Fixed | | 2.000% | | 8/1/2052 | | | 449,306 | |
| | 105,541 | | | Loan ID 201189 | | Fixed | | 4.500% | | 12/1/2051 | | | 110,818 | |
| | 161,115 | | | Loan ID 201190 | | Fixed | | 4.250% | | 6/1/2051 | | | 169,171 | |
| | 212,664 | | | Loan ID 201191 | | Fixed | | 3.000% | | 2/1/2037 | | | 206,763 | |
| | 117,776 | | | Loan ID 201192 | | Fixed | | 2.000% | | 2/1/2051 | | | 104,230 | |
| | 232,449 | | | Loan ID 201193 | | Fixed | | 3.000% | | 5/1/2051 | | | 131,614 | |
| | 329,911 | | | Loan ID 201194 | | Fixed | | 2.000% | | 6/1/2054 | | | 244,644 | |
| | 148,113 | | | Loan ID 201195 | | Fixed | | 3.500% | | 5/1/2036 | | | 127,134 | |
| | | | | | | | | | | | | | | |
The accompanying notes are an integral part of these financial statements.
| Vertical Capital Income Fund |
| PORTFOLIO OF INVESTMENTS (Continued) |
| September 30, 2016 |
| Principal | | | | | Loan Type | | Interest Rate | | Maturity | | Value | |
| | | | | MORTGAGE NOTES (Continued) - 93.2 % | | | | | | | | | | |
| $ | 640,373 | | | Loan ID 201196 | | Fixed | | 2.000% | | 11/1/2036 | | $ | 525,622 | |
| | 178,477 | | | Loan ID 201197 | | Fixed | | 5.125% | | 8/1/2037 | | | 163,793 | |
| | 51,310 | | | Loan ID 201198 | | Fixed | | 4.125% | | 9/1/2053 | | | 53,725 | |
| | 339,506 | | | Loan ID 201199 | | Fixed | | 3.000% | | 11/1/2046 | | | 268,326 | |
| | 293,204 | | | Loan ID 201200 | | Fixed | | 4.500% | | 3/1/2044 | | | 286,601 | |
| | 295,021 | | | Loan ID 201201 | | Fixed | | 4.500% | | 8/1/2044 | | | 309,772 | |
| | 193,716 | | | Loan ID 201202 | | Fixed | | 3.750% | | 8/1/2044 | | | 172,672 | |
| | 127,459 | | | Loan ID 201203 | | Fixed | | 3.875% | | 12/1/2044 | | | 116,498 | |
| | 460,095 | | | Loan ID 201204 | | Fixed | | 3.750% | | 4/1/2045 | | | 474,307 | |
| | 152,230 | | | Loan ID 201205 | | Fixed | | 4.625% | | 1/1/2045 | | | 157,877 | |
| | 132,573 | | | Loan ID 201206 | | Fixed | | 3.990% | | 4/1/2045 | | | 138,058 | |
| | 425,231 | | | Loan ID 201207 | | Fixed | | 4.625% | | 8/1/2051 | | | 398,382 | |
| | 117,533 | | | Loan ID 201208 | | Fixed | | 4.625% | | 4/1/2045 | | | 117,533 | |
| | 182,572 | | | Loan ID 201209 | | Fixed | | 4.250% | | 4/1/2045 | | | 181,752 | |
| | 175,987 | | | Loan ID 201210 | | Fixed | | 3.500% | | 12/1/2042 | | | 144,678 | |
| | 132,112 | | | Loan ID 201211 | | Fixed | | 4.125% | | 7/1/2044 | | | 125,285 | |
| | 367,806 | | | Loan ID 201212 | | Fixed | | 4.625% | | 3/1/2045 | | | 261,260 | |
| | 203,391 | | | Loan ID 201213 | | Fixed | | 4.875% | | 8/1/2044 | | | 207,989 | |
| | 560,203 | | | Loan ID 201214 | | ARM | | 2.875% | | 9/1/2043 | | | 497,704 | |
| | 272,106 | | | Loan ID 201216 | | Fixed | | 3.500% | | 2/1/2043 | | | 244,664 | |
| | 103,921 | | | Loan ID 201217 | | Fixed | | 3.875% | | 5/1/2045 | | | 97,850 | |
| | 128,885 | | | Loan ID 201218 | | Fixed | | 4.125% | | 1/1/2045 | | | 119,713 | |
| | 69,876 | | | Loan ID 201219 | | Fixed | | 4.000% | | 7/1/2044 | | | 71,955 | |
| | 295,961 | | | Loan ID 201220 | | Fixed | | 4.125% | | 8/1/2045 | | | 270,118 | |
| | 67,146 | | | Loan ID 201221 | | Fixed | | 3.250% | | 5/1/2043 | | | 57,795 | |
| | 48,841 | | | Loan ID 201222 | | Fixed | | 5.125% | | 1/1/2045 | | | 49,372 | |
| | 230,614 | | | Loan ID 201223 | | Fixed | | 3.875% | | 4/1/2030 | | | 241,728 | |
| | 254,021 | | | Loan ID 201224 | | Fixed | | 4.625% | | 9/1/2044 | | | 266,722 | |
| | 62,202 | | | Loan ID 201226 | | Fixed | | 5.000% | | 3/1/2045 | | | 65,265 | |
| | 179,617 | | | Loan ID 201227 | | Fixed | | 5.125% | | 3/1/2045 | | | 186,249 | |
| | 66,515 | | | Loan ID 201228 | | Fixed | | 4.625% | | 3/1/2045 | | | 68,184 | |
| | 102,601 | | | Loan ID 201229 | | Fixed | | 3.250% | | 7/1/2024 | | | 103,923 | |
| | 205,053 | | | Loan ID 201230 | | Fixed | | 3.875% | | 3/1/2045 | | | 207,907 | |
| | 209,833 | | | Loan ID 201231 | | Fixed | | 4.250% | | 8/1/2045 | | | 213,175 | |
| | 126,574 | | | Loan ID 201232 | | Fixed | | 4.500% | | 1/1/2045 | | | 127,627 | |
| | 262,524 | | | Loan ID 201233 | | Fixed | | 4.500% | | 12/1/2044 | | | 250,180 | |
| | 204,351 | | | Loan ID 201234 | | Fixed | | 5.000% | | 10/1/2045 | | | 195,333 | |
| | 93,934 | | | Loan ID 201235 | | Fixed | | 3.750% | | 7/1/2045 | | | 94,119 | |
| | 68,932 | | | Loan ID 201236 | | Fixed | | 5.250% | | 2/1/2044 | | | 72,378 | |
| | 241,993 | | | Loan ID 201237 | | Fixed | | 3.750% | | 5/1/2045 | | | 245,596 | |
| | 203,453 | | | Loan ID 201238 | | Fixed | | 5.125% | | 12/1/2044 | | | 213,625 | |
| | 191,455 | | | Loan ID 201239 | | Fixed | | 4.500% | | 3/1/2045 | | | 201,028 | |
| | 161,027 | | | Loan ID 201240 | | Fixed | | 4.250% | | 10/1/2045 | | | 168,406 | |
| | 301,856 | | | Loan ID 201241 | | Fixed | | 4.375% | | 7/1/2045 | | | 314,331 | |
| | | | | | | | | | | | | | | |
The accompanying notes are an integral part of these financial statements.
| Vertical Capital Income Fund |
| PORTFOLIO OF INVESTMENTS (Continued) |
| September 30, 2016 |
| Principal | | | | | Loan Type | | Interest Rate | | Maturity | | Value | |
| | | | | MORTGAGE NOTES (Continued) - 93.2 % | | | | | | | | | | |
| $ | 230,765 | | | Loan ID 201242 | | Fixed | | 4.625% | | 11/1/2044 | | $ | 241,256 | |
| | 112,995 | | | Loan ID 201243 | | Fixed | | 4.625% | | 11/1/2045 | | | 115,022 | |
| | 408,003 | | | Loan ID 201244 | | Fixed | | 4.500% | | 6/1/2045 | | | 381,433 | |
| | 117,921 | | | Loan ID 201245 | | Fixed | | 4.750% | | 8/1/2044 | | | 113,488 | |
| | 324,298 | | | Loan ID 201246 | | Fixed | | 4.750% | | 1/1/2045 | | | 314,778 | |
| | 190,300 | | | Loan ID 201247 | | Fixed | | 4.250% | | 5/1/2045 | | | 157,631 | |
| | 102,740 | | | Loan ID 201248 | | Fixed | | 4.875% | | 7/1/2044 | | | 107,331 | |
| | 473,252 | | | Loan ID 201249 | | Fixed | | 4.625% | | 8/1/2045 | | | 433,194 | |
| | 64,733 | | | Loan ID 201250 | | Fixed | | 4.250% | | 10/1/2045 | | | 66,799 | |
| | 133,471 | | | Loan ID 201251 | | Fixed | | 4.500% | | 8/1/2045 | | | 124,920 | |
| | 12,501 | | | Loan ID 201253 | | ARM | | 8.750% | | 3/1/2019 | | | 13,127 | |
| | 164,102 | | | Loan ID 201254 | | ARM | | 6.840% | | 9/1/2034 | | | 172,307 | |
| | 250,937 | | | Loan ID 201255 | | ARM | | 7.000% | | 6/1/2035 | | | 263,484 | |
| | 41,615 | | | Loan ID 201256 | | ARM | | 10.500% | | 10/1/2021 | | | 43,696 | |
| | 244,817 | | | Loan ID 201257 | | Fixed | | 4.500% | | 5/1/2044 | | | 256,580 | |
| | 92,929 | | | Loan ID 201258 | | Fixed | | 4.500% | | 6/1/2045 | | | 78,368 | |
| | 121,051 | | | Loan ID 201259 | | Fixed | | 4.625% | | 1/1/2046 | | | 99,833 | |
| | 175,244 | | | Loan ID 201260 | | Fixed | | 4.750% | | 9/1/2045 | | | 183,775 | |
| | 102,237 | | | Loan ID 201261 | | Fixed | | 4.125% | | 6/1/2045 | | | 105,791 | |
| | 61,979 | | | Loan ID 201262 | | Fixed | | 4.200% | | 1/1/2046 | | | 63,943 | |
| | 51,295 | | | Loan ID 201263 | | Fixed | | 4.750% | | 10/1/2045 | | | 43,251 | |
| | 191,094 | | | Loan ID 201264 | | Fixed | | 5.000% | | 3/1/2045 | | | 118,992 | |
| | 365,276 | | | Loan ID 201265 | | Fixed | | 4.750% | | 6/1/2045 | | | 373,460 | |
| | 148,804 | | | Loan ID 201266 | | Fixed | | 4.500% | | 2/1/2046 | | | 148,271 | |
| | 190,829 | | | Loan ID 201267 | | Fixed | | 4.875% | | 12/1/2045 | | | 190,084 | |
| | 242,095 | | | Loan ID 201268 | | Fixed | | 4.250% | | 6/1/2045 | | | 252,274 | |
| | 127,413 | | | Loan ID 201269 | | Fixed | | 4.375% | | 12/1/2045 | | | 82,954 | |
| | 156,061 | | | Loan ID 201270 | | Fixed | | 4.125% | | 2/1/2045 | | | 146,047 | |
| | 260,521 | | | Loan ID 201271 | | Fixed | | 4.500% | | 6/1/2045 | | | 243,300 | |
| | 142,782 | | | Loan ID 201272 | | Fixed | | 4.750% | | 11/1/2044 | | | 146,293 | |
| | 245,977 | | | Loan ID 201273 | | Fixed | | 4.500% | | 12/1/2045 | | | 249,169 | |
| | 223,067 | | | Loan ID 201274 | | Fixed | | 4.125% | | 10/1/2045 | | | 206,045 | |
| | 575,930 | | | Loan ID 201276 | | Fixed | | 4.000% | | 11/1/2045 | | | 604,727 | |
| | 197,482 | | | Loan ID 201278 | | Fixed | | 3.750% | | 12/1/2045 | | | 169,787 | |
| | 321,501 | | | Loan ID 201279 | | Fixed | | 4.875% | | 3/1/2046 | | | 250,791 | |
| | 377,976 | | | Loan ID 201280 | | Fixed | | 4.500% | | 4/1/2046 | | | 366,877 | |
| | 156,603 | | | Loan ID 201281 | | Fixed | | 4.875% | | 7/1/2044 | | | 164,434 | |
| | 131,918 | | | Loan ID 201282 | | Fixed | | 5.250% | | 1/1/2046 | | | 126,557 | |
| | 113,390 | | | Loan ID 201283 | | Fixed | | 4.250% | | 11/1/2045 | | | 115,928 | |
| | 144,472 | | | Loan ID 201284 | | Fixed | | 3.625% | | 2/1/2029 | | | 151,145 | |
| | 35,413 | | | Loan ID 201285 | | Fixed | | 4.625% | | 11/1/2028 | | | 37,184 | |
| | 112,598 | | | Loan ID 201286 | | Fixed | | 4.375% | | 12/1/2045 | | | 115,958 | |
| | 189,872 | | | Loan ID 201287 | | Fixed | | 3.625% | | 4/1/2046 | | | 191,605 | |
| | 126,757 | | | Loan ID 201288 | | Fixed | | 4.500% | | 2/1/2046 | | | 115,281 | |
| | | | | | | | | | | | | | | |
The accompanying notes are an integral part of these financial statements.
| Vertical Capital Income Fund |
| PORTFOLIO OF INVESTMENTS (Continued) |
| September 30, 2016 |
| Principal | | | | | Loan Type | | Interest Rate | | Maturity | | Value | |
| | | | | MORTGAGE NOTES (Continued) - 93.2 % | | | | | | | | | | |
| $ | 87,459 | | | Loan ID 201289 | | Fixed | | 4.000% | | 3/1/2045 | | $ | 89,434 | |
| | 254,748 | | | Loan ID 201290 | | Fixed | | 4.750% | | 7/1/2045 | | | 266,822 | |
| | 310,353 | | | Loan ID 201291 | | Fixed | | 5.000% | | 8/1/2045 | | | 316,576 | |
| | 83,285 | | | Loan ID 201292 | | Fixed | | 4.500% | | 5/1/2045 | | | 87,449 | |
| | 37,919 | | | Loan ID 201293 | | Fixed | | 4.875% | | 9/1/2045 | | | 39,005 | |
| | 129,469 | | | Loan ID 201294 | | Fixed | | 4.625% | | 2/1/2046 | | | 116,115 | |
| | 101,326 | | | Loan ID 201295 | | Fixed | | 4.500% | | 12/1/2045 | | | 83,055 | |
| | 780,319 | | | Loan ID 201296 | | Fixed | | 4.250% | | 2/1/2046 | | | 805,868 | |
| | 349,691 | | | Loan ID 201297 | | Fixed | | 4.875% | | 8/1/2045 | | | 367,176 | |
| | 156,231 | | | Loan ID 201298 | | Fixed | | 4.250% | | 8/1/2045 | | | 161,002 | |
| | 261,468 | | | Loan ID 201299 | | Fixed | | 4.250% | | 12/1/2045 | | | 203,794 | |
| | 201,452 | | | Loan ID 201300 | | Fixed | | 4.750% | | 3/1/2046 | | | 203,801 | |
| | 75,280 | | | Loan ID 201301 | | Fixed | | 4.550% | | 10/1/2044 | | | 77,233 | |
| | 139,114 | | | Loan ID 201302 | | Fixed | | 4.250% | | 5/1/2045 | | | 144,573 | |
| | 100,192 | | | Loan ID 201303 | | Fixed | | 3.875% | | 3/1/2045 | | | 102,889 | |
| | 234,810 | | | Loan ID 201304 | | Fixed | | 4.125% | | 2/1/2046 | | | 205,070 | |
| | 152,287 | | | Loan ID 201305 | | Fixed | | 4.625% | | 8/1/2044 | | | 157,092 | |
| | 120,761 | | | Loan ID 201306 | | Fixed | | 3.875% | | 9/1/2045 | | | 104,628 | |
| | 171,225 | | | Loan ID 201307 | | Fixed | | 4.250% | | 11/1/2045 | | | 155,187 | |
| | 64,523 | | | Loan ID 201308 | | Fixed | | 4.625% | | 11/1/2045 | | | 66,390 | |
| | 167,601 | | | Loan ID 201309 | | Fixed | | 4.000% | | 9/1/2045 | | | 110,865 | |
| | 192,005 | | | Loan ID 201310 | | Fixed | | 4.750% | | 9/1/2045 | | | 164,770 | |
| | 140,740 | | | Loan ID 201311 | | Fixed | | 4.375% | | 3/1/2046 | | | 139,842 | |
| | 174,051 | | | Loan ID 201312 | | Fixed | | 4.250% | | 2/1/2046 | | | 179,073 | |
| | 331,027 | | | Loan ID 201313 | | Fixed | | 4.625% | | 1/1/2046 | | | 336,066 | |
| | 115,710 | | | Loan ID 201315 | | Fixed | | 4.375% | | 9/1/2045 | | | 117,389 | |
| | 166,246 | | | Loan ID 201316 | | Fixed | | 4.500% | | 2/1/2046 | | | 127,797 | |
| | 170,551 | | | Loan ID 201317 | | Fixed | | 5.250% | | 2/1/2046 | | | 160,610 | |
| | 87,594 | | | Loan ID 201318 | | Fixed | | 4.750% | | 11/1/2045 | | | 74,865 | |
| | 177,213 | | | Loan ID 201319 | | Fixed | | 4.375% | | 10/1/2045 | | | 159,836 | |
| | 169,397 | | | Loan ID 201320 | | Fixed | | 4.000% | | 10/1/2045 | | | 173,726 | |
| | 99,824 | | | Loan ID 201321 | | Fixed | | 4.000% | | 1/1/2046 | | | 85,977 | |
| | 142,617 | | | Loan ID 201322 | | Fixed | | 4.750% | | 9/1/2045 | | | 147,745 | |
| | 126,980 | | | Loan ID 201323 | | Fixed | | 4.375% | | 7/1/2045 | | | 130,445 | |
| | 139,256 | | | Loan ID 201324 | | Fixed | | 5.250% | | 4/1/2046 | | | 124,675 | |
| | 213,831 | | | Loan ID 201325 | | Fixed | | 4.500% | | 5/1/2046 | | | 184,152 | |
| | 181,771 | | | Loan ID 201326 | | Fixed | | 4.625% | | 3/1/2046 | | | 161,424 | |
| | 214,630 | | | Loan ID 201327 | | Fixed | | 4.250% | | 9/1/2045 | | | 221,574 | |
| | 196,676 | | | Loan ID 201328 | | Fixed | | 4.250% | | 11/1/2045 | | | 172,492 | |
| | 164,368 | | | Loan ID 201329 | | Fixed | | 4.250% | | 11/1/2045 | | | 129,373 | |
| | 277,221 | | | Loan ID 201330 | | Fixed | | 4.375% | | 6/1/2046 | | | 252,888 | |
| | 365,294 | | | Loan ID 201331 | | Fixed | | 4.250% | | 10/1/2044 | | | 376,549 | |
| | 275,780 | | | Loan ID 201332 | | Fixed | | 4.000% | | 11/1/2045 | | | 239,004 | |
| | 358,973 | | | Loan ID 201333 | | Fixed | | 3.875% | | 1/1/2046 | | | 305,524 | |
| | | | | | | | | | | | | | | |
The accompanying notes are an integral part of these financial statements.
| Vertical Capital Income Fund |
| PORTFOLIO OF INVESTMENTS (Continued) |
| September 30, 2016 |
| Principal | | | | | Loan Type | | Interest Rate | | Maturity | | Value | |
| | | | | MORTGAGE NOTES (Continued) - 93.2% | | | | | | | | | | |
| $ | 398,393 | | | Loan ID 201334 | | Fixed | | 4.500% | | 3/1/2044 | | $ | 418,313 | |
| | 197,283 | | | Loan ID 201335 | | Fixed | | 4.750% | | 1/1/2046 | | | 203,040 | |
| | 195,031 | | | Loan ID 201336 | | Fixed | | 4.750% | | 1/1/2046 | | | 153,844 | |
| | 141,499 | | | Loan ID 201337 | | Fixed | | 9.500% | | 1/1/2046 | | | 148,574 | |
| | 141,240 | | | Loan ID 201338 | | Fixed | | 4.375% | | 10/1/2045 | | | 143,070 | |
| | 428,795 | | | Loan ID 201339 | | Fixed | | 4.625% | | 7/1/2045 | | | 369,501 | |
| | 127,485 | | | Loan ID 201340 | | Fixed | | 4.375% | | 7/1/2045 | | | 117,167 | |
| | 150,905 | | | Loan ID 201341 | | Fixed | | 4.050% | | 11/1/2045 | | | 135,284 | |
| | 148,760 | | | Loan ID 201342 | | Fixed | | 4.750% | | 7/1/2045 | | | 153,272 | |
| | 90,361 | | | Loan ID 201343 | | Fixed | | 4.250% | | 11/1/2045 | | | 92,089 | |
| | 75,439 | | | Loan ID 201344 | | Fixed | | 5.000% | | 7/1/2044 | | | 79,211 | |
| | 140,669 | | | Loan ID 201345 | | Fixed | | 4.125% | | 5/1/2045 | | | 125,912 | |
| | 482,975 | | | Loan ID 201347 | | Fixed | | 5.750% | | 5/1/2046 | | | 507,124 | |
| | 467,323 | | | Loan ID 201348 | | Fixed | | 6.500% | | 5/1/2046 | | | 490,689 | |
| | 243,410 | | | Loan ID 201349 | | Fixed | | 5.625% | | 2/1/2046 | | | 255,091 | |
| | 251,717 | | | Loan ID 201350 | | Fixed | | 4.000% | | 6/1/2045 | | | 230,249 | |
| | 64,349 | | | Loan ID 201351 | | Fixed | | 4.500% | | 4/1/2045 | | | 46,108 | |
| | 76,167 | | | Loan ID 201352 | | Fixed | | 4.875% | | 3/1/2045 | | | 78,891 | |
| | 507,739 | | | Loan ID 201353 | | ARM | | 3.875% | | 5/1/2046 | | | 532,492 | |
| | 525,055 | | | Loan ID 201354 | | Fixed | | 3.375% | | 7/1/2046 | | | 523,788 | |
| | 137,878 | | | Loan ID 201355 | | Fixed | | 5.250% | | 12/1/2045 | | | 141,568 | |
| | 107,180 | | | Loan ID 201356 | | Fixed | | 4.625% | | 10/1/2045 | | | 108,096 | |
| | 124,335 | | | Loan ID 201357 | | Fixed | | 4.750% | | 5/1/2046 | | | 120,096 | |
| | 154,716 | | | Loan ID 201358 | | Fixed | | 4.875% | | 7/1/2045 | | | 148,088 | |
| | 196,137 | | | Loan ID 201359 | | Fixed | | 4.250% | | 9/1/2045 | | | 200,101 | |
| | 287,468 | | | Loan ID 201360 | | Fixed | | 4.375% | | 9/1/2044 | | | 300,098 | |
| | 149,147 | | | Loan ID 201361 | | Fixed | | 5.250% | | 7/1/2044 | | | 156,605 | |
| | 120,288 | | | Loan ID 201362 | | Fixed | | 4.375% | | 4/1/2036 | | | 115,890 | |
| | 128,849 | | | Loan ID 201363 | | Fixed | | 4.250% | | 2/1/2046 | | | 102,439 | |
| | 115,978 | | | Loan ID 201364 | | Fixed | | 3.875% | | 4/1/2046 | | | 95,828 | |
| | 188,940,143 | | | TOTAL MORTGAGE NOTES (Cost - $150,396,153)* | ’ | | | | | 169,713,431 | |
| | | | | | | | | | | | | | | |
| | | | | OTHER INVESTMENTS* (Cost - $366,499)(a) - 0.2% | | | | | | 404,767 | |
| | | | | | | | | | | | | | | |
| | | | | TOTAL INVESTMENTS (Cost - $150,762,652)(a) - 93.4% | | | | | $ | 170,118,198 | |
| | | | | OTHER ASSETS IN EXCESS OF LIABILITIES - 6.6% | | | | | | 11,890,119 | |
| | | | | NET ASSETS - 100.0% | | | | | $ | 182,008,317 | |
| | | | | | | | | | | | | | | |
ARM - Adjustable Rate Mortgage
| ** | Non -income producing security. |
| (a) | Represents cost for financial reporting purposes. Aggregate cost for federal tax purposes is the same as there are no book to tax differences. |
| Unrealized appreciation: | | $ | 24,437,676 | |
| Unrealized depreciation: | | | (5,082,130 | ) |
| Net unrealized appreciation: | | $ | 19,355,546 | |
| | | | | |
The accompanying notes are an integral part of these financial statements.
| Vertical Capital Income Fund |
| Statement of Assets and Liabilities |
| September 30, 2016 |
| Assets: | | | | |
| Investments at Value (identified cost $150,762,652) | | $ | 170,118,198 | |
| Cash | | | 8,337,456 | |
| Interest Receivable | | | 2,024,096 | |
| Receivable for Securities Sold and Principal Paydowns | | | 703,275 | |
| Receivable for Fund Shares Sold | | | 108,950 | |
| Due from Investment Adviser | | | 1,314,486 | |
| Deferred Financing Fees, Net | | | 77,231 | |
| Prepaid Expenses and Other Assets | | | 829,331 | |
| Total Assets | | | 183,513,023 | |
| | | | | |
| Liabilities: | | | | |
| Related Party Payable | | | 26,234 | |
| Payable to Shareholders | | | 1,332,484 | |
| Accrued Expenses and Other Liabilities | | | 145,988 | |
| Total Liabilities | | | 1,504,706 | |
| | | | | |
| Net Assets | | $ | 182,008,317 | |
| | | | | |
| Composition of Net Assets: | | | | |
| At September 30, 2016, Net Assets consisted of: | | | | |
| Paid-in-Beneficial Interest | | $ | 161,234,616 | |
| Accumulated Net Investment Income | | | 25,559 | |
| Accumulated Net Realized Gain From Investments | | | 1,392,596 | |
| Net Unrealized Appreciation on Investments | | | 19,355,546 | |
| Net Assets | | $ | 182,008,317 | |
| | | | | |
| Net Asset Value Per Share | | | | |
| Net Assets | | $ | 182,008,317 | |
| Shares of Beneficial Interest Outstanding (no par value; unlimited shares authorized) | | | 14,581,202 | |
| Net Asset Value and Repurchase Price per Share (a) | | $ | 12.49 | |
| Offering Price per Share (Maximum sales charge of 4.50%) | | $ | 13.07 | |
| (a) NAV is rounded | | | | |
| | | | | |
The accompanying notes are an integral part of these financial statements.
| Vertical Capital Income Fund |
| Statement of Operations |
| For the Year Ended September 30, 2016 |
| Investment Income: | | | | |
| Interest Income | | $ | 8,917,571 | |
| Total Investment Income | | | 8,917,571 | |
| | | | | |
| Expenses: | | | | |
| Investment Advisory Fees | | | 2,119,196 | |
| Security Servicing Fees | | | 771,641 | |
| Advisor Transition Expenses | | | 348,297 | |
| Interest Expense | | | 227,671 | |
| Transfer Agent Fees | | | 181,502 | |
| Administration Fees | | | 158,092 | |
| Insurance Expense | | | 149,083 | |
| Legal Fees | | | 123,373 | |
| Audit Fees | | | 117,756 | |
| Line of Credit Fees | | | 108,133 | |
| Non 12b-1 Shareholder Expense | | | 104,162 | |
| Security Pricing Expense | | | 103,237 | |
| Printing Expense | | | 101,957 | |
| Custody Fees | | | 95,250 | |
| Trustees’ Fees | | | 65,232 | |
| Shareholder Servicing Fees | | | 54,338 | |
| Fund Accounting Fees | | | 49,026 | |
| Registration and Filing Fees | | | 35,096 | |
| Chief Compliance Officer Fees | | | 26,041 | |
| Miscellaneous Expenses | | | 20,542 | |
| Total Expenses | | | 4,959,625 | |
| Less: Expenses Waived by Adviser | | | (1,063,215 | ) |
| Net Expenses | | | 3,896,410 | |
| Net Investment Income | | | 5,021,161 | |
| | | | | |
| Net Realized and Unrealized Gain on Investments: | | | | |
| Net Realized Gain on Investments | | | 1,558,992 | |
| Net Change in Unrealized Appreciation on Investments | | | 17,268,989 | |
| Net Realized and Unrealized Gain on Investments | | | 18,827,981 | |
| | | | | |
| Net Increase in Net Assets Resulting From Operations | | $ | 23,849,142 | |
| | | | | |
The accompanying notes are an integral part of these financial statements.
| Vertical Capital Income Fund |
| Statements of Changes in Net Assets |
| |
| | | For the Year | | | For the Year | |
| | | Ended | | | Ended | |
| | | September 30, 2016 | | | September 30, 2015 | |
| | | | | | | |
| Operations: | | | | | | | | |
| Net Investment Income | | $ | 5,021,161 | | | $ | 5,088,866 | |
| Net Realized Gain on Investments | | | 1,558,992 | | | | 5,577,999 | |
| Net Change in Unrealized Appreciation on Investments | | | 17,268,989 | | | | 1,042,946 | |
| Net Increase in Net Assets | | | | | | | | |
| Resulting From Operations | | | 23,849,142 | | | | 11,709,811 | |
| | | | | | | | | |
| Distributions to Shareholders From: | | | | | | | | |
| Net Investment Income ($0.38 and $0.44 per share, respectively) | | | (5,278,242 | ) | | | (5,481,291 | ) |
| Net Realized Gains ($0.35 and $0.04 per share, respectively) | | | (4,894,463 | ) | | | (496,914 | ) |
| Total Distributions to Shareholders | | | (10,172,705 | ) | | | (5,978,205 | ) |
| | | | | | | | | |
| Beneficial Interest Transactions: | | | | | | | | |
| Proceeds from Shares Issued | | | 36,900,456 | | | | 63,006,549 | |
| Distributions Reinvested | | | 5,848,424 | | | | 3,206,422 | |
| Cost of Shares Redeemed | | | (34,799,498 | ) | | | (20,172,498 | ) |
| Total Beneficial Interest Transactions | | | 7,949,382 | | | | 46,040,473 | |
| | | | | | | | | |
| Total Increase in Net Assets | | | 21,625,819 | | | | 51,772,079 | |
| | | | | | | | | |
| Net Assets: | | | | | | | | |
| Beginning of Period | | | 160,382,498 | | | | 108,610,419 | |
| End of Period (including accumulated net investment income (loss) of $25,559 and $(476,009), respectively) | | $ | 182,008,317 | | | $ | 160,382,498 | |
| | | | | | | | | |
| Share Activity | | | | | | | | |
| Shares Issued | | | 3,120,942 | | | | 5,565,739 | |
| Shares Reinvested | | | 483,421 | | | | 283,130 | |
| Shares Redeemed | | | (2,937,959 | ) | | | (1,769,354 | ) |
| Net Increase in Shares of Beneficial Interest Outstanding | | | 666,404 | | | | 4,079,515 | |
The accompanying notes are an integral part of these financial statements.
| Vertical Capital Income Fund |
| Statement of Cash Flows |
| For the Year Ended September 30, 2016 |
| Increase (Decrease) in Cash | | | |
| Cash Flows Provided by (Used for) Operating Activities: | | | |
| Net Increase in Net Assets Resulting from Operations | | $ | 23,849,142 | |
| | | | | |
| Adjustments to Reconcile Net Increase in Net Assets Resulting from Operations to Net Cash Used for Operating Activities: | | | | |
| | | | | |
| Purchases of Long-Term Portfolio Investments | | | (23,279,952 | ) |
| Proceeds from Sale of Long-Term Portfolio Investments and Principal Paydowns | | | 22,088,772 | |
| Decrease in Interest Receivable | | | 81,477 | |
| Decrease in Receivable for Securities Sold and Principal Paydowns | | | 1,962,373 | |
| Decrease in Receivable for Fund Shares Sold | | | 72,740 | |
| Increase in Prepaid Expenses and Other Assets | | | (526,963 | ) |
| Decrease in Accrued Advisory Fees | | | (153,216 | ) |
| Decrease in Shareholder Servicing Fees | | | (2,124 | ) |
| Decrease in Accrued Expenses and Other Liabilities | | | (253,211 | ) |
| Increase in Related Party Payable | | | 26,234 | |
| Amortization of Deferred Financing Fees | | | 108,133 | |
| Net Amortization on Investments | | | (1,422,126 | ) |
| Net Realized Gain on Investments | | | (1,558,992 | ) |
| Change in Unrealized Appreciation on Investments | | | (17,268,989 | ) |
| | | | | |
| Net Cash Provided by Operating Activities | | | 3,723,298 | |
| | | | | |
| Cash Flows Provided by/Used for Financing Activities: | | | | |
| Deferred Financing Costs | | | (185,364 | ) |
| Proceeds from Sale of Shares | | | 38,232,940 | |
| Redemption of Shares | | | (36,082,424 | ) |
| Dividends Paid to Shareholders, Net of Reinvestments | | | (4,324,281 | ) |
| Proceeds from Line of Credit | | | (13,521,750 | ) |
| Net Cash Provided by Financing Activities | | | (15,880,879 | ) |
| | | | | |
| Net Increase in Cash | | | (12,157,581 | ) |
| Cash at Beginning of Period | | | 20,495,037 | |
| Cash at End of Period | | $ | 8,337,456 | |
Supplemental Disclosure of Cash Flow Information:
Non-Cash Financing Activities Included Reinvestment of Distributions During the Fiscal Period of $5,848,424
Non-Cash Financing Activities Included Proceeds from Shares issued of $1,332,484
Non-Cash Financing Activities Included Cost of Shares Redeemed of $1,282,926
The accompanying notes are an integral part of these financial statements.
| Vertical Capital Income Fund |
| Financial Highlights |
| |
| The table below sets forth financial data for one share of beneficial interest outstanding throughout each period presented. |
| | | Year | | | Year | | | Year | | | Year | | | Period | |
| | | Ended | | | Ended | | | Ended | | | Ended | | | Ended | |
| | | September 30, 2016 | | | September 30, 2015 | | | September 30, 2014 | | | September 30, 2013 | | | September 30, 2012** | |
| | | | | | | | | | | | | | | | |
| | | | | | | | | | | | | | | | |
| Net Asset Value, Beginning of Period | | $ | 11.53 | | | $ | 11.04 | | | $ | 10.87 | | | $ | 10.58 | | | $ | 10.00 | |
| | | | | | | | | | | | | | | | | | | | | |
| From Operations: | | | | | | | | | | | | | | | | | | | | |
| Net investment income (a) | | | 0.36 | | | | 0.41 | | | | 0.51 | | | | 0.50 | | | | 0.33 | |
| Net gain from investments (both realized and unrealized) | | | 1.33 | | | | 0.56 | | | | 0.27 | | | | 0.28 | | | | 0.44 | |
| Total from operations | | | 1.69 | | | | 0.97 | | | | 0.78 | | | | 0.78 | | | | 0.77 | |
| | | | | | | | | | | | | | | | | | | | | |
| Distributions to shareholders from: | | | | | | | | | | | | | | | | | | | | |
| Net investment income | | | (0.38 | ) | | | (0.44 | ) | | | (0.56 | ) | | | (0.42 | ) | | | (0.19 | ) |
| Net realized gains | | | (0.35 | ) | | | (0.04 | ) | | | (0.05 | ) | | | (0.07 | ) | | | — | |
| Total distributions | | | (0.73 | ) | | | (0.48 | ) | | | (0.61 | ) | | | (0.49 | ) | | | (0.19 | ) |
| | | | | | | | | | | | | | | | | | | | | |
| Net Asset Value, End of Period | | $ | 12.49 | | | $ | 11.53 | | | $ | 11.04 | | | $ | 10.87 | | | $ | 10.58 | |
| | | | | | | | | | | | | | | | | | | | | |
| Total Return (b) | | | 15.10 | % | | | 8.86 | % | | | 7.29 | % | | | 7.42 | % | | | 7.70 | % (d) |
| | | | | | | | | | | | | | | | | | | | | |
| Ratios/Supplemental Data | | | | | | | | | | | | | | | | | | | | |
| Net assets, end of period (in 000’s) | | $ | 182,008 | | | $ | 160,382 | | | $ | 108,610 | | | $ | 39,987 | | | $ | 11,756 | |
| Ratio of gross expenses to average net assets | | | 2.95 | % (e)(f) | | | 2.67 | % (e)(f) | | | 2.32 | % (e) | | | 3.20 | % | | | 9.42 | % (c) |
| Ratio of net expenses to average net assets | | | 2.26 | % (e)(f) | | | 2.33 | % (e)(f) | | | 1.91 | % (e) | | | 1.85 | % | | | 1.85 | % (c) |
| Ratio of net investment income to average net assets | | | 2.98 | % (e)(f) | | | 3.54 | % (e)(f) | | | 4.68 | % (e) | | | 4.61 | % | | | 4.21 | % (c) |
| Portfolio turnover rate | | | 13.72 | % | | | 2.58 | % | | | 8.37 | % | | | 11.68 | % | | | 1.50 | % (d) |
| ** | The Fund commenced operations on December 30, 2011. |
| (a) | Per share amounts are calculated using the average shares method, which more appropriately presents the per share data for the period. |
| (b) | Total returns are historical in nature and assume changes in share price, reinvestment of dividends and capital gains distributions, if any, and excludes the effect of sales charges. Had the Adviser not waived expenses, total returns would have been lower. |
| (e) | Ratio includes 0.20%, 0.27% and 0.06% for the years ended September 30, 2016, September 30, 2015 and September 30, 2014, respectively, that attributed to interest expenses and fees. |
| (f) | Ratio includes 0.21% and 0.21% for the years ended September 30, 2016 and the year ended September 30, 2015, respectively, that attributed to adviser transition expenses. |
The accompanying notes are an integral part of these financial statements.
| Vertical Capital Income Fund |
| Notes to Financial Statements |
| September 30, 2016 |
Vertical Capital Income Fund (the “Fund”), was organized as a Delaware statutory trust on April 8, 2011 and is registered under the Investment Company Act of 1940, as amended (the “1940 Act”), as a diversified, closed-end management investment company that operates as an interval fund with a continuous offering of Fund shares. The investment objective of the Fund is to seek income. The Fund commenced operations on December 30, 2011. The Fund currently offers shares at net asset value plus a maximum sales charge of 4.50%. Oakline Advisors, LLC, formerly known as Behringer Advisors, LLC (the “Advisor”) serves as the Fund’s investment adviser.
| 2. | SUMMARY OF SIGNIFICANT ACCOUNTING POLICIES |
The Fund is an investment company and applies the specialized accounting and reporting guidance in the Financial Accounting Standards Board (FASB) Accounting Standards Codification (ASC) Topic 946. The following is a summary of significant accounting policies and reporting policies used in preparing the financial statements. The accompanying financial statements have been prepared in conformity with accounting principles generally accepted in the United States of America (“GAAP”).
The preparation of financial statements in conformity with GAAP requires management to make estimates and assumptions that affect the reported amounts of assets and liabilities and disclosure of contingent assets and liabilities at the date of the financial statements and the reported amounts of income and expenses for the period. Actual results could differ from those estimates.
Security Valuation
Mortgage Notes – On October 13, 2015 the Fund began using an independent third-party pricing service, approved by the Fund’s Board of Trustees (“the Board”), to value its Mortgage Notes on a daily basis. The Fund had previously used the prior advisor’s proprietary model. The Fund’s NAV increased $0.76 per share upon conversion to the new pricing service on October 13, 2015. The revaluing of certain Mortgage Notes (see Note 3 for more detail) decreased the original October 13, 2015 value $0.42 per share. The third-party pricing servicer uses a cash flow forecast and valuation model that focuses on forecasting the frequency, timing and severity of mortgage loss behavior. The model incorporates numerous observable loan-level factors such as unpaid principal balance, remaining term of the loan and coupon rate as well as macroeconomic data including yield curves, spreads to the Treasury curves and home price indexes. The model also includes a number of unobservable factors and assumptions (such as voluntary and involuntary prepayment speeds, delinquency rates, foreclosure timing, and others) to determine a fair value. While the model requires a minimum set of data to develop a reasonable fair value, the model is capable of accepting additional data elements. The model makes certain assumptions unless a specific data element is included, in which case it uses the additional data. Not all assumptions have equal weighting in the model. Using assumptions in this manner is a part of the Fund’s valuation policy and procedures and provides consistency in the application of valuation assumptions. The third-party pricing servicer also benchmarks their pricing model against observable pricing levels being quoted by a range of market participants active in the purchase and sale of residential mortgage loans. The combination of loan level criteria and daily market adjustments produced a daily price for each Mortgage Note relative to current public market conditions.
Prior to purchase, each Mortgage Note goes through a due diligence process that includes considerations such as underwriting borrower credit, employment history, property valuation, and delinquency history with an overall emphasis on repayment of the Mortgage Notes. The purchase price of the Mortgage Notes reflects the overall risk relative to the findings of this due diligence process.
The Fund invests primarily in Mortgage Notes secured by residential real estate. The market or liquidation value of each type of residential real estate collateral may be adversely affected by numerous factors, including rising interest rates; changes in the national, state and local economic climate and real estate conditions; perceptions of
| Vertical Capital Income Fund |
| Notes to Financial Statements (Continued) |
| September 30, 2016 |
prospective buyers of the safety, convenience and attractiveness of the properties; maintenance and insurance costs; changes in real estate taxes and other expenses; adverse changes in governmental rules and fiscal policies; adverse changes in zoning laws; and other factors beyond the control of the borrowers.
The Fund’s investments in Mortgage Notes are subject to liquidity risk because there is a limited secondary market for Mortgage Notes. Liquidity risk exists when particular investments of the Fund would be difficult to purchase or sell, possibly preventing the Fund from selling such illiquid securities at an advantageous time or price, or possibly requiring the Fund to dispose of other investments at unfavorable times or prices in order to satisfy its obligations. Securities for which current market quotations are not readily available, such as the Mortgage Notes the Fund invests in, or for which quotations are not deemed to be representative of market values are valued at fair value as determined in good faith by or under the direction of the Board in accordance with the Trust’s Portfolio Securities Valuation Procedures (the “Procedures”). The Procedures consider, among others, the following factors to determine a security’s fair value: the nature and pricing history (if any) of the security; whether any dealer quotations for the security are available; and possible valuation methodologies that could be used to determine the fair value of the security.
The valuation inputs and subsequent outputs are reviewed and maintained on a daily basis. Any calibrations or adjustments to the model that may be necessary are done on an as-needed basis to facilitate fair pricing. Financial markets are monitored daily relative to the interest rate environment. If other available market data indicates that the pricing data from the third-party service is materially inaccurate, or pricing data is unavailable, the Fund undertakes a review of other available prices and takes additional steps to determine fair value. In all cases, the Fund validates its understanding of methodology and assumptions underlying the fair value used.
The Fund follows guidance in ASC 820, Fair Value Measurement, where fair value is defined as the price that would be received to sell an asset or paid to transfer a liability in an orderly transaction between the market participants at the measurement date. The Fund utilizes various methods to measure the fair value of its investments on a recurring basis. Notwithstanding, the actual sale price of a Mortgage Note will likely be different than its fair value determined under ASC 820. GAAP establishes a hierarchy that prioritizes inputs to valuation methods. ASC 820 classifies the inputs used to measure these fair values into the following hierarchy:
Level 1 – Unadjusted quoted prices in active markets for identical and/or similar assets and liabilities that the Fund has the ability to access at the measurement date.
Level 2 – Other significant observable inputs other than quoted prices included in Level 1 for the asset or liability, either directly or indirectly. These inputs may include quoted prices for similar investments or identical investments in an active market, interest rates, prepayment speeds, credit risk, yield curves, default rates and similar data.
Level 3 – Significant unobservable inputs for the asset or liability, to the extent relevant observable inputs are not available, representing the Fund’s own assumptions about the assumptions a market participant would use in valuing the asset or liability, and would be based on the best information available.
The availability of observable inputs can vary from security to security and is affected by a wide variety of factors, including, for example, the type of security, whether the security is new and not yet established in the marketplace, the liquidity of markets, and other characteristics particular to the security. To the extent that valuation is based on models or inputs that are less observable or unobservable in the market, the determination of fair value requires more judgment. Accordingly, the degree of judgment exercised in determining fair value is greatest for instruments categorized in Level 3.
The inputs used to measure fair value may fall into different levels of the fair value hierarchy. In such cases, for disclosure purposes, the level in the fair value hierarchy within which the fair value measurement falls in its entirety, is determined based on the lowest level input that is significant to the fair value measurement in its entirety.
| Vertical Capital Income Fund |
| Notes to Financial Statements (Continued) |
| September 30, 2016 |
The inputs or methodology used for valuing investments are not necessarily an indication of the risk associated with investing in those investments. The following tables summarize the inputs used as of September 30, 2016 for the Fund’s assets measured at fair value:
| Assets | | Level 1 | | | Level 2 | | | Level 3 | | | Total | |
| Mortgage Notes | | $ | — | | | $ | — | | | $ | 169,713,431 | | | $ | 169,713,431 | |
| Other Investments | | | — | | | | — | | | | 404,767 | | | $ | 404,767 | |
| Total | | $ | — | | | $ | — | | | $ | 170,118,198 | | | $ | 170,118,198 | |
There were no transfers between levels during the current period presented. It is the Fund’s policy to record transfers into or out of levels at the end of the reporting period.
The following is a reconciliation of assets in which Level 3 inputs were used in determining value:
| | | Mortgage Notes | | | Other Investments | | | Total | |
| Beginning Balance | | $ | 148,189,668 | | | $ | 487,243 | | | $ | 148,676,911 | |
| Net realized gain (loss) | | | 1,535,546 | | | | 23,446 | | | | 1,558,992 | |
| Change in unrealized appreciation (depreciation) | | | 17,169,195 | | | | 99,794 | | | | 17,268,989 | |
| Cost of purchases | | | 23,279,952 | | | | — | | | | 23,279,952 | |
| Proceeds from sales and principal paydow | | | (21,536,745 | ) | | | (552,027 | ) | | | (22,088,772 | ) |
| Amortization | | | 1,408,454 | | | | 13,672 | | | | 1,422,126 | |
| Net Transfers within level 3 | | | (332,639 | ) | | | 332,639 | | | | — | |
| Ending balance | | $ | 169,713,431 | | | $ | 404,767 | | | $ | 170,118,198 | |
| | | | | | | | | | | | | |
The total change in unrealized appreciation (depreciation) included in the Statement of Operations attributable to Level 3 investments still held at September 30, 2016 is $17,268,989.
The following table provides quantitative information about the Fund’s Level 3 values, as well as its inputs, as of September 30, 2016. The table is not all-inclusive, but provides information on the significant Level 3 inputs.
| | | | | | | | | | | | Weighted |
| | | | | | | | | | Range of | | Average of |
| | | | | | | | Unobservable | | Unobservable | | Unobservable |
| | | Value | | | Valuation Technique | | Inputs | | Inputs | | Inputs |
| | | | | | Comprehensive | | | | | | |
| | | | | | | pricing model with | | | | | | |
| | | | | | | emphasis on | | | | | | |
| | | | | | | discounted cash | | Constant | | | | |
| Mortgage Notes | | $ | 169,713,431 | | | flows | | prepayment rate | | 0-44.8% | | 13.90% |
| | | | | | | | | Deliquency | | 0-3,104 days | | 36 days |
| | | | | | | | | Loan-to-Value | | 3-300% | | 87.1% |
| Other Investments | | | 404,767 | | | Market comparable | | Sales prices | | $65-$150 sq/ft | | $102 sq/ft |
| Closing Balance | | $ | 170,118,198 | | | | | | | | | |
A change to the unobservable input may result in a significant change to the value of the investment as follows:
| Vertical Capital Income Fund |
| Notes to Financial Statements (Continued) |
| September 30, 2016 |
| Security Transactions and | | | | |
| Investment Income - | | Impact to Value if | | Impact to Value if |
| Investment Security | | Input Increases | | Input Decreases |
| Constant Prepayment Rate | | Increase | | Decrease |
| Delinquency | | Decrease | | Increase |
| Loan to Value | | Decrease | | Increase |
Cash and Cash Equivalents – Cash and cash equivalents include cash and overnight investments in interest-bearing demand deposits with a financial institution with maturities of three months or less. The Fund maintains deposits with a high quality financial institution in an amount that is in excess of federally insured limits.
Security Transactions and Investment Income – Investment security transactions are accounted for on a trade date basis. Cost is determined and gains and losses are based upon the specific identification method for both financial statement and federal income tax purposes. Interest income is recorded on the accrual basis. Purchase discounts and premiums on securities are accreted and amortized over the life of the respective securities.
Interest Income on Non-Accrual Loans – The Fund discontinues the accrual of interest on loans when, in the opinion of management, there is an assessment that the borrower will likely be unable to meet all contractual payments as they become due.
Credit Facility – On February 5, 2013, the Fund entered into a revolving line of credit agreement with Sunwest Bank for investment purposes and to help maintain the Fund’s liquidity, subject to the limitations of the 1940 Act for borrowings. The maximum amount of borrowing allowed under the agreement was the lesser of $15 million or 33% of the eligible portion of the Fund’s loans. On February 5, 2016, the original maturity date, the agreement was amended to extend the maturity date to May 5, 2016 and waive any event of default. The Fund entered into the Amended and Restated Credit Agreement (“Amended Agreement”) on June 29, 2016. Borrowings under the Amended Agreement continue to bear interest at a rate equal to the Wall Street Journal Prime, with a floor rate of 3.50%, per annum, on the outstanding principal balance and the maximum amount of borrowing allowed continues to be the lesser of $15 million or 33% of the eligible portion of the Fund’s loans. The Amended Agreement matures on January 5, 2018. The Fund incurred deferred financing fees of $185,364 as a result of the Amended Agreement. Accumulated amortization of deferred financing fees was $108,133 as of September 30, 2016. During the year ended September 30, 2016, the Fund utilized the line of credit. The average amount of borrowing outstanding for the period was $8,555,192 and the total interest expense was $227,671. As of September 30, 2016, there were no borrowings outstanding under the line of credit. The outstanding balance under the line of credit was $15,000,000 at March 10, 2017.
Federal Income Taxes – The Fund intends to continue to comply with the requirements of Subchapter M of the Internal Revenue Code applicable to regulated investment companies and will distribute all of its taxable income, if any, to shareholders. Accordingly, no provision for Federal income taxes is required in the financial statements.
The Fund recognizes the tax benefits of uncertain tax positions only where the position is “more likely than not” to be sustained assuming examination by tax authorities. Management has analyzed the Fund’s tax positions, and has concluded that no liability for unrecognized tax benefits should be recorded related to uncertain tax positions taken by the Fund in its 2013 - 2015 tax returns or expected to be taken in the Fund’s 2016 tax returns. The Fund identified its major tax jurisdictions as U.S. Federal jurisdictions where the Fund makes significant investments; however, the Fund is not aware of any tax positions for which it is reasonably possible that the total amounts of unrecognized tax benefits will change materially in the next twelve months.
Distributions to Shareholders – Distributions from investment income, if any, are declared and paid monthly and are recorded on the ex-dividend date. The Fund will declare and pay net realized capital gains not previously distributed, if any, annually. The character of income and gains to be distributed is determined in accordance with Federal
| Vertical Capital Income Fund |
| Notes to Financial Statements (Continued) |
| September 30, 2016 |
income tax regulations, which may differ from GAAP. These “book/tax” differences are considered either temporary (i.e., deferred losses, capital loss carry forwards) or permanent in nature. To the extent these differences are permanent in nature, such amounts are reclassified within the composition of net assets based on their federal tax-basis treatment; temporary differences do not require classification.
Indemnification – The Trust indemnifies its officers and Trustees for certain liabilities that may arise from the performance of their duties to the Trust. Additionally, in the normal course of business, the Fund enters into contracts that contain a variety of representations and warranties and which provide general indemnities. The Fund’s maximum exposure under these arrangements is unknown, as this would involve future claims that may be made against the Fund that have not yet occurred. However, management of the Fund expects the risk of loss due to these warranties and indemnities to be remote.
| 3. | REPRICING OF CERTAIN MORTGAGE NOTES |
As noted above, the Fund began using an independent third-party valuation service on October 13, 2015 which, in general, priced all of the Fund’s Mortgage Notes on a daily basis. However, there were two general exceptions. One related to loans having a portion of their unpaid principle balance deferred to maturity (“deferred balance”), and the other related to loans that had provisions for contractual increases in future interest rates (“step rates”). Both of these situations typically resulted from prior loan modifications.
In the case of loans with deferred balance features, the Fund used several procedures during the year. For the period October 1, 2015 through October 12, 2015, the Fund employed the prior advisor’s proprietary model in a manner consistent with historical practice. For the period October 13, 2015 (when the Fund’s current valuation service’s model was first deployed) through September 23, 2016, the Fund’s Administrator applied certain pricing information obtained from the Fund’s valuation service to the amount of deferred balances that it maintained on the Fund’s books.
During the course of working with the Fund’s valuation service to include the pricing of the deferred balances in their model, the Fund determined that some information relating to step rate loans was not being considered in determining the fair value of the Mortgage Notes. When discovered, management sought to have such information additionally included in the valuation servicer’s model. This occurred simultaneously on September 26, 2016 with the inclusion of the deferred balance information, after such step rate loan information was also validated.
As a result of the change in the valuation process, the Fund reported a decrease in its NAV of $0.31 per share on September 26, 2016. Since the change was viewed as material, the Board determined that the Fund should revalue its Mortgage Notes for the period of October 13, 2015 through September 23, 2016 using revised pricing obtained from the Fund’s valuation service. After repricing, it was determined that the Fund’s daily NAV (and NAV per share) were overstated during this period.
As a result, the Fund will reprocess certain shareholder transactions that occurred during this period and has calculated the amounts, if any, due to, or from, the Fund or such shareholders as of September 30, 2016 (see Note 6).
| 4. | INVESTMENT IN RESTRICTED SECURITIES |
Notes secured by a mortgage or deed of trust held by the Fund (“Restricted Securities”), while exempt from registration under the Securities Act of 1933 (the “1933 Act”), are subject to certain restrictions on resale and cannot be sold publicly. The Fund may invest in Restricted Securities that are consistent with the Fund’s investment objectives and investment strategies. Investments in Restricted Securities are valued at fair value as determined in
| Vertical Capital Income Fund |
| Notes to Financial Statements (Continued) |
| September 30, 2016 |
good faith in accordance with procedures adopted by the Board of Trustees. The Fund has no rights to compel the obligor or issuer of a Restricted Security to register such a Restricted Security under the 1933 Act.
| 5. | ADVISORY FEE AND OTHER RELATED PARTY TRANSACTIONS |
The business activities of the Fund are overseen by the Board, which is responsible for the overall management of the Fund.
Advisory Fees – Pursuant to an Advisory Agreement with the Fund, the Advisor, under the oversight of the Board, directs certain of the daily operations of the Fund and supervises the performance of administrative and professional services provided by others. As compensation for its services and the related expenses borne by the Advisor, the Fund pays the adviser a management fee, computed and accrued daily and paid monthly, at an annual rate of 1.25% of the average daily net assets of the Fund. For the year ended September 30, 2016, the Advisor earned advisory fees of $2,119,196.
The Advisor has contractually agreed to waive all or part of its management fees and/or make payments to limit Fund expenses (exclusive of any front-end or contingent deferred loads, taxes, leverage interest, brokerage commissions, expenses incurred in connection with any merger or reorganization, expenses of investing in underlying funds, or extraordinary expenses such as litigation) at least until January 31, 2018, so that the total annual operating expenses of the Fund do not exceed 1.85% of the average daily net assets of the Fund. The Fund incurred extraordinary expenses totaling $348,297 during the year ended September 30, 2016 associated with the transition to the new Advisor. These extraordinary transition expenses are not subject to the operating expense limitation. Waivers and expense reimbursements may be recouped by the Advisor from the Fund, to the extent that overall expenses fall below the expense limitation, within three years of when the amounts were waived. For the year ended September 30, 2016, the Advisor waived advisory fees of $1,063,215. Expenses subject to recapture by the Advisor amounted to $178,366 that will expire on September 30, 2018 and $1,063,215 that will expire on September 30, 2019.
Distributor – The distributor of the Fund is Northern Lights Distributors, LLC (the “Distributor”). The Board of Trustees of the Fund has adopted, on behalf of the Fund, a Shareholder Servicing Plan to pay for certain shareholder services. Under the Plan, the Fund will pay 0.03% per year of its average daily net assets for such shareholder service activities. The Fund does not pay shareholder servicing fees to the Distributor. For the year ended September 30, 2016, the Fund incurred shareholder servicing fees of $54,338.
In addition, certain affiliates of the Distributor provide services to the Fund as follows:
Gemini Fund Services, LLC (“GFS”), an affiliate of the Distributor, provides administration, fund accounting, and transfer agent services to the Trust. Pursuant to a separate servicing agreement with GFS, the Fund pays GFS customary fees for providing administration, fund accounting and transfer agency services to the Fund. Certain officers of the Fund are also officers of GFS, and are not paid any fees directly by the Fund for serving in such capacities.
Northern Lights Compliance Services, LLC (“NLCS”) – NLCS, an affiliate of GFS and the Distributor, provides a Chief Compliance Officer to the Fund, as well as related compliance services, pursuant to a consulting agreement between NLCS and the Fund. Under the terms of such agreement, NLCS receives customary fees from the Fund.
Blu Giant, LLC (“Blu Giant”) – Blu Giant, an affiliate of GFS and the Distributor, provides EDGAR conversion and filing services as well as print management services for the Fund on an ad-hoc basis. For the provision of these services, Blu Giant receives customary fees from the Fund.
| Vertical Capital Income Fund |
| Notes to Financial Statements (Continued) |
| September 30, 2016 |
Security Servicing Agent – The Fund pays Statebridge Company, LLC (“Statebridge”), an unaffiliated third party, a fee for the collections from and maintenance of its securities by providing services such as contacting delinquent borrowers and managing the foreclosure process or other recovery processes for the Fund in the event of a borrower’s default.
Trustees – The Fund pays each Trustee who is not affiliated with the Fund or advisor a quarterly fee of $5,000, as well as reimbursement for any reasonable expenses incurred attending meetings. Additionally, beginning November 11, 2016, each unaffiliated Trustee will receive $2,500 per meeting and the lead unaffiliated Trustee will receive an additional $10,000 per year. The “interested persons” who serve as Trustees of the Fund receive no compensation for their services as Trustees. None of the executive officers receive compensation from the Fund.
| 6. | RECEIVABLE FROM ADVISOR/PAYABLE TO SHAREHOLDERS |
As a result of the recalculation of the Fund’s NAV (and NAV per share) for the period October 13, 2015 to September 23, 2016 as described in Note 3, the Fund has recorded certain adjustments to its financial position as of September 30, 2016. For shareholders who had a portion of their shares redeemed and are still shareholders, and for shareholders who acquired shares and are still shareholders; their remaining share counts will be decreased or increased to reflect the Fund’s revised NAV per share on the dates of their transactions.
As of September 30, 2016 the over payment to redeemed shareholders totaling $1,242,366 has been recorded as a receivable from the Advisor of which a portion is expected to be recovered through the reprocessing of shareholder transactions, and the under-issued shares to acquiring shareholders totaling $1,332,484 has been recorded as a payable to shareholders; with offsetting entries to the Fund’s paid-in-beneficial interests.
The Fund has also recorded a receivable from the Advisor in the amount of $40,560 reflecting the amount the Advisor has agreed to pay the Fund as a reimbursement for over payments of asset-based fees including advisory fees and interest on the reimbursement amounts.
| 7. | INVESTMENT TRANSACTIONS |
The cost of purchases and proceeds from sales and paydowns of securities, other than U.S. Government securities and short-term investments, for the year ended September 30, 2016 amounted to $23,279,952 and $22,088,772 respectively.
Pursuant to Rule 23c-3 under the Investment Company Act of 1940, as amended, the Fund offers shareholders on a quarterly basis the option of redeeming shares, at net asset value, of no less than 5% and no more than 25% of the shares outstanding. There is no guarantee that shareholders will be able to sell all of the shares they desire in a quarterly repurchase offer, although each shareholder will have the right to require the Fund to purchase up to and including 5% of such shareholder’s shares in each quarterly repurchase. Limited liquidity will be provided to shareholders only through the Fund’s quarterly repurchases.
During the year ended September 30, 2016, the Fund completed four quarterly repurchase offers. In those offers, the Fund offered to repurchase up to 5% (and an additional 2% at the Fund’s discretion) of the number of its outstanding shares as of the Repurchase Pricing Dates. The results of those repurchase offers were as follows:
| Vertical Capital Income Fund |
| Notes to Financial Statements (Continued) |
| September 30, 2016 |
| | | Repurchase | | | Repurchase | | | Repurchase | | | Repurchase | |
| | | Offer #1 | | | Offer #2 | | | Offer #3 | | | Offer #4 | |
| Commencement Date | | | 09/11/15 | | | | 12/15/15 | | | | 03/21/16 | | | | 06/15/16 | |
| Repurchase Request Deadline | | | 10/16/15 | | | | 01/20/16 | | | | 04/22/16 | | | | 07/21/16 | |
| Repurchase Pricing Date | | | 10/16/15 | | | | 01/20/16 | | | | 04/22/16 | | | | 07/21/16 | |
| Net Asset Value as of Repurchase Pricing Date | | $ | 12.35 | | | $ | 12.06 | | | $ | 12.26 | | | $ | 12.46 | |
| Amount Repurchased | | $ | 8,668,005 | | | $ | 8,898,952 | | | $ | 9,296,040 | | | $ | 9,219,427 | |
| Percentage of Outstanding Share Repurchased | | | 5.00 | % | | | 5.00 | % | | | 5.00 | % | | | 5.00 | % |
The following repurchases offer occurred subsequent to the reporting period:
| | | | Repurchase Offer | | | | Repurchase Offer | |
| Commencement Date | | | 09/12/16 | | | | 12/13/2016 | |
| Repurchase Request Deadline | | | 10/17/16 | | | | 1/20/2017 | |
| Repurchase Pricing Date | | | 10/17/16 | | | | 1/20/2017 | |
| | | | | | | | | |
| Net Asset Value as of Repurchase Pricing Date | | $ | 12.50 | | | $ | 12.37 | |
| Amount Repurchased | | $ | 9,257,348 | | | $ | 9,000,244 | |
| Percentage of Outstanding Share Repurchased | | | 5.00 | % | | | 5.00 | % |
| 9. | DISTRIBUTIONS TO SHAREHOLDERS AND TAX COMPONENTS OF CAPITAL |
The tax character of distributions paid during the fiscal years ended September 30, 2016 and September 30, 2015 was as follows:
| | | Fiscal Year Ended | | | Fiscal Year Ended | |
| | | September 30, 2016 | | | September 30, 2015 | |
| Ordinary Income | | $ | 5,780,415 | | | $ | 5,734,414 | |
| Long-Term Capital Gain | | | 4,392,290 | | | | 243,791 | |
| | | $ | 10,172,705 | | | $ | 5,978,205 | |
As of September 30, 2016, the components of accumulated earnings/ (deficit) on a tax basis were as follows:
| Undistributed | | | Undistributed | | | Post October Loss | | | Capital Loss | | | Other | | | Unrealized | | | Total | |
| Ordinary | | | Long-Term | | | and | | | Carry | | | Book/Tax | | | Appreciation/ | | | Accumulated | |
| Income | | | Gains | | | Late Year Loss | | | Forwards | | | Differences | | | (Depreciation) | | | Earnings/(Deficits) | |
| $ | 558,522 | | | $ | 893,855 | | | $ | — | | | $ | — | | | $ | (34,222 | ) | | $ | 19,355,546 | | | $ | 20,773,701 | |
The amount listed under other book/tax differences for the Fund is primarily attributable to tax adjustments for defaulted notes.
| Vertical Capital Income Fund |
| Notes to Financial Statements (Continued) |
| September 30, 2016 |
Permanent book and tax differences, primarily attributable to the reclassification of Fund distributions and tax adjustments for defaulted notes, resulted in reclassification for the year ended September 30, 2016 as follows:
| Paid | | | Undistributed | | | Accumulated | |
| In | | | Net Investment | | | Net Realized | |
| Capital | | | Income (Loss) | | | Gains (Loss) | |
| $ | — | | | $ | 282,640 | | | $ | (282,640 | ) |
The Fund is required to recognize in the financial statements the effects of all subsequent events that provide additional evidence about conditions that existed at the date of the Statement of Assets and Liabilities. For non-recognized subsequent events that must be disclosed to keep the financial statements from being misleading, the Fund is required to disclose the nature of the event as well as an estimate of its financial effect, or a statement that such an estimate cannot be made. Management has determined that other than those disclosed in these financial statements, there were no other subsequent events to report through the issuance of these financial statements.
Report of Independent Registered Public Accounting Firm
The Board of Trustees and Shareholders of
Vertical Capital Income Fund:
We have audited the accompanying statement of assets and liabilities of Vertical Capital Income Fund (the Fund), including the portfolio of investments, as of September 30, 2016, and the related statements of operations and cash flows for the year then ended, the statements of changes in net assets and the financial highlights for each of the years in the two-year period then ended. These financial statements and financial highlights are the responsibility of the Fund’s management. Our responsibility is to express an opinion on these financial statements and financial highlights based on our audits. The accompanying financials highlights for each of the years in the two-year period ended September 30, 2014, and for the period December 30, 2011 (commencement of operations) through September 30, 2012 of Vertical Capital Income Fund were audited by other auditors whose report thereon dated November 28, 2014, expressed an unqualified opinion on those statements.
We conducted our audits in accordance with the standards of the Public Company Accounting Oversight Board (United States). Those standards require that we plan and perform the audit to obtain reasonable assurance about whether the financial statements and financial highlights are free of material misstatement. An audit includes examining, on a test basis, evidence supporting the amounts and disclosures in the financial statements. Our procedures included confirmation of securities owned as of September 30, 2016, by correspondence with the custodian. An audit also includes assessing the accounting principles used and significant estimates made by management, as well as evaluating the overall financial statement presentation. We believe that our audits provide a reasonable basis for our opinion.
In our opinion, the financial statements and financial highlights referred to above present fairly, in all material respects, the financial position of Vertical Capital Income Fund as of September 30, 2016, the results of its operations and its cash flows for the year then ended, the changes in its net assets and financial highlights for each of the years in the two-year period then ended, in conformity with U.S. generally accepted accounting principles.
/s/KPMG LLP
Dallas, Texas
March 21, 2017
| Supplemental Information (Unaudited) |
FACTORS CONSIDERED BY THE INDEPENDENT TRUSTEES IN APPROVAL OF THE INVESTMENT ADVISORY AGREEMENT*
The Investment Advisory Agreement (“New Agreement”) was approved by a majority of the Board, including the Independent Trustees, at an in-person meeting held on June 29, 2015. The Board reviewed the materials provided by the Advisor: Oakline Advisors, LLC (formerly known as Behringer Advisors, LLC) in advance of the meeting. The Trustees were assisted by independent legal counsel throughout the New Agreement review process. The Board relied upon the advice of independent legal counsel and their own business judgment in determining the material factors to be considered in evaluating the New Agreement and the weight to be given to each such factor. The conclusions reached by the Trustees were based on a comprehensive evaluation of all of the information provided and were not the result of any one factor. Moreover, each Trustee may have afforded different weight to the various factors in reaching his conclusions with respect to the New Agreement.
Nature, Extent and Quality of Services. The Trustees discussed the Advisor’s history and portfolio management experience. They noted that the Advisor and its affiliates currently serves a variety of retail, registered investment advisers and institutional investor clients, managing approximately $787 million in assets across its non-listed real estate investment trust (“REIT”), closed end funds and DST/Net Lease platform (a real estate related investment vehicle). The Trustees reviewed the background and experience of the Advisor’s team proposed to advise and service the Fund. They noted that although the Advisor had not provided advisory services to a registered investment company directly, they considered the varied and extensive experience of the portfolio management and compliance teams, and the Advisor’s ability to leverage the experience and expertise of its affiliates to the benefit of the Fund and shareholders. The Trustees discussed the investment advisory and related services to be provided to the Fund noting that the Advisor would oversee the day-to-day operations of the Fund, provide a variety of investment advisory services including execution and management of the Fund’s investment portfolio, and provide oversight and compliance. They considered that although the Advisor does not have experience in the residential mortgage markets, it does have previous experience with REIT and real-estate related investments. The Trustees noted positively the significant support the Advisor has in the Advisor-affiliated entities which further strengthen the services available to the Fund and shareholders. The Trustees discussed the Advisor’s proposal for the ongoing management and implementation of strategy changes for the Fund over time, and agreed that it had given thoughtful consideration to the development of a strategic and promising plan for the Fund. After further discussion, the Trustees concluded that the Advisor has the potential to provide advisory services to the Fund in line with the Board’s expectations.
Performance. The Trustees reviewed the performance of a variety of accounts currently managed by the Advisor. They noted that the Advisor does not currently manage a fund with a strategy substantially similar to that of the Fund, so the performance information provided was merely illustrative of the Advisor’s general capabilities. They also reviewed the performance of multiple REITs managed by the Advisor noting the positive returns in each period shown. The Trustees considered that while the Advisor does not have experience in the residential mortgage market, its experience and successful track record in the commercial real-estate and REIT markets suggest it has the capacity to provide positive returns for shareholders.
Fees and Expenses. The Trustees noted that the Advisor proposed to charge an advisory fee of 1.25%, equal to that currently paid by the Fund. They considered that the proposed fee was higher than the Morningstar category of real estate related funds average but within the range of fees of the peer group. The Trustees noted that Morningstar does not have a closed-end interval fund category and, therefore, the Morningstar comparison, while informative is not directly on point as to the relative reasonableness of the proposed fee. The Trustees further considered that the Advisor would maintain a contractual fee waiver until January 31, 2017 limiting the Fund’s total expense ratio to 1.85%. After further discussion, the Trustees concluded that the proposed advisory fee was reasonable.
Profitability. The Trustees reviewed a profitability analysis provided by the Advisor, and discussed the Advisor’s estimated profitability in connection with its relationship with the Fund. They noted that the Advisor anticipates realizing a net profit during the initial term of the New Agreement but agreed that the amount of profit was not excessive in terms of actual dollars or as a percentage of revenue. The Trustees further noted that the Advisor had agreed, if shareholders approve the New Agreement, to pay a portion of an existing shortfall in the Fund’s mortgage loan servicing account. They considered that the Advisor’s profitability analysis did not take this expense into account, and if it had, the Advisor would realize a net loss in connection with its relationship with the Fund for the first year. After further discussion, the Trustees concluded the Advisor’s estimated profitability was reasonable.
Economies of Scale. The Trustees considered whether there will be economies of scale with respect to the management of the Fund. The Trustees noted the absence of breakpoints in the Advisor’s fee proposal. They considered the Advisor’s representation that the Fund could benefit from economies as certain expenses of the Fund will be leveraged across the Advisor’s shared services platform and firm resources. After further discussion, the Trustees agreed that the matter of economies of scale would be revisited in connection with the renewal of the New Agreement as the Advisor’s costs are more clearly identified and prospects for Fund growth are better understood.
Conclusion. Having requested and received such information from the Advisor as the Trustees believed to be reasonably necessary to evaluate the terms of the New Agreement, and as assisted by the advice of Counsel, the Trustees concluded that the fee structure is reasonable and that approval of the New Agreement is in the best interests of the shareholders of Vertical Capital Income Fund.
PROXY VOTE
At a Special Meeting of Shareholders of the Fund, held at the offices of Gemini Fund Services, LLC, 80 Arkay Drive, Suite 110, Hauppauge, NY 11788, on Friday, October 30, 2015, shareholders of record as of the close of business on September 4, 2015 voted to approve the following proposal:
Proposal 1: To Elect a new Trustee
| Shares Voted | | Shares Voted Against |
| In Favor | | or Abstentions |
| 12,293,980 | | 878,966 |
At a Special Meeting of Shareholders of the Fund, held at the offices of Gemini Fund Services, LLC, 80 Arkay Drive, Suite 110, Hauppauge, NY 11788, on Monday, November 16, 2015, shareholders of record as of the close of business on September 4, 2015 voted to approve the following proposal:
Proposal: To approve a new investment Advisory Agreement between the Fund and Behringer Advisors, LLC.
| Shares Voted | | Shares Voted Against |
| In Favor | | or Abstentions |
| 6,909,137 | | 255,810 |
| * | Due to timing of the contract renewal schedule, these deliberations may or may not relate to the current performance results of the Fund. |
| Vertical Capital Income Fund |
| Supplemental Information (Continued) |
| September 30, 2016 (Unaudited) |
Following is a list of the Trustees and executive officers of the Trust and their principal occupation over the last five years. Unless otherwise noted, the address of each Trustee and Officer is 80 Arkay Drive, Hauppauge, NY 11788.
| | | | |
| Independent Trustees | | | |
| Name (Year of Birth) | | | Number of |
| Position held with the Fund* | | | Portfolios in Fund |
| Principal Occupations and Other Directorships During Past 5 Years | | | Complex Overseen |
| | | | by Trustee** |
Robert J. Boulware (1956)
Trustee, since August 2011
Managing Director, Pilgrim Funds, LLC (private equity fund), Sept. 2006 to present. Other Directorships: Trustee, Met Investors Series Trust (48 portfolios), March 2008 to present; Metropolitan Series Funds (30 portfolios) April 2012 to Present; Director, Gainsco Inc. (auto insurance) May 2005 to present, Trustee, Sharespost 100 Fund, March 2013 to Present. | | | 1 |
Mark J. Schlafly (1961)
Trustee, since August 2011
Managing Director, Russell Investments, June 2013 to January 2015; Staff Member, Weston Center, Washington University, August 2011 to present; Other Directorships: None | | | 1 |
T. Neil Bathon (1961)
Trustee, since August 2011
Managing Partner, FUSE Research Network, LLC, Aug. 2008 to present; Managing Director, PMR Associates LLC (consulting firm), July 2006 to Present;
Other Directorships: BNY Mellon Chartable Gift Fund, July 2013 to Present | | | 1 |
| Vertical Capital Income Fund |
| Supplemental Information (Continued) |
| September 30, 2016 (Unaudited) |
| Interested Trustees and Officers | | | |
| Name (Year of Birth) | | | Number of |
| Position held with the Fund* | | | Portfolios in Fund |
| Principal Occupations and Other Directorships During Past 5 Years | | | Complex Overseen
by Trustee** |
Robert J. Chapman *** (1947)
Trustee, since August 2015
Executive Vice President, Oakline Advisors, LLC (investment adviser), a position held since July 2015. Executive Vice President, Stratera Holdings, LLC (financial services holding company) a position held since 2007.
Other Directorships: None | | | 1 |
Michael D. Cohen (1974)
President, since July 2015
Chief Executive Officer, Stratera Holdings, LLC, (financial services holding company), a position held since October 2016, President of Stratera Holdings, LLC, a position held since April 2015; Executive Vice President, Jan. 2013 to Apr. 2015. President of Stratera Services, LLC, Apr. 2015 to present; Executive Vice President, Jan. 2011 to Apr. 2015. Similar positions held at subsidiaries of Stratera Holdings. Executive Vice President of Pathway Energy Infrastructure Management, LLC, Aug. 2014 to present. Director, Behringer Harvard Opportunity REIT I, Inc., July 2014 to present. Director, Behringer Harvard Opportunity REIT II, Inc., Feb. 2013 to present. Executive Vice President, Pathway Energy Infrastructure Fund, LLC, Feb 2013 to present. Executive Vice President of Priority Senior Secured Income Management, LLC, Oct. 2012 to present. Executive Vice President of Priority Income Fund, Inc., July 2012 to present.
Other Directorships: N/A | | | N/A |
Jason Hall (1966)
Treasurer, since July 2015
Senior VP, Chief Financial Officer, Chief Accounting Officer and Treasurer, Behringer Harvard Opportunity REIT II Inc., positions held since Oct. 2014; Senior VP, Chief Accounting Officer, Treasurer, Sept. 2013 to Oct. 2014;Treasurer, Director of Financial Reporting, Senior Fund Controller, Jan 2012 to Sept. 2013, Director of Financial Reporting, Senior Fund Controller, Behringer Harvard Holdings, LLC (financial services holding company), Jan. 2011 to Dec. 2011.
Other Directorships: N/A | | | N/A |
Harris Cohen (1981)
Assistant Treasurer since 2011
Assistant Vice President of Fund Administration (2016-Present); Manager of Fund Administration (2011-2016); Senior Fund Administrator (2005-2011), Gemini Fund Services, LLC.
Other Directorships: N/A | | | N/A |
Stanton P. Eigenbrodt (1965)
Secretary since July 2015
Executive Vice President of Oakline Advisors, a position held since July 2015. Chief Legal Officer of Statera Holdings, LLC (financial services holding company) a position held since 2015; Executive Vice President and General Counsel (2011-2015); Senior Vice President and General Counsel (2006-2011). Similar positions held at subsidiaries of Stratera Holdings, LLC.
Other Directorships: N/A | | | N/A |
Emile R. Molineaux (1962)
Chief Compliance Officer and Anti-Money Laundering Officer Since August 2011
Northern Lights Compliance Services, LLC (Secretary since 2003 and Senior Compliance Officer since 2011); General Counsel, CCO and Senior Vice President, Gemini Fund Services, LLC; Secretary and CCO, Northern Lights Compliance Services, LLC (2003-2011).
Other Directorships: N/A | | | N/A |
| * | The term of office for each Trustee listed above will continue indefinitely and officers listed above serve subject to annual reappointment. |
| ** | The term “Fund Complex” refers to the Vertical Capital Income Fund. |
| *** | Mr. Chapman is an interested Trustee because he is also an officer of the Fund’s investment adviser. |
The Fund’s Statement of Additional Information includes additional information about the Trustees and is available free of charge, upon request, by calling toll-free at 1-866-277-VCIF.
PRIVACY NOTICE
Rev. May 2012
| FACTS | WHAT DOES VERTICAL CAPITAL INCOME FUND DO WITH YOUR PERSONAL INFORMATION? |
| | |
| Why? | Financial companies choose how they share your personal information. Federal law gives consumers the right to limit some but not all sharing. Federal law also requires us to tell you how we collect, share, and protect your personal information. Please read this notice carefully to understand what we do. |
| | |
| What? | The types of personal information we collect and share depend on the product or service you have with us. This information can include: |
| | |
| | ■ | Social Security number | ■ | Purchase History |
| | | | | |
| | ■ | Assets | ■ | Account Balances |
| | | | | |
| | ■ | Retirement Assets | ■ | Account Transactions |
| | | | | |
| | ■ | Transaction History | ■ | Wire Transfer Instructions |
| | | | | |
| | ■ | Checking Account Information | | |
| | |
| | When you are no longer our customer, we continue to share your information as described in this notice. |
| | |
| How? | All financial companies need to share customers’ personal information to run their everyday business. In the section below, we list the reasons financial companies can share their customers’ personal information; the reasons Vertical Capital Income Fund chooses to share; and whether you can limit this sharing. |
| Reasons we can share your personal information | Does Vertical
Capital Income
Fund share? | Can you limit this sharing? |
For our everyday business purposes – such as to process your transactions, maintain your account(s), respond to court orders and legal investigations, or report to credit bureaus | Yes | No |
For our marketing purposes – to offer our products and services to you | No | We don’t share |
| For joint marketing with other financial companies | No | We don’t share |
For our affiliates’ everyday business purposes – information about your transactions and experiences | No | We don’t share |
For our affiliates’ everyday business purposes – information about your creditworthiness | No | We don’t share |
| For nonaffiliates to market to you | No | We don’t share |
| Questions? | Call 1-866-277-VCIF |
Rev. May 2012
| Who we are |
Who is providing this notice? | Vertical Capital Income Fund |
| What we do |
| How does Vertical Capital Income Fund protect my personal information? | To protect your personal information from unauthorized access and use, we use security measures that comply with federal law. These measures include computer safeguards and secured files and buildings. Our service providers are held accountable for adhering to strict policies and procedures to prevent any misuse of your nonpublic personal information. |
| How does Vertical Capital Income Fund collect my personal information? | We collect your personal information, for example, when you ■ Open an account ■ Provide account information ■ Give us your contact information ■ Make deposits or withdrawals from your account ■ Make a wire transfer ■ Tell us where to send the money ■ Tells us who receives the money ■ Show your government-issued ID ■ Show your driver’s license We also collect your personal information from other companies. |
| Why can’t I limit all sharing? | Federal law gives you the right to limit only ■ Sharing for affiliates’ everyday business purposes – information about your creditworthiness ■ Affiliates from using your information to market to you ■ Sharing for nonaffiliates to market to you State laws and individual companies may give you additional rights to limit sharing. |
| Definitions |
| Affiliates | Companies related by common ownership or control. They can be financial and nonfinancial companies. ■ Vertical Capital Income Fund does not share with our affiliates. |
| Nonaffiliates | Companies not related by common ownership or control. They can be financial and nonfinancial companies ■ Vertical Capital Income Fund does not share with nonaffiliates so they can market to you. |
| Joint marketing | A formal agreement between nonaffiliated financial companies that together market financial products or services to you. ■ Vertical Capital Income Fund doesn’t jointly market. |
| | | | | | |
How to Obtain Proxy Voting Information
Information regarding how the Fund votes proxies relating to portfolio securities for the 12 month period ended June 30th as well as a description of the policies and procedures that the Fund used to determine how to vote proxies is available without charge, upon request, by calling 1-866-277-VCIF by referring to the Securities and Exchange Commission’s (“SEC”) website at http://www.sec.gov.
How to Obtain 1st and 3rd Fiscal Quarter Portfolio Holdings
The Fund files its complete schedule of portfolio holdings with the SEC for the first and third quarters of each fiscal year on Form N-Q. Form N-Q is available on the SEC’s website at http://www.sec.gov and may be reviewed and copied at the SEC’s Public Reference Room in Washington, DC (1-800-SEC-0330). The information on Form N-Q is available without charge, upon request, by calling 1-866-277-VCIF.
| Investment Adviser |
| Oakline Advisors, LLC |
| 15601 Dallas Parkway, Suite 600 |
| Addison, Texas 75001 |
| |
| Administrator |
| Gemini Fund Services, LLC |
| 80 Arkay Drive |
| Hauppauge, NY 11788 |
Item 2. Code of Ethics.
(a) As of the end of the period covered by this report, the registrant has adopted a code of ethics that applies to the registrant's principal executive officer, principal financial officer, principal accounting officer or controller, or persons performing similar functions, regardless of whether these individuals are employed by the registrant or a third party.
(b) For purposes of this item, “code of ethics” means written standards that are reasonably designed to deter wrongdoing and to promote:
| (1) | Honest and ethical conduct, including the ethical handling of actual or apparent conflicts of interest between personal and professional relationships; |
| (2) | Full, fair, accurate, timely, and understandable disclosure in reports and documents that a registrant files with, or submits to, the Commission and in other public communications made by the registrant; |
(3) Compliance with applicable governmental laws, rules, and regulations;
| (4) | The prompt internal reporting of violations of the code to an appropriate person or persons identified in the code; and |
(5) Accountability for adherence to the code.
(c) Amendments: During the period covered by the report, there have not been any amendments to the provisions of the code of ethics.
(d) Waivers: During the period covered by the report, the registrant has not granted any express or implicit waivers from the provisions of the code of ethics.
Item 3. Audit Committee Financial Expert.
The registrant’s board of trustees has determined that the registrant does not have an audit committee financial expert serving on its audit committee.
Item 4. Principal Accountant Fees and Services
Registrant Advisor
FYE 09/30/16 $141,500 N/A
FYE 09/30/15 $130,193 N/A
Registrant Advisor
FYE 09/30/16 $0 N/A
FYE 09/30/15 $0 N/A
Registrant Advisor
FYE 09/30/16 $0 N/A
FYE 09/30/15 $0 N/A
Preparation of Federal & State income tax returns, assistance with calculation of required income, capital gain and excise distributions and preparation of Federal excise tax returns.
Registrant Advisor
FYE 09/30/16 $0 N/A
FYE 09/30/15 $0 N/A
| (e) | (1) Audit Committee’s Pre-Approval Policies |
The registrant’s Audit Committee is required to pre-approve all audit services and, when appropriate, any non-audit services (including audit-related, tax and all other services) to the registrant. The registrant’s Audit Committee also is required to pre-approve, when appropriate, any non-audit services (including audit-related, tax and all other services) to its adviser, or any entity controlling, controlled by or under common control with the adviser that provides ongoing services to the registrant, to the extent that the services may be determined to have an impact on the operations or financial reporting of the registrant. Services are reviewed on an engagement by engagement basis by the Audit Committee.
| (2) | Percentages of Services Approved by the Audit Committee |
Registrant Advisor
Audit-Related Fees: N/A N/A
Tax Fees: N/A N/A
All Other Fees: N/A N/A
| (f) | During the audit of registrant's financial statements for the most recent fiscal year, less than 50 percent of the hours expended on the principal accountant's engagement were attributed to work performed by persons other than the principal accountant's full-time, permanent employees. |
| (g) | The aggregate non-audit fees billed by the registrant's accountant for services rendered to the registrant, and rendered to the registrant's investment adviser (not including any sub-adviser whose role is primarily portfolio management and is subcontracted with or overseen by another investment adviser), and any entity controlling, controlled by, or under common control with the adviser that provides ongoing services to the registrant: |
Registrant Advisor
FYE 09/30/2016 $0 N/A
FYE 09/30/2015 $0 N/A
(h) The registrant's audit committee has considered whether the provision of non-audit services to the registrant's investment adviser (not including any sub-adviser whose role is primarily portfolio management and is subcontracted with or overseen by another investment adviser), and any entity controlling, controlled by, or under common control with the investment adviser that provides ongoing services to the registrant, that were not pre-approved pursuant to paragraph (c)(7)(ii) of Rule 2-01 of Regulation S-X, is compatible with maintaining the principal accountant's independence.
Item 5. Audit Committee of Listed Companies. Not applicable.
Item 6. Schedule of Investments. See Item 1.
Item 7. Disclosure of Proxy Voting Policies and Procedures for Closed-End Funds.
Pursuant to the adoption by the Securities and Exchange Commission (the “Commission”) of Rule 206(4)-6 (17 CFR 275.206(4)-6) and amendments to Rule 204-2 (17 CFR 275.204-2) under the Investment Adviser Act of 1940 (the “Act”), it is a fraudulent, deceptive, or manipulative act, practice or course of business, within the meaning of Section 206(4) of the Act, for an investment adviser to exercise voting authority with respect to client securities, unless (i) the adviser has adopted and implemented written policies and procedures that are reasonably designed to ensure that the adviser votes proxies in the best interests of its clients, (ii) the adviser describes its proxy voting procedures to its clients and provides copies on request, and (iii) the adviser discloses to clients how they may obtain information on how the adviser voted their proxies.
In order to fulfill its responsibilities under the Act, Vertical Capital Asset Management, LLC (hereinafter, “we” or “our”) has adopted the following policies and procedures for proxy voting with regard to direct investments in companies held in investment portfolios of our clients.
KEY OBJECTIVES
The key objectives of these policies and procedures recognize that a company’s management is entrusted with the day-to-day operations and longer term strategic planning of the company, subject to the oversight of the company’s board of directors. While “ordinary business matters” are primarily the responsibility of management and should be approved solely by the corporation’s board of directors, these objectives also recognize that the company’s shareholders must have final say over how management and directors are performing, and how shareholders’ rights and ownership interests are handled, especially when matters could have substantial economic implications to the shareholders.
Therefore, we will pay particular attention to the following matters in exercising our proxy voting responsibilities as a fiduciary for our clients:
Accountability. Each company should have effective means in place to hold those entrusted with running a company’s business accountable for their actions. Management of a company should be accountable to its board of directors and the board should be accountable to shareholders.
Alignment of Management and Shareholder Interests. Each company should endeavor to align the interests of management and the board of directors with the interests of the company’s shareholders. For example, we generally believe that compensation should be designed to reward management for doing a good job of creating value for the shareholders of the company.
Transparency. Promotion of timely disclosure of important information about a company’s business operations and financial performance enables investors to evaluate the performance of a company and to make informed decisions about the purchase and sale of a company’s securities.
DECISION METHODS
We generally believe that portfolio managers that invest in and track particular companies have a unique perspective to make decisions with regard to proxy votes. Therefore, we rely on that perspective to make the final decisions on how to cast proxy votes.
No set of proxy voting guidelines can anticipate all situations that may arise. In special cases, we may seek insight and expertise from outside sources as to how a particular proxy proposal will impact the financial prospects of a company, and vote accordingly.
In some instances, a proxy vote may present a conflict between the interests of a client, on the one hand, and our interests or the interests of a person affiliated with us, on the other. In such a case, we will abstain from making a voting decision and will forward all of the necessary proxy voting materials to the client to enable the client to cast the votes.
SUMMARY OF PROXY VOTING GUIDELINES
Election of the Board of Directors
We believe that good corporate governance generally starts with a board composed primarily of independent directors, unfettered by significant ties to management, all of whose members are elected annually. We also believe that some measure of turnover in board composition typically promotes more independent board action and fresh perspectives on governance. Of greater importance is the skill set of the proposed board member. We will also look at the backgrounds of the directors to gauge their business acumen and any special talent or experience that may add value to their participation on the board.
The election of a company’s board of directors is one of the most fundamental rights held by shareholders. Because a classified board structure prevents shareholders from electing a full slate of directors annually, we will pay special attention to efforts to declassify boards or other measures that permit shareholders to remove a majority of directors at any time.
Approval of Independent Auditors
We believe that the relationship between a company and its auditors should be limited primarily to the audit engagement, although it may include certain closely related activities that do not raise an appearance of impaired independence.
We will evaluate on a case-by-case basis instances in which the audit firm has a substantial non-audit relationship with a company to determine whether we believe independence has been, or could be, compromised.
Equity-based compensation plans
We believe that appropriately designed equity-based compensation plans, approved by shareholders, can be an effective way to align the interests of shareholders and the interests of directors, management, and employees by providing incentives to increase shareholder value. Conversely, we are opposed to plans that substantially dilute ownership interests in the company, provide participants with excessive awards, or have inherently objectionable structural features.
We will generally support measures intended to increase stock ownership by executives and the use of employee stock purchase plans to increase company stock ownership by employees. These may include:
1. Requiring senior executives to hold stock in a company.
2. Requiring stock acquired through option exercise to be held for a certain period of time.
These are guidelines, and we consider other factors, such as the nature of the industry and size of the company, when assessing a plan’s impact on ownership interests.
Corporate Structure
We view the exercise of shareholders’ rights, including the rights to act by written consent, to call special meetings and to remove directors, to be fundamental to good corporate governance.
Because classes of common stock with unequal voting rights limit the rights of certain shareholders, we generally believe that shareholders should have voting power equal to their equity interest in the company and should be able to approve or reject changes to a company’s by-laws by a simple majority vote.
We will generally support the ability of shareholders to cumulate their votes for the election of directors.
Shareholder Rights Plans
There are arguments both in favor of and against shareholder rights plans, also known as poison pills. For example, such measures may tend to entrench or provide undue compensation to current management, which we generally consider to have a negative impact on shareholder value. Therefore, our preference is for a plan that places shareholder value in a priority position above interests of management.
SUMMARY OF PROXY VOTING PROCEDURES
As a fiduciary to its investors, we recognize the need to actively manage and vote proxies and other shareholder actions and consents that may arise in the course of its investment advisory activities on behalf of its clients. However, due to the nature of the investments of the Fund and indirect exposure to underlying equity investments, we believe that it would be rare that we would be in a position to cast a vote or called upon to vote a proxy.
In the event that we do receive a proxy notice, shareholder consent, or is otherwise entitled to vote on any issue related to the investments of its advisory client accounts, we will process and vote all shareholder proxies and other actions in a timely manner insofar as we can determine based on the facts available at the time of its action, in the best interests of the affected advisory client(s). Although we expect that proxies will generally be voted in a manner consistent with the guidelines set forth in this policy, there may be individual cases where, based on facts available, voting according to policy would not be in the best interests of the fund and its shareholders. In such cases, we may vote counter to the stated policy.
Proxy Voting Procedure
1) Notices received are reviewed by the Compliance Department;
2) Forwarded to the Investment Department for review and voting decision;
3) Vote or consent entered according to our best judgment under the facts and circumstances presented. Such decision shall be made and documented;
4) Final review and sign-off by Compliance Department and filing with a copy in the Proxy Voting Log.
We may at any time, outsource Proxy Voting responsibilities to Institutional Shareholder Services (“ISS”) or similar service provider that we may approve, provided that such service provider votes each proxy based on decisions made by us.
CLIENT INFORMATION
A copy of these Proxy Voting Policies and Procedures is available to our clients, without charge, upon request, by calling 1-866-277-VCIF. We will send a copy of these Proxy Voting Policies and Procedures within three business days of receipt of a request, by first-class mail or other means designed to ensure equally prompt delivery.
In addition, we will provide each client, without charge, upon request, information regarding the proxy votes cast by us with regard to the client’s securities.
Item 8. Portfolio Managers of Closed-End Management Investment Companies.
As of September 30, 2016, Mr. Chapman, Chairman of the Board and Executive Vice President of the Adviser, and Mr. David Aisner, Executive Vice President of the Adviser, are the Fund's co-portfolio managers. Each share primary responsibility for management of the Fund's investment portfolio and have served the Fund in this capacity since July 6, 2015. Mr. Chapman and Mr. Chase are not compensated through their share of the profits, if any, of the Adviser. Because the portfolio managers may manage assets for other pooled investment vehicles and/or other accounts (including institutional clients, pension plans and certain high net worth individuals) (collectively "Client Accounts"), or may be affiliated with such Client Accounts, there may be an incentive to favor one Client Account over another, resulting in conflicts of interest. For example, the Adviser may, directly or indirectly, receive fees from Client Accounts that are higher than the fee it receives from the Fund, or it may, directly or indirectly, receive a performance-based fee on a Client Account. In those instances, a portfolio manager may have an incentive to not favor the Fund over the Client Accounts. The Adviser has adopted trade allocation and other policies and procedures that it believes are reasonably designed to address these and other conflicts of interest. As September 30, 2016, Mr. Chapman and Mr. Aisner owned no shares of the Fund.
As of September 30, 2016, Mr. Chapman was responsible for the management of the following types of accounts in addition to the Fund:
| Other Accounts By Type | Total Number of Accounts by Account Type | Total Assets By Account Type | Number of Accounts by Type Subject to a Performance Fee | Total Assets By Account Type Subject to a Performance Fee |
| Registered Investment Companies | 0 | $0 | 0 | $0 |
| Other Pooled Investment Vehicles | 0 | $0 | 0 | $0 |
| Other Accounts | 0 | $0 | 0 | $0 |
As of September 30, 2016, Mr. Aisner was responsible for the management of the following types of accounts in addition to the Fund:
| Other Accounts By Type | Total Number of Accounts by Account Type | Total Assets By Account Type | Number of Accounts by Type Subject to a Performance Fee | Total Assets By Account Type Subject to a Performance Fee |
| Registered Investment Companies | 0 | $0 | 0 | $0 |
| Other Pooled Investment Vehicles | 0 | $0 | 0 | $0 |
| Other Accounts | 0 | $0 | 0 | $0 |
Item 9. Purchases of Equity Securities by Closed-End Management Investment Company and Affiliated Purchasers. Not applicable.
Item 10. Submission of Matters to a Vote of Security Holder. None.
Item 11. Controls and Procedures.
(a) Based on an evaluation of the Registrant’s disclosure controls and procedures as of a date within 90 days of filing date of this Form N-CSR, the principal executive officer and principal financial officer of the Registrant have concluded that the disclosure controls and procedures of the Registrant are reasonably designed to ensure that the information required in filings on Form N-CSR is recorded, processed, summarized, and reported by the filing date, including that information required to be disclosed is accumulated and communicated to the Registrant’s management, including the Registrant’s principal executive officer and principal financial officer, as appropriate to allow timely decisions regarding required disclosure.
(b) There were no significant changes in the registrant’s internal control over financial reporting that occurred during the second fiscal quarter of the period covered by this report (in the registrant’s second fiscal half-year in the case of an annual report) that have materially affected, or are reasonably likely to materially affect, the registrant’s internal control over financial reporting. However, a change to the internal control over financial reporting was made subsequent to the end of the reporting period. This change provides for (1) the remodeling of Mortgage Notes to include additional information related to modified loans; (2) validation of the data inputs to insure complete and accurate information used to calculate the fair value; (3) enhancement of data transfer between third-party service providers to provide a more complete dataset to determine the fair value; (4) conducting of back-testing that reasonably supports the assumptions used in fair valuing the securities and (5) developing enhanced escalation procedures to address any fair valuation concerns—these enhanced escalation procedures are expected to be completed by the registrant’s next filing on this Form.
Item 12. Exhibits.
(a)(1) Code of Ethics filed herewith.
(a)(2) Certification(s) required by Section 302 of the Sarbanes-Oxley Act of 2002 (and Item 11(a)(2) of Form N-CSR) are filed herewith.
(a)(3) Not applicable.
(b) Certification(s) required by Section 906 of the Sarbanes-Oxley Act of 2002 (and Item 11(b) of Form N-CSR) are filed herewith.
SIGNATURES
Pursuant to the requirements of the Securities Exchange Act of 1934 and the Investment Company Act of 1940, the registrant has duly caused this report to be signed on its behalf by the undersigned, thereunto duly authorized.
(Registrant) Vertical Capital Income Fund
By (Signature and Title)
* /s/Michael D. Cohen
Michael D. Cohen, President
Date 3/22/17
Pursuant to the requirements of the Securities Exchange Act of 1934 and the Investment Company Act of 1940, this report has been signed below by the following persons on behalf of the registrant and in the capacities and on the dates indicated.
By (Signature and Title)
* /s/Michael D. Cohen
Michael D. Cohen, President
Date 3/22/17
By (Signature and Title)
* /s/S. Jason Hall
S. Jason Hall Treasurer
Date 3/22/17
* Print the name and title of each signing officer under his or her signature.