united states
securities and exchange commission
washington, d.c. 20549
form n-csr
certified shareholder report of registered management
investment companies
Investment Company Act file number 811-22554
Vertical Capital Income Fund
(Exact name of registrant as specified in charter)
80 Arkay Drive, Hauppauge, NY 11788
(Address of principal executive offices) (Zip code)
Gemini Fund Services, LLC
17645 Wright Street, Omaha, Nebraska, 68130
(Name and address of agent for service)
Registrant's telephone number, including area code: 631-470-2616
Date of fiscal year end: 9/30
Date of reporting period:9/30/19
Item 1. Reports to Stockholders.
| | | |
| | | |
| | | |
| | | |
| | | |
| | | |
| | | |
| | | |
| | | |
| | | |
| | Vertical Capital Income Fund | |
| | | |
| | | |
| | | |
| | VCIF | |
| | Cusip: 92535C104 | |
| | | |
| | | |
| | Annual Report | |
| | September 30, 2019 | |
| | | |
| | | |
| | | |
| | | |
| | | |
| | | |
| | Investor Information: 1-866-277-VCIF | |
| | | |
| | | |
| | | |
| | This report and the financial statements contained herein are submitted for the general information of shareholders. Nothing contained herein is to be considered an offer of sale or solicitation of an offer to buy shares of the Vertical Capital Income Fund. | |
| | | |
| | Beginning on January 1, 2021, as permitted by regulations adopted by the Securities and Exchange Commission, paper copies of the Fund’s shareholder reports like this one will no longer be sent by mail, unless you specifically request paper copies of the reports. Instead, the reports will be made available on the Fund’s website https://www.vertical-incomefund.com/, and you will be notified by mail each time a report is posted and provided with a website link to access the report. | |
| | | |
| | If you already elected to receive shareholder reports electronically, you will not be affected by this change and you need not take any action. You may elect to receive shareholder reports and other communications from the Fund electronically or to continue receiving paper copies of shareholder reports, which are available free of charge, by contacting your financial intermediary (such as a broker-dealer or bank) or, if you are a direct investor, by following the instructions included with paper Fund documents that have been mailed to you. | |
| | | |
| | | |
| | | |
| | | |
| | | |
| | | |
| | | |

November 27, 2019
Dear Shareholder,
We have mixed feelings as we report to you the results of another year for the Vertical Capital Income Fund (the “Fund”). While we are pleased with our investment performance and your decision to seek liquidity through a listing, we are displeased that the Fund had to bear significant non-recurring costs in dealing with a proxy challenge, resulting in lower earnings and distributions than otherwise would have occurred.
As a result of the Trustees’ desire to provide additional liquidity for the Fund’s shareholders, the Trustees undertook an analysis of strategic options to determine the best path forward for the Fund’s investors. In the end, the decision was made that a listing on the New York Stock Exchange (“NYSE”) would benefit shareholders the most. To list and cease operations as an “interval” fund that provides liquidity through quarterly repurchase offers; the Fund needed shareholder approval, which was obtained through a proxy vote in March 2019. The Fund then applied for listing with the NYSE and, after receiving approval, began trading on May 29, 2019.
Soon thereafter as a result of a technical change of control of the parent ownership of the Fund’s advisor, which did not in any way effect the daily management of the Fund or the economic terms of the advisory agreement; the Fund was required to again obtain shareholder approval through another proxy solicitation for the renewal of the Fund’s advisory agreement. Shortly after mailing the proxy statements, the Fund was notified by an activist investor that it was seeking to contest the proxy and press management to undertake a plan of liquidation. The activist took this position despite the fact that the Fund’s shareholders had just a few months earlier voted in support of a listing on the NYSE in lieu of pursuing other strategic alternatives, including liquidation.
In October 2019 the Fund accepted the certified final report of the independent inspector of election that determined the renewal of the advisory agreement had been approved. The cost to the Fund of dealing with this matter through September 30, 2019 was approximately $684,000, representing approximately $0.066 per share of distributions lost to you, our shareholders. The negative impact on the Fund’s share price cannot be measured.
Update on Financial Performance
The Fund made distributions from operations aggregating approximately $0.34 per share for the fiscal year ended September 30, 2019. In addition, the Fund made a special distribution of approximately $0.20 per share in December 2018 as a result of net capital gains realized on loan sales and loan payoffs for the taxable year 2018. The Fund expects to make another similar special distribution currently estimated at approximately $0.20 per share in December 2019. The annualized dividend yield, excluding net capital gain distributions, for the period October 2018 through May 2019, prior to the Fund’s listing, was approximately 4.13%. The annualized dividend yield thereafter was approximately 1.96%, primarily reflecting the negative impact of the cost of dealing with the activist investor and the contested proxy.
Based on NAV, for the fiscal year ended September 30, 2019, the Fund produced a total return (load waived) of 8.80% (including the $0.20 per share special dividend paid in December 2018) compared to one of its key benchmarks, the Barclays Capital Mortgage Backed Securities Index, which reported a total return of 7.80%. Including the maximum load, the Fund’s total return was 2.51%. Since inception through the end of our fiscal year 2019, the Fund has produced an annualized total return of 7.97%. The SEC Yield as of September 30, 2019, including the expense cap subsidized by the Advisor, totaled 0.40%.
Since the Fund listed on the NYSE mid-year without the benefit of an initial offering price, any performance measurement from the date of listing through September 30, 2019, when the Fund’s closing price was $10.68 per
share, would be difficult to give a traditional meaning. However, there are several conclusions from this period that are worth noting. First, notwithstanding the Fund’s eight-year track record, the Fund listed on the NYSE with little visibility among trading market participants. Second, although the Fund’s quarterly redemption queue was a consideration in the decision to list the Fund, there was a lack of specificity concerning the intentions of individual shareholders. Notwithstanding, management expected that there might be more downward pressure on the shares than upward interest immediately after listing due to some shareholders seeking immediate liquidity. Third, management knew that it would take some time for many shareholders to register their shares with the DTC, thereby delaying their ability to trade, should they want to. Fourth, the uncertainty caused by the actions of the activist may have weakened market interest in the shares. And fifth, we know the dividend yield would have been higher without the negative impact of the non-recurring costs noted above. Next year we will be reporting investment performance based on over a year of market share price, in addition to performance based on NAV.
We believe the downward pressure created by legacy shareholders seeking liquidity, combined with the activist-related disruptions, have not given the Fund a runway to demonstrate its full return profile and value proposition in an undisputed manner. Looking forward, we are hopeful and continue to believe in both the Fund’s fundamental investment strategy and in management’s ability to generate competitive risk-adjusted returns. The listing has stabilized the Fund’s asset base and eliminated the quarterly redemption overhang. Those factors should enhance our ability to more fully execute the Fund’s investment strategy by making long-term decisions that are in the best interest of shareholders. The Fund’s earnings should additionally benefit from the accretive deployment of capital previously held in reserve for contingencies, in addition to the judicious use of the Fund’s line of credit.
Update on Economic Outlook and Fund Strategy
During the past year, the U.S. economy again grew; however, at a slower pace than last year. Real GDP is expected to average 2.0% for the 12 months ended September 30, 2019 compared to approximately 2.8% for the twelve months ended September 30, 2018. The first half of the calendar year was fueled by consumer spending and business investment, both of which slowed in the third quarter of 2019. Expectations are for more cooling in the coming quarters. Current forecasts suggest GDP should be in the 1.1% range for calendar 2020 and 1.4% for 2021. The unemployment rate has trended down slightly from 3.8% at the beginning of the fiscal year, based on a tight job market; but it is now expected to increase back to around 4.1% in 2020 and 2021.
For some time, the Federal Reserve’s focus has been on containing inflation, yet, in a defensive move in July 2019, the Fed lowered its short-term benchmark rate for the first time since 2008, dropping rates by 0.50% to their second quarter 2018 level. Last year, forecasters predicted a Fed Funds rate of 3.25% by the end of 2019 and 3.5% by the end of 2020. Now predictions are that the Fed will likely continue to lower rates again in 2020.
One reason for the Fed’s defensive positioning is that there is much uncertainty concerning the broader global economy, once again underscored by the ups and downs of the escalating U.S. -China trade war, as well as the continuing saga of Brexit. Many investors have moved into safer investments, including sovereign debt, pushing down long-term interest rates. At September 30, 2019, mid-term US Treasury rates were lower than short-term rates, resulting in a partially inverted yield curve, seen by many as a sign of a coming recession. A year ago, the 10-year U.S. Treasury rate was approximately 3.0%, and long-term rates were expected to rise by 25 bps before the end of 2018 and by another 50 bps by mid-2019. Instead rates have fallen over that period, with the 10-year Treasury at 1.68% on September 30, 2019.
Economic growth helps support jobs and wage growth, and along with population growth and household formation, are important factors in creating demand for housing. Slightly less than two-thirds of all U. S. households own a home. Home ownership generates demand for purchase mortgage originations and for refinancing of existing mortgages. Mortgage volume is also highly influenced by home prices, the inventory of homes for sale, particularly newly constructed housing, and by the cost of mortgage financing.
Total mortgage originations for calendar year 2019 are expected to be $1.89 trillion, an increase over last year’s projection, due primarily to a 38% increase in projected refinancing volume of $633 billion, as a result of lower interest rates. Volume for 2020 is projected to be around $1.7 trillion, of which 25% is estimated to be refinancing.
The Fund primarily invests in first mortgage, residential whole loans traded in the secondary market at a discount to their unpaid principal balances. The secondary whole loan market is part of the larger almost $11 trillion residential mortgage market which boasts a deep roster of institutional participants. As such, we are comfortable that we will continue to see one-off and portfolio acquisition opportunities, as well as disposition opportunities when it makes sense for the Fund to sell.
Update on the Portfolio and Liquidity
At September 30, 2019 the Fund owned 764 individual loans with an average unpaid principal balance of approximately $169,000 and an average collateral value of approximately $236,000, or 71%. By comparison the median prices of existing and new homes in the U.S. are approximately $280,000 and $318,000, respectively, with average down payments upon purchase of 13% and 6%, respectively. We continue to be pleased with the fundamental character of the portfolio and each of its key metrics, including acquisition cost, current loan-to-collateral value, nominal and effective interest rates, borrower FICO scores and delinquency rates, among others.
We employ a conservative approach to managing the Fund’s financial position, focusing primarily on the generation of current income while maintaining a positive net working capital position and low, if any, leverage. In addition to scheduled monthly amortization payments, the Fund typically receives unscheduled receipts of loan payoffs as a result of home sales or refinancing. Coupled with the proceeds from sale of loans, the Fund is able to self-generate cash available for investment. In addition, the Fund has a $35 million bank line of credit for general working capital purposes, including investment. The Fund had $2.5 million outstanding on the line of credit at year-end.
We again appreciate your support during the past year and look forward to working on your behalf in 2020.
Regards,
Robert J. Chapman
Chairman of the Board of Trustees and Co-Portfolio Manager
David Aisner
Co-Portfolio Manager
Past performance is neither indicative nor a guarantee of future results.The performance data quoted here represents past performance. Current performance may be lower or higher than the performance data quoted above. The investment return and principal value of an investment will fluctuate so that investor’s shares, when sold, may be worth more or less than their original cost. Results shown reflect the Fund’s expense waiver, without which the results could have been lower. For more recent price information please go to vertical-incomefund.com.
This material contains forward-looking statements relating to the business and financial outlook of Vertical Capital Income Fund that are based on our current expectations, estimates, forecasts and projections and are not guarantees of future performance. There is no assurance that the Fund will achieve its investment objective. Actual results may differ materially from those expressed in these forward-looking statements, and you should not place undue reliance on any such statements. A number of important factors could cause actual results to differ materially from the forward-looking statements contained in this material.
Securities may be subject to prepayment risk because borrowers are typically able to prepay principal. The Fund will not invest in real estate directly, but, because the Fund will invest the majority of its assets in securities secured by real estate, its portfolio will be significantly impacted by the performance of the real estate market and may experience more volatility and be exposed to greater risk than a more diversified portfolio.
| Vertical Capital Income Fund |
| PORTFOLIO REVIEW (Unaudited) |
| September 30, 2019 |
PERFORMANCE OF A $10,000 INVESTMENT
(Based upon Net Asset Value)
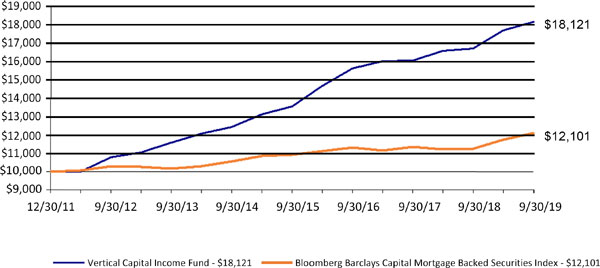
| The Fund’s performance figures for the period ended September 30, 2019, compared to its |
| benchmark: |
| | | | | | |
| | | One Year | Three Years | Five Years | Since Inception* |
| Vertical Capital Income Fund-NAV | 8.62% | 5.15% | 7.86% | 7.97% |
| Vertical Capital Income Fund-Market Price ** | -8.73% | -1.04% | 4.08% | 5.52% |
| Bloomberg Barclays Capital Mortgage Backed Securities Index | 7.80% | 2.32% | 2.80% | 2.49% |
| * | The Fund commenced operations on December 30, 2011. The performance of the Fund is based on average annual returns. |
| ** | The calculation is comparing the Market Price to the NAV until the initial Market Price on May 30, 2019. |
The Bloomberg Barclays Capital Mortgage Backed Securities Index is an unmanaged index composed of securities backed by mortgage pools of Ginnie Mae, Freddie Mac and Fannie Mae. Investors cannot invest directly in an index or benchmark.
Past performance is not predictive of future results. The investment return and principal value of an investment will fluctuate. An investor’s shares, when redeemed, may be worth more or less than the original cost. Total return is calculated assuming reinvestment of all dividends and distributions. Total returns would have been lower had the dviser not waived its fees and reimbursed a portion of the Fund’s expenses. For performance information current to the most recent month-end, please call 1-866-277-VCIF.
| PORTFOLIO COMPOSITION*** |
| |
| Mortgage Notes | | | 99.7 | % |
| Other Investments | | | 0.3 | % |
| | | | 100.0 | % |
*** Based on Investments at Value as of September 30, 2019.
| Vertical Capital Income Fund |
| PORTFOLIO OF INVESTMENTS |
| September 30, 2019 |
| Principal | | | | | Loan Type | | Interest Rate | | | Maturity | | Fair Value | |
| | | | | MORTGAGE NOTES - 97.9% | | | | | | | | | | | | |
| $ | 113,914 | | | Loan ID 200003 | | Fixed | | | 7.250 | % | | 9/1/2035 | | $ | 101,667 | |
| | 230,985 | | | Loan ID 200004 | | Fixed | | | 7.990 | % | | 10/1/2036 | | | 242,535 | |
| | 48,672 | | | Loan ID 200012 | | ARM | | | 9.800 | % | | 7/1/2037 | | | 49,751 | |
| | 35,524 | | | Loan ID 200016 | | ARM | | | 10.375 | % | | 1/1/2031 | | | 37,300 | |
| | 47,445 | | | Loan ID 200018 | | Fixed | | | 7.000 | % | | 1/1/2033 | | | 49,817 | |
| | 97,739 | | | Loan ID 200023 | | Fixed | | | 5.875 | % | | 12/1/2050 | | | 91,671 | |
| | 205,980 | | | Loan ID 200026 | | Interest Only | | | 4.750 | % | | 1/1/2050 | | | 215,490 | |
| | 228,102 | | | Loan ID 200028 | | Fixed | | | 4.875 | % | | 6/1/2050 | | | 239,350 | |
| | 201,942 | | | Loan ID 200029 | | Fixed | | | 6.310 | % | | 7/1/2037 | | | 206,832 | |
| | 320,872 | | | Loan ID 200032 | | Fixed | | | 3.130 | % | | 1/1/2051 | | | 305,960 | |
| | 539,346 | | | Loan ID 200035 | | Fixed | | | 4.625 | % | | 11/1/2050 | | | 562,536 | |
| | 152,438 | | | Loan ID 200037 | | Fixed | | | 7.800 | % | | 5/1/2035 | | | 160,059 | |
| | 111,310 | | | Loan ID 200041 | | Fixed | | | 4.875 | % | | 8/1/2039 | | | 116,876 | |
| | 38,931 | | | Loan ID 200042 | | Fixed | | | 7.000 | % | | 12/1/2037 | | | 40,878 | |
| | 48,550 | | | Loan ID 200043 | | Fixed | | | 6.125 | % | | 7/1/2039 | | | 50,977 | |
| | 49,544 | | | Loan ID 200048 | | Fixed | | | 5.500 | % | | 8/1/2039 | | | 52,021 | |
| | 147,496 | | | Loan ID 200052 | | Fixed | | | 5.125 | % | | 5/1/2040 | | | 154,871 | |
| | 52,265 | | | Loan ID 200054 | | Fixed | | | 8.250 | % | | 3/1/2039 | | | 54,878 | |
| | 78,999 | | | Loan ID 200055 | | Fixed | | | 10.000 | % | | 1/5/2036 | | | 82,949 | |
| | 119,239 | | | Loan ID 200057 | | ARM | | | 4.875 | % | | 10/1/2036 | | | 125,098 | |
| | 31,155 | | | Loan ID 200060 | | Fixed | | | 5.750 | % | | 8/1/2039 | | | 32,712 | |
| | 24,326 | | | Loan ID 200065 | | ARM | | | 9.000 | % | | 1/1/2037 | | | 25,542 | |
| | 190,183 | | | Loan ID 200075 | | Fixed | | | 4.250 | % | | 2/1/2042 | | | 198,041 | |
| | 157,496 | | | Loan ID 200076 | | Fixed | | | 4.250 | % | | 12/1/2041 | | | 163,635 | |
| | 24,410 | | | Loan ID 200078 | | Fixed | | | 7.000 | % | | 8/1/2036 | | | 25,630 | |
| | 133,362 | | | Loan ID 200079 | | Fixed | | | 5.000 | % | | 2/1/2059 | | | 121,565 | |
| | 64,737 | | | Loan ID 200082 | | Fixed | | | 8.250 | % | | 4/1/2040 | | | 58,581 | |
| | 176,046 | | | Loan ID 200084 | | Fixed | | | 7.000 | % | | 3/1/2039 | | | 153,185 | |
| | 190,887 | | | Loan ID 200086 | | Fixed | | | 4.250 | % | | 11/1/2050 | | | 158,601 | |
| | 218,064 | | | Loan ID 200087 | | Fixed | | | 6.000 | % | | 3/1/2051 | | | 205,750 | |
| | 116,692 | | | Loan ID 200088 | | Fixed | | | 7.000 | % | | 6/1/2039 | | | 101,446 | |
| | 256,323 | | | Loan ID 200089 | | Fixed | | | 3.875 | % | | 3/1/2052 | | | 216,544 | |
| | 271,213 | | | Loan ID 200090 | | Fixed | | | 4.500 | % | | 11/1/2036 | | | 76,650 | |
| | 124,386 | | | Loan ID 200093 | | Fixed | | | 5.000 | % | | 2/1/2038 | | | 130,605 | |
| | 70,632 | | | Loan ID 200102 | | Fixed | | | 8.250 | % | | 3/1/2040 | | | 71,100 | |
| | 107,513 | | | Loan ID 200110 | | Fixed | | | 8.250 | % | | 8/1/2039 | | | 112,888 | |
| | 69,180 | | | Loan ID 200128 | | Fixed | | | 4.710 | % | | 7/1/2037 | | | 52,463 | |
| | 444,762 | | | Loan ID 200129 | | Fixed | | | 4.625 | % | | 3/1/2052 | | | 395,053 | |
| | 26,581 | | | Loan ID 200131 | | Fixed | | | 3.875 | % | | 11/1/2027 | | | 27,318 | |
| | 116,004 | | | Loan ID 200135 | | Fixed | | | 4.375 | % | | 12/1/2042 | | | 121,131 | |
| | 119,217 | | | Loan ID 200137 | | Fixed | | | 4.500 | % | | 9/1/2042 | | | 124,930 | |
| | 75,522 | | | Loan ID 200141 | | Fixed | | | 4.250 | % | | 2/1/2042 | | | 77,601 | |
| | 119,559 | | | Loan ID 200143 | | Fixed | | | 3.000 | % | | 2/1/2037 | | | 117,905 | |
| | 379,287 | | | Loan ID 200145 | | Fixed | | | 4.625 | % | | 8/1/2051 | | | 342,876 | |
| | 95,445 | | | Loan ID 200152 | | ARM | | | 5.000 | % | | 9/1/2037 | | | 100,148 | |
| | 145,783 | | | Loan ID 200158 | | Fixed | | | 3.625 | % | | 12/1/2042 | | | 148,397 | |
| | 117,799 | | | Loan ID 200160 | | Fixed | | | 3.250 | % | | 2/1/2043 | | | 117,538 | |
| | 207,682 | | | Loan ID 200162 | | Fixed | | | 3.875 | % | | 7/1/2042 | | | 213,506 | |
| | 185,486 | | | Loan ID 200165 | | Fixed | | | 4.375 | % | | 12/1/2041 | | | 193,908 | |
| | 102,800 | | | Loan ID 200168 | | Fixed | | | 3.750 | % | | 10/1/2042 | | | 104,883 | |
| | | | | | | | | | | | | | | | | |
The accompanying notes are an integral part of these financial statements.
| Vertical Capital Income Fund |
| PORTFOLIO OF INVESTMENTS (Continued) |
| September 30, 2019 |
| Principal | | | | | Loan Type | | Interest Rate | | | Maturity | | Fair Value | |
| | | | | MORTGAGE NOTES (Continued) - 97.9% | | | | | | | | | |
| $ | 21,407 | | | Loan ID 200169 | | Fixed | | | 6.923 | % | | 9/1/2034 | | $ | 22,478 | |
| | 131,226 | | | Loan ID 200172 | | Fixed | | | 7.250 | % | | 2/1/2037 | | | 137,787 | |
| | 85,476 | | | Loan ID 200174 | | Fixed | | | 7.340 | % | | 4/1/2037 | | | 89,750 | |
| | 49,275 | | | Loan ID 200175 | | Fixed | | | 9.600 | % | | 5/1/2037 | | | 51,738 | |
| | 27,585 | | | Loan ID 200177 | | Fixed | | | 8.000 | % | | 1/11/2022 | | | 28,964 | |
| | 107,212 | | | Loan ID 200181 | | Fixed | | | 7.500 | % | | 6/1/2041 | | | 112,573 | |
| | 69,592 | | | Loan ID 200184 | | Fixed | | | 4.375 | % | | 12/1/2042 | | | 72,570 | |
| | 26,753 | | | Loan ID 200185 | | Fixed | | | 5.375 | % | | 6/1/2042 | | | 28,091 | |
| | 50,874 | | | Loan ID 200186 | | Fixed | | | 5.125 | % | | 8/1/2042 | | | 53,417 | |
| | 312,976 | | | Loan ID 200190 | | Fixed | | | 3.625 | % | | 11/1/2042 | | | 318,666 | |
| | 154,855 | | | Loan ID 200194 | | Fixed | | | 4.750 | % | | 9/1/2041 | | | 162,598 | |
| | 246,182 | | | Loan ID 200195 | | Fixed | | | 3.875 | % | | 3/1/2042 | | | 253,021 | |
| | 95,006 | | | Loan ID 200196 | | Fixed | | | 4.500 | % | | 1/1/2043 | | | 99,585 | |
| | 37,270 | | | Loan ID 200197 | | Fixed | | | 4.750 | % | | 11/1/2042 | | | 39,133 | |
| | 38,962 | | | Loan ID 200198 | | Fixed | | | 5.250 | % | | 10/1/2042 | | | 40,911 | |
| | 268,090 | | | Loan ID 200199 | | Fixed | | | 4.000 | % | | 9/1/2042 | | | 276,490 | |
| | 230,587 | | | Loan ID 200200 | | Fixed | | | 3.875 | % | | 9/1/2042 | | | 234,156 | |
| | 43,130 | | | Loan ID 200201 | | Fixed | | | 5.125 | % | | 8/1/2041 | | | 45,287 | |
| | 21,507 | | | Loan ID 200206 | | Fixed | | | 3.990 | % | | 12/1/2042 | | | 22,140 | |
| | 44,387 | | | Loan ID 200208 | | Fixed | | | 4.250 | % | | 1/1/2043 | | | 46,157 | |
| | 184,501 | | | Loan ID 200209 | | Fixed | | | 3.875 | % | | 8/1/2042 | | | 189,692 | |
| | 51,560 | | | Loan ID 200214 | | Fixed | | | 5.750 | % | | 7/1/2039 | | | 54,138 | |
| | 108,010 | | | Loan ID 200216 | | Fixed | | | 5.750 | % | | 9/1/2039 | | | 113,411 | |
| | 136,414 | | | Loan ID 200217 | | Fixed | | | 5.250 | % | | 7/1/2040 | | | 143,235 | |
| | 69,881 | | | Loan ID 200218 | | Fixed | | | 4.250 | % | | 12/1/2041 | | | 72,767 | |
| | 188,832 | | | Loan ID 200219 | | Fixed | | | 4.250 | % | | 4/1/2043 | | | 196,445 | |
| | 179,062 | | | Loan ID 200224 | | Fixed | | | 4.000 | % | | 7/1/2043 | | | 184,994 | |
| | 77,110 | | | Loan ID 200226 | | Fixed | | | 5.250 | % | | 7/1/2041 | | | 80,966 | |
| | 47,911 | | | Loan ID 200228 | | Fixed | | | 4.625 | % | | 8/1/2042 | | | 50,306 | |
| | 137,494 | | | Loan ID 200230 | | Fixed | | | 3.500 | % | | 2/1/2043 | | | 139,147 | |
| | 64,472 | | | Loan ID 200232 | | Fixed | | | 3.875 | % | | 8/1/2042 | | | 66,291 | |
| | 111,522 | | | Loan ID 200243 | | Fixed | | | 3.750 | % | | 4/1/2043 | | | 113,867 | |
| | 25,326 | | | Loan ID 200244 | | Fixed | | | 5.000 | % | | 5/1/2042 | | | 26,592 | |
| | 189,957 | | | Loan ID 200245 | | Fixed | | | 3.875 | % | | 3/1/2043 | | | 195,259 | |
| | 85,753 | | | Loan ID 200286 | | Fixed | | | 4.500 | % | | 7/1/2043 | | | 89,918 | |
| | 95,002 | | | Loan ID 200287 | | Fixed | | | 4.375 | % | | 7/1/2043 | | | 99,127 | |
| | 318,366 | | | Loan ID 200288 | | Fixed | | | 4.375 | % | | 11/1/2041 | | | 333,233 | |
| | 272,956 | | | Loan ID 200290 | | Fixed | | | 4.250 | % | | 4/1/2043 | | | 284,012 | |
| | 193,191 | | | Loan ID 200296 | | Fixed | | | 3.250 | % | | 2/1/2043 | | | 192,804 | |
| | 182,693 | | | Loan ID 200299 | | Fixed | | | 3.625 | % | | 10/1/2042 | | | 185,872 | |
| | 114,507 | | | Loan ID 200300 | | Fixed | | | 8.400 | % | | 10/20/2037 | | | 120,232 | |
| | 104,049 | | | Loan ID 200302 | | Fixed | | | 9.875 | % | | 10/1/2035 | | | 109,251 | |
| | 128,112 | | | Loan ID 200304 | | Fixed | | | 7.250 | % | | 10/1/2033 | | | 134,518 | |
| | 40,250 | | | Loan ID 200307 | | Fixed | | | 6.500 | % | | 7/1/2031 | | | 42,262 | |
| | 36,028 | | | Loan ID 200313 | | Fixed | | | 8.500 | % | | 3/1/2028 | | | 37,829 | |
| | 282,814 | | | Loan ID 200315 | | ARM | | | 5.750 | % | | 6/1/2037 | | | 281,634 | |
| | 65,951 | | | Loan ID 200317 | | Fixed | | | 7.000 | % | | 9/1/2032 | | | 69,249 | |
| | 72,482 | | | Loan ID 200326 | | Fixed | | | 8.375 | % | | 10/1/2036 | | | 76,106 | |
| | 137,943 | | | Loan ID 200327 | | Fixed | | | 6.790 | % | | 10/26/2036 | | | 144,840 | |
| | 238,894 | | | Loan ID 200330 | | Fixed | | | 7.000 | % | | 8/1/2037 | | | 197,634 | |
| | | | | | | | | | | | | | | | | |
The accompanying notes are an integral part of these financial statements.
| Vertical Capital Income Fund |
| PORTFOLIO OF INVESTMENTS (Continued) |
| September 30, 2019 |
| Principal | | | | | Loan Type | | Interest Rate | | | Maturity | | Fair Value | |
| | | | | MORTGAGE NOTES (Continued) - 97.9% | | | | | | | | | |
| $ | 94,532 | | | Loan ID 200332 | | Fixed | | | 5.775 | % | | 10/1/2037 | | $ | 99,259 | |
| | 86,905 | | | Loan ID 200334 | | Fixed | | | 7.000 | % | | 1/1/2033 | | | 91,250 | |
| | 259,133 | | | Loan ID 200335 | | Fixed | | | 4.000 | % | | 11/1/2052 | | | 212,081 | |
| | 41,236 | | | Loan ID 200337 | | Fixed | | | 7.000 | % | | 10/1/2034 | | | 37,407 | |
| | 47,067 | | | Loan ID 200338 | | ARM | | | 10.500 | % | | 8/1/2029 | | | 42,631 | |
| | 137,012 | | | Loan ID 200339 | | Fixed | | | 2.000 | % | | 10/1/2033 | | | 128,190 | |
| | 29,475 | | | Loan ID 200340 | | Fixed | | | 7.000 | % | | 3/1/2030 | | | 30,949 | |
| | 57,639 | | | Loan ID 200348 | | Fixed | | | 6.500 | % | | 7/1/2038 | | | 60,521 | |
| | 229,534 | | | Loan ID 200349 | | Fixed | | | 7.000 | % | | 1/1/2037 | | | 167,401 | |
| | 69,431 | | | Loan ID 200352 | | Fixed | | | 7.000 | % | | 8/1/2030 | | | 69,431 | |
| | 92,403 | | | Loan ID 200358 | | Fixed | | | 5.000 | % | | 4/1/2025 | | | 96,575 | |
| | 64,913 | | | Loan ID 200361 | | Fixed | | | 7.500 | % | | 1/1/2034 | | | 68,159 | |
| | 63,046 | | | Loan ID 200366 | | Fixed | | | 6.250 | % | | 1/1/2033 | | | 63,046 | |
| | 162,099 | | | Loan ID 200368 | | Fixed | | | 4.500 | % | | 4/1/2036 | | | 169,927 | |
| | 69,085 | | | Loan ID 200374 | | ARM | | | 8.500 | % | | 5/1/2034 | | | 69,085 | |
| | 177,473 | | | Loan ID 200380 | | Fixed | | | 4.220 | % | | 4/1/2049 | | | 169,280 | |
| | 374,314 | | | Loan ID 200383 | | Fixed | | | 5.030 | % | | 12/1/2046 | | | 393,029 | |
| | 282,586 | | | Loan ID 200384 | | Fixed | | | 5.000 | % | | 11/1/2047 | | | 266,972 | |
| | 137,967 | | | Loan ID 200385 | | Fixed | | | 8.250 | % | | 1/1/2040 | | | 144,865 | |
| | 116,927 | | | Loan ID 200389 | | Fixed | | | 4.820 | % | | 9/1/2047 | | | 74,754 | |
| | 192,188 | | | Loan ID 200390 | | Fixed | | | 4.780 | % | | 4/16/2047 | | | 172,140 | |
| | 153,280 | | | Loan ID 200391 | | Fixed | | | 4.000 | % | | 1/13/2035 | | | 157,036 | |
| | 62,569 | | | Loan ID 200392 | | Fixed | | | 10.000 | % | | 6/5/2034 | | | 65,697 | |
| | 76,691 | | | Loan ID 200395 | | Fixed | | | 4.860 | % | | 4/1/2047 | | | 51,697 | |
| | 68,945 | | | Loan ID 200396 | | Fixed | | | 10.000 | % | | 2/1/2036 | | | 72,392 | |
| | 83,052 | | | Loan ID 200397 | | ARM | | | 5.375 | % | | 9/1/2037 | | | 87,204 | |
| | 68,234 | | | Loan ID 200399 | | Fixed | | | 4.980 | % | | 6/1/2037 | | | 67,030 | |
| | 45,055 | | | Loan ID 200403 | | Fixed | | | 8.300 | % | | 10/15/2032 | | | 47,308 | |
| | 53,238 | | | Loan ID 200404 | | Fixed | | | 8.100 | % | | 5/1/2037 | | | 55,900 | |
| | 89,819 | | | Loan ID 200405 | | Fixed | | | 4.870 | % | | 12/1/2035 | | | 78,592 | |
| | 113,130 | | | Loan ID 200406 | | Fixed | | | 4.875 | % | | 10/1/2051 | | | 118,787 | |
| | 223,327 | | | Loan ID 200407 | | Fixed | | | 6.500 | % | | 4/1/2042 | | | 234,493 | |
| | 335,524 | | | Loan ID 200409 | | Fixed | | | 6.000 | % | | 2/1/2049 | | | 269,888 | |
| | 99,880 | | | Loan ID 200411 | | Fixed | | | 8.275 | % | | 6/1/2037 | | | 104,874 | |
| | 176,611 | | | Loan ID 200416 | | Fixed | | | 4.670 | % | | 8/1/2053 | | | 168,534 | |
| | 65,156 | | | Loan ID 200417 | | Fixed | | | 7.000 | % | | 5/1/2035 | | | 68,413 | |
| | 143,615 | | | Loan ID 200419 | | Fixed | | | 4.000 | % | | 12/19/2035 | | | 144,642 | |
| | 152,595 | | | Loan ID 200420 | | Fixed | | | 4.225 | % | | 4/10/2038 | | | 145,360 | |
| | 71,818 | | | Loan ID 200421 | | Fixed | | | 7.710 | % | | 8/1/2037 | | | 75,409 | |
| | 131,293 | | | Loan ID 200422 | | Fixed | | | 3.830 | % | | 8/1/2053 | | | 111,462 | |
| | 121,878 | | | Loan ID 200423 | | Fixed | | | 4.500 | % | | 6/1/2043 | | | 127,652 | |
| | 210,988 | | | Loan ID 200430 | | Fixed | | | 3.625 | % | | 7/1/2043 | | | 214,466 | |
| | 174,506 | | | Loan ID 200431 | | Fixed | | | 4.625 | % | | 7/1/2043 | | | 183,232 | |
| | 277,622 | | | Loan ID 200432 | | Fixed | | | 4.875 | % | | 5/1/2043 | | | 291,503 | |
| | 121,539 | | | Loan ID 200433 | | Fixed | | | 4.250 | % | | 8/1/2043 | | | 126,470 | |
| | 193,360 | | | Loan ID 200435 | | Fixed | | | 4.625 | % | | 11/1/2052 | | | 200,691 | |
| | 41,360 | | | Loan ID 200439 | | Fixed | | | 5.000 | % | | 8/1/2041 | | | 43,428 | |
| | 141,502 | | | Loan ID 200445 | | Fixed | | | 5.250 | % | | 2/1/2039 | | | 148,577 | |
| | 38,814 | | | Loan ID 200447 | | Fixed | | | 5.875 | % | | 11/4/2034 | | | 40,754 | |
| | 75,466 | | | Loan ID 200448 | | Fixed | | | 5.750 | % | | 5/1/2042 | | | 70,385 | |
| | | | | | | | | | | | | | | | | |
The accompanying notes are an integral part of these financial statements.
| Vertical Capital Income Fund |
| PORTFOLIO OF INVESTMENTS (Continued) |
| September 30, 2019 |
| Principal | | | | | Loan Type | | Interest Rate | | | Maturity | | Fair Value | |
| | | | | MORTGAGE NOTES (Continued) - 97.9% | | | | | | | | | |
| $ | 132,636 | | | Loan ID 200449 | | Fixed | | | 5.000 | % | | 2/1/2042 | | $ | 139,267 | |
| | 336,977 | | | Loan ID 200451 | | Fixed | | | 6.250 | % | | 7/1/2038 | | | 353,825 | |
| | 8,129 | | | Loan ID 200453 | | ARM | | | 6.000 | % | | 3/1/2026 | | | 8,535 | |
| | 180,520 | | | Loan ID 200460 | | Fixed | | | 7.000 | % | | 7/1/2041 | | | 189,546 | |
| | 369,334 | | | Loan ID 200462 | | Fixed | | | 6.000 | % | | 7/1/2045 | | | 348,485 | |
| | 230,334 | | | Loan ID 200465 | | Fixed | | | 6.500 | % | | 7/1/2037 | | | 233,691 | |
| | 101,915 | | | Loan ID 200468 | | Fixed | | | 5.625 | % | | 12/1/2044 | | | 40,211 | |
| | 120,786 | | | Loan ID 200469 | | Fixed | | | 6.500 | % | | 7/1/2037 | | | 115,912 | |
| | 272,266 | | | Loan ID 200473 | | Fixed | | | 4.000 | % | | 12/1/2042 | | | 232,151 | |
| | 235,843 | | | Loan ID 200474 | | Fixed | | | 5.750 | % | | 11/1/2050 | | | 247,635 | |
| | 162,798 | | | Loan ID 200475 | | Fixed | | | 5.450 | % | | 7/1/2049 | | | 170,938 | |
| | 185,956 | | | Loan ID 200476 | | Fixed | | | 6.000 | % | | 9/1/2050 | | | 195,254 | |
| | 146,544 | | | Loan ID 200477 | | Fixed | | | 4.125 | % | | 12/1/2028 | | | 151,504 | |
| | 90,609 | | | Loan ID 200482 | | Fixed | | | 4.375 | % | | 11/1/2028 | | | 94,672 | |
| | 85,117 | | | Loan ID 200483 | | Fixed | | | 4.375 | % | | 11/1/2028 | | | 88,934 | |
| | 70,444 | | | Loan ID 200485 | | Fixed | | | 4.125 | % | | 2/1/2043 | | | 73,003 | |
| | 231,319 | | | Loan ID 200486 | | Fixed | | | 3.500 | % | | 1/1/2043 | | | 233,782 | |
| | 107,250 | | | Loan ID 200489 | | Fixed | | | 4.000 | % | | 3/1/2043 | | | 110,621 | |
| | 53,805 | | | Loan ID 200490 | | Fixed | | | 4.000 | % | | 11/1/2028 | | | 55,515 | |
| | 190,859 | | | Loan ID 200491 | | Fixed | | | 5.500 | % | | 10/1/2039 | | | 190,859 | |
| | 113,851 | | | Loan ID 200492 | | Fixed | | | 4.000 | % | | 1/1/2043 | | | 117,466 | |
| | 262,267 | | | Loan ID 200494 | | Fixed | | | 4.625 | % | | 10/1/2043 | | | 275,381 | |
| | 188,559 | | | Loan ID 200496 | | Fixed | | | 3.875 | % | | 2/1/2043 | | | 193,695 | |
| | 300,106 | | | Loan ID 200497 | | Fixed | | | 3.250 | % | | 4/1/2043 | | | 299,292 | |
| | 255,265 | | | Loan ID 200499 | | Fixed | | | 4.250 | % | | 1/1/2043 | | | 265,181 | |
| | 197,936 | | | Loan ID 200500 | | Fixed | | | 5.875 | % | | 2/1/2037 | | | 207,833 | |
| | 350,083 | | | Loan ID 200504 | | Fixed | | | 3.375 | % | | 3/1/2043 | | | 351,277 | |
| | 65,509 | | | Loan ID 200507 | | Fixed | | | 4.500 | % | | 9/1/2042 | | | 68,784 | |
| | 312,638 | | | Loan ID 200514 | | Fixed | | | 3.000 | % | | 4/1/2047 | | | 308,357 | |
| | 93,251 | | | Loan ID 200515 | | Fixed | | | 8.250 | % | | 2/1/2039 | | | 97,914 | |
| | 96,698 | | | Loan ID 200517 | | Fixed | | | 8.000 | % | | 5/1/2039 | | | 101,515 | |
| | 193,800 | | | Loan ID 200518 | | Fixed | | | 3.000 | % | | 12/1/2050 | | | 191,158 | |
| | 298,784 | | | Loan ID 200519 | | Fixed | | | 3.000 | % | | 11/1/2049 | | | 295,007 | |
| | 264,279 | | | Loan ID 200525 | | Fixed | | | 3.250 | % | | 12/1/2042 | | | 215,050 | |
| | 105,365 | | | Loan ID 200527 | | Fixed | | | 4.500 | % | | 12/1/2043 | | | 110,529 | |
| | 373,716 | | | Loan ID 200529 | | Fixed | | | 4.625 | % | | 2/1/2044 | | | 392,402 | |
| | 165,015 | | | Loan ID 200531 | | Fixed | | | 4.625 | % | | 11/1/2043 | | | 173,266 | |
| | 102,347 | | | Loan ID 200532 | | Fixed | | | 3.250 | % | | 7/1/2043 | | | 102,093 | |
| | 87,834 | | | Loan ID 200537 | | Fixed | | | 4.500 | % | | 3/1/2042 | | | 92,226 | |
| | 78,783 | | | Loan ID 200540 | | Fixed | | | 3.875 | % | | 2/1/2043 | | | 80,977 | |
| | 45,657 | | | Loan ID 200545 | | Fixed | | | 4.375 | % | | 2/1/2029 | | | 47,639 | |
| | 115,980 | | | Loan ID 200546 | | Fixed | | | 5.375 | % | | 12/1/2043 | | | 121,779 | |
| | 157,509 | | | Loan ID 200548 | | Fixed | | | 5.250 | % | | 2/1/2044 | | | 165,384 | |
| | 128,573 | | | Loan ID 200564 | | Fixed | | | 4.875 | % | | 5/1/2039 | | | 128,573 | |
| | 123,332 | | | Loan ID 200567 | | Fixed | | | 3.375 | % | | 5/1/2043 | | | 123,847 | |
| | 127,601 | | | Loan ID 200571 | | Fixed | | | 4.500 | % | | 7/1/2043 | | | 133,695 | |
| | 89,177 | | | Loan ID 200573 | | Fixed | | | 3.750 | % | | 9/1/2042 | | | 91,089 | |
| | 123,656 | | | Loan ID 200574 | | Fixed | | | 4.875 | % | | 1/1/2044 | | | 129,839 | |
| | 172,505 | | | Loan ID 200578 | | Fixed | | | 4.750 | % | | 8/1/2040 | | | 181,130 | |
| | 45,180 | | | Loan ID 200579 | | Fixed | | | 4.875 | % | | 5/1/2042 | | | 47,439 | |
| | | | | | | | | | | | | | | | | |
The accompanying notes are an integral part of these financial statements.
| Vertical Capital Income Fund |
| PORTFOLIO OF INVESTMENTS (Continued) |
| September 30, 2019 |
| Principal | | | | | Loan Type | | Interest Rate | | | Maturity | | Fair Value | |
| | | | | MORTGAGE NOTES (Continued) - 97.9% | | | | | | | | | |
| $ | 161,382 | | | Loan ID 200580 | | Fixed | | | 4.125 | % | | 11/1/2041 | | $ | 167,395 | |
| | 36,382 | | | Loan ID 200581 | | Fixed | | | 4.750 | % | | 9/1/2042 | | | 38,119 | |
| | 349,881 | | | Loan ID 200582 | | Fixed | | | 4.000 | % | | 11/1/2042 | | | 357,156 | |
| | 55,439 | | | Loan ID 200583 | | Fixed | | | 3.625 | % | | 9/1/2027 | | | 56,400 | |
| | 305,600 | | | Loan ID 200586 | | Fixed | | | 3.500 | % | | 1/1/2043 | | | 309,064 | |
| | 235,025 | | | Loan ID 200588 | | Fixed | | | 3.750 | % | | 5/1/2042 | | | 240,511 | |
| | 62,550 | | | Loan ID 200593 | | Fixed | | | 3.875 | % | | 6/1/2042 | | | 64,258 | |
| | 214,049 | | | Loan ID 200594 | | Fixed | | | 4.250 | % | | 4/1/2043 | | | 222,927 | |
| | 36,256 | | | Loan ID 200597 | | Fixed | | | 5.625 | % | | 2/1/2044 | | | 38,069 | |
| | 175,672 | | | Loan ID 200600 | | Fixed | | | 4.625 | % | | 4/1/2044 | | | 184,456 | |
| | 172,698 | | | Loan ID 200602 | | Fixed | | | 3.750 | % | | 3/1/2043 | | | 176,663 | |
| | 21,388 | | | Loan ID 200603 | | Fixed | | | 4.125 | % | | 6/1/2043 | | | 22,114 | |
| | 68,562 | | | Loan ID 200604 | | Fixed | | | 3.500 | % | | 1/1/2043 | | | 69,339 | |
| | 140,005 | | | Loan ID 200605 | | Fixed | | | 4.875 | % | | 12/1/2043 | | | 147,005 | |
| | 126,118 | | | Loan ID 200608 | | Fixed | | | 4.125 | % | | 11/1/2043 | | | 130,792 | |
| | 118,152 | | | Loan ID 200612 | | Fixed | | | 4.500 | % | | 2/1/2043 | | | 123,994 | |
| | 191,047 | | | Loan ID 200613 | | Fixed | | | 3.369 | % | | 1/1/2043 | | | 192,015 | |
| | 96,073 | | | Loan ID 200615 | | Fixed | | | 4.250 | % | | 8/1/2043 | | | 99,948 | |
| | 322,296 | | | Loan ID 200616 | | Fixed | | | 4.875 | % | | 2/1/2044 | | | 338,411 | |
| | 214,669 | | | Loan ID 200620 | | Fixed | | | 4.250 | % | | 10/1/2043 | | | 223,321 | |
| | 123,506 | | | Loan ID 200621 | | Fixed | | | 3.625 | % | | 1/1/2043 | | | 125,316 | |
| | 68,000 | | | Loan ID 200623 | | Fixed | | | 4.375 | % | | 12/1/2042 | | | 70,990 | |
| | 123,779 | | | Loan ID 200627 | | Fixed | | | 4.250 | % | | 10/1/2043 | | | 128,808 | |
| | 157,163 | | | Loan ID 200630 | | Fixed | | | 5.250 | % | | 9/1/2043 | | | 165,021 | |
| | 327,381 | | | Loan ID 200632 | | Fixed | | | 5.250 | % | | 5/1/2044 | | | 343,750 | |
| | 213,829 | | | Loan ID 200633 | | Fixed | | | 5.125 | % | | 5/1/2044 | | | 224,521 | |
| | 217,774 | | | Loan ID 200634 | | Fixed | | | 4.375 | % | | 1/1/2044 | | | 227,468 | |
| | 138,105 | | | Loan ID 200642 | | Fixed | | | 5.000 | % | | 3/1/2044 | | | 135,225 | |
| | 111,844 | | | Loan ID 200645 | | Fixed | | | 5.000 | % | | 4/1/2044 | | | 117,436 | |
| | 134,080 | | | Loan ID 200649 | | Fixed | | | 4.375 | % | | 3/1/2044 | | | 139,960 | |
| | 122,949 | | | Loan ID 200650 | | Fixed | | | 4.875 | % | | 5/1/2044 | | | 129,097 | |
| | 221,185 | | | Loan ID 200651 | | Fixed | | | 3.625 | % | | 7/1/2043 | | | 224,802 | |
| | 130,905 | | | Loan ID 200655 | | Fixed | | | 3.375 | % | | 5/1/2043 | | | 131,440 | |
| | 143,031 | | | Loan ID 200656 | | Fixed | | | 6.875 | % | | 7/1/2037 | | | 76,028 | |
| | 140,821 | | | Loan ID 200657 | | Fixed | | | 4.875 | % | | 8/1/2051 | | | 147,862 | |
| | 169,405 | | | Loan ID 200660 | | Fixed | | | 5.875 | % | | 3/1/2038 | | | 177,876 | |
| | 199,623 | | | Loan ID 200662 | | Fixed | | | 5.000 | % | | 3/1/2044 | | | 209,604 | |
| | 65,370 | | | Loan ID 200663 | | Fixed | | | 4.750 | % | | 5/1/2044 | | | 68,638 | |
| | 282,433 | | | Loan ID 200668 | | Fixed | | | 3.625 | % | | 4/1/2043 | | | 287,561 | |
| | 147,705 | | | Loan ID 200669 | | Fixed | | | 5.250 | % | | 4/1/2044 | | | 155,090 | |
| | 51,839 | | | Loan ID 200670 | | Fixed | | | 4.375 | % | | 2/1/2029 | | | 54,085 | |
| | 224,312 | | | Loan ID 200671 | | Fixed | | | 4.625 | % | | 8/1/2043 | | | 235,528 | |
| | 147,014 | | | Loan ID 200672 | | Fixed | | | 3.750 | % | | 7/1/2043 | | | 150,188 | |
| | 293,332 | | | Loan ID 200674 | | Fixed | | | 4.500 | % | | 5/1/2044 | | | 307,420 | |
| | 96,716 | | | Loan ID 200677 | | Fixed | | | 3.625 | % | | 5/1/2028 | | | 98,372 | |
| | 437,932 | | | Loan ID 200678 | | Fixed | | | 4.375 | % | | 2/1/2044 | | | 457,045 | |
| | 241,923 | | | Loan ID 200679 | | Fixed | | | 5.000 | % | | 4/1/2044 | | | 214,966 | |
| | 180,114 | | | Loan ID 200682 | | Fixed | | | 4.875 | % | | 5/1/2044 | | | 175,197 | |
| | 119,953 | | | Loan ID 200684 | | Fixed | | | 4.875 | % | | 4/1/2044 | | | 125,951 | |
| | 217,779 | | | Loan ID 200685 | | Fixed | | | 4.875 | % | | 5/1/2044 | | | 228,668 | |
| | | | | | | | | | | | | | | | | |
The accompanying notes are an integral part of these financial statements.
| Vertical Capital Income Fund |
| PORTFOLIO OF INVESTMENTS (Continued) |
| September 30, 2019 |
| Principal | | | | | Loan Type | | Interest Rate | | | Maturity | | Fair Value | |
| | | | | MORTGAGE NOTES (Continued) - 97.9% | | | | | | | | | |
| $ | 212,030 | | | Loan ID 200690 | | Fixed | | | 4.250 | % | | 4/1/2044 | | $ | 220,821 | |
| | 231,348 | | | Loan ID 200692 | | Fixed | | | 4.625 | % | | 7/1/2044 | | | 242,916 | |
| | 101,032 | | | Loan ID 200694 | | Fixed | | | 4.500 | % | | 9/1/2043 | | | 105,854 | |
| | 45,281 | | | Loan ID 200696 | | Fixed | | | 3.750 | % | | 10/1/2042 | | | 46,345 | |
| | 85,942 | | | Loan ID 200700 | | Fixed | | | 4.250 | % | | 2/1/2044 | | | 89,359 | |
| | 160,533 | | | Loan ID 200701 | | Fixed | | | 4.750 | % | | 6/1/2044 | | | 151,368 | |
| | 91,372 | | | Loan ID 200704 | | Fixed | | | 4.375 | % | | 3/1/2043 | | | 95,239 | |
| | 125,354 | | | Loan ID 200708 | | Fixed | | | 4.875 | % | | 2/1/2044 | | | 131,621 | |
| | 48,205 | | | Loan ID 200709 | | Fixed | | | 4.375 | % | | 4/1/2043 | | | 50,330 | |
| | 109,216 | | | Loan ID 200710 | | Fixed | | | 4.500 | % | | 7/1/2044 | | | 114,427 | |
| | 578,596 | | | Loan ID 200714 | | Fixed | | | 4.175 | % | | 11/1/2036 | | | 541,171 | |
| | 199,946 | | | Loan ID 200716 | | ARM | | | 5.483 | % | | 8/1/2037 | | | 178,192 | |
| | 134,173 | | | Loan ID 200720 | | ARM | | | 5.500 | % | | 4/1/2042 | | | 123,371 | |
| | 145,779 | | | Loan ID 200726 | | Fixed | | | 4.375 | % | | 9/1/2037 | | | 106,955 | |
| | 154,135 | | | Loan ID 200727 | | Fixed | | | 3.500 | % | | 7/1/2037 | | | 155,809 | |
| | 442,662 | | | Loan ID 200730 | | ARM | | | 4.750 | % | | 9/1/2036 | | | 346,672 | |
| | 188,584 | | | Loan ID 200732 | | Fixed | | | 4.125 | % | | 9/1/2027 | | | 195,048 | |
| | 216,820 | | | Loan ID 200733 | | Fixed | | | 3.750 | % | | 12/1/2042 | | | 221,811 | |
| | 223,242 | | | Loan ID 200734 | | ARM | | | 3.375 | % | | 4/1/2044 | | | 225,003 | |
| | 95,940 | | | Loan ID 200735 | | Fixed | | | 4.500 | % | | 6/1/2044 | | | 100,619 | |
| | 137,384 | | | Loan ID 200736 | | Fixed | | | 4.750 | % | | 5/1/2044 | | | 133,127 | |
| | 166,875 | | | Loan ID 200742 | | Fixed | | | 4.250 | % | | 4/1/2043 | | | 173,327 | |
| | 180,472 | | | Loan ID 200744 | | Fixed | | | 3.625 | % | | 6/1/2043 | | | 183,492 | |
| | 427,773 | | | Loan ID 200748 | | Fixed | | | 4.750 | % | | 12/1/2043 | | | 449,162 | |
| | 146,053 | | | Loan ID 200749 | | Fixed | | | 4.750 | % | | 9/1/2043 | | | 153,355 | |
| | 56,977 | | | Loan ID 200753 | | Fixed | | | 5.250 | % | | 5/1/2044 | | | 59,826 | |
| | 52,238 | | | Loan ID 200755 | | Fixed | | | 4.250 | % | | 6/1/2043 | | | 54,367 | |
| | 180,316 | | | Loan ID 200756 | | Fixed | | | 4.875 | % | | 11/1/2043 | | | 168,792 | |
| | 118,185 | | | Loan ID 200759 | | Fixed | | | 3.750 | % | | 6/1/2043 | | | 120,974 | |
| | 161,766 | | | Loan ID 200760 | | Fixed | | | 3.750 | % | | 6/1/2043 | | | 165,449 | |
| | 281,903 | | | Loan ID 200762 | | Fixed | | | 3.875 | % | | 5/1/2042 | | | 289,839 | |
| | 144,625 | | | Loan ID 200763 | | Fixed | | | 4.250 | % | | 11/1/2043 | | | 150,298 | |
| | 194,154 | | | Loan ID 200765 | | Fixed | | | 4.875 | % | | 11/1/2043 | | | 203,862 | |
| | 461,839 | | | Loan ID 200766 | | Fixed | | | 3.625 | % | | 12/1/2042 | | | 470,163 | |
| | 169,106 | | | Loan ID 200771 | | Fixed | | | 4.500 | % | | 4/1/2043 | | | 169,106 | |
| | 231,487 | | | Loan ID 200772 | | Fixed | | | 3.750 | % | | 3/1/2043 | | | 236,913 | |
| | 192,428 | | | Loan ID 200774 | | Fixed | | | 3.875 | % | | 7/1/2043 | | | 197,783 | |
| | 42,158 | | | Loan ID 200775 | | Fixed | | | 4.250 | % | | 4/1/2043 | | | 43,826 | |
| | 76,969 | | | Loan ID 200776 | | Fixed | | | 4.250 | % | | 3/1/2044 | | | 80,000 | |
| | 51,079 | | | Loan ID 200777 | | Fixed | | | 4.750 | % | | 6/1/2044 | | | 53,149 | |
| | 159,760 | | | Loan ID 200781 | | Fixed | | | 4.625 | % | | 9/1/2044 | | | 167,459 | |
| | 133,876 | | | Loan ID 200783 | | Fixed | | | 4.750 | % | | 9/1/2044 | | | 140,569 | |
| | 106,560 | | | Loan ID 200785 | | Fixed | | | 4.500 | % | | 8/1/2044 | | | 111,759 | |
| | 215,834 | | | Loan ID 200786 | | Fixed | | | 4.625 | % | | 7/1/2044 | | | 226,626 | |
| | 41,189 | | | Loan ID 200787 | | Fixed | | | 4.750 | % | | 9/1/2044 | | | 43,248 | |
| | 122,881 | | | Loan ID 200789 | | Fixed | | | 3.750 | % | | 9/1/2044 | | | 125,649 | |
| | 143,796 | | | Loan ID 200790 | | Fixed | | | 4.250 | % | | 8/1/2044 | | | 149,774 | |
| | 193,966 | | | Loan ID 200791 | | Fixed | | | 4.875 | % | | 6/1/2044 | | | 203,664 | |
| | 87,386 | | | Loan ID 200795 | | Fixed | | | 6.750 | % | | 8/1/2036 | | | 91,756 | |
| | 69,677 | | | Loan ID 200796 | | Fixed | | | 5.170 | % | | 12/1/2053 | | | 30,876 | |
| | | | | | | | | | | | | | | | | |
The accompanying notes are an integral part of these financial statements.
| Vertical Capital Income Fund |
| PORTFOLIO OF INVESTMENTS (Continued) |
| September 30, 2019 |
| Principal | | | | | Loan Type | | Interest Rate | | | Maturity | | Fair Value | |
| | | | | MORTGAGE NOTES (Continued) - 97.9% | | | | | | | | | |
| $ | 57,432 | | | Loan ID 200799 | | Fixed | | | 4.000 | % | | 2/5/2053 | | $ | 55,941 | |
| | 62,779 | | | Loan ID 200800 | | Fixed | | | 4.000 | % | | 1/1/2053 | | | 59,430 | |
| | 150,062 | | | Loan ID 200805 | | Fixed | | | 4.625 | % | | 7/1/2050 | | | 120,988 | |
| | 155,659 | | | Loan ID 200806 | | Fixed | | | 5.000 | % | | 8/1/2049 | | | 127,102 | |
| | 55,752 | | | Loan ID 200808 | | Fixed | | | 4.250 | % | | 11/1/2050 | | | 28,857 | |
| | 114,217 | | | Loan ID 200809 | | Fixed | | | 5.000 | % | | 4/1/2050 | | | 71,574 | |
| | 230,114 | | | Loan ID 200814 | | Fixed | | | 8.250 | % | | 7/1/2039 | | | 241,620 | |
| | 275,963 | | | Loan ID 200817 | | Fixed | | | 5.000 | % | | 1/1/2050 | | | 204,705 | |
| | 198,435 | | | Loan ID 200821 | | Fixed | | | 4.250 | % | | 8/1/2044 | | | 206,582 | |
| | 77,113 | | | Loan ID 200823 | | Fixed | | | 4.250 | % | | 9/1/2044 | | | 80,298 | |
| | 210,675 | | | Loan ID 200824 | | Fixed | | | 4.250 | % | | 8/1/2044 | | | 216,564 | |
| | 100,409 | | | Loan ID 200826 | | Fixed | | | 4.375 | % | | 9/1/2044 | | | 104,609 | |
| | 195,079 | | | Loan ID 200829 | | Fixed | | | 4.375 | % | | 7/1/2043 | | | 203,650 | |
| | 191,330 | | | Loan ID 200830 | | ARM | | | 2.875 | % | | 7/1/2044 | | | 191,825 | |
| | 58,034 | | | Loan ID 200831 | | Fixed | | | 4.250 | % | | 10/1/2044 | | | 60,261 | |
| | 322,777 | | | Loan ID 200832 | | Fixed | | | 4.250 | % | | 10/1/2044 | | | 335,615 | |
| | 151,930 | | | Loan ID 200834 | | Fixed | | | 4.125 | % | | 7/1/2043 | | | 157,392 | |
| | 312,092 | | | Loan ID 200835 | | Fixed | | | 5.000 | % | | 8/1/2043 | | | 327,697 | |
| | 220,536 | | | Loan ID 200839 | | Fixed | | | 5.000 | % | | 5/1/2044 | | | 231,563 | |
| | 283,409 | | | Loan ID 200844 | | Fixed | | | 4.500 | % | | 7/1/2043 | | | 297,202 | |
| | 192,422 | | | Loan ID 200846 | | Fixed | | | 4.375 | % | | 11/1/2043 | | | 201,169 | |
| | 173,707 | | | Loan ID 200847 | | Fixed | | | 4.750 | % | | 10/1/2044 | | | 182,392 | |
| | 102,933 | | | Loan ID 200853 | | Fixed | | | 5.000 | % | | 4/1/2037 | | | 108,079 | |
| | 182,431 | | | Loan ID 200856 | | Fixed | | | 6.500 | % | | 6/1/2042 | | | 118,475 | |
| | 255,078 | | | Loan ID 200858 | | Fixed | | | 4.000 | % | | 1/1/2053 | | | 225,666 | |
| | 160,334 | | | Loan ID 200860 | | Fixed | | | 3.875 | % | | 3/1/2052 | | | 117,396 | |
| | 409,019 | | | Loan ID 200861 | | Fixed | | | 3.000 | % | | 6/1/2054 | | | 292,207 | |
| | 239,962 | | | Loan ID 200863 | | Fixed | | | 3.380 | % | | 7/1/2052 | | | 240,043 | |
| | 254,469 | | | Loan ID 200866 | | Fixed | | | 3.400 | % | | 5/1/2053 | | | 256,059 | |
| | 108,640 | | | Loan ID 200867 | | Fixed | | | 4.370 | % | | 9/1/2053 | | | 98,497 | |
| | 193,227 | | | Loan ID 200873 | | Fixed | | | 4.525 | % | | 11/1/2053 | | | 85,827 | |
| | 180,155 | | | Loan ID 200880 | | Fixed | | | 4.250 | % | | 6/1/2043 | | | 187,390 | |
| | 67,156 | | | Loan ID 200883 | | Fixed | | | 3.375 | % | | 5/1/2028 | | | 67,402 | |
| | 83,691 | | | Loan ID 200886 | | Fixed | | | 4.250 | % | | 10/1/2044 | | | 87,065 | |
| | 240,663 | | | Loan ID 200887 | | Fixed | | | 4.750 | % | | 9/1/2044 | | | 252,697 | |
| | 195,874 | | | Loan ID 200891 | | Fixed | | | 4.250 | % | | 10/1/2044 | | | 203,514 | |
| | 239,165 | | | Loan ID 200892 | | Fixed | | | 3.750 | % | | 9/1/2043 | | | 244,399 | |
| | 212,043 | | | Loan ID 200895 | | Fixed | | | 3.875 | % | | 11/1/2043 | | | 218,070 | |
| | 184,131 | | | Loan ID 200897 | | Fixed | | | 4.750 | % | | 10/1/2044 | | | 193,337 | |
| | 326,401 | | | Loan ID 200900 | | Fixed | | | 4.375 | % | | 9/1/2044 | | | 341,417 | |
| | 622,954 | | | Loan ID 200902 | | Fixed | | | 4.250 | % | | 9/1/2044 | | | 648,679 | |
| | 384,917 | | | Loan ID 200905 | | Fixed | | | 5.375 | % | | 9/1/2044 | | | 404,163 | |
| | 281,298 | | | Loan ID 200906 | | Fixed | | | 4.875 | % | | 2/1/2035 | | | 295,362 | |
| | 359,834 | | | Loan ID 200907 | | ARM | | | 5.533 | % | | 8/1/2047 | | | 367,007 | |
| | 101,307 | | | Loan ID 200908 | | Fixed | | | 4.000 | % | | 6/1/2049 | | | 104,112 | |
| | 111,502 | | | Loan ID 200909 | | Fixed | | | 4.870 | % | | 3/1/2046 | | | 90,259 | |
| | 194,513 | | | Loan ID 200910 | | Fixed | | | 5.300 | % | | 4/1/2053 | | | 175,625 | |
| | 685,906 | | | Loan ID 200912 | | Fixed | | | 4.500 | % | | 3/1/2037 | | | 719,865 | |
| | 56,834 | | | Loan ID 200913 | | Fixed | | | 4.250 | % | | 5/1/2047 | | | 53,271 | |
| | 142,484 | | | Loan ID 200914 | | Fixed | | | 2.875 | % | | 12/1/2047 | | | 139,933 | |
| | | | | | | | | | | | | | | | | |
The accompanying notes are an integral part of these financial statements.
| Vertical Capital Income Fund |
| PORTFOLIO OF INVESTMENTS (Continued) |
| September 30, 2019 |
| Principal | | | | | Loan Type | | Interest Rate | | | Maturity | | Fair Value | |
| | | | | MORTGAGE NOTES (Continued) - 97.9% | | | | | | | | | |
| $ | 87,034 | | | Loan ID 200916 | | Fixed | | | 4.000 | % | | 10/1/2037 | | $ | 86,991 | |
| | 154,459 | | | Loan ID 200917 | | Fixed | | | 4.875 | % | | 1/1/2051 | | | 162,181 | |
| | 89,963 | | | Loan ID 200921 | | ARM | | | 5.625 | % | | 7/1/2051 | | | 94,461 | |
| | 408,770 | | | Loan ID 200922 | | Fixed | | | 3.340 | % | | 9/1/2053 | | | 421,241 | |
| | 496,397 | | | Loan ID 200924 | | Fixed | | | 5.500 | % | | 9/1/2051 | | | 521,217 | |
| | 299,238 | | | Loan ID 200927 | | Fixed | | | 3.000 | % | | 8/1/2038 | | | 295,675 | |
| | 113,189 | | | Loan ID 200928 | | Fixed | | | 4.800 | % | | 12/1/2036 | | | 118,848 | |
| | 153,879 | | | Loan ID 200929 | | Fixed | | | 4.625 | % | | 1/1/2043 | | | 161,573 | |
| | 380,116 | | | Loan ID 200931 | | Fixed | | | 4.250 | % | | 12/1/2052 | | | 354,051 | |
| | 287,473 | | | Loan ID 200933 | | Fixed | | | 4.250 | % | | 3/1/2043 | | | 299,162 | |
| | 108,423 | | | Loan ID 200934 | | Fixed | | | 3.810 | % | | 1/1/2043 | | | 111,085 | |
| | 168,785 | | | Loan ID 200935 | | Fixed | | | 3.875 | % | | 4/1/2043 | | | 173,560 | |
| | 184,159 | | | Loan ID 200936 | | Fixed | | | 4.000 | % | | 5/1/2042 | | | 190,021 | |
| | 187,718 | | | Loan ID 200940 | | Fixed | | | 3.250 | % | | 2/1/2043 | | | 187,207 | |
| | 108,413 | | | Loan ID 200941 | | Fixed | | | 3.780 | % | | 1/1/2043 | | | 110,963 | |
| | 265,182 | | | Loan ID 200942 | | Fixed | | | 4.000 | % | | 4/1/2043 | | | 273,744 | |
| | 99,524 | | | Loan ID 200944 | | Fixed | | | 4.500 | % | | 2/1/2044 | | | 104,050 | |
| | 274,059 | | | Loan ID 200947 | | Fixed | | | 4.000 | % | | 2/1/2043 | | | 282,755 | |
| | 123,757 | | | Loan ID 200948 | | Fixed | | | 4.625 | % | | 12/1/2042 | | | 129,945 | |
| | 267,415 | | | Loan ID 200949 | | Fixed | | | 3.875 | % | | 4/1/2043 | | | 275,017 | |
| | 172,716 | | | Loan ID 200952 | | Fixed | | | 3.875 | % | | 1/1/2043 | | | 177,540 | |
| | 111,163 | | | Loan ID 200953 | | Fixed | | | 3.750 | % | | 12/1/2042 | | | 113,622 | |
| | 358,997 | | | Loan ID 200954 | | Fixed | | | 3.625 | % | | 1/1/2043 | | | 365,202 | |
| | 308,900 | | | Loan ID 200955 | | Fixed | | | 3.250 | % | | 5/1/2043 | | | 308,398 | |
| | 255,894 | | | Loan ID 200956 | | Fixed | | | 5.000 | % | | 8/1/2051 | | | 268,689 | |
| | 397,359 | | | Loan ID 200959 | | Fixed | | | 4.000 | % | | 11/1/2042 | | | 410,272 | |
| | 341,959 | | | Loan ID 200960 | | Fixed | | | 3.500 | % | | 1/1/2043 | | | 345,594 | |
| | 195,557 | | | Loan ID 200962 | | Fixed | | | 4.250 | % | | 10/1/2044 | | | 203,539 | |
| | 113,084 | | | Loan ID 200963 | | Fixed | | | 4.750 | % | | 9/1/2044 | | | 118,739 | |
| | 336,085 | | | Loan ID 200964 | | Fixed | | | 3.750 | % | | 7/1/2043 | | | 343,834 | |
| | 140,109 | | | Loan ID 200966 | | Fixed | | | 4.875 | % | | 7/1/2044 | | | 147,114 | |
| | 90,360 | | | Loan ID 200968 | | Fixed | | | 4.250 | % | | 11/1/2044 | | | 94,878 | |
| | 347,462 | | | Loan ID 200969 | | Fixed | | | 4.875 | % | | 8/1/2043 | | | 364,835 | |
| | 147,641 | | | Loan ID 200974 | | Fixed | | | 4.250 | % | | 10/1/2044 | | | 153,630 | |
| | 338,243 | | | Loan ID 200977 | | Fixed | | | 4.875 | % | | 9/1/2044 | | | 355,155 | |
| | 192,856 | | | Loan ID 200983 | | Fixed | | | 4.375 | % | | 8/1/2044 | | | 201,392 | |
| | 109,789 | | | Loan ID 200987 | | Fixed | | | 4.625 | % | | 10/1/2044 | | | 115,278 | |
| | 176,860 | | | Loan ID 200989 | | Fixed | | | 3.750 | % | | 6/1/2029 | | | 180,427 | |
| | 160,633 | | | Loan ID 200993 | | Fixed | | | 2.004 | % | | 7/15/2049 | | | 147,007 | |
| | 53,550 | | | Loan ID 200996 | | Fixed | | | 2.500 | % | | 8/1/2048 | | | 43,514 | |
| | 353,896 | | | Loan ID 200998 | | Fixed | | | 3.875 | % | | 12/1/2050 | | | 357,869 | |
| | 123,790 | | | Loan ID 201005 | | Fixed | | | 4.750 | % | | 7/1/2041 | | | 129,980 | |
| | 41,144 | | | Loan ID 201006 | | Fixed | | | 6.875 | % | | 3/1/2038 | | | 43,202 | |
| | 83,521 | | | Loan ID 201007 | | Fixed | | | 7.125 | % | | 4/1/2037 | | | 87,697 | |
| | 76,458 | | | Loan ID 201010 | | Fixed | | | 5.500 | % | | 4/1/2039 | | | 80,281 | |
| | 44,382 | | | Loan ID 201012 | | Fixed | | | 7.500 | % | | 12/1/2038 | | | 46,601 | |
| | 53,942 | | | Loan ID 201013 | | Fixed | | | 7.500 | % | | 12/1/2038 | | | 47,637 | |
| | 100,623 | | | Loan ID 201016 | | Fixed | | | 6.500 | % | | 2/1/2036 | | | 105,654 | |
| | 74,250 | | | Loan ID 201022 | | ARM | | | 4.875 | % | | 5/1/2037 | | | 62,370 | |
| | 133,990 | | | Loan ID 201023 | | Fixed | | | 6.450 | % | | 2/1/2036 | | | 128,256 | |
| | | | | | | | | | | | | | | | | |
The accompanying notes are an integral part of these financial statements.
| Vertical Capital Income Fund |
| PORTFOLIO OF INVESTMENTS (Continued) |
| September 30, 2019 |
| Principal | | | | | Loan Type | | Interest Rate | | | Maturity | | Fair Value | |
| | | | | MORTGAGE NOTES (Continued) - 97.9% | | | | | | | | | |
| $ | 103,452 | | | Loan ID 201027 | | ARM | | | 9.538 | % | | 3/1/2037 | | $ | 108,624 | |
| | 98,998 | | | Loan ID 201030 | | Fixed | | | 5.000 | % | | 7/1/2042 | | | 103,947 | |
| | 136,098 | | | Loan ID 201032 | | Fixed | | | 4.500 | % | | 11/1/2044 | | | 141,996 | |
| | 274,326 | | | Loan ID 201033 | | Fixed | | | 4.125 | % | | 12/1/2044 | | | 284,588 | |
| | 86,180 | | | Loan ID 201036 | | Fixed | | | 4.375 | % | | 12/1/2044 | | | 89,931 | |
| | 66,545 | | | Loan ID 201037 | | Fixed | | | 8.250 | % | | 7/1/2039 | | | 69,872 | |
| | 88,399 | | | Loan ID 201041 | | Fixed | | | 3.750 | % | | 11/1/2052 | | | 82,317 | |
| | 109,531 | | | Loan ID 201043 | | Fixed | | | 4.000 | % | | 4/1/2039 | | | 106,449 | |
| | 170,440 | | | Loan ID 201044 | | Fixed | | | 4.870 | % | | 3/29/2037 | | | 178,962 | |
| | 103,031 | | | Loan ID 201045 | | Fixed | | | 3.375 | % | | 7/1/2037 | | | 91,233 | |
| | 276,448 | | | Loan ID 201046 | | Fixed | | | 3.000 | % | | 10/1/2058 | | | 192,810 | |
| | 106,098 | | | Loan ID 201047 | | Fixed | | | 3.625 | % | | 4/1/2053 | | | 102,683 | |
| | 63,645 | | | Loan ID 201053 | | Fixed | | | 3.860 | % | | 7/1/2053 | | | 65,258 | |
| | 203,307 | | | Loan ID 201054 | | Fixed | | | 2.400 | % | | 5/17/2050 | | | 186,777 | |
| | 569,061 | | | Loan ID 201056 | | Fixed | | | 3.000 | % | | 7/1/2054 | | | 508,357 | |
| | 159,963 | | | Loan ID 201057 | | Fixed | | | 3.000 | % | | 1/1/2050 | | | 140,124 | |
| | 122,592 | | | Loan ID 201058 | | Fixed | | | 4.250 | % | | 8/1/2037 | | | 127,444 | |
| | 103,127 | | | Loan ID 201060 | | ARM | | | 5.000 | % | | 7/1/2035 | | | 92,496 | |
| | 84,762 | | | Loan ID 201061 | | Fixed | | | 5.000 | % | | 2/1/2050 | | | 73,592 | |
| | 113,920 | | | Loan ID 201062 | | Fixed | | | 3.100 | % | | 4/1/2047 | | | 112,987 | |
| | 119,913 | | | Loan ID 201063 | | Fixed | | | 4.000 | % | | 9/1/2047 | | | 111,045 | |
| | 222,465 | | | Loan ID 201066 | | Fixed | | | 4.250 | % | | 12/1/2046 | | | 231,135 | |
| | 418,561 | | | Loan ID 201067 | | Fixed | | | 4.750 | % | | 1/1/2044 | | | 439,489 | |
| | 65,651 | | | Loan ID 201069 | | Fixed | | | 4.625 | % | | 12/1/2044 | | | 68,933 | |
| | 91,601 | | | Loan ID 201072 | | Fixed | | | 3.500 | % | | 3/1/2028 | | | 92,701 | |
| | 91,784 | | | Loan ID 201075 | | Fixed | | | 4.375 | % | | 10/1/2044 | | | 95,816 | |
| | 128,907 | | | Loan ID 201077 | | Fixed | | | 3.625 | % | | 7/1/2044 | | | 131,252 | |
| | 219,892 | | | Loan ID 201084 | | Fixed | | | 5.000 | % | | 8/1/2038 | | | 219,892 | |
| | 141,488 | | | Loan ID 201086 | | Fixed | | | 4.625 | % | | 11/1/2044 | | | 148,562 | |
| | 151,838 | | | Loan ID 201091 | | Fixed | | | 4.125 | % | | 1/1/2045 | | | 156,826 | |
| | 242,235 | | | Loan ID 201092 | | Fixed | | | 5.250 | % | | 4/1/2046 | | | 242,235 | |
| | 132,227 | | | Loan ID 201093 | | Fixed | | | 4.125 | % | | 9/1/2043 | | | 109,528 | |
| | 139,674 | | | Loan ID 201094 | | Fixed | | | 4.550 | % | | 3/1/2044 | | | 146,213 | |
| | 335,801 | | | Loan ID 201101 | | Fixed | | | 4.625 | % | | 3/1/2045 | | | 352,591 | |
| | 145,355 | | | Loan ID 201103 | | ARM | | | 2.875 | % | | 5/1/2044 | | | 147,331 | |
| | 153,529 | | | Loan ID 201104 | | Fixed | | | 4.375 | % | | 4/1/2045 | | | 160,092 | |
| | 73,409 | | | Loan ID 201107 | | Fixed | | | 5.150 | % | | 2/1/2036 | | | 77,080 | |
| | 150,051 | | | Loan ID 201108 | | Fixed | | | 4.750 | % | | 2/1/2054 | | | 84,713 | |
| | 495,399 | | | Loan ID 201110 | | ARM | | | 5.875 | % | | 4/1/2037 | | | 412,743 | |
| | 157,614 | | | Loan ID 201111 | | Fixed | | | 4.875 | % | | 4/1/2050 | | | 111,159 | |
| | 229,916 | | | Loan ID 201112 | | Fixed | | | 4.750 | % | | 8/1/2037 | | | 241,412 | |
| | 76,931 | | | Loan ID 201113 | | Fixed | | | 5.750 | % | | 12/1/2052 | | | 80,778 | |
| | 116,556 | | | Loan ID 201114 | | Fixed | | | 8.087 | % | | 5/1/2054 | | | 122,384 | |
| | 492,488 | | | Loan ID 201115 | | Fixed | | | 4.000 | % | | 2/1/2051 | | | 502,254 | |
| | 84,746 | | | Loan ID 201121 | | Fixed | | | 4.125 | % | | 10/1/2037 | | | 82,756 | |
| | 82,947 | | | Loan ID 201122 | | Fixed | | | 4.750 | % | | 11/1/2048 | | | 80,848 | |
| | 230,971 | | | Loan ID 201124 | | Fixed | | | 4.750 | % | | 4/1/2040 | | | 242,520 | |
| | 76,898 | | | Loan ID 201127 | | ARM | | | 4.875 | % | | 4/1/2037 | | | 73,523 | |
| | 112,876 | | | Loan ID 201130 | | Fixed | | | 4.850 | % | | 12/1/2037 | | | 118,520 | |
| | 115,353 | | | Loan ID 201131 | | Fixed | | | 8.250 | % | | 5/1/2053 | | | 121,120 | |
| | | | | | | | | | | | | | | | | |
The accompanying notes are an integral part of these financial statements.
| Vertical Capital Income Fund |
| PORTFOLIO OF INVESTMENTS (Continued) |
| September 30, 2019 |
| Principal | | | | | Loan Type | | Interest Rate | | | Maturity | | Fair Value | |
| | | | | MORTGAGE NOTES (Continued) - 97.9% | | | | | | | | | |
| $ | 165,629 | | | Loan ID 201132 | | Fixed | | | 4.250 | % | | 7/1/2037 | | $ | 146,104 | |
| | 191,819 | | | Loan ID 201134 | | Fixed | | | 3.000 | % | | 10/1/2053 | | | 169,735 | |
| | 51,744 | | | Loan ID 201138 | | Fixed | | | 4.250 | % | | 3/1/2034 | | | 53,631 | |
| | 157,161 | | | Loan ID 201139 | | Fixed | | | 3.000 | % | | 11/1/2053 | | | 130,299 | |
| | 145,612 | | | Loan ID 201140 | | Fixed | | | 4.870 | % | | 1/1/2038 | | | 152,893 | |
| | 83,536 | | | Loan ID 201143 | | Fixed | | | 3.500 | % | | 11/1/2037 | | | 74,688 | |
| | 127,799 | | | Loan ID 201146 | | Fixed | | | 4.875 | % | | 8/1/2054 | | | 122,899 | |
| | 106,336 | | | Loan ID 201147 | | Fixed | | | 4.125 | % | | 11/1/2051 | | | 100,781 | |
| | 91,108 | | | Loan ID 201148 | | Fixed | | | 3.950 | % | | 10/1/2042 | | | 93,521 | |
| | 312,518 | | | Loan ID 201149 | | Fixed | | | 5.000 | % | | 5/1/2058 | | | 150,247 | |
| | 91,184 | | | Loan ID 201155 | | Fixed | | | 3.000 | % | | 11/1/2053 | | | 59,293 | |
| | 62,299 | | | Loan ID 201156 | | Fixed | | | 5.000 | % | | 4/1/2050 | | | 51,229 | |
| | 282,046 | | | Loan ID 201157 | | Fixed | | | 4.000 | % | | 3/1/2055 | | | 290,489 | |
| | 197,861 | | | Loan ID 201160 | | Fixed | | | 4.920 | % | | 10/1/2049 | | | 148,734 | |
| | 371,696 | | | Loan ID 201163 | | Fixed | | | 4.750 | % | | 12/1/2049 | | | 259,396 | |
| | 160,795 | | | Loan ID 201164 | | Fixed | | | 4.250 | % | | 11/1/2051 | | | 166,707 | |
| | 105,392 | | | Loan ID 201165 | | Fixed | | | 4.750 | % | | 1/1/2044 | | | 110,662 | |
| | 420,282 | | | Loan ID 201168 | | Fixed | | | 3.875 | % | | 4/1/2052 | | | 388,914 | |
| | 101,150 | | | Loan ID 201169 | | Fixed | | | 5.934 | % | | 9/1/2037 | | | 63,485 | |
| | 61,068 | | | Loan ID 201170 | | Fixed | | | 4.375 | % | | 7/1/2037 | | | 63,789 | |
| | 104,763 | | | Loan ID 201173 | | Fixed | | | 4.280 | % | | 11/1/2047 | | | 60,738 | |
| | 140,880 | | | Loan ID 201174 | | Fixed | | | 4.750 | % | | 1/1/2053 | | | 147,924 | |
| | 130,908 | | | Loan ID 201176 | | Fixed | | | 4.250 | % | | 8/1/2053 | | | 135,777 | |
| | 294,528 | | | Loan ID 201179 | | Fixed | | | 4.750 | % | | 5/1/2051 | | | 244,756 | |
| | 279,446 | | | Loan ID 201181 | | Fixed | | | 4.500 | % | | 4/1/2034 | | | 292,088 | |
| | 129,036 | | | Loan ID 201183 | | Fixed | | | 3.500 | % | | 10/1/2052 | | | 118,609 | |
| | 60,986 | | | Loan ID 201184 | | Fixed | | | 4.000 | % | | 6/1/2049 | | | 62,697 | |
| | 250,595 | | | Loan ID 201185 | | Fixed | | | 6.760 | % | | 10/1/2053 | | | 216,309 | |
| | 78,278 | | | Loan ID 201187 | | Fixed | | | 4.000 | % | | 11/1/2048 | | | 43,908 | |
| | 602,585 | | | Loan ID 201196 | | Fixed | | | 4.000 | % | | 11/1/2036 | | | 541,078 | |
| | 180,558 | | | Loan ID 201197 | | Fixed | | | 6.500 | % | | 4/1/2049 | | | 189,586 | |
| | 322,303 | | | Loan ID 201199 | | Fixed | | | 5.125 | % | | 11/1/2046 | | | 300,664 | |
| | 431,536 | | | Loan ID 201204 | | Fixed | | | 3.750 | % | | 4/1/2045 | | | 440,776 | |
| | 142,028 | | | Loan ID 201205 | | Fixed | | | 4.625 | % | | 1/1/2045 | | | 149,130 | |
| | 124,644 | | | Loan ID 201206 | | Fixed | | | 3.990 | % | | 4/1/2045 | | | 128,513 | |
| | 407,482 | | | Loan ID 201207 | | Fixed | | | 4.625 | % | | 8/1/2051 | | | 422,548 | |
| | 110,708 | | | Loan ID 201208 | | Fixed | | | 4.625 | % | | 4/1/2045 | | | 115,984 | |
| | 172,082 | | | Loan ID 201209 | | Fixed | | | 4.250 | % | | 4/1/2045 | | | 170,911 | |
| | 122,849 | | | Loan ID 201211 | | Fixed | | | 4.125 | % | | 7/1/2044 | | | 106,344 | |
| | 359,698 | | | Loan ID 201212 | | Fixed | | | 4.625 | % | | 10/1/2058 | | | 322,709 | |
| | 190,193 | | | Loan ID 201213 | | Fixed | | | 4.875 | % | | 8/1/2044 | | | 199,049 | |
| | 517,849 | | | Loan ID 201214 | | ARM | | | 3.875 | % | | 9/1/2043 | | | 405,836 | |
| | 120,564 | | | Loan ID 201218 | | Fixed | | | 4.125 | % | | 1/1/2045 | | | 123,062 | |
| | 61,155 | | | Loan ID 201221 | | Fixed | | | 3.250 | % | | 5/1/2043 | | | 64,212 | |
| | 46,444 | | | Loan ID 201222 | | Fixed | | | 5.125 | % | | 1/1/2045 | | | 48,766 | |
| | 188,136 | | | Loan ID 201223 | | Fixed | | | 3.875 | % | | 4/1/2030 | | | 195,861 | |
| | 55,805 | | | Loan ID 201226 | | Fixed | | | 5.000 | % | | 3/1/2045 | | | 58,595 | |
| | 52,207 | | | Loan ID 201229 | | Fixed | | | 3.250 | % | | 7/1/2024 | | | 52,567 | |
| | 248,228 | | | Loan ID 201233 | | Fixed | | | 4.500 | % | | 12/1/2044 | | | 216,620 | |
| | 224,568 | | | Loan ID 201237 | | Fixed | | | 3.750 | % | | 5/1/2045 | | | 229,719 | |
| | | | | | | | | | | | | | | | | |
The accompanying notes are an integral part of these financial statements.
| Vertical Capital Income Fund |
| PORTFOLIO OF INVESTMENTS (Continued) |
| September 30, 2019 |
| Principal | | | | | Loan Type | | Interest Rate | | | Maturity | | Fair Value | |
| | | | | MORTGAGE NOTES (Continued) - 97.9% | | | | | | | | | |
| $ | 152,865 | | | Loan ID 201240 | | Fixed | | | 4.250 | % | | 10/1/2045 | | $ | 102,861 | |
| | 285,600 | | | Loan ID 201241 | | Fixed | | | 4.375 | % | | 7/1/2045 | | | 298,616 | |
| | 217,885 | | | Loan ID 201242 | | Fixed | | | 4.625 | % | | 11/1/2044 | | | 228,248 | |
| | 105,961 | | | Loan ID 201243 | | Fixed | | | 4.625 | % | | 11/1/2045 | | | 111,068 | |
| | 384,958 | | | Loan ID 201244 | | Fixed | | | 4.500 | % | | 6/1/2045 | | | 402,732 | |
| | 109,620 | | | Loan ID 201245 | | Fixed | | | 4.750 | % | | 8/1/2044 | | | 115,101 | |
| | 96,973 | | | Loan ID 201248 | | Fixed | | | 4.875 | % | | 7/1/2044 | | | 101,822 | |
| | 466,697 | | | Loan ID 201249 | | Fixed | | | 4.625 | % | | 3/1/2059 | | | 472,474 | |
| | 154,364 | | | Loan ID 201254 | | ARM | | | 9.000 | % | | 9/1/2034 | | | 154,364 | |
| | 230,339 | | | Loan ID 201255 | | ARM | | | 9.125 | % | | 6/1/2035 | | | 241,855 | |
| | 17,427 | | | Loan ID 201256 | | ARM | | | 10.500 | % | | 10/1/2021 | | | 18,169 | |
| | 230,490 | | | Loan ID 201257 | | Fixed | | | 4.500 | % | | 5/1/2044 | | | 240,579 | |
| | 87,481 | | | Loan ID 201258 | | Fixed | | | 4.500 | % | | 6/1/2045 | | | 81,512 | |
| | 166,026 | | | Loan ID 201260 | | Fixed | | | 4.750 | % | | 9/1/2045 | | | 174,327 | |
| | 48,362 | | | Loan ID 201263 | | Fixed | | | 4.750 | % | | 10/1/2045 | | | 46,560 | |
| | 345,509 | | | Loan ID 201265 | | Fixed | | | 4.750 | % | | 6/1/2045 | | | 362,784 | |
| | 140,802 | | | Loan ID 201266 | | Fixed | | | 4.500 | % | | 2/1/2046 | | | 146,755 | |
| | 146,120 | | | Loan ID 201270 | | Fixed | | | 4.125 | % | | 2/1/2045 | | | 151,105 | |
| | 245,406 | | | Loan ID 201271 | | Fixed | | | 4.500 | % | | 6/1/2045 | | | 226,493 | |
| | 134,965 | | | Loan ID 201272 | | Fixed | | | 4.750 | % | | 11/1/2044 | | | 141,713 | |
| | 232,822 | | | Loan ID 201273 | | Fixed | | | 4.500 | % | | 12/1/2045 | | | 242,969 | |
| | 209,621 | | | Loan ID 201274 | | Fixed | | | 4.125 | % | | 10/1/2045 | | | 216,462 | |
| | 185,295 | | | Loan ID 201278 | | Fixed | | | 3.750 | % | | 12/1/2045 | | | 186,059 | |
| | 358,293 | | | Loan ID 201280 | | Fixed | | | 4.500 | % | | 4/1/2046 | | | 373,292 | |
| | 147,969 | | | Loan ID 201281 | | Fixed | | | 4.875 | % | | 7/1/2044 | | | 155,367 | |
| | 125,603 | | | Loan ID 201282 | | Fixed | | | 5.250 | % | | 1/1/2046 | | | 131,884 | |
| | 107,100 | | | Loan ID 201283 | | Fixed | | | 4.250 | % | | 11/1/2045 | | | 110,648 | |
| | 115,267 | | | Loan ID 201284 | | Fixed | | | 3.625 | % | | 2/1/2029 | | | 118,917 | |
| | 28,433 | | | Loan ID 201285 | | Fixed | | | 4.625 | % | | 11/1/2028 | | | 29,748 | |
| | 106,505 | | | Loan ID 201286 | | Fixed | | | 4.375 | % | | 12/1/2045 | | | 111,016 | |
| | 82,184 | | | Loan ID 201289 | | Fixed | | | 4.000 | % | | 3/1/2045 | | | 84,451 | |
| | 240,124 | | | Loan ID 201290 | | Fixed | | | 4.750 | % | | 7/1/2045 | | | 252,130 | |
| | 294,901 | | | Loan ID 201291 | | Fixed | | | 5.000 | % | | 8/1/2045 | | | 309,646 | |
| | 119,918 | | | Loan ID 201294 | | Fixed | | | 4.625 | % | | 2/1/2046 | | | 125,464 | |
| | 738,930 | | | Loan ID 201296 | | Fixed | | | 4.250 | % | | 2/1/2046 | | | 764,674 | |
| | 329,254 | | | Loan ID 201297 | | Fixed | | | 4.875 | % | | 8/1/2045 | | | 345,716 | |
| | 70,604 | | | Loan ID 201301 | | Fixed | | | 4.550 | % | | 10/1/2044 | | | 73,850 | |
| | 131,131 | | | Loan ID 201302 | | Fixed | | | 4.250 | % | | 5/1/2045 | | | 136,074 | |
| | 218,588 | | | Loan ID 201304 | | Fixed | | | 4.125 | % | | 2/1/2046 | | | 225,988 | |
| | 143,680 | | | Loan ID 201305 | | Fixed | | | 4.625 | % | | 8/1/2044 | | | 150,864 | |
| | 112,680 | | | Loan ID 201306 | | Fixed | | | 3.875 | % | | 9/1/2045 | | | 116,631 | |
| | 170,077 | | | Loan ID 201307 | | Fixed | | | 4.250 | % | | 10/1/2048 | | | 176,298 | |
| | 60,319 | | | Loan ID 201308 | | Fixed | | | 4.625 | % | | 11/1/2045 | | | 63,037 | |
| | 157,132 | | | Loan ID 201309 | | Fixed | | | 4.000 | % | | 9/1/2045 | | | 159,820 | |
| | 312,730 | | | Loan ID 201313 | | Fixed | | | 4.625 | % | | 1/1/2046 | | | 326,922 | |
| | 109,342 | | | Loan ID 201315 | | Fixed | | | 4.375 | % | | 9/1/2045 | | | 113,650 | |
| | 157,308 | | | Loan ID 201316 | | Fixed | | | 4.500 | % | | 2/1/2046 | | | 136,911 | |
| | 166,910 | | | Loan ID 201319 | | Fixed | | | 4.375 | % | | 10/1/2045 | | | 171,722 | |
| | 132,156 | | | Loan ID 201324 | | Fixed | | | 5.250 | % | | 4/1/2046 | | | 138,764 | |
| | | | | | | | | | | | | | | | | |
The accompanying notes are an integral part of these financial statements.
| Vertical Capital Income Fund |
| PORTFOLIO OF INVESTMENTS (Continued) |
| September 30, 2019 |
| Principal | | | | | Loan Type | | Interest Rate | | | Maturity | | Fair Value | |
| | | | | MORTGAGE NOTES (Continued) - 97.9% | | | | | | | | | |
| $ | 171,231 | | | Loan ID 201326 | | Fixed | | | 4.625 | % | | 3/1/2046 | | $ | 178,901 | |
| | 185,035 | | | Loan ID 201328 | | Fixed | | | 4.250 | % | | 11/1/2045 | | | 109,734 | |
| | 262,652 | | | Loan ID 201330 | | Fixed | | | 4.375 | % | | 6/1/2046 | | | 273,312 | |
| | 337,205 | | | Loan ID 201333 | | Fixed | | | 3.875 | % | | 1/1/2046 | | | 344,894 | |
| | 187,350 | | | Loan ID 201335 | | Fixed | | | 4.750 | % | | 1/1/2046 | | | 196,236 | |
| | 185,395 | | | Loan ID 201336 | | Fixed | | | 4.750 | % | | 1/1/2046 | | | 163,408 | |
| | 404,572 | | | Loan ID 201339 | | Fixed | | | 4.625 | % | | 7/1/2045 | | | 388,358 | |
| | 140,766 | | | Loan ID 201342 | | Fixed | | | 4.750 | % | | 7/1/2045 | | | 147,805 | |
| | 83,430 | | | Loan ID 201343 | | Fixed | | | 4.250 | % | | 11/1/2045 | | | 86,505 | |
| | 71,294 | | | Loan ID 201344 | | Fixed | | | 5.000 | % | | 7/1/2044 | | | 74,859 | |
| | 132,027 | | | Loan ID 201345 | | Fixed | | | 4.125 | % | | 5/1/2045 | | | 134,414 | |
| | 462,232 | | | Loan ID 201347 | | Fixed | | | 5.750 | % | | 5/1/2046 | | | 485,344 | |
| | 234,756 | | | Loan ID 201350 | | Fixed | | | 4.000 | % | | 6/1/2045 | | | 137,960 | |
| | 68,705 | | | Loan ID 201352 | | Fixed | | | 4.875 | % | | 3/1/2045 | | | 72,140 | |
| | 489,851 | | | Loan ID 201354 | | Fixed | | | 3.375 | % | | 7/1/2046 | | | 510,506 | |
| | 131,448 | | | Loan ID 201355 | | Fixed | | | 5.250 | % | | 12/1/2045 | | | 138,020 | |
| | 101,421 | | | Loan ID 201356 | | Fixed | | | 4.625 | % | | 10/1/2045 | | | 106,142 | |
| | 146,788 | | | Loan ID 201358 | | Fixed | | | 4.875 | % | | 7/1/2045 | | | 139,799 | |
| | 141,220 | | | Loan ID 201361 | | Fixed | | | 5.250 | % | | 7/1/2044 | | | 148,281 | |
| | 109,406 | | | Loan ID 201364 | | Fixed | | | 3.875 | % | | 4/1/2046 | | | 110,416 | |
| | 331,210 | | | Loan ID 201365 | | Fixed | | | 4.250 | % | | 10/1/2045 | | | 342,739 | |
| | 46,879 | | | Loan ID 201368 | | Fixed | | | 5.125 | % | | 2/1/2045 | | | 49,223 | |
| | 177,978 | | | Loan ID 201370 | | Fixed | | | 4.250 | % | | 7/1/2046 | | | 167,629 | |
| | 98,142 | | | Loan ID 201371 | | Fixed | | | 4.125 | % | | 4/1/2046 | | | 100,961 | |
| | 254,200 | | | Loan ID 201372 | | Fixed | | | 4.625 | % | | 8/1/2046 | | | 254,200 | |
| | 153,691 | | | Loan ID 201373 | | Fixed | | | 5.125 | % | | 4/1/2046 | | | 161,376 | |
| | 140,859 | | | Loan ID 201375 | | Fixed | | | 4.500 | % | | 6/1/2045 | | | 147,262 | |
| | 281,603 | | | Loan ID 201377 | | Fixed | | | 3.875 | % | | 5/1/2046 | | | 295,684 | |
| | 66,543 | | | Loan ID 201379 | | Fixed | | | 5.000 | % | | 10/1/2045 | | | 69,871 | |
| | 307,642 | | | Loan ID 201381 | | Fixed | | | 4.875 | % | | 7/1/2045 | | | 323,024 | |
| | 131,711 | | | Loan ID 201383 | | Fixed | | | 4.125 | % | | 12/1/2045 | | | 138,297 | |
| | 77,000 | | | Loan ID 201384 | | Fixed | | | 4.375 | % | | 10/1/2045 | | | 80,850 | |
| | 136,250 | | | Loan ID 201385 | | Fixed | | | 4.625 | % | | 12/1/2045 | | | 143,063 | |
| | 68,947 | | | Loan ID 201386 | | Fixed | | | 5.250 | % | | 5/1/2046 | | | 72,394 | |
| | 231,040 | | | Loan ID 201390 | | Fixed | | | 5.125 | % | | 9/1/2045 | | | 242,592 | |
| | 388,127 | | | Loan ID 201391 | | Fixed | | | 5.125 | % | | 10/1/2045 | | | 407,534 | |
| | 164,753 | | | Loan ID 201392 | | Fixed | | | 3.750 | % | | 2/1/2046 | | | 150,303 | |
| | 422,702 | | | Loan ID 201393 | | Fixed | | | 3.750 | % | | 4/1/2056 | | | 443,837 | |
| | 76,149 | | | Loan ID 201394 | | Fixed | | | 6.700 | % | | 6/1/2034 | | | 79,956 | |
| | 83,763 | | | Loan ID 201395 | | Fixed | | | 6.300 | % | | 7/1/2044 | | | 79,622 | |
| | 259,826 | | | Loan ID 201397 | | Fixed | | | 4.125 | % | | 1/1/2046 | | | 268,265 | |
| | 80,167 | | | Loan ID 201399 | | Fixed | | | 5.000 | % | | 11/1/2045 | | | 84,176 | |
| | 84,063 | | | Loan ID 201400 | | Fixed | | | 4.750 | % | | 7/1/2044 | | | 88,266 | |
| | 88,874 | | | Loan ID 201401 | | Fixed | | | 4.750 | % | | 10/1/2044 | | | 93,318 | |
| | 92,055 | | | Loan ID 201403 | | Fixed | | | 4.750 | % | | 8/1/2044 | | | 80,618 | |
| | 132,282 | | | Loan ID 201404 | | Fixed | | | 4.750 | % | | 10/1/2044 | | | 116,157 | |
| | 70,314 | | | Loan ID 201405 | | Fixed | | | 5.250 | % | | 8/1/2044 | | | 73,829 | |
| | 53,635 | | | Loan ID 201406 | | Fixed | | | 4.250 | % | | 6/1/2046 | | | 55,308 | |
| | 237,105 | | | Loan ID 201407 | | Fixed | | | 4.875 | % | | 1/1/2046 | | | 248,960 | |
| | 161,750 | | | Loan ID 201408 | | Fixed | | | 4.125 | % | | 1/1/2046 | | | 167,353 | |
| | | | | | | | | | | | | | | | | |
The accompanying notes are an integral part of these financial statements.
| Vertical Capital Income Fund |
| PORTFOLIO OF INVESTMENTS (Continued) |
| September 30, 2019 |
| Principal | | | | | Loan Type | | Interest Rate | | | Maturity | | Fair Value | |
| | | | | MORTGAGE NOTES (Continued) - 97.9% | | | | | | | | | |
| $ | 160,209 | | | Loan ID 201411 | | Fixed | | | 4.750 | % | | 12/1/2045 | | $ | 168,219 | |
| | 139,612 | | | Loan ID 201412 | | Fixed | | | 5.750 | % | | 12/1/2045 | | | 136,852 | |
| | 329,301 | | | Loan ID 201413 | | Fixed | | | 4.500 | % | | 7/1/2045 | | | 308,555 | |
| | 72,500 | | | Loan ID 201414 | | Fixed | | | 4.250 | % | | 7/1/2044 | | | 75,299 | |
| | 55,882 | | | Loan ID 201415 | | Fixed | | | 8.000 | % | | 4/1/2034 | | | 58,676 | |
| | 53,194 | | | Loan ID 201416 | | Fixed | | | 10.000 | % | | 7/1/2033 | | | 55,854 | |
| | 59,600 | | | Loan ID 201417 | | Fixed | | | 6.000 | % | | 8/1/2037 | | | 62,580 | |
| | 41,231 | | | Loan ID 201419 | | Fixed | | | 10.000 | % | | 11/1/2033 | | | 43,293 | |
| | 56,114 | | | Loan ID 201422 | | Fixed | | | 4.625 | % | | 10/1/2046 | | | 58,233 | |
| | 672,778 | | | Loan ID 201423 | | ARM | | | 3.875 | % | | 6/1/2045 | | | 703,395 | |
| | 649,231 | | | Loan ID 201425 | | Fixed | | | 3.875 | % | | 4/1/2046 | | | 664,978 | |
| | 308,221 | | | Loan ID 201426 | | Fixed | | | 4.875 | % | | 3/1/2044 | | | 323,632 | |
| | 526,411 | | | Loan ID 201428 | | ARM | | | 3.250 | % | | 4/1/2045 | | | 528,584 | |
| | 192,592 | | | Loan ID 201431 | | Fixed | | | 4.875 | % | | 5/1/2045 | | | 183,326 | |
| | 275,438 | | | Loan ID 201432 | | Fixed | | | 5.000 | % | | 8/1/2046 | | | 288,589 | |
| | 96,460 | | | Loan ID 201434 | | Fixed | | | 4.375 | % | | 6/1/2046 | | | 100,147 | |
| | 88,704 | | | Loan ID 201436 | | Fixed | | | 4.375 | % | | 5/1/2045 | | | 92,544 | |
| | 127,376 | | | Loan ID 201437 | | Fixed | | | 4.750 | % | | 5/1/2046 | | | 77,009 | |
| | 176,261 | | | Loan ID 201439 | | Fixed | | | 5.000 | % | | 12/1/2045 | | | 185,074 | |
| | 312,806 | | | Loan ID 201440 | | Fixed | | | 4.625 | % | | 7/1/2046 | | | 165,342 | |
| | 98,191 | | | Loan ID 201441 | | Fixed | | | 4.750 | % | | 10/1/2045 | | | 102,652 | |
| | 293,100 | | | Loan ID 201442 | | Fixed | | | 4.875 | % | | 12/1/2045 | | | 306,201 | |
| | 541,765 | | | Loan ID 201443 | | Fixed | | | 3.875 | % | | 8/1/2046 | | | 553,664 | |
| | 50,190 | | | Loan ID 201444 | | Fixed | | | 4.500 | % | | 11/1/2044 | | | 52,401 | |
| | 97,454 | | | Loan ID 201446 | | Fixed | | | 4.875 | % | | 1/1/2045 | | | 102,327 | |
| | 247,913 | | | Loan ID 201447 | | Fixed | | | 4.875 | % | | 10/1/2044 | | | 260,309 | |
| | 91,089 | | | Loan ID 201449 | | Fixed | | | 4.000 | % | | 8/1/2044 | | | 93,866 | |
| | 219,226 | | | Loan ID 201451 | | Fixed | | | 4.250 | % | | 6/1/2045 | | | 227,734 | |
| | 184,580 | | | Loan ID 201453 | | Fixed | | | 5.250 | % | | 9/1/2046 | | | 193,639 | |
| | 184,580 | | | Loan ID 201454 | | Fixed | | | 5.250 | % | | 9/1/2046 | | | 193,734 | |
| | 181,029 | | | Loan ID 201455 | | Fixed | | | 4.500 | % | | 5/1/2046 | | | 188,701 | |
| | 204,412 | | | Loan ID 201456 | | Fixed | | | 4.125 | % | | 7/1/2046 | | | 210,810 | |
| | 230,624 | | | Loan ID 201458 | | Fixed | | | 3.875 | % | | 9/1/2046 | | | 232,267 | |
| | 154,624 | | | Loan ID 201460 | | Fixed | | | 4.250 | % | | 7/1/2045 | | | 160,536 | |
| | 264,775 | | | Loan ID 201461 | | Fixed | | | 4.125 | % | | 12/1/2044 | | | 273,020 | |
| | 464,815 | | | Loan ID 201463 | | Fixed | | | 4.750 | % | | 11/1/2044 | | | 488,056 | |
| | 293,943 | | | Loan ID 201464 | | Fixed | | | 4.375 | % | | 6/1/2045 | | | 273,569 | |
| | 99,825 | | | Loan ID 201465 | | Fixed | | | 5.125 | % | | 12/1/2044 | | | 104,816 | |
| | 269,421 | | | Loan ID 201466 | | Fixed | | | 4.500 | % | | 12/1/2044 | | | 281,510 | |
| | 45,309 | | | Loan ID 201467 | | Fixed | | | 5.250 | % | | 3/1/2044 | | | 47,575 | |
| | 275,195 | | | Loan ID 201470 | | Fixed | | | 4.375 | % | | 10/1/2044 | | | 286,766 | |
| | 220,273 | | | Loan ID 201471 | | Fixed | | | 4.500 | % | | 1/1/2045 | | | 230,239 | |
| | 146,388 | | | Loan ID 201472 | | Fixed | | | 4.000 | % | | 11/1/2044 | | | 153,708 | |
| | 300,567 | | | Loan ID 201473 | | Fixed | | | 4.500 | % | | 2/1/2045 | | | 314,819 | |
| | 91,119 | | | Loan ID 201475 | | ARM | | | 6.625 | % | | 9/1/2036 | | | 71,092 | |
| | 132,579 | | | Loan ID 201476 | | ARM | | | 8.500 | % | | 2/1/2037 | | | 119,705 | |
| | 82,787 | | | Loan ID 201477 | | Fixed | | | 6.750 | % | | 11/1/2036 | | | 86,926 | |
| | 105,148 | | | Loan ID 201478 | | Fixed | | | 4.625 | % | | 10/1/2045 | | | 110,359 | |
| | 156,292 | | | Loan ID 201480 | | Fixed | | | 4.250 | % | | 11/1/2045 | | | 162,303 | |
| | 68,244 | | | Loan ID 201481 | | Fixed | | | 4.375 | % | | 7/1/2046 | | | 69,903 | |
| | | | | | | | | | | | | | | | | |
The accompanying notes are an integral part of these financial statements.
| Vertical Capital Income Fund |
| PORTFOLIO OF INVESTMENTS (Continued) |
| September 30, 2019 |
| Principal | | | | | Loan Type | | Interest Rate | | | Maturity | | Fair Value | |
| | | | | MORTGAGE NOTES (Continued) - 97.9% | | | | | | | | | |
| $ | 133,112 | | | Loan ID 201482 | | Fixed | | | 4.625 | % | | 6/1/2045 | | $ | 139,087 | |
| | 290,778 | | | Loan ID 201483 | | Fixed | | | 4.125 | % | | 12/1/2045 | | | 272,004 | |
| | 74,831 | | | Loan ID 201484 | | Fixed | | | 4.500 | % | | 10/1/2046 | | | 77,711 | |
| | 61,693 | | | Loan ID 201485 | | Fixed | | | 5.750 | % | | 3/1/2038 | | | 64,777 | |
| | 162,562 | | | Loan ID 201487 | | Fixed | | | 4.625 | % | | 2/1/2052 | | | 170,690 | |
| | 90,259 | | | Loan ID 201489 | | Fixed | | | 4.750 | % | | 3/1/2046 | | | 94,633 | |
| | 104,980 | | | Loan ID 201490 | | Fixed | | | 4.750 | % | | 9/1/2045 | | | 110,029 | |
| | 220,234 | | | Loan ID 201491 | | Fixed | | | 4.250 | % | | 2/1/2046 | | | 227,745 | |
| | 373,986 | | | Loan ID 201492 | | Fixed | | | 4.625 | % | | 1/1/2047 | | | 356,698 | |
| | 77,612 | | | Loan ID 201499 | | Fixed | | | 4.750 | % | | 5/1/2045 | | | 81,263 | |
| | 104,784 | | | Loan ID 201502 | | Fixed | | | 5.250 | % | | 4/1/2044 | | | 110,024 | |
| | 146,213 | | | Loan ID 201503 | | Fixed | | | 5.000 | % | | 7/1/2046 | | | 152,995 | |
| | 446,696 | | | Loan ID 201504 | | Fixed | | | 4.500 | % | | 7/1/2045 | | | 365,729 | |
| | 91,312 | | | Loan ID 201505 | | ARM | | | 5.750 | % | | 9/1/2046 | | | 95,745 | |
| | 300,459 | | | Loan ID 201506 | | Fixed | | | 5.000 | % | | 2/1/2047 | | | 284,587 | |
| | 218,493 | | | Loan ID 201508 | | Fixed | | | 5.000 | % | | 2/1/2047 | | | 226,548 | |
| | 231,942 | | | Loan ID 201509 | | Fixed | | | 5.000 | % | | 12/1/2046 | | | 223,616 | |
| | 78,121 | | | Loan ID 201511 | | Fixed | | | 4.375 | % | | 1/1/2046 | | | 80,926 | |
| | 122,427 | | | Loan ID 201513 | | Fixed | | | 4.000 | % | | 1/1/2046 | | | 128,549 | |
| | 135,901 | | | Loan ID 201515 | | Fixed | | | 5.125 | % | | 4/1/2047 | | | 141,963 | |
| | 136,079 | | | Loan ID 201516 | | Fixed | | | 3.875 | % | | 4/1/2046 | | | 139,394 | |
| | 317,532 | | | Loan ID 201517 | | Fixed | | | 4.625 | % | | 6/1/2046 | | | 333,095 | |
| | 402,390 | | | Loan ID 201518 | | Fixed | | | 4.875 | % | | 1/1/2047 | | | 421,945 | |
| | 93,971 | | | Loan ID 201519 | | Fixed | | | 4.750 | % | | 9/1/2045 | | | 98,669 | |
| | 79,200 | | | Loan ID 201522 | | Interest Only | | | 9.750 | % | | 5/1/2018 | | | 77,616 | |
| | 80,299 | | | Loan ID 201523 | | Fixed | | | 5.125 | % | | 7/1/2045 | | | 84,313 | |
| | 310,185 | | | Loan ID 201525 | | ARM | | | 7.500 | % | | 9/1/2046 | | | 287,032 | |
| | 152,422 | | | Loan ID 201526 | | Fixed | | | 5.250 | % | | 9/1/2044 | | | 147,348 | |
| | 363,844 | | | Loan ID 201527 | | Fixed | | | 4.375 | % | | 7/1/2046 | | | 376,050 | |
| | 488,117 | | | Loan ID 201533 | | Fixed | | | 4.750 | % | | 5/1/2046 | | | 510,375 | |
| | 43,555 | | | Loan ID 201534 | | Fixed | | | 4.875 | % | | 5/1/2047 | | | 45,216 | |
| | 327,563 | | | Loan ID 201535 | | Fixed | | | 4.875 | % | | 8/1/2047 | | | 342,601 | |
| | 466,414 | | | Loan ID 201536 | | Fixed | | | 3.375 | % | | 4/1/2045 | | | 414,583 | |
| | 162,408 | | | Loan ID 201544 | | Fixed | | | 3.750 | % | | 9/1/2047 | | | 170,528 | |
| | 269,937 | | | Loan ID 201545 | | Fixed | | | 4.000 | % | | 9/1/2047 | | | 278,862 | |
| | 55,754 | | | Loan ID 201548 | | Interest Only | | | 12.000 | % | | 6/1/2019 | | | 55,475 | |
| | 149,500 | | | Loan ID 201549 | | Interest Only | | | 12.500 | % | | 10/1/2019 | | | 147,258 | |
| | 141,299 | | | Loan ID 201550 | | Fixed | | | 5.000 | % | | 2/1/2047 | | | 148,186 | |
| | 199,566 | | | Loan ID 201551 | | Fixed | | | 4.500 | % | | 2/1/2047 | | | 146,526 | |
| | 134,614 | | | Loan ID 201552 | | Fixed | | | 4.000 | % | | 8/1/2047 | | | 138,925 | |
| | 47,100 | | | Loan ID 201556 | | Fixed | | | 4.990 | % | | 12/1/2047 | | | 47,143 | |
| | 130,832 | | | Loan ID 201558 | | Fixed | | | 4.500 | % | | 8/1/2047 | | | 137,374 | |
| | 98,312 | | | Loan ID 201562 | | Fixed | | | 4.625 | % | | 5/1/2047 | | | 103,227 | |
| | 172,484 | | | Loan ID 201563 | | Fixed | | | 5.875 | % | | 12/1/2047 | | | 177,868 | |
| | 75,000 | | | Loan ID 201566 | | Interest Only | | | 11.500 | % | | 2/1/2019 | | | 73,876 | |
| | 109,637 | | | Loan ID 201579 | | Fixed | | | 4.750 | % | | 12/1/2036 | | | 105,258 | |
| | 488,087 | | | Loan ID 201580 | | Fixed | | | 7.625 | % | | 4/1/2047 | | | 512,491 | |
| | 85,292 | | | Loan ID 201581 | | Fixed | | | 4.125 | % | | 10/1/2046 | | | 79,653 | |
| | 87,229 | | | Loan ID 201583 | | Fixed | | | 5.250 | % | | 8/1/2047 | | | 90,294 | |
| | 46,850 | | | Loan ID 201585 | | Fixed | | | 5.500 | % | | 3/1/2048 | | | 47,584 | |
| | | | | | | | | | | | | | | | | |
The accompanying notes are an integral part of these financial statements.
| Vertical Capital Income Fund |
| PORTFOLIO OF INVESTMENTS (Continued) |
| September 30, 2019 |
| Principal | | | | | Loan Type | | Interest Rate | | | Maturity | | Fair Value | |
| | | | | MORTGAGE NOTES (Continued) - 97.9% | | | | | | | | | |
| $ | 382,834 | | | Loan ID 201586 | | Fixed | | | 4.625 | % | | 5/1/2047 | | $ | 397,570 | |
| | 314,661 | | | Loan ID 201587 | | Fixed | | | 4.375 | % | | 1/1/2048 | | | 300,670 | |
| | 329,433 | | | Loan ID 201588 | | Fixed | | | 5.125 | % | | 2/1/2048 | | | 311,191 | |
| | 64,621 | | | Loan ID 201589 | | Fixed | | | 5.375 | % | | 6/1/2048 | | | 66,629 | |
| | 138,624 | | | Loan ID 201590 | | Fixed | | | 5.200 | % | | 5/1/2048 | | | 82,507 | |
| | 314,827 | | | Loan ID 201591 | | Fixed | | | 5.375 | % | | 8/1/2048 | | | 298,866 | |
| | 75,000 | | | Loan ID 201593 | | Interest Only | | | 13.500 | % | | 11/1/2019 | | | 72,750 | |
| | 365,500 | | | Loan ID 201594 | | Interest Only | | | 11.250 | % | | 6/1/2019 | | | 360,018 | |
| | 46,800 | | | Loan ID 201597 | | Interest Only | | | 12.990 | % | | 9/1/2019 | | | 46,332 | |
| | 67,625 | | | Loan ID 201598 | | Fixed | | | 6.000 | % | | 1/1/2037 | | | 63,820 | |
| | 340,370 | | | Loan ID 201599 | | Fixed | | | 5.000 | % | | 7/1/2038 | | | 265,262 | |
| | 44,013 | | | Loan ID 201600 | | Fixed | | | 6.000 | % | | 1/1/2036 | | | 17,868 | |
| | 36,112 | | | Loan ID 201602 | | Fixed | | | 5.000 | % | | 4/20/2032 | | | 37,917 | |
| | 59,592 | | | Loan ID 201604 | | Fixed | | | 8.500 | % | | 1/1/2048 | | | 48,706 | |
| | 73,857 | | | Loan ID 201605 | | Fixed | | | 8.750 | % | | 3/1/2048 | | | 77,550 | |
| | 89,656 | | | Loan ID 201606 | | Fixed | | | 9.990 | % | | 5/1/2048 | | | 92,581 | |
| | 57,642 | | | Loan ID 201607 | | Fixed | | | 9.990 | % | | 5/1/2048 | | | 51,755 | |
| | 66,346 | | | Loan ID 201608 | | Fixed | | | 9.990 | % | | 6/1/2048 | | | 69,663 | |
| | 43,313 | | | Loan ID 201610 | | Fixed | | | 9.990 | % | | 7/1/2048 | | | 45,479 | |
| | 59,357 | | | Loan ID 201611 | | Fixed | | | 9.990 | % | | 7/1/2048 | | | 62,325 | |
| | 255,000 | | | Loan ID 201612 | | Interest Only | | | 12.000 | % | | 10/1/2020 | | | 252,450 | |
| | 193,162 | | | Loan ID 201613 | | Fixed | | | 4.500 | % | | 9/1/2047 | | | 101,212 | |
| | 33,750 | | | Loan ID 201614 | | Interest Only | | | 12.000 | % | | 12/1/2019 | | | 33,075 | |
| | 500,079 | | | Loan ID 201615 | | Fixed | | | 10.500 | % | | 1/1/2021 | | | 497,579 | |
| | 480,788 | | | Loan ID 201616 | | Interest Only | | | 9.990 | % | | 1/1/2020 | | | 478,383 | |
| | 178,641 | | | Loan ID 201617 | | Fixed | | | 9.750 | % | | 2/1/2022 | | | 176,855 | |
| | 97,785 | | | Loan ID 201622 | | Fixed | | | 9.750 | % | | 3/1/2021 | | | 96,807 | |
| | 32,011 | | | Loan ID 201623 | | Fixed | | | 9.950 | % | | 10/11/2031 | | | 33,612 | |
| | 34,015 | | | Loan ID 201624 | | Fixed | | | 11.000 | % | | 7/22/2028 | | | 33,290 | |
| | 42,192 | | | Loan ID 201626 | | Fixed | | | 8.950 | % | | 5/18/2035 | | | 44,302 | |
| | 43,337 | | | Loan ID 201627 | | Fixed | | | 10.450 | % | | 2/19/2047 | | | 45,504 | |
| | 44,537 | | | Loan ID 201628 | | Fixed | | | 11.000 | % | | 9/25/2032 | | | 44,537 | |
| | 44,702 | | | Loan ID 201629 | | Fixed | | | 11.000 | % | | 3/6/2033 | | | 46,937 | |
| | 46,383 | | | Loan ID 201630 | | Fixed | | | 9.950 | % | | 1/28/2020 | | | 47,095 | |
| | 46,602 | | | Loan ID 201631 | | Fixed | | | 9.950 | % | | 7/25/2031 | | | 48,932 | |
| | 50,365 | | | Loan ID 201632 | | Fixed | | | 11.000 | % | | 10/13/2041 | | | 52,883 | |
| | 55,082 | | | Loan ID 201633 | | Fixed | | | 11.000 | % | | 12/2/2032 | | | 57,836 | |
| | 63,928 | | | Loan ID 201634 | | Fixed | | | 7.950 | % | | 2/28/2048 | | | 67,125 | |
| | 65,809 | | | Loan ID 201635 | | Fixed | | | 9.950 | % | | 3/14/2046 | | | 69,100 | |
| | 84,958 | | | Loan ID 201636 | | Fixed | | | 9.450 | % | | 5/13/2031 | | | 89,205 | |
| | 99,297 | | | Loan ID 201637 | | Fixed | | | 11.000 | % | | 5/22/2045 | | | 104,261 | |
| | 143,466 | | | Loan ID 201638 | | Fixed | | | 8.500 | % | | 9/19/2044 | | | 150,639 | |
| | 326,874 | | | Loan ID 201639 | | Fixed | | | 5.000 | % | | 9/1/2048 | | | 337,424 | |
| | 347,550 | | | Loan ID 201640 | | Fixed | | | 5.125 | % | | 4/1/2049 | | | 308,077 | |
| | 158,632 | | | Loan ID 201641 | | Fixed | | | 10.500 | % | | 6/1/2020 | | | 162,335 | |
| | 420,000 | | | Loan ID 201642 | | Interest Only | | | 13.000 | % | | 4/1/2021 | | | 419,777 | |
| | 285,000 | | | Loan ID 201644 | | Interest Only | | | 10.000 | % | | 2/1/2021 | | | 299,250 | |
| | 673,000 | | | Loan ID 201645 | | Fixed | | | 8.000 | % | | 7/1/2020 | | | 634,351 | |
| | 43,788 | | | Loan ID 201647 | | Fixed | | | 6.000 | % | | 10/1/2031 | | | 25,835 | |
| | 42,749 | | | Loan ID 201648 | | Fixed | | | 7.150 | % | | 8/14/2030 | | | 30,352 | |
| | | | | | | | | | | | | | | | | |
The accompanying notes are an integral part of these financial statements.
| Vertical Capital Income Fund |
| PORTFOLIO OF INVESTMENTS (Continued) |
| September 30, 2019 |
| Principal | | | | | Loan Type | | Interest Rate | | | Maturity | | Fair Value | |
| | | | | MORTGAGE NOTES (Continued) - 97.9% | | | | | | | | | |
| $ | 63,865 | | | Loan ID 201649 | | Fixed | | | 4.800 | % | | 2/20/2030 | | $ | 48,218 | |
| | 39,928 | | | Loan ID 201650 | | Fixed | | | 7.000 | % | | 11/14/2031 | | | 27,950 | |
| | 50,336 | | | Loan ID 201651 | | Fixed | | | 7.000 | % | | 12/1/2036 | | | 26,175 | |
| | 249,292 | | | Loan ID 201652 | | Fixed | | | 5.000 | % | | 10/1/2036 | | | 183,230 | |
| | 201,178 | | | Loan ID 201653 | | Fixed | | | 4.250 | % | | 6/1/2048 | | | 141,830 | |
| | 448,891 | | | Loan ID 201654 | | Fixed | | | 4.875 | % | | 7/1/2049 | | | 446,647 | |
| | 149,125 | | | Loan ID 201655 | | Fixed | | | 7.700 | % | | 1/1/2049 | | | 148,379 | |
| | 127,504 | | | Loan ID 201656 | | Fixed | | | 4.625 | % | | 6/1/2049 | | | 126,229 | |
| | 248,805 | | | Loan ID 201657 | | Fixed | | | 5.250 | % | | 11/1/2048 | | | 211,484 | |
| | 419,764 | | | Loan ID 201658 | | Fixed | | | 5.500 | % | | 9/1/2048 | | | 417,665 | |
| | 270,654 | | | Loan ID 201659 | | Fixed | | | 4.875 | % | | 5/1/2049 | | | 269,301 | |
| | 155,347 | | | Loan ID 201660 | | Fixed | | | 5.500 | % | | 2/1/2049 | | | 154,570 | |
| | 86,156 | | | Loan ID 201661 | | Fixed | | | 5.500 | % | | 8/1/2049 | | | 81,848 | |
| | 132,252 | | | Loan ID 201662 | | Fixed | | | 5.375 | % | | 9/1/2048 | | | 128,615 | |
| | 430,965 | | | Loan ID 201663 | | Fixed | | | 4.750 | % | | 10/1/2048 | | | 387,868 | |
| | 130,934,528 | | | TOTAL MORTGAGE NOTES (Cost - $108,000,900) | | | | | 129,194,075 | |
| | | | | | | | | | | |
| | | | | OTHER INVESTMENTS* (Cost - $488,519) - 0.3% | | | | | 440,909 | |
| | | | | | | | | | | |
| | | | | TOTAL INVESTMENTS (Cost - $108,489,419) - 98.2% | | | | $ | 129,634,984 | |
| | | | | OTHER ASSETS IN EXCESS OF LIABILITIES - 1.8% | | | | | 2,309,872 | |
| | | | | NET ASSETS - 100.0% | | | | $ | 131,944,856 | |
| | | | | | | | | | | | | | | | | |
ARM - Adjustable Rate Mortgage
The accompanying notes are an integral part of these financial statements.
| Vertical Capital Income Fund |
| STATEMENT OF ASSETS AND LIABILITIES |
| September 30, 2019 |
| Assets: | | | | |
| Investments in Securities at Market Value (identified cost $108,489,419) | | $ | 129,634,984 | |
| Cash | | | 2,491,179 | |
| Interest Receivable | | | 1,674,413 | |
| Receivable for Investment Securities Sold and Principal Paydowns | | | 1,643,460 | |
| Prepaid Expenses and Other Assets | | | 415,559 | |
| Total Assets | | | 135,859,595 | |
| | | | | |
| Liabilities: | | | | |
| Line of Credit | | | 2,355,335 | |
| Payable for Securities Purchased | | | 550,195 | |
| Accrued Extraordinary Expense | | | 684,822 | |
| Accrued Advisory Fees | | | 100,490 | |
| Related Party Payable | | | 38,088 | |
| Accrued Expenses and Other Liabilities | | | 185,809 | |
| Total Liabilities | | | 3,914,739 | |
| | | | | |
| Net Assets | | $ | 131,944,856 | |
| | | | | |
| Net Assets consisted of: | | | | |
| Paid-in-Capital | | $ | 108,668,945 | |
| Accumulated earnings | | | 23,275,911 | |
| Net Assets | | $ | 131,944,856 | |
| | | | | |
| Net Asset Value Per Share | | | | |
| Net Assets | | $ | 131,944,856 | |
| Shares of Beneficial Interest Outstanding (no par value) | | | 10,380,003 | |
| Net Asset Value (Net Assets/Shares Outstanding) | | $ | 12.71 | |
| | | | | |
The accompanying notes are an integral part of these financial statements.
| Vertical Capital Income Fund |
| STATEMENT OF OPERATIONS |
| For the Year Ended September 30, 2019 |
| Investment Income: | | | | |
| Interest Income | | $ | 7,512,538 | |
| Total Investment Income | | | 7,512,538 | |
| | | | | |
| Expenses: | | | | |
| Investment Advisory Fees | | | 1,607,261 | |
| Distribution Fees: | | | | |
| Class C * | | | 392 | |
| Contested Proxy Expense | | | 684,822 | |
| Interest Expense | | | 415,608 | |
| Security Servicing Fees | | | 374,784 | |
| Fund Reorganization Expense | | | 323,027 | |
| Printing Expense | | | 196,679 | |
| Transfer Agent Fees | | | 194,323 | |
| Line of Credit Fees | | | 181,295 | |
| Audit Fees | | | 179,746 | |
| Administration Fees | | | 136,208 | |
| Trustees’ Fees | | | 123,767 | |
| Insurance Expense | | | 109,550 | |
| Shareholder Servicing Fee | | | 107,474 | |
| Legal Fees | | | 106,761 | |
| Security Pricing Expense | | | 72,910 | |
| Chief Compliance Officer Fees | | | 62,152 | |
| Fund Accounting Fees | | | 51,806 | |
| Custody Fees | | | 50,039 | |
| Registration & Filing Fees | | | 34,367 | |
| Miscellaneous Expenses | | | 27,398 | |
| Total Expenses | | | 5,040,369 | |
| Less: Expenses Waived by Adviser | | | (692,741 | ) |
| Net Expenses | | | 4,347,628 | |
| Net Investment Income | | | 3,164,910 | |
| | | | | |
| Net Realized and Unrealized Gain on Investments: | | | | |
| Net Realized Gain from: | | | | |
| Investments | | | 1,926,569 | |
| Net Change in Unrealized Appreciation on: | | | | |
| Investments | | | 5,629,734 | |
| Net Realized and Unrealized Gain on Investments | | | 7,556,303 | |
| | | | | |
| Net Increase in Net Assets Resulting From Operations | | $ | 10,721,213 | |
| * | Prior to listing on the NYSE, the Fund discontinued share class structure. |
The accompanying notes are an integral part of these financial statements.
| Vertical Capital Income Fund |
| STATEMENT OF CHANGES IN NET ASSETS |
| | | For the Year | | | For the Year | |
| | | Ended | | | Ended | |
| | | September 30, 2019 (b) | | | September 30, 2018 (a) | |
| Operations: | | | | | | | | |
| Net Investment Income | | $ | 3,164,910 | | | $ | 5,273,668 | |
| Net Realized Gain from Investments | | | 1,926,569 | | | | 2,218,536 | |
| Net Change in Unrealized Appreciation/(Depreciation) on Investments | | | 5,629,734 | | | | (1,465,814 | ) |
| Net Increase in Net Assets Resulting From Operations | | | 10,721,213 | | | | 6,026,390 | |
| | | | | | | | | |
| Distributions to Shareholders From: | | | | | | | | |
| Net Investment Income: | | | | | | | | |
| Class A *** | | | — | | | | (4,720,349 | ) |
| Class C *** | | | — | | | | (760 | ) |
| Net Realized Gains: | | | | | | | | |
| Class A *** | | | — | | | | (2,683,322 | ) |
| Total Distributions Paid* | | | | | | | | |
| Class A *** | | | (5,747,639 | ) | | | — | |
| Class C *** | | | (2,747 | ) | | | — | |
| Total Distributions to Shareholders | | | (5,750,386 | ) | | | (7,404,431 | ) |
| | | | | | | | | |
| Beneficial Interest Transactions: | | | | | | | | |
| Proceeds from Shares Issued: | | | | | | | | |
| Class A *** | | | 456,022 | | | | 5,704,246 | |
| Class C *** | | | — | | | | 100,013 | |
| Class I *** | | | — | | | | 13 | |
| Class L *** | | | — | | | | 13 | |
| Distributions Reinvested: | | | | | | | | |
| Class A *** | | | 2,361,676 | | | | 3,740,905 | |
| Class C *** | | | 2,747 | | | | 760 | |
| Cost of Shares Redeemed: | | | | | | | | |
| Class A *** | | | (13,501,460 | ) | | | (31,037,285 | ) |
| Class C *** | | | (105,641 | ) | | | — | |
| Class I *** | | | — | | | | (13 | ) |
| Class L *** | | | — | | | | (13 | ) |
| Net Decrease in Net Assets from Beneficial Interest Transactions | | | (10,786,656 | ) | | | (21,491,361 | ) |
| | | | | | | | | |
| Total Decrease in Net Assets | | | (5,815,829 | ) | | | (22,869,402 | ) |
| | | | | | | | | |
| Net Assets: | | | | | | | | |
| Beginning of Year | | | 137,760,685 | | | | 160,630,087 | |
| End of Year ** | | $ | 131,944,856 | | | $ | 137,760,685 | |
| (a) | The Vertical Capital Income Fund Class C, Class I, and Class L commenced operations on January 24, 2018. Class I and Class L closed on June 27, 2018. |
| (b) | Class C closed on April 2, 2019. |
| * | Distributions from net investment income and net realized capital gains are combined for the year ended September 30, 2019. See “New Accounting Pronouncements” in the Notes to Financial Statements for more information. The dividends and distributions to shareholders for the year ended September 30, 2018 have not been reclassified to conform to the current year presentation. |
| ** | Net Assets - End of Year includes net investment income in excess of distributions of $442,773 as of September 30, 2018. |
| *** | Prior to listing on the NYSE, the Fund discontinued share class structure. |
The accompanying notes are an integral part of these financial statements.
| Vertical Capital Income Fund |
| STATEMENT OF CHANGES IN NET ASSETS (Continued) |
| | | For the Year | | | For the Year | |
| | | Ended | | | Ended | |
| | | September 30, 2019 (b) | | | September 30, 2018 (a) | |
| Share Activity | | | | | | | | |
| Class A (c): | | | | | | | | |
| Shares Sold | | | 37,357 | | | | 448,705 | |
| Shares Reinvested | | | 195,274 | | | | 301,825 | |
| Shares Redeemed | | | (1,110,358 | ) | | | (2,510,899 | ) |
| Net Decrease in Shares of Beneficial Interest Outstanding | | | (877,727 | ) | | | (1,760,369 | ) |
| | | | | | | | | |
| Class C (c): | | | | | | | | |
| Shares Sold | | | — | | | | 8,145 | |
| Shares Reinvested | | | 225 | | | | 61 | |
| Shares Redeemed | | | (8,431 | ) | | | — | |
| Net Increase/(Decrease) in Shares of Beneficial Interest Outstanding | | | (8,206 | ) | | | 8,206 | |
| | | | | | | | | |
| Class I (c): | | | | | | | | |
| Shares Sold | | | — | | | | 1 | |
| Shares Redeemed | | | — | | | | (1 | ) |
| Net Increase in Shares of Beneficial Interest Outstanding | | | — | | | | 0 | |
| | | | | | | | | |
| Class L (c): | | | | | | | | |
| Shares Sold | | | — | | | | 1 | |
| Shares Redeemed | | | — | | | | (1 | ) |
| Net Increase in Shares of Beneficial Interest Outstanding | | | — | | | | 0 | |
| (a) | The Vertical Capital Income Fund Class C, Class I, and Class L commenced operations on January 24, 2018. Class I and Class L closed on June 27, 2018. |
| (b) | The Vertical Capital Income Fund Class C, Class I, and Class L commenced operations on January 24, 2018. Class I and Class L closed on June 27, 2018. |
| (c) | Prior to listing on the NYSE, the Fund discontinued share class structure. |
The accompanying notes are an integral part of these financial statements.
| Vertical Capital Income Fund |
| Statement of Cash Flows |
| For the Year Ended September 30, 2019 |
| Decrease in Cash | | | | |
| Cash Flows Provided by (Used for) Operating Activities: | | | | |
| Net Increase in Net Assets Resulting from Operations | | $ | 10,721,213 | |
| | | | | |
| Adjustments to Reconcile Net Increase in Net Assets Resulting from Operations to Net Cash Provided by Operating Activities: | | | | |
| | | | | |
| Purchases of Long-Term Portfolio Investments | | | (9,287,427 | ) |
| Proceeds from Sale of Long-Term Portfolio Investments and Principal Paydowns | | | 21,605,416 | |
| Proceeds from Short-Term Portfolio Investments, Net Decrease in Interest Receivable | | | 377,906 | |
| Increase in Receivable for Investment Securities Sold and Principal Paydowns | | | (852,212 | ) |
| Decrease in Prepaid Expenses and Other Assets | | | 72,838 | |
| Increase in Payable for Securities Purchased | | | 518,054 | |
| Increase in Accrued Advisory Fees | | | 90,971 | |
| Increase in Accrued Extraordinary Fees | | | 684,822 | |
| Decrease in Distribution Fees Payable | | | (63 | ) |
| Decrease in Related Party Payable | | | (10,723 | ) |
| Decrease in Accrued Expenses and Other Liabilities | | | (31,090 | ) |
| Amortization of Deferred Financing Fees | | | 191,294 | |
| Net Amortization on Investments | | | (465,400 | ) |
| Net Realized Gain on Investments | | | (1,926,569 | ) |
| Change in Unrealized Appreciation on Investments | | | (5,629,734 | ) |
| | | | | |
| Net Cash Provided by Operating Activities | | | 16,059,296 | |
| | | | | |
| Cash Flows Provided by (Used for) Financing Activities: | | | | |
| Proceeds from Sale of Shares | | | 461,276 | |
| Redemption of Shares | | | (13,607,101 | ) |
| Dividends Paid to Shareholders, Net of Reinvestments | | | (3,385,963 | ) |
| Payments on Line of Credit | | | (9,500,000 | ) |
| Proceeds from Line of Credit | | | 5,000,000 | |
| Net Cash Used for Financing Activities | | | (21,031,788 | ) |
| | | | | |
| Net Decrease in Cash | | | (4,972,492 | ) |
| Cash at Beginning of Year | | | 7,463,671 | |
| Cash at End of Year | | $ | 2,491,179 | |
Supplemental disclosure of Cash Flow Information:
Non-Cash Financing Activities Included Reinvestment of Distributions During the Fiscal Year of $2,364,423.
Cash Paid for Interest of $414,483.
The accompanying notes are an integral part of these financial statements.
| Vertical Capital Income Fund |
| Financial Highlights |
| |
| The table below sets forth financial data for one share of beneficial interest outstanding throughout each year presented. |
| | | Year | | | Year | | | Year | | | Year | | | Year | |
| | | Ended | | | Ended | | | Ended | | | Ended | | | Ended | |
| | | September 30, 2019 | | | September 30, 2018 | | | September 30, 2017 | | | September 30, 2016 | | | September 30, 2015 | |
| | | | | | | | | | | | | | | | |
| Net Asset Value, Beginning of Year | | $ | 12.23 | | | $ | 12.34 | | | $ | 12.49 | | | $ | 11.53 | | | $ | 11.04 | |
| From Operations: | | | | | | | | | | | | | | | | | | | | |
| Net investment income (a) | | | 0.30 | | | | 0.43 | | | | 0.39 | | | | 0.36 | | | | 0.41 | |
| Net gain (loss) from investments (both realized and unrealized) | | | 0.72 | | | | 0.06 | | | | (0.04 | ) (b) | | | 1.33 | | | | 0.56 | |
| Total from operations | | | 1.02 | | | | 0.49 | | | | 0.35 | | | | 1.69 | | | | 0.97 | |
| | | | | | | | | | | | | | | | | | | | | |
| Distributions to shareholders from: | | | | | | | | | | | | | | | | | | | | |
| Net investment income | | | (0.34 | ) | | | (0.39 | ) | | | (0.40 | ) | | | (0.38 | ) | | | (0.44 | ) |
| Net realized gains | | | (0.20 | ) | | | (0.21 | ) | | | (0.10 | ) | | | (0.35 | ) | | | (0.04 | ) |
| Total distributions | | | (0.54 | ) | | | (0.60 | ) | | | (0.50 | ) | | | (0.73 | ) | | | (0.48 | ) |
| | | | | | | | | | | | | | | | | | | | | |
| Net Asset Value, End of Year | | $ | 12.71 | | | $ | 12.23 | | | $ | 12.34 | | | $ | 12.49 | | | $ | 11.53 | |
| Market Price, End of Year | | $ | 10.68 | | | | N/A | | | | N/A | | | | N/A | | | | N/A | |
| | | | | | | | | | | | | | | | | | | | | |
| Total Return-NAV (c) | | | 8.62 | % | | | 4.03 | % | | | 2.81 | % | | | 15.10 | % | | | 8.86 | % |
| Total Return-Market Price (c) | | | -8.73 | % | | | NA | | | | NA | | | | NA | | | | NA | |
| | | | | | | | | | | | | | | | | | | | | |
| Ratios/Supplemental Data | | | | | | | | | | | | | | | | | | | | |
| Net assets, end of period (in 000’s) | | $ | 131,945 | | | $ | 137,659 | | | $ | 160,630 | | | $ | 182,008 | | | $ | 160,382 | |
| Ratio of gross expenses to average net assets (d) | | | 3.87 | % (f) | | | 3.03 | % (e) | | | 2.74 | % (e) | | | 2.95 | % (e) | | | 2.67 | % (e) |
| Ratio of net expenses to average net assets (d) | | | 3.34 | % (f) | | | 2.09 | % (e) | | | 2.04 | % (e) | | | 2.26 | % (e) | | | 2.33 | % (e) |
| Ratio of net investment income to average net assets (d) | | | 2.43 | % (f) | | | 3.52 | % (e) | | | 3.24 | % (e) | | | 2.98 | % (e) | | | 3.54 | % (e) |
| Portfolio turnover rate | | | 7.12 | % | | | 5.11 | % | | | 17.69 | % | | | 13.72 | % | | | 2.58 | % |
| Loan Outstanding, End of Period (000s) | | $ | 2,355 | | | $ | 6,664 | | | $ | — | | | $ | — | | | $ | 13,522 | |
| Asset Coverage Ratio for Loan Outstanding (g) | | | 5702 | % | | | 2167 | % | | | 0 | % | | | 0 | % | | | 1286 | % |
| Asset Coverage, per $1,000 Principal Amount of Loan Outstanding (g) | | $ | 53,778 | | | $ | 20,680 | | | $ | — | | | $ | — | | | $ | 12,672 | |
| Weighted Average Loans Outstanding (000s) (h) | | $ | 7,500 | | | $ | 4,500 | | | $ | 14,368 | | | $ | 12,330 | | | $ | 12,372 | |
| Weighted Average Interest Rate on Loans Outstanding | | | 5.14 | % | | | 4.69 | % | | | 3.88 | % | | | 3.41 | % | | | 3.25 | % |
| | | | | | | | | | | | | | | | | | | | | |
| (a) | Per share amounts are calculated using the annual average shares method, which more appropriately presents the per share data for the period. |
| (b) | The amount of net gain (loss) on investments (both realized and unrealized) per share does not accord with the amounts reported in the Statement of Operations due to timing of purchases and redemptions of Fund shares. |
| (c) | Total returns are historical in nature and assume changes in share price, reinvestment of dividends and capital gains distributions, if any, and excludes the effect of sales charges. Had the Adviser not waived expenses, total returns would have been lower. |
| (d) | Ratio includes 0.46%, 0.24%, 0.14%, 0.20% and 0.27% for the years ended September 30, 2019, 2018, 2017, 2016, and 2015, respectively, that attributed to interest expenses and fees. |
| (e) | Ratio includes 0.01%, 0.05%, 0.21% and 0.21% for the years ended September 30, 2018, 2017, 2016 and the year ended 2015, respectively, that attributed to advisory transition expenses. |
| (f) | Ratio includes 0.77% for the year ended September 30, 2019 that attributed to reorganization expenses. |
| (g) | Represents value of net assets plus the loan outstanding at the end of the period divided by the loan outstanding at the end of the period. |
| (h) | Based on monthly weighted average. |
The accompanying notes are an integral part of these financial statements.
| Vertical Capital Income Fund |
| Notes to Financial Statements |
| September 30, 2019 |
| |
Vertical Capital Income Fund (the “Fund”), was organized as a Delaware statutory trust on April 8, 2011 and is registered under the Investment Company Act of 1940, as amended (the “1940 Act”), as a diversified, closed-end management investment company. The investment objective of the Fund is to seek income. During part of 2019, the Fund offered two classes of shares: Class A and Class C. Class A shares commenced operations on December 30, 2011. Class C shares commenced operations on January 24, 2018 and closed on April 2, 2019. All classes of shares have equal voting privileges except that each class has exclusive voting rights with respect to its service and/or distribution plans. The Fund’s income, expenses (other than class specific distribution fees) and realized and unrealized gains and losses are allocated proportionately each day based upon the relative net assets of each class. Prior to March 29, 2019, the Fund offered shares at net asset value plus a maximum sales charge of 5.75% for Class A. Oakline Advisors, LLC (the “Advisor”), served as the Fund’s investment adviser until September 11, 2019 and resumed September 30, 2019.
| 2. | SUMMARY OF SIGNIFICANT ACCOUNTING POLICIES |
The Fund is an investment company and accordingly follows the investment company accounting and reporting guidance of the Financial Accounting Standards Board (“FASB”) Accounting Standard Codification Topic 946 “Financial Services – Investment Companies” including FASB Accounting Standards Update 2013-08. The following is a summary of significant accounting policies and reporting policies used in preparing the financial statements. The accompanying financial statements have been prepared in conformity with accounting principles generally accepted in the United States of America (“GAAP”). The Fund amortizes premiums and discounts using the effective interest rate method. Offering expenses are amortized over 12 months following the time they are incurred.
The preparation of financial statements in conformity with GAAP requires management to make estimates and assumptions that affect the reported amounts of assets and liabilities and disclosure of contingent assets and liabilities at the date of the financial statements and the reported amounts of income and expenses for the period. Actual results could differ from those estimates.
Investment Security Valuation
Mortgage Notes –The Fund uses an independent third-party pricing service, approved by the Fund’s Board of Trustees (the “Board”), to value its Mortgage Notes on an as needed basis. The third-party pricing servicer uses a cash flow forecast and valuation model that focuses on forecasting the frequency, timing and severity of mortgage loss behavior. The model incorporates numerous observable loan-level factors such as unpaid principal balance, remaining term of the loan and coupon rate as well as macroeconomic data including yield curves, spreads to the Treasury curves and home price indexes. The model also includes a number of unobservable factors and assumptions (such as voluntary and involuntary prepayment speeds, delinquency rates, foreclosure timing, and others) to determine a fair value. While the model requires a minimum set of data to develop a reasonable fair value, the model is capable of accepting additional data elements. The model makes certain assumptions unless a specific data element is included, in which case it uses the additional data. Not all assumptions have equal weighting in the model. Using assumptions in this manner is a part of the Fund’s valuation policy and procedures and provides consistency in the application of valuation assumptions. The third-party pricing servicer also benchmarks its pricing model against observable pricing levels being quoted by a range of market participants active in the purchase and sale of residential mortgage loans. The combination of loan level criteria and daily market adjustments produces a monthly price for each Mortgage Note relative to current public market conditions.
Prior to purchase, each Mortgage Note goes through a due diligence process that includes considerations such as underwriting borrower credit, employment history, property valuation, and delinquency history with an overall emphasis on repayment of the Mortgage Notes. The purchase price of the Mortgage Notes reflects the overall risk relative to the findings of this due diligence process.
| Vertical Capital Income Fund |
| Notes to Financial Statements (Continued) |
| September 30, 2019 |
| |
The Fund invests primarily in Mortgage Notes secured by residential real estate. The market or liquidation value of each type of residential real estate collateral may be adversely affected by numerous factors, including rising interest rates; changes in the national, state and local economic climate and real estate conditions; perceptions of prospective buyers of the safety, convenience and attractiveness of the properties; maintenance and insurance costs; changes in real estate taxes and other expenses; adverse changes in governmental rules and fiscal policies; adverse changes in zoning laws; natural disasters and other factors beyond the control of the borrowers.
The Fund’s investments in Mortgage Notes are subject to liquidity risk because there is a limited secondary market for Mortgage Notes. Liquidity risk exists when particular investments of the Fund would be difficult to purchase or sell, possibly preventing the Fund from selling such illiquid securities at an advantageous time or price, or possibly requiring the Fund to dispose of other investments at unfavorable times or prices in order to satisfy its obligations. Securities for which current market quotations are not readily available, such as the Mortgage Notes the Fund invests in, or for which quotations are not deemed to be representative of market values are valued at fair value as determined in good faith by or under the direction of the Board in accordance with the Fund’s Portfolio Securities Valuation Procedures (the “Procedures”). The Procedures consider, among others, the following factors to determine a security’s fair value: the nature and pricing history (if any) of the security; whether any dealer quotations for the security are available; and possible valuation methodologies that could be used to determine the fair value of the security.
The valuation inputs and subsequent outputs are reviewed and maintained on a monthly basis. Any calibrations or adjustments to the model that may be necessary are done on an as-needed basis to facilitate fair pricing. Financial markets are monitored daily relative to the interest rate environment. If other available market data indicates that the pricing data from the third-party service is materially inaccurate, or pricing data is unavailable, the Fund undertakes a review of other available prices and takes additional steps to determine fair value. In all cases, the Fund validates its understanding of methodology and assumptions underlying the fair value used.
The Fund follows guidance in ASC 820,Fair Value Measurement, where fair value is defined as the price that would be received to sell an asset or paid to transfer a liability in an orderly transaction between the market participants at the measurement date. The Fund utilizes various methods to measure the fair value of its investments on a recurring basis. Notwithstanding, the actual sale price of a Mortgage Note will likely be different than its fair value determined under ASC 820. GAAP establishes a hierarchy that prioritizes inputs to valuation methods. ASC 820 classifies the inputs used to measure these fair values into the following hierarchy:
Level 1– Unadjusted quoted prices in active markets for identical and/or similar assets and liabilities that the Fund has the ability to access at the measurement date.
Level 2– Other significant observable inputs other than quoted prices included in Level 1 for the asset or liability, either directly or indirectly. These inputs may include quoted prices for similar investments or identical investments in an active market, interest rates, prepayment speeds, credit risk, yield curves, default rates and similar data.
Level 3 –Significant unobservable inputs for the asset or liability, to the extent relevant observable inputs are not available, representing the Fund’s own assumptions about the assumptions a market participant would use in valuing the asset or liability, and would be based on the best information available.
The availability of observable inputs can vary from security to security and is affected by a wide variety of factors, including, for example, the type of security, whether the security is new and not yet established in the marketplace, the liquidity of markets, and other characteristics particular to the security. To the extent that valuation is based on models or inputs that are less observable or unobservable in the market, the determination of fair value requires more judgment. Accordingly, the degree of judgment exercised in determining fair value is greatest for instruments categorized in Level 3.
| Vertical Capital Income Fund |
| Notes to Financial Statements (Continued) |
| September 30, 2019 |
| |
The inputs used to measure fair value may fall into different levels of the fair value hierarchy. In such cases, for disclosure purposes, the level in the fair value hierarchy within which the fair value measurement falls in its entirety, is determined based on the lowest level input that is significant to the fair value measurement in its entirety.
As of September 30, 2019, management estimated that the carrying value of cash and cash equivalents, accounts receivable, prepaid expenses and other assets, line of credit payable, payables for securities purchased, accrued advisory fees, related party payables, and accrued and other liabilities were at amounts that reasonably approximated their fair value based on their highly-liquid nature and short-term maturities. This is considered a Level 1 valuation technique.
The inputs or methodology used for valuing investments are not necessarily an indication of the risk associated with investing in those investments. The following tables summarize the inputs used as of September 30, 2019 for the Fund’s assets measured at fair value:
| Assets | | Level 1 | | | Level 2 | | | Level 3 | | | Total | |
| Mortgage Notes | | $ | — | | | $ | — | | | $ | 129,194,075 | | | $ | 129,194,075 | |
| Other Investments | | | — | | | | — | | | | 440,909 | | | | 440,909 | |
| Total | | $ | — | | | $ | — | | | $ | 129,634,984 | | | $ | 129,634,984 | |
There were no transfers between levels during the current period presented. It is the Fund’s policy to record transfers into or out of levels at the end of the reporting period.
The following is a reconciliation of assets in which Level 3 inputs were used in determining value:
| | | Mortgage Notes | | | Other Investments | | | Total | |
| Beginning Balance | | $ | 133,770,170 | | | $ | 161,100 | | | $ | 133,931,270 | |
| Net realized gain (loss) | | | 1,926,569 | | | | — | | | | 1,926,569 | |
| Change in unrealized appreciation | | | 5,629,734 | | | | — | | | | 5,629,734 | |
| Cost of purchases | | | 9,287,427 | | | | — | | | | 9,287,427 | |
| Proceeds from sales and principal paydowns | | | (21,444,316 | ) | | | (161,100 | ) | | | (21,605,416 | ) |
| Purchase discount amortization | | | 465,400 | | | | — | | | | 465,400 | |
| Net Transfers within level 3 | | | (440,909 | ) | | | 440,909 | | | | — | |
| Ending balance | | $ | 129,194,075 | | | $ | 440,909 | | | $ | 129,634,984 | |
The total change in unrealized appreciation included in the Statement of Operations attributable to Level 3 investments still held at September 30, 2019 is $7,044,196.
| Vertical Capital Income Fund |
| Notes to Financial Statements (Continued) |
| September 30, 2019 |
| |
The following table provides quantitative information about the Fund’s Level 3 values, as well as its inputs, as of September 30, 2019. The table is not all-inclusive, but provides information on the significant Level 3 inputs:
| | | | | | | | | | | | Weighted |
| | | | | | | | | | Range of | | Average of |
| | | | | | | | Unobservable | | Unobservable | | Unobservable |
| | | Value | | | Valuation Technique | | Inputs | | Inputs | | Inputs |
| Mortgage Notes | | $ | 129,194,075 | | | Comprehensive pricing model with emphasis on discounted cash flows | | Constant
prepayment rate | | 0-72.9% | | 14.9% |
| | | | | | | | | Deliquency | | 0-606 days | | 15 days |
| | | | | | | | | Loan-to-Value | | 4-510% | | 81.4% |
| | | | | | | | | Discount Rate | | 0.1-24.0% | | 4.0% |
| | | | | | | | | Sales prices | | $74.04 sq/ft | | $74.04 sq/ft |
| Other Investments | | | 440,909 | | | Market comparable | | | | | | |
| Closing Balance | | $ | 129,634,984 | | | | | | | | | |
A change to the unobservable input may result in a significant change to the value of the investment as follows:
Security Transactions and
Investment Income -
Investment Security | | Impact to Value if
Input Increases | | Impact to Value if
Input Decreases |
| Constant Prepayment Rate | | Increase | | Decrease |
| Delinquency | | Decrease | | Increase |
| Loan to Value | | Decrease | | Increase |
| Discount rate | | Decrease | | Increase |
| | | | | |
Cash and Cash Equivalents –Cash and cash equivalents include cash and overnight investments in interest-bearing demand deposits with a financial institution with maturities of three months or less. The Fund maintains deposits with a high quality financial institution in an amount that is in excess of federally insured limits.
Security Transactions and Investment Income –Investment security transactions are accounted for on a trade date basis. Cost is determined and gains and losses are based upon the specific identification method for both financial statement and federal income tax purposes. Interest income is recorded on the accrual basis. Purchase discounts and premiums on securities are accreted and amortized over the life of the respective securities using the effective interest method.
Interest Income on Non-Accrual Loans –The Fund discontinues the accrual of interest on loans when, in the opinion of management, there is an assessment that the borrower will likely be unable to meet all contractual payments as they become due.
Credit Facility –On July 20, 2018, the Fund entered into a revolving line of credit agreement with NexBank for investment purposes and to help maintain the Fund’s liquidity, subject to the limitations of the 1940 Act for borrowings. The maximum amount of borrowing allowed under the agreement was the lesser of $35 million or 75% of the eligible portion of the Fund’s loans. Borrowings under the Nexbank agreement bear interest at a rate equal to the 30-day LIBOR plus applicable margin of 2.75%, per annum, on the outstanding principal balance. The Nexbank agreement matures on July 17, 2020 and has one one-year extension available. The Nexbank agreement is secured by assets of the Fund.
| Vertical Capital Income Fund |
| Notes to Financial Statements (Continued) |
| September 30, 2019 |
| |
During the year ended September 30, 2019 the Fund incurred deferred financing fees of $0. Accumulated amortization of deferred financing fees was $227,321 as of September 30, 2019. The average amount of borrowing outstanding for the period was $7,500,000 and the total interest expense was $415,608. The outstanding balance under the Nexbank line of credit was $2,500,000 at September 30, 2019.
Federal Income Taxes– The Fund intends to continue to comply with the requirements of Subchapter M of the Internal Revenue Code applicable to regulated investment companies and will distribute all of its taxable income, if any, to shareholders. Accordingly, no provision for Federal income taxes is required in the financial statements.
The Fund recognizes the tax benefits of uncertain tax positions only where the position is “more likely than not” to be sustained assuming examination by tax authorities. Management has analyzed the Fund’s tax positions, and has concluded that no liability for unrecognized tax benefits should be recorded related to uncertain tax positions taken by the Fund in its 2016 - 2018 tax returns, which remain open for examination, or expected to be taken in the Fund’s 2019 tax returns. The Fund identified its major tax jurisdictions as U.S. Federal jurisdictions where the Fund makes significant investments; however, the Fund is not aware of any tax positions for which it is reasonably possible that the total amounts of unrecognized tax benefits will change materially in the next twelve months. The Fund accounts for interest and penalties for any uncertain tax positions as a component of income tax expense. No interest or penalty expense was recorded during the year ended September 30, 2019.
Distributions to Shareholders– Distributions from investment income, if any, are declared and paid monthly and are recorded on the ex-dividend date. The Fund will declare and pay net realized capital gains not previously distributed, if any, annually. The Board’s decision to declare distributions will be influenced by its obligation to ensure that the Fund maintains its federal tax status as a Registered Investment Company (“RIC”). In order to qualify as a RIC, the Fund must derive a minimum of 90% of its income from capital gains, interest or dividends earned on investments and must distribute a minimum of 90% of its net investment income in the form of interest, dividends or capital gains to its shareholders. Otherwise, the Fund may be subject to an excise tax from the IRS.
The character of income and gains to be distributed is determined in accordance with Federal income tax regulations, which may differ from GAAP. These “book/tax” differences are considered either temporary (i.e., deferred losses, capital loss carry forwards) or permanent in nature. To the extent these differences are permanent in nature, such amounts are reclassified within the composition of net assets based on their federal tax-basis treatment; temporary differences do not require classification.
Indemnification –The Trust indemnifies its officers and Trustees for certain liabilities that may arise from the performance of their duties to the Trust. Additionally, in the normal course of business, the Fund enters into contracts that contain a variety of representations and warranties and which provide general indemnities. The Fund’s maximum exposure under these arrangements is unknown, as this would involve future claims that may be made against the Fund that have not yet occurred. However, management of the Fund expects the risk of loss due to these warranties and indemnities to be remote.
| 3. | INVESTMENT IN RESTRICTED SECURITIES |
The Fund may invest in Restricted Securities (those which cannot be offered for public sale without first being registered under the Securities Act of 1933) that are consistent with the Fund’s investment objectives and investment strategies. Investments in Restricted Securities are valued at fair value as determined in good faith in accordance with procedures adopted by the Board of Trustees. The Fund would typically have no rights to compel the obligor or issuer of a Restricted Security to register such a Restricted Security under the 1933 Act. No such securities were owned by the Fund at September 30, 2019.
| Vertical Capital Income Fund |
| Notes to Financial Statements (Continued) |
| September 30, 2019 |
| |
| 4. | INVESTMENT ADVISORY AGREEMENT AND TRANSACTIONS WITH RELATED PARTIES |
The business activities of the Fund are overseen by the Board, which is responsible for the overall management of the Fund.
Advisory Fees – Pursuant to an Advisory Agreement with the Fund, the Advisor, under the oversight of the Board, directs certain of the daily operations of the Fund and supervises the performance of administrative and professional services provided by others. As compensation for its services and the related expenses borne by the Advisor, the Fund pays the adviser a management fee, computed and accrued daily and paid monthly, at an annual rate of 1.25% of the average daily net assets of the Fund. For the year ended September 30, 2019 the Advisor earned advisory fees of $1,607,261. Effective September 11, 2019 the Advisory Agreement expired. Beginning September 12, 2019, the Fund accrued expenses to pay essential personnel and services expenses of $103,142 per month. On September 30, 2019, the Advisory Agreement was reinstated and the preceding sentence no longer applied.
The Advisor had contractually agreed to waive all or part of its management fees and/or make payments to limit Fund expenses (exclusive of any front-end or contingent deferred loads, taxes, leverage interest, brokerage commissions, expenses incurred in connection with any merger or reorganization, expenses of investing in underlying funds, or extraordinary expenses such as litigation and advisor transition expenses) so that the total annual operating expenses of the Fund do not exceed 2.25% of the average daily net assets of Class A and 3.00% of Class C, effective January 31, 2019. Prior to January 31,2019, annual operating expenses did not exceed 1.85% of the average daily net assets of Class A and 2.60% of Class C. Waivers and expense reimbursements may be recouped by the Advisor from the Fund within three years of when the amounts were waived only if the fund expenses are lower than both the lesser of the current expense cap and the expense cap in place at the time of waiver. For the year ended September 30, 2019, the Advisor waived advisory fees of $692,741. Expenses subject to recapture by the Advisor amounted to $1,196,051 that will expire on September 30, 2020, and $1,409,845 that will expire on September 30, 2021, and $692,741 that will expire on September 30, 2022. Effective September 30, 2019, and through at least September 30, 2020, the Advisor has contractually agreed to waive all or part of its management fees and/or make payments to limit Fund expenses (exclusive of any front-end or contingent deferred loads, taxes, leverage interest, brokerage commissions, expenses incurred in connection with any merger or reorganization, expenses of investing in underlying funds, or extraordinary expenses such as litigation and advisor transition expenses) so that the total annual operating expenses of the Fund do not exceed 2.25% of the average daily net assets. Waivers and expense reimbursements may be recouped by the Advisor from the Fund within three years of when the amounts were waived only if the fund expenses are lower than both the lesser of the current expense cap and the expense cap in place at the time of waiver.
Distributor– The distributor of the Fund was Northern Lights Distributors, LLC (the “Distributor”) until May 30, 2019. The Board of Trustees of the Fund has adopted, on behalf of the Fund, a Shareholder Servicing Plan (“Plan”) to pay for certain shareholder services. Under the Plan, the Fund may pay up to 0.25% per year of its average daily net assets for such shareholder service activities. The Fund does not pay shareholder servicing fees to the Distributor. For the year ended September 30, 2019, the Fund incurred shareholder servicing fees of $107,474.
The Fund, with respect to its Class C shares, was authorized under a “Distribution Plan” to pay to the Distributor a Distribution Fee for certain activities relating to the distribution of shares to investors and maintenance of shareholder accounts. These activities included marketing and other activities to support the distribution of the Class C shares. The Plan operated in a manner consistent with Rule 12b-1 under the 1940 Act, which regulates the manner in which an open-end investment company may directly or indirectly bear the expenses of distributing its shares. Although the Fund is not an open-end investment company, it complied with the terms of Rule 12b-1 as a condition of an exemptive order under the 1940 Act which permited it to have asset based distribution fees. Under the Distribution Plan, the Fund paid the Distributor a Distribution Fee at an annual rate of 0.75% of average daily net assets attributable to Class C shares. Pursuant to the Distribution Plan, the Fund incurred $392 for Class C during the year ended September 30, 2019.
| Vertical Capital Income Fund |
| Notes to Financial Statements (Continued) |
| September 30, 2019 |
| |
In addition, certain affiliates of the Distributor provide services to the Fund as follows:
Gemini Fund Services, LLC (“GFS”) – GFS,an affiliate of the Distributor, provides administration and fund accounting services to the Fund. Pursuant to a separate servicing agreement with GFS, the Fund pays GFS customary fees for providing administration and fund accounting services to the Fund. Certain officers of the Fund are also officers of GFS, and are not paid any fees directly by the Fund for serving in such capacities. For the year ended September 30, 2019 GFS earned $356,848.
Northern Lights Compliance Services, LLC (“NLCS”) –NLCS, an affiliate of GFS and the Distributor, provides a Chief Compliance Officer to the Fund, as well as related compliance services, pursuant to a consulting agreement between NLCS and the Fund. Under the terms of such agreement, NLCS receives customary fees from the Fund. For the year ended September 30, 2019 NLCS earned $62,152.
Blu Giant, LLC (“Blu Giant”) –Blu Giant, an affiliate of GFS and the Distributor, provides EDGAR conversion and filing services as well as print management services for the Fund on an ad -hoc basis. For the provision of these services, Blu Giant receives customary fees from the Fund. For the year ended September 30, 2019 Blu Giant earned $44,801.
Effective February 1, 2019, NorthStar Financial Services Group, LLC, the parent company of GFS and its affiliated companies including NLCS and Blu Giant (collectively, the “Gemini Companies”), sold its interest in the Gemini Companies to a third party private equity firm that contemporaneously acquired Ultimus Fund Solutions, LLC (an independent mutual fund administration firm) and its affiliates (collectively, the “Ultimus Companies”). As a result of these separate transactions, the Gemini Companies and the Ultimus Companies are now indirectly owned through a common parent entity, The Ultimus Group, LLC.
Trustees– The Fund pays each Trustee who is not affiliated with the Fund or advisor a quarterly fee of $5,000 and the lead unaffiliated Trustee a quarterly fee of $10,000. Additionally, each unaffiliated Trustee receives $2,500 per meeting as well as reimbursement for any reasonable expenses incurred attending meetings. The “interested persons” who serve as Trustees of the Fund receive no compensation for their services as Trustees. None of the executive officers receive compensation from the Fund.
| 5. | INVESTMENT TRANSACTIONS |
The cost of purchases and proceeds from sales and paydowns of investment securities, other than U.S. Government securities and short-term investments, for the year ended September 30, 2019 amounted to $9,287,427 and $21,605,416 respectively.
Pursuant to Rule 23c-3 under the Investment Company Act of 1940, as amended, prior to March 29, 2019 the Fund offered shareholders on a quarterly basis the option of redeeming shares, at net asset value, of no less than 5% and no more than 25% of the shares outstanding. There is no guarantee that shareholders will be able to sell all of the shares they desire in a quarterly repurchase offer, although each shareholder will have the right to require the Fund to purchase up to and including 5% of such shareholder’s shares in each quarterly repurchase
| Vertical Capital Income Fund |
| Notes to Financial Statements (Continued) |
| September 30, 2019 |
During the year ended September 30, 2019, the Fund completed two quarterly repurchase offers. In those offers, the Fund offered to repurchase up to 5% (and an additional 2% at the Fund’s discretion) of the number of its outstanding shares as of the Repurchase Pricing Dates. The results of that repurchase offer were as follows:
| | | Repurchase Offer #1 | | | Repurchase Offer #2 | |
| Commencement Date | | | 09/20/18 | | | | 12/20/18 | |
| Repurchase Request Deadline | | | 10/22/18 | | | | 01/23/19 | |
| Repurchase Pricing Date | | | 10/22/18 | | | | 01/23/19 | |
| Net Asset Value as of Repurchase Pricing Date | | $ | 12.09 | | | $ | 12.23 | |
| Amount Repurchased * | | $ | 6,810,272 | | | $ | 6,643,791 | |
| Percentage of Outstanding Shares Repurchased | | | 5.00 | % | | | 5.00 | % |
| Percentage of Outstanding Shares Tendered | | | 43.15 | % | | | 40.29 | % |
| * | Repurchases were made on a pro-rata basis. |
| 7. | DISTRIBUTIONS TO SHAREHOLDERS AND TAX COMPONENTS OF CAPITAL |
The Statement of Assets and Liabilities represents cost for financial reporting purposes. Aggregate cost for federal tax purposes is $108,489,419 and differs from fair value by net unrealized appreciation (depreciation) of securities as follows:
| Unrealized appreciation | | $ | 22,169,159 | |
| Unrealized depreciation | | | (1,023,594 | ) |
| Net unrealized appreciation | | $ | 21,145,565 | |
The tax character of distributions paid during the fiscal years ended September 30, 2019 and September 30, 2018 was as follows:
| | | Fiscal Year Ended | | | Fiscal Year Ended | |
| | | September 30, 2019 | | | September 30, 2018 | |
| Ordinary Income | | $ | 3,688,381 | | | $ | 5,580,553 | |
| Long-Term Capital Gain | | | 2,062,005 | | | | 1,823,878 | |
| | | $ | 5,750,386 | | | $ | 7,404,431 | |
| | | | | | | | | |
As of September 30, 2019, the components of accumulated earnings/ (deficit) on a tax basis were as follows:
| Undistributed | | | Undistributed | | | Post October Loss | | | Capital Loss | | | Other | | | Unrealized | | | Total | |
| Ordinary | | | Long-Term | | | and | | | Carry | | | Book/Tax | | | Appreciation/ | | | Accumulated | |
| Income | | | Gains | | | Late Year Loss | | | Forwards | | | Differences | | | (Depreciation) | | | Earnings/(Deficits) | |
| $ | 328,440 | | | $ | 1,801,906 | | | $ | — | | | $ | — | | | $ | — | | | $ | 21,145,565 | | | $ | 23,275,911 | |
| | | | | | | | | | | | | | | | | | | | | | | | | | | |
The difference between book basis and tax basis unrealized appreciation (depreciation), undistributed net investment income (loss) and accumulated net realized gain (loss) from security transactions are primarily attributable to the adjustments for defaulted bond adjustments.
| Vertical Capital Income Fund |
| Notes to Financial Statements (Continued) |
| September 30, 2019 |
Permanent book and tax differences, primarily attributable to the book/tax treatment of reclassification of fund distributions and tax adjustments for paydowns resulted in reclassification for the year ended September 30, 2019 as follows:
| Paid | | | | |
| In | | | Accumulated | |
| Capital | | | Earnings | |
| $ | (323,663) | | | $ | 323,663 | |
| | | | | | | |
| 8. | NEW ACCOUNTING PRONOUNCEMENTS |
In August 2018, FASB issued ASU No. 2018-13, which changed certain fair value measurement disclosure requirements. The ASU, in addition to other modifications and additions, removed the requirement to disclose the amount and reasons for transfers between Level 1 and Level 2 of the fair value hierarchy, and the policy for the timing of transfers between levels. For investment companies, the amendments are effective for financial statements issued for fiscal years beginning after December 15, 2019, and interim periods within those fiscal years. These amendments have been adopted with these financial statements.
In August 2018, the Securities and Exchange Commission adopted amendments to certain disclosure requirements under Regulation S-X to conform to US GAAP, including: (i) an amendment to require presentation of the total, rather than the components, of distributable earnings on the Statement of Assets and Liabilities; and (ii) an amendment to require presentation of the total, rather than the components, of distributions to shareholders, except for tax return of capital distributions, on the Statement of Changes in Net Assets. The amendments also removed the requirement for parenthetical disclosure of undistributed net investment income on the Statement of Changes in Net Assets.These amendments have been adopted with these financial statements.
The Fund is required to recognize in the financial statements the effects of all subsequent events that provide additional evidence about conditions that existed at the date of the Statement of Assets and Liabilities. For non-recognized subsequent events that must be disclosed to keep the financial statements from being misleading, the Fund is required to disclose the nature of the event as well as an estimate of its financial effect, or a statement that such an estimate cannot be made. Management has determined that other than those disclosed in these financial statements, there were no other subsequent events to report through the issuance of these financial statements.

GRANT THORNTON LLP
1717 Main Street, Suite 1800
Dallas, TX 75201
D +1 214 561 2300
F +1 214 561 2370
REPORT OF INDEPENDENT REGISTERED PUBLIC ACCOUNTING FIRM
Board of Trustees and Shareholders
Vertical Capital Income Fund
Opinion on the financial statements
We have audited the accompanying statement of assets and liabilities of Vertical Capital Income Fund (the “Fund”), including the portfolio of investments, as of September 30, 2019, the related statements of operations and cash flows for the year then ended, the statements of changes in net assets for each of the two years in the period then ended, and the related notes (collectively referred to as the “financial statements”) and the financial highlights for each of the three years in the period then ended. In our opinion, the financial statements and financial highlights present fairly, in all material respects, the financial position of the Fund as of September 30, 2019, the results of its operations and its cash flows for the year then ended, the changes in net assets for each of the two years in the period then ended, and the financial highlights for each of the three years in the period then ended, in conformity with accounting principles generally accepted in the United States of America. The accompanying financial highlights for each of the years in the two-period ended September 30, 2016 of Vertical Capital Income Fund were audited by other auditors whose report thereon dated March 21, 2017 expressed an unqualified opinion on those statements.
Basis for opinion
These financial statements and financial highlights are the responsibility of the Fund’s management. Our responsibility is to express an opinion on the Fund’s financial statements and financial highlights based on our audits. We are a public accounting firm registered with the Public Company Accounting Oversight Board (United States) (“PCAOB”) and are required to be independent with respect to the Fund in accordance with the U.S. federal securities laws and the applicable rules and regulations of the Securities and Exchange Commission and the PCAOB.
We conducted our audits in accordance with the standards of the PCAOB. Those standards require that we plan and perform the audit to obtain reasonable assurance about whether the financial statements and financial highlights are free of material misstatement, whether due to error or fraud. The Fund is not required to have, nor were we engaged to perform, an audit of its internal control over financial reporting. As part of our audits we are required to obtain an understanding of internal control over financial reporting but not for the purpose of expressing an opinion on the
| GT.COM | Grant Thornton LLP is the U.S. member firm of Grant Thornton International Ltd (GTIL). GTIL and each of its member firms are separate legal entities and are not a worldwide partnership. |
effectiveness of the Fund’s internal control over financial reporting. Accordingly, we express no such opinion.
Our audits included performing procedures to assess the risks of material misstatement of the financial statements and financial highlights, whether due to error or fraud, and performing procedures that respond to those risks. Such procedures included examining, on a test basis, evidence supporting the amounts and disclosures in the financial statements and financial highlights. Our procedures included confirmation of securities owned as of September 30, 2019 by correspondence with the custodian and brokers. Our audits also included evaluating the accounting principles used and significant estimates made by management, as well as evaluating the overall presentation of the financial statements and financial highlights. We believe that our audits provide a reasonable basis for our opinion.
We have served as the Fund’s auditor since 2017.
Dallas, Texas
November 27, 2019
| Supplemental Information (Unaudited) |
| |
Approval of Investment Advisory Agreement
Evaluation of New Advisory Agreement by the Board of Trustees
The New Advisory Agreement was approved by a majority of the Board, including the Independent Trustees, at an in person meeting held on May 20, 2019. The Board reviewed the materials provided by the Adviser in advance of the meeting. The Trustees were assisted by independent legal counsel throughout the New Advisory Agreement review process. The Board relied upon the advice of independent legal counsel and their own business judgment in determining the material factors to be considered in evaluating the New Advisory Agreement and the weight to be given to each such factor. The conclusions reached by the Trustees were based on a comprehensive evaluation of all of the information provided and were not the result of any one factor. Moreover, each Trustee may have afforded different weight to the various factors in reaching his conclusions with respect to the New Advisory Agreement.
Nature, Extent and Quality of Services. The Trustees discussed the Adviser’s history and portfolio management experience. They noted that the Adviser and its affiliates served a variety of clients, and managed approximately $479 million in assets. The Trustees reviewed the background and experience of the Adviser’s investment team, noting that key personnel responsible for managing the portfolio remained unchanged from the previous approval. The Trustees further noted the Adviser had provided a high level of expertise and diligence in performing investment advisory services for the Fund and appreciated the Adviser’s long-term view in managing the Fund. They acknowledged the Adviser’s careful stewardship of the portfolio and careful, ongoing attention to assistance with portfolio valuation as well as increased resources devoted to compliance. After further discussion, the Trustees concluded that they are satisfied with the Adviser’s service. They also observed that the Adviser’s financial condition is satisfactory based on a representation form the Adviser that it has access to additional capital. They noted the Adviser’s representation that the day-to-day management of the Adviser is not changing and believed the Adviser would continue to provide quality advisory services to the Fund.
Performance. The Trustees reviewed the performance of the Fund compared to its benchmark indices for the one-year and three-year periods, which correspond to the majority of the period the Adviser has been advising the Fund. Next, the Adviser noted that interval fund comparisons are useful from a management fee and expense ratio, but they are not entirely useful from a performance standpoint because of the Fund’s novel strategy. The Fund’s strategy is novel when compared to other interval funds because the Fund’s portfolio is composed solely of individual mortgage notes. While some other interval funds may include real estate related securities in their portfolios, none follow a strategy as focused as the Fund’s. The Adviser focuses on two applicable indices: the Bloomberg Barclays Capital MBS Index and the Bloomberg Barclays US Aggregate Bond Index. The Trustees noted that the Fund outperformed the indices over one, three, five and since inception periods ended April 30, 2019. They further considered that the assets acquired by the Fund since the appointment of the Adviser have also outperformed the assets that were in the Fund’s portfolio when the Adviser took over in 2015. The Trustees agreed that the Adviser continues to deliver positive, acceptable returns consistent with the Fund’s objective.
Fees and Expenses. The Trustees noted that the Adviser charges an advisory fee of 1.25% and that the Fund had a net expense ratio of 2.50% as of the February 2019 prospectus and a more recent
| Supplemental Information (Unaudited)(Continued) |
| |
estimated net expense ratio of 2.57%, based on the draft March 31, 2019, semi-annual report. The Trustees reviewed average fees for two peer groups: (i) closed-end exchange traded real estate and mortgage related funds, and (ii) closed-end interval funds. The Trustees acknowledged that neither peer group was precisely comparable to the Fund due to various factors including the significantly larger size of some peer funds, and differing strategies and objectives, but agreed the information was relevant. They noted that the Fund’s advisory fee was lower than the interval fund peer group average. They also noted that, while above the exchange traded fund peer group average of 1.21%, the Fund’s advisory fee was significantly below the 1.76% upper end of the range of advisory fees of the exchange traded peer group. The Trustees also observed that Fund’s net expense ratio was above the 1.99% average of the interval fund peer group and above the 2.32% average of the exchange traded fund peer group. They further observed that while Fund expenses were above average, they were below the 2.82% upper end of the interval fund peer group and below the 3.41% upper end of the exchange traded fund peer group. The Trustees concluded that the advisory fee and Fund expenses were not unreasonable. The Trustees noted that the Adviser had agreed to an Expense Limitation Agreement, whereby the Adviser would waive its fees and pay or absorb the ordinary operating expenses of the Fund (including offering expenses, but excluding interest, brokerage commissions, extraordinary expenses and acquired fund fees and expenses) to the extent that they exceed 2.25%.
Profitability. The Trustees reviewed a profitability analysis provided by the Adviser, and discussed the Adviser’s estimated lack of profitability in connection with its projected relationship with the Fund. The Trustees considered that the Adviser did not earn a profit through its relationship with the Fund and as such, excessive profit was not an issue at this time.
Economies of Scale. The Trustees considered whether the Fund had yet reached a size where material economies of scale had been achieved. The Adviser had explained to the Trustees that economies of scale were difficult to achieve given the labor intensive mortgage note selection process. The Trustees agreed and further noted that discontinued interval status may provide some management efficiencies in the future because the Adviser no longer has to manage the portfolio to provide quarterly liquidity to facilitate share repurchase offers. The Trustees and the Adviser agreed to reevaluate the issue at the next renewal.
Conclusion. Having requested and received such information from the Adviser as the Trustees believed to be reasonably necessary to evaluate the terms of the Advisory Agreement with the Adviser, and as assisted by the advice of legal counsel, the Trustees concluded that the fee structure was reasonable and that approval of the Advisory Agreement with the Adviser was in the best interests of the shareholders of the Fund.
| Supplemental Information (Unaudited)(Continued) |
| |
Dividend Reinvestment Plan
Unless the registered owner of shares elects to receive cash by contacting the Plan Agent, all dividends declared for the shares of the Fund will be automatically paid in the form of, or reinvested by American Stock Transfer & Trust Company (“AST”) (the “Plan Agent”), agent for shareholders in administering the Fund’s Dividend Reinvestment Plan (the “Plan”), in additional shares of the Fund. If you are a registered owner of shares and elect not to participate in the Plan, you will receive all dividends or other distributions (together, a “dividend”) in cash paid by check mailed directly to you (or, if the shares are held in street or other nominee name, then to such nominee) by AST, as dividend disbursing agent. You may elect not to participate in the Plan and to receive all dividends in cash by sending written instructions or by contacting AST, as dividend disbursing agent, at the address set forth below. Participation in the Plan is completely voluntary and may be terminated or resumed at any time without penalty by contacting the Plan Agent before the dividend record date; otherwise such termination or resumption will be effective with respect to any subsequently declared dividend. Some brokers or other financial intermediaries through which shareholders may hold their shares, may automatically elect to receive cash on the shareholders’ behalf and may reinvest that cash in additional shares of the Fund for the respective shareholders.
The Plan Agent will open an account for each shareholder under the Plan in the same name in which such shareholder’s shares are registered. Whenever the Fund declares a dividend payable in cash, non-participants in the Plan will receive cash and participants in the Plan will receive the equivalent in shares. The shares will be acquired by the Plan Agent for the participants’ accounts, depending upon the circumstances described below, either (i) through receipt of additional unissued but authorized shares from the Fund (“newly issued shares”) or (ii) by purchase of outstanding shares on the open market (“open-market purchases”) on the New York Stock Exchange or elsewhere.
Whenever the Fund declares a dividend, non-participants in the Plan will receive cash and participants in the Plan will receive the equivalent in shares. The shares will be acquired by the Plan Agent for the participants’ accounts, depending upon the circumstances described below, either (i) through receipt of additional unissued but authorized shares from the Fund (newly issued shares) or (ii) by purchase of outstanding shares on the open market (open-market purchases”) on the NYSE or elsewhere. If, on the payment date for any dividend, the closing market price plus estimated brokerage commissions per share is equal to or greater than the NAV per share, the Plan Agent will invest the dividend amount in newly issued shares on behalf of the participants. The number of newly issued shares to be credited to each participant’s account will be determined by dividing the dollar amount of the dividend by the Fund’s NAV per share on the payment date. If, on the payment date for any dividend, the NAV per share is greater than the closing market value plus estimated brokerage commissions (i.e., the Fund’s shares are trading at a discount), the Plan Agent will invest the dividend amount in shares acquired on behalf of the participants in open-market purchases.
In the event of a market discount on the payment date for any dividend, the Plan Agent will have until the last business day before the next date on which the shares trade on an “ex -dividend” basis or 30 days after the payment date for such dividend, whichever is sooner (the “last purchase date”), to invest the dividend amount in shares acquired in open-market purchases. It is contemplated that
| Supplemental Information (Unaudited)(Continued) |
| |
the Fund will pay monthly income dividends. If, before the Plan Agent has completed its open-market purchases, the market price per share exceeds the NAV per share, the average per share purchase price paid by the Plan Agent may exceed the NAV of the shares, resulting in the acquisition of fewer shares than if the dividend had been paid in newly issued shares on the dividend payment date. Because of the foregoing difficulty with respect to open-market purchases, the Plan provides that if the Plan Agent is unable to invest the full dividend amount in open-market purchases during the purchase period or if the market discount shifts to a market premium during the purchase period, the Plan Agent may cease making open-market purchases and may invest the uninvested portion of the dividend amount in newly issued shares at the NAV per share.
The Plan Agent maintains all shareholders’ accounts in the Plan and furnishes written confirmation of all transactions in the accounts, including information needed by shareholders for tax records. shares in the account of each Plan participant will be held by the Plan Agent on behalf of the Plan participant, and each shareholder proxy will include those shares purchased or received pursuant to the Plan. The Plan Agent will forward all proxy solicitation materials to participants and vote proxies for shares held under the Plan in accordance with the instructions of the participants.
In the case of shareholders such as banks, brokers or nominees which hold shares for others who are the beneficial owners, the Plan Agent will administer the Plan on the basis of the number of shares certified from time to time by the record shareholder’s name and held for the account of beneficial owners who participate in the Plan.
There will be no brokerage charges with respect to shares issued directly by the Fund. However, each participant will pay a pro rata share of brokerage commissions incurred in connection with open-market purchases. The automatic reinvestment of dividends will not relieve participants of any tax that may be payable (or required to be withheld) on such dividends. Accordingly, any taxable dividend received by a participant that is reinvested in additional shares will be subject to U.S. federal (and possibly state and local) income tax even though such participant will not receive a corresponding amount of cash with which to pay such taxes. Participants who request a sale of shares through the Plan Agent are subject to a $15.00 sales fee and pay a brokerage commission of $0.12 per share sold.
The Fund reserves the right to amend or terminate the Plan. There is no direct service charge to participants in the Plan; however, the Fund reserves the right to amend the Plan to include a service charge payable by the participants.
All correspondence concerning the Plan should be directed to the Plan Agent at American Stock Transfer & Trust Company, 6201 15th Avenue, Brooklyn, New York 11219; telephone 1-866-277-8243.
| Supplemental Information (Unaudited)(Continued) |
| |
PROXY VOTE
At a Special Meeting of Shareholders of the Fund, held at the offices of Gemini Fund Services, LLC, 80 Arkay Drive, Suite 110, Hauppauge, NY 11788, on Friday, March 29, 2019, shareholders of record as of the close of business on January 11, 2019, voted to approve the following proposal:
To facilitate the Fund listing its shares on the New York Stock Exchange, approval of eliminating the Fund’s fundamental policy of making quarterly repurchase offers for no less than 5% of the Fund’s shares outstanding at net asset value.
FOR: 5,189,642.764
AGAINST: 275,353.549
ABSTAIN: 225,833.520
At a Special Meeting of Shareholders of the Fund, held at the offices of Gemini Fund Services, LLC, 80 Arkay Drive, Suite 110, Hauppauge, NY 11788, on Monday, September 30, 2019, shareholders of record as of the close of business on June 20, 2019 voted to approve the following proposal:
Proposal: To approve a new investment Advisory Agreement between the Fund and Behringer Advisors, LLC.
FOR: 4,455,412
AGAINST: 729,484
ABSTAIN: 435,463
At a Special Meeting of Shareholders of the Fund, held at the offices of Gemini Fund Services, LLC, 80 Arkay Drive, Suite 110, Hauppauge, NY 11788, on Monday, September 30, 2019, shareholders of record as of the close of business on June 20, 2019 voted to approve the following proposal:
Proposal: To re-elect Robert Boulware as a Trustee of the Fund.
FOR: 4,625,747
WITHHELD: 992,481
| Vertical Capital Income Fund |
| Supplemental Information |
| September 30, 2019 (Unaudited) |
Independent Trustees
Name, Address
and Age (Year of
Birth) | Position/Term
of Office* | Principal Occupation
During the Past Five Years | Number of
Portfolios in
Fund
Complex**
Overseen by
Trustee | Other Directorships held by
Trustee |
Robert J. Boulware
1956 | Trustee since August 2011, Class I Board member until 2022 annual shareholder meeting | Managing Director, Pilgrim Funds, LLC (private equity fund), Sept. 2006 to present. | 1 | Trustee, Brighthouse Funds Trust I (45 portfolios), March 2008 to present; Trustee, Brighthouse Funds Trust II (29 portfolios), April 2012 to present; Director, Gainsco Inc. (auto insurance) May 2005 to present; SharesPost 100 Fund, March 2013 to present. |
Mark J. Schlafly
1961 | Trustee since August 2011, Class II Board member until 2020 annual shareholder meeting | Adjunct Professor/Career Advisor, Olin School of Business, Washington University, August 2011 to present; Executive Vice President , Waddell & Reed, Inc. (financial services firm), June 2016 to Aug 2017; Managing Director, Russell Investments, June 2013 to Dec. 2014. | 1 | None |
T. Neil Bathon
1961 | Trustee since August 2011, Class III Board member until 2021 annual shareholder meeting | Managing Partner, FUSE Research Network, LLC, Aug. 2008 to present; Managing Director, PMR Associates LLC, July 2006 to Present. | 1 | BNY Mellon Charitable Gift Fund, June 2013 to present. |
| Vertical Capital Income Fund |
| Supplemental Information (Continued) |
| September 30, 2019 (Unaudited) |
Interested Trustee, Officers
Name, Address
and Age (Year of
Birth) | Position/Term
of Office* | Principal Occupation
During the Past Five Years | Number of
Portfolios in
Fund
Complex
Overseen by
Trustee | Other Directorships held by
Trustee |
Robert J. Chapman ***
1947 | Trustee, since August 2015, Class III Board member until 2021 annual shareholder meeting | Executive Vice President, Oakline Advisors, LLC (investment adviser), a position held since July 2015. Executive Vice President, Stratera Holdings, LLC (financial services holding company) a position held since 2007. | 1 | None |
Michael D. Cohen
1974 | President, since July 2015 | Chief Executive Officer Stratera Holdings, LLC, (financial services holding company), a position held since Oct. 2016; President of Stratera Holdings, LLC, a position held since April 2015; Executive Vice President, Stratera Holdings, LLC, Jan. 2013 to Apr. 2015. Chief Executive Officer Stratera Services, LLC, a position held since Oct. 2016; President of Stratera Services, LLC, Apr. 2015 to present; Executive Vice President, of Stratera Services, LLC Jan. 2011 to Apr. 2015. Executive Vice President of Pathway Capital Opportunity Fund Management, LLC, Aug. 2014 to present. Executive Vice President, Pathway Capital Opportunity Fund, Inc., Feb. 2013 to Feb. 2019. Director, Behringer Harvard Opportunity REIT I, Inc., July 2014 to Aug. 2018. Director, Behringer Harvard Opportunity REIT II, Inc., Feb. 2013 to Sept. 2017. Member of Board of Managers, Priority Senior Secured Income Management, LLC, Oct. 2012 to present. Executive Vice President of Priority Income Fund, Inc., July 2012 to present. | n/a | n/a |
Lisa Ross ****
1963 | Treasurer since August 2018 | Chief Financial Officer, Stratera Holdings, LLC (financial services holding company), May 2017 to present; Senior Vice President Accounting, Stratera Holdings, LLC, October 2013 to May 2017; Chief Financial Officer, Behringer Harvard Opportunity REIT I, Inc.(a public real estate investment trust), October 2014 to June 2017; Chief Accounting Officer, Behringer Harvard Opportunity REIT I, Inc., January 2012 to October 2014. | n/a | n/a |
Stanton P.
Eigenbrodt
1965 | Secretary since July 2015 | Executive Vice President of Oakline Advisors, a position held since July 2015. Chief Legal Officer of Stratera Holdings, LLC (financial services holding company) a position held since Sept. 2015; Executive Vice President and General Counsel (2011-2015); Senior Vice President and General Counsel (2006-2011). Similar positions held at subsidiaries of Stratera Holdings, LLC. | n/a | n/a |
Emile R. Molineaux
1962 | Chief Compliance Officer and Anti- Money Laundering Officer since August 2011 | Northern Lights Compliance Services, LLC (Secretary since 2003 and Senior Compliance Officer since 2011); General Counsel, CCO and Senior Vice President, Gemini Fund Services, LLC; Secretary and CCO, Northern Lights Compliance Services, LLC (2003-2011). | n/a | n/a |
| * | The term of office for each Trustee and officer listed above will serve subject to annual reappointment. |
| ** | The term “Fund Complex” refers to the Vertical Capital Income Fund. |
| *** | Mr. Chapman is an interested Trustee because he is also an officer of the Fund’s investment adviser. |
| **** | As of October 25, 2019 Mr. Chapman replaced Ms. Ross as Treasurer. |
The Fund’s Statement of Additional Information includes additional information about the Trustees and is available free of charge, upon request, by calling toll-free at 1-866-277-VCIF.
Effective upon the approval for listing of Fund shares on the NYSE on May 23, 2019, the Board of Trustees adopted a classified structure. The minimum number of Trustees shall be three and the Trustees shall be elected in three classes. The Trustees shall be divided into three classes, designated Class I, Class II and Class III. Each class shall consist, as nearly as may be possible, of one-third of the total number of Trustees constituting the entire Board. Within the limits above specified, the number of the Trustees in each class shall be determined by resolution of the Board. The term of office of the first class shall expire on the date of the first annual meeting of Shareholders or special meeting in lieu thereof following the effective date of listing on the NYSE. The term of the second class shall expire on the date of the second annual meeting of Shareholders or special meeting in lieu thereof following the effective date of listing on the NYSE. The term of the third class shall expire on the date of the third annual meeting of Shareholders or special meeting in lieu thereof following the effective date of listing on the NYSE. Upon expiration of the term of office of each class as set forth above, the number of Trustees in such class, as determined by the Board, shall be elected for a three-year term expiring on the date of the third annual meeting of Shareholders or special meeting in lieu thereof following such expiration to succeed the Trustees whose terms of office expire. The Trustees shall be elected at an annual meeting of the Shareholders or special meeting in lieu thereof called for that purpose. The Classification of the Board could have the effect of limiting the ability of other entities or persons to acquire control of the Fund or to change the composition of the Board of Trustees, and could have the effect of depriving the Fund’s shareholders of an opportunity to sell their shares at a premium over prevailing market prices, if any, by discouraging a third party from seeking to obtain control of the Fund. These provisions may have the effect of discouraging attempts to acquire control of the Fund, which attempts could have the effect of increasing the expenses of the Fund and interfering with the normal operation of the Fund.
PRIVACY NOTICE
Rev. May 2012
| FACTS | WHAT DOES VERTICAL CAPITAL INCOME FUND DO WITH YOUR PERSONAL INFORMATION? |
| | |
| Why? | Financial companies choose how they share your personal information. Federal law gives consumers the right to limit some but not all sharing. Federal law also requires us to tell you how we collect, share, and protect your personal information. Please read this notice carefully to understand what we do. |
| | |
| What? | The types of personal information we collect and share depend on the product or service you have with us. This information can include: |
| | |
| | ■ | Social Security number | ■ | Purchase History |
| | | | | |
| | ■ | Assets | ■ | Account Balances |
| | | | | |
| | ■ | Retirement Assets | ■ | Account Transactions |
| | | | | |
| | ■ | Transaction History | ■ | Wire Transfer Instructions |
| | | | | |
| | ■ | Checking Account Information | | |
| | |
| | When you areno longer our customer, we continue to share your information as described in this notice. |
| | |
| How? | All financial companies need to share customers’ personal information to run their everyday business. In the section below, we list the reasons financial companies can share their customers’ personal information; the reasons Vertical Capital Income Fund chooses to share; and whether you can limit this sharing. |
| Reasons we can share your personal information | Does Vertical
Capital Income
Fund share? | Can you limit this sharing? |
For our everyday business purposes – such as to process your transactions, maintain your account(s), respond to court orders and legal investigations, or report to credit bureaus | Yes | No |
For our marketing purposes – to offer our products and services to you | No | We don’t share |
| For joint marketing with other financial companies | No | We don’t share |
For our affiliates’ everyday business purposes – information about your transactions and experiences | No | We don’t share |
For our affiliates’ everyday business purposes – information about your creditworthiness | No | We don’t share |
| For nonaffiliates to market to you | No | We don’t share |
| Questions? | Call 1-866-277-VCIF |
Rev. May 2012
| Who we are |
Who is providing this notice? | Vertical Capital Income Fund |
| What we do |
| How does Vertical Capital Income Fund protect my personal information? | To protect your personal information from unauthorized access and use, we use security measures that comply with federal law. These measures include computer safeguards and secured files and buildings. Our service providers are held accountable for adhering to strict policies and procedures to prevent any misuse of your nonpublic personal information. |
| How does Vertical Capital Income Fund collect my personal information? | We collect your personal information, for example, when you ■ Open an account ■ Provide account information ■ Give us your contact information ■ Make deposits or withdrawals from your account ■ Make a wire transfer ■ Tell us where to send the money ■ Tells us who receives the money ■ Show your government-issued ID ■ Show your driver’s license We also collect your personal information from other companies. |
| Why can’t I limit all sharing? | Federal law gives you the right to limit only ■ Sharing for affiliates’ everyday business purposes – information about your creditworthiness ■ Affiliates from using your information to market to you ■ Sharing for nonaffiliates to market to you State laws and individual companies may give you additional rights to limit sharing. |
| Definitions |
| Affiliates | Companies related by common ownership or control. They can be financial and nonfinancial companies. ■ Vertical Capital Income Funddoes not share with our affiliates. |
| Nonaffiliates | Companies not related by common ownership or control. They can be financial and nonfinancial companies ■ Vertical Capital Income Funddoes not share with nonaffiliates so they can market to you. |
| Joint marketing | A formal agreement between nonaffiliated financial companies that together market financial products or services to you. ■ Vertical Capital Income Funddoesn’t jointly market. |
| | | | | | |
How to Obtain Proxy Voting Information
Information regarding how the Fund votes proxies relating to portfolio securities for the 12 month period ended June 30th as well as a description of the policies and procedures that the Fund used to determine how to vote proxies is available without charge, upon request, by calling 1-866-277-VCIF by referring to the Securities and Exchange Commission’s (“SEC”) website at http://www.sec.gov.
How to Obtain 1st and 3rd Fiscal Quarter Portfolio Holdings
The Fund files its complete schedule of portfolio holdings with the SEC for the first and third quarters of each fiscal year on Form N-Q. Form N-Q is available on the SEC’s website athttp://www.sec.gov and may be reviewed and copied at the SEC’s Public Reference Room in Washington, DC (1-800-SEC-0330). The information on Form N-Q is available without charge, upon request, by calling 1-866-277-VCIF.
Investment Adviser
Oakline Advisors, LLC
14675 Dallas Parkway, Suite 600
Dallas, Texas 75254
Administrator
Gemini Fund Services, LLC
80 Arkay Drive
Hauppauge, NY 11788
Item 2. Code of Ethics.
(a) As of the end of the period covered by this report, the registrant has adopted a code of ethics that applies to the registrant's principal executive officer, principal financial officer, principal accounting officer or controller, or persons performing similar functions, regardless of whether these individuals are employed by the registrant or a third party.
(b) For purposes of this item, “code of ethics” means written standards that are reasonably designed to deter wrongdoing and to promote:
| (1) | Honest and ethical conduct, including the ethical handling of actual or apparent conflicts of interest between personal and professional relationships; |
| (2) | Full, fair, accurate, timely, and understandable disclosure in reports and documents that a registrant files with, or submits to, the Commission and in other public communications made by the registrant; |
(3) Compliance with applicable governmental laws, rules, and regulations;
| (4) | The prompt internal reporting of violations of the code to an appropriate person or persons identified in the code; and |
(5) Accountability for adherence to the code.
(c) Amendments: During the period covered by the report, there have not been any amendments to the provisions of the code of ethics.
(d) Waivers: During the period covered by the report, the registrant has not granted any express or implicit waivers from the provisions of the code of ethics.
Item 3. Audit Committee Financial Expert.
The registrant’s board of trustees has determined that the registrant does not have an audit committee financial expert serving on its audit committee.
Item 4. Principal Accountant Fees and Services
RegistrantAdvisor
FYE 09/30/19 $167,000 N/A
FYE 09/30/18 $159,000 N/A
RegistrantAdvisor
FYE 09/30/19 $0 N/A
FYE 09/30/18 $0 N/A
RegistrantAdvisor
FYE 09/30/19 $0 N/A
FYE 09/30/18 $0 N/A
Preparation of Federal & State income tax returns, assistance with calculation of required income, capital gain and excise distributions and preparation of Federal excise tax returns.
RegistrantAdvisor
FYE 09/30/19 $0 N/A
FYE 09/30/18 $0 N/A
| (e) | (1)Audit Committee’s Pre-Approval Policies |
The registrant’s Audit Committee is required to pre-approve all audit services and, when appropriate, any non-audit services (including audit-related, tax and all other services) to the registrant. The registrant’s Audit Committee also is required to pre-approve, when appropriate, any non-audit services (including audit-related, tax and all other services) to its adviser, or any entity controlling, controlled by or under common control with the adviser that provides ongoing services to the registrant, to the extent that the services may be determined to have an impact on the operations or financial reporting of the registrant. Services are reviewed on an engagement by engagement basis by the Audit Committee.
| (2) | Percentages of Services Approved by the Audit Committee |
RegistrantAdvisor
Audit-Related Fees: N/A N/A
Tax Fees: N/A N/A
All Other Fees: N/A N/A
| (f) | During the audit of registrant's financial statements for the most recent fiscal year, less than 50 percent of the hours expended on the principal accountant's engagement were attributed to work performed by persons other than the principal accountant's full-time, permanent employees. |
| (g) | The aggregate non-audit fees billed by the registrant's accountant for services rendered to the registrant, and rendered to the registrant's investment adviser (not including any sub-adviser whose role is primarily portfolio management and is subcontracted with or overseen by another investment adviser), and any entity controlling, controlled by, or under common control with the adviser that provides ongoing services to the registrant: |
RegistrantAdvisor
FYE 09/30/2019 $0 N/A
FYE 09/30/2018 $0 N/A
(h) The registrant's audit committee has considered whether the provision of non-audit services to the registrant's investment adviser (not including any sub-adviser whose role is primarily portfolio management and is subcontracted with or overseen by another investment adviser), and any entity controlling, controlled by, or under common control with the investment adviser that provides ongoing services to the registrant, that were not pre-approved pursuant to paragraph (c)(7)(ii) of Rule 2-01 of Regulation S-X, is compatible with maintaining the principal accountant's independence.
Item 5. Audit Committee of Listed Companies.Not applicable.
Item 6. Schedule of Investments.See Item 1.
Item 7. Disclosure of Proxy Voting Policies and Procedures for Closed-End Funds.
Pursuant to the adoption by the Securities and Exchange Commission (the “Commission”) of Rule 206(4)-6 (17 CFR 275.206(4)-6) and amendments to Rule 204-2 (17 CFR 275.204-2) under the Investment Adviser Act of 1940 (the “Act”), it is a fraudulent, deceptive, or manipulative act, practice or course of business, within the meaning of Section 206(4) of the Act, for an investment adviser to exercise voting authority with respect to client securities, unless (i) the adviser has adopted and implemented written policies and procedures that are reasonably designed to ensure that the adviser votes proxies in the best interests of its clients, (ii) the adviser describes its proxy voting procedures to its clients and provides copies on request, and (iii) the adviser discloses to clients how they may obtain information on how the adviser voted their proxies.
In order to fulfill its responsibilities under the Act, Oakline Advisors, LLC (hereinafter, “we” or “our”) has adopted the following policies and procedures for proxy voting with regard to direct investments in companies held in investment portfolios of our clients.
KEY OBJECTIVES
The key objectives of these policies and procedures recognize that a company’s management is entrusted with the day-to-day operations and longer term strategic planning of the company, subject to the oversight of the company’s board of directors. While “ordinary business matters” are primarily the responsibility of management and should be approved solely by the corporation’s board of directors, these objectives also recognize that the company’s shareholders must have final say over how management and directors are performing, and how shareholders’ rights and ownership interests are handled, especially when matters could have substantial economic implications to the shareholders.
Therefore, we will pay particular attention to the following matters in exercising our proxy voting responsibilities as a fiduciary for our clients:
Accountability. Each company should have effective means in place to hold those entrusted with running a company’s business accountable for their actions. Management of a company should be accountable to its board of directors and the board should be accountable to shareholders.
Alignment of Management and Shareholder Interests. Each company should endeavor to align the interests of management and the board of directors with the interests of the company’s shareholders. For example, we generally believe that compensation should be designed to reward management for doing a good job of creating value for the shareholders of the company.
Transparency. Promotion of timely disclosure of important information about a company’s business operations and financial performance enables investors to evaluate the performance of a company and to make informed decisions about the purchase and sale of a company’s securities.
DECISION METHODS
We generally believe that portfolio managers that invest in and track particular companies have a unique perspective to make decisions with regard to proxy votes. Therefore, we rely on that perspective to make the final decisions on how to cast proxy votes.
No set of proxy voting guidelines can anticipate all situations that may arise. In special cases, we may seek insight and expertise from outside sources as to how a particular proxy proposal will impact the financial prospects of a company, and vote accordingly.
In some instances, a proxy vote may present a conflict between the interests of a client, on the one hand, and our interests or the interests of a person affiliated with us, on the other. In such a case, we will abstain from making a voting decision and will forward all of the necessary proxy voting materials to the client to enable the client to cast the votes.
SUMMARY OF PROXY VOTING GUIDELINES
Election of the Board of Directors
We believe that good corporate governance generally starts with a board composed primarily of independent directors, unfettered by significant ties to management, all of whose members are elected annually. We also believe that some measure of turnover in board composition typically promotes more independent board action and fresh perspectives on governance. Of greater importance is the skill set of the proposed board member. We will also look at the backgrounds of the directors to gauge their business acumen and any special talent or experience that may add value to their participation on the board.
The election of a company’s board of directors is one of the most fundamental rights held by shareholders. Because a classified board structure prevents shareholders from electing a full slate of directors annually, we will pay special attention to efforts to declassify boards or other measures that permit shareholders to remove a majority of directors at any time.
Approval of Independent Auditors
We believe that the relationship between a company and its auditors should be limited primarily to the audit engagement, although it may include certain closely related activities that do not raise an appearance of impaired independence.
We will evaluate on a case-by-case basis instances in which the audit firm has a substantial non-audit relationship with a company to determine whether we believe independence has been, or could be, compromised.
Equity-based compensation plans
We believe that appropriately designed equity-based compensation plans, approved by shareholders, can be an effective way to align the interests of shareholders and the interests of directors, management, and employees by providing incentives to increase shareholder value. Conversely, we are opposed to plans that substantially dilute ownership interests in the company, provide participants with excessive awards, or have inherently objectionable structural features.
We will generally support measures intended to increase stock ownership by executives and the use of employee stock purchase plans to increase company stock ownership by employees. These may include:
1. Requiring senior executives to hold stock in a company.
2. Requiring stock acquired through option exercise to be held for a certain period of time.
These are guidelines, and we consider other factors, such as the nature of the industry and size of the company, when assessing a plan’s impact on ownership interests.
Corporate Structure
We view the exercise of shareholders’ rights, including the rights to act by written consent, to call special meetings and to remove directors, to be fundamental to good corporate governance.
Because classes of common stock with unequal voting rights limit the rights of certain shareholders, we generally believe that shareholders should have voting power equal to their equity interest in the company and should be able to approve or reject changes to a company’s by-laws by a simple majority vote.
We will generally support the ability of shareholders to cumulate their votes for the election of directors.
Shareholder Rights Plans
There are arguments both in favor of and against shareholder rights plans, also known as poison pills. For example, such measures may tend to entrench or provide undue compensation to current management, which we generally consider to have a negative impact on shareholder value. Therefore, our preference is for a plan that places shareholder value in a priority position above interests of management.
SUMMARY OF PROXY VOTING PROCEDURES
As a fiduciary to its investors, we recognize the need to actively manage and vote proxies and other shareholder actions and consents that may arise in the course of its investment advisory activities on behalf of its clients. However, due to the nature of the investments of the Fund and indirect exposure to underlying equity investments, we believe that it would be rare that we would be in a position to cast a vote or called upon to vote a proxy.
In the event that we do receive a proxy notice, shareholder consent, or is otherwise entitled to vote on any issue related to the investments of its advisory client accounts, we will process and vote all shareholder proxies and other actions in a timely manner insofar as we can determine based on the facts available at the time of its action, in the best interests of the affected advisory client(s). Although we expect that proxies will generally be voted in a manner consistent with the guidelines set forth in this policy, there may be individual cases where, based on facts available, voting according to policy would not be in the best interests of the fund and its shareholders. In such cases, we may vote counter to the stated policy.
Proxy Voting Procedure
1) Notices received are reviewed by the Compliance Department;
2) Forwarded to the Investment Department for review and voting decision;
3) Vote or consent entered according to our best judgment under the facts and circumstances presented. Such decision shall be made and documented;
4) Final review and sign-off by Compliance Department and filing with a copy in the Proxy Voting Log.
We may at any time, outsource Proxy Voting responsibilities to Institutional Shareholder Services (“ISS”) or similar service provider that we may approve, provided that such service provider votes each proxy based on decisions made by us.
CLIENT INFORMATION
A copy of these Proxy Voting Policies and Procedures is available to our clients, without charge, upon request, by calling 1-866-277-VCIF. We will send a copy of these Proxy Voting Policies and Procedures within three business days of receipt of a request, by first-class mail or other means designed to ensure equally prompt delivery.
In addition, we will provide each client, without charge, upon request, information regarding the proxy votes cast by us with regard to the client’s securities.
Item 8. Portfolio Managers of Closed-End Management Investment Companies.
As of September 30, 2019, Mr. Chapman, Chairman of the Board and Executive Vice President of the Adviser, and Mr. David Aisner, Executive Vice President of the Adviser, are the Fund's co-portfolio managers. Each share primary responsibility for management of the Fund's investment portfolio and have served the Fund in this capacity since July 6, 2015. Mr. Chapman and Mr. Aisner are not compensated through their share of the profits, if any, of the Adviser. Because the portfolio managers may manage assets for other pooled investment vehicles and/or other accounts (including institutional clients, pension plans and certain high net worth individuals) (collectively "Client Accounts"), or may be affiliated with such Client Accounts, there may be an incentive to favor one Client Account over another, resulting in conflicts of interest. For example, the Adviser may, directly or indirectly, receive fees from Client Accounts that are higher than the fee it receives from the Fund, or it may, directly or indirectly, receive a performance-based fee on a Client Account. In those instances, a portfolio manager may have an incentive to not favor the Fund over the Client Accounts. The Adviser has adopted trade allocation and other policies and procedures that it believes are reasonably designed to address these and other conflicts of interest. As September 30, 2019, Mr. Chapman and Mr. Aisner owned no shares of the Fund.
As of September 30, 2019, Mr. Chapman was responsible for the management of the following types of accounts in addition to the Fund:
| Other Accounts By Type | Total Number of Accounts by Account Type | Total Assets By Account Type | Number of Accounts by Type Subject to a Performance Fee | Total Assets By Account Type Subject to a Performance Fee |
| Registered Investment Companies | 0 | $0 | 0 | $0 |
| Other Pooled Investment Vehicles | 0 | $0 | 0 | $0 |
| Other Accounts | 0 | $0 | 0 | $0 |
As of September 30, 2019, Mr. Aisner was responsible for the management of the following types of accounts in addition to the Fund:
| Other Accounts By Type | Total Number of Accounts by Account Type | Total Assets By Account Type | Number of Accounts by Type Subject to a Performance Fee | Total Assets By Account Type Subject to a Performance Fee |
| Registered Investment Companies | 0 | $0 | 0 | $0 |
| Other Pooled Investment Vehicles | 0 | $0 | 0 | $0 |
| Other Accounts | 0 | $0 | 0 | $0 |
Item 9. Purchases of Equity Securities by Closed-End Management Investment Company and Affiliated Purchasers.Not applicable.
Item 10. Submission of Matters to a Vote of Security Holder.None.
Item 11. Controls and Procedures.
(a) Based on an evaluation of the Registrant’s disclosure controls and procedures as of a date within 90 days of filing date of this Form N-CSR, the principal executive officer and principal financial officer of the Registrant have concluded that the disclosure controls and procedures of the Registrant are reasonably designed to ensure that the information required in filings on Form N-CSR is recorded, processed, summarized, and reported by the filing date, including that information required to be disclosed is accumulated and communicated to the Registrant’s management, including the Registrant’s principal executive officer and principal financial officer, as appropriate to allow timely decisions regarding required disclosure.
(b) There were no significant changes in the registrant’s internal control over financial reporting that occurred during the second fiscal quarter of the period covered by this report (in the registrant’s second fiscal half-year in the case of an annual report) that have materially affected, or are reasonably likely to materially affect, the registrant’s internal control over financial reporting.
Item 12. Disclosure of Securities Lending Activities for Closed-End Management Investment Companies.
(a) If the registrant is a closed-end management investment company, provide the following dollar amounts of income and fees/compensation related to the securities lending activities of the registrant during its most recent fiscal year:
(1) Gross income from securities lending activities;
(2) All fees and/or compensation for each of the following securities lending activities and related services: any share of revenue generated by the securities lending program paid to the securities lending agent(s) (“revenue split”); fees paid for cash collateral management services (including fees deducted from a pooled cash collateral reinvestment vehicle) that are not included in the revenue split; administrative fees that are not included in the revenue split; fees for indemnification that are not included in the revenue split; rebates paid to borrowers; and any other fees relating to the securities lending program that are not included in the revenue split, including a description of those other fees;
(3) The aggregate fees/compensation disclosed pursuant to paragraph (2); and
11
(4) Net income from securities lending activities (i.e., the dollar amount in paragraph (1) minus the dollar amount in paragraph (3)).
Instruction to paragraph (a).
If a fee for a service is included in the revenue split, state that the fee is “included in the revenue split.”
(b) If the registrant is a closed-end management investment company, describe the services provided to the registrant by the securities lending agent in the registrant’s most recent fiscal year.
Item 13. Exhibits.
(a)(1) Code of Ethics filed herewith.
(a)(2) Certification(s) required by Section 302 of the Sarbanes-Oxley Act of 2002 (and Item 11(a)(2) of Form N-CSR) are filed herewith.
(a)(3) Not applicable.
(b) Certification(s) required by Section 906 of the Sarbanes-Oxley Act of 2002 (and Item 11(b) of Form N-CSR) are filed herewith.
SIGNATURES
Pursuant to the requirements of the Securities Exchange Act of 1934 and the Investment Company Act of 1940, the registrant has duly caused this report to be signed on its behalf by the undersigned, thereunto duly authorized.
(Registrant) Vertical Capital Income Fund
By (Signature and Title)
* /s/ Michael D. Cohen
Michael D. Cohen, Principal Executive Officer/President
Date 11/29/19
Pursuant to the requirements of the Securities Exchange Act of 1934 and the Investment Company Act of 1940, this report has been signed below by the following persons on behalf of the registrant and in the capacities and on the dates indicated.
By (Signature and Title)
* /s/ Michael D. Cohen
Michael D. Cohen, Principal Executive Officer/President
Date 11/29/19
By (Signature and Title)
* /s/ Robert Chapman
Robert Chapman, Principal Financial Officer/Treasurer
Date 11/29/19
* Print the name and title of each signing officer under his or her signature.