united states
securities and exchange commission
washington, d.c. 20549
form n-csr
certified shareholder report of registered management
investment companies
Investment Company Act file number 811-22554
Vertical Capital Income Fund
(Exact name of registrant as specified in charter)
225 Pictoria Drive, Suite 450, Cincinnati, OH 45246
(Address of principal executive offices) (Zip code)
The Corporation Trust Company
Corporation Trust Center
1209 Orange Street
Wilmington, Delaware 19801
(Name and address of agent for service)
Registrant's telephone number, including area code: 631-470-2616
Date of fiscal year end: 9/30
Date of reporting period: 9/30/20
Item 1. Reports to Stockholders.
| | | | | |
| | | | | |
| | | | | |
| | | | | |
| | | | | |
| | | | | |
| | | | | |
| | | | | |
| | | | | |
| | | | | |
| | | | | |
| | | | | |
| | | | | |
| | | Vertical Capital Income Fund | | |
| | | | | |
| | | | | |
| | | | | |
| | | VCIF | | |
| | | Cusip: 92535C104 | | |
| | | | | |
| | | | | |
| | | Annual Report | | |
| | | September 30, 2021 | | |
| | | | | |
| | | | | |
| | | | | |
| | | | | |
| | | | | |
| | | | | |
| | | | | |
| | | | | |
| | | | | |
| | | | | |
| | | | | |
| | | | | |
| | | | | |
| | | | | |
| | | Investor Information: 1-866-277-VCIF | | |
| | | | | |
| | | | | |
| | | | | |
| | | |
| | | |
| | | |
| | | |
| | | |
| | | |
| | | |
| | | |
| | | |
| | | |
| | | |
| | | |
| | | | | |
| | | |
| | | | | |
| | This report and the financial statements contained herein are submitted for the general information of shareholders. Nothing contained herein is to be considered an offer of sale or solicitation of an offer to buy shares of the Vertical Capital Income Fund. | |
| | | |
| | | |
| | | | | |
Managed Distribution Plan Disclosure
In December 2020, the Board of Trustees (the “Board”), acting pursuant to a Securities and Exchange Commission exemptive order, approved a Managed Distribution Plan (the “Plan”) for Vertical Capital Income Fund (the “Fund”). Pursuant to the Plan, the Fund pays a minimum monthly distribution to shareholders at a stated annual rate as a percentage of the three-month average net asset value (“NAV”) of the Fund’s shares prior to the month of distribution. The distribution is calculated as 8% of the previous three-month average NAV, divided by 12. Payment of monthly distributions under the Fund’s Plan commenced in January 2021.
The Plan is subject to periodic review by the Board, and the Board may amend the terms of the Plan including amending the annual rate of payment or may terminate the Plan at any time without prior notice to the Fund’s shareholders. The Fund’s distribution rate may be affected by numerous factors, including changes in realized and projected market returns, Fund performance, and other factors. There can be no assurance that an unanticipated change in market conditions or other unforeseen factors will not result in a change in the Fund’s distribution rate at a future time. The Fund does not believe there are any reasonably foreseeable circumstances that would cause the termination of the Plan. The amendment or termination of the Plan could have an adverse effect on the market price of a Fund’s shares.
You should not draw any conclusions about the Fund’s investment performance from the amount of these distributions or from the terms of the Fund’s Managed Distribution Plan.
November 19, 2021
Dear Shareholder,
We are pleased to report to you the results of another six-month period for the Vertical Capital Income Fund (the “Fund”). Consistent with the Managed Distribution Plan (the “Plan”) and our investment objective to seek income, the Fund made monthly distributions aggregating approximately $1.11 per share for the year ended September 30, 2021. Included in that amount was a special distribution of approximately $0.22 per share paid in December 2020 as a result of net capital gains realized on loan sales and loan payoffs during the Fund’s last fiscal year ended September 30, 2020. In alignment with the Plan’s policy, the Fund will pay net capital gains realized on loan sales and loan payoffs included in the monthly distributions rather than only as a special December distribution going forward.
The Fund’s net asset value (“NAV)” per share was $12.05 at the September 30, 2020 and $11.69 per share at September 30, 2021. In comparison, the Fund’s traded share price was $9.93 at the beginning of the fiscal year and $10.49 at September 30, 2021, reflecting discounts to NAV of 18% and 10%. The management team is encouraged and would like to continue to see the narrowing of discount after the announcement in December of the Plan.
For the year ended September 30, 2021 the Fund produced a total return, based on its traded share price, of 17.59% compared to one of its key benchmarks, the Bloomberg Barclays U.S. Mortgage Backed Securities Index, which reported a total return of -0.43%. (Please see the definition of the index that accompanies the performance table that immediately follows this letter.) The SEC Yield per share as of September 30, 2021 was 2.92%. In comparison the Fund produced a total return based on its NAV per share for the same period of 6.52%. Since inception, the Fund has produced an annualized total return of 6.84% based on its NAV.
Update on Economic Outlook
The Mortgage Bankers Association forecasts purchase mortgage originations to grow 9% to a new record of $1.73 trillion in 2022. This comes after an initial anticipated 14% decline in 2021. MBA also expects refinance originations will slow further next year, decreasing by 62% to $860 billion from $2.26 trillion in 2021.
Forecasters expect mortgage originations to total $ 2.59 trillion in 2022. In 2023, mortgage originations are expected to decrease to $ 2.53 trillion though purchase originations are forecasted to reach new successive records in 2022 and 2023. Meanwhile, higher mortgage rates and fewer eligible homeowners will lead to further declines in refinance volume.
MBA’s baseline forecast is for mortgage rates to rise, with the 30-year, fixed-rate mortgage expected to end 2021 at 3.1% before increasing to 4.0% by the end of 2022.
We are seeing forecasters assume continued strong economic growth amidst the eventual easing of supply chain constraints that have restricted some economic activity this year. The economy and specifically the labor market rebounded in 2021, though the overall growth did not meet expectations. Challenges including stubborn supply chain issues, fueling inflation, decreased consumer spending, led to record number job openings at almost 11 million unfilled job openings in the economy.
Amongst the recent headlines, the Feds steps toward tapering asset purchases and removing monetary policy accommodation should come as no surprise. The biggest news from the FOMC’s most recent meeting was the change in projections. A majority of members now see the first interest rate hike in 2022 and possibly three rate hikes in 2023, a faster pace than had been previously projected.
Fund Strategy
There is almost $16 trillion of U.S. residential mortgage debt outstanding, of which approximately $ 11 trillion is secured by one-to-four family residences. The balance is represented by mortgage debt on multi-family, non-farm/non-residential and farm properties. The Fund invests as a secondary market participant in the one-to-four family residential whole loan market. This market historically boasts a deep roster of institutional participants, along with a diverse universe of sellers and reasons for sale. As such, we are comfortable that we will continue to see an adequate supply of investment opportunities. The Fund generates monthly cash distributions from interest income earned on the Fund’s loan portfolio, net of the costs to operate. Costs include fees paid to third parties for loan servicing and custodial, valuation, audit and legal services, as well as fees to the advisor to manage the Fund. As noted above, the Fund made aggregated distributions for the fiscal year of approximately $1.11 per share.
The Fund also generates capital gains when it sells loans at a price that is excess of its adjusted cost basis or when loans originally purchased at a discount to their unpaid principal balance (“UPB”) pay off in full before maturity of the loan. Asset sales and loan payoffs can occur anytime throughout the year; however, the Fund has historically made a single distribution in December of each year in order to fully account for all net long-term and short-term capital gains and losses during its taxable period. Most of these distributions have been subject to lower long-term capital gain tax rates; thereby, potentially increasing the after-tax yield to our shareholders. As noted above, the capital gain distribution during the fiscal year was $0.22 per share and going forward the Fund will pay net realized capital gains in the monthly distributions rather than only as a special December distribution.
The Fund meets its investment objective primarily by investing in mortgage notes secured by first liens on residential real estate. The Fund only invests in “whole loans” and does not invest in tranches of RMBS. Investing as a first mortgage lender in whole loans allows the Fund to deal directly with any borrower who is delinquent, in default or needs to restructure their loan for any reason. The Fund can decide on a case by case basis how best to work with the borrower to secure repayment of all amounts due the Fund, which is not always the case in RMBS. This direct interaction has been a significant benefit over the years when the Fund has had to manage assets with borrowers affected by crises, such as COVID-19,hurricanes, floods or fires.
The Fund pursues investment opportunities in many types of residential mortgage whole loans. Some known as “Scratch and Dent” are “conforming” loans with typical original terms of 25 or 30 years that would have otherwise qualified for purchase by one of the Government Sponsored Enterprises (“GSEs”), like Fannie Mae or Freddie Mac, but were rejected for technical defects in the application or documentation process. Others are non-qualified loans (“Non QM”), which do not meet the criteria for purchase or origination by a GSE. In addition, there are “Fix and Flip” loans, which typically have 12-24 month terms and “Rental and Bridge” loans which typically have 24-60 month terms. Loans can be performing, re-performing (loans that were non-performing at one point and have now become performing), long-term, short-term, fixed rate or adjustable.
As always, we are appreciative of your continued support and we look forward to working on your behalf.
Regards,
Katherine L. Hawkins
Portfolio Manager
| Vertical Capital Income Fund |
| PORTFOLIO REVIEW |
| September 30, 2021 |
| |
PERFORMANCE OF A $10,000 INVESTMENT
(Based upon Net Asset Value)
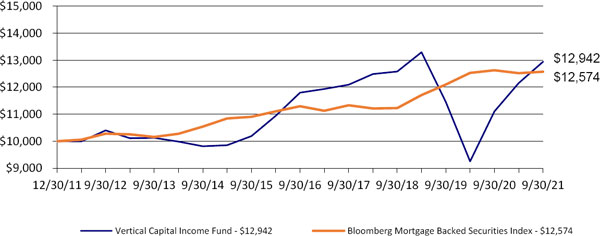
The Fund’s performance figures for the period ended September 30, 2021, compared to its
benchmark:
| | One Year | Three Years | Five Years | Since Inception* |
| Vertical Capital Income Fund-NAV | 6.52% | 4.60% | 4.11% | 6.84% |
| Vertical Capital Income Fund-Market Price ** | 17.59% | 0.95% | 1.87% | 2.68% |
| | | | | |
| Bloomberg Mortgage Backed Securities Index | (0.43)% | 3.85% | 2.17% | 2.38% |
| * | The Fund commenced operations on December 30, 2011. The performance of the Fund is based on average annual returns. |
| ** | The calculation is made using the NAV until the initial Market Price on May 30, 2019. |
The Bloomberg Mortgage Backed Securities Index is an unmanaged index composed of securities backed by U.S. government agency guaranteed mortgage pools of Ginnie Mae, Freddie Mac and Fannie Mae. Investors cannot invest directly in an index or benchmark. The mortgage notes held by the Fund are not guaranteed by any U.S. government agency.
Past performance is not predictive of future results. The investment return and principal value of an investment will fluctuate. An investor’s shares, when redeemed, may be worth more or less than the original cost. Total return is calculated assuming reinvestment of all dividends and distributions. Total returns would have been lower had the Adviser not waived its fees and reimbursed a portion of the Fund’s expenses. For performance information current to the most recent month-end, please call 1-866-277-VCIF.
PORTFOLIO COMPOSITION***
| Mortgage Notes | | | 99.9 | % |
| Other Investments | | | 0.1 | % |
| | | | 100.0 | % |
| | | | | |
*** Based on Investments at Value as of September 30, 2021.
VERTICAL CAPITAL INCOME FUND
SCHEDULE OF INVESTMENTS
September 30, 2021
| Principal | | | | | | | Coupon Rate | | | | | | |
| Amount ($) | | | | | Loan Type | | (%) | | Maturity | | | Fair Value | |
| | | | | LOANS — 93.9% | | | | | | | | | | | | |
| | | | | MORTGAGE LOANS (PRIVATE) — 93.9% | | | | | | | | | | | | |
| | 46,518 | | | Loan ID 200012 | | ARM | | 9.8000 | | | 07/01/37 | | | $ | 47,449 | |
| | 32,025 | | | Loan ID 200016 | | ARM | | 10.3750 | | | 01/01/31 | | | | 32,666 | |
| | 42,802 | | | Loan ID 200018 | | Fixed | | 7.0000 | | | 01/01/33 | | | | 43,658 | |
| | 96,419 | | | Loan ID 200023 | | Fixed | | 5.8750 | | | 12/01/50 | | | | 89,660 | |
| | 200,824 | | | Loan ID 200026 | | Fixed | | 4.7500 | | | 01/01/50 | | | | 204,840 | |
| | 188,600 | | | Loan ID 200029 | | Fixed | | 6.3100 | | | 07/01/37 | | | | 192,372 | |
| | 523,826 | | | Loan ID 200035 | | Fixed | | 4.6250 | | | 11/01/50 | | | | 527,261 | |
| | 103,801 | | | Loan ID 200041 | | Fixed | | 4.8750 | | | 08/01/39 | | | | 105,320 | |
| | 36,598 | | | Loan ID 200042 | | Fixed | | 7.0000 | | | 12/01/37 | | | | 37,330 | |
| | 43,815 | | | Loan ID 200043 | | Fixed | | 6.1250 | | | 07/01/39 | | | | 44,691 | |
| | 46,639 | | | Loan ID 200048 | | Fixed | | 5.5000 | | | 08/01/39 | | | | 47,572 | |
| | 48,824 | | | Loan ID 200054 | | Fixed | | 8.2500 | | | 03/01/39 | | | | 49,800 | |
| | 73,291 | | | Loan ID 200055 | | Fixed | | 10.0000 | | | 01/05/36 | | | | 74,757 | |
| | 28,103 | | | Loan ID 200060 | | Fixed | | 5.7500 | | | 08/01/39 | | | | 28,665 | |
| | 157,871 | | | Loan ID 200076 | | Fixed | | 4.2500 | | | 12/01/41 | | | | 96,032 | |
| | 12,934 | | | Loan ID 200078 | | Fixed | | 7.0000 | | | 08/01/36 | | | | 13,192 | |
| | 131,184 | | | Loan ID 200079 | | Fixed | | 5.0000 | | | 02/01/59 | | | | 122,899 | |
| | 61,999 | | | Loan ID 200082 | | Fixed | | 8.2500 | | | 04/01/40 | | | | 61,421 | |
| | 165,469 | | | Loan ID 200084 | | Fixed | | 7.0000 | | | 03/01/39 | | | | 158,676 | |
| | 213,064 | | | Loan ID 200087 | | Fixed | | 6.0000 | | | 03/01/51 | | | | 210,358 | |
| | 110,204 | | | Loan ID 200088 | | Fixed | | 7.0000 | | | 06/01/39 | | | | 95,475 | |
| | 248,053 | | | Loan ID 200089 | | Fixed | | 3.8750 | | | 03/01/52 | | | | 217,313 | |
| | 268,848 | | | Loan ID 200090 | | Fixed | | 4.5000 | | | 11/01/36 | | | | 185,470 | |
| | 67,546 | | | Loan ID 200102 | | Fixed | | 8.2500 | | | 03/01/40 | | | | 68,897 | |
| | 102,803 | | | Loan ID 200110 | | Fixed | | 8.2500 | | | 08/01/39 | | | | 104,859 | |
| | 66,323 | | | Loan ID 200128 | | Fixed | | 4.7100 | | | 07/01/37 | | | | 62,139 | |
| | 432,350 | | | Loan ID 200129 | | Fixed | | 4.6250 | | | 03/01/52 | | | | 395,742 | |
| | 109,968 | | | Loan ID 200135 | | Fixed | | 4.3750 | | | 12/01/42 | | | | 108,700 | |
| | 71,168 | | | Loan ID 200141 | | Fixed | | 4.2500 | | | 02/01/42 | | | | 69,658 | |
| | 371,510 | | | Loan ID 200145 | | Fixed | | 4.6250 | | | 08/01/51 | | | | 349,103 | |
| | 88,635 | | | Loan ID 200152 | | ARM | | 3.0000 | | | 09/01/37 | | | | 84,203 | |
| | 136,846 | | | Loan ID 200158 | | Fixed | | 3.6250 | | | 12/01/42 | | | | 129,809 | |
| | 175,168 | | | Loan ID 200165 | | Fixed | | 4.3750 | | | 12/01/41 | | | | 173,371 | |
| | 19,029 | | | Loan ID 200169 | | Fixed | | 6.9230 | | | 09/01/34 | | | | 19,410 | |
VERTICAL CAPITAL INCOME FUND
SCHEDULE OF INVESTMENTS (Continued)
September 30, 2021
| Principal | | | | | | | Coupon Rate | | | | | | |
| Amount ($) | | | | | Loan Type | | (%) | | Maturity | | | Fair Value | |
| | | | | LOANS — 93.9% (Continued) | | | | | | | | | | | | |
| | | | | MORTGAGE LOANS (PRIVATE) — 93.9% (Continued) |
| | 80,054 | | | Loan ID 200174 | | Fixed | | 7.3400 | | | 04/01/37 | | | $ | 81,655 | |
| | 45,270 | | | Loan ID 200175 | | Fixed | | 9.6000 | | | 05/01/37 | | | | 46,175 | |
| | 4,807 | | | Loan ID 200177 | | Fixed | | 8.0000 | | | 01/11/22 | | | | 4,904 | |
| | 104,065 | | | Loan ID 200181 | | Fixed | | 7.5000 | | | 06/01/41 | | | | 67,086 | |
| | 65,934 | | | Loan ID 200184 | | Fixed | | 4.3750 | | | 12/01/42 | | | | 65,132 | |
| | 25,480 | | | Loan ID 200185 | | Fixed | | 5.3750 | | | 06/01/42 | | | | 25,990 | |
| | 48,605 | | | Loan ID 200186 | | Fixed | | 5.1250 | | | 08/01/42 | | | | 49,577 | |
| | 146,468 | | | Loan ID 200194 | | Fixed | | 4.7500 | | | 09/01/41 | | | | 147,730 | |
| | 229,189 | | | Loan ID 200195 | | Fixed | | 3.8750 | | | 03/01/42 | | | | 221,330 | |
| | 36,254 | | | Loan ID 200198 | | Fixed | | 5.2500 | | | 10/01/42 | | | | 36,979 | |
| | 33,662 | | | Loan ID 200201 | | Fixed | | 5.1250 | | | 08/01/41 | | | | 34,335 | |
| | 18,821 | | | Loan ID 200206 | | Fixed | | 3.9900 | | | 12/01/42 | | | | 18,265 | |
| | 40,044 | | | Loan ID 200208 | | Fixed | | 4.2500 | | | 01/01/43 | | | | 39,371 | |
| | 163,797 | | | Loan ID 200209 | | Fixed | | 3.8750 | | | 08/01/42 | | | | 158,100 | |
| | 128,598 | | | Loan ID 200217 | | Fixed | | 5.2500 | | | 07/01/40 | | | | 131,170 | |
| | 65,507 | | | Loan ID 200218 | | Fixed | | 4.2500 | | | 12/01/41 | | | | 64,567 | |
| | 45,113 | | | Loan ID 200228 | | Fixed | | 4.6250 | | | 08/01/42 | | | | 45,118 | |
| | 105,032 | | | Loan ID 200243 | | Fixed | | 3.7500 | | | 04/01/43 | | | | 100,339 | |
| | 23,087 | | | Loan ID 200244 | | Fixed | | 5.0000 | | | 05/01/42 | | | | 23,409 | |
| | 80,651 | | | Loan ID 200286 | | Fixed | | 4.5000 | | | 07/01/43 | | | | 80,184 | |
| | 86,721 | | | Loan ID 200287 | | Fixed | | 4.3750 | | | 07/01/43 | | | | 85,677 | |
| | 181,452 | | | Loan ID 200296 | | Fixed | | 3.2500 | | | 02/01/43 | | | | 166,977 | |
| | 30,233 | | | Loan ID 200313 | | Fixed | | 8.5000 | | | 03/01/28 | | | | 30,837 | |
| | 258,169 | | | Loan ID 200315 | | ARM | | 3.3750 | | | 06/01/37 | | | | 252,121 | |
| | 58,253 | | | Loan ID 200317 | | Fixed | | 7.0000 | | | 09/01/32 | | | | 59,418 | |
| | 240,423 | | | Loan ID 200330 | | Fixed | | 7.0000 | | | 08/01/37 | | | | 169,318 | |
| | 88,110 | | | Loan ID 200332 | | Fixed | | 5.7750 | | | 10/01/37 | | | | 89,872 | |
| | 83,773 | | | Loan ID 200334 | | Fixed | | 7.0000 | | | 01/01/33 | | | | 85,448 | |
| | 252,203 | | | Loan ID 200335 | | Fixed | | 5.0000 | | | 11/01/52 | | | | 257,247 | |
| | 40,313 | | | Loan ID 200338 | | ARM | | 10.5000 | | | 08/01/29 | | | | 41,119 | |
| | 16,513 | | | Loan ID 200340 | | Fixed | | 7.0000 | | | 03/01/30 | | | | 16,844 | |
| | 53,232 | | | Loan ID 200348 | | Fixed | | 6.5000 | | | 07/01/38 | | | | 54,297 | |
| | 59,728 | | | Loan ID 200352 | | Fixed | | 7.0000 | | | 08/01/30 | | | | 60,922 | |
| | 58,617 | | | Loan ID 200358 | | Fixed | | 5.0000 | | | 04/01/25 | | | | 59,072 | |
VERTICAL CAPITAL INCOME FUND
SCHEDULE OF INVESTMENTS (Continued)
September 30, 2021
| Principal | | | | | | | Coupon Rate | | | | | | |
| Amount ($) | | | | | Loan Type | | (%) | | Maturity | | | Fair Value | |
| | | | | LOANS — 93.9% (Continued) | | | | | | | | | | | | |
| | | | | MORTGAGE LOANS (PRIVATE) — 93.9% (Continued) |
| | 59,030 | | | Loan ID 200361 | | Fixed | | 7.5000 | | | 01/01/34 | | | $ | 60,211 | |
| | 78,807 | | | Loan ID 200366 | | Fixed | | 6.2500 | | | 03/01/34 | | | | 80,383 | |
| | 148,325 | | | Loan ID 200368 | | Fixed | | 4.5000 | | | 04/01/36 | | | | 148,593 | |
| | 62,997 | | | Loan ID 200374 | | ARM | | 7.0000 | | | 05/01/34 | | | | 59,847 | |
| | 170,749 | | | Loan ID 200380 | | Fixed | | 4.2200 | | | 04/01/49 | | | | 168,995 | |
| | 270,281 | | | Loan ID 200384 | | Fixed | | 5.0000 | | | 11/01/47 | | | | 242,355 | |
| | 131,982 | | | Loan ID 200385 | | Fixed | | 8.2500 | | | 01/01/40 | | | | 134,622 | |
| | 184,871 | | | Loan ID 200390 | | Fixed | | 4.7800 | | | 04/16/47 | | | | 173,397 | |
| | 136,562 | | | Loan ID 200391 | | Fixed | | 4.0000 | | | 01/13/35 | | | | 134,128 | |
| | 58,978 | | | Loan ID 200392 | | Fixed | | 10.0000 | | | 06/05/34 | | | | 56,029 | |
| | 75,048 | | | Loan ID 200395 | | Fixed | | 4.8600 | | | 04/01/47 | | | | 44,250 | |
| | 65,200 | | | Loan ID 200396 | | Fixed | | 10.0000 | | | 02/01/36 | | | | 66,504 | |
| | 52,687 | | | Loan ID 200397 | | ARM | | 3.1250 | | | 09/01/37 | | | | 51,898 | |
| | 54,570 | | | Loan ID 200399 | | Fixed | | 4.9800 | | | 06/01/37 | | | | 55,658 | |
| | 38,801 | | | Loan ID 200403 | | Fixed | | 8.3000 | | | 10/15/32 | | | | 39,578 | |
| | 49,587 | | | Loan ID 200404 | | Fixed | | 8.1000 | | | 05/01/37 | | | | 50,579 | |
| | 81,504 | | | Loan ID 200405 | | Fixed | | 4.8700 | | | 12/01/35 | | | | 82,493 | |
| | 109,924 | | | Loan ID 200406 | | Fixed | | 4.8750 | | | 10/01/51 | | | | 111,747 | |
| | 327,450 | | | Loan ID 200409 | | Fixed | | 6.0000 | | | 02/01/49 | | | | 300,703 | |
| | 94,444 | | | Loan ID 200411 | | Fixed | | 8.2750 | | | 06/01/37 | | | | 96,333 | |
| | 60,223 | | | Loan ID 200417 | | Fixed | | 7.0000 | | | 05/01/35 | | | | 61,427 | |
| | 141,183 | | | Loan ID 200420 | | Fixed | | 4.2250 | | | 04/10/38 | | | | 139,531 | |
| | 67,674 | | | Loan ID 200421 | | Fixed | | 7.7100 | | | 08/01/37 | | | | 69,028 | |
| | 115,359 | | | Loan ID 200423 | | Fixed | | 4.5000 | | | 06/01/43 | | | | 114,584 | |
| | 198,038 | | | Loan ID 200430 | | Fixed | | 3.6250 | | | 07/01/43 | | | | 187,341 | |
| | 257,808 | | | Loan ID 200432 | | Fixed | | 4.8750 | | | 05/01/43 | | | | 260,263 | |
| | 90,203 | | | Loan ID 200433 | | Fixed | | 4.2500 | | | 08/01/43 | | | | 88,692 | |
| | 188,017 | | | Loan ID 200435 | | Fixed | | 4.6250 | | | 11/01/52 | | | | 189,993 | |
| | 38,980 | | | Loan ID 200439 | | Fixed | | 5.0000 | | | 08/01/41 | | | | 39,669 | |
| | 123,099 | | | Loan ID 200445 | | Fixed | | 5.2500 | | | 02/01/39 | | | | 125,561 | |
| | 26,712 | | | Loan ID 200447 | | Fixed | | 5.8750 | | | 11/04/34 | | | | 27,246 | |
| | 72,163 | | | Loan ID 200448 | | Fixed | | 5.7500 | | | 05/01/42 | | | | 73,606 | |
| | 127,663 | | | Loan ID 200449 | | Fixed | | 5.0000 | | | 02/01/42 | | | | 119,636 | |
| | 315,239 | | | Loan ID 200451 | | Fixed | | 6.2500 | | | 07/01/38 | | | | 321,544 | |
VERTICAL CAPITAL INCOME FUND
SCHEDULE OF INVESTMENTS (Continued)
September 30, 2021
| Principal | | | | | | | Coupon Rate | | | | | | |
| Amount ($) | | | | | Loan Type | | (%) | | Maturity | | | Fair Value | |
| | | | | LOANS — 93.9% (Continued) | | | | | | | | | | | | |
| | | | | MORTGAGE LOANS (PRIVATE) — 93.9% (Continued) |
| | 167,682 | | | Loan ID 200460 | | Fixed | | 7.0000 | | | 07/01/41 | | | $ | 171,036 | |
| | 356,613 | | | Loan ID 200462 | | Fixed | | 6.0000 | | | 07/01/45 | | | | 363,746 | |
| | 210,544 | | | Loan ID 200465 | | Fixed | | 6.5000 | | | 07/01/37 | | | | 214,755 | |
| | 101,915 | | | Loan ID 200468 | | Fixed | | 5.6250 | | | 12/01/44 | | | | 32,192 | |
| | 113,556 | | | Loan ID 200469 | | Fixed | | 6.5000 | | | 07/01/37 | | | | 115,827 | |
| | 230,092 | | | Loan ID 200474 | | Fixed | | 5.7500 | | | 11/01/50 | | | | 234,694 | |
| | 180,777 | | | Loan ID 200476 | | Fixed | | 6.0000 | | | 09/01/50 | | | | 184,392 | |
| | 101,408 | | | Loan ID 200489 | | Fixed | | 4.0000 | | | 03/01/43 | | | | 98,533 | |
| | 179,164 | | | Loan ID 200491 | | Fixed | | 5.5000 | | | 10/01/39 | | | | 182,747 | |
| | 249,830 | | | Loan ID 200494 | | Fixed | | 4.6250 | | | 10/01/43 | | | | 250,237 | |
| | 178,785 | | | Loan ID 200500 | | Fixed | | 5.8750 | | | 02/01/37 | | | | 182,360 | |
| | 59,615 | | | Loan ID 200507 | | Fixed | | 4.5000 | | | 09/01/42 | | | | 59,323 | |
| | 88,905 | | | Loan ID 200517 | | Fixed | | 8.0000 | | | 05/01/39 | | | | 88,905 | |
| | 179,723 | | | Loan ID 200518 | | Fixed | | 3.0000 | | | 12/01/50 | | | | 165,115 | |
| | 100,315 | | | Loan ID 200527 | | Fixed | | 4.5000 | | | 12/01/43 | | | | 99,794 | |
| | 94,795 | | | Loan ID 200532 | | Fixed | | 3.2500 | | | 07/01/43 | | | | 87,203 | |
| | 36,049 | | | Loan ID 200545 | | Fixed | | 4.3750 | | | 02/01/29 | | | | 35,620 | |
| | 120,425 | | | Loan ID 200564 | | Fixed | | 4.8750 | | | 05/01/39 | | | | 122,190 | |
| | 83,776 | | | Loan ID 200573 | | Fixed | | 3.7500 | | | 09/01/42 | | | | 80,054 | |
| | 118,082 | | | Loan ID 200574 | | Fixed | | 4.8750 | | | 01/01/44 | | | | 119,550 | |
| | 162,564 | | | Loan ID 200578 | | Fixed | | 4.7500 | | | 08/01/40 | | | | 161,423 | |
| | 42,760 | | | Loan ID 200579 | | Fixed | | 4.8750 | | | 05/01/42 | | | | 29,530 | |
| | 151,244 | | | Loan ID 200580 | | Fixed | | 4.1250 | | | 11/01/41 | | | | 148,246 | |
| | 288,044 | | | Loan ID 200586 | | Fixed | | 3.5000 | | | 01/01/43 | | | | 270,498 | |
| | 58,444 | | | Loan ID 200593 | | Fixed | | 3.8750 | | | 06/01/42 | | | | 56,399 | |
| | 34,145 | | | Loan ID 200597 | | Fixed | | 5.6250 | | | 02/01/44 | | | | 34,827 | |
| | 64,620 | | | Loan ID 200604 | | Fixed | | 3.5000 | | | 01/01/43 | | | | 60,665 | |
| | 112,113 | | | Loan ID 200612 | | Fixed | | 4.5000 | | | 02/01/43 | | | | 111,488 | |
| | 307,548 | | | Loan ID 200616 | | Fixed | | 4.8750 | | | 02/01/44 | | | | 311,021 | |
| | 149,275 | | | Loan ID 200630 | | Fixed | | 5.2500 | | | 09/01/43 | | | | 152,261 | |
| | 206,355 | | | Loan ID 200634 | | Fixed | | 4.3750 | | | 01/01/44 | | | | 204,060 | |
| | 106,916 | | | Loan ID 200645 | | Fixed | | 5.0000 | | | 04/01/44 | | | | 108,642 | |
| | 126,857 | | | Loan ID 200649 | | Fixed | | 4.3750 | | | 03/01/44 | | | | 125,320 | |
| | 117,376 | | | Loan ID 200650 | | Fixed | | 4.8750 | | | 05/01/44 | | | | 118,849 | |
VERTICAL CAPITAL INCOME FUND
SCHEDULE OF INVESTMENTS (Continued)
September 30, 2021
| Principal | | | | | | | Coupon Rate | | | | | | |
| Amount ($) | | | | | Loan Type | | (%) | | Maturity | | | Fair Value | |
| | | | | LOANS — 93.9% (Continued) | | | | | | | | | | | | |
| | | | | MORTGAGE LOANS (PRIVATE) — 93.9% (Continued) |
| | 200,531 | | | Loan ID 200651 | | Fixed | | 3.6250 | | | 07/01/43 | | | $ | 189,610 | |
| | 123,405 | | | Loan ID 200655 | | Fixed | | 3.3750 | | | 05/01/43 | | | | 114,540 | |
| | 165,734 | | | Loan ID 200656 | | Fixed | | 6.8750 | | | 11/01/45 | | | | 157,447 | |
| | 136,936 | | | Loan ID 200657 | | Fixed | | 4.8750 | | | 08/01/51 | | | | 139,009 | |
| | 158,259 | | | Loan ID 200660 | | Fixed | | 5.8750 | | | 03/01/38 | | | | 161,424 | |
| | 190,160 | | | Loan ID 200662 | | Fixed | | 5.0000 | | | 03/01/44 | | | | 193,005 | |
| | 62,435 | | | Loan ID 200663 | | Fixed | | 4.7500 | | | 05/01/44 | | | | 62,915 | |
| | 141,272 | | | Loan ID 200669 | | Fixed | | 5.2500 | | | 04/01/44 | | | | 144,097 | |
| | 42,121 | | | Loan ID 200670 | | Fixed | | 4.3750 | | | 02/01/29 | | | | 41,644 | |
| | 279,921 | | | Loan ID 200674 | | Fixed | | 4.5000 | | | 05/01/44 | | | | 278,790 | |
| | 231,326 | | | Loan ID 200679 | | Fixed | | 5.0000 | | | 04/01/44 | | | | 232,915 | |
| | 172,253 | | | Loan ID 200682 | | Fixed | | 4.8750 | | | 05/01/44 | | | | 174,162 | |
| | 114,639 | | | Loan ID 200684 | | Fixed | | 4.8750 | | | 04/01/44 | | | | 116,118 | |
| | 208,504 | | | Loan ID 200685 | | Fixed | | 4.8750 | | | 05/01/44 | | | | 210,562 | |
| | 200,848 | | | Loan ID 200690 | | Fixed | | 4.2500 | | | 04/01/44 | | | | 197,609 | |
| | 220,774 | | | Loan ID 200692 | | Fixed | | 4.6250 | | | 07/01/44 | | | | 220,531 | |
| | 96,129 | | | Loan ID 200694 | | Fixed | | 4.5000 | | | 09/01/43 | | | | 95,652 | |
| | 42,079 | | | Loan ID 200696 | | Fixed | | 3.7500 | | | 10/01/42 | | | | 40,293 | |
| | 79,293 | | | Loan ID 200700 | | Fixed | | 4.2500 | | | 02/01/44 | | | | 77,876 | |
| | 86,713 | | | Loan ID 200704 | | Fixed | | 4.3750 | | | 03/01/43 | | | | 85,586 | |
| | 45,699 | | | Loan ID 200709 | | Fixed | | 4.3750 | | | 04/01/43 | | | | 45,186 | |
| | 102,444 | | | Loan ID 200710 | | Fixed | | 4.5000 | | | 07/01/44 | | | | 100,009 | |
| | 559,918 | | | Loan ID 200714 | | Fixed | | 4.1750 | | | 11/01/36 | | | | 553,291 | |
| | 183,736 | | | Loan ID 200716 | | ARM | | 3.0900 | | | 08/01/37 | | | | 181,717 | |
| | 128,035 | | | Loan ID 200720 | | ARM | | 3.5000 | | | 04/01/42 | | | | 119,680 | |
| | 142,879 | | | Loan ID 200726 | | Fixed | | 4.3750 | | | 09/01/37 | | | | 107,744 | |
| | 181,656 | | | Loan ID 200732 | | Fixed | | 4.1250 | | | 09/01/27 | | | | 178,836 | |
| | 91,117 | | | Loan ID 200735 | | Fixed | | 4.5000 | | | 06/01/44 | | | | 90,641 | |
| | 131,230 | | | Loan ID 200736 | | Fixed | | 4.7500 | | | 05/01/44 | | | | 129,637 | |
| | 158,654 | | | Loan ID 200742 | | Fixed | | 4.2500 | | | 04/01/43 | | | | 155,703 | |
| | 54,373 | | | Loan ID 200753 | | Fixed | | 5.2500 | | | 05/01/44 | | | | 55,460 | |
| | 47,332 | | | Loan ID 200755 | | Fixed | | 4.2500 | | | 06/01/43 | | | | 46,568 | |
| | 167,910 | | | Loan ID 200756 | | Fixed | | 4.8750 | | | 11/01/43 | | | | 169,883 | |
| | 162,922 | | | Loan ID 200771 | | Fixed | | 4.5000 | | | 04/01/43 | | | | 150,542 | |
VERTICAL CAPITAL INCOME FUND
SCHEDULE OF INVESTMENTS (Continued)
September 30, 2021
| Principal | | | | | | | Coupon Rate | | | | | | |
| Amount ($) | | | | | Loan Type | | (%) | | Maturity | | | Fair Value | |
| | | | | LOANS — 93.9% (Continued) | | | | | | | | | | | | |
| | | | | MORTGAGE LOANS (PRIVATE) — 93.9% (Continued) |
| | 39,987 | | | Loan ID 200775 | | Fixed | | 4.2500 | | | 04/01/43 | | | $ | 39,286 | |
| | 72,976 | | | Loan ID 200776 | | Fixed | | 4.2500 | | | 03/01/44 | | | | 71,621 | |
| | 48,792 | | | Loan ID 200777 | | Fixed | | 4.7500 | | | 06/01/44 | | | | 48,904 | |
| | 152,633 | | | Loan ID 200781 | | Fixed | | 4.6250 | | | 09/01/44 | | | | 152,131 | |
| | 76,368 | | | Loan ID 200783 | | Fixed | | 4.7500 | | | 09/01/44 | | | | 76,813 | |
| | 101,305 | | | Loan ID 200785 | | Fixed | | 4.5000 | | | 08/01/44 | | | | 100,796 | |
| | 205,690 | | | Loan ID 200786 | | Fixed | | 4.6250 | | | 07/01/44 | | | | 206,208 | |
| | 39,383 | | | Loan ID 200787 | | Fixed | | 4.7500 | | | 09/01/44 | | | | 39,595 | |
| | 184,727 | | | Loan ID 200791 | | Fixed | | 4.8750 | | | 06/01/44 | | | | 186,383 | |
| | 81,569 | | | Loan ID 200795 | | Fixed | | 6.7500 | | | 08/01/36 | | | | 83,200 | |
| | 68,643 | | | Loan ID 200796 | | Fixed | | 5.8800 | | | 12/01/53 | | | | 37,716 | |
| | 55,764 | | | Loan ID 200799 | | Fixed | | 4.0000 | | | 02/05/53 | | | | 53,251 | |
| | 61,051 | | | Loan ID 200800 | | Fixed | | 4.0000 | | | 01/01/53 | | | | 50,643 | |
| | 145,572 | | | Loan ID 200805 | | Fixed | | 4.6250 | | | 07/01/50 | | | | 129,327 | |
| | 53,685 | | | Loan ID 200808 | | Fixed | | 4.2500 | | | 11/01/50 | | | | 44,636 | |
| | 112,093 | | | Loan ID 200809 | | Fixed | | 5.0000 | | | 04/01/50 | | | | 104,007 | |
| | 220,100 | | | Loan ID 200814 | | Fixed | | 8.2500 | | | 07/01/39 | | | | 224,502 | |
| | 271,314 | | | Loan ID 200817 | | Fixed | | 5.0000 | | | 01/01/50 | | | | 240,298 | |
| | 189,069 | | | Loan ID 200821 | | Fixed | | 4.2500 | | | 08/01/44 | | | | 186,049 | |
| | 73,241 | | | Loan ID 200823 | | Fixed | | 4.2500 | | | 09/01/44 | | | | 72,028 | |
| | 200,733 | | | Loan ID 200824 | | Fixed | | 4.2500 | | | 08/01/44 | | | | 197,257 | |
| | 95,814 | | | Loan ID 200826 | | Fixed | | 4.3750 | | | 09/01/44 | | | | 94,557 | |
| | 175,799 | | | Loan ID 200830 | | ARM | | 1.2500 | | | 07/01/44 | | | | 161,870 | |
| | 38,306 | | | Loan ID 200831 | | Fixed | | 4.2500 | | | 10/01/44 | | | | 37,560 | |
| | 303,302 | | | Loan ID 200832 | | Fixed | | 4.2500 | | | 10/01/44 | | | | 292,756 | |
| | 143,807 | | | Loan ID 200834 | | Fixed | | 4.1250 | | | 07/01/43 | | | | 140,468 | |
| | 267,198 | | | Loan ID 200844 | | Fixed | | 4.5000 | | | 07/01/43 | | | | 265,642 | |
| | 177,498 | | | Loan ID 200846 | | Fixed | | 4.3750 | | | 11/01/43 | | | | 175,787 | |
| | 95,196 | | | Loan ID 200853 | | Fixed | | 5.0000 | | | 04/01/37 | | | | 97,091 | |
| | 172,272 | | | Loan ID 200856 | | Fixed | | 6.5000 | | | 06/01/42 | | | | 166,057 | |
| | 248,272 | | | Loan ID 200858 | | Fixed | | 5.0000 | | | 01/01/53 | | | | 253,238 | |
| | 147,383 | | | Loan ID 200860 | | Fixed | | 3.8750 | | | 03/01/52 | | | | 140,275 | |
| | 244,614 | | | Loan ID 200866 | | Fixed | | 3.4000 | | | 05/01/53 | | | | 231,816 | |
| | 105,590 | | | Loan ID 200867 | | Fixed | | 4.5800 | | | 09/01/53 | | | | 105,971 | |
VERTICAL CAPITAL INCOME FUND
SCHEDULE OF INVESTMENTS (Continued)
September 30, 2021
| Principal | | | | | | | Coupon Rate | | | | | | |
| Amount ($) | | | | | Loan Type | | (%) | | Maturity | | | Fair Value | |
| | | | | LOANS — 93.9% (Continued) | | | | | | | | | | | | |
| | | | | MORTGAGE LOANS (PRIVATE) — 93.9% (Continued) |
| | 170,609 | | | Loan ID 200880 | | Fixed | | 4.2500 | | | 06/01/43 | | | $ | 167,585 | |
| | 53,476 | | | Loan ID 200883 | | Fixed | | 3.3750 | | | 05/01/28 | | | | 49,674 | |
| | 73,925 | | | Loan ID 200886 | | Fixed | | 4.2500 | | | 10/01/44 | | | | 72,621 | |
| | 207,008 | | | Loan ID 200887 | | Fixed | | 4.7500 | | | 09/01/44 | | | | 208,100 | |
| | 186,105 | | | Loan ID 200891 | | Fixed | | 4.2500 | | | 10/01/44 | | | | 182,340 | |
| | 223,061 | | | Loan ID 200892 | | Fixed | | 3.7500 | | | 09/01/43 | | | | 213,123 | |
| | 175,728 | | | Loan ID 200897 | | Fixed | | 4.7500 | | | 10/01/44 | | | | 176,826 | |
| | 357,156 | | | Loan ID 200907 | | ARM | | 3.1400 | | | 08/01/47 | | | | 345,834 | |
| | 98,050 | | | Loan ID 200908 | | Fixed | | 4.0000 | | | 06/01/49 | | | | 96,698 | |
| | 118,315 | | | Loan ID 200909 | | Fixed | | 4.8700 | | | 04/01/47 | | | | 112,400 | |
| | 631,924 | | | Loan ID 200912 | | Fixed | | 4.5000 | | | 03/01/37 | | | | 632,566 | |
| | 54,391 | | | Loan ID 200913 | | Fixed | | 4.2500 | | | 05/01/47 | | | | 53,859 | |
| | 134,500 | | | Loan ID 200914 | | Fixed | | 2.8750 | | | 12/01/47 | | | | 124,683 | |
| | 80,294 | | | Loan ID 200916 | | Fixed | | 4.0000 | | | 10/01/37 | | | | 77,400 | |
| | 149,870 | | | Loan ID 200917 | | Fixed | | 4.8750 | | | 01/01/51 | | | | 152,219 | |
| | 82,847 | | | Loan ID 200921 | | ARM | | 3.6250 | | | 07/01/51 | | | | 81,783 | |
| | 395,395 | | | Loan ID 200922 | | Fixed | | 3.3400 | | | 09/01/53 | | | | 378,433 | |
| | 115,686 | | | Loan ID 200928 | | Fixed | | 4.8000 | | | 02/01/41 | | | | 117,228 | |
| | 176,584 | | | Loan ID 200940 | | Fixed | | 3.2500 | | | 02/01/43 | | | | 162,466 | |
| | 101,642 | | | Loan ID 200941 | | Fixed | | 3.7800 | | | 01/01/43 | | | | 95,373 | |
| | 242,538 | | | Loan ID 200942 | | Fixed | | 4.0000 | | | 04/01/43 | | | | 235,556 | |
| | 94,470 | | | Loan ID 200944 | | Fixed | | 4.5000 | | | 02/01/44 | | | | 93,836 | |
| | 259,334 | | | Loan ID 200947 | | Fixed | | 4.0000 | | | 02/01/43 | | | | 251,881 | |
| | 138,388 | | | Loan ID 200948 | | Fixed | | 4.6250 | | | 05/01/61 | | | | 138,329 | |
| | 248,525 | | | Loan ID 200956 | | Fixed | | 5.0000 | | | 08/01/51 | | | | 253,450 | |
| | 375,262 | | | Loan ID 200959 | | Fixed | | 4.0000 | | | 11/01/42 | | | | 364,776 | |
| | 133,513 | | | Loan ID 200966 | | Fixed | | 4.8750 | | | 07/01/44 | | | | 134,981 | |
| | 330,977 | | | Loan ID 200969 | | Fixed | | 4.8750 | | | 08/01/43 | | | | 334,944 | |
| | 140,499 | | | Loan ID 200974 | | Fixed | | 4.2500 | | | 10/01/44 | | | | 138,095 | |
| | 324,954 | | | Loan ID 200977 | | Fixed | | 4.8750 | | | 09/01/44 | | | | 308,706 | |
| | 152,889 | | | Loan ID 200993 | | Fixed | | 2.0040 | | | 07/15/49 | | | | 131,443 | |
| | 51,121 | | | Loan ID 200996 | | Fixed | | 2.5000 | | | 08/01/48 | | | | 45,121 | |
| | 116,907 | | | Loan ID 201005 | | Fixed | | 4.7500 | | | 07/01/41 | | | | 117,818 | |
| | 38,756 | | | Loan ID 201006 | | Fixed | | 6.8750 | | | 03/01/38 | | | | 39,532 | |
VERTICAL CAPITAL INCOME FUND
SCHEDULE OF INVESTMENTS (Continued)
September 30, 2021
| Principal | | | | | | | Coupon Rate | | | | | | |
| Amount ($) | | | | | Loan Type | | (%) | | Maturity | | | Fair Value | |
| | | | | LOANS — 93.9% (Continued) | | | | | | | | | | | | |
| | | | | MORTGAGE LOANS (PRIVATE) — 93.9% (Continued) |
| | 83,521 | | | Loan ID 201007 | | Fixed | | 7.1250 | | | 04/01/37 | | | $ | 85,192 | |
| | 71,281 | | | Loan ID 201010 | | Fixed | | 5.5000 | | | 04/01/39 | | | | 71,281 | |
| | 42,157 | | | Loan ID 201012 | | Fixed | | 7.5000 | | | 12/01/38 | | | | 43,000 | |
| | 51,238 | | | Loan ID 201013 | | Fixed | | 7.5000 | | | 12/01/38 | | | | 52,052 | |
| | 102,451 | | | Loan ID 201016 | | Fixed | | 6.5000 | | | 05/01/46 | | | | 104,500 | |
| | 57,848 | | | Loan ID 201022 | | ARM | | 2.3750 | | | 05/01/37 | | | | 54,175 | |
| | 124,316 | | | Loan ID 201023 | | Fixed | | 6.4500 | | | 02/01/36 | | | | 126,802 | |
| | 98,385 | | | Loan ID 201027 | | ARM | | 9.5380 | | | 03/01/37 | | | | 100,353 | |
| | 129,747 | | | Loan ID 201032 | | Fixed | | 4.5000 | | | 11/01/44 | | | | 128,713 | |
| | 76,937 | | | Loan ID 201036 | | Fixed | | 4.3750 | | | 12/01/44 | | | | 76,030 | |
| | 63,645 | | | Loan ID 201037 | | Fixed | | 8.2500 | | | 07/01/39 | | | | 64,918 | |
| | 85,606 | | | Loan ID 201041 | | Fixed | | 3.7500 | | | 11/01/52 | | | | 82,855 | |
| | 103,094 | | | Loan ID 201043 | | Fixed | | 4.0000 | | | 04/01/39 | | | | 98,169 | |
| | 157,435 | | | Loan ID 201044 | | Fixed | | 4.8700 | | | 03/29/37 | | | | 159,854 | |
| | 96,568 | | | Loan ID 201045 | | Fixed | | 3.3750 | | | 07/01/37 | | | | 84,807 | |
| | 276,448 | | | Loan ID 201046 | | Fixed | | 3.0000 | | | 10/01/58 | | | | 155,047 | |
| | 103,107 | | | Loan ID 201047 | | Fixed | | 3.6250 | | | 04/01/53 | | | | 96,306 | |
| | 61,678 | | | Loan ID 201053 | | Fixed | | 3.8600 | | | 07/01/53 | | | | 60,085 | |
| | 189,302 | | | Loan ID 201054 | | Fixed | | 2.4000 | | | 05/17/50 | | | | 162,686 | |
| | 144,947 | | | Loan ID 201057 | | Fixed | | 4.3750 | | | 01/01/50 | | | | 144,483 | |
| | 103,381 | | | Loan ID 201058 | | Fixed | | 4.2500 | | | 08/01/37 | | | | 102,367 | |
| | 92,666 | | | Loan ID 201060 | | ARM | | 2.3750 | | | 07/01/35 | | | | 89,479 | |
| | 77,154 | | | Loan ID 201061 | | Fixed | | 5.0000 | | | 02/01/50 | | | | 74,397 | |
| | 106,482 | | | Loan ID 201063 | | Fixed | | 4.0000 | | | 09/01/47 | | | | 104,241 | |
| | 213,294 | | | Loan ID 201066 | | Fixed | | 4.2500 | | | 12/01/46 | | | | 211,369 | |
| | 399,371 | | | Loan ID 201067 | | Fixed | | 4.7500 | | | 01/01/44 | | | | 401,987 | |
| | 61,739 | | | Loan ID 201069 | | Fixed | | 4.6250 | | | 12/01/44 | | | | 61,812 | |
| | 71,016 | | | Loan ID 201072 | | Fixed | | 3.5000 | | | 03/01/28 | | | | 66,717 | |
| | 86,282 | | | Loan ID 201075 | | Fixed | | 4.3750 | | | 10/01/44 | | | | 85,230 | |
| | 214,175 | | | Loan ID 201084 | | Fixed | | 5.0000 | | | 08/01/38 | | | | 200,469 | |
| | 144,272 | | | Loan ID 201091 | | Fixed | | 4.1250 | | | 01/01/45 | | | | 140,523 | |
| | 232,164 | | | Loan ID 201092 | | Fixed | | 5.2500 | | | 04/01/46 | | | | 236,807 | |
| | 128,874 | | | Loan ID 201093 | | Fixed | | 4.1250 | | | 02/01/45 | | | | 116,459 | |
| | 320,361 | | | Loan ID 201101 | | Fixed | | 4.6250 | | | 03/01/45 | | | | 314,714 | |
VERTICAL CAPITAL INCOME FUND
SCHEDULE OF INVESTMENTS (Continued)
September 30, 2021
| Principal | | | | | | | Coupon Rate | | | | | | |
| Amount ($) | | | | | Loan Type | | (%) | | Maturity | | | Fair Value | |
| | | | | LOANS — 93.9% (Continued) | | | | | | | | | | | | |
| | | | | MORTGAGE LOANS (PRIVATE) — 93.9% (Continued) |
| | 137,191 | | | Loan ID 201103 | | ARM | | 2.7500 | | | 05/01/44 | | | $ | 130,828 | |
| | 146,971 | | | Loan ID 201104 | | Fixed | | 4.3750 | | | 04/01/45 | | | | 145,321 | |
| | 66,718 | | | Loan ID 201107 | | Fixed | | 5.1500 | | | 02/01/36 | | | | 68,053 | |
| | 148,024 | | | Loan ID 201111 | | Fixed | | 4.8750 | | | 04/01/50 | | | | 136,440 | |
| | 75,287 | | | Loan ID 201113 | | Fixed | | 5.7500 | | | 12/01/52 | | | | 76,793 | |
| | 114,669 | | | Loan ID 201114 | | Fixed | | 8.0870 | | | 05/01/54 | | | | 116,962 | |
| | 471,032 | | | Loan ID 201115 | | Fixed | | 4.0000 | | | 02/01/51 | | | | 460,868 | |
| | 74,854 | | | Loan ID 201122 | | Fixed | | 4.7500 | | | 11/01/48 | | | | 75,801 | |
| | 208,195 | | | Loan ID 201124 | | Fixed | | 4.7500 | | | 04/01/40 | | | | 210,373 | |
| | 68,319 | | | Loan ID 201127 | | ARM | | 2.5000 | | | 04/01/37 | | | | 65,764 | |
| | 105,030 | | | Loan ID 201130 | | Fixed | | 4.8500 | | | 12/01/37 | | | | 106,019 | |
| | 114,091 | | | Loan ID 201131 | | Fixed | | 8.2500 | | | 05/01/53 | | | | 116,372 | |
| | 155,645 | | | Loan ID 201132 | | Fixed | | 4.2500 | | | 07/01/37 | | | | 142,367 | |
| | 178,092 | | | Loan ID 201134 | | Fixed | | 4.6250 | | | 10/01/53 | | | | 166,242 | |
| | 165,677 | | | Loan ID 201139 | | Fixed | | 3.0000 | | | 11/01/53 | | | | 151,993 | |
| | 78,182 | | | Loan ID 201143 | | Fixed | | 3.5000 | | | 11/01/37 | | | | 69,461 | |
| | 124,581 | | | Loan ID 201146 | | Fixed | | 4.8750 | | | 08/01/54 | | | | 125,398 | |
| | 103,607 | | | Loan ID 201147 | | Fixed | | 4.1250 | | | 11/01/51 | | | | 98,026 | |
| | 86,193 | | | Loan ID 201148 | | Fixed | | 3.9500 | | | 10/01/42 | | | | 84,763 | |
| | 308,169 | | | Loan ID 201149 | | Fixed | | 5.0000 | | | 05/01/58 | | | | 165,731 | |
| | 88,407 | | | Loan ID 201155 | | Fixed | | 5.0000 | | | 11/01/53 | | | | 58,688 | |
| | 60,393 | | | Loan ID 201156 | | Fixed | | 5.0000 | | | 04/01/50 | | | | 55,348 | |
| | 187,869 | | | Loan ID 201160 | | Fixed | | 4.9200 | | | 10/01/49 | | | | 176,328 | |
| | 357,294 | | | Loan ID 201163 | | Fixed | | 4.7500 | | | 12/01/49 | | | | 305,824 | |
| | 156,759 | | | Loan ID 201164 | | Fixed | | 4.2500 | | | 11/01/51 | | | | 153,560 | |
| | 400,964 | | | Loan ID 201168 | | Fixed | | 3.8750 | | | 04/01/52 | | | | 370,421 | |
| | 50,731 | | | Loan ID 201170 | | Fixed | | 4.3750 | | | 07/01/37 | | | | 50,524 | |
| | 101,832 | | | Loan ID 201173 | | Fixed | | 4.2800 | | | 11/01/47 | | | | 79,307 | |
| | 121,955 | | | Loan ID 201176 | | Fixed | | 4.2500 | | | 07/01/53 | | | | 121,203 | |
| | 289,697 | | | Loan ID 201179 | | Fixed | | 4.7500 | | | 05/01/51 | | | | 264,802 | |
| | 252,045 | | | Loan ID 201181 | | Fixed | | 4.5000 | | | 04/01/34 | | | | 253,198 | |
| | 124,733 | | | Loan ID 201183 | | Fixed | | 3.5000 | | | 10/01/52 | | | | 119,301 | |
| | 58,748 | | | Loan ID 201184 | | Fixed | | 4.0000 | | | 06/01/49 | | | | 57,903 | |
| | 230,649 | | | Loan ID 201185 | | Fixed | | 7.2500 | | | 10/01/53 | | | | 235,262 | |
VERTICAL CAPITAL INCOME FUND
SCHEDULE OF INVESTMENTS (Continued)
September 30, 2021
| Principal | | | | | | | Coupon Rate | | | | | | |
| Amount ($) | | | | | Loan Type | | (%) | | Maturity | | | Fair Value | |
| | | | | LOANS — 93.9% (Continued) | | | | | | | | | | | | |
| | | | | MORTGAGE LOANS (PRIVATE) — 93.9% (Continued) |
| | 76,151 | | | Loan ID 201187 | | Fixed | | 5.0000 | | | 11/01/48 | | | $ | 55,480 | |
| | 574,603 | | | Loan ID 201196 | | Fixed | | 4.3750 | | | 11/01/36 | | | | 572,349 | |
| | 304,867 | | | Loan ID 201199 | | Fixed | | 5.1250 | | | 11/01/46 | | | | 310,965 | |
| | 135,489 | | | Loan ID 201205 | | Fixed | | 4.6250 | | | 01/01/45 | | | | 135,463 | |
| | 105,232 | | | Loan ID 201208 | | Fixed | | 4.6250 | | | 04/01/45 | | | | 104,990 | |
| | 164,310 | | | Loan ID 201209 | | Fixed | | 4.2500 | | | 04/01/45 | | | | 161,517 | |
| | 387,912 | | | Loan ID 201212 | | Fixed | | 4.6250 | | | 03/01/61 | | | | 388,359 | |
| | 180,471 | | | Loan ID 201213 | | Fixed | | 4.8750 | | | 08/01/44 | | | | 181,761 | |
| | 490,475 | | | Loan ID 201214 | | ARM | | 2.7500 | | | 09/01/43 | | | | 463,232 | |
| | 57,471 | | | Loan ID 201221 | | Fixed | | 3.2500 | | | 05/01/43 | | | | 25,578 | |
| | 44,580 | | | Loan ID 201222 | | Fixed | | 5.1250 | | | 01/01/45 | | | | 45,272 | |
| | 144,697 | | | Loan ID 201240 | | Fixed | | 4.2500 | | | 10/01/45 | | | | 141,368 | |
| | 272,073 | | | Loan ID 201241 | | Fixed | | 4.3750 | | | 07/01/45 | | | | 269,547 | |
| | 101,178 | | | Loan ID 201243 | | Fixed | | 4.6250 | | | 11/01/45 | | | | 101,160 | |
| | 367,461 | | | Loan ID 201244 | | Fixed | | 4.5000 | | | 06/01/45 | | | | 365,869 | |
| | 104,139 | | | Loan ID 201245 | | Fixed | | 4.7500 | | | 08/01/44 | | | | 104,926 | |
| | 92,673 | | | Loan ID 201248 | | Fixed | | 4.8750 | | | 07/01/44 | | | | 93,481 | |
| | 457,480 | | | Loan ID 201249 | | Fixed | | 4.6250 | | | 03/01/59 | | | | 455,452 | |
| | 194,203 | | | Loan ID 201254 | | Fixed | | 7.2500 | | | 05/01/60 | | | | 198,087 | |
| | 215,167 | | | Loan ID 201255 | | ARM | | 6.7500 | | | 06/01/35 | | | | 219,470 | |
| | 158,910 | | | Loan ID 201260 | | Fixed | | 4.7500 | | | 09/01/45 | | | | 159,502 | |
| | 46,218 | | | Loan ID 201263 | | Fixed | | 4.7500 | | | 10/01/45 | | | | 46,402 | |
| | 134,986 | | | Loan ID 201266 | | Fixed | | 4.5000 | | | 02/01/46 | | | | 133,749 | |
| | 138,284 | | | Loan ID 201270 | | Fixed | | 4.1250 | | | 02/01/45 | | | | 135,004 | |
| | 233,622 | | | Loan ID 201271 | | Fixed | | 4.5000 | | | 06/01/45 | | | | 232,601 | |
| | 222,957 | | | Loan ID 201273 | | Fixed | | 4.5000 | | | 12/01/45 | | | | 220,875 | |
| | 199,689 | | | Loan ID 201274 | | Fixed | | 4.1250 | | | 10/01/45 | | | | 194,607 | |
| | 23,213 | | | Loan ID 201285 | | Fixed | | 4.6250 | | | 11/01/28 | | | | 23,677 | |
| | 283,805 | | | Loan ID 201291 | | Fixed | | 5.0000 | | | 08/01/45 | | | | 263,195 | |
| | 113,638 | | | Loan ID 201294 | | Fixed | | 4.6250 | | | 02/01/46 | | | | 111,856 | |
| | 707,440 | | | Loan ID 201296 | | Fixed | | 4.2500 | | | 02/01/46 | | | | 690,912 | |
| | 66,880 | | | Loan ID 201301 | | Fixed | | 4.5500 | | | 10/01/44 | | | | 66,649 | |
| | 125,215 | | | Loan ID 201302 | | Fixed | | 4.2500 | | | 05/01/45 | | | | 122,773 | |
| | 137,229 | | | Loan ID 201305 | | Fixed | | 4.6250 | | | 08/01/44 | | | | 137,268 | |
VERTICAL CAPITAL INCOME FUND
SCHEDULE OF INVESTMENTS (Continued)
September 30, 2021
| Principal | | | | | | | Coupon Rate | | | | | | |
| Amount ($) | | | | | Loan Type | | (%) | | Maturity | | | Fair Value | |
| | | | | LOANS — 93.9% (Continued) | | | | | | | | | | | | |
| | | | | MORTGAGE LOANS (PRIVATE) — 93.9% (Continued) |
| | 107,527 | | | Loan ID 201306 | | Fixed | | 3.8750 | | | 09/01/45 | | | $ | 103,209 | |
| | 163,889 | | | Loan ID 201307 | | Fixed | | 4.2500 | | | 10/01/48 | | | | 160,945 | |
| | 57,800 | | | Loan ID 201308 | | Fixed | | 4.6250 | | | 11/01/45 | | | | 57,652 | |
| | 149,805 | | | Loan ID 201309 | | Fixed | | 4.0000 | | | 09/01/45 | | | | 145,185 | |
| | 299,638 | | | Loan ID 201313 | | Fixed | | 4.6250 | | | 01/01/46 | | | | 299,869 | |
| | 150,771 | | | Loan ID 201316 | | Fixed | | 4.5000 | | | 02/01/46 | | | | 149,815 | |
| | 159,252 | | | Loan ID 201319 | | Fixed | | 4.3750 | | | 10/01/45 | | | | 157,441 | |
| | 126,903 | | | Loan ID 201324 | | Fixed | | 5.2500 | | | 04/01/46 | | | | 129,442 | |
| | 164,463 | | | Loan ID 201326 | | Fixed | | 4.6250 | | | 03/01/46 | | | | 164,468 | |
| | 176,813 | | | Loan ID 201328 | | Fixed | | 4.2500 | | | 11/01/45 | | | | 111,684 | |
| | 342,480 | | | Loan ID 201333 | | Fixed | | 3.8750 | | | 11/01/45 | | | | 328,270 | |
| | 177,920 | | | Loan ID 201336 | | Fixed | | 4.7500 | | | 01/01/46 | | | | 175,243 | |
| | 222,635 | | | Loan ID 201350 | | Fixed | | 4.0000 | | | 06/01/45 | | | | 161,225 | |
| | 61,114 | | | Loan ID 201352 | | Fixed | | 4.8750 | | | 03/01/45 | | | | 61,505 | |
| | 464,928 | | | Loan ID 201354 | | Fixed | | 3.3750 | | | 07/01/46 | | | | 449,180 | |
| | 126,349 | | | Loan ID 201355 | | Fixed | | 5.2500 | | | 12/01/45 | | | | 128,876 | |
| | 140,821 | | | Loan ID 201358 | | Fixed | | 4.8750 | | | 07/01/45 | | | | 142,331 | |
| | 104,314 | | | Loan ID 201364 | | Fixed | | 3.8750 | | | 04/01/46 | | | | 100,112 | |
| | 316,063 | | | Loan ID 201365 | | Fixed | | 4.2500 | | | 10/01/45 | | | | 309,078 | |
| | 169,946 | | | Loan ID 201370 | | Fixed | | 4.2500 | | | 07/01/46 | | | | 166,311 | |
| | 94,066 | | | Loan ID 201371 | | Fixed | | 4.1250 | | | 04/01/46 | | | | 91,119 | |
| | 243,719 | | | Loan ID 201372 | | Fixed | | 4.6250 | | | 08/01/46 | | | | 243,638 | |
| | 134,075 | | | Loan ID 201375 | | Fixed | | 4.5000 | | | 06/01/45 | | | | 133,477 | |
| | 255,023 | | | Loan ID 201377 | | Fixed | | 3.8750 | | | 05/01/46 | | | | 251,834 | |
| | 295,834 | | | Loan ID 201381 | | Fixed | | 4.8750 | | | 07/01/45 | | | | 299,111 | |
| | 130,097 | | | Loan ID 201385 | | Fixed | | 4.6250 | | | 12/01/45 | | | | 130,097 | |
| | 216,000 | | | Loan ID 201390 | | Fixed | | 5.1250 | | | 09/01/45 | | | | 220,320 | |
| | 371,940 | | | Loan ID 201391 | | Fixed | | 5.1250 | | | 10/01/45 | | | | 371,391 | |
| | 406,399 | | | Loan ID 201393 | | Fixed | | 3.7500 | | | 04/01/56 | | | | 402,921 | |
| | 69,665 | | | Loan ID 201394 | | Fixed | | 6.7000 | | | 06/01/34 | | | | 71,058 | |
| | 80,770 | | | Loan ID 201395 | | Fixed | | 6.3000 | | | 07/01/44 | | | | 17,583 | |
| | 80,327 | | | Loan ID 201400 | | Fixed | | 4.7500 | | | 07/01/44 | | | | 80,868 | |
| | 84,272 | | | Loan ID 201401 | | Fixed | | 4.7500 | | | 10/01/44 | | | | 84,814 | |
| | 87,981 | | | Loan ID 201403 | | Fixed | | 4.7500 | | | 08/01/44 | | | | 79,128 | |
VERTICAL CAPITAL INCOME FUND
SCHEDULE OF INVESTMENTS (Continued)
September 30, 2021
| Principal | | | | | | | Coupon Rate | | | | | | |
| Amount ($) | | | | | Loan Type | | (%) | | Maturity | | | Fair Value | |
| | | | | LOANS — 93.9% (Continued) | | | | | | | | | | | | |
| | | | | MORTGAGE LOANS (PRIVATE) — 93.9% (Continued) |
| | 126,261 | | | Loan ID 201404 | | Fixed | | 4.7500 | | | 10/01/44 | | | $ | 126,401 | |
| | 67,313 | | | Loan ID 201405 | | Fixed | | 5.2500 | | | 08/01/44 | | | | 68,660 | |
| | 51,310 | | | Loan ID 201406 | | Fixed | | 4.2500 | | | 06/01/46 | | | | 50,123 | |
| | 227,789 | | | Loan ID 201407 | | Fixed | | 4.8750 | | | 01/01/46 | | | | 230,476 | |
| | 153,743 | | | Loan ID 201411 | | Fixed | | 4.7500 | | | 12/01/45 | | | | 154,544 | |
| | 134,726 | | | Loan ID 201412 | | Fixed | | 5.7500 | | | 12/01/45 | | | | 137,421 | |
| | 315,251 | | | Loan ID 201413 | | Fixed | | 4.5000 | | | 07/01/45 | | | | 313,949 | |
| | 68,811 | | | Loan ID 201414 | | Fixed | | 4.2500 | | | 07/01/44 | | | | 64,230 | |
| | 51,282 | | | Loan ID 201415 | | Fixed | | 8.0000 | | | 04/01/34 | | | | 52,308 | |
| | 55,638 | | | Loan ID 201417 | | Fixed | | 6.0000 | | | 08/01/37 | | | | 56,750 | |
| | 38,299 | | | Loan ID 201419 | | Fixed | | 10.0000 | | | 11/01/33 | | | | 39,065 | |
| | 53,768 | | | Loan ID 201422 | | Fixed | | 4.6250 | | | 10/01/46 | | | | 53,406 | |
| | 500,901 | | | Loan ID 201428 | | ARM | | 2.5000 | | | 04/01/45 | | | | 474,176 | |
| | 92,399 | | | Loan ID 201434 | | Fixed | | 4.3750 | | | 06/01/46 | | | | 91,298 | |
| | 84,528 | | | Loan ID 201436 | | Fixed | | 4.3750 | | | 05/01/45 | | | | 83,519 | |
| | 127,376 | | | Loan ID 201437 | | Fixed | | 4.7500 | | | 05/01/46 | | | | 43,298 | |
| | 168,824 | | | Loan ID 201439 | | Fixed | | 5.0000 | | | 12/01/45 | | | | 171,622 | |
| | 299,996 | | | Loan ID 201440 | | Fixed | | 4.6250 | | | 07/01/46 | | | | 187,409 | |
| | 281,518 | | | Loan ID 201442 | | Fixed | | 4.8750 | | | 12/01/45 | | | | 283,792 | |
| | 47,869 | | | Loan ID 201444 | | Fixed | | 4.5000 | | | 11/01/44 | | | | 47,489 | |
| | 237,305 | | | Loan ID 201447 | | Fixed | | 4.8750 | | | 10/01/44 | | | | 239,375 | |
| | 86,369 | | | Loan ID 201449 | | Fixed | | 4.0000 | | | 08/01/44 | | | | 83,632 | |
| | 209,427 | | | Loan ID 201451 | | Fixed | | 4.2500 | | | 06/01/45 | | | | 205,185 | |
| | 219,960 | | | Loan ID 201458 | | Fixed | | 3.8750 | | | 09/01/46 | | | | 206,394 | |
| | 252,345 | | | Loan ID 201461 | | Fixed | | 4.1250 | | | 12/01/44 | | | | 240,382 | |
| | 279,991 | | | Loan ID 201464 | | Fixed | | 4.3750 | | | 06/01/45 | | | | 271,452 | |
| | 95,747 | | | Loan ID 201465 | | Fixed | | 5.1250 | | | 12/01/44 | | | | 97,458 | |
| | 262,438 | | | Loan ID 201470 | | Fixed | | 4.3750 | | | 10/01/44 | | | | 258,890 | |
| | 210,508 | | | Loan ID 201471 | | Fixed | | 4.5000 | | | 01/01/45 | | | | 209,054 | |
| | 287,147 | | | Loan ID 201473 | | Fixed | | 4.5000 | | | 02/01/45 | | | | 286,046 | |
| | 91,119 | | | Loan ID 201475 | | ARM | | 6.6250 | | | 09/01/36 | | | | 10,806 | |
| | 133,930 | | | Loan ID 201476 | | ARM | | 8.5000 | | | 02/01/37 | | | | 127,234 | |
| | 75,471 | | | Loan ID 201477 | | Fixed | | 6.7500 | | | 11/01/36 | | | | 76,981 | |
| | 100,790 | | | Loan ID 201478 | | Fixed | | 4.6250 | | | 10/01/45 | | | | 100,683 | |
VERTICAL CAPITAL INCOME FUND
SCHEDULE OF INVESTMENTS (Continued)
September 30, 2021
| Principal | | | | | | | Coupon Rate | | | | | | |
| Amount ($) | | | | | Loan Type | | (%) | | Maturity | | | Fair Value | |
| | | | | LOANS — 93.9% (Continued) | | | | | | | | | | | | |
| | | | | MORTGAGE LOANS (PRIVATE) — 93.9% (Continued) |
| | 140,433 | | | Loan ID 201482 | | Fixed | | 4.6250 | | | 02/01/51 | | | $ | 139,763 | |
| | 277,606 | | | Loan ID 201483 | | Fixed | | 4.1250 | | | 12/01/45 | | | | 269,926 | |
| | 71,864 | | | Loan ID 201484 | | Fixed | | 4.5000 | | | 10/01/46 | | | | 71,091 | |
| | 57,001 | | | Loan ID 201485 | | Fixed | | 5.7500 | | | 03/01/38 | | | | 58,141 | |
| | 157,767 | | | Loan ID 201487 | | Fixed | | 4.6250 | | | 02/01/52 | | | | 160,922 | |
| | 86,392 | | | Loan ID 201489 | | Fixed | | 4.7500 | | | 03/01/46 | | | | 86,726 | |
| | 72,708 | | | Loan ID 201499 | | Fixed | | 4.7500 | | | 05/01/45 | | | | 73,294 | |
| | 99,246 | | | Loan ID 201502 | | Fixed | | 5.2500 | | | 04/01/44 | | | | 101,231 | |
| | 140,316 | | | Loan ID 201503 | | Fixed | | 5.0000 | | | 07/01/46 | | | | 142,516 | |
| | 423,189 | | | Loan ID 201504 | | Fixed | | 4.5000 | | | 07/01/45 | | | | 421,301 | |
| | 86,598 | | | Loan ID 201505 | | ARM | | 4.0000 | | | 09/01/46 | | | | 86,684 | |
| | 289,339 | | | Loan ID 201506 | | Fixed | | 5.0000 | | | 02/01/47 | | | | 293,781 | |
| | 210,352 | | | Loan ID 201508 | | Fixed | | 5.0000 | | | 02/01/47 | | | | 213,977 | |
| | 116,578 | | | Loan ID 201513 | | Fixed | | 4.0000 | | | 01/01/46 | | | | 116,578 | |
| | 71,817 | | | Loan ID 201515 | | Fixed | | 5.1250 | | | 04/01/47 | | | | 72,704 | |
| | 90,291 | | | Loan ID 201519 | | Fixed | | 4.7500 | | | 09/01/45 | | | | 90,947 | |
| | 74,956 | | | Loan ID 201523 | | Fixed | | 5.1250 | | | 07/01/45 | | | | 76,424 | |
| | 365,667 | | | Loan ID 201533 | | Fixed | | 4.7500 | | | 05/01/46 | | | | 365,843 | |
| | 39,950 | | | Loan ID 201534 | | Fixed | | 4.8750 | | | 05/01/47 | | | | 40,125 | |
| | 313,851 | | | Loan ID 201535 | | Fixed | | 4.8750 | | | 08/01/47 | | | | 313,851 | |
| | 191,104 | | | Loan ID 201551 | | Fixed | | 4.5000 | | | 02/01/47 | | | | 157,881 | |
| | 129,795 | | | Loan ID 201552 | | Fixed | | 4.0000 | | | 08/01/47 | | | | 129,795 | |
| | 45,436 | | | Loan ID 201556 | | Fixed | | 4.9900 | | | 12/01/47 | | | | 46,030 | |
| | 125,921 | | | Loan ID 201558 | | Fixed | | 4.5000 | | | 08/01/47 | | | | 125,921 | |
| | 100,663 | | | Loan ID 201579 | | Fixed | | 4.7500 | | | 12/01/36 | | | | 100,964 | |
| | 80,979 | | | Loan ID 201581 | | Fixed | | 4.1250 | | | 10/01/46 | | | | 78,896 | |
| | 82,105 | | | Loan ID 201583 | | Fixed | | 5.2500 | | | 08/01/47 | | | | 82,105 | |
| | 42,604 | | | Loan ID 201585 | | Fixed | | 5.5000 | | | 03/01/48 | | | | 43,456 | |
| | 368,517 | | | Loan ID 201586 | | Fixed | | 4.6250 | | | 05/01/47 | | | | 365,099 | |
| | 299,061 | | | Loan ID 201587 | | Fixed | | 4.3750 | | | 01/01/48 | | | | 294,425 | |
| | 34,192 | | | Loan ID 201589 | | Fixed | | 5.3750 | | | 06/01/48 | | | | 34,848 | |
| | 138,286 | | | Loan ID 201590 | | Fixed | | 5.2000 | | | 05/01/48 | | | | 83,535 | |
| | 303,727 | | | Loan ID 201591 | | Fixed | | 5.3750 | | | 08/01/48 | | | | 309,801 | |
| | 63,206 | | | Loan ID 201598 | | Fixed | | 6.0000 | | | 01/01/37 | | | | 64,471 | |
VERTICAL CAPITAL INCOME FUND
SCHEDULE OF INVESTMENTS (Continued)
September 30, 2021
| Principal | | | | | | | Coupon Rate | | | | | | |
| Amount ($) | | | | | Loan Type | | (%) | | Maturity | | | Fair Value | |
| | | | | LOANS — 93.9% (Continued) | | | | | | | | | | | | |
| | | | | MORTGAGE LOANS (PRIVATE) — 93.9% (Continued) |
| | 326,185 | | | Loan ID 201599 | | Fixed | | 5.0000 | | | 07/01/38 | | | $ | 249,747 | |
| | 44,013 | | | Loan ID 201600 | | Fixed | | 6.0000 | | | 01/01/36 | | | | 40,829 | |
| | 34,603 | | | Loan ID 201602 | | Fixed | | 5.0000 | | | 04/20/32 | | | | 35,295 | |
| | 58,454 | | | Loan ID 201604 | | Fixed | | 8.5000 | | | 01/01/48 | | | | 48,860 | |
| | 67,431 | | | Loan ID 201605 | | Fixed | | 8.7500 | | | 03/01/48 | | | | 68,779 | |
| | 88,284 | | | Loan ID 201606 | | Fixed | | 9.9900 | | | 05/01/48 | | | | 90,050 | |
| | 43,017 | | | Loan ID 201610 | | Fixed | | 9.9900 | | | 07/01/48 | | | | 8,089 | |
| | 58,983 | | | Loan ID 201611 | | Fixed | | 9.9900 | | | 07/01/48 | | | | 10,636 | |
| | 253,556 | | | Loan ID 201612 | | Fixed | | 8.9900 | | | 10/01/25 | | | | 258,627 | |
| | 493,192 | | | Loan ID 201615 | | Fixed | | 10.5000 | | | 01/01/22 | | | | 503,056 | |
| | 29,217 | | | Loan ID 201624 | | Fixed | | 11.0000 | | | 07/22/28 | | | | 27,757 | |
| | 42,754 | | | Loan ID 201627 | | Fixed | | 10.4500 | | | 02/19/47 | | | | 43,609 | |
| | 48,825 | | | Loan ID 201628 | | Fixed | | 11.0000 | | | 07/25/40 | | | | 49,802 | |
| | 36,864 | | | Loan ID 201629 | | Fixed | | 11.0000 | | | 03/06/33 | | | | 36,864 | |
| | 46,187 | | | Loan ID 201630(a) | | Fixed | | 9.9500 | | | 01/28/20 | | | | 43,878 | |
| | 42,247 | | | Loan ID 201631 | | Fixed | | 9.9500 | | | 07/25/31 | | | | 40,134 | |
| | 64,026 | | | Loan ID 201634 | | Fixed | | 7.9500 | | | 02/28/48 | | | | 60,824 | |
| | 64,724 | | | Loan ID 201635 | | Fixed | | 9.9500 | | | 03/14/46 | | | | 66,018 | |
| | 74,835 | | | Loan ID 201636 | | Fixed | | 9.4500 | | | 05/13/31 | | | | 76,332 | |
| | 97,809 | | | Loan ID 201637 | | Fixed | | 11.0000 | | | 05/22/45 | | | | 99,766 | |
| | 137,453 | | | Loan ID 201638 | | Fixed | | 8.5000 | | | 09/19/44 | | | | 140,202 | |
| | 315,769 | | | Loan ID 201639 | | Fixed | | 5.0000 | | | 09/01/48 | | | | 315,769 | |
| | 336,572 | | | Loan ID 201640 | | Fixed | | 5.1250 | | | 04/01/49 | | | | 341,416 | |
| | 158,632 | | | Loan ID 201641(a) | | DSI | | 10.5000 | | | 06/01/20 | | | | 150,700 | |
| | 669,302 | | | Loan ID 201645(a) | | Fixed | | 8.0000 | | | 07/01/20 | | | | 104,172 | |
| | 40,318 | | | Loan ID 201647 | | Fixed | | 6.0000 | | | 10/01/31 | | | | 40,034 | |
| | 30,481 | | | Loan ID 201648 | | Fixed | | 7.1500 | | | 08/14/30 | | | | 26,203 | |
| | 53,823 | | | Loan ID 201649 | | Fixed | | 4.8000 | | | 02/20/30 | | | | 54,758 | |
| | 36,032 | | | Loan ID 201650 | | Fixed | | 7.0000 | | | 11/14/31 | | | | 36,753 | |
| | 49,853 | | | Loan ID 201651 | | Fixed | | 7.0000 | | | 12/01/36 | | | | 34,086 | |
| | 247,013 | | | Loan ID 201652 | | Fixed | | 5.0000 | | | 10/01/36 | | | | 115,615 | |
| | 194,023 | | | Loan ID 201653 | | Fixed | | 4.2500 | | | 06/01/48 | | | | 194,023 | |
| | 434,849 | | | Loan ID 201654 | | Fixed | | 4.8750 | | | 07/01/49 | | | | 438,817 | |
| | 146,040 | | | Loan ID 201655 | | Fixed | | 7.7000 | | | 01/01/49 | | | | 148,961 | |
VERTICAL CAPITAL INCOME FUND
SCHEDULE OF INVESTMENTS (Continued)
September 30, 2021
| Principal | | | | | | | Coupon Rate | | | | | | |
| Amount ($) | | | | | Loan Type | | (%) | | Maturity | | | Fair Value | |
| | | | | LOANS — 93.9% (Continued) | | | | | | | | | | | | |
| | | | | MORTGAGE LOANS (PRIVATE) — 93.9% (Continued) |
| | 118,938 | | | Loan ID 201656 | | Fixed | | 4.6250 | | | 06/01/49 | | | $ | 117,412 | |
| | 241,523 | | | Loan ID 201657 | | Fixed | | 5.2500 | | | 11/01/48 | | | | 246,353 | |
| | 81,666 | | | Loan ID 201661 | | Fixed | | 5.5000 | | | 08/01/49 | | | | 82,503 | |
| | 128,232 | | | Loan ID 201662 | | Fixed | | 5.3750 | | | 09/01/48 | | | | 130,407 | |
| | 417,162 | | | Loan ID 201663 | | Fixed | | 4.7500 | | | 10/01/48 | | | | 417,162 | |
| | 19,186 | | | Loan ID 201664 | | Fixed | | 10.0000 | | | 08/01/33 | | | | 19,186 | |
| | 41,196 | | | Loan ID 201665 | | Fixed | | 9.9900 | | | 08/01/48 | | | | 42,020 | |
| | 17,960 | | | Loan ID 201666 | | Fixed | | 10.0000 | | | 06/01/33 | | | | 18,319 | |
| | 16,620 | | | Loan ID 201667 | | Fixed | | 10.0000 | | | 07/01/33 | | | | 16,952 | |
| | 15,591 | | | Loan ID 201668 | | Fixed | | 9.7500 | | | 11/01/33 | | | | 15,903 | |
| | 55,350 | | | Loan ID 201670 | | Fixed | | 8.0000 | | | 09/15/48 | | | | 55,350 | |
| | 22,544 | | | Loan ID 201671 | | Fixed | | 9.0000 | | | 09/15/48 | | | | 22,544 | |
| | 21,037 | | | Loan ID 201672 | | Fixed | | 9.9000 | | | 10/15/48 | | | | 21,458 | |
| | 51,243 | | | Loan ID 201673 | | Fixed | | 9.9900 | | | 06/01/48 | | | | 52,268 | |
| | 23,808 | | | Loan ID 201674 | | Fixed | | 9.9000 | | | 12/01/48 | | | | 24,284 | |
| | 111,143 | | | Loan ID 201676 | | Fixed | | 9.6250 | | | 10/01/48 | | | | 113,366 | |
| | 79,678 | | | Loan ID 201677 | | Fixed | | 9.2500 | | | 11/01/48 | | | | 81,271 | |
| | 23,854 | | | Loan ID 201678 | | Fixed | | 10.0000 | | | 08/01/48 | | | | 24,331 | |
| | 42,464 | | | Loan ID 201679 | | Fixed | | 7.7000 | | | 03/01/47 | | | | 43,313 | |
| | 39,219 | | | Loan ID 201680 | | Fixed | | 9.9000 | | | 09/15/48 | | | | 40,003 | |
| | 176,056 | | | Loan ID 201682 | | Fixed | | 5.0000 | | | 07/01/48 | | | | 96,547 | |
| | 401,670 | | | Loan ID 201684 | | Fixed | | 4.5000 | | | 08/01/49 | | | | 396,414 | |
| | 283,403 | | | Loan ID 201685 | | Fixed | | 5.5000 | | | 02/01/49 | | | | 289,071 | |
| | 99,972 | | | Loan ID 201686 | | Fixed | | 4.2500 | | | 07/01/49 | | | | 97,025 | |
| | 105,413 | | | Loan ID 201687 | | Fixed | | 5.5000 | | | 07/01/48 | | | | 92,899 | |
| | 205,040 | | | Loan ID 201689 | | Fixed | | 4.5000 | | | 04/01/49 | | | | 202,504 | |
| | 162,144 | | | Loan ID 201692 | | Fixed | | 8.4900 | | | 11/01/29 | | | | 165,387 | |
| | 302,227 | | | Loan ID 201695 | | Fixed | | 8.9000 | | | 12/01/21 | | | | 308,271 | |
| | 64,423 | | | Loan ID 201696 | | Fixed | | 5.1250 | | | 10/01/48 | | | | 65,637 | |
| | 123,279 | | | Loan ID 201697 | | Fixed | | 6.1250 | | | 04/01/49 | | | | 125,745 | |
| | 82,484 | | | Loan ID 201698 | | Fixed | | 4.3750 | | | 12/01/47 | | | | 80,672 | |
| | 263,036 | | | Loan ID 201699 | | Fixed | | 5.5220 | | | 09/01/49 | | | | 268,297 | |
| | 320,544 | | | Loan ID 201700 | | Fixed | | 6.1250 | | | 06/01/49 | | | | 326,955 | |
| | 61,901 | | | Loan ID 201701 | | Fixed | | 5.0000 | | | 08/01/49 | | | | 61,921 | |
VERTICAL CAPITAL INCOME FUND
SCHEDULE OF INVESTMENTS (Continued)
September 30, 2021
| Principal | | | | | | | Coupon Rate | | | | | | |
| Amount ($) | | | | | Loan Type | | (%) | | Maturity | | | Fair Value | |
| | | | | LOANS — 93.9% (Continued) | | | | | | | | | | | | |
| | | | | MORTGAGE LOANS (PRIVATE) — 93.9% (Continued) |
| | 53,667 | | | Loan ID 201703 | | Fixed | | 6.6000 | | | 12/01/48 | | | $ | 54,741 | |
| | 177,622 | | | Loan ID 201707 | | Fixed | | 4.8750 | | | 08/01/49 | | | | 177,392 | |
| | 203,973 | | | Loan ID 201709 | | Fixed | | 5.3250 | | | 09/01/49 | | | | 205,185 | |
| | 146,189 | | | Loan ID 201710 | | Fixed | | 6.7000 | | | 11/01/49 | | | | 153,498 | |
| | 720,051 | | | Loan ID 201711 | | Fixed | | 4.8750 | | | 10/01/49 | | | | 719,354 | |
| | 183,604 | | | Loan ID 201713 | | Fixed | | 10.1110 | | | 12/01/49 | | | | 174,424 | |
| | 111,083 | | | Loan ID 201715 | | Fixed | | 10.1300 | | | 12/01/49 | | | | 113,305 | |
| | 236,189 | | | Loan ID 201716 | | Fixed | | 10.1500 | | | 12/01/49 | | | | 240,913 | |
| | 433,412 | | | Loan ID 201717 | | Fixed | | 6.5000 | | | 12/01/48 | | | | 442,080 | |
| | 116,207 | | | Loan ID 201719 | | Fixed | | 4.7500 | | | 09/01/49 | | | | 116,207 | |
| | 136,579 | | | Loan ID 201720 | | Fixed | | 4.3750 | | | 04/01/49 | | | | 134,689 | |
| | 248,381 | | | Loan ID 201724 | | Fixed | | 5.3750 | | | 01/01/49 | | | | 138,941 | |
| | 76,403 | | | Loan ID 201725 | | Fixed | | 8.4900 | | | 12/01/22 | | | | 72,583 | |
| | 55,011 | | | Loan ID 201726 | | Fixed | | 8.4900 | | | 12/01/22 | | | | 52,261 | |
| | 73,955 | | | Loan ID 201728 | | Fixed | | 9.4900 | | | 01/01/22 | | | | 75,434 | |
| | 127,498 | | | Loan ID 201732 | | Fixed | | 5.1250 | | | 05/01/47 | | | | 127,660 | |
| | 77,813 | | | Loan ID 201733 | | Fixed | | 5.2500 | | | 04/01/44 | | | | 79,369 | |
| | 125,501 | | | Loan ID 201739 | | ARM | | 7.1250 | | | 04/01/48 | | | | 111,981 | |
| | 226,960 | | | Loan ID 201741 | | ARM | | 8.0000 | | | 07/01/48 | | | | 231,500 | |
| | 139,998 | | | Loan ID 201743 | | Fixed | | 5.4990 | | | 09/01/48 | | | | 142,798 | |
| | 291,810 | | | Loan ID 201744 | | Fixed | | 5.6250 | | | 05/01/49 | | | | 291,810 | |
| | 367,574 | | | Loan ID 201746 | | Fixed | | 4.8750 | | | 07/01/49 | | | | 367,673 | |
| | 542,989 | | | Loan ID 201750 | | Fixed | | 6.1250 | | | 04/01/50 | | | | 553,848 | |
| | 1,099,726 | | | Loan ID 201753 | | Fixed | | 4.8750 | | | 04/01/50 | | | | 1,114,223 | |
| | 601,798 | | | Loan ID 201755 | | Fixed | | 5.7500 | | | 03/01/50 | | | | 613,834 | |
| | 249,285 | | | Loan ID 201756 | | Fixed | | 5.0000 | | | 03/01/50 | | | | 252,269 | |
| | 273,435 | | | Loan ID 201757 | | ARM | | 5.1250 | | | 04/01/50 | | | | 277,371 | |
| | 415,886 | | | Loan ID 201758 | | Fixed | | 5.8750 | | | 03/01/50 | | | | 423,455 | |
| | 259,204 | | | Loan ID 201759 | | ARM | | 5.7500 | | | 03/01/50 | | | | 266,387 | |
| | 256,519 | | | Loan ID 201761 | | Fixed | | 6.8750 | | | 02/01/50 | | | | 261,649 | |
| | 423,170 | | | Loan ID 201762 | | Fixed | | 5.9900 | | | 03/01/50 | | | | 431,634 | |
| | 145,196 | | | Loan ID 201763 | | Fixed | | 7.3750 | | | 04/01/50 | | | | 148,100 | |
| | 216,209 | | | Loan ID 201767 | | Fixed | | 5.2500 | | | 07/01/49 | | | | 216,209 | |
| | 188,538 | | | Loan ID 201768 | | Fixed | | 6.7500 | | | 04/01/50 | | | | 192,309 | |
VERTICAL CAPITAL INCOME FUND
SCHEDULE OF INVESTMENTS (Continued)
September 30, 2021
| Principal | | | | | | | Coupon Rate | | | | | | |
| Amount ($) | | | | | Loan Type | | (%) | | Maturity | | | Fair Value | |
| | | | | LOANS — 93.9% (Continued) | | | | | | | | | | | | |
| | | | | MORTGAGE LOANS (PRIVATE) — 93.9% (Continued) |
| | 214,768 | | | Loan ID 201770 | | Fixed | | 9.3750 | | | 04/01/50 | | | $ | 219,064 | |
| | 350,700 | | | Loan ID 201772 | | Fixed | | 8.1250 | | | 03/01/50 | | | | 368,235 | |
| | 753,632 | | | Loan ID 201773 | | ARM | | 5.5000 | | | 06/01/49 | | | | 768,705 | |
| | 710,532 | | | Loan ID 201776 | | Fixed | | 6.6250 | | | 01/01/50 | | | | 724,742 | |
| | 124,912 | | | Loan ID 201777 | | Fixed | | 5.8750 | | | 04/01/49 | | | | 127,411 | |
| | 250,000 | | | Loan ID 201779 | | Fixed | | 10.5000 | | | 07/01/22 | | | | 255,000 | |
| | 442,725 | | | Loan ID 201780 | | Fixed | | 6.1250 | | | 04/01/50 | | | | 450,056 | |
| | 124,600 | | | Loan ID 201783 | | Interest Only | | 7.5000 | | | 09/01/25 | | | | 129,073 | |
| | 307,079 | | | Loan ID 201784 | | Fixed | | 6.7500 | | | 04/01/50 | | | | 322,433 | |
| | 273,000 | | | Loan ID 201785 | | Interest Only | | 8.0000 | | | 08/31/23 | | | | 286,650 | |
| | 935,000 | | | Loan ID 201787 | | ARM | | 6.3460 | | | 03/01/60 | | | | 953,700 | |
| | 253,485 | | | Loan ID 201795 | | Interest Only | | 7.5000 | | | 10/31/25 | | | | 266,159 | |
| | 247,000 | | | Loan ID 201797 | | Fixed | | 10.9900 | | | 12/01/21 | | | | 247,000 | |
| | 752,300 | | | Loan ID 201800 | | Interest Only | | 7.5000 | | | 12/31/23 | | | | 739,746 | |
| | 36,152 | | | Loan ID 201802 | | Fixed | | 4.2500 | | | 10/01/29 | | | | 33,944 | |
| | 26,450 | | | Loan ID 201803 | | Fixed | | 7.0500 | | | 09/01/34 | | | | 26,979 | |
| | 174,777 | | | Loan ID 201804 | | Fixed | | 4.0000 | | | 03/01/58 | | | | 175,825 | |
| | 109,410 | | | Loan ID 201805 | | Fixed | | 4.3750 | | | 08/01/59 | | | | 111,342 | |
| | 27,848 | | | Loan ID 201806 | | DSI | | 9.0000 | | | 06/01/26 | | | | 28,405 | |
| | 72,101 | | | Loan ID 201807 | | Fixed | | 5.0000 | | | 08/01/43 | | | | 64,962 | |
| | 119,383 | | | Loan ID 201808 | | Fixed | | 3.8750 | | | 06/01/60 | | | | 119,319 | |
| | 164,554 | | | Loan ID 201809 | | Fixed | | 3.7500 | | | 11/01/59 | | | | 161,272 | |
| | 75,137 | | | Loan ID 201810 | | Fixed | | 3.7500 | | | 02/01/42 | | | | 73,927 | |
| | 62,120 | | | Loan ID 201811 | | DSI | | 11.8300 | | | 05/01/35 | | | | 63,362 | |
| | 32,160 | | | Loan ID 201812 | | Fixed | | 9.2400 | | | 02/01/27 | | | | 32,803 | |
| | 75,885 | | | Loan ID 201813 | | DSI | | 6.0000 | | | 01/01/39 | | | | 55,405 | |
| | 49,550 | | | Loan ID 201814 | | DSI | | 7.7400 | | | 03/01/33 | | | | 50,541 | |
| | 67,273 | | | Loan ID 201815 | | Fixed | | 8.0000 | | | 09/01/33 | | | | 68,619 | |
| | 51,896 | | | Loan ID 201816 | | Fixed | | 4.6250 | | | 04/01/29 | | | | 49,301 | |
| | 98,437 | | | Loan ID 201817 | | Fixed | | 4.1250 | | | 10/01/34 | | | | 98,576 | |
| | 57,205 | | | Loan ID 201818 | | Fixed | | 10.3900 | | | 12/01/41 | | | | 58,349 | |
| | 54,618 | | | Loan ID 201819 | | Fixed | | 3.8750 | | | 11/01/29 | | | | 54,627 | |
| | 94,726 | | | Loan ID 201820 | | Fixed | | 3.7500 | | | 01/01/60 | | | | 94,121 | |
| | 67,267 | | | Loan ID 201821 | | Fixed | | 6.4500 | | | 05/01/30 | | | | 68,613 | |
VERTICAL CAPITAL INCOME FUND
SCHEDULE OF INVESTMENTS (Continued)
September 30, 2021
| Principal | | | | | | | Coupon Rate | | | | | | |
| Amount ($) | | | | | Loan Type | | (%) | | Maturity | | | Fair Value | |
| | | | | LOANS — 93.9% (Continued) | | | | | | | | | | | | |
| | | | | MORTGAGE LOANS (PRIVATE) — 93.9% (Continued) |
| | 48,649 | | | Loan ID 201822 | | DSI | | 8.9200 | | | 01/01/36 | | | $ | 45,696 | |
| | 72,775 | | | Loan ID 201823 | | Fixed | | 9.6250 | | | 03/01/40 | | | | 73,820 | |
| | 278,604 | | | Loan ID 201824 | | DSI | | 8.5000 | | | 10/01/37 | | | | 277,322 | |
| | 126,203 | | | Loan ID 201825 | | Fixed | | 3.8750 | | | 03/01/40 | | | | 115,970 | |
| | 62,828 | | | Loan ID 201826 | | Fixed | | 8.4980 | | | 11/01/30 | | | | 64,085 | |
| | 31,131 | | | Loan ID 201827 | | Fixed | | 10.7800 | | | 03/01/26 | | | | 31,753 | |
| | 29,411 | | | Loan ID 201828 | | Fixed | | 8.2490 | | | 10/01/30 | | | | 29,999 | |
| | 111,631 | | | Loan ID 201829 | | DSI | | 10.4600 | | | 08/01/37 | | | | 113,864 | |
| | 33,034 | | | Loan ID 201830 | | DSI | | 10.5550 | | | 10/01/26 | | | | 33,695 | |
| | 62,633 | | | Loan ID 201831 | | DSI | | 11.1100 | | | 02/01/38 | | | | 63,885 | |
| | 53,852 | | | Loan ID 201832 | | Fixed | | 6.2500 | | | 06/01/34 | | | | 41,617 | |
| | 38,088 | | | Loan ID 201833 | | DSI | | 12.6790 | | | 06/01/23 | | | | 38,850 | |
| | 60,835 | | | Loan ID 201834 | | DSI | | 9.1500 | | | 04/01/38 | | | | 62,052 | |
| | 37,829 | | | Loan ID 201835 | | DSI | | 7.5000 | | | 01/01/27 | | | | 38,585 | |
| | 29,250 | | | Loan ID 201836 | | DSI | | 8.8360 | | | 07/01/27 | | | | 29,835 | |
| | 46,391 | | | Loan ID 201837 | | DSI | | 6.9960 | | | 09/01/31 | | | | 47,319 | |
| | 46,394 | | | Loan ID 201838 | | DSI | | 9.0700 | | | 07/01/27 | | | | 47,322 | |
| | 43,442 | | | Loan ID 201839 | | DSI | | 11.1100 | | | 08/01/39 | | | | 44,311 | |
| | 67,521 | | | Loan ID 201840 | | DSI | | 10.8700 | | | 10/01/41 | | | | 68,871 | |
| | 42,079 | | | Loan ID 201841 | | Fixed | | 10.0600 | | | 05/01/25 | | | | 42,920 | |
| | 73,353 | | | Loan ID 201842 | | DSI | | 11.0300 | | | 03/01/28 | | | | 74,820 | |
| | 35,069 | | | Loan ID 201843 | | Fixed | | 9.1800 | | | 08/01/31 | | | | 35,771 | |
| | 48,441 | | | Loan ID 201844 | | DSI | | 11.4900 | | | 11/01/28 | | | | 49,410 | |
| | 21,497 | | | Loan ID 201845 | | DSI | | 7.0000 | | | 02/01/24 | | | | 21,927 | |
| | 42,777 | | | Loan ID 201846 | | Fixed | | 8.4960 | | | 05/01/34 | | | | 43,633 | |
| | 127,408 | | | Loan ID 201847 | | Fixed | | 2.3750 | | | 06/01/33 | | | | 115,711 | |
| | 54,776 | | | Loan ID 201848 | | DSI | | 4.2900 | | | 11/01/32 | | | | 55,872 | |
| | 52,125 | | | Loan ID 201849 | | DSI | | 4.4800 | | | 06/01/35 | | | | 53,167 | |
| | 93,944 | | | Loan ID 201850 | | Fixed | | 4.6250 | | | 10/01/42 | | | | 94,617 | |
| | 124,298 | | | Loan ID 201851 | | DSI | | 4.5000 | | | 08/30/23 | | | | 126,784 | |
| | 95,923 | | | Loan ID 201853 | | DSI | | 4.9100 | | | 02/01/34 | | | | 97,842 | |
| | 85,998 | | | Loan ID 201855 | | DSI | | 4.3900 | | | 07/01/36 | | | | 87,718 | |
| | 46,194 | | | Loan ID 201856 | | Fixed | | 7.9000 | | | 06/01/37 | | | | 41,302 | |
| | 51,835 | | | Loan ID 201857 | | Fixed | | 3.2500 | | | 04/01/35 | | | | 42,985 | |
VERTICAL CAPITAL INCOME FUND
SCHEDULE OF INVESTMENTS (Continued)
September 30, 2021
| Principal | | | | | | | Coupon Rate | | | | | | |
| Amount ($) | | | | | Loan Type | | (%) | | Maturity | | | Fair Value | |
| | | | | LOANS — 93.9% (Continued) | | | | | | | | | | | | |
| | | | | MORTGAGE LOANS (PRIVATE) — 93.9% (Continued) |
| | 368,606 | | | Loan ID 201858 | | Fixed | | 4.6250 | | | 02/01/59 | | | $ | 375,978 | |
| | 592,500 | | | Loan ID 201859 | | Interest Only | | 7.5000 | | | 12/31/25 | | | | 604,350 | |
| | 123,867 | | | Loan ID 201861 | | Fixed | | 5.0000 | | | 05/01/40 | | | | 123,867 | |
| | 22,916 | | | Loan ID 201862 | | DSI | | 10.0000 | | | 05/01/27 | | | | 23,375 | |
| | 21,273 | | | Loan ID 201864 | | DSI | | 7.0560 | | | 01/01/35 | | | | 21,699 | |
| | 28,236 | | | Loan ID 201865 | | Fixed | | 6.4990 | | | 01/01/32 | | | | 28,801 | |
| | 52,575 | | | Loan ID 201866 | | Fixed | | 4.8750 | | | 01/01/44 | | | | 53,175 | |
| | 34,371 | | | Loan ID 201867 | | DSI | | 4.2300 | | | 12/01/32 | | | | 33,734 | |
| | 55,468 | | | Loan ID 201868 | | DSI | | 7.5360 | | | 09/01/34 | | | | 52,695 | |
| | 18,611 | | | Loan ID 201869 | | DSI | | 8.3900 | | | 07/01/24 | | | | 18,983 | |
| | 15,264 | | | Loan ID 201870 | | DSI | | 9.4800 | | | 02/01/23 | | | | 15,569 | |
| | 9,467 | | | Loan ID 201871 | | Fixed | | 9.9700 | | | 05/01/26 | | | | 9,656 | |
| | 34,703 | | | Loan ID 201872 | | DSI | | 8.1000 | | | 09/01/38 | | | | 35,397 | |
| | 17,235 | | | Loan ID 201873 | | Fixed | | 6.6480 | | | 02/01/27 | | | | 17,580 | |
| | 25,272 | | | Loan ID 201874 | | DSI | | 10.5400 | | | 05/01/27 | | | | 25,778 | |
| | 9,489 | | | Loan ID 201875 | | Fixed | | 10.9800 | | | 06/01/30 | | | | 9,679 | |
| | 15,667 | | | Loan ID 201876 | | Fixed | | 8.3100 | | | 02/01/27 | | | | 15,980 | |
| | 7,672 | | | Loan ID 201877 | | DSI | | 9.8300 | | | 11/01/28 | | | | 7,825 | |
| | 27,132 | | | Loan ID 201878 | | DSI | | 9.0500 | | | 08/01/24 | | | | 27,675 | |
| | 12,872 | | | Loan ID 201879 | | Fixed | | 9.3100 | | | 10/01/26 | | | | 13,130 | |
| | 21,434 | | | Loan ID 201881 | | DSI | | 4.5900 | | | 05/01/26 | | | | 21,343 | |
| | 11,151 | | | Loan ID 201882 | | Fixed | | 8.3100 | | | 04/01/27 | | | | 11,374 | |
| | 29,352 | | | Loan ID 201883 | | Fixed | | 4.6250 | | | 06/01/33 | | | | 29,575 | |
| | 9,545 | | | Loan ID 201884 | | DSI | | 11.3890 | | | 02/01/22 | | | | 9,736 | |
| | 21,532 | | | Loan ID 201885 | | Fixed | | 5.0000 | | | 05/01/34 | | | | 21,963 | |
| | 6,114 | | | Loan ID 201886 | | Fixed | | 10.6080 | | | 12/01/22 | | | | 6,236 | |
| | 41,975 | | | Loan ID 201887 | | Fixed | | 6.2500 | | | 01/01/42 | | | | 42,815 | |
| | 20,430 | | | Loan ID 201889 | | DSI | | 9.4990 | | | 02/01/39 | | | | 20,839 | |
| | 9,370 | | | Loan ID 201890 | | Fixed | | 4.5000 | | | 11/01/25 | | | | 9,422 | |
| | 17,466 | | | Loan ID 201891 | | Fixed | | 10.2900 | | | 07/01/26 | | | | 17,815 | |
| | 15,121 | | | Loan ID 201892 | | DSI | | 9.9600 | | | 06/01/23 | | | | 15,424 | |
| | 31,794 | | | Loan ID 201893 | | DSI | | 5.0400 | | | 06/01/26 | | | | 32,421 | |
| | 13,421 | | | Loan ID 201895 | | Fixed | | 9.6900 | | | 05/01/26 | | | | 13,689 | |
| | 8,225 | | | Loan ID 201896 | | Fixed | | 9.6800 | | | 09/01/25 | | | | 8,389 | |
VERTICAL CAPITAL INCOME FUND
SCHEDULE OF INVESTMENTS (Continued)
September 30, 2021
| Principal | | | | | | | Coupon Rate | | | | | | |
| Amount ($) | | | | | Loan Type | | (%) | | Maturity | | | Fair Value | |
| | | | | LOANS — 93.9% (Continued) | | | | | | | | | | | | |
| | | | | MORTGAGE LOANS (PRIVATE) — 93.9% (Continued) |
| | 18,550 | | | Loan ID 201897 | | Fixed | | 8.2800 | | | 03/01/27 | | | $ | 18,921 | |
| | 13,992 | | | Loan ID 201898 | | Fixed | | 10.3120 | | | 10/01/26 | | | | 14,271 | |
| | 17,460 | | | Loan ID 201899 | | DSI | | 10.5000 | | | 10/01/24 | | | | 17,809 | |
| | 15,121 | | | Loan ID 201900(a) | | DSI | | 12.1320 | | | 01/29/19 | | | | 14,365 | |
| | 20,906 | | | Loan ID 201901 | | DSI | | 8.7360 | | | 09/01/28 | | | | 19,861 | |
| | 16,496 | | | Loan ID 201902 | | Fixed | | 10.5480 | | | 10/01/26 | | | | 16,826 | |
| | 16,937 | | | Loan ID 201904 | | DSI | | 10.1900 | | | 08/01/29 | | | | 17,275 | |
| | 10,318 | | | Loan ID 201905 | | DSI | | 10.8900 | | | 01/01/24 | | | | 10,525 | |
| | 17,694 | | | Loan ID 201906 | | DSI | | 10.2100 | | | 07/01/23 | | | | 18,048 | |
| | 71,333 | | | Loan ID 201907 | | Fixed | | 9.8540 | | | 09/01/30 | | | | 67,766 | |
| | 25,237 | | | Loan ID 201908 | | DSI | | 11.6160 | | | 09/01/27 | | | | 25,742 | |
| | 53,847 | | | Loan ID 201909 | | DSI | | 9.2400 | | | 07/01/33 | | | | 54,924 | |
| | 11,506 | | | Loan ID 201910 | | DSI | | 6.0000 | | | 07/01/26 | | | | 11,736 | |
| | 16,544 | | | Loan ID 201911 | | DSI | | 7.9990 | | | 07/01/31 | | | | 16,875 | |
| | 38,821 | | | Loan ID 201912 | | Fixed | | 7.7500 | | | 08/01/34 | | | | 36,880 | |
| | 7,856 | | | Loan ID 201913 | | Fixed | | 9.3100 | | | 11/01/26 | | | | 8,013 | |
| | 25,475 | | | Loan ID 201914 | | DSI | | 9.3260 | | | 08/01/26 | | | | 25,984 | |
| | 5,053 | | | Loan ID 201915 | | Fixed | | 3.7500 | | | 07/01/25 | | | | 4,882 | |
| | 94,300 | | | Loan ID 201916 | | Fixed | | 3.7500 | | | 05/01/38 | | | | 93,323 | |
| | 101,214 | | | Loan ID 201923 | | Fixed | | 10.9900 | | | 03/01/26 | | | | 103,238 | |
| | 221,300 | | | Loan ID 201924 | | Interest Only | | 7.5000 | | | 02/28/26 | | | | 232,365 | |
| | 345,000 | | | Loan ID 201925 | | Interest Only | | 7.0000 | | | 02/29/24 | | | | 298,394 | |
| | 187,946 | | | Loan ID 201926 | | Fixed | | 11.9900 | | | 03/01/22 | | | | 191,705 | |
| | 302,906 | | | Loan ID 201927 | | Fixed | | 8.9900 | | | 04/01/51 | | | | 308,964 | |
| | 1,610,000 | | | Loan ID 201928 | | ARM | | 7.8750 | | | 04/01/50 | | | | 1,642,200 | |
| | 393,750 | | | Loan ID 201929 | | Fixed | | 8.9900 | | | 04/01/23 | | | | 401,625 | |
| | 297,970 | | | Loan ID 201930 | | Fixed | | 8.9900 | | | 04/01/51 | | | | 303,929 | |
| | 283,500 | | | Loan ID 201933 | | Interest Only | | 7.5000 | | | 04/30/26 | | | | 297,675 | |
| | 305,000 | | | Loan ID 201934 | | Fixed | | 9.0000 | | | 05/01/22 | | | | 305,000 | |
| | 239,613 | | | Loan ID 201935 | | Fixed | | 10.5000 | | | 05/01/26 | | | | 244,406 | |
| | 164,635 | | | Loan ID 201936 | | Fixed | | 8.9900 | | | 05/01/51 | | | | 167,927 | |
| | 360,000 | | | Loan ID 201937 | | Interest Only | | 7.0000 | | | 04/30/24 | | | | 367,200 | |
| | 471,081 | | | Loan ID 201938 | | Fixed | | 7.4900 | | | 05/01/51 | | | | 480,503 | |
| | 2,792,726 | | | Loan ID 201939 | | Fixed | | 6.7500 | | | 05/01/51 | | | | 2,525,425 | |
VERTICAL CAPITAL INCOME FUND
SCHEDULE OF INVESTMENTS (Continued)
September 30, 2021
| Principal | | | | | | | Coupon Rate | | | | | | |
| Amount ($) | | | | | Loan Type | | (%) | | Maturity | | | Fair Value | |
| | | | | LOANS — 93.9% (Continued) | | | | | | | | | | | | |
| | | | | MORTGAGE LOANS (PRIVATE) — 93.9% (Continued) |
| | 69,298 | | | Loan ID 201940 | | Fixed | | 5.2500 | | | 06/20/50 | | | $ | 69,080 | |
| | 242,085 | | | Loan ID 201941 | | Fixed | | 5.1250 | | | 12/01/48 | | | | 170,126 | |
| | 124,114 | | | Loan ID 201942 | | Fixed | | 5.0000 | | | 06/01/50 | | | | 124,108 | |
| | 100,604 | | | Loan ID 201943 | | Interest Only | | 7.0000 | | | 05/31/24 | | | | 102,616 | |
| | 196,000 | | | Loan ID 201944 | | Interest Only | | 8.0000 | | | 05/31/24 | | | | 205,800 | |
| | 170,000 | | | Loan ID 201945 | | Fixed | | 8.9900 | | | 06/01/22 | | | | 170,000 | |
| | 219,000 | | | Loan ID 201946 | | Fixed | | 9.9900 | | | 05/01/22 | | | | 219,000 | |
| | 352,284 | | | Loan ID 201947 | | Fixed | | 7.2500 | | | 12/01/37 | | | | 355,706 | |
| | 141,343 | | | Loan ID 201948 | | Fixed | | 4.2500 | | | 06/01/34 | | | | 140,378 | |
| | 87,240 | | | Loan ID 201949 | | Fixed | | 5.5000 | | | 03/01/24 | | | | 82,878 | |
| | 181,809 | | | Loan ID 201950 | | Fixed | | 6.5000 | | | 10/01/26 | | | | 171,868 | |
| | 11,740 | | | Loan ID 201951 | | Fixed | | 7.2500 | | | 03/01/24 | | | | 11,153 | |
| | 11,417 | | | Loan ID 201952 | | Fixed | | 7.2500 | | | 03/01/24 | | | | 10,846 | |
| | 11,846 | | | Loan ID 201953 | | Fixed | | 6.5000 | | | 03/01/24 | | | | 11,254 | |
| | 30,284 | | | Loan ID 201954 | | Fixed | | 6.7500 | | | 03/01/24 | | | | 28,769 | |
| | 208,200 | | | Loan ID 201955 | | Fixed | | 7.7500 | | | 03/01/51 | | | | 202,340 | |
| | 318,754 | | | Loan ID 201956 | | Fixed | | 8.2500 | | | 03/01/51 | | | | 298,492 | |
| | 404,989 | | | Loan ID 201957 | | Fixed | | 8.9900 | | | 06/01/26 | | | | 320,529 | |
| | 150,000 | | | Loan ID 201958 | | Fixed | | 8.9900 | | | 05/01/23 | | | | 153,000 | |
| | 499,173 | | | Loan ID 201959 | | Fixed | | 8.9900 | | | 06/01/31 | | | | 509,156 | |
| | 222,000 | | | Loan ID 201960 | | Interest Only | | 7.5000 | | | 05/31/26 | | | | 232,899 | |
| | 157,500 | | | Loan ID 201961 | | Interest Only | | 7.0000 | | | 05/31/23 | | | | 165,375 | |
| | 230,441 | | | Loan ID 201962 | | Fixed | | 9.9900 | | | 06/01/26 | | | | 235,049 | |
| | 85,697 | | | Loan ID 201963 | | Fixed | | 10.4900 | | | 06/01/26 | | | | 87,411 | |
| | 213,014 | | | Loan ID 201965 | | Fixed | | 8.0000 | | | 05/01/38 | | | | 202,363 | |
| | 380,819 | | | Loan ID 201966 | | Fixed | | 7.0000 | | | 01/01/27 | | | | 361,778 | |
| | 91,705 | | | Loan ID 201967 | | Fixed | | 7.0000 | | | 03/01/43 | | | | 78,477 | |
| | 254,304 | | | Loan ID 201968 | | Fixed | | 6.0000 | | | 03/01/43 | | | | 259,391 | |
| | 302,013 | | | Loan ID 201969 | | Fixed | | 8.2500 | | | 04/01/51 | | | | 306,543 | |
| | 174,000 | | | Loan ID 201971 | | Fixed | | 9.4900 | | | 07/01/23 | | | | 177,480 | |
| | 153,666 | | | Loan ID 201972 | | Fixed | | 8.9900 | | | 07/01/26 | | | | 156,739 | |
| | 204,775 | | | Loan ID 201973 | | Fixed | | 8.9900 | | | 07/01/31 | | | | 208,870 | |
| | 168,000 | | | Loan ID 201974 | | Interest Only | | 8.0000 | | | 06/30/24 | | | | 176,400 | |
| | 79,871 | | | Loan ID 201976 | | Fixed | | 9.4900 | | | 07/01/31 | | | | 81,468 | |
VERTICAL CAPITAL INCOME FUND
SCHEDULE OF INVESTMENTS (Continued)
September 30, 2021
| Principal | | | | | | | Coupon Rate | | | | | | |
| Amount ($) | | | | | Loan Type | | (%) | | Maturity | | | Fair Value | |
| | | | | LOANS — 93.9% (Continued) | | | | | | | | | | | | |
| | | | | MORTGAGE LOANS (PRIVATE) — 93.9% (Continued) |
| | 148,060 | | | Loan ID 201977 | | Fixed | | 8.7500 | | | 06/01/51 | | | $ | 129,849 | |
| | 156,750 | | | Loan ID 201978 | | Fixed | | 9.9900 | | | 08/01/23 | | | | 159,885 | |
| | 240,000 | | | Loan ID 201979 | | Fixed | | 10.9900 | | | 08/01/22 | | | | 240,000 | |
| | 187,925 | | | Loan ID 201980 | | Fixed | | 10.5000 | | | 08/01/26 | | | | 191,684 | |
| | 244,375 | | | Loan ID 201981 | | Fixed | | 9.9900 | | | 08/01/22 | | | | 244,375 | |
| | 198,750 | | | Loan ID 201982 | | Fixed | | 8.9900 | | | 08/01/22 | | | | 198,750 | |
| | 304,865 | | | Loan ID 201983 | | Fixed | | 9.9900 | | | 08/01/26 | | | | 310,962 | |
| | 162,411 | | | Loan ID 201984 | | Fixed | | 8.9900 | | | 08/01/26 | | | | 165,659 | |
| | 496,000 | | | Loan ID 201985 | | Interest Only | | 9.0000 | | | 07/31/24 | | | | 505,920 | |
| | 222,000 | | | Loan ID 201986 | | Interest Only | | 7.5000 | | | 06/30/26 | | | | 233,100 | |
| | 146,300 | | | Loan ID 201987 | | Interest Only | | 7.5000 | | | 06/30/26 | | | | 153,615 | |
| | 142,500 | | | Loan ID 201988 | | Interest Only | | 7.0000 | | | 07/31/24 | | | | 149,625 | |
| | 176,000 | | | Loan ID 201989 | | Fixed | | 9.5000 | | | 09/01/22 | | | | 176,000 | |
| | 202,389 | | | Loan ID 201990 | | Fixed | | 8.9900 | | | 08/01/51 | | | | 206,437 | |
| | 249,863 | | | Loan ID 201991 | | Fixed | | 8.9900 | | | 08/01/31 | | | | 254,860 | |
| | 296,119 | | | Loan ID 201992 | | Fixed | | 9.9900 | | | 08/01/26 | | | | 302,041 | |
| | 161,162 | | | Loan ID 201993 | | Fixed | | 8.9900 | | | 08/01/31 | | | | 164,385 | |
| | 198,750 | | | Loan ID 201994 | | Fixed | | 9.9900 | | | 09/01/24 | | | | 202,725 | |
| | 161,250 | | | Loan ID 201995 | | Fixed | | 8.9900 | | | 09/01/22 | | | | 164,475 | |
| | 311,250 | | | Loan ID 201996 | | Fixed | | 8.9900 | | | 09/01/23 | | | | 317,475 | |
| | 225,000 | | | Loan ID 201997 | | Fixed | | 9.0000 | | | 09/01/23 | | | | 229,500 | |
| | 138,750 | | | Loan ID 201998 | | Fixed | | 8.9900 | | | 09/01/22 | | | | 138,750 | |
| | 1,034,500 | | | Loan ID 201999 | | Interest Only | | 7.5000 | | | 08/31/26 | | | | 839,445 | |
| | 198,800 | | | Loan ID 202000 | | Interest Only | | 7.0000 | | | 08/31/24 | | | | 208,740 | |
| | 360,000 | | | Loan ID 202001 | | Interest Only | | 7.5000 | | | 08/31/26 | | | | 304,195 | |
| | 122,500 | | | Loan ID 202002 | | Interest Only | | 7.0000 | | | 08/31/24 | | | | 128,625 | |
| | 153,000 | | | Loan ID 202003 | | Interest Only | | 7.0000 | | | 08/31/24 | | | | 160,650 | |
| | 472,000 | | | Loan ID 202004 | | Fixed | | 8.2500 | | | 09/01/24 | | | | 481,440 | |
| | 84,500 | | | Loan ID 202005 | | Fixed | | 9.9900 | | | 09/01/36 | | | | 86,190 | |
VERTICAL CAPITAL INCOME FUND
SCHEDULE OF INVESTMENTS (Continued)
September 30, 2021
| Principal | | | | | | | Coupon Rate | | | | | |
| Amount ($) | | | | | Loan Type | | (%) | | Maturity | | Fair Value | |
| | | | | LOANS — 93.9% (Continued) | | | | |
| | | | | MORTGAGE LOANS (PRIVATE) — 93.9% (Continued) | | | | |
| | | | | TOTAL LOANS (Cost $102,731,279) | | $ | 113,855,799 | |
| | | | | | | | | | | | | | | |
| | | | | OTHER INVESTMENTS(b) (Cost $177,074) – 0.1% | | | 160,749 | |
| | | | | | | | | | | | | | | |
| | | | | TOTAL INVESTMENTS – 94.0% (Cost $102,908,353) | | $ | 114,016,548 | |
| | | | | OTHER ASSETS IN EXCESS OF LIABILITIES - 6.0% | | | 7,307,380 | |
| | | | | NET ASSETS - 100.0% | | $ | 121,323,928 | |
| ARM | - Adjustable Rate Mortgage |
| DSI | - Daily Simple Interest |
| (a) | Loan is in loss mitigation, which means the Fund is restructuring the loan with the delinquent borrower. |
| (b) | Illiquid Securities, non-income producing defaulted securities. |
See accompanying notes which are an integral part of these financial statements.
| Vertical Capital Income Fund |
| STATEMENT OF ASSETS AND LIABILITIES |
| September 30, 2021 |
| Assets: | | | | |
| Investments in Securities at Market Value (identified cost $102,908,353) | | $ | 114,016,548 | |
| Cash | | | 4,628,425 | |
| Receivable for Investment Securities Sold and Principal Paydowns | | | 3,148,317 | |
| Interest Receivable | | | 1,357,624 | |
| Prepaid Expenses and Other Assets | | | 457,723 | |
| Total Assets | | | 123,608,637 | |
| | | | | |
| Liabilities: | | | | |
| Line of Credit | | | 1,923,022 | |
| Accrued Advisory Fees | | | 133,462 | |
| Related Party Payable | | | 16,975 | |
| Payable for Securities Purchased | | | 1,786 | |
| Accrued Expenses and Other Liabilities | | | 209,464 | |
| Total Liabilities | | | 2,284,709 | |
| | | | | |
| Net Assets | | $ | 121,323,928 | |
| | | | | |
| Net Assets consisted of: | | | | |
| Paid-in-Capital | | $ | 108,668,945 | |
| Accumulated Earnings | | | 12,654,983 | |
| Net Assets | | $ | 121,323,928 | |
| | | | | |
| Net Asset Value Per Share | | | | |
| Net Assets | | $ | 121,323,928 | |
| Shares of Beneficial Interest Outstanding (no par value) | | | 10,380,003 | |
| Net Asset Value (Net Assets/Shares Outstanding) | | $ | 11.69 | |
| | | | | |
The accompanying notes are an integral part of these financial statements.
| Vertical Capital Income Fund |
| STATEMENT OF OPERATIONS |
| For the Year Ended September 30, 2021 |
| Investment Income: | | | | |
| Interest Income | | $ | 7,935,400 | |
| Total Investment Income | | | 7,935,400 | |
| | | | | |
| Expenses: | | | | |
| Investment Advisory Fees | | | 1,541,131 | |
| Security Servicing Fees | | | 492,998 | |
| Interest Expense | | | 451,349 | |
| Insurance Expense | | | 255,411 | |
| Audit Fees | | | 176,946 | |
| Administration Fees | | | 146,323 | |
| Trustees’ Fees | | | 145,281 | |
| Legal Fees | | | 130,650 | |
| Transfer Agent Fees | | | 81,595 | |
| Custody Fees | | | 66,791 | |
| Chief Compliance Officer Fees | | | 56,175 | |
| Fund Accounting Fees | | | 51,186 | |
| Security Pricing Expense | | | 35,997 | |
| Printing Expense | | | 23,986 | |
| Line of Credit Fees | | | 14,841 | |
| Miscellaneous Expenses | | | 84,353 | |
| Total Expenses | | | 3,755,013 | |
| Less: Expenses Waived by Adviser | | | (203,867 | ) |
| Net Expenses | | | 3,551,146 | |
| Net Investment Income | | | 4,384,254 | |
| | | | | |
| Net Realized and Unrealized Gain/Loss on Investments: | | | | |
| Net Realized Gain from: | | | | |
| Investments | | | 5,719,044 | |
| Net Change in Unrealized Depreciation on: | | | | |
| Investments | | | (2,319,580 | ) |
| Net Realized and Unrealized Gain on Investments | | | 3,399,464 | |
| | | | | |
| Net Increase in Net Assets Resulting From Operations | | $ | 7,783,718 | |
| | | | | |
The accompanying notes are an integral part of these financial statements.
| Vertical Capital Income Fund |
| STATEMENT OF CHANGES IN NET ASSETS |
| | | For the Year | | | For the Year | |
| | | Ended | | | Ended | |
| | | September 30, 2021 | | | September 30, 2020 | |
| Operations: | | | | | | | | |
| Net Investment Income | | $ | 4,384,254 | | | $ | 3,761,422 | |
| Net Realized Gain from Investments | | | 5,719,044 | | | | 2,487,468 | |
| Net Change in Unrealized Depreciation on Investments | | | (2,319,580 | ) | | | (7,717,790 | ) |
| Net Increase/Decrease in Net Assets Resulting From Operations | | | 7,783,718 | | | | (1,468,900 | ) |
| | | | | | | | | |
| Distributions to Shareholders From: | | | | | | | | |
| Total Distributions Paid | | | (11,494,103 | ) | | | (5,441,643 | ) |
| Total Distributions to Shareholders | | | (11,494,103 | ) | | | (5,441,643 | ) |
| | | | | | | | | |
| Beneficial Interest Transactions: | | | | | | | | |
| Proceeds from Shares Issued: | | | — | | | | — | |
| Distributions Reinvested: | | | — | | | | — | |
| Cost of Shares Redeemed: | | | — | | | | — | |
| Net Decrease in Net Assets from Beneficial Interest Transactions | | | — | | | | — | |
| | | | | | | | | |
| Total Decrease in Net Assets | | | (3,710,385 | ) | | | (6,910,543 | ) |
| | | | | | | | | |
| Net Assets: | | | | | | | | |
| Beginning of Period/Year | | | 125,034,313 | | | | 131,944,856 | |
| End of Period/Year | | $ | 121,323,928 | | | $ | 125,034,313 | |
| | | | | | | | | |
| Share Activity | | | | | | | | |
| Shares Sold | | | — | | | | — | |
| Shares Reinvested | | | — | | | | — | |
| Shares Redeemed | | | — | | | | — | |
| Net Decrease in Shares of Beneficial Interest Outstanding | | | — | | | | — | |
| | | | | | | | | |
The accompanying notes are an integral part of these financial statements.
| Vertical Capital Income Fund |
| STATEMENT OF CASH FLOWS |
| For the Year Ended September 30, 2021 |
| Increase in Cash | | | | |
| Cash Flows Provided by (Used for) Operating Activities: | | | | |
| Net Increase in Net Assets Resulting from Operations | | $ | 7,783,718 | |
| | | | | |
| Adjustments to Reconcile Net Increase (Decrease) in Net Assets Resulting from Operations to Net Cash Provided by (Used for) Operating Activities: | | | | |
| Purchases of Long-Term Portfolio Investments | | | (34,437,508 | ) |
| Proceeds from Sale of Long-Term Portfolio Investments and Principal Paydowns | | | 55,573,370 | |
| Decrease in Interest Receivable | | | 127,625 | |
| Decrease in Receivable for Investment Securities Sold and Principal Paydowns | | | 552,347 | |
| Increase in Prepaid Expenses and Other Assets | | | (155,801 | ) |
| Decrease in Payable for Securities Purchased | | | (686,148 | ) |
| Decrease in Accrued Advisory Fees | | | (15,003 | ) |
| Increase in Related Party Payable | | | 981 | |
| Decrease in Accrued Expenses and Other Liabilities | | | (6,426 | ) |
| Amortization of Deferred Financing Fees | | | 14,841 | |
| Net Amortization on Investments | | | (903,530 | ) |
| Net Realized Gain on Investments | | | (5,719,044 | ) |
| Change in Unrealized Depreciation on Investments | | | 2,319,580 | |
| | | | | |
| Net Cash Provided by Operating Activities | | | 24,449,002 | |
| | | | | |
| Cash Flows Provided by (Used for) Financing Activities: | | | | |
| Dividends Paid to Shareholders | | | (11,494,103 | ) |
| Deferred Financing Costs | | | (91,819 | ) |
| Proceeds from Line of Credit | | | 15,500,000 | |
| Payments on Line of Credit | | | (26,500,000 | ) |
| Net Cash Used for Financing Activities | | | (22,585,922 | ) |
| | | | | |
| Net Increase in Cash | | | 1,863,080 | |
| Cash at Beginning of Period | | | 2,765,345 | |
| Cash at End of Period | | $ | 4,628,425 | |
| | | | | |
| Cash Paid for Interest of $451,407 | | | | |
| | | | | |
The accompanying notes are an integral part of these financial statements.
| Vertical Capital Income Fund |
| Financial Highlights |
The table below sets forth financial data for one share of beneficial interest outstanding throughout each year presented.
| | | Year | | | Year | | | Year | | | Year | | | Year | |
| | | Ended | | | Ended | | | Ended | | | Ended | | | Ended | |
| | | September 30, 2021 | | | September 30, 2020 | | | September 30, 2019 | | | September 30, 2018 | | | September 30, 2017 | |
| Net Asset Value, Beginning of Year | | $ | 12.05 | | | $ | 12.71 | | | $ | 12.23 | | | $ | 12.34 | | | $ | 12.49 | |
| From Operations: | | | | | | | | | | | | | | | | | | | | |
| Net investment income (a) | | | 0.42 | | | | 0.36 | | | | 0.30 | | | | 0.43 | | | | 0.39 | |
| Net gain (loss) from investments (both realized and unrealized) | | | 0.33 | | | | (0.50 | ) | | | 0.72 | | | | 0.06 | | | | (0.04 | ) (b) |
| Total from operations | | | 0.75 | | | | (0.14 | ) | | | 1.02 | | | | 0.49 | | | | 0.35 | |
| Distributions to shareholders from: | | | | | | | | | | | | | | | | | | | | |
| Net investment income | | | (0.89 | ) | | | (0.33 | ) | | | (0.34 | ) | | | (0.39 | ) | | | (0.40 | ) |
| Net realized gains | | | (0.22 | ) | | | (0.19 | ) | | | (0.20 | ) | | | (0.21 | ) | | | (0.10 | ) |
| Total distributions | | | (1.11 | ) | | | (0.52 | ) | | | (0.54 | ) | | | (0.60 | ) | | | (0.50 | ) |
| Net Asset Value, End of Year | | $ | 11.69 | | | $ | 12.05 | | | $ | 12.71 | | | $ | 12.23 | | | $ | 12.34 | |
| Market Price, End of Year | | $ | 10.49 | | | $ | 9.93 | | | $ | 10.68 | | | | N/A | | | | N/A | |
| Total Return-NAV (c) | | | 6.52 | % | | | (1.09 | )% | | | 8.62 | % | | | 4.03 | % | | | 2.81 | % |
| Total Return-Market Price (c) | | | 17.59 | % | | | (2.99 | )% | | | (8.73 | )% | | | NA | | | | NA | |
| Ratios/Supplemental Data | | | | | | | | | | | | | | | | | | | | |
| Net assets, end of Year (in 000’s) | | $ | 121,324 | | | $ | 125,034 | | | $ | 131,945 | | | $ | 137,659 | | | $ | 160,630 | |
| Ratio of gross expenses to average net assets (d) | | | 3.05 | % | | | 3.06 | % | | | 3.87 | % (f) | | | 3.03 | % (e) | | | 2.74 | % (e) |
| Ratio of net expenses to average net assets (d) | | | 2.88 | % | | | 2.73 | % | | | 3.34 | % (f) | | | 2.09 | % (e) | | | 2.04 | % (e) |
| Ratio of net investment income to average net assets (d) | | | 3.56 | % | | | 2.95 | % | | | 2.43 | % (f) | | | 3.52 | % (e) | | | 3.24 | % (e) |
| Portfolio turnover rate | | | 14.73 | % | | | 20.13 | % | | | 7.12 | % | | | 5.11 | % | | | 17.69 | % |
| Loan Outstanding, End of Year (000s) | | $ | 1,923 | | | $ | 13,000 | | | $ | 2,355 | | | $ | 6,664 | | | $ | — | |
| Asset Coverage Ratio for Loan Outstanding (g) | | | 6409 | % | | | 1062 | % | | | 5702 | % | | | 2167 | % | | | 0 | % |
| Asset Coverage, per $1,000 Principal Amount of Loan Outstanding (g) | | $ | 64,090 | | | $ | 10,618 | | | $ | 53,778 | | | $ | 20,680 | | | $ | — | |
| Weighted Average Loans Outstanding (000s) (h) | | $ | 10,788 | | | $ | 9,796 | | | $ | 7,500 | | | $ | 4,500 | | | $ | 14,368 | |
| Weighted Average Interest Rate on Loans Outstanding | | | 3.75 | % | | | 3.79 | % | | | 5.14 | % | | | 4.69 | % | | | 3.88 | % |
| (a) | Per share amounts are calculated using the annual average shares method, which more appropriately presents the per share data for the period. |
| (b) | The amount of net gain (loss) on investments (both realized and unrealized) per share does not accord with the amounts reported in the Statement of Operations due to timing of purchases and redemptions of Fund shares. |
| (c) | Total returns are historical in nature and assume changes in share price, reinvestment of dividends and capital gains distributions, if any, and excludes the effect of sales charges. Had the Adviser not waived expenses, total returns would have been lower. |
| (d) | Ratio includes 0.41%, 0.46%, 0.48%, 0.46%, 0.24%, and 0.14% for the years ended September 30, 2021, 2020, 2019, 2018, and 2017, respectively, that attributed to interest expenses and fees. |
| (e) | Ratio includes 0.01%, 0.05% and 0.21% for the years ended September 30, 2018, 2017 and the year ended 2016, respectively, that attributed to advisory transition expenses. |
| (f) | Ratio includes 0.77% for the year ended September 30, 2019 that attributed to reorganization (NYSE listing) expenses and contested proxy expenses. |
| (g) | Represents value of net assets plus the loan outstanding at the end of the period divided by the loan outstanding at the end of the period. |
| (h) | Based on monthly weighted average. |
The accompanying notes are an integral part of these financial statements.
| Vertical Capital Income Fund |
| Notes to Financial Statements |
| September 30, 2021 |
| |
Vertical Capital Income Fund (the “Fund”), was organized as a Delaware statutory trust on April 8, 2011 and is registered under the Investment Company Act of 1940, as amended (the “1940 Act”), as a diversified, closed- end management investment company. The investment objective of the Fund is to seek income. The Fund currently has one class of shares which commenced operations on December 30, 2011. Prior to March 29, 2019, the Fund offered shares at net asset value plus a maximum sales charge of 5.75%. Oakline Advisors, LLC (the “Advisor”), serves as the Fund’s investment adviser.
| 2. | SUMMARY OF SIGNIFICANT ACCOUNTING POLICIES |
The Fund is an investment company and accordingly follows the investment company accounting and reporting guidance of the Financial Accounting Standards Board (“FASB”) Accounting Standards Codification Topic 946 “Financial Services – Investment Companies” including FASB Accounting Standards Update 2013-08. The following is a summary of significant accounting policies and reporting policies used in preparing the financial statements. The accompanying financial statements have been prepared in conformity with accounting principles generally accepted in the United States of America (“GAAP”). The Fund amortizes premiums and discounts using the effective interest rate method. Offering expenses are amortized over 12 months following the time they are incurred.
The preparation of financial statements in conformity with GAAP requires management to make estimates and assumptions that affect the reported amounts of assets and liabilities and disclosure of contingent assets and liabilities at the date of the financial statements and the reported amounts of income and expenses for the period. Actual results could differ from those estimates.
Investment Security Valuation
Mortgage Notes – The Fund uses an independent third-party pricing service, approved by the Fund’s Board of Trustees (the “Board”), to value its Mortgage Notes on an as needed basis. The third-party pricing servicer uses a cash flow forecast and valuation model that focuses on forecasting the frequency, timing and severity of mortgage loss behavior. The model incorporates numerous observable loan-level factors such as unpaid principal balance, remaining term of the loan and coupon rate as well as macroeconomic data including yield curves, spreads to the Treasury curves and home price indexes. The model also includes a number of unobservable factors and assumptions (such as voluntary and involuntary prepayment speeds, delinquency rates, foreclosure timing, and others) to determine a fair value. While the model requires a minimum set of data to develop a reasonable fair value, the model is capable of accepting additional data elements. The model makes certain assumptions unless a specific data element is included, in which case it uses the additional data. Not all assumptions have equal weighting in the model. Using assumptions in this manner is a part of the Fund’s valuation policy and procedures and provides consistency in the application of valuation assumptions. The third-party pricing servicer also benchmarks its pricing model against observable pricing levels being quoted by a range of market participants active in the purchase and sale of residential mortgage loans. The combination of loan level criteria and market adjustments produces a monthly price for each Mortgage Note relative to current public market conditions.
Prior to purchase, each Mortgage Note goes through a due diligence process that includes considerations such as underwriting borrower credit, employment history, property valuation, and delinquency history with an overall emphasis on repayment of the Mortgage Notes. The purchase price of the Mortgage Notes reflects the overall risk relative to the findings of this due diligence process.
The Fund invests primarily in Mortgage Notes secured by residential real estate. The market or liquidation value of each type of residential real estate collateral may be adversely affected by numerous factors, including rising interest rates; changes in the national, state and local economic climate and real estate conditions; perceptions of prospective buyers of the safety, convenience and attractiveness of the properties; maintenance and insurance
| Vertical Capital Income Fund |
| Notes to Financial Statements (Continued) |
| September 30, 2021 |
| |
costs; changes in real estate taxes and other expenses; adverse changes in governmental rules and fiscal policies; adverse changes in zoning laws; natural disasters and other factors beyond the control of the borrowers.
The Fund’s investments in Mortgage Notes are subject to liquidity risk because there is a limited secondary market for Mortgage Notes. Liquidity risk exists when particular investments of the Fund would be difficult to purchase or sell, possibly preventing the Fund from selling such illiquid securities at an advantageous time or price, or possibly requiring the Fund to dispose of other investments at unfavorable times or prices in order to satisfy its obligations. Securities for which current market quotations are not readily available, such as the Mortgage Notes the Fund invests in, or for which quotations are not deemed to be representative of market values are valued at fair value as determined in good faith by or under the direction of the Board in accordance with the Fund’s Portfolio Securities Valuation Procedures (the “Procedures”). The Procedures consider, among others, the following factors to determine a security’s fair value: the nature and pricing history (if any) of the security; whether any dealer quotations for the security are available; and possible valuation methodologies that could be used to determine the fair value of the security.
The valuation inputs and subsequent outputs are reviewed and maintained on a monthly basis. Any calibrations or adjustments to the model that may be necessary are done on an as-needed basis to facilitate fair pricing. Financial markets are monitored relative to the interest rate environment. If other available market data indicates that the pricing data from the third-party service is materially inaccurate, or pricing data is unavailable, the Fund undertakes a review of other available prices and takes additional steps to determine fair value. In all cases, the Fund validates its understanding of methodology and assumptions underlying the fair value used.
The Fund follows guidance in ASC 820, Fair Value Measurement, where fair value is defined as the price that would be received to sell an asset or paid to transfer a liability in an orderly transaction between the market participants at the measurement date. The Fund utilizes various methods to measure the fair value of its investments on a recurring basis. Notwithstanding, the actual sale price of a Mortgage Note will likely be different than its fair value determined under ASC 820. GAAP establishes a hierarchy that prioritizes inputs to valuation methods. ASC 820 classifies the inputs used to measure these fair values into the following hierarchy:
Level 1 – Unadjusted quoted prices in active markets for identical and/or similar assets and liabilities that the Fund has the ability to access at the measurement date.
Level 2 – Other significant observable inputs other than quoted prices included in Level 1 for the asset or liability, either directly or indirectly. These inputs may include quoted prices for similar investments or identical investments in an active market, interest rates, prepayment speeds, credit risk, yield curves, default rates and similar data.
Level 3 – Significant unobservable inputs for the asset or liability, to the extent relevant observable inputs are not available, representing the Fund’s own assumptions about the assumptions a market participant would use in valuing the asset or liability, and would be based on the best information available.
The availability of observable inputs can vary from security to security and is affected by a wide variety of factors, including, for example, the type of security, whether the security is new and not yet established in the marketplace, the liquidity of markets, and other characteristics particular to the security. To the extent that valuation is based on models or inputs that are less observable or unobservable in the market, the determination of fair value requires more judgment. Accordingly, the degree of judgment exercised in determining fair value is greatest for instruments categorized in Level 3.
The inputs used to measure fair value may fall into different levels of the fair value hierarchy. In such cases, for disclosure purposes, the level in the fair value hierarchy within which the fair value measurement falls in its entirety, is determined based on the lowest level input that is significant to the fair value measurement in its entirety.
As of September 30, 2021, management estimated that the carrying value of cash and cash equivalents, accounts receivable, prepaid expenses and other assets, line of credit payable, payables for securities purchased, accrued
| Vertical Capital Income Fund |
| Notes to Financial Statements (Continued) |
| September 30, 2021 |
| |
advisory fees, related party payables, and accrued and other liabilities were at amounts that reasonably approximated their fair value based on their highly-liquid nature and short-term maturities. This is considered a Level 1 valuation technique.
The inputs or methodology used for valuing investments are not necessarily an indication of the risk associated with investing in those investments. The following tables summarize the inputs used as of September 30, 2021 for the Fund’s assets measured at fair value:
| Assets | | Level 1 | | | Level 2 | | | Level 3 | | | Total | |
| Mortgage Notes | | $ | — | | | $ | — | | | $ | 113,855,799 | | | $ | 113,855,799 | |
| Other Investments | | | — | | | | — | | | | 160,749 | | | | 160,749 | |
| Total | | $ | — | | | $ | — | | | $ | 114,016,548 | | | $ | 114,016,548 | |
There were no transfers between levels during the current period presented. It is the Fund’s policy to record transfers into or out of levels at the end of the reporting period.
The following is a reconciliation of assets in which Level 3 inputs were used in determining value:
| | | Mortgage Notes | | | Other Investments | | | Total | |
| Beginning Balance | | $ | 130,311,594 | | | $ | 537,822 | | | $ | 130,849,416 | |
| Net realized gain (loss) | | | 5,708,894 | | | | 10,150 | | | | 5,719,044 | |
| Change in unrealized appreciation | | | (2,413,112 | ) | | | 93,532 | | | | (2,319,580 | ) |
| Cost of purchases | | | 34,437,508 | | | | — | | | | 34,437,508 | |
| Proceeds from sales and principal paydowns | | | (55,469,688 | ) | | | (103,682 | ) | | | (55,573,370 | ) |
| Purchase discount amortization | | | 903,530 | | | | — | | | | 903,530 | |
| Net Transfers within level 3 | | | 377,073 | | | | (377,073 | ) | | | — | |
| Ending balance | | $ | 113,855,799 | | | $ | 160,749 | | | $ | 114,016,548 | |
The total change in unrealized depreciation included in the Statement of Operations attributable to Level 3 investments still held at September 30, 2021 is $2,317,276.
The following table provides quantitative information about the Fund’s Level 3 values, as well as its inputs, as of September 30, 2021. The table is not all-inclusive, but provides information on the significant Level 3 inputs:
| | Value | Valuation Technique | Unobservable
Inputs | Range of
Unobservable
Inputs | Weighted
Average of
Unobservable
Inputs |
| Mortgage Notes | $ | 113,855,799 | Comprehensive
pricing model with
emphasis on
discounted cash
flows | Constant
prepayment rate | 0 - 100.0% | 15.8% |
| | | | | Deliquency | 0 - 1,125 days | 31 days |
| | | | | Loan-to-Value | 3.0 - 667.4% | 83.5% |
| | | | | Discount Rate | 2.0 - 23.2% | 4.8% |
| Other Investments | | 160,749 | Market comparable | Sales prices | $26 - $69 sq/ft | $49.3 sq/ft |
| Closing Balance | $ | 114,016,548 | | | | |
| Vertical Capital Income Fund |
| Notes to Financial Statements (Continued) |
| September 30, 2021 |
| |
A change to the unobservable input may result in a significant change to the value of the investment as follows:
Security Transactions and
Investment Income -
Investment Security | Impact to Value if
Input Increases | Impact to Value if
Input Decreases |
| Constant Prepayment Rate | Increase | Decrease |
| Delinquency | Decrease | Increase |
| Loan to Value | Decrease | Increase |
| Discount rate | Decrease | Increase |
| | | |
Cash and Cash Equivalents – Cash and cash equivalents include cash and overnight investments in interest-bearing demand deposits with a financial institution with maturities of three months or less. The Fund maintains deposits with a high quality financial institution in an amount that is in excess of federally insured limits.
Security Transactions and Investment Income – Investment security transactions are accounted for on a trade date basis. Cost is determined and gains and losses are based upon the specific identification method for both financial statement and federal income tax purposes. Interest income is recorded on the accrual basis. Purchase discounts and premiums on securities are accreted and amortized over the life of the respective securities using the effective interest method.
Interest Income on Non-Accrual Loans – The Fund discontinues the accrual of interest on loans when, in the opinion of management, there is an assessment that the borrower will likely be unable to meet all contractual payments as they become due.
Credit Facility – On July 21, 2021, the Fund entered into an amended and restated revolving line of credit agreement with Nexbank for investment purposes and to help maintain the Fund’s liquidity, subject to the limitations of the 1940 Act for borrowings. The maximum amount of borrowing allowed under the amended and restated agreement was the lesser of $35 million or 75% of the eligible portion of the Fund’s loans. Borrowings under the amended and restated Nexbank agreement bear interest at a rate equal to the Prime Rate plus applicable margin of 0.5%, per annum, on the outstanding principal balance. The Nexbank agreement matures on July 19, 2022 and has two one-year extensions available. The Nexbank agreement is secured by assets of the Fund.
During the year ended September 30, 2021 the Fund incurred deferred financing fees of $91,819. Accumulated amortization of deferred financing fees was $14,841. The average amount of borrowing outstanding for the period was $10,788,462 and the total interest expense was $451,349. The outstanding balance under the NexBank line of credit was $2,000,000 at September 30, 2021.
Federal Income Taxes – The Fund intends to continue to comply with the requirements of Subchapter M of the Internal Revenue Code applicable to regulated investment companies and will distribute all of its taxable income, if any, to shareholders. Accordingly, no provision for Federal income taxes is required in the financial statements.
The Fund recognizes the tax benefits of uncertain tax positions only where the position is “more likely than not” to be sustained assuming examination by tax authorities. Management has analyzed the Fund’s tax positions, and has concluded that no liability for unrecognized tax benefits should be recorded related to uncertain tax positions taken by the Fund in its 2018 - 2020 tax returns, which remain open for examination, or expected to be taken in the Fund’s 2021 tax returns. The Fund identified its major tax jurisdictions as U.S. Federal jurisdictions where the Fund makes significant investments; however, the Fund is not aware of any tax positions for which it is reasonably possible that the total amounts of unrecognized tax benefits will change materially in the next twelve months. The Fund accounts for interest and penalties for any uncertain tax positions as a component of income tax expense. No interest or penalty expense was recorded during the year ended September 30, 2021.
| Vertical Capital Income Fund |
| Notes to Financial Statements (Continued) |
| September 30, 2021 |
| |
Distributions to Shareholders – Distributions from investment income and capital gains, if any, are declared and paid monthly and are recorded on the ex-dividend date. The Board’s decision to declare distributions will be influenced by its obligation to ensure that the Fund maintains its federal tax status as a Registered Investment Company (“RIC”). In order to qualify as a RIC, the Fund must derive a minimum of 90% of its income from capital gains, interest or dividends earned on investments and must distribute a minimum of 90% of its net investment income in the form of interest, dividends or capital gains to its shareholders. Otherwise, the Fund may be subject to an excise tax from the IRS.
The character of income and gains to be distributed is determined in accordance with Federal income tax regulations, which may differ from GAAP. These “book/tax” differences are considered either temporary (i.e., deferred losses, capital loss carry forwards) or permanent in nature. To the extent these differences are permanent in nature, such amounts are reclassified within the composition of net assets based on their federal tax-basis treatment; temporary differences do not require classification.
Indemnification – The Trust indemnifies its officers and Trustees for certain liabilities that may arise from the performance of their duties to the Trust. Additionally, in the normal course of business, the Fund enters into contracts that contain a variety of representations and warranties and which provide general indemnities. The Fund’s maximum exposure under these arrangements is unknown, as this would involve future claims that may be made against the Fund that have not yet occurred. However, management of the Fund expects the risk of loss due to these warranties and indemnities to be remote.
| 3. | INVESTMENT IN RESTRICTED SECURITIES |
The Fund may invest in Restricted Securities (those which cannot be offered for public sale without first being registered under the Securities Act of 1933) that are consistent with the Fund’s investment objectives and investment strategies. Investments in Restricted Securities are valued at fair value as determined in good faith in accordance with procedures adopted by the Board of Trustees. The Fund would typically have no rights to compel the obligor or issuer of a Restricted Security to register such a Restricted Security under the 1933 Act. No such securities were owned by the Fund at September 30, 2021.
| 4. | INVESTMENT ADVISORY AGREEMENT AND TRANSACTIONS WITH RELATED PARTIES |
The business activities of the Fund are overseen by the Board, which is responsible for the overall management of the Fund.
Advisory Fees - Pursuant to an Advisory Agreement with the Fund, the Advisor, under the oversight of the Board, directs certain of the daily operations of the Fund and supervises the performance of administrative and professional services provided by others. As compensation for its services and the related expenses borne by the Advisor, the Fund pays the adviser a management fee, computed and accrued daily and paid monthly, at an annual rate of 1.25% of the average daily net assets of the Fund. For the six months ended September 30, 2021 the Advisor earned advisory fees of $1,541,131.
The Advisor has contractually agreed to waive all or part of its management fees and/or make payments to limit Fund expenses (exclusive of any taxes, leverage interest, brokerage commissions, expenses incurred in connection with any merger or reorganization, expenses of investing in underlying funds, or extraordinary expenses such as litigation and Advisor transition expenses) so that the total annual operating expenses of the Fund do not exceed 2.25% of the average daily net assets through September 30, 2021. This agreement has been extended through September 30, 2022 at 2.50%. Waivers and expense reimbursements may be recouped by the Advisor from the Fund within three years of when the amounts were waived only if the Fund expenses are lower than both the lesser of the current expense cap and the expense cap in place at the time of waiver. For the year ended September 30,
| Vertical Capital Income Fund |
| Notes to Financial Statements (Continued) |
| September 30, 2021 |
| |
2021, the Advisor waived advisory fees of $203,867. Expenses subject to recapture by the Advisor amounted to $692,741 that will expire on September 30, 2022, and $428,908 that will expire on September 30, 2023, and $203,867 that will expire on September 30, 2024.
Effective January 8, 2021, Katherine Hawkins, the Advisor’s Senior Vice President assumed the role of Portfolio Manager. Ms. Hawkins has been with the Advisor for approximately six years and with Behringer, the Advisor’s parent company, for eight years. Ms. Hawkins succeeded Robert J. Chapman in the role of Portfolio Manager. Mr. Chapman retired as Trustee, Chairman of the Board of Trustees, Treasurer, and Portfolio Manager, effective January 8, 2021.
In addition, certain affiliates provide services to the Fund as follows:
Ultimus Fund Solutions, LLC (“UFS”) – UFS provides administration and fund accounting services to the Fund. Pursuant to a separate servicing agreement with UFS, the Fund pays UFS customary fees for providing administration and fund accounting services to the Fund. Certain officers of the Fund are also officers of UFS, and are not paid any fees directly by the Fund for serving in such capacities. For the year ended September 30, 2021 UFS earned $197,509.
Northern Lights Compliance Services, LLC (“NLCS”) – NLCS, an affiliate of UFS, provides a Chief Compliance Officer to the Fund, as well as related compliance services, pursuant to a consulting agreement between NLCS and the Fund. Under the terms of such agreement, NLCS receives customary fees from the Fund. For the year ended September 30, 2021 NLCS earned $56,175.
Blu Giant, LLC (“Blu Giant”) – Blu Giant, an affiliate of UFS, provides EDGAR conversion and filing services as well as print management services for the Fund on an ad-hoc basis. For the provision of these services, Blu Giant receives customary fees from the Fund. For the year ended September 30, 2021 Blu Giant earned $12,920.
Trustees – The Fund pays each Trustee who is not affiliated with the Fund or Advisor a quarterly fee of $5,000 and the lead unaffiliated Trustee a quarterly fee of $10,000. Additionally, each unaffiliated Trustee receives $2,500 per meeting as well as reimbursement for any reasonable expenses incurred attending meetings. The “interested persons” who serve as Trustees of the Fund receive no compensation for their services as Trustees. None of the executive officers receive compensation from the Fund.
| 5. | INVESTMENT TRANSACTIONS |
The cost of purchases and proceeds from sales and paydowns of investment securities, other than U.S. Government securities and short-term investments, for the year ended September 30, 2021 amounted to $34,437,508 and $55,573,370 respectively.
| 6. | DISTRIBUTIONS TO SHAREHOLDERS AND TAX COMPONENTS OF CAPITAL |
The Statement of Assets and Liabilities represents cost for financial reporting purposes. Aggregate cost for federal tax purposes is $102,908,823 and differs from fair value by net unrealized appreciation (depreciation) of securities as follows:
| Unrealized Appreciation | | $ | 13,460,105 | |
| Unrealized Depreciation | | | (2,352,380 | ) |
| Tax Net Unrealized Appreciation | | | 11,107,725 | |
| Vertical Capital Income Fund |
| Notes to Financial Statements (Continued) |
| September 30, 2021 |
| |
The tax character of distributions paid during the fiscal years ended September 30, 2021 and September 30, 2020 was as follows:
| | | Fiscal Year Ended | | | Fiscal Year Ended | |
| | | September 30, 2021 | | | September 30, 2020 | |
| Ordinary Income | | $ | 5,689,472 | | | $ | 3,432,074 | |
| Long-Term Capital Gain | | | 5,804,631 | | | | 2,009,569 | |
| Return of Capital | | | — | | | | — | |
| | | $ | 11,494,103 | | | $ | 5,441,643 | |
| | | | | | | | | |
As of September 30, 2021, the components of accumulated earnings/ (deficit) on a tax basis were as follows:
| Undistributed | | | Undistributed | | | Post October Loss | | | Capital Loss | | | Other | | | Unrealized | | | Total | |
| Ordinary | | | Long-Term | | | and | | | Carry | | | Book/Tax | | | Appreciation/ | | | Accumulated | |
| Income | | | Gains | | | Late Year Loss | | | Forwards | | | Differences | | | (Depreciation) | | | Earnings/(Deficits) | |
| $ | — | | | $ | 1,547,258 | | | $ | — | | | $ | — | | | $ | — | | | $ | 11,107,725 | | | $ | 12,654,983 | |
| | | | | | | | | | | | | | | | | | | | | | | | | | | |
| 7. | MARKET RISK AND CORONAVIRUS |
Unexpected local, regional or global events, such as war; acts of terrorism; financial, political or social disruptions; natural, environmental or man-made disasters; the spread of infectious illnesses or other public health issues; and recessions and depressions could have a significant impact on the Fund and its investments and may impair market liquidity. Such events can cause investor fear, which can adversely affect the economies of nations, regions and the market in general, in ways that cannot necessarily be foreseen. An outbreak of infectious respiratory illness known as COVID-19, which is caused by a novel coronavirus (SARS-CoV-2), was first detected in China in December 2019 and subsequently spread globally. This coronavirus has resulted in, among other things, travel restrictions, closed international borders, enhanced health screenings at ports of entry and elsewhere, disruption of and delays in healthcare service preparation and delivery, prolonged quarantines, significant disruptions to business operations, market closures, cancellations and restrictions, supply chain disruptions, lower consumer demand, and significant volatility and declines in global financial markets, as well as general concern and uncertainty. The impact of COVID-19 has adversely affected, and other infectious illness outbreaks that may arise in the future could adversely affect, the economies of the U.S., many other nations and the entire global economy, as well as individual mortgage note borrowers and capital markets in ways that cannot necessarily be foreseen. Public health crises caused by the COVID-19 outbreak may exacerbate other pre-existing political, social and economic risks in the U.S., certain other countries or globally. The duration of the COVID-19 outbreak and its effects cannot be determined with certainty.
The Fund is required to recognize in the financial statements the effects of all subsequent events that provide additional evidence about conditions that existed at the date of the Statement of Assets and Liabilities. For non-recognized subsequent events that must be disclosed to keep the financial statements from being misleading, the Fund is required to disclose the nature of the event as well as an estimate of its financial effect, or a statement that such an estimate cannot be made. Management has evaluated subsequent events through November 29, 2021, which is the date of these financial statements, and determined that no events or transactions occurred requiring adjustment or disclosure in the financial statements.

| | | |
GRANT THORNTON LLP
1717 Main Street, Suite 1800
Dallas, TX 75201 D +1 214 561 2300
F +1 214 561 2370 | | REPORT OF INDEPENDENT REGISTERED PUBLIC ACCOUNTING FIRM |
| | | Board of Trustees and Shareholders |
| | | Vertical Capital Income Fund |
| | | |
| | | Opinion on the financial statements |
| | | |
| | | We have audited the accompanying statement of assets and liabilities of Vertical Capital Income Fund (the “Fund”), including the schedule of investments, as of September 30, 2021, the related statements of operations and cash flows for the year then ended, the statements of changes in net assets for each of the two years in the period then ended, and the related notes (collectively referred to as the “financial statements”) and the financial highlights for each of the five years in the period then ended. In our opinion, the financial statements and financial highlights present fairly, in all material respects, the financial position of the Fund as of September 30, 2021, and the results of its operations and its cash flows for the year then ended, the changes in net assets for each of the two years in the period then ended, and the financial highlights for each of the five years in the period then ended, in conformity with accounting principles generally accepted in the United States of America. |
| | | |
| | | Basis for opinion |
| | | |
| | | These financial statements and financial highlights are the responsibility of the Fund’s management. Our responsibility is to express an opinion on the Fund’s financial statements and financial highlights based on our audits. We are a public accounting firm registered with the Public Fund Accounting Oversight Board (United States) (“PCAOB”) and are required to be independent with respect to the Fund in accordance with the U.S. federal securities laws and the applicable rules and regulations of the Securities and Exchange Commission and the PCAOB. |
| | | |
| | | We conducted our audits in accordance with the standards of the PCAOB. Those standards require that we plan and perform the audit to obtain reasonable assurance about whether the financial statements and financial highlights are free of material misstatement, whether due to error or fraud. The Fund is not required to have, nor were we engaged to perform, an audit of its internal control over financial reporting. As part of our audits we are required to obtain an understanding of internal control over financial reporting but not for the purpose of expressing an opinion on the effectiveness of the Fund’s internal control over financial reporting. Accordingly, we express no such opinion. |
| | | |
| | | Our audits included performing procedures to assess the risks of material misstatement of the financial statements and financial highlights, whether due to error or fraud, and performing procedures that respond to those risks. Such procedures included examining, on a test basis, evidence supporting the amounts and disclosures in the financial statements and financial highlights. Our procedures included confirmation of securities owned as of September 30, 2021 by correspondence with the custodian and brokers. Our audits also included evaluating |
| | | |
| | | |
| GT.COM | | Grant Thornton LLP is the U.S. member firm of Grant Thornton International Ltd (GTIL). GTIL and each of its member firms are separate legal entities and are not a worldwide partnership. |
| | | the accounting principles used and significant estimates made by management, as well as evaluating the overall presentation of the financial statements and financial highlights. We believe that our audits provide a reasonable basis for our opinion. |
| | | |
| | |  |
| | | |
| | | We have served as the Fund’s auditor since 2017. |
| | | |
| | | Dallas, Texas |
| | | November 29, 2021 |
| Supplemental Information (Unaudited) |
CURRENT INVESTMENT OBJECTIVE, PRINCIPAL INVESTMENT POLICIES AND PRINCIPAL RISKS OF THE FUND
Investment Objective and Policies
The Fund’s investment objective is to seek income. The Fund pursues its investment objective by investing primarily in individual interest income-producing debt securities secured by residential real estate (i.e., mortgage loans made to individual borrowers that are represented by a note (the “security”) and a security agreement in the form of a mortgage or deed of trust). These notes are typically sold individually or in groups or packages, all of which are difficult to value. The Fund acquires loans with varying terms and structures, levels of borrower equity and credit profiles. The Fund does not limit the allocation of Fund assets in performing loans along the dimensions of terms and structures, borrower equity, and credit profiles. Up to 10% of the loans the Fund acquires may be delinquent or in default at the time of acquisition. The Fund will not purchase loans that currently are in foreclosure; however, loans acquired by the Fund may go into foreclosure subsequent to acquisition by the Fund. In addition, the Fund may invest up to approximately 10% of its assets in loans that are classified as “sub-prime” at the time of purchase by the Fund. The Fund does not invest in foreign securities.
The Fund defines the individual borrowers issuing these types of mortgage-related notes as a type of industry. Therefore, the Fund concentrates investments in the mortgage-related industry because, under normal circumstances, it invests over 25% of its assets in mortgage-related securities. This policy is fundamental and may not be changed without shareholder approval.
Principal Risk Factors
Investing in the Fund involves risks, including the risk that you may receive little or no return on your investment or that you may lose part or all of your investment.
Borrower Risk. A specific security can perform differently from the market as a whole for reasons related to the borrower, such as an individual’s economic situation. Compared to investment companies that focus only on securities issued by large capitalization companies, the Fund’s net asset value may be more volatile because it invests in notes of individuals. Individuals issuing notes secured by residential real estate are more likely to suffer sudden financial reversals such as (i) job loss, (ii) depletion of savings or (iii) loss of access to refinancing opportunities. Further, compared to securities issued by large companies, notes issued by individuals are more likely to experience more significant changes in market values, be harder to sell at times and at prices that the Adviser believes appropriate, and offer greater potential for losses.
Concentration Risk. Because the Fund will invest more than 25% of its assets in the mortgage-related industry, the Fund will be subject to greater volatility risk than a fund that is not concentrated in a single industry. The Fund’s investments may be concentrated in regions or states, which exposes the Fund to region- or state-specific economic risks.
| Supplemental Information (Unaudited)(Continued) |
Credit Risk. Individual borrowers may not make scheduled interest and principal payments, resulting in losses to the Fund. In addition, the credit quality of securities may be lowered if a borrower’s financial condition deteriorates, which tends to increase the risk of default and decreases a note’s value. Weak or declining general economic conditions tend to increase default risk. Lower-quality notes, such as those considered “sub-prime” by the Adviser are more likely to default than those considered “prime” by the Adviser or a rating evaluation agency or service provider. An economic downturn or period of rising interest rates could adversely affect the market for sub-prime notes and reduce the Fund’s ability to sell these securities. The lack of a liquid market for these securities could decrease the Fund’s share price. Additionally, borrowers may seek bankruptcy protection which would delay resolution of security holder claims and may eliminate or materially reduce liquidity.
Defaulted Securities Risk. Defaulted securities lack liquidity and may have no secondary market for extended periods. Defaulted securities may have low recovery values and defaulting borrowers may seek bankruptcy protection which would delay resolution of the Fund’s claims. The Fund anticipates a significant likelihood of default by mortgage-related borrowers.
Fixed Income Risk. Typically, a rise in interest rates causes a decline in the value of fixed income securities. Rising interest rates tend to increase the likelihood of borrower default.
Leverage Risk. The use of leverage by borrowing money to purchase additional securities causes the Fund to incur additional expenses and will magnify losses in the event of underperformance of the securities purchased with borrowed money. In addition, a lender to the Fund may terminate or refuse to renew any credit facility. If the Fund is unable to access additional credit, it may be forced to sell investments at inopportune times, which may further depress the returns of the Fund.
Liquidity Risk. The Fund’s investments are subject to liquidity risk because there is a limited secondary market for mortgage notes. Liquidity risk exists when particular investments of the Fund would be difficult to purchase or sell, possibly preventing the Fund from selling such illiquid securities at an advantageous time or price, or possibly requiring the Fund to dispose of other investments at unfavorable times or prices in order to satisfy its obligations.
Management Risk. The Adviser’s judgments about the attractiveness, value and potential appreciation of a particular real estate segment and securities in which the Fund invests may prove to be incorrect and may not produce the desired results.
Market Risk. An investment in the Fund’s shares is subject to investment risk, including the possible loss of the entire principal amount invested. An investment in the Fund’s shares represents an indirect investment in the securities owned by the Fund. The value of these securities, like other market investments, may move up or down, sometimes rapidly and unpredictably. The Fund’s borrowing costs, if any, will increase when interest rates rise. Additionally, unexpected local, regional or global events, such as war; acts of
| Supplemental Information (Unaudited)(Continued) |
terrorism; financial, political or social disruptions; natural, environmental or man-made disasters; the spread of infectious illnesses or other public health issues (such as the global pandemic coronavirus disease 2019 (COVID-19)); and recessions and depressions could have a significant impact on the Fund and its investments and may impair market liquidity. Such events can cause investor fear, which can adversely affect the economies of nations, regions and the market in general, in ways that cannot necessarily be foreseen.
Prepayment Risk. Securities may be subject to prepayment risk because borrowers are typically able to prepay principal. Consequently, a security’s maturity may be longer or shorter than anticipated. When interest rates fall, obligations tend to be paid off more quickly than originally anticipated and the Fund may have to invest the prepaid proceeds in securities with lower yields. When interest rates rise, obligations will tend to be paid off by the obligor more slowly than anticipated, preventing the Fund from reinvesting at higher yields.
Real Estate Risk. The Fund will not invest in real estate directly, but, because the Fund will invest the majority of its assets in securities secured by real estate, its portfolio will be significantly impacted by the performance of the real estate market and may experience more volatility and be exposed to greater risk than a more diversified portfolio. The value of residential real estate collateral is affected by:
| | (i) | changes in general economic and market conditions including changes in employment; |
| | | |
| | (ii) | changes in the value of real estate properties generally; |
| | | |
| | (iii) | local economic conditions, overbuilding and increased competition; |
| | | |
| | (iv) | increases in property taxes and operating expenses; |
| | | |
| | (v) | changes in zoning laws; |
| | | |
| | (vi) | casualty and condemnation losses including environment remediation costs; |
| | | |
| | (vii) | variations in rental income, neighborhood values or the appeal of property to tenants or potential buyers; |
| | | |
| | (viii) | the availability of financing; |
| | | |
| | (ix) | changes in interest rates and available borrowing leverage; and |
| | | |
| | (x) | natural disasters. |
Servicer Risk. Because the Fund engages servicers to collect payments from borrowers, there is a risk that payments to the Fund will be delayed if a servicer fails to perform its functions or fails to perform them in a timely manner. If a servicer becomes insolvent or the Fund otherwise decides to move to a new servicer, the Fund will incur expenses in transferring servicing duties to a new servicer and borrower delinquencies would likely rise during a transition.
The Adviser may invest up to 10% of the Fund’s assets in notes secured by commercial real estate. The Adviser selects securities by evaluating the issuer’s credit quality and the potential liquidation value of the commercial real estate collateral securing the issuer’s debt obligation. When evaluating credit quality the Adviser uses an underwriting model that takes into account the following factors, but may also take into consideration others:
| Supplemental Information (Unaudited)(Continued) |
Commercial Issuers
| | ● | Issuer payment history including delinquencies and defaults |
| | | |
| | ● | Issuer credit report |
| | | |
| | ● | Security’s interest rate |
| | | |
| | ● | Issuer total debt service load and total fixed costs |
| | | |
| | ● | Tenant quality and lease roll-over |
| | | |
| | ● | Local market competition |
| | | |
| | ● | Projected vacancy rate |
| | | |
| | ● | Title search of property to assure clear title by issuer |
When evaluating commercial real estate collateral’s potential liquidation value the Adviser uses a collateral valuation underwriting model that may take into account the following factors, but may also take into consideration others:
| | ● | Current property value as established by an independent broker’s price opinion |
| | | |
| | ● | State laws pertaining to mortgages in that domicile |
| | | |
| | ● | Local real estate trends around the respective property |
| | | |
| | ● | Potential environmental remediation costs at site |
| | | |
| | ● | Estimated foreclosure value for the property |
Even though the Adviser re- evaluates each issuer’s ability to pay, it nonetheless anticipates a significant likelihood of default by issuers because of difficult-to-predict economic events. The Adviser expects to resolve or forestall defaults primarily by renegotiating note terms to lower interest and/or principal payments so that an issuer can resume payments on its note. The Adviser also may enter into an agreement with the issuer and a third party to sell the property to the third party for less than the principal balance on the note while forgiving any unpaid principal that remains after receiving the proceeds from the sale (commonly referred to as a short- sale). The Adviser may also foreclose upon the property and seek to recover via sale of the property.
There are also special risks associated with particular sectors, or real estate operations generally, as described below:
Retail Properties. Retail properties are affected by the overall health of the economy and may be adversely affected by, among other things, the growth of alternative forms of retailing, bankruptcy, departure or cessation of operations of a tenant, a shift in consumer demand due to demographic changes, changes in spending patterns and lease terminations.
Office Properties. Office properties are affected by the overall health of the economy, and other factors such as a downturn in the businesses operated by their tenants, obsolescence and non-competitiveness.
Hotel Properties. The risks of hotel properties include, among other things, the necessity of a high level of continuing capital expenditures, competition, increases in operating costs which may not be offset by increases in revenues, dependence on business and commercial travelers and tourism, increases in fuel costs and other expenses of travel, and adverse effects of general and local economic conditions. Hotel properties tend to be more sensitive to adverse economic conditions and competition than many other commercial properties.
Healthcare Properties. Healthcare properties and healthcare providers are affected by several significant factors, including federal, state and local laws governing licenses, certification, adequacy
| Supplemental Information (Unaudited)(Continued) |
of care, pharmaceutical distribution, rates, equipment, personnel and other factors regarding operations, continued availability of revenue from government reimbursement programs and competition on a local and regional basis. The failure of any healthcare operator to comply with governmental laws and regulations may affect its ability to operate its facility or receive government reimbursements.
Multifamily Properties. The value and successful operation of a multifamily property may be affected by a number of factors such as the location of the property, the ability of the management team, the level of mortgage rates, the presence of competing properties, adverse economic conditions in the locale, oversupply and rent control laws or other laws affecting such properties.
Community Centers. Community center properties are dependent upon the successful operations and financial condition of their tenants, particularly certain of their major tenants, and could be adversely affected by bankruptcy of those tenants. In some cases a tenant may lease a significant portion of the space in one center, and the filing of bankruptcy could cause significant revenue loss. Like others in the commercial real estate industry, community centers are subject to environmental risks and interest rate risk. They also face the need to enter into new leases or renew leases on favorable terms to generate rental revenues. Community center properties could be adversely affected by changes in the local markets where their properties are located, as well as by adverse changes in national economic and market conditions.
Self-Storage Properties. The value and successful operation of a self-storage property may be affected by a number of factors, such as the ability of the management team, the location of the property, the presence of competing properties, changes in traffic patterns and effects of general and local economic conditions with respect to rental rates and occupancy levels.
Other factors may contribute to the risk of commercial real estate investments:
Development Issues. Certain commercial real estate issuers may engage in the development or construction of real estate properties. These issuers are exposed to a variety of risks inherent in real estate development and construction, such as the risk that there will be insufficient tenant demand to occupy newly developed properties, and the risk that prices of construction materials or construction labor may rise materially during the development.
Lack of Insurance. Certain commercial real estate issuers may fail to carry comprehensive liability, fire, flood, earthquake extended coverage and rental loss insurance, or insurance in place may be subject to various policy specifications, limits and deductibles. Should any type of uninsured loss occur, the portfolio company could lose its investment in, and anticipated profits and cash flows from, a number of properties and, as a result, adversely affect the Fund’s investment performance.
Dependence on Tenants. The value of commercial real estate issuers’ properties and the ability to repay their notes depend upon the ability of the tenants at their properties to generate enough income in excess of their operating expenses to make their lease payments. Changes beyond the control of commercial real estate issuers may adversely affect their tenants’ ability to make their lease payments and, in such event, would substantially reduce both their income from operations and ability to repay their notes.
Financial Leverage. Commercial real estate issuers may be highly leveraged and financial covenants may affect the ability of these issuers to operate effectively.
Environmental Issues. In connection with the ownership (direct or indirect), operation, management and development of real properties that may contain hazardous or toxic substances, a commercial real estate issuer may be considered an owner, operator or responsible party of such properties and, therefore, may be potentially liable for removal or remediation costs, as well as certain other costs, including governmental fines and liabilities for injuries to persons and property. The existence of any such material environmental liability could have a material adverse effect on the results of
| Supplemental Information (Unaudited)(Continued) |
operations and cash flow of any such issuer and, as a result, the amount available to make interest or principal payments to the Fund could be reduced.
Fundamental Policies
The Fund’s stated fundamental policies, which may only be changed by the affirmative vote of a majority of the outstanding voting securities of the Fund (the shares), are listed below. Majority of the outstanding voting securities of the Fund means the vote, at an annual or special meeting of shareholders, duly called, (a) of 67% or more of the shares present at such meeting, if the holders of more than 50% of the outstanding shares are present or represented by proxy; or (b) of more than 50% of the outstanding shares, whichever is less. The Fund may not:
(1) Borrow money, except to the extent permitted by the Investment Company Act of 1940, as amended (the “1940 Act”) (which currently limits borrowing to no more than 33-1/3% of the value of the Fund’s total assets, including the value of the assets purchased with the proceeds of its indebtedness, if any). The Fund may borrow for investment purposes, for temporary liquidity, or to finance repurchases of its shares.
(2) Issue senior securities, except to the extent permitted by Section 18 of the 1940 Act (which currently limits the issuance of a class of senior securities that is indebtedness to no more than 33-1/3% of the value of the Fund’s total assets or, if the class of senior security is stock, to no more than 50% of the value of the Fund’s total assets).
(3) Underwrite securities of other issuers, except insofar as the Fund may be deemed an underwriter under the Securities Act of 1933, as amended (the “Securities Act”) in connection with the disposition of its portfolio securities. The Fund may invest in restricted securities (those that must be registered under the Securities Act before they may be offered or sold to the public) to the extent permitted by the 1940 Act.
(4) Invest more than 25% of the market value of its assets in the securities of companies, entities or issuers engaged in any one industry, except the mortgage-related industry, as defined in the Fund’s Prospectus. Under normal circumstances, the Fund will invest at least 25% of its net assets in mortgage-related securities. This limitation does not apply to investment in the securities of the U.S. Government, its agencies or instrumentalities.
(5) Purchase or sell real estate or interests in real estate. This limitation is not applicable to investments in securities that are secured by or represent interests in real estate (e.g. mortgage loans evidenced by notes or other writings defined to be a type of security). Additionally, the preceding limitation on real estate or interests in real estate does not preclude the Fund from investing in mortgage-related securities or investing in companies engaged in the real estate business or that have a significant portion of their assets in real estate (including real estate investment trusts), nor from disposing of real estate that may be acquired pursuant to a foreclosure (or equivalent procedure) upon a security interest.
| Supplemental Information (Unaudited)(Continued) |
(6) Purchase or sell commodities, commodity contracts, including commodity futures contracts, unless acquired as a result of ownership of securities or other investments, except that the Fund may invest in securities or other instruments backed by or linked to commodities, and invest in companies that are engaged in a commodities business or have a significant portion of their assets in commodities, and may invest in commodity pools and other entities that purchase and sell commodities and commodity contracts.
(7) Make loans to others, except (a) through the purchase of debt securities in accordance with its investment objectives and policies, including notes secured by real estate, which may be considered loans; (b) to the extent the entry into a repurchase agreement is deemed to be a loan; and (c) by loaning portfolio securities. Additionally, the preceding limitation on loans does not preclude the Fund from modifying note terms.
If a restriction on the Fund’s investments is adhered to at the time an investment is made, a subsequent change in the percentage of Fund assets invested in certain securities or other instruments, or change in average duration of the Fund’s investment portfolio, resulting from changes in the value of the Fund’s total assets, will not be considered a violation of the restriction; provided, however, that the asset coverage requirement applicable to borrowings shall be maintained in the manner contemplated by applicable law.
The following information in this annual report is a summary of certain changes since the date of the September 30, 2021 annual report. This information may not reflect all of the changes that have occurred since you purchased this Fund.
The Fund has adopted a managed distribution plan. In December 2020, the Board of Trustees (the “Board”), acting pursuant to a Securities and Exchange Commission exemptive order, approved a Managed Distribution Plan (the “Plan”) for Vertical Capital Income Fund (the “Fund”). Pursuant to the Plan, the Fund pays a minimum monthly distribution to shareholders at a stated annual rate as a percentage of the three-month average net asset value (“NAV”) of the Fund’s shares prior to the month of distribution. The distribution is calculated as 8% of the previous three-month average NAV, divided by 12. Payment of monthly distributions under the Fund’s Plan commenced in January 2021.
Effective January 8, 2021, Robert J. Chapman retired as Trustee, Chairman of the Board of Trustees, Treasurer, and Portfolio Manager. His role as Chairman of the Board of Trustees was assumed by Robert J. Boulware. His Board seat was eliminated. His role as Treasurer was assumed by Destiny Poninski. Katherine Hawkins, the Advisor’s Senior Vice President assumed the role of Portfolio Manager. Ms. Hawkins has been with the Advisor for approximately six years and with Behringer, the Advisor’s parent company, for eight years.
| Supplemental Information (Unaudited)(Continued) |
Annual Shareholder Meeting
At the Annual Meeting of Shareholders of the Fund, held at the offices of Thompson Hine LLP, 41 S. High St. 17th Floor, Columbus, Ohio 43215, on Friday, August 27, 2021, shareholders of record as of the close of business on July 16, 2021, voted to approve the following proposal:
Proposal To re-elect T. Neil Bathon as a Trustee of the Fund.
FOR: 3,385,830.942
WITHHOLD: 4,145,252.291
Renewal of Investment Advisory Agreement
Approval of Renewal of Investment Advisory Agreement with Oakline Advisors, LLC
At a meeting held on August 13, 2021, the Board of Trustees (the “Board” or “Trustees”) of the Vertical Capital Income Fund (the “Fund”), including a majority of the Trustees who are not “interested persons” (the “Independent Trustees”), as such term is defined by the Investment Company Act of 1940, as amended (the “1940 Act”), approved the renewal of the investment management agreement (the “Advisory Agreement”) between Oakline Advisors, LLC (the “Adviser” or “Oakline”) and the Fund. Matters considered by the Trustees in connection with the Board’s renewal of the Advisory Agreement included the following:
Nature, Extent and Quality of Services. The Trustees discussed Oakline’s history and portfolio management experience. They noted that Oakline and its affiliates served a variety of clients, and managed approximately $400 million in assets. The Trustees reviewed the background and experience of Oakline’s investment team. The Trustees further noted the Adviser had provided a high level of expertise and diligence in performing investment advisory services for the Fund and appreciated the Adviser’s long-term view in managing the Fund. They acknowledged the Adviser’s lack of material regulatory issues, careful stewardship of the portfolio and careful ongoing attention to portfolio valuation. The Trustees acknowledged that the Adviser has considering retaining a third-party compliance services provider to the Adviser, subject to oversight of the Adviser’s Chief Compliance Officer. After further discussion, the Trustees concluded that they are satisfied with Oakline and believed Oakline would continue to provide quality advisory services to the Fund.
Performance. The Trustees reviewed the performance of the Fund compared to its benchmark indices for the one-year, three-year, five- year and since inception periods. Next, the Board noted that interval fund comparisons are useful from a management fee and expense ratio, but they are not entirely useful from a performance standpoint because of the Fund’s novel strategy. They noted that the Adviser focuses on two applicable indices: the Bloomberg Capital MBS Index and the Barclays US Aggregate Bond Index when managing the Fund. The Trustees noted that the Fund outperformed the indices for the one-year, five-year and since inception periods and outperformed Bloomberg MBS Index for the three-year period. The Trustees agreed that the Adviser had delivered positive, acceptable returns consistent with the Fund’s objective and that it is expected to continue to do so.
Fees and Expenses. The Trustees noted that Oakline charged an advisory fee of 1.25% and the Fund had a net expense ratio of 2.50%, as measured by the current expense limitation agreement. The Trustees noted that total expenses were somewhat higher at 2.97% as of June 30, 2021, as per the Administrator’s report. . The Trustees reviewed average fees for two peer groups: (i) closed-end exchange traded real estate and mortgage funds, and (ii) closed-end real estate related and other interval funds. The Trustees acknowledged that neither peer group was precisely comparable to the Fund due to various factors including the significantly larger size of some peer funds, and differing strategies and objectives, but agreed the information was relevant. They noted that the Fund’s advisory fee was only slightly higher than the average for the interval fund comparison group and between the average and the maximum for closed-end exchange traded closed-end funds. The Trustees also observed that Fund’s net
| Supplemental Information (Unaudited)(Continued) |
expense ratio, measured at either 2.50% or 2.97% is within the range of reasonable expenses when viewing both peer groups together. The Trustees noted that the Adviser has agreed to an Expense Limitation Agreement, whereby the Adviser will waive its fees and pay or absorb the ordinary operating expenses of the Fund (including offering expenses, but excluding interest, brokerage commissions, extraordinary expenses and acquired fund fees and expenses) to the extent that they exceed 2.50%. The Trustees concluded that the advisory fee and Fund expenses were not unreasonable.
Profitability. The Trustees reviewed a profitability analysis provided by Oakline, and discussed Oakline’s historical and estimated profitability in connection with its relationship with the Fund. The Trustees considered that Oakline realized a small net profit through its relationship with the Fund in the most recent calendar year. The Trustees concluded, after further discussion of the profitability analysis provided, that excessive profitability from Oakline’s relationship with the Fund was not an issue at this time.
Economies of Scale. The Trustees considered whether the Fund had yet reached a size where economies of scale had been achieved. The Trustees concurred with the Adviser’s representation that economies of scale were difficult to achieve given the labor intensive mortgage note selection process. The Trustees agreed to reevaluate the issue at the next renewal.
Conclusion. Having requested and received such information from Oakline as the Trustees believed to be reasonably necessary to evaluate the terms of the advisory agreement with Oakline, and as assisted by the advice of Counsel, the Trustees concluded that the fee structure was reasonable and that reapproval of the Investment Advisory Agreement was in the best interests of the Fund and its shareholders.
| Supplemental Information (Unaudited)(Continued) |
Vertical Capital Income Fund
Dividend Reinvestment Plan
Unless the registered owner of shares elects to receive cash by contacting the Plan Agent, all dividends declared for the shares of the Fund will be automatically paid in the form of, or reinvested by American Stock Transfer & Trust Company (“AST”) (the “Plan Agent”), agent for shareholders in administering the Fund’s Dividend Reinvestment Plan (the “Plan”), in additional shares of the Fund. If you are a registered owner of shares and elect not to participate in the Plan, you will receive all dividends or other distributions (together, a “dividend”) in cash paid by check mailed directly to you (or, if the shares are held in street or other nominee name, then to such nominee) by AST, as dividend disbursing agent. You may elect not to participate in the Plan and to receive all dividends in cash by sending written instructions or by contacting AST, as dividend disbursing agent, at the address set forth below. Participation in the Plan is completely voluntary and may be terminated or resumed at any time without penalty by contacting the Plan Agent before the dividend record date; otherwise such termination or resumption will be effective with respect to any subsequently declared dividend. Some brokers or other financial intermediaries through which shareholders may hold their shares, may automatically elect to receive cash on the shareholders’ behalf and may reinvest that cash in additional shares of the Fund for the respective shareholders.
The Plan Agent will open an account for each shareholder under the Plan in the same name in which such shareholder’s shares are registered. Whenever the Fund declares a dividend payable in cash, non-participants in the Plan will receive cash and participants in the Plan will receive the equivalent in shares. The shares will be acquired by the Plan Agent for the participants’ accounts, depending upon the circumstances described below, either (i) through receipt of additional unissued but authorized shares from the Fund (“newly issued shares”) or (ii) by purchase of outstanding shares on the open market (“open-market purchases”) on the New York Stock Exchange or elsewhere.
Whenever the Fund declares a dividend, non-participants in the Plan will receive cash and participants in the Plan will receive the equivalent in shares. The shares will be acquired by the Plan Agent for the participants’ accounts, depending upon the circumstances described below, either (i) through receipt of additional unissued but authorized shares from the Fund (newly issued shares) or (ii) by purchase of outstanding shares on the open market (open-market purchases”) on the NYSE or elsewhere. If, on the payment date for any dividend, the closing market price plus estimated brokerage commissions per share is equal to or greater than the NAV per share, the Plan Agent will invest the dividend amount in newly issued shares on behalf of the participants. The number of newly issued shares to be credited to each participant’s account will be determined by dividing the dollar amount of the dividend by the Fund’s NAV per share on the payment date. If, on the payment date for any dividend, the NAV per share is greater than the closing market value plus estimated brokerage commissions (i.e., the Fund’s shares are trading at a discount),
| Supplemental Information (Unaudited)(Continued) |
the Plan Agent will invest the dividend amount in shares acquired on behalf of the participants in open-market purchases.
In the event of a market discount on the payment date for any dividend, the Plan Agent will have until the last business day before the next date on which the shares trade on an “ex-dividend” basis or 30 days after the payment date for such dividend, whichever is sooner (the “last purchase date”), to invest the dividend amount in shares acquired in open-market purchases. It is contemplated that the Fund will pay monthly income dividends. If, before the Plan Agent has completed its open-market purchases, the market price per share exceeds the NAV per share, the average per share purchase price paid by the Plan Agent may exceed the NAV of the shares, resulting in the acquisition of fewer shares than if the dividend had been paid in newly issued shares on the dividend payment date. Because of the foregoing difficulty with respect to open-market purchases, the Plan provides that if the Plan Agent is unable to invest the full dividend amount in open-market purchases during the purchase period or if the market discount shifts to a market premium during the purchase period, the Plan Agent may cease making open-market purchases and may invest the uninvested portion of the dividend amount in newly issued shares at the NAV per share.
The Plan Agent maintains all shareholders’ accounts in the Plan and furnishes written confirmation of all transactions in the accounts, including information needed by shareholders for tax records. shares in the account of each Plan participant will be held by the Plan Agent on behalf of the Plan participant, and each shareholder proxy will include those shares purchased or received pursuant to the Plan. The Plan Agent will forward all proxy solicitation materials to participants and vote proxies for shares held under the Plan in accordance with the instructions of the participants.
In the case of shareholders such as banks, brokers or nominees which hold shares for others who are the beneficial owners, the Plan Agent will administer the Plan on the basis of the number of shares certified from time to time by the record shareholder’s name and held for the account of beneficial owners who participate in the Plan.
There will be no brokerage charges with respect to shares issued directly by the Fund. However, each participant will pay a pro rata share of brokerage commissions incurred in connection with open-market purchases. The automatic reinvestment of dividends will not relieve participants of any tax that may be payable (or required to be withheld) on such dividends. Accordingly, any taxable dividend received by a participant that is reinvested in additional shares will be subject to U.S. federal (and possibly state and local) income tax even though such participant will not receive a corresponding amount of cash with which to pay such taxes. Participants who request a sale of shares through the Plan Agent are subject to a $15.00 sales fee and pay a brokerage commission of $0.12 per share sold.
| Supplemental Information (Unaudited)(Continued) |
The Fund reserves the right to amend or terminate the Plan. There is no direct service charge to participants in the Plan; however, the Fund reserves the right to amend the Plan to include a service charge payable by the participants.
All correspondence concerning the Plan should be directed to the Plan Agent at American Stock Transfer & Trust Company, 6201 15th Avenue, Brooklyn, New York 11219; telephone 1-866-277-8243.
| Vertical Capital Income Fund |
| Supplemental Information |
| September 30, 2021 (Unaudited) |
Independent Trustees
Name, Address
and Age | Position/Term of
Office | Principal Occupation
During the Past Five Years | Number
of
Portfolios
in Fund
Complex*
Overseen
by
Trustee | Other Directorships
held by Trustee During
past Five Years |
T. Neil Bathon
60 | Trustee since August 2011, Class III Board until 2024 annual shareholder meeting. | Managing Partner, FUSE Research Network, LLC (investment management and fund management consultancy firm), Aug. 2008 to present; Managing Director, PMR Associates LLC (financial consultancy firm), July 2006 to Present. | 1 | None |
Robert J.
Boulware
65 | Trustee since August 2011, Class I Board member until 2022 annual shareholder meeting. | Trustee, Brighthouse Funds Trust I, March 2008 to present; Trustee, Brighthouse Funds Trust II , April 2012 to present; Managing Director, Pilgrim Funds, LLC (private equity fund), Aug. 2006 to June 2020. | 1 | Trustee, Brighthouse Funds Trust I (45 portfolios), March 2008 to present; Trustee, Brighthouse Funds Trust II (29 portfolios), April 2012 to present; Director, SharesPost 100 Fund, March 2013 to present; Gainsco Inc. (auto insurance) May 2005 to Dec. 2020; Mid-Con Energy Partners, LP, June 2020 to Jan. 2021. |
Jack L.
Macdowell, Jr. 47 | Trustee since August 2020, Class II Board member until 2023 annual shareholder meeting. | Chief Investment Officer, The Palisades Group, LLC (investment adviser), Sept. 2012 to present. | 1 | None |
Mark J. Schlafly
60 | Trustee since August 2011, Class II Board member until 2023 annual shareholder meeting | Adjunct Professor/Career Advisor, Olin School of Business, Washington University, August 2011 to present; Executive Vice President , Waddell & Reed, Inc. (financial services firm), June 2016 to Aug 2017; Managing Director, Russell Investments, June 2013 to Dec. 2014. | 1 | None |
| Vertical Capital Income Fund |
| Supplemental Information |
| September 30, 2021 (Unaudited)(Continued) |
Officers
Name, Address
and Age | Position/Term
of Office* | Principal Occupation
During the Past Five Years | Number of
Portfolios
in Fund
Complex**
Overseen
by Trustee | Other
Directorships
held by
Trustee During
the Past Five
Years |
Michael D. Cohen
47 | President, since July 2015 | Chief Executive Officer Stratera Holdings, LLC, (financial services holding company), a position held since Oct. 2016; President of Stratera Holdings, LLC, a position held since April 2015; Executive Vice President, Stratera Holdings, LLC, Jan. 2013 to Apr. 2015. Chief Executive Officer Stratera Services, LLC, a position held since Oct. 2016; President of Stratera Services, LLC, Apr. 2015 to present; Executive Vice President, of Stratera Services, LLC Jan. 2011 to Apr. 2015. Executive Vice President of Pathway Capital Opportunity Fund Management, LLC, Aug. 2014 to present. Executive Vice President, Pathway Capital Opportunity Fund, Inc., Feb. 2013 to Feb. 2019. Director, Behringer Harvard Opportunity REIT I, Inc., July 2014 to Aug. 2018. Director, Behringer Harvard Opportunity REIT II, Inc., Feb. 2013 to Sept. 2017. Member of Board of Managers, Priority Senior Secured Income Management, LLC, Oct. 2012 to present. Executive Vice President of Priority Income Fund, Inc., July 2012 to Nov. 2019. | n/a | n/a |
Destiny Poninski
32 | Treasurer since Jan. 2021 | Oakline Advisors, LLC, Vice President & Senior Controller, Feb. 2021 to present, Vice President & Controller, Dec. 2019 to Feb. 2021, Senior Accountant, Aug. 2014 to Dec. 2019. Stratera Holdings, LLC (f.k.a. Behringer Harvard Holdings, LLC) (financial services holding company), Vice President & Senior Controller, Feb. 2021 to present, Vice President & Controller, Dec. 2019 to Feb. 2021, Senior Accountant, Aug. 2014 to Dec. 2019; Provasi Capital Partners, LP (broker dealer), Vice President & Senior Controller, Feb. 2021 to present, Vice President & Controller, Dec. 2019 to Feb. 2021, Senior Accountant, Aug. 2014 to Dec. 2019. | n/a | n/a |
Stanton P.
Eigenbrodt
56 | Secretary since July 2015 | Executive Vice President, Chief Legal Officer and Secretary of Oakline Advisors, positions held since July 2015 and Chief Compliance Officer since Sept. 2019; Chief Legal Officer of Stratera Holdings, LLC and Secretary (financial services holding company) positions held since Sept. 2015; Executive Vice President and General Counsel (2011-2015); Senior Vice President and General Counsel (2006-2011). Similar positions held at subsidiaries of Stratera Holdings, LLC. | n/a | n/a |
Emile R. Molineaux
59 | Chief Compliance Officer and Anti-Money Laundering Officer since August 2011 | Northern Lights Compliance Services, LLC (Secretary since 2003 and Senior Compliance Officer since 2011); General Counsel, CCO and Senior Vice President, Gemini Fund Services, LLC; Secretary and CCO, Northern Lights Compliance Services, LLC (2003-2011). | n/a | n/a |
| * | Officers are reappointed annually. |
| ** | The term “Fund Complex” refers to the Vertical Capital Income Fund. |
The Fund’s Statement of Additional Information includes additional information about certain of the Trustees and is available free of charge, upon request, by calling toll-free at 1-866-277-VCIF.
PRIVACY NOTICE
Rev. May 2012
| FACTS | WHAT DOES VERTICAL CAPITAL INCOME FUND DO WITH YOUR PERSONAL INFORMATION? |
| | |
| Why? | Financial companies choose how they share your personal information. Federal law gives consumers the right to limit some but not all sharing. Federal law also requires us to tell you how we collect, share, and protect your personal information. Please read this notice carefully to understand what we do. |
| | |
| What? | The types of personal information we collect and share depend on the product or service you have with us. This information can include: |
| | |
| | ■ | Social Security number | ■ | Purchase History |
| | | | | |
| | ■ | Assets | ■ | Account Balances |
| | | | | |
| | ■ | Retirement Assets | ■ | Account Transactions |
| | | | | |
| | ■ | Transaction History | ■ | Wire Transfer Instructions |
| | | | | |
| | ■ | Checking Account Information | | |
| | |
| | When you are no longer our customer, we continue to share your information as described in this notice. |
| | |
| How? | All financial companies need to share customers’ personal information to run their everyday business. In the section below, we list the reasons financial companies can share their customers’ personal information; the reasons Vertical Capital Income Fund chooses to share; and whether you can limit this sharing. |
| Reasons we can share your personal information | Does Vertical
Capital Income
Fund share? | Can you limit this sharing? |
For our everyday business purposes – such as to process your transactions, maintain your account(s), respond to court orders and legal investigations, or report to credit bureaus | Yes | No |
For our marketing purposes – to offer our products and services to you | No | We don’t share |
| For joint marketing with other financial companies | No | We don’t share |
For our affiliates’ everyday business purposes – information about your transactions and experiences | No | We don’t share |
For our affiliates’ everyday business purposes – information about your creditworthiness | No | We don’t share |
| For nonaffiliates to market to you | No | We don’t share |
| Questions? | Call 1-866-277-VCIF |
Rev. May 2012
| Who we are |
Who is providing this notice? | Vertical Capital Income Fund |
| What we do |
| How does Vertical Capital Income Fund protect my personal information? | To protect your personal information from unauthorized access and use, we use security measures that comply with federal law. These measures include computer safeguards and secured files and buildings. Our service providers are held accountable for adhering to strict policies and procedures to prevent any misuse of your nonpublic personal information. |
| How does Vertical Capital Income Fund collect my personal information? | We collect your personal information, for example, when you ■ Open an account ■ Provide account information ■ Give us your contact information ■ Make deposits or withdrawals from your account ■ Make a wire transfer ■ Tell us where to send the money ■ Tells us who receives the money ■ Show your government-issued ID ■ Show your driver’s license We also collect your personal information from other companies. |
| Why can’t I limit all sharing? | Federal law gives you the right to limit only ■ Sharing for affiliates’ everyday business purposes – information about your creditworthiness ■ Affiliates from using your information to market to you ■ Sharing for nonaffiliates to market to you State laws and individual companies may give you additional rights to limit sharing. |
| Definitions |
| Affiliates | Companies related by common ownership or control. They can be financial and nonfinancial companies. ■ Vertical Capital Income Fund does not share with our affiliates. |
| Nonaffiliates | Companies not related by common ownership or control. They can be financial and nonfinancial companies ■ Vertical Capital Income Fund does not share with nonaffiliates so they can market to you. |
| Joint marketing | A formal agreement between nonaffiliated financial companies that together market financial products or services to you. ■ Vertical Capital Income Fund doesn’t jointly market. |
| | | | | |
How to Obtain Proxy Voting Information
Information regarding how the Fund votes proxies relating to portfolio securities for the most-recent 12 month period ended June 30th as well as a description of the policies and procedures that the Fund used to determine how to vote proxies is available without charge, upon request, by calling 1-866-277-VCIF by referring to the Securities and Exchange Commission’s (“SEC”) website at http://www.sec.gov.
How to Obtain 1st and 3rd Fiscal Quarter Portfolio Holdings
The Fund files its complete schedule of portfolio holdings with the SEC on a monthly basis on Form N-PORT for the first and third quarters of each fiscal year. Form N-PORT is available on the SEC’s website at http://www.sec.gov. The information on Form N-PORT is available without charge, upon request, by calling 1-866-277-VCIF.
| Investment Adviser |
| Oakline Advisors, LLC |
| 5301 Alpha Rd, Suite 80 - 222 |
| Dallas, Texas 75240 |
| |
| Administrator |
| Ultimus Fund Solutions, LLC |
| 4221 North 203rd St., Suite 100 |
| Elkhorn, NE 68022 |
| |
| VERTICAL-AR21 |
Item 2. Code of Ethics.
(a) As of the end of the period covered by this report, the registrant has adopted a code of ethics that applies to the registrant's principal executive officer, principal financial officer, principal accounting officer or controller, or persons performing similar functions, regardless of whether these individuals are employed by the registrant or a third party.
(b) For purposes of this item, “code of ethics” means written standards that are reasonably designed to deter wrongdoing and to promote:
| (1) | Honest and ethical conduct, including the ethical handling of actual or apparent conflicts of interest between personal and professional relationships; |
| (2) | Full, fair, accurate, timely, and understandable disclosure in reports and documents that a registrant files with, or submits to, the Commission and in other public communications made by the registrant; |
(3) Compliance with applicable governmental laws, rules, and regulations;
| (4) | The prompt internal reporting of violations of the code to an appropriate person or persons identified in the code; and |
(5) Accountability for adherence to the code.
(c) Amendments: During the period covered by the report, there have not been any amendments to the provisions of the code of ethics.
(d) Waivers: During the period covered by the report, the registrant has not granted any express or implicit waivers from the provisions of the code of ethics.
Item 3. Audit Committee Financial Expert.
The registrant’s board of trustees has determined that the registrant does not have an audit committee financial expert serving on its audit committee.
Item 4. Principal Accountant Fees and Services
| | | Registrant | | Advisor |
| | FYE 09/30/21 | | | | $180,200 | | | | N/A | |
| | FYE 09/30/20 | | | | $167,000 | | | | N/A | |
| | | Registrant | | Advisor |
| | FYE 09/30/21 | | | | $0 | | | | N/A | |
| | FYE 09/30/20 | | | | $0 | | | | N/A | |
| | | Registrant | | Advisor |
| | FYE 09/30/21 | | | | $0 | | | | N/A | |
| | FYE 09/30/20 | | | | $0 | | | | N/A | |
Preparation of Federal & State income tax returns, assistance with calculation of required income, capital gain and excise distributions and preparation of Federal excise tax returns.
| | | Registrant | | Advisor |
| | FYE 09/30/21 | | | | $0 | | | | N/A | |
| | FYE 09/30/20 | | | | $0 | | | | N/A | |
| (e) | (1) Audit Committee’s Pre-Approval Policies |
The registrant’s Audit Committee is required to pre-approve all audit services and, when appropriate, any non-audit services (including audit-related, tax and all other services) to the registrant. The registrant’s Audit Committee also is required to pre-approve, when appropriate, any non-audit services (including audit-related, tax and all other services) to its adviser, or any entity controlling, controlled by or under common control with the adviser that provides ongoing services to the registrant, to the extent that the services may be determined to have an impact on the operations or financial reporting of the registrant. Services are reviewed on an engagement by engagement basis by the Audit Committee.
| (2) | Percentages of Services Approved by the Audit Committee |
| | | | Registrant | | | | Advisor | |
| | | | | | | | | |
| Audit-Related Fees: | | | N/A | | | | N/A | |
| Tax Fees: | | | N/A | | | | N/A | |
| All Other Fees: | | | N/A | | | | N/A | |
| (f) | During the audit of registrant's financial statements for the most recent fiscal year, less than 50 percent of the hours expended on the principal accountant's engagement were attributed to work performed by persons other than the principal accountant's full-time, permanent employees. |
| (g) | The aggregate non-audit fees billed by the registrant's accountant for services rendered to the registrant, and rendered to the registrant's investment adviser (not including any sub-adviser whose role is primarily portfolio management and is subcontracted with or overseen by another investment adviser), and any entity controlling, controlled by, or under common control with the adviser that provides ongoing services to the registrant: |
| | | Registrant | | Advisor |
| FYE 09/30/2021 | | | | $0 | | | | N/A | |
| FYE 09/30/2020 | | | | $0 | | | | N/A | |
(h) The registrant's audit committee has considered whether the provision of non-audit services to the registrant's investment adviser (not including any sub-adviser whose role is primarily portfolio management and is subcontracted with or overseen by another investment adviser), and any entity controlling, controlled by, or under common control with the investment adviser that provides ongoing services to the registrant, that were not pre-approved pursuant to paragraph (c)(7)(ii) of Rule 2-01 of Regulation S-X, is compatible with maintaining the principal accountant's independence.
Item 5. Audit Committee of Listed Companies. Not applicable.
Item 6. Schedule of Investments. See Item 1.
Item 7. Disclosure of Proxy Voting Policies and Procedures for Closed-End Funds.
Pursuant to the adoption by the Securities and Exchange Commission (the “Commission”) of Rule 206(4)-6 (17 CFR 275.206(4)-6) and amendments to Rule 204-2 (17 CFR 275.204-2) under the Investment Adviser Act of 1940 (the “Act”), it is a fraudulent, deceptive, or manipulative act, practice or course of business, within the meaning of Section 206(4) of the Act, for an investment adviser to exercise voting authority with respect to client securities, unless (i) the adviser has adopted and implemented written policies and procedures that are reasonably designed to ensure that the adviser votes proxies in the best interests of its clients, (ii) the adviser describes its proxy voting procedures to its clients and provides copies on request, and (iii) the adviser discloses to clients how they may obtain information on how the adviser voted their proxies.
In order to fulfill its responsibilities under the Act, Oakline Advisors, LLC (hereinafter, “we” or “our”) has adopted the following policies and procedures for proxy voting with regard to direct investments in companies held in investment portfolios of our clients.
KEY OBJECTIVES
The key objectives of these policies and procedures recognize that a company’s management is entrusted with the day-to-day operations and longer term strategic planning of the company, subject to the oversight of the company’s board of directors. While “ordinary business matters” are primarily the responsibility of management and should be approved solely by the corporation’s board of directors, these objectives also recognize that the company’s shareholders must have final say over how management and directors are performing, and how shareholders’ rights and ownership interests are handled, especially when matters could have substantial economic implications to the shareholders.
Therefore, we will pay particular attention to the following matters in exercising our proxy voting responsibilities as a fiduciary for our clients:
Accountability. Each company should have effective means in place to hold those entrusted with running a company’s business accountable for their actions. Management of a company should be accountable to its board of directors and the board should be accountable to shareholders.
Alignment of Management and Shareholder Interests. Each company should endeavor to align the interests of management and the board of directors with the interests of the company’s shareholders. For example, we generally believe that compensation should be designed to reward management for doing a good job of creating value for the shareholders of the company.
Transparency. Promotion of timely disclosure of important information about a company’s business operations and financial performance enables investors to evaluate the performance of a company and to make informed decisions about the purchase and sale of a company’s securities.
DECISION METHODS
We generally believe that portfolio managers that invest in and track particular companies have a unique perspective to make decisions with regard to proxy votes. Therefore, we rely on that perspective to make the final decisions on how to cast proxy votes.
No set of proxy voting guidelines can anticipate all situations that may arise. In special cases, we may seek insight and expertise from outside sources as to how a particular proxy proposal will impact the financial prospects of a company, and vote accordingly.
In some instances, a proxy vote may present a conflict between the interests of a client, on the one hand, and our interests or the interests of a person affiliated with us, on the other. In such a case, we will abstain from making a voting decision and will forward all of the necessary proxy voting materials to the client to enable the client to cast the votes.
SUMMARY OF PROXY VOTING GUIDELINES
Election of the Board of Directors
We believe that good corporate governance generally starts with a board composed primarily of independent directors, unfettered by significant ties to management, all of whose members are elected annually. We also believe that some measure of turnover in board composition typically promotes more independent board action and fresh perspectives on governance. Of greater importance is the skill set of the proposed board member. We will also look at the backgrounds of the directors to gauge their business acumen and any special talent or experience that may add value to their participation on the board.
The election of a company’s board of directors is one of the most fundamental rights held by shareholders. Because a classified board structure prevents shareholders from electing a full slate of directors annually, we will pay special attention to efforts to declassify boards or other measures that permit shareholders to remove a majority of directors at any time.
Approval of Independent Auditors
We believe that the relationship between a company and its auditors should be limited primarily to the audit engagement, although it may include certain closely related activities that do not raise an appearance of impaired independence.
We will evaluate on a case-by-case basis instances in which the audit firm has a substantial non-audit relationship with a company to determine whether we believe independence has been, or could be, compromised.
Equity-based compensation plans
We believe that appropriately designed equity-based compensation plans, approved by shareholders, can be an effective way to align the interests of shareholders and the interests of directors, management, and employees by providing incentives to increase shareholder value. Conversely, we are opposed to plans that substantially dilute ownership interests in the company, provide participants with excessive awards, or have inherently objectionable structural features.
We will generally support measures intended to increase stock ownership by executives and the use of employee stock purchase plans to increase company stock ownership by employees. These may include:
1. Requiring senior executives to hold stock in a company.
2. Requiring stock acquired through option exercise to be held for a certain period of time.
These are guidelines, and we consider other factors, such as the nature of the industry and size of the company, when assessing a plan’s impact on ownership interests.
Corporate Structure
We view the exercise of shareholders’ rights, including the rights to act by written consent, to call special meetings and to remove directors, to be fundamental to good corporate governance.
Because classes of common stock with unequal voting rights limit the rights of certain shareholders, we generally believe that shareholders should have voting power equal to their equity interest in the company and should be able to approve or reject changes to a company’s by-laws by a simple majority vote.
We will generally support the ability of shareholders to cumulate their votes for the election of directors.
Shareholder Rights Plans
There are arguments both in favor of and against shareholder rights plans, also known as poison pills. For example, such measures may tend to entrench or provide undue compensation to current management, which we generally consider to have a negative impact on shareholder value. Therefore, our preference is for a plan that places shareholder value in a priority position above interests of management.
SUMMARY OF PROXY VOTING PROCEDURES
As a fiduciary to its investors, we recognize the need to actively manage and vote proxies and other shareholder actions and consents that may arise in the course of its investment advisory activities on behalf of its clients. However, due to the nature of the investments of the Fund and indirect exposure to underlying equity investments, we believe that it would be rare that we would be in a position to cast a vote or called upon to vote a proxy.
In the event that we do receive a proxy notice, shareholder consent, or is otherwise entitled to vote on any issue related to the investments of its advisory client accounts, we will process and vote all shareholder proxies and other actions in a timely manner insofar as we can determine based on the facts available at the time of its action, in the best interests of the affected advisory client(s). Although we expect that proxies will generally be voted in a manner consistent with the guidelines set forth in this policy, there may be individual cases where, based on facts available, voting according to policy would not be in the best interests of the fund and its shareholders. In such cases, we may vote counter to the stated policy.
Proxy Voting Procedure
1) Notices received are reviewed by the Compliance Department;
2) Forwarded to the Investment Department for review and voting decision;
3) Vote or consent entered according to our best judgment under the facts and circumstances presented. Such decision shall be made and documented;
4) Final review and sign-off by Compliance Department and filing with a copy in the Proxy Voting Log.
We may at any time, outsource Proxy Voting responsibilities to Institutional Shareholder Services (“ISS”) or similar service provider that we may approve, provided that such service provider votes each proxy based on decisions made by us.
CLIENT INFORMATION
A copy of these Proxy Voting Policies and Procedures is available to our clients, without charge, upon request, by calling 1-866-277-VCIF. We will send a copy of these Proxy Voting Policies and Procedures within three business days of receipt of a request, by first-class mail or other means designed to ensure equally prompt delivery.
In addition, we will provide each client, without charge, upon request, information regarding the proxy votes cast by us with regard to the client’s securities.
Item 8. Portfolio Managers of Closed-End Management Investment Companies.
As of September 30, 2021, Ms. Hawkins, Advisor’s Senior Vice President is the sole portfolio manager of the Fund. Ms. Hawkins is responsible for management of the Fund's investment portfolio. Ms. Hawkins is not compensated through her share of the profits, if any, of the Adviser. Because the portfolio manager may manage assets for other pooled investment vehicles and/or other accounts (including institutional clients, pension plans and certain high net worth individuals) (collectively "Client Accounts"), or may be affiliated with such Client Accounts, there may be an incentive to favor one Client Account over another, resulting in conflicts of interest. For example, the Adviser may, directly or indirectly, receive fees from Client Accounts that are higher than the fee it receives from the Fund, or it may, directly or indirectly, receive a performance-based fee on a Client Account. In those instances, a portfolio manager may have an incentive to not favor the Fund over the Client Accounts. The Adviser has adopted trade allocation and other policies and procedures that it believes are reasonably designed to address these and other conflicts of interest. As of September 30, 2021, Ms. Hawkins owned no shares of the Fund.
As of September 30, 2021, Ms. Hawkins was responsible for the management of the following types of accounts in addition to the Fund:
| Other Accounts By Type | Total Number of Accounts by Account Type | Total Assets By Account Type | Number of Accounts by Type Subject to a Performance Fee | Total Assets By Account Type Subject to a Performance Fee |
| Registered Investment Companies | 0 | $0 | 0 | $0 |
| Other Pooled Investment Vehicles | 0 | $0 | 0 | $0 |
| Other Accounts | 0 | $0 | 0 | $0 |
Item 9. Purchases of Equity Securities by Closed-End Management Investment Company and Affiliated Purchasers. Not applicable.
Item 10. Submission of Matters to a Vote of Security Holder. None.
Item 11. Controls and Procedures.
(a) Based on an evaluation of the Registrant’s disclosure controls and procedures as of a date within 90 days of filing date of this Form N-CSR, the principal executive officer and principal financial officer of the Registrant have concluded that the disclosure controls and procedures of the Registrant are reasonably designed to ensure that the information required in filings on Form N-CSR is recorded, processed, summarized, and reported by the filing date, including that information required to be disclosed is accumulated and communicated to the Registrant’s management, including the Registrant’s principal executive officer and principal financial officer, as appropriate to allow timely decisions regarding required disclosure.
(b) There were no significant changes in the registrant’s internal control over financial reporting that occurred during the second fiscal quarter of the period covered by this report (in the registrant’s second fiscal half-year in the case of an annual report) that have materially affected, or are reasonably likely to materially affect, the registrant’s internal control over financial reporting.
Item 12. Disclosure of Securities Lending Activities for Closed-End Management Investment Companies.
(a) If the registrant is a closed-end management investment company, provide the following dollar amounts of income and fees/compensation related to the securities lending activities of the registrant during its most recent fiscal year:
(1) Gross income from securities lending activities;
(2) All fees and/or compensation for each of the following securities lending activities and related services: any share of revenue generated by the securities lending program paid to the securities lending agent(s) (“revenue split”); fees paid for cash collateral management services (including fees deducted from a pooled cash collateral reinvestment vehicle) that are not included in the revenue split; administrative fees that are not included in the revenue split; fees for indemnification that are not included in the revenue split; rebates paid to borrowers; and any other fees relating to the securities lending program that are not included in the revenue split, including a description of those other fees;
(3) The aggregate fees/compensation disclosed pursuant to paragraph (2); and
11
(4) Net income from securities lending activities (i.e., the dollar amount in paragraph (1) minus the dollar amount in paragraph (3)).
Instruction to paragraph (a).
If a fee for a service is included in the revenue split, state that the fee is “included in the revenue split.”
(b) If the registrant is a closed-end management investment company, describe the services provided to the registrant by the securities lending agent in the registrant’s most recent fiscal year.
Item 13. Exhibits.
(a)(1) Code of Ethics filed herewith.
(a)(2) Certification(s) required by Section 302 of the Sarbanes-Oxley Act of 2002 (and Item 11(a)(2) of Form N-CSR) are filed herewith.
(a)(3) Not applicable.
(b) Certification(s) required by Section 906 of the Sarbanes-Oxley Act of 2002 (and Item 11(b) of Form N-CSR) are filed herewith.
SIGNATURES
Pursuant to the requirements of the Securities Exchange Act of 1934 and the Investment Company Act of 1940, the registrant has duly caused this report to be signed on its behalf by the undersigned, thereunto duly authorized.
(Registrant) Vertical Capital Income Fund
By (Signature and Title)
* /s/ Michael D. Cohen
Michael D. Cohen, President
Date 12/7/21
Pursuant to the requirements of the Securities Exchange Act of 1934 and the Investment Company Act of 1940, this report has been signed below by the following persons on behalf of the registrant and in the capacities and on the dates indicated.
By (Signature and Title)
* /s/ Michael D. Cohen
Michael D. Cohen, President
Date 12/7/21
By (Signature and Title)
* /s/ Destiny Poninski
Destiny Poninski, Treasurer
Date 12/7/21
* Print the name and title of each signing officer under his or her signature.