united states
securities and exchange commission
washington, d.c. 20549
form n-csr
certified shareholder report of registered management
investment companies
Investment Company Act file number 811-22549
Northern Lights Fund Trust II
(Exact name of registrant as specified in charter)
225 Pictoria Dr, Ste 450 Cincinnati, Ohio 45246
(Address of principal executive offices) (Zip code)
Kevin E. Wolf, Gemini Fund Services, LLC.
80 Arkay Drive, Suite 110., Hauppauge, NY 11788
(Name and address of agent for service)
Registrant's telephone number, including area code: 631-470-2600
Date of fiscal year end: 10/31
Date of reporting period: 10/31/20
Item 1. Reports to Stockholders.
| |
 |
| |
| |
| |
| |
| Invenomic Fund |
| Institutional Class |
| BIVIX |
| Investor Class |
| BIVRX |
| Super Institutional Class |
| BIVSX |
| |
| |
| |
| |
| |
| Annual Report |
| October 31, 2020 |
| |
| |
| |
| |
| |
| 1-855-466-3406 |
| www.Invenomic.com |
| Distributed by Northern Lights Distributors, LLC |
| Member FINRA |
| |
| |
| |
Beginning on January 1, 2021, as permitted by regulations adopted by the Securities and Exchange Commission, paper copies of the Fund’s shareholder reports like this one will no longer be sent by mail, unless you specifically request paper copies of the reports. Instead, the reports will be made available on the Fund’s website www.Invenomic.com, and you will be notified by mail each time a report is posted and provided with a website link to access the report.
If you already elected to receive shareholder reports electronically, you will not be affected by this change and you need not take any action. You may elect to receive shareholder reports and other communications from the Fund electronically by contacting your financial intermediary (such as a broker-dealer or bank) or, if you are a direct investor, by following the instructions included with paper Fund documents that have been mailed to you.
Dear Shareholders,
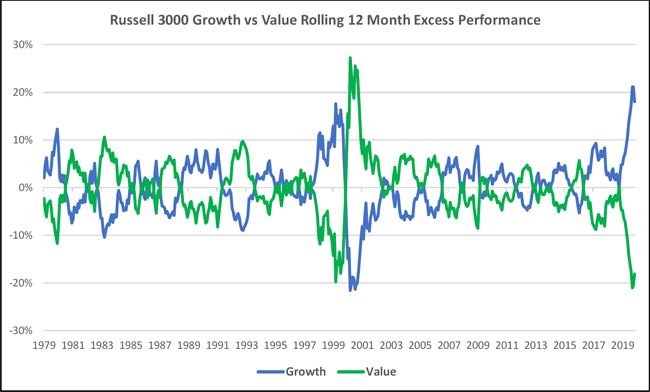
For the 12-month period ending October 31, 2020, the Fund (ticker: BIVIX) returned -3.88% compared to 8.56% for the S&P 1500 Index, 10.15% for the Russell 3000 Index and -0.38% for Morningstar Long/Short Category Average. During this period, the Russell 3000 Growth Index returned 28.20% and the Russell 3000 Value Index lost -8.00% resulting in value underperforming growth by over 36%. This is one of the widest 12-month performance differentials in the past 40 years.
Source: Invenomic, Morningstar
Our long portfolio returned 16.32% during the last 12 months while our short portfolio lost 16.31%, gross of fees. As value investors we tend to be long cheap companies and short expensive companies. This set up was very challenging over the last 12 months as expensive companies outperformed inexpensive companies by one of the widest margins in history. We believe the catalyst for this environment was the Coronavirus pandemic. Investors ran to technology companies under the belief that they are in the best position in the current environment. Conversely, investors ran away from businesses with any degree of cyclicality or ties to the “old economy”. Uncertainty about the pandemic has caused investors to become very short-term focused, chasing the stocks that are up the most and selling the ones that are down. This is most apparent when looking at the performance of the Goldman Sachs High Beta Momentum Index which has returned more than 40% over the last 12 months.
From a sector perspective, consumer discretionary was our biggest contributor over the last 12 months adding 1,066 basis point to performance. We generated profits in both the long and short portfolios, with longs adding 959 basis points and shorts adding 107 basis points. Materials was the next best performing sector, adding 429 basis points to performance. We were profitable in both the long and the short portfolios, with longs adding 390 basis points and shorts adding 39 basis points. Information technology was the biggest detractor from a sector perspective during the period, costing the fund 967 basis points. The short portfolio was the driver of the loss, costing the fund approximately 1,077 basis points while the long portfolio added 110 basis points. Energy was the next worst performing sector detracting 401 basis points to performance. The loss was almost entirely driven from the long portfolio. All attribution discussed in this paragraph is gross of fees.
Given the extreme headwind to value biased strategies, we feel we have navigated the current environment well. As the pandemic begins to wind down, we see a very large rotation coming out of growth stocks and into value stocks.
7440-NLD-11/19/2020
| Invenomic Fund |
| PORTFOLIO REVIEW (Unaudited) |
| October 31, 2020 |
| |
The fund’s performance figures* for the periods ended October 31, 2020, compared to its benchmarks:
| | | Annualized | Annualized |
| | One Year | Since Inception (a) | Since Inception (b) |
| Invenomic Fund Institutional Class | (4.06)% | N/A | 4.73% |
| Invenomic Fund Investor Class | (4.27)% | N/A | 4.45% |
| Invenomic Fund Super Institutional Class | (3.88)% | (2.30)% | N/A |
| Russell 3000 Total Return Index (c) | 10.15% | 10.73% | 10.72% |
| S&P Composite 1500 Total Return Index (d) | 8.56% | 9.94% | 10.34% |
| | | | |
Comparison of the Change in Value of a $50,000 Investment
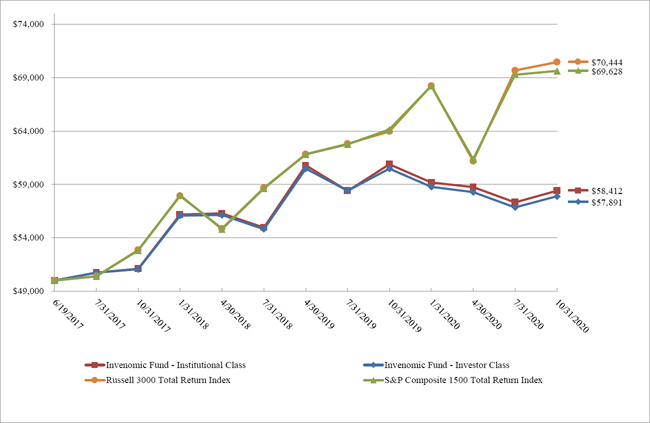
| * | The Performance data quoted is historical. Past performance is no guarantee of future results. Current performance may be higher or lower than the performance data quoted. The principal value and investment return of an investment will fluctuate so that your shares, when redeemed, may be worth more or less than their original cost. The returns shown do not reflect the deduction of taxes that a shareholder would pay on Fund distributions or on the redemptions of Fund shares. Returns greater than 1 year are annualized. The total operating expenses as stated in the fee table to the Fund’s prospectus dated March 1, 2020 are 2.84%, 3.09% and 2.59% for the Institutional Class, Investor Class and Super Institutional Class, respectively. For performance information current to the most recent month-end, please call 1-855-466-3406. |
| (a) | Inception date is May 10, 2019. |
| (b) | Inception date is June 19, 2017 |
| (c) | The Russell 3000 Total Return Index is a market capitalization weighted equity index maintained by the FTSE Russell that provides exposure to the entire U.S. stock market. The index tracks the performance of the 3,000 largest U.S.-traded stocks which represent about 98% of all U.S incorporated equity securities. Index returns assume reinvestment of dividends. Investors may not invest in the Index directly; unlike the Fund’s returns, the Index does not reflect any fees or expenses. |
| (d) | The S&P Composite 1500 Total Return Index combines three leading indices, the S&P 500, the S&P MidCap 400, and the S&P SmallCap 600, to cover approximately 90% of U.S. market capitalization. It is designed for investors seeking to replicate the performance of the U.S. equity market or benchmark against a representative universe of tradable stocks. Index returns assume reinvestment of dividends. Investors may not invest in the Index directly; unlike the Fund’s returns, the Index does not reflect any fees or expenses. |
| Holdings By Industry/Asset Type (1) | | % of Net Assets | |
| Commercial Support Services | | | 7.8 | % |
| Chemicals | | | 7.4 | % |
| Retail - Discretionary | | | 7.1 | % |
| Technology Hardware | | | 6.8 | % |
| Consumer Services | | | 6.8 | % |
| Banking | | | 5.1 | % |
| Asset Management | | | 4.5 | % |
| Oil & Gas Producers | | | 4.5 | % |
| Home & Office Products | | | 3.6 | % |
| Health Care Facilities & Services | | | 3.6 | % |
| Other Assets Less Liabilities | | | 42.8 | % |
| | | | 100.0 | % |
| | | | | |
| (1) | Does not include securities sold short and derivatives in which the fund invests. |
Please refer to the Portfolio of Investments in this annual report for a detailed analysis of the Fund’s holdings.
| Invenomic Fund |
| PORTFOLIO OF INVESTMENTS |
| October 31, 2020 |
| Shares | | | | | Fair Value | |
| | | | | COMMON STOCK - 111.0% | | | | |
| | | | | ADVERTISING & MARKETING - 0.0% | | | | |
| | 4,406 | | | Cxloyalty Group Holdings, Inc. * @ | | $ | — | |
| | | | | | | | | |
| | | | | AEROSPACE & DEFENSE - 0.1% | | | | |
| | 9,938 | | | Park Aerospace Corp. | | | 105,243 | |
| | | | | | | | | |
| | | | | APPAREL & TEXTILE PRODUCTS - 2.6% | | | | |
| | 116,242 | | | Capri Holdings Ltd. * + | | | 2,466,655 | |
| | 35,791 | | | Culp, Inc. + | | | 444,166 | |
| | 29,399 | | | Unifi, Inc. * + | | | 440,691 | |
| | | | | | | | 3,351,512 | |
| | | | | ASSET MANAGEMENT - 4.5% | | | | |
| | 79,025 | | | Blucora, Inc. * + | | | 786,299 | |
| | 23,404 | | | Diamond Hill Investment Group, Inc. + | | | 3,204,944 | |
| | 9,987 | | | GoldMoney, Inc. | | | 16,478 | |
| | 1,631 | | | Raymond James Financial, Inc. + | | | 124,674 | |
| | 23,267 | | | Sprott, Inc. + | | | 694,520 | |
| | 61,796 | | | Waddell & Reed Financial, Inc. # | | | 948,569 | |
| | | | | | | | 5,775,484 | |
| | | | | AUTOMOTIVE - 2.8% | | | | |
| | 7,114 | | | BorgWarner, Inc. | | | 248,848 | |
| | 48,446 | | | Cooper-Standard Holdings, Inc. * + | | | 760,118 | |
| | 14,759 | | | Lear Corp. + | | | 1,783,035 | |
| | 99,420 | | | Tenneco, Inc. * # | | | 857,000 | |
| | | | | | | | 3,649,001 | |
| | | | | BANKING - 5.1% | | | | |
| | 20,562 | | | Citigroup, Inc. + | | | 851,678 | |
| | 464,955 | | | First BanCorp. + | | | 3,017,558 | |
| | 88,140 | | | Huntington Bancshares, Inc. # + | | | 920,182 | |
| | 23,471 | | | Union Bankshares, Inc. # | | | 487,727 | |
| | 58,282 | | | Wells Fargo & Co. + | | | 1,250,149 | |
| | | | | | | | 6,527,294 | |
| | | | | BEVERAGES - 2.1% | | | | |
| | 74,532 | | | Molson Coors Beverage Co. + | | | 2,627,998 | |
| | | | | | | | | |
| | | | | BIOTECH & PHARMACEUTICALS - 2.8% | | | | |
| | 151,428 | | | Bausch Health Cos., Inc. * + | | | 2,498,562 | |
| | 76,422 | | | Mylan NV * + | | | 1,111,176 | |
| | | | | | | | 3,609,738 | |
| | | | | CHEMICALS - 7.4% | | | | |
| | 18,902 | | | Cabot Corp. + | | | 718,465 | |
| | 2,958 | | | Eastman Chemical Co. + | | | 239,125 | |
| | 42,013 | | | Imerys SA + | | | 1,254,792 | |
| | 23,502 | | | Mosaic Co. + | | | 434,787 | |
| | 149,607 | | | Neo Performance Materials, Inc. + | | | 1,306,053 | |
| | 109,968 | | | Orion Engineered Carbons SA + | | | 1,613,231 | |
| | 145,529 | | | Tronox Holdings PLC | | | 1,421,818 | |
| | 58,445 | | | Valhi, Inc. | | | 794,852 | |
| | 38,339 | | | W R Grace & Co. + | | | 1,667,363 | |
| | | | | | | | 9,450,486 | |
| | | | | COMMERCIAL SUPPORT SERVICES - 7.8% | | | | |
| | 38,399 | | | BrightView Holdings, Inc. * + | | | 469,620 | |
| | 7,737 | | | Cypress Environmental Partners LP | | | 16,170 | |
| | 193,042 | | | Emerald Holding, Inc. | | | 505,770 | |
| | 207,852 | | | H&R Block, Inc. + | | | 3,587,526 | |
| | 199,386 | | | Heidrick & Struggles International, Inc. + | | | 4,555,970 | |
| | 28,534 | | | SP Plus Corp. * | | | 525,882 | |
| | 24,420 | | | TrueBlue, Inc. * | | | 378,998 | |
| | | | | | | | 10,039,936 | |
| | | | | CONSTRUCTION MATERIALS - 0.3% | | | | |
| | 105,967 | | | Cemex SAB de CV - ADR | | | 439,763 | |
| | | | | | | | | |
| | | | | CONSUMER SERVICES - 6.8% | | | | |
| | 76,891 | | | Adtalem Global Education, Inc. * + | | | 1,802,325 | |
| | 149,528 | | | K12, Inc. * + | | | 3,569,233 | |
| | 45,613 | | | Matthews International Corp. | | | 995,732 | |
| | 51,720 | | | Select Interior Concepts, Inc. * | | | 357,902 | |
| | 3,356 | | | Strategic Education, Inc. # | | | 278,749 | |
| | 78,908 | | | WW International, Inc. * + | | | 1,669,693 | |
| | | | | | | | 8,673,634 | |
| | | | | CONTAINERS & PACKAGING - 0.2% | | | | |
| | 32,407 | | | O-I Glass, Inc. + | | | 305,598 | |
| | | | | | | | | |
| | | | | ELECTRIC UTILITIES - 0.2% | | | | |
| | 85,370 | | | Charah Solutions, Inc. * # | | | 240,743 | |
| | | | | | | | | |
| | | | | ELECTRICAL EQUIPMENT - 2.8% | | | | |
| | 55,268 | | | Belden, Inc. + | | | 1,706,676 | |
| | 351,938 | | | Houston Wire & Cable Co. * + | | | 967,830 | |
| | 17,075 | | | Preformed Line Products Co. + | | | 939,637 | |
| | | | | | | | 3,614,143 | |
| | | | | ELECTRIC - 2.1% | | | | |
| | 15,377 | | | MasTec, Inc. * + | | | 763,314 | |
| | 457,730 | | | Mistras Group, Inc. * + | | | 1,702,756 | |
| | 14,531 | | | Primoris Services Corp. | | | 274,200 | |
| | | | | | | | 2,740,270 | |
| | | | | ENTERTAINMENT CONTENT - 3.3% | | | | |
| | 23,396 | | | Corus Entertainment, Inc. + | | | 61,765 | |
| | 5,638 | | | Discovery, Inc. - Class A * # | | | 114,113 | |
| | 105,826 | | | Discovery, Inc. - Class C * + | | | 1,938,732 | |
| | 3,944 | | | Electronic Arts, Inc. * + | | | 472,610 | |
| | 58,394 | | | ViacomCBS, Inc. + | | | 1,668,317 | |
| | | | | | | | 4,255,537 | |
| | | | | FOOD - 0.6% | | | | |
| | 16,193 | | | Fresh Del Monte Produce, Inc. + | | | 348,635 | |
| | 16,523 | | | Nomad Foods Ltd. * + | | | 400,683 | |
| | | | | | | | 749,318 | |
| | | | | | | | | |
See accompanying notes to financial statements.
| Invenomic Fund |
| PORTFOLIO OF INVESTMENTS (Continued) |
| October 31, 2020 |
| Shares | | | | | Fair Value | |
| | | | | COMMON STOCK (Continued) - 111.0% | | | | |
| | | | | GAS & WATER UTILITIES - 1.3% | | | | |
| | 52,167 | | | UGI Corp. + | | $ | 1,687,081 | |
| | | | | | | | | |
| | | | | HEALTH CARE FACILITIES & SERVICES - 3.6% | | | | |
| | 38,068 | | | Cardinal Health, Inc. + | | | 1,743,134 | |
| | 5,179 | | | CVS Health Corp. + | | | 290,490 | |
| | 94,481 | | | Psychemedics Corp. | | | 356,193 | |
| | 20,054 | | | Universal Health Services, Inc. + | | | 2,196,916 | |
| | | | | | | | 4,586,733 | |
| | | | | HOME & OFFICE PRODUCTS - 3.6% | | | | |
| | 319,709 | | | Dorel Industries, Inc. * + | | | 3,450,416 | |
| | 53,353 | | | Hamilton Beach Brands Holding Co. + | | | 1,176,434 | |
| | | | | | | | 4,626,850 | |
| | | | | HOME CONSTRUCTION - 0.7% | | | | |
| | 87,486 | | | Caesarstone Ltd. + | | | 844,240 | |
| | | | | | | | | |
| | | | | HOUSEHOLD PRODUCTS - 0.3% | | | | |
| | 113,000 | | | Mav Beauty Brands, Inc. * | | | 327,978 | |
| | | | | | | | | |
| | | | | INDUSTRIAL INTERMEDIATE PRODUCTS - 0.9% | | | | |
| | 48,959 | | | Park-Ohio Holdings Corp. | | | 966,451 | |
| | 47,071 | | | Steel Partners Holdings LP * | | | 251,359 | |
| | | | | | | | 1,217,810 | |
| | | | | INDUSTRIAL SUPPORT SERVICES - 0.3% | | | | |
| | 29,283 | | | Titan Machinery, Inc. * + | | | 438,952 | |
| | | | | | | | | |
| | | | | INSTITUTIONAL FINANCIAL SERVICES - 2.0% | | | | |
| | 9,035 | | | Goldman Sachs Group, Inc. + | | | 1,707,976 | |
| | 23,969 | | | Lazard Ltd. + | | | 807,036 | |
| | | | | | | | 2,515,012 | |
| | | | | INSURANCE - 2.4% | | | | |
| | 29,211 | | | Prudential Financial, Inc. + | | | 1,870,088 | |
| | 11,951 | | | Reinsurance Group of America, Inc. | | | 1,207,290 | |
| | | | | | | | 3,077,378 | |
| | | | | INTERNET MEDIA & SERVICES - 2.7% | | | | |
| | 221,542 | | | HyreCar, Inc. * + | | | 759,889 | |
| | 19,451 | | | SRAX, Inc. * | | | 50,573 | |
| | 362,151 | | | Travelzoo * + | | | 2,687,160 | |
| | | | | | | | 3,497,622 | |
| | | | | LEISURE FACILITIES & SERVICES - 0.6% | | | | |
| | 19,571 | | | Cedar Fair LP | | | 509,042 | |
| | 170,046 | | | Drive Shack, Inc. * # | | | 249,968 | |
| | | | | | | | 759,010 | |
| | | | | MACHINERY - 0.9% | | | | |
| | 32,832 | | | MTS Systems Corp. + | | | 797,161 | |
| | 131,364 | | | Titan International, Inc. | | | 361,251 | |
| | | | | | | | 1,158,412 | |
| | | | | MEDICAL EQUIPMENT & DEVICES - 1.9% | | | | |
| | 43,875 | | | Biolase, Inc. * | | | 11,408 | |
| | 21,880 | | | Inogen, Inc. * # | | | 639,115 | |
| | 412,551 | | | IRIDEX Corp. * + | | | 734,341 | |
| | 20,353 | | | Natus Medical, Inc. * | | | 370,628 | |
| | 285,587 | | | Sensus Healthcare, Inc. * | | | 708,256 | |
| | | | | | | | 2,463,748 | |
| | | | | METALS & MINING - 3.1% | | | | |
| | 256,553 | | | Gold Standard Ventures Corp. * | | | 175,713 | |
| | 2,867 | | | Kaiser Aluminum Corp. | | | 180,420 | |
| | 128,991 | | | Kinross Gold Corp. + | | | 1,028,058 | |
| | 13,710 | | | NACCO Industries, Inc. | | | 267,208 | |
| | 129,143 | | | Osisko Mining, Inc. * | | | 357,726 | |
| | 152,930 | | | Teck Resources Ltd. # + | | | 2,009,500 | |
| | | | | | | | 4,018,625 | |
| | | | | OIL & GAS PRODUCERS - 4.5% | | | | |
| | 242,350 | | | Blueknight Energy Partners LP | | | 336,867 | |
| | 25,063 | | | Bonanza Creek Energy, Inc. * + | | | 443,866 | |
| | 11,960 | | | EQT Corp. | | | 181,074 | |
| | 449,501 | | | Freehold Royalties Ltd. + | | | 1,243,979 | |
| | 373,952 | | | Reconnaissance Energy Africa Ltd. * | | | 258,024 | |
| | 10,017 | | | Valero Energy Corp. + | | | 386,756 | |
| | 135,405 | | | World Fuel Services Corp. + | | | 2,850,275 | |
| | | | | | | | 5,700,841 | |
| | | | | OIL & GAS SERVICES & EQUIPMENT - 0.2% | | | | |
| | 347,442 | | | Profire Energy, Inc. * | | | 226,185 | |
| | | | | | | | | |
| | | | | REAL ESTATE SERVICES - 0.4% | | | | |
| | 18,970 | | | RMR Group, Inc. + | | | 505,740 | |
| | | | | | | | | |
| | | | | REIT - 3.1% | | | | |
| | 82,843 | | | Braemar Hotels & Resorts, Inc. # | | | 200,480 | |
| | 603,413 | | | Tanger Factory Outlet Centers, Inc. # + | | | 3,735,126 | |
| | | | | | | | 3,935,606 | |
| | | | | RETAIL - CONSUMER STAPLES - 2.9% | | | | |
| | 607,694 | | | Naked Wines PLC | | | 3,665,519 | |
| | | | | | | | | |
| | | | | RETAIL - DISCRETIONARY - 7.1% | | | | |
| | 140,013 | | | Caleres, Inc. + | | | 1,075,300 | |
| | 57,239 | | | Children’s Place, Inc. + | | | 1,446,430 | |
| | 20,232 | | | Foot Locker, Inc. + | | | 746,156 | |
| | 64,754 | | | Genesco, Inc. * + | | | 1,147,441 | |
| | 66,336 | | | Kohl’s Corp. # + | | | 1,412,293 | |
| | 264,624 | | | Michaels Cos., Inc. * + | | | 2,146,101 | |
| | 41,193 | | | Tilly’s, Inc. + | | | 252,925 | |
| | 130,317 | | | Vera Bradley, Inc. * + | | | 826,210 | |
| | | | | | | | 9,052,856 | |
| | | | | | | | | |
See accompanying notes to financial statements.
| Invenomic Fund |
| PORTFOLIO OF INVESTMENTS (Continued) |
| October 31, 2020 |
| Shares | | | | | | | | | | | | | | | | | Fair Value | |
| | | | | COMMON STOCK (Continued) - 111.0% | | | | | | |
| | | | | SOFTWARE - 2.4% | | | | | | |
| | 37,959 | | | Donnelley Financial Solutions, Inc. * + | | | | $ | 479,422 | |
| | 73,327 | | | Immersion Corp. * + | | | | | 451,694 | |
| | 19,338 | | | J2 Global, Inc. * + | | | | | 1,312,663 | |
| | 64,183 | | | Xperi Holding Corp. + | | | | | 795,869 | |
| | | | | | | | | | | | | | | | | | | | 3,039,648 | |
| | | | | STEEL - 1.3% | | | | | | |
| | 145,237 | | | Ryerson Holding Corp. * + | | | | | 1,143,015 | |
| | 9,320 | | | Steel Dynamics, Inc. | | | | | 293,394 | |
| | 34,030 | | | Universal Stainless & Alloy Products, Inc. * + | | | | | 184,783 | |
| | | | | | | | | | 1,621,192 | |
| | | | | TECHNOLOGY HARDWARE - 6.8% | | | | | | |
| | 36,211 | | | AstroNova, Inc. | | | | | 286,067 | |
| | 118,387 | | | Celestica, Inc. * + | | | | | 694,932 | |
| | 45,926 | | | Cisco Systems, Inc. + | | | | | 1,648,743 | |
| | 22,737 | | | Comtech Telecommunications Corp. | | | | | 327,413 | |
| | 11,133 | | | F5 Networks, Inc. * + | | | | | 1,480,021 | |
| | 2,697 | | | Flex Ltd. * | | | | | 38,163 | |
| | 23,764 | | | Gilat Satellite Networks Ltd. * | | | | | 142,346 | |
| | 88,197 | | | NCR Corp. * + | | | | | 1,792,163 | |
| | 38,974 | | | Sanmina Corp. * + | | | | | 952,525 | |
| | 221,606 | | | TESSCO Technologies, Inc. + | | | | | 1,351,797 | |
| | | | | | | | | | 8,714,170 | |
| | | | | TECHNOLOGY SERVICES - 0.7% | | | | | | |
| | 49,541 | | | CPI Card Group, Inc. * | | | | | 132,274 | |
| | 10,049 | | | CSG Systems International, Inc. | | | | | 380,656 | |
| | 116,469 | | | Priority Technology Holdings, Inc. * # | | | | | 336,595 | |
| | | | | | | | | | | | | | | | | | | | 849,525 | |
| | | | | TELECOMMUNICATIONS - 2.2% | | | | | | |
| | 72,025 | | | AT&T, Inc. | | | | | 1,946,116 | |
| | 96,953 | | | RigNet, Inc. * | | | | | 355,818 | |
| | 57,703 | | | Spok Holdings, Inc. + | | | | | 523,943 | |
| | | | | | | | | | 2,825,877 | |
| | | | | TOBACCO & CANNABIS - 0.5% | | | | | | |
| | 16,568 | | | Swedish Match AB - ADR + | | | | | 622,791 | |
| | | | | | | | | | | | | | | | | | | | | |
| | | | | TRANSPORTATION & LOGISTICS - 2.6% | | | | | | |
| | 2,447 | | | Copa Holdings SA | | | | | | | | | | | | | | | 120,588 | |
| | 284,115 | | | Costamare, Inc. + | | | | | | | | | | | | | | | 1,616,614 | |
| | 3,567 | | | FedEx Corp. + | | | | | | | | | | | | | �� | | 925,529 | |
| | 127,484 | | | Radiant Logistics, Inc. * | | | | | | | | | | | | | | | 655,268 | |
| | | | | | | | | | | | | | | | | | | | 3,317,999 | |
| | | | | WHOLESALE - DISCRETIONARY - 0.5% | | | | | | |
| | 24,102 | | | G-III Apparel Group Ltd. * # + | | | | | 324,895 | |
| | 11,911 | | | LKQ Corp. * + | | | | | | | | | | | | | | | 381,033 | |
| | | | | | | | | | | | | | | | | | | | 705,928 | |
| | | | | | | | | | | | | | | | | | | | | |
| | | | | TOTAL COMMON STOCK (Cost - $138,202,422) | | | | | 142,159,026 | |
| | | | | | | | | | | | | | | | | | | | | |
| | | | | | | | | | | Expiration Date | | Exercise Price | | | | |
| | | | | WARRANTS - 0.2% | | | | | | | | | | | |
| | 181,735 | | | Ampco-Pittsburgh Corp. * | | | 8/4/2025 | | $ | 3.50 | | | $ | 108,141 | |
| | 108,964 | | | Experience Investment Corp. * | | | 9/2/2026 | | | 11.50 | | | | 104,061 | |
| | | | | TOTAL WARRANTS (Cost - $66,032) | | | | | 212,202 | |
| | | | | | | | | | | | | | | | | | | | | |
| Contracts ** | | | | | Counterparty | | Notional | | | Expiration Date | | Exercise Price | | | | | |
| | | | | OPTIONS PURCHASED - 0.3% | | | | | | |
| | | | | CALL OPTIONS PURCHASED - 0.3% | | | | | | |
| | 308 | | | Cardinal Health, Inc. | | Goldman Sachs | | $ | 1,694,000 | | | 11/20/2020 | | $ | 55.00 | | | $ | 3,080 | |
| | 209 | | | Cardinal Health, Inc. | | Goldman Sachs | | | 1,045,000 | | | 11/20/2020 | | | 50.00 | | | | 13,585 | |
| | 1,156 | | | CenturyLink, Inc. | | Goldman Sachs | | | 1,502,800 | | | 1/15/2021 | | | 13.00 | | | | 2,312 | |
| | 511 | | | CenturyLink, Inc. | | Goldman Sachs | | | 613,200 | | | 1/21/2022 | | | 12.00 | | | | 28,105 | |
| | 1,426 | | | CenturyLink, Inc. | | Goldman Sachs | | | 1,426,000 | | | 1/21/2022 | | | 10.00 | | | | 134,044 | |
| | 157 | | | K12, Inc. | | Goldman Sachs | | | 471,000 | | | 11/20/2020 | | | 30.00 | | | | 4,710 | |
| | 727 | | | Molson Coors Beverage Co. | | Goldman Sachs | | | 3,635,000 | | | 4/16/2021 | | | 50.00 | | | | 27,262 | |
| | 921 | | | Tanger Factory Outlet Centers, Inc. | | Goldman Sachs | | | 921,000 | | | 1/15/2021 | | | 10.00 | | | | 11,052 | |
| | 2,695 | | | Tanger Factory Outlet Centers, Inc. | | Goldman Sachs | | | 2,425,500 | | | 1/15/2021 | | | 9.00 | | | | 41,773 | |
| | 749 | | | Tanger Factory Outlet Centers, Inc. | | Goldman Sachs | | | 599,200 | | | 1/15/2021 | | | 8.00 | | | | 20,972 | |
| | 1,117 | | | Tanger Factory Outlet Centers, Inc. | | Goldman Sachs | | | 1,340,400 | | | 3/19/2021 | | | 12.00 | | | | 18,989 | |
| | 878 | | | Tanger Factory Outlet Centers, Inc. | | Goldman Sachs | | | 965,800 | | | 3/19/2021 | | | 11.00 | | | | 15,365 | |
| | 1,060 | | | ViacomCBS, Inc. | | Goldman Sachs | | | 5,830,000 | | | 1/15/2021 | | | 55.00 | | | | 3,710 | |
| | 602 | | | ViacomCBS, Inc. | | Goldman Sachs | | | 1,655,500 | | | 1/15/2021 | | | 27.50 | | | | 4,816 | |
| | | | | TOTAL CALL OPTIONS PURCHASED (Cost - $820,799) | | | | | 329,775 | |
| | | | | | | | | | | | | | | | | | | | | |
| | | | | PUT OPTIONS PURCHASED - 0.0% | | | | | | |
| | 5 | | | iShares Global Clean Energy ETF | | Goldman Sachs | | | 9,000 | | | 11/20/2020 | | | 18.00 | | | | 340 | |
| | 210 | | | Zillow Group, Inc. | | Goldman Sachs | | | 1,470,000 | | | 1/15/2021 | | | 70.00 | | | | 64,050 | |
| | | | | TOTAL PUT OPTIONS PURCHASED (Cost - $36,744) | | | | | 64,390 | |
| | | | | | | | | | | | | | | | | | | | | |
| | | | | TOTAL OPTIONS PURCHASED (Cost - $857,543) | | | | | 394,165 | |
| | | | | | | | | | | | | | | | | | | | | |
| Shares | | | | | | | | | | | | | | | | | | | |
| | | | | SHORT-TERM INVESTMENTS - 6.0% | | | | | | |
| | | | | COLLATERAL FOR SECURITIES LOANED - 3.1% | | | | | | |
| | 3,953,047 | | | Mount Vernon Liquid Assets Portfolio, LLC, 0.16% ^ (a) | | | | | 3,953,047 | |
| | | | | TOTAL COLLATERAL FOR SECURITIES LOANED (Cost $3,953,047) | | | | | | |
| | | | | | | | | | | | | | | | | | | | | |
| | | | | MONEY MARKET FUNDS - 2.9% | | | | | | |
| | 4,286,345 | | | First American Government Obligations Fund, Institutional Class, 0.05% ^ | | | | | 4,286,345 | |
| | | | | TOTAL MONEY MARKET FUNDS (Cost - $4,286,345) | | | | | | |
| | | | | | | | | | | | | | | | | | | | | |
| | | | | TOTAL SHORT-TERM INVESTMENTS (Cost - $8,239,392) | | | | | 8,239,392 | |
| | | | | | | | | | | | | | | | | | | | | |
| | | | | TOTAL INVESTMENTS - 117.5% (Cost - $147,365,389) | | | | $ | 151,004,785 | |
| | | | | CALL OPTIONS WRITTEN - (0.2)% (Proceeds - $333,146) | | | | | (253,575 | ) |
| | | | | SECURITIES SOLD SHORT - (78.8)% (Proceeds - $93,995,831) | | | | | (100,872,776 | ) |
| | | | | OTHER ASSETS LESS LIABILITIES - 61.5% | | | | | 78,195,463 | |
| | | | | NET ASSETS - 100.0% | | | | $ | 128,073,897 | |
| | | | | | | | | | | | | | | | | | | | | |
See accompanying notes to financial statements.
| Invenomic Fund |
| PORTFOLIO OF INVESTMENTS (Continued) |
| October 31, 2020 |
| Contracts ** | | | | | Counterparty | | Notional | | | Expiration Date | | Exercise Price | | | Fair Value | |
| | | | | OPTIONS WRITTEN - (0.2)% | | | | | | | | | | | |
| | | | | CALL OPTIONS WRITTEN - (0.2)% | | | | | | | | | | | | |
| | 133 | | | Nautilus, Inc. | | Goldman Sachs | | $ | 266,000 | | | 7/16/2021 | | $ | 20.00 | | | $ | 105,735 | |
| | 128 | | | Vital Farms, Inc. | | Goldman Sachs | | | 320,000 | | | 4/16/2021 | | | 25.00 | | | | 147,840 | |
| | | | | TOTAL OPTIONS WRITTEN (Proceeds - $333,146) | | | | | | | 253,575 | |
| Shares | | | | | | |
| | | | | SECURITIES SOLD SHORT - (78.8)% | | | | |
| | | | | ADVERTISING & MARKETING - (0.3)% | | | | |
| | 5,020 | | | Cardlytics, Inc. * | | | 370,576 | |
| | | | | | | | | |
| | | | | ASSET MANAGEMENT - (1.3)% | | | | |
| | 23,045 | | | Hamilton Lane, Inc. | | | 1,606,237 | |
| | | | | | | | | |
| | | | | AUTOMOTIVE - (1.8)% | | | | |
| | 3,373 | | | Ferrari NV | | | 601,811 | |
| | 4,463 | | | Tesla, Inc. * | | | 1,731,823 | |
| | | | | | | | 2,333,634 | |
| | | | | BANKING - (0.6)% | | | | |
| | 27,379 | | | First Financial Bankshares, Inc. | | | 816,168 | |
| | | | | | | | | |
| | | | | BEVERAGES - (1.3)% | | | | |
| | 1,463 | | | Boston Beer Co., Inc. * | | | 1,520,320 | |
| | 1,615 | | | Brown-Forman Corp. | | | 112,582 | |
| | | | | | | | 1,632,902 | |
| | | | | BIOTECH & PHARMACEUTICALS - (1.0)% | | | | |
| | 42,165 | | | Amphastar Pharmaceuticals, Inc. * | | | 826,012 | |
| | 4,393 | | | Neurocrine Biosciences, Inc. * | | | 433,457 | |
| | | | | | | | 1,259,469 | |
| | | | | CHEMICALS - (0.3)% | | | | |
| | 1,912 | | | Quaker Chemical Corp. | | | 364,791 | |
| | | | | | | | | |
| | | | | COMMERCIAL SUPPORT SERVICES - (3.1)% | | | | |
| | 12,868 | | | Avalara, Inc. * | | | 1,917,975 | |
| | 15,616 | | | Casella Waste Systems, Inc. * | | | 843,108 | |
| | 16,227 | | | Collectors Universe, Inc. | | | 891,349 | |
| | 7,180 | | | National Research Corp. | | | 371,924 | |
| | | | | | | | 4,024,356 | |
| | | | | CONSTRUCTION MATERIALS - (0.1)% | | | | |
| | 1,804 | | | Advanced Drainage Systems, Inc. | | | 114,428 | |
| | | | | | | | | |
| | | | | CONSUMER SERVICES - (2.4)% | | | | |
| | 10,612 | | | Bright Horizons Family Solutions, Inc. * | | | 1,677,227 | |
| | 19,615 | | | Chegg, Inc. * | | | 1,440,526 | |
| | | | | | | | 3,117,753 | |
| | | | | E - COMMERCE DISCRETIONARY - (0.8)% | | | | |
| | 4,277 | | | Wayfair, Inc. * | | | 1,060,824 | |
| | | | | | | | | |
| | | | | ELECTRICAL EQUIPMENT - (4.3)% | | | | |
| | 34,296 | | | AAON, Inc. | | | 2,003,229 | |
| | 18,514 | | | Cognex Corp. | | | 1,220,073 | |
| | 5,720 | | | Mesa Laboratories, Inc. | | | 1,495,265 | |
| | 7,700 | | | Novanta, Inc. * | | | 837,144 | |
| | | | | | | | 5,555,711 | |
| | | | | ENGINEERING & CONSTRUCTION - (0.6)% | | | | |
| | 7,921 | | | Installed Building Products, Inc. * | | | 717,167 | |
| | | | | | | | | |
| | | | | EXCHANGE - TRADED FUND - (0.6)% | | | | |
| | 14,338 | | | Direxion Daily S&P Biotech Bull 3X Shares ETF | | | 770,954 | |
| | | | | | | | | |
| | | | | FOOD - (3.1)% | | | | |
| | 10,977 | | | Beyond Meat, Inc. * | | | 1,563,454 | |
| | 12,737 | | | Hormel Foods Corp. | | | 620,165 | |
| | 584 | | | Lancaster Colony Corp. | | | 97,026 | |
| | 50,898 | | | Vital Farms, Inc. * | | | 1,759,035 | |
| | | | | | | | 4,039,680 | |
| | | | | FORESTRY, PAPER & WOOD PRODUCTS - (1.0)% | | | | |
| | 18,757 | | | Trex Co., Inc. * | | | 1,304,362 | |
| | | | | | | | | |
| | | | | GAS WATER & UTILITIES - (0.2)% | | | | |
| | 5,338 | | | York Water Co. | | | 225,531 | |
| | | | | | | | | |
| | | | | HEALTH CARE FACILITIES & SERVICES - (5.4)% | | | | |
| | 29,562 | | | Accolade, Inc. * | | | 1,035,261 | |
| | 19,346 | | | American Well Corp. * | | | 499,320 | |
| | 20,019 | | | Invitae Corp. * | | | 784,945 | |
| | 1,563 | | | Medpace Holdings, Inc. * | | | 173,399 | |
| | 41,237 | | | NeoGenomics, Inc. * | | | 1,617,728 | |
| | 43,563 | | | RadNet, Inc. * | | | 632,099 | |
| | 11,316 | | | Teladoc Health, Inc. * | | | 2,223,140 | |
| | | | | | | | 6,965,892 | |
| | | | | HOME & OFFICE PRODUCTS - (0.1)% | | | | |
| | 1,431 | | | Tempur Sealy International, Inc. * | | | 127,359 | |
| | | | | | | | | |
| | | | | HOME CONSTRUCTION - (0.4)% | | | | |
| | 6,292 | | | Masonite International Corp. * | | | 553,696 | |
| | | | | | | | | |
| | | | | INDUSTRIAL INTERMEDIATE PRODUCTS - (1.3)% | | | | |
| | 10,697 | | | Omega Flex, Inc. | | | 1,601,341 | |
| | | | | | | | | |
| | | | | INDUSTRIAL SUPPORT SERVICES - (0.9)% | | | | |
| | 10,011 | | | SiteOne Landscape Supply, Inc. * | | | 1,196,214 | |
| | | | | | | | | |
| | | | | INSURANCE - (1.4)% | | | | |
| | 3,475 | | | Kinsale Capital Group, Inc. | | | 651,458 | |
| | 5,042 | | | Lemonade, Inc. * | | | 253,562 | |
| | 10,859 | | | RLI Corp. | | | 941,475 | |
| | | | | | | | 1,846,495 | |
| | | | | | | | | |
See accompanying notes to financial statements.
| Invenomic Fund |
| PORTFOLIO OF INVESTMENTS (Continued) |
| October 31, 2020 |
| Shares | | | | | Fair Value | |
| | | | | SECURITIES SOLD SHORT (Continued) - (78.8)% | | | | |
| | | | | INTERNET MEDIA & SERVICES - (4.2)% | | | | |
| | 1,597 | | | Fiverr International Ltd. * | | $ | 233,833 | |
| | 1,036 | | | Netflix, Inc. * | | | 492,867 | |
| | 648 | | | Roku, Inc. * | | | 131,155 | |
| | 1,435 | | | Shopify, Inc. * | | | 1,327,992 | |
| | 13,320 | | | Snap, Inc. * | | | 524,675 | |
| | 26,383 | | | TechTarget, Inc. * | | | 1,155,575 | |
| | 2,175 | | | Zillow Group, Inc. - Class A * | | | 194,293 | |
| | 14,447 | | | Zillow Group, Inc. - Class C * | | | 1,280,293 | |
| | | | | | | | 5,340,683 | |
| | | | | LEISURE FACILITIES & SERVICES - (4.0)% | | | | |
| | 10,470 | | | Churchill Downs, Inc. | | | 1,561,601 | |
| | 6,274 | | | Penn National Gaming, Inc. * | | | 338,671 | |
| | 28,346 | | | Shake Shack, Inc. * | | | 1,913,922 | |
| | 5,658 | | | Vail Resorts, Inc. | | | 1,312,882 | |
| | | | | | | | 5,127,076 | |
| | | | | LEISURE PRODUCTS - (0.9)% | | | | |
| | 13,359 | | | Nautilus, Inc. * | | | 289,757 | |
| | 7,315 | | | Peloton Interactive, Inc. * | | | 806,186 | |
| | | | | | | | 1,095,943 | |
| | | | | MACHINERY - (1.8)% | | | | |
| | 13,747 | | | Graco, Inc. | | | 850,939 | |
| | 40,922 | | | Ingersoll Rand, Inc. * | | | 1,429,815 | |
| | | | | | | | 2,280,754 | |
| | | | | MEDICAL EQUIPMENT & DEVICES - (3.7)% | | | | |
| | 16,732 | | | AtriCure, Inc. * | | | 578,258 | |
| | 535 | | | DexCom, Inc. * | | | 170,975 | |
| | 9,998 | | | Natera, Inc. * | | | 672,465 | |
| | 10,023 | | | Neogen Corp. * | | | 699,004 | |
| | 8,993 | | | Novocure Ltd. * | | | 1,098,045 | |
| | 5,682 | | | Penumbra, Inc. * | | | 1,483,173 | |
| | | | | | | | 4,701,920 | |
| | | | | REAL ESTATE SERVICES - (1.3)% | | | | |
| | 38,545 | | | Redfin Corp. * | | | 1,610,025 | |
| | | | | | | | | |
| | | | | RENEWABLE ENERGY - (1.3)% | | | | |
| | 5,941 | | | Ameresco, Inc. * | | | 228,075 | |
| | 53,768 | | | Plug Power, Inc. * | | | 752,752 | |
| | 204 | | | SolarEdge Technologies, Inc. * | | | 52,569 | |
| | 11,167 | | | Sunrun, Inc. * | | | 580,907 | |
| | | | | | | | 1,614,303 | |
| | | | | RETAIL - DISCRETIONARY - (3.9)% | | | | |
| | 12,565 | | | Carvana Co. * | | | 2,328,923 | |
| | 32,412 | | | Hennes & Mauritz AB | | | 526,536 | |
| | 12,714 | | | Hibbett Sports, Inc. * | | | 480,716 | |
| | 16,529 | | | Lumber Liquidators Holdings, Inc. * | | | 365,621 | |
| | 25,439 | | | Sportsman’s Warehouse Holdings, Inc. * | | | 331,216 | |
| | 22,267 | | | Vroom, Inc. * | | | 915,174 | |
| | | | | | | | 4,948,186 | |
| | | | | SEMICONDUCTORS - (4.4)% | | | | |
| | 11,005 | | | Advanced Micro Devices, Inc. * | | | 828,566 | |
| | 18,785 | | | Cree, Inc. * | | | 1,194,726 | |
| | 21,496 | | | Marvell Technology Group Ltd. | | | 806,315 | |
| | 1,967 | | | NVIDIA Corp. | | | 986,175 | |
| | 9,433 | | | Universal Display Corp. | | | 1,870,658 | |
| | | | | | | | 5,686,440 | |
| | | | | SOFTWARE - (14.4)% | | | | |
| | 5,706 | | | Alteryx, Inc. * | | | 715,247 | |
| | 10,220 | | | Appfolio, Inc. * | | | 1,460,131 | |
| | 8,358 | | | Appian Corp. * | | | 529,061 | |
| | 3,106 | | | BigCommerce Holdings, Inc. * | | | 227,980 | |
| | 3,572 | | | Bill.com Holdings, Inc. * | | | 357,200 | |
| | 11,350 | | | Ceridian HCM Holding, Inc. * | | | 978,597 | |
| | 18,473 | | | Cloudflare, Inc. * | | | 960,042 | |
| | 4,112 | | | Coupa Software, Inc. * | | | 1,100,782 | |
| | 7,063 | | | Datadog, Inc. * | | | 640,967 | |
| | 4 | | | Dynatrace, Inc. * | | | 141 | |
| | 4,324 | | | Elastic NV * | | | 438,497 | |
| | 17,371 | | | Fastly, Inc. * | | | 1,103,232 | |
| | 16,108 | | | Guidewire Software, Inc. * | | | 1,548,140 | |
| | 173 | | | HubSpot, Inc. * | | | 50,182 | |
| | 20,175 | | | Jamf Holding Corp. * | | | 657,705 | |
| | 9,976 | | | Lightspeed POS, Inc. * | | | 319,531 | |
| | 1,484 | | | MongoDB, Inc. * | | | 339,050 | |
| | 3,509 | | | Paycom Software, Inc. * | | | 1,277,592 | |
| | 25,038 | | | Ping Identity Holding Corp. * | | | 693,302 | |
| | 2,349 | | | Q2 Holdings, Inc. * | | | 214,323 | |
| | 3,294 | | | RingCentral, Inc. * | | | 850,972 | |
| | 12,450 | | | Simulations Plus, Inc. | | | 807,009 | |
| | 8,401 | | | Smartsheet, Inc. * | | | 418,790 | |
| | 2,806 | | | Snowflake, Inc. * | | | 701,556 | |
| | 1,943 | | | Splunk, Inc. * | | | 384,792 | |
| | 22,392 | | | Sprout Social, Inc. * | | | 978,530 | |
| | 1,023 | | | Tyler Technologies, Inc. * | | | 393,221 | |
| | 2,059 | | | Zscaler, Inc. * | | | 279,509 | |
| | | | | | | | 18,426,081 | |
| | | | | SPECIALTY FINANCE - (1.8)% | | | | |
| | 14,827 | | | Afterpay Ltd. * | | | 1,006,762 | |
| | 1,439 | | | Credit Acceptance Corp. * | | | 428,995 | |
| | 2,535 | | | LendingTree, Inc. * | | | 820,301 | |
| | | | | | | | 2,256,058 | |
| | | | | TECHNOLOGY HARDWARE - (3.4)% | | | | |
| | 16,945 | | | Apple, Inc. | | | 1,844,633 | |
| | 45,068 | | | Inseego Corp. * | | | 392,092 | |
| | 19,566 | | | Kornit Digital Ltd. * | | | 1,317,183 | |
| | 7,438 | | | Vicor Corp. * | | | 580,164 | |
| | 7,882 | | | Vocera Communications, Inc. * | | | 258,372 | |
| | | | | | | | 4,392,444 | |
| | | | | | | | | |
See accompanying notes to financial statements.
| Invenomic Fund |
| PORTFOLIO OF INVESTMENTS (Continued) |
| October 31, 2020 |
| Shares | | | | | Fair Value | |
| | | | | SECURITIES SOLD SHORT (Continued) - (78.8)% | | | | |
| | | | | TECHNOLOGY SERVICES - (0.2)% | | | | |
| | 4,419 | | | Shift4 Payments, Inc. * | | $ | 224,971 | |
| | | | | | | | | |
| | | | | TELECOMMUNICATIONS - (0.5)% | | | | |
| | 14,160 | | | Shenandoah Telecommunications Co. | | | 617,659 | |
| | | | | | | | | |
| | | | | WHOLESALE - DISCRETIONARY - (0.7)% | | | | |
| | 12,014 | | | IAA, Inc. * | | | 679,872 | |
| | 757 | | | Pool Corp. | | | 264,821 | |
| | | | | | | | 944,693 | |
| �� | | | | | | | | |
| | | | | SECURITIES SOLD SHORT (Proceeds - $93,995,831) | | $ | 100,872,776 | |
| | | | | | | | | |
ADR - American Depositary Receipt
ETF - Exchange-Traded Fund
LLC - Limited Liability Company
LP - Limited Partnership
PLC - Public Limited Company
| * | | Non-income producing security. |
| @ | | Fair valued security, the value of this security has been determined in good faith under the policies of the Board of Trustees. |
| # | | All or a portion of this security is on loan. The market value of loaned securities is $3,768,025. |
| + | | All or a portion of the security is held as collateral for written options and securities sold short. |
| ** | | Each option contract allows the holder of the option to purchase or sell 100 shares of the underlying security. |
| ^ | | Money market fund; interest rate reflects effective yield on October 31, 2020. |
| (a) | | Security was purchased with cash received as collateral for securities on loan at October 31, 2020. Total collateral had a value of $3,953,047 at October 31, 2020. |
See accompanying notes to financial statements.
| Invenomic Fund |
| STATEMENT OF ASSETS AND LIABILITIES |
| October 31, 2020 |
| ASSETS | | | | |
| Investment securities: | | | | |
| At cost | | $ | 147,365,389 | |
| At value | | $ | 151,004,785 | |
| Cash collateral segregated for short sales | | | 84,150,109 | |
| Foreign Currency (Cost $1,119,904) | | | 1,158,660 | |
| Receivable for securities sold | | | 5,926,588 | |
| Dividends and interest receivable | | | 79,359 | |
| Prepaid expenses and other assets | | | 63,895 | |
| Receivable for Fund shares sold | | | 23,635 | |
| TOTAL ASSETS | | | 242,407,031 | |
| | | | | |
| LIABILITIES | | | | |
| Securities sold short (Proceeds - $93,995,831) | | | 100,872,776 | |
| Due to Custodian | | | 598,556 | |
| Securities lending collateral | | | 3,953,047 | |
| Payable for investments purchased | | | 8,370,839 | |
| Options written (Proceeds $333,146) | | | 253,575 | |
| Investment advisory fees payable | | | 158,914 | |
| Dividends payable on securities sold short | | | 58,334 | |
| Shareholder servicing fees payable | | | 27,624 | |
| Payable for Fund shares redeemed | | | 6,133 | |
| Payable to related parties | | | 5,707 | |
| Distribution (12b-1) fees payable | | | 1,275 | |
| Accrued expenses and other liabilities | | | 26,354 | |
| TOTAL LIABILITIES | | | 114,333,134 | |
| NET ASSETS | | $ | 128,073,897 | |
| | | | | |
| NET ASSETS CONSIST OF: | | | | |
| Paid in capital | | $ | 141,125,950 | |
| Accumulated loss | | | (13,052,053 | ) |
| NET ASSETS | | $ | 128,073,897 | |
| | | | | |
| NET ASSET VALUE PER SHARE: | | | | |
| Institutional Class: | | | | |
| Net Assets | | $ | 122,104,959 | |
| Shares of beneficial interest outstanding ($0 par value, unlimited shares authorized) | | | 11,440,989 | |
| Net asset value (Net Assets ÷ Shares Outstanding), offering price and redemption price per share (a) | | $ | 10.67 | |
| | | | | |
| Investor Class: | | | | |
| Net Assets | | $ | 5,933,318 | |
| Shares of beneficial interest outstanding ($0 par value, unlimited shares authorized) | | | 561,204 | |
| Net asset value (Net Assets ÷ Shares Outstanding), offering price and redemption price per share (a) | | $ | 10.57 | |
| | | | | |
| Super Institutional Class: | | | | |
| Net Assets | | $ | 35,620 | |
| Shares of beneficial interest outstanding ($0 par value, unlimited shares authorized) | | | 3,329 | |
| Net asset value (Net Assets ÷ Shares Outstanding), offering price and redemption price per share (a) | | $ | 10.70 | |
| | | | | |
| (a) | Redemptions made within 60 days of purchases may be assessed a redemption fee of 1.00%. |
See accompanying notes to financial statements.
| Invenomic Fund |
| STATEMENT OF OPERATIONS |
| For the Year Ended October 31, 2020 |
| INVESTMENT INCOME | | | | |
| Dividends (net of foreign tax withheld of $125,984) | | $ | 3,219,931 | |
| Interest | | | 56,354 | |
| Securities lending income - net | | | 199,221 | |
| TOTAL INVESTMENT INCOME | | | 3,475,506 | |
| | | | | |
| EXPENSES | | | | |
| Investment advisory fees | | | 2,900,232 | |
| Distribution (12b-1) fees: | | | | |
| Investor Class | | | 25,212 | |
| Dividends on securities sold short | | | 944,005 | |
| Shareholder service fees - Institutional Class | | | 370,424 | |
| Administration fees | | | 196,672 | |
| Third party administrative servicing fees | | | 133,388 | |
| Registration fees | | | 75,001 | |
| Interest expense | | | 74,415 | |
| Custodian fees | | | 37,786 | |
| Legal fees | | | 37,738 | |
| Trustees fees and expenses | | | 28,996 | |
| Shareholder service fees - Investor Class | | | 25,212 | |
| Compliance officer fees | | | 23,327 | |
| Printing expense | | | 23,116 | |
| Insurance expense | | | 20,478 | |
| Audit fees | | | 19,603 | |
| Other expenses | | | 20,973 | |
| TOTAL EXPENSES | | | 4,956,578 | |
| | | | | |
| Less: Fees waived by the Advisor | | | (223,856 | ) |
| | | | | |
| NET EXPENSES | | | 4,732,722 | |
| | | | | |
| NET INVESTMENT LOSS | | | (1,257,216 | ) |
| | | | | |
| REALIZED AND UNREALIZED GAIN (LOSS) ON INVESTMENTS | | | | |
| Net realized gain (loss) on: | | | | |
| Investments | | | 10,562,175 | |
| Foreign currency transactions | | | 17,021 | |
| Options purchased | | | (44,534 | ) |
| Options written | | | (184,884 | ) |
| Securities sold short | | | (16,524,164 | ) |
| | | | (6,174,386 | ) |
| Net change in unrealized appreciation (depreciation) on: | | | | |
| Investments | | | (599,306 | ) |
| Foreign currency translations | | | 48,105 | |
| Options purchased | | | (582,555 | ) |
| Options written | | | (227,265 | ) |
| Securities sold short | | | (6,810,143 | ) |
| | | | (8,171,164 | ) |
| | | | | |
| NET REALIZED AND UNREALIZED LOSS ON INVESTMENTS | | | (14,345,550 | ) |
| | | | | |
| NET DECREASE IN NET ASSETS | | $ | (15,602,766 | ) |
| | | | | |
See accompanying notes to financial statements.
| Invenomic Fund |
| STATEMENTS OF CHANGES IN NET ASSETS |
| | | For the | | | For the | |
| | | Year Ended | | | Year Ended | |
| | | October 31, 2020 | | | October 31, 2019 | |
| FROM OPERATIONS | | | | | | | | |
| Net investment loss | | $ | (1,257,216 | ) | | $ | (934,115 | ) |
| Net realized gain (loss) from investments, foreign currency transactions, options purchased, and securities sold short | | | (6,174,386 | ) | | | 6,824,849 | |
| Net change in unrealized appreciation (depreciation) on investments, securities sold short, options purchased, options written and foreign currency translations | | | (8,171,164 | ) | | | 5,273,101 | |
| Net increase (decrease) in net assets resulting from operations | | | (15,602,766 | ) | | | 11,163,835 | |
| | | | | | | | | |
| DISTRIBUTIONS TO SHAREHOLDERS | | | | | | | | |
| Total Distributions Paid: | | | | | | | | |
| Institutional Class | | | (6,409,033 | ) | | | (3,714,113 | ) |
| Investor Class | | | (482,116 | ) | | | (424,069 | ) |
| Super Institutional Class | | | (912,601 | ) | | | — | |
| Net decrease in net assets resulting from distributions to shareholders | | | (7,803,750 | ) | | | (4,138,182 | ) |
| | | | | | | | | |
| FROM SHARES OF BENEFICIAL INTEREST | | | | | | | | |
| Proceeds from shares sold: | | | | | | | | |
| Institutional Class | | | 57,388,260 | | | | 148,643,182 | |
| Investor Class | | | 6,506,133 | | | | 12,719,581 | |
| Super Institutional Class | | | 1,022,115 | | | | 27,691,854 | |
| Net asset value of shares issued in reinvestment of distributions: | | | | | | | | |
| Institutional Class | | | 5,743,554 | | | | 3,499,276 | |
| Investor Class | | | 481,013 | | | | 423,838 | |
| Super Institutional Class | | | 906,119 | | | | — | |
| Redemption fee proceeds: | | | | | | | | |
| Institutional Class | | | 15,681 | | | | 7,681 | |
| Investor Class | | | 9,072 | | | | 954 | |
| Super Institutional Class | | | 545 | | | | — | |
| Payments for shares redeemed: | | | | | | | | |
| Institutional Class | | | (120,184,821 | ) | | | (28,477,371 | ) |
| Investor Class | | | (14,813,753 | ) | | | (6,748,100 | ) |
| Super Institutional Class | | | (27,660,046 | ) | | | (800,549 | ) |
| Net increase (decrease) in net assets from shares of beneficial interest | | | (90,586,128 | ) | | | 156,960,346 | |
| | | | | | | | | |
| TOTAL INCREASE (DECREASE) IN NET ASSETS | | | (113,992,644 | ) | | | 163,985,999 | |
| | | | | | | | | |
| NET ASSETS | | | | | | | | |
| Beginning of Year | | | 242,066,541 | | | | 78,080,542 | |
| End of Year | | $ | 128,073,897 | | | $ | 242,066,541 | |
| | | | | | | | | |
| SHARE ACTIVITY | | | | | | | | |
| Institutional Class: | | | | | | | | |
| Shares Sold | | | 5,426,179 | | | | 13,292,982 | |
| Shares Reinvested | | | 505,594 | | | | 329,189 | |
| Shares Redeemed | | | (11,821,247 | ) | | | (2,579,692 | ) |
| Net increase (decrease) in shares of beneficial interest outstanding | | | (5,889,474 | ) | | | 11,042,479 | |
| | | | | | | | | |
| Investor Class: | | | | | | | | |
| Shares Sold | | | 641,855 | | | | 1,144,155 | |
| Shares Reinvested | | | 42,643 | | | | 40,060 | |
| Shares Redeemed | | | (1,448,909 | ) | | | (629,723 | ) |
| Net increase (decrease) in shares of beneficial interest outstanding | | | (764,411 | ) | | | 554,492 | |
| | | | | | | | | |
| Super Institutional Class: (a) | | | | | | | | |
| Shares Sold | | | 88,241 | | | | 2,513,969 | |
| Shares Reinvested | | | 79,624 | | | | — | |
| Shares Redeemed | | | (2,604,421 | ) | | | (74,084 | ) |
| Net increase (decrease) in shares of beneficial interest outstanding | | | (2,436,556 | ) | | | 2,439,885 | |
| | | | | | | | | |
| (a) | The Super Institutional Class commenced operations on May 10, 2019. |
See accompanying notes to financial statements.
| Invenomic Fund |
| FINANCIAL HIGHLIGHTS |
| |
| Per Share Data and Ratios for a Share of Beneficial Interest Outstanding Throughout Each Period |
| | | Institutional Class | |
| | | | | | | | | | | | | |
| | | For the | | | For the | | | For the | | | For the | |
| | | Year Ended | | | Year Ended | | | Year Ended | | | Period Ended | |
| | | October 31, 2020 | | | October 31, 2019 | | | October 31, 2018 | | | October 31, 2017 (1) | |
| Net asset value, beginning of period | | $ | 11.48 | | | $ | 11.07 | | | $ | 10.22 | | | $ | 10.00 | |
| Activity from investment operations: | | | | | | | | | | | | | | | | |
| Net investment loss (2) | | | (0.08 | ) | | | (0.06 | ) | | | (0.12 | ) | | | (0.05 | ) |
| Net realized and unrealized gain (loss) on investments | | | (0.36 | ) | | | 0.98 | | | | 1.10 | | | | 0.27 | |
| Total from investment operations | | | (0.44 | ) | | | 0.92 | | | | 0.98 | | | | 0.22 | |
| Less distributions from: | | | | | | | | | | | | | | | | |
| Net realized gains | | | (0.37 | ) | | | (0.51 | ) | | | (0.13 | ) | | | — | |
| Total distributions | | | (0.37 | ) | | | (0.51 | ) | | | (0.13 | ) | | | — | |
| Paid-in-Capital From Redemption Fees | | | 0.00 | (3) | | | 0.00 | (3) | | | 0.00 | (3) | | | — | |
| Net asset value, end of period | | $ | 10.67 | | | $ | 11.48 | | | $ | 11.07 | | | $ | 10.22 | |
| Total return (4) | | | (4.06 | )% | | | 8.67 | % | | | 9.63 | % | | | 2.20 | % (5) |
| Net assets, at end of period (000’s) | | $ | 122,105 | | | $ | 198,929 | | | $ | 69,580 | | | $ | 28,354 | |
| Ratio of gross expenses to average net assets (6,8) | | | 2.97 | % | | | 2.83 | % | | | 2.91 | % | | | 3.07 | % (7) |
| Ratio of net expenses to average net assets (8) | | | 2.83 | % | | | 2.77 | % | | | 2.72 | % | | | 2.61 | % (7) |
| Ratio of net investment loss to average net assets | | | (0.76 | )% | | | (0.57 | )% | | | (1.14 | )% | | | (1.25 | )% (7) |
| Portfolio Turnover Rate | | | 153 | % | | | 100 | % | | | 106 | % | | | 37 | % (5) |
| | | | | | | | | | | | | | | | | |
| (1) | The Institutional Class commenced operations on June 19, 2017. |
| (2) | Per share amounts calculated using the average shares method, which more appropriately presents the per share data for the period. |
| (3) | Represents less than $0.01 per share. |
| (4) | Total returns shown exclude the effect of applicable sales charges and redemption fees and assumes the reinvestment of distributions. |
| (6) | Represents the ratio of expenses to average net assets absent fee waivers and/or expense reimbursements by the Advisor. |
| (8) | Excluding dividends from securities sold short and interest expense, the ratio of expenses to average net assets would have been: |
| | | | 2.37 | % | | | 2.29 | % | | | 2.43 | % | | | 2.70 | % (7) |
| | | | 2.23 | % | | | 2.23 | % | | | 2.24 | % | | | 2.24 | % (7) |
| | | | | | | | | | | | | | | | | |
See accompanying notes to financial statements.
| Invenomic Fund |
| FINANCIAL HIGHLIGHTS |
| |
| Per Share Data and Ratios for a Share of Beneficial Interest Outstanding Throughout Each Period |
| | | Investor Class | |
| | | | | | | | | | | | | |
| | | For the | | | For the | | | For the | | | For the | |
| | | Year Ended | | | Year Ended | | | Year Ended | | | Period Ended | |
| | | October 31, 2020 | | | October 31, 2019 | | | October 31, 2018 | | | October 31, 2017 (1) | |
| Net asset value, beginning of period | | $ | 11.40 | | | $ | 11.02 | | | $ | 10.21 | | | $ | 10.00 | |
| Activity from investment operations: | | | | | | | | | | | | | | | | |
| Net investment loss (2) | | | (0.11 | ) | | | (0.09 | ) | | | (0.16 | ) | | | (0.07 | ) |
| Net realized and unrealized gain (loss) on investments | | | (0.36 | ) | | | 0.98 | | | | 1.10 | | | | 0.28 | |
| Total from investment operations | | | (0.47 | ) | | | 0.89 | | | | 0.94 | | | | 0.21 | |
| Less distributions from: | | | | | | | | | | | | | | | | |
| Net realized gains | | | (0.37 | ) | | | (0.51 | ) | | | (0.13 | ) | | | — | |
| Total distributions | | | (0.37 | ) | | | (0.51 | ) | | | (0.13 | ) | | | — | |
| Paid-in-Capital From Redemption Fees | | | 0.01 | | | | 0.00 | (3) | | | 0.00 | (3) | | | — | |
| Net asset value, end of period | | $ | 10.57 | | | $ | 11.40 | | | $ | 11.02 | | | $ | 10.21 | |
| Total return (4) | | | (4.27 | )% | | | 8.43 | % | | | 9.25 | % | | | 2.10 | % (5) |
| Net assets, at end of period (000’s) | | $ | 5,933 | | | $ | 15,113 | | | $ | 8,501 | | | $ | 1 | |
| Ratio of gross expenses to average net assets (6,8) | | | 3.22 | % | | | 3.08 | % | | | 3.21 | % | | | 3.32 | % (7) |
| Ratio of net expenses to average net assets (8) | | | 3.08 | % | | | 3.02 | % | | | 3.02 | % | | | 2.86 | % (7) |
| Ratio of net investment loss to average net assets | | | (0.99 | )% | | | (0.84 | )% | | | (1.39 | )% | | | (2.85 | )% (7) |
| Portfolio Turnover Rate | | | 153 | % | | | 100 | % | | | 106 | % | | | 37 | % (5) |
| | | | | | | | | | | | | | | | | |
| (1) | The Investor Class commenced operations on June 19, 2017. |
| (2) | Per share amounts calculated using the average shares method, which more appropriately presents the per share data for the period. |
| (3) | Represents less than $0.01 per share. |
| (4) | Total returns shown exclude the effect of applicable sales charges and redemption fees and assumes the reinvestment of distributions. |
| (6) | Represents the ratio of expenses to average net assets absent fee waivers and/or expense reimbursements by the Advisor. |
| (8) | Excluding dividends from securities sold short and interest expense, the ratio of expenses to average net assets would have been: |
| | | 2.62 | % | | | 2.54 | % | | | 2.73 | % | | | 2.95 | % (7) |
| | | | 2.48 | % | | | 2.48 | % | | | 2.54 | % | | | 2.49 | % (7) |
| | | | | | | | | | | | | | | | | |
See accompanying notes to financial statements.
| Invenomic Fund |
| FINANCIAL HIGHLIGHTS |
| |
| Per Share Data and Ratios for a Share of Beneficial Interest Outstanding Throughout Each Period |
| | | Super Institutional Class | |
| | | | | | | |
| | | For the | | | For the | |
| | | Period Ended | | | Period Ended | |
| | | October 31, 2020 | | | October 31, 2019 (1) | |
| Net asset value, beginning of period | | $ | 11.49 | | | $ | 11.43 | |
| Activity from investment operations: | | | | | | | | |
| Net investment loss (2) | | | (0.07 | ) | | | (0.02 | ) |
| Net realized and unrealized gain (loss) on investments | | | (0.35 | ) | | | 0.08 | |
| Total from investment operations | | | (0.42 | ) | | | 0.06 | |
| Less distributions from: | | | | | | | | |
| Net realized gains | | | (0.37 | ) | | | — | |
| Total distributions | | | (0.37 | ) | | | — | |
| Paid-in-Capital From Redemption Fees | | | 0.00 | (3) | | | — | |
| Net asset value, end of period | | $ | 10.70 | | | $ | 11.49 | |
| Total return (4) | | | (3.88 | )% | | | 0.52 | % (5) |
| Net assets, at end of period (000’s) | | $ | 36 | | | $ | 28,024 | |
| Ratio of gross expenses to average net assets (6,8) | | | 2.72 | % | | | 2.58 | % (6) |
| Ratio of net expenses to average net assets (8) | | | 2.58 | % | | | 2.52 | % (6) |
| Ratio of net investment loss to average net assets | | | (0.59 | )% | | | (0.30 | )% (6) |
| Portfolio Turnover Rate | | | 153 | % | | | 100 | % (5) |
| | | | | | | | | |
| (1) | The Super Institutional Class commenced operations on May 10, 2019. |
| (2) | Per share amounts calculated using the average shares method, which more appropriately presents the per share data for the period. |
| (3) | Represents less than $0.01 per share. |
| (4) | Total returns shown exclude the effect of applicable sales charges and redemption fees and assumes the reinvestment of distributions. |
| (6) | Represents the ratio of expenses to average net assets absent fee waivers and/or expense reimbursements by the Advisor. |
| (8) | Excluding dividends from securities sold short and interest expense, the ratio of expenses to average net assets would have been: |
| Before fees waived | | | 2.12 | % | | | 2.04 | % (6) |
| After fees waived | | | 1.98 | % | | | 1.98 | % (6) |
| | | | | | | | | |
See accompanying notes to financial statements.
| Invenomic Fund |
| NOTES TO FINANCIAL STATEMENTS |
| October 31, 2020 |
The Invenomic Fund (the “Fund”) is a diversified series of shares of beneficial interest of Northern Lights Fund Trust II (the “Trust”), a statutory trust organized under the laws of the State of Delaware on August 26, 2010, and is registered under the Investment Company Act of 1940, as amended (the “1940 Act”), as an open-end management investment company.
The Fund’s investment objective is to seek to achieve long-term capital appreciation. The Fund offers three classes of shares: Institutional Class shares, Investor Class shares and Super Institutional Class shares. The Institutional Class Shares and Investor Class shares commenced operations on June 19, 2017. The Super Institutional Class shares commenced operations on May 10, 2019. Each class of shares is offered at their net asset value. Each class of shares has identical rights and privileges with respect to arrangements pertaining to shareholder servicing or distribution, class-related expenses, voting rights on matters affecting a single class of shares, and the exchange privilege of each class of shares. The share classes differ in the fees and expenses charged to shareholders. The Fund’s income, expenses (other than class specific distribution fees) and realized and unrealized gains and losses are allocated proportionately each day based upon the relative net assets of each class.
| 2. | SIGNIFICANT ACCOUNTING POLICIES |
The following is a summary of significant accounting policies followed by the Fund in preparation of its financial statements. These policies are in conformity with accounting principles generally accepted in the United States of America (“GAAP”). The preparation of financial statements in conformity with GAAP requires management to make estimates and assumptions that affect the reported amounts of assets and liabilities and disclosure of contingent assets and liabilities at the date of the financial statements and the reported amounts of increases and decreases in net assets from operations during the reporting period. Actual results could differ from those estimates. The Fund is an investment company and accordingly follow the investment company accounting and reporting guidance of the Financial Accounting Standards Board (FASB) Accounting Standard Codification Topic 946 “Financial Services – Investment Companies”.
Securities valuation – Securities listed on an exchange are valued at the last reported sale price at the close of the regular trading session of the primary exchange on the business day the value is being determined, or in the case of securities listed on NASDAQ at the NASDAQ Official Closing Price (“NOCP”). In the absence of a sale such securities shall be valued at the mean between the current bid and ask prices on the day of valuation. Options contracts listed on a securities exchange or board of trade for which market quotations are readily available shall be valued at the last quoted sales price or, in the absence of a sale, at the mean between the current bid and ask prices on the day of valuation. Option contracts not listed on a securities exchange or board of trade for which over-the-counter market quotations are readily available shall be valued at the mean between the current bid and ask prices on the day of valuation. Index options shall be valued at the mean between the current bid and ask prices on the day of valuation. Short-term debt obligations having 60 days or less remaining until maturity, at time of purchase may be valued at amortized cost. Investments in open-end investment companies are valued at net asset value.
Valuation of Fund of Funds – The Fund may invest in portfolios of open-end or closed-end investment companies (the “underlying funds”). Underlying open-end funds are valued at their respective net asset values as reported by such investment companies. The underlying funds value securities in their portfolios for which market quotations are readily available at their market values (generally the last reported sale price) and all other securities and assets at their fair value by the methods established by the Boards of the underlying funds. The shares of many closed-end investment companies, after their initial public offering, frequently trade at a price per share, which is different than the net asset value per share. The difference represents a market premium or market discount of such shares. There can be no assurances that the market discount or market premium on shares of any closed-end investment company purchased by the Fund will not change.
The Fund may hold securities, such as private investments, interests in commodity pools, other non-traded securities or temporarily illiquid securities, for which market quotations are not readily available or are determined to be unreliable. These securities will be valued using the “fair value” procedures approved by the Board. The Board has delegated execution of these procedures to a fair value committee composed of one or more representatives from each of the (i) Trust, (ii) administrator, and (iii) advisor. The committee may also enlist third party consultants such as a valuation specialist at a public accounting firm, valuation consultant or financial officer of a security issuer on an as-needed basis to assist in determining a security-specific fair value. The Board has also engaged a third party valuation firm to attend valuation meetings held by the Trust, review minutes of such meetings and report to the Board on a quarterly basis. The Board reviews
| Invenomic Fund |
| NOTES TO FINANCIAL STATEMENTS (Continued) |
| October 31, 2020 |
and ratifies the execution of this process and the resultant fair value prices at least quarterly to assure the process produces reliable results.
Fair Valuation Process – As noted above, the fair value committee is composed of one or more representatives from each of the (i) Trust, (ii) administrator, and (iii) advisor. The applicable investments are valued collectively via inputs from each of these groups. For example, fair value determinations are required for the following securities: (i) securities for which market quotations are insufficient or not readily available on a particular business day (including securities for which there is a short and temporary lapse in the provision of a price by the regular pricing source), (ii) securities for which, in the judgment of the advisor the prices or values available do not represent the fair value of the instrument. Factors which may cause the advisor to make such a judgment include, but are not limited to, the following: only a bid price or an asked price is available; the spread between bid and asked prices is substantial; the frequency of sales; the thinness of the market; the size of reported trades; and actions of the securities markets, such as the suspension or limitation of trading; (iii) securities determined to be illiquid; (iv) securities with respect to which an event that will affect the value thereof has occurred (a “significant event”) since the closing prices were established on the principal exchange on which they are traded, but prior to a Fund’s calculation of its net asset value. Specifically, interests in commodity pools or managed futures pools are valued on a daily basis by reference to the closing market prices of each futures contract or other asset held by a pool, as adjusted for pool expenses. Restricted or illiquid securities, such as private investments or non-traded securities are valued via inputs from the advisor based upon the current bid for the security from two or more independent dealers or other parties reasonably familiar with the facts and circumstances of the security (who should take into consideration all relevant factors as may be appropriate under the circumstances). If the advisor is unable to obtain a current bid from such independent dealers or other independent parties, the fair value committee shall determine the fair value of such security using the following factors: (i) the type of security; (ii) the cost at date of purchase; (iii) the size and nature of the Fund’s holdings; (iv) the discount from market value of unrestricted securities of the same class at the time of purchase and subsequent thereto; (v) information as to any transactions or offers with respect to the security; (vi) the nature and duration of restrictions on disposition of the security and the existence of any registration rights; (vii) how the yield of the security compares to similar securities of companies of similar or equal creditworthiness; (viii) the level of recent trades of similar or comparable securities; (ix) the liquidity characteristics of the security; (x) current market conditions; and (xi) the market value of any securities into which the security is convertible or exchangeable.
The Fund utilizes various methods to measure the fair value of all of its investments on a recurring basis. GAAP establishes a hierarchy that prioritizes inputs to valuation methods. The three levels of input are:
Level 1 – Unadjusted quoted prices in active markets for identical assets and liabilities that the Fund has the ability to access.
Level 2 – Observable inputs other than quoted prices included in level 1 that are observable for the asset or liability, either directly or indirectly. These inputs may include quoted prices for the identical instrument on an inactive market, prices for similar instruments, interest rates, prepayment speeds, credit risk, yield curves, default rates and similar data.
Level 3 – Unobservable inputs for the asset or liability, to the extent relevant observable inputs are not available, representing the Fund’s own assumptions about the assumptions a market participant would use in valuing the asset or liability, and would be based on the best information available.
The availability of observable inputs can vary from security to security and is affected by a wide variety of factors, including, for example, the type of security, whether the security is new and not yet established in the marketplace, the liquidity of markets, and other characteristics particular to the security. To the extent that valuation is based on models or inputs that are less observable or unobservable in the market, the determination of fair value requires more judgment. Accordingly, the degree of judgment exercised in determining fair value is greatest for instruments categorized in Level 3.
The inputs used to measure fair value may fall into different levels of the fair value hierarchy. In such cases, for disclosure purposes, the level in the fair value hierarchy within which the fair value measurement falls in its entirety, is determined based on the lowest level input that is significant to the fair value measurement in its entirety.
| Invenomic Fund |
| NOTES TO FINANCIAL STATEMENTS (Continued) |
| October 31, 2020 |
The inputs or methodology used for valuing securities are not necessarily an indication of the risk associated with investing in those securities. The following tables summarize the inputs used as of October 31, 2020 for the Fund’s investments measured at fair value:
| Assets * | | Level 1 | | | Level 2 | | | Level 3 | | | Total | |
| Common Stock | | $ | 142,159,026 | | | $ | — | | | $ | 0 | | | $ | 142,159,026 | |
| Warrants | | | 212,202 | | | | — | | | | — | | | | 212,202 | |
| Call Options Purchased | | | 202,098 | | | | 127,677 | | | | — | | | | 329,775 | |
| Put Options Purchased | | | 64,390 | | | | — | | | | — | | | | 64,390 | |
| Collateral For Securities Loaned | | | 3,953,047 | | | | — | | | | — | | | | 3,953,047 | |
| Money Market Fund | | | 4,286,345 | | | | — | | | | — | | | | 4,286,345 | |
| Total | | $ | 150,877,108 | | | $ | 127,677 | | | $ | — | | | $ | 151,004,785 | |
| Liabilities* | | | | | | | | | | | | | | | | |
| Call Options Written | | $ | — | | | $ | 253,575 | | | $ | — | | | $ | 253,575 | |
| Securities Sold Short | | | 100,872,776 | | | | — | | | | — | | | | 100,872,776 | |
| Total | | $ | 100,872,776 | | | $ | 253,575 | | | $ | — | | | $ | 101,126,351 | |
| * | Refer to the Portfolio of Investments for industry classification. |
The following is a reconciliation for which level 3 inputs were used in determining value.
| | | Cxloyalty Group Holdings, Inc. | |
| Beginning balance November 1, 2019 | | $ | 0 | |
| Purchases | | | — | |
| Proceeds from sales | | | — | |
| Total realized gain/(loss) | | | — | |
| Change in unrealized appreciation | | | — | |
| Ending balance October 31, 2020 | | $ | 0 | |
The total change in unrealized appreciation/(depreciation) included in the Statements of Operations attributable to Level 3 investments still held at October 31, 2020, was $0.
Quantitative disclosures of unobservable inputs and assumptions used by the Fund are below.
| Common Stock | | Fair Value | | | Valuation Techniques | | Unobservable Input |
| Cxloyalty Group Holdings, Inc. | | $ | 0 | | | Independent Valuation | | Adjusted for lack of marketability |
Security transactions and related income – Security transactions are accounted for on trade date. Interest income is recognized on an accrual basis. Discounts are accreted and premiums are amortized on securities purchased over the lives of the respective securities. Dividend income is recorded on the ex-dividend date. Realized gains or losses from sales of securities are determined by comparing the identified cost of the security lot sold with the net sales proceeds.
Dividends and distributions to shareholders – Dividends from net investment income, if any, are declared and paid annually. Distributable net realized capital gains, if any, are declared and distributed annually. Dividends from net investment income and distributions from net realized gains are recorded on ex dividend date and are determined in accordance with federal income tax regulations, which may differ from GAAP. These “book/tax” differences are considered either temporary (i.e., deferred losses, capital loss carry forwards) or permanent in nature. To the extent these differences are permanent in nature, such amounts are reclassified within the composition of net assets based on their federal tax-basis treatment; temporary differences do not require reclassification. These reclassifications have no effect on net assets, results from operations or net asset value per share of the Fund.
Exchange Traded Funds – The Fund may invest in exchange traded funds (“ETFs”). ETFs are a type of index fund bought and sold on a securities exchange. An ETF trades like common stock and represents a fixed portfolio of securities designed to track the performance and dividend yield of a particular domestic or foreign market index. A Fund may purchase an ETF
| Invenomic Fund |
| NOTES TO FINANCIAL STATEMENTS (Continued) |
| October 31, 2020 |
to temporarily gain exposure to a portion of the U.S. or a foreign market while awaiting purchase of underlying securities. The risks of owning an ETF generally reflect the risks of owning the underlying securities they are designed to track, although the lack of liquidity on an ETF could result in it being more volatile. Additionally, ETFs have fees and expenses that reduce their value.
Foreign Currency Translations – The accounting records of the Fund are maintained in U.S. dollars. Investment securities and other assets and liabilities denominated in a foreign currency, and income receipts and expense payments are translated into U.S. dollars using the prevailing exchange rate at the London market close. Purchases and sales of securities are translated into U.S. dollars at the contractual currency rates established at the approximate time of the trade.
Option Transactions – When the Fund writes a call option, an amount equal to the premium received is included in the statement of assets and liabilities as a liability. The amount of the liability is subsequently marked-to-market to reflect the current market value of the option. If an option expires on its stipulated expiration date or if the Fund enters into a closing purchase transaction, a gain or loss is realized. If a written call option is exercised, a gain or loss is realized for the sale of the underlying security and the proceeds from the sale are increased by the premium originally received. As writer of an option, the Fund has no control over whether the option will be exercised and, as a result, retains the market risk of an unfavorable change in the price of the security underlying the written option.
The Fund may purchase put and call options. Put options are purchased to hedge against a decline in the value of securities held in the Fund’s portfolio. If such a decline occurs, the put options will permit the Fund to sell the securities underlying such options at the exercise price, or to close out the options at a profit. The premium paid for a put or call option plus any transaction costs will reduce the benefit, if any, realized by the Fund upon exercise of the option, and, unless the price of the underlying security rises or declines sufficiently, the option may expire worthless to the Fund. In addition, in the event that the price of the security in connection with which an option was purchased moves in a direction favorable to the Fund, the benefits realized by the Fund as a result of such favorable movement will be reduced by the amount of the premium paid for the option and related transaction costs. Written and purchased options are non-income producing securities. With purchased options, there is minimal counterparty risk to the Fund since these options are exchange traded and the exchange’s clearinghouse, as counterparty to all exchange traded options, guarantees against a possible default.
In conjunction with the use of written options contracts and short sales, the Fund may be required to maintain collateral in various forms. At October 31, 2020, such collateral is denoted in the Fund’s Schedule of Investments and Statements of Assets and Liabilities. Also in conjunction with the use of written options contacts and short sales, the Fund, when appropriate, utilize a segregated margin deposit account with the counterparty. At October 31, 2020, these segregated margin deposit accounts are denoted in the Fund’s Statements of Assets and Liabilities.
Short Sales – A “short sale” is a transaction in which the Fund sells a security it does not own but has borrowed in anticipation that the market price of that security will decline. The Fund is obligated to replace the security borrowed by purchasing it on the open market at a later date. If the price of the security sold short increases between the time of the short sale and the time the Fund replaces the borrowed security, the Fund will incur a loss, unlimited in size. Conversely, if the price declines, the Fund will realize a gain, limited to the price at which the Fund sold the security short. Certain cash and securities are held as collateral.
Securities Lending Risk – The Fund may lend portfolio securities to institutions, such as banks and certain broker-dealers. A Fund may experience a loss or delay in the recovery of its securities if the borrowing institution breaches its agreement with the Fund.
Federal income tax – It is the Fund’s policy to qualify as a regulated investment company by complying with the provisions of the Internal Revenue Code that are applicable to regulated investment companies and to distribute substantially all of its taxable income and net realized gains to shareholders. Therefore, no federal income tax provision is required. The Fund recognizes the tax benefits of uncertain tax positions only where the position is “more likely than not” to be sustained assuming examination by tax authorities. Management has analyzed the Fund’s tax positions and has concluded that no liability for unrecognized tax benefits should be recorded related to uncertain tax positions taken on returns filed for open tax years ended October 31, 2017 to October 31, 2019, or expected to be taken in the Fund’s October 31, 2020 year end tax returns. The Fund identifies its major tax jurisdictions as U.S. Federal and Ohio (Nebraska in years prior to 2019), and foreign jurisdictions where the Fund makes significant investments; however the Fund is not aware of any tax positions for
| Invenomic Fund |
| NOTES TO FINANCIAL STATEMENTS (Continued) |
| October 31, 2020 |
which it is reasonably possible that the total amounts of unrecognized tax benefits will change materially in the next twelve months.
Expenses – Expenses of the Trust that are directly identifiable to a specific fund are charged to that fund. Expenses which are not readily identifiable to a specific fund are allocated in such a manner as deemed equitable, taking into consideration the nature and type of expense and the relative sizes of the funds in the Trust.
Indemnification – The Trust indemnifies its officers and Trustees for certain liabilities that may arise from the performance of their duties to the Trust. Additionally, in the normal course of business, the Fund enters into contracts that contain a variety of representations and warranties and which provide general indemnities. The Fund’s maximum exposure under these arrangements is unknown, as this would involve future claims that may be made against the Fund that have not yet occurred. However, based on experience, the risk of loss due to these warranties and indemnities appears to be remote.
| 3. | INVESTMENT TRANSACTIONS |
For the year ended October 31, 2020, cost of purchases and proceeds from sales of portfolio securities, other than short-term investments and securities sold short, amounted to the following:
| Purchases | | | Sales | |
| $ | 260,811,608 | | | $ | 366,387,693 | |
| 4. | INVESTMENT ADVISORY AGREEMENT AND TRANSACTIONS WITH RELATED PARTIES |
Invenomic Capital Management LP serves as the investment advisor to the Fund. Pursuant to an Investment Advisory Agreement with the Fund, the Advisor, under the oversight of the Board, directs the daily operations of the Fund and supervises the performance of administrative and professional services provided by others. As compensation for its services and the related expenses borne by the Advisor, the Fund pays the Advisor an investment advisory fee, computed and accrued daily and paid monthly, at an annual rate of 1.74%. For the year ended October 31, 2020, the Fund incurred advisory fees in the amount of $2,900,232.
The Fund’s Advisor has contractually agreed to reduce its fees and/or absorb expenses of the Fund, until at least February 28, 2021 to ensure that Total Annual Fund Operating Expenses after fee waiver and/or reimbursement (excluding interest and tax expenses, dividends on short positions and Acquired Fund Fees and Expenses) for the Fund do not exceed 2.23%, 2.48% and 1.98% of the Fund’s average net assets, for Institutional Class, Investor Class shares and Super Institutional Class shares, respectively; subject to possible recoupment from the Fund in future years on a rolling three year basis (within the three years after the fees have been waived or reimbursed) if such recoupment can be achieved within the foregoing expense limits. During the year ended October 31, 2020 the total amount of advisory fees waived was $223,856. As of October 31, 2020 the total amount of advisory fees waived subject to recapture is $286,049, of which $62,193 will expire on October 31, 2022 and $223,856 will expire October 31, 2023.
Distributor – The distributor of the Fund is Northern Lights Distributors, LLC (the “Distributor”). The Board of Trustees of the Northern Lights Fund Trust II has adopted, on behalf of the Fund, the Trust’s Master Distribution and Shareholder Servicing Plan (the “Plan”), as amended, pursuant to Rule 12b-1 under the Investment Company Act of 1940, to pay for certain distribution activities and shareholder services. Under the Plan, the Fund may pay 0.25% per year of the average daily net assets of Investor Class shares for such distribution and shareholder service activities. For the year ended October 31, 2020, the Fund incurred distribution fees in the amount of $25,212.
In addition, certain affiliates of the Distributor provide services to the Fund as follows:
Gemini Fund Services, LLC (“GFS”), an affiliate of the Distributor, provides administration, fund accounting, and transfer agent services to the Trust. Pursuant to separate servicing agreements with GFS, the Fund pays GFS customary fees for providing administration, fund accounting and transfer agency services to the Fund. Certain officers of the Trust are also officers of GFS, and are not paid any fees directly by the Fund for serving in such capacities.
| Invenomic Fund |
| NOTES TO FINANCIAL STATEMENTS (Continued) |
| October 31, 2020 |
Northern Lights Compliance Services, LLC (“NLCS”), an affiliate of GFS and the Distributor, provides a Chief Compliance Officer to the Trust, as well as related compliance services, pursuant to a consulting agreement between NLCS and the Trust. Under the terms of such agreement, NLCS receives customary fees from the Fund.
Blu Giant, LLC (“Blu Giant”), an affiliate of GFS and the Distributor, provides EDGAR conversion and filing services as well as print management services for the Fund on an ad-hoc basis. For the provision of these services, Blu Giant receives customary fees from the Fund.
| 5. | DERIVATIVE TRANSACTIONS |
The following is a summary of the effect of derivative instruments on the Fund’s Statement of Assets and Liabilities as of October 31, 2020.
| Contract Type/Primary Risk Exposure | | Statements of Assets and Liabilities | | Value | |
| Equity Contracts/Equity price risk | | Investment securities at value | | $ | 394,165 | |
| Equity Contracts/Equity price risk | | Options Written | | $ | (253,575 | ) |
The following is a summary of the effect of derivative instruments on the Fund’s Statement of Operations for the year ended October 31, 2020.
| | | | | | Change in Unrealized | |
| Contract type/ | | Realized Gain/(Loss) | | | Appreciation/(Depreciation) | |
| Primary Risk Exposure | | On Options Purchased | | | on Options Purchased | |
| Equity contracts/Equity Price Risk | | $ | (44,534 | ) | | $ | (582,555 | ) |
| | | | | | | | | |
| | | | | | Change in Unrealized | |
| Contract type/ | | Realized Gain/(Loss) | | | Appreciation/(Depreciation) | |
| Primary Risk Exposure | | on Options Written | | | on Options Written | |
| Equity contracts/Equity Price Risk | | $ | (184,884 | ) | | $ | (227,265 | ) |
The notional value and contracts of the derivative instruments outstanding as of October 31, 2020 as disclosed in the Portfolio of Investments and the amounts realized and changes in unrealized gains and losses on derivative instruments during the period as disclosed above and within the Statement of Operations serve as indicators of the volume of derivative activity for the Fund.
The Fund may assess a short-term redemption fee of 1.00% of the total redemption amount if a shareholder sells his shares after holding them for less than 60 days. The redemption fee is paid directly to the Fund. For the year ended October 31, 2020 the redemption fees assessed by the Fund were as follows:
| Institutional | | | Investor | | | Super Institutional | |
| $ | 15,681 | | | $ | 9,072 | | | $ | 545 | |
| Invenomic Fund |
| NOTES TO FINANCIAL STATEMENTS (Continued) |
| October 31, 2020 |
| 7. | AGGREGATE UNREALIZED APPRECIATION AND DEPRECIATION – TAX BASIS |
The identified cost of investments in securities owned by the Fund for federal income tax purposes, and its respective gross unrealized appreciation and depreciation at October 31, 2020, was as follows:
| | | | Gross | | | Gross | | | Net Unrealized | |
| Tax | | | Unrealized | | | Unrealized | | | Appreciation | |
| Cost | | | Appreciation | | | Depreciation | | | (Depreciation) | |
| $ | 67,804,631 | | | $ | 17,967,859 | | | $ | (35,894,056 | ) | | $ | (17,926,197 | ) |
| 8. | DISTRIBUTIONS TO SHAREHOLDERS AND TAX COMPONENTS OF CAPITAL |
The tax character of distributions paid during the period ended October 31, 2020 and October 31, 2019 was as follows:
| | | Fiscal Year Ended | | | Fiscal Year Ended | |
| | | October 31, 2020 | | | October 31, 2019 | |
| Ordinary Income | | $ | 7,686,875 | | | $ | 4,007,417 | |
| Long-Term Capital Gain | | | 116,875 | | | | 130,765 | |
| Return of Capital | | | — | | | | — | |
| | | $ | 7,803,750 | | | $ | 4,138,182 | |
As of October 31, 2020, the components of accumulated earnings/ (deficit) on a tax basis were as follows:
| Undistributed | | | Undistributed | | | Post October Loss | | | Capital Loss | | | Other | | | Unrealized | | | Total | |
| Ordinary | | | Long-Term | | | and | | | Carry | | | Book/Tax | | | Appreciation/ | | | Accumulated | |
| Income | | | Gains | | | Late Year Loss | | | Forwards | | | Differences | | | (Depreciation) | | | Earnings/(Deficits) | |
| $ | 4,834,801 | | | $ | — | | | $ | — | | | $ | — | | | $ | — | | | $ | (17,886,854 | ) | | $ | (13,052,053 | ) |
The difference between book basis and tax basis accumulated net realized gain/(loss), and unrealized appreciation/(depreciation) from investments is primarily attributable to the tax deferral of losses on wash sales, mark-to-market on passive foreign investment companies and adjustments related to partnerships.
Under an agreement with U.S. Bank National Association (The “Bank”) the Invenomic Fund (the “Fund”) can lend its portfolio securities to brokers, dealers and other financial institutions approved by the Board of Trustees to earn additional income. Loans are collateralized by cash, in an amount at least equal to the market value of the securities loaned plus accrued interest, which is invested in highly liquid, short-term instruments such as repurchase agreements collateralized by money market funds in accordance with the Fund’s security lending procedures. A portion of the income generated by the investment in the collateral, net of any rebates paid by the Bank to the borrowers is remitted to the Bank as lending agent, and the remainder is paid to the Fund. The Fund continues to receive interest or dividends on the securities loaned. The Fund has the right under the Master Securities Lending Agreement to recover the securities from the borrower on demand; if the borrower fails to deliver the securities on a timely basis, the Fund could experience delays or losses on recovery. Additionally, the Fund is subject to the risk of loss from investments made with the cash received as collateral. The Fund manages credit exposure arising from these lending transactions by, in appropriate circumstances, entering into master netting agreements and collateral agreements with third party borrowers that provide in the event of default (such as bankruptcy or a borrower’s failure to pay or perform), the right to net a third party borrower’s rights and obligations under such agreement and liquidate and set off collateral against the net amount owed by the counterparty.
At October 31, 2020, the Fund had loaned securities and received cash collateral for the loan. This cash was invested in the Mount Vernon Liquid Assets Portfolio, LLC as shown in the Schedules of Investments. The Fund receives compensation relating to the lending of the Fund’s securities.
| Invenomic Fund |
| NOTES TO FINANCIAL STATEMENTS (Continued) |
| October 31, 2020 |
The market value of loaned securities and collateral and percentage of total investment income the Fund received from the investment of cash collateral retained by the lending agent, U.S. Bank, were as follows:
| Market Value of | | | Market Value of | | | Percentage of Total | |
| Loaned Securities | | | Collateral | | | Investment Income | |
| $ | 3,768,025 | | | $ | 3,953,047 | | | | 5.73 | % |
| | | | | | Gross Amounts Not Offset in | | | | |
| | | | | | the Statement of Assets and | | | | |
| | | | | | Liabilities | | | | |
| | | Gross Amounts | | | | | | | | | | |
| | | Recognized in | | | Financial | | | Cash | | | | |
| | | Statements of Assets | | | Instruments | | | Collateral | | | Net Amount | |
| | | and Liabilities | | | Pledged | | | Pledged | | | of Assets | |
| Invenomic Fund | | | | | | | | | | | | |
| Description of Liability Securities lending collateral | | $ | 3,953,047 | | | $ | — | | | $ | 3,953,047 | (1) | | $ | — | |
| (1) | The amount is limited to the liability balance and accordingly does not include excess collateral pledged. |
The following table breaks out the holdings pledged as collateral as of October 31, 2020:
| | | Overnight and | | | Up to | | | | | | Greater than | | | | |
| | | Continuous | | | 30 Days | | | 30-90 days | | | 90 days | | | Total | |
| Mount Vernon Liquid Assets Portfolio, LLC | | $ | 3,953,047 | | | $ | — | | | $ | — | | | $ | — | | | $ | 3,953,047 | |
The fair value of the securities loaned for the Fund totaled $3,768,025 at October 31, 2020. The securities loaned are noted in the Portfolios of Investments. The fair value of the “Collateral for Securities Loaned” on the Portfolio of Investments includes only cash collateral received and reinvested that totaled $3,953,047 for the Fund at October 31, 2020. These amounts are offset by a liability recorded as “Securities lending collateral.”
The beneficial ownership, either directly or indirectly, of more than 25% of the voting securities of a fund creates presumption of control of the fund, under Section 2(a)(9) of the 1940 Act. As of October 31, 2020, Charles Schwab & Co. and National Financial Services LLC held approximately 28.34% and 27.06%, respectively of the voting securities of the Fund for the benefit of others. The Fund has no knowledge as to whether all or any portion of the shares owned on record by Charles Schwab & Co. and National Financial Services LLC. are also owned beneficially by any party who would be presumed to control the Fund.
Subsequent events after the date of the Statement of Assets and Liabilities have been evaluated through the date the financial statements were issued. Management has determined that no events or transactions occurred requiring adjustment or disclosure in the financial statements.
REPORT OF INDEPENDENT REGISTERED PUBLIC ACCOUNTING FIRM
To the Board of Trustees
of Northern Lights Fund Trust II and
Shareholders of
Invenomic Fund
Opinion on the Financial Statements
We have audited the accompanying statements of assets and liabilities of Invenomic Fund, a series of Northern Lights Fund Trust II (the “Trust”), including the schedules of investments, as of October 31, 2020, the related statement of operations for the year then ended, the statements of changes in net assets for each of the two years in the period then ended, the financial highlights for each of the periods indicated in the table below, and the related notes (collectively referred to as the “financial statements”). In our opinion, the financial statements present fairly, in all material respects, the financial position of the Fund as of October 31, 2020, the results of its operations for the year then ended, the changes in its net assets for each of the two years in the period then ended, and the financial highlights for each of the periods indicated in the table below, in conformity with accounting principles generally accepted in the United States of America.
Individual Funds
constituting | | Statement of | | Statements of | | |
| Invenomic Fund | | operations | | changes in net assets | | Financial highlights |
| Invenomic Fund | | For the year ended October 31, 2020 | | For each of the two years in the period ended October 31, 2020 | | For each of the three years in the period ended October 31, 2020 and the period from June 19, 2017 (commencement of operations) through October 31, 2017. |
Basis for Opinion
These financial statements are the responsibility of the Fund’s management. Our responsibility is to express an opinion on the Fund’s financial statements based on our audits. We are a public accounting firm registered with the Public Company Accounting Oversight Board (United States) (“PCAOB”) and are required to be independent with respect to the Fund in accordance with the U.S. federal securities laws and the applicable rules and regulations of the Securities and Exchange Commission and the PCAOB. We have served as the auditor of one or more of the funds in the Trust since 2012.
We conducted our audits in accordance with the standards of the PCAOB. Those standards require that we plan and perform the audit to obtain reasonable assurance about whether the financial statements are free of material misstatement, whether due to error or fraud. The Fund is not required to have, nor were we engaged to perform, an audit of its internal control over financial reporting. As part of our audits we are required to obtain an understanding of internal control over financial reporting, but not for the purpose of expressing an opinion on the effectiveness of the Fund’s internal control over financial reporting. Accordingly, we express no such opinion.
Our audits included performing procedures to assess the risks of material misstatement of the financial statements, whether due to error or fraud, and performing procedures that respond to those risks. Such procedures included examining, on a test basis, evidence regarding the amounts and disclosures in the financial statements. Our audits also included evaluating the accounting principles used and significant estimates made by management, as well as evaluating the overall presentation of the financial statements. Our procedures included confirmation of securities owned as of October 31, 2020 by correspondence with the custodian and brokers; when replies were not received from brokers, we performed other auditing procedures. We believe that our audits provide a reasonable basis for our opinion.
TAIT, WELLER & BAKER LLP
| Philadelphia, Pennsylvania |
| December 30, 2020 |
| Invenomic Fund |
| EXPENSE EXAMPLES (Unaudited) |
| October 31, 2020 |
As a shareholder of a Fund, you incur two types of costs: (1) transaction costs, including sales charges (loads) on purchases and redemptions; and redemption fees; (2) ongoing costs, including management fees; distribution and/or service (12b-1) fees; and other Fund expenses. This example is intended to help you understand your ongoing costs (in dollars) of investing in the Funds and to compare these costs with the ongoing costs of investing in other mutual funds.
The example is based on an investment of $1,000 invested at the beginning of the period and held for the entire period as noted below.
Actual Expenses
The “Actual Expenses” line in the table below provides information about actual account values and actual expenses. You may use the information below; together with the amount you invested, to estimate the expenses that you paid over the period. Simply divide your account value by $1,000 (for example, an $8,600 account value divided by $1,000 = 8.6), then multiply the result by the number in the table under the heading entitled “Expenses Paid During Period” to estimate the expenses you paid on your account during this period.
Hypothetical Example for Comparison Purposes
The “Hypothetical” line in the table below provides information about hypothetical account values and hypothetical expenses based on the respective Fund’s actual expense ratio and an assumed rate of return of 5% per year before expenses, which is not the Fund’s actual return. The hypothetical account values and expenses may not be used to estimate the actual ending account balances or expenses you paid for the period. You may use this information to compare this 5% hypothetical example with the 5% hypothetical examples that appear in the shareholder reports of other funds.
Please note that the expenses shown in the table are meant to highlight your ongoing costs only and do not reflect any transactional costs, such as sales charges (loads). Therefore, the table is useful in comparing ongoing costs only, and will not help you determine the relative total costs of owning different funds. In addition, if these transactional costs were included, your costs would have been higher.
| | Beginning | Ending | Expenses Paid | Expense Ratio During |
| | Account Value | Account Value | During Period | the Period |
| Actual* | 5/1/20 | 10/31/20 | 5/1/20 – 10/31/20 | 5/1/20 – 10/31/20 |
| Institutional Class | $1,000.00 | $994.40 | $11.18 | 2.23% |
| Investor Class | $1,000.00 | $993.40 | $12.43 | 2.48% |
| Super Institutional Class | $1,000.00 | $961.20 | $9.76 | 1.98% |
| | Beginning | Ending | Expenses Paid | Expense Ratio During |
| Hypothetical ** | Account Value | Account Value | During Period | the Period |
| (5% return before expenses) | 5/1/20 | 10/31/20 | 5/1/20 – 10/31/20 | 5/1/20 – 10/31/20 |
| Institutional Class | $1,000.00 | $1,013.93 | $11.29 | 2.23% |
| Investor Class | $1,000.00 | $1,012.67 | $12.55 | 2.48% |
| Super Institutional Class | $1,000.00 | $1,015.18 | $10.03 | 1.98% |
| * | Expenses are equal to the average account value over the period, multiplied by the Fund’s annualized expense ratio, multiplied by the number of days in the period (184) divided by the number of days in the fiscal year (366). |
| ** | The hypothetical example assumes that the Fund was in operation for the full six months ended October 31, 2020. |
| Invenomic Fund |
| SUPPLEMENTAL INFORMATION (Unaudited) |
| October 31, 2020 |
LIQUIDITY RISK MANAGEMENT PROGRAM
The Fund has adopted and implemented a written liquidity risk management program as required by Rule 22e-4 (the “Liquidity Rule”) under the Investment Company Act. The program is reasonably designed to assess and manage the Fund’s liquidity risk, taking into consideration, among other factors, the Fund’s investment strategy and the liquidity of its portfolio investments during normal and reasonably foreseeable stressed conditions; its short and long-term cash flow projections; and its cash holdings and access to other funding sources.
During the fiscal year ended October 31, 2020, the Trust’s Liquidity Risk Management Program Committee (the “Committee”) reviewed the Fund’s investments and determined that the Fund held adequate levels of cash and highly liquid investments to meet shareholder redemption activities in accordance with applicable requirements. Accordingly, the Committee concluded that (i) the Fund’s liquidity risk management program is reasonably designed to prevent violations of the Liquidity Rule and (ii) the Fund’s liquidity risk management program has been effectively implemented.
| Invenomic Fund |
| SUPPLEMENTAL INFORMATION (Unaudited) |
| October 31, 2020 |
The Trustees and the officers of the Trust are listed below with their present positions with the Trust and principal occupations over at least the last five years. The business address of each Trustee and Officer is 225 Pictoria Drive, Suite 450, Cincinnati, OH 45246. All correspondence to the Trustees and Officers should be directed to c/o Gemini Fund Services, LLC, P.O. Box 541150, Omaha, Nebraska 68154.
Independent Trustees
Name and
Year of Birth | Position/Term of
Office* | Principal Occupation
During the Past Five Years | Number of
Portfolios in
Fund
Complex
Overseen by
Trustee *** | Other Directorships held by
Trustee
During the Past Five Years |
Thomas T. Sarkany
1946 | Trustee Since October 2011 | President, TTS Consultants, LLC (financial services) (since 2010). | 1 | Director, Aquila Distributors; Trustee, Arrow ETF Trust; Trustee, Arrow Investments Trust; Trustee, Northern Lights Fund Trust IV |
Anthony H. Lewis
1946 | Trustee Since May 2011 | Chairman and CEO of The Lewis Group USA (executive consulting firm) (since 2007). | 1 | Director, Member of the Compensation Committee and Member of the Risk Committee of Torotel Inc. (Magnetics, Aerospace and Defense), Trustee, Chairman of the Fair Valuation Committee and Member of the Audit Committee of the Wildermuth Endowment Strategy Fund |
Keith Rhoades
1948 | Trustee Since May 2011 | Retired since 2008. | 1 | NONE |
Randal D. Skalla
1962 | Trustee Since May 2011 | President, L5 Enterprises, Inc. (financial services company) (since 2001). | 1 | Board Member, Orizon Investment Counsel (financial services company) (from 2001 to 2017) |
10/31/20 – NLII v1
| Invenomic Fund |
| SUPPLEMENTAL INFORMATION (Unaudited)(Continued) |
| October 31, 2020 |
Interested Trustees and Officers
Name and
Year of Birth | Position/Term
of Office* | Principal Occupation
During the Past Five Years | Number of
Portfolios in
Fund
Complex
Overseen
by
Trustee *** | Other Directorships held by
Trustee
During the Past Five Years |
Brian Nielsen**
1972 | Trustee Since May 2011 | Trustee of Northern Lights Fund Trust II (since 2011); Special Projects Counsel of NorthStar Financial Services Group, LLC (from 2018 to 2019); Secretary of CLS Investments, LLC (from 2001 to 2018); Secretary of Orion Advisor Services, LLC (from 2001 to 2018); Manager (from 2012 to 2015), General Counsel and Secretary (from 2003 to 2018) of NorthStar Financial Services Group, LLC; CEO (from 2012 to 2018), Secretary (from 2003 to 2018) and Manager (from 2005 to 2018) of Northern Lights Distributors, LLC; Director, Secretary and General Counsel of Constellation Trust Company (from 2004 to 2018); CEO (from 2015 to 2018), Manager (from 2008 to 2015), General Counsel and Secretary (from 2011 to 2018) of Northern Lights Compliance Services, LLC; General Counsel and Secretary of Blu Giant, LLC (from 2011 to 2018); Secretary of Gemini Fund Services, LLC (from 2012 to 2018); Manager of Arbor Point Advisors, LLC (from 2012 to 2018); Secretary and General Counsel of NorthStar Holdings, LLC (from 2013 to 2015); Director, Secretary and General Counsel of NorthStar CTC Holdings, Inc. (from 2015 to 2018) and Secretary and Chief Legal Officer of AdvisorOne Funds (from 2003 to 2018). | 1 | Manager of Northern Lights Distributors, LLC (from 2005 to 2018); Manager of NorthStar Financial Services Group, LLC (from 2012 to 2015); Manager of Arbor Point Advisors, LLC (from 2012 to 2018); Director of Constellation Trust Company (from 2004 to 2018) |
Kevin E. Wolf
1969 | President Since January 2013 | Vice President of The Ultimus Group, LLC and Executive Vice President, Head of Fund Administration and Product, Gemini Fund Services, LLC (since 2019), President, Gemini Fund Services, LLC (2012 - 2019). | N/A | N/A |
Richard Malinowski
1983 | Secretary Since January 2018 | Senior Vice President and Senior Managing Counsel, Gemini Fund Services, LLC, (since February 2020); Senior Vice President Legal Administration, Gemini Fund Services, LLC (since April 2017); Vice President and Counsel (April 2016 to 2017) and AVP and Staff Attorney (September 2012 to March 2016). | N/A | N/A |
Erik Naviloff
1968 | Treasurer Since January 2013 | Vice President of Gemini Fund Services, LLC (since 2011). | N/A | N/A |
Emile R. Molineaux
1962 | Chief Compliance Officer and Anti Money Laundering Officer Since May 2011 | Senior Compliance Officer and CCO of Various clients of Northern Lights Compliance Services, LLC (since 2011). | N/A | N/A |
| * | The term of office for each Trustee and Officer listed above will continue indefinitely. |
| ** | Brian Nielsen is an “interested person” of the Trust as that term is defined under the 1940 Act, because of his prior affiliation with Northern Lights Distributors, LLC (the Fund’s Distributor). |
| *** | As of October 31, 2020, the Trust was comprised of 18 active portfolios managed by unaffiliated investment advisers. The term “Fund Complex” applies only to the Fund, and not to any other series of the Trust. The Fund does not hold itself out as related to any other series within the Trust for investment purposes, nor does it share the same investment adviser with any other series. |
The Fund’s Statement of Additional Information (“SAI”) includes additional information about the Trustees and is available free of charge, upon request, by calling toll-free at 1-855-466-3406.
10/31/20 – NLII v1
Privacy Policy
Rev. May 2019
| FACTS | WHAT DOES NORTHERN LIGHTS FUND TRUST II (“NLFT II”) DO WITH YOUR PERSONAL INFORMATION? |
| Why? | Financial companies choose how they share your personal information. Federal law gives consumers the right to limit some but not all sharing. Federal law also requires us to tell you how we collect, share, and protect your personal information. Please read this notice carefully to understand what we do. |
| What? | The types of personal information we collect and share depend on the product or service you have with us. This information can include:
|
● Social Security number ● Employment information ● Account balances | ● Account transactions ● Income ● Investment experience |
When you are no longer our customer, we continue to share your information as described in this notice. |
| How? | All financial companies need to share a customer’s personal information to run their everyday business - to process transactions, maintain customer accounts, and report to credit bureaus. In the section below, we list the reasons financial companies can share their customer’s personal information; the reasons NLFT II chooses to share; and whether you can limit this sharing. |
| | |
| Reasons we can share your personal information | Does NLFT II
share? | Can you limit
this sharing? |
For our everyday business purposes —
such as to process your transactions, maintain your account(s), respond to court orders and legal investigations, or report to credit bureaus
| Yes | No |
For our marketing purposes —
to offer our products and services to you
| Yes | No |
For joint marketing with other financial companies
| Yes | No |
For our affiliates’ everyday business purposes —
information about your transactions and experiences
| Yes | No |
For our affiliates’ everyday business purposes —
information about your creditworthiness
| No | We don’t share |
For nonaffiliates to market to you
| No | We don’t share |
| Questions? | Call 1-402-493-4603 |
| | |
| Who we are |
| Who is providing this notice? | Northern Lights Fund Trust II |
| What we do |
| How does NLFT II protect my personal information? | To protect your personal information from unauthorized access and use, we use security measures that comply with federal law. These measures include computer safeguards and secured files and buildings.
|
| How does NLFT II collect my personal information? | We collect your personal information, for example, when you
|
● open an account ● give us your income information ● provide employment information | ● provide account information ● give us your contact information |
| We also collect your personal information from others, such as credit bureaus, affiliates, or other companies. |
| Why can’t I limit all sharing? | Federal law gives you the right to limit only ● sharing for affiliates’ everyday business purposes—information about your creditworthiness ● affiliates from using your information to market to you ● sharing for nonaffiliates to market to you State laws and individual companies may give you additional rights to limit sharing. |
| Definitions |
| Affiliates | Companies related by common ownership or control. They can be financial and nonfinancial companies. ● Northern Lights Fund Trust II has no affiliates. |
| Nonaffiliates | Companies not related by common ownership or control. They can be financial and nonfinancial companies. ● NLFT II does not share with nonaffiliates so they can market to you. |
| Joint marketing | A formal agreement between nonaffiliated financial companies that together market financial products and services to you. ● Our joint marketing partners include other financial service companies. |
This Page Intentionally Left Blank
PROXY VOTING POLICY
Information regarding how the Fund voted proxies relating to portfolio securities for the most recent twelve month period ended June 30 as well as a description of the policies and procedures that the Fund uses to determine how to vote proxies is available without charge, upon request, by calling 1-855-466-3406 or by referring to the Securities and Exchange Commission’s (“SEC”) website at http://www.sec.gov.
PORTFOLIO HOLDINGS
The Fund files its complete schedule of portfolio holdings with the SEC for the first and third quarters of each fiscal year on Form N-PORT. Form N-PORT is available on the SEC’s website at http://www.sec.gov. The information on Form N-PORT is available without charge, upon request, by calling 1-855-466-3406.
| INVESTMENT ADVISOR |
| Invenomic Capital Management |
| 211 Congress Street, Floor 7 |
| Boston, Massachusetts 02110 |
| |
| ADMINISTRATOR |
| Gemini Fund Services, LLC |
| 4221 North 203rd Street, Suite 100 |
| Elkhorn, Nebraska 68022 |
Item 2. Code of Ethics.
(a) As of the end of the period covered by this report, the registrant has adopted a code of ethics that applies to the registrant's principal executive officer, principal financial officer, principal accounting officer or controller, or persons performing similar functions, regardless of whether these individuals are employed by the registrant or a third party.
(b) For purposes of this item, “code of ethics” means written standards that are reasonably designed to deter wrongdoing and to promote:
| (1) | Honest and ethical conduct, including the ethical handling of actual or apparent conflicts of interest between personal and professional relationships; |
| (2) | Full, fair, accurate, timely, and understandable disclosure in reports and documents that a registrant files with, or submits to, the Commission and in other public communications made by the registrant; |
(3) Compliance with applicable governmental laws, rules, and regulations;
| (4) | The prompt internal reporting of violations of the code to an appropriate person or persons identified in the code; and |
(5) Accountability for adherence to the code.
(c) Amendments: During the period covered by the report, there have not been any amendments to the provisions of the code of ethics.
(d) Waivers: During the period covered by the report, the registrant has not granted any express or implicit waivers from the provisions of the code of ethics.
(e) The Code of Ethics is not posted on Registrant’ website.
(f) A copy of the Code of Ethics is attached as an exhibit.
Item 3. Audit Committee Financial Expert.
(a) The Registrant’s board of trustees has determined that Keith Rhoades is an audit committee financial expert, as defined in Item 3 of Form N-CSR. Mr. Rhoades is independent for purposes of this Item.
Item 4. Principal Accountant Fees and Services.
2018 2019 2020
Invenomic Fund $15,000 $15,500 $16,000
2018 2019 2020
Invenomic Fund None None None
2018 2019 2020
Invenomic Fund $3,150 $3,250 $3,250
Preparation of Federal & State income tax returns, assistance with calculation of required income, capital gain and excise distributions and preparation of Federal excise tax returns.
2018 2019 2020
Invenomic Fund None None None
| (e) | (1) Audit Committee’s Pre-Approval Policies |
The registrant’s Audit Committee is required to pre-approve all audit services and, when appropriate, any non-audit services (including audit-related, tax and all other services) to the registrant. The registrant’s Audit Committee also is required to pre-approve, when appropriate, any non-audit services (including audit-related, tax and all other services) to its adviser, or any entity controlling, controlled by or under common control with the adviser that provides ongoing services to the registrant, to the extent that the services may be determined to have an impact on the operations or financial reporting of the registrant. Services are reviewed on an engagement by engagement basis by the Audit Committee.
| (2) | Percentages of Services Approved by the Audit Committee |
Invenomic Fund
2018 2019 2020
Audit-Related Fees: 0.00% 0.00% 0.00%
Tax Fees: 0.00% 0.00% 0.00%
All Other Fees: 0.00% 0.00% 0.00%
| (f) | During the audit of registrant's financial statements for the most recent fiscal year, less than 50 percent of the hours expended on the principal accountant's engagement were attributed to work performed by persons other than the principal accountant's full-time, permanent employees. |
| (g) | The aggregate non-audit fees billed by the registrant's accountant for services rendered to the registrant, and rendered to the registrant's investment adviser (not including any sub-adviser whose role is primarily portfolio management and is subcontracted with or overseen by another investment adviser), and any entity controlling, controlled by, or under common control with the adviser that provides ongoing services to the registrant: |
2018 2019 2020
Invenomic Fund $3,150 $3,250 $3,250
(h) The registrant's audit committee has considered whether the provision of non-audit services to the registrant's investment adviser (not including any sub-adviser whose role is primarily portfolio management and is subcontracted with or overseen by another investment adviser), and any entity controlling, controlled by, or under common control with the investment adviser that provides ongoing services to the registrant, that were not pre-approved pursuant to paragraph (c)(7)(ii) of Rule 2-01 of Regulation S-X, is compatible with maintaining the principal accountant's independence.
Item 5. Audit Committee of Listed Companies. Not applicable to open-end investment companies.
Item 6. Schedule of Investments. Schedule of investments in securities of unaffiliated issuers is included under Item 1.
Item 7. Disclosure of Proxy Voting Policies and Procedures for Closed-End Funds. Not applicable to open-end investment companies.
Item 8. Portfolio Managers of Closed-End Management Investment Companies. Not applicable to open-end investment companies.
Item 9. Purchases of Equity Securities by Closed-End Funds. Not applicable to open-end investment companies.
Item 10. Submission of Matters to a Vote of Security Holders. None
Item 11. Controls and Procedures.
(a) Based on an evaluation of the Registrant’s disclosure controls and procedures as of a date within 90 days of filing date of this Form N-CSR, the principal executive officer and principal financial officer of the Registrant have concluded that the disclosure controls and procedures of the Registrant are reasonably designed to ensure that the information required in filings on Form N-CSR is recorded, processed, summarized, and reported by the filing date, including that information required to be disclosed is accumulated and communicated to the Registrant’s management, including the Registrant’s principal executive officer and principal financial officer, as appropriate to allow timely decisions regarding required disclosure.
(b) There were no significant changes in the Registrant’s internal control over financial reporting that occurred during the Registrant’s last fiscal half-year that have materially affected, or are reasonably likely to materially affect, the Registrant’s internal control over financial reporting.
Item 12. Disclosure of securities lending activities for closed-end management investment companies.
Not applicable to open-end investment companies.
Item 13. Exhibits.
(a)(1) Code of Ethics filed herewith.
(a)(2) Certifications required by Section 302 of the Sarbanes-Oxley Act of 2002 (and Item 11(a)(2) of Form N-CSR) are filed herewith.
(a)(3) Not applicable for open-end investment companies.
(b) Certifications required by Section 906 of the Sarbanes-Oxley Act of 2002 (and Item 11(b) of Form N-CSR) are filed herewith.
SIGNATURES
Pursuant to the requirements of the Securities Exchange Act of 1934 and the Investment Company Act of 1940, the registrant has duly caused this report to be signed on its behalf by the undersigned, thereunto duly authorized.
(Registrant) Northern Lights Fund Trust II
By (Signature and Title)
/s/ Kevin E. Wolf
Kevin E. Wolf, Principal Executive Officer/President
Date 1/7/21
Pursuant to the requirements of the Securities Exchange Act of 1934 and the Investment Company Act of 1940, this report has been signed below by the following persons on behalf of the registrant and in the capacities and on the dates indicated.
By (Signature and Title)
/s/Kevin E. Wolf
Kevin E. Wolf, Principal Executive Officer/President
Date 1/7/21
By (Signature and Title)
/s/ Erik Naviloff
Erik Naviloff, Principal Financial Officer/Treasurer
Date 1/7/21