united states
securities and exchange commission
washington, d.c. 20549
form n-csr
certified shareholder report of registered management
investment companies
Investment Company Act file number 811-22549
Northern Lights Fund Trust II
(Exact name of registrant as specified in charter)
225 Pictoria Drive, Suite 450 Cincinnati, OH 45246
(Address of principal executive offices) (Zip code)
Richard Malinowski, Gemini Fund Services, LLC.
80 Arkay Drive Suite 110, Hauppauge, NY 11788
(Name and address of agent for service)
Registrant's telephone number, including area code: 631-470-2619
Date of fiscal year end: 8/31
Date of reporting period: 8/31/20
Item 1. Reports to Stockholders.
| |
| |
| |
| |
| |
| |
| |
 |
| |
| |
| |
| |
| |
| |
| |
| PCS Commodity Strategy Fund |
| |
| Class A: PCYAX | Class C: PCYCX | Class I: PCYIX |
| |
| |
| |
| |
| |
| Annual Report |
| August 31, 2020 |
| |
| |
| |
| |
| |
| |
| 1-844-828-3242 |
| |
| |
| www.pcscommodityfunds.com |
| |
| |
| |
| |
| |
| |
| |
| |
| |
| |
| |
| |
| |
| Distributed by Northern Lights Distributors, LLC |
| Member FINRA |
| |
| |
| |
| |
| |
| |
Beginning on January 1, 2021, as permitted by regulations adopted by the Securities and Exchange Commission, paper copies of the Fund’s shareholder reports like this one will no longer be sent by mail, unless you specifically request paper copies of the reports. Instead, the reports will be made available on the Fund’s website www.pcscommodityfunds.com, and you will be notified by mail each time a report is posted and provided with a website link to access the report.
If you already elected to receive shareholder reports electronically, you will not be affected by this change and you need not take any action. You may elect to receive shareholder reports and other communications from the Fund electronically or to continue receiving paper copies of shareholder reports, which are available free of charge, by contacting your financial intermediary (such as a broker-dealer or bank) or, if you are a direct investor, by following the instructions included with paper Fund documents that have been mailed to you.

Dear Fellow Shareholders:
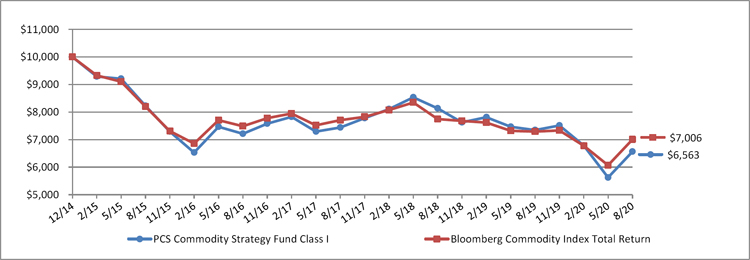
We are pleased to present you with the Annual Report for the PCS Commodity Strategy Fund (the “Fund”) covering the activities of the Fund from September 1, 2019, through August 31, 2020. Commodities declined during this period; the Fund’s Class I Share’s total return was -10.68%1, compared with -3.90% for the (benchmark) Bloomberg Commodity Total Return Index2, and +21.94% for the S&P 500 Total Return Index3.
All of the performance decline can be attributed to the sudden and, we believe, idiosyncratic drop in energy prices that occurred as a direct result of the COVID-19 global pandemic, and the resultant dramatically reduced demand for crude oil, natural gas, and refined products like gasoline and jet fuel. Turmoil in the crude oil markets reached unprecedented levels, culminating in the price of WTI Crude Oil delivery month futures contracts temporarily trading at negative prices on April 20. (As a reminder, the Fund is never invested in futures contracts near their expiration, and as a result, avoided exposure to this). Despite a rapid and steady recovery for the balance of the reporting period, crude oil failed to reach its previous high prices at the beginning of the period, delivering a loss of -42.40% for the RICI® Energy Sector.
During the period, performance across the other two commodity sectors demonstrated stronger results. The RICI® Metals Sector, including both precious and industrial metals, advanced by +18.06%, continuing its previous year’s upward trend. The RICI® Agricultural Sector, which may have benefited from the supply chain dislocations producers and processors experienced because of the pandemic-related lockdowns and workforce issues, advanced by +8.26%.
With very low short-term interest rates still in effect, the collateral portion of the Fund, consisting exclusively of shorter-maturity U.S. Treasury obligations, government securities money market funds, and cash, did not make a material contribution to the total return of the Fund.
In adopting the Rogers International Commodity Index® (the “RICI®”) methodology for obtaining exposure to the commodity futures asset class, the Fund invests in 38 commodity futures contracts across three principal sectors: agriculture, energy, and metals. At the Rogers International Commodity Index Committee meeting in December 2019, no adjustments were made to index weightings or methodology. In April 2020, although not exposed to the nearby WTI Crude Oil contract pricing volatility, the Committee made the decision to extend some WTI Crude Oil contract maturities further along the expiration curve during the current and subsequent roll periods in order to avoid, to the extent possible, exposure to any possible dislocations in those markets.
We believe that the demand-weighted commodity selection methodology of the RICI® has consistently demonstrated advantages over the more common volume or production weighting schemes, emphasizing as it does commodities that are consumed over those that are simply produced. Thus, the fund is much less prone to over-weighting commodities that are subject to a production imbalance relative to true demand. Recall also
| 1 | Annual period reflects the Fund’s performance from September 1, 2019 through August 31, 2020. Return reflected above is for Class I shares; the return for Class A shares and Class C shares were -10.76% and -11.41%, respectively. Returns do not reflect the sales charges associated with each such class of shares. |
| 2 | The Bloomberg Commodity Index Total Return® (formerly known as the Dow Jones-UBS Commodity Index Total Return®) is an unmanaged index composed of futures contracts on physical commodities. The Index is designed to be a highly liquid and diversified benchmark for commodities as an asset class. An investment cannot be made directly in an index. |
| 3 | The S&P 500 Total Return Index® is an unmanaged market-value weighted index consisting of 500 stocks chosen for market size, liquidity, sector performance and other factors. The index tracks the performance of the large cap U.S. equity market. An investment cannot be made directly in an index. |
that the commodity weightings of the Fund are rebalanced back to RICI® index weight on a monthly basis. By continually maintaining index weights the Fund is always close to its full normal allocation. Rebalancing tends to position the Fund for subsequent recoveries in price better than adhering to static weightings that are never adjusted intra-year.
Outlook:
In our opinion, the performance for the period from September 2019 through August 2020, particularly the effect the sudden decline in energy demand had on the broad index, is a reflection of both continued uncertainties around the demand patterns for raw materials, and a unusual combination of higher crude oil supply immediately followed by an acute demand shock. The COVID-19 pandemic has pushed the world into new territory, one without a relevant historical benchmark, and the shape and structure of the post-pandemic economy has yet to be defined. However, as we have frequently noted, commodities generally respond favorably to global risk events and the implied potential disruptions to production and distribution mechanisms. This occurred in the agricultural sector during the period, and on a more limited basis, in industrial metals. Commodities have also, in the past, demonstrated superior late economic cycle performance vs. equities, and the equity cycle is certainly at a mature stage, at least. Finally, depending on the speed with which the economy bounces back, the unprecedented degree of global fiscal and monetary stimulus may finally have an inflationary effect, providing a tailwind to commodity performance.
We thank you for being a shareholder in the PCS Commodity Strategy Fund.
Sincerely,
John D. Reese
CEO of Price Asset Management, LLC
8008-NLD-10/02/2020
| PCS Commodity Strategy Fund |
| PORTFOLIO REVIEW (Unaudited) |
| August 31, 2020 |
| |
The Fund’s performance figures* for the periods ended August 31, 2020, as compared to its benchmark:
| | | Annualized | Annualized Since |
| | 1 Year | 5 Year | Inception** |
| PCS Commodity Strategy Fund Class A | (10.76)% | (4.62)% | (7.30)% |
| PCS Commodity Strategy Fund Class A with load of 5.50% | (15.63)% | (5.70)% | (8.21)% |
| PCS Commodity Strategy Fund Class C + | (11.41)% | (5.35)% | (7.94)% |
| PCS Commodity Strategy Fund Class I | (10.68)% | (4.43)% | (7.09)% |
| Bloomberg Commodity Index Total Return *** | (3.90)% | (3.10)% | (6.03)% |
| | | | |
| * | Past performance is not predictive of future results. The investment return and principal value of an investment will fluctuate. An investor’s shares, when redeemed, may be worth more or less than the original cost. Total return is calculated assuming reinvestment of all dividends and distributions. Total returns would have been lower had the adviser not waived its fees and reimbursed a portion of the Fund’s expenses. The Fund’s total gross annual operating expenses, per its prospectus dated December 31, 2019 including underlying funds, are 1.79%, 2.54% and 1.53% for Class A, Class C and Class I, respectively. Class A shares are subject to a maximum sales load imposed on purchases of 5.50%. The chart does not reflect the deduction of taxes that a shareholder would have to pay on fund distributions or the redemption of the fund shares. For performance information current to the most recent month-end, please call 1-844-828-3242. |
| ** | Fund commenced operations on December 10, 2014. |
| *** | The Bloomberg Commodity Index Total Return (“BCOM” or the “Index”) is designed to be a highly liquid and diversified benchmark for commodities investments. The principal potential benefits of including commodities in a diversified financial portfolio include positive returns over time and low correlation with equities and fixed income. BCOM provides broad-based exposure to commodities as an asset class, since no single commodity or commodity sector dominates the Index. Rather than being driven by micro-economic events affecting one commodity market or sector, the diversified commodity exposure of BCOM potentially reduces volatility in comparison to non-diversified commodity baskets. Investors cannot invest directly in an index or benchmark. |
| + | The returns are based upon unadjusted net asset values and may differ from the returns shown in the consolidated financial statements, which include adjustments in accordance with accounting principles generally accepted in the United States. |
Comparison of the Change in Value of a $10,000 Investment
| Portfolio Composition as of | | | |
| August 31, 2020 | | % of Net Assets | |
| Short-Term Investments | | | 87.1 | % |
| Other Assets in Excess of Liabilities - Net (1) | | | 12.9 | % |
| | | | 100.0 | % |
| | | | | |
| (1) Includes Net Unrealized Appreciation on Open Future Contracts |
| |
Please refer to the Portfolio of Investments in this annual report for a detailed analysis of the Fund’s holdings.
| PCS Commodity Strategy Fund |
| CONSOLIDATED PORTFOLIO OF INVESTMENTS |
| August 31, 2020 |
| Principal | | | | | Effective Rate ** | | Maturity Date | | Fair Value | |
| | | | | SHORT TERM INVESTMENTS - 87.1% | | | | | | | | |
| | | | | U. S. TREASURY BILLS - 34.3% | | | | | | | | |
| $ | 4,000,000 | | | US Treasury Bill | | 0.0850% | | 10/8/2020 | | $ | 3,999,645 | |
| | | | | | | | | | | | | |
| Shares | | | | | | | | | | | |
| | | | | MONEY MARKET FUND - 52.8% | | | | | | | | |
| | 6,140,740 | | | Fidelity Treasury Portfolio - Institutional Class, 0.01% * + | | | 6,140,740 | |
| | | | | | | | | | | | | |
| | | | | TOTAL SHORT-TERM INVESTMENTS (Cost - $10,140,085) | | | 10,140,385 | |
| | | | | | | | | | | | | |
| | | | | TOTAL INVESTMENTS - 87.1% (Cost - $10,140,085) | | $ | 10,140,385 | |
| | | | | OTHER ASSETS LESS LIABILITIES - 12.9% (a) | | | 1,496,281 | |
| | | | | NET ASSETS - 100.0% | | $ | 11,636,666 | |
| | | | | | | | | | | | | |
| * | Money market fund; interest rate reflects the seven-day effective yield on August 31, 2020. |
| ** | Effective rate as of August 31, 2020. |
| + | All or a portion of this security is a holding in PCS Fund Limited. |
| (a) | Includes net unrealized appreciation on open futures contracts. |
OPEN FUTURES CONTRACTS LONG ^ - 7.5%
| | | | | | | | | | | Unrealized | |
| | | | | | | | | Appreciation/ | |
| Contracts | | | Description | | Expiration | | Notional Amount | | | (Depreciation) | |
| | 1 | | | BP Currency Future | | September 2020 | | $ | 83,619 | | | $ | 7,097 | |
| | 22 | | | Brent Crude Future | | December 2020 | | | 1,004,520 | | | | (6,490 | ) |
| | 11 | | | Brent Crude Future | | November 2020 | | | 498,080 | | | | 7,240 | |
| | 5 | | | Cocoa Future | | December 2020 | | | 117,962 | | | | 7,767 | |
| | 16 | | | Coffee Robusta Future | | November 2020 | | | 228,640 | | | | 12,180 | |
| | 31 | | | Corn Future | | December 2020 | | | 554,513 | | | | 46,950 | |
| | 15 | | | Cotton Future | | December 2020 | | | 488,700 | | | | 47,045 | |
| | 2 | | | Euro FX Currency Future | | September 2020 | | | 298,488 | | | | 23,353 | |
| | 4 | | | FCOJ-A Future | | November 2020 | | | 70,080 | | | | (4,808 | ) |
| | 5 | | | Gasoline RBOB Future | | November 2020 | | | 249,480 | | | | (2,377 | ) |
| | 2 | | | Gasoline RBOB Future | | October 2020 | | | 101,951 | | | | 7,846 | |
| | 3 | | | Gold 100 Oz Future | | December 2020 | | | 593,580 | | | | 51,340 | |
| | 1 | | | Japanese Yen Currency Future | | September 2020 | | | 118,094 | | | | 1,863 | |
| | 5 | | | KC HRW Wheat Future | | December 2020 | | | 118,813 | | | | 6,963 | |
| | 3 | | | Lean Hogs Future | | December 2020 | | | 66,150 | | | | (60 | ) |
| | 2 | | | Lean Hogs Future | | October 2020 | | | 42,880 | | | | 4,260 | |
| | 3 | | | Live Cattle Future | | December 2020 | | | 130,770 | | | | 380 | |
| | 2 | | | Live Cattle Future | | October 2020 | | | 84,240 | | | | 3,700 | |
| | 1 | | | LME Copper Future | | November 2020 | | | 166,744 | | | | (6 | ) |
| | 3 | | | LME Copper Future | | October 2020 | | | 500,400 | | | | 16,950 | |
| | 3 | | | LME Copper Future | | September 2020 | | | 501,113 | | | | 49,894 | |
| | 2 | | | LME Lead Future | | November 2020 | | | 98,525 | | | | (13 | ) |
| | 5 | | | LME Lead Future | | October 2020 | | | 245,313 | | | | 11,323 | |
| | 5 | | | LME Lead Future | | September 2020 | | | 244,063 | | | | 21,081 | |
| | 1 | | | LME Nickel Future | | October 2020 | | | 92,133 | | | | 9,441 | |
| | 1 | | | LME Nickel Future | | September 2020 | | | 92,064 | | | | 15,252 | |
| | | | | | | | | | | | | | | |
See accompanying notes to consolidated financial statements.
| PCS Commodity Strategy Fund |
| CONSOLIDATED PORTFOLIO OF INVESTMENTS (Continued) |
| August 31, 2020 |
OPEN FUTURES CONTRACTS LONG ^ - 7.5% (Continued)
| | | | | | | | | | | Unrealized | |
| | | | | | | | | Appreciation/ | |
| Contracts | | | Description | | Expiration Date | | Notional Amount | | | (Depreciation) | |
| | 3 | | | LME PRI Aluminum Future | | November 2020 | | $ | 134,794 | | | $ | (19 | ) |
| | 11 | | | LME PRI Aluminum Future | | October 2020 | | | 491,563 | | | | 17,738 | |
| | 11 | | | LME PRI Aluminum Future | | September 2020 | | | 487,163 | | | | 43,619 | |
| | 1 | | | LME Tin Future | | October 2020 | | | 89,335 | | | | (205 | ) |
| | 1 | | | LME Tin Future | | September 2020 | | | 89,335 | | | | 5,610 | |
| | 1 | | | LME Zinc Future | | November 2020 | | | 62,869 | | | | (6 | ) |
| | 4 | | | LME Zinc Future | | October 2020 | | | 250,825 | | | | 19,712 | |
| | 4 | | | LME Zinc Future | | September 2020 | | | 249,825 | | | | 45,000 | |
| | 3 | | | Low Sulfur Gasoil Future | | November 2020 | | | 112,200 | | | | (375 | ) |
| | 1 | | | Low Sulfur Gasoil Future | | October 2020 | | | 36,825 | | | | (975 | ) |
| | 2 | | | Lumber Future | | November 2020 | | | 164,450 | | | | 47,872 | |
| | 1 | | | Milk Future | | October 2020 | | | 35,720 | | | | 20 | |
| | 20 | | | Mill Wheat Euro Future | | December 2020 | | | 221,849 | | | | 4,300 | |
| | 16 | | | Natural Gas Future | | November 2020 | | | 467,200 | | | | 320 | |
| | 11 | | | Natural Gas Future | | October 2020 | | | 289,300 | | | | 43,010 | |
| | 3 | | | NY Harbour ULSD Future | | November 2020 | | | 156,278 | | | | (911 | ) |
| | 1 | | | NY Harbour ULSD Future | | October 2020 | | | 51,127 | | | | (1,625 | ) |
| | 4 | | | Oat Future | | December 2020 | | | 55,000 | | | | 1,000 | |
| | 3 | | | Platinum Future | | January 2021 | | | 142,110 | | | | (185 | ) |
| | 1 | | | Platinum Future | | October 2020 | | | 46,895 | | | | 1,835 | |
| | 5 | | | Rapeseed Future | | November 2020 | | | 114,512 | | | | 1,294 | |
| | 4 | | | Red Wheat Future | | December 2020 | | | 107,900 | | | | 2,900 | |
| | 3 | | | Rough Rice Future | | November 2020 | | | 74,130 | | | | 4,390 | |
| | 9 | | | Rubber Future | | February 2021 | | | 82,536 | | | | 2,337 | |
| | 5 | | | Rubber Future | | January 2021 | | | 45,759 | | | | 6,425 | |
| | 3 | | | Silver Future | | December 2020 | | | 428,910 | | | | 60,530 | |
| | 9 | | | Soybean Future | | November 2020 | | | 429,075 | | | | 45,075 | |
| | 3 | | | Soybean Meal Future | | December 2020 | | | 93,750 | | | | 6,120 | |
| | 12 | | | Soybean Oil Future | | December 2020 | | | 236,592 | | | | 31,080 | |
| | 5 | | | Sugar #11 Future | | March 2021 | | | 74,368 | | | | 202 | |
| | 3 | | | Sugar #11 Future | | October 2020 | | | 42,538 | | | | 5,309 | |
| | 12 | | | Wheat Future | | December 2020 | | | 331,350 | | | | 9,737 | |
| | 2 | | | White Sugar Future | | December 2020 | | | 36,520 | | | | 10 | |
| | 4 | | | White Sugar Future | | October 2020 | | | 71,940 | | | | 590 | |
| | 27 | | | WTI Crude Future | | November 2020 | | | 1,158,300 | | | | (5,070 | ) |
| | 13 | | | WTI Crude Future | | October 2020 | | | 553,930 | | | | 142,300 | |
| | | | | TOTAL UNREALIZED APPRECIATION ON OPEN FUTURE CONTRACTS LONG | | $ | 877,135 | |
OPEN FUTURES CONTRACTS SHORT ^ - (0.6)%
| | | | | | | | | | | Unrealized | |
| | | | | | | | | Appreciation/ | |
| Contracts | | | Description | | Expiration Date | | Notional Amount | | | (Depreciation) | |
| | 3 | | | LME Copper Future | | September 2020 | | | 501,113 | | | | (17,588 | ) |
| | 1 | | | LME Copper Future | | October 2020 | | | 166,800 | | | | — | |
| | | | | | | | | | | | | | | |
See accompanying notes to consolidated financial statements.
| PCS Commodity Strategy Fund |
| CONSOLIDATED PORTFOLIO OF INVESTMENTS (Continued) |
| August 31, 2020 |
OPEN FUTURES CONTRACTS SHORT ^ - (0.6)% (Continued)
| | | | | | | | | | | Unrealized | |
| | | | | | | Appreciation/ | |
| Contracts | | | Description | | Expiration Date | | Notional Amount | | | (Depreciation) | |
| | 5 | | | LME Lead Future | | September 2020 | | $ | 244,063 | | | $ | (10,742 | ) |
| | 2 | | | LME Lead Future | | October 2020 | | | 98,125 | | | | — | |
| | 1 | | | LME Nickel Future | | September 2020 | | | 92,064 | | | | (9,483 | ) |
| | 11 | | | LME PRI Aluminum Future | | September 2020 | | | 487,163 | | | | (16,788 | ) |
| | 4 | | | LME PRI Aluminum Future | | October 2020 | | | 178,750 | | | | (231 | ) |
| | 1 | | | LME Tin Future | | September 2020 | | | 89,335 | | | | 325 | |
| | 4 | | | LME Zinc Future | | September 2020 | | | 249,825 | | | | (18,988 | ) |
| | 1 | | | LME Zinc Future | | October 2020 | | | 62,706 | | | | — | |
| | | | | TOTAL UNREALIZED DEPRECIATION ON OPEN FUTURE CONTRACTS SHORT | | $ | (73,495 | ) |
| | | | | | | | | | | | | | | |
| | | | | NET UNREALIZED APPRECIATION ON OPEN FUTURE CONTRACTS | | $ | 803,640 | |
| | | | | | | | | | | | | | | |
| ^ | All of these securities are holdings in PCS Fund Limited. |
See accompanying notes to consolidated financial statements.
| PCS Commodity Strategy Fund |
| CONSOLIDATED STATEMENT OF ASSETS AND LIABILITIES |
| August 31, 2020 |
| ASSETS | | | | |
| Investment securities: | | | | |
| At cost | | $ | 10,140,085 | |
| At value | | | 10,140,385 | |
| Net unrealized appreciation on open Futures Contracts | | | 803,640 | |
| Deposits with Broker | | | 631,350 | |
| Receivable from investment adviser | | | 100,230 | |
| Interest receivable | | | 165 | |
| Prepaid expenses and other assets | | | 15,531 | |
| TOTAL ASSETS | | | 11,691,301 | |
| | | | | |
| LIABILITIES | | | | |
| Distribution (12b-1) fees payable | | | 1,782 | |
| Payable to Related Parties | | | 17,824 | |
| Accrued audit fees payable | | | 22,380 | |
| Accrued expenses and other liabilities | | | 12,649 | |
| TOTAL LIABILITIES | | | 54,635 | |
| NET ASSETS | | $ | 11,636,666 | |
| | | | | |
| Net Assets Consist Of: | | | | |
| Paid in capital | | $ | 23,268,284 | |
| Accumulated losses | | | (11,631,618 | ) |
| NET ASSETS | | $ | 11,636,666 | |
| | | | | |
| Class A Shares: | | | | |
| Net Assets | | $ | 3,729,570 | |
| Shares of beneficial interest outstanding [$0 par value, unlimited shares authorized] | | | 608,800 | |
| Net asset value and redemption price per share (Net assets/Shares of Beneficial Interest)* | | $ | 6.13 | |
| Maximum offering price per share (maximum sales charge of 5.50%) | | $ | 6.49 | |
| | | | | |
| Class C Shares: | | | | |
| Net Assets | | $ | 1,026,648 | |
| Shares of beneficial interest outstanding [$0 par value, unlimited shares authorized] | | | 171,757 | |
| Net asset value, offering and redemption price per share (Net assets/Shares of Beneficial Interest)* | | $ | 5.98 | |
| | | | | |
| Class I Shares: | | | | |
| Net Assets | | $ | 6,880,448 | |
| Shares of beneficial interest outstanding [$0 par value, unlimited shares authorized] | | | 1,116,514 | |
| Net asset value, offering and redemption price per share (Net assets/Shares of Beneficial Interest)* | | $ | 6.16 | |
| | | | | |
| * | The Fund charges a redemption fee of 1% on redemptions of shares held for less than 30 days. |
See accompanying notes to consolidated financial statements.
| PCS Commodity Strategy Fund |
| CONSOLIDATED STATEMENT OF OPERATIONS |
| For the year ended August 31, 2020 |
| INVESTMENT INCOME | | | | |
| Interest | | $ | 344,723 | |
| TOTAL INVESTMENT INCOME | | | 344,723 | |
| | | | | |
| EXPENSES | | | | |
| Investment advisory fees | | | 189,170 | |
| Distribution (12b-1) fees | | | | |
| Class A | | | 16,411 | |
| Class C | | | 14,853 | |
| Transfer agent fees | | | 65,067 | |
| Registration fees | | | 51,950 | |
| Administrative services fees | | | 44,159 | |
| Trustee fees | | | 36,529 | |
| Legal fees | | | 34,925 | |
| Chief compliance officer fees | | | 28,284 | |
| Accounting services fees | | | 26,852 | |
| Audit and tax fees | | | 22,444 | |
| Printing and postage expenses | | | 21,877 | |
| Third party administrative services fees | | | 21,050 | |
| Custodian fees | | | 9,643 | |
| Insurance expense | | | 5,318 | |
| Miscellaneous expenses | | | 4,978 | |
| TOTAL EXPENSES | | | 593,510 | |
| Fees waived by the Advisor | | | (299,771 | ) |
| NET EXPENSES | | | 293,739 | |
| | | | | |
| NET INVESTMENT INCOME | | | 50,984 | |
| | | | | |
| REALIZED AND UNREALIZED GAIN (LOSS) ON INVESTMENTS, FUTURE CONTRACTS AND FOREIGN CURRENCY | | | | |
| Net Realized Gain (Loss) from: | | | | |
| Investments | | | 15,983 | |
| Foreign Currency Transactions | | | 3,034 | |
| Future Contracts | | | (5,216,408 | ) |
| Net Realized Loss | | | (5,197,391 | ) |
| | | | | |
| Net Change in Unrealized Appreciation (Depreciation) on: | | | | |
| Investments | | | (20,165 | ) |
| Foreign Currency Translations | | | 18,162 | |
| Future Contracts | | | 1,441,745 | |
| Net Change in Unrealized Appreciation (Depreciation) | | | 1,439,742 | |
| | | | | |
| NET REALIZED AND UNREALIZED LOSS | | | (3,757,649 | ) |
| | | | | |
| NET DECREASE IN NET ASSETS RESULTING FROM OPERATIONS | | $ | (3,706,665 | ) |
| | | | | |
See accompanying notes to consolidated financial statements.
| PCS Commodity Strategy Fund |
| CONSOLIDATED STATEMENTS OF CHANGES IN NET ASSETS |
| | | For the | | | For the | |
| | | Year Ended | | | Year Ended | |
| | | August 31, 2020 | | | August 31, 2019 | |
| FROM OPERATIONS | | | | | | | | |
| Net investment income | | $ | 50,984 | | | $ | 538,207 | |
| Net realized loss on investments, future contracts and foreign currency transactions | | | (5,197,391 | ) | | | (7,353,922 | ) |
| Net change in unrealized appreciation (depreciation) on investments, future contracts and foreign currency translations | | | 1,439,742 | | | | 780,979 | |
| Net decrease in net assets resulting from operations | | | (3,706,665 | ) | | | (6,034,736 | ) |
| | | | | | | | | |
| DISTRIBUTIONS TO SHAREHOLDERS | | | | | | | | |
| Return of Capital: | | | | | | | | |
| Class A | | | (6,908 | ) | | | — | |
| Class C | | | — | | | | — | |
| Class I | | | (16,148 | ) | | | — | |
| Total distributions paid: | | | | | | | | |
| Class A | | | (61,482 | ) | | | (682,080 | ) |
| Class C | | | — | | | | (116,983 | ) |
| Class I | | | (219,034 | ) | | | (1,964,326 | ) |
| Net decrease in net assets from distributions to shareholders | | | (303,572 | ) | | | (2,763,389 | ) |
| | | | | | | | | |
| FROM SHARES OF BENEFICIAL INTEREST | | | | | | | | |
| Class A: | | | | | | | | |
| Proceeds from shares sold | | | 925,983 | | | | 5,405,706 | |
| Distributions reinvested | | | 68,157 | | | | 681,651 | |
| Payments for shares redeemed | | | (5,066,120 | ) | | | (11,757,392 | ) |
| Redemption fee proceeds | | | 415 | | | | 432 | |
| | | | (4,071,565 | ) | | | (5,669,603 | ) |
| Class C: | | | | | | | | |
| Proceeds from shares sold | | | 87,000 | | | | 135,000 | |
| Distributions reinvested | | | — | | | | 115,394 | |
| Payments for shares redeemed | | | (710,198 | ) | | | (1,130,252 | ) |
| | | | (623,198 | ) | | | (879,858 | ) |
| Class I: | | | | | | | | |
| Proceeds from shares sold | | | 3,277,887 | | | | 18,814,976 | |
| Distributions reinvested | | | 228,957 | | | | 1,924,441 | |
| Payments for shares redeemed | | | (23,145,878 | ) | | | (31,295,063 | ) |
| Redemption fee proceeds | | | 556 | | | | 2,551 | |
| | | | (19,638,478 | ) | | | (10,553,095 | ) |
| | | | | | | | | |
| Net decrease in net assets from shares of beneficial interest | | | (24,333,241 | ) | | | (17,102,556 | ) |
| | | | | | | | | |
| TOTAL DECREASE IN NET ASSETS | | | (28,343,478 | ) | | | (25,900,681 | ) |
| | | | | | | | | |
| Net Assets: | | | | | | | | |
| Beginning of Year | | | 39,980,144 | | | | 65,880,825 | |
| End of Year | | $ | 11,636,666 | | | $ | 39,980,144 | |
| | | | | | | | | |
See accompanying notes to consolidated financial statements.
| PCS Commodity Strategy Fund |
| CONSOLIDATED STATEMENTS OF CHANGES IN NET ASSETS (Continued) |
| | | For the | | | For the | |
| | | Year Ended | | | Year Ended | |
| | | August 31, 2020 | | | August 31, 2019 | |
| SHARE ACTIVITY | | | | | | | | |
| Class A | | | | | | | | |
| Shares Sold | | | 145,400 | | | | 725,437 | |
| Shares Reinvested | | | 9,493 | | | | 94,411 | |
| Shares Redeemed | | | (859,950 | ) | | | (1,600,656 | ) |
| Net decrease in shares of beneficial interest outstanding | | | (705,057 | ) | | | (780,808 | ) |
| | | | | | | | | |
| Class C | | | | | | | | |
| Shares Sold | | | 13,030 | | | | 17,995 | |
| Shares Reinvested | | | — | | | | 16,276 | |
| Shares Redeemed | | | (119,406 | ) | | | (159,968 | ) |
| Net decrease in shares of beneficial interest outstanding | | | (106,376 | ) | | | (125,697 | ) |
| | | | | | | | | |
| Class I | | | | | | | | |
| Shares Sold | | | 473,314 | | | | 2,442,350 | |
| Shares Reinvested | | | 31,755 | | | | 265,074 | |
| Shares Redeemed | | | (3,550,546 | ) | | | (4,193,800 | ) |
| Net decrease in shares of beneficial interest outstanding | | | (3,045,477 | ) | | | (1,486,376 | ) |
| | | | | | | | | |
See accompanying notes to consolidated financial statements.
| PCS Commodity Strategy Fund - Class A |
| CONSOLIDATED FINANCIAL HIGHLIGHTS |
Per Share Data and Ratios for a Share of Beneficial Interest Outstanding Throughout each Year Presented
| | | For the | | | For the | | | For the | | | For the | | | For the | |
| | | Year Ended | | | Year Ended | | | Year Ended | | | Year Ended | | | Year Ended | |
| | | August 31, 2020 | | | August 31, 2019 | | | August 31, 2018 | | | August 31, 2017 | | | August 31, 2016 | |
| Net asset value, beginning of year | | $ | 6.92 | | | $ | 8.06 | | | $ | 7.40 | | | $ | 7.18 | | | $ | 8.21 | |
| Activity from investment operations: | | | | | | | | | | | | | | | | | | | | |
| Net investment income (loss) (1) | | | 0.00 | (2) | | | 0.07 | | | | (0.00 | ) (2) | | | (0.07 | ) | | | (0.09 | ) |
| Net realized and unrealized gain (loss) on investments and future contracts | | | (0.74 | ) | | | (0.86 | ) | | | 0.67 | | | | 0.29 | | | | (0.94 | ) |
| Total from investment operations | | | (0.74 | ) | | | (0.79 | ) | | | 0.67 | | | | 0.22 | | | | (1.03 | ) |
| Less distributions from: | | | | | | | | | | | | | | | | | | | | |
| Net investment income | | | (0.04 | ) | | | (0.35 | ) | | | (0.01 | ) | | | — | | | | — | |
| Return of Capital | | | (0.01 | ) | | | — | | | | — | | | | — | | | | — | |
| Total distributions | | | (0.05 | ) | | | (0.35 | ) | | | (0.01 | ) | | | — | | | | — | |
| Redemption fees (2) | | | 0.00 | | | | 0.00 | | | | 0.00 | | | | 0.00 | | | | 0.00 | |
| Net asset value, end of year | | $ | 6.13 | | | $ | 6.92 | | | $ | 8.06 | | | $ | 7.40 | | | $ | 7.18 | |
| Total return (3) | | | (10.76 | )% | | | (10.03 | )% | | | 9.08 | % | | | 3.06 | % | | | (12.55 | )% |
| Net assets, end of year (000s) | | $ | 3,730 | | | $ | 9,093 | | | $ | 16,873 | | | $ | 14,105 | | | $ | 7,246 | |
| Ratio of expenses to average net assets: | | | | | | | | | | | | | | | | | | | | |
| Before waiver/reimbursement (4) | | | 2.73 | % | | | 1.78 | % | | | 1.93 | % | | | 2.44 | % | | | 3.90 | % |
| Net of waiver/reimbursement | | | 1.35 | % | | | 1.35 | % | | | 1.35 | % | | | 1.35 | % | | | 1.35 | % |
| Ratio of net investment income (loss) to average net assets | | | 0.01 | % | | | 0.90 | % | | | (0.01 | )% | | | (0.90 | )% | | | (1.21 | )% |
| Portfolio Turnover Rate (5) | | | 0 | % | | | 0 | % | | | 0 | % | | | 0 | % | | | 0 | % |
| (1) | Per share amounts calculated using the average shares method, which more appropriately presents the per share data for the period. |
| (2) | Less than $0.005 per share |
| (3) | Total returns are historical in nature and assume changes in share price, reinvestment of dividends and capital gains distributions, if any. Had the Adviser not absorbed a portion of Fund expenses, total returns would have been lower. |
| (4) | Represents the ratio of expenses to average net assets absent fee waivers and/or expense reimbursements by the Adviser. |
| (5) | The portfolio turnover rate excludes investments whose maturities or expiration dates at the time of acquisition were one year or less. For this reason all futures contracts, money market funds and U.S Treasury Bills that were traded throughout the period are excluded from the calculation. Had the Fund’s core investments been included in the calculation, the turnover calculation would have been much higher. |
See accompanying notes to consolidated financial statements.
| PCS Commodity Strategy Fund - Class C |
| CONSOLIDATED FINANCIAL HIGHLIGHTS |
Per Share Data and Ratios for a Share of Beneficial Interest Outstanding Throughout each Year Presented
| | | For the | | | For the | | | For the | | | For the | | | For the | |
| | | Year Ended | | | Year Ended | | | Year Ended | | | Year Ended | | | Year Ended | |
| | | August 31, 2020 | | | August 31, 2019 | | | August 31, 2018 | | | August 31, 2017 | | | August 31, 2016 | |
| Net asset value, beginning of year | | $ | 6.76 | | | $ | 7.87 | | | $ | 7.28 | | | $ | 7.12 | | | $ | 8.20 | |
| Activity from investment operations: | | | | | | | | | | | | | | | | | | | | |
| Net investment income (loss) (1) | | | (0.05 | ) | | | 0.01 | | | | (0.06 | ) | | | (0.12 | ) | | | (0.14 | ) |
| Net realized and unrealized gain (loss) on investments and future contracts | | | (0.73 | ) | | | (0.83 | ) | | | 0.65 | | | | 0.28 | | | | (0.94 | ) |
| Total from investment operations | | | (0.78 | ) | | | (0.82 | ) | | | 0.59 | | | | 0.16 | | | | (1.08 | ) |
| Less distributions from: | | | | | | | | | | | | | | | | | | | | |
| Net investment income | | | — | | | | (0.29 | ) | | | — | | | | — | | | | — | |
| Total distributions | | | — | | | | (0.29 | ) | | | — | | | | — | | | | — | |
| Redemption fees | | | — | | | | — | | | | 0.00 | (2) | | | 0.00 | (2) | | | 0.00 | (2) |
| Net asset value, end of year | | $ | 5.98 | | | $ | 6.76 | | | $ | 7.87 | | | $ | 7.28 | | | $ | 7.12 | |
| Total return (3) | | | (11.54 | )% (4) | | | (10.54 | )% (4) | | | 8.10 | % | | | 2.11 | % | | | (13.17 | )% |
| Net assets, end of year (000s) | | $ | 1,027 | | | $ | 1,879 | | | $ | 3,179 | | | $ | 2,282 | | | $ | 1,701 | |
| Ratio of expenses to average net assets: | | | | | | | | | | | | | | | | | | | | |
| Before waiver/reimbursement (5) | | | 3.65 | % | | | 2.53 | % | | | 2.68 | % | | | 3.19 | % | | | 4.65 | % |
| Net of waiver/reimbursement | | | 2.10 | % | | | 2.10 | % | | | 2.10 | % | | | 2.10 | % | | | 2.10 | % |
| Ratio of net investment income (loss) to average net assets | | | (0.85 | )% | | | 0.15 | % | | | (0.75 | )% | | | (1.67 | )% | | | (1.99 | )% |
| Portfolio Turnover Rate (6) | | | 0 | % | | | 0 | % | | | 0 | % | | | 0 | % | | | 0 | % |
| (1) | Per share amounts calculated using the average shares method, which more appropriately presents the per share data for the period. |
| (2) | Less than $0.005 per share |
| (3) | Total returns are historical in nature and assume changes in share price, reinvestment of dividends and capital gains distributions, if any. Had the Adviser not absorbed a portion of Fund expenses, total returns would have been lower. |
| (4) | Includes adjustments in accordance with accounting principles generally accepted in the United States and, consequently, the net asset value for financial reporting purposes and the returns based upon those net asset values may differ from the net asset values and returns for shareholder transactions. |
| (5) | Represents the ratio of expenses to average net assets absent fee waivers and/or expense reimbursements by the Adviser. |
| (6) | The portfolio turnover rate excludes investments whose maturities or expiration dates at the time of acquisition were one year or less. For this reason all futures contracts, money market funds and U.S Treasury Bills that were traded throughout the period are excluded from the calculation. Had the Fund’s core investments been included in the calculation, the turnover calculation would have been much higher. |
See accompanying notes to consolidated financial statements.
| PCS Commodity Strategy Fund - Class I |
| CONSOLIDATED FINANCIAL HIGHLIGHTS |
Per Share Data and Ratios for a Share of Beneficial Interest Outstanding Throughout each Year Presented
| | | For the | | | For the | | | For the | | | For the | | | For the | |
| | | Year Ended | | | Year Ended | | | Year Ended | | | Year Ended | | | Year Ended | |
| | | August 31, 2020 | | | August 31, 2019 | | | August 31, 2018 | | | August 31, 2017 | | | August 31, 2016 | |
| Net asset value, beginning of year | | $ | 6.97 | | | $ | 8.11 | | | $ | 7.45 | | | $ | 7.21 | | | $ | 8.23 | |
| Activity from investment operations: | | | | | | | | | | | | | | | | | | | | |
| Net investment Income (loss) (1) | | | 0.03 | | | | 0.09 | | | | 0.03 | | | | (0.05 | ) | | | (0.08 | ) |
| Net realized and unrealized gain (loss) on investments and future contracts | | | (0.76 | ) | | | (0.86 | ) | | | 0.65 | | | | 0.29 | | | | (0.94 | ) |
| Total from investment operations | | | (0.73 | ) | | | (0.77 | ) | | | 0.68 | | | | 0.24 | | | | (1.02 | ) |
| Less distributions from: | | | | | | | | | | | | | | | | | | | | |
| Net investment income | | | (0.07 | ) | | | (0.37 | ) | | | (0.02 | ) | | | — | | | | — | |
| Return of Capital | | | (0.01 | ) | | | — | | | | — | | | | — | | | | — | |
| Total distributions | | | (0.08 | ) | | | (0.37 | ) | | | (0.02 | ) | | | — | | | | — | |
| Redemption fees (2) | | | 0.00 | | | | 0.00 | | | | 0.00 | | | | 0.00 | | | | 0.00 | |
| Net asset value, end of year | | $ | 6.16 | | | $ | 6.97 | | | $ | 8.11 | | | $ | 7.45 | | | $ | 7.21 | |
| Total return (3) | | | (10.68 | )% | | | (9.69 | )% | | | 9.22 | % | | | 3.19 | % | | | (12.39 | )% |
| Net assets, end of year (000s) | | $ | 6,880 | | | $ | 29,008 | | | $ | 45,829 | | | $ | 9,874 | | | $ | 7,012 | |
| Ratio of expenses to average net assets: | | | | | | | | | | | | | | | | | | | | |
| Before waiver/reimbursement (4) | | | 2.28 | % | | | 1.52 | % | | | 1.56 | % | | | 2.19 | % | | | 3.65 | % |
| Net of waiver/reimbursement | | | 1.10 | % | | | 1.10 | % | | | 1.10 | % | | | 1.10 | % | | | 1.10 | % |
| Ratio of net investment income (loss) to average net assets | | | 0.40 | % | | | 1.15 | % | | | 0.39 | % | | | (0.67 | )% | | | (0.99 | )% |
| Portfolio Turnover Rate (5) | | | 0 | % | | | 0 | % | | | 0 | % | | | 0 | % | | | 0 | % |
| (1) | Per share amounts calculated using the average shares method, which more appropriately presents the per share data for the period. |
| (2) | Less than $0.005 per share |
| (3) | Total returns are historical in nature and assume changes in share price, reinvestment of dividends and capital gains distributions, if any. Had the Adviser not absorbed a portion of Fund expenses, total returns would have been lower. |
| (4) | Represents the ratio of expenses to average net assets absent fee waivers and/or expense reimbursements by the Adviser. |
| (5) | The portfolio turnover rate excludes investments whose maturities or expiration dates at the time of acquisition were one year or less. For this reason all futures contracts, money market funds and U.S Treasury Bills that were traded throughout the period are excluded from the calculation. Had the Fund’s core investments been included in the calculation, the turnover calculation would have been much higher. |
See accompanying notes to consolidated financial statements.
| PCS Commodity Strategy Fund |
| NOTES TO CONSOLIDATED FINANCIAL STATEMENTS |
| August 31, 2020 |
PCS Commodity Strategy Fund (the “Fund”) is a diversified series of shares of beneficial interest of Northern Lights Fund Trust II (the “Trust”), a trust organized under the laws of the State of Delaware on August 26, 2010, and is registered under the Investment Company Act of 1940, as amended (the “1940 Act”), as an open-end management investment company. The Fund’s investment objective is to seek to provide long term total return. The fund commenced operations on December 10, 2014 and currently offers Class A, Class C and Class I shares. Class A shares are offered at net asset value plus a maximum sales charge of 5.50%. Class C and Class I shares are offered at net asset value. Each class represents an interest in the same assets of the Fund and classes are identical except for differences in their ongoing service and distribution charges. All classes of shares have equal voting privileges except that each class has exclusive voting rights with respect to its service and/or distribution plans. The Fund’s income, expenses (other than class specific distribution fees) and realized and unrealized gains and losses are allocated proportionately each day based upon the relative net assets of each class.
| 2. | SIGNIFICANT ACCOUNTING POLICIES |
The following is a summary of significant accounting policies followed by the Fund in preparation of its financial statements. The policies are in conformity with accounting principles generally accepted in the United States of America (“GAAP”). The preparation of financial statements requires management to make estimates and assumptions that affect the reported amounts of assets and liabilities and disclosure of contingent assets and liabilities at the date of the financial statements and the reported amounts of income and expenses for the period. Actual results could differ from those estimates. The Fund is an investment company and accordingly follows the investment company accounting and reporting guidance of the Financial Accounting Standards Board (FASB) Accounting Standard Codification Topic 946 “Financial Services – Investment Companies”.
Security Valuation – Securities listed on an exchange are valued at the last reported sale price at the close of the regular trading session of the primary exchange on the business day the value is being determined, or in the case of securities listed on NASDAQ at the NASDAQ Official Closing Price (“NOCP”). In the absence of a sale such securities shall be valued at the mean between the current bid and ask prices on the day of valuation. Investments valued in currencies other than the U.S. dollar are converted to U.S. dollars using exchange rates obtained from pricing services. Short-term debt obligations having 60 days or less remaining until maturity, at time of purchase, may be valued at amortized cost. Investments in open-end investment companies are valued at net asset value. Futures and future options are valued at the final settled price or, in the absence of a settled price, at the last sale price on the day of valuation.
The Fund may hold securities, such as private investments, interests in commodity pools, other non-traded securities or temporarily illiquid securities, for which market quotations are not readily available or are determined to be unreliable. These securities will be valued using the “fair value” procedures approved by Trust’s Board of Trustees (the “Board”). The Board has delegated execution of these procedures to a fair value committee composed of one or more officers from each of the (i) Trust, (ii) administrator, and (iii) adviser. The committee may also enlist third party consultants such as a valuation specialist at a public accounting firm, valuation consultant or financial officer of a security issuer on an as-needed basis to assist in determining a security-specific fair value. The Board has also engaged a third party valuation firm to attend valuation meetings held by the Trust, review minutes of such meetings and report to the Board on a quarterly basis. The Board reviews and ratifies the execution of this process and the resultant fair value prices at least quarterly to assure the process produces reliable results.
Fair Valuation Process – As noted above, the fair value committee is composed of one or more officers from each of the (i) Trust, (ii) administrator, and (iii) adviser. The applicable investments are valued collectively via inputs from each of these groups. For example, fair value determinations are required for the following securities: (i) securities for which market quotations are insufficient or not readily available on a particular business
| PCS Commodity Strategy Fund |
| NOTES TO CONSOLIDATED FINANCIAL STATEMENTS |
| August 31, 2020 (Continued) |
day (including securities for which there is a short and temporary lapse in the provision of a price by the regular pricing source), (ii) securities for which, in the judgment of the adviser, the prices or values available do not represent the fair value of the instrument. Factors which may cause the adviser to make such a judgment include, but are not limited to, the following: only a bid price or an asked price is available; the spread between bid and asked prices is substantial; the frequency of sales; the thinness of the market; the size of reported trades; and actions of the securities markets, such as the suspension or limitation of trading; (iii) securities determined to be illiquid; (iv) securities with respect to which an event that will affect the value thereof has occurred (a “significant event”) since the closing prices were established on the principal exchange on which they are traded, but prior to a Fund’s calculation of its net asset value. Specifically, interests in commodity pools or managed futures pools are valued on a daily basis by reference to the closing market prices of each futures contract or other asset held by a pool, as adjusted for pool expenses. Restricted or illiquid securities, such as private placements or non-traded securities are valued via inputs from the adviser based upon the current bid for the security from two or more independent dealers or other parties reasonably familiar with the facts and circumstances of the security (who should take into consideration all relevant factors as may be appropriate under the circumstances). If the adviser is unable to obtain a current bid from such independent dealers or other independent parties, the fair value committee shall determine the fair value of such security using the following factors: (i) the type of security; (ii) the cost at date of purchase; (iii) the size and nature of the Fund’s holdings; (iv) the discount from market value of unrestricted securities of the same class at the time of purchase and subsequent thereto; (v) information as to any transactions or offers with respect to the security; (vi) the nature and duration of restrictions on disposition of the security and the existence of any registration rights; (vii) how the yield of the security compares to similar securities of companies of similar or equal creditworthiness; (viii) the level of recent trades of similar or comparable securities; (ix) the liquidity characteristics of the security; (x) current market conditions; and (xi) the market value of any securities into which the security is convertible or exchangeable.
The Fund utilizes various methods to measure the fair value of its investments on a recurring basis. GAAP establishes a hierarchy that prioritizes inputs to valuation methods. The three levels of input are:
Level 1 – Unadjusted quoted prices in active markets for identical assets and liabilities that the Fund has the ability to access.
Level 2 – Observable inputs other than quoted prices included in level 1 that are observable for the asset or liability, either directly or indirectly. These inputs may include quoted prices for the identical instrument in an inactive market, prices for similar instruments, interest rates, prepayment speeds, credit risk, yield curves, default rates and similar data.
Level 3 – Unobservable inputs for the asset or liability, to the extent relevant observable inputs are not available; representing the Fund’s own assumptions about the assumptions a market participant would use in valuing the asset or liability, and would be based on the best information available.
The availability of observable inputs can vary from security to security and is affected by a wide variety of factors, including, for example, the type of security, whether the security is new and not yet established in the marketplace, the liquidity of markets, and other characteristics particular to the security. To the extent that valuation is based on models or inputs that are less observable or unobservable in the market, the determination of fair value requires more judgment. Accordingly, the degree of judgment exercised in determining fair value is greatest for instruments categorized in Level 3.
The inputs used to measure fair value may fall into different levels of the fair value hierarchy. In such cases, for disclosure purposes, the level in the fair value hierarchy within which the fair value measurement falls in its entirety, is determined based on the lowest level input that is significant to the fair value measurement in its entirety.
| PCS Commodity Strategy Fund |
| NOTES TO CONSOLIDATED FINANCIAL STATEMENTS |
| August 31, 2020 (Continued) |
The inputs or methodology used for valuing securities are not necessarily an indication of the risk associated with investing in those securities. The following tables summarize the inputs used as of August 31, 2020 for the Fund’s investments measured at fair value:
| Assets | | Level 1 | | | Level 2 | | | Level 3 | | | Total | |
| Investments: | | | | | | | | | | | | | | | | |
| U.S. Treasury Bill | | $ | — | | | $ | 3,999,645 | | | $ | — | | | $ | 3,999,645 | |
| Money Market Fund | | | 6,140,740 | | | | — | | | | — | | | | 6,140,740 | |
| Long Future Contracts | | | 877,135 | | | | — | | | | — | | | | 877,135 | |
| Total Assets: | | $ | 7,017,875 | | | $ | 3,999,645 | | | $ | — | | | $ | 11,017,520 | |
| Liabilities | | | | | | | | | | | | | | | | |
| Short Future Contracts | | $ | 73,495 | | | $ | — | | | $ | — | | | $ | 73,495 | |
| Total Liabilities: | | $ | 73,495 | | | $ | — | | | $ | — | | | $ | 73,495 | |
The Fund did not hold any Level 3 securities during the period.
Futures Contracts – The Fund is subject to equity price risk, interest rate risk, foreign currency exchange rate risk and commodity risk in the normal course of pursuing its investment objectives. The Fund may purchase or sell futures contracts to gain exposure to, or hedge against, changes in the value of equities, interest rates or foreign currencies or commodities. Initial margin deposits required upon entering into futures contracts are satisfied by the segregation of specific securities or cash as collateral for the account of the broker (the Fund’s agent in acquiring the futures position). During the period the futures contracts are open, changes in the value of the contracts are recognized as unrealized gains or losses by “marking to market” on a daily basis to reflect the market value of the contracts at the end of each day’s trading. Variation margin payments are received or made depending upon whether unrealized gains or losses are incurred. When the contracts are closed, the Fund recognizes a realized gain or loss equal to the difference between the proceeds from, or cost of, the closing transaction and the Fund’s basis in the contract. If the Fund were unable to liquidate a futures contract and/or enter into an offsetting closing transaction, the Fund would continue to be subject to market risk with respect to the value of the contracts and continue to be required to maintain the margin deposits on the futures contracts. Amounts reflected as deposits with brokers in the Consolidated Statement of Assets and Liabilities include restricted balances held with the broker as collateral. The Fund segregates liquid securities having a value at least equal to the amount of the current obligation under any open futures contract. Risks may exceed amounts recognized in the Consolidated Statement of Assets and Liabilities. With futures, there is minimal counterparty credit risk to the Fund since futures are exchange traded and the exchange’s clearinghouse, as counterparty to all exchange traded futures, guarantees the futures against default.
Disclosures About Offsetting Assets and Liabilities – The following table presents the Fund’s asset and liability derivatives available for offset under a master netting arrangement, net of collateral pledged, as of August 31, 2020:
Assets:
| | | | | | | | | Net Amounts of Assets | |
| | | | | | Gross Amounts Offset in the | | | Presented in the | |
| | | Gross Amounts of | | | Consolidated Statement of | | | Consolidated Statement of | |
| Description | | Recognized Assets | | | Assets & Liabilities | | | Assets & Liabilities (1) | |
| Futures Contracts | | $ | 900,585 | | | $ | (96,945 | ) | | $ | 803,640 | |
| (1) | The amount presented is limited to the net unrealized appreciation on futures contracts balance, and accordingly, does not include excess collateral pledged. Cash collateral is included in deposits with broker amount of $631,350 on the Consolidated Statement of Assets and Liabilities. |
| PCS Commodity Strategy Fund |
| NOTES TO CONSOLIDATED FINANCIAL STATEMENTS |
| August 31, 2020 (Continued) |
Derivatives Disclosure – Fair Values of Derivative Instruments in the Fund as of August 31, 2020:
| | | Asset & Liability Derivatives |
| | | Consolidated Statement of | | | |
| Contract Type/ | | Assets and Liabilities | | | |
| Primary Risk Exposure | | Location | | Fair Value | |
| | | | | | | |
| Currency contracts: | | | | | | |
| Futures | | | | | | |
| | | Assets - Unrealized Appreciation | | $ | 32,313 | * |
| Commodity contracts: | | | | | | |
| Futures | | | | | | |
| | | Assets - Unrealized Appreciation | | $ | 868,272 | |
| | | Liabilities - Unrealized Depreciation | | | (96,945 | ) |
| | | Futures Unrealized Appreciation, Net | | $ | 771,327 | * |
| * | Represents cumulative appreciation/(depreciation) on open futures contracts as reported in the Consolidated Portfolio of Investments. |
The effect of Derivative Instruments on the Consolidated Statement of Operations for the year ended August 31, 2020:
| | | | | | | | Change in Unrealized | |
| | | | | Realized | | | Appreciation/ | |
| Contract Type/ | | Location of Gain or (Loss) On | | Loss on | | | (Depreciation) | |
| Primary Risk Exposure | | Derivatives | | Derivatives | | | on Derivatives | |
| Commodity Future contracts | | Net realized loss from futures contracts | | $ | (5,140,327 | ) | | $ | — | |
| | | Net change in unrealized appreciation (depreciation) from futures contracts | | | — | | | | 1,343,626 | |
| Currency Future contracts | | Net realized loss from futures contracts | | | (76,081 | ) | | | — | |
| | | Net change in unrealized appreciation (depreciation) from futures contracts | | | — | | | | 98,119 | |
| Total | | | | $ | (5,216,408 | ) | | $ | 1,441,745 | |
The notional value of the derivative instruments outstanding as of August 31, 2020 as disclosed in the Consolidated Portfolio of Investments and the amounts realized and changes in unrealized gains and losses on derivative instruments during the period as disclosed above and within the Consolidated Statement of Operations serve as indicators of the volume of derivative activity for the Fund.
Foreign Currency – The accounting records of the Fund are maintained in U.S. dollars. Investment securities and other assets and liabilities denominated in a foreign currency, and income receipts and expense payments are translated into U.S. dollars using the prevailing exchange rate at the London market close. Purchases and sales of securities are translated into U.S. dollars at the contractual currency rates established at the approximate time of the trade. Net realized gains and losses on foreign currency transactions represent net gains and losses from currency realized between the trade and settlement dates on securities transactions and the difference between
| PCS Commodity Strategy Fund |
| NOTES TO CONSOLIDATED FINANCIAL STATEMENTS |
| August 31, 2020 (Continued) |
income accrued versus income received. The effects of changes in foreign currency exchange rates on investments in securities are included with the net realized and unrealized gain or loss on investment securities.
Security transactions and related income – Security transactions are accounted for on trade date. Interest income is recognized on an accrual basis. Discounts are accreted and premiums are amortized on securities purchased over the lives of the respective securities. Dividend income is recorded on the ex-dividend date. Realized gains or losses from sales of securities are determined by comparing the identified cost of the security lot sold with the net sales proceeds. Withholding taxes on foreign dividends have been provided for in accordance with the Fund’s understanding of the applicable country’s tax rules and rates.
Consolidation of Subsidiary – PCS Fund Limited (PCSFL) – In order to achieve its investment objectives, the Fund invests up to 25% of its total assets (measured at the time of purchase) in a wholly-owned subsidiary, PCSFL, incorporated under the laws of the Cayman Islands. PCSFL acts as an investment vehicle in order to enter into certain investments for the Fund consistent with its investment objectives and policies specified in the Fund’s Prospectus and Statement of Additional Information. The consolidated financial statements of the Fund include the investment activity and financial statements of PCSFL. All intercompany balances and transactions have been eliminated in consolidation.
For tax purposes, PCSFL is an exempted Cayman investment company. PCSFL has received an undertaking from the government of the Cayman Islands exempting it from all local income, profits and capital gains taxes. No such taxes are levied in the Cayman Islands at the present time. For U.S. income tax purposes, PCSFL is a Controlled Foreign Corporation which generates and is allocated no income which is considered effectively connected with U.S. trade or business and as such is not subject to U.S. income tax. However, as a wholly-owned Controlled Foreign Corporation, PCSFL’s net income and capital gain, to the extent of its earnings and profits, will be included each year in the Fund’s investment company taxable income.
PCSFL will utilize commodity futures, options on futures, swap contracts and structured notes to facilitate the Fund’s pursuit of its investment objective. In accordance with its investment objective and through its exposure to the aforementioned commodity based products, PCSFL may have increased or decreased exposure to one or more of the risk factors defined in the Principal Investment Risks section of the Fund’s prospectus.
A summary of the Fund’s investment in the PCSFL is as follows:
| | | | % Of Fund Total Net Assets |
| | | CFC Total Net Assets at | at |
| | Inception Date of CFC | August 31, 2020 | August 31, 2020 |
| PCS Fund Limited | 12/10/2014 | $ 1,486,683 | 12.78% |
Dividends and distributions to shareholders – Dividends from net investment income, if any, are declared and paid at least annually. Distributable net realized capital gains, if any, are declared and distributed annually.
Dividends from net investment income and distributions from net realized gains are determined in accordance with federal income tax regulations, which may differ from GAAP. These “book/tax” differences are considered either temporary (e.g., deferred losses, capital loss carryforwards) or permanent in nature. To the extent these differences are permanent in nature, such amounts are reclassified within the composition of net assets based on their federal tax-basis treatment; temporary differences do not require reclassification. Any such reclassifications will have no effect on net assets, results of operations, or net asset values per share of the Fund.
Federal Income Taxes – The Fund intends to qualify as a “regulated investment company” under Subchapter M of the Internal Revenue Code of 1986, as amended, and, if so qualified, will not be liable for federal income taxes
| PCS Commodity Strategy Fund |
| NOTES TO CONSOLIDATED FINANCIAL STATEMENTS |
| August 31, 2020 (Continued) |
to the extent all earnings are distributed to shareholders on a timely basis. Therefore, no federal income tax provision has been recorded.
The Fund recognizes the tax benefits of uncertain tax positions only where the position is “more likely than not” to be sustained assuming examination by tax authorities. Management has analyzed the Fund’s tax positions, and has concluded that no liability for unrecognized tax benefits should be recorded related to uncertain tax positions taken on returns filed for the open tax years 2017-2019, or expected to be taken in the Fund’s 2020 tax returns. The Fund identifies its major tax jurisdictions as U.S. Federal, Ohio and foreign jurisdictions where the Fund makes significant investments; however, the Fund is not aware of any tax positions for which it is reasonably possible that the total amounts of unrecognized tax benefits will change materially in the next twelve months.
Expenses – Expenses of the Trust that are directly identifiable to a specific Fund are charged to that Fund. Expenses, which are not readily identifiable to a specific Fund, are allocated in such a manner as deemed equitable, taking into consideration the nature and type of expense and the relative sizes of the funds in the Trust.
Indemnification – The Trust indemnifies its officers and trustees for certain liabilities that may arise from the performance of their duties to the Trust. Additionally, in the normal course of business, the Fund enters into contracts that contain a variety of representations and warranties and which provide general indemnities. The Fund’s maximum exposure under these arrangements is unknown, as this would involve future claims that may be made against the Fund that have not yet occurred. However, based on experience, the risk of loss due to these warranties and indemnities appears to be remote.
| 3. | INVESTMENT TRANSACTIONS |
For the year ended August 31, 2020, cost of purchases and proceeds from sales of portfolio securities, other than short-term investments and U.S. Government securities, amounted to $0 and $0, respectively.
| 4. | INVESTMENT ADVISORY AGREEMENT AND TRANSACTIONS WITH RELATED PARTIES |
Price Asset Management, LLC, (the “Advisor”) serves as the Fund’s investment advisor. Pursuant to an Advisory Agreement with the Trust, on behalf of the Fund, the Advisor, under the supervision of the Board, oversees the daily operations of the Fund and supervises the performance of administrative and professional services provided by others. As compensation for its services and the related expenses borne by the Advisor, the Fund pays the Advisor a management fee, computed and accrued daily and paid monthly, at an annual rate of 0.79% of the Fund’s average daily net assets. For the year ended August 31, 2020, the Fund incurred $189,170 in investment advisory fees.
Pursuant to a written contract (the “Waiver Agreement”), the Advisor has agreed, at least until December 31, 2021 to waive a portion of its advisory fee and has agreed to reimburse the Fund for other expenses to the extent necessary so that total expenses incurred (excluding any front-end or contingent deferred loads, brokerage fees and commissions, acquired fund fees and expenses, borrowing costs (such as interest and dividend expense on securities sold short), taxes and extraordinary expenses such as litigation) do not exceed 1.35%, 2.10% and 1.10% for Class A, Class C and Class I shares, respectively, with respect to the average daily net assets for each share class. These amounts will herein be referred to as the “expense limitations.”
If the Advisor waives any fee or reimburses any expenses pursuant to the Waiver Agreement, and the Fund’s operating expenses are subsequently lower than their respective expense limitation, the Advisor shall be entitled to reimbursement by the Fund provided that such reimbursement does not cause the Fund’s operating expense to exceed the respective expense limitation. If any Fund’s operating expenses subsequently exceed the respective expense limitation, the reimbursements for the Fund shall be suspended. For the year ended August 31, 2020, the Advisor waived fees and reimbursed expenses in the amount of $299,771. Pursuant to the Waiver Agreement,
| PCS Commodity Strategy Fund |
| NOTES TO CONSOLIDATED FINANCIAL STATEMENTS |
| August 31, 2020 (Continued) |
cumulative expenses subject to recapture were $751,075, as of August 31, 2020 and the amounts will expire as follows on August 31, 2021 - $230,741, August 31, 2022 - $220,563 and August 31, 2023 - $299,771
Distributor – The Board has adopted the Trust’s Master Distribution and Shareholder Service Plan (the “Plan”) pursuant to Rule 12b-1 under the 1940 Act. The Plan provides that a monthly service and/or distribution fee is calculated at an annual rate of 0.25% and 1.00% of the average daily net assets for Class A shares and Class C shares, respectively, and is paid to Northern Lights Distributors, LLC (the “Distributor”) to provide compensation for ongoing shareholder servicing and distribution-related activities or services and/or maintenance of the Fund’s shareholder accounts not otherwise required to be provided by the Advisor. For the year ended August 31, 2020, pursuant to the Plan, Class A shares and Class C shares paid $16,411 and $14,853 respectively.
The Distributor acts as the Fund’s principal underwriter in a continuous public offering of the Fund’s shares. For the year ended August 31, 2020, the Distributor received $1,086 in underwriting commissions for sales of Class A shares and Class C shares, of which $26 was retained by the principal underwriter or other affiliated broker-dealers.
In addition, certain affiliates of the distributor provide services to the Fund as follows:
Gemini Fund Services, LLC (“GFS”) – GFS, an affiliate of the Distributor, provides administration, fund accounting, and transfer agent services to the Trust. Pursuant to separate servicing agreements with GFS, the Fund pays GFS customary fees for providing administration, fund accounting and transfer agency services to the Fund. Certain officers of the trust are also officers of GFS, and are not paid any fees directly by the Fund for servicing in such capacities.
Northern Lights Compliance Services, LLC (“NLCS”) – NLCS, an affiliate of GFS and the Distributor, provides a Chief Compliance Officer to the Trust, as well as related compliance services, pursuant to a consulting agreement between NLCS and the Trust. Under the terms of such agreement, NLCS receives customary fees from the Fund.
Blu Giant, LLC (“Blu Giant”) – Blu Giant, an affiliate of GFS and the Distributor, provides EDGAR conversion and filing services as well as print management services for the Fund on an ad-hoc basis. For the provision of these services, Blu Giant receives customary fees from the Fund.
On February 1, 2019, NorthStar Financial Services Group, LLC, the parent company of GFS and its affiliated companies including NLD, NLCS and Blu Giant (collectively, the “Gemini Companies”), sold its interest in the Gemini Companies to a third party private equity firm that contemporaneously acquired Ultimus Fund Solutions, LLC (an independent mutual fund administration firm) and its affiliates (collectively, the “Ultimus Companies”). As a result of these separate transactions, the Gemini Companies and the Ultimus Companies are now indirectly owned through a common parent entity, The Ultimus Group, LLC.
5. CONTROL OWNERSHIP
The beneficial ownership, either directly or indirectly, of more than 25% of the voting securities of the Fund creates presumption of control of the Fund, under Section 2(2) 9 of the Act. As of August 31, 2020, beneficial ownership in excess of 25% is as follows:
| Beneficial Owner | | % of Outstanding Shares |
| Charles Schwab & Co., Inc. | | 42% |
The Trust has no knowledge as to whether all or any portion of the shares owned of record are also owned beneficially.
| PCS Commodity Strategy Fund |
| NOTES TO CONSOLIDATED FINANCIAL STATEMENTS |
| August 31, 2020 (Continued) |
| 6. | UNDERLYING INVESTMENT IN OTHER INVESTMENT COMPANIES |
The Fund currently seeks to achieve its investment objectives by investing a portion of its assets in Fidelity Treasury Portfolio – Institutional Class, a registered open-end investment company (“Fidelity”). The Fund may redeem its investment from Fidelity at any time if the Advisor determines that it is in the best interest of the Fund and its shareholders to do so.
The performance of the Fund will be directly affected by the performance of Fidelity. The annual reports of Fidelity, along with the report of the independent registered public accounting firm is included in Fidelity’s N-CSR available at “www.sec.gov”. As of August 31, 2020, the percentage of the Fund’s net assets invested in Fidelity was 52.8%.
The Fund may assess a short-term redemption fee of 1.00% of the total redemption amount if shareholders sell their shares after holding them for less than 30 days or if shares are redeemed for failure to maintain the Fund’s minimum account balance requirement. The redemption fee is paid directly to the Fund. For the year ended August 31, 2020, the Fund assessed $415, and $556 in redemption fees for Class A and Class I shares, respectively.
| 8. | AGGREGATE UNREALIZED APPRECIATION AND DEPRECIATION – TAX BASIS |
The identified cost of investments in securities owned by the Fund for federal income tax purposes, and respective gross unrealized appreciation and depreciation at August 31, 2020 were as follows:
| Cost for Federal Tax purposes | | $ | 10,140,085 | |
| | | | | |
| Unrealized Appreciation | | | 196,900 | |
| Unrealized Depreciation | | | (249 | ) |
| Tax Net Unrealized Appreciation | | $ | 196,651 | |
| 9. | DISTRIBUTIONS TO SHAREHOLDERS AND TAX COMPONENTS OF CAPITAL |
The tax character of fund distributions paid for the years ended August 31, 2020 and August 31, 2019 was as follows:
| | | Fiscal Year Ended | | | Fiscal Year Ended | |
| | | August 31, 2020 | | | August 31, 2019 | |
| Ordinary Income | | $ | 280,516 | | | $ | 2,763,389 | |
| Return of Capital | | | 23,056 | | | | — | |
| | | $ | 303,572 | | | $ | 2,763,389 | |
As of August 31, 2020, the components of accumulated earnings/(deficit) on a tax basis were as follows:
| Post October Loss | | | Capital Loss | | | Other | | | Unrealized | | | Total | |
| and | | | Carry | | | Book/Tax | | | Appreciation/ | | | Accumulated | |
| Late Year Loss | | | Forwards | | | Differences | | | (Depreciation) | | | Earnings/(Deficits) | |
| $ | (48,511 | ) | | $ | (7,710 | ) | | $ | (11,789,102 | ) | | $ | 213,705 | | | $ | (11,631,618 | ) |
| PCS Commodity Strategy Fund |
| NOTES TO CONSOLIDATED FINANCIAL STATEMENTS |
| August 31, 2020 (Continued) |
The difference between book basis and tax basis unrealized appreciation, accumulated net investment losses and accumulated net realized losses from security transactions are primarily attributable to adjustments for the Fund’s wholly owned subsidiary. The unrealized appreciation (depreciation) in the table above includes unrealized foreign currency gains of $17,054, and tax unrealized appreciation on the subsidiary of $196,351.
Late year losses incurred after December 31 within the fiscal year are deemed to arise on the first business day of the following fiscal year for tax purposes. The Fund incurred and elected to defer such late year losses of $48,511.
At August 31, 2020, the Fund had capital loss carry forwards for federal income tax purposes available to offset future capital gains, along with capital loss carryforwards utilized as follows:
| Non-Expiring | | | Non-Expiring | | | | | | CLCF | |
| Short-Term | | | Long-Term | | | Total | | | Utilized | |
| $ | 7,710 | | | $ | — | | | $ | 7,710 | | | $ | 957 | |
Permanent book and tax differences, primarily attributable to the reclassification of Fund distributions, resulted in reclassifications for the Fund for the year ended August 31, 2020 as follows:
| | | | Accumulated | |
| Paid In Capital | | | Earnings (Losses) | |
| $ | (23,056 | ) | | $ | 23,056 | |
Subsequent events after the date of the Consolidated Statement of Assets and Liabilities have been evaluated through the date the financial statements were issued. Management has determined that no events or transactions occurred requiring adjustment or disclosure in the consolidated financial statements.
| PCS Commodity Strategy Fund |
| LIQUIDITY RISK MANAGEMENT PROGRAM (Unaudited) |
| August 31, 2020 |
The Fund has adopted and implemented a written liquidity risk management program as required by Rule 22e-4 (the “Liquidity Rule”) under the Investment Company Act. The program is reasonably designed to assess and manage the Fund’s liquidity risk, taking into consideration, among other factors, the Fund’s investment strategy and the liquidity of its portfolio investments during normal and reasonably foreseeable stressed conditions; its short and long-term cash flow projections; and its cash holdings and access to other funding sources.
During the fiscal year ended August 31, 2020 the Trust’s Liquidity Risk Management Program Committee (the “Committee”) reviewed the Fund’s investments and determined that the Fund held adequate levels of cash and highly liquid investments to meet shareholder redemption activities in accordance with applicable requirements. Accordingly, the Committee concluded that (i) the Fund’s liquidity risk management program is reasonably designed to prevent violations of the Liquidity Rule and (ii) the Fund’s liquidity risk management program has been effectively implemented.
Report of Independent Registered Public Accounting Firm
To the Board of Trustees of Northern Lights Fund Trust II
and the Shareholders of PCS Commodity Strategy Fund
Opinion on the Financial Statements
We have audited the accompanying consolidated statement of assets and liabilities of PCS Commodity Strategy Fund (the Fund), a Series of Northern Lights Fund Trust II, including the consolidated portfolio of investments, as of August 31, 2020, the related consolidated statements of operations for the year then ended, the consolidated statements of changes in net assets for each of the two years in the period then ended, and the related notes to the consolidated financial statements, and the financial highlights for each of the five years in the period then ended (collectively, the financial statements). In our opinion, the financial statements present fairly, in all material respects, the financial position of the Fund as of August 31, 2020, the results of its operations for the year then ended, the changes in net assets for each of the two years in the period then ended, and the financial highlights for each of the five years in the period then ended, in conformity with accounting principles generally accepted in the United States of America.
Basis for Opinion
These financial statements are the responsibility of the Fund’s management. Our responsibility is to express an opinion on the Fund’s financial statements based on our audits. We are a public accounting firm registered with the Public Company Accounting Oversight Board (United States) (PCAOB) and are required to be independent with respect to the Fund in accordance with U.S. federal securities laws and the applicable rules and regulations of the Securities and Exchange Commission and the PCAOB.
We conducted our audits in accordance with the standards of the PCAOB. Those standards require that we plan and perform the audit to obtain reasonable assurance about whether the financial statements are free of material misstatement, whether due to error or fraud. The Fund is not required to have, nor were we engaged to perform, an audit of its internal control over financial reporting. As part of our audits, we are required to obtain an understanding of internal control over financial reporting but not for the purpose of expressing an opinion on the effectiveness of the Fund’s internal control over financial reporting. Accordingly, we express no such opinion.
Our audits included performing procedures to assess the risks of material misstatement of the financial statements, whether due to error or fraud, and performing procedures that respond to those risks. Such procedures included examining, on a test basis, evidence regarding the amounts and disclosures in the financial statements. Our procedures included confirmation of investments owned as of August 31, 2020, by correspondence with the custodian and brokers. Our audits also included evaluating the accounting principles used and significant estimates made by management, as well as evaluating the overall presentation of the financial statements. We believe that our audits provide a reasonable basis for our opinion.
/s/ RSM US LLP
We have served as the auditor of one or more Price Asset Management, LLC advised investment companies since 2015.
Denver, Colorado
October 30, 2020
| PCS Commodity Strategy Fund |
| EXPENSE EXAMPLES (Unaudited) |
| August 31, 2020 |
As a shareholder of the Fund you incur ongoing costs, including management fees; distribution and/or service (12b-1) fees and other Fund expenses. This example is intended to help you understand your ongoing costs (in dollars) of investing in the Fund and to compare these costs with the ongoing costs of investing in other mutual funds.
The example is based on an investment of $1,000 invested at the beginning of the period and held for the entire period as disclosed in the table below.
Actual Expenses
The “Actual Expenses” line in the table below provides information about actual account values and actual expenses. You may use the information below, together with the amount you invested, to estimate the expenses that you paid over the period. Simply divide your account value by $1,000 (for example, an $8,600 account value divided by $1,000 = 8.6), then multiply the result by the number in the table under the heading entitled “Expenses Paid During Period” to estimate the expenses you paid on your account during this period.
Hypothetical Example for Comparison Purposes
The “Hypothetical” line in the table below provides information about hypothetical account values and hypothetical expenses based on the Fund’s actual expense ratio and an assumed rate of return of 5% per year before expenses, which is not the Fund’s actual return. The hypothetical account values and expenses may not be used to estimate the actual ending account balances or expenses you paid for the period. You may use this information to compare this 5% hypothetical example with the 5% hypothetical examples that appear in the shareholder reports of other funds.
Please note that the expenses shown in the table are meant to highlight your ongoing costs only and do not reflect any transactional costs, such as contingent deferred sales charges (loads), or redemption fees. Therefore, the table is useful in comparing ongoing costs only, and will not help you determine the relative total costs of owning different funds. In addition, if these transactional costs were included, your costs would have been higher.
| | | | | | | | | | | | | | | |
| | | | | Beginning | | | Ending | | | Annualized | | | Expense Paid | |
| | | | | Account Value | | | Account Value | | | Expense | | | During Period | |
| | | | | 3/1/20 | | | 8/31/20 | | | Ratio | | | 3/1/20-8/31/20 * | |
| | Actual | | | | | | | | | | | | | |
| | Class A | | | $1,000.00 | | | $ 966.90 | | | 1.35% | | | $ 6.67 | |
| | Class C | | | $1,000.00 | | | $ 963.00 | | | 2.10% | | | $ 10.36 | |
| | Class I | | | $1,000.00 | | | $ 967.00 | | | 1.10% | | | $ 5.44 | |
| | | | | | | | | | | | | | | |
| | | | | Beginning | | | Ending | | | Annualized | | | Expense Paid | |
| | Hypothetical | | | Account Value | | | Account Value | | | Expense | | | During Period | |
| | (5% return before expenses) | | | 3/1/20 | | | 8/31/20 | | | Ratio | | | 3/1/20-8/31/20 * | |
| | Class A | | | $1,000.00 | | | $1,018.35 | | | 1.35% | | | $ 6.85 | |
| | Class C | | | $1,000.00 | | | $1,014.58 | | | 2.10% | | | $ 10.63 | |
| | Class I | | | $1,000.00 | | | $1,019.61 | | | 1.10% | | | $ 5.58 | |
| * | Expenses are equal to the average account value over the period, multiplied by the Fund’s annualized expense ratio, multiplied by the number of days in the six month period ended August 31, 2020 (184) divided by the number of days in the fiscal year (366). |
| PCS Commodity Strategy Fund |
| SUPPLEMENTAL INFORMATION (Unaudited) |
| August 31, 2020 |
FACTORS CONSIDERED BY THE TRUSTEES IN APPROVAL OF THE RENEWAL OF THE INVESTMENT ADVISORY AGREEMENT
At a Regular meeting (the “Meeting”) of the Board of Trustees (the “Board”) of Northern Lights Fund Trust II (the “Trust”) held on January 22-23, 2020 the Board, including the disinterested Trustees (the “Independent Trustees”), considered the renewal of an Investment Advisory Agreement between the Trust, on behalf of the PCS Commodity Strategy Fund (“PCS Commodity Strategy”) and Price Asset Management, LLC (“PAM”) (the “PCS Advisory Agreement”).
Based on their evaluation of the information provided by PAM, in conjunction with PCS Commodity Strategy’s other service providers, the Board, by a unanimous vote (including a separate vote of the Independent Trustees), approved the renewal of the PCS Advisory Agreement with respect to PCS Commodity Strategy.
In advance of the Meeting, the Board requested and received materials to assist them in considering the PCS Advisory Agreement. The materials provided contained information with respect to the factors enumerated below, including the PCS Advisory Agreement, a memorandum prepared by the Trust’s outside legal counsel discussing in detail the Trustees’ fiduciary obligations and the factors they should assess in considering the continuation of the PCS Advisory Agreement and comparative information relating to the advisory fee and other expenses of PCS Commodity Strategy. The materials also included due diligence materials relating to PAM (including due diligence questionnaires completed by PAM, select financial information of PAM, bibliographic information regarding PAM’s key management and investment advisory personnel, and comparative fee information relating to PCS Commodity Strategy) and other pertinent information. At the Meeting, the Independent Trustees were advised by counsel that is experienced in Investment Company Act of 1940 matters and that is independent of fund management and met with such counsel separately from fund management.
The Board reviewed and discussed the written materials that were provided in advance of the Meeting and deliberated on the renewal of the PCS Advisory Agreement. The Board relied upon the advice of independent legal counsel and their own business judgment in determining the material factors to be considered in evaluating the PCS Advisory Agreement and the weight to be given to each such factor. The conclusions reached by the Board were based on a comprehensive evaluation of all of the information provided and were not the result of any one factor. Moreover, each Trustee may have afforded different weight to the various factors in reaching his conclusions with respect to the PCS Advisory Agreement. In considering the renewal of the PCS Advisory Agreement, the Board reviewed and analyzed various factors that they determined were relevant, including the factors enumerated below.
Nature, Extent and Quality of Services. The Board reviewed materials provided by PAM related to the proposed renewal of the PCS Advisory Agreement, including its ADV, a description of the manner in which investment decisions are made and executed, a review of the professional personnel performing services for PCS Commodity Strategy, including the team of individuals that primarily monitors and executes the investment process. The Board discussed the extent of the research capabilities, the quality of PAM’s compliance infrastructure and the experience of its fund management personnel. The Board also noted PAM’s experience with tracking the Rogers Index and knowledge of commodities. Additionally, the Board received satisfactory responses from the representatives of PAM with respect to a series of important questions, including whether PAM was involved in any lawsuits or pending regulatory actions; whether the management of other accounts would conflict with its management of PCS Commodity Strategy; and whether there are procedures in place to adequately allocate trades among its respective clients. The Board reviewed the description provided on the practices for monitoring compliance with PCS Commodity Strategy’s investment limitations, discussed procedures with PCS Commodity Strategy’s CCO and noted
| PCS Commodity Strategy Fund |
| SUPPLEMENTAL INFORMATION (Unaudited)(Continued) |
| August 31, 2020 |
that the CCO of PAM would continually review the portfolio managers’ performance of their duties to ensure compliance under PAM’s compliance program. The Board reviewed the information provided on the practices for monitoring compliance with PCS Commodity Strategy’s investment limitations and discussed PAM’s compliance program with the CCO of the Trust. The Board noted that the CCO of the Trust continued to represent that PAM’s policies and procedures were reasonably designed to prevent violations of applicable federal securities laws. The Board also noted PAM’s representation that the prospectus and statement of additional information for PCS Commodity Strategy accurately describe the investment strategies of PCS Commodity Strategy. The Board then reviewed the capitalization of PAM based on financial information provided, and representations made, by PAM and its representatives, and concluded that PAM was sufficiently well-capitalized, or its principals had the ability to make additional contributions in order to meet its obligations to PCS Commodity Strategy. The Board also noted PAM’s vested interest in the marketing and distribution of PCS Commodity Strategy. The Board concluded that PAM had sufficient quality and depth of personnel, resources, investment methods and compliance policies and procedures essential to performing its duties under the PCS Advisory Agreement and that the nature, overall quality and extent of the management services provided by PAM to PCS Commodity Strategy were satisfactory.
Performance. The Board discussed the reports prepared by Broadridge and reviewed the performance of PCS Commodity Strategy as compared to its peer group, Morningstar category and benchmark for the one year, three year, five year and since inception periods as of December 31, 2019, noting that PCS Commodity Strategy had outperformed its peer group median, Morningstar category median and benchmark for the one year period, underperformed the peer group median but outperformed the Morningstar category median and benchmark for the three year period and underperformed its peer group median and Morningstar category median but outperformed its benchmark for the five year and since inception periods. The Board discussed and noted the improved performance of PCS Commodity Strategy since the last renewal of the PCS Advisory Agreement. The Trustees also reviewed the performance of a private fund managed by PAM using the same strategy as PCS Commodity Strategy. After further discussion, the Board concluded that the performance of PCS Commodity Strategy was acceptable.
Fees and Expenses. As to the costs of the services to be provided by PAM, the Board reviewed and discussed PCS Commodity Strategy’s advisory fee and total operating expenses as compared to its peer group and Morningstar category as presented in the Broadridge Report. The Board noted the advisory fee which, although on the high end of its peer group, was on the higher side, but in line, with the Morningstar category average. The Board also reviewed the contractual expense limitation arrangement for PCS Commodity Strategy, which stated that PAM had agreed to waive or limit its advisory fee and/or reimburse expenses at least until December 31, 2020, in order to limit net annual operating expenses, exclusive of certain fees, so as not to exceed 1.35%, 2.10%, 1.10%, 1.35% and 1.60% of the average net assets for Class A, Class C, Class I, Class N and Class R shares, respectively, and found such arrangements to be beneficial to shareholders. It was the consensus of the Board that, based on PAM’s experience and expertise, and the services provided by PAM to PCS Commodity Strategy, the advisory fee charged by PAM was not unreasonable.
Profitability. The Board also considered the level of profits that could be expected to accrue to PAM with respect to PCS Commodity Strategy based on break even and profitability reports and analyses reviewed by the Board and the selected financial information of PAM provided by PAM. After review and discussion, the Board concluded that based on the services provided by PAM and the current assets of PCS Commodity
Strategy, profits from PAM’s relationship with PCS Commodity Strategy were not excessive.
Economies of Scale. As to the extent to which PCS Commodity Strategy will realize economies of scale as it grows, and whether the fee levels reflect these economies of scale for the benefit of investors, the Board discussed PAM’s expectations for growth of PCS Commodity Strategy and concluded that any material
| PCS Commodity Strategy Fund |
| SUPPLEMENTAL INFORMATION (Unaudited)(Continued) |
| August 31, 2020 |
economies of scale would not be achieved in the near term.
Conclusion. The Board relied upon the advice of counsel, and their own business judgment in determining the material factors to be considered in evaluating the PCS Advisory Agreement and the weight to be given to each such factor. Accordingly, having requested and received such information from PAM as the Trustees believed to be reasonably necessary to evaluate the terms of the PCS Advisory Agreement, and as assisted by the advice of independent counsel, the Board, including a majority of the Independent Trustees voting separately, determined that with respect to the PCS Advisory Agreement, (a) the terms of the PCS Advisory Agreement are reasonable; (b) the advisory fee is not unreasonable; and (c) the PCS Advisory Agreement is in the best interests of the Fund and its shareholders. In considering the renewal of the PCS Advisory Agreement, the Board did not identify any one factor as all important, but rather considered these factors collectively and determined that approval of the renewal of the PCS Advisory Agreement was in the best interest of PCS Commodity Strategy and its shareholders. Moreover, the Board noted that each Trustee may have afforded different weight to the various factors in reaching his conclusions with respect to the PCS Advisory Agreement.
| PCS Commodity Strategy Fund |
| SUPPLEMENTAL INFORMATION (Unaudited)(Continued) |
| August 31, 2020 |
The Trustees and the officers of the Trust are listed below with their present positions with the Trust and principal occupations over at least the last five years. The business address of each Trustee and Officer is 225 Pictoria Drive, Suite 450, Cincinnati, OH 45246. All correspondence to the Trustees and Officers should be directed to c/o Gemini Fund Services, LLC, P.O. Box 541150, Omaha, Nebraska 68154.
Independent Trustees
Name and Year
of Birth | Position/Term of
Office* | Principal Occupation
During the Past Five Years | Number of
Portfolios in
Fund
Complex
Overseen by
Trustee*** | Other Directorships held by Trustee
During the Past Five Years |
Thomas T. Sarkany
1946 | Trustee Since October 2011 | President, TTS Consultants, LLC (financial services) (since 2010). | 1 | Director, Aquila Distributors; Trustee, Arrow ETF Trust; Trustee, Arrow Investments Trust; Trustee, Northern Lights Fund Trust IV |
Anthony H. Lewis
1946 | Trustee Since May 2011 | Chairman and CEO of The Lewis Group USA (executive consulting firm) (since 2007). | 1 | Director, Member of the Compensation Committee and Member of the Risk Committee of Torotel Inc. (Magnetics, Aerospace and Defense), Trustee, Chairman of the Fair Valuation Committee and Member of the Audit Committee of the Wildermuth Endowment Strategy Fund |
Keith Rhoades
1948 | Trustee Since May 2011 | Retired since 2008. | 1 | NONE |
Randal D. Skalla
1962 | Trustee Since May 2011 | President, L5 Enterprises, Inc. (financial services company) (since 2001). | 1 | Board Member, Orizon Investment Counsel (financial services company) (from 2001 to 2017) |
8/31/20 – NLII v1
| PCS Commodity Strategy Fund |
| SUPPLEMENTAL INFORMATION (Unaudited)(Continued) |
| August 31, 2020 |
Interested Trustees and Officers
Name and
Year of Birth | Position/Term of
Office* | Principal Occupation
During the Past Five Years | Number of
Portfolios in
Fund
Complex
Overseen by
Trustee*** | Other Directorships held by Trustee
During the Past Five Years |
Brian Nielsen**
1972 | Trustee Since May 2011 | Trustee of Northern Lights Fund Trust II (since 2011); Special Projects Counsel of NorthStar Financial Services Group, LLC (from 2018 to 2019); Secretary of CLS Investments, LLC (from 2001 to 2018); Secretary of Orion Advisor Services, LLC (from 2001 to 2018); Manager (from 2012 to 2015), General Counsel and Secretary (from 2003 to 2018) of NorthStar Financial Services Group, LLC; CEO (from 2012 to 2018), Secretary (from 2003 to 2018) and Manager (from 2005 to 2018) of Northern Lights Distributors, LLC; Director, Secretary and General Counsel of Constellation Trust Company (from 2004 to 2018); CEO (from 2015 to 2018), Manager (from 2008 to 2015), General Counsel and Secretary (from 2011 to 2018) of Northern Lights Compliance Services, LLC; General Counsel and Secretary of Blu Giant, LLC (from 2011 to 2018); Secretary of Gemini Fund Services, LLC (from 2012 to 2018); Manager of Arbor Point Advisors, LLC (from 2012 to 2018); Secretary and General Counsel of NorthStar Holdings, LLC (from 2013 to 2015); Director,Secretary and General Counsel of NorthStar CTC Holdings, Inc. (from 2015 to 2018) and Secretary and Chief Legal Officer of AdvisorOne Funds (from 2003 to 2018). | 1 | Manager of Northern Lights Distributors, LLC (from 2005 to 2018); Manager of NorthStar Financial Services Group, LLC (from 2012 to 2015); Manager of Arbor Point Advisors, LLC (from 2012 to 2018); Director of Constellation Trust Company (from 2004 to 2018) |
Kevin E. Wolf
1969 | President Since January 2013 | Vice President of The Ultimus Group, LLC and Executive Vice President, Head of Fund Administration and Product, Gemini Fund Services, LLC (since 2019), President, Gemini Fund Services, LLC (2012 -2019). | N/A | N/A |
Richard Malinowski
1983 | Secretary Since January 2018 | Senior Vice President and Senior Managing Counsel, Gemini Fund Services, LLC, (since February 2020); Senior Vice President Legal Administration, Gemini Fund Services, LLC (since April 2017); Vice President and Counsel (April 2016 to 2017) and AVP and Staff Attorney (September 2012 to March 2016). | N/A | N/A |
Erik Naviloff
1968 | Treasurer Since January 2013 | Vice President of Gemini Fund Services, LLC (since 2011). | N/A | N/A |
Emile R. Molineaux
1962 | Chief Compliance Officer and Anti Money Laundering Officer Since May 2011 | Senior Compliance Officer and CCO of Various clients of Northern Lights Compliance Services, LLC (since 2011). | N/A | N/A |
| * | The term of office for each Trustee and Officer listed above will continue indefinitely. |
| ** | Brian Nielsen is an “interested person” of the Trust as that term is defined under the 1940 Act, because of his prior affiliation with Northern Lights Distributors, LLC (the Fund’s Distributor). |
| *** | As of August 31, 2020, the Trust was comprised of 19 active portfolios managed by unaffiliated investment advisers. The term “Fund Complex” applies only to the Fund, and not to any other series of the Trust. The Fund does not hold itself out as related to any other series within the Trust for investment purposes, nor does it share the same investment adviser with any other series. |
The Fund’s Statement of Additional Information (“SAI”) includes additional information about the Trustees and is available free of charge, upon request, by calling toll-free at 1-844-828-3242.
8/31/20 – NLII v1
Privacy Policy
Rev. May 2019
| FACTS | WHAT DOES NORTHERN LIGHTS FUND TRUST II (“NLFT II”) DO WITH YOUR PERSONAL INFORMATION? |
| Why? | Financial companies choose how they share your personal information. Federal law gives consumers the right to limit some but not all sharing. Federal law also requires us to tell you how we collect, share, and protect your personal information. Please read this notice carefully to understand what we do. |
| | |
| What? | The types of personal information we collect and share depend on the product or service you have with us. This information can include:
|
● Social Security number ● Employment information ● Account balances | ● Account transactions ● Income ● Investment experience |
When you are no longer our customer, we continue to share your information as described in this notice. |
| | |
| How? | All financial companies need to share a customer’s personal information to run their everyday business - to process transactions, maintain customer accounts, and report to credit bureaus. In the section below, we list the reasons financial companies can share their customer’s personal information; the reasons NLFT II chooses to share; and whether you can limit this sharing. |
| | |
| Reasons we can share your personal information | Does NLFT II
share? | Can you limit
this sharing? |
For our everyday business purposes —
such as to process your transactions, maintain your account(s), respond to court orders and legal investigations, or report to credit bureaus
| Yes | No |
For our marketing purposes —
to offer our products and services to you
| Yes | No |
For joint marketing with other financial companies
| Yes | No |
For our affiliates’ everyday business purposes —
information about your transactions and experiences
| Yes | No |
For our affiliates’ everyday business purposes —
information about your creditworthiness
| No | We don’t share |
For nonaffiliates to market to you
| No | We don’t share |
| Questions? | Call 1-402-493-4603 |
| Who we are |
| Who is providing this notice? | Northern Lights Fund Trust II |
| What we do |
| How does NLFT II protect my personal information? | To protect your personal information from unauthorized access and use, we use security measures that comply with federal law. These measures include computer safeguards and secured files and buildings. |
| How does NLFT II collect my personal information? | We collect your personal information, for example, when you
|
● open an account ● give us your income information ● provide employment information | ● provide account information ● give us your contact information |
| We also collect your personal information from others, such as credit bureaus, affiliates, or other companies. |
| Why can’t I limit all sharing? | Federal law gives you the right to limit only ● sharing for affiliates’ everyday business purposes—information about your creditworthiness ● affiliates from using your information to market to you ● sharing for nonaffiliates to market to you State laws and individual companies may give you additional rights to limit sharing. |
| Definitions |
| Affiliates | Companies related by common ownership or control. They can be financial and nonfinancial companies. ● NLFT II has no affiliates. |
| Nonaffiliates | Companies not related by common ownership or control. They can be financial and nonfinancial companies. ● NLFT II does not share with nonaffiliates so they can market to you. |
| Joint marketing | A formal agreement between nonaffiliated financial companies that together market financial products and services to you. ● Our joint marketing partners include other financial service companies. |
PROXY VOTING POLICY
Information regarding how the Fund voted proxies relating to portfolio securities for the most recent twelve month period ended June 30th as well as a description of the policies and procedures that the Fund uses to determine how to vote proxies is available without charge, upon request, by calling 1-844-828-3242 or by referring to the Securities and Exchange Commission’s (“SEC”) website at http://www.sec.gov.
PORTFOLIO HOLDINGS
The Fund files a complete schedule of portfolio holdings with the Securities and Exchange Commission (the “SEC”) for the first and third quarters of each fiscal year as an exhibit to its reports on Form N-PORT, within sixty days after the end of the period. Form N-PORT reports are available at the SEC’s website at www.sec.gov.
| |
| INVESTMENT ADVISOR |
| Price Asset Management, LLC |
| 303 W Madison Street, Suite 1700 |
| Chicago, IL 60606 |
| |
| ADMINISTRATOR |
| Gemini Fund Services, LLC |
| 4221 North 203rd Street, Suite 100 |
| Elkhorn, Nebraska 68022-3474 |
Item 2. Code of Ethics.
(a) As of the end of the period covered by this report, the registrant has adopted a code of ethics that applies to the registrant's principal executive officer, principal financial officer, principal accounting officer or controller, or persons performing similar functions, regardless of whether these individuals are employed by the registrant or a third party.
(b) For purposes of this item, “code of ethics” means written standards that are reasonably designed to deter wrongdoing and to promote:
| (1) | Honest and ethical conduct, including the ethical handling of actual or apparent conflicts of interest between personal and professional relationships; |
| (2) | Full, fair, accurate, timely, and understandable disclosure in reports and documents that a registrant files with, or submits to, the Commission and in other public communications made by the registrant; |
| (3) | Compliance with applicable governmental laws, rules, and regulations; |
| (4) | The prompt internal reporting of violations of the code to an appropriate person or persons identified in the code; and |
| (5) | Accountability for adherence to the code. |
(c) Amendments: During the period covered by the report, there have not been any amendments to the provisions of the code of ethics.
(d) Waivers: During the period covered by the report, the registrant has not granted any express or implicit waivers from the provisions of the code of ethics.
(e) The Code of Ethics is not posted on Registrant’ website.
(f) A copy of the Code of Ethics is attached as an exhibit.
Item 3. Audit Committee Financial Expert.
(a) The Registrant’s board of trustees has determined that Keith Rhoades is an audit committee financial expert, as defined in Item 3 of Form N-CSR. Mr. Rhoades is independent for purposes of this Item.
Item 4. Principal Accountant Fees and Services.
2020 - $19,500
2019 - $19,000
2018 - $19,000
2017 - $18,500
2020 - None
2019 - None
2018 - None
2017 - None
2020 - $3,750
2019 - $3,750
2018 - $3,750
2017 - $3,750
Preparation of Federal & State income tax returns, assistance with calculation of required income, capital gain and excise distributions and preparation of Federal excise tax returns.
2020 - None
2019 - None
2018 - None
2017 – None
| (e) | (1) Audit Committee’s Pre-Approval Policies |
The registrant’s Audit Committee is required to pre-approve all audit services and, when appropriate, any non-audit services (including audit-related, tax and all other services) to the registrant. The registrant’s Audit Committee also is required to pre-approve, when appropriate, any non-audit services (including audit-related, tax and all other services) to its adviser, or any entity controlling, controlled by or under common control with the adviser that provides ongoing services to the registrant, to the extent that the services may be determined to have an impact on the operations or financial reporting of the registrant. Services are reviewed on an engagement by engagement basis by the Audit Committee.
| (2) | Percentages of Services Approved by the Audit Committee |
2020 2019 2018 2017
Audit-Related Fees: 0.00% 0.00% 0.00% 0.00%
Tax Fees: 0.00% 0.00% 0.00% 0.00%
All Other Fees: 0.00% 0.00% 0.00% 0.00%
| (f) | During the audit of registrant's financial statements for the most recent fiscal year, less than 50 percent of the hours expended on the principal accountant's engagement were attributed to work performed by persons other than the principal accountant's full-time, permanent employees. |
| (g) | The aggregate non-audit fees billed by the registrant's accountant for services rendered to the registrant, and rendered to the registrant's investment adviser (not including any sub-adviser whose role is primarily portfolio management and is subcontracted with or overseen by another investment adviser), and any entity controlling, controlled by, or under common control with the adviser that provides ongoing services to the registrant: |
2020 - $3,750
2019 - $3,750
2018 - $3,750
2017 - $3,750
(h) The registrant's audit committee has considered whether the provision of non-audit services to the registrant's investment adviser (not including any sub-adviser whose role is primarily portfolio management and is subcontracted with or overseen by another investment adviser), and any entity controlling, controlled by, or under common control with the investment adviser that provides ongoing services to the registrant, that were not pre-approved pursuant to paragraph (c)(7)(ii) of Rule 2-01 of Regulation S-X, is compatible with maintaining the principal accountant's independence.
Item 5. Audit Committee of Listed Companies. Not applicable to open-end investment companies.
Item 6. Schedule of Investments. Schedule of investments in securities of unaffiliated issuers is included under Item 1.
Item 7. Disclosure of Proxy Voting Policies and Procedures for Closed-End Funds. Not applicable to open-end investment companies.
Item 8. Portfolio Managers of Closed-End Management Investment Companies. Not applicable to open-end investment companies.
Item 9. Purchases of Equity Securities by Closed-End Funds. Not applicable to open-end investment companies.
Item 10. Submission of Matters to a Vote of Security Holders. None
Item 11. Controls and Procedures.
(a) Based on an evaluation of the Registrant’s disclosure controls and procedures as of a date within 90 days of filing date of this Form N-CSR, the principal executive officer and principal financial officer of the Registrant have concluded that the disclosure controls and procedures of the Registrant are reasonably designed to ensure that the information required in filings on Form N-CSR is recorded, processed, summarized, and reported by the filing date, including that information required to be disclosed is accumulated and communicated to the Registrant’s management, including the Registrant’s principal executive officer and principal financial officer, as appropriate to allow timely decisions regarding required disclosure.
(b) There were no significant changes in the Registrant’s internal control over financial reporting that occurred during the Registrant’s last fiscal half-year that have materially affected, or are reasonably likely to materially affect, the Registrant’s internal control over financial reporting.
Item 12. Disclosure of Securities Lending Activities for Closed-End Management Investment Companies. Not applicable
Item 13. Exhibits.
(a)(1) Code of Ethics filed herewith.
(a)(2) Certifications required by Section 302 of the Sarbanes-Oxley Act of 2002 (and Item 11(a)(2) of Form N-CSR) are filed herewith.
(a)(3) Not applicable for open-end investment companies.
(b) Certifications required by Section 906 of the Sarbanes-Oxley Act of 2002 (and Item 11(b) of Form N-CSR) are filed herewith.
SIGNATURES
Pursuant to the requirements of the Securities Exchange Act of 1934 and the Investment Company Act of 1940, the registrant has duly caused this report to be signed on its behalf by the undersigned, thereunto duly authorized.
(Registrant) Northern Lights Fund Trust II
By (Signature and Title)
*/s/ Kevin E. Wolf
Kevin E. Wolf, Principal Executive Officer/President
Date 11/4/20
Pursuant to the requirements of the Securities Exchange Act of 1934 and the Investment Company Act of 1940, this report has been signed below by the following persons on behalf of the registrant and in the capacities and on the dates indicated.
By (Signature and Title)
*/s/ Kevin E. Wolf
Kevin E. Wolf, Principal Executive Officer/President
Date 11/4/20
By (Signature and Title)
*/s/ Erik Naviloff
Erik Naviloff, Principal Financial Officer/Treasurer
Date 11/4/20