united states
securities and exchange commission
washington, d.c. 20549
form n-csr
certified shareholder report of registered management
investment companies
Investment Company Act file number 811-22549
Northern Lights Fund Trust II
(Exact name of registrant as specified in charter)
4221 North 203rd Street, Ste 100, Elkhorn, Nebraska 68022 _______
(Address of principal executive offices) (Zip code)
Rich Malinowski, Gemini Fund Services, LLC.
80 Arkay Drive, Hauppauge, NY 11788
(Name and address of agent for service)
Registrant's telephone number, including area code: 631-470-2734
Date of fiscal year end: 3/31
Date of reporting period:3/31/20
Item 1. Reports to Stockholders.
| |
 |
| |
| |
| |
| |
| T W O O A K S D I V E R S I F I E D |
| G R O W T H A N D I N C O M E F U N D |
| |
| |
| |
| |
| |
| |
| |
| |
| |
| |
| |
| |
| |
| |
| Annual Report |
| March 31, 2020 |
| |
| |
| |
| |
| |
| |
| |
| |
| |
| |
| |
| |
| |
| |
| |
| |
| |
| |
| |
| |
| |
| |
| |
| |
| |
| Beginning on January 1, 2021, as permitted by regulations adopted by the Securities and Exchange Commission, paper copies of the Fund’s shareholder reports like this one will no longer be sent by mail, unless you specifically request paper copies of the reports. Instead, the reports will be made available on the Fund’s website www.twooaks.com and you will be notified by mail each time a report is posted and provided with a website link to access the report. |
| |
| If you already elected to receive shareholder reports electronically, you will not be affected by this change and you need not take any action. You may elect to receive shareholder reports and other communications from the Fund electronically or to continue receiving paper copies of shareholder reports, which are available free of charge, by contacting your financial intermediary (such as a broker-dealer or bank) or, if you are a direct investor, by following the instructions included with paper Fund documents that have been mailed to you. |
The Two Oaks Diversified Growth and Income Fund March 31, 2020
Dear Fellow Shareholders of The Two Oaks Diversified Growth and Income Fund, it has been over fourteen years since we took over the portfolio management of the Montecito Fund on November 1, 2005. The Fund we inherited started operations on April 15, 2002 and has a publishable track record back to this date. However, the current management and investment disciplines have been in place since November 1, 2005. We are pleased that we now have a publishable 14-year track record for the Fund that shows the results of our investment philosophy. On November 1, 2005 the Net Asset Value of the Fund was $10.09 per share. Since November 1, 2005, there have been $6.3668 in Class A distributions per share and the Net Asset Value per Class A share was $10.83 as of March 31, 2020. This has resulted in a total positive return of $7.11 per share. As of the end of March the portfolio was invested 43.48% in Equities, 24.52% in Real Estate and Asset Based Securities, 23.47% in Fixed Income and 8.53% in Cash. The benchmark selected for our Fund is a blend of 60% Standard and Poor’s 500 and 40% Bloomberg Barclay’s U.S. Aggregate Bond Index. From November 1, 2005 until March 31, 2020, this index showed a cumulative rate of return of 153.55% and an Average Annual Return of 6.67%. During this same time frame our Fund at Net Asset Value showed a cumulative rate of return of 87.70% and an Average Annual Return of 4.46%. For the year ended March 31, 2020, our Class A shares were down 13.81% versus down 0.39% for the benchmark. This return consisted of depreciation of $2.06 per share and distributions of $0.3532 per share. Trailing 1 year returns can be attributed to a sharp decline in equity, real estate, and asset based securities prices.
Asset prices have declined significantly during the global COVID-19 outbreak. Asset based securities whose performance is largely correlated to commodity prices have been hit exceptionally hard with daily commutes and overall travel screeching to a sudden halt. For a brief period, short-term oil prices actually went negative! Many commercial real estate owners are not collecting rents as various tenants deemed non-essential were forced to close their doors with some choosing never to reopen again. While many stocks have seen dramatic price declines, overall declines in asset based and real estate markets have been even worse. While we do envision a strong bounce back once economies begin to reopen the possibility of a second wave of COVID-19 remains. We do believe the world has learned a lot over these past few months. Although continued shutdowns remains a risk we believe the more likely outcome to be a more organized, targeted approached to outbreak containment with localized shutdowns if needed.
The performance data quoted here represents past performance. Current performance may be lower or higher than the performance data quoted above. Investment return and principal value will fluctuate, so that shares, when redeemed, may be worth more or less than their original cost. Past performance is no guarantee of future results. A Fund's performance, especially for very short periods of time, should not be the sole factor in making your investment decisions. For performance information current to the most recent month-end, please call 888.806.8633.
MARKET THOUGHTS
We prepare market commentary on a regular basis. Due to these unprecedented times, we will share our thoughts we had entering the year 2020 as well as an update after we finished the first quarter of 2020. It is amazing to see how quickly today’s markets, sentiment, emotions, and news flow can change in a mere 3 months. However, our long-term conclusions we formed entering the year 2020 remain unchanged.
5597-NLD-4/27/2020
OUR THOUGHTS ENTERING 2020 - “MUCK AND UP”
A few years ago we wrote about the Lost Generation. This was a generation that endured the dot-com crash, accounting scandals, the housing bubble boom and bust, and near financial system implosion all within a single decade. These events etched fear and distrust into the hearts and minds of many, impacting investment decisions to this day. The evidence is rather overwhelming. In spite of stock markets climbing to all-time highs, unemployment near all-time lows, and innovation / technological advancement progressing at a rate the world has never seen before – the typical investor is more likely to hit the eject button and sell every stock they own rather than bang down our front door rushing to invest as much as possible into the market. According to the Wall Street Journal, 2019 saw over $135B pulled out of US stock-focused mutual funds and ETFs, which is the greatest amount ever recorded for a calendar year!
It is easy to fall victim to the belief that what recently happened will repeat itself in the future. This is human nature and we covered this topic last year when writing about anchoring and recency bias. Humans tend to give disproportionate weight to recent events and discount information from the more distant past. However, when it comes to investing we must remember that markets are long-term and our perspective must be long-term as well. With this in mind, a study was born. Our country has certainly been through rough times in the past. What did those other eras look like? How long did they last? What were returns like? We examined monthly return data on the US stock market (S&P 500 benchmark) and made some fascinating discoveries.
Our main takeaway is that there has been a clear pattern of long-term movements for US stocks in what we refer to as“Muck and Up”. The Muck refers to long stretches where the market struggles to eclipse previous highs. The market action is violent with big swings taking place. The drops are severe and take a long time to recover from as fear runs rampant.
TIME PERIODS OF MUCK
(All monthly return data and charts are for the S&P 500 Index and courtesy of FactSet)
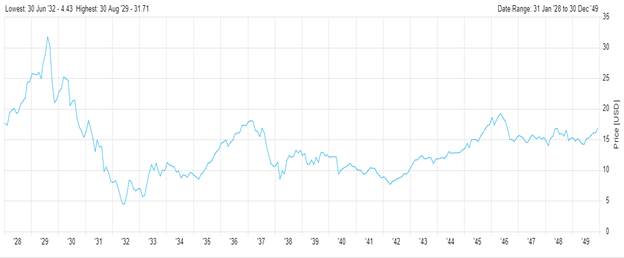
FEBRUARY 1928 TO DECEMBER 1949
21.9 YEARS
RETURN: -2.72%
DECLINES OF 86%, 24%, 53%, 42%, & 27% TAKING ON AVERAGE 2.2 YEARS TO RECOVER FROM
5597-NLD-4/27/2020
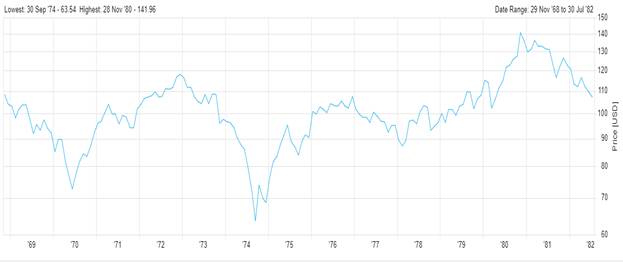
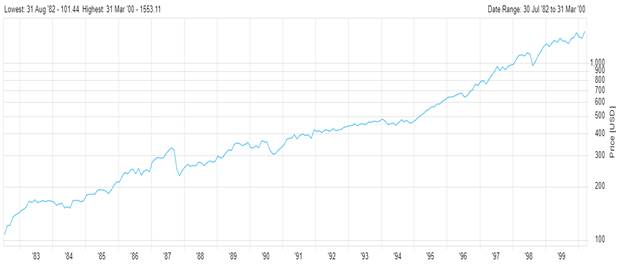
NOVEMBER 1968 TO JULY 1982
13.8 YEARS
RETURN OF -1.18%
DECLINES OF 33%, 46%, 19%, & 26% TAKING ON AVERAGE 1.6 YEARS TO RECOVER FROM
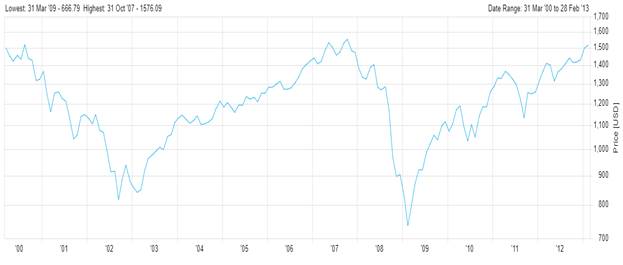
MARCH 2000 TO FEBRUARY 2013
13.0 YEARS
RETURN OF 1.07%
DECLINES OF 51%, 58%, & 18% TAKING ON AVERAGE 1.6 YEARS TO RECOVER FROM
Eventually, the market clears through these periods of Muck and then embarks on a long journey of moving significantly higher. These stretches still go through downturns but the drops are far less severe and declines are quickly recovered. Market declines shift from being viewed as the start of the next crash to being viewed as buying opportunities.
5597-NLD-4/27/2020
TIME PERIODS OF UP
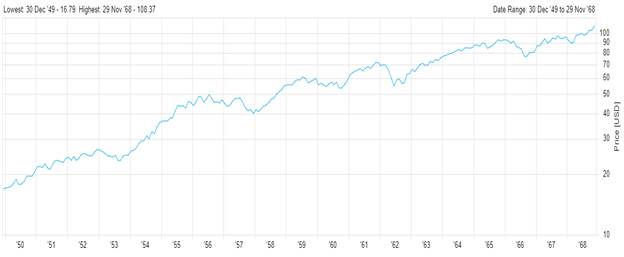
DECEMBER 1949 TO NOVEMBER 1968
19 YEARS
RETURN: 545%
DECLINES OF 8%, 19%, 12%, 21%, & 18% TAKING ON AVERAGE 1.1 YEARS TO RECOVER FROM
JULY 1982 TO MARCH 2000
17.8 YEARS
RETURN: 1,377%
DECLINES OF 33%, 19%, 9%, & 20% TAKING ON AVERAGE ..3 YEARS TO RECOVER FROM
These long-term trends are difficult to identify when we’re bombarded with a sensationalized 24 hour“news” cycle. However, after analyzing our study we believe there are numerous ingredients in place that could see us currently in the early stages of the next major Up move for the US stock market.
5597-NLD-4/27/2020
THE NEXT MOVE UP?
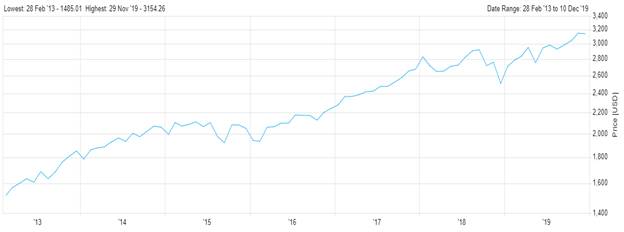
FEBRUARY 2013 TO TODAY
6.9 YEARS
RETURN: 112%
DECLINES OF 15% & 18% TAKING ON AVERAGE .9 YEARS TO RECOVER FROM
It may sound outlandish to predict we’re in the early stages of the next significant Up move when we constantly hear how close we are to the next recession, how late stage we are in this economic expansion, and how we’re in the last innings of this bull market. However, we challenge these assumptions. Very few investors felt that we have been in a roaring bull market at any point over the last 20 years.It is unfair to measure the start of an upward market from a trough that was catastrophic and emotionally damaging to those that experienced it. If you had the worst possible timing in the world and invested in October 2007 it took you 5 full years to get back to even! If we are correct it doesn’t mean we won’t experience recessions or even bear markets. However, there will be a shift in sentiment when they do occur. Instead of causing catastrophic panic these dips will be viewed as opportunities and not the start of the next crash that scars an entire generation.
These up moves cannot simply be fueled by stock prices moving higher. There must be fundamental ingredients in place that will drive the economy, create growth, and justify valuations. Fortunately, we see numerous factors contributing to the next move Up.
FACTORS WE SEE DRIVING THE MOVE UP
#1 CORPORATE TAX RATES ON PAR WITH THE REST OF THE WORLD
Congress recently passed a piece of legislation that received a lot of attention at the time, yet is rarely mentioned anymore. The Tax Cuts and Jobs Act was signed into law on 12/22/2017 and cut the U.S. corporate tax rate from 35% to 21%. Prior to this, the US had the fourth highest corporate tax rate of 202 jurisdictions surveyed in 2017 and the highest among OECD (Organization for Economic Cooperation and Development) nations. It wasn’t just slightly higher than OECD members either. When combined with average state taxes the US corporate tax rates were 60% greater than the average OECD member!
5597-NLD-4/27/2020
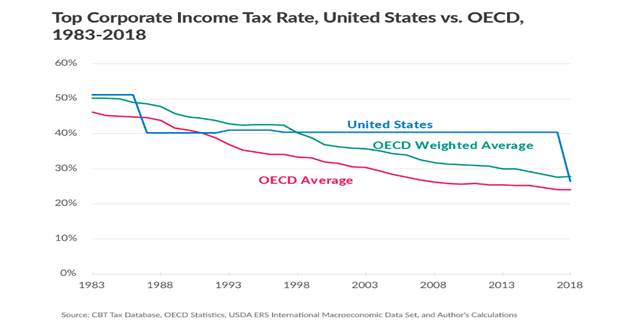
https://taxfoundation.org/benefits-of-a-corporate-tax-cut/
Although the passage of the tax cut was a one-time event, it is leaving a lasting impact on employment, wages, capital investment, research and development, and overall business sentiment. It has been referenced numerous times by some of the most respected business leaders in the world:
“Last year, however, 40% of the government’s “ownership” (14/35ths) was returned to Berkshire – free of charge – when the corporate tax rate was reduced to 21%”. –Warren Buffett 2018 Berkshire annual letter
“The economy is ripping. Salesforce’s own customers are benefiting from changes that have come about as a result of recently enacted U.S. tax reform. Hundreds of CEOs have told me they are investing more because of confidence stemming from the tax breaks.” –Marc Benioff, Salesforce CEO
#2 SHIFTING ANIMAL SPIRITS
In John Maynard Keynes’1936 book“The General Theory of Employment, Interest and Money” he described“animal spirits” as instincts and emotions that influence and guide human behavior. Humans have a spontaneous urge to action rather than inaction. We strive to make decisions that result in positive outcomes. There is a common misunderstanding that these spirits have recently been released. Keynes said these spirits are always around – they just drive differing actions. Having lived through a period of major accounting fraud, high-tech blow-ups, massive foreclosures, and near financial system collapse, the animal spirits drive decisions to hunker down, be safe, and distrust everything. People who did this believed they were acting positively, trying to preserve what they had, and avoid catastrophe. This is the exact sentiment associated with periods of Muck, however, we feel this is gradually changing. The farther away we move from the dot-com blow up and Great Recession, the more likely we are to see behaviors shift to decision making driven by confidence and optimism.
5597-NLD-4/27/2020
#3 WE ARE IN THE MIDST OF A TECHNOLOGICAL AND INNOVATION BOOM
We’ve written at great length on this topic. We are living in arguably the most innovative time in human history. Virtually every industry is being disrupted. This trend is not slowing – it is accelerating. Gains in computing power continue their exponential growth rate giving rise to the digitization of business, importance of data analysis, and evolution of artificial intelligence. This advancement continues to remove layers of expense, making the world faster, more efficient, and displacing stagnant businesses and processes with far superior solutions.
#4 ACCOMODATIVE FED
We do not envy the job of Jay Powell. As the 16th Chair of the Federal Reserve he has been under constant scrutiny since taking over the position in February 2018. Regularly blasted by President Trump on Twitter and named as the cause of the market sell-off in Q4 2018, we feel the criticism is rather unjustified. The Fed has merely been trying to find the neutral rate of interest. Although they are technically raising interest rates we believe when you’re coming off a base of 0%, the first several moves are quite meaningless. There is a point at which interest rates become so low they no longer have any material impact on an economy. All we have to do is look at every single country around the world with 0 or negative rates – their economies are certainly not booming. Instead, cutting rates to extreme levels seems to be interpreted more as a sign of serious weakness than economic prosperity. Because of this, we’re pleased to see the Fed trying to find neutral. Until we get rates closer to 3% we do not view this as tightening and therefore see very little meaningful impact to stock prices.
#5 U.S. STOCK MARKET VALUATIONS ARE IN-LINE WITH HISTORIC AVERAGES
The S&P 500 Index trades at a long-term, historic average of approximately 15 times earnings. By the very nature of an average, that implies you spend time both above and below this number. During times of uncertainty and fear this multiple has dipped below average. We’ve also witnessed this multiple spend significant time below average when there were attractive alternatives available such as 10 year treasury bonds yielding 14% (this happened in 1981).
Currently, the S&P 500 trades at approximately 17.6 times 2020’s earnings estimate. While this is above average it is also within one standard deviation of the mean. Further, one could argue that with today’s innovation boom, and alternatives such as fixed income yielding paltry amounts, an above average earnings multiple would be justified. (Keep in mind, the average earnings multiple of the S&P 500 when the 10 year US treasury yields below 4% is approximately 20.) The big takeaway – this is not the late 1990s and we are nowhere near euphoric valuations.
#6 SENTIMENT REMAINS WEAK
It is worth repeating, 2019 will go down as the year with the greatest amount of money pulled out of U.S. stocks on record. Consensus keeps waiting for the next crash. But in investing, consensus is usually wrong.Remember, the only times in US history where the S&P 500 endured two greater than 20% annual declines within a 10 year time period was 1929 to 1939 and 2000 to 2010. Those waiting for
5597-NLD-4/27/2020
the next crash might be waiting for a long time. After the decline in 1937 you had to wait 37 years before the next 20% down year in the market! Without sentiment rising to euphoric levels we are lacking the stretch in valuations that becomes unsustainable and leads to truly dramatic market declines.
Rather than following the herd and proclaiming that we’re nearing the end of this economic expansion and bull market, we prefer to take a different perspective. Ours is a perspective grounded in long-term analysis that clearly illustrates a pattern of market behavior. Perhaps that is why it is never mentioned in the media – they want you to react by the day. Looking through a multi-decade lens doesn’t create the same sense of urgency. You’ll never know the exact starts and ends of these long-term moves until you’ve lived through them. However, there are signs to look for. Analyzing those signs leads us to believe we are in the early stages of the next significant, long-term Up move in the market.
OUR THOUGHTS AFTER THE FIRST QUARTER OF 2020 - “ONE FOR THE AGES”
The first quarter of 2020 will be one for the ages. Shelter in place, self-quarantine, social distancing, and“out of an abundance of caution” will be engrained in all of our memories. The shock of empty grocery store shelves and inability to buy basic staples harken back to the Depression era and World Wars. Interest rates cut to 0%, a $2 trillion government stimulus bill, and the fastest fall from new highs and into a bear market in history highlight the amount of uncertainty, fear, and panic engulfing the world. Although the near-term might appear bleak there are a few silver linings in these unprecedented times.
Everyone just received a major wake-up call and found out how woefully unprepared they are for a disaster.Most now realize the importance of having strategic reserves of basic healthcare supplies. There is no reason for the world to have a shortage of gloves, masks, and ventilators. Companies will have far more robust and fine-tuned contingency plans allowing for the smooth transition to work from home. The education system now realizes the need for remote and alternative teaching methods to keep pace with today’s rapidly advancing technologies. The mindset of“that’s the way we’ve always done things” isn’t going to always work in the future. In our opinion, we should all be more prepared, more flexible, and ready to adapt.
Recessions can be cleansing and improve the long-term health of financial markets. Although difficult to live through, resets like this are essential for the long-term health of financial markets and the economy. By the middle of this year we will have gone through the first bear market and recession in over a decade. This is important for a few reasons. Recessions serve as a great cleansing for the economy. Weak, inefficient, less productive ways of doing things are replaced by newer, better, faster solutions ensuring our economy continues to push forward with the best and brightest ideas. Further, investor mindsets can become complacent when times are good leading to overconfidence and an inefficient allocation of capital causing zombie like ideas to wander around for years with seemingly unlimited funding (WeWork as a great example).
5597-NLD-4/27/2020
Our“new normal” might eventually prove better for the environment, work/life balance, and overall happiness. We do believe change will come from this outbreak and not everything will go back to the way it was. Technology has clearly enabled a level of connectivity never before available in human history. Companies will examine if face-to-face practices are essential, possibly altering the demand for business travel forever. More employees working from home mean less daily commutes possibly impacting energy demand and improving overall air quality. With major outbreaks in densely populated urban areas we might see a continued exodus from the big cities as people tire of living on top of each other and instead prefer a more affordable, less stressful rural setting. Shelter in place has caused families to spend more time together enjoying movie nights, family dinners, and games. With health of loved ones at the forefront of everyone’s mind the perspective of what is truly important has also been reset.
It is important to keep perspective. While we certainly don’t want to come off as taking COVID-19 lightly, we do hope the numerous other causes of death receive a sliver of the current 24/7 news coverage COVID-19 is garnering. The National Vital Statistics report from June 2019 showed all deaths and causes of death in the U.S. for 2017 and 2016. In the year 2017 the U.S. lost 2,813,503 lives with the top 10 causes being:
| Cause | | # of deaths | | % of deaths |
| Heart Disease | | | 647,457 | | | | 23.0% | |
| Cancer | | | 599,108 | | | | 21.3% | |
| Accidents | | | 169,936 | | | | 6.0% | |
| Chronic lower respiratory diseases | | | 160,201 | | | | 5.7% | |
| Cerebrovascular diseases (Stroke) | | | 146,383 | | | | 5.2% | |
| Alzheimer disease | | | 121,404 | | | | 4.3% | |
| Diabetes | | | 83,564 | | | | 3.0% | |
| Influenza and pneumonia | | | 55,672 | | | | 2.0% | |
| Nephritis, nephrotic syndrome (Kidney disease) | | | 50,633 | | | | 1.8% | |
| Suicide | | | 47,173 | | | | 1.7% | |
| | | | | | | | | |
As of 3/31/2020 there were 3,173 deaths in the U.S .and 39,014 worldwide attributed to COVID-19. Many of these deaths may still have occurred and been attributed to the causes listed above. Although sad to say, think of how many lives have been saved and tragedies prevented with far less vehicles on the road during this time of shelter in place. We’re hopeful that the world and media recognize constant attention given to various topics does impact behavior. There are other causes of death such as heart disease, accidents, influenza, and suicide that could see numerous lives saved if healthy lifestyle choices, mental health awareness, or safe driving practices had consistent coverage. If we’re truly about saving lives it would be nice to see influence used to promote solutions and not just fear.
We are aware that the current environment looks scary but panic and fear will not help your financial plans. While we never know when an exact bottom will occur in stock prices we do know that markets generally look forward and normally turn up before the news turns positive. Those investors that panic and sell their investments while waiting for more clarity will miss out on some of the biggest recovery gains to be had. Recall, at the March 23rd lows of 2,191 on the S&P 500 we were just 41% above where the S&P 500 peaked in March of 2000! Given, the March 2000 highs were a truly euphoric valuation
5597-NLD-4/27/2020
peak, but that still equates to a horrendously low 20-year compound annual growth rate of 1.74%. At a certain point these market drops are like going back in time and eventually become severely disconnected from reality. Reality is our economy has grown dramatically over the past 20 years with GDP growing from $10.3 trillion in 2000 to $21.4 trillion in 2020. In the year 2000 iPhones didn’t exist, apps weren’t a thing, people still talked on land lines, Netflix only delivered DVDs by mail, talk of the cloud was handled by meteorologists, electric vehicles were golf carts, and a small up-start named Amazon just opened their marketplace to 3rd party merchants.
There has never been a time in U.S. history where our markets went down and stayed down. They eventually pushed forward making new all-time highs 100% of the time. Keep in mind this track record was achieved in spite of other terrifying events such as the rise of Hitler and devastation of World War II, the assassination of JFK, the horrendous terrorist attacks on 9/11, and even other viral pandemics. In spite of the current outbreak fears, our conviction remains as strong as ever that we remain in the early stages of a long-term secular bull market that will see exceptional returns through the end of this decade. Because of this we feel it is an excellent time to take stock of your long-term goals and objectives and update your financial plan. We’re confident patience and maintaining control of emotion will once again be rewarded. The world has advanced significantly and will continue to do so.
THOUGHTS ON PORTFOLIO POSITIONING
Two Oaks investment philosophy believes in diversification amongst three major asset classes: Stocks, Fixed Income, and Real Estate / Asset Based securities. During this market downturn Real Estate / Asset Based securities have been hit exceptionally hard contributing to the underperformance of our Fund as it has greater exposure to this asset class. As of quarter-end, real estate indexes are still down greater than 30% and certain commodities (such as oil) are down greater than 50%.
We do believe real estate’s underperformance is due to the vast amount of uncertainty related to the COVID-19 outbreak. Questions surrounding how property owners will collect rent from tenants that are not able to open their doors for business need to be answered. However, we believe the government programs recently put in place will help address these concerns and clear up this uncertainty over the next couple of weeks. Our conviction remains high in real estate’s long-term investment appeal. With yields from fixed income at record lows the attractiveness of real estate remains as strong as ever. Properties such as industrial warehouses, data centers, and affordable housing remain in strong demand and offer compelling cash flows and current yield in today’s marketplace. Further, publicly traded real estate is trading at one of the largest discounts to private real estate that we have ever seen. This has historically been an excellent predictor of future returns from this asset class. Although the past does not guarantee the future, we do believe patient investors will be rewarded.
The bright spot in the market and our portfolio are those companies with a focus on the future. Many young, disruptive, up and coming companies are truly shining in today’s environment. We believe many will emerge from this downturn as leading companies of this decade and eventually make their way into the major indexes at some point in the future. We will continue to require that our existing companies
5597-NLD-4/27/2020
are embracing this technological advancement and also look to add some of these leading companies of the next generation as they graduate from young upstarts to industry leaders.
We continue to believe that it is more prudent than ever to focus on a bottoms-up, fundamental based approach to the markets. Up until recently you were able to achieve success by merely having exposure to the broad markets. However, recent events have reminded us just how volatile markets can be. We continue to believe success will be earned by focusing on long-term investment themes, unique company-specific ideas, & investing in less followed asset classes. We believe our current asset allocation & portfolio holdings reflect these points. Looking forward, we believe the greatest value & opportunities will be found by keeping the asset allocation near a maximum weighting in equities, minimum in fixed income, & looking to real estate / asset based securities to generate acceptable cash flows lacking from traditional fixed income.
CLOSING THOUGHTS
We continue to believe that owning high quality investment assets that pay an income that grows over time and diversifying those holdings is an excellent equation for investors to achieve financial independence. Our disciplines dictate that we be balanced, with 15% to 50% in each of the three major asset categories – Equities, Fixed Income, and Real Estate and Asset Based. Adding to that asset allocation is our own proprietary research and analytical tools that are the hallmarks of our “common sense investing” for the long term. Thank you for your continued confidence and the opportunity to manage our Fund. We take very seriously our responsibility and will always endeavor to be responsive to your questions and concerns. As always, we welcome and encourage your comments and feedback.
| Blake Todd | | Jarrett Perez, CFA |
| Portfolio Manager | | Portfolio Manager |
Sources:
https://www.cdc.gov/nchs/data/nvsr/nvsr68/nvsr68_09-508.pdf
https://google.com/covid19-map/
The material herein has been provided by Two Oaks Investment Management, LLC and is for informational purposes only.
Two Oaks Investment Management, LLC is not affiliated with Northern Lights Distributors, LLC.
Bloomberg Barclays Capital U.S. Aggregate Bond Index covers the USD-denominated, investment-grade, fixed-rate, taxable bond market of SEC-registered securities. The index includes bonds from the Treasury, Government- Related, Corporate, MBS (agency fixed-rate and hybrid ARM pass-throughs), ABS, and CMBS sectors. The U.S. Aggregate Index is a component of the U.S. Universal Index in its entirety. Fixed Income securities are subject to risks including inflationary and interest rate changes, among others.
5597-NLD-4/27/2020
S&P 500 Index is an unmanaged composite of 500 large capitalization companies. This index is widely used by professional investors as a performance benchmark for large-cap stocks. You cannot invest directly in an index and unmanaged index returns do not reflect any fees, expenses or sales charges.
5597-NLD-4/27/2020
| Two Oaks Diversified Growth and Income Fund (Unaudited) |
| Growth of $10,000 |
| Performance Summary – For Year Ended March 31, 2020 |
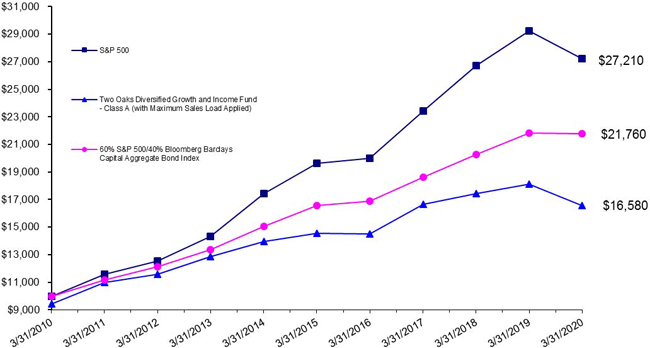
| | | Annualized |
| | | | | Since Inception |
| | 1 Year | 5 Years | 10 Years | 04/15/2002 |
| Two Oaks Diversified Growth and Income Fund(1) – Class A: | (13.81)% | 1.42% | 5.19% | 3.71% |
| Without Sales Charge |
| With Sales Charge(2) | (18.78)% | 0.23% | 4.56% | 3.36% |
| S&P 500 | (6.98)% | 6.73% | 10.53% | 7.01% |
| 60% S&P 500/40% Bloomberg Barclays U.S. Aggregate Bond | (0.39)% | 5.63% | 8.08% | 6.33% |
| | | | | |
| (1) | Effective November 1, 2005, the strategy of the Two Oaks Diversified Growth and Income Fund, formerly known as the Montecito Fund changed and Blake T. Todd assumed the role of Portfolio Manager. |
| (2) | Adjusted for initial maximum sales charge of 5.75%. |
The S&P 500 is a market capitalization-weighted index of 500 widely held common stocks. The Bloomberg Barclays U.S. Aggregate Bond Index is an unmanaged market index representative of the U.S. taxable fixed income securities.
Past performance is not predictive of future results and current performance may be lower or higher than the performance data quoted. The Fund’s total annual gross operating expenses, as stated in the fee table to the Portfolio’s prospectus dated July 31, 2019, are 1.70% for Class A. The investment return and principal value of an investment will fluctuate. An investor’s shares, when redeemed, may be worth more or less than the original cost. The returns shown do not reflect the deduction of taxes that a shareholder would have to pay on Fund distributions or the redemption of the Fund shares. Investment performance current to the most recent month-end may be obtained by calling (888) 806-8633.
| Two Oaks Diversified Growth and Income Fund |
| March 31, 2020 (Unaudited) |
| Top 10 Holdings* (Unaudited) | | % of Net Assets | | | Portfolio Composition (Unaudited) | | % of Net Assets | |
| Apple, Inc. | | | 5.1 | % | | Common Stock | | | 47.6 | % |
| Brookfield Infrastructure Partners LP | | | 4.6 | % | | Corporate Bonds | | | 22.5 | % |
| Dollar General Corp., 3.25%, 4/15/2023 | | | 4.2 | % | | Real Estate Investment Trusts (REITS) | | | 18.0 | % |
| Digital Realty Trust, Inc. | | | 3.9 | % | | Short-Term Investments | | | 8.4 | % |
| Walt Disney Co. | | | 3.6 | % | | Preferred Stock | | | 1.8 | % |
| T. Rowe Price Group, Inc. | | | 3.4 | % | | Closed-End Fund | | | 1.4 | % |
| UnitedHealth Group, Inc. | | | 3.4 | % | | Cash And Other Assets Less Liabilities | | | 0.3 | % |
| Rockwell Automation, Inc. | | | 3.1 | % | | NET ASSETS | | | 100.0 | % |
| Consolidated Water Co., Ltd. | | | 2.6 | % | | | | | | |
| McKesson Corp. | | | 2.4 | % | | | | | | |
| * | As of March 31, 2020. Top ten holdings exclude short-term investments. |
Please refer to the Schedule of Investments in this annual report for a detailed listing of the Fund’s holdings.
| Two Oaks Diversified Growth and Income Fund | |
| SCHEDULE OF INVESTMENTS | March 31, 2020 |
| Shares | | | Security | | Fair Value | |
| | | | | COMMON STOCK - 47.6% | | | | |
| | | | | APPAREL - 0.5% | | | | |
| | 15,000 | | | Hanesbrands, Inc. | | $ | 118,050 | |
| | | | | | | | | |
| | | | | BANKS - 1.1% | | | | |
| | 30,000 | | | Community West Bancshares | | | 182,700 | |
| | 234 | | | WTB Financial Corp. | | | 60,957 | |
| | | | | | | | 243,657 | |
| | | | | BEVERAGES - 1.6% | | | | |
| | 2,500 | | | Constellation Brands, Inc. | | | 358,400 | |
| | | | | | | | | |
| | | | | COMMERCIAL SERVICES - 1.8% | | | | |
| | 10,000 | | | Service Corporation International | | | 391,100 | |
| | | | | | | | | |
| | | | | COMPUTERS - 5.1% | | | | |
| | 4,375 | | | Apple, Inc. | | | 1,112,519 | |
| | | | | | | | | |
| | | | | DIVERSIFIED FINANCIAL SERVICES - 5.3% | | | | |
| | 8,780 | | | BGC Partners, Inc., Class A | | | 22,126 | |
| | 7,500 | | | T. Rowe Price Group, Inc. | | | 732,375 | |
| | 2,500 | | | Visa, Inc. | | | 402,800 | |
| | | | | | | | 1,157,301 | |
| | | | | ELECTRIC - 4.6% | | | | |
| | 27,750 | | | Brookfield Infrastructure Partners LP | | | 998,167 | |
| | | | | | | | | |
| | | | | FOOD - 1.9% | | | | |
| | 7,000 | | | Calavo Growers, Inc. | | | 403,830 | |
| | | | | | | | | |
| | | | | HEALTHCARE - SERVICES - 4.7% | | | | |
| | 725 | | | Align Technology, Inc. * | | | 126,114 | |
| | 325 | | | Intuitive Surgical, Inc. * | | | 160,943 | |
| | 3,000 | | | UnitedHealth Group, Inc. | | | 748,140 | |
| | | | | | | | 1,035,197 | |
| | | | | | | | | |
| | | | | HOUSEWARES - 1.3% | | | | |
| | 2,800 | | | The Scotts Miracle-Gro Co. | | | 286,720 | |
| | | | | | | | | |
| | | | | MACHINERY - DIVERSIFIED - 5.2% | | | | |
| | 4,500 | | | Rockwell Automation, Inc. | | | 679,095 | |
| | 7,000 | | | Xylem, Inc. | | | 455,910 | |
| | | | | | | | 1,135,005 | |
| | | | | MEDIA - 3.6% | | | | |
| | 8,200 | | | Walt Disney Co. | | | 792,120 | |
| | | | | | | | | |
| | | | | RETAIL - 4.1% | | | | |
| | 3,000 | | | McDonald’s Corp. | | | 496,050 | |
| | 6,000 | | | Starbucks Corp. | | | 394,440 | |
| | | | | | | | 890,490 | |
| | | | | SOFTWARE - 1.5% | | | | |
| | 1,000 | | | NetEase, Inc. - ADR | | | 320,960 | |
| | | | | | | | | |
| | | | | TRANSPORTATION - 2.7% | | | | |
| | 3,083 | | | Brookfield Infrastructure Corp. * | | | 100,332 | |
| | 4,000 | | | FedEx Corp. | | | 485,040 | |
| | | | | | | | 585,372 | |
| | | | | | | | | |
The accompanying notes are an integral part of these financial statements.
| Two Oaks Diversified Growth and Income Fund | |
| SCHEDULE OF INVESTMENTS (Continued) | March 31, 2020 |
| Shares | | | Security | | Fair Value | |
| | | | | COMMON STOCK - 47.6% (Continued) | | | | |
| | | | | WATER - 2.6% | | | | |
| | 34,300 | | | Consolidated Water Co., Ltd. | | $ | 562,520 | |
| | | | | | | | | |
| | | | | TOTAL COMMON STOCK
(Cost - $8,217,691) | | | 10,391,408 | |
| | | | | | | | | |
| | | | | REAL ESTATE INVESTMENT TRUSTS (REITS) - 18.0% | | | | |
| | | | | APARTMENTS - 2.0% | | | | |
| | 80,000 | | | Bluerock Residential Growth REIT, Inc. | | | 445,600 | |
| | | | | | | | | |
| | | | | DIVERSIFIED - 13.8% | | | | |
| | 43,000 | | | Armada Hoffler Properties, Inc. | | | 460,100 | |
| | 20,000 | | | CorEnergy Infrastructure Trust, Inc. | | | 367,600 | |
| | 6,200 | | | Digital Realty Trust, Inc. | | | 861,242 | |
| | 4,000 | | | EPR Properties | | | 96,880 | |
| | 10,000 | | | Healthpeak Properties, Inc. | | | 238,500 | |
| | 50,000 | | | Lexington Realty Trust | | | 496,500 | |
| | 45,000 | | | UMH Properties, Inc. | | | 488,700 | |
| | | | | | | | 3,009,522 | |
| | | | | WAREHOUSE/INDUSTRIAL - 2.2% | | | | |
| | 40,000 | | | Monmouth Real Estate Investment Corp. | | | 482,000 | |
| | | | | | | | | |
| | | | | TOTAL REAL ESTATE INVESTMENTS TRUSTS
(Cost - $3,741,776) | | | 3,937,122 | |
| Principal | | | | | Coupon Rate (%) | | | Maturity Date | | | |
| | | | CORPORATE BONDS - 22.5% | | | |
| | | | | AUTO MANUFACTURERS - 0.8% | | | | | | | |
| $ | 100,000 | | | Tesla, Inc. | | | 2.0000 | | | 5/15/2024 | | | 182,669 | |
| | | | | | | | | | | | | | | |
| | | | | BANKS - 4.4% | | | | | | | | | | |
| | 500,000 | | | Barclays Bank PLC, 3 mo. LIBOR + 1.25% (a) | | | 3.0979 | | | 4/11/2023 | | | 463,980 | |
| | 500,000 | | | Goldman Sachs Group, Inc., 3mo. LIBOR + 1.15% (a) | | | 2.8446 | | | 5/20/2020 | | | 498,744 | |
| | 962,724 | | | | | | | | | | | | | |
| | | | | ELECTRIC - 2.3% | | | | | | | | | | |
| | 500,000 | | | Public Service Enterprise Group, Inc. | | | 2.0000 | | | 11/15/2021 | | | 490,660 | |
| | | | | | | | | | | | | | | |
| | | | | ENVIRONMENTAL CONTROL - 1.6% | | | | | | | | | | |
| | 347,000 | | | Waste Management, Inc. | | | 2.4000 | | | 5/15/2023 | �� | | 341,702 | |
| | | | | | | | | | | | | | | |
| | | | | MISCELLANEOUS MANUFACTURING - 2.2% | | | | | | | | | | |
| | 500,000 | | | General Electric Co., 3 mo. LIBOR + 1.00% (a) | | | 2.8312 | | | 4/15/2023 | | | 487,272 | |
| | | | | | | | | | | | | | | |
| | | | | OIL & GAS - 2.3% | | | | | | | | | | |
| | 500,000 | | | Chevron Corp. | | | 2.4980 | | | 3/3/2022 | | | 507,871 | |
| | | | | | | | | | | | | | | |
| | | | | PHARMACEUTICALS - 2.4% | | | | | | | | | | |
| | 500,000 | | | McKesson Corp. | | | 3.7960 | | | 3/15/2024 | | | 519,625 | |
| | | | | | | | | | | | | | | |
| | | | | RETAIL - 4.2% | | | | | | | | | | |
| | 900,000 | | | Dollar General Corp. | | | 3.2500 | | | 4/15/2023 | | | 916,374 | |
| | | | | | | | | | | | | | | |
| | | | | TELECOMMUNICATIONS - 2.3% | | | | | | | | | | |
| | 500,000 | | | AT&T, Inc. | | | 3.0000 | | | 6/30/2022 | | | 504,957 | |
| | | | | | | | | | | | | | | |
| | | | | TOTAL CORPORATE BONDS
(Cost - $4,811,631) | | | | | | | | | 4,913,854 | |
| | | | | | | | | | | | | | | |
The accompanying notes are an integral part of these financial statements.
| Two Oaks Diversified Growth and Income Fund | |
| SCHEDULE OF INVESTMENTS (Continued) | March 31, 2020 |
| Principal Amount | | | Security | | Coupon Rate (%) | | | Maturity Date | | Fair Value | |
| Shares | | | | | | | | | | | | | |
| | | | | CLOSED-END FUNDS - 1.4% | | | | | | | |
| | 22,000 | | | Tortoise Energy Infrastructure Corp. | | | | | $ | 56,320 | |
| | 25,000 | | | Tortoise Essential Assets Income Term Fund | | | | | | 252,500 | |
| | | | | TOTAL CLOSED-END FUNDS
(Cost - $732,665) | | | | | | 308,820 | |
| | | | | | | | | | | | | | | |
| | | | | | | | | | | | | | | |
| | | | | PREFERRED STOCK - 1.8% | | | | | | | |
| | | | | BANKS - 1.8% | | | | | | | | |
| | 300 | | | Wells Fargo & Co., 7.50% | | | | | | | 382,206 | |
| | | | | TOTAL PREFERRED STOCK
(Cost - $463,177) | | | | | | | |
| | | | | | | | | | | | | | | |
| | | | | SHORT-TERM INVESTMENTS - 8.4% | | | | | | | |
| | 1,844,249 | | | Dreyfus Institutional Preferred Government Money Market Fund Premier Shares, 0.39% (b) | | | 1,844,249 | |
| | | | | TOTAL SHORT-TERM INVESTMENTS
(Cost - $1,844,249) | | | | |
| | | | | | | | | | | | | | | |
| | | | | TOTAL INVESTMENTS - 99.7%
(Cost - $19,811,189) | | | $ | 21,777,659 | |
| | | | | CASH AND OTHER ASSETS LESS LIABILITIES - 0.3% | | | | | 56,279 | |
| | | | | NET ASSETS - 100.0% | | | | | | | | $ | 21,833,938 | |
| | | | | | | | | | | | | | | |
| * | Non Income Producing Security |
ADR - American Depositary Receipt
LP - Limited Partnership
PLC - Public Limited Company
REITS - Real Estate Investment Trusts
LIBOR - London Interbank Offered Rate
| (a) | Variable rate security; the rate shown represents the rate at March 31, 2020. |
| (b) | Money market fund; interest rate reflects the seven-day effective yield on March 31, 2020. |
The accompanying notes are an integral part of these financial statements.
| Two Oaks Diversified Growth and Income Fund | |
| STATEMENT OF ASSETS AND LIABILITIES | March 31, 2020 |
| Assets: | | | | |
| Investments in Securities at Fair Value (Cost $19,811,189) | | $ | 21,777,659 | |
| Cash | | | 14,916 | |
| Receivables: | | | | |
| Dividends and Interest | | | 78,530 | |
| Prepaid Expenses and Other Assets | | | 5,790 | |
| Total Assets | | | 21,876,895 | |
| | | | | |
| Liabilities: | | | | |
| Payables: | | | | |
| Accrued Advisory Fees | | | 12,011 | |
| Accrued Distribution Fees | | | 5,005 | |
| Payable to Related Parties | | | 8,781 | |
| Payable to Trustees | | | 7,173 | |
| Accrued Expenses and Other Liabilities | | | 9,987 | |
| Total Liabilities | | | 42,957 | |
| | | | | |
| Net Assets | | $ | 21,833,938 | |
| | | | | |
| Class A Shares: | | | | |
| Net Asset Value and Redemption Price Per Share ($0 par value, unlimited shares authorized) ($21,833,938/2,016,951 shares) | | $ | 10.83 | |
| | | | | |
| Maximum Offering Price Per Share ($10.83/0.9425) | | $ | 11.49 | |
| | | | | |
| Composition of Net Assets: | | | | |
| At March 31, 2020, Net Assets consisted of: | | | | |
| Paid-in-Capital | | | 21,360,638 | |
| Accumulated Earnings | | | 473,300 | |
| Net Assets | | $ | 21,833,938 | |
| | | | | |
The accompanying notes are an integral part of these financial statements.
| Two Oaks Diversified Growth and Income Fund | For the Year Ended |
| STATEMENT OF OPERATIONS | March 31, 2020 |
| Investment Income: | | | | |
| Dividend Income net of foreign taxes of $1,607 | | $ | 570,210 | |
| Interest Income | | | 173,968 | |
| Total Investment Income | | | 744,178 | |
| | | | | |
| Expenses: | | | | |
| Investment Advisory Fees | | | 168,355 | |
| Distribution Fees - Class A | | | 70,148 | |
| Administration Fees | | | 38,186 | |
| Transfer Agent Fees | | | 30,468 | |
| Trustee Fees | | | 28,076 | |
| Legal Fees | | | 24,917 | |
| Chief Compliance Officer Fees | | | 21,606 | |
| Fund Accounting Fees | | | 18,665 | |
| Audit Fees | | | 17,998 | |
| Printing Expenses | | | 12,008 | |
| Registration & Filing Fees | | | 10,468 | |
| Third Party Administrative Servicing Fees | | | 7,329 | |
| Custody Fees | | | 3,974 | |
| Insurance Expense | | | 2,447 | |
| Miscellaneous Expense | | | 2,006 | |
| Total Expenses | | | 456,651 | |
| Net Investment Income | | | 287,527 | |
| | | | | |
| Net Realized and Unrealized Loss on Investments: | | | | |
| Net Realized Loss From Security Transactions | | | (1,529,527 | ) |
| Net Change in Net Unrealized Appreciation (Depreciation) on Investments | | | (2,247,985 | ) |
| Net Realized and Unrealized Loss on Investments | | | (3,777,512 | ) |
| | | | | |
| Net Decrease in Net Assets Resulting From Operations | | $ | (3,489,985 | ) |
| | | | | |
The accompanying notes are an integral part of these financial statements.
| Two Oaks Diversified Growth and Income Fund |
| STATEMENTS OF CHANGES IN NET ASSETS |
| | | Year Ended | | | Year Ended | |
| | | March 31, 2020 | | | March 31, 2019 | |
| Operations: | | | | | | | | |
| Net Investment Income | | $ | 287,527 | | | $ | 311,228 | |
| Net Realized Gain (Loss) From Security Transactions | | | (1,529,527 | ) | | | 1,187,987 | |
| Net Change in Net Unrealized Appreciation (Depreciation) on Investments | | | (2,247,985 | ) | | | (403,289 | ) |
| Net Increase (Decrease) in Net Assets Resulting From Operations | | | (3,489,985 | ) | | | 1,095,926 | |
| | | | | | | | | |
| Dividends and Distributions to Shareholders From: | | | | | | | | |
| Total Distributions Paid | | | | | | | | |
| Class A ($0.35 and $0.77 per share, respectively) | | | (715,780 | ) | | | (1,533,633 | ) |
| Total Distributions to Shareholders | | | (715,780 | ) | | | (1,533,633 | ) |
| | | | | | | | | |
| Capital Share Transactions: | | | | | | | | |
| Class A: | | | | | | | | |
| Proceeds from Shares Issued (110,460 and 102,017 shares, respectively) | | | 1,509,201 | | | | 1,317,319 | |
| Reinvestment of Dividends (52,115 and 122,896 shares, respectively) | | | 714,118 | | | | 1,529,988 | |
| Cost of Shares Redeemed (269,803 and 207,764 shares, respectively) | | | (3,567,034 | ) | | | (2,747,335 | ) |
| Total Capital Share Transactions | | | (1,343,715 | ) | | | 99,972 | |
| | | | | | | | | |
| Total Decrease in Net Assets | | | (5,549,480 | ) | | | (337,735 | ) |
| | | | | | | | | |
| Net Assets: | | | | | | | | |
| Beginning of Year | | | 27,383,418 | | | | 27,721,153 | |
| End of Year | | $ | 21,833,938 | | | $ | 27,383,418 | |
| | | | | | | | | |
The accompanying notes are an integral part of these financial statements.
| Two Oaks Diversified Growth and Income Fund |
| FINANCIAL HIGHLIGHTS |
| |
| The table below sets forth financial data for one share of capital stock outstanding throughout each year presented. |
| | | Class A (a) | |
| | | | | | | | | | | | | | | | |
| | | For the Year Ended March 31, | |
| | | 2020 | | | 2019 | | | 2018 | | | 2017 | | | 2016 | |
| | | | | | | | | | | | | | | | |
| Net Asset Value, Beginning of Year | | $ | 12.89 | | | $ | 13.16 | | | $ | 13.02 | | | $ | 11.52 | | | $ | 12.04 | |
| | | | | | | | | | | | | | | | | | | | | |
| From Operations: | | | | | | | | | | | | | | | | | | | | |
| Net investment income (b) | | | 0.14 | | | | 0.15 | | | | 0.12 | | | | 0.11 | | | | 0.20 | |
| Net gain (loss) from securities (both realized and unrealized) | | | (1.85 | ) | | | 0.35 | | | | 0.51 | | | | 1.57 | | | | (0.25 | ) |
| Total from operations | | | (1.71 | ) | | | 0.50 | | | | 0.63 | | | | 1.68 | | | | (0.05 | ) |
| | | | | | | | | | | | | | | | | | | | | |
| Distributions to shareholders from | | | | | | | | | | | | | | | | | | | | |
| Net investment income | | | (0.09 | ) | | | (0.16 | ) | | | (0.13 | ) | | | (0.18 | ) | | | (0.16 | ) |
| Net realized gains | | | (0.26 | ) | | | (0.61 | ) | | | (0.36 | ) | | | — | | | | (0.28 | ) |
| Return of capital | | | — | | | | — | | | | — | | | | — | | | | (0.03 | ) |
| Total distributions | | | (0.35 | ) | | | (0.77 | ) | | | (0.49 | ) | | | (0.18 | ) | | | (0.47 | ) |
| | | | | | | | | | | | | | | | | | | | | |
| Net Asset Value, End of Year | | $ | 10.83 | | | $ | 12.89 | | | $ | 13.16 | | | $ | 13.02 | | | $ | 11.52 | |
| | | | | | | | | | | | | | | | | | | | | |
| Total Return (c) | | | (13.81 | )% | | | 4.05 | % | | | 4.70 | % | | | 14.63 | % | | | (0.31 | )% |
| | | | | | | | | | | | | | | | | | | | | |
| Ratios/Supplemental Data | | | | | | | | | | | | | | | | | | | | |
| Net assets, end of year (in 000’s) | | $ | 21,834 | | | $ | 27,383 | | | $ | 27,721 | | | $ | 24,940 | | | $ | 22,059 | |
| Ratio of expenses to average net assets, | | | | | | | | | | | | | | | | | | | | |
| before recapture (d) | | | 1.63 | % | | | 1.69 | % | | | 1.70 | % | | | 1.75 | % | | | 1.81 | % |
| net of recapture (d) | | | 1.63 | % | | | 1.69 | % | | | 1.75 | % (e) | | | 1.75 | % | | | 1.75 | % |
| Ratio of net investment income to average net assets (d) | | | 1.03 | % | | | 1.13 | % | | | 0.86 | % | | | 0.90 | % | | | 1.71 | % |
| Portfolio turnover rate | | | 7 | % | | | 15 | % | | | 22 | % | | | 24 | % | | | 28 | % |
| | | | | | | | | | | | | | | | | | | | | |
| (a) | Class C shares were merged into Class A on May 20, 2017. The amounts presented represent the results of the Class A shares for the periods prior to the merger and the results of the combined share class for the period subsequent to the merger. |
| (b) | Per share amounts are calculated using the average shares method, which more appropriately presents the per share data for each year. |
| (c) | Total returns are historical in nature and assume changes in share price, reinvestment of dividends and capital gains distributions, if any, and do not assume the effects of any sales charges. Had the Adviser not waived a portion of its fee during 2016-2017, total returns would have been lower. |
| (d) | Does not include expenses of the investment companies in which the Fund invests. |
| (e) | Inclusive of Adviser’s recapture of waived/reimbursed fees from prior periods. |
The accompanying notes are an integral part of these financial statements.
| Two Oaks Diversified Growth and Income Fund | |
| NOTES TO FINANCIAL STATEMENTS | March 31, 2020 |
Two Oaks Diversified Growth and Income Fund (the “Fund”) is a diversified series of Northern Lights Fund Trust II (the “Trust”), a Delaware statutory trust organized on August 26, 2010. The Fund is registered under the Investment Company Act of 1940, as amended (the “Act”), as an open-end management investment company. The Fund commenced operations on April 15, 2002. The investment objective of the Fund is long-term growth of capital and income.
The Fund currently offers Class A shares. Class A shares are offered at net asset value plus a maximum sales charge of 5.75%.
| 2. | SUMMARY OF SIGNIFICANT ACCOUNTING POLICIES |
The following is a summary of significant accounting policies followed by the Fund in preparation of the financial statements. These policies are in conformity with accounting principles generally accepted in the United States of America (“GAAP”). The preparation of financial statements requires management to make estimates and assumptions that affect the reported amounts of assets and liabilities and disclosure of contingent assets and liabilities at the date of the financial statements and the reported amounts of income and expenses for the period. Actual results could differ from those estimates. The Fund is an investment company and accordingly follows the investment company accounting and reporting guidance of the Financial Accounting Standards Board (FASB) Accounting Standard Codification Topic 946 “Financial Services – Investment Companies” including FASB Accounting Standard Update ASU 2013-08.
Security valuation – Securities listed on an exchange are valued at the last reported sale price at the close of the regular trading session of the primary exchange on the business day the value is being determined, or in the case of securities listed on NASDAQ at the NASDAQ Official Closing Price (“NOCP”). In the absence of a sale such securities shall be valued at the mean between the current bid and ask prices on the day of valuation. Debt securities (other than short-term obligations) are valued each day by an independent pricing service approved by the Board of Trustees (the “Board”) based on methods which include consideration of: yields or prices of securities of comparable quality, coupon, maturity and type, indications as to values from dealers, and general market conditions or market quotations from a major market maker in the securities. The independent pricing service does not distinguish between smaller-sized bond positions known as “odd lots” and larger institutional-sized bond positions known as “round lots”. The Fund may fair value a particular bond if the adviser does not believe that the round lot value provided by the independent pricing service reflects fair value of the Fund’s holding. Investments valued in currencies other than the U.S. dollar are converted to U.S. dollars using exchange rates obtained from pricing services. Short-term debt obligations having 60 days or less remaining until maturity, at time of purchase, may be valued at amortized cost.
The Fund may invest in portfolios of open-end or closed-end investment companies (the “underlying funds”). Open-end underlying funds are valued at their respective net asset values as reported by such investment companies. The underlying funds value securities in their portfolios for which market quotations are readily available at their market values (generally the last reported sale price) and all other securities and assets at their fair value by the methods established by the Boards of the underlying funds. The shares of many closed-end investment companies, after their initial public offering, frequently trade at a price per share, which is different than the net asset value per share. The difference represents a market premium or market discount of such shares. There can be no assurances that the market discount or market premium on shares of any closed-end investment company purchased by the Fund will not change.
The Fund may hold securities, such as private investments, interests in commodity pools, other non-traded securities or temporarily illiquid securities, for which market quotations are not readily available or are determined to be unreliable. These securities will be valued using the “fair value” procedures approved by the Board. The Board has delegated execution of these procedures to a fair value committee composed of one or more representatives from each of the (i) Trust, (ii) administrator, and (iii) adviser. The committee may also enlist third party consultants such as a valuation specialist at a public accounting firm, valuation consultant, or financial officer of a security issuer on an as-needed basis to assist in determining a security-specific fair value. The Board has also engaged a third-party valuation firm to attend valuation meetings held by the trust, review minutes of such meetings, and report to the Board on a quarterly basis. The Board reviews and ratifies the execution of this process and the resultant fair value prices at least quarterly to assure the process produces reliable results.
Fair Valuation Process. As noted above, the fair value committee is composed of one or more representatives from each of the (i) Trust, (ii) administrator, and (iii) adviser. The applicable investments are valued collectively via inputs from each of these groups. For example, fair value determinations are required for the following securities: (i) securities for which market quotations are insufficient or not readily available on a particular business day (including securities for which there is a short and temporary lapse in the provision of a price by the regular pricing source), (ii) securities for which, in the judgment of the adviser, the prices or values available do not represent the fair value of the instrument. Factors which may cause the adviser to make such a judgment include, but are not limited to, the following: only a bid price or an asked price is available; the spread between
| Two Oaks Diversified Growth and Income Fund | |
| NOTES TO FINANCIAL STATEMENTS (Continued) | March 31, 2020 |
bid and asked prices is substantial; the frequency of sales; the thinness of the market; the size of reported trades; and actions of the securities markets, such as the suspension or limitation of trading; (iii) securities determined to be illiquid; (iv) securities with respect to which an event that will affect the value thereof has occurred (a “significant event”) since the closing prices were established on the principal exchange on which they are traded, but prior to a Fund’s calculation of its net asset value. Specifically, interests in commodity pools or managed futures pools are valued on a daily basis by reference to the closing market prices of each futures contract or other asset held by a pool, as adjusted for pool expenses. Restricted or illiquid securities, such as private investments or non-traded securities are valued via inputs from the adviser based upon the current bid for the security from two or more independent dealers or other parties reasonably familiar with the facts and circumstances of the security (who should take into consideration all relevant factors as may be appropriate under the circumstances). If the adviser is unable to obtain a current bid from such independent dealers or other independent parties, the fair value committee shall determine the fair value of such security using the following factors: (i) the type of security; (ii) the cost at date of purchase; (iii) the size and nature of the Fund’s holdings; (iv) the discount from market value of unrestricted securities of the same class at the time of purchase and subsequent thereto; (v) information as to any transactions or offers with respect to the security; (vi) the nature and duration of restrictions on disposition of the security and the existence of any registration rights; (vii) how the yield of the security compares to similar securities of companies of similar or equal creditworthiness; (viii) the level of recent trades of similar or comparable securities; (ix) the liquidity characteristics of the security; (x) current market conditions; and (xi) the market value of any securities into which the security is convertible or exchangeable.
The Fund utilizes various methods to measure the fair value of most of its investments on a recurring basis. GAAP establishes a hierarchy that prioritizes inputs to valuation methods. The three levels of input are:
Level 1 – Unadjusted quoted prices in active markets for identical assets and liabilities that the Fund has the ability to access.
Level 2 – Observable inputs other than quoted prices included in level 1 that are observable for the asset or liability, either directly or indirectly. These inputs may include quoted prices for the identical instrument in an inactive market, prices for similar instruments, interest rates, prepayment speeds, credit risk, yield curves, default rates and similar data.
Level 3 – Unobservable inputs for the asset or liability, to the extent relevant observable inputs are not available, representing the Fund’s own assumptions about the assumptions a market participant would use in valuing the asset or liability, and would be based on the best information available.
The availability of observable inputs can vary from security to security and is affected by a wide variety of factors, including, for example, the type of security, whether the security is new and not yet established in the marketplace, the liquidity of markets, and other characteristics particular to the security. To the extent that valuation is based on models or inputs that are less observable or unobservable in the market, the determination of fair value requires more judgment. Accordingly, the degree of judgment exercised in determining fair value is greatest for instruments categorized in Level 3.
The inputs used to measure fair value may fall into different levels of the fair value hierarchy. In such cases, for disclosure purposes, the level in the fair value hierarchy within which the fair value measurement falls in its entirety, is determined based on the lowest level input that is significant to the fair value measurement in its entirety.
The inputs or methodology used for valuing securities are not necessarily an indication of the risk associated with investing in those securities. The following table summarizes the inputs used as of March 31, 2020 for the Fund’s assets measured at fair value:
| Assets* | | Level 1 | | | Level 2 | | | Level 3 | | | Total | |
| Common Stock | | $ | 10,391,408 | | | $ | — | | | $ | — | | | $ | 10,391,408 | |
| REITS | | | 3,937,122 | | | | — | | | | — | | | | 3,937,122 | |
| Corporate Bonds | | | — | | | | 4,913,854 | | | | — | | | | 4,913,854 | |
| Closed-End Funds | | | 308,820 | | | | — | | | | — | | | | 308,820 | |
| Preferred Stock | | | 382,206 | | | | — | | | | — | | | | 382,206 | |
| Short-Term Investments | | | 1,844,249 | | | | — | | | | — | | | | 1,844,249 | |
| Total | | $ | 16,863,805 | | | $ | 4,913,854 | | | $ | — | | | $ | 21,777,659 | |
The Fund did not hold any Level 3 securities during the period.
| * | Please refer to the Schedule of Investments for industry classifications. |
Security transactions and related income –Security transactions are accounted for on trade date. Interest income is recognized on an accrual basis. Discounts are accreted and premiums are amortized on securities purchased over the lives of the respective securities. Dividend income is recorded on the ex-dividend date. Realized gains or losses from sales of securities are determined
| Two Oaks Diversified Growth and Income Fund | |
| NOTES TO FINANCIAL STATEMENTS (Continued) | March 31, 2020 |
by comparing the identified cost of the security lot sold with the net sales proceeds. Withholding taxes on foreign dividends have been provided for in accordance with the Fund’s understanding of the applicable country’s tax rules and rates.
Distributions received from investments in securities that represent a return of capital or capital gain are recorded as a reduction of cost of investment or as a realized gain, respectively. The calendar year-end amounts of ordinary income, capital gains, and return of capital included in distributions received from the Fund’s investments in real estate investment trusts (“REITS”) and master limited partnerships (“MLPS”) are reported to the Fund after the end of the calendar year; accordingly, the Fund estimates these amounts for accounting purposes until the characterization of REIT and MLP distributions is reported to the Fund after the end of the calendar year. Estimates are based on the most recent REIT and MLP distribution information available.
Dividends and distributions to shareholders –Dividends from net investment income, if any, are declared and paid quarterly. Distributable net realized capital gains, if any, are declared and distributed annually. Dividends from net investment income and distributions from net realized gains are determined in accordance with federal income tax regulations, which may differ from GAAP, and are recorded on the ex-dividend date. These “book/tax” differences are considered either temporary (e.g., deferred losses, capital loss carryforwards) or permanent in nature. To the extent these differences are permanent in nature, such amounts are reclassified within the composition of net assets based on their federal tax-basis treatment; temporary differences do not require reclassification. Any such reclassifications will have no effect on net assets, results of operations, or net asset values per share of the Fund.
Federal income tax – The Fund intends to continue to comply with the requirements of the Internal Revenue Code applicable to regulated investment companies and to distribute all of its taxable income to shareholders. Therefore, no provision for Federal income tax is required.
The Fund recognizes the tax benefits of uncertain tax positions only where the position is “more likely than not” to be sustained assuming examination by tax authorities. Management has analyzed the Fund’s tax positions and has concluded that no liability for unrecognized tax benefits should be recorded related to uncertain tax positions taken on returns filed for open tax years ended March 31, 2017 to March 31, 2019, or expected to be taken in the Fund’s March 31, 2020 year-end tax returns. The Fund identified its major tax jurisdictions as U.S. Federal, Ohio and foreign jurisdictions where the Fund makes significant investments; however, the Fund is not aware of any tax positions for which it is reasonably possible that the total amounts of unrecognized tax benefits will change materially in the next twelve months. The Fund recognizes interest and penalties, if any, related to unrecognized tax benefits as income tax expense in the Statement of Operations. During the year, the Fund did not incur any interest or penalties.
Foreign Currency –The accounting records of the Fund are maintained in U.S. dollars. Investment securities and other assets and liabilities denominated in a foreign currency, and income receipts and expense payments are translated into U.S. dollars using the prevailing exchange rate at the London market close. Purchases and sales of securities are translated into U.S. dollars at the contractual currency rates established at the approximate time of the trade. Net realized gains and losses on foreign currency transactions represent net gains and losses from currency realized between the trade and settlement dates on securities transactions and the difference between income accrued versus income received. The effects of changes in foreign currency exchange rates on investments in securities are included with the net realized and unrealized gain or loss on investment securities.
Expenses – Expenses of the Trust that are directly identifiable to a specific Fund are charged to that Fund. Expenses, which are not readily identifiable to a specific Fund, are allocated in such a manner as deemed equitable, taking into consideration the nature and type of expense and the relative sizes of the funds in the Trust.
Indemnification –The Trust indemnifies its officers and trustees for certain liabilities that may arise from the performance of their duties to the Trust. Additionally, in the normal course of business, the Fund enters into contracts that contain a variety of representations and warranties and which provide general indemnities. The Fund’s maximum exposure under these arrangements is unknown, as this would involve future claims that may be made against the Fund that have not yet occurred. However, based on experience, the risk of loss due to these warranties and indemnities appears to be remote.
| 3. | INVESTMENT ADVISORY AGREEMENT AND TRANSACTIONS WITH RELATED PARTIES |
Pursuant to the Investment Advisory Agreement (the “Advisory Agreement”), investment advisory services are provided to the Fund by Two Oaks Investment Management, LLC (the “Adviser”). Under the terms of the Advisory Agreement, the Adviser
| Two Oaks Diversified Growth and Income Fund | |
| NOTES TO FINANCIAL STATEMENTS (Continued) | March 31, 2020 |
receives monthly fees calculated at an annual rate of 0.60% of the average daily net assets of the Fund. For the year ended March 31, 2020, the Adviser earned advisory fees of $168,355.
The Trust, on behalf of the Fund, has adopted the Trust’s Master Distribution and shareholder serving plan (the “Plan”) pursuant to Rule 12b-1 under the 1940 Act. The Plan provides that a monthly service and/or distribution fee is calculated by the Fund at an annual rate of 0.25% of the average daily net assets attributable to the Class A shares and is paid to Northern Lights Distributors, LLC (the “Distributor”) to provide compensation for ongoing distribution-related activities or services and/or maintenance of the Fund’s shareholder accounts, not otherwise required to be provided by the Adviser. The Plan is a compensation plan, which means that compensation is provided regardless of 12b-1 expenses incurred.
The Plan further provides for periodic payments to brokers, dealers and other financial intermediaries, for providing shareholder services and for promotional and other sales-related costs. For the year ended March 31, 2020, the Fund paid distribution fees of $70,148.
The Distributor acts as the Fund’s principal underwriter in a continuous public offering of the Funds’ shares. For the year ended March 31, 2020, the Distributor received $25,946 in underwriting commissions for sales of shares, of which $5,451 was retained by the principal underwriter.
In addition, certain affiliates of the Distributor provide services to the Fund as follows:
Gemini Fund Services, LLC (“GFS”), an affiliate of the Distributor, provides administration, fund accounting, and transfer agent services to the Trust. Pursuant to separate servicing agreements with GFS, the Fund pays GFS customary fees for providing administration, fund accounting, and transfer agency services to the Fund. Certain officers of the Trust are also officers of GFS, and are not paid any fees directly by the Fund for serving in such capacities.
Northern Lights Compliance Services, LLC (“NLCS”) – NLCS, an affiliate of GFS and the Distributor, provides a Chief Compliance Officer to the Trust, as well as related compliance services, pursuant to a consulting agreement between NLCS and the Trust. Under the terms of such agreement, NLCS receives customary fees from the Fund.
Blu Giant, LLC (“Blu Giant”) – Blu Giant, an affiliate of GFS and the Distributor, provides EDGAR conversion and filing services as well as print management services for the Fund on an ad-hoc basis. For the provision of these services, Blu Giant receives customary fees from the Fund.
Effective February 1, 2019, NorthStar Financial Services Group, LLC, the parent company of GFS and its affiliated companies including NLD, NLCS and Blu Giant (collectively, the “Gemini Companies”), sold its interest in the Gemini Companies to a third party private equity firm that contemporaneously acquired Ultimus Fund Solutions, LLC (an independent mutual fund administration firm) and its affiliates (collectively, the “Ultimus Companies”). As a result of these separate transactions, the Gemini Companies and the Ultimus Companies are now indirectly owned through a common parent entity, The Ultimus Group, LLC.
| 4. | INVESTMENT TRANSACTIONS |
The cost of purchases and proceeds from the sale of securities, other than short-term securities, for the year ended March 31, 2020 amounted to $1,887,697 and $3,979,661, respectively.
| 5. | AGGREGATE UNREALIZED APPRECIATION AND DEPRECIATION – TAX BASIS |
The identified cost of investments in securities owned by the Fund for federal income tax purposes, and its respective gross unrealized appreciation and depreciation at March 31, 2020, were as follows:
| | | | Gross Unrealized | | | Gross Unrealized | | | Net Unrealized | |
| Tax Cost | | | Appreciation | | | (Depreciation) | | | Appreciation | |
| $ | 19,715,387 | | | $ | 4,424,139 | | | $ | (2,361,867 | ) | | $ | 2,062,272 | |
| Two Oaks Diversified Growth and Income Fund | |
| NOTES TO FINANCIAL STATEMENTS (Continued) | March 31, 2020 |
| 6. | DISTRIBUTIONS TO SHAREHOLDERS AND TAX COMPONENTS OF CAPITAL |
The tax character of fund distributions paid for the years ended March 31, 2020 and March 31, 2019 was as follows:
| | | Fiscal Year Ended | | | Fiscal Year Ended | |
| | | March 31, 2020 | | | April 1, 2019 | |
| Ordinary Income | | $ | 289,966 | | | $ | 340,858 | |
| Long-Term Capital Gain | | | 425,814 | | | | 1,192,775 | |
| | | $ | 715,780 | | | $ | 1,533,633 | |
As of March 31, 2020, the components of accumulated earnings/ (deficit) on a tax basis were as follows:
| Undistributed | | | Undistributed | | | Post October Loss | | | Capital Loss | | | Other | | | Unrealized | | | Total | |
| Ordinary | | | Long-Term | | | and | | | Carry | | | Book/Tax | | | Appreciation/ | | | Accumulated | |
| Income | | | Gains | | | Late Year Loss | | | Forwards | | | Differences | | | (Depreciation) | | | Earnings/(Deficits) | |
| $ | 19,510 | | | $ | — | | | $ | (1,608,482 | ) | | $ | — | | | $ | — | | | $ | 2,062,272 | | | $ | 473,300 | |
Capital losses incurred after October 31 within the fiscal year are deemed to arise on the first business day of the following fiscal year for tax purposes. The Fund incurred and elected to defer such capital losses of $1,608,482.
The difference between book basis and tax basis unrealized appreciation and undistributed ordinary income is primarily attributable to tax adjustments for partnerships, and C-Corporation return of capital distributions.
| 7. | NEW ACCOUNTING PRONOUNCEMENTS |
In August 2018, FASB issued Change to Accounting Standards Update (ASU) No. 2018-13, which changed certain fair value measurement disclosure requirements. The ASU, in addition to other modifications and additions, removed the requirement to disclose the amount and reasons for transfers between Level 1 and Level 2 of the fair value hierarchy, and the policy for the timing of transfers between levels. For investment companies, the amendments are effective for financial statements issued for fiscal years beginning after December 15, 2019, and interim periods within those fiscal years. Early adoption is allowed, and the Fund has adopted this amendment early.
Subsequent events after the date of the Statement of Assets and Liabilities have been evaluated through the date the financial statements were issued. Management has determined that no events or transactions occurred requiring adjustment or disclosure in the financial statements.

REPORT OF INDEPENDENT REGISTERED PUBLIC ACCOUNTING FIRM
To the Shareholders of Two Oaks Diversified Growth and Income Fund and
Board of Trustees of Northern Lights Fund Trust II
Opinion on the Financial Statements
We have audited the accompanying statement of assets and liabilities, including the schedule of investments, of Two Oaks Diversified Growth and Income Fund (the “Fund”), a series of Northern Lights Fund Trust II, as of March 31, 2020, the related statement of operations for the year then ended, the statements of changes in net assets for each of the two years in the period then ended, including the related notes, and the financial highlights for each of the five years in the period then ended (collectively referred to as the “financial statements”). In our opinion, the financial statements present fairly, in all material respects, the financial position of the Fund as of March 31, 2020, the results of its operations for the year then ended, the changes in its net assets for each of the two years in the period then ended, and the financial highlights for each of the five years in the period then ended, in conformity with accounting principles generally accepted in the United States of America.
Basis for Opinion
These financial statements are the responsibility of the Fund’s management. Our responsibility is to express an opinion on the Fund’s financial statements based on our audits. We are a public accounting firm registered with the Public Company Accounting Oversight Board (United States) (“PCAOB”) and are required to be independent with respect to the Fund in accordance with the U.S. federal securities laws and the applicable rules and regulations of the Securities and Exchange Commission and the PCAOB.
We conducted our audits in accordance with the standards of the PCAOB. Those standards require that we plan and perform the audit to obtain reasonable assurance about whether the financial statements are free of material misstatement whether due to error or fraud.
Our audits included performing procedures to assess the risks of material misstatement of the financial statements, whether due to error or fraud, and performing procedures that respond to those risks. Such procedures included examining, on a test basis, evidence regarding the amounts and disclosures in the financial statements. Our procedures included confirmation of securities owned as of March 31, 2020, by correspondence with the custodian. Our audits also included evaluating the accounting principles used and significant estimates made by management, as well as evaluating the overall presentation of the financial statements. We believe that our audits provide a reasonable basis for our opinion.
We have served as the Fund’s auditor since 2004.

COHEN & COMPANY, LTD.
Cleveland, Ohio
May 28, 2020
C O H E N & C O M P A N Y , L T D .
800.229.1099|866.818.4538 fax| cohencpa.com
Registered with the Public Company Accounting Oversight Board
FACTORS CONSIDERED BY THE TRUSTEES WITH THE APPROVAL OF THE RENEWAL OF THE INVESTMENT ADVISORY AGREEMENT
At a Meeting (the “Meeting”) of the Board of Trustees (the “Board”) of Northern Lights Fund Trust II (the “Trust”) held on July 25 and 26, 2019, the Board, including the disinterested Trustees (the “Independent Trustees”), considered the renewal of an Investment Advisory Agreement between the Trust, on behalf of the Two Oaks Diversified Growth and Income Fund (“Two Oaks”), and Two Oaks Investment Management, LLC (“TOIM”) (“Two Oaks Advisory Agreement”).
Based on their evaluation of the information provided by TOIM, in conjunction with Two Oaks’ other service providers, the Board, by a unanimous vote (including a separate vote of the Independent Trustees), approved the renewal of the Two Oaks Advisory Agreement with respect to Two Oaks.
In advance of the Meeting, the Board requested and received materials to assist them in considering the Two Oaks Advisory Agreement. The materials provided contained information with respect to the factors enumerated below, including the Two Oaks Advisory Agreement, a memorandum prepared by the Independent Trustees legal counsel discussing in detail the Trustees’ fiduciary obligations and the factors they should assess in considering the renewal of the Two Oaks Advisory Agreement and comparative information relating to the advisory fee and other expenses of Two Oaks. The materials also included due diligence materials relating to TOIM (including due diligence questionnaire completed by TOIM, TOIM’s Forms ADV, select financial information of TOIM, bibliographic information regarding TOIM’s key management and investment advisory personnel, and comparative fee information relating to Two Oaks) and other pertinent information. At the Meeting, the Independent Trustees were advised by counsel that is experienced in Investment Company Act of 1940 matters and that is independent of fund management and met with such counsel separately from fund management.
The Board reviewed and discussed the written materials that were provided in advance of the Meeting and deliberated on the renewal of the Two Oaks Advisory Agreement. The Board relied upon the advice of independent legal counsel and their own business judgment in determining the material factors to be considered in evaluating the Two Oaks Advisory Agreement and the weight to be given to each such factor. The conclusions reached by the Board were based on a comprehensive evaluation of all of the information provided and were not the result of any one factor. Moreover, each Trustee may have afforded different weight to the various factors in reaching his conclusions with respect to the Two Oaks Advisory Agreement. In considering the renewal of the Two Oaks Advisory Agreement, the Board reviewed and analyzed various factors that they determined were relevant, including the factors enumerated below.
Nature, Extent and Quality of Services. The Board reviewed materials provided by TOIM related to the proposed renewal of the Two Oaks Advisory Agreement, including TOIM’s ADV, a description of the manner in which investment decisions are made and executed and a review of the professional personnel performing services for Two Oaks, including the individuals that primarily monitor and execute the investment process. The Board discussed the extent of TOIM’s research capabilities, the quality of its compliance infrastructure and the experience of its Fund management personnel. Additionally, the Board received satisfactory responses from representatives of TOIM with respect to a series of important questions, including: whether TOIM was involved in any lawsuits or pending regulatory actions; whether TOIM’s management of other accounts would conflict with its management of Two Oaks; and whether TOIM has procedures in place to adequately allocate trades among its respective clients. The Board reviewed the description provided by TOIM of its practices for monitoring compliance with Two Oaks’ investment limitations, noting that TOIM’s CCO would continually review the portfolio managers’ performance of their duties to ensure compliance under TOIM’s compliance program. The Board also discussed TOIM’s compliance program with the CCO of the Trust. The Board noted that the CCO of the Trust continued to represent that TOIM’s policies and procedures were reasonably designed to prevent violations of applicable securities laws. The Board also noted TOIM’s representation that the prospectus and statement of additional information for Two Oaks accurately describe the investment strategies of Two Oaks. The Board then reviewed the capitalization of TOIM based on representations made by TOIM and concluded that TOIM was sufficiently well-capitalized, or that its control persons had the ability to make additional
contributions in order to meet its obligations to Two Oaks. The Board concluded that TOIM had sufficient quality and depth of personnel, resources, investment methods and compliance policies and procedures essential to performing its duties under the Two Oaks Advisory Agreement and that the nature, overall quality and extent of the management services to be provided by TOIM to Two Oaks were satisfactory.
Performance.The Board discussed the reports prepared by Broadridge and reviewed the performance of the Fund as compared to its peer group, Morningstar category and benchmark for the one year, three year, five year, and since inception periods ended June 30, 2019. The Board noted that Two Oaks had underperformed its peer group median and Morningstar category median for the one year, three year and since inception periods, underperformed its Morningstar category median and benchmark but outperformed its peer group median for the five year period. In reviewing Two Oaks’ performance, the Board noted that the Fund’s primary benchmark was the S&P 500 Index while a blended index, 60% of which is based on the S&P 500 Index and 40% on the Barclays U.S. Aggregate Bond Index was used as a secondary benchmark. The Board noted that the S&P 500 Index is a broad based equity securities index while the Fund is a blend of equities, fixed income and real estate/asset-based securities and the difficulty of finding an a appropriate benchmark for the Fund as the Fund’s allocation among asset classes varies from time to time. The Board noted that certain REIT investments had been a performance detractor and that inconsistent performance had hurt overall performance of the Fund. The Board discussed the risk assumed by the Fund although concluding that TOIM continues to execute the Fund’s strategy according to the prospectus. After considering other factors relating to TOIM’s and the portfolio managers’ track record, the Board concluded that the overall performance of Two Oaks was satisfactory.
Fees and Expenses. As to the costs of the services to be provided by TOIM, the Board reviewed and discussed the Two Oaks’ advisory fee and total operating expenses as compared to its peer group and Morningstar category as presented in the Broadridge Report noting that the 0.60% advisory fee is less than the Morningstar category average and peer group average of 0.65% and 0.64%, respectively. The Board also noted that, although its net total annual operating expenses are near the highest in its peer group, it was significantly lower than the highest such fee in its Morningstar category. After further discussion, the Board concluded that based on TOIM’s experience, expertise and services to Two Oaks, the advisory fee charged by TOIM was not unreasonable.
Profitability.The Board also considered the level of profits that could be expected to accrue to TOIM with respect to Two Oaks based on break even and profitability reports and analyses reviewed by the Board and the selected financial information provided by TOIM. After review and discussion, the Board concluded that, based on the services provided by TOIM and the current assets of the Fund, profits from TOIM’s relationship with Two Oaks were not excessive.
Economies of Scale. As to the extent to which Two Oaks will realize economies of scale as it grows, and whether the fee levels reflect these economies of scale for the benefit of investors, the Board discussed the current size of the Fund, TOIM’s expectations for growth of the Fund, and concluded that any material economies of scale would not be achieved in the near term.
Conclusion.The Board relied upon the advice of counsel, and their own business judgment in determining the material factors to be considered in evaluating the Two Oaks Advisory Agreement and the weight to be given to each such factor. Accordingly, having requested and received such information from TOIM as the Trustees believed to be reasonably necessary to evaluate the terms of the Two Oaks Advisory Agreement, and as assisted by the advice of independent counsel, the Board, including a majority of the Independent Trustees, unanimously concluded with respect to the Two Oaks Advisory Agreement, that (a) the terms of the Two Oaks Advisory Agreement are reasonable; (b) the advisory fee is reasonable; and (c) the Two Oaks Advisory Agreement is in the best interests of Two Oaks and its shareholders. In considering the renewal of the Two Oaks Advisory Agreement, the Trustees did not identify any one factor as all important, but rather considered these factors collectively and determined that approval of the renewal of the Two Oaks Advisory Agreement was in the best interests of Two Oaks and its shareholders. Moreover, the Board noted that each Trustee may have afforded different weight to the various factors in reaching his conclusions with respect to the Two Oaks Advisory Agreement.
| Two Oaks Diversified Growth and Income Fund | |
| FUND EXPENSES (Unaudited) | March 31, 2020 |
As a shareholder of the Fund you incur two types of costs: (1) transaction costs, including sales charges (loads) on purchase payments and (2) ongoing costs, including management fees; distribution and/or service (12b-1 fees) fees; and other Fund expenses. This Example is intended to help you understand your ongoing costs (in dollars) of investing in the Funds and to compare these costs with the ongoing costs of investing in other mutual funds.
This Example is based on an investment of $1,000 invested at the beginning of the period and held for the entire period as indicated below.
Actual Expenses: The first section of the table provides information about actual account values and actual expenses. You may use the information in this line, together with the amount you invested, to estimate the expenses that you paid over the period. Simply divide your account value by $1,000 (for example, an $8,600 account value divided by $1,000 = 8.6), then multiply the result by the number in the first line under the heading entitled “Expenses Paid During the Period” to estimate the expenses you paid on your account during the period.
Hypothetical Examples for Comparison Purposes: The second section of the table below provides information about hypothetical account values and hypothetical expenses based on the Fund’s actual expense ratio and an assumed rate of return of 5% per year before expenses, which is not the Fund’s actual return. The hypothetical account values and expenses may not be used to estimate the actual ending account balance or expenses you paid for the period. You may use this information to compare the ongoing costs of investing in the Funds and other funds. To do so, compare this 5% hypothetical example with the 5% hypothetical examples that appear in the shareholder reports of the other funds.
Please note that the expenses shown in the table are meant to highlight your ongoing costs only and do not reflect any transactional costs, such as sales charges (loads) or contingent deferred sales charges on redemptions. Therefore, the second line of the table is useful in comparing ongoing costs only, and will not help you determine the relative total costs of owning different funds. In addition, if these transactional costs were included, your costs would have been higher.
| | | | | | | | | |
| | | Beginning | | | | | | Expenses Paid |
| | | Account | | | | Expense | | During the |
| | | Value | | Ending Account Value | | Ratio | | Period* |
| | | (10/1/19) | | (3/31/20) | | (Annualized) | | (10/1/19-3/31/20) |
| Actual: | | | | | | | | |
| Class A | | $1,000.00 | | $810.90 | | 1.60% | | $7.24 |
| Hypothetical (5% return before expenses): | | | | | | | | |
| Class A | | $1,000.00 | | $1,017.00 | | 1.60% | | $8.07 |
| * | Expenses are equal to the Fund’s annualized expense ratio multiplied by the average account value over the period, multiplied by 183/366 (to reflect the one-half year period). |
| Two Oaks Diversified Growth and Income Fund |
| SUPPLEMENTAL INFORMATION (Unaudited) |
| March 31, 2020 |
The Trustees and the officers of the Trust are listed below with their present positions with the Trust and principal occupations over at least the last five years. The business address of each Trustee and Officer is 225 Pictoria Drive, Suite 450, Cincinnati, OH 45246. All correspondence to the Trustees and Officers should be directed to c/o Gemini Fund Services, LLC, P.O. Box 541150, Omaha, Nebraska 68154.
Independent Trustees
| | | | Number of | |
| | | | Portfolios in | |
| | | | Fund | |
| | | | Complex | Other Directorships held by |
| Name and | Position/Term of | Principal Occupation | Overseen by | Trustee |
| Year of Birth | Office* | During the Past Five Years | Trustee*** | During the Past Five Years |
Thomas T. Sarkany
1946 | Trustee Since October 2011 | President, TTS Consultants, LLC (financial services) (since 2010). | 1 | Director, Aquila Distributors; Trustee, Arrow ETF Trust; Trustee, Arrow Investments Trust; Trustee, Northern Lights Fund Trust IV |
Anthony H. Lewis
1946 | Trustee Since May 2011 | Chairman and CEO of The Lewis Group USA (executive consulting firm) (since 2007). | 1 | Director, Member of the Compensation Committee and Member of the Risk Committee of Torotel Inc. (Magnetics, Aerospace and Defense), Trustee, Chairman of the Fair Valuation Committee and Member of the Audit Committee of the Wildermuth Endowment Strategy Fund |
Keith Rhoades
1948 | Trustee Since May 2011 | Retired since 2008. | 1 | NONE |
Randal D. Skalla
1962 | Trustee Since May 2011 | President, L5 Enterprises, Inc. (financial services company) (since 2001). | 1 | Board Member, Orizon Investment Counsel (financial services company) (from 2001 to 2017) |
3/31/20 – NLII v2
| Two Oaks Diversified Growth and Income Fund |
| SUPPLEMENTAL INFORMATION (Unaudited)(Continued) |
| March 31, 2020 |
Interested Trustees and Officers
| | | | Number of | |
| | | | Portfolios in | |
| | | | Fund Complex | Other Directorships held by |
| Name and | Position/Term | Principal Occupation | Overseen by | Trustee |
| Year of Birth | of Office* | During the Past Five Years | Trustee*** | During the Past Five Years |
Brian Nielsen**
1972 | Trustee Since May 2011 | Trustee of Northern Lights Fund Trust II (since 2011); Special Projects Counsel of NorthStar Financial Services Group, LLC (from 2018 to 2019); Secretary of CLS Investments, LLC (from 2001 to 2018); Secretary of Orion Advisor Services, LLC (from 2001 to 2018); Manager (from 2012 to 2015), General Counsel and Secretary (from 2003 to 2018) of NorthStar Financial Services Group, LLC; CEO (from 2012 to 2018), Secretary (from 2003 to 2018) and Manager (from 2005 to 2018) of Northern Lights Distributors, LLC; Director, Secretary and General Counsel of Constellation Trust Company (from 2004 to 2018); CEO (from 2015 to 2018), Manager (from 2008 to 2015), General Counsel and Secretary (from 2011 to 2018) of Northern Lights Compliance Services, LLC; General Counsel and Secretary of Blu Giant, LLC (from 2011 to 2018); Secretary of Gemini Fund Services, LLC (from 2012 to 2018); Manager of Arbor Point Advisors, LLC (from 2012 to 2018); Secretary and General Counsel of NorthStar Holdings, LLC (from 2013 to 2015); Director, Secretary and General Counsel of NorthStar CTC Holdings, Inc. (from 2015 to 2018) and Secretary and Chief Legal Officer of AdvisorOne Funds (from 2003 to 2018). | 1 | Manager of Northern Lights Distributors, LLC (from 2005 to 2018); Manager of NorthStar Financial Services Group, LLC (from 2012 to 2015); Manager of Arbor Point Advisors, LLC (from 2012 to 2018); Director of Constellation Trust Company (from 2004 to 2018) |
Kevin E. Wolf
1969 | President Since January 2013 | Vice President of The Ultimus Group, LLC and Executive Vice President of Gemini Fund Services, LLC (since 2019), President, Gemini Fund Services, LLC (2012 - 2019). | N/A | N/A |
Richard Malinowski
1983 | Secretary Since January 2018 | Senior Vice President and Senior Managing Counsel, Gemini Fund Services, LLC, (since February 2020); Senior Vice President Legal Administration, Gemini Fund Services, LLC (since April 2017); Vice President and Counsel (April 2016 to 2017) and AVP and Staff Attorney (September 2012 to March 2016). | N/A | N/A |
Erik Naviloff
1968 | Treasurer Since January 2013 | Vice President of Gemini Fund Services, LLC (since 2011). | N/A | N/A |
Emile R. Molineaux
1962 | Chief Compliance Officer and Anti Money Laundering Officer Since May 2011 | Senior Compliance Officer and CCO of Various clients of Northern Lights Compliance Services, LLC (since 2011). | N/A | N/A |
| * | The term of office for each Trustee and Officer listed above will continue indefinitely. |
| ** | Brian Nielsen is an “interested person” of the Trust as that term is defined under the 1940 Act, because of his prior affiliation with Northern Lights Distributors, LLC (the Fund’s Distributor). |
| *** | As of March 31, 2020, the Trust was comprised of 20 active portfolios managed by unaffiliated investment advisers. The term “Fund Complex” applies only to the Fund, and not to any other series of the Trust. The Fund does not hold itself out as related to any other series within the Trust for investment purposes, nor does it share the same investment adviser with any other series. |
The Fund’s Statement of Additional Information (“SAI”) includes additional information about the Trustees and is available free of charge, upon request, by calling toll-free at 1-855-896-6257.
3/31/20 – NLII v2
Privacy Policy
Rev. May 2019
| FACTS | WHAT DOES NORTHERN LIGHTS FUND TRUST II (“NLFT II”) DO WITH YOUR PERSONAL INFORMATION? |
| Why? | Financial companies choose how they share your personal information. Federal law gives consumers the right to limit some but not all sharing. Federal law also requires us to tell you how we collect, share, and protect your personal information. Please read this notice carefully to understand what we do. |
| What? | The types of personal information we collect and share depend on the product or service you have with us. This information can include:
|
● Social Security number ● Employment information ● Account balances | ● Account transactions ● Income ● Investment experience |
When you are no longer our customer, we continue to share your information as described in this notice. |
| How? | All financial companies need to share a customer’s personal information to run their everyday business - to process transactions, maintain customer accounts, and report to credit bureaus. In the section below, we list the reasons financial companies can share their customer’s personal information; the reasons NLFT II chooses to share; and whether you can limit this sharing. |
| | |
| Reasons we can share your personal information | Does NLFT II
share? | Can you limit
this sharing? |
For our everyday business purposes —
such as to process your transactions, maintain your account(s), respond to court orders and legal investigations, or report to credit bureaus
| Yes | No |
For our marketing purposes —
to offer our products and services to you
| Yes | No |
For joint marketing with other financial companies
| Yes | No |
For our affiliates’ everyday business purposes —
information about your transactions and experiences
| Yes | No |
For our affiliates’ everyday business purposes —
information about your creditworthiness
| No | We don’t share |
For nonaffiliates to market to you
| No | We don’t share |
| Questions? | Call 1-402-493-4603 |
| Who we are |
| Who is providing this notice? | Northern Lights Fund Trust II |
| What we do |
| How does NLFT II protect my personal information? | To protect your personal information from unauthorized access and use, we use security measures that comply with federal law. These measures include computer safeguards and secured files and buildings.
|
| How does NLFT II collect my personal information? | We collect your personal information, for example, when you
|
● open an account ● give us your income information ● provide employment information | ● provide account information ● give us your contact information |
| We also collect your personal information from others, such as credit bureaus, affiliates, or other companies. |
| Why can’t I limit all sharing? | Federal law gives you the right to limit only ● sharing for affiliates’ everyday business purposes—information about your creditworthiness ● affiliates from using your information to market to you ● sharing for nonaffiliates to market to you State laws and individual companies may give you additional rights to limit sharing. |
| Definitions |
| Affiliates | Companies related by common ownership or control. They can be financial and nonfinancial companies. ● Northern Lights Fund Trust II has no affiliates. |
| Nonaffiliates | Companies not related by common ownership or control. They can be financial and nonfinancial companies. ● NLFT II does not share with nonaffiliates so they can market to you. |
| Joint marketing | A formal agreement between nonaffiliated financial companies that together market financial products and services to you. ● Our joint marketing partners include other financial service companies. |
| INVESTMENT ADVISOR |
| Two Oaks Investment Management, LLC |
| 597 Goshen Avenue |
| Clovis, CA 93611 |
| |
| ADMINISTRATOR |
| Gemini Fund Services, LLC |
| 4221 North 203rd Street, Suite 100 |
| Elkhorn, NE 68022 |
| |
How to Obtain Proxy Voting Information
Information regarding how the Fund votes proxies relating to portfolio securities for the 12 month period ended June 30th as well as a description of the policies and procedures that the Fund used to determine how to vote proxies is available without charge, upon request, by calling 1-855-896-6257 or by referring to the Securities and Exchange Commission’s (“SEC”) website athttp://www.sec.gov.
How to Obtain 1st and 3rd Fiscal Quarter Portfolio Holdings
The Fund files its complete schedule of portfolio holdings with the SEC for the first and third quarters of each fiscal year on Form N-PORT. Form N-PORT is available on the SEC’s website athttp://www.sec.gov and may be reviewed and copied at the SEC’s Public Reference Room in Washington, DC (1-800-SEC-0330). The information on Form N-PORT is available without charge, upon request, by calling 1-855-896-6257.
For more complete information about the Two Oaks Diversified Growth and Income Fund, including charges and expenses, please call (855) 896-6257 and request a free prospectus. Read the prospectus carefully before you invest or send money. For more information about the Fund’s Board of Directors, please call or write to request the Fund’s Statement of Additional Information.
| |
| |
| |
| |
 |
| |
| |
| |
| TWO OAKS DIVERSIFIED |
| GROWTH AND INCOME FUND |
| |
| |
| |
| Annual Report |
| March 31, 2020 |
Item 2. Code of Ethics.
(a) As of the end of the period covered by this report, the registrant has adopted a code of ethics that applies to the registrant's principal executive officer, principal financial officer, principal accounting officer or controller, or persons performing similar functions, regardless of whether these individuals are employed by the registrant or a third party.
(b) For purposes of this item, “code of ethics” means written standards that are reasonably designed to deter wrongdoing and to promote:
| (1) | Honest and ethical conduct, including the ethical handling of actual or apparent conflicts of interest between personal and professional relationships; |
| (2) | Full, fair, accurate, timely, and understandable disclosure in reports and documents that a registrant files with, or submits to, the Commission and in other public communications made by the registrant; |
| (3) | Compliance with applicable governmental laws, rules, and regulations; |
| (4) | The prompt internal reporting of violations of the code to an appropriate person or persons identified in the code; and |
| (5) | Accountability for adherence to the code. |
(c) Amendments: During the period covered by the report, there have not been any amendments to the provisions of the code of ethics.
(d) Waivers: During the period covered by the report, the registrant has not granted any express or implicit waivers from the provisions of the code of ethics.
(e) The Code of Ethics is not posted on Registrant’ website.
(f) A copy of the Code of Ethics is attached as an exhibit.
Item 3. Audit Committee Financial Expert.
(a) The Registrant’s board of trustees has determined that Keith Rhoades is an audit committee financial expert, as defined in Item 3 of Form N-CSR. Mr. Rhoades is independent for purposes of this Item.
Item 4. Principal Accountant Fees and Services.
2020 - $14,500
2019 - $14,500
2020 – None
2019 – None
2020 – $3,000
2019 – $3,000
Preparation of Federal & State income tax returns, assistance with calculation of required income, capital gain and excise distributions and preparation of Federal excise tax returns.
2020 – None
2019 – None
| (e) | (1)Audit Committee’s Pre-Approval Policies |
The registrant’s Audit Committee is required to pre-approve all audit services and, when appropriate, any non-audit services (including audit-related, tax and all other services) to the registrant. The registrant’s Audit Committee also is required to pre-approve, when appropriate, any non-audit services (including audit-related, tax and all other services) to its adviser, or any entity controlling, controlled by or under common control with the adviser that provides ongoing services to the registrant, to the extent that the services may be determined to have an impact on the operations or financial reporting of the registrant. Services are reviewed on an engagement by engagement basis by the Audit Committee.
| (2) | Percentages of Services Approved by the Audit Committee |
| | | 2020 | | 2019 |
| Audit-Related Fees: | | | 0.00 | % | | | 0.00 | % |
| Tax Fees: | | | 0.00 | % | | | 0.00 | % |
| All Other Fees: | | | 0.00 | % | | | 0.00 | % |
| (f) | During the audit of registrant's financial statements for the most recent fiscal year, less than 50 percent of the hours expended on the principal accountant's engagement were attributed to work performed by persons other than the principal accountant's full-time, permanent employees. |
| (g) | The aggregate non-audit fees billed by the registrant's accountant for services rendered to the registrant, and rendered to the registrant's investment adviser (not including any sub-adviser whose role is primarily portfolio management and is subcontracted with or overseen by another investment adviser), and any entity controlling, controlled by, or under common control with the adviser that provides ongoing services to the registrant: |
2020 – $3,000
2019 – $3,000
(h) The registrant's audit committee has considered whether the provision of non-audit services to the registrant's investment adviser (not including any sub-adviser whose role is primarily portfolio management and is subcontracted with or overseen by another investment adviser), and any entity controlling, controlled by, or under common control with the investment adviser that provides ongoing services to the registrant, that were not pre-approved pursuant to paragraph (c)(7)(ii) of Rule 2-01 of Regulation S-X, is compatible with maintaining the principal accountant's independence.
Item 5. Audit Committee of Listed Companies.Not applicable to open-end investment companies.
Item 6. Schedule of Investments.Schedule of investments in securities of unaffiliated issuers is included under Item 1.
Item 7. Disclosure of Proxy Voting Policies and Procedures for Closed-End Funds. Not applicable to open-end investment companies.
Item 8. Portfolio Managers of Closed-End Management Investment Companies. Not applicable to open-end investment companies.
Item 9. Purchases of Equity Securities by Closed-End Funds. Not applicable to open-end investment companies.
Item 10. Submission of Matters to a Vote of Security Holders. None
Item 11. Controls and Procedures.
(a) Based on an evaluation of the Registrant’s disclosure controls and procedures as of a date within 90 days of filing date of this Form N-CSR, the principal executive officer and principal financial officer of the Registrant have concluded that the disclosure controls and procedures of the Registrant are reasonably designed to ensure that the information required in filings on Form N-CSR is recorded, processed, summarized, and reported by the filing date, including that information required to be disclosed is accumulated and communicated to the Registrant’s management, including the Registrant’s principal executive officer and principal financial officer, as appropriate to allow timely decisions regarding required disclosure.
(b) There were no significant changes in the Registrant’s internal control over financial reporting that occurred during the Registrant’s last fiscal half-year that have materially affected, or are reasonably likely to materially affect, the Registrant’s internal control over financial reporting.
Item 12. Disclosure of Securities Lending Activities for Closed-End Management Investment Companies.Not applicable.
Item 13. Exhibits.
(a)(1) Code of Ethics filed herewith.
(a)(2) Certifications required by Section 302 of the Sarbanes-Oxley Act of 2002 (and Item 11(a)(2) of Form N-CSR) are filed herewith.
(a)(3) Not applicable for open-end investment companies.
(b) Certifications required by Section 906 of the Sarbanes-Oxley Act of 2002 (and Item 11(b) of Form N-CSR) are filed herewith.
SIGNATURES
Pursuant to the requirements of the Securities Exchange Act of 1934 and the Investment Company Act of 1940, the registrant has duly caused this report to be signed on its behalf by the undersigned, thereunto duly authorized.
(Registrant)Northern Lights Fund Trust II
By (Signature and Title)
/s/ Kevin E. Wolf
Kevin E. Wolf, Principal Executive Officer/President
Date 6/1/20
Pursuant to the requirements of the Securities Exchange Act of 1934 and the Investment Company Act of 1940, this report has been signed below by the following persons on behalf of the registrant and in the capacities and on the dates indicated.
By (Signature and Title)
/s/ Kevin E. Wolf
Kevin E. Wolf, Principal Executive Officer/President
Date 6/1/20
By (Signature and Title)
/s/ Erik Naviloff
Erik Naviloff, Principal Financial Officer/Treasurer
Date 6/1/20