united states
securities and exchange commission
washington, d.c. 20549
form n-csr
certified shareholder report of registered management
investment companies
Investment Company Act file number 811-22549
Northern Lights Fund Trust II
(Exact name of registrant as specified in charter)
225 Pictoria Drive, Suite 450, Cincinnati, Ohio 45246
(Address of principal executive offices) (Zip code)
Kevin Wolf, Gemini Fund Services, LLC
80 Arkay Drive, Hauppauge, NY 11788
(Name and address of agent for service)
Registrant's telephone number, including area code: 631-470-2619
Date of fiscal year end: 12/31
Date of reporting period:12/31/19
Item 1. Reports to Stockholders.

| | 2019 |
| | |
| | Annual Report |
| | |
| | AL FRANK FUND |
| | |
| | |
| | |
| | |
| | |
| | |
Beginning on January 1, 2021, as permitted by regulations adopted by the Securities and Exchange Commission, paper copies of the Fund’s shareholder reports like this one will no longer be sent by mail, unless you specifically request paper copies of the reports. Instead, the reports will be made available on the Fund’s website www.alfrankfunds.com, and you will be notified by mail each time a report is posted and provided with a website link to access the report.
If you already elected to receive shareholder reports electronically, you will not be affected by this change and you need not take any action. You may elect to receive shareholder reports and other communications from the Fund electronically or to continue receiving paper copies of shareholder reports, which are available free of charge, by contacting your financial intermediary (such as a broker-dealer or bank) or, if you are a direct investor, by following the instructions included with paper Fund documents that have been mailed to you.
Dear Shareholders,
The legendary football coach Vince Lombardi once said, “When you go into the end zone, act like you’ve been there before.” Wise words for equity investors in 2019, who after suffering fumbles and interceptions in 2018 on their way to a losing season, once again hit pay dirt. Indeed, the S&P 500 soared more than 30% in 2019, the 20th such time the broad-based index has enjoyed an annual return of that magnitude or greater since 1925. True, the average stock in the S&P gained just 27.1% and the average return for Russell 3000 members was only 22.3%, but it obviously was a victorious year in the equity markets.
| Al Frank Fund Average Annual Total Return as of 12/31/2019 (unaudited) |
| |
| | Al Frank Fund | Al Frank Fund | Russell 3000® | S&P 500® |
| | Investor Class * | Advisor Class** | Index | Index |
| 1 year | 25.46% | 25.78% | 31.02% | 31.49% |
| 5 years | 8.02% | 8.29% | 11.24% | 11.70% |
| 10 years | 10.93% | 11.20% | 13.42% | 13.56% |
Since
Inception
1.2.98 | 10.17% | | 7.75% | 7.61% |
Since
Inception
4.30.06 | | 6.36% | 8.97% | 9.09% |
Past performance does not guarantee future results. The investment return and principal value of an investment will fluctuate so that the investor’s shares, when redeemed, may be worth more or less than their original cost. Current performance of the Fund may be lower or higher than the performance quoted. Performance data for the most recent month-end is available at www.alfrankfunds.com. The Fund’s total annual operating expenses are 1.64% for the Investor Class and 1.39% for the Advisor Class, respectively, per the May 1, 2019 prospectus. Pursuant to an operating expense limitation agreement between AFAM Capital, Inc. (the “Adviser”) and the Fund, the Adviser has agreed to waive its fees and/or absorb expenses of the Fund to ensure that Total Annual Fund Operating Expenses for the Fund do not exceed 1.49% and 1.24% of the Fund’s average net assets, for Investor Class and Advisor Class shares, respectively, through April 30, 2020.
| * | Commencement of operations 01/02/1998 |
| ** | Commencement of operations 04/30/2006 |
Absolute returns in 2019 were very good, bouncing back from a poor 2018, though Value-oriented strategies lagged Growth. The following attribution analysis illustrates some of the reasons why the Al Frank Fund performed as it did during 2019 relative to the Russell 3000 benchmark. VALUX was boosted by favorable stock selection in the Energy and Financials Sectors. We were also helped by our allocations to Health Care and Information Technology, while our lack of exposure to Utilities was a positive
contributor and our modest Cash position was a negative contributor to relative performance. Offsetting the positives to a degree was our stock selection within the Information Technology, Consumer Discretionary, Industrials and Materials Sectors, and overweight allocations to Materials and Energy. The Al Frank Fund’s selection of large- and mid-cap stocks hurt relative performance during the period, while small-cap stock picking was a positive.
Looking at specific stocks, the top five positions that had the greatest positive absolute impact on the portfolio during 2019 were Apple, Microsoft, JPMorgan Chase, MDC Holdings and Target. On the other side of the ledger, Designer Brands, Mosaic, Kohl’s, Goodyear Tire and Foot Locker had the largest negative absolute impact.
| Ticker | Weight | Sector | Weight | Capitalization Weight |
| AAPL | 2.66 | Information Technology | 22.10 | Giant | 49.12 |
| AMGN | 2.49 | Health Care | 11.23 | Large | 31.36 |
| JPM | 2.43 | Financials | 16.67 | Medium | 16.15 |
| MSFT | 2.24 | Communication Services | 6.91 | Small | 3.37 |
| DIS | 2.06 | Consumer Discretionary | 11.79 | Micro | 0.00 |
| RCL | 1.90 | Industrials | 11.31 | | |
| TFC | 1.89 | Consumer Staples | 5.94 | | |
| ETN | 1.84 | Materials | 5.50 | | |
| INTC | 1.78 | Real Estate | 3.56 | | |
| GLW | 1.77 | Energy | 4.98 | | |
| COF | 1.73 | | | | |
| GOOG | 1.73 | | | | |
| STX | 1.69 | | | | |
| ADM | 1.65 | | | | |
| CE | 1.59 | | | | |
| | | | | | |
No doubt, turnovers and touchdowns always are part of the equity game, with history showing that there are far more of the latter than the former, yet it remains difficult for many to avoid heading for the sidelines at an inopportune time. For example, a year ago in this space, we were writing about a dismal December that saw the 20% Bear Market threshold breached early on Boxing Day when the S&P was off 20.2% from its September highs at one point and the average stock in the Russell 3000 index tumbled 24.6% from Sept. 20 to Dec. 24. Not surprisingly, many in the financial press and more than a few supposed market experts were then busy advising on ways to protect one’s portfolio from further declines, prompting many to hit the showers as evidenced by the whopping $26.1 billion in net outflows
out of domestic equity mutual and exchange-traded funds over the three weeks ended Dec. 26, 2018, per data from Investment Company Institute, and a spike to a five-year high of 50.3% in the number of Bears, per sentiment numbers that same day from AAII.
Interestingly, the late-2018 carnage was caused by fears of slowing economic and corporate profit growth, with the constant drama in Washington and trade uncertainties not helping. And 2019 did not begin on a strong note, when consumer electronics giant Apple dropped a huge revenue-miss bombshell on investors on Jan. 2. Of course, aside from Apple, which saw its stock price rise from $157.74 at the start of the year to $293.65 at the end of 2019, none of those worries really were alleviated last year, as U.S. GDP growth of 2.0% for 2020 is the current expectation, earnings have not grown as fast as many had expected, there are still more fronts in regard to the trade battle and two Articles of Impeachment against President Trump were sent from the House of Representatives to the Senate.
While the markets often climb a Wall of Worry, a year ago we argued that a modest to moderate economic AND profit recession seemingly was discounted in the prices of many stocks. Given that there was no recession on either score in 2019, it made it easier for equities to rebound, while it didn’t hurt that lackluster economic data prompted the Federal Reserve to cut the Fed Funds rate three times, that the yield on the 10-year U.S. Treasury tumbled from more than 2.5% to near 1.9%, and that tariff hostilities with China ebbed, with President Trump and Chinese officials agreeing to a “phase one” trade deal.
No doubt, the huge rally in 2019 has many questioning whether the equity market gains can continue in 2020. Hopefully, it should come as no surprise when our answer is that nobody can predict short-term market movements with any certainty and we must always be braced for downturns, corrections and even Bear Markets. However, while we realize that geopolitical events are always a wild card, we continue to be optimistic about the long-term prospects of our broadly diversified portfolios of what we believe to be undervalued stocks. The interest rate equation remains very supportive of equities, dividends and stock buybacks are expected to remain robust, the U.S. and global economies are likely to continue to grow, albeit modestly, and we still do not see much in the way of investor exuberance. Anything can happen, of course, but we like the J.P. Morgan quotation, “Any man who is bearish on the United States will eventually go broke.”
In Conclusion
We know that we will not always be able to outperform the benchmarks in the short run, especially as our focus is always on the long-term prospects of the Funds and the stocks contained therein. As such, we remain pleased with our long-term performance comparisons. For example, as of 12/31/19, the Al Frank Fund – Investor Class (VALUX) has enjoyed a 10.17% annualized rate of return since its inception on January 2, 1998, compared to a 7.75% annualized return for the Russell 3000® Index and a 7.61% annualized return for the S&P 500® Index over the same period. The Russell 3000 Value index had a return of 7.46% over the same time span.
Volatility likely will remain elevated as we confront the new coronavirus brick in the Wall of Worry that stocks have been climbing since the inception of the equity markets, while the 2020 Elections are on the
horizon and the trade skirmishes are far from settled. ‘Twas ever thus, as our founder Al Frank was fond of saying, but we have long been comfortable with our basic risk mitigation tools ofpatiently buying and seeking to harvest a broadlydiversifiedportfolio ofundervalued stocks, generally ofdividend-paying companies, while modestly ebbing and flowing ourcash position. True, we would love to avoid the next big downturn, but we know that more money has been lost in anticipation of a correction than has been lost in the corrections themselves. Only by accepting that these events are a normal part of the process can we seek to achieve overall long-term returns that assist investors in meeting their financial goals.
**********
We pride ourselves on our educational heritage and we are always striving to keep shareholders and prospective shareholders abreast of our thinking. While many are receiving our philosophical musings via their subscriptions toThe Prudent Speculator newsletter, we encourage those who are not subscribers to e-mail us at info@theprudentspeculator.com for additional information and to sign up for our free electronic offerings.
All of us at Kovitz Investment Group thank you for your continued loyalty and patronage. We appreciate the faith you have shown in us, and Jason and I are proud to say that we continue to invest our own money right alongside our shareholders in our Fund.
Sincerely,
John Buckingham & Jason Clark
3256-NLD-2/12/2020
| Al Frank Fund |
| PORTFOLIO REVIEW (Unaudited) |
| December 31, 2019 |
| |
The Fund’s performance figures* for the periods ended December 31, 2019, compared to its benchmark:
| | | Annualized |
| | | | | Since Inception | Since Inception |
| | One Year | Five Year | Ten Year | (1/2/98) | (4/30/06) |
| Al Frank Fund - Investor Class** | 25.46% | 8.02% | 10.93% | 10.17% | N/A |
| Al Frank Fund - Advisor Class*** | 25.78% | 8.29% | 11.20% | N/A | 6.36% |
| S&P 500® Total Return Index**** | 31.49% | 11.70% | 13.56% | 7.61% | 9.09% |
| Russell 3000® Total Return Index***** | 31.02% | 11.24% | 13.42% | 7.75% | 8.97% |
| | | | | | |
Comparison of the Change in Value of a $10,000 Investment
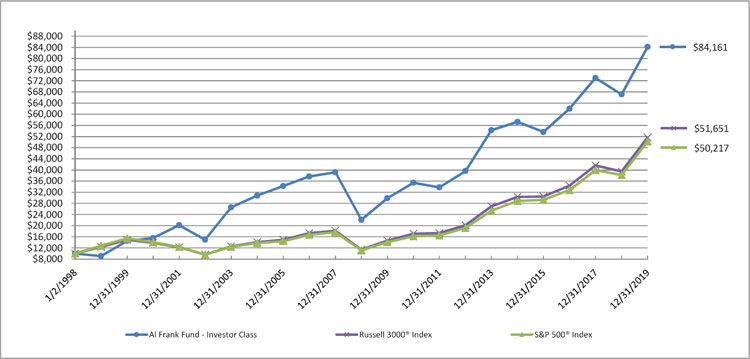
Returns reflect the reinvestment of dividends and capital gains. Fee waivers are in effect. In the absence of fee waivers, returns would have been reduced. The performance data and graphs above do not reflect the deduction of taxes that a shareholder may pay on dividends, capital gain distributions, or redemption of Fund shares. Performance data shown does not reflect the 2.00% redemption fee imposed on shares held 60 days or less. If it did, returns would have been reduced.
| * | Past performance does not guarantee future results. The investment return and principal value of an investment will fluctuate so that an investor’s shares, when redeemed, may be worth more or less than their original cost. Current performance of the Fund may be lower or higher than the performance quoted. Performance data for the most recent month-end is available at www.alfrankfunds.com. The Fund’s total annual operating expenses are 1.64% for the Investor Class and 1.39% for the Advisor Class, respectively, per the May 1, 2019 prospectus. After fee waivers, the Fund’s total annual operating expenses are 1.49% for the Investor Class and 1.24% for the Advisor Class, respectively. |
| ** | Commencement of operations on January 2, 1998. |
| *** | Commencement of operations on April 30, 2006. |
| **** | The S&P 500® Index is a broad based unmanaged capitalization-weighted index of 500 stocks designed to represent the broad domestic market. You cannot invest directly in an index. |
| ***** | The Russell 3000® Index measures the performance of the largest 3,000 U.S. companies determined by total market capitalization. You cannot invest directly in an index. |
| Holdings By Asset Class as of December 31, 2019 | | % of Net Assets | |
| Information Technology | | | 21.92 | % |
| Financials | | | 16.54 | % |
| Consumer Discretionary | | | 11.52 | % |
| Industrials | | | 11.21 | % |
| Health Care | | | 10.97 | % |
| Communication Services | | | 6.86 | % |
| Consumer Staples | | | 5.71 | % |
| Materials | | | 5.30 | % |
| Energy | | | 4.79 | % |
| Real Estate | | | 3.40 | % |
| Other, Cash & Cash Equivalents | | | 1.78 | % |
| | | | 100.00 | % |
| | | | | |
Please refer to the Schedule of Investments in this annual report for a detailed analysis of the Fund’s holdings.
| Al Frank Fund |
| SCHEDULE OF INVESTMENTS at December 31, 2019 |
| Shares | | | | | Value | |
| | | | | COMMON STOCKS - 98.22% | | | | |
| | | | | COMMUNICATION SERVICES - 6.86% | | | | |
| | | | | Internet - 1.72% | | | | |
| | 1,000 | | | Alphabet, Inc. (a) | | $ | 1,337,020 | |
| | | | | | | | | |
| | | | | Media - 3.42% | | | | |
| | 24,000 | | | Comcast Corp. - Class A | | | 1,079,280 | |
| | 11,000 | | | Walt Disney Co. (The) | | | 1,590,930 | |
| | | | | | | | 2,670,210 | |
| | | | | Telecommunications - 1.72% | | | | |
| | 17,000 | | | AT&T, Inc. | | | 664,360 | |
| | 11,000 | | | Verizon Commnunications, Inc. | | | 675,400 | |
| | | | | | | | 1,339,760 | |
| | | | | Total Communication Services (Cost $2,542,288) | | | 5,346,990 | |
| | | | | | | | | |
| | | | | CONSUMER DISCRETIONARY - 11.52% | | | | |
| | | | | Apparel - 0.86% | | | | |
| | 25,000 | | | Tapestry, Inc. | | | 674,250 | |
| | | | | | | | | |
| | | | | Auto Manufacturers - 1.06% | | | | |
| | 22,500 | | | General Motors Co. | | | 823,500 | |
| | | | | | | | | |
| | | | | Auto Parts & Equipment - 0.70% | | | | |
| | 35,000 | | | Goodyear Tire & Rubber Co. (The) | | | 544,425 | |
| | | | | | | | | |
| | | | | Home Builders - 1.54% | | | | |
| | 31,500 | | | MDC Holdings, Inc. | | | 1,202,040 | |
| | | | | | | | | |
| | | | | Home Furnishings - 1.23% | | | | |
| | 6,500 | | | Whirlpool Corp. | | | 958,945 | |
| | | | | | | | | |
| | | | | Leisure Time - 1.71% | | | | |
| | 10,000 | | | Royal Caribbean Cruises Ltd. | | | 1,335,100 | |
| | | | | | | | | |
| | | | | Retail - 4.42% | | | | |
| | 20,000 | | | Designer Brands, Inc. | | | 314,800 | |
| | 20,000 | | | Foot Locker, Inc. | | | 779,800 | |
| | 12,000 | | | Kohl’s Corp. | | | 611,400 | |
| | 7,000 | | | Target Corp. | | | 897,470 | |
| | 11,500 | | | Williams-Sonoma, Inc. | | | 844,560 | |
| | | | | | | | 3,448,030 | |
| | | | | Total Consumer Discretionary (Cost $6,290,645) | | | 8,986,290 | |
| | | | | | | | | |
| | | | | CONSUMER STAPLES - 5.71% | | | | |
| | | | | Agriculture - 1.64% | | | | |
| | 27,500 | | | Archer-Daniels-Midland Co. | | | 1,274,625 | |
| | | | | | | | | |
See accompanying notes to financial statements.
| Al Frank Fund |
| SCHEDULE OF INVESTMENTS at December 31, 2019 (Continued) |
| Shares | | | | | Value | |
| | | | | Food - 2.03% | | | | |
| | 20,000 | | | Kroger Co. (The) | | $ | 579,800 | |
| | 11,000 | | | Tyson Foods, Inc. - Class A | | | 1,001,440 | |
| | | | | | | | 1,581,240 | |
| | | | | Retail - 2.04% | | | | |
| | 8,900 | | | Walgreens Boots Alliance, Inc. | | | 524,744 | |
| | 9,000 | | | Wal-Mart, Inc. | | | 1,069,560 | |
| | | | | | | | 1,594,304 | |
| | | | | Total Consumer Staples (Cost $2,331,514) | | | 4,450,169 | |
| | | | | | | | | |
| | | | | ENERGY - 4.79% | | | | |
| | | | | Oil & Gas - 3.01% | | | | |
| | 11,500 | | | Exxon Mobil Corp. | | | 802,470 | |
| | 12,000 | | | HollyFrontier Corp. | | | 608,520 | |
| | 17,000 | | | Total SA - ADR (b) | | | 940,100 | |
| | | | | | | | 2,351,090 | |
| | | | | Oil & Gas Services - 0.70% | | | | |
| | 13,500 | | | Schlumberger Ltd. | | | 542,700 | |
| | | | | | | | | |
| | | | | Transportation - 1.08% | | | | |
| | 58,000 | | | SFL Corp. Ltd. | | | 843,320 | |
| | | | | | | | | |
| | | | | Total Energy (Cost $3,101,557) | | | 3,737,110 | |
| | | | | | | | | |
| | | | | FINANCIALS - 16.54% | | | | |
| | | | | Banks - 12.26% | | | | |
| | 30,000 | | | Bank of America Corp. | | | 1,056,600 | |
| | 18,000 | | | Bank of New York Mellon Corp. (The) | | | 905,940 | |
| | 30,000 | | | Fifth Third Bancorp. | | | 922,200 | |
| | 4,500 | | | Goldman Sachs Group, Inc. (The) | | | 1,034,685 | |
| | 13,500 | | | JPMorgan Chase & Co. | | | 1,881,900 | |
| | 60,000 | | | Old National Bancorp | | | 1,097,400 | |
| | 7,500 | | | PNC Financial Services Group, Inc. (The) | | | 1,197,225 | |
| | 26,000 | | | Truist Financial Corp. | | | 1,464,320 | |
| | | | | | | | 9,560,270 | |
| | | | | Diversified Financial Services - 1.72% | | | | |
| | 13,000 | | | Capital One Financial Corp. | | | 1,337,830 | |
| | | | | | | | | |
| | | | | Insurance - 2.56% | | | | |
| | 18,000 | | | MetLife, Inc. | | | 917,460 | |
| | 11,500 | | | Prudential Financial, Inc. | | | 1,078,010 | |
| | | | | | | | 1,995,470 | |
| | | | | Total Financials (Cost $6,263,635) | | | 12,893,570 | |
| | | | | | | | | |
| | | | | HEALTH CARE - 10.97% | | | | |
| | | | | Biotechnology - 3.42% | | | | |
| | 8,000 | | | Amgen, Inc. | | | 1,928,560 | |
| | 2,500 | | | Biogen, Inc. (a) | | | 741,825 | |
| | | | | | | | 2,670,385 | |
| | | | | | | | | |
See accompanying notes to financial statements.
| Al Frank Fund |
| SCHEDULE OF INVESTMENTS at December 31, 2019 (Continued) |
| Shares | | | | | Value | |
| | | | | Health Care Products - 3.09% | | | | |
| | 10,000 | | | Abbott Laboratories | | $ | 868,600 | |
| | 7,000 | | | Medtronic PLC | | | 794,150 | |
| | 5,000 | | | Zimmer Biomet Holdings, Inc. | | | 748,400 | |
| | | | | | | | 2,411,150 | |
| | | | | Health Care Services - 0.00% ^ | | | | |
| | 1 | | | Encompass Health Corp. | | | 69 | |
| | | | | | | | | |
| | | | | Pharmaceuticals - 4.46% | | | | |
| | 11,200 | | | Cardinal Health, Inc. | | | 566,496 | |
| | 6,702 | | | CVS Health Corp. | | | 497,892 | |
| | 7,500 | | | Johnson & Johnson | | | 1,094,025 | |
| | 8,000 | | | Merck & Co., Inc. | | | 727,600 | |
| | 15,000 | | | Pfizer, Inc. | | | 587,700 | |
| | | | | | | | 3,473,713 | |
| | | | | Total Health Care (Cost $5,543,316) | | | 8,555,317 | |
| | | | | | | | | |
| | | | | INDUSTRIALS - 11.21% | | | | |
| | | | | Airlines - 1.20% | | | | |
| | 16,000 | | | Delta Air Lines, Inc. | | | 935,680 | |
| | | | | | | | | |
| | | | | Auto Manufacturers - 1.26% | | | | |
| | 5,500 | | | Cummins, Inc. | | | 984,280 | |
| | | | | | | | | |
| | | | | Commercial Services - 1.49% | | | | |
| | 12,000 | | | ManpowerGroup, Inc. | | | 1,165,200 | |
| | | | | | | | | |
| | | | | Machinery- Construction & Mining - 1.51% | | | | |
| | 8,000 | | | Caterpillar, Inc. | | | 1,181,440 | |
| | | | | | | | | |
| | | | | Machinery- Diversified - 1.56% | | | | |
| | 7,000 | | | Deere & Co. | | | 1,212,820 | |
| | | | | | | | | |
| | | | | Miscellaneous Manufacturing - 1.82% | | | | |
| | 15,000 | | | Eaton Corp. PLC | | | 1,420,800 | |
| | | | | | | | | |
| | | | | Transportation - 2.37% | | | | |
| | 4,500 | | | FedEx Corp. | | | 680,445 | |
| | 6,000 | | | Norfolk Southern Corp. | | | 1,164,780 | |
| | | | | | | | 1,845,225 | |
| | | | | Total Industrials (Cost $4,798,933) | | | 8,745,445 | |
| | | | | | | | | |
See accompanying notes to financial statements.
| Al Frank Fund |
| SCHEDULE OF INVESTMENTS at December 31, 2019 (Continued) |
| Shares | | | | | Value | |
| | | | | INFORMATION TECHNOLOGY - 21.92% | | | | |
| | | | | Computers - 6.41% | | | | |
| | 7,000 | | | Apple, Inc. | | $ | 2,055,550 | |
| | 7,100 | | | International Business Machines Corp. | | | 951,684 | |
| | 11,000 | | | NetApp, Inc. | | | 684,750 | |
| | 22,000 | | | Seagate Technology PLC | | | 1,309,000 | |
| | | | | | | | 5,000,984 | |
| | | | | Electronics - 1.21% | | | | |
| | 15,500 | | | Benchmark Electronics, Inc. | | | 532,580 | |
| | 10,000 | | | Jabil, Inc. | | | 413,300 | |
| | | | | | | | 945,880 | |
| | | | | Internet - 1.18% | | | | |
| | 36,000 | | | NortonLifeLock, Inc. | | | 918,720 | |
| | | | | | | | | |
| | | | | Semiconductors - 5.52% | | | | |
| | 40,000 | | | Cohu, Inc. | | | 914,000 | |
| | 23,000 | | | Intel Corp. | | | 1,376,550 | |
| | 2,900 | | | Lam Research Corp. | | | 847,960 | |
| | 13,200 | | | QUALCOMM, Inc. | | | 1,164,636 | |
| | | | | | | | 4,303,146 | |
| | | | | Software - 3.79% | | | | |
| | 11,000 | | | Microsoft Corp. | | | 1,734,700 | |
| | 23,000 | | | Oracle Corp. | | | 1,218,540 | |
| | | | | | | | 2,953,240 | |
| | | | | Telecommunications - 3.81% | | | | |
| | 18,000 | | | Cisco Systems, Inc. | | | 863,280 | |
| | 47,100 | | | Corning, Inc. | | | 1,371,081 | |
| | 30,000 | | | Juniper Networks, Inc. | | | 738,900 | |
| | | | | | | | 2,973,261 | |
| | | | | Total Information Technology (Cost $7,482,966) | | | 17,095,231 | |
| | | | | | | | | |
| | | | | MATERIALS - 5.30% | | | | |
| | | | | Chemicals - 2.78% | | | | |
| | 8,000 | | | Albemarle Corp. | | | 584,320 | |
| | 9,000 | | | Celanese Corp. - Class A | | | 1,108,080 | |
| | 22,000 | | | Mosaic Co. (The) | | | 476,080 | |
| | | | | | | | 2,168,480 | |
| | | | | Forest Products & Paper - 1.21% | | | | |
| | 20,500 | | | International Paper Co. | | | 944,025 | |
| | | | | | | | | |
| | | | | Mining - 1.31% | | | | |
| | 23,500 | | | Newmont Goldcorp Corp. | | | 1,021,075 | |
| | | | | | | | | |
| | | | | Total Materials (Cost $3,268,771) | | | 4,133,580 | |
| | | | | | | | | |
See accompanying notes to financial statements.
| Al Frank Fund |
| SCHEDULE OF INVESTMENTS at December 31, 2019 (Continued) |
| Shares | | | | | Value | |
| | | | | REAL ESTATE - 3.40% | | | | |
| | | | | Real Estate Investment Trusts (REITS) - 3.40% | | | | |
| | 8,000 | | | Digital Realty Trust, Inc. | | $ | 957,920 | |
| | 45,000 | | | Kimco Realty Corp. | | | 931,950 | |
| | 40,000 | | | Physicians Realty Trust | | | 757,600 | |
| | | | | Total Real Estate (Cost $2,129,082) | | | 2,647,470 | |
| | | | | | | | | |
| | | | | TOTAL COMMON STOCKS (Cost $43,752,707) | | | 76,591,172 | |
| | | | | | | | | |
| | | | | SHORT-TERM INVESTMENT - 1.02% | | | | |
| | | | | Money Market Fund - 1.02% | | | | |
| | 794,545 | | | Fidelity Investments Money Market Funds - Government Portfolio - Class I, to yield 1.49% (c) | | | 794,545 | |
| | | | | TOTAL SHORT-TERM INVESTMENT (Cost $794,545) | | | 794,545 | |
| | | | | | | | | |
| | | | | Total Investments (Cost $44,547,252) - 99.24% | | $ | 77,385,717 | |
| | | | | Other Assets Less Liabilities: 0.76% | | | 590,625 | |
| | | | | NET ASSETS: 100.00% | | $ | 77,976,342 | |
| | | | | | | | | |
ADR - American Depositary Receipt
| ^ | Represents less than 0.005% |
| (a) | Non-income producing security. |
| (b) | U.S. traded security of a foreign issuer. |
| (c) | Rate shown is the 7-day annualized yield as of December 31, 2019. |
See accompanying notes to financial statements.
| Al Frank Fund |
| STATEMENT OF ASSETS AND LIABILITIES |
| December 31, 2019 |
| ASSETS | | | | |
| Investment securities: | | | | |
| At cost | | $ | 44,547,252 | |
| At value | | $ | 77,385,717 | |
| Receivable for investments sold | | | 753,923 | |
| Dividends and interest receivable | | | 111,997 | |
| Prepaid expenses & other assets | | | 13,675 | |
| TOTAL ASSETS | | | 78,265,312 | |
| | | | | |
| LIABILITIES | | | | |
| Payable for Fund shares redeemed | | | 173,157 | |
| Investment advisory fees payable | | | 61,686 | |
| Distribution (12b-1) fees payable | | | 16,321 | |
| Payable to Related Parties | | | 11,994 | |
| Accrued expenses and other liabilities | | | 25,812 | |
| TOTAL LIABILITIES | | | 288,970 | |
| NET ASSETS | | $ | 77,976,342 | |
| | | | | |
| Net Assets Consist Of: | | | | |
| Paid in capital | | $ | 43,844,024 | |
| Accumulated Earnings | | | 34,132,318 | |
| NET ASSETS | | $ | 77,976,342 | |
| | | | | |
| Net Asset Value Per Share: | | | | |
| Investor Class Shares: | | | | |
| Net Assets | | $ | 72,709,461 | |
| Shares of beneficial interest outstanding ($0 par value, unlimited shares authorized) | | | 3,005,377 | |
| Net asset value (Net Assets ÷ Shares Outstanding, offering price ) and redemption price per share (a) | | $ | 24.19 | |
| | | | | |
| Advisor Class Shares: | | | | |
| Net Assets | | $ | 5,266,881 | |
| Shares of beneficial interest outstanding ($0 par value, unlimited shares authorized) | | | 217,316 | |
| Net asset value (Net Assets ÷ Shares Outstanding, offering price ) and redemption price per share (a) | | $ | 24.24 | |
| | | | | |
| (a) | Redemptions of shares held less than 60 days may be assessed a redemption fee of 2.00%. |
See accompanying notes to financial statements.
| Al Frank Fund |
| STATEMENT OF OPERATIONS |
| For the Year Ended December 31, 2019 |
| INVESTMENT INCOME | | | | |
| Dividends * | | $ | 2,100,106 | |
| Interest | | | 31,043 | |
| TOTAL INVESTMENT INCOME | | | 2,131,149 | |
| | | | | |
| EXPENSES | | | | |
| Investment advisory fees | | | 766,756 | |
| Distribution (12b-1) fees: | | | | |
| Investor Class | | | 178,434 | |
| Transfer agent fees | | | 35,781 | |
| Administration fees | | | 44,434 | |
| Fund accounting fees | | | 43,595 | |
| Trustees’ fees | | | 32,237 | |
| Shareholder reporting expense | | | 28,484 | |
| Registration fees | | | 22,842 | |
| Audit fees | | | 18,198 | |
| Legal fees | | | 16,382 | |
| Compliance officer fees | | | 20,165 | |
| Third party administrative servicing fees | | | 13,611 | |
| Insurance expense | | | 8,368 | |
| Custody fees | | | 3,931 | |
| Other expenses | | | 1,633 | |
| TOTAL EXPENSES | | | 1,234,851 | |
| | | | | |
| Less: Fees waived by the Adviser | | | (105,460 | ) |
| | | | | |
| NET EXPENSES | | | 1,129,391 | |
| NET INVESTMENT INCOME | | | 1,001,758 | |
| | | | | |
| REALIZED AND UNREALIZED GAIN ON INVESTMENTS | | | | |
| Net realized gain from investments | | | 5,618,905 | |
| Net change in unrealized appreciation on investments | | | 10,840,477 | |
| | | | | |
| NET REALIZED AND UNREALIZED GAIN ON INVESTMENTS | | | 16,459,382 | |
| | | | | |
| NET INCREASE IN NET ASSETS RESULTING FROM OPERATIONS | | $ | 17,461,140 | |
| | | | | |
| * | Includes withholding tax of $38,317. |
See accompanying notes to financial statements.
| Al Frank Fund |
| STATEMENTS OF CHANGES IN NET ASSETS |
| | | For the | | | For the | |
| | | Year Ended | | | Year Ended | |
| | | December 31, 2019 | | | December 31, 2018 | |
| | | | | | | |
| FROM OPERATIONS | | | | | | | | |
| Net investment income | | $ | 1,001,758 | | | $ | 860,658 | |
| Net realized gain from investments | | | 5,618,905 | | | | 5,841,646 | |
| Net change in unrealized appreciation/(depreciation) on investments | | | 10,840,477 | | | | (13,021,779 | ) |
| Net increase/(decrease) in net assets resulting from operations | | | 17,461,140 | | | | (6,319,475 | ) |
| | | | | | | | | |
| DISTRIBUTIONS TO SHAREHOLDERS | | | | | | | | |
| Total Distributions Paid | | | | | | | | |
| Investor Class | | | (5,046,464 | ) | | | (6,610,378 | ) |
| Advisor Class | | | (371,762 | ) | | | (493,805 | ) |
| Net decrease in net assets from distributions to shareholders | | | (5,418,226 | ) | | | (7,104,183 | ) |
| | | | | | | | | |
| FROM SHARES OF BENEFICIAL INTEREST | | | | | | | | |
| Proceeds from shares sold | | | | | | | | |
| Investor Class | | | 1,304,744 | | | | 811,203 | |
| Advisor Class | | | 209,574 | | | | 208,068 | |
| Net asset value of shares issued in reinvestment of distributions | | | | | | | | |
| Investor Class | | | 4,922,425 | | | | 6,447,755 | |
| Advisor Class | | | 369,000 | | | | 489,920 | |
| Payments for shares redeemed | | | | | | | | |
| Investor Class | | | (13,102,404 | ) | | | (9,963,628 | ) |
| Advisor Class | | | (1,176,902 | ) | | | (1,149,505 | ) |
| Redemption fee proceeds | | | | | | | | |
| Investor Class | | | 89 | | | | 60 | |
| Advisor Class | | | 6 | | | | 5 | |
| Net decrease in net assets from shares of beneficial interest | | | (7,473,468 | ) | | | (3,156,122 | ) |
| | | | | | | | | |
| TOTAL INCREASE/(DECREASE) IN NET ASSETS | | | 4,569,446 | | | | (16,579,780 | ) |
| | | | | | | | | |
| NET ASSETS | | | | | | | | |
| Beginning of Year | | | 73,406,896 | | | | 89,986,676 | |
| End of Year | | $ | 77,976,342 | | | $ | 73,406,896 | |
| | | | | | | | | |
See accompanying notes to financial statements.
| Al Frank Fund |
| STATEMENTS OF CHANGES IN NET ASSETS (Continued) |
| | | For the | | | For the | |
| | | Year Ended | | | Year Ended | |
| | | December 31, 2019 | | | December 31, 2018 | |
| | | | | | | |
| SHARE ACTIVITY - INVESTOR CLASS | | | | | | | | |
| Shares sold | | | 57,215 | | | | 32,583 | |
| Shares reinvested | | | 208,843 | | | | 296,858 | |
| Shares redeemed | | | (560,016 | ) | | | (403,523 | ) |
| Net decrease in shares of beneficial interest outstanding | | | (293,958 | ) | | | (74,082 | ) |
| | | | | | | | | |
| SHARE ACTIVITY - ADVISOR CLASS | | | | | | | | |
| Shares sold | | | 9,334 | | | | 8,245 | |
| Shares reinvested | | | 15,629 | | | | 22,525 | |
| Shares redeemed | | | (50,147 | ) | | | (45,051 | ) |
| Net decrease in shares of beneficial interest outstanding | | | (25,184 | ) | | | (14,281 | ) |
| | | | | | | | | |
See accompanying notes to financial statements.
| Al Frank Fund |
| FINANCIAL HIGHLIGHTS |
| |
| Per Share Data and Ratios for a Share of Beneficial Interest Outstanding Throughout Each Year |
| | | Investor Class | |
| | | Year Ended | | | Year Ended | | | Year Ended | | | Year Ended | | | Year Ended | |
| | | December 31, | | | December 31, | | | December 31, | | | December 31, | | | December 31, | |
| | | 2019 | | | 2018 | | | 2017 | | | 2016 | | | 2015 | |
| Net asset value, beginning of year | | $ | 20.72 | | | $ | 24.79 | | | $ | 23.27 | | | $ | 21.13 | | | $ | 24.67 | |
| Activity from investment operations: | | | | | | | | | | | | | | | | | | | | |
| Net investment income (1) | | | 0.30 | | | | 0.25 | | | | 0.32 | | | | 0.29 | | | | 0.24 | |
| Net realized and unrealized gain/(loss) on investments | | | 4.93 | | | | (2.16 | ) | | | 3.79 | | | | 3.03 | | | | (1.83 | ) |
| Total from investment operations | | | 5.23 | | | | (1.91 | ) | | | 4.11 | | | | 3.32 | | | | (1.59 | ) |
| Less distributions from: | | | | | | | | | | | | | | | | | | | | |
| Net investment income | | | (0.31 | ) | | | (0.25 | ) | | | (0.31 | ) | | | (0.30 | ) | | | (0.23 | ) |
| Net realized gain on investments | | | (1.45 | ) | | | (1.91 | ) | | | (2.28 | ) | | | (0.88 | ) | | | (1.69 | ) |
| Return of capital | | | — | | | | — | | | | — | | | | — | | | | (0.03 | ) |
| Total distributions | | | (1.76 | ) | | | (2.16 | ) | | | (2.59 | ) | | | (1.18 | ) | | | (1.95 | ) |
| Paid in capital from redemption fees (5) | | | 0.00 | | | | 0.00 | | | | 0.00 | | | | 0.00 | | | | 0.00 | |
| Net asset value, end of year | | $ | 24.19 | | | $ | 20.72 | | | $ | 24.79 | | | $ | 23.27 | | | $ | 21.13 | |
| Total return (2) | | | 25.47 | % (6) | | | (8.10 | )%( 6) | | | 17.76 | % | | | 15.62 | % | | | (6.32 | )% |
| Net assets, at end of year (000s) | | $ | 72,709 | | | $ | 68,373 | | | $ | 83,611 | | | $ | 69,119 | | | $ | 71,470 | |
| Ratio of gross expenses to average net assets (3)(4) | | | 1.63 | % | | | 1.64 | % | | | 1.61 | % | | | 1.64 | % | | | 1.58 | % |
| Ratio of net expenses to average net assets (4) | | | 1.49 | % | | | 1.49 | % | | | 1.50 | % | | | 1.51 | % | | | 1.49 | % |
| Ratio of net investment income to average net assets (4) | | | 1.29 | % | | | 0.98 | % | | | 1.28 | % | | | 1.33 | % | | | 0.96 | % |
| Portfolio turnover rate | | | 1.78 | % | | | 16.28 | % | | | 22.16 | % | | | 7.99 | % | | | 12.38 | % |
| | | | | | | | | | | | | | | | | | | | | |
| (1) | Per share amounts calculated using the average shares method, which more appropriately presents the per share data for the year. |
| (2) | Total returns shown exclude the effect of applicable redemption fees. Had the Adviser not waived a portion of the Fund’s expenses, total returns would have been lower. |
| (3) | Represents the ratio of expenses to average net assets absent fee waivers and/or expense reimbursements by the Adviser. |
| (4) | Does not include the expenses of other investment companies in which the Fund invests. |
| (5) | Amount represents less than $0.005 per share. |
| (6) | Includes adjustments in accordance with accounting principles generally accepted in the United States and consequently the net asset value for financial reporting purposes and the returns based upon those net asset values may differ from the net asset values and returns for shareholder transactions. |
See accompanying notes to financial statements.
| Al Frank Fund |
| FINANCIAL HIGHLIGHTS |
| |
| Per Share Data and Ratios for a Share of Beneficial Interest Outstanding Throughout Each Year |
| | | Advisor Class | |
| | | Year Ended | | | Year Ended | | | Year Ended | | | Year Ended | | | Year Ended | |
| | | December 31, | | | December 31, | | | December 31, | | | December 31, | | | December 31, | |
| | | 2019 | | | 2018 | | | 2017 | | | 2016 | | | 2015 | |
| Net asset value, beginning of year | | $ | 20.76 | | | $ | 24.83 | | | $ | 23.30 | | | $ | 21.16 | | | $ | 24.71 | |
| Activity from investment operations: | | | | | | | | | | | | | | | | | | | | |
| Net investment income (1) | | | 0.36 | | | | 0.31 | | | | 0.38 | | | | 0.35 | | | | 0.29 | |
| Net realized and unrealized gain/(loss) on investments | | | 4.94 | | | | (2.15 | ) | | | 3.80 | | | | 3.03 | | | | (1.82 | ) |
| Total from investment operations | | | 5.30 | | | | (1.84 | ) | | | 4.18 | | | | 3.38 | | | | (1.53 | ) |
| Less distributions from: | | | | | | | | | | | | | | | | | | | | |
| Net investment income | | | (0.37 | ) | | | (0.32 | ) | | | (0.37 | ) | | | (0.36 | ) | | | (0.30 | ) |
| Net realized gain on investments | | | (1.45 | ) | | | (1.91 | ) | | | (2.28 | ) | | | (0.88 | ) | | | (1.69 | ) |
| Return of capital | | | — | | | | — | | | | — | | | | — | | | | (0.03 | ) |
| Total distributions | | | (1.82 | ) | | | (2.23 | ) | | | (2.65 | ) | | | (1.24 | ) | | | (2.02 | ) |
| Paid in capital from redemption fees (5) | | | 0.00 | | | | 0.00 | | | | 0.00 | | | | 0.00 | | | | 0.00 | |
| Net asset value, end of year | | $ | 24.24 | | | $ | 20.76 | | | $ | 24.83 | | | $ | 23.30 | | | $ | 21.16 | |
| Total return (2) | | | 25.78 | % | | | (7.83 | )% | | | 18.05 | % | | | 15.87 | % | | | (6.09 | )% |
| Net assets, at end of year (000s) | | $ | 5,267 | | | $ | 5,033 | | | $ | 6,376 | | | $ | 2,673 | | | $ | 2,820 | |
| Ratio of gross expenses to average net assets (3)(4) | | | 1.38 | % | | | 1.39 | % | | | 1.36 | % | | | 1.39 | % | | | 1.32 | % |
| Ratio of net expenses to average net assets (4) | | | 1.24 | % | | | 1.24 | % | | | 1.25 | % | | | 1.26 | % | | | 1.24 | % |
| Ratio of net investment income to average net assets (4) | | | 1.54 | % | | | 1.23 | % | | | 1.52 | % | | | 1.59 | % | | | 1.21 | % |
| Portfolio turnover rate | | | 1.78 | % | | | 16.28 | % | | | 22.16 | % | | | 7.99 | % | | | 12.38 | % |
| | | | | | | | | | | | | | | | | | | | | |
| (1) | Per share amounts calculated using the average shares method, which more appropriately presents the per share data for the year. |
| (2) | Total returns shown exclude the effect of applicable redemption fees. Had the Adviser not waived a portion of the Fund’s expenses, total returns would have been lower. |
| (3) | Represents the ratio of expenses to average net assets absent fee waivers and/or expense reimbursements by the Adviser. |
| (4) | Does not include the expenses of other investment companies in which the Fund invests. |
| (5) | Amount represents less than $0.005 per share. |
See accompanying notes to financial statements.
| Al Frank Fund |
| NOTES TO FINANCIAL STATEMENTS at December 31, 2019 |
NOTE 1 - ORGANIZATION
The Al Frank Fund (the “Fund”) is a diversified series of Northern Lights Fund Trust II (the “Trust”), which is registered under the Investment Company Act of 1940, as amended, (the “1940 Act”) as an open-end management investment company. The investment objective of the Al Frank Fund is long-term capital appreciation. The Al Frank Fund Investor and Advisor Classes commenced operations on January 2, 1998, and April 30, 2006, respectively.
Advisor Class Shares are offered primarily to qualified registered investment advisers, financial advisors and investors such as pension and profit sharing plans, employee benefit trusts, endowments, foundations and corporations. Advisor Class Shares may be purchased through certain financial intermediaries and mutual fund supermarkets that charge their customers transaction or other fees with respect to their customers’ investment in the Fund. The Fund may also be purchased by qualified investors directly through the Fund’s Transfer Agent. Wrap account programs established with broker-dealers or financial intermediaries may purchase Advisor Class Shares only if the program for which the shares are being acquired will not require the Fund to pay any type of distribution or administration payment to any third-party. A registered investment advisor may aggregate all client accounts investing in the Fund to meet the Advisor Class Shares investment minimum.
NOTE 2 - SIGNIFICANT ACCOUNTING POLICIES
The following is a summary of significant accounting policies followed by the Fund in preparation of its financial statements. These policies are in conformity with accounting principles generally accepted in the United States of America (“GAAP”). The preparation of financial statements requires management to make estimates and assumptions that affect the reported amounts of assets and liabilities and disclosure of contingent assets and liabilities at the date of the financial statements and the reported amounts of income and expenses for the period. Actual results could differ from those estimates. The Fund is an investment company and accordingly follows the investment company accounting and reporting guidance of the Financial Accounting Standards Board (“FASB”) Accounting Standard Codification Topic 946 “Financial Services – Investment Companies” including FASB Accounting Standard Update “ASU” 2013-08.
| A. | Security Valuation: All investments in securities are recorded at their estimated fair value, as described in Note 3. |
| B. | Federal Income Taxes: It is the Fund’s policy to continue to comply with the requirements of the Internal Revenue Code applicable to regulated investment companies and to distribute substantially all of their taxable income to shareholders. Therefore, no provision for Federal income taxes has been recorded. |
The Fund recognizes the tax benefits of uncertain tax positions only where the position is “more likely than not” to be sustained assuming examination by tax authorities. Management has analyzed the Fund’s tax positions and has concluded that no liability for unrecognized tax benefits should be recorded related to uncertain tax positions taken on returns filed for open tax years ended December 31, 2016 to December 31, 2018, or expected to be taken in the Fund’s December 31, 2019 year-end tax returns. The Fund identifies its major tax jurisdictions as U.S. Federal and the state of Ohio. For the years ended December 31, 2016 through December 31, 2018, the Fund’s jurisdictions included the state of Nebraska. The Fund is not aware of any tax positions for which it is reasonably possible that the total amounts of unrecognized tax benefits will change materially in the next twelve months.
| C. | Security Transactions, Income and Distributions: Security transactions are accounted for on the trade date. Realized gains and losses on securities sold are determined on the basis of identified cost. Interest income is recorded on an accrual basis. Dividend income and distributions to shareholders are recorded on the ex-dividend date. Withholding taxes on foreign dividends have been provided for in accordance with the Fund’s understanding of the applicable country’s tax rules and rates. |
Investment income, expenses (other than those specific to the class of shares), and realized and unrealized gains and losses on investments are allocated to the separate classes of the Fund’s shares
| Al Frank Fund |
| NOTES TO FINANCIAL STATEMENTS at December 31, 2019 (Continued) |
based upon their relative net assets on the date income is earned or expenses, realized and unrealized gains and losses are incurred. The Fund distributes substantially all net investment income, if any, and net realized capital gains, if any, annually. The amount of dividends and distributions to shareholders from net investment income and net realized capital gains is determined in accordance with Federal income tax regulations, which differs from accounting principles generally accepted in the United States of America. To the extent these book/tax differences are permanent, such amounts are reclassified within the capital accounts based on their Federal tax treatment.
| D. | Redemption Fees: The Fund charges a 2% redemption fee to shareholders who redeem shares held for 60 days or less. Such fees are retained by the Fund and accounted for as an addition to paid-in capital. For the year ended December 31, 2019, the Al Frank Fund assessed $95 in redemption fees. |
| E. | Expenses – Expenses of the Trust that are directly identifiable to a specific fund are charged to that fund. Expenses, which are not readily identifiable to a specific fund, are allocated in such a manner as deemed equitable, taking into consideration the nature and type of expense and the relative size of the fund in the Trust. |
| F. | Indemnification– The Trust indemnifies its officers and Trustees for certain liabilities that may arise from the performance of their duties to the Trust. Additionally, in the normal course of business, the Fund enters into contracts that contain a variety of representations and warranties and which provide general indemnities. The Fund’s maximum exposure under these arrangements is unknown, as this would involve future claims that may be made against the Fund that have not yet occurred. However, based on experience, the risk of loss due to these warranties and indemnities appears to be remote. |
NOTE 3 - SECURITIES VALUATION
Securities listed on an exchange are valued at the last reported sale price at the close of the regular trading session of the primary exchange on the business day the value is being determined, or in the case of securities listed on NASDAQ at the NASDAQ Official Closing Price (“NOCP”). In the absence of a sale, such securities shall be valued at the mean between the current bid and ask prices on the day of valuation. Investments valued in currencies other than the U.S. dollar are converted to U.S. dollars using exchange rates obtained from pricing services. Investments in open-end investment companies are valued at net asset value. Short-term debt obligations having 60 days or less remaining until maturity, at time of purchase, may be valued at amortized cost.
The Fund may hold securities, such as private investments, interests in commodity pools, other non-traded securities or temporarily illiquid securities, for which market quotations are not readily available or are determined to be unreliable. These securities will be valued using the “fair value” procedures approved by the Trust’s Board of Trustees (the “Board”). The Board has delegated execution of these procedures to a fair value committee composed of one or more representatives from each of the (i) Trust, (ii) administrator, and (iii) adviser. The committee may also enlist third party consultants such as a valuation specialist at a public accounting firm, valuation consultant or financial officer of a security issuer on an as-needed basis to assist in determining a security-specific fair value. The Board has also engaged a third party valuation firm to attend valuation meetings held by the Trust, review minutes of such meetings and report to the Board on a quarterly basis. The Board reviews and ratifies the execution of this process and the resultant fair value prices at least quarterly to assure the process produces reliable results.
Fair Valuation Process – As noted above, the fair valuation committee is composed of one or more representatives from each of the (i) Trust, (ii) administrator, and (iii) adviser. The applicable investments are valued collectively via inputs from each of these groups. For example, fair value determinations are required for the following securities: (i) securities for which market quotations are insufficient or not readily available on a particular business day (including securities for which there is a short and temporary lapse in the provision of a price by the regular pricing source); (ii) securities for which, in the judgment of the adviser, the prices or values available do not represent the fair value of the instrument, factors which may cause the adviser to make such a judgment include, but are not limited to, the following: only a bid price or an asked price is available; the spread between bid and asked prices is substantial; the frequency of sales; the thinness of the market; the size of reported trades; and actions of the securities markets, such as the suspension or limitation of trading, (iii) securities
| Al Frank Fund |
| NOTES TO FINANCIAL STATEMENTS at December 31, 2019 (Continued) |
determined to be illiquid; and (iv) securities with respect to which an event that will affect the value thereof has occurred (a “significant event”) since the closing prices were established on the principal exchange on which they are traded, but prior to a Fund’s calculation of its net asset value. Specifically, interests in commodity pools or managed futures pools are valued on a daily basis by reference to the closing market prices of each futures contract or other asset held by a pool, as adjusted for pool expenses. Restricted or illiquid securities, such as private investments or non-traded securities are valued via inputs from the adviser based upon the current bid for the security from two or more independent dealers or other parties reasonably familiar with the facts and circumstances of the security (who should take into consideration all relevant factors as may be appropriate under the circumstances). If the adviser is unable to obtain a current bid from such independent dealers or other independent parties, the fair value committee shall determine the fair value of such security using the following factors: (i) the type of security; (ii) the cost at date of purchase; (iii) the size and nature of the Fund’s holdings; (iv) the discount from market value of unrestricted securities of the same class at the time of purchase and subsequent thereto; (v) information as to any transactions or offers with respect to the security; (vi) the nature and duration of restrictions on disposition of the security and the existence of any registration rights; (vii) how the yield of the security compares to similar securities of companies of similar or equal creditworthiness; (viii) the level of recent trades of similar or comparable securities; (ix) the liquidity characteristics of the security; (x) current market conditions; and (xi) the market value of any securities into which the security is convertible or exchangeable.
The Fund utilizes various methods to measure fair value of all of their investments on a recurring basis. GAAP establishes the hierarchy that prioritizes inputs to valuation methods. The three levels of input are:
Level 1 – Unadjusted quoted prices in active markets for identical assets and liabilities that the Fund has the ability to access.
Level 2 – Observable inputs other than quoted prices included in Level 1 that are observable for the asset or liability, either directly or indirectly. These inputs may include quoted prices for the identical instrument in an inactive market, prices for similar instruments, interest rates, prepayment speeds, credit risk, yield curves, default rates and similar data.
Level 3 – Unobservable inputs for the asset or liability, to the extent relevant observable inputs are not available, representing the Fund’s own assumptions about the assumptions a market participant would use in valuing the asset or liability, and would be based on the best information available.
The availability of observable inputs can vary from security to security and is affected by a wide variety of factors, including, for example, the type of security, whether the security is new and not yet established in the marketplace, the liquidity of markets, and other characteristics particular to the security. To the extent that valuation is based on models or inputs that are less observable or unobservable in the market, the determination of fair value requires more judgment. Accordingly, the degree of judgment exercised in determining fair value is greatest for instruments categorized in Level 3.
The inputs used to measure fair value may fall into different levels of the fair value hierarchy. In such cases, for disclosure purposes, the level in the fair value hierarchy within which the fair value measurement falls in its entirety, is determined based on the lowest level input that is significant to the fair value measurement in its entirety.
| Al Frank Fund |
| NOTES TO FINANCIAL STATEMENTS at December 31, 2019 (Continued) |
The inputs or methodology used for valuing securities are not necessarily an indication of the risk associated with investing in those securities. The following tables summarize the inputs used as of December 31, 2019 for the Fund’s assets measured at fair value:
| Al Frank Fund | |
| Common Stocks | | Level 1 | | | Level 2 | | | Level 3 | | | Total | |
| Communication Services | | $ | 5,346,990 | | | $ | — | | | $ | — | | | $ | 5,346,990 | |
| Consumer Discretionary | | | 8,986,290 | | | | — | | | | — | | | | 8,986,290 | |
| Consumer Staples | | | 4,450,169 | | | | — | | | | — | | | | 4,450,169 | |
| Energy | | | 3,737,110 | | | | — | | | | — | | | | 3,737,110 | |
| Financials | | | 12,893,570 | | | | — | | | | — | | | | 12,893,570 | |
| Health Care | | | 8,555,317 | | | | — | | | | — | | | | 8,555,317 | |
| Industrials | | | 8,745,445 | | | | — | | | | — | | | | 8,745,445 | |
| Information Technology | | | 17,095,231 | | | | — | | | | — | | | | 17,095,231 | |
| Materials | | | 4,133,580 | | | | — | | | | — | | | | 4,133,580 | |
| Real Estate | | | 2,647,470 | | | | — | | | | — | | | | 2,647,470 | |
| Total Common Stocks | | | 76,591,172 | | | | — | | | | — | | | | 76,591,172 | |
| Short-Term Investment | | | | | | | | | | | | | | | | |
| Money Market Fund | | | 794,545 | | | | — | | | | — | | | | 794,545 | |
| Total Short-Term Investment | | | 794,545 | | | | — | | | | — | | | | 794,545 | |
| Total Investments | | $ | 77,385,717 | | | $ | — | | | $ | — | | | $ | 77,385,717 | |
There were no Level 3 securities held in the Fund during the year ended December 31, 2019.
NOTE 4 - INVESTMENT ADVISORY AGREEMENT AND TRANSACTIONS WITH RELATED PARTIES
Kovitz Investment Group Partners, LLC serves as the Fund’s investment adviser (the “Adviser”).
Pursuant to an investment advisory agreement with the Fund (the “Advisory Agreement”), the Adviser, under the oversight of the Board, directs the daily operations of the Fund and supervises the performance of administrative and professional services provided by others. As compensation for its services, the Fund pays the Adviser a management fee, computed and accrued daily and paid monthly, at an annual rate of 1.00% of the Fund’s average daily net assets (“Advisory Fees”).
For the year ended December 31, 2019, the Adviser earned $766,756 in Advisory Fees.
Pursuant to a written contract (the “Waiver Agreement”), the Adviser has agreed, at least until April 30, 2020, to waive a portion of its advisory fee and has agreed to reimburse the Fund for other expenses to the extent necessary so that the total expenses incurred by the Fund (excluding any front-end or contingent deferred loads, brokerage fees and commissions, acquired fund fees and expenses, borrowing costs, (such as interest and dividend expense on securities sold short) taxes and extraordinary expenses such as litigation) do not exceed 1.49% and 1.24% of the Fund’s average net assets for Investor Class and Advisor Class shares, respectively. Any such reduction made by the Adviser in its fees or payment of expenses which are the Fund’s obligation are subject to reimbursement by the Fund to the Adviser, if so requested by the Adviser, in subsequent fiscal years only if the aggregate amount actually paid by the Fund toward the operating expenses for such fiscal year (taking into account the reimbursement) would not cause the Fund to exceed the expense limitation in effect at the time of the waiver or currently in effect, whichever is lower. The Adviser is permitted to receive reimbursement from the Fund for fees it waived and Fund expenses it paid only if reimbursement is made within three years from the date the fees and expenses were initially waived or reimbursed. Any such reimbursement is also contingent upon the Board’s review and approval at the time the reimbursement is made. Such reimbursement may not be paid prior to the Fund’s payment of current ordinary operating expenses. For the year ended December 31, 2019, the Adviser waived its fees in the amount of $105,460.
Cumulative expenses subject to recapture pursuant to the aforementioned conditions expire as follows:
| 12/31/2020 | | | 12/31/2021 | | | 12/31/2022 | |
| $ | 85,266 | | | $ | 133,701 | | | $ | 105,460 | |
| Al Frank Fund |
| NOTES TO FINANCIAL STATEMENTS at December 31, 2019 (Continued) |
During the year ended December 31, 2019, $94,767 of previously waived fees expired unrecouped.
Distributor- The distributor for the Fund is Northern Lights Distributors LLC (the “Distributor”) and acts as the Fund’s principal underwriter in a continuous public offering of the Fund’s shares. The Board has adopted the Trust’s Master Distribution and Shareholder Servicing Plan for Investor Class shares (the “Investor Class Plan”) pursuant to Rule 12b-1 under the 1940 Act to pay for ongoing distribution-related activities or shareholder services. Under the Investor Class Plan, the Fund is permitted to pay a fee at an annual rate of 0.25% of the average daily net assets of the Fund’s Investor Class shares. The Fund pays the Distributor to provide compensation for ongoing distribution-related activities or services and/or maintenance of the Fund’s shareholder accounts, not otherwise required to be provided by the Adviser. The Plan is a compensation plan, which means that compensation is provided regardless of 12b-1 expenses incurred. For the year ended December 31, 2019, the Al Frank Fund Investor Class shares incurred 12b-1 fees of $178,434. For the year ended December 31, 2019, the Al Frank Fund Investor Class shares paid the Distributor underwriting fees of $0.
In addition, certain affiliates of the Distributor provide services to the Fund as follows:
Gemini Fund Services, LLC (“GFS”), GFS, an affiliate of the Distributor, provides administration, fund accounting, and transfer agent services to the Trust. Pursuant to separate servicing agreements with GFS, the Fund pays GFS customary fees for providing administration, fund accounting and transfer agency services to the Fund. Certain officers of the Trust are also officers of GFS, and are not paid any fees directly by the Fund for serving in such capacities.
Northern Lights Compliance Services, LLC (“NLCS”) – NLCS, an affiliate of GFS and the Distributor, provides a Chief Compliance Officer to the Trust, as well as related compliance services, pursuant to a consulting agreement between NLCS and the Trust. Under the terms of such agreement, NLCS receives customary fees from the Fund.
Blu Giant, LLC (“Blu Giant”)– Blu Giant, an affiliate of GFS and the Distributor, provides EDGAR conversion and filing services as well as print management services for the Fund on an ad-hoc basis. For the provision of these services, Blu Giant receives customary fees from the Fund.
On February 1, 2019, NorthStar Financial Services Group, LLC, the parent company of GFS and its affiliated companies including NLD, NLCS and Blu Giant (collectively, the “Gemini Companies”), sold its interest in the Gemini Companies to a third party private equity firm that contemporaneously acquired Ultimus Fund Solutions, LLC (an independent mutual fund administration firm) and its affiliates (collectively, the “Ultimus Companies”). As a result of these separate transactions, the Gemini Companies and the Ultimus Companies are now indirectly owned through a common parent entity, The Ultimus Group, LLC.
NOTE 5 – PURCHASES AND SALES OF SECURITIES
For the year ended December 31, 2019, the cost of purchases and the proceeds from sales of securities, excluding short-term securities, for the Fund was $1,335,341 and $12,870,212, respectively.
NOTE 6 – AGGREGATE UNREALIZED APPRECIATION & DEPRECIATION – TAX BASIS
| Cost for Federal Tax purposes | | $ | 44,430,206 | |
| Unrealized Appreciation | | $ | 34,411,097 | |
| Unrealized Depreciation | | | (1,455,586 | ) |
| Tax Net Unrealized Appreciation | | $ | 32,955,511 | |
| Al Frank Fund |
| NOTES TO FINANCIAL STATEMENTS at December 31, 2019 (Continued) |
NOTE 7 – DISTRIBUTIONS TO SHAREHOLDERS AND TAX COMPONENTS OF CAPITAL
The tax character of portfolio distributions paid for the following years was as follows:
| | | Fiscal Year Ended | | | Fiscal Year Ended | |
| | | December 31, 2019 | | | December 31, 2018 | |
| Ordinary Income | | $ | 965,823 | | | $ | 817,098 | |
| Long-Term Capital Gain | | | 4,452,403 | | | | 6,263,668 | |
| Return of Capital | | | — | | | | 23,417 | |
| | | $ | 5,418,226 | | | $ | 7,104,183 | |
As of December 31, 2019, the components of accumulated earnings/(deficit) on a tax basis were as follows:
| Undistributed | | | Undistributed | | | Post October Loss | | | Capital Loss | | | Other | | | Unrealized | | | Total | |
| Ordinary | | | Long-Term | | | and | | | Carry | | | Book/Tax | | | Appreciation/ | | | Accumulated | |
| Income | | | Gains | | | Late Year Loss | | | Forwards | | | Differences | | | (Depreciation) | | | Earnings/(Deficits) | |
| $ | 143,619 | | | $ | 1,033,188 | | | $ | — | | | $ | — | | | $ | — | | | $ | 32,955,511 | | | $ | 34,132,318 | |
| | | | | | | | | | | | | | | | | | | | | | | | | | | |
The difference between book basis and tax basis accumulated net realized gain, and unrealized appreciation from investments is primarily attributable to the tax deferral of losses on wash sales and C-Corporation return of capital distributions.
NOTE 8 – NEW ACCOUNTING PRONOUNCEMENTS
In August 2018, the FASB issued Accounting Standards Update (“ASU”) No. 2018-13, which changes certain fair value measurement disclosure requirements. The new ASU, in addition to other modifications and additions, removes the requirement to disclose the amount and reasons for transfers between Level 1 and Level 2 of the fair value hierarchy, and the policy for the timing of transfers between levels. For investment companies, the amendments are effective for financial statements issued for fiscal years beginning after December 15, 2019, and interim periods within those fiscal years. Early adoption is allowed and the Fund has adopted these amendments early.
NOTE 9 – SUBSEQUENT EVENT
Subsequent events after the date of the Statement of Assets and Liabilities have been evaluated through the date the financial statements were issued. Management has determined that no events or transactions occurred requiring adjustment or disclosure in the financial statements.

REPORT OF INDEPENDENT REGISTERED PUBLIC ACCOUNTING FIRM
To the Board of Trustees of Northern Lights Fund Trust II
and the Shareholders of Al Frank Fund
Opinion on the Financial Statements
We have audited the accompanying statement of assets and liabilities of Al Frank Fund, a series of shares of beneficial interest in Northern Lights Fund Trust II (the“Fund”), including the schedule of investments, as of December 31, 2019, and the related statement of operations for the year then ended, the statements of changes in net assets for each of the years in the two-year period then ended and the financial highlights for each of the years in the five-year period then ended, and the related notes (collectively referred to as the“financial statements”). In our opinion, the financial statements present fairly, in all material respects, the financial position of the Fund as of December 31, 2019, and the results of its operations for the year then ended, the changes in its net assets for each of the years in the two-year period then ended and its financial highlights for each of the years in the five-year period then ended, in conformity with accounting principles generally accepted in the United States of America.
Basis for Opinion
These financial statements are the responsibility of the Fund’ management. Our responsibility is to express an opinion on the Fund’s financial statements based on our audits. We are a public accounting firm registered with the Public Company Accounting Oversight Board (United States) (“PCAOB”) and are required to be independent with respect to the Fund in accordance with the U.S. federal securities law and the applicable rules and regulations of the Securities and Exchange Commission and the PCAOB.
We conducted our audits in accordance with the standards of the PCAOB. Those standards require that we plan and perform the audit to obtain reasonable assurance about whether the financial statements are free of material misstatement, whether due to error or fraud. The Fund is not required to have, nor were we engaged to perform, an audit of its internal control over financial reporting. As part of our audit we are required to obtain an understanding of internal control over financial reporting but not for the purpose of expressing an opinion on the effectiveness of the Fund’s internal control over financial reporting. Accordingly, we express no such opinion.
Our audits included performing procedures to assess the risk of material misstatement of the financial statements, whether due to error or fraud, and performing procedures that respond to those risks. Such procedures included examining, on a test basis, evidence regarding the amounts and disclosures in the financial statements. Our procedures included confirmation of securities owned as of December 31, 2019 by correspondence with the custodian. Our audits also included evaluating the accounting principles used and significant estimates made by management, as well as evaluating the overall presentation of the financial statements. We believe that our audits provide a reasonable basis for our opinion.
BBD, LLP
We have served as the auditor of one or more of the Funds in the Northern Lights Fund Trust II since 2012.
Philadelphia, Pennsylvania
February 28, 2020
| Al Frank Fund |
| EXPENSE EXAMPLES at December 31, 2019 (Unaudited) |
Generally, shareholders of mutual funds incur two types of costs: (1) transaction costs, redemption fees, and exchange fees, and (2) ongoing costs, including management fees, distribution and/or service fees, and other Fund expenses. This Example is intended to help you understand your ongoing costs (in dollars) of investing in the Fund and to compare these costs with the ongoing costs of investing in other mutual funds. The Example is based on an investment of $1,000 invested in both the Investor Class and the Advisor Class at the beginning of the period and held for the entire period (7/1/19 12/31/19).
Actual Expenses
The first line of the tables below provides information about actual account values and actual expenses, with actual net expenses being limited to 1.49% and 1.24% per the operating expenses limitation agreement for the Al Frank Fund Investor Class and Advisor Class, respectively. Although the Fund does not charge a sales load or transaction fees, you will be assessed fees for outgoing wire transfers, returned checks, and stop payment orders at prevailing rates charged by Gemini Fund Services, LLC, the Funds’ transfer agent. The Example below includes, but is not limited to, management fees, 12b-1 fees, fund accounting, custody and transfer agent fees. You may use the information in the first line, together with the amount you invested, to estimate the expenses that you paid over the period. Simply divide your account value by $1,000 (for example, an $8,600 account value divided by $1,000 = 8.6), then multiply the result by the number in the first line under the heading entitled “Expenses Paid During Period’’ to estimate the expenses you paid on your account during this period.
Hypothetical Example for Comparison Purposes
The second line of the tables below provides information about hypothetical account values and hypothetical expenses based on the Fund’s actual expense ratio and an assumed rate of return of 5% per year before expenses, which is not the Fund’s actual return. The hypothetical account values and expenses may not be used to estimate the actual ending account balance or expenses you paid for the period. You may use this information to compare the ongoing costs of investing in the Fund’s and other funds. To do so, compare this 5% hypothetical example with the 5% hypothetical examples that appear in the shareholder reports of the other funds. Please note that the expenses shown in the table are meant to highlight your ongoing costs only and do not reflect any transaction costs, such as redemption fees, or exchange fees. Therefore, the second line of the tables is useful in comparing ongoing costs only, and will not help you determine the relative total costs of owning different funds. In addition, if these costs were included, your costs would have been higher.
| | | | | | | | | | | | | | | |
| | | | | | | | | | | Expenses Paid | | | Expense Ratio | |
| | | | | Beginning Account | | | Ending Account | | | During Period * | | | During Period ** | |
| Actual | | Value 7/1/2019 | | | Value 12/31/2019 | | | 7/1/19-12/31/19 | | | 7/1/19-12/31/19 | |
| Al Frank Fund | | | | | | | | | | | | |
| | | Investor Class | | $ | 1,000.00 | | | $ | 1,107.70 | | | $ | 7.92 | | | | 1.49 | % |
| | | Advisor Class | | | 1,000.00 | | | | 1,109.30 | | | | 6.59 | | | | 1.24 | % |
| Hypothetical (5% return before Expenses) | | | | | | | | | | | | | | | | |
| Al Frank Fund | | | | | | | | | | | | | | | | |
| | | Investor Class | | $ | 1,000.00 | | | $ | 1,017.69 | | | $ | 7.58 | | | | 1.49 | % |
| | | Advisor Class | | | 1,000.00 | | | | 1,018.95 | | | | 6.31 | | | | 1.24 | % |
| * | Expenses are equal to the average account value over the period, multiplied by the Fund’s annualized expense ratio, multiplied by the number of days in the period (184) divided by the number of days in the fiscal year (365). |
| Al Frank Fund |
| SUPPLEMENTAL INFORMATION (Unaudited)(Continued) |
| December 31, 2019 |
The Trustees and the officers of the Trust are listed below with their present positions with the Trust and principal occupations over at least the last five years. The business address of each Trustee and Officer is 225 Pictoria Drive, Suite 450, Cincinnati, OH 45246. All correspondence to the Trustees and Officers should be directed to c/o Gemini Fund Services, LLC, P.O. Box 541150, Omaha, Nebraska 68154. .
Independent Trustees
Name and
Year of Birth | Position/Term of
Office* | Principal Occupation
During the Past Five Years | Number of
Portfolios
Overseen by
Trustee*** | Other Directorships held by
Trustee
During the Past Five Years |
Thomas T.
Sarkany
1946 | Trustee Since October 2011 | President, TTS Consultants, LLC (financial services) (since 2010). | 1 | Director, Aquila Distributors; Trustee, Arrow ETF Trust; Trustee, Arrow Investments Trust; Trustee, Northern Lights Fund Trust IV |
Anthony H.
Lewis
1946 | Trustee Since May 2011 | Chairman and CEO of The Lewis Group USA (executive consulting firm) (since 2007). | 1 | Director, Member of the Compensation Committee and Member of the Risk Committee of Torotel Inc. (Magnetics, Aerospace and Defense), Trustee, Chairman of the Fair Valuation Committee and Member of the Audit Committee of the Wildermuth Endowment Strategy Fund |
Keith
Rhoades
1948 | Trustee Since May 2011 | Retired since 2008. | 1 | NONE |
Randal D.
Skalla
1962 | Trustee Since May 2011 | President, L5 Enterprises, Inc. (financial services company) (since 2001). | 1 | Board Member, Orizon Investment Counsel (financial services company) (from 2001 to 2017) |
| Al Frank Fund |
| SUPPLEMENTAL INFORMATION (Unaudited)(Continued) |
| December 31, 2019 |
Interested Trustees and Officers
Name and
Year of Birth | Position/Term
of Office* | Principal Occupation
During the Past Five Years | Number of
Portfolios
Overseen
by
Trustee*** | Other Directorships held by
Trustee
During the Past Five Years |
Brian Nielsen**
1972 | Trustee Since May 2011 | Trustee (since 2011) of Northern Lights Fund Trust II; Special Projects Counsel of NorthStar Financial Services Group, LLC (from 2018 to 2019); General Counsel (from 2001 to 2014) and Secretary (from 2001 to 2018) of CLS Investments, LLC; General Counsel (from 2001 to 2014) and Secretary (from 2001 to 2018) of Orion Advisor Services, LLC; Manager (from 2012 to 2015), General Counsel and Secretary (from 2003 to 2018) of NorthStar Financial Services Group, LLC; CEO (from 2012 to 2018), General Counsel (from 2003 to 2014), Secretary (from 2003 to 2018) and Manager (from 2005 to 2018) of Northern Lights Distributors, LLC; Director, Secretary and General Counsel (from 2004 to 2018) of Constellation Trust Company; CEO (from 2015 to 2018), Manager (from 2008 to 2015), General Counsel and Secretary (from 2011 to 2018) of Northern Lights Compliance Services, LLC; General Counsel and Secretary (from 2011 to 2018) of Blu Giant, LLC; General Counsel (from 2012 to 2014) and Secretary (from 2012 to 2018) of Gemini Fund Services, LLC; Manager (from 2012 to 2018) of Arbor Point Advisors, LLC; General Counsel and Secretary (from 2013 to 2014) of Gemini Hedge Fund Services, LLC; General Counsel and Secretary (from 2013 to 2014) of Gemini Alternative Funds, LLC; Secretary and General Counsel of NorthStar Holdings, LLC (from 2013 to 2015); Director, Secretary and General Counsel of NorthStar CTC Holdings, Inc. (from 2015 to 2018) and Secretary and Chief Legal Officer (from 2003 to 2018) of AdvisorOne Funds. | 1 | Manager of Northern Lights Distributors, LLC (from 2005 to 2018); Manager of NorthStar Financial Services Group, LLC (from 2012 to 2015); Manager of Arbor Point Advisors, LLC (from 2012 to 2018); Director of Constellation Trust Company |
Kevin E.
Wolf
1969 | President Since January 2013 | Vice President of The Ultimus Group, LLC and Executive Vice President of Gemini Fund Services, LLC (since 2019), President, Gemini Fund Services, LLC (2012 - 2019) | N/A | N/A |
Richard
Malinowski
1983 | Secretary Since January 2018 | Senior Vice President Legal Administration, Gemini Fund Services, LLC (since April 2017); Vice President and Counsel (April 2016 to 2017) and AVP and Staff Attorney (September 2012 to March 2016). | N/A | N/A |
Erik Naviloff
1968 | Treasurer Since January 2013 | Vice President of Gemini Fund Services, LLC (since 2011). | N/A | N/A |
Emile R.
Molineaux
1962 | Chief Compliance Officer and Anti Money Laundering Officer Since May 2011 | Senior Compliance Officer and CCO of Various clients of Northern Lights Compliance Services, LLC (since 2011). | N/A | N/A |
| * | The term of office for each Trustee and Officer listed above will continue indefinitely. |
| ** | Brian Nielsen is an “interested person” of the Trust as that term is defined under the 1940 Act, because of his former affiliation with Northern Lights Distributors, LLC (the Fund’s Distributor). |
| *** | As of December 31, 2019, the Trust was comprised of 20 active portfolios managed by unaffiliated investment advisers. The term “Fund Complex” applies only to the Fund and not to any other series of the Trust. The Fund does not hold itself out as related to any other series within the Trust for investment purposes, nor does it share the same investment adviser with any other series. |
The Fund’s Statement of Additional Information (“SAI”) includes additional information about the Trustees and is available free of charge, upon request, by calling toll-free at 1-855-873-3837.
Privacy Policy
Rev. May 2019
| FACTS | WHAT DOES NORTHERN LIGHTS FUND TRUST II (“NLFT II”) DO WITH YOUR PERSONAL INFORMATION? |
| Why? | Financial companies choose how they share your personal information. Federal law gives consumers the right to limit some but not all sharing. Federal law also requires us to tell you how we collect, share, and protect your personal information. Please read this notice carefully to understand what we do. |
| What? | The types of personal information we collect and share depend on the product or service you have with us. This information can include:
|
● Social Security number ● Employment information ● Account balances | ● Account transactions ● Income ● Investment experience |
When you are no longer our customer, we continue to share your information as described in this notice. |
| How? | All financial companies need to share a customer’s personal information to run their everyday business - to process transactions, maintain customer accounts, and report to credit bureaus. In the section below, we list the reasons financial companies can share their customer’s personal information; the reasons NLFT II chooses to share; and whether you can limit this sharing. |
| | |
| Reasons we can share your personal information | Does NLFT II
share? | Can you limit
this sharing? |
For our everyday business purposes —
such as to process your transactions, maintain your account(s), respond to court orders and legal investigations, or report to credit bureaus
| Yes | No |
For our marketing purposes —
to offer our products and services to you
| Yes | No |
For joint marketing with other financial companies
| Yes | No |
For our affiliates’ everyday business purposes —
information about your transactions and experiences
| Yes | No |
For our affiliates’ everyday business purposes —
information about your creditworthiness
| No | We don’t share |
For nonaffiliates to market to you
| No | We don’t share |
| Questions? | Call 1-402-493-4603 |
| | |
| Who we are |
| Who is providing this notice? | Northern Lights Fund Trust II |
| What we do |
| How does NLFT II protect my personal information? | To protect your personal information from unauthorized access and use, we use security measures that comply with federal law. These measures include computer safeguards and secured files and buildings.
|
| How does NLFT II collect my personal information? | We collect your personal information, for example, when you
|
● open an account ● give us your income information ● provide employment information | ● provide account information ● give us your contact information |
| We also collect your personal information from others, such as credit bureaus, affiliates, or other companies. |
| Why can’t I limit all sharing? | Federal law gives you the right to limit only ● sharing for affiliates’ everyday business purposes—information about your creditworthiness ● affiliates from using your information to market to you ● sharing for nonaffiliates to market to you State laws and individual companies may give you additional rights to limit sharing. |
| Definitions |
| Affiliates | Companies related by common ownership or control. They can be financial and nonfinancial companies. ● Northern Lights Fund Trust II has no affiliates. |
| Nonaffiliates | Companies not related by common ownership or control. They can be financial and nonfinancial companies. ● NLFT II does not share with nonaffiliates so they can market to you. |
| Joint marketing | A formal agreement between nonaffiliated financial companies that together market financial products and services to you. ● Our joint marketing partners include other financial service companies. |
| Advisor |
| Kovitz Investment Group Partners, LLC |
| 115 S. LaSalle Street, 27th Floor |
| Chicago, IL 60603 |
| alfrankfunds.com |
| |
| Distributor |
| Northern Lights Distributors, LLC |
| 4221 North 203rd Street, Suite 100 |
| Elkhorn, NE 68022 |
| |
| Transfer Agent |
| Gemini Fund Services, LLC |
| 4221 North 203rd Street, Suite 100 |
| Elkhorn, NE 68022 |
PROXY VOTING POLICY
Information regarding how the Fund voted proxies relating to portfolio securities for the most recent twelve month period ended June 30 as well as a description of the policies and procedures that the Fund used to determine how to vote proxies is available without charge, upon request, by calling 1-888-263-6443 or by referring to the Securities and Exchange Commission’s (“SEC”) website at http://www.sec.gov.
PORTFOLIO HOLDINGS
The Fund files its complete schedule of portfolio holdings with the SEC for the first and third quarters of each fiscal year on Form N-Q. Form N-Q is available on the SEC’s website at http://www.sec.gov and may be reviewed and copied at the SEC’s Public Reference Room in Washington, DC (1-800-SEC-0330). The information on Form N-Q is available without charge, upon request, by calling 1-888-263-6443.
This report is intended for shareholders of the Fund and may not be used as sales literature unless preceded or accompanied by a current prospectus. Statements and other information herein are dated and are subject to change.

If you have any questions or need help with your account, call our customer service team at:
888.263.6443
The Al Frank Fund’s website contains resources for both current and potential shareholders, including:
| ● | Performance through the most recent quarter and month-end |
| ● | Applications, including new account forms, IRA and IRA transfer forms |
| ● | Electronic copies of the Prospectus, Annual Report and Semi-Annual Report |
All of this information and more is available at:
alfrankfunds.com
Must be preceded or accompanied by a prospectus. Please refer to the prospectus for important information about the investment company, including investment objectives, risks, charges and expenses.
Small company investing involves greater volatility, limited liquidity and other risks.
Item 2. Code of Ethics.
(a) As of the end of the period covered by this report, the registrant has adopted a code of ethics that applies to the registrant's principal executive officer, principal financial officer, principal accounting officer or controller, or persons performing similar functions, regardless of whether these individuals are employed by the registrant or a third party.
(b) For purposes of this item, “code of ethics” means written standards that are reasonably designed to deter wrongdoing and to promote:
| (1) | Honest and ethical conduct, including the ethical handling of actual or apparent conflicts of interest between personal and professional relationships; |
| (2) | Full, fair, accurate, timely, and understandable disclosure in reports and documents that a registrant files with, or submits to, the Commission and in other public communications made by the registrant; |
(3) Compliance with applicable governmental laws, rules, and regulations;
| (4) | The prompt internal reporting of violations of the code to an appropriate person or persons identified in the code; and |
(5) Accountability for adherence to the code.
(c) Amendments: During the period covered by the report, there have not been any amendments to the provisions of the code of ethics.
(d) Waivers: During the period covered by the report, the registrant has not granted any express or implicit waivers from the provisions of the code of ethics.
(e) The Code of Ethics is not posted on Registrant’ website.
(f) A copy of the Code of Ethics is attached as an exhibit.
Item 3. Audit Committee Financial Expert.
(a)(1)ii The board of directors of the fund has determined that the fund does not have an audit committee financial expert serving on its audit committee.
(a)(2) Not applicable.
(a)(3) In this regard, no member of the audit committee was identified as having all of the required technical attributes identified in instruction 2 (b) to item 3 of Form N-CSR to qualify as an “audit committee financial expert,” whether through the type of specialized education or experience required by that instruction. At this time, the board believes the experience provided by each member of the audit committee collectively offers the fund adequate oversight by its audit committee given the fund’s level of financial complexity. The board will from time to time reexamine such belief.
Item 4. Principal Accountant Fees and Services.
2019 - $13,000
2018 - $13,000
2017 - $25,000
2016 - $25,000
2015 - $25,000
2019 - None
2018 - None
2017 - None
2016 - None
2015 - None
2019 - $2,200
2018 - $2,200
2017 - $4,400
2016 - $4,400
2015 - $4,000
Preparation of Federal & State income tax returns, assistance with calculation of required income, capital gain and excise distributions and preparation of Federal excise tax returns.
2019 - None
2018 - None
2017 - None
2016 - None
2015 - None
| (e) | (1)Audit Committee’s Pre-Approval Policies |
The registrant’s Audit Committee is required to pre-approve all audit services and, when appropriate, any non-audit services (including audit-related, tax and all other services) to the registrant. The registrant’s Audit Committee also is required to pre-approve, when appropriate, any non-audit services (including audit-related, tax and all other services) to its adviser, or any entity controlling, controlled by or under common control with the adviser that provides ongoing services to the registrant, to the extent that the services may be determined to have an impact on the operations or financial reporting of the registrant. Services are reviewed on an engagement by engagement basis by the Audit Committee.
| (2) | Percentages of Services Approved by the Audit Committee |
| | | 2019 | | 2018 | | 2017 | | 2016 | | 2015 |
| Audit-Related Fees: | | | 0.00 | % | | | 0.00 | % | | | 0.00 | % | | | 0.00 | % | | | 0.00 | % |
| Tax Fees: | | | 0.00 | % | | | 0.00 | % | | | 0.00 | % | | | 0.00 | % | | | 0.00 | % |
| All Other Fees: | | | 0.00 | % | | | 0.00 | % | | | 0.00 | % | | | 0.00 | % | | | 0.00 | % |
| | | | | | | | | | | | | | | | | | | | | |
| (f) | During the audit of registrant's financial statements for the most recent fiscal year, less than 50 percent of the hours expended on the principal accountant's engagement were attributed to work performed by persons other than the principal accountant's full-time, permanent employees. |
| (g) | The aggregate non-audit fees billed by the registrant's accountant for services rendered to the registrant, and rendered to the registrant's investment adviser (not including any sub-adviser whose role is primarily portfolio management and is subcontracted with or overseen by another investment adviser), and any entity controlling, controlled by, or under common control with the adviser that provides ongoing services to the registrant: |
2019 - $2,200
2018 - $2,200
2017 - $4,400
2016 - $4,400
2015 - $4,000
(h) The registrant's audit committee has considered whether the provision of non-audit services to the registrant's investment adviser (not including any sub-adviser whose role is primarily portfolio management and is subcontracted with or overseen by another investment adviser), and any entity controlling, controlled by, or under common control with the investment adviser that provides ongoing services to the registrant, that were not pre-approved pursuant to paragraph (c)(7)(ii) of Rule 2-01 of Regulation S-X, is compatible with maintaining the principal accountant's independence.
Item 5. Audit Committee of Listed Companies.Not applicable to open-end investment companies.
Item 6. Schedule of Investments.See Item 1.
Item 7. Disclosure of Proxy Voting Policies and Procedures for Closed-End Funds. Not applicable to open-end investment companies.
Item 8. Portfolio Managers of Closed-End Management Investment Companies. Not applicable to open-end investment companies.
Item 9. Purchases of Equity Securities by Closed-End Funds. Not applicable to open-end investment companies.
Item 10. Submission of Matters to a Vote of Security Holders. None
Item 11. Controls and Procedures.
(a) Based on an evaluation of the Registrant’s disclosure controls and procedures as of a date within 90 days of filing date of this Form N-CSR, the principal executive officer and principal financial officer of the Registrant have concluded that the disclosure controls and procedures of the Registrant are reasonably designed to ensure that the information required in filings on Form N-CSR is recorded, processed, summarized, and reported by the filing date, including that information required to be disclosed is accumulated and communicated to the Registrant’s management, including the Registrant’s principal executive officer and principal financial officer, as appropriate to allow timely decisions regarding required disclosure.
(b) There were no significant changes in the Registrant’s internal control over financial reporting that occurred during the Registrant’s last fiscal half-year that have materially affected, or are reasonably likely to materially affect, the Registrant’s internal control over financial reporting.
Item 12. Disclosure of Securities Lending Activities for Closed-End Management Investment Companies. Not applicable to open-end investment companies.
Item 13. Exhibits.
(a)(1) Code of Ethics herewith.
(a)(2) Certifications required by Section 302 of the Sarbanes-Oxley Act of 2002 (and Item 11(a)(2) of Form N-CSR) are filed herewith.
(a)(3) Not applicable for open-end investment companies.
(b) Certifications required by Section 906 of the Sarbanes-Oxley Act of 2002 (and Item 11(b) of Form N-CSR) are filed herewith.
SIGNATURES
Pursuant to the requirements of the Securities Exchange Act of 1934 and the Investment Company Act of 1940, the registrant has duly caused this report to be signed on its behalf by the undersigned, thereunto duly authorized.
(Registrant)Northern Lights Fund Trust II
By (Signature and Title)
/s/ Kevin E. Wolf
Kevin E. Wolf, Principal Executive Officer/President
Date 3/6/20
Pursuant to the requirements of the Securities Exchange Act of 1934 and the Investment Company Act of 1940, this report has been signed below by the following persons on behalf of the registrant and in the capacities and on the dates indicated.
By (Signature and Title)
/s/ Kevin E. Wolf
Kevin E. Wolf, Principal Executive Officer/President
Date 3/6/20
By (Signature and Title)
/s/ Erik Naviloff
Erik Naviloff, Principal Financial Officer/Treasurer
Date 3/6/20