united states
securities and exchange commission
washington, d.c. 20549
form n-csr
certified shareholder report of registered management
investment companies
Investment Company Act file number 811-22549
Northern Lights Fund Trust II
(Exact name of registrant as specified in charter)
225 Pictoria Drive, Suite 450, Cincinnati, Ohio 45246
(Address of principal executive offices) (Zip code)
Kevin Wolf, Gemini Fund Services, LLC
80 Arkay Drive, Hauppauge, NY 11788
(Name and address of agent for service)
Registrant's telephone number, including area code: 631-470-2619
Date of fiscal year end: 12/31
Date of reporting period:12/31/19
Item 1. Reports to Stockholders.
 |
| |
| |
| |
| |
| |
| Acclivity Small Cap Value Fund |
| |
| |
| |
| |
| |
| Annual Report |
| |
| December 31, 2019 |
| |
| |
| |
| |
| |
| |
| |
| www.acclivityfunds.com |
| 1 (855) 873-3837 |
| |
| |
| |
| |
| |
| |
| |
| |
| Distributed by Northern Lights Distributors, LLC |
| Member FINRA |
| |
| |
| |
| |
| |
| |
Beginning on January 1, 2021, as permitted by regulations adopted by the Securities and Exchange Commission, paper copies of the Fund’s shareholder reports like this one will no longer be sent by mail, unless you specifically request paper copies of the reports. Instead, the reports will be made available on the Fund’s website www.acclivityfunds.com, and you will be notified by mail each time a report is posted and provided with a website link to access the report.
If you already elected to receive shareholder reports electronically, you will not be affected by this change and you need not take any action. You may elect to receive shareholder reports and other communications from the Fund electronically or to continue receiving paper copies of shareholder reports, which are available free of charge, by contacting your financial intermediary (such as a broker-dealer or bank) or, if you are a direct investor, by following the instructions included with paper Fund documents that have been mailed to you.
US Market Review (Unaudited)
A Brief Recap
The U.S. equity market had a stellar year in 2019, as all three primary U.S. indices returned more than 20%. Across different market capitalization segments, the U.S. large-cap, as represented by the Russell 1000 Index, finished the year up 31.43%, the U.S. mid-cap, as represented by the Russell Midcap Index, up 30.54%, and U.S. small-cap, as represented by the Russell 2000 Index, up 25.52%. Among all the GICS sectors, Information Technology and Communication outperformed while Energy and Healthcare lagged. In 2019, value securities underperformed growth securities across different market capitalization segments. Within the Small Caps for this period, value underperformed growth with the Russell 2000 Value Total Return Index (“Russell 2000 Value”) returned 22.39%, while the Russell 2000 Growth Total Return Index returned 28.48%. The Acclivity Small Cap Value Fund I Share class (“AXVIX”) returned 18.44% for the 2019 calendar year. Exhibit 1 compares the quarterly performance of AXVIX and the Russell 2000 Value.
Exhibit 1. Quarterly Performance of AXVIX v.s. Russell 2000 Value in 2019
| 2019 Performance | Q1 | Q2 | Q3 | Q4 | YTD |
| AXVIX | 12.50% | -0.89% | -1.08% | 7.38% | 18.44% |
| Russell 2000 Value | 11.93% | 1.37% | -0.57% | 8.49% | 22.39% |
Source: Innealta Capital using Bloomberg data.
The underperformance of value and small-capitalization securities has been a headwind for the Acclivity Small Cap Value Fund given its profound overweights to small and lower relatively priced securities throughout the year 2019. Exhibit 2 compares the characteristics of the fund relative to the Russell 2000 Value.
Exhibit 2. Characteristics of AXVIX v.s. Russell 2000 Value Index as of December 31st, 2019.
| Fund/Index | Price-to-
Book | Price-to-
Earnings | EBITDA/Total Market
Value | Market
Capitalization ($B) |
| AXVIX | 1.04 | 12.11 | 8.58% | 1.95 |
| Russell 2000 Value | 1.44 | 15.03 | 5.11% | 2.20 |
Source: Innealta Capital using Bloomberg data.
Over the long run, value securities have outperformed growth securities, and small-capitalization securities have outperformed their large counterparts. We believe that the size and value premiums will persist in the future as their existence makes intuitive sense and these recent trends are well within the realm of possible outcomes.
Currently, the valuation spread between Value and Growth is near its widest measurements over the last 20 years. This could imply that value securities are cheap relative to historical standards, and potentially present an attractive buying opportunity.
Looking into the historical performance of Value and Growth, the current underperformance of Value is not surprising. Although value has a long-term outperformance track record, value tends to underperform growth when the economy is slowing down. See Exhibit 3 for Small-Cap Value v.s. Small-Cap Growth average annual return based on U.S. economic growth.
We believe that the monetary and fiscal policy easing has played a major role in this outperformance of growth investing. However, investing is a marathon, and as the business cycle progresses, we believe that value investing will deliver excess returns as it has done in the past.
Exhibit 3. Small-Cap Value underperforms Small-Cap Growth when the economy is slowing down
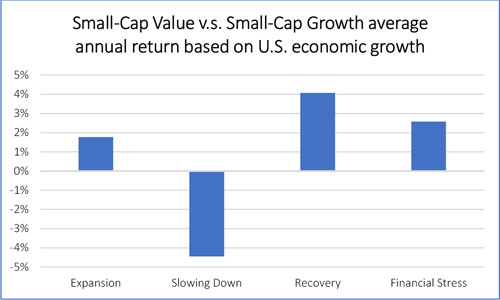
Source: Innealta Capital. Small-Cap Value refers to Russell 2000 Value TR Index, and Small-Cap Growth refers to Russell 2000 Growth TR Index. Time frame from December 1996 to December 2019. Frequency quarterly. “Expansion” is defined as both the first derivative and the second derivative of Real GDP Growth are positive. “Slowing Down” is defined as the first derivative of Real GDP Growth is positive, and the second derivative of Real GDP Growth is negative. “Recovery” is defined as the first derivative of Real GDP Growth is negative, and the second derivative of Real GDP Growth is positive. “Financial Stress” is defined as both the first derivative and the second derivative of Real GDP Growth are negative. Real GDP Growth refers to Real Gross Domestic Product [A191RL1Q225SBEA], sourced from the U.S. Bureau of Economic Analysis, retrieved from FRED, Federal Reserve Bank of St. Louis.
Disclosures and Important Information
Russell 1000 Indexis a stock market index that tracks the highest-ranking 1,000 stocks in the Russell 3000 Index.Russell 2000 Indexis a small-cap stock market index of the bottom 2,000 stocks in the Russell 3000 Index.Russell 2000 Value Indexmeasures the performance of Russell 2000 companies with lower price-to-book ratios and lower forecasted growth values. Total return indexes reinvest dividends.Russell 2000 Growth Index measures the performance of Russell 2000 companies with higher price-to-book ratios and higher forecasted growth values. Total return indexes reinvest dividends.Russell Midcap Index is a stock market index that tracks the 800 smallest companies in the Ruessell 1000 Index, which represent approximately 25% of the total market capitalization of the Russell 1000 Index. Frank Russell Company is the source and owner of the trademarks, service marks, and copyrights related to the Russell Indexes. Indices do not reflect any fees, expenses, or sales charges and are not available for direct investment.
Price-to-book ratiois calculated using Index Methodology.Price-to-earnings ratiois calculated using Weighted Harmonic Average.EBITDA/Total Market Valueis a proxy for current cash flow to total market value, commonly known in factor investing as “profitability”.
Investments cannot be made in an index. Unmanaged index returns do not reflect any fees, expenses or sales charges. Past performance is no guarantee of future results.
INN: 424-INN-02/05/2020
NLD: 3186-NLD-2/5/2020
| ACCLIVITY SMALL CAP VALUE FUND |
| PORTFOLIO REVIEW (Unaudited) |
| December 31, 2019 |
| |
The Fund’s performance figures* for the period ended December 31, 2019, compared to its benchmark:
| | One Year | Since Inception (12/31/18) |
| Acclivity Small Cap Value Fund - Class I | 18.44% | 18.44% |
| Acclivity Small Cap Value Fund - Class N | 18.34% | 18.34% |
| Russell 2000® Value Total Return Index** | 22.39% | 22.39% |
| S&P 500 Total Return Index*** | 31.49% | 31.49% |
| | | |
Comparison of the Change in Value of a $100,000 Investment
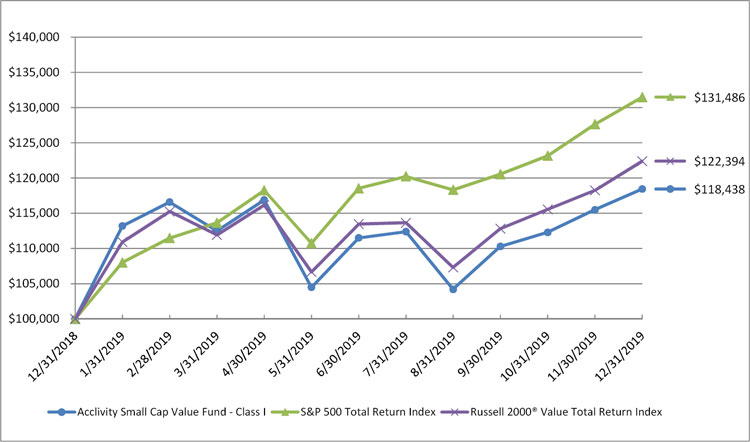
| * | The performance data quoted here represents past performance. The performance comparison includes reinvestment of all dividends and capital gain distributions, if any. Current performance may be lower or higher than the performance data quoted above. Past performance is no guarantee of future results. The investment return and principal value of an investment will fluctuate so that investor’s shares, when redeemed, may be worth more or less than their original cost. The returns shown do not reflect the deduction of taxes that a shareholder would pay on Fund distributions or on the redemption of Fund shares. The Fund’s total annual operating expenses are 0.95% for Class I shares and 1.20% for Class N shares per the December 31, 2018, prospectus. After fee waivers, the Fund’s total annual operating expenses are 0.68% for Class I shares and 0.93% for Class N shares. For performance information current to the most recent month-end, please call toll-free 1-855-873-3837 (1-855-USE-ETFS). |
| ** | The Russell 2000® Value Total Return Index measures the performance of the largest 2,000 U.S. companies determined by total market capitalization. Investors cannot invest directly in an index. |
| *** | The S&P 500 Total Return Index is a widely accepted, unmanaged index of U.S. stock market performance which does not take into account charges, fees and other expenses. Investors cannot invest directly in an index. |
| | Holdings By Asset Class as of December 31, 2019 | | % of Net Assets | |
| | Common Stocks | | | 99.7 | % |
| | Short-Term Investment | | | 3.8 | % |
| | Liabilities in Excess of Other Assets | | | (3.5 | )% |
| | | | | 100.0 | % |
| | | | | | |
Please refer to the Portfolio of Investments in this annual report for a detailed analysis of the Fund’s holdings.
| ACCLIVITY SMALL CAP VALUE FUND |
| PORTFOLIO OF INVESTMENTS |
| December 31, 2019 |
| Shares | | | | | Value | |
| | | | | COMMON STOCKS - 99.7% | | | | |
| | | | | AEROSPACE/DEFENSE - 0.4% | | | | |
| | 30 | | | Astronics Corp. * | | $ | 838 | |
| | 40 | | | Ducommun, Inc. * | | | 2,021 | |
| | 84 | | | Moog, Inc. | | | 7,168 | |
| | 21 | | | National Presto Industries, Inc. | | | 1,856 | |
| | | | | | | | 11,883 | |
| | | | | AGRICULTURE - 0.4% | | | | |
| | 75 | | | Alico, Inc. | | | 2,687 | |
| | 380 | | | S&W Seed Co. * | | | 798 | |
| | 155 | | | Universal Corp. | | | 8,844 | |
| | | | | | | | 12,329 | |
| | | | | AIRLINES - 1.3% | | | | |
| | 491 | | | Hawaiian Holdings, Inc. | | | 14,381 | |
| | 547 | | | Mesa Air Group, Inc. * | | | 4,890 | |
| | 284 | | | SkyWest, Inc. | | | 18,355 | |
| | | | | | | | 37,626 | |
| | | | | APPAREL - 0.2% | | | | |
| | 48 | | | Lakeland Industries, Inc. * | | | 518 | |
| | 76 | | | Rocky Brands, Inc. | | | 2,237 | |
| | 149 | | | Tandy Leather Factory, Inc. * | | | 851 | |
| | 92 | | | Unifi, Inc. * | | | 2,324 | |
| | 22 | | | Weyco Group, Inc. | | | 582 | |
| | | | | | | | 6,512 | |
| | | | | AUTO MANUFACTURERS - 0.2% | | | | |
| | 396 | | | Wabash National Corp. | | | 5,817 | |
| | | | | | | | | |
| | | | | AUTO PARTS & EQUIPMENT - 2.0% | | | | |
| | 665 | | | China Automotive Systems, Inc. * | | | 2,095 | |
| | 210 | | | Cooper Tire & Rubber Co. | | | 6,037 | |
| | 1,349 | | | Dana, Inc. | | | 24,552 | |
| | 443 | | | Goodyear Tire & Rubber Co. (The) | | | 6,891 | |
| | 276 | | | Methode Electronics, Inc. | | | 10,861 | |
| | 81 | | | Miller Industries, Inc. | | | 3,008 | |
| | 130 | | | Motorcar Parts of America, Inc. * | | | 2,864 | |
| | | | | | | | 56,308 | |
| | | | | BANKS - 19.3% | | | | |
| | 82 | | | American River Bankshares | | | 1,219 | |
| | 1,220 | | | Associated Banc-Corp. | | | 26,889 | |
| | 12 | | | Bank of Princeton (The) | | | 378 | |
| | 942 | | | Bank OZK | | | 28,736 | |
| | 105 | | | Bar Harbor Bankshares | | | 2,666 | |
| | 162 | | | BCB Bancorp, Inc. | | | 2,234 | |
| | | | | | | | | |
See accompanying notes to financial statements.
| ACCLIVITY SMALL CAP VALUE FUND |
| PORTFOLIO OF INVESTMENTS (Continued) |
| December 31, 2019 |
| Shares | | | | | Value | |
| | | | | BANKS - 19.3% (Continued) | | | | |
| | 773 | | | Byline Bancorp, Inc. | | $ | 15,128 | |
| | 488 | | | Cadence BanCorp | | | 8,847 | |
| | 132 | | | Capstar Financial Holdings, Inc. | | | 2,198 | |
| | 52 | | | CBM Bancorp, Inc. * | | | 734 | |
| | 279 | | | CenterState Bank Corp. | | | 6,969 | |
| | 157 | | | Civista Bancshares, Inc. | | | 3,768 | |
| | 18 | | | Codorus Valley Bancorp, Inc. | | | 415 | |
| | 10 | | | Community Financial Corp. (The) | | | 356 | |
| | 56 | | | County Bancorp, Inc. | | | 1,435 | |
| | 161 | | | Customers Bancorp, Inc. * | | | 3,833 | |
| | 34 | | | Equity Bancshares, Inc. * | | | 1,050 | |
| | 156 | | | First Bancshares, Inc. (The) | | | 5,541 | |
| | 55 | | | First Business Financial Services, Inc. | | | 1,448 | |
| | 525 | | | First Financial Bancorp | | | 13,356 | |
| | 128 | | | First Financial Corp. | | | 5,852 | |
| | 1 | | | First Guaranty Bancshares, Inc. | | | 11 | |
| | 1,326 | | | First Midwest Bancorp, Inc. | | | 30,578 | |
| | 90 | | | First Northwest Bancorp | | | 1,632 | |
| | 997 | | | FNB Corp. | | | 12,662 | |
| | 526 | | | Great Western Bancorp, Inc. | | | 18,273 | |
| | 567 | | | Hancock Whitney Corp. | | | 24,880 | |
| | 363 | | | Hanmi Financial Corp. | | | 7,258 | |
| | 374 | | | Heartland Financial USA, Inc. | | �� | 18,603 | |
| | 1,082 | | | Hilltop Holdings, Inc. | | | 26,974 | |
| | 120 | | | HomeStreet, Inc. * | | | 4,080 | |
| | 1,455 | | | Hope Bancorp, Inc. | | | 21,621 | |
| | 147 | | | Howard Bancorp, Inc. * | | | 2,481 | |
| | 319 | | | IBERIABANK Corp. | | | 23,871 | |
| | 244 | | | Lakeland Bancorp, Inc. | | | 4,241 | |
| | 115 | | | LCNB Corp. | | | 2,220 | |
| | 79 | | | Mackinac Financial Corp. | | | 1,379 | |
| | 12 | | | Middlefield Banc Corp. | | | 313 | |
| | 213 | | | Midland States Bancorp, Inc. | | | 6,168 | |
| | 120 | | | MidWestOne Financial Group, Inc. | | | 4,348 | |
| | 1,290 | | | Old National Bancorp | | | 23,594 | |
| | 10 | | | Old Point Financial Corp. | | | 275 | |
| | 45 | | | OP Bancorp | | | 467 | |
| | 517 | | | Opus Bank | | | 13,375 | |
| | 168 | | | Orrstown Financial Services, Inc. | | | 3,800 | |
| | 745 | | | PacWest Bancorp | | | 28,511 | |
| | 135 | | | PCB Bancorp | | | 2,333 | |
| | 144 | | | Peapack Gladstone Financial Corp. | | | 4,450 | |
| | 283 | | | Peoples Bancorp, Inc. | | | 9,809 | |
| | 45 | | | Premier Financial Bancorp, Inc. | | | 816 | |
| | 11 | | | RBB Bancorp | | | 233 | |
| | 414 | | | Renasant Corp. | | | 14,664 | |
| | | | | | | | | |
See accompanying notes to financial statements.
| ACCLIVITY SMALL CAP VALUE FUND |
| PORTFOLIO OF INVESTMENTS (Continued) |
| December 31, 2019 |
| Shares | | | | | Value | |
| | | | | BANKS - 19.3% (Continued) | | | | |
| | 137 | | | Riverview Financial Corp. | | $ | 1,711 | |
| | 278 | | | Sandy Spring Bancorp, Inc. | | | 10,531 | |
| | 12 | | | SB Financial Group, Inc. | | | 236 | |
| | 25 | | | SB One Bancorp | | | 623 | |
| | 112 | | | Select Bancorp, Inc. * | | | 1,378 | |
| | 641 | | | Simmons First National Corp. | | | 17,172 | |
| | 120 | | | SmartFinancial, Inc. | | | 2,838 | |
| | 88 | | | South State Corp. | | | 7,634 | |
| | 237 | | | Southern National Bancorp of Virginia, Inc. | | | 3,875 | |
| | 1,688 | | | Umpqua Holdings Corp. | | | 29,878 | |
| | 53 | | | United Bancshares, Inc. | | | 1,204 | |
| | 259 | | | Univest Financial Corp. | | | 6,936 | |
| | 246 | | | Western New England Bancorp, Inc. | | | 2,369 | |
| | 192 | | | Wintrust Financial Corp. | | | 13,613 | |
| | | | | | | | 546,970 | |
| | | | | BEVERAGES - 0.0% ** | | | | |
| | 8 | | | Coffee Holding Co., Inc. * | | | 37 | |
| | | | | | | | | |
| | | | | BIOTECHNOLOGY - 0.8% | | | | |
| | 22 | | | ANI Pharmaceuticals, Inc. * | | | 1,357 | |
| | 300 | | | Harvard Bioscience, Inc. * | | | 915 | |
| | 808 | | | PDL BioPharma, Inc. * | | | 2,622 | |
| | 80 | | | resTORbio, Inc. * | | | 119 | |
| | 174 | | | United Therapeutics Corp. * | | | 15,326 | |
| | 104 | | | Xencor, Inc. * | | | 3,577 | |
| | | | | | | | 23,916 | |
| | | | | BUILDING MATERIALS - 1.3% | | | | |
| | 199 | | | Apogee Enterprises, Inc. | | | 6,468 | |
| | 421 | | | Griffon Corp. | | | 8,559 | |
| | 73 | | | LSI Industries, Inc. | | | 442 | |
| | 70 | | | PGT Innovations, Inc. * | | | 1,044 | |
| | 73 | | | Select Interior Concepts, Inc. * | | | 656 | |
| | 586 | | | Summit Materials, Inc. * | | | 14,005 | |
| | 121 | | | US Concrete, Inc. * | | | 5,041 | |
| | | | | | | | 36,215 | |
| | | | | BUSINESS DEVELOPMENT COMPANIES - 2.4% | | | | |
| | 391 | | | BlackRock Capital Investment Corp. | | | 1,941 | |
| | 594 | | | BlackRock TCP Capital Corp. | | | 8,346 | |
| | 147 | | | Capital Southwest Corp. | | | 3,059 | |
| | 216 | | | Entasis Therapeutics Holdings, Inc. * | | | 1,073 | |
| | 356 | | | Fidus Investment Corp. | | | 5,283 | |
| | 13 | | | Medallion Financial Corp. * | | | 94 | |
| | 1,687 | | | Oaktree Specialty Lending Corp. | | | 9,211 | |
| | 564 | | | PennantPark Floating Rate Capital Ltd. | | | 6,870 | |
| | 1,618 | | | Prospect Capital Corp. | | | 10,420 | |
| | | | | | | | | |
See accompanying notes to financial statements.
| ACCLIVITY SMALL CAP VALUE FUND |
| PORTFOLIO OF INVESTMENTS (Continued) |
| December 31, 2019 |
| Shares | | | | | Value | |
| | | | | BUSINESS DEVELOPMENT COMPANIES - 2.4% (Continued) | | | | |
| | 155 | | | Saratoga Investment Corp. | | $ | 3,867 | |
| | 494 | | | Solar Capital Ltd. | | | 10,186 | |
| | 98 | | | Stellus Capital Investment Corp. | | | 1,395 | |
| | 298 | | | TCG BDC, Inc. | | | 3,987 | |
| | 168 | | | WhiteHorse Finance, Inc. | | | 2,302 | |
| | | | | | | | 68,034 | |
| | | | | CHEMICALS - 0.7% | | | | |
| | 61 | | | Hawkins, Inc. | | | 2,794 | |
| | 75 | | | Innophos Holdings, Inc. | | | 2,399 | |
| | 58 | | | Kraton Corp. * | | | 1,469 | |
| | 28 | | | Oil-Dri Corp. of America | | | 1,015 | |
| | 347 | | | PQ Group Holdings, Inc. * | | | 5,961 | |
| | 47 | | | Rogers Corp. * | | | 5,862 | |
| | | | | | | | 19,500 | |
| | | | | COAL - 0.2% | | | | |
| | 268 | | | Warrior Met Coal, Inc. | | | 5,663 | |
| | | | | | | | | |
| | | | | COMMERCIAL SERVICES - 4.4% | | | | |
| | 214 | | | Aaron’s, Inc. | | | 12,222 | |
| | 234 | | | ABM Industries, Inc. | | | 8,824 | |
| | 476 | | | Acacia Research Corp. * | | | 1,266 | |
| | 81 | | | American Public Education, Inc. * | | | 2,219 | |
| | 684 | | | BrightView Holdings, Inc. * | | | 11,539 | |
| | 172 | | | CAI International, Inc. * | | | 4,985 | |
| | 61 | | | Carriage Services, Inc. | | | 1,562 | |
| | 146 | | | CBIZ, Inc. * | | | 3,936 | |
| | 156 | | | DLH Holdings Corp. * | | | 654 | |
| | 419 | | | Emerald Expositions Events, Inc. | | | 4,420 | |
| | 156 | | | Ennis, Inc. | | | 3,377 | |
| | 180 | | | GP Strategies Corp. * | | | 2,381 | |
| | 13 | | | Graham Holdings Co. | | | 8,307 | |
| | 77 | | | Heidrick & Struggles International, Inc. | | | 2,503 | |
| | 188 | | | Herc Holdings, Inc. * | | | 9,201 | |
| | 465 | | | Hertz Global Holdings, Inc. * | | | 7,324 | |
| | 419 | | | Kelly Services, Inc. | | | 9,461 | |
| | 108 | | | Korn Ferry | | | 4,579 | |
| | 139 | | | Macquarie Infrastructure Corp. | | | 5,955 | |
| | 146 | | | Resources Connection, Inc. | | | 2,384 | |
| | 372 | | | SEACOR Marine Holdings, Inc. * | | | 5,130 | |
| | 424 | | | TrueBlue, Inc. * | | | 10,201 | |
| | 28 | | | Vectrus, Inc. * | | | 1,435 | |
| | | | | | | | 123,865 | |
| | | | | COMPUTERS - 2.0% | | | | |
| | 187 | | | Cubic Corp. | | | 11,888 | |
| | 16 | | | Data I/O Corp. * | | | 67 | |
| | 121 | | | Insight Enterprises, Inc. * | | | 8,505 | |
| | | | | | | | | |
See accompanying notes to financial statements.
| ACCLIVITY SMALL CAP VALUE FUND |
| PORTFOLIO OF INVESTMENTS (Continued) |
| December 31, 2019 |
| Shares | | | | | Value | |
| | | | | COMPUTERS - 2.0% (Continued) | | | | |
| | 56 | | | Key Tronic Corp. * | | $ | 305 | |
| | 78 | | | MTS Systems Corp. | | | 3,746 | |
| | 762 | | | NetScout Systems, Inc. * | | | 18,341 | |
| | 91 | | | NetSol Technologies, Inc. * | | | 364 | |
| | 289 | | | OneSpan, Inc. * | | | 4,948 | |
| | 237 | | | Sykes Enterprises, Inc. * | | | 8,767 | |
| | | | | | | | 56,931 | |
| | | | | COSMETICS/PERSONAL CARE - 0.4% | | | | |
| | 337 | | | Edgewell Personal Care Co. * | | | 10,434 | |
| | | | | | | | | |
| | | | | DISTRIBUTION/WHOLESALE - 2.4% | | | | |
| | 64 | | | Core-Mark Holding Co., Inc. | | | 1,740 | |
| | 36 | | | Educational Development Corp. | | | 222 | |
| | 500 | | | G-III Apparel Group Ltd. * | | | 16,750 | |
| | 174 | | | Houston Wire & Cable Co. * | | | 767 | |
| | 735 | | | KAR Auction Services, Inc. | | | 16,016 | |
| | 232 | | | ScanSource, Inc. * | | | 8,572 | |
| | 242 | | | Veritiv Corp. * | | | 4,760 | |
| | 354 | | | Wesco Aircraft Holdings, Inc. * | | | 3,901 | |
| | 273 | | | WESCO International, Inc. * | | | 16,213 | |
| | | | | | | | 68,941 | |
| | | | | DIVERSIFIED FINANCIAL SERVICES - 2.1% | | | | |
| | 9 | | | Altisource Portfolio Solutions SA * | | | 174 | |
| | 34 | | | Associated Capital Group, Inc. | | | 1,333 | |
| | 20 | | | Consumer Portfolio Services, Inc. * | | | 67 | |
| | 256 | | | Encore Capital Group, Inc. * | | | 9,052 | |
| | 683 | | | EZCORP, Inc. * | | | 4,658 | |
| | 29 | | | First Western Financial, Inc. * | | | 478 | |
| | 446 | | | GAIN Capital Holdings, Inc. | | | 1,762 | |
| | 881 | | | Legg Mason, Inc. | | | 31,637 | |
| | 27 | | | Marlin Business Services Corp. | | | 593 | |
| | 59 | | | Nicholas Financial, Inc. * | | | 486 | |
| | 269 | | | Oppenheimer Holdings, Inc. | | | 7,392 | |
| | 81 | | | Regional Management Corp. * | | | 2,432 | |
| | | | | | | | 60,064 | |
| | | | | ELECTRIC - 0.1% | | | | |
| | 216 | | | Ameresco, Inc. * | | | 3,780 | |
| | | | | | | | | |
| | | | | ELECTRICAL COMPONENTS & EQUIPMENT - 0.4% | | | | |
| | 116 | | | Belden, Inc. | | | 6,380 | |
| | 52 | | | Encore Wire Corp. | | | 2,985 | |
| | 40 | | | Powell Industries, Inc. | | | 1,960 | |
| | 100 | | | Ultralife Corp. * | | | 739 | |
| | | | | | | | 12,064 | |
| | | | | | | | | |
See accompanying notes to financial statements.
| ACCLIVITY SMALL CAP VALUE FUND |
| PORTFOLIO OF INVESTMENTS (Continued) |
| December 31, 2019 |
| Shares | | | | | Value | |
| | | | | ELECTRONICS - 2.4% | | | | |
| | 325 | | | Avnet, Inc. | | $ | 13,793 | |
| | 200 | | | Aware, Inc. * | | | 672 | |
| | 61 | | | Bel Fuse, Inc. | | | 1,250 | |
| | 21 | | | FARO Technologies, Inc. * | | | 1,057 | |
| | 96 | | | Identiv, Inc. * | | | 541 | |
| | 228 | | | Kimball Electronics, Inc. * | | | 4,001 | |
| | 382 | | | Knowles Corp. * | | | 8,079 | |
| | 78 | | | Plexus Corp. * | | | 6,001 | |
| | 347 | | | Sanmina Corp. * | | | 11,881 | |
| | 563 | | | TTM Technologies, Inc. * | | | 8,473 | |
| | 319 | | | Vishay Intertechnology, Inc. | | | 6,792 | |
| | 74 | | | Vishay Precision Group, Inc. * | | | 2,516 | |
| | 343 | | | ZAGG, Inc. * | | | 2,782 | |
| | | | | | | | 67,838 | |
| | | | | ENERGY - ALTERNATE SOURCES - 0.1% | | | | |
| | 200 | | | FutureFuel Corp. | | | 2,478 | |
| | | | | | | | | |
| | | | | ENGINEERING & CONSTRUCTION - 1.3% | | | | |
| | 190 | | | Aegion Corp. * | | | 4,250 | |
| | 91 | | | Dycom Industries, Inc. * | | | 4,291 | |
| | 70 | | | Limbach Holdings, Inc. * | | | 265 | |
| | 237 | | | Mistras Group, Inc. * | | | 3,382 | |
| | 160 | | | MYR Group, Inc. * | | | 5,214 | |
| | 55 | | | NV5 Global, Inc. * | | | 2,775 | |
| | 244 | | | Primoris Services Corp. | | | 5,427 | |
| | 93 | | | Sterling Construction Co., Inc. * | | | 1,309 | |
| | 732 | | | Tutor Perini Corp. * | | | 9,414 | |
| | 20 | | | VSE Corp. | | | 761 | |
| | | | | | | | 37,088 | |
| | | | | ENTERTAINMENT - 0.0% ** | | | | |
| | 60 | | | Golden Entertainment, Inc. * | | | 1,153 | |
| | | | | | | | | |
| | | | | ENVIRONMENTAL CONTROL - 0.0% ** | | | | |
| | 180 | | | CECO Environmental Corp. * | | | 1,379 | |
| | 152 | | | Quest Resource Holding Corp. * | | | 331 | |
| | | | | | | | 1,710 | |
| | | | | FOOD - 1.2% | | | | |
| | 184 | | | Hain Celestial Group, Inc. (The) * | | | 4,776 | |
| | 24 | | | Ingles Markets, Inc. | | | 1,140 | |
| | 101 | | | Natural Grocers by Vitamin Cottage, Inc. | | | 997 | |
| | 210 | | | Tootsie Roll Industries, Inc. | | | 7,169 | |
| | 31 | | | TreeHouse Foods, Inc. * | | | 1,503 | |
| | 1,134 | | | United Natural Foods, Inc. * | | | 9,934 | |
| | 60 | | | Village Super Market, Inc. | | | 1,392 | |
| | 140 | | | Weis Markets, Inc. | | | 5,669 | |
| | | | | | | | 32,580 | |
| | | | | | | | | |
See accompanying notes to financial statements.
| ACCLIVITY SMALL CAP VALUE FUND |
| PORTFOLIO OF INVESTMENTS (Continued) |
| December 31, 2019 |
| Shares | | | | | Value | |
| | | | | FOREST PRODUCTS & PAPER - 1.3% | | | | |
| | 170 | | | Clearwater Paper Corp. * | | $ | 3,631 | |
| | 525 | | | Domtar Corp. | | | 20,076 | |
| | 276 | | | PH Glatfelter Co. | | | 5,051 | |
| | 416 | | | Verso Corp. * | | | 7,500 | |
| | | | | | | | 36,258 | |
| | | | | HAND/MACHINE TOOLS - 0.4% | | | | |
| | 67 | | | LS Starrett Co. (The) * | | | 383 | |
| | 125 | | | Regal Beloit Corp. | | | 10,701 | |
| | | | | | | | 11,084 | |
| | | | | HEALTHCARE - PRODUCTS - 0.7% | | | | |
| | 54 | | | Alpha Pro Tech Ltd. * | | | 185 | |
| | 39 | | | CryoLife, Inc. * | | | 1,056 | |
| | 110 | | | FONAR Corp. * | | | 2,166 | |
| | 33 | | | Luminex Corp. | | | 764 | |
| | 63 | | | Natus Medical, Inc. * | | | 2,078 | |
| | 267 | | | OraSure Technologies, Inc. * | | | 2,144 | |
| | 314 | | | Patterson Cos., Inc. | | | 6,431 | |
| | 9 | | | Utah Medical Products, Inc. | | | 971 | |
| | 162 | | | Varex Imaging Corp. * | | | 4,829 | |
| | | | | | | | 20,624 | |
| | | | | HEALTHCARE - SERVICES - 0.9% | | | | |
| | 722 | | | Brookdale Senior Living, Inc. * | | | 5,249 | |
| | 80 | | | LHC Group, Inc. * | | | 11,021 | |
| | 18 | | | Psychemedics Corp. | | | 165 | |
| | 433 | | | Select Medical Holdings Corp. * | | | 10,106 | |
| | | | | | | | 26,541 | |
| | | | | HOME BUILDERS - 6.7% | | | | |
| | 493 | | | Beazer Homes USA, Inc. * | | | 6,966 | |
| | 362 | | | Century Communities, Inc. * | | | 9,901 | |
| | 128 | | | Forestar Group, Inc. * | | | 2,669 | |
| | 883 | | | Green Brick Partners, Inc. * | | | 10,137 | |
| | 506 | | | KB Home | | | 17,341 | |
| | 91 | | | LGI Homes, Inc. * | | | 6,429 | |
| | 353 | | | M/I Homes, Inc. * | | | 13,891 | |
| | 631 | | | MDC Holdings, Inc. | | | 24,079 | |
| | 170 | | | Meritage Homes Corp. * | | | 10,389 | |
| | 1,171 | | | Taylor Morrison Home Corp. * | | | 25,598 | |
| | 218 | | | Thor Industries, Inc. | | | 16,195 | |
| | 1,428 | | | TRI Pointe Group, Inc. * | | | 22,248 | |
| | 803 | | | William Lyon Homes * | | | 16,044 | |
| | 146 | | | Winnebago Industries, Inc. | | | 7,735 | |
| | | | | | | | 189,622 | |
| | | | | HOME FURNISHINGS - 0.3% | | | | |
| | 896 | | | Daktronics, Inc. | | | 5,457 | |
| | 66 | | | Hooker Furniture Corp. | | | 1,696 | |
| | | | | | | | 7,153 | |
| | | | | | | | | |
See accompanying notes to financial statements.
| ACCLIVITY SMALL CAP VALUE FUND |
| PORTFOLIO OF INVESTMENTS (Continued) |
| December 31, 2019 |
| Shares | | | | | Value | |
| | | | | HOUSEHOLD PRODUCTS/WARES - 1.3% | | | | |
| | 1,455 | | | ACCO Brands Corp. | | $ | 13,619 | |
| | 346 | | | Central Garden & Pet Co. * | | | 10,159 | |
| | 188 | | | CSS Industries, Inc. | | | 829 | |
| | 243 | | | Quanex Building Products Corp. | | | 4,150 | |
| | 112 | | | Spectrum Brands Holdings, Inc. | | | 7,200 | |
| | | | | | | | 35,957 | |
| | | | | INSURANCE - 5.7% | | | | |
| | 277 | | | Ambac Financial Group, Inc. * | | | 5,975 | |
| | 955 | | | American Equity Investment Life Holding Co. | | | 28,583 | |
| | 159 | | | American National Insurance Co. | | | 18,711 | |
| | 1,362 | | | CNO Financial Group, Inc. | | | 24,693 | |
| | 285 | | | Employers Holdings, Inc. | | | 11,899 | |
| | 7,332 | | | Genworth Financial, Inc. * | | | 32,261 | |
| | 76 | | | Global Indemnity Ltd. | | | 2,252 | |
| | 490 | | | Heritage Insurance Holdings, Inc. | | | 6,492 | |
| | 7 | | | Investors Title Co. | | | 1,114 | |
| | 292 | | | National General Holdings Corp. | | | 6,453 | |
| | 40 | | | National Western Life Group, Inc. | | | 11,635 | |
| | 135 | | | Protective Insurance Corp. | | | 2,172 | |
| | 116 | | | Security National Financial Corp. * | | | 679 | |
| | 364 | | | Tiptree, Inc. | | | 2,963 | |
| | 4 | | | White Mountains Insurance Group Ltd. | | | 4,462 | |
| | | | | | | | 160,344 | |
| | | | | INTERNET - 0.8% | | | | |
| | 132 | | | Cars.com, Inc. * | | | 1,613 | |
| | 1,146 | | | DHI Group, Inc. * | | | 3,449 | |
| | 39 | | | ePlus, Inc. * | | | 3,287 | |
| | 123 | | | HealthStream, Inc. * | | | 3,346 | |
| | 92 | | | Lands’ End, Inc. * | | | 1,546 | |
| | 992 | | | Meet Group, Inc. (The) * | | | 4,970 | |
| | 138 | | | PC-Tel, Inc. | | | 1,169 | |
| | 400 | | | Support.com, Inc. | | | 436 | |
| | 328 | | | TrueCar, Inc. * | | | 1,558 | |
| | | | | | | | 21,374 | |
| | | | | IRON/STEEL - 1.9% | | | | |
| | 619 | | | Allegheny Technologies, Inc. * | | | 12,789 | |
| | 232 | | | Carpenter Technology Corp. | | | 11,549 | |
| | 609 | | | Commercial Metals Co. | | | 13,562 | |
| | 86 | | | Friedman Industries, Inc. | | | 518 | |
| | 328 | | | Schnitzer Steel Industries, Inc. | | | 7,111 | |
| | 610 | | | United States Steel Corp. | | | 6,960 | |
| | | | | | | | 52,489 | |
| | | | | LEISURE TIME - 0.1% | | | | |
| | 55 | | | Clarus Corp. | | | 746 | |
| | 118 | | | Escalade, Inc. | | | 1,160 | |
| | | | | | | | 1,906 | |
| | | | | | | | | |
See accompanying notes to financial statements.
| ACCLIVITY SMALL CAP VALUE FUND |
| PORTFOLIO OF INVESTMENTS (Continued) |
| December 31, 2019 |
| Shares | | | | | Value | |
| | | | | LODGING - 0.0% ** | | | | |
| | 339 | | | Full House Resorts, Inc. * | | $ | 1,136 | |
| | | | | | | | | |
| | | | | MACHINERY - DIVERSIFIED - 1.0% | | | | |
| | 180 | | | Altra Industrial Motion Corp. | | | 6,518 | |
| | 111 | | | Columbus McKinnon Corp. | | | 4,443 | |
| | 60 | | | DXP Enterprises, Inc. * | | | 2,389 | |
| | 117 | | | Gencor Industries, Inc. * | | | 1,365 | |
| | 46 | | | Hurco Cos., Inc. | | | 1,765 | |
| | 186 | | | Intevac, Inc. * | | | 1,313 | |
| | 146 | | | NN, Inc. | | | 1,350 | |
| | 155 | | | SPX FLOW, Inc. * | | | 7,575 | |
| | | | | | | | 26,718 | |
| | | | | MEDIA - 3.2% | | | | |
| | 276 | | | Beasley Broadcast Group, Inc. | | | 853 | |
| | 254 | | | Cumulus Media, Inc. * | | | 4,463 | |
| | 130 | | | Emmis Communications Corp. * | | | 524 | |
| | 594 | | | Entercom Communications Corp. | | | 2,756 | |
| | 1,606 | | | Entravision Communications Corp. | | | 4,208 | |
| | 532 | | | EW Scripps Co. (The) | | | 8,358 | |
| | 574 | | | Gannett Co., Inc. | | | 3,662 | |
| | 476 | | | Gray Television, Inc. * | | | 10,205 | |
| | 2,063 | | | Houghton Mifflin Harcourt Co. * | | | 12,894 | |
| | 70 | | | Saga Communications, Inc. | | | 2,128 | |
| | 686 | | | Scholastic Corp. | | | 26,377 | |
| | 624 | | | TEGNA, Inc. | | | 10,415 | |
| | 241 | | | Townsquare Media, Inc. | | | 2,403 | |
| | 360 | | | Urban One, Inc. * | | | 684 | |
| | | | | | | | 89,930 | |
| | | | | METAL FABRICATE/HARDWARE - 1.0% | | | | |
| | 58 | | | Ampco-Pittsburgh Corp. * | | | 175 | |
| | 117 | | | AZZ, Inc. | | | 5,376 | |
| | 53 | | | CIRCOR International, Inc. * | | | 2,451 | |
| | 56 | | | Eastern Co. (The) | | | 1,710 | |
| | 102 | | | LB Foster Co. * | | | 1,977 | |
| | 60 | | | Northwest Pipe Co. * | | | 1,999 | |
| | 178 | | | Olympic Steel, Inc. | | | 3,190 | |
| | 122 | | | Park-Ohio Holdings Corp. | | | 4,105 | |
| | 164 | | | Tredegar Corp. | | | 3,665 | |
| | 121 | | | TriMas Corp. * | | | 3,801 | |
| | | | | | | | 28,449 | |
| | | | | | | | | |
See accompanying notes to financial statements.
| ACCLIVITY SMALL CAP VALUE FUND |
| PORTFOLIO OF INVESTMENTS (Continued) |
| December 31, 2019 |
| Shares | | | | | Value | |
| | | | | MINING - 0.8% | | | | |
| | 1,054 | | | Alcoa Corp. * | | $ | 22,671 | |
| | | | | | | | | |
| | | | | MISCELLANEOUS MANUFACTURING - 0.7% | | | | |
| | 192 | | | American Outdoor Brands Corp. * | | | 1,782 | |
| | 89 | | | Haynes International, Inc. | | | 3,184 | |
| | 111 | | | Lydall, Inc. * | | | 2,278 | |
| | 494 | | | Trinity Industries, Inc. | | | 10,942 | |
| | | | | | | | 18,186 | |
| | | | | OFFICE FURNISHINGS - 0.0% ** | | | | |
| | 4 | | | Kewaunee Scientific Corp. | | | 54 | |
| | | | | | | | | |
| | | | | OFFICE/BUSINESS EQUIPMENT - 0.0% ** | | | | |
| | 2 | | | AstroNova, Inc. | | | 27 | |
| | | | | | | | | |
| | | | | OIL & GAS - 1.9% | | | | |
| | 1,273 | | | Berry Petroleum Corp. | | | 12,004 | |
| | 280 | | | Bonanza Creek Energy, Inc. * | | | 6,535 | |
| | 2,549 | | | Laredo Petroleum, Inc. * | | | 7,316 | |
| | 169 | | | Penn Virginia Corp. * | | | 5,129 | |
| | 262 | | | Permrock Royalty Trust | | | 1,410 | |
| | 102 | | | Trecora Resources * | | | 729 | |
| | 1,433 | | | WPX Energy, Inc. * | | | 19,689 | |
| | | | | | | | 52,812 | |
| | | | | OIL & GAS SERVICES - 2.3% | | | | |
| | 61 | | | Era Group, Inc. * | | | 620 | |
| | 1,622 | | | Helix Energy Solutions Group, Inc. * | | | 15,620 | |
| | 253 | | | MRC Global, Inc. * | | | 3,451 | |
| | 543 | | | NOW, Inc. * | | | 6,103 | |
| | 1,081 | | | Oil States International, Inc. * | | | 17,631 | |
| | 86 | | | Ranger Energy Services, Inc. * | | | 554 | |
| | 565 | | | Select Energy Services, Inc. * | | | 5,243 | |
| | 575 | | | Smart Sand, Inc. * | | | 1,449 | |
| | 781 | | | USA Compression Partners LP | | | 14,167 | |
| | | | | | | | 64,838 | |
| | | | | PACKAGING & CONTAINERS - 0.1% | | | | |
| | 76 | | | Matthews International Corp. | | | 2,901 | |
| | | | | | | | | |
| | | | | PHARMACEUTICALS - 1.0% | | | | |
| | 394 | | | Akebia Therapeutics, Inc. * | | | 2,490 | |
| | 593 | | | Akorn, Inc. * | | | 889 | |
| | 92 | | | Anika Therapeutics, Inc. * | | | 4,770 | |
| | 23 | | | BioSpecifics Technologies Corp. * | | | 1,310 | |
| | 296 | | | Corcept Therapeutics, Inc. * | | | 3,582 | |
| | 83 | | | Cumberland Pharmaceuticals, Inc. * | | | 427 | |
| | 27 | | | Enanta Pharmaceuticals, Inc. * | | | 1,668 | |
| | | | | | | | | |
See accompanying notes to financial statements.
| ACCLIVITY SMALL CAP VALUE FUND |
| PORTFOLIO OF INVESTMENTS (Continued) |
| December 31, 2019 |
| Shares | | | | | Value | |
| | | | | PHARMACEUTICALS - 1.0% (Continued) | | | | |
| | 484 | | | Jounce Therapeutics, Inc. * | | $ | 4,225 | |
| | 445 | | | Lannett Co., Inc. * | | | 3,925 | |
| | 111 | | | Nature’s Sunshine Products, Inc. * | | | 991 | |
| | 136 | | | Owens & Minor, Inc. | | | 703 | |
| | 130 | | | Vanda Pharmaceuticals, Inc. * | | | 2,133 | |
| | | | | | | | 27,113 | |
| | | | | PIPELINES - 0.5% | | | | |
| | 574 | | | NGL Energy Partners LP | | | 6,509 | |
| | 316 | | | NuStar Energy LP | | | 8,169 | |
| | | | | | | | 14,678 | |
| | | | | PRIVATE EQUITY - 0.1% | | | | |
| | 200 | | | Sutter Rock Capital Corp. | | | 1,310 | |
| | | | | | | | | |
| | | | | REAL ESTATE - 0.9% | | | | |
| | 7 | | | Consolidated-Tomoka Land Co. | | | 422 | |
| | 24 | | | FRP Holdings, Inc. * | | | 1,195 | |
| | 190 | | | Landmark Infrastructure Partners LP | | | 3,116 | |
| | 59 | | | RE/MAX Holdings, Inc. | | | 2,271 | |
| | 1,897 | | | Realogy Holdings Corp. | | | 18,363 | |
| | 20 | | | Stratus Properties, Inc. * | | | 620 | |
| | | | | | | | 25,987 | |
| | | | | RETAIL - 8.1% | | | | |
| | 787 | | | American Eagle Outfitters, Inc. | | | 11,569 | |
| | 31 | | | America’s Car-Mart, Inc. * | | | 3,399 | |
| | 15 | | | Ark Restaurants Corp. | | | 333 | |
| | 378 | | | AutoNation, Inc. * | | | 18,382 | |
| | 125 | | | Bassett Furniture Industries, Inc. | | | 2,085 | |
| | 506 | | | Beacon Roofing Supply, Inc. * | | | 16,182 | |
| | 278 | | | Caleres, Inc. | | | 6,602 | |
| | 253 | | | Cato Corp. (The) | | | 4,402 | |
| | 322 | | | Conn’s, Inc. * | | | 3,990 | |
| | 800 | | | Designer Brands, Inc. | | | 12,592 | |
| | 174 | | | Foot Locker, Inc. | | | 6,784 | |
| | 295 | | | Foundation Building Materials, Inc. * | | | 5,708 | |
| | 435 | | | GMS, Inc. * | | | 11,780 | |
| | 120 | | | Group 1 Automotive, Inc. | | | 12,000 | |
| | 247 | | | Guess?, Inc. | | | 5,528 | |
| | 181 | | | Habit Restaurants, Inc. (The) * | | | 1,888 | |
| | 152 | | | La-Z-Boy, Inc. | | | 4,785 | |
| | 294 | | | Movado Group, Inc. | | | 6,392 | |
| | | | | | | | | |
See accompanying notes to financial statements.
| ACCLIVITY SMALL CAP VALUE FUND |
| PORTFOLIO OF INVESTMENTS (Continued) |
| December 31, 2019 |
| Shares | | | | | Value | |
| | | | | RETAIL - 8.1% (Continued) | | | | |
| | 9,121 | | | Office Depot, Inc. | | $ | 24,992 | |
| | 106 | | | PC Connection, Inc. | | | 5,264 | |
| | 421 | | | Penske Automotive Group, Inc. | | | 21,143 | |
| | 445 | | | Potbelly Corp. * | | | 1,878 | |
| | 75 | | | PriceSmart, Inc. | | | 5,326 | |
| | 127 | | | Shoe Carnival, Inc. | | | 4,735 | |
| | 519 | | | Sonic Automotive, Inc. | | | 16,089 | |
| | 210 | | | Tilly’s, Inc. | | | 2,572 | |
| | 221 | | | Urban Outfitters, Inc. * | | | 6,137 | |
| | 165 | | | Zumiez, Inc. * | | | 5,699 | |
| | | | | | | | 228,236 | |
| | | | | SAVINGS & LOANS - 2.3% | | | | |
| | 209 | | | BankFinancial Corp. | | | 2,734 | |
| | 335 | | | Berkshire Hills Bancorp, Inc. | | | 11,015 | |
| | 1 | | | Citizens Community Bancorp, Inc. | | | 12 | |
| | 79 | | | Entegra Financial Corp. * | | | 2,383 | |
| | 99 | | | First Financial Northwest, Inc. | | | 1,479 | |
| | 102 | | | HomeTrust Bancshares, Inc. | | | 2,737 | |
| | 325 | | | OceanFirst Financial Corp. | | | 8,300 | |
| | 375 | | | Pacific Premier Bancorp, Inc. | | | 12,227 | |
| | 21 | | | Pathfinder Bancorp, Inc. | | | 292 | |
| | 353 | | | Provident Financial Services, Inc. | | | 8,701 | |
| | 650 | | | Sterling Bancorp | | | 13,702 | |
| | | | | | | | 63,582 | |
| | | | | SEMICONDUCTORS - 2.8% | | | | |
| | 1,694 | | | Amkor Technology, Inc. * | | | 22,022 | |
| | 176 | | | Amtech Systems, Inc. * | | | 1,260 | |
| | 300 | | | AVX Corp. | | | 6,141 | |
| | 241 | | | Axcelis Technologies, Inc. * | | | 5,807 | |
| | 92 | | | CEVA, Inc. * | | | 2,480 | |
| | 250 | | | Cohu, Inc. | | | 5,712 | |
| | 214 | | | Diodes, Inc. * | | | 12,063 | |
| | 124 | | | GSI Technology, Inc. * | | | 879 | |
| | 677 | | | Photronics, Inc. * | | | 10,669 | |
| | 322 | | | Rambus, Inc. * | | | 4,436 | |
| | 295 | | | Veeco Instruments, Inc. * | | | 4,332 | |
| | 235 | | | Xperi Corp. | | | 4,348 | |
| | | | | | | | 80,149 | |
| | | | | | | | | |
See accompanying notes to financial statements.
| ACCLIVITY SMALL CAP VALUE FUND |
| PORTFOLIO OF INVESTMENTS (Continued) |
| December 31, 2019 |
| Shares | | | | | Value | |
| | | | | SOFTWARE - 2.3% | | | | |
| | 1,076 | | | Allscripts Healthcare Solutions, Inc. * | | $ | 10,561 | |
| | 198 | | | Asure Software, Inc. * | | | 1,620 | |
| | 876 | | | Avaya Holdings Corp. * | | | 11,826 | |
| | 1 | | | Daily Journal Corp. * | | | 290 | |
| | 273 | | | Digi International, Inc. * | | | 4,838 | |
| | 102 | | | Ebix, Inc. | | | 3,408 | |
| | 285 | | | InnerWorkings, Inc. * | | | 1,570 | |
| | 555 | | | Inovalon Holdings, Inc. * | | | 10,445 | |
| | 32 | | | ManTech International Corp. | | | 2,556 | |
| | 281 | | | Seachange International, Inc. * | | | 1,177 | |
| | 1,644 | | | TiVo Corp. | | | 13,941 | |
| | 71 | | | Verint Systems, Inc. * | | | 3,931 | |
| | 7 | | | Wayside Technology Group, Inc. | | | 113 | |
| | | | | | | | 66,276 | |
| | | | | TELECOMMUNICATIONS - 2.6% | | | | |
| | 66 | | | Airgain, Inc. * | | | 706 | |
| | 82 | | | Aviat Networks, Inc. * | | | 1,152 | |
| | 196 | | | Communications Systems, Inc. | | | 1,209 | |
| | 596 | | | EchoStar Corp. * | | | 25,813 | |
| | 83 | | | LogMeIn, Inc. | | | 7,116 | |
| | 756 | | | Maxar Technologies, Inc. | | | 11,846 | |
| | 358 | | | NETGEAR, Inc. * | | | 8,775 | |
| | 48 | | | Preformed Line Products Co. | | | 2,897 | |
| | 100 | | | RF Industries Ltd. | | | 676 | |
| | 109 | | | Spok Holdings, Inc. | | | 1,333 | |
| | 164 | | | ViaSat, Inc. * | | | 12,004 | |
| | | | | | | | 73,527 | |
| | | | | TEXTILES - 0.0% ** | | | | |
| | 18 | | | Crown Crafts, Inc. | | | 111 | |
| | 18 | | | Culp, Inc. | | | 245 | |
| | | | | | | | 356 | |
| | | | | TRANSPORTATION - 1.3% | | | | |
| | 176 | | | ArcBest Corp. | | | 4,858 | |
| | 129 | | | Echo Global Logistics, Inc. * | | | 2,670 | |
| | 126 | | | Hub Group, Inc. * | | | 6,462 | |
| | 418 | | | Marten Transport Ltd. | | | 8,983 | |
| | 29 | | | Patriot Transportation Holding, Inc. * | | | 565 | |
| | 435 | | | Schneider National, Inc. | | | 9,492 | |
| | 98 | | | SEACOR Holdings, Inc. * | | | 4,229 | |
| | | | | | | | 37,259 | |
| | | | | | | | | |
See accompanying notes to financial statements.
| ACCLIVITY SMALL CAP VALUE FUND |
| PORTFOLIO OF INVESTMENTS (Continued) |
| December 31, 2019 |
| Shares | | | | | Value | |
| | | | | TRUCKING & LEASING - 0.7% | | | | |
| | 474 | | | Greenbrier Cos., Inc. (The) | | $ | 15,372 | |
| | 49 | | | Willis Lease Finance Corp. * | | | 2,887 | |
| | | | | | | | 18,259 | |
| | | | | | | | | |
| | | | | TOTAL COMMON STOCKS (Cost - $2,723,241) | | | 2,817,542 | |
| | | | | | | | | |
| | | | | SHORT-TERM INVESTMENT - 3.8% | | | | |
| | | | | MONEY MARKET FUND - 3.8% | | | | |
| | 107,901 | | | BlackRock Liquidity Funds T-Fund Portfolio, to yield 1.51% (a)(Cost - $107,901) | | | 107,901 | |
| | | | | | | | | |
| | | | | TOTAL INVESTMENTS - 103.5% (Cost - $2,831,142) | | $ | 2,925,443 | |
| | | | | LIABILITIES IN EXCESS OF OTHER ASSETS - NET - (3.5)% | | | (98,472 | ) |
| | | | | TOTAL NET ASSETS - 100.0% | | $ | 2,826,971 | |
| | | | | | | | | |
| * | Non-income producing security. |
| ** | Represents less than 0.05% |
| (a) | Money market rate shown represents the 7-day annualized yield as of December 31, 2019. |
See accompanying notes to financial statements.
| Acclivity Small Cap Value Fund |
| STATEMENT OF ASSETS AND LIABILITIES |
| December 31, 2019 |
| ASSETS | | | | |
| Investment securities: | | | | |
| At cost | | $ | 2,831,142 | |
| At value | | $ | 2,925,443 | |
| Receivable for investments sold | | | 157,305 | |
| Dividends and interest receivable | | | 3,273 | |
| Receivable due from Advisor | | | 13,199 | |
| Prepaid expenses and other assets | | | 2,422 | |
| TOTAL ASSETS | | | 3,101,642 | |
| | | | | |
| LIABILITIES | | | | |
| Payable for investments purchased | | | 227,690 | |
| Audit fees payable | | | 17,998 | |
| Payable to related parties | | | 12,375 | |
| Accrued expenses and other liabilities | | | 16,608 | |
| TOTAL LIABILITIES | | | 274,671 | |
| NET ASSETS | | $ | 2,826,971 | |
| | | | | |
| Net Assets Consist Of: | | | | |
| Paid in capital | | $ | 2,678,123 | |
| Accumulated Earnings | | | 148,848 | |
| NET ASSETS | | $ | 2,826,971 | |
| | | | | |
| Net Asset Value Per Share: | | | | |
| Class I Shares: | | | | |
| Net Assets | | $ | 2,826,959 | |
| Shares of beneficial interest outstanding ($0 par value, unlimited shares authorized) | | | 240,472 | |
| Net asset value (Net Assets ÷ Shares Outstanding), offering price and redemption price per share | | $ | 11.76 | |
| | | | | |
| Class N Shares: | | | | |
| Net Assets | | $ | 12 | |
| Shares of beneficial interest outstanding ($0 par value, unlimited shares authorized) | | | 1 | |
| Net asset value (Net Assets ÷ Shares Outstanding), offering price and redemption price per share (a) | | $ | 11.75 | |
| | | | | |
| (a) | Net asset value may not recalculate due to the rounding of shares. |
See accompanying notes to financial statements.
| Acclivity Small Cap Value Fund |
| STATEMENT OF OPERATIONS |
| For the Period* Ended December 31, 2019 |
| INVESTMENT INCOME | | | | |
| Dividends (Foreign Taxes Withheld - $25) | | $ | 17,525 | |
| Interest | | | 859 | |
| TOTAL INVESTMENT INCOME | | | 18,384 | |
| | | | | |
| EXPENSES | | | | |
| Investment advisory fees | | | 4,996 | |
| Distribution (12b-1) fees: | | | | |
| Class N | | | 30 | |
| Transfer agent fees | | | 27,092 | |
| Trustees’ fees | | | 22,243 | |
| Legal fees | | | 29,071 | |
| Audit fees | | | 17,998 | |
| Administration fees | | | 14,411 | |
| Shareholder reporting expense | | | 7,606 | |
| Compliance officer fees | | | 8,286 | |
| Custody fees | | | 5,065 | |
| Third party administrative servicing fees | | | 676 | |
| Registration fees | | | 1,375 | |
| Fund accounting fees | | | 560 | |
| Insurance expense | | | 94 | |
| Other expenses | | | 2,177 | |
| TOTAL EXPENSES | | | 141,680 | |
| | | | | |
| Less: Fees waived/reimbursed by the Adviser | | | (135,510 | ) |
| | | | | |
| NET EXPENSES | | | 6,170 | |
| NET INVESTMENT INCOME | | | 12,214 | |
| | | | | |
| REALIZED AND UNREALIZED GAIN ON INVESTMENTS | | | | |
| Net realized gain from investments | | | 57,329 | |
| Distributions of realized gains from underlying investment companies | | | 63 | |
| Net change in unrealized appreciation on investments | | | 94,301 | |
| | | | | |
| NET REALIZED AND UNREALIZED GAIN ON INVESTMENTS | | | 151,693 | |
| | | | | |
| NET INCREASE IN NET ASSETS RESULTING FROM OPERATIONS | | $ | 163,907 | |
| | | | | |
| * | The inception date of the Acclivity Small Cap Value Fund was December 31, 2018 and the Fund commenced operations on January 2, 2019. |
See accompanying notes to financial statements.
| Acclivity Small Cap Value Fund |
| STATEMENT OF CHANGES IN NET ASSETS |
| | | For the | |
| | | Period* Ended | |
| | | December 31, 2019 | |
| | | | |
| FROM OPERATIONS | | | | |
| Net investment income | | $ | 12,214 | |
| Net realized gain from investments | | | 57,329 | |
| Distributions of realized gains from underlying investment companies | | | 63 | |
| Net change in unrealized appreciation of investments | | | 94,301 | |
| Net increase in net assets resulting from operations | | | 163,907 | |
| | | | | |
| DISTRIBUTIONS TO SHAREHOLDERS | | | | |
| Total Distributions Paid | | | | |
| Class I | | | (15,059 | ) |
| Class N | | | (0 | ) ^ |
| Net decrease in net assets from distributions to shareholders | | | (15,059 | ) |
| | | | | |
| FROM SHARES OF BENEFICIAL INTEREST | | | | |
| Proceeds from shares sold | | | | |
| Class I | | | 2,691,627 | |
| Class N | | | 32,013 | |
| Net asset value of shares issued in reinvestment of distributions | | | | |
| Class I | | | 14,807 | |
| Payments for shares redeemed | | | | |
| Class I | | | (29,296 | ) |
| Class N | | | (31,028 | ) |
| Net increase in net assets from shares of beneficial interest | | | 2,678,123 | |
| | | | | |
| TOTAL INCREASE IN NET ASSETS | | | 2,826,971 | |
| | | | | |
| NET ASSETS | | | | |
| Beginning of Period | | | — | |
| End of Period | | $ | 2,826,971 | |
| | | | | |
| * | The inception date of the Acclivity Small Cap Value Fund was December 31, 2018 and the Fund commenced operations on January 2, 2019. |
| ^ | Represents less than $0.50. |
See accompanying notes to financial statements.
| Acclivity Small Cap Value Fund |
| STATEMENT OF CHANGES IN NET ASSETS (Continued) |
| | | For the | |
| | | Period* Ended | |
| | | December 31, 2019 | |
| SHARE ACTIVITY - CLASS I | | | | |
| Shares sold | | | 241,722 | |
| Shares reinvested | | | 1,284 | |
| Shares redeemed | | | (2,534 | ) |
| Net increase in shares of beneficial interest outstanding | | | 240,472 | |
| | | | | |
| SHARE ACTIVITY - CLASS N | | | | |
| Shares sold | | | 2,861 | |
| Shares redeemed | | | (2,860 | ) |
| Net increase in shares of beneficial interest outstanding | | | 1 | |
| | | | | |
| * | The inception date of the Acclivity Small Cap Value Fund was December 31, 2018 and the Fund commenced operations on January 2, 2019. |
See accompanying notes to financial statements.
| Acclivity Small Cap Value Fund |
| FINANCIAL HIGHLIGHTS |
| |
| Per Share Data and Ratios for a Share of Beneficial Interest Outstanding Throughout the Period |
| | | Class I | |
| | | Period* Ended | |
| | | December 31, | |
| | | 2019 | |
| Net asset value, beginning of period | | $ | 10.00 | |
| Activity from investment operations: | | | | |
| Net investment income (1) | | | 0.15 | |
| Net realized and unrealized gain on investments | | | 1.69 | |
| Total from investment operations | | | 1.84 | |
| Less distributions from: | | | | |
| Net investment income | | | (0.08 | ) |
| Net asset value, end of period | | $ | 11.76 | |
| Total return (2,6) | | | 18.44 | % |
| Net assets, at end of period (000s) | | $ | 2,827 | |
| Ratio of gross expenses to average net assets (3,4,5) | | | 14.59 | % |
| Ratio of net expenses to average net assets (4,5) | | | 0.67 | % |
| Ratio of net investment income to average net assets (4,5) | | | 1.34 | % |
| Portfolio turnover rate (6) | | | 166 | % |
| | | | | |
| * | The inception date of the Acclivity Small Cap Value Fund was December 31, 2018 and the Fund commenced operations on January 2, 2019. |
| (1) | Per share amounts calculated using the average shares method, which more appropriately presents the per share data for the period. |
| (2) | Total returns shown exclude the effect of applicable redemption fees. Had the Adviser not waived a portion of the Fund’s expenses, total returns would have been lower. |
| (3) | Represents the ratio of expenses to average net assets absent fee waivers and/or expense reimbursements by the Adviser. |
| (4) | Does not include the expenses of other investment companies in which the Fund invests. |
| (5) | Annualized for periods less than one full year. |
See accompanying notes to financial statements.
| Acclivity Small Cap Value Fund |
| FINANCIAL HIGHLIGHTS |
| |
| Per Share Data and Ratios for a Share of Beneficial Interest Outstanding Throughout the Period |
| | | Class N | |
| | | Period* Ended | |
| | | December 31, | |
| | | 2019 | |
| Net asset value, beginning of period | | $ | 10.00 | |
| Activity from investment operations: | | | | |
| Net investment income (1) | | | 0.16 | |
| Net realized and unrealized gain on investments | | | 1.67 | |
| Total from investment operations | | | 1.83 | |
| Less distributions from: | | | | |
| Net investment income | | | (0.08 | ) |
| Net asset value, end of period | | $ | 11.75 | |
| Total return (2,6) | | | 18.34 | % |
| Net assets, at end of period (7) | | $ | 12 | |
| Ratio of gross expenses to average net assets (3,4,5) | | | 81.62 | % |
| Ratio of net expenses to average net assets (4,5) | | | 0.92 | % |
| Ratio of net investment income to average net assets (4,5) | | | 1.44 | % |
| Portfolio turnover rate (6) | | | 166 | % |
| | | | | |
| * | The inception date of the Acclivity Small Cap Value Fund was December 31, 2018 and the Fund commenced operations on January 2, 2019. |
| (1) | Per share amounts calculated using the average shares method, which more appropriately presents the per share data for the period. |
| (2) | Total returns shown exclude the effect of applicable redemption fees. Had the Adviser not waived a portion of the Fund’s expenses, total returns would have been lower. |
| (3) | Represents the ratio of expenses to average net assets absent fee waivers and/or expense reimbursements by the Adviser. |
| (4) | Does not include the expenses of other investment companies in which the Fund invests. |
| (5) | Annualized for periods less than one full year. |
| (7) | Represents actual net assets. |
See accompanying notes to financial statements.
| Acclivity Small Cap Value Fund |
| NOTES TO FINANCIAL STATEMENTS |
| December 31, 2019 |
The Acclivity Small Cap Value Fund (the “Fund”), is a diversified series of shares of beneficial interest of Northern Lights Fund Trust II (the “Trust”), a statutory trust organized under the laws of the State of Delaware on August 26, 2010, and is registered under the Investment Company Act of 1940, as amended (the “1940 Act”), as an open-end management investment company. The inception date of the Fund was December 31, 2018 and the Fund commenced operations on January 2, 2019. The Fund seeks long term capital appreciation.
The Fund currently offers Class I shares and Class N shares. Class I and Class N shares are offered at net asset value without an initial sales charge. Class N shares are subject to a 0.25% Rule 12b-1 distribution and shareholder servicing fee. Each class represents an interest in the same assets of the Fund and classes are identical except for differences in ongoing service and distribution charges. All classes of shares have equal voting privileges except that each class has exclusive voting rights with respect to its shareholder service and/or distribution plans.
| 2. | SIGNIFICANT ACCOUNTING POLICIES |
The following is a summary of significant accounting policies followed by the Fund in preparation of its financial statements. The policies are in conformity with accounting principles generally accepted in the United States of America (“GAAP”). The preparation of financial statements requires management to make estimates and assumptions that affect the reported amounts of assets and liabilities and disclosure of contingent assets and liabilities at the date of the financial statements and the reported amounts of income and expenses for the period. Actual results could differ from those estimates. The Fund is an investment company and accordingly follows the investment company accounting and reporting guidance of the Financial Accounting Standards Board (“FASB”) Accounting Standard Codification Topic 946 “Financial Services – Investment Companies” including FASB Accounting Standard Update “ASU” 2013-08.
Security Valuation – Securities listed on an exchange are valued at the last reported sale price at the close of the regular trading session of the primary exchange on the business day the value is being determined, or in the case of securities listed on NASDAQ at the NASDAQ Official Closing Price (“NOCP”). In the absence of a sale such securities shall be valued at the mean between the current bid and ask prices on the day of valuation. Investments valued in currencies other than the U.S. dollar are converted to U.S. dollars using exchange rates obtained from pricing services. Short-term debt obligations having 60 days or less remaining until maturity, at time of purchase, may be valued at amortized cost.
The Fund may hold securities, such as private investments, interests in commodity pools, other non-traded securities or temporarily illiquid securities, for which market quotations are not readily available or are determined to be unreliable. These securities will be valued using the “fair value” procedures approved by the Trust’s Board of Trustees (the “Board”). The Board has delegated execution of these procedures to a fair value committee composed of one or more representatives from each of the (i) Trust, (ii) administrator, and (iii) Adviser. The committee may also enlist third party consultants such as a valuation specialist at a public accounting firm, valuation consultant or financial officer of a security
| Acclivity Small Cap Value Fund |
| NOTES TO FINANCIAL STATEMENTS (Continued) |
| December 31, 2019 |
issuer on an as-needed basis to assist in determining a security-specific fair value. The Board has also engaged a third party valuation firm to attend meetings held by the Trust, review minutes of such meetings and report to the Board on a quarterly basis. The Board reviews and ratifies the execution of this process and the resultant fair value prices at least quarterly to assure the process produces reliable results.
Fair Valuation Process –As noted above, this fair value committee is composed of one or more representatives from each of the (i) Trust, (ii) administrator, and (iii) adviser. The applicable investments are valued collectively via inputs from each of these groups. For example, fair value determinations are required for the following securities: (i) securities for which market quotations are insufficient or not readily available on a particular business day (including securities for which there is a short and temporary lapse in the provision of a price by the regular pricing source), (ii) securities for which, in the judgment of the adviser, the prices or values available do not represent the fair value of the instrument. Factors which may cause the adviser to make such a judgment include, but are not limited to, the following: only a bid price or an asked price is available; the spread between bid and asked prices is substantial; the frequency of sales; the thinness of the market; the size of reported trades; and actions of the securities markets, such as the suspension or limitation of trading; (iii) securities determined to be illiquid; (iv) securities with respect to which an event that will affect the value thereof has occurred (a “significant event”) since the closing prices were established on the principal exchange on which they are traded, but prior to the Fund’s calculation of its net asset values. Specifically, interests in commodity pools or managed futures pools are valued on a daily basis by reference to the closing market prices of each futures contract or other asset held by a pool, as adjusted for pool expenses. Restricted or illiquid securities, such as private investments or non-traded securities are valued via inputs from the adviser based upon the current bid for the security from two or more independent dealers or other parties reasonably familiar with the facts and circumstances of the security (who should take into consideration all relevant factors as may be appropriate under the circumstances). If the adviser is unable to obtain a current bid from such independent dealers or other independent parties, the fair value committee shall determine the fair value of such security using the following factors: (i) the type of security; (ii) the cost at date of purchase; (iii) the size and nature of the Fund’s holdings; (iv) the discount from market value of unrestricted securities of the same class at the time of purchase and subsequent thereto; (v) information as to any transactions or offers with respect to the security; (vi) the nature and duration of restrictions on disposition of the security and the existence of any registration rights; (vii) how the yield of the security compares to similar securities of companies of similar or equal creditworthiness; (viii) the level of recent trades of similar or comparable securities; (ix) the liquidity characteristics of the security; (x) current market conditions; and (xi) the market value of any securities into which the security is convertible or exchangeable.
The Fund utilizes various methods to measure fair value of all of its investments on a recurring basis. GAAP establishes the hierarchy that prioritizes inputs to valuation methods. The three levels of input are:
Level 1 – Unadjusted quoted prices in active markets for identical assets and liabilities that the Fund has the ability to access.
Level 2 – Observable inputs other than quoted prices included in Level 1 that are observable for the
| Acclivity Small Cap Value Fund |
| NOTES TO FINANCIAL STATEMENTS (Continued) |
| December 31, 2019 |
asset or liability, either directly or indirectly. These inputs may include quoted prices for the identical instrument in an inactive market, prices for similar instruments, interest rates, prepayment speeds, credit risk, yield curves, default rates and similar data.
Level 3 – Unobservable inputs for the asset or liability, to the extent relevant observable inputs are not available, representing the Fund’s own assumptions about the assumptions a market participant would use in valuing the asset or liability, and would be based on the best information available.
The availability of observable inputs can vary from security to security and is affected by a wide variety of factors, including, for example, the type of security, whether the security is new and not yet established in the marketplace, the liquidity of markets, and other characteristics particular to the security. To the extent that valuation is based on models or inputs that are less observable or unobservable in the market, the determination of fair value requires more judgment. Accordingly, the degree of judgment exercised in determining fair value is greatest for instruments categorized in Level 3.
The inputs used to measure fair value may fall into different levels of the fair value hierarchy. In such cases, for disclosure purposes, the level in the fair value hierarchy within which the fair value measurement falls in its entirety, is determined based on the lowest level input that is significant to the fair value measurement in its entirety.
The inputs or methodology used for valuing securities are not necessarily an indication of the risk associated with investing in those securities. The following tables summarize the inputs used as of December 31, 2019 for the Fund’s assets measured at fair value:
| Acclivity Small Cap Value Fund |
| Assets * | | Level 1 | | | Level 2 | | | Level 3 | | | Total | |
| Common Stocks | | $ | 2,817,542 | | | $ | — | | | $ | — | | | $ | 2,817,542 | |
| Short-Term Investment | | | 107,901 | | | | — | | | | — | | | | 107,901 | |
| Total | | $ | 2,925,443 | | | $ | — | | | $ | — | | | $ | 2,925,443 | |
The Fund did not hold any Level 3 securities during the period.
| * | See the Fund’s Portfolio of Investments for classification. |
Security Transactions and Related Income – Security transactions are accounted for on trade date. Interest income is recognized on an accrual basis. Discounts are accreted and premiums are amortized on securities purchased over the lives of the respective securities. Dividend income is recorded on the ex-dividend date. Realized gains or losses from sales of securities are determined by comparing the identified cost of the security lot sold with the net sales proceeds. The Fund’s income, expenses (other than class specific distribution fees) and realized and unrealized gains and losses are allocated proportionately each day based upon the relative net assets of each class.
Dividends and Distributions to Shareholders –Dividends from net investment income, if any, are declared and paid annually. Distributable net realized capital gains, if any, are declared and distributed
| Acclivity Small Cap Value Fund |
| NOTES TO FINANCIAL STATEMENTS (Continued) |
| December 31, 2019 |
annually in December. Dividends from net investment income and distributions from net realized gains are determined in accordance with federal income tax regulations, which may differ from GAAP. These “book/tax” differences are considered either temporary (i.e., deferred losses) or permanent in nature. To the extent these differences are permanent in nature, such amounts are reclassified within the composition of net assets based on their Federal tax-basis treatment; temporary differences do not require reclassification. Dividends and distributions to shareholders are recorded on ex-dividend date.
Federal Income Taxes – The Fund intends to continue to comply with the requirements of the Internal Revenue Code applicable to regulated investment companies and to distribute all of their taxable income to their shareholders. Therefore, no provision for federal income tax is required. The Fund recognizes the tax benefits of uncertain tax positions only where the position is “more likely than not” to be sustained assuming examination by tax authorities. Management has analyzed the Fund’s tax positions and has concluded that no liability for unrecognized tax benefits should be recorded related to uncertain tax positions expected to be taken in the Fund’s December 31, 2019 year-end tax returns. The Fund has identified its major tax jurisdictions as U.S. Federal, Ohio, and foreign jurisdictions where the Fund makes significant investments. The Fund is not aware of any tax positions for which it is reasonably possible that the total amounts of unrecognized tax benefits will change materially in the next twelve months.
Expenses – Expenses of the Trust that are directly identifiable to a specific fund are charged to that fund. Expenses, which are not readily identifiable to a specific fund, are allocated in such a manner as deemed equitable, taking into consideration the nature and type of expense and the relative sizes of the funds in the Trust.
Indemnification – The Trust indemnifies its officers and Trustees for certain liabilities that may arise from the performance of their duties to the Trust. Additionally, in the normal course of business, the Fund enters into contracts that contain a variety of representations and warranties and which provide general indemnities. The Fund’s maximum exposure under these arrangements is unknown, as this would involve future claims that may be made against the Fund that have not yet occurred. However, based on experience, the Fund expects the risk of loss due to these warranties and indemnities to be remote.
| 3. | INVESTMENT TRANSACTIONS |
For the period ended December 31, 2019, cost of purchases and proceeds from sales of portfolio securities, other than short-term investments, amounted to:
| Purchases | | | Sales | |
| $ | 4,369,122 | | | $ | 1,703,199 | |
| Acclivity Small Cap Value Fund |
| NOTES TO FINANCIAL STATEMENTS (Continued) |
| December 31, 2019 |
| 4. | INVESTMENT ADVISORY AGREEMENT AND TRANSACTIONS WITH RELATED PARTIES |
Innealta Capital, LLC (the “Adviser”) serves as investment adviser to the Fund. Pursuant to an Advisory Agreement with the Fund, the Adviser, under the oversight of the Board, directs the daily operations of the Fund and supervises the performance of administrative and professional services provided by others. As compensation for its services and the related expenses borne by the Adviser, the Fund pays the Adviser a management fee, computed and accrued daily and paid monthly, at an annual rate of 0.55% of the Fund’s average daily net assets. For the period ended December 31, 2019, the Adviser earned $4,996.
Pursuant to a written contract (the “Waiver Agreement”), the Adviser has agreed, at least until April 30, 2020, to waive a portion of its advisory fee and has agreed to reimburse the Fund for other expenses to the extent necessary so that the total expenses incurred by the Fund (excluding taxes, leverage interest, brokerage fees and commissions, expenses of investing in underlying funds, expenses incurred in connection with any merger or reorganization, dividend expense on securities sold short, or extraordinary expenses, such as litigation, not incurred in the ordinary course of the Fund’s business) do not exceed 0.67% and 0.92% for Class I and Class N shares, respectively.
If the Adviser waives any fee or reimburses any expenses pursuant to the Waiver Agreement for the Fund, and the Fund’s operating expenses are subsequently lower than its respective expense limitation, the Adviser shall be entitled to reimbursement by the Fund provided that such reimbursement does not cause the Fund’s operating expenses to exceed its expense limitation. If the Fund’s operating expenses subsequently exceed its expense limitation, the reimbursements for the Fund shall be suspended. The Adviser may seek reimbursement only for expenses waived or paid by it during the three fiscal years prior to such reimbursement; provided, however, that such expenses may only be reimbursed to the extent they were waived or paid after the date of the Waiver Agreement (or any similar agreement). The Board may terminate this expense reimbursement arrangement at any time. For the period ended December 31, 2019, the Adviser waived advisory fees and reimbursed the Fund for expenses in the amount of $135,510.
The following amount is subject to recapture by the Fund by the following date:
Distributor– The distributor for the Fund is Northern Lights Distributors, LLC (the “Distributor”). The Board has adopted the Trust’s Master Distribution and Shareholder Servicing Plans for Class N shares (the “Plan”) pursuant to Rule 12b-1 under the 1940 Act to pay for ongoing distribution-related activities or shareholder services. Under the Plan, the Fund is permitted to pay a fee at an annual rate of 0.25% of the average daily net assets of Class N shares. For the period ended December 31, 2019, pursuant to the Class N Plan, the Fund incurred $30 in 12b-1 fees.
The Distributor acts as the Fund’s principal underwriter in a continuous public offering of the Fund’s shares.
| Acclivity Small Cap Value Fund |
| NOTES TO FINANCIAL STATEMENTS (Continued) |
| December 31, 2019 |
In addition, certain affiliates of the Distributor provide services to the Fund as follows:
Gemini Fund Services, LLC (“GFS”) – GFS, an affiliate of the Distributor, provides administration, fund accounting, and transfer agent services to the Trust. Pursuant to separate servicing agreements with GFS, the Fund pays GFS customary fees for providing administration, fund accounting, and transfer agency services to the Fund. Certain officers of the Trust are also officers of GFS, and are not paid any fees directly by the Fund for serving in such capacities.
Northern Lights Compliance Services, LLC(“NLCS”) – NLCS, an affiliate of GFS and the Distributor, provides a Chief Compliance Officer to the Trust, as well as related compliance services, pursuant to a consulting agreement between NLCS and the Trust. Under the terms of such agreement, NLCS receives customary fees from the Fund.
Blu Giant, LLC(“Blu Giant”) – Blu Giant, an affiliate of GFS and the Distributor, provides EDGAR conversion and filing services as well as print management services for the Fund on an ad-hoc basis. For the provision of these services, Blu Giant receives customary fees from the Fund.
On February 1, 2019, NorthStar Financial Services Group, LLC, the parent company of GFS and its affiliated companies including NLD, NLCS and Blu Giant (collectively, the “Gemini Companies”), sold its interest in the Gemini Companies to a third party private equity firm that contemporaneously acquired Ultimus Fund Solutions, LLC (an independent mutual fund administration firm) and its affiliates (collectively, the “Ultimus Companies”). As a result of these separate transactions, the Gemini Companies and the Ultimus Companies are now indirectly owned through a common parent entity, The Ultimus Group, LLC.
| 5. | AGGREGATE UNREALIZED APPRECIATION AND DEPRECIATION – TAX BASIS |
The identified cost of investments in securities owned by the Fund for federal income tax purposes, and its respective gross unrealized appreciation and depreciation at December 31, 2019, were as follows:
| | | | | | Gross | | | Gross | | | Net Unrealized | |
| | | Tax | | | Unrealized | | | Unrealized | | | Appreciation/ | |
| | | Cost | | | Appreciation | | | Depreciation | | | (Depreciation) | |
| Acclivity Small Cap Value Fund | | $ | 2,830,889 | | | $ | 138,587 | | | $ | (44,033 | ) | | $ | 94,554 | |
| Acclivity Small Cap Value Fund |
| NOTES TO FINANCIAL STATEMENTS (Continued) |
| December 31, 2019 |
| 6. | SHAREHOLDERS & TAX COMPONENTS OF CAPITAL |
The tax character of fund distributions paid for the period ended December 31, 2019 was as follows:
| | | Fiscal Year Ended | |
| | | December 31, 2019 | |
| Ordinary Income | | $ | 15,059 | |
As of December 31, 2019, the components of accumulated earnings/(deficit) on a tax basis were as follows:
| Undistributed | | | Undistributed | | | Unrealized | | | Total | |
| Ordinary | | | Long-Term | | | Appreciation/ | | | Accumulated | |
| Income | | | Gains | | | (Depreciation) | | | Earnings/(Deficits) | |
| $ | 54,228 | | | $ | 66 | | | $ | 94,554 | | | $ | 148,848 | |
The difference between book basis and tax basis undistributed net investment income, accumulated net realized loss and unrealized appreciation from investments is primarily attributable to the tax deferral of losses on wash sales and adjustments for partnerships.
The beneficial ownership, either directly or indirectly, of more than 25% of the voting securities of a Fund creates presumption of control of the Fund, under Section 2(a)(9) of the 1940 Act. As of December 31, 2019, beneficial ownership in excess of 25% for the Funds is as follows:
| | | % of Outstanding | |
| Beneficial Owner | | Shares | |
| National Financial Services, LLC | | | 61 | % |
The Trust has no knowledge as to whether all or any portion of the shares owned of record are also owned beneficially.
Subsequent events after the date of the Statement of Assets and Liabilities have been evaluated through the date the financial statements were issued. Management has determined that no events or transactions occurred requiring adjustment or disclosure in the financial statements.

REPORT OF INDEPENDENT REGISTERED PUBLIC ACCOUNTING FIRM
To the Board of Trustees of Northern Lights Fund Trust II
and the Shareholders of Acclivity Small Cap Value Fund
Opinion on the Financial Statements
We have audited the accompanying statement of assets and liabilities of Acclivity Small Cap Value Fund, a series of shares of beneficial interest in Northern Lights Fund Trust II (the“Fund”), including the portfolio of investments, as of December 31, 2019, and the related statement of operations, the statement of changes in net assets and the financial highlights for the period from January 2, 2019 (commencement of operations) through December 31, 2019, and the related notes (collectively referred to as the“financial statements”). In our opinion, the financial statements present fairly, in all material respects, the financial position of the Fund as of December 31, 2019, and the results of its operations, the changes in its net assets and its financial highlights for the period from January 2, 2019 through December 31, 2019, in conformity with accounting principles generally accepted in the United States of America.
Basis for Opinion
These financial statements are the responsibility of the Fund’s management. Our responsibility is to express an opinion on the Fund’s financial statements based on our audit. We are a public accounting firm registered with the Public Company Accounting Oversight Board (United States) (“PCAOB”) and are required to be independent with respect to the Fund in accordance with the U.S. federal securities law and the applicable rules and regulations of the Securities and Exchange Commission and the PCAOB.
We conducted our audit in accordance with the standards of the PCAOB. Those standards require that we plan and perform the audit to obtain reasonable assurance about whether the financial statements are free of material misstatement, whether due to error or fraud. The Fund is not required to have, nor were we engaged to perform, an audit of its internal control over financial reporting. As part of our audit we are required to obtain an understanding of internal control over financial reporting but not for the purpose of expressing an opinion on the effectiveness of the Fund’s internal control over financial reporting. Accordingly, we express no such opinion.
Our audit included performing procedures to assess the risk of material misstatement of the financial statements, whether due to error or fraud, and performing procedures that respond to those risks. Such procedures included examining, on a test basis, evidence regarding the amounts and disclosures in the financial statements. Our procedures included confirmation of securities owned as of December 31, 2019 by correspondence with the custodian and broker. Our audit also included evaluating the accounting principles used and significant estimates made by management, as well as evaluating the overall presentation of the financial statements. We believe that our audit provides a reasonable basis for our opinion.
BBD, LLP
We have served as the auditor of one or more of the Funds in the Northern Lights Fund Trust II since 2012.
Philadelphia, Pennsylvania
February 28, 2020
| Acclivity Small Cap Value Fund |
| EXPENSE EXAMPLES (Unaudited) |
| December 31, 2019 |
As a shareholder of Acclivity Small Cap Value Fund, you incur two types of costs: (1) transaction costs including redemption fees; and (2) ongoing costs, including advisory fees; distribution and/or service (12b-1) fees; and other Fund expenses. This example is intended to help you understand your ongoing costs (in dollars) of investing in Acclivity Small Cap Value Fund and to compare these costs with the ongoing costs of investing in other mutual funds.
The example is based on an investment of $1,000 invested at the beginning of the period and held for the entire period from July 1, 2019 through December 31, 2019.
Actual Expenses
The “Actual Expenses” line in the table below provides information about actual account values and actual expenses. You may use the information below together with the amount you invested, to estimate the expenses that you paid over the period. Simply divide your account value by $1,000 (for example, an $8,600 account value divided by $1,000 = 8.6), then multiply the result by the number in the table under the heading entitled “Expenses Paid During Period” to estimate the expenses you paid on your account during this period.
Hypothetical Example for Comparison Purposes
The “Hypothetical” line in the table below provides information about hypothetical account values and hypothetical expenses based on the Funds’ actual expense ratios and an assumed rate of return of 5% per year before expenses, which are not the Funds’ actual returns. The hypothetical account values and expenses may not be used to estimate the actual ending account balances or expenses you paid for the period. You may use this information to compare this 5% hypothetical example with the 5% hypothetical examples that appear in the shareholder reports of other funds.
Please note that the expenses shown in the table are meant to highlight your ongoing costs only and do not reflect any transactional costs, such as redemption fees. Therefore, the table is useful in comparing ongoing costs only, and will not help you determine the relative total costs of owning different funds. In addition, if these transactional costs were included, your costs would have been higher.
| | | | | Beginning | | | | | | Expenses Paid | | | Annualized | |
| | | | | Account Value | | | Ending Account | | | During Period * | | | Expense Ratio | |
| Actual | | 7/1/19 | | | Value 12/31/19 | | | 7/1/19-12/31/19 | | | During Period | |
| Acclivity Small Cap Value Fund | | | | | | | | | | | | |
| | | Class I | | $ | 1,000.00 | | | $ | 1,062.20 | | | $ | 3.48 | | | | 0.67 | % |
| | | Class N | | | 1,000.00 | | | | 1,062.30 | | | | 4.78 | | | | 0.92 | % |
| Hypothetical (5% return before Expenses) | | | | | | | | | | | | | | | | |
| Acclivity Small Cap Value Fund | | | | | | | | | | | | | | | | |
| | | Class I | | $ | 1,000.00 | | | $ | 1,021.83 | | | $ | 3.41 | | | | 0.67 | % |
| | | Class N | | | 1,000.00 | | | | 1,020.57 | | | | 4.69 | | | | 0.92 | % |
| * | Expenses are equal to the average account value over the period, multiplied by the Fund’s annualized expense ratio, multiplied by the number of days in the period (184) divided by the number of days in the fiscal year (365). |
| Acclivity Small Cap Value Fund |
| SUPPLEMENTAL INFORMATION (Unaudited)(Continued) |
| December 31, 2019 |
The Trustees and the officers of the Trust are listed below with their present positions with the Trust and principal occupations over at least the last five years. The business address of each Trustee and Officer is 225 Pictoria Drive, Suite 450, Cincinnati, OH 45246. All correspondence to the Trustees and Officers should be directed to c/o Gemini Fund Services, LLC, P.O. Box 541150, Omaha, Nebraska 68154.
Independent Trustees
Name and
Year of Birth | Position/Term of
Office* | Principal Occupation
During the Past Five Years | Number of
Portfolios in
Fund
Complex
Overseen by
Trustee*** | Other Directorships held by
Trustee
During the Past Five Years |
Thomas T.
Sarkany
1946 | Trustee Since October 2011 | President, TTS Consultants, LLC (financial services) (since 2010). | 3 | Director, Aquila Distributors; Trustee, Arrow ETF Trust; Trustee, Arrow Investments Trust; Trustee, Northern Lights Fund Trust IV |
Anthony H.
Lewis
1946 | Trustee Since May 2011 | Chairman and CEO of The Lewis Group USA (executive consulting firm) (since 2007). | 3 | Director, Member of the Compensation Committee and Member of the Risk Committee of Torotel Inc. (Magnetics, Aerospace and Defense), Trustee, Chairman of the Fair Valuation Committee and Member of the Audit Committee of the Wildermuth Endowment Strategy Fund |
Keith
Rhoades
1948 | Trustee Since May 2011 | Retired since 2008. | 3 | NONE |
Randal D.
Skalla
1962 | Trustee Since May 2011 | President, L5 Enterprises, Inc. (financial services company) (since 2001). | 3 | Board Member, Orizon Investment Counsel (financial services company) (from 2001 to 2017) |
| Acclivity Small Cap Value Fund |
| SUPPLEMENTAL INFORMATION (Unaudited)(Continued) |
| December 31, 2019 |
Interested Trustees and Officers
Name and
Year of Birth | Position/Term
of Office* | Principal Occupation
During the Past Five Years | Number of
Portfolios in
Fund
Complex
Overseen
by
Trustee*** | Other Directorships held by
Trustee
During the Past Five Years |
Brian
Nielsen**
1972 | Trustee Since May 2011 | Trustee (since 2011) of Northern Lights Fund Trust II; Special Projects Counsel of NorthStar Financial Services Group, LLC (from 2018 to 2019); General Counsel (from 2001 to 2014) and Secretary (from 2001 to 2018) of CLS Investments, LLC; General Counsel (from 2001 to 2014) and Secretary (from 2001 to 2018) of Orion Advisor Services, LLC; Manager (from 2012 to 2015), General Counsel and Secretary (from 2003 to 2018) of NorthStar Financial Services Group, LLC; CEO (from 2012 to 2018), General Counsel (from 2003 to 2014), Secretary (from 2003 to 2018) and Manager (from 2005 to 2018) of Northern Lights Distributors, LLC; Director, Secretary and General Counsel (from 2004 to 2018) of Constellation Trust Company; CEO (from 2015 to 2018), Manager (from 2008 to 2015), General Counsel and Secretary (from 2011 to 2018) of Northern Lights Compliance Services, LLC; General Counsel and Secretary (from 2011 to 2018) of Blu Giant, LLC; General Counsel (from 2012 to 2014) and Secretary (from 2012 to 2018) of Gemini Fund Services, LLC; Manager (from 2012 to 2018) of Arbor Point Advisors, LLC; General Counsel and Secretary (from 2013 to 2014) of Gemini Hedge Fund Services, LLC; General Counsel and Secretary (from 2013 to 2014) of Gemini Alternative Funds, LLC; Secretary and General Counsel of NorthStar Holdings, LLC (from 2013 to 2015); Director, Secretary and General Counsel of NorthStar CTC Holdings, Inc. (from 2015 to 2018) and Secretary and Chief Legal Officer (from 2003 to 2018) of AdvisorOne Funds. | 3 | Manager of Northern Lights Distributors, LLC (from 2005 to 2018); Manager of NorthStar Financial Services Group, LLC (from 2012 to 2015); Manager of Arbor Point Advisors, LLC (from 2012 to 2018); Director of Constellation Trust Company |
Kevin E.
Wolf
1969 | President Since January 2013 | Vice President of The Ultimus Group, LLC and Executive Vice President of Gemini Fund Services, LLC (since 2019), President, Gemini Fund Services, LLC (2012 - 2019) | N/A | N/A |
Richard
Malinowski
1983 | Secretary Since January 2018 | Senior Vice President Legal Administration, Gemini Fund Services, LLC (since April 2017); Vice President and Counsel (April 2016 to 2017) and AVP and Staff Attorney (September 2012 to March 2016). | N/A | N/A |
Erik Naviloff
1968 | Treasurer Since January 2013 | Vice President of Gemini Fund Services, LLC (since 2011). | N/A | N/A |
Emile R.
Molineaux
1962 | Chief Compliance Officer and Anti Money Laundering Officer Since May 2011 | Senior Compliance Officer and CCO of Various clients of Northern Lights Compliance Services, LLC (since 2011). | N/A | N/A |
| * | The term of office for each Trustee and Officer listed above will continue indefinitely. |
| ** | Brian Nielsen is an “interested person” of the Trust as that term is defined under the 1940 Act, because of his former affiliation with Northern Lights Distributors, LLC (the Fund’s Distributor). |
| *** | As of December 31, 2019, the Trust was comprised of 19 active portfolios managed by unaffiliated investment advisers. The term “Fund Complex” applies only to the Dynamic International Opportunity Fund, Dynamic U.S. Opportunity Fund, and Acclivity Small Cap Value Fund and not to any other series of the Trust. The Funds do not hold themselves out as related to any other series within the Trust for investment purposes, nor do they share the same investment adviser with any other series. |
The Fund’s Statement of Additional Information (“SAI”) includes additional information about the Trustees and is available free of charge, upon request, by calling toll-free at 1-855-873-3837.
Privacy Policy
Rev. May 2019
| FACTS | WHAT DOES NORTHERN LIGHTS FUND TRUST II (“NLFT II”) DO WITH YOUR PERSONAL INFORMATION? |
| Why? | Financial companies choose how they share your personal information. Federal law gives consumers the right to limit some but not all sharing. Federal law also requires us to tell you how we collect, share, and protect your personal information. Please read this notice carefully to understand what we do. |
| What? | The types of personal information we collect and share depend on the product or service you have with us. This information can include:
|
● Social Security number ● Employment information ● Account balances | ● Account transactions ● Income ● Investment experience |
When you are no longer our customer, we continue to share your information as described in this notice. |
| How? | All financial companies need to share a customer’s personal information to run their everyday business - to process transactions, maintain customer accounts, and report to credit bureaus. In the section below, we list the reasons financial companies can share their customer’s personal information; the reasons NLFT II chooses to share; and whether you can limit this sharing. |
| | |
| Reasons we can share your personal information | Does NLFT II
share? | Can you limit
this sharing? |
For our everyday business purposes —
such as to process your transactions, maintain your account(s), respond to court orders and legal investigations, or report to credit bureaus
| Yes | No |
For our marketing purposes —
to offer our products and services to you
| Yes | No |
For joint marketing with other financial companies
| Yes | No |
For our affiliates’ everyday business purposes —
information about your transactions and experiences
| Yes | No |
For our affiliates’ everyday business purposes —
information about your creditworthiness
| No | We don’t share |
For nonaffiliates to market to you
| No | We don’t share |
| Questions? | Call 1-402-493-4603 |
| | |
| Who we are |
| Who is providing this notice? | Northern Lights Fund Trust II |
| What we do |
| How does NLFT II protect my personal information? | To protect your personal information from unauthorized access and use, we use security measures that comply with federal law. These measures include computer safeguards and secured files and buildings.
|
| How does NLFT II collect my personal information? | We collect your personal information, for example, when you
|
● open an account ● give us your income information ● provide employment information | ● provide account information ● give us your contact information |
| We also collect your personal information from others, such as credit bureaus, affiliates, or other companies. |
| Why can’t I limit all sharing? | Federal law gives you the right to limit only ● sharing for affiliates’ everyday business purposes—information about your creditworthiness ● affiliates from using your information to market to you ● sharing for nonaffiliates to market to you State laws and individual companies may give you additional rights to limit sharing. |
| Definitions |
| Affiliates | Companies related by common ownership or control. They can be financial and nonfinancial companies. ● Northern Lights Fund Trust II has no affiliates. |
| Nonaffiliates | Companies not related by common ownership or control. They can be financial and nonfinancial companies. ● NLFT II does not share with nonaffiliates so they can market to you. |
| Joint marketing | A formal agreement between nonaffiliated financial companies that together market financial products and services to you. ● Our joint marketing partners include other financial service companies. |
PROXY VOTING POLICY
Information regarding how the Fund voted proxies relating to portfolio securities for the most recent twelve month period ended June 30 as well as a description of the policies and procedures that the Fund uses to determine how to vote proxies is available without charge, upon request, by calling 1-855-873-3837 or by referring to the Securities and Exchange Commission’s (“SEC”) website at http://www.sec.gov.
PORTFOLIO HOLDINGS
The Fund files its complete schedule of portfolio holdings with the SEC for the first and third quarters of each fiscal year on Form N-Q. Form N-Q is available on the SEC’s website at http://www.sec.gov and may be reviewed and copied at the SEC’s Public Reference Room in Washington, DC (1-800-SEC-0330). The information on Form N-Q is available without charge, upon request, by calling 1-855-873-3837.
| INVESTMENT ADVISER |
| Innealta Capital, LLC |
| 13215 Bee Cave Pkwy, Bldg A, Suite 240 |
| Austin, Texas 78738 |
| |
| ADMINISTRATOR |
| Gemini Fund Services, LLC |
| 4221 North 203rd Street, Suite 100 |
| Elkhorn, Nebraska 68022 |
Item 2. Code of Ethics.
(a) As of the end of the period covered by this report, the registrant has adopted a code of ethics that applies to the registrant's principal executive officer, principal financial officer, principal accounting officer or controller, or persons performing similar functions, regardless of whether these individuals are employed by the registrant or a third party.
(b) For purposes of this item, “code of ethics” means written standards that are reasonably designed to deter wrongdoing and to promote:
| (1) | Honest and ethical conduct, including the ethical handling of actual or apparent conflicts of interest between personal and professional relationships; |
| (2) | Full, fair, accurate, timely, and understandable disclosure in reports and documents that a registrant files with, or submits to, the Commission and in other public communications made by the registrant; |
(3) Compliance with applicable governmental laws, rules, and regulations;
| (4) | The prompt internal reporting of violations of the code to an appropriate person or persons identified in the code; and |
(5) Accountability for adherence to the code.
(c) Amendments: During the period covered by the report, there have not been any amendments to the provisions of the code of ethics.
(d) Waivers: During the period covered by the report, the registrant has not granted any express or implicit waivers from the provisions of the code of ethics.
(e) The Code of Ethics is not posted on Registrant’ website.
(f) A copy of the Code of Ethics is attached as an exhibit.
Item 3. Audit Committee Financial Expert.
(a)(1)ii The board of directors of the fund has determined that the fund does not have an audit committee financial expert serving on its audit committee.
(a)(2) Not applicable.
(a)(3) In this regard, no member of the audit committee was identified as having all of the required technical attributes identified in instruction 2 (b) to item 3 of Form N-CSR to qualify as an “audit committee financial expert,” whether through the type of specialized education or experience required by that instruction. At this time, the board believes the experience provided by each member of the audit committee collectively offers the fund adequate oversight by its audit committee given the fund’s level of financial complexity. The board will from time to time reexamine such belief.
Item 4. Principal Accountant Fees and Services.
2019 - $10,000
2019 - None
2019 - $2,200
Preparation of Federal & State income tax returns, assistance with calculation of required income, capital gain and excise distributions and preparation of Federal excise tax returns.
2019 - None
| (e) | (1)Audit Committee’s Pre-Approval Policies |
The registrant’s Audit Committee is required to pre-approve all audit services and, when appropriate, any non-audit services (including audit-related, tax and all other services) to the registrant. The registrant’s Audit Committee also is required to pre-approve, when appropriate, any non-audit services (including audit-related, tax and all other services) to its adviser, or any entity controlling, controlled by or under common control with the adviser that provides ongoing services to the registrant, to the extent that the services may be determined to have an impact on the operations or financial reporting of the registrant. Services are reviewed on an engagement by engagement basis by the Audit Committee.
| (2) | Percentages of Services Approved by the Audit Committee |
| | | 2019 |
| Audit-Related Fees: | | | 0.00 | % |
| Tax Fees: | | | 0.00 | % |
| All Other Fees: | | | 0.00 | % |
| (f) | During the audit of registrant's financial statements for the most recent fiscal year, less than 50 percent of the hours expended on the principal accountant's engagement were attributed to work performed by persons other than the principal accountant's full-time, permanent employees. |
| (g) | The aggregate non-audit fees billed by the registrant's accountant for services rendered to the registrant, and rendered to the registrant's investment adviser (not including any sub-adviser whose role is primarily portfolio management and is subcontracted with or overseen by another investment adviser), and any entity controlling, controlled by, or under common control with the adviser that provides ongoing services to the registrant: |
2019 - $2,200
(h) The registrant's audit committee has considered whether the provision of non-audit services to the registrant's investment adviser (not including any sub-adviser whose role is primarily portfolio management and is subcontracted with or overseen by another investment adviser), and any entity controlling, controlled by, or under common control with the investment adviser that provides ongoing services to the registrant, that were not pre-approved pursuant to paragraph (c)(7)(ii) of Rule 2-01 of Regulation S-X, is compatible with maintaining the principal accountant's independence.
Item 5. Audit Committee of Listed Companies.Not applicable to open-end investment companies.
Item 6. Schedule of Investments.See Item 1.
Item 7. Disclosure of Proxy Voting Policies and Procedures for Closed-End Funds. Not applicable to open-end investment companies.
Item 8. Portfolio Managers of Closed-End Management Investment Companies. Not applicable to open-end investment companies.
Item 9. Purchases of Equity Securities by Closed-End Funds. Not applicable to open-end investment companies.
Item 10. Submission of Matters to a Vote of Security Holders. None
Item 11. Controls and Procedures.
(a) Based on an evaluation of the Registrant’s disclosure controls and procedures as of a date within 90 days of filing date of this Form N-CSR, the principal executive officer and principal financial officer of the Registrant have concluded that the disclosure controls and procedures of the Registrant are reasonably designed to ensure that the information required in filings on Form N-CSR is recorded, processed, summarized, and reported by the filing date, including that information required to be disclosed is accumulated and communicated to the Registrant’s management, including the Registrant’s principal executive officer and principal financial officer, as appropriate to allow timely decisions regarding required disclosure.
(b) There were no significant changes in the Registrant’s internal control over financial reporting that occurred during the Registrant’s last fiscal half-year that have materially affected, or are reasonably likely to materially affect, the Registrant’s internal control over financial reporting.
Item 12. Disclosure of Securities Lending Activities for Closed-End Management Investment Companies. Not applicable to open-end investment companies.
Item 13. Exhibits.
(a)(1) Code of Ethics herewith.
(a)(2) Certifications required by Section 302 of the Sarbanes-Oxley Act of 2002 (and Item 11(a)(2) of Form N-CSR) are filed herewith.
(a)(3) Not applicable for open-end investment companies.
(b) Certifications required by Section 906 of the Sarbanes-Oxley Act of 2002 (and Item 11(b) of Form N-CSR) are filed herewith.
SIGNATURES
Pursuant to the requirements of the Securities Exchange Act of 1934 and the Investment Company Act of 1940, the registrant has duly caused this report to be signed on its behalf by the undersigned, thereunto duly authorized.
(Registrant)Northern Lights Fund Trust II
By (Signature and Title)
/s/ Kevin E. Wolf
Kevin E. Wolf, Principal Executive Officer/President
Date 3/6/20
Pursuant to the requirements of the Securities Exchange Act of 1934 and the Investment Company Act of 1940, this report has been signed below by the following persons on behalf of the registrant and in the capacities and on the dates indicated.
By (Signature and Title)
/s/ Kevin E. Wolf
Kevin E. Wolf, Principal Executive Officer/President
Date 3/6/20
By (Signature and Title)
/s/ Erik Naviloff
Erik Naviloff, Principal Financial Officer/Treasurer
Date 3/6/20