united states
securities and exchange commission
washington, d.c. 20549
form n-csr
certified shareholder report of registered management
investment companies
Investment Company Act file number 811-22549
Northern Lights Fund Trust II
(Exact name of registrant as specified in charter)
225 Pictoria Drive, Suite 450, Cincinnati, Ohio 45246
(Address of principal executive offices) (Zip code)
Kevin Wolf, Gemini Fund Services, LLC
80 Arkay Drive, Hauppauge, NY 11788
(Name and address of agent for service)
Registrant's telephone number, including area code: 631-470-2619
Date of fiscal year end: 12/31
Date of reporting period: 12/31/20
Item 1. Reports to Stockholders.
Acclivity Mid Cap Multi-Style Fund
Acclivity Small Cap Value Fund
Annual Report
December 31, 2020
www.acclivityfunds.com
1 (855) 873-3837
Distributed by Northern Lights Distributors, LLC
Member FINRA
US Market Review (unaudited)
A Brief Recap
The U.S. equity market had a historic and unprecedented year in 2020 because of the global healthcare pandemic. Across different market capitalization segments, the U.S. large-cap, as represented by the Russell 1000 Index, finished with 20.96%, the U.S. mid-cap, as represented by the Russell Mid-Cap Index, went up with 17.10%, while the U.S. small-cap, as represented by the Russell 2000 Index, underperformed the large peers by 1%. Among all the GICS sectors, Information Technology and Consumer Discretionary securities outperformed while Energy securities lagged behind most. Value securities underperformed growth securities across different market capitalization segments measured by Russell indices in 2020.
Acclivity Mid-Cap Multi-Style Fund (AXMIX)
Within the Mid Caps for this period, the Russell Mid-Cap Value Total Return Index went up 4.96%, while the Russell Mid-Cap Growth Total Return Index surged 35.59%. Acclivity Mid-Cap Multi-Style Fund I Share class was up 10.40%. Exhibit 1 compares the quarterly performance of AXMIX and its benchmark Russell Mid-Cap Total Return Index.
Exhibit 1. Performance of AXMIX v.s. Russell Mid-Cap Index as of December 31th, 2020
| | | | | | |
| 2020 Performance | Q1 | Q2 | Q3 | Q4 | YTD |
| | | | | | |
| AXMIX | -31.00% | 22.46% | 6.86% | 22.26% | 10.40% |
| Russell Mid-Cap | -27.07% | 24.61% | 7.46% | 19.91% | 17.10% |
To decompose fund performance, the underweight of real estate and utility securities have made up most of the positive sector allocation, and the overweight in financial securities dragged the performance. In the meanwhile, the security selections in the information technology and real estate sectors struggled.
Exhibit 2 compares the characteristics of the fund against the benchmark. Our fund investment style is consistent and is in line with the investment prospectus, while the investment style of the benchmark deviates over time due to the infrequent rebalance.
Exhibit 2. Characteristics of AXMIX v.s. Russell Mid-Cap Index as of December 31th, 2020.
| | | | | Market |
| | | | EBITDA/Total | Capitalization |
| Fund/Index | Price-to-Book | Price-to-Earnings | Market Value | ($B) |
| AXMIX | 2.63 | 20.11 | 2.67% | 12.78 |
| Russell Mid-Cap Index | 3.20 | 23.31 | 2.97% | 20.48 |
Our research team pursues an active research agenda in which we are looking for better ways to define and measure factors systematically. We work with leading financial economists to follow, digest, and analyze the latest academic research. And as always, we are focused on delivering long-term results that our clients expect from Innealta Capital.
Acclivity Small Cap Value Fund (AXVIX)
Within the Small Caps for this period, the Russell 2000 Value Total Return Index (“The Benchmark”) gained 4.63%, while the Russell 2000 Growth Total Return Index surged 34.63%. Acclivity Small Cap Value Fund I Share class was up 7.51%. Exhibit 1 compares the quarterly performance of AXVIX and its benchmark Russell 2000 Value Index.
Exhibit 1. Quarterly Performance of AXVIX v.s. Russell 2000 Value in 2020
| | | | | | |
| 2020 Performance | Q1 | Q2 | Q3 | Q4 | YTD |
| | | | | | |
| AXVIX | -38.78% | 26.39% | 3.96% | 33.65% | 7.51% |
| Russell 2000 Value | -35.66% | 18.91% | 2.56% | 33.36% | 4.63% |
To decompose fund performance, the overweight in consumer discretionary and information technology securities and the underweight of real estate securities have made up most of the positive sector allocation. Meanwhile, the security selections in the financial and real estate sectors have made up most of the positive security selection. The security selections in information technology and materials securities struggled.
Exhibit 2 compares the characteristics of the fund against the benchmark. Our fund investment style is consistent and is in line with the investment prospectus, while the investment style of the benchmark deviates over time due to the infrequent rebalance.
Exhibit 2. Characteristics of AXVIX v.s. Russell 2000 Value Index as of December 31st, 2020.
| | | | | Market |
| | | | EBITDA/Total | Capitalization |
| Fund/Index | Price-to-Book | Price-to-Earnings | Market Value | ($B) |
| AXVIX | 1.09 | 11.84 | 6.41% | 2.87 |
| Russell 2000 Value Index | 1.51 | 15.88 | 2.76% | 2.50 |
The underperformance of value securities relative to the growth securities has been a headwind for our more profound value tilt throughout 2020. The spread between Value and Growth is the widest in almost the last 20 years. See Exhibit 3 for Value v.s. Growth spread from January 2000 to December 2020. In the long run, value still outperforms growth. However, the spread has been narrowed sharply in the last five years.
Exhibit 3. High minus Low (Value v.s. Growth) spread from January 2000 to December 2020.
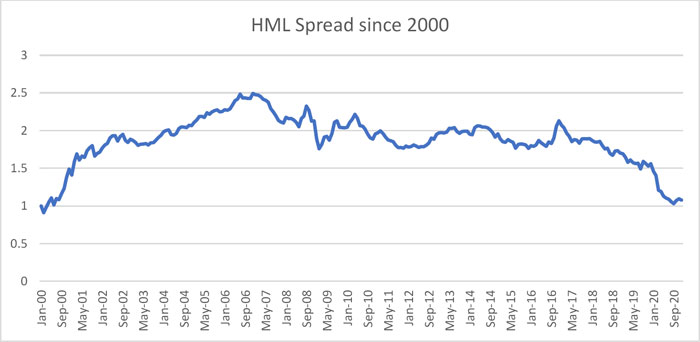
Source: Kenneth R. French data library. Fama/French 3 Factors from 01/01/2000 to 12/31/2020. Frequency monthly. HML (High Minus Low) is the average return on the two value portfolios minus the average return on the two growth portfolios.
If we look into the historical performance of value and growth, the value factor’s current underperformance is not surprising. Although value has a long-term outperformance track record, value underperforms growth when the economy is slowing down. We believe that the monetary and fiscal policy easing has played a significant role in this outperformance of growth investing.
Disclosures and Important Information
Russell 1000 Index is a stock market index that tracks the highest-ranking 1,000 stocks in the Russell 3000 Index. Russell 2000 Index is a small-cap stock market index of the bottom 2,000 stocks in the Russell 3000 Index. Total return indexes reinvest dividends. Russell Mid-Cap Index is a stock market index that tracks the 800 smallest companies in the Russell 1000 Index, which represents approximately 25% of the total market capitalization of the Russell 1000 Index. Russell 2000 Value Index measures the performance of Russell 2000 companies with lower price-to-book ratios and lower forecasted growth values. Russell 2000 Growth Index measures the performance of Russell 2000 companies with higher price-to-book ratios and higher forecasted growth values. Frank Russell Company is the source and owner of the trademarks, service marks, and copyrights related to the Russell Indexes. Indices do not reflect any fees, expenses, or sales charges and are not available for direct investment.
Price-to-book ratio is calculated using Index Methodology. Price-to-earnings ratio is calculated using Weighted Harmonic Average. EBITDA/Total Market Value is a proxy for current cash flow to total market value, commonly known in factor investing as “profitability”.
Investments cannot be made in an index. Unmanaged index returns do not reflect any fees, expenses, or sales charges. Past performance is no guarantee of future results.
706-INN-02/02/2021
2136-NLD-2/2/2021
| ACCLIVITY MID CAP MULTI-STYLE FUND |
| PORTFOLIO REVIEW (Unaudited) |
| December 31, 2020 |
The Fund’s performance figures* for the period ended December 31, 2020, compared to its benchmark:
| | | Since Inception |
| | One Year | (12/31/19) |
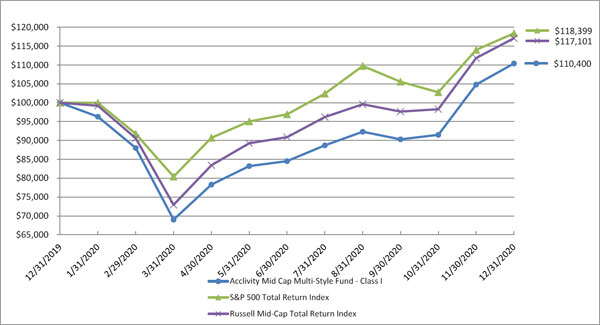
| Acclivity Mid Cap Multi-Style Fund - Class I | 10.40% | 10.40% |
| Acclivity Mid Cap Multi-Style Fund - Class N | 10.40% | 10.40% |
| Russell Mid-Cap Total Return Index** | 17.10% | 17.10% |
| S&P 500 Total Return Index*** | 18.40% | 18.40% |
Comparison of the Change in Value of a $100,000 Investment
| * | The performance data quoted here represents past performance. The performance comparison includes reinvestment of all dividends and capital gain distributions, if any. Current performance may be lower or higher than the performance data quoted above. Past performance is no guarantee of future results. The investment return and principal value of an investment will fluctuate so that investor’s shares, when redeemed, may be worth more or less than their original cost. The returns shown do not reflect the deduction of taxes that a shareholder would pay on Fund distributions or on the redemption of Fund shares. The Fund’s total annual operating expenses are 0.89% for Class I shares and 1.14% for Class N shares per the May 1, 2020, prospectus. After fee waivers, the Fund’s total annual operating expenses are 0.45% for Class I shares and 0.70% for Class N shares. For performance information current to the most recent month-end, please call toll-free 1-855-873-3837 (1-855-USE-ETFS). |
| ** | The Russell Mid-Cap Total Return Index measures the performance of the smallest 800 companies in the Russell 1000 index. Investors cannot invest directly in an index. |
| *** | The S&P 500 Total Return Index is a widely accepted, unmanaged index of U.S. stock market performance which does not take into account charges, fees and other expenses. Investors cannot invest directly in an index. |
| | Holdings By Asset Class as of December 31, 2020 | | % of Net Assets | |
| | Money Market Fund | | | 19.1 | % |
| | Insurance | | | 8.9 | % |
| | Health Care Facilities & Services | | | 5.3 | % |
| | Medical Equipment & Devices | | | 5.0 | % |
| | Semiconductors | | | 4.8 | % |
| | Technology Hardware | | | 4.6 | % |
| | Chemicals | | | 4.3 | % |
| | Banking | | | 4.2 | % |
| | Machinery | | | 4.1 | % |
| | Other | | | 54.9 | % |
| | Liabilities in Excess of Other Assets | | | (15.2 | )% |
| | | | | 100.0 | % |
| | | | | | |
| | Please refer to the Schedule of Investments in this annual report for a detailed analysis of the Fund’s holdings. |
| ACCLIVITY SMALL CAP VALUE FUND |
| PORTFOLIO REVIEW (Unaudited) |
| December 31, 2020 |
The Fund’s performance figures* for the periods ended December 31, 2020, compared to its benchmark:
| | | Since Inception |
| | One Year | (12/31/18) |
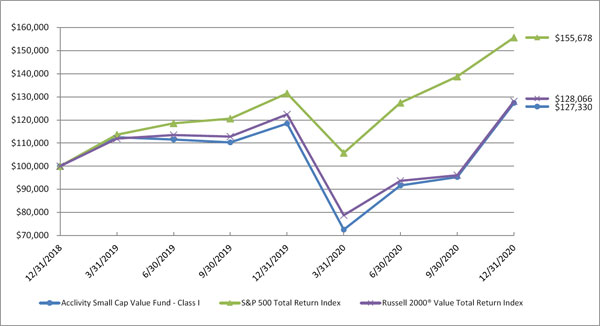
| Acclivity Small Cap Value Fund - Class I | 7.51% | 12.84% |
| Acclivity Small Cap Value Fund - Class N | 7.43% | 12.75% |
| Russell 2000® Value Total Return Index** | 4.63% | 13.17% |
| S&P 500 Total Return Index*** | 18.40% | 24.77% |
Comparison of the Change in Value of a $100,000 Investment
| * | The performance data quoted here represents past performance. The performance comparison includes reinvestment of all dividends and capital gain distributions, if any. Current performance may be lower or higher than the performance data quoted above. Past performance is no guarantee of future results. The investment return and principal value of an investment will fluctuate so that investor’s shares, when redeemed, may be worth more or less than their original cost. The returns shown do not reflect the deduction of taxes that a shareholder would pay on Fund distributions or on the redemption of Fund shares. The Fund’s total annual operating expenses are 14.44% for Class I shares and 81.47% for Class N shares per the May 1, 2020, prospectus. After fee waivers, the Fund’s total annual operating expenses are 0.49% for Class I shares and 0.74% for Class N shares. For performance information current to the most recent month-end, please call toll-free 1-855-873-3837 (1-855-USE-ETFS). |
| ** | The Russell 2000® Value Total Return Index measures the performance of the largest 2,000 U.S. companies determined by total market capitalization. Investors cannot invest directly in an index. |
| *** | The S&P 500 Total Return Index is a widely accepted, unmanaged index of U.S. stock market performance which does not take into account charges, fees and other expenses. Investors cannot invest directly in an index. |
| | Holdings By Asset Class as of December 31, 2020 | | % of Net Assets | |
| | Banking | | | 21.0 | % |
| | Retail - Discretionary | | | 8.9 | % |
| | Insurance | | | 6.5 | % |
| | Technology Hardware | | | 5.9 | % |
| | Specialty Finance | | | 4.2 | % |
| | Machinery | | | 4.2 | % |
| | Oil & Gas Producers | | | 3.1 | % |
| | Biotech & Pharma | | | 2.6 | % |
| | Engineering & Construction | | | 2.3 | % |
| | Other | | | 41.9 | % |
| | Liabilities in Excess of Other Assets | | | (0.6 | )% |
| | | | | 100.0 | % |
| | | | | | |
| | Please refer to the Schedule of Investments in this annual report for a detailed analysis of the Fund’s holdings. |
| ACCLIVITY MID CAP MULTI-STYLE FUND |
| SCHEDULE OF INVESTMENTS |
| December 31, 2020 |
| Shares | | | | | Value | |
| | | | | COMMON STOCKS — 96.1% | | | | |
| | | | | ADVERTISING & MARKETING - 2.9% | | | | |
| | 44 | | | Interpublic Group of Companies, Inc. (The) | | $ | 1,035 | |
| | 10 | | | Omnicom Group, Inc. | | | 624 | |
| | 3 | | | Trade Desk, Inc. (The), Class A(a) | | | 2,403 | |
| | | | | | | | 4,062 | |
| | | | | AEROSPACE & DEFENSE - 0.2% | | | | |
| | 1 | | | Hexcel Corporation | | | 48 | |
| | 6 | | | Textron, Inc. | | | 290 | |
| | | | | | | | 338 | |
| | | | | APPAREL & TEXTILE PRODUCTS - 1.0% | | | | |
| | 1 | | | Carter’s, Inc. | | | 94 | |
| | 2 | | | Deckers Outdoor Corporation(a) | | | 574 | |
| | 4 | | | Ralph Lauren Corporation | | | 415 | |
| | 6 | | | Skechers USA, Inc., Class A(a) | | | 216 | |
| | 6 | | | Tapestry, Inc. | | | 186 | |
| | | | | | | | 1,485 | |
| | | | | ASSET MANAGEMENT - 2.5% | | | | |
| | 20 | | | Apollo Global Management, Inc. | | | 979 | |
| | 3 | | | Eaton Vance Corporation | | | 204 | |
| | 25 | | | Franklin Resources, Inc. | | | 625 | |
| | 5 | | | LPL Financial Holdings, Inc. | | | 521 | |
| | 13 | | | Raymond James Financial, Inc. | | | 1,244 | |
| | | | | | | | 3,573 | |
| | | | | AUTOMOTIVE - 1.1% | | | | |
| | 6 | | | Autoliv, Inc. | | | 553 | |
| | 11 | | | BorgWarner, Inc. | | | 425 | |
| | 4 | | | Lear Corporation | | | 636 | |
| | | | | | | | 1,614 | |
| | | | | BANKING - 4.2% | | | | |
| | 1 | | | CIT Group, Inc. | | | 36 | |
| | 24 | | | Citizens Financial Group, Inc. | | | 858 | |
| | 61 | | | Huntington Bancshares, Inc. | | | 770 | |
| | 59 | | | KeyCorp | | | 968 | |
| | 7 | | | M&T Bank Corporation | | | 891 | |
| | 57 | | | Regions Financial Corporation | | | 919 | |
See accompanying notes to financial statements.
| ACCLIVITY MID CAP MULTI-STYLE FUND |
| SCHEDULE OF INVESTMENTS (Continued) |
| December 31, 2020 |
| Shares | | | | | Value | |
| | | | | COMMON STOCKS — 96.1% (Continued) | | | | |
| | | | | BANKING - 4.2% (Continued) | | | | |
| | 3 | | | SVB Financial Group(a) | | $ | 1,164 | |
| | 8 | | | Zions Bancorp NA | | | 348 | |
| | | | | | | | 5,954 | |
| | | | | BEVERAGES - 0.8% | | | | |
| | 1 | | | Boston Beer Company, Inc. (The), Class A(a) | | | 994 | |
| | 2 | | | Molson Coors Beverage Company, Class B | | | 91 | |
| | | | | | | | 1,085 | |
| | | | | BIOTECH & PHARMA - 1.4% | | | | |
| | 1 | | | Arrowhead Pharmaceuticals, Inc.(a) | | | 77 | |
| | 6 | | | BioMarin Pharmaceutical, Inc.(a) | | | 526 | |
| | 16 | | | Exelixis, Inc.(a) | | | 321 | |
| | 3 | | | Ionis Pharmaceuticals, Inc.(a) | | | 170 | |
| | 5 | | | Neurocrine Biosciences, Inc.(a) | | | 479 | |
| | 3 | | | United Therapeutics Corporation(a) | | | 455 | |
| | | | | | | | 2,028 | |
| | | | | CABLE & SATELLITE - 0.4% | | | | |
| | 4 | | | Liberty Broadband Corporation - Series A(a) | | | 630 | |
| | | | | | | | | |
| | | | | CHEMICALS - 4.3% | | | | |
| | 5 | | | Albemarle Corporation | | | 738 | |
| | 2 | | | Ashland Global Holdings, Inc. | | | 158 | |
| | 4 | | | Avery Dennison Corporation | | | 620 | |
| | 6 | | | Celanese Corporation | | | 780 | |
| | 13 | | �� | CF Industries Holdings, Inc. | | | 503 | |
| | 8 | | | Eastman Chemical Company | | | 802 | |
| | 11 | | | FMC Corporation | | | 1,264 | |
| | 4 | | | Huntsman Corporation | | | 101 | |
| | 5 | | | International Flavors & Fragrances, Inc. | | | 544 | |
| | 6 | | | RPM International, Inc. | | | 545 | |
| | 2 | | | W R Grace & Company | | | 110 | |
| | | | | | | | 6,165 | |
| | | | | COMMERCIAL SUPPORT SERVICES - 0.4% | | | | |
| | 1 | | | Aramark | | | 39 | |
| | 2 | | | ManpowerGroup, Inc. | | | 180 | |
See accompanying notes to financial statements.
| ACCLIVITY MID CAP MULTI-STYLE FUND |
| SCHEDULE OF INVESTMENTS (Continued) |
| December 31, 2020 |
| Shares | | | | | Value | |
| | | | | COMMON STOCKS — 96.1% (Continued) | | | | |
| | | | | COMMERCIAL SUPPORT SERVICES - 0.4% (Continued) | | | | |
| | 2 | | | Robert Half International, Inc. | | $ | 125 | |
| | 4 | | | Stericycle, Inc.(a) | | | 277 | |
| | | | | | | | 621 | |
| | | | | CONSTRUCTION MATERIALS - 1.7% | | | | |
| | 3 | | | Carlisle Companies, Inc. | | | 468 | |
| | 4 | | | Martin Marietta Materials, Inc. | | | 1,136 | |
| | 2 | | | MDU Resources Group, Inc. | | | 53 | |
| | 10 | | | Owens Corning | | | 758 | |
| | | | | | | | 2,415 | |
| | | | | CONSUMER SERVICES - 0.6% | | | | |
| | 9 | | | Chegg, Inc.(a) | | | 813 | |
| | | | | | | | | |
| | | | | CONTAINERS & PACKAGING - 1.7% | | | | |
| | 4 | | | AptarGroup, Inc. | | | 547 | |
| | 8 | | | Crown Holdings, Inc.(a) | | | 802 | |
| | 2 | | | Graphic Packaging Holding Company | | | 34 | |
| | 8 | | | Packaging Corp of America | | | 1,103 | |
| | | | | | | | 2,486 | |
| | | | | DIVERSIFIED INDUSTRIALS - 0.2% | | | | |
| | 4 | | | ITT, Inc. | | | 308 | |
| | | | | | | | | |
| | | | | E-COMMERCE DISCRETIONARY - 0.9% | | | | |
| | 7 | | | Etsy, Inc.(a) | | | 1,245 | |
| | | | | | | | | |
| | | | | ELECTRIC UTILITIES - 1.5% | | | | |
| | 2 | | | Hawaiian Electric Industries, Inc. | | | 71 | |
| | 2 | | | IDACORP, Inc. | | | 192 | |
| | 25 | | | NRG Energy, Inc. | | | 939 | |
| | 13 | | | OGE Energy Corporation | | | 414 | |
| | 6 | | | Pinnacle West Capital Corporation | | | 480 | |
| | 2 | | | Portland General Electric Company | | | 85 | |
| | | | | | | | 2,181 | |
| | | | | ELECTRICAL EQUIPMENT - 3.0% | | | | |
| | 10 | | | A O Smith Corporation | | | 548 | |
See accompanying notes to financial statements.
| ACCLIVITY MID CAP MULTI-STYLE FUND |
| SCHEDULE OF INVESTMENTS (Continued) |
| December 31, 2020 |
| Shares | | | | | Value | |
| | | | | COMMON STOCKS — 96.1% (Continued) | | | | |
| | | | | ELECTRICAL EQUIPMENT - 3.0% (Continued) | | | | |
| | 1 | | | Acuity Brands, Inc. | | $ | 121 | |
| | 6 | | | BWX Technologies, Inc. | | | 362 | |
| | 6 | | | Cognex Corporation | | | 482 | |
| | 4 | | | Generac Holdings, Inc.(a) | | | 910 | |
| | 4 | | | Hubbell, Inc. | | | 627 | |
| | 4 | | | National Instruments Corporation | | | 176 | |
| | 15 | | | Trimble, Inc.(a) | | | 1,001 | |
| | | | | | | | 4,227 | |
| | | | | ENGINEERING & CONSTRUCTION - 1.5% | | | | |
| | 8 | | | AECOM(a) | | | 398 | |
| | 2 | | | EMCOR Group, Inc. | | | 183 | |
| | 6 | | | Jacobs Engineering Group, Inc. | | | 654 | |
| | 13 | | | Quanta Services, Inc. | | | 936 | |
| | | | | | | | 2,171 | |
| | | | | ENTERTAINMENT CONTENT - 0.3% | | | | |
| | 37 | | | Zynga, Inc., Class A(a) | | | 365 | |
| | | | | | | | | |
| | | | | FOOD - 1.3% | | | | |
| | 9 | | | Darling Ingredients, Inc.(a) | | | 519 | |
| | 4 | | | Ingredion, Inc. | | | 315 | |
| | 6 | | | J M Smucker Company (The) | | | 694 | |
| | 2 | | | Lancaster Colony Corporation | | | 367 | |
| | | | | | | | 1,895 | |
| | | | | FORESTRY, PAPER & WOOD PRODUCTS - 0.5% | | | | |
| | 8 | | | Trex Company, Inc.(a) | | | 670 | |
| | | | | | | | | |
| | | | | HEALTH CARE FACILITIES & SERVICES - 5.3% | | | | |
| | 16 | | | Cardinal Health, Inc. | | | 857 | |
| | 3 | | | Charles River Laboratories International, Inc.(a) | | | 749 | |
| | 1 | | | Chemed Corporation | | | 533 | |
| | 7 | | | DaVita, Inc.(a) | | | 822 | |
| | 7 | | | Encompass Health Corporation | | | 579 | |
| | 2 | | | LHC Group, Inc.(a) | | | 427 | |
| | 5 | | | Molina Healthcare, Inc.(a) | | | 1,063 | |
See accompanying notes to financial statements.
| ACCLIVITY MID CAP MULTI-STYLE FUND |
| SCHEDULE OF INVESTMENTS (Continued) |
| December 31, 2020 |
| Shares | | | | | Value | |
| | | | | COMMON STOCKS — 96.1% (Continued) | | | | |
| | | | | HEALTH CARE FACILITIES & SERVICES - 5.3% (Continued) | | | | |
| | 3 | | | PRA Health Sciences, Inc.(a) | | $ | 376 | |
| | 7 | | | Syneos Health, Inc.(a) | | | 477 | |
| | 3 | | | Teladoc Health, Inc.(a) | | | 600 | |
| | 8 | | | Universal Health Services, Inc., Class B | | | 1,100 | |
| | | | | | | | 7,583 | |
| | | | | HOME & OFFICE PRODUCTS - 1.3% | | | | |
| | 2 | | | Leggett & Platt, Inc. | | | 89 | |
| | 18 | | | Newell Brands, Inc. | | | 382 | |
| | 3 | | | Scotts Miracle-Gro Company (The) | | | 597 | |
| | 8 | | | Tempur Sealy International, Inc.(a) | | | 216 | |
| | 3 | | | Whirlpool Corporation | | | 542 | |
| | | | | | | | 1,826 | |
| | | | | HOME CONSTRUCTION - 0.9% | | | | |
| | 7 | | | Fortune Brands Home & Security, Inc. | | | 600 | |
| | 15 | | | PulteGroup, Inc. | | | 647 | |
| | | | | | | | 1,247 | |
| | | | | INDUSTRIAL SUPPORT SERVICES - 1.6% | | | | |
| | 2 | | | AMERCO | | | 908 | |
| | 4 | | | United Rentals, Inc.(a) | | | 928 | |
| | 2 | | | Watsco, Inc. | | | 453 | |
| | | | | | | | 2,289 | |
| | | | | INSURANCE - 8.9% | | | | |
| | 10 | | | American Financial Group, Inc. | | | 876 | |
| | 6 | | | Assurant, Inc. | | | 817 | |
| | 13 | | | Globe Life, Inc. | | | 1,235 | |
| | 33 | | | Hartford Financial Services Group, Inc. (The) | | | 1,616 | |
| | 9 | | | Kemper Corporation | | | 691 | |
| | 26 | | | Lincoln National Corporation | | | 1,308 | |
| | 29 | | | Loews Corporation | | | 1,306 | |
| | 25 | | | Old Republic International Corporation | | | 493 | |
| | 19 | | | Principal Financial Group, Inc. | | | 943 | |
| | 8 | | | Radian Group, Inc. | | | 162 | |
| | 8 | | | Reinsurance Group of America, Inc. | | | 927 | |
| | 9 | | | Unum Group | | | 206 | |
See accompanying notes to financial statements.
| ACCLIVITY MID CAP MULTI-STYLE FUND |
| SCHEDULE OF INVESTMENTS (Continued) |
| December 31, 2020 |
| Shares | | | | | Value | |
| | | | | COMMON STOCKS — 96.1% (Continued) | | | | |
| | | | | INSURANCE - 8.9% (Continued) | | | | |
| | 12 | | | Voya Financial, Inc. | | $ | 706 | |
| | 20 | | | W R Berkley Corporation | | | 1,328 | |
| | | | | | | | 12,614 | |
| | | | | INTERNET MEDIA & SERVICES - 2.8% | | | | |
| | 16 | | | Expedia Group, Inc. | | | 2,119 | |
| | 16 | | | GoDaddy, Inc., Class A(a) | | | 1,327 | |
| | 5 | | | Grubhub, Inc.(a) | | | 371 | |
| | 4 | | | TripAdvisor, Inc. (a) | | | 115 | |
| | | | | | | | 3,932 | |
| | | | | LEISURE FACILITIES & SERVICES - 1.2% | | | | |
| | 1 | | | Choice Hotels International, Inc. | | | 107 | |
| | 6 | | | Darden Restaurants, Inc. | | | 714 | |
| | 3 | | | Vail Resorts, Inc. | | | 837 | |
| | | | | | | | 1,658 | |
| | | | | LEISURE PRODUCTS - 0.8% | | | | |
| | 5 | | | Brunswick Corporation | | | 381 | |
| | 5 | | | Hasbro, Inc. | | | 468 | |
| | 3 | | | Polaris, Inc. | | | 286 | |
| | | | | | | | 1,135 | |
| | | | | MACHINERY - 4.1% | | | | |
| | 5 | | | AGCO Corporation | | | 515 | |
| | 2 | | | Crane Company | | | 155 | |
| | 2 | | | Curtiss-Wright Corporation | | | 233 | |
| | 10 | | | Donaldson Company, Inc. | | | 559 | |
| | 2 | | | Flowserve Corporation | | | 74 | |
| | 11 | | | Graco, Inc. | | | 796 | |
| | 3 | | | IDEX Corporation | | | 597 | |
| | 2 | | | Middleby Corporation (The)(a) | | | 258 | |
| | 2 | | | MSA Safety, Inc. | | | 299 | |
| | 3 | | | Nordson Corporation | | | 603 | |
| | 3 | | | Oshkosh Corporation | | | 258 | |
| | 5 | | | Snap-on, Inc. | | | 856 | |
| | 6 | | | Toro Company (The) | | | 569 | |
| | | | | | | | 5,772 | |
See accompanying notes to financial statements.
| ACCLIVITY MID CAP MULTI-STYLE FUND |
| SCHEDULE OF INVESTMENTS (Continued) |
| December 31, 2020 |
| Shares | | | | | Value | |
| | | | | COMMON STOCKS — 96.1% (Continued) | | | | |
| | | | | MEDICAL EQUIPMENT & DEVICES - 5.0% | | | | |
| | 3 | | | ABIOMED, Inc.(a) | | $ | 973 | |
| | 6 | | | Bruker Corporation | | | 325 | |
| | 12 | | | DENTSPLY SIRONA, Inc. | | | 628 | |
| | 3 | | | Globus Medical, Inc., Class A(a) | | | 196 | |
| | 2 | | | Haemonetics Corporation(a) | | | 238 | |
| | 4 | | | Hill-Rom Holdings, Inc. | | | 392 | |
| | 5 | | | Insulet Corporation(a) | | | 1,278 | |
| | 1 | | | Integra LifeSciences Holdings Corporation(a) | | | 65 | |
| | 3 | | | Masimo Corporation(a) | | | 805 | |
| | 7 | | | PerkinElmer, Inc. | | | 1,004 | |
| | 2 | | | Quidel Corporation(a) | | | 359 | |
| | 5 | | | Varian Medical Systems, Inc.(a) | | | 875 | |
| | | | | | | | 7,138 | |
| | | | | OIL & GAS PRODUCERS - 0.5% | | | | |
| | 28 | | | Cabot Oil & Gas Corporation | | | 456 | |
| | 1 | | | Diamondback Energy, Inc. | | | 48 | |
| | 6 | | | HollyFrontier Corporation | | | 155 | |
| | 5 | | | Parsley Energy, Inc., Class A | | | 71 | |
| | | | | | | | 730 | |
| | | | | OIL & GAS SERVICES & EQUIPMENT - 0.7% | | | | |
| | 44 | | | Halliburton Company | | | 832 | |
| | 10 | | | NOV, Inc. | | | 137 | |
| | | | | | | | 969 | |
| | | | | PUBLISHING & BROADCASTING - 1.6% | | | | |
| | 12 | | | Liberty Media Corp-Liberty Formula One - Series C(a) | | | 512 | |
| | 18 | | | Liberty Media Corp-Liberty SiriusXM, Class C(a) | | | 783 | |
| | 8 | | | New York Times Company (The), Class A | | | 414 | |
| | 30 | | | News Corporation, Class A | | | 539 | |
| | | | | | | | 2,248 | |
| | | | | RENEWABLE ENERGY - 2.1% | | | | |
| | 5 | | | Enphase Energy, Inc.(a) | | | 877 | |
| | 8 | | | First Solar, Inc.(a) | | | 791 | |
| | 4 | | | SolarEdge Technologies, Inc.(a) | | | 1,277 | |
| | | | | | | | 2,945 | |
See accompanying notes to financial statements.
| ACCLIVITY MID CAP MULTI-STYLE FUND |
| SCHEDULE OF INVESTMENTS (Continued) |
| December 31, 2020 |
| Shares | | | | | Value | |
| | | | | COMMON STOCKS — 96.1% (Continued) | | | | |
| | | | | RETAIL - CONSUMER STAPLES - 0.5% | | | | |
| | 4 | | | Casey’s General Stores, Inc. | | $ | 714 | |
| | | | | | | | | |
| | | | | RETAIL - DISCRETIONARY - 3.8% | | | | |
| | 4 | | | Advance Auto Parts, Inc. | | | 630 | |
| | 3 | | | Burlington Stores, Inc.(a) | | | 785 | |
| | 25 | | | Gap, Inc. (The) (a) | | | 505 | |
| | 7 | | | Genuine Parts Company | | | 703 | |
| | 1 | | | Lithia Motors, Inc., Class A | | | 293 | |
| | 9 | | | Tractor Supply Company | | | 1,265 | |
| | 2 | | | Ulta Beauty, Inc.(a) | | | 574 | |
| | 6 | | | Williams-Sonoma, Inc. | | | 611 | |
| | | | | | | | 5,366 | |
| | | | | SEMICONDUCTORS - 4.8% | | | | |
| | 2 | | | Cirrus Logic, Inc.(a) | | | 164 | |
| | 6 | | | Cree, Inc.(a) | | | 635 | |
| | 7 | | | Entegris, Inc. | | | 673 | |
| | 4 | | | MKS Instruments, Inc. | | | 602 | |
| | 2 | | | Monolithic Power Systems, Inc. | | | 733 | |
| | 23 | | | ON Semiconductor Corporation(a) | | | 753 | |
| | 8 | | | Qorvo, Inc.(a) | | | 1,330 | |
| | 2 | | | Silicon Laboratories, Inc.(a) | | | 255 | |
| | 14 | | | Teradyne, Inc. | | | 1,678 | |
| | | | | | | | 6,823 | |
| | | | | SOFTWARE - 3.8% | | | | |
| | 2 | | | ACI Worldwide, Inc.(a) | | | 77 | |
| | 5 | | | Aspen Technology, Inc.(a) | | | 651 | |
| | 7 | | | Black Knight, Inc.(a) | | | 619 | |
| | 3 | | | Concentrix Corporation(a) | | | 296 | |
| | 3 | | | Guidewire Software, Inc.(a) | | | 386 | |
| | 2 | | | J2 Global, Inc. (a) | | | 195 | |
| | 8 | | | NortonLifeLock, Inc. | | | 166 | |
| | 21 | | | Nuance Communications, Inc.(a) | | | 926 | |
| | 3 | | | Paylocity Holding Corporation(a) | | | 618 | |
| | 7 | | | PTC, Inc.(a) | | | 837 | |
See accompanying notes to financial statements.
| ACCLIVITY MID CAP MULTI-STYLE FUND |
| SCHEDULE OF INVESTMENTS (Continued) |
| December 31, 2020 |
| Shares | | | | | Value | |
| | | | | COMMON STOCKS — 96.1% (Continued) | | | | |
| | | | | SOFTWARE - 3.8% (Continued) | | | | |
| | 4 | | | Zendesk, Inc.(a) | | $ | 573 | |
| | | | | | | | 5,344 | |
| | | | | SPECIALTY FINANCE - 2.7% | | | | |
| | 17 | | | Fidelity National Financial, Inc. | | | 664 | |
| | 12 | | | First American Financial Corporation | | | 620 | |
| | 9 | | | MGIC Investment Corporation | | | 113 | |
| | 69 | | | Synchrony Financial | | | 2,395 | |
| | | | | | | | 3,792 | |
| | | | | STEEL - 1.0% | | | | |
| | 6 | | | Reliance Steel & Aluminum Company | | | 718 | |
| | 18 | | | Steel Dynamics, Inc. | | | 664 | |
| | | | | | | | 1,382 | |
| | | | | TECHNOLOGY HARDWARE - 4.6% | | | | |
| | 4 | | | Arrow Electronics, Inc.(a) | | | 389 | |
| | 15 | | | Ciena Corporation(a) | | | 793 | |
| | 7 | | | Dolby Laboratories, Inc., Class A | | | 680 | |
| | 5 | | | F5 Networks, Inc.(a) | | | 880 | |
| | 3 | | | FLIR Systems, Inc. | | | 131 | |
| | 9 | | | Jabil, Inc. | | | 383 | |
| | 31 | | | Juniper Networks, Inc. | | | 698 | |
| | 12 | | | NetApp, Inc. | | | 795 | |
| | 8 | | | Pure Storage, Inc., Class A(a) | | | 181 | |
| | 3 | | | SYNNEX Corporation | | | 244 | |
| | 2 | | | ViaSat, Inc.(a) | | | 65 | |
| | 21 | | | Western Digital Corporation | | | 1,163 | |
| | 4 | | | Xerox Holdings Corporation | | | 93 | |
| | | | | | | | 6,495 | |
| | | | | TECHNOLOGY SERVICES - 2.6% | | | | |
| | 8 | | | Booz Allen Hamilton Holding Corporation | | | 697 | |
| | 2 | | | Euronet Worldwide, Inc.(a) | | | 290 | |
| | 2 | | | FactSet Research Systems, Inc. | | | 665 | |
| | 5 | | | Gartner, Inc.(a) | | | 801 | |
| | 6 | | | Leidos Holdings, Inc. | | | 631 | |
| | 2 | | | MAXIMUS, Inc. | | | 146 | |
See accompanying notes to financial statements.
| ACCLIVITY MID CAP MULTI-STYLE FUND |
| SCHEDULE OF INVESTMENTS (Continued) |
| December 31, 2020 |
| Shares | | | | | Value | |
| | | | | COMMON STOCKS — 96.1% (Continued) | | | | |
| | | | | TECHNOLOGY SERVICES - 2.6% (Continued) | | | | |
| | 2 | | | WEX, Inc.(a) | | $ | 407 | |
| | | | | | | | 3,637 | |
| | | | | TRANSPORTATION & LOGISTICS - 1.6% | | | | |
| | 8 | | | CH Robinson Worldwide, Inc. | | | 751 | |
| | 5 | | | JB Hunt Transport Services, Inc. | | | 683 | |
| | 9 | | | Knight-Swift Transportation Holdings, Inc. | | | 376 | |
| | 3 | | | Landstar System, Inc. | | | 404 | |
| | | | | | | | 2,214 | |
| | | | | TRANSPORTATION EQUIPMENT - 0.5% | | | | |
| | 1 | | | Allison Transmission Holdings, Inc. | | | 43 | |
| | 10 | | | Westinghouse Air Brake Technologies Corporation | | | 732 | |
| | | | | | | | 775 | |
| | | | | WHOLESALE - DISCRETIONARY – 1.0% | | | | |
| | 17 | | | LKQ Corporation(a) | | | 599 | |
| | 2 | | | Pool Corporation | | | 745 | |
| | | | | | | | 1,344 | |
| | | | | | | | | |
| | | | | TOTAL COMMON STOCKS (Cost $105,528) | | | 136,303 | |
| | | | | | | | | |
| | | | | MONEY MARKET FUND – 19.1% | | | | |
| | 27,038 | | | BlackRock Liquidity Funds T-Fund, Institutional Class, 0.01%(b) | | | 27,038 | |
| | | | | | | | | |
| | | | | TOTAL MONEY MARKET FUND (Cost $27,038) | | | 27,038 | |
| | | | | | | | | |
| | | | | TOTAL INVESTMENTS – 115.2% (Cost $132,566) | | $ | 163,341 | |
| | | | | LIABILITIES IN EXCESS OF OTHER ASSETS - (15.2)% | | | (21,528 | ) |
| | | | | NET ASSETS - 100.0% | | $ | 141,813 | |
| (a) | Non-income producing security. |
| (b) | Rate disclosed is the seven day effective yield as of December 31, 2020. |
See accompanying notes to financial statements.
| ACCLIVITY SMALL CAP VALUE FUND |
| SCHEDULE OF INVESTMENTS |
| December 31, 2020 |
| Shares | | | | | Value | |
| | | | | COMMON STOCKS — 99.1% | | | | |
| | | | | AEROSPACE & DEFENSE - 0.4% | | | | |
| | 79 | | | Barnes Group, Inc. | | $ | 4,005 | |
| | 35 | | | Ducommun, Inc.(a) | | | 1,879 | |
| | 47 | | | Moog, Inc., Class A | | | 3,727 | |
| | 21 | | | National Presto Industries, Inc. | | | 1,857 | |
| | | | | | | | 11,468 | |
| | | | | APPAREL & TEXTILE PRODUCTS - 0.6% | | | | |
| | 18 | | | Culp, Inc. | | | 286 | |
| | 124 | | | Fossil Group, Inc.(a) | | | 1,075 | |
| | 31 | | | Movado Group, Inc. | | | 515 | |
| | 110 | | | PVH Corporation | | | 10,328 | |
| | 76 | | | Rocky Brands, Inc. | | | 2,133 | |
| | 149 | | | Tandy Leather Factory, Inc.(a) | | | 477 | |
| | 26 | | | Unifi, Inc.(a) | | | 461 | |
| | 22 | | | Weyco Group, Inc. | | | 349 | |
| | | | | | | | 15,624 | |
| | | | | ASSET MANAGEMENT - 0.9% | | | | |
| | 34 | | | Associated Capital Group, Inc., Class A | | | 1,194 | |
| | 22 | | | BM Technologies, Inc.(a) | | | 306 | |
| | 275 | | | Boston Private Financial Holdings, Inc. | | | 2,324 | |
| | 112 | | | Community Bankers Trust Corporation | | | 756 | |
| | 138 | | | Entasis Therapeutics Holdings, Inc.(a) | | | 341 | |
| | 14 | | | First Western Financial, Inc.(a) | | | 274 | |
| | 45 | | | Hennessy Advisors, Inc. | | | 384 | |
| | 13 | | | Medallion Financial Corporation(a) | | | 64 | |
| | 7 | | | Mediaco Holding, Inc.(a) | | | 18 | |
| | 419 | | | ODP Corporation (The) | | | 12,276 | |
| | 132 | | | Oppenheimer Holdings, Inc., Class A | | | 4,149 | |
See accompanying notes to financial statements.
| ACCLIVITY SMALL CAP VALUE FUND |
| SCHEDULE OF INVESTMENTS (Continued) |
| December 31, 2020 |
| Shares | | | | | Value | |
| | | | | COMMON STOCKS — 99.1% (Continued) | | | | |
| | | | | ASSET MANAGEMENT - 0.9% (Continued) | | | | |
| | 37 | | | PennantPark Investment Corporation | | $ | 171 | |
| | 171 | | | SuRo Capital Corporation | | | 2,238 | |
| | 105 | | | TCG BDC, Inc. | | | 1,077 | |
| | | | | | | | 25,572 | |
| | | | | AUTOMOTIVE - 1.9% | | | | |
| | 238 | | | American Axle & Manufacturing Holdings, Inc.(a) | | | 1,985 | |
| | 665 | | | China Automotive Systems, Inc.(a) | | | 4,150 | |
| | 104 | | | Cooper Tire & Rubber Company | | | 4,212 | |
| | 260 | | | Dana, Inc. | | | 5,075 | |
| | 549 | | | Goodyear Tire & Rubber Company (The) | | | 5,989 | |
| | 458 | | | Harley-Davidson, Inc. | | | 16,809 | |
| | 276 | | | Methode Electronics, Inc. | | | 10,565 | |
| | 34 | | | Miller Industries, Inc. | | | 1,293 | |
| | 225 | | | Modine Manufacturing Company(a) | | | 2,826 | |
| | | | | | | | 52,904 | |
| | | | | BANKING - 21.0% | | | | |
| | 61 | | | American National Bankshares, Inc. | | | 1,599 | |
| | 82 | | | American River Bankshares | | | 1,078 | |
| | 627 | | | Associated Banc-Corporation | | | 10,690 | |
| | 274 | | | Atlantic Union Bankshares Corporation | | | 9,026 | |
| | 12 | | | Bank of Princeton (The) | | | 281 | |
| | 378 | | | Bank OZK | | | 11,820 | |
| | 97 | | | BankFinancial Corporation | | | 852 | |
| | 219 | | | BankUnited, Inc. | | | 7,617 | |
| | 75 | | | Bar Harbor Bankshares | | | 1,694 | |
| | 183 | | | Berkshire Hills Bancorp, Inc. | | | 3,133 | |
| | 339 | | | BOK Financial Corporation | | | 23,215 | |
| | 108 | | | Bridge Bancorp, Inc. | | | 2,611 | |
| | 904 | | | Cadence BanCorporation | | | 14,844 | |
| | 86 | | | Capstar Financial Holdings, Inc. | | | 1,268 | |
| | 52 | | | CBM Bancorp, Inc. | | | 691 | |
| | 147 | | | Central Pacific Financial Corporation | | | 2,794 | |
| | 348 | | | CIT Group, Inc. | | | 12,493 | |
| | 83 | | | Citizens Community Bancorp, Inc. | | | 904 | |
| | 114 | | | Civista Bancshares, Inc. | | | 1,998 | |
See accompanying notes to financial statements.
| ACCLIVITY SMALL CAP VALUE FUND |
| SCHEDULE OF INVESTMENTS (Continued) |
| December 31, 2020 |
| Shares | | | | | Value | |
| | | | | COMMON STOCKS — 99.1% (Continued) | | | | |
| | | | | BANKING - 21.0% (Continued) | | | | |
| | 18 | | | Codorus Valley Bancorp, Inc. | | $ | 305 | |
| | 10 | | | Community Financial Corporation (The) | | | 265 | |
| | 56 | | | County Bancorp, Inc. | | | 1,236 | |
| | 198 | | | Customers Bancorp, Inc.(a) | | | 3,600 | |
| | 135 | | | Dime Community Bancshares, Inc. | | | 2,129 | |
| | 138 | | | Eagle Bancorp, Inc. | | | 5,699 | |
| | 84 | | | ESSA Bancorp, Inc. | | | 1,260 | |
| | 31 | | | Financial Institutions, Inc. | | | 697 | |
| | 277 | | | First Bancorp | | | 9,371 | |
| | 379 | | | First Busey Corporation | | | 8,167 | |
| | 48 | | | First Business Financial Services, Inc. | | | 884 | |
| | 248 | | | First Commonwealth Financial Corporation | | | 2,713 | |
| | 378 | | | First Financial Bancorp | | | 6,626 | |
| | 114 | | | First Financial Corporation | | | 4,429 | |
| | 99 | | | First Financial Northwest, Inc. | | | 1,129 | |
| | 234 | | | First Hawaiian, Inc. | | | 5,518 | |
| | 2,026 | | | First Horizon Corporation | | | 25,852 | |
| | 459 | | | First Midwest Bancorp, Inc. | | | 7,307 | |
| | 90 | | | First Northwest Bancorp | | | 1,404 | |
| | 1,548 | | | FNB Corporation | | | 14,706 | |
| | 395 | | | Fulton Financial Corporation | | | 5,024 | |
| | 526 | | | Great Western Bancorp, Inc. | | | 10,993 | |
| | 428 | | | Hancock Whitney Corporation | | | 14,561 | |
| | 200 | | | Hanmi Financial Corporation | | | 2,268 | |
| | 218 | | | Heartland Financial USA, Inc. | | | 8,801 | |
| | 1,030 | | | Hilltop Holdings, Inc. | | | 28,335 | |
| | 20 | | | HomeStreet, Inc. | | | 675 | |
| | 102 | | | HomeTrust Bancshares, Inc. | | | 1,970 | |
| | 891 | | | Hope Bancorp, Inc. | | | 9,721 | |
| | 109 | | | Horizon Bancorp, Inc. | | | 1,729 | |
| | 147 | | | Howard Bancorp, Inc.(a) | | | 1,736 | |
| | 678 | | | Investors Bancorp, Inc. | | | 7,160 | |
| | 207 | | | Lakeland Bancorp, Inc. | | | 2,629 | |
| | 115 | | | LCNB Corporation | | | 1,689 | |
See accompanying notes to financial statements.
| ACCLIVITY SMALL CAP VALUE FUND |
| SCHEDULE OF INVESTMENTS (Continued) |
| December 31, 2020 |
| Shares | | | | | Value | |
| | | | | COMMON STOCKS — 99.1% (Continued) | | | | |
| | | | | BANKING - 21.0% (Continued) | | | | |
| | 79 | | | Mackinac Financial Corporation | | $ | 1,008 | |
| | 164 | | | Meridian Bancorp, Inc. | | | 2,445 | |
| | 100 | | | MidWestOne Financial Group, Inc. | | | 2,450 | |
| | 1,083 | | | New York Community Bancorp, Inc. | | | 11,426 | |
| | 232 | | | OceanFirst Financial Corporation | | | 4,322 | |
| | 1,096 | | | Old National Bancorp | | | 18,150 | |
| | 10 | | | Old Point Financial Corporation | | | 190 | |
| | 45 | | | OP Bancorp | | | 346 | |
| | 686 | | | PacWest Bancorp | | | 17,424 | |
| | 21 | | | Pathfinder Bancorp, Inc. | | | 241 | |
| | 135 | | | PCB Bancorp | | | 1,365 | |
| | 165 | | | Peoples Bancorp, Inc. | | | 4,470 | |
| | 245 | | | Pinnacle Financial Partners, Inc. | | | 15,778 | |
| | 45 | | | Premier Financial Bancorp, Inc. | | | 598 | |
| | 245 | | | Provident Financial Services, Inc. | | | 4,400 | |
| | 230 | | | Renasant Corporation | | | 7,746 | |
| | 137 | | | Riverview Financial Corporation | | | 1,254 | |
| | 12 | | | SB Financial Group, Inc. | | | 219 | |
| | 112 | | | Select Bancorp, Inc.(a) | | | 1,061 | |
| | 406 | | | Simmons First National Corporation, Class A | | | 8,766 | |
| | 120 | | | SmartFinancial, Inc. | | | 2,177 | |
| | 36 | | | South State Corporation | | | 2,603 | |
| | 237 | | | Southern National Bancorp of Virginia, Inc. | | | 2,870 | |
| | 456 | | | Sterling Bancorp | | | 8,199 | |
| | 1,302 | | | Synovus Financial Corporation | | | 42,146 | |
| | 530 | | | TCF Financial Corporation | | | 19,621 | |
| | 313 | | | Towne Bank | | | 7,349 | |
| | 1,294 | | | Umpqua Holdings Corporation | | | 19,591 | |
| | 53 | | | United Bancshares, Inc. | | | 1,296 | |
| | 362 | | | United Bankshares, Inc. | | | 11,729 | |
| | 134 | | | Univest Financial Corporation | | | 2,758 | |
| | 843 | | | Valley National Bancorp | | | 8,219 | |
| | 773 | | | Webster Financial Corporation | | | 32,582 | |
| | 142 | | | WesBanco, Inc. | | | 4,254 | |
See accompanying notes to financial statements.
| ACCLIVITY SMALL CAP VALUE FUND |
| SCHEDULE OF INVESTMENTS (Continued) |
| December 31, 2020 |
| Shares | | | | | Value | |
| | | | | COMMON STOCKS — 99.1% (Continued) | | | | |
| | | | | BANKING - 21.0% (Continued) | | | | |
| | 276 | | | Wintrust Financial Corporation | | $ | 16,861 | |
| | | | | | | | 595,110 | |
| | | | | BEVERAGES - 0.0%(b) | | | | |
| | 8 | | | Coffee Holding Company, Inc.(a) | | | 31 | |
| | | | | | | | | |
| | | | | BIOTECH & PHARMA - 2.6% | | | | |
| | 193 | | | Akebia Therapeutics, Inc.(a) | | | 540 | |
| | 21 | | | ANI Pharmaceuticals, Inc.(a) | | | 610 | |
| | 83 | | | Cumberland Pharmaceuticals, Inc.(a) | | | 244 | |
| | 41 | | | Eagle Pharmaceuticals, Inc.(a) | | | 1,909 | |
| | 169 | | | Emergent BioSolutions, Inc.(a) | | | 15,142 | |
| | 841 | | | Innoviva, Inc.(a) | | | 10,420 | |
| | 78 | | | Lannett Company, Inc.(a) | | | 509 | |
| | 81 | | | MacroGenics, Inc.(a) | | | 1,852 | |
| | 141 | | | Minerva Neurosciences, Inc.(a) | | | 330 | |
| | 180 | | | Prestige Consumer Healthcare, Inc.(a) | | | 6,277 | |
| | 376 | | | Sangamo Therapeutics, Inc.(a) | | | 5,867 | |
| | 112 | | | Travere Therapeutics, Inc.(a) | | | 3,053 | |
| | 174 | | | United Therapeutics Corporation(a) | | | 26,411 | |
| | 467 | | | Verastem, Inc.(a) | | | 995 | |
| | | | | | | | 74,159 | |
| | | | | CHEMICALS - 2.0% | | | | |
| | 126 | | | AdvanSix, Inc.(a) | | | 2,519 | |
| | 207 | | | American Vanguard Corporation | | | 3,213 | |
| | 385 | | | Element Solutions, Inc. | | | 6,826 | |
| | 34 | | | Hawkins, Inc. | | | 1,778 | |
| | 56 | | | Haynes International, Inc. | | | 1,335 | |
| | 700 | | | Huntsman Corporation | | | 17,598 | |
| | 164 | | | Kraton Corporation(a) | | | 4,557 | |
| | 141 | | | Minerals Technologies, Inc. | | | 8,759 | |
| | 28 | | | Oil-Dri Corp of America | | | 954 | |
| | 70 | | | PQ Group Holdings, Inc. | | | 998 | |
| | 102 | | | Trecora Resources(a) | | | 713 | |
See accompanying notes to financial statements.
| ACCLIVITY SMALL CAP VALUE FUND |
| SCHEDULE OF INVESTMENTS (Continued) |
| December 31, 2020 |
| Shares | | | | | Value | |
| | | | | COMMON STOCKS — 99.1% (Continued) | | | | |
| | | | | CHEMICALS - 2.0% (Continued) | | | | |
| | 457 | | | Univar Solutions, Inc.(a) | | $ | 8,688 | |
| | | | | | | | 57,938 | |
| | | | | COMMERCIAL SUPPORT SERVICES - 1.4% | | | | |
| | 56 | | | ABM Industries, Inc. | | | 2,119 | |
| | 28 | | | BrightView Holdings, Inc.(a) | | | 423 | |
| | 137 | | | Deluxe Corporation | | | 4,000 | |
| | 163 | | | Emerald Holding, Inc. | | | 884 | |
| | 156 | | | Ennis, Inc. | | | 2,785 | |
| | 90 | | | GP Strategies Corporation(a) | | | 1,067 | |
| | 77 | | | Heidrick & Struggles International, Inc. | | | 2,262 | |
| | 106 | | | Kelly Services, Inc., Class A | | | 2,180 | |
| | 18 | | | Korn Ferry | | | 783 | |
| | 131 | | | ManpowerGroup, Inc. | | | 11,814 | |
| | 110 | | | Quest Resource Holding Corporation(a) | | | 252 | |
| | 79 | | | Resources Connection, Inc. | | | 993 | |
| | 204 | | | Schnitzer Steel Industries, Inc., Class A | | | 6,510 | |
| | 72 | | | TrueBlue, Inc.(a) | | | 1,346 | |
| | 28 | | | Vectrus, Inc.(a) | | | 1,392 | |
| | | | | | | | 38,810 | |
| | | | | CONSTRUCTION MATERIALS - 0.2% | | | | |
| | 199 | | | Apogee Enterprises, Inc. | | | 6,304 | |
| | | | | | | | | |
| | | | | CONSUMER SERVICES - 0.7% | | | | |
| | 134 | | | Adtalem Global Education, Inc.(a) | | | 4,549 | |
| | 81 | | | American Public Education, Inc.(a) | | | 2,469 | |
| | 12 | | | Graham Holdings Company, Class B | | | 6,401 | |
| | 130 | | | Matthews International Corporation, Class A | | | 3,822 | |
| | 183 | | | Perdoceo Education Corporation(a) | | | 2,311 | |
| | | | | | | | 19,552 | |
| | | | | CONTAINERS & PACKAGING - 0.1% | | | | |
| | 121 | | | TriMas Corporation(a) | | | 3,832 | |
See accompanying notes to financial statements.
| ACCLIVITY SMALL CAP VALUE FUND |
| SCHEDULE OF INVESTMENTS (Continued) |
| December 31, 2020 |
| Shares | | | | | Value | |
| | | | | COMMON STOCKS — 99.1% (Continued) | | | | |
| | | | | E-COMMERCE DISCRETIONARY - 0.1% | | | | |
| | 137 | | | Lands’ End, Inc.(a) | | $ | 2,955 | |
| | | | | | | | | |
| | | | | ELECTRICAL EQUIPMENT - 0.6% | | | | |
| | 61 | | | Bel Fuse, Inc., Class B | | | 917 | |
| | 97 | | | Belden, Inc. | | | 4,064 | |
| | 174 | | | Houston Wire & Cable Company (a) | | | 485 | |
| | 228 | | | Kimball Electronics, Inc.(a) | | | 3,646 | |
| | 243 | | | LSI Industries, Inc. | | | 2,080 | |
| | 48 | | | Powell Industries, Inc. | | | 1,416 | |
| | 48 | | | Preformed Line Products Company | | | 3,285 | |
| | | | | | | | 15,893 | |
| | | | | ENGINEERING & CONSTRUCTION - 2.3% | | | | |
| | 190 | | | Aegion Corporation(a) | | | 3,608 | |
| | 106 | | | Dycom Industries, Inc.(a) | | | 8,005 | |
| | 137 | | | EMCOR Group, Inc. | | | 12,530 | |
| | 371 | | | Fluor Corporation | | | 5,925 | |
| | 162 | | | Granite Construction, Inc. | | | 4,327 | |
| | 70 | | | Limbach Holdings, Inc.(a) | | | 863 | |
| | 183 | | | MasTec, Inc.(a) | | | 12,477 | |
| | 192 | | | Mistras Group, Inc.(a) | | | 1,490 | |
| | 160 | | | MYR Group, Inc.(a) | | | 9,616 | |
| | 185 | | | Orion Group Holdings, Inc.(a) | | | 918 | |
| | 50 | | | Primoris Services Corporation | | | 1,380 | |
| | 248 | | | Sterling Construction Company, Inc.(a) | | | 4,615 | |
| | 20 | | | VSE Corporation | | | 770 | |
| | | | | | | | 66,524 | |
| | | | | ENTERTAINMENT CONTENT - 0.1% | | | | |
| | 100 | | | AMC Networks, Inc., Class A(a) | | | 3,577 | |
| | | | | | | | | |
| | | | | FOOD - 1.0% | | | | |
| | 75 | | | Alico, Inc. | | | 2,327 | |
| | 512 | | | B&G Foods, Inc. | | | 14,198 | |
| | 276 | | | Hostess Brands, Inc.(a) | | | 4,041 | |
| | 111 | | | Nature’s Sunshine Products, Inc.(a) | | | 1,659 | |
See accompanying notes to financial statements.
| ACCLIVITY SMALL CAP VALUE FUND |
| SCHEDULE OF INVESTMENTS (Continued) |
| December 31, 2020 |
| Shares | | | | | Value | |
| | | | | COMMON STOCKS — 99.1% (Continued) | | | | |
| | | | | FOOD - 1.0% (Continued) | | | | |
| | 380 | | | S&W Seed Company(a) | | $ | 1,113 | |
| | 24 | | | Sanderson Farms, Inc. | | | 3,173 | |
| | 45 | | | Tootsie Roll Industries, Inc. | | | 1,336 | |
| | 19 | | | TreeHouse Foods, Inc.(a) | | | 807 | |
| | | | | | | | 28,654 | |
| | | | | FORESTRY, PAPER & WOOD PRODUCTS - 0.5% | | | | |
| | 165 | | | Domtar Corporation | | | 5,222 | |
| | 119 | | | Glatfelter Corporation | | | 1,949 | |
| | 70 | | | Mercer International, Inc. | | | 718 | |
| | 29 | | | Neenah, Inc. | | | 1,604 | |
| | 90 | | | Schweitzer-Mauduit International, Inc. | | | 3,619 | |
| | 114 | | | Verso Corporation, Class A | | | 1,370 | |
| | | | | | | | 14,482 | |
| | | | | HEALTH CARE FACILITIES & SERVICES - 1.8% | | | | |
| | 741 | | | MEDNAX, Inc.(a) | | | 18,184 | |
| | 1,630 | | | OPKO Health, Inc.(a) | | | 6,438 | |
| | 16 | | | Owens & Minor, Inc. | | | 433 | |
| | 513 | | | Patterson Companies, Inc. | | | 15,200 | |
| | 18 | | | Psychemedics Corporation | | | 92 | |
| | 380 | | | Select Medical Holdings Corporation(a) | | | 10,511 | |
| | | | | | | | 50,858 | |
| | | | | HOME & OFFICE PRODUCTS - 0.5% | | | | |
| | 240 | | | ACCO Brands Corporation | | | 2,028 | |
| | 90 | | | Hooker Furniture Corporation | | | 2,902 | |
| | 4 | | | Kewaunee Scientific Corporation(a) | | | 50 | |
| | 364 | | | Knoll, Inc. | | | 5,344 | |
| | 276 | | | Steelcase, Inc., Class A | | | 3,740 | |
| | | | | | | | 14,064 | |
| | | | | HOME CONSTRUCTION - 2.1% | | | | |
| | 41 | | | American Woodmark Corporation(a) | | | 3,848 | |
| | 256 | | | Beazer Homes USA, Inc.(a) | | | 3,878 | |
| | 80 | | | Century Communities, Inc.(a) | | | 3,502 | |
| | 198 | | | Green Brick Partners, Inc.(a) | | | 4,546 | |
| | 9 | | | Griffon Corporation | | | 184 | |
See accompanying notes to financial statements.
| ACCLIVITY SMALL CAP VALUE FUND |
| SCHEDULE OF INVESTMENTS (Continued) |
| December 31, 2020 |
| Shares | | | | | Value | |
| | | | | COMMON STOCKS — 99.1% (Continued) | | | | |
| | | | | HOME CONSTRUCTION - 2.1% (Continued) | | | | |
| | 160 | | | Interface, Inc. | | $ | 1,680 | |
| | 143 | | | KB Home | | | 4,793 | |
| | 91 | | | LGI Homes, Inc.(a) | | | 9,632 | |
| | 88 | | | M/I Homes, Inc.(a) | | | 3,898 | |
| | 89 | | | MDC Holdings, Inc. | | | 4,325 | |
| | 96 | | | Meritage Homes Corporation(a) | | | 7,951 | |
| | 142 | | | Toll Brothers, Inc. | | | 6,173 | |
| | 351 | | | TRI Pointe Group, Inc.(a) | | | 6,055 | |
| | | | | | | | 60,465 | |
| | | | | HOUSEHOLD PRODUCTS - 1.5% | | | | |
| | 304 | | | Central Garden & Pet Company, Class A(a) | | | 11,044 | |
| | 84 | | | Clearwater Paper Corporation(a) | | | 3,171 | |
| | 195 | | | Crown Crafts, Inc. | | | 1,394 | |
| | 337 | | | Edgewell Personal Care Company | | | 11,654 | |
| | 138 | | | Quanex Building Products Corporation | | | 3,060 | |
| | 144 | | | Spectrum Brands Holdings, Inc. | | | 11,373 | |
| | | | | | | | 41,696 | |
| | | | | INDUSTRIAL INTERMEDIATE PRODUCTS - 1.4% | | | | |
| | 124 | | | Ampco-Pittsburgh Corporation(a) | | | 679 | |
| | 136 | | | AZZ, Inc. | | | 6,452 | |
| | 26 | | | Eastern Company (The) | | | 627 | |
| | 102 | | | L B Foster Company, Class A(a) | | | 1,535 | |
| | 122 | | | Park-Ohio Holdings Corporation | | | 3,770 | |
| | 322 | | | Timken Company (The) | | | 24,910 | |
| | 70 | | | Tredegar Corporation | | | 1,169 | |
| | | | | | | | 39,142 | |
| | | | | INDUSTRIAL SUPPORT SERVICES - 1.1% | | | | |
| | 151 | | | CAI International, Inc. | | | 4,717 | |
| | 95 | | | DXP Enterprises, Inc.(a) | | | 2,112 | |
| | 299 | | | Herc Holdings, Inc.(a) | | | 19,857 | |
| | 54 | | | WESCO International, Inc.(a) | | | 4,239 | |
| | | | | | | | 30,925 | |
| | | | | INSTITUTIONAL FINANCIAL SERVICES - 1.5% | | | | |
| | 322 | | | Cowen, Inc., Class A | | | 8,369 | |
See accompanying notes to financial statements.
| ACCLIVITY SMALL CAP VALUE FUND |
| SCHEDULE OF INVESTMENTS (Continued) |
| December 31, 2020 |
| Shares | | | | | Value | |
| | | | | COMMON STOCKS — 99.1% (Continued) | | | | |
| | | | | INSTITUTIONAL FINANCIAL SERVICES - 1.5% (Continued) | | | | |
| | 1,363 | | | Jefferies Financial Group, Inc. | | $ | 33,530 | |
| | | | | | | | 41,899 | |
| | | | | INSURANCE - 6.5% | | | | |
| | 187 | | | Ambac Financial Group, Inc.(a) | | | 2,876 | |
| | 360 | | | American Equity Investment Life Holding Company | | | 9,958 | |
| | 159 | | | American National Group, Inc. | | | 15,283 | |
| | 513 | | | Brighthouse Financial, Inc.(a) | | | 18,573 | |
| | 844 | | | CNO Financial Group, Inc. | | | 18,762 | |
| | 40 | | | Employers Holdings, Inc. | | | 1,288 | |
| | 90 | | | FBL Financial Group, Inc., Class A | | | 4,726 | |
| | 179 | | | FedNat Holding Company | | | 1,060 | |
| | 3,604 | | | Genworth Financial, Inc., Class A(a) | | | 13,623 | |
| | 490 | | | Heritage Insurance Holdings, Inc. | | | 4,964 | |
| | 13 | | | Horace Mann Educators Corporation | | | 546 | |
| | 36 | | | National General Holdings Corporation | | | 1,230 | |
| | 40 | | | National Western Life Group, Inc., Class A | | | 8,258 | |
| | 385 | | | ProAssurance Corporation | | | 6,849 | |
| | 135 | | | Protective Insurance Corporation, Class B | | | 1,851 | |
| | 1,621 | | | Radian Group, Inc. | | | 32,825 | |
| | 103 | | | Security National Financial Corporation, Class A(a) | | | 860 | |
| | 150 | | | United Fire Group, Inc. | | | 3,765 | |
| | 418 | | | United Insurance Holdings Corporation | | | 2,391 | |
| | 1,307 | | | Unum Group | | | 29,982 | |
| | 4 | | | White Mountains Insurance Group Ltd. | | | 4,003 | |
| | | | | | | | 183,673 | |
| | | | | INTERNET MEDIA & SERVICES - 0.2% | | | | |
| | 241 | | | Cars.com, Inc.(a) | | | 2,723 | |
| | 1,146 | | | DHI Group, Inc.(a) | | | 2,544 | |
| | 328 | | | TrueCar, Inc.(a) | | | 1,378 | |
| | | | | | | | 6,645 | |
| | | | | LEISURE FACILITIES & SERVICES - 1.3% | | | | |
| | 15 | | | Ark Restaurants Corporation | | | 291 | |
| | 37 | | | Biglari Holdings, Inc.(a) | | | 4,114 | |
| | 397 | | | Carrols Restaurant Group, Inc.(a) | | | 2,493 | |
See accompanying notes to financial statements.
| ACCLIVITY SMALL CAP VALUE FUND |
| SCHEDULE OF INVESTMENTS (Continued) |
| December 31, 2020 |
| Shares | | | | | Value | |
| | | | | COMMON STOCKS — 99.1% (Continued) | | | | |
| | | | | LEISURE FACILITIES & SERVICES - 1.3% (Continued) | | | | |
| | 124 | | | Chuy’s Holdings, Inc.(a) | | $ | 3,285 | |
| | 441 | | | El Pollo Loco Holdings, Inc.(a) | | | 7,982 | |
| | 172 | | | Fiesta Restaurant Group, Inc.(a) | | | 1,961 | |
| | 108 | | | Full House Resorts, Inc.(a) | | | 424 | |
| | 39 | | | Golden Entertainment, Inc.(a) | | | 776 | |
| | 108 | | | J Alexander’s Holdings, Inc.(a) | | | 787 | |
| | 331 | | | Marcus Corporation (The) | | | 4,462 | |
| | 42 | | | Potbelly Corporation(a) | | | 185 | |
| | 104 | | | RCI Hospitality Holdings, Inc. | | | 4,102 | |
| | 266 | | | Red Robin Gourmet Burgers, Inc.(a) | | | 5,115 | |
| | | | | | | | 35,977 | |
| | | | | LEISURE PRODUCTS - 0.9% | | | | |
| | 63 | | | American Outdoor Brands, Inc.(a) | | | 1,073 | |
| | 118 | | | Escalade, Inc. | | | 2,498 | |
| | 252 | | | Smith & Wesson Brands, Inc. | | | 4,473 | |
| | 157 | | | Thor Industries, Inc. | | | 14,599 | |
| | 130 | | | Vista Outdoor, Inc.(a) | | | 3,089 | |
| | | | | | | | 25,732 | |
| | | | | MACHINERY - 4.2% | | | | |
| | 201 | | | AGCO Corporation | | | 20,721 | |
| | 639 | | | Altra Industrial Motion Corporation | | | 35,420 | |
| | 303 | | | CECO Environmental Corporation(a) | | | 2,109 | |
| | 1 | | | CIRCOR International, Inc. (a) | | | 38 | |
| | 233 | | | Colfax Corporation(a) | | | 8,910 | |
| | 91 | | | Columbus McKinnon Corporation | | | 3,498 | |
| | 117 | | | Gencor Industries, Inc.(a) | | | 1,439 | |
| | 314 | | | Hillenbrand, Inc. | | | 12,497 | |
| | 46 | | | Hurco Companies, Inc. | | | 1,380 | |
| | 36 | | | Hyster-Yale Materials Handling, Inc., Class A | | | 2,144 | |
| | 126 | | | Intevac, Inc.(a) | | | 909 | |
| | 177 | | | Kennametal, Inc. | | | 6,415 | |
| | 67 | | | LS Starrett Company (The), Class A(a) | | | 283 | |
| | 170 | | | Manitowoc Company, Inc. (The)(a) | | | 2,263 | |
| | 1,072 | | | NN, Inc. (a) | | | 7,043 | |
See accompanying notes to financial statements.
| ACCLIVITY SMALL CAP VALUE FUND |
| SCHEDULE OF INVESTMENTS (Continued) |
| December 31, 2020 |
| Shares | | | | | Value | |
| | | | | COMMON STOCKS — 99.1% (Continued) | | | | |
| | | | | MACHINERY - 4.2% (Continued) | | | | |
| | 73 | | | Regal Beloit Corporation | | $ | 8,965 | |
| | 14 | | | SPX FLOW, Inc.(a) | | | 811 | |
| | 119 | | | Terex Corporation | | | 4,152 | |
| | | | | | | | 118,997 | |
| | | | | MEDICAL EQUIPMENT & DEVICES - 0.6% | | | | |
| | 720 | | | Accuray, Inc.(a) | | | 3,002 | |
| | 155 | | | AngioDynamics, Inc.(a) | | | 2,376 | |
| | 96 | | | Avanos Medical, Inc.(a) | | | 4,405 | |
| | 20 | | | CryoLife, Inc. (a) | | | 472 | |
| | 300 | | | Harvard Bioscience, Inc.(a) | | | 1,287 | |
| | 17 | | | Luminex Corporation | | | 393 | |
| | 41 | | | Natus Medical, Inc.(a) | | | 822 | |
| | 146 | | | OraSure Technologies, Inc.(a) | | | 1,545 | |
| | 9 | | | Utah Medical Products, Inc. | | | 759 | |
| | 45 | | | Varex Imaging Corporation(a) | | | 751 | |
| | | | | | | | 15,812 | |
| | | | | METALS & MINING - 0.9% | | | | |
| | 445 | | | Alcoa Corporation(a) | | | 10,257 | |
| | 52 | | | Encore Wire Corporation | | | 3,150 | |
| | 812 | | | Hecla Mining Company | | | 5,262 | |
| | 657 | | | SunCoke Energy, Inc. | | | 2,858 | |
| | 235 | | | Warrior Met Coal, Inc. | | | 5,010 | |
| | | | | | | | 26,537 | |
| | | | | OIL & GAS PRODUCERS - 2.6% | | | | |
| | 144 | | | Bonanza Creek Energy, Inc.(a) | | | 2,784 | |
| | 815 | | | Earthstone Energy, Inc., Class A(a) | | | 4,344 | |
| | 1,284 | | | EQT Corporation | | | 16,320 | |
| | 958 | | | Equitrans Midstream Corporation | | | 7,702 | |
| | 556 | | | HollyFrontier Corporation | | | 14,373 | |
| | 120 | | | Matador Resources Company(a) | | | 1,447 | |
| | 442 | | | PBF Energy, Inc., Class A | | | 3,138 | |
| | 233 | | | PDC Energy, Inc.(a) | | | 4,783 | |
| | 22 | | | Plains GP Holdings, L.P., Class A | | | 186 | |
| | 4,666 | | | Southwestern Energy Company(a) | | | 13,905 | |
See accompanying notes to financial statements.
| ACCLIVITY SMALL CAP VALUE FUND |
| SCHEDULE OF INVESTMENTS (Continued) |
| December 31, 2020 |
| Shares | | | | | Value | |
| | | | | COMMON STOCKS — 99.1% (Continued) | | | | |
| | | | | OIL & GAS PRODUCERS - 2.6% (Continued) | | | | |
| | 173 | | | World Fuel Services Corporation | | $ | 5,391 | |
| | | | | | | | 74,373 | |
| | | | | OIL & GAS SERVICES & EQUIPMENT - 0.2% | | | | |
| | 215 | | | Helmerich & Payne, Inc. | | | 4,979 | |
| | 175 | | | Natural Gas Services Group, Inc.(a) | | | 1,659 | |
| | | | | | | | 6,638 | |
| | | | | PUBLISHING & BROADCASTING - 2.1% | | | | |
| | 199 | | | Beasley Broadcast Group, Inc., Class A | | | 297 | |
| | 60 | | | Cumulus Media, Inc., Class A(a) | | | 523 | |
| | 130 | | | Emmis Communications Corporation(a) | | | 237 | |
| | 1,606 | | | Entravision Communications Corporation, Class A | | | 4,416 | |
| | 853 | | | EW Scripps Company (The), Class A | | | 13,042 | |
| | 476 | | | Gray Television, Inc.(a) | | | 8,516 | |
| | 81 | | | Houghton Mifflin Harcourt Company(a) | | | 270 | |
| | 476 | | | Meredith Corporation | | | 9,139 | |
| | 70 | | | Saga Communications, Inc., Class A | | | 1,681 | |
| | 212 | | | Scholastic Corporation | | | 5,300 | |
| | 624 | | | TEGNA, Inc. | | | 8,705 | |
| | 445 | | | Townsquare Media, Inc., Class A | | | 2,964 | |
| | 193 | | | Tribune Publishing Company | | | 2,644 | |
| | 360 | | | Urban One, Inc.(a) | | | 421 | |
| | | | | | | | 58,155 | |
| | | | | REAL ESTATE OWNERS & DEVELOPERS - 0.1% | | | | |
| | 24 | | | FRP Holdings, Inc.(a) | | | 1,093 | |
| | 14 | | | Stratus Properties, Inc.(a) | | | 357 | |
| | | | | | | | 1,450 | |
| | | | | REAL ESTATE SERVICES - 0.4% | | | | |
| | 59 | | | RE/MAX Holdings, Inc., Class A | | | 2,143 | |
| | 738 | | | Realogy Holdings Corporation(a) | | | 9,683 | |
| | | | | | | | 11,826 | |
| | | | | RENEWABLE ENERGY - 1.0% | | | | |
| | 266 | | | FutureFuel Corporation | | | 3,378 | |
| | 141 | | | Green Plains, Inc. (a) | | | 1,857 | |
| | 314 | | | Renewable Energy Group, Inc.(a) | | | 22,238 | |
See accompanying notes to financial statements.
| ACCLIVITY SMALL CAP VALUE FUND |
| SCHEDULE OF INVESTMENTS (Continued) |
| December 31, 2020 |
| Shares | | | | | Value | |
| | | | | COMMON STOCKS — 99.1% (Continued) | | | | |
| | | | | RENEWABLE ENERGY - 1.0% (Continued) | | | | |
| | 100 | | | Ultralife Corporation(a) | | $ | 647 | |
| | | | | | | | 28,120 | |
| | | | | RETAIL - CONSUMER STAPLES - 1.0% | | | | |
| | 221 | | | Big Lots, Inc. | | | 9,488 | |
| | 135 | | | Ingles Markets, Inc., Class A | | | 5,759 | |
| | 147 | | | Rite Aid Corporation(a) | | | 2,327 | |
| | 179 | | | SpartanNash Company | | | 3,116 | |
| | 60 | | | Village Super Market, Inc., Class A | | | 1,324 | |
| | 140 | | | Weis Markets, Inc. | | | 6,693 | |
| | | | | | | | 28,707 | |
| | | | | RETAIL - DISCRETIONARY - 8.9% | | | | |
| | 18 | | | Aaron’s Company, Inc. (The)(a) | | | 341 | |
| | 226 | | | Abercrombie & Fitch Company, Class A | | | 4,601 | |
| | 50 | | | American Eagle Outfitters, Inc. | | | 1,004 | |
| | 20 | | | America’s Car-Mart, Inc.(a) | | | 2,197 | |
| | 292 | | | AutoNation, Inc.(a) | | | 20,379 | |
| | 256 | | | Beacon Roofing Supply, Inc.(a) | | | 10,289 | |
| | 476 | | | Bed Bath & Beyond, Inc. | | | 8,454 | |
| | 199 | | | Big 5 Sporting Goods Corporation | | | 2,032 | |
| | 88 | | | Children’s Place, Inc. (The) | | | 4,409 | |
| | 333 | | | Conn’s, Inc.(a) | | | 3,893 | |
| | 312 | | | Container Store Group, Inc. (The)(a) | | | 2,976 | |
| | 20 | | | Designer Brands, Inc., Class A | | | 153 | |
| | 386 | | | Dick’s Sporting Goods, Inc. | | | 21,697 | |
| | 102 | | | Ethan Allen Interiors, Inc. | | | 2,061 | |
| | 224 | | | Foot Locker, Inc. | | | 9,059 | |
| | 259 | | | Foundation Building Materials, Inc.(a) | | | 4,975 | |
| | 151 | | | GMS, Inc.(a) | | | 4,602 | |
| | 271 | | | Group 1 Automotive, Inc. | | | 35,539 | |
| | 173 | | | Guess?, Inc. | | | 3,913 | |
| | 57 | | | Haverty Furniture Companies, Inc. | | | 1,577 | |
| | 19 | | | Hertz Global Holdings, Inc.(a) | | | 24 | |
| | 38 | | | Hibbett Sports, Inc.(a) | | | 1,755 | |
| | 750 | | | Kohl’s Corporation | | | 30,518 | |
See accompanying notes to financial statements.
| ACCLIVITY SMALL CAP VALUE FUND |
| SCHEDULE OF INVESTMENTS (Continued) |
| December 31, 2020 |
| Shares | | | | | Value | |
| | | | | COMMON STOCKS — 99.1% (Continued) | | | | |
| | | | | RETAIL - DISCRETIONARY - 8.9% (Continued) | | | | |
| | 103 | | | La-Z-Boy, Inc. | | $ | 4,104 | |
| | 170 | | | Penske Automotive Group, Inc. | | | 10,096 | |
| | 2,853 | | | Qurate Retail, Inc. - Series A | | | 31,297 | |
| | 432 | | | Rush Enterprises, Inc., Class A | | | 17,893 | |
| | 63 | | | Sonic Automotive, Inc., Class A | | | 2,430 | |
| | 111 | | | Tilly’s, Inc., Class A | | | 906 | |
| | 276 | | | Urban Outfitters, Inc.(a) | | | 7,066 | |
| | 265 | | | Vera Bradley, Inc.(a) | | | 2,109 | |
| | 5 | | | Zumiez, Inc.(a) | | | 184 | |
| | | | | | | | 252,533 | |
| | | | | SEMICONDUCTORS - 1.5% | | | | |
| | 1,075 | | | Amkor Technology, Inc. | | | 16,211 | |
| | 127 | | | Amtech Systems, Inc.(a) | | | 810 | |
| | 16 | | | Data I/O Corporation(a) | | | 66 | |
| | 488 | | | Photronics, Inc.(a) | | | 5,446 | |
| | 12 | | | Rambus, Inc.(a) | | | 210 | |
| | 183 | | | Ultra Clean Holdings, Inc.(a) | | | 5,700 | |
| | 547 | | | Veeco Instruments, Inc.(a) | | | 9,496 | |
| | 260 | | | Vishay Intertechnology, Inc. | | | 5,385 | |
| | | | | | | | 43,324 | |
| | | | | SOFTWARE - 2.0% | | | | |
| | 944 | | | Allscripts Healthcare Solutions, Inc.(a) | | | 13,631 | |
| | 214 | | | Avaya Holdings Corporation(a) | | | 4,098 | |
| | 205 | | | ChannelAdvisor Corporation(a) | | | 3,276 | |
| | 110 | | | Computer Programs and Systems, Inc. | | | 2,952 | |
| | 273 | | | Donnelley Financial Solutions, Inc.(a) | | | 4,633 | |
| | 90 | | | Ebix, Inc. | | | 3,417 | |
| | 149 | | | NextGen Healthcare, Inc.(a) | | | 2,718 | |
| | 181 | | | SeaChange International, Inc.(a) | | | 253 | |
| | 288 | | | Support.com, Inc. (a) | | | 634 | |
| | 71 | | | Verint Systems, Inc.(a) | | | 4,770 | |
| | 771 | | | Xperi Holding Corporation | | | 16,114 | |
| | | | | | | | 56,496 | |
See accompanying notes to financial statements.
| ACCLIVITY SMALL CAP VALUE FUND |
| SCHEDULE OF INVESTMENTS (Continued) |
| December 31, 2020 |
| Shares | | | | | Value | |
| | | | | COMMON STOCKS — 99.1% (Continued) | | | | |
| | | | | SPECIALTY FINANCE - 4.2% | | | | |
| | 178 | | | Alliance Data Systems Corporation | | $ | 13,190 | |
| | 20 | | | Consumer Portfolio Services, Inc.(a) | | | 85 | |
| | 221 | | | Encore Capital Group, Inc.(a) | | | 8,608 | |
| | 561 | | | EZCORP, Inc., Class A(a) | | | 2,687 | |
| | 110 | | | GATX Corporation | | | 9,150 | |
| | 190 | | | General Finance Corporation(a) | | | 1,617 | |
| | 4 | | | Investors Title Company | | | 612 | |
| | 27 | | | Marlin Business Services Corporation | | | 330 | |
| | 1,351 | | | MGIC Investment Corporation | | | 16,955 | |
| | 98 | | | Nelnet, Inc., Class A | | | 6,981 | |
| | 57 | | | Nicholas Financial, Inc.(a) | | | 478 | |
| | 1,081 | | | OneMain Holdings, Inc. | | | 52,061 | |
| | 37 | | | PROG Holdings, Inc. | | | 1,993 | |
| | 81 | | | Regional Management Corporation | | | 2,419 | |
| | 49 | | | Willis Lease Finance Corporation(a) | | | 1,493 | |
| | | | | | | | 118,659 | |
| | | | | STEEL - 1.7% | | | | |
| | 168 | | | Carpenter Technology Corporation | | | 4,892 | |
| | 960 | | | Commercial Metals Company | | | 19,718 | |
| | 86 | | | Friedman Industries, Inc. | | | 590 | |
| | 158 | | | Northwest Pipe Company(a) | | | 4,472 | |
| | 258 | | | Olympic Steel, Inc. | | | 3,439 | |
| | 922 | | | United States Steel Corporation | | | 15,462 | |
| | | | | | | | 48,573 | |
| | | | | TECHNOLOGY HARDWARE - 5.9% | | | | |
| | 239 | | | ADTRAN, Inc. | | | 3,530 | |
| | 100 | | | Applied Optoelectronics, Inc.(a) | | | 851 | |
| | 2 | | | AstroNova, Inc. | | | 21 | |
| | 82 | | | Aviat Networks, Inc.(a) | | | 2,800 | |
| | 242 | | | Avnet, Inc. | | | 8,497 | |
| | 200 | | | Aware, Inc.(a) | | | 700 | |
| | 88 | | | Benchmark Electronics, Inc. | | | 2,377 | |
| | 940 | | | CommScope Holding Company, Inc.(a) | | | 12,596 | |
| | 196 | | | Communications Systems, Inc. | | | 896 | |
See accompanying notes to financial statements.
| ACCLIVITY SMALL CAP VALUE FUND |
| SCHEDULE OF INVESTMENTS (Continued) |
| December 31, 2020 |
| Shares | | | | | Value | |
| | | | | COMMON STOCKS — 99.1% (Continued) | | | | |
| | | | | TECHNOLOGY HARDWARE - 5.9% (Continued) | | | | |
| | 896 | | | Daktronics, Inc. | | $ | 4,193 | |
| | 104 | | | InterDigital, Inc. | | | 6,311 | |
| | 492 | | | Jabil, Inc. | | | 20,925 | |
| | 56 | | | Key Tronic Corporation(a) | | | 386 | |
| | 207 | | | Knowles Corporation(a) | | | 3,815 | |
| | 265 | | | Maxar Technologies, Inc. | | | 10,226 | |
| | 677 | | | NCR Corporation(a) | | | 25,435 | |
| | 314 | | | NETGEAR, Inc.(a) | | | 12,758 | |
| | 762 | | | NetScout Systems, Inc.(a) | | | 20,894 | |
| | 63 | | | PCTEL, Inc. | | | 414 | |
| | 477 | | | Pitney Bowes, Inc. | | | 2,938 | |
| | 252 | | | Sanmina Corporation(a) | | | 8,036 | |
| | 229 | | | TTM Technologies, Inc.(a) | | | 3,159 | |
| | 5 | | | Vishay Precision Group, Inc.(a) | | | 158 | |
| | 574 | | | Xerox Holdings Corporation | | | 13,311 | |
| | 443 | | | ZAGG, Inc.(a) | | | 1,847 | |
| | | | | | | | 167,074 | |
| | | | | TECHNOLOGY SERVICES - 1.4% | | | | |
| | 793 | | | DXC Technology Company | | | 20,420 | |
| | 101 | | | Insight Enterprises, Inc.(a) | | | 7,685 | |
| | 54 | | | ManTech International Corporation, Class A | | | 4,803 | |
| | 91 | | | NetSol Technologies, Inc.(a) | | | 346 | |
| | 132 | | | Sykes Enterprises, Inc.(a) | | | 4,972 | |
| | | | | | | | 38,226 | |
| | | | | TELECOMMUNICATIONS - 1.1% | | | | |
| | 1,499 | | | Alaska Communications Systems Group, Inc. | | | 5,531 | |
| | 353 | | | EchoStar Corporation, Class A(a) | | | 7,480 | |
| | 563 | | | ORBCOMM, Inc.(a) | | | 4,178 | |
| | 109 | | | Spok Holdings, Inc. | | | 1,213 | |
| | 683 | | | Telephone and Data Systems, Inc. | | | 12,683 | |
| | | | | | | | 31,085 | |
| | | | | TOBACCO & CANNABIS - 0.3% | | | | |
| | 155 | | | Universal Corporation | | | 7,535 | |
See accompanying notes to financial statements.
| ACCLIVITY SMALL CAP VALUE FUND |
| SCHEDULE OF INVESTMENTS (Continued) |
| December 31, 2020 |
| Shares | | | | | Value | |
| | | | | COMMON STOCKS — 99.1% (Continued) | | | | |
| | | | | TRANSPORTATION & LOGISTICS - 1.8% | | | | |
| | 144 | | | Alaska Air Group, Inc. | | $ | 7,488 | |
| | 308 | | | Atlas Air Worldwide Holdings, Inc.(a) | | | 16,798 | |
| | 9 | | | Echo Global Logistics, Inc.(a) | | | 241 | |
| | 152 | | | Hawaiian Holdings, Inc. | | | 2,690 | |
| | 32 | | | Hub Group, Inc., Class A(a) | | | 1,824 | |
| | 128 | | | Kirby Corporation(a) | | | 6,634 | |
| | 20 | | | Macquarie Infrastructure Corporation | | | 751 | |
| | 29 | | | Patriot Transportation Holding, Inc. | | | 255 | |
| | 113 | | | Ryder System, Inc. | | | 6,979 | |
| | 59 | | | Schneider National, Inc., Class B | | | 1,221 | |
| | 66 | | | SEACOR Holdings, Inc.(a) | | | 2,736 | |
| | 111 | | | SkyWest, Inc. | | | 4,475 | |
| | | | | | | | 52,092 | |
| | | | | TRANSPORTATION EQUIPMENT - 0.5% | | | | |
| | 216 | | | Greenbrier Companies, Inc. (The) | | | 7,858 | |
| | 181 | | | REV Group, Inc. | | | 1,595 | |
| | 195 | | | Trinity Industries, Inc. | | | 5,146 | |
| | 45 | | | Wabash National Corporation | | | 775 | |
| | | | | | | | 15,374 | |
| | | | | WHOLESALE - CONSUMER STAPLES - 0.5% | | | | |
| | 234 | | | Core-Mark Holding Company, Inc. | | | 6,873 | |
| | 520 | | | United Natural Foods, Inc.(a) | | | 8,304 | |
| | | | | | | | 15,177 | |
| | | | | WHOLESALE - DISCRETIONARY - 1.0% | | | | |
| | 36 | | | Educational Development Corporation | | | 553 | |
| | 39 | | | ePlus, Inc.(a) | | | 3,430 | |
| | 431 | | | G-III Apparel Group Ltd.(a) | | | 10,232 | |
| | 199 | | | KAR Auction Services, Inc. | | | 3,703 | |
| | 106 | | | PC Connection, Inc. | | | 5,013 | |
| | 232 | | | ScanSource, Inc.(a) | | | 6,120 | |
| | 7 | | | Wayside Technology Group, Inc. | | | 134 | |
| | | | | | | | 29,185 | |
See accompanying notes to financial statements.
| ACCLIVITY SMALL CAP VALUE FUND |
| SCHEDULE OF INVESTMENTS (Continued) |
| December 31, 2020 |
| Shares | | | | | Value | |
| | | | | COMMON STOCKS — 99.1% (Continued) | | | | |
| | | | | | | | | |
| | | | | TOTAL COMMON STOCKS (Cost $2,165,800) | | $ | 2,810,413 | |
| | | | | | | | | |
| | | | | PARTNERSHIP SHARES — 0.7% | | | | |
| | | | | METALS & MINING - 0.1% | | | | |
| | 774 | | | Alliance Resource Partners, L.P. | | | 3,466 | |
| | | | | | | | | |
| | | | | OIL & GAS PRODUCERS - 0.5% | | | | |
| | 188 | | | NGL Energy Partners, L.P. | | | 451 | |
| | 1,426 | | | Plains All American Pipeline, L.P. | | | 11,751 | |
| | | | | | | | 12,202 | |
| | | | | REIT - 0.1% | | | | |
| | 190 | | | Landmark Infrastructure Partners, L.P. | | | 2,037 | |
| | | | | | | | | |
| | | | | SPECIALTY FINANCE - 0.0% (b) | | | | |
| | 224 | | | America First Multifamily Investors, L.P. | | | 952 | |
| | | | | | | | | |
| | | | | TOTAL PARTNERSHIP SHARES (Cost $17,324) | | | 18,657 | |
| | | | | | | | | |
| | | | | REIT — 0.1% | | | | |
| | | | | MORTGAGE FINANCE - 0.1% | | | | |
| | 214 | | | Ellington Financial, Inc. | | | 3,176 | |
| | | | | | | | | |
| | | | | TOTAL REIT (Cost $3,260) | | | 3,176 | |
| | | | | | | | | |
| | | | | MONEY MARKET FUND - 0.7% | | | | |
| | 19,076 | | | BlackRock Liquidity Funds T-Fund, Institutional Class, 0.01%(c) | | | 19,076 | |
| | | | | | | | | |
| | | | | TOTAL MONEY MARKET FUND (Cost $19,076) | | | 19,076 | |
See accompanying notes to financial statements.
| ACCLIVITY SMALL CAP VALUE FUND |
| SCHEDULE OF INVESTMENTS (Continued) |
| December 31, 2020 |
| Shares | | | | | Value | |
| | | | | TOTAL INVESTMENTS - 100.6% (Cost $2,205,460) | | $ | 2,851,322 | |
| | | | | LIABILITIES IN EXCESS OF OTHER ASSETS - (0.6)% | | | (16,066 | ) |
| | | | | NET ASSETS - 100.0% | | $ | 2,835,256 | |
| (a) | Non-income producing security. |
| (b) | Percentage rounds to less than 0.1%. |
| (c) | Rate disclosed is the seven day effective yield as of December 31, 2020. |
LP - Limited Partnership
REIT - Real Estate Investment Trust.
See accompanying notes to financial statements.
| Acclivity Funds |
| STATEMENTS OF ASSETS AND LIABILITIES |
| December 31, 2020 |
| | | Acclivity Mid Cap | | | Acclivity Small Cap | |
| | | Multi-Style Fund | | | Value Fund | |
| ASSETS | | | | | | | | |
| Investment securities: | | | | | | | | |
| At cost | | $ | 132,566 | | | $ | 2,205,460 | |
| At value | | $ | 163,341 | | | $ | 2,851,322 | |
| Dividends and interest receivable | | | 106 | | | | 2,394 | |
| Receivable due from Advisor | | | 2,473 | | | | 9,857 | |
| Prepaid expenses and other assets | | | 1,152 | | | | 1,864 | |
| TOTAL ASSETS | | | 167,072 | | | | 2,865,437 | |
| | | | | | | | | |
| LIABILITIES | | | | | | | | |
| Payable for Fund shares redeemed | | | — | | | | 15 | |
| Audit fees payable | | | 12,200 | | | | 12,205 | |
| Distribution (12b-1) fees payable | | | — | | | | 6 | |
| Payable to related parties | | | 9,135 | | | | 10,953 | |
| Accrued expenses and other liabilities | | | 3,924 | | | | 7,002 | |
| TOTAL LIABILITIES | | | 25,259 | | | | 30,181 | |
| NET ASSETS | | $ | 141,813 | | | $ | 2,835,256 | |
| | | | | | | | | |
| Net Assets Consist Of: | | | | | | | | |
| Paid in capital | | $ | 125,020 | | | $ | 2,551,759 | |
| Accumulated earnings | | | 16,793 | | | | 283,497 | |
| NET ASSETS | | $ | 141,813 | | | $ | 2,835,256 | |
| | | | | | | | | |
| Net Asset Value Per Share: | | | | | | | | |
| Class I Shares: | | | | | | | | |
| Net Assets | | $ | 141,802 | | | $ | 2,825,024 | |
| Shares of beneficial interest outstanding ($0 par value, unlimited shares authorized) | | | 12,842 | | | | 228,037 | |
| Net asset value (Net Assets ÷ Shares Outstanding), offering price and redemption price per share | | $ | 11.04 | | | $ | 12.39 | |
| | | | | | | | | |
| Class N Shares: | | | | | | | | |
| Net Assets | | $ | 11 | | | $ | 10,232 | |
| Shares of beneficial interest outstanding ($0 par value, unlimited shares authorized) | | | 1 | | | | 827 | |
| Net asset value (Net Assets ÷ Shares Outstanding), offering price and redemption price per share | | $ | 11.04 | (a) | | $ | 12.37 | |
| (a) | Net asset value may not recalculate due to the rounding of net assets. |
See accompanying notes to financial statements.
| Acclivity Funds |
| STATEMENTS OF OPERATIONS |
| For the Year or Period* Ended December 31, 2020 |
| | | Acclivity Mid Cap | | | Acclivity Small Cap | |
| | | Multi-Style Fund | | | Value Fund | |
| INVESTMENT INCOME | | | | | | | | |
| Dividends (Foreign Taxes Withheld - $1 and $0, respectively) | | $ | 1,682 | | | $ | 61,406 | |
| Interest | | | 28 | | | | 112 | |
| TOTAL INVESTMENT INCOME | | | 1,710 | | | | 61,518 | |
| | | | | | | | | |
| EXPENSES | | | | | | | | |
| Investment advisory fees | | | 428 | | | | 10,228 | |
| Distribution (12b-1) fees: | | | | | | | | |
| Class N | | | — | | | | 6 | |
| Transfer agent fees | | | 24,195 | | | | 26,740 | |
| Trustees’ fees | | | 19,077 | | | | 27,480 | |
| Legal fees | | | 21,204 | | | | 21,643 | |
| Administration fees | | | 15,237 | | | | 21,866 | |
| Audit fees | | | 12,200 | | | | 6,408 | |
| Compliance officer fees | | | 3,686 | | | | 2,600 | |
| Registration fees | | | 614 | | | | 4,323 | |
| Custody fees | | | 4,988 | | | | 1,852 | |
| Shareholder reporting expense | | | 3,336 | | | | 2,819 | |
| Fund accounting fees | | | 65 | | | | 1,250 | |
| Third party administrative servicing fees | | | — | | | | 1,074 | |
| Insurance expense | | | 9 | | | | 75 | |
| Other expenses | | | 2,857 | | | | 1,514 | |
| TOTAL EXPENSES | | | 107,896 | | | | 129,878 | |
| | | | | | | | | |
| Less: Fees waived/reimbursed by the Adviser | | | (107,373 | ) | | | (117,329 | ) |
| | | | | | | | | |
| NET EXPENSES | | | 523 | | | | 12,549 | |
| NET INVESTMENT INCOME | | | 1,187 | | | | 48,969 | |
| | | | | | | | | |
| REALIZED AND UNREALIZED GAIN/(LOSS) ON INVESTMENTS | | | | | | | | |
| Net realized loss from investments | | | (15,169 | ) | | | (410,033 | ) |
| Distributions of realized gains from underlying investment companies | | | — | | | | 7 | |
| Net change in unrealized appreciation on investments | | | 30,775 | | | | 551,561 | |
| | | | | | | | | |
| NET REALIZED AND UNREALIZED GAIN ON INVESTMENTS | | | 15,606 | | | | 141,535 | |
| | | | | | | | | |
| NET INCREASE IN NET ASSETS RESULTING FROM OPERATIONS | | $ | 16,793 | | | $ | 190,504 | |
| * | The inception date of the Acclivity Mid Cap Multi-Style Fund was December 31, 2019 and the Fund commenced operations on January 2, 2020. |
See accompanying notes to financial statements.
| Acclivity Mid Cap Multi-Style Fund |
| STATEMENT OF CHANGES IN NET ASSETS |
| | | For the Period* Ended | |
| | | December 31, | |
| | | 2020 | |
| FROM OPERATIONS | | | | |
| Net investment income | | $ | 1,187 | |
| Net realized loss from investments | | | (15,169 | ) |
| Net change in unrealized appreciation of investments | | | 30,775 | |
| Net increase in net assets resulting from operations | | | 16,793 | |
| | | | | |
| FROM SHARES OF BENEFICIAL INTEREST | | | | |
| Proceeds from shares sold | | | | |
| Class I | | | 125,010 | |
| Class N | | | 10 | |
| Net increase in net assets from shares of beneficial interest | | | 125,020 | |
| | | | | |
| TOTAL INCREASE IN NET ASSETS | | | 141,813 | |
| | | | | |
| NET ASSETS | | | | |
| Beginning of Period | | | — | |
| End of Period | | $ | 141,813 | |
| | | | | |
| SHARE ACTIVITY - CLASS I | | | | |
| Shares sold | | | 12,842 | |
| Net increase in shares of beneficial interest outstanding | | | 12,842 | |
| | | | | |
| SHARE ACTIVITY - CLASS N | | | | |
| Shares sold | | | 1 | |
| Net increase in shares of beneficial interest outstanding | | | 1 | |
| * | The inception date of the Acclivity Mid Cap Multi-Style Fund was December 31, 2019 and the Fund commenced operations on January 2, 2020. |
See accompanying notes to financial statements.
| Acclivity Small Cap Value Fund |
| STATEMENTS OF CHANGES IN NET ASSETS |
| | | For the Year Ended | | | For the Period* Ended | |
| | | December 31, | | | December 31, | |
| | | 2020 | | | 2019 | |
| FROM OPERATIONS | | | | | | | | |
| Net investment income | | $ | 48,969 | | | $ | 12,214 | |
| Net realized gain/(loss) from security investments | | | (410,033 | ) | | | 57,329 | |
| Distributions of realized gains from underlying investment companies | | | 7 | | | | 63 | |
| Net change in unrealized appreciation of investments | | | 551,561 | | | | 94,301 | |
| Net increase in net assets resulting from operations | | | 190,504 | | | | 163,907 | |
| | | | | | | | | |
| DISTRIBUTIONS TO SHAREHOLDERS | | | | | | | | |
| Total Distributions Paid | | | | | | | | |
| Class I | | | (55,855 | ) | | | (15,059 | ) |
| Class N ^ | | | (0 | ) | | | (0 | ) |
| | | | (55,855 | ) | | | (15,059 | ) |
| | | | | | | | | |
| FROM SHARES OF BENEFICIAL INTEREST | | | | | | | | |
| Proceeds from shares sold | | | | | | | | |
| Class I | | | 435,810 | | | | 2,691,627 | |
| Class N | | | 20,000 | | | | 32,013 | |
| Net asset value of shares issued in reinvestment of distributions | | | | | | | | |
| Class I | | | 55,182 | | | | 14,807 | |
| Class N ^ | | | 0 | | | | 0 | |
| Payments for shares redeemed | | | | | | | | |
| Class I | | | (624,862 | ) | | | (29,296 | ) |
| Class N | | | (12,494 | ) | | | (31,028 | ) |
| Net increase/(decrease) in net assets from shares of beneficial interest | | | (126,364 | ) | | | 2,678,123 | |
| | | | | | | | | |
| TOTAL INCREASE IN NET ASSETS | | | 8,285 | | | | 2,826,971 | |
| | | | | | | | | |
| NET ASSETS | | | | | | | | |
| Beginning of Period | | | 2,826,971 | | | | — | |
| End of Period | | $ | 2,835,256 | | | $ | 2,826,971 | |
| | | | | | | | | |
| SHARE ACTIVITY - CLASS I | | | | | | | | |
| Shares sold | | | 46,406 | | | | 241,722 | |
| Shares reinvested | | | 4,509 | | | | 1,284 | |
| Shares redeemed | | | (63,350 | ) | | | (2,534 | ) |
| Net increase/(decrease) in shares of beneficial interest outstanding | | | (12,435 | ) | | | 240,472 | |
| | | | | | | | | |
| SHARE ACTIVITY - CLASS N | | | | | | | | |
| Shares sold | | | 1,888 | | | | 2,861 | |
| Shares reinvested # | | | 0 | | | | 0 | |
| Shares redeemed | | | (1,062 | ) | | | (2,860 | ) |
| Net increase in shares of beneficial interest outstanding | | | 826 | | | | 1 | |
| * | The inception date of the Acclivity Small Cap Value Fund was December 31, 2018 and the Fund commenced operations on January 2, 2019. |
| ^ | Amount represents less than $0.50. |
| # | Amount represents less than 0.50 shares. |
See accompanying notes to financial statements.
| Acclivity Mid Cap Multi-Style Fund |
| FINANCIAL HIGHLIGHTS |
Per Share Data and Ratios for a Share of Beneficial Interest Outstanding Throughout the Period
| | | Class I | |
| | | Period* Ended
December 31, 2020 | |
| Net asset value, beginning of period | | $ | 10.00 | |
| Activity from investment operations: | | | | |
| Net investment income (1) | | | 0.10 | |
| Net realized and unrealized gain on investments | | | 0.94 | |
| Total from investment operations | | | 1.04 | |
| Net asset value, end of period | | $ | 11.04 | |
| Total return (2)(3) | | | 10.40 | % |
| Net assets, at end of period (000s) | | $ | 142 | |
| Ratio of gross expenses to average net assets (4)(5)(6) | | | 97.49 | % |
| Ratio of net expenses to average net assets (5)(6) | | | 0.47 | % |
| Ratio of net investment income to average net assets (5)(6) | | | 1.07 | % |
| Portfolio turnover rate (3) | | | 47 | % |
| * | The inception date of the Acclivity Mid Cap Multi-Style Fund was December 31, 2019 and the Fund commenced operations on January 2, 2020. |
| (1) | Per share amounts calculated using the average shares method, which more appropriately presents the per share data for the period. |
| (2) | Had the Adviser not waived a portion of the Fund’s expenses, total returns would have been lower. |
| (4) | Represents the ratio of expenses to average net assets absent fee waivers and/or expense reimbursements by the Adviser. |
| (5) | Does not include the expenses of other investment companies in which the Fund invests. |
| (6) | Annualized for periods less than one full year. |
See accompanying notes to financial statements.
| Acclivity Mid Cap Multi-Style Fund |
| FINANCIAL HIGHLIGHTS |
Per Share Data and Ratios for a Share of Beneficial Interest Outstanding Throughout the Period
| | | Class N | |
| | | Period* Ended
December 31, 2020 | |
| Net asset value, beginning of period | | $ | 10.00 | |
| Activity from investment operations: | | | | |
| Net investment income (1) | | | 0.10 | |
| Net realized and unrealized gain on investments | | | 0.94 | |
| Total from investment operations | | | 1.04 | |
| Net asset value, end of period | | $ | 11.04 | |
| Total return (2)(3) | | | 10.40 | % |
| Net assets, at end of period (4) | | $ | 11 | |
| Ratio of gross expenses to average net assets (5)(6)(7) | | | 97.74 | % |
| Ratio of net expenses to average net assets (6)(7) | | | 0.72 | % |
| Ratio of net investment income to average net assets (6)(7) | | | 0.82 | % |
| Portfolio turnover rate (3) | | | 47 | % |
| * | The inception date of the Acclivity Mid Cap Multi-Style Fund was December 31, 2019 and the Fund commenced operations on January 2, 2020. |
| (1) | Per share amounts calculated using the average shares method, which more appropriately presents the per share data for the period. |
| (2) | Had the Adviser not waived a portion of the Fund’s expenses, total returns would have been lower. |
| (4) | Represents actual net assets. |
| (5) | Represents the ratio of expenses to average net assets absent fee waivers and/or expense reimbursements by the Adviser. |
| (6) | Does not include the expenses of other investment companies in which the Fund invests. |
| (7) | Annualized for periods less than one full year. |
See accompanying notes to financial statements.
| Acclivity Small Cap Value Fund |
| FINANCIAL HIGHLIGHTS |
Per Share Data and Ratios for a Share of Beneficial Interest Outstanding Throughout Each Period
| | | Class I | |
| | | Year Ended | | | Period* Ended | |
| | | December 31, | | | December 31, | |
| | | 2020 | | | 2019 | |
| Net asset value, beginning of period | | $ | 11.76 | | | $ | 10.00 | |
| Activity from investment operations: | | | | | | | | |
| Net investment income (1) | | | 0.21 | | | | 0.15 | |
| Net realized and unrealized gain on investments | | | 0.67 | | | | 1.69 | |
| Total from investment operations | | | 0.88 | | | | 1.84 | |
| Less distributions from: | | | | | | | | |
| Net investment income | | | (0.01 | ) | | | (0.08 | ) |
| Net realized gains | | | (0.24 | ) | | | — | |
| Total distributions | | | (0.25 | ) | | | (0.08 | ) |
| Net asset value, end of period | | $ | 12.39 | | | $ | 11.76 | |
| Total return (2) | | | 7.51 | % | | | 18.44 | % (6) |
| Net assets, at end of period (000s) | | $ | 2,825 | | | $ | 2,827 | |
| Ratio of gross expenses to average net assets (3)(4) | | | 5.62 | % | | | 14.59 | % (5) |
| Ratio of net expenses to average net assets (4) | | | 0.54 | % | | | 0.67 | % (5) |
| Ratio of net investment income to average net assets (4) | | | 2.12 | % | | | 1.34 | % (5) |
| Portfolio turnover rate | | | 65 | % | | | 166 | % (6) |
| * | The inception date of the Acclivity Small Cap Value Fund was December 31, 2018 and the Fund commenced operations on January 2, 2019. |
| (1) | Per share amounts calculated using the average shares method, which more appropriately presents the per share data for the period. |
| (2) | Had the Adviser not waived a portion of the Fund’s expenses, total returns would have been lower. |
| (3) | Represents the ratio of expenses to average net assets absent fee waivers and/or expense reimbursements by the Adviser. |
| (4) | Does not include the expenses of other investment companies in which the Fund invests. |
| (5) | Annualized for periods less than one full year. |
See accompanying notes to financial statements.
| Acclivity Small Cap Value Fund |
| FINANCIAL HIGHLIGHTS |
Per Share Data and Ratios for a Share of Beneficial Interest Outstanding Throughout Each Period
| | | Class N | |
| | | Year Ended | | | Period* Ended | |
| | | December 31, | | | December 31, | |
| | | 2020 | | | 2019 | |
| Net asset value, beginning of period | | $ | 11.75 | | | $ | 10.00 | |
| Activity from investment operations: | | | | | | | | |
| Net investment income (1) | | | 0.26 | | | | 0.16 | |
| Net realized and unrealized gain on investments | | | 0.61 | | | | 1.67 | |
| Total from investment operations | | | 0.87 | | | | 1.83 | |
| Less distributions from: | | | | | | | | |
| Net investment income | | | (0.01 | ) | | | (0.08 | ) |
| Net realized gains | | | (0.24 | ) | | | — | |
| Total distributions | | | (0.25 | ) | | | (0.08 | ) |
| Net asset value, end of period | | $ | 12.37 | | | $ | 11.75 | |
| Total return (2) | | | 7.43 | % | | | 18.34 | % (6) |
| Net assets, at end of period (000s) | | $ | 10 | | | $ | 12 | (7) |
| Ratio of gross expenses to average net assets (3)(4) | | | 5.87 | % | | | 81.62 | % (5) |
| Ratio of net expenses to average net assets (4) | | | 0.79 | % | | | 0.92 | % (5) |
| Ratio of net investment income to average net assets (4) | | | 1.87 | % | | | 1.44 | % (5) |
| Portfolio turnover rate | | | 65 | % | | | 166 | % (6) |
| * | The inception date of the Acclivity Small Cap Value Fund was December 31, 2018 and the Fund commenced operations on January 2, 2019. |
| (1) | Per share amounts calculated using the average shares method, which more appropriately presents the per share data for the period. |
| (2) | Had the Adviser not waived a portion of the Fund’s expenses, total returns would have been lower. |
| (3) | Represents the ratio of expenses to average net assets absent fee waivers and/or expense reimbursements by the Adviser. |
| (4) | Does not include the expenses of other investment companies in which the Fund invests. |
| (5) | Annualized for periods less than one full year. |
| (7) | Represents actual net assets. |
See accompanying notes to financial statements.
| Acclivity Funds |
| NOTES TO FINANCIAL STATEMENTS |
| December 31, 2020 |
The Acclivity Mid Cap Multi-Style Fund (the “Mid Cap Fund”) and Acclivity Small Cap Value Fund (the “Small Cap Fund”) (each a “Fund,” collectively the “Funds”) are each a diversified series of shares of beneficial interest of Northern Lights Fund Trust II (the “Trust”), a statutory trust organized under the laws of the State of Delaware on August 26, 2010, and are registered under the Investment Company Act of 1940, as amended (the “1940 Act”), as open-end management investment companies. The inception date of the Mid Cap Fund was December 31, 2019 and the Mid Cap Fund commenced operations on January 2, 2020. The inception date of the Small Cap Fund was December 31, 2018 and the Small Cap Fund commenced operations on January 2, 2019. The Funds seek long term capital appreciation.
The Funds currently offer Class I shares and Class N shares. Class I and Class N shares are offered at net asset value without an initial sales charge. Class N shares are subject to a 0.25% Rule 12b-1 distribution and shareholder servicing fee. Each class represents an interest in the same assets of a Fund and classes are identical except for differences in ongoing service and distribution charges. All classes of shares have equal voting privileges except that each class has exclusive voting rights with respect to its shareholder service and/or distribution plans.
| 2. | SIGNIFICANT ACCOUNTING POLICIES |
The following is a summary of significant accounting policies followed by the Funds in preparation of their financial statements. The policies are in conformity with accounting principles generally accepted in the United States of America (“GAAP”). The preparation of financial statements requires management to make estimates and assumptions that affect the reported amounts of assets and liabilities and disclosure of contingent assets and liabilities at the date of the financial statements and the reported amounts of income and expenses for the period. Actual results could differ from those estimates. The Funds are each an investment company and accordingly follow the investment company accounting and reporting guidance of the Financial Accounting Standards Board (“FASB”) Accounting Standard Codification Topic 946 “Financial Services – Investment Companies”.
Security Valuation – Securities listed on an exchange are valued at the last reported sale price at the close of the regular trading session of the primary exchange on the business day the value is being determined, or in the case of securities listed on NASDAQ at the NASDAQ Official Closing Price (“NOCP”). In the absence of a sale, such securities shall be valued at the mean between the current bid and ask prices on the day of valuation. Investments valued in currencies other than the U.S. dollar are converted to U.S. dollars using exchange rates obtained from pricing services. Short-term debt obligations having 60 days or less remaining until maturity, at time of purchase, may be valued at amortized cost.
The Funds may hold securities, such as private investments, interests in commodity pools, other non-traded securities or temporarily illiquid securities, for which market quotations are not readily available or are determined to be unreliable. These securities will be valued using the “fair value” procedures approved by the Trust’s Board of Trustees (the “Board”). The Board has delegated execution of these procedures to a fair value committee composed of one or more representatives from each of the (i)
| Acclivity Funds |
| NOTES TO FINANCIAL STATEMENTS (Continued) |
| December 31, 2020 |
Trust, (ii) administrator, and (iii) Adviser. The committee may also enlist third party consultants such as a valuation specialist at a public accounting firm, valuation consultant or financial officer of a security issuer on an as-needed basis to assist in determining a security-specific fair value. The Board has also engaged a third party valuation firm to attend meetings held by the Trust, review minutes of such meetings and report to the Board on a quarterly basis. The Board reviews and ratifies the execution of this process and the resultant fair value prices at least quarterly to assure the process produces reliable results.
Fair Valuation Process – As noted above, this fair value committee is composed of one or more representatives from each of the (i) Trust, (ii) administrator, and (iii) adviser. The applicable investments are valued collectively via inputs from each of these groups. For example, fair value determinations are required for the following securities: (i) securities for which market quotations are insufficient or not readily available on a particular business day (including securities for which there is a short and temporary lapse in the provision of a price by the regular pricing source), (ii) securities for which, in the judgment of the adviser, the prices or values available do not represent the fair value of the instrument. Factors which may cause the adviser to make such a judgment include, but are not limited to, the following: only a bid price or an asked price is available; the spread between bid and asked prices is substantial; the frequency of sales; the thinness of the market; the size of reported trades; and actions of the securities markets, such as the suspension or limitation of trading; (iii) securities determined to be illiquid; (iv) securities with respect to which an event that will affect the value thereof has occurred (a “significant event”) since the closing prices were established on the principal exchange on which they are traded, but prior to a Fund’s calculation of its net asset values. Specifically, interests in commodity pools or managed futures pools are valued on a daily basis by reference to the closing market prices of each futures contract or other asset held by a pool, as adjusted for pool expenses. Restricted or illiquid securities, such as private investments or non-traded securities are valued via inputs from the adviser based upon the current bid for the security from two or more independent dealers or other parties reasonably familiar with the facts and circumstances of the security (who should take into consideration all relevant factors as may be appropriate under the circumstances). If the adviser is unable to obtain a current bid from such independent dealers or other independent parties, the fair value committee shall determine the fair value of such security using the following factors: (i) the type of security; (ii) the cost at date of purchase; (iii) the size and nature of the Fund’s holdings; (iv) the discount from market value of unrestricted securities of the same class at the time of purchase and subsequent thereto; (v) information as to any transactions or offers with respect to the security; (vi) the nature and duration of restrictions on disposition of the security and the existence of any registration rights; (vii) how the yield of the security compares to similar securities of companies of similar or equal creditworthiness; (viii) the level of recent trades of similar or comparable securities; (ix) the liquidity characteristics of the security; (x) current market conditions; and (xi) the market value of any securities into which the security is convertible or exchangeable.
Each Fund utilizes various methods to measure fair value of all of its investments on a recurring basis. GAAP establishes the hierarchy that prioritizes inputs to valuation methods. The three levels of input are:
Level 1 – Unadjusted quoted prices in active markets for identical assets and liabilities that each Fund has the ability to access.
| Acclivity Funds |
| NOTES TO FINANCIAL STATEMENTS (Continued) |
| December 31, 2020 |
Level 2 – Observable inputs other than quoted prices included in Level 1 that are observable for the asset or liability, either directly or indirectly. These inputs may include quoted prices for the identical instrument in an inactive market, prices for similar instruments, interest rates, prepayment speeds, credit risk, yield curves, default rates and similar data.
Level 3 – Unobservable inputs for the asset or liability, to the extent relevant observable inputs are not available, representing a Fund’s own assumptions about the assumptions a market participant would use in valuing the asset or liability, and would be based on the best information available.
The availability of observable inputs can vary from security to security and is affected by a wide variety of factors, including, for example, the type of security, whether the security is new and not yet established in the marketplace, the liquidity of markets, and other characteristics particular to the security. To the extent that valuation is based on models or inputs that are less observable or unobservable in the market, the determination of fair value requires more judgment. Accordingly, the degree of judgment exercised in determining fair value is greatest for instruments categorized in Level 3.
The inputs used to measure fair value may fall into different levels of the fair value hierarchy. In such cases, for disclosure purposes, the level in the fair value hierarchy within which the fair value measurement falls in its entirety, is determined based on the lowest level input that is significant to the fair value measurement in its entirety.
The inputs or methodology used for valuing securities are not necessarily an indication of the risk associated with investing in those securities. The following tables summarize the inputs used as of December 31, 2020 for each Fund’s assets measured at fair value:
| Acclivity Mid Cap Multi-Style Fund | |
| Assets * | | Level 1 | | | Level 2 | | | Level 3 | | | Total | |
| Common Stocks | | $ | 136,303 | | | $ | — | | | $ | — | | | $ | 136,303 | |
| Money Market Fund | | | 27,038 | | | | — | | | | — | | | | 27,038 | |
| Total | | $ | 163,341 | | | $ | — | | | $ | — | | | $ | 163,341 | |
| | | | | | | | | | | | | | | | | |
| Acclivity Small Cap Value Fund | |
| Assets * | | Level 1 | | | Level 2 | | | Level 3 | | | Total | |
| Common Stocks | | $ | 2,810,413 | | | $ | — | | | $ | — | | | $ | 2,810,413 | |
| Partnership Shares | | | 18,657 | | | | — | | | | — | | | | 18,657 | |
| REIT | | | 3,176 | | | | — | | | | — | | | | 3,176 | |
| Money Market Fund | | | 19,076 | | | | — | | | | — | | | | 19,076 | |
| Total | | $ | 2,851,322 | | | $ | — | | | $ | — | | | $ | 2,851,322 | |
The Funds did not hold any Level 3 securities during the period.
| * | See each Fund’s Schedule of Investments for classification. |
| Acclivity Funds |
| NOTES TO FINANCIAL STATEMENTS (Continued) |
| December 31, 2020 |
Security Transactions and Related Income – Security transactions are accounted for on trade date. Interest income is recognized on an accrual basis. Discounts are accreted and premiums are amortized on securities purchased over the lives of the respective securities. Dividend income is recorded on the ex-dividend date. Realized gains or losses from sales of securities are determined by comparing the identified cost of the security lot sold with the net sales proceeds. Each Fund’s income, expenses (other than class specific distribution fees) and realized and unrealized gains and losses are allocated proportionately each day based upon the relative net assets of each class.
Dividends and Distributions to Shareholders – Dividends from net investment income, if any, are declared and paid annually. Distributable net realized capital gains, if any, are declared and distributed annually in December. Dividends from net investment income and distributions from net realized gains are determined in accordance with federal income tax regulations, which may differ from GAAP. These “book/tax” differences are considered either temporary (i.e., deferred losses) or permanent in nature. To the extent these differences are permanent in nature, such amounts are reclassified within the composition of net assets based on their Federal tax-basis treatment; temporary differences do not require reclassification. Dividends and distributions to shareholders are recorded on ex-dividend date.
Federal Income Taxes – Each Fund intends to continue to comply with the requirements of the Internal Revenue Code applicable to regulated investment companies and to distribute all of their taxable income to their shareholders. Therefore, no provision for federal income tax is required. The Funds recognize the tax benefits of uncertain tax positions only where the position is “more likely than not” to be sustained assuming examination by tax authorities. Management has analyzed each Fund’s tax positions and has concluded that no liability for unrecognized tax benefits should be recorded related to uncertain tax positions taken on returns filed for the Small Cap Fund’s December 31, 2019 year-end, or expected to be taken in the Funds’ December 31, 2020 tax returns. Each Fund has identified its major tax jurisdictions as U.S. Federal, Ohio, and foreign jurisdictions where the Funds make significant investments. The Funds are not aware of any tax positions for which it is reasonably possible that the total amounts of unrecognized tax benefits will change materially in the next twelve months.
Expenses – Expenses of the Trust that are directly identifiable to a specific fund are charged to that fund. Expenses, which are not readily identifiable to a specific fund, are allocated in such a manner as deemed equitable, taking into consideration the nature and type of expense and the relative sizes of the funds in the Trust.
Indemnification – The Trust indemnifies its officers and Trustees for certain liabilities that may arise from the performance of their duties to the Trust. Additionally, in the normal course of business, the Funds enter into contracts that contain a variety of representations and warranties and which provide general indemnities. Each Fund’s maximum exposure under these arrangements is unknown, as this would involve future claims that may be made against a Fund that have not yet occurred. However, based on experience, the Funds expect the risk of loss due to these warranties and indemnities to be remote.
| Acclivity Funds |
| NOTES TO FINANCIAL STATEMENTS (Continued) |
| December 31, 2020 |
| 3. | INVESTMENT TRANSACTIONS |
For the year or period ended December 31, 2020, cost of purchases and proceeds from sales of portfolio securities, other than short-term investments, amounted to:
| | | Purchases | | | Sales | |
| Mid Cap | | $ | 170,279 | | | $ | 49,583 | |
| Small Cap | | | 1,508,095 | | | | 1,634,802 | |
| 4. | INVESTMENT ADVISORY AGREEMENT AND TRANSACTIONS WITH RELATED PARTIES |
Innealta Capital, LLC (the “Adviser”) serves as investment adviser to the Funds. Pursuant to an Advisory Agreement with the Funds, the Adviser, under the oversight of the Board, directs the daily operations of the Funds and supervises the performance of administrative and professional services provided by others. Effective May 1, 2020, the Funds pay the Adviser a management fee at an annual rate of 0.35% and 0.39% of the Mid Cap Fund’s and Small Cap Fund’s average daily net assets, respectively. Prior to May 1, 2020, as compensation for its services and the related expenses borne by the Adviser, the Funds paid the Adviser a management fee, computed and accrued daily and paid monthly, at an annual rate of 0.45% and 0.55% of the Mid Cap Fund’s and Small Cap Fund’s average daily net assets, respectively. For the period ended December 31, 2020, the Adviser earned $428 and $10,228 from the Mid Cap Fund and Small Cap Fund, respectively.
Effective May 1, 2020, pursuant to a written contract (the “Waiver Agreement”), the Adviser has agreed, at least until April 30, 2022, to waive a portion of its advisory fee and has agreed to reimburse each Fund for other expenses to the extent necessary so that the total expenses incurred by each Fund (excluding taxes, leverage interest, brokerage fees and commissions, expenses of investing in underlying funds, expenses incurred in connection with any merger or reorganization, dividend expense on securities sold short, or extraordinary expenses, such as litigation, not incurred in the ordinary course of a Fund’s business) do not exceed 0.44% and 0.69% for Class I and Class N shares of the Mid Cap Fund, respectively, and 0.48% and 0.73% for Class I and Class N shares of the Small Cap Fund, respectively. Prior to May 1, 2020, the Advisor agreed to waive/reimburse expenses to the extent necessary that the total expenses did not exceed 0.55% and 0.80% for Class I and Class N shares of the Mid Cap Fund, respectively, and 0.67% and 0.92% for Class I and Class N shares of the Small Cap Fund, respectively.
If the Adviser waives any fee or reimburses any expenses pursuant to the Waiver Agreement for a Fund, and a Fund’s operating expenses are subsequently lower than its respective expense limitation, the Adviser shall be entitled to reimbursement by a Fund provided that such reimbursement does not cause a Fund’s operating expenses to exceed its expense limitation. If a Fund’s operating expenses subsequently exceed its expense limitation, the reimbursements for a Fund shall be suspended. The Adviser may seek reimbursement only for expenses waived or paid by it during the three fiscal years prior to such reimbursement; provided, however, that such expenses may only be reimbursed to the extent they were waived or paid after the date of the Waiver Agreement (or any similar agreement).
| Acclivity Funds |
| NOTES TO FINANCIAL STATEMENTS (Continued) |
| December 31, 2020 |
The Board may terminate this expense reimbursement arrangement at any time. For the year ended December 31, 2020, the Adviser waived advisory fees and reimbursed the Mid Cap Fund and Small Cap Fund for expenses in the amounts of $107,373 and $117,329, respectively.
The following amounts are subject to recapture by the Funds by the following date:
| | | 12/31/2022 | | | 12/31/2023 | |
| Mid Cap | | | N/A | | | $ | 107,373 | |
| Small Cap | | $ | 135,510 | | | $ | 117,329 | |
Distributor – The distributor for the Funds is Northern Lights Distributors, LLC (the “Distributor”). The Board has adopted the Trust’s Master Distribution and Shareholder Servicing Plans for Class N shares (the “Plan”) pursuant to Rule 12b-1 under the 1940 Act to pay for ongoing distribution-related activities or shareholder services. Under the Plan, the Funds are permitted to pay a fee at an annual rate of 0.25% of the average daily net assets of Class N shares. For the year or period ended December 31, 2020, pursuant to the Class N Plan, the Mid Cap Fund and Small Cap Fund incurred $0 and $6 in 12b-1 fees, respectively.
The Distributor acts as the Funds’ principal underwriter in a continuous public offering of each Fund’s shares.
In addition, certain affiliates of the Distributor provide services to the Funds as follows:
Gemini Fund Services, LLC (“GFS”) – GFS, an affiliate of the Distributor, provides administration, fund accounting, and transfer agent services to the Trust. Pursuant to separate servicing agreements with GFS, the Funds pay GFS customary fees for providing administration, fund accounting, and transfer agency services to the Funds. Certain officers of the Trust are also officers of GFS, and are not paid any fees directly by the Funds for serving in such capacities.
Northern Lights Compliance Services, LLC (“NLCS”) – NLCS, an affiliate of GFS and the Distributor, provides a Chief Compliance Officer to the Trust, as well as related compliance services, pursuant to a consulting agreement between NLCS and the Trust. Under the terms of such agreement, NLCS receives customary fees from the Funds.
Blu Giant, LLC (“Blu Giant”) – Blu Giant, an affiliate of GFS and the Distributor, provides EDGAR conversion and filing services as well as print management services for the Funds on an ad-hoc basis. For the provision of these services, Blu Giant receives customary fees from the Funds.
| Acclivity Funds |
| NOTES TO FINANCIAL STATEMENTS (Continued) |
| December 31, 2020 |
| 5. | AGGREGATE UNREALIZED APPRECIATION AND DEPRECIATION – TAX BASIS |
The identified cost of investments in securities owned by each Fund for federal income tax purposes, and its respective gross unrealized appreciation and depreciation at December 31, 2020, were as follows:
| | | | | | Gross | | | Gross | | | | |
| | | Tax | | | Unrealized | | | Unrealized | | | Net Unrealized | |
| | | Cost | | | Appreciation | | | Depreciation | | | Appreciation | |
| Mid Cap Fund | | $ | 132,566 | | | $ | 33,439 | | | $ | (2,664 | ) | | $ | 30,775 | |
| Small Cap Fund | | | 2,207,369 | | | | 759,964 | | | | (116,011 | ) | | | 643,953 | |
| 6. | SHAREHOLDERS & TAX COMPONENTS OF CAPITAL |
The tax character of fund distributions paid for the periods ended December 31, 2020 and December 31, 2019 was as follows:
| For fiscal year or period | | Ordinary | | | Long-Term | | | | |
| ended December 31, 2020 | | Income | | | Capital Gains | | | Total | |
| Mid Cap Fund | | $ | — | | | $ | — | | | $ | — | |
| Small Cap Fund | | | 55,589 | | | | 266 | | | | 55,855 | |
| | | | | | | | | | | | | |
| For fiscal period ended | | Ordinary | | | Long-Term | | | | |
| December 31, 2019 | | Income | | | Capital Gains | | | Total | |
| Small Cap Fund | | $ | 15,059 | | | $ | — | | | $ | 15,059 | |
As of December 31, 2020, the components of accumulated earnings on a tax basis were as follows:
| | | Undistributed | | | Undistributed | | | | | | Capital Loss | | | Other | | | | | | Total | |
| | | Ordinary | | | Long-Term | | | Post October | | | Carry | | | Book/Tax | | | Unrealized | | | Accumulated | |
| | | Income | | | Capital Gains | | | Loss | | | Forwards | | | Differences | | | Appreciation | | | Earnings | |
| Mid Cap Fund | | $ | 1,187 | | | $ | — | | | $ | — | | | $ | (15,169 | ) | | $ | — | | | $ | 30,775 | | | $ | 16,793 | |
| Small Cap Fund | | | 46,060 | | | | — | | | | (6,398 | ) | | | (400,118 | ) | | | — | | | | 643,953 | | | | 283,497 | |
The difference between book basis and tax basis distributable earnings is primarily attributable to the tax deferral of losses on wash sales, adjustments for partnerships, and C-Corporation return of capital distributions.
Capital losses incurred after October 31 within the fiscal year are deemed to arise on the first business day of the following fiscal year for tax purposes. The Small Cap Fund incurred and elected to defer such capital losses of $6,398.
| Acclivity Funds |
| NOTES TO FINANCIAL STATEMENTS (Continued) |
| December 31, 2020 |
At December 31, 2020, the Funds had capital loss carry forwards for federal income tax purposes available to offset future capital gains as follows:
| | | Non-Expiring | | | Non-Expiring | | | | |
| | | Short-Term | | | Long-Term | | | Total | |
| Mid Cap Fund | | $ | 15,169 | | | $ | — | | | $ | 15,169 | |
| Small Cap Fund | | | 391,432 | | | | 8,686 | | | | 400,118 | |
The beneficial ownership, either directly or indirectly, of more than 25% of the voting securities of a Fund creates presumption of control of the Fund, under Section 2(a)(9) of the 1940 Act. As of December 31, 2020, beneficial ownership in excess of 25% for the Funds is as follows:
| | | | | % of Outstanding |
| | | Beneficial Owner | | Shares |
| Mid Cap Fund | | Innealta Capital, LLC | | 100% |
| Small Cap Fund | | National Financial Services, LLC | | 60% |
The Trust has no knowledge as to whether all or any portion of the shares owned of record are also owned beneficially.
Subsequent events after the date of the Statements of Assets and Liabilities have been evaluated through the date the financial statements were issued. Management has determined that no events or transactions occurred requiring adjustment or disclosure in the financial statements.

REPORT OF INDEPENDENT REGISTERED PUBLIC ACCOUNTING FIRM
To the Board of Trustees of Northern Lights Fund Trust II
and the Shareholders of Acclivity Mid Cap Multi-Style Fund and
Acclivity Small Cap Value Fund
Opinion on the Financial Statements
We have audited the accompanying statements of assets and liabilities of Acclivity Mid Cap Multi-Style Fund and Acclivity Small Cap Value Fund, each a series of shares of beneficial interest in Northern Lights Fund Trust II (the “Funds”), including the schedules of investments, as of December 31, 2020, and the related statements of operations, the statements of changes in net assets and financial highlights as noted in the table below, and the related notes (collectively referred to as the “financial statements”). In our opinion, the financial statements present fairly, in all material respects, the financial position of the Funds as of December 31, 2020, and the results of their operations, the changes in their net assets and their financial highlights as noted in the table below, in conformity with accounting principles generally accepted in the United States of America
| Fund | Statements of Operations and Changes in Net Assets and the Financial Highlights |
| Acclivity Mid Cap Multi-Style Fund | The statement of operations, changes in net assets and the financial highlights for the period from January 2, 2020 (commencement of operations) through December 31, 2020 |
| Acclivity Small Cap Value Fund | The statement of operations for the year ended December 31, 2020, and the statements of changes in net assets and the financial highlights for the year then ended and for the period from January 2, 2019 (commencement of operations) through December 31, 2019 |
Basis for Opinion
These financial statements are the responsibility of the Funds’ management. Our responsibility is to express an opinion on the Funds’ financial statements based on our audits. We are a public accounting firm registered with the Public Company Accounting Oversight Board (United States) (“PCAOB”) and are required to be independent with respect to the Funds in accordance with the U.S. federal securities law and the applicable rules and regulations of the Securities and Exchange Commission and the PCAOB.
We conducted our audits in accordance with the standards of the PCAOB. Those standards require that we plan and perform the audits to obtain reasonable assurance about whether the financial statements are free of material misstatement, whether due to error or fraud. The Funds are not required to have, nor were we engaged to perform, an audit of their internal control over financial reporting. As part of our audits we are required to obtain an understanding of internal control over financial reporting but not for the purpose of expressing an opinion on the effectiveness of the Funds’ internal control over financial reporting. Accordingly, we express no such opinion.
Our audits included performing procedures to assess the risk of material misstatement of the financial statements, whether due to error or fraud, and performing procedures that respond to those risks. Such procedures included examining, on a test basis, evidence regarding the amounts and disclosures in the financial statements. Our procedures included confirmation of securities owned as of December 31, 2020 by correspondence with the custodian and brokers, or by other appropriate auditing procedures where replies from brokers were not received. Our audits also included evaluating the accounting principles used and significant estimates made by management, as well as evaluating the overall presentation of the financial statements. We believe that our audits provide a reasonable basis for our opinion.

BBD, LLP
We have served as the auditor of one or more of the Funds in the Northern Lights Fund Trust II since 2012.
Philadelphia, Pennsylvania
March 1, 2021
| Acclivity Funds |
| EXPENSE EXAMPLES (Unaudited) |
| December 31, 2020 |
As a shareholder of a Fund, you incur two types of costs: (1) transaction costs including redemption fees; and (2) ongoing costs, including advisory fees; distribution and/or service (12b-1) fees; and other Fund expenses. This example is intended to help you understand your ongoing costs (in dollars) of investing in the Funds and to compare these costs with the ongoing costs of investing in other mutual funds.
The example is based on an investment of $1,000 invested at the beginning of the period and held for the entire period from July 1, 2020 through December 31, 2020.
Actual Expenses
The “Actual Expenses” line in the table below provides information about actual account values and actual expenses. You may use the information below together with the amount you invested, to estimate the expenses that you paid over the period. Simply divide your account value by $1,000 (for example, an $8,600 account value divided by $1,000 = 8.6), then multiply the result by the number in the table under the heading entitled “Expenses Paid During Period” to estimate the expenses you paid on your account during this period.
Hypothetical Example for Comparison Purposes
The “Hypothetical” line in the table below provides information about hypothetical account values and hypothetical expenses based on the Funds’ actual expense ratios and an assumed rate of return of 5% per year before expenses, which are not the Funds’ actual returns. The hypothetical account values and expenses may not be used to estimate the actual ending account balances or expenses you paid for the period. You may use this information to compare this 5% hypothetical example with the 5% hypothetical examples that appear in the shareholder reports of other funds.
Please note that the expenses shown in the table are meant to highlight your ongoing costs only and do not reflect any transactional costs, such as redemption fees. Therefore, the table is useful in comparing ongoing costs only, and will not help you determine the relative total costs of owning different funds. In addition, if these transactional costs were included, your costs would have been higher.
| | | | | Beginning | | | Ending | | | Expenses Paid | | | Annualized |
| | | | | Account Value | | | Account Value | | | During Period * | | | Expense Ratio |
| Actual | | | | 7/1/20 | | | 12/31/20 | | | 7/1/20-12/31/20 | | | During Period |
| Acclivity Mid Cap Multi-Style Fund | | | | | | | | | | | | | | | | |
| | | Class I | | $ | 1,000.00 | | | $ | 1,306.50 | | | $ | 2.55 | | | 0.44% |
| | | Class N | | | 1,000.00 | | | | 1,306.50 | | | | 4.00 | | | 0.69% |
| Acclivity Small Cap Value Fund | | | | | | | | | | | | | | | | |
| | | Class I | | $ | 1,000.00 | | | $ | 1,389.30 | | | $ | 2.88 | | | 0.48% |
| | | Class N | | | 1,000.00 | | | | 1,388.70 | | | | 4.38 | | | 0.73% |
| | | | | | | | | | | | | | | | | |
| Hypothetical (5% return before Expenses) | | | | | | | | | | | | | | | | |
| Acclivity Mid Cap Multi-Style Fund | | | | | | | | | | | | | | | | |
| | | Class I | | $ | 1,000.00 | | | $ | 1,022.92 | | | $ | 2.24 | | | 0.44% |
| | | Class N | | | 1,000.00 | | | | 1,021.67 | | | | 3.51 | | | 0.69% |
| Acclivity Small Cap Value Fund | | | | | | | | | | | | | | | | |
| | | Class I | | $ | 1,000.00 | | | $ | 1,022.72 | | | $ | 2.44 | | | 0.48% |
| | | Class N | | | 1,000.00 | | | | 1,021.47 | | | | 3.71 | | | 0.73% |
| * | Expenses are equal to the average account value over the period, multiplied by a Fund’s annualized expense ratio, multiplied by the number of days in the period (184) divided by the number of days in the fiscal year (366). |
| Acclivity Funds |
| SUPPLEMENTAL INFORMATION (Unaudited) |
| December 31, 2020 |
FACTORS CONSIDERED BY THE TRUSTEES IN THE APPROVAL OF THE RENEWAL OF THE INVESTMENT ADVISORY AGREEMENT
At a Regular meeting (the “Meeting”) of the Board of Trustees (the “Board”) of Northern Lights Fund Trust II (the “Trust”) held on October 14, 2020, the Board, including the disinterested Trustees (the “Independent Trustees”), considered the renewal of the Investment Advisory Agreement between the Trust, on behalf of the Acclivity Small Cap Value Fund (“Acclivity Small Cap Value”) and Innealta Capital, LLC (“Innealta”) (the “Innealta Advisory Agreement”).
Based on their evaluation of the information provided by Innealta in conjunction with Acclivity Small Cap Value’s other service providers, the Board, by a unanimous vote (including a separate vote of the Independent Trustees), approved the renewal of the Innealta Advisory Agreement with respect to Acclivity Small Cap Value.
In advance of the Meeting, the Board requested and received materials to assist them in considering the renewal of the Innealta Advisory Agreement. The materials provided contained information with respect to the factors enumerated below, including the Innealta Advisory Agreement, a memorandum prepared by the Trust’s outside legal counsel discussing in detail the Trustees’ fiduciary obligations and the factors they should assess in considering the continuation of the Innealta Advisory Agreement and comparative information relating to the advisory fee and other expenses of Acclivity Small Cap Value. The materials also included due diligence materials relating to Innealta (including due diligence questionnaires completed by Innealta, select financial information of Innealta, bibliographic information regarding Innealta’s key management and investment advisory personnel, and comparative fee information relating to Acclivity Small Cap Value) and other pertinent information. At the Meeting, the Independent Trustees were advised by counsel that is experienced in Investment Company Act of 1940 matters and that is independent of fund management and met with such counsel separately from fund management.
The Board reviewed and discussed the written materials that were provided in advance of the Meeting and deliberated on the renewal of the Innealta Advisory Agreement with respect to Acclivity Small Cap Value. The Board relied upon the advice of independent legal counsel and their own business judgment in determining the material factors to be considered in evaluating the Innealta Advisory Agreement and the weight to be given to each such factor. The conclusions reached by the Board were based on a comprehensive evaluation of all of the information provided and were not the result of any one factor. Moreover, each Trustee may have afforded different weight to the various factors in reaching his conclusions with respect to the Innealta Advisory Agreement. In considering the approval of the renewal of the Innealta Advisory Agreement, the Board reviewed and analyzed various factors that they determined were relevant, including the factors enumerated below.
Nature, Extent and Quality of Services. The Board then reviewed materials provided by Innealta related to the approval of the renewal of the Innealta Advisory Agreement, including Innealta’s Form ADV and related schedules, a description of the manner in which investment decisions are made and executed, a review of the personnel performing services for Acclivity Small Cap Value, including the team of individuals that primarily monitor and execute the investment process. The Board discussed the extent of Innealta’s research capabilities, the quality of Innealta’s compliance infrastructure and the experience of its management personnel. The Board noted the recent hiring of Dr. Glenn Freed as an investment strategist and portfolio manager for certain Acclivity Funds. Additionally, the Board received satisfactory responses from the representative of Innealta with respect to a series of important questions, including: whether Innealta was involved in any lawsuits or pending regulatory actions; whether the management of other accounts would conflict with its management of Acclivity Small Cap Value; whether there were procedures in place to adequately allocate trades among its respective clients; and whether Innealta’s CCO would routinely review the portfolio managers’ performance of their duties to ensure compliance under Innealta’s compliance program. The Board also reviewed the information provided on the practices for monitoring compliance with Acclivity Small Cap Value’s investment limitations. The Board also discussed details of Innealta’s compliance program with the CCO of the Trust. The Board noted that the CCO of the Trust continued to represent that Innealta’s policies and procedures were reasonably designed to prevent violations of applicable federal securities laws. The Board also noted Innealta’s representation that the prospectus and statement of additional information for Acclivity Small Cap Value accurately describe the investment strategies of Acclivity Small Cap Value. The Board
| Acclivity Funds |
| SUPPLEMENTAL INFORMATION (Unaudited)(Continued) |
| December 31, 2020 |
then reviewed the capitalization of Innealta based on financial information provided, and representations made by Innealta and its representatives, and concluded that Innealta was sufficiently well-capitalized, or Innealta’s owners had the ability to make additional contributions in order to meet its obligations to Acclivity Small Cap Value. The Board concluded that Innealta had sufficient quality and depth of personnel, resources, investment methods and compliance policies and procedures essential to performing its duties under the Innealta Advisory Agreement and that the nature, overall quality and extent of the management services to be provided by Innealta to Acclivity Small Cap Value were satisfactory.
Performance. The Board then discussed the reports prepared by Broadridge and reviewed the performance for the one year and since inception periods for Acclivity Small Cap Value as of August 31, 2020. The Board noted that Acclivity Small Cap Value outperformed the peer group median and Morningstar category median but underperformed its benchmark (the S&P 500 Total Return Index) for the one year period, and outperformed the peer group median but underperformed the Morningstar category median and benchmark for the since inception period. The Board noted the portfolio managers’ ability to manage risk and the recent addition of investment team personnel. After further discussion, the Board concluded that Acclivity Small Cap Value’s past performance was acceptable and generally in line with its risk level.
Fees and Expenses. As to the costs of the services to be provided by Innealta, the Board reviewed and discussed the Acclivity Small Cap Value’s advisory fee and total operating expenses as compared to its peer group and its Morningstar category as presented in the Broadridge Reports. The Board reviewed the contractual arrangements, noting that Innealta charges an advisory fee at an annual rate of 0.39% of the average daily net assets of Acclivity Small Cap Value under the Innealta Advisory Agreement. The Board noted the advisory fee for Acclivity Small Cap Value was significantly lower than the peer group median and Morningstar category median. The Board also reviewed the net expenses for Acclivity Small Cap Value as compared to its peer group and Morningstar category. The Board then reviewed the Operating Expenses Limitation Agreement noting that Innealta had agreed to waive or limit its advisory fee and/or reimburse expenses at least until April 30, 2022, in order to limit net annual operating expenses, exclusive of certain fees, so as not to exceed 0.48% and 0.73% of Acclivity Small Cap Value’s average net assets for Class I and Class N shares, respectively and found such arrangements to be beneficial to shareholders. The Board concluded that, based on Innealta’s experience, expertise and services provided to Acclivity Small Cap Value, the advisory fee charged by Innealta for Acclivity Small Cap Value was not unreasonable. The Board also noted their approval to lower the advisory fee and expense cap of Acclivity Small Cap Value at its meeting on April 22, 2020.
Profitability. The Board also considered the level of profits that could be expected to accrue to Innealta with respect to Acclivity Small Cap Value based on profitability reports and analyses prepared by Innealta and reviewed by the Board and the selected financial information of Innealta provided by Innealta. After review and discussion, the Board concluded that the anticipated profit from Innealta’s relationship with Acclivity Small Cap Value was not excessive.
Economies of Scale. As to the extent to which Acclivity Small Cap Value would realize economies of scale as it grew, and whether the fee levels reflect these economies of scale for the benefit of investors, the Board discussed the current size of Acclivity Small Cap Value, Innealta’s expectations for growth of Acclivity Small Cap Value, and concluded that any material economies of scale would not be achieved in the near term.
Conclusion. Having requested and received such information from Innealta as the Board believed to be reasonably necessary to evaluate the terms of the Innealta Advisory Agreement, and as assisted by the advice of independent counsel, the Board, including a majority of the Independent Trustees voting separately, determined that (a) the terms of the Innealta Advisory Agreement are not unreasonable with respect to Acclivity Small Cap Value; (b) the investment advisory fee payable for Acclivity Small Cap Value pursuant to the Innealta Advisory Agreement is not unreasonable; and (c) the Innealta Advisory Agreement is in the best interests of Acclivity Small Cap Value and its shareholders. In considering the renewal of the Innealta Advisory Agreement, the Board did not identify any one factor as all important, but rather considered these factors collectively and determined that approval of the renewal of the Innealta Advisory Agreement was in the best interest Acclivity Small Cap Value and its shareholders. Moreover, the Board noted that each Trustee may have afforded different weight to the various factors in reaching his conclusions with respect to the Innealta Advisory Agreement.
| Acclivity Funds |
| LIQUIDITY RISK MANAGEMENT PROGRAM (Unaudited) |
| December 31, 2020 |
The Funds have adopted and implemented a written liquidity risk management program as required by Rule 22e-4 (the “Liquidity Rule”) under the Investment Company Act. The program is reasonably designed to assess and manage each Fund’s liquidity risk, taking into consideration, among other factors, the respective Fund’s investment strategy and the liquidity of its portfolio investments during normal and reasonably foreseeable stressed conditions; its short and long-term cash flow projections; and its cash holdings and access to other funding sources.
During the fiscal period ended December 31, 2020, the Trust’s Liquidity Risk Management Program Committee (the “Committee”) reviewed each Fund’s investments and determined that the Funds held adequate levels of cash and highly liquid investments to meet shareholder redemption activities in accordance with applicable requirements. Accordingly, the Committee concluded that (i) the Funds’ liquidity risk management program is reasonably designed to prevent violations of the Liquidity Rule and (ii) the Funds’ liquidity risk management program has been effectively implemented.
| Acclivity Funds |
| SUPPLEMENTAL INFORMATION (Unaudited) |
| December 31, 2020 |
The Trustees and the officers of the Trust are listed below with their present positions with the Trust and principal occupations over at least the last five years. The business address of each Trustee and Officer is 225 Pictoria Drive, Suite 450, Cincinnati, OH 45246. All correspondence to the Trustees and Officers should be directed to c/o Gemini Fund Services, LLC, P.O. Box 541150, Omaha, Nebraska 68154.
Independent Trustees
Name and
Year of Birth | Position/Term
of Office* | Principal Occupation
During the Past Five
Years | Number of
Portfolios
in Fund
Complex
Overseen
by
Trustee *** | Other Directorships held by
Trustee
During the Past Five Years |
Thomas T. Sarkany
1946 | Trustee Since October 2011 | President, TTS Consultants, LLC (financial services) (since 2010). | 4 | Director, Aquila Distributors; Trustee, Arrow ETF Trust; Trustee, Arrow Investments Trust; Trustee, Northern Lights Fund Trust IV |
Anthony H. Lewis
1946 | Trustee Since May 2011 | Chairman and CEO of The Lewis Group USA (executive consulting firm) (since 2007). | 4 | Director, Member of the Compensation Committee and Member of the Risk Committee of Torotel Inc. (Magnetics, Aerospace and Defense), Trustee, Chairman of the Fair Valuation Committee and Member of the Audit Committee of the Wildermuth Endowment Strategy Fund |
Keith Rhoades
1948 | Trustee Since May 2011 | Retired since 2008. | 4 | NONE |
Randal D. Skalla
1962 | Trustee Since May 2011 | President, L5 Enterprises, Inc. (financial services company) (since 2001). | 4 | Board Member, Orizon Investment Counsel (financial services company) (from 2001 to 2017) |
| Acclivity Funds |
| SUPPLEMENTAL INFORMATION (Unaudited)(Continued) |
| December 31, 2020 |
Interested Trustees and Officers
Name and
Year of Birth | Position/Term
of Office* | Principal Occupation
During the Past Five
Years | Number of
Portfolios
in Fund
Complex
Overseen
by
Trustee *** | Other Directorships held by
Trustee
During the Past Five Years |
Brian Nielsen**
1972 | Trustee Since May 2011 | Trustee of Northern Lights Fund Trust II (since 2011); Special Projects Counsel of NorthStar Financial Services Group, LLC (from 2018 to 2019); Secretary of CLS Investments, LLC (from 2001 to 2018); Secretary of OrionAdvisor Services, LLC (from 2001 to 2018); Manager (from 2012 to 2015), General Counsel and Secretary (from 2003 to 2018) of NorthStar Financial Services Group, LLC; CEO (from 2012 to 2018), Secretary (from 2003 to 2018) and Manager (from 2005 to 2018) of Northern Lights Distributors, LLC; Director, Secretary and General Counsel of Constellation Trust Company (from 2004 to 2018); CEO (from 2015 to 2018), Manager (from 2008 to 2015), General Counsel and Secretary (from 2011 to 2018) of Northern Lights Compliance Services, LLC; General Counsel and Secretary of Blu Giant, LLC (from 2011 to 2018); Secretary of Gemini Fund Services, LLC (from 2012 to 2018); Manager of Arbor Point Advisors, LLC (from 2012 to 2018); Secretary and General Counsel of NorthStar Holdings, LLC (from 2013 to 2015); Director, Secretary and General Counsel of NorthStar CTC Holdings, Inc. (from 2015 to 2018) and Secretary and Chief Legal Officer of AdvisorOne Funds (from 2003 to 2018). | 4 | Manager of Northern Lights Distributors, LLC (from 2005 to 2018); Manager of NorthStar Financial Services Group, LLC (from 2012 to 2015); Manager of Arbor Point Advisors, LLC (from 2012 to 2018); Director of Constellation Trust Company (from 2004 to 2018) |
Kevin E. Wolf
1969 | President Since January 2013 | Vice President of The Ultimus Group, LLC and Executive Vice President, Head of Fund Administration and Product, Gemini Fund Services, LLC (since 2019), President, Gemini Fund Services, LLC (2012 - 2019). | N/A | N/A |
Richard Malinowski
1983 | Secretary Since January 2018 | Senior Vice President and Senior Managing Counsel, Gemini Fund Services, LLC, (since February 2020); Senior Vice President Legal Administration, Gemini Fund Services, LLC (since April 2017); Vice President and Counsel (April 2016 to 2017) and AVP and Staff Attorney (September 2012 to March 2016). | N/A | N/A |
Erik Naviloff
1968 | Treasurer Since January 2013 | Vice President of Gemini Fund Services, LLC (since 2011). | N/A | N/A |
Emile R. Molineaux
1962 | Chief Compliance Officer and Anti Money Laundering Officer Since May 2011 | Senior Compliance Officer and CCO of Various clients of Northern Lights Compliance Services, LLC (since 2011). | N/A | N/A |
| * | The term of office for each Trustee and Officer listed above will continue indefinitely. |
| ** | Brian Nielsen is an “interested person” of the Trust as that term is defined under the 1940 Act, because of his prior affiliation with Northern Lights Distributors, LLC (the Fund’s Distributor). |
| *** | As of December 31, 2020, the Trust was comprised of 19 active portfolios managed by unaffiliated investment advisers. The term “Fund Complex” applies only to the Funds and the Dynamic International Opportunity Fund and the Dynamic US Opportunity Fund, and not to any other series of the Trust. The Funds do not hold themselves out as related to any other series within the Trust for investment purposes, nor do they share the same investment adviser with any other series. |
The Fund’s Statement of Additional Information (“SAI”) includes additional information about the Trustees and is available free of charge, upon request, by calling toll-free at 1-855-873-3837.
Privacy Policy
Rev. May 2019
| FACTS | WHAT DOES NORTHERN LIGHTS FUND TRUST II (“NLFT II”) DO WITH YOUR PERSONAL INFORMATION? |
| Why? | Financial companies choose how they share your personal information. Federal law gives consumers the right to limit some but not all sharing. Federal law also requires us to tell you how we collect, share, and protect your personal information. Please read this notice carefully to understand what we do. |
| What? | The types of personal information we collect and share depend on the product or service you have with us. This information can include:
|
● Social Security number ● Employment information ● Account balances | ● Account transactions ● Income ● Investment experience |
When you are no longer our customer, we continue to share your information as described in this notice. |
| How? | All financial companies need to share a customer’s personal information to run their everyday business - to process transactions, maintain customer accounts, and report to credit bureaus. In the section below, we list the reasons financial companies can share their customer’s personal information; the reasons NLFT II chooses to share; and whether you can limit this sharing. |
| | |
| Reasons we can share your personal information | Does NLFT II
share? | Can you limit
this sharing? |
For our everyday business purposes —
such as to process your transactions, maintain your account(s), respond to court orders and legal investigations, or report to credit bureaus
| Yes | No |
For our marketing purposes —
to offer our products and services to you
| Yes | No |
For joint marketing with other financial companies
| Yes | No |
For our affiliates’ everyday business purposes —
information about your transactions and experiences
| Yes | No |
For our affiliates’ everyday business purposes —
information about your creditworthiness
| No | We don’t share |
For nonaffiliates to market to you
| No | We don’t share |
| Questions? | Call 1-631-490-4300 |
| | |
| Who we are |
| Who is providing this notice? | Northern Lights Fund Trust II |
| What we do |
| How does NLFT II protect my personal information? | To protect your personal information from unauthorized access and use, we use security measures that comply with federal law. These measures include computer safeguards and secured files and buildings.
|
| How does NLFT II collect my personal information? | We collect your personal information, for example, when you
|
● open an account ● give us your income information ● provide employment information | ● provide account information ● give us your contact information |
| We also collect your personal information from others, such as credit bureaus, affiliates, or other companies. |
| Why can’t I limit all sharing? | Federal law gives you the right to limit only ● sharing for affiliates’ everyday business purposes—information about your creditworthiness ● affiliates from using your information to market to you ● sharing for nonaffiliates to market to you State laws and individual companies may give you additional rights to limit sharing. |
| Definitions |
| Affiliates | Companies related by common ownership or control. They can be financial and nonfinancial companies. ● Northern Lights Fund Trust II has no affiliates. |
| Nonaffiliates | Companies not related by common ownership or control. They can be financial and nonfinancial companies. ● NLFT II does not share with nonaffiliates so they can market to you. |
| Joint marketing | A formal agreement between nonaffiliated financial companies that together market financial products and services to you. ● Our joint marketing partners include other financial service companies. |
PROXY VOTING POLICY
Information regarding how the Funds voted proxies relating to portfolio securities for the most recent twelve month period ended June 30 as well as a description of the policies and procedures that the Funds use to determine how to vote proxies is available without charge, upon request, by calling 1-855-873-3837 or by referring to the Securities and Exchange Commission’s (“SEC”) website at http://www.sec.gov.
PORTFOLIO HOLDINGS
Funds file a complete schedule of portfolio holdings with the Securities and Exchange Commission (the “SEC”) for the first and third quarters of each fiscal year as an exhibit to its reports on Form N-PORT, within sixty days after the end of the period. Form N-PORT reports are available at the SEC’s website at www.sec.gov.
| INVESTMENT ADVISER |
| Innealta Capital, LLC |
| 13215 Bee Cave Pkwy, Bldg A, Suite 240 |
| Austin, Texas 78738 |
| |
| ADMINISTRATOR |
| Gemini Fund Services, LLC |
| 4221 North 203rd Street, Suite 100 |
| Elkhorn, Nebraska 68022 |
| |
| Acclivity-AR-20 |
Item 2. Code of Ethics.
(a) As of the end of the period covered by this report, the registrant has adopted a code of ethics that applies to the registrant's principal executive officer, principal financial officer, principal accounting officer or controller, or persons performing similar functions, regardless of whether these individuals are employed by the registrant or a third party.
(b) For purposes of this item, “code of ethics” means written standards that are reasonably designed to deter wrongdoing and to promote:
| (1) | Honest and ethical conduct, including the ethical handling of actual or apparent conflicts of interest between personal and professional relationships; |
| (2) | Full, fair, accurate, timely, and understandable disclosure in reports and documents that a registrant files with, or submits to, the Commission and in other public communications made by the registrant; |
(3) Compliance with applicable governmental laws, rules, and regulations;
| (4) | The prompt internal reporting of violations of the code to an appropriate person or persons identified in the code; and |
(5) Accountability for adherence to the code.
(c) Amendments: During the period covered by the report, there have not been any amendments to the provisions of the code of ethics.
(d) Waivers: During the period covered by the report, the registrant has not granted any express or implicit waivers from the provisions of the code of ethics.
(e) The Code of Ethics is not posted on Registrant’ website.
(f) A copy of the Code of Ethics is attached as an exhibit.
Item 3. Audit Committee Financial Expert.
(a)(1)ii The board of directors of the fund has determined that the fund does not have an audit committee financial expert serving on its audit committee.
(a)(2) Not applicable.
(a)(3) In this regard, no member of the audit committee was identified as having all of the required technical attributes identified in instruction 2 (b) to item 3 of Form N-CSR to qualify as an “audit committee financial expert,” whether through the type of specialized education or experience required by that instruction. At this time, the board believes the experience provided by each member of the audit committee collectively offers the fund adequate oversight by its audit committee given the fund’s level of financial complexity. The board will from time to time reexamine such belief.
Item 4. Principal Accountant Fees and Services.
2020 - $22,000
2019 - $10,000
2020 - None
2019 - None
2020 - $4,400
2019 - $2,200
Preparation of Federal & State income tax returns, assistance with calculation of required income, capital gain and excise distributions and preparation of Federal excise tax returns.
2020 - None
2019 - None
| (e) | (1) Audit Committee’s Pre-Approval Policies |
The registrant’s Audit Committee is required to pre-approve all audit services and, when appropriate, any non-audit services (including audit-related, tax and all other services) to the registrant. The registrant’s Audit Committee also is required to pre-approve, when appropriate, any non-audit services (including audit-related, tax and all other services) to its adviser, or any entity controlling, controlled by or under common control with the adviser that provides ongoing services to the registrant, to the extent that the services may be determined to have an impact on the operations or financial reporting of the registrant. Services are reviewed on an engagement by engagement basis by the Audit Committee.
| (2) | Percentages of Services Approved by the Audit Committee |
| | | 2020 | | 2019 |
| Audit-Related Fees: | | | 0.00 | % | | | 0.00 | % |
| Tax Fees: | | | 0.00 | % | | | 0.00 | % |
| All Other Fees: | | | 0.00 | % | | | 0.00 | % |
| (f) | During the audit of registrant's financial statements for the most recent fiscal year, less than 50 percent of the hours expended on the principal accountant's engagement were attributed to work performed by persons other than the principal accountant's full-time, permanent employees. |
| (g) | The aggregate non-audit fees billed by the registrant's accountant for services rendered to the registrant, and rendered to the registrant's investment adviser (not including any sub-adviser whose role is primarily portfolio management and is subcontracted with or overseen by another investment adviser), and any entity controlling, controlled by, or under common control with the adviser that provides ongoing services to the registrant: |
2020 - $4,400
2019 - $2,200
(h) The registrant's audit committee has considered whether the provision of non-audit services to the registrant's investment adviser (not including any sub-adviser whose role is primarily portfolio management and is subcontracted with or overseen by another investment adviser), and any entity controlling, controlled by, or under common control with the investment adviser that provides ongoing services to the registrant, that were not pre-approved pursuant to paragraph (c)(7)(ii) of Rule 2-01 of Regulation S-X, is compatible with maintaining the principal accountant's independence.
Item 5. Audit Committee of Listed Companies. Not applicable to open-end investment companies.
Item 6. Schedule of Investments. See Item 1.
Item 7. Disclosure of Proxy Voting Policies and Procedures for Closed-End Funds. Not applicable to open-end investment companies.
Item 8. Portfolio Managers of Closed-End Management Investment Companies. Not applicable to open-end investment companies.
Item 9. Purchases of Equity Securities by Closed-End Funds. Not applicable to open-end investment companies.
Item 10. Submission of Matters to a Vote of Security Holders. None
Item 11. Controls and Procedures.
(a) Based on an evaluation of the Registrant’s disclosure controls and procedures as of a date within 90 days of filing date of this Form N-CSR, the principal executive officer and principal financial officer of the Registrant have concluded that the disclosure controls and procedures of the Registrant are reasonably designed to ensure that the information required in filings on Form N-CSR is recorded, processed, summarized, and reported by the filing date, including that information required to be disclosed is accumulated and communicated to the Registrant’s management, including the Registrant’s principal executive officer and principal financial officer, as appropriate to allow timely decisions regarding required disclosure.
(b) There were no significant changes in the Registrant’s internal control over financial reporting that occurred during the Registrant’s last fiscal half-year that have materially affected, or are reasonably likely to materially affect, the Registrant’s internal control over financial reporting.
Item 12. Disclosure of Securities Lending Activities for Closed-End Management Investment Companies. Not applicable to open-end investment companies.
Item 13. Exhibits.
(a)(1) Code of Ethics herewith.
(a)(2) Certifications required by Section 302 of the Sarbanes-Oxley Act of 2002 (and Item 11(a)(2) of Form N-CSR) are filed herewith.
(a)(3) Not applicable for open-end investment companies.
(b) Certifications required by Section 906 of the Sarbanes-Oxley Act of 2002 (and Item 11(b) of Form N-CSR) are filed herewith.
SIGNATURES
Pursuant to the requirements of the Securities Exchange Act of 1934 and the Investment Company Act of 1940, the registrant has duly caused this report to be signed on its behalf by the undersigned, thereunto duly authorized.
(Registrant) Northern Lights Fund Trust II
By (Signature and Title)
/s/ Kevin E. Wolf
Kevin E. Wolf, Principal Executive Officer/President
Date 3/9/21
Pursuant to the requirements of the Securities Exchange Act of 1934 and the Investment Company Act of 1940, this report has been signed below by the following persons on behalf of the registrant and in the capacities and on the dates indicated.
By (Signature and Title)
/s/ Kevin E. Wolf
Kevin E. Wolf, Principal Executive Officer/President
Date 3/9/21
By (Signature and Title)
/s/ Erik Naviloff
Erik Naviloff, Principal Financial Officer/Treasurer
Date 3/9/21