united states
securities and exchange commission
washington, d.c. 20549
form n-csr
certified shareholder report of registered management
investment companies
Investment Company Act file number 811-22549
Northern Lights Fund Trust II
(Exact name of registrant as specified in charter)
4221 North 203rd Street, Ste 100, Elkhorn, Nebraska 68022 _______
(Address of principal executive offices) (Zip code)
Rich Malinowski, Gemini Fund Services, LLC.
80 Arkay Drive, Hauppauge, NY 11788
(Name and address of agent for service)
Registrant's telephone number, including area code: 631-470-2734
Date of fiscal year end: 3/31
Date of reporting period: 3/31/21
Item 1. Reports to Stockholders.

TWO OAKS DIVERSIFIED
GROWTH AND INCOME FUND
Annual Report
March 31, 2021
The Two Oaks Diversified Growth and Income Fund March 31, 2021
Dear Fellow Shareholders of The Two Oaks Diversified Growth and Income Fund, it has been over fifteen years since we took over the portfolio management of the Montecito Fund on November 1, 2005. The Fund we inherited started operations on April 15, 2002 and has a publishable track record back to this date. However, the current management and investment disciplines have been in place since November 1, 2005. We are pleased that we now have a publishable 15-year track record for the Fund that shows the results of our investment philosophy. On November 1, 2005 the Net Asset Value of the Fund was $10.09 per share. Since November 1, 2005, there have been $6.4868 in Class A distributions per share and the Net Asset Value per Class A share was $15.82 as of March 31, 2021. This has resulted in a total positive return of $12.2168 per share since November 1, 2005. As of the end of March, the portfolio was invested 61.07% in Equities, 24.17% in Real Estate and Asset Based Securities, 10.10% in Fixed Income and 4.66% in Cash. The benchmark selected for our Fund is a blend of 60% Standard and Poor’s 500 and 40% Bloomberg Barclay’s U.S. Aggregate Bond Index. From November 1, 2005 until March 31, 2021, this index showed a cumulative rate of return of 233.95% and an Average Annual Return of 8.14%. During this same time frame our Fund at Net Asset Value showed a cumulative rate of return of 176.99% and an Average Annual Return of 6.83%. For the year ended March 31, 2021, our Class A shares appreciated by 47.57% versus a 31.71% for the benchmark. Trailing 1 year returns can be attributed to a sharp recovery in equity and real estate values as COVID-19 restrictions gradually eased and sentiment vastly improved.
The performance data quoted here represents past performance. Current performance may be lower or higher than the performance data quoted above. Investment return and principal value will fluctuate, so that shares, when redeemed, may be worth more or less than their original cost. Past performance is no guarantee of future results. A Fund’s performance, especially for very short periods of time, should not be the sole factor in making your investment decisions. For performance information current to the most recent month-end, please call 888.806.8633.
MARKET THOUGHTS
THE PAST & PRESENT
Last year, we highlighted the long-term movements in the stock market in our main message titled “Muck and Up”. When looking beyond the short-term, a consistent pattern emerged. The US stock market has gone through decade-long periods of what we refer to as “Muck”, followed by decade-long periods of “Up”. The “Muck” is nasty, characterized by extreme volatility with some of the worst market declines ever witnessed. Not only are the declines severe but they take a long time to recover from. “Up” periods are good – really good. The market has increased anywhere from 5 to 14 times in value. Last year we predicted that we were exiting a period of “Muck” and entering a new period of “Up”. With the awfulness of 2020, you might think we would backtrack on this prediction that we’re entering a period where the market could potentially increase in value by many multiples. However, we are sticking to our call for several reasons:
| ● | An entire generation has endured numerous, horrendously bad markets highlighted by the dot-com crash, Great Recession, and now 2020. That’s right – this recent period of “Muck” has been historically bad, being the only other period along with the Great Depression to have 2 greater than 50% peak to trough declines in market history. Remember, in March of 2020 the market |
2346-NLD-5/6/2021
| | was only 40% higher than where it was 20 years ago – this works out to an annualized growth rate of under 2% which is woefully bad. |
| ● | The past 20 years of “Muck” has engrained worry, fear, and doubt towards investing in stocks. Many investors are now conditioned to expect the worst. This has filled the market with doubters saddled with a short-term mindset focused on profit-taking and crash avoidance as opposed to long-term wealth-building. |
| ● | The final, missing ingredient to our “Up” call is now in place. The general public is once again coming around to viewing the stock market as a great way to build wealth. This has largely been missing over the past 20 years. As a matter of fact, for much of the past 2 decades we believe the stock market was viewed in a negative light, too scary for most, and lacking significant enough returns to justify the risk. |
The negative recency bias built over the past 2 decades was gradually eroding as we moved further and further away from the dot-com crash and Great Recession. 2020 jeopardized this progress as the world was slammed by COVID and the largest economic decline in history. At the beginning of COVID lock- downs, it looked like more of the same. A huge market drop, millions unemployed, and rampant panic and fear. Hedge fund manager Bill Ackman famously went on CNBC and proclaimed “HELL IS COMING.” We saw negative yields on US treasury debt and people more than willing to lock in that known loss for fear the future held much worse in store. But then, something happened. The world pivoted like very few expected. A vast majority of businesses transitioned to a remote environment as did education. The majority of consumption shifted online. People accepted our new, temporary, way of life and largely made it work. It may sound outlandish, but we don’t think it’s too crazy to say that the technology of today saved a lot of lives. Certainly, the ability to work from anywhere had to have an impact on the spread of COVID. The ability for this pivot to take place would not have been possible just a few decades ago – heck, we would have been lucky to be able to pull this off just 10 years ago. The bright spot of 2020 might just be how quickly human ingenuity gave us an option during COVID.
Our historic economic decline was quickly met with a historic economic recovery. In the depths of March, virtually every financial journalist and market pro on CNBC was painting a picture of doom, gloom, and advice to not act too quickly and exercise patience. Only the rare contrarian was calling this one of the great buying opportunities of a lifetime. Unfortunately, those that hunkered down, acted defensively, or worse yet panicked and sold, largely missed the fastest recovery from a bear market in history and the subsequent gains the market produced as the year progressed. 2020 was another example of why it’s next-to-impossible to time the market.
WE’RE WITNESSING A NEW MINDSET AND NEW TALENT PULSE THROUGH THE MARKET
In our opinion, 2020 ignited two significant themes that will drive our “Up” forecast for market returns over this next decade:
The return of the retail investor is proof of a new mindset towards stocks - empowered with tools such as Robinhood, individual investors stepped into the market during the March sell-off and bought stocks. They bought companies they know, believe in, enjoy, and do better for the world at large. The retail in-
2346-NLD-5/6/2021
vestor acted with a level of interest for stocks never displayed by this younger generation until now. The exceptionally entertaining Jim Cramer said it best just a few months ago:
“I think it’s time to stop disrespecting the younger investors who’ve nailed 2020 every step of the way and start taking them seriously. We’ve got a massive group of individual investors who’ve become in many ways a more powerful collective force than the professionals, and they simply don’t care about the same things as the experts. The return of individual investors has changed the entire character of the market. They only care about who’s doing what’s right and who’s doing what’s wrong. If they buy a stock that turns out wrong, they can always trade out of it for free because there are no commissions. This pandemic has become the ultimate changing of the guard, but you might have missed it if you’re not as plugged in to what’s happening with the younger generation.”
These market newcomers are displaying some key characteristics that differ from recent memory:
| ● | They prefer to own individual stocks versus index funds |
| ● | They make independent investment choices |
| ● | They have a willingness to take on risk in a bear market |
| ● | A strong belief in environmental, social and corporate governance, or ESG, investing |
This new group of investors will make plenty of mistakes. However, we remind our readers that anyone proclaiming to have never made a bad investment decision is lying to you. Not even the legends of in- vesting bat one thousand. The perspective that it’s a good thing to invest in stocks is finally back. The belief that you can make significant amounts of money in the stock market is back. THIS IS WONDERFUL!
A new mindset about coming public has opened the floodgates for new companies to invest in – We wrote in a previous letter about the problem with short-termism dominating the market. We cited evidence from the likes of Jamie Dimon, Warren Buffet, Elon Musk, and a study showing how the public markets have become unfriendly to younger, smaller companies. The US market had actually become a vehicle that on a net basis was returning capital to shareholders as opposed to raising capital for companies. This structural problem with the workings of our public market was a true long-term fear of ours giving us much greater cause for concern than any temporary market crash. We feared this would lead the US market to turn into the land of boring, predictable, and slow growth. We believe our fears were justified when you consider that the 1990s saw 5,724 companies come public, which was 34% higher than the decades of the 2000s and 2010s combined! Fortunately, this is starting to reverse. We’re not sure if there’s an exact inflection point, but we do believe Tesla achieving consistent profitability served as a catalyst for many companies to no longer live in fear from the scrutiny of the public markets. There is now a wave of new companies opting to come public, taking advantage of our robust capital markets, and fueling their vision for the future with significant capital raises. Not all of these companies will thrive. There will be some failures. However, we do not anticipate another dot-com bust anytime soon based on the following:
| ● | Dot-com boom was rather narrow in scope - It was led by the buildout of physical infrastructure allowing the internet to blossom. In the 5 years after the Telecommunications Act of 1996 |
2346-NLD-5/6/2021
| | passed, companies invested more than $500 billion, mostly financed with debt, in laying fiber optic cable, adding switches, and building wireless networks. The growth in capacity vastly out- stripped the growth in demand. Today, we’re not led by just one technological advancement and we’re not building out any type of excess capacity. We’re seeing massive technological advancement from investment cycles that have been happening for a decade. This is leading to rapid innovation in everything from healthcare to plant-based meats, from battery technology to the reusability of rockets, from predicting fashion styles to the shape of various proteins found in nature. The dot-com era was just that – an era. It largely marked the birth of the internet. We do not believe you will be able to mark this as an era – we believe it will be a revolution. Like the agricultural revolution and industrial revolutions, this digital revolution will change our lives like never before. The difference is, it’s just getting started – not ending. |
| ● | We have private markets acting as a buffer against the really bad companies – The dot-com era was not one where companies were afforded the luxury of raising significant amounts of private capital, work out their kinks away from the scrutiny of the public market, and come public when they chose to. The dot-com era lacked significant institutional investor allocations to “alternative” asset classes such as venture capital, private equity, real estate, & hedge funds as we had not yet experienced the two crashes of the 2000’s and fixed income still offered a decent yield. Today’s robust private markets are filtering out a lot of the lower quality companies before they even get the opportunity to come public. The result has been far more developed and higher quality companies entering the public market today. While this does take away some of the big wealth creation potential from finding these exciting companies early, it has also resulted in the public markets consisting of a lot more quality businesses than you might expect. |
| ● | Interest rate environment - In the late 1990’s you had the 10 year US treasury yield 6% - there was a viable alternative. This does not exist today. |
| ● | Dot-com bust marked the end of an “Up” move, not the beginning - After nearly 2 decades of the market appreciating by almost 14 times in value, investors had been through the strongest “Up” period in market history. The top was marked by massive signs of excess including outright frauds from major companies like WorldCom, Enron, Adelphia, C-suite execs like the team at Tyco taking out multi-million dollar interest-free loans they never repaid, analysts trashing their own recommendations behind the scenes at major investment firms, and hundreds of dot-com companies imploding as they had no viable business plans. Investor sentiment had peaked after this monumental, two-decade run. We believe it is going to take a lot longer than 12 months to get to a point where we can say investor sentiment has tired, markets have peaked, and behavior has become euphoric. |
We are not saying this market is without speculative pockets – it certainly is. Anytime you see several companies post triple-digit percentage gains for one day, let alone one year, you can be assured there is some speculation taking place. However, these euphoric moves are not taking place across the entire market. They are limited to certain areas or companies that the market is really excited about. The key to success will be sorting through the companies that merely possess potential versus those with the ability to turn potential into reality. The ability to analyze competitive advantages will be key.
2346-NLD-5/6/2021
A new generation of investing gurus are being crowned today – Today, we’re seeing bright investment minds in numerous areas of the market. Some leading SPACs, some in venture capital world, but all with a plaform to promote like no other time in history. Millions of twitter followers, millions of podcast subscribers, all about how they found great ideas, what they look to identify in phenomenal companies, and what characteristics great business leaders of today possess. This is a changing of the guard. For much of the past two decades, hedge fund managers ruled supreme. They were viewed as investment gods, betting against the status quo, and making a fortune when something fell apart. If you’re a believer in mean reversion then we believe this will be one of the biggest mean reversions from market pessimism to market optimism in history. This generation’s Warren Buffett, Carl Icahn, & Peter Lynch are going to be heralded for their early investments in leading companies of this next generation, not for calling the next great collapse.
What does it all mean? - All of this points to a future for stocks that we believe will differ dramatically from the past. A generational shift, led by a great reset of thought in regards to where we work, what is truly important in life, and what we can accomplish going forward. This is not a comparatively minor change to tax rates, health care, or social security benefits. This is far, far more lasting change that will reshape beliefs about the employee-employer relationship, big city life, customer experiences, and our work-life balance as connectivity enables us to be productive from anywhere in the world. This has sparked a renewed sense of optimism that we see growing throughout this decade into what we’re calling THE ROARING 2.0’S.
THE FUTURE – WELCOME TO THE ROARING 2.0’S
Making comparisons to a period from a century ago will not necessarily be apples to apples but there are certainly similarities. Let’s take a look at some of the characteristics that drove the 1920s, which was a decade of massive change, and illustrate why we believe a similar decade could be in store.
Innovation flourished. The 1920s saw Americans owning cars, radios, and telephones for the first time ever. While Americans still own cars, radios, and telephones the devices of today might as well be considered a new invention.
CARS
“It is only a question of a short time when the carriages and trucks of every large city will be run by motors. The expense of keeping and feeding horses in a great city like New York is very heavy, and all this will be done away with. You must remember that every invention of this kind which is made adds to the general wealth by introducing a new system of greater economy of force. A great invention which facilitates commerce, enriches a country just as much as the discovery of vast hoards of gold.” – Thomas Edison - New York World interview - November 17, 1895
2346-NLD-5/6/2021
 |  |
Transportation is on the cusp of a revolution. In the Roaring 2.0’s we will see vehicles that are powered by electricity, have the ability to handle the majority of driving themselves, and become the ultimate mobile device. They can act as a large, distributed, mobile data center, capturing real-time information from across the globe. As they become a far simpler machine to manufacture, the entire sales process and dealership model will become unnecessary. Car owners may be presented with the intriguing proposition of allowing their vehicle to operate in a ride-sharing fleet, allowing the owner to earn an in- come to help offset the cost of the vehicle. Should this happen, we could witness the entire equation of car ownership flipped upside down. As vehicles become assets, producing a net positive value for their owner, the thought of owning a “dumb” car will be like owning a horse and buggy just over a century ago. With costs plummeting, battery life improving, impeccable performance, and minimal maintenance, you can see why we believe the experience of owning a car will be dramatically improved. The days of cars being a huge liability, depreciating throughout their useful life, and costing owners thou- sands of dollars in maintenance and numerous hours in lost time are numbered. The Roaring 2.0s will see Transportation as a Service {TaaS) fully blossom. This is revolutionary.
PHONES
Phones of today are no longer tethered to a physical location, instead, they reside in the hand of virtually everyone on the planet. They have become the remote controls for life. Their powerful processing power {current smartphones have about 100,000 times the processing power as the computers that helped mankind reach the moon), stunning visual displays, and immense capabilities have made them nearly essential for all generations. The creation of the smartphone allowed for an entirely new segment
2346-NLD-5/6/2021
of the economy to form. Developers were free to use the capabilities of the device to put movies, games, friends and family, communication, work, banking, investments, news, memories, and much more right in the palm of our hand. Oddly enough, the phone app on most smartphones is probably the least used app on the device. The Roaring 2.0s will see the rollout of the 5G network across our country and much of the world. This will bring an increase in speed of about 10 times what we’re currently used to. The first generation network brought us voice, the second was data, the third was basic mobile computing, and the current, fourth generation, has speeds that allow for the app-based economy to flourish. 5G speed will allow augmented reality, advanced robotics, and connected devices to boom. Imagine being able to see that new couch right in your living room, see how that shirt would look on you before you buy it, track biometric data as your work out, or check out advanced statistics about your favorite sporting event as you watch it live. With 5G’s higher throughput and lower latency we will see the rise of advanced robotics that can become a valuable input in advanced manufacturing operations. 5G will see a boom in connected devices as virtually all aspects of an operation can be made smart, communicate with one another, and make adjustments accordingly.
RADIO / TELEVISION
 |  |
The days of waiting for the Sunday paper to grab the weekly TV Guide are long gone. Television and Radio have both moved to on-demand. It’s no longer tune in when you can, it’s tune in when you want. Neflix pioneered streaming and has forced the entire industry to adapt, finally breaking the shackles of the channel packages. This has given consumers the choice to pay for content they actually want to watch. Radio has also migrated to streaming plans giving you access to virtually any song ever created. Further, podcasts have created an entirely new genre of information and entertainment. As of this year, Apple now hosts 1.68 million podcasts with nearly 42 million episodes on their plaform. Over 55% of the US population has now listened to at least one podcast. On-demand, streaming channels like pod- casts and YouTube, have given the entire world a voice and provided a means to monetize their content. It is truly amazing from both a creator and consumer standpoint. We are witnessing a massive democratization of knowledge spread across the world on a scale never witnessed before in human history.
2346-NLD-5/6/2021
FLIGHT
 |  |
Up until the 1920s only a handful of daredevils had flown. In 1924 eight US Army Air Service pilots circumnavigated the world for the first time, just 21 years after the Wright Bros. first flight. By 1925 the US Postal Service had delivered 14 million letters and packages via airplanes and were maintaining regular flight schedules. In 2019, US airlines carried 925.5 million passengers illustrating just how common commercial flight has become. This decade, the public will be introduced to space flight. The reusability of rockets has dramatically cut the cost of a launch {could you imagine the cost of flying in an airplane if they were all single-use machines) and will eventually make it affordable for all. Space X continues to cut their own launch cost estimates and believes they can reach a price below $30 million, whereas the United Launch Alliance {consisting of Boeing and Lockheed-Martin) have charged nearly $150 million in recent history. This will have a profound impact on all of humanity. Mankind has known one home for all of our existence. The Roaring 2.0s will most likely see this change. We envision many firsts this decade when it comes to space. The first civilians taking a trip around the moon, the first lunar base established, and the first humans to set foot on Mars. We believe this could be one of the most unifying events in human history as the world comes together to celebrate mankind’s accomplishment and spark an entirely new space economy.
MANPOWER TO MACHINE POWER
The 1920s saw mass manufacturing excel. Innovation, led by the likes of Henry Ford, dramatically cut manufacturing time and cost. In 1910, the Model T cost approximately $900 and Ford produced 19,000 of them. By 1923 the cost had plummeted to $360 and they produced over 2 million of them. Blending manpower with innovation led to a boom in producing standardized goods, with new offerings of sizes and styles, all at affordable prices. While this boom was indeed revolutionary, it will look exceptionally
2346-NLD-5/6/2021
crude compared to the advancement that will take place throughout this decade. The Roaring 2.0s will see two technologies evolve to become primary labor inputs – advanced robotics and artificial intelligence. We believe they will lead to productivity enhancements like never before. While robotics have been utilized for decades, they were limited to performing repetitive tasks that their engineers programmed them for. AI will bring advancements in:
| ● | Machine Vision – will vastly improve depth and image recognition |
| ● | Scalability – machine learning will allow robots to handle new parts of a manufacturing process without needing to be reprogrammed, as these programs are typically cloud- based, learnings of one robot can be applied to an entire army of robots |
| ● | Intelligent Placement – the ability to carefully and neatly handle delicate items |
Machines will continue to be able to handle more and more tasks previously only thought possible to be done by humans. We think the Roaring 2.0s will not only see this in industrial settings, but also see more and more consumer-focused solutions become common in households throughout the country.
Optimism grew. The 1920s was a decade of optimism for many reasons, not least of which was the end of World War I. While we’ve been fortunate to be living through one of the longest peace times in global history we do believe COVID-19 has taught us many lessons about what is truly valuable in life – similar to perspectives gained from previous conflicts. We are definitely not comparing what we’ve experienced with COVID to the horrendousness of actual war. Merely the appreciation we’ve recognized when certain freedoms are impacted. Time with family and friends, work-life balance, and a deeper sense of appreciation are being recognized across the world right now. As extraordinary work has been done on the vaccine front we believe there is a pent-up global demand wave about to be unleashed throughout this decade as the world now has a deeper value for what is truly important in life.
We believe 2020 will mark a peak in pessimism for the foreseeable future. A major driver of renewed optimism will be led by a refreshed sense of what capitalism can accomplish. Overlooked amongst the chaos of 2020 was the fact that America largely voted against a meaningful shift towards socialism. However, this does not mean that the voices in favor of a more socialist agenda were not heard. Issues related to homelessness, affordability of housing, rampant drug use, significant wage gaps, student debt, and high unemployment are real. In some respects, you can’t blame those that feel the American Dream is not achievable for them after having witnessed their parents’ retirement savings decimated in the Great Recession and their inability to find a job after borrowing thousands of dollars for an “education”. However, as referenced in our recent commentary, we are a country that airs our dirty laundry. While this can cause discomfort, in the end, our issues tend to get dealt with. Business leaders are listening and recognize something needs to be done. They are using their position of influence as a plaform to deliver change. Interestingly enough, we believe an innovation of capitalism will be what solves the problems some have raised with capitalism.
A NEW ERA FOR THE PURPOSE OF A CORPORATION, FOCUSED ON THE LONG-TERM, WILL DRIVE THE
ROARING 2.0’S - What might have gone largely unnoticed and probably didn’t receive the media atten-
2346-NLD-5/6/2021
tion it deserved was the August 2019 Business Roundtable meeting in which 181 CEO’s signed on to a refreshed vision for what the purpose of a corporation is:
Americans deserve an economy that allows each person to succeed through hard work and creativity and to lead a life of meaning and dignity. We believe the free-market system is the best means of generating good jobs, a strong and sustainable economy, innovation, a healthy environment and economic opportunity for all. Businesses play a vital role in the economy by creating jobs, fostering innovation and providing essential goods and services. Businesses make and sell consumer products; manufacture equipment and vehicles; support the national defense; grow and produce food; provide health care; generate and deliver energy; and offer financial, communications and other services that underpin economic growth. While each of our individual companies serves its own corporate purpose, we share a fundamental commitment to all of our stakeholders. We commit to:
| ● | Delivering value to our customers. We will further the tradition of American companies leading the way in meeting or exceeding customer expectations. |
| ● | Investing in our employees. This starts with compensating them fairly and providing important benefits. It also includes supporting them through training and education that help develop new skills for a rapidly changing world. We foster diversity and inclusion, dignity and respect. |
| ● | Dealing fairly and ethically with our suppliers. We are dedicated to serving as good partners to the other companies, large and small, that help us meet our missions. |
| ● | Supporting the communities in which we work. We respect the people in our communities and protect the environment by embracing sustainable practices across our businesses. |
| ● | Generating long-term value for shareholders, who provide the capital that allows companies to invest, grow and innovate. We are committed to transparency and effective engagement with shareholders. |
Each of our stakeholders is essential. We commit to deliver value to all of them, for the future success of our companies, our communities and our country.
This new perspective, that a corporation is responsible to not just their shareholders, but to their customers, employees, suppliers, and their communities, is a far broader scope of what the future of capitalism will aim to achieve. Business leaders are now taking an active role in not just bettering the lives of their employees, but also the lives of those they work with, and members of the communities in which they operate. They’ve had enough with inefficient government programs that are big on promises but small on results. Having some of our brightest minds engaged in solving complex, societal problems will be a good thing over the long-run.
EMBRACING THE LONG-TERM – Another event that did not receive much attention or media coverage was the recent launch of the Long Term Stock Exchange. The new exchange has a set of differentiated listing standards designed to create lasting value for modern, public companies and their like-minded investors. The standards were developed through years of discussion with founders, executives, investors, policymakers, regulators, academics, trade organizations, and others with valuable perspectives on the public markets. The standards are part of a broader ecosystem designed to promote sustainability, resilience, long-term value creation, and systemic change. These standards require companies listed on the Long-Term Stock Exchange to adopt and publish five policies regarding the following topics:
| ● | Long-Term Stakeholders – should consider a broader group of stakeholders and the critical role they play in one another’s success just like the Business Roundtable espoused |
| ● | Strategy – companies should commit to measuring success in years and decades and prioritize long-term decision-making |
| ● | Board of Directors – should be engaged in and have explicit oversight of long-term strategy |
2346-NLD-5/6/2021
| ● | Compensation – should align executive compensation and board compensation with long-term performance |
| ● | Investors – should engage with their long-term shareholders |
Adopting these policies means embracing obligations to do right by all key stakeholders {employees, customers, suppliers, communities, and long-term shareholders). Companies might ask why they would want to hold themselves to these higher standards. Fortunately, there’s broad empirical evidence linking stakeholder-focused behavior to superior financial and operational performance across multiple dimensions:
| ● | Companies accrue important intangible resources such as legitimacy, reputation, and trust, which can lead to a sustainable competitive advantage |
| ● | Companies attract a higher-quality workforce, foster employee commitment to organizational values and practices, and retain talented employees |
| ● | Companies attract and retain customers, build brand loyalty, and stronger brand recognition |
| ● | Increasingly, customers are taking into account a company’s impact on society, the environment, and their community when they make purchasing decisions. Brands can be severely damaged by actions that consumers view as unacceptable |
| ● | Improved environmental performance and risk management led to reductions in firms’ costs of capital |
We’re intrigued by the ability to directly measure returns of companies that will commit to the standards of the Long-Term Stock Exchange. They should be companies that care far more about investing in the future than in cutting corners or engaging in financial gymnastics to meet quarterly targets. They will support boards and executives in making the hard choices that are right for the long-term, even if they are harder in the short-term.
CAPITALISM 2.0 IS HERE AND IT WILL ALLOW MORE PEOPLE THAN EVER TO CONTROL THEIR OWN DESTINY
“Prior to capitalism, the way people amassed great wealth was by looting, plundering, and enslaving their fellow man. Capitalism made it possible to become wealthy by serving your fellow man.” - Walter Williams – American Economist
COVID-19 has led to many surprises. One we find astonishing is the generational surge in new business applications.
2346-NLD-5/6/2021
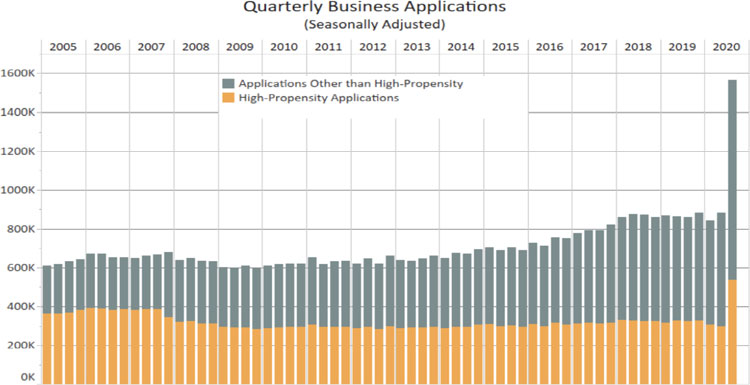
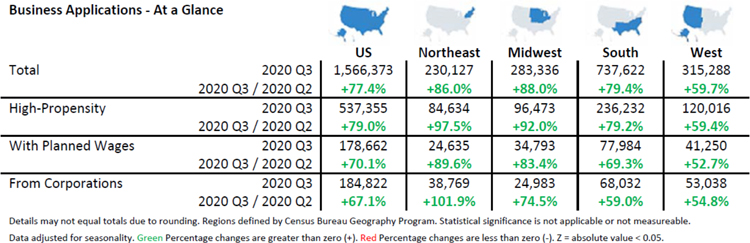
It is possible, some of the surge was from people trying to claim stimulus funds and a backlog of built-up, unprocessed applications. Nonetheless, we believe it reflects a genuine rise in American entrepreneur- ship. By contrast, the Great Recession saw a sharp decline in the number of business applications. Further, over the past four decades the rate of new-business creation had been drifting downwards {re- searchers pointed to declining population growth as one cause, as well as the growing power of large firms, which may have dissuaded new ones from entering the market). The fact that America has suddenly recovered its entrepreneurial spirit is particularly intriguing, since nothing comparable seems to be happening elsewhere in the developed world.
In Berkshire Hathaway’s 2018 shareholder letter Warren Buffet wrote about the “American Tailwind”. He imagined life in America in 1788 when there wasn’t much here except for a small band of ambitious people and an embryonic governing framework aimed at turning their dreams into reality. He notes, from that date forward, America endured a Civil War, Great Depression, growing budget deficits, bipartisan politics, viral inflation, paralyzing financial panic, and a host of other problems. Despite this, investing in the mettle of American business had no peer. We believe this Tailwind is setting the stage for its next wave of acceleration. Just over 10 years ago, in the depths of the Great Recession, entrepreneurs created Airbnb, Groupon, WhatsApp, Uber, Slack, Venmo, Square, & Bitcoin. Today’s entrepreneurs have access to an unprecedented entrepreneurial toolbox full of financial and human capital, subscription- based productivity tools, the ability to outsource non-core functions of their business, and an archive of
2346-NLD-5/6/2021
human knowledge. We have no doubt that numerous, leading companies of the future, will mark 2020 as their birth year.
WHILE EASY TO GET CAUGHT UP IN WORRIES OF TODAY, WE MUST LOOK FORWARD
The American Tailwind is alive and well. The world is going through a great reset. We are asking questions like never before about how we want life to look going forward. While it’s easy to get caught up in doom and gloom, perspective is very important to keep in mind. Much of the world still recognizes what can be accomplished in America. Chamath Palihapitiya, a rising star in today’s investing landscape, was recently asked about a New York Times article titled “The Rich Kids That Want To Tear Down Capitalism”. His response provides a perspective that we should all keep in mind. Before he immigrated from Sri Lanka he told of not having access to toilet paper, brushing his teeth with coal, and walking to a well for water. He merely wanted the chance to run the race and was constantly told by those born into power that he couldn’t.
Despite political division, social injustice, a wealth gap, and numerous other concerns, it’s important to remember that mankind has never been in such an amazing place. Life expectancy and literacy rates are at all-time highs, infant mortality has plummeted, famine has largely been eradicated, and billions of people have risen from poverty. People are aware of their impact on the environment like never before and are creating new, better solutions to tackle climate change, pollution, and the preservation of our natural resources.
INVESTING IN DISRUPTIVE INNOVATION WILL BE ESSENTIAL
The Roaring 2.0s will see old replaced by new, slow replaced by fast, and inefficient replaced by efficient. Companies will be forced to examine every aspect of customer interaction to ensure their experience is enjoyable. What happens if you’re on the wrong side of this disruption and fail to adapt? Not only do you potentially miss out on tremendous gains as the world evolves, you might also destroy wealth by hanging onto those stuck in the status-quo, failing to innovate. Let’s take a look at some recent industry leaders that ignored signs of where the future was headed and fell behind, thus relinquishing market share to younger, faster, more efficient competitors.
2346-NLD-5/6/2021
| Company | Symbol | 3 year return | 5 year return | 10 year return |
| Macy's Inc | M | -54 | -70 | -52 |
| International Business Machines Corporation | IBM | -23 | -5 | -15 |
| Ford Motor Company | F | -33 | -31 | -52 |
| General Electric Company | GE | -39 | -61 | -39 |
| Exxon Mobil Corporation | XOM | -52 | -46 | -45 |
| ViacomCBS Inc. Class B | VIAC | -35 | -18 | 94 |
| Nokia Oyj Sponsored ADR | NOK | -21 | -45 | -63 |
| AVERAGE | | -37 | -39 | -25 |
| VALUE OF $1,000,000 INVESTMENT | | 631,877 | 606,074 | 753,890 |
| VALUE DESTROYED | | 368,123 | 393,926 | 246,110 |
| | | | | |
| Amazon.com, Inc. | AMZN | 165 | 436 | 1,656 |
| Tesla Inc | TSLA | 1015 | 1,536 | 12,394 |
| Netflix, Inc. | NFLX | 158 | 372 | 2,011 |
| Apple Inc. | AAPL | 203 | 450 | 1,005 |
| AVERAGE | | 385 | 699 | 4,267 |
| VALUE OF $1,000,000 INVESTMENT | | 4,850,728 | 7,985,450 | 43,666,029 |
| VALUE CREATED | | 3,850,728 | 6,985,450 | 42,666,029 |
| | | | | |
| THE POTENTIAL COST OF BEING ON THE WRONG SIDE OF CHANGE | | 4,218,851 | 7,379,376 | 42,912,139 |
SOURCE: FACTSET – TRAILING PRICE RETURNS FOR 3, 5, AND 10 YEARS ENDING 12/31/2020
In our example above, each of the young, disruptive companies has impacted and continues to impact the business of the older, slower-to-adapt, leading companies of yesterday. Amazon affecting Macy’s and IBM, Tesla affecting Ford, General Electric, and Exxon Mobil, Neflix affecting Viacom, and Apple affecting Nokia. These younger companies have not just taken market share, but have created and defined new markets allowing them to grow even more than initially thought. Of course these are four of the absolute best-performing stocks in the market over this time frame but certainly highlights the point that investors can’t afford to miss monumental change.
Looking forward, we envision these disruptors taking tremendous market share, defining new markets, and creating great wealth for true long-term investors with the ability to exercise patience. We believe Investors are going to have to become more comfortable with broad indexes being valued above historic averages. If S&P does their job correctly they will identify these companies changing the world and include them as early as possible while maintaining their index investment guidelines. In the early stages of this monumental index turnover, valuation metrics are going to shift wildly. We believe it will be in an investor’s best interest to tune out the talking heads that will call for drastic mean reversion from a price to earnings standpoint. Instead, we believe index valuations will gradually approach normalcy as these younger companies mature and maximize profits.
OUR SOLUTION – ADOPT A MINDSET BASED ON INVESTING FOR A LIFETIME, WHERE YOUR STAGE OF LIFE HELPS GUIDE ALLOCATION DECISIONS
Investors face numerous challenges today. There is little to no interest being earned on savings. Investors have been conditioned to expect the worst when it comes to investing in stocks. People have access to tools that make it easier than ever to be a trader and attempt to time the market. The days of
2346-NLD-5/6/2021
pulling money out of “risky” assets like stocks and shifting to “safe” assets like bonds are over when interest rates are around 1%. Not even tried-and-true dividend-paying stocks can be viewed as a perfect solution when business models that fail to adapt are getting left behind in a hurry. Investors need a solution that takes all this into consideration.
Fortunately, our Stage of Life investment approach is anchored in empirical evidence that shows investors will be best served by:
| ● | Acting like business owners |
| �� | Abide by a disciplined research process and make decisions like an investment committee |
| ● | Embrace those companies with potential to change the world |
| ● | Carve out a peace of mind bucket to weather the eventual market drops they will certainly have to endure |
As investors journey through life, they will make their way through an accumulation phase, a transition phase, and eventually, a distribution phase. They will go from savings assets to living off their assets. The concerns associated with no longer receiving a steady paycheck are valid. The fears over market crashes are almost constant. It takes patience to achieve success. We believe our approach will help temper these fears, keep investors on course with the long-term in mind, and in the process maximize returns.
While the world may be filled with uncertainty, our long-term investment outlook and philosophy re- mains unchanged. Owning quality businesses allows investors the ability to create wealth. Owning quality businesses allows investors the ability to produce a growing income stream, as they share in corporate profits. The key takeaway here is that in order to reap these benefits you actually have to own these businesses. While selling investments during a panic might sound like a good idea, history has proven this can only provide a temporary benefit. The comfort gained from not having to watch stock prices and account balances go down is more than offset by the lost potential of creating wealth and participating in your share of corporate profits. Investors cannot fund permanent, long-term goals with temporary, short-term benefits. There will always be events that cause fear and worry. To reiterate a recent point from our previous commentary: There has never been a ‘time in U.S. history where our markets went down and stayed down. They eventually pushed forward, making new all-‘time highs 100% of the ‘time. We’re confident patience and maintaining control of emotion will once again be re- warded. The world has advanced significantly and we believe will continue to do so.
THOUGHTS ON PORTFOLIO POSITIONING
(Past performance does not guarantee future results)
Two Oaks investment philosophy believes in diversification amongst three major asset classes: Stocks, Fixed Income, and Real Estate / Asset Based securities. During last year’s market sell-off Real Estate / Asset Based securities were hit exceptionally hard contributing to the underperformance of our Fund as it has greater exposure to this asset class. Year-to-date we’ve seen a substantial recovery in real estate indexes as well as certain commodities such as oil. Further, we’ve witnessed some market rotation out
2346-NLD-5/6/2021
of high growth and back into more traditional “value” stocks with nice dividend yields and more reasonable valuation metrics. Various asset classes will go in and out of favor over the short-term. We certainly do not advocate for taking a short-term view when it comes to investing. COVID-19 will leave a lasting impact on the world. However, we believe a sound investment philosophy can stand the test of time.
We believe investment success will be earned by focusing on long-term investment themes, unique company-specific ideas, & investing in less followed asset classes. We believe our current asset allocation & porfolio holdings reflect these points. Looking forward, we believe the greatest value & opportunities will be found by keeping the asset allocation near a maximum weighting in equities, minimum in fixed income, & looking to real estate / asset based securities to generate acceptable cash flows lacking from traditional fixed income.
CLOSING THOUGHTS
Many things have changed in the financial industry over these past years. We are realists in understanding that shareholder interests always come first. If those interests dictate it is time to step aside as portfolio managers of the fund, then we will do that. Based on our latest internal review we have determined that shareholders would benefit from being part of a larger mutual fund family that can provide lower fund expenses and the ability to exchange into other investment strategies. Further, as we are able to structure a deal as a merger it will not be a taxable event to current Two Oaks shareholders. This is very beneficial as Two Oaks shares currently trade near their highest Net Asset Value during our management tenure. After a thorough process we are pleased to share that the Two Oaks Diversified Growth and In- come Fund will merge into the North Star Opportunities Fund. We are highly confident that we have found a group of like minded professionals at North Star Investment Management in Peter, Brad, and Eric who will carry on a similar investment philosophy and seek competitive rates of return.
In anticipation of the merger being finalized, we once again reiterate that it has been our distinct honor to serve as the porfolio managers of the Two Oaks Diversified Growth and Income Fund. Thank you for entrusting us with this responsibility. It has been a true honor and privilege to manage the fund.
Sincerely,
| Blake Todd | Jarrett Perez, CFA |
| Portfolio Manager | Portfolio Manager |
2346-NLD-5/6/2021
Sources:
The material herein has been provided by Two Oaks Investment Management, LLC and is for informational purposes only.
Two Oaks Investment Management, LLC is not affiliated with Northern Lights Distributors, LLC.
Bloomberg Barclays Capital U.S. Aggregate Bond Index covers the USD-denominated, investment-grade, fixed-rate, taxable bond market of SEC-registered securities. The index includes bonds from the Treasury, Government- Related, Corporate, MBS {agency fixed-rate and hybrid ARM pass-throughs), ABS, and CMBS sectors. The U.S. Aggregate Index is a component of the U.S. Universal Index in its entirety. Fixed Income securities are subject to risks including inflationary and interest rate changes, among others.
S&P 500 Index is an unmanaged composite of 500 large capitalization companies. This index is widely used by professional investors as a performance benchmark for large-cap stocks. You cannot invest directly in an index and unmanaged index returns do not reflect any fees, expenses or sales charges.
2346-NLD-5/6/2021
Two Oaks Diversified Growth and Income Fund (Unaudited)
Growth of $10,000
Performance Summary – For Year Ended March 31, 2021

| | Annualized |
| | | | | Since Inception |
| | 1 Year | 5 Years | 10 Years | 04/15/2002 |
| Two Oaks Diversified Growth and Income Fund (1) – Class A: | | | | |
| Without Sales Charge | 47.57% | 9.70% | 7.71% | 5.65% |
| With Sales Charge (2) | 39.09% | 8.41% | 7.07% | 5.32% |
| S&P 500 | 56.35% | 16.29% | 13.91% | 9.17% |
| 60% S&P 500/40% Bloomberg Barclays U.S. Aggregate Bond | 31.71% | 11.15% | 9.87% | 7.53% |
| | | | | |
| (1) | Effective November 1, 2005, the strategy of the Two Oaks Diversified Growth and Income Fund, formerly known as the Montecito Fund changed and Blake T. Todd assumed the role of Portfolio Manager. |
| (2) | Adjusted for initial maximum sales charge of 5.75%. |
The S&P 500 is a market capitalization-weighted index of 500 widely held common stocks. The Bloomberg Barclays U.S. Aggregate Bond Index is an unmanaged market index representative of the U.S. taxable fixed income securities.
Past performance is not predictive of future results and current performance may be lower or higher than the performance data quoted. The Fund’s total annual gross operating expenses, as stated in the fee table to the Fund’s prospectus dated July 31, 2020, are 1.65% for Class A. The investment return and principal value of an investment will fluctuate. An investor’s shares, when redeemed, may be worth more or less than the original cost. The returns shown do not reflect the deduction of taxes that a shareholder would have to pay on Fund distributions or the redemption of the Fund shares. Investment performance current to the most recent month-end may be obtained by calling (888) 806-8633.
Two Oaks Diversified Growth and Income Fund
March 31, 2021 (Unaudited)
| Top 10 Holdings* (Unaudited) | | % of Net Assets | | Portfolio Composition (Unaudited) | | % of Net Assets |
| Apple, Inc. | | 6.6% | | Common Stock | | 66.2% |
| Walt Disney Co. | | 5.1% | | Real Estate Investment Trusts (REITS) | | 19.1% |
| Monmouth Real Estate Investment Corp. | | 4.8% | | Corporate Bonds | | 8.7% |
| Brookfield Infrastructure Partners, L.P. | | 4.3% | | Short-Term Investments | | 4.6% |
| T Rowe Price Group, Inc. | | 4.3% | | Preferred Stock | | 1.4% |
| Rockwell Automation, Inc. | | 4.0% | | Liabilities In Excess Of Cash And Other Assets | | 0.0% |
| FedEx Corp. | | 3.8% | | NET ASSETS | | 100.0% |
| UnitedHealth Group, Inc. | | 3.8% | | | | |
| EPR Properties | | 3.1% | | | | |
| The Scotts Miracle-Gro Co. | | 3.1% | | | | |
| * | As of March 31, 2021. Top ten holdings exclude short-term investments. |
Please refer to the Schedule of Investments in this annual report for a detailed listing of the Fund’s holdings.
| Two Oaks Diversified Growth and Income Fund | |
| SCHEDULE OF INVESTMENTS | March 31, 2021 |
| Shares | | | Security | | Fair Value | |
| | | | | COMMON STOCK - 66.2% | | | | |
| | | | | ADVERTISING & MARKETING - 0.6% | | | | |
| | 250 | | | Trade Desk, Inc. * | | $ | 162,915 | |
| | | | | | | | | |
| | | | | APPAREL & TEXTILE PRODUCTS - 1.0% | | | | |
| | 15,000 | | | Hanesbrands, Inc. | | | 295,050 | |
| | | | | | | | | |
| | | | | ASSET MANAGEMENT - 5.1% | | | | |
| | 3,083 | | | Brookfield Infrastructure Corp. | | | 235,449 | |
| | 7,500 | | | T Rowe Price Group, Inc. | | | 1,287,000 | |
| | | | | | | | 1,522,449 | |
| | | | | AUTOMOTIVE - 3.1% | | | | |
| | 1,376 | | | Tesla, Inc. * | | | 919,072 | |
| | | | | | | | | |
| | | | | BANKING - 1.5% | | | | |
| | 28,093 | | | Community West Bancshares | | | 360,714 | |
| | 234 | | | WTB Financial Corp. | | | 90,090 | |
| | | | | | | | 450,804 | |
| | | | | BEVERAGES - 1.9% | | | | |
| | 2,500 | | | Constellation Brands, Inc. | | | 570,000 | |
| | | | | | | | | |
| | | | | BIOTECH & PHARMA - 1.8% | | | | |
| | 15,000 | | | Pfizer, Inc. | | | 543,450 | |
| | | | | | | | | |
| | | | | CONSUMER SERVICES - 1.6% | | | | |
| | 9,000 | | | Service Corporation International | | | 459,450 | |
| | | | | | | | | |
| | | | | E-COMMERCE DISCRETIONARY - 1.0% | | | | |
| | 200 | | | MercadoLibre, Inc. * | | | 294,428 | |
| | | | | | | | | |
| | | | | ELECTRIC UTILITIES - 4.3% | | | | |
| | 24,000 | | | Brookfield Infrastructure Partners, L.P. | | | 1,278,000 | |
| | | | | | | | | |
| | | | | ELECTRICAL EQUIPMENT - 4.0% | | | | |
| | 4,500 | | | Rockwell Automation, Inc. | | | 1,194,480 | |
| | | | | | | | | |
| | | | | ENTERTAINMENT CONTENT - 5.1% | | | | |
| | 8,200 | | | Walt Disney Co. * | | | 1,513,064 | |
| | | | | | | | | |
| | | | | FOOD - 0.9% | | | | |
| | 2,000 | | | Beyond Meat, Inc. * | | | 260,240 | |
| | | | | | | | | |
| | | | | HEALTHCARE FACILITIES & SERVICES - 3.8% | | | | |
| | 3,000 | | | UnitedHealth Group, Inc. | | | 1,116,210 | |
| | | | | | | | | |
| | | | | HOME & OFFICE PRODUCTS - 3.1% | | | | |
| | 3,800 | | | The Scotts Miracle-Gro Co. | | | 930,886 | |
| | | | | | | | | |
| | | | | INTERNET MEDIA & SERIVICES - 0.8% | | | | |
| | 200 | | | Shopify, Inc. * | | | 221,300 | |
| | | | | | | | | |
| | | | | LEISURE FACILITIES & SERVICES - 6.1% | | | | |
| | 50,000 | | | Del Taco Restaurants, Inc. | | | 479,000 | |
| | 3,000 | | | McDonald’s Corp. | | | 672,420 | |
| | 6,000 | | | Starbucks Corp. | | | 655,620 | |
| | | | | | | | 1,807,040 | |
| | | | | MACHINERY - 2.5% | | | | |
| | 7,000 | | | Xylem, Inc. | | | 736,260 | |
The accompanying notes are an integral part of these financial statements.
| Two Oaks Diversified Growth and Income Fund | |
| SCHEDULE OF INVESTMENTS (Continued) | March 31, 2021 |
| Shares | | | Security | | Fair Value | |
| | | | | COMMON STOCK - 66.2% (Continued) | | | | |
| | | | | MEDICAL EQUIPMENT & DEVICES - 2.7% | | | | |
| | 725 | | | Align Technology, Inc. * | | $ | 392,609 | |
| | 500 | | | DexCom, Inc. * | | | 179,695 | |
| | 325 | | | Intuitive Surgical, Inc. * | | | 240,155 | |
| | | | | | | | 812,459 | |
| | | | | SOFTWARE - 1.3% | | | | |
| | 400 | | | Palo Alto Networks, Inc. * | | | 128,824 | |
| | 400 | | | RingCentral, Inc. * | | | 119,152 | |
| | 680 | | | Salesforce.com, Inc. * | | | 144,072 | |
| | | | | | | | 392,048 | |
| | | | | TECHNOLOGY HARDWARE - 6.6% | | | | |
| | 16,000 | | | Apple, Inc. | | | 1,954,400 | |
| | | | | | | | | |
| | | | | TECHNOLOGY SERVICES - 1.8% | | | | |
| | 2,500 | | | Visa, Inc. | | | 529,325 | |
| | | | | | | | | |
| | | | | TRANSPORTATION & LOGISTICS - 3.8% | | | | |
| | 4,000 | | | FedEx Corp. | | | 1,136,160 | |
| | | | | | | | | |
| | | | | WHOLESALE - CONSUMER STAPLES - 1.8% | | | | |
| | 7,000 | | | Calavo Growers, Inc. | | | 543,480 | |
| | | | | | | | | |
| | | | | TOTAL COMMON STOCK | | | 19,642,970 | |
| | | | | (Cost - $10,223,752) | | | | |
| | | | | | | | | |
| | | | | REAL ESTATE INVESTMENT TRUSTS (REITS) - 19.1% | | | | |
| | | | | INDUSTRIAL - 4.9% | | | | |
| | 80,000 | | | Monmouth Real Estate Investment Corp. | | | 1,415,200 | |
| | | | | | | | | |
| | | | | MULTI ASSET CLASS - 5.5% | | | | |
| | 60,000 | | | Armada Hoffler Properties, Inc. | | | 752,400 | |
| | 80,000 | | | Lexington Realty Trust | | | 888,800 | |
| | | | | | | | 1,641,200 | |
| | | | | RESIDENTIAL - 5.6% | | | | |
| | 80,000 | | | Bluerock Residential Growth REIT, Inc. | | | 808,800 | |
| | 45,000 | | | UMH Properties, Inc. | | | 862,650 | |
| | | | | | | | 1,671,450 | |
| | | | | SPECIALTY - 3.1% | | | | |
| | 20,000 | | | EPR Properties | | | 931,800 | |
| | | | | | | | | |
| | | | | TOTAL REAL ESTATE INVESTMENTS TRUSTS | | | 5,659,650 | |
| | | | | (Cost - $3,678,796) | | | | |
The accompanying notes are an integral part of these financial statements.
| Two Oaks Diversified Growth and Income Fund | |
| SCHEDULE OF INVESTMENTS (Continued) | March 31, 2021 |
| Principal | | | Security | | Coupon Rate (%) | | Maturity Date | | Fair Value | |
| | | | | CORPORATE BONDS - 8.7% | | | | | | | | |
| | | | | BANKING - 1.7% | | | | | | | | |
| $ | 500,000 | | | Barclays Bank PLC, 3 mo. LIBOR + 1.25% (a) | | 1.4748 | | 4/11/2023 | | $ | 502,581 | |
| | | | | | | | | | | | | |
| | | | | ELECTRIC UTILITIES - 1.7% | | | | | | | | |
| | 500,000 | | | Public Service Enterprise Group, Inc. | | 2.0000 | | 11/15/2021 | | | 504,445 | |
| | | | | | | | | | | | | |
| | | | | HEALTH CARE FACILITIES & SERVICES - 1.8% | | | | | | | | |
| | 500,000 | | | McKesson Corp. | | 3.7960 | | 3/15/2024 | | | 542,575 | |
| | | | | | | | | | | | | |
| | | | | OIL & GAS PRODUCERS - 1.7% | | | | | | | | |
| | 500,000 | | | Chevron Corp. | | 2.4980 | | 3/3/2022 | | | 509,522 | |
| | | | | | | | | | | | | |
| | | | | TELECOMMUNICATIONS - 1.8% | | | | | | | | |
| | 500,000 | | | AT&T, Inc. | | 3.0000 | | 6/30/2022 | | | 514,007 | |
| | | | | | | | | | | | | |
| | | | | TOTAL CORPORATE BONDS | | | | | | | 2,573,130 | |
| | | | | (Cost - $2,503,205) | | | | | | | | |
| | | | | | | | | | | | | |
| Shares | | | | | | | | | | | |
| | | | | PREFERRED STOCK - 1.4% | | | | | | | | |
| | | | | BANKING - 1.4% | | | | | | | | |
| | 300 | | | Wells Fargo & Co., 7.50% | | | | | | | | |
| | | | | TOTAL PREFERRED STOCK | | | | | | | 425,223 | |
| | | | | (Cost - $463,177) | | | | | | | | |
| | | | | | | | | | | | | |
| | | | | SHORT-TERM INVESTMENTS - 4.6% | | | | | | | | |
| | | | | MONEY MARKET FUND - 4.6% | | | | | | | | |
| | 1,383,734 | | | Dreyfus Institutional Preferred Money Market Fund Hamilton Shares, 0.01% (b) | | | | |
| | | | | TOTAL SHORT-TERM INVESTMENTS | | | | | | | 1,383,734 | |
| | | | | (Cost - $1,383,734) | | | | | | | | |
| | | | | | | | | | | | | |
| | | | | TOTAL INVESTMENTS - 100.0% | | | | | | | | |
| | | | | (Cost - $18,252,664) | | | | | | $ | 29,684,707 | |
| | | | | LIABILITIES IN EXCESS OF CASH AND OTHER ASSETS - (0.0)% | | | | | | | (1,736 | ) |
| | | | | NET ASSETS - 100.0% | | | | | | $ | 29,682,971 | |
| * | Non Income Producing Security |
LP - Limited Partnership
PLC - Public Limited
REITS - Real Estate
LIBOR - London
| (a) | Variable rate security; the rate shown represents the rate at March 31, 2021. |
| (b) | Money market fund; interest rate reflects the seven-day effective yield on March 31, 2021. |
The accompanying notes are an integral part of these financial statements.
| Two Oaks Diversified Growth and Income Fund | |
| STATEMENT OF ASSETS AND LIABILITIES | March 31, 2021 |
| Assets: | | | | |
| Investments in Securities at Fair Value (Cost $18,252,664) | | $ | 29,684,707 | |
| Receivables: | | | | |
| Dividends and Interest | | | 56,443 | |
| Prepaid Expenses and Other Assets | | | 6,508 | |
| Total Assets | | | 29,747,658 | |
| | | | | |
| Liabilities: | | | | |
| Payables: | | | | |
| Accrued Advisory Fees | | | 15,107 | |
| Accrued Distribution Fees | | | 6,294 | |
| Payable to Related Parties | | | 20,695 | |
| Payable to Trustees | | | 411 | |
| Accrued Expenses and Other Liabilities | | | 22,180 | |
| Total Liabilities | | | 64,687 | |
| | | | | |
| Net Assets | | $ | 29,682,971 | |
| | | | | |
| Class A Shares: | | | | |
| Net Asset Value and Redemption Price Per Share ($0 par value, unlimited shares authorized) ($29,682,971/1,876,048 shares) | | $ | 15.82 | |
| | | | | |
| Maximum Offering Price Per Share ($15.82/0.9425) | | $ | 16.79 | |
| | | | | |
| Composition of Net Assets: | | | | |
| At March 31, 2021, Net Assets consisted of: | | | | |
| Paid-in-Capital | | | 19,188,458 | |
| Accumlated Earnings | | | 10,494,513 | |
| Net Assets | | $ | 29,682,971 | |
The accompanying notes are an integral part of these financial statements.
| Two Oaks Diversified Growth and Income Fund | For the Year Ended |
| STATEMENT OF OPERATIONS | March 31, 2021 |
| Investment Income: | | | | |
| Dividend Income, net of foreign taxes of $(8,418) | | $ | 396,945 | |
| Interest Income | | | 85,347 | |
| Total Investment Income | | | 482,292 | |
| | | | | |
| Expenses: | | | | |
| Investment Advisory Fees | | | 159,212 | |
| Distribution Fees - Class A | | | 66,339 | |
| Administration Fees | | | 52,275 | |
| Transfer Agent Fees | | | 33,280 | |
| Trustee Fees | | | 26,745 | |
| Legal Fees | | | 26,502 | |
| Fund Accounting Fees | | | 22,058 | |
| Chief Compliance Officer Fees | | | 21,229 | |
| Audit Fees | | | 17,502 | |
| Registration and Filing Fees | | | 14,528 | |
| Printing Expenses | | | 12,640 | |
| Third Party Administrative Servicing Fees | | | 6,780 | |
| Custody Fees | | | 6,652 | |
| Insurance Expense | | | 3,478 | |
| Miscellaneous Expense | | | 2,248 | |
| Total Expenses | | | 471,468 | |
| Net Investment Income | | | 10,824 | |
| | | | | |
| Net Realized and Unrealized Gain on Investments: | | | | |
| Net Realized Gain From Security Transactions | | | 561,548 | |
| Net Change in Net Unrealized Appreciation on Investments | | | 9,465,573 | |
| Net Realized and Unrealized Gain on Investments | | | 10,027,121 | |
| | | | | |
| Net Increase in Net Assets Resulting From Operations | | $ | 10,037,945 | |
The accompanying notes are an integral part of these financial statements.
| Two Oaks Diversified Growth and Income Fund |
| STATEMENTS OF CHANGES IN NET ASSETS |
| | | Year Ended | | | Year Ended | |
| | | March 31, 2021 | | | March 31, 2020 | |
| Operations: | | | | | | | | |
| Net Investment Income | | $ | 10,824 | | | $ | 287,527 | |
| Net Realized Gain (Loss) From Security Transactions | | | 561,548 | | | | (1,529,527 | ) |
| Net Change in Net Unrealized Appreciation (Depreciation) on Investments | | | 9,465,573 | | | | (2,247,985 | ) |
| Net Increase (Decrease) in Net Assets Resulting From Operations | | | 10,037,945 | | | | (3,489,985 | ) |
| | | | | | | | | |
| Dividends and Distributions to Shareholders From: | | | | | | | | |
| Total Distributions Paid | | | | | | | | |
| Class A ($0.01 and $0.35 per share, respectively) | | | (19,510 | ) | | | (715,780 | ) |
| Return of Capital | | | | | | | | |
| Class A ($0.11 and $- per share, respectively) | | | (218,828 | ) | | | — | |
| Total Distributions to Shareholders | | | (238,338 | ) | | | (715,780 | ) |
| Capital Share Transactions: | | | | | | | | |
| Proceeds from Shares Issued (19,927 and 110,460 shares, respectively) | | | 264,446 | | | | 1,509,201 | |
| Reinvestment of Dividends (20,177 and 52,115 shares, respectively) | | | 237,773 | | | | 714,118 | |
| Cost of Shares Redeemed (181,007 and 269,803 shares, respectively) | | | (2,452,793 | ) | | | (3,567,034 | ) |
| Total Capital Share Transactions | | | (1,950,574 | ) | | | (1,343,715 | ) |
| | | | | | | | | |
| Total Increase (Decrease) in Net Assets | | | 7,849,033 | | | | (5,549,480 | ) |
| | | | | | | | | |
| Net Assets: | | | | | | | | |
| Beginning of Year | | | 21,833,938 | | | | 27,383,418 | |
| End of Year | | $ | 29,682,971 | | | $ | 21,833,938 | |
The accompanying notes are an integral part of these financial statements.
| Two Oaks Diversified Growth and Income Fund |
| FINANCIAL HIGHLIGHTS |
The table below sets forth financial data for one share of capital stock outstanding throughout each year presented.
| | | Class A (a) | |
| | | | | | | | | | | | | | | | |
| | | For the Year Ended March 31, | |
| | | 2021 | | | 2020 | | | 2019 | | | 2018 | | | 2017 | |
| | | | | | | | | | | | | | | | |
| Net Asset Value, Beginning of Year | | $ | 10.83 | | | $ | 12.89 | | | $ | 13.16 | | | $ | 13.02 | | | $ | 11.52 | |
| | | | | | | | | | | | | | | | | | | | | |
| From Operations: | | | | | | | | | | | | | | | | | | | | |
| Net investment income (b) | | | 0.01 | | | | 0.14 | | | | 0.15 | | | | 0.12 | | | | 0.11 | |
| Net gain (loss) from securities (both realized and unrealized) | | | 5.10 | | | | (1.85 | ) | | | 0.35 | | | | 0.51 | | | | 1.57 | |
| Total from operations | | | 5.11 | | | | (1.71 | ) | | | 0.50 | | | | 0.63 | | | | 1.68 | |
| | | | | | | | | | | | | | | | | | | | | |
| Distributions to shareholders from | | | | | | | | | | | | | | | | | | | | |
| Net investment income | | | (0.01 | ) | | | (0.09 | ) | | | (0.16 | ) | | | (0.13 | ) | | | (0.18 | ) |
| Net realized gains | | | — | | | | (0.26 | ) | | | (0.61 | ) | | | (0.36 | ) | | | — | |
| Return of capital | | | (0.11 | ) | | | — | | | | — | | | | — | | | | — | |
| Total distributions | | | (0.12 | ) | | | (0.35 | ) | | | (0.77 | ) | | | (0.49 | ) | | | (0.18 | ) |
| | | | | | | | | | | | | | | | | | | | | |
| Net Asset Value, End of Year | | $ | 15.82 | | | $ | 10.83 | | | $ | 12.89 | | | $ | 13.16 | | | $ | 13.02 | |
| | | | | | | | | | | | | | | | | | | | | |
| Total Return (c) | | | 47.57 | % | | | (13.81 | )% | | | 4.05 | % | | | 4.70 | % | | | 14.63 | % |
| | | | | | | | | | | | | | | | | | | | | |
| Ratios/Supplemental Data | | | | | | | | | | | | | | | | | | | | |
| Net assets, end of year (in 000’s) | | $ | 29,683 | | | $ | 21,834 | | | $ | 27,383 | | | $ | 27,721 | | | $ | 24,940 | |
| Ratio of expenses to average net assets, | | | | | | | | | | | | | | | | | | | | |
| before recapture (d) | | | 1.78 | % | | | 1.63 | % | | | 1.69 | % | | | 1.70 | % | | | 1.75 | % |
| net of recapture (d) | | | 1.78 | % | | | 1.63 | % | | | 1.69 | % | | | 1.75 | % (e) | | | 1.75 | % |
| Ratio of net investment income to average net assets (d) | | | 0.04 | % | | | 1.03 | % | | | 1.13 | % | | | 0.86 | % | | | 0.90 | % |
| Portfolio turnover rate | | | 21 | % | | | 7 | % | | | 15 | % | | | 22 | % | | | 24 | % |
| (a) | Class C shares were merged into Class A on May 20, 2017. The amounts presented represent the results of the Class A shares for the periods prior to the merger and the results of the combined share class for the period subsequent to the merger. |
| (b) | Per share amounts are calculated using the average shares method, which more appropriately presents the per share data for each year. |
| (c) | Total returns are historical in nature and assume changes in share price, reinvestment of dividends and capital gains distributions, if any, and do not assume the effects of any sales charges. Had the Adviser not waived a portion of its fee during 2017, total returns would have been lower. |
| (d) | Does not include expenses of the investment companies in which the Fund invests. |
| (e) | Inclusive of Adviser’s recapture of waived/reimbursed fees from prior periods. |
The accompanying notes are an integral part of these financial statements.
| Two Oaks Diversified Growth and Income Fund | |
| NOTES TO FINANCIAL STATEMENTS | March 31, 2021 |
Two Oaks Diversified Growth and Income Fund (the “Fund”) is a diversified series of Northern Lights Fund Trust II (the “Trust”), a Delaware statutory trust organized on August 26, 2010. The Fund is registered under the Investment Company Act of 1940, as amended (the “Act”), as an open-end management investment company. The Fund commenced operations on April 15, 2002. The investment objective of the Fund is long-term growth of capital and income.
The Fund currently offers Class A shares. Class A shares are offered at net asset value plus a maximum sales charge of 5.75%.
At a meeting held on January 26, 2021, the Board of Trustees of Northern Lights Fund Trust II (the “Trust”), including a majority of the independent trustees, approved an Agreement and Plan of Reorganization (the “Plan”) which contemplates the reorganization of the Fund, a series of the Trust, with and into the North Star Opportunity Fund (the “North Star Fund”), another series of the Trust. See Note 7 for additional information.
| 2. | SUMMARY OF SIGNIFICANT ACCOUNTING POLICIES |
The following is a summary of significant accounting policies followed by the Fund in preparation of the financial statements. These policies are in conformity with accounting principles generally accepted in the United States of America (“GAAP”). The preparation of financial statements requires management to make estimates and assumptions that affect the reported amounts of assets and liabilities and disclosure of contingent assets and liabilities at the date of the financial statements and the reported amounts of income and expenses for the period. Actual results could differ from those estimates. The Fund is an investment company and accordingly follows the investment company accounting and reporting guidance of the Financial Accounting Standards Board (FASB) Accounting Standard Codification Topic 946 “Financial Services – Investment Companies”.
Security valuation – Securities listed on an exchange are valued at the last reported sale price at the close of the regular trading session of the primary exchange on the business day the value is being determined, or in the case of securities listed on NASDAQ at the NASDAQ Official Closing Price (“NOCP”). In the absence of a sale such securities shall be valued at the mean between the current bid and ask prices on the day of valuation. Debt securities (other than short-term obligations) are valued each day by an independent pricing service approved by the Board of Trustees (the “Board”) based on methods which include consideration of: yields or prices of securities of comparable quality, coupon, maturity and type, indications as to values from dealers, and general market conditions or market quotations from a major market maker in the securities. The independent pricing service does not distinguish between smaller-sized bond positions known as “odd lots” and larger institutional-sized bond positions known as “round lots”. The Fund may fair value a particular bond if the adviser does not believe that the round lot value provided by the independent pricing service reflects fair value of the Fund’s holding. Investments valued in currencies other than the U.S. dollar are converted to U.S. dollars using exchange rates obtained from pricing services. Short-term debt obligations having 60 days or less remaining until maturity, at time of purchase, may be valued at amortized cost.
The Fund may invest in portfolios of open-end or closed-end investment companies (the “underlying funds”). Open-end underlying funds are valued at their respective net asset values as reported by such investment companies. The underlying funds value securities in their portfolios for which market quotations are readily available at their market values (generally the last reported sale price) and all other securities and assets at their fair value by the methods established by the Boards of the underlying funds. The shares of many closed-end investment companies, after their initial public offering, frequently trade at a price per share, which is different than the net asset value per share. The difference represents a market premium or market discount of such shares. There can be no assurances that the market discount or market premium on shares of any closed-end investment company purchased by the Fund will not change.
The Fund may hold securities, such as private investments, interests in commodity pools, other non-traded securities or temporarily illiquid securities, for which market quotations are not readily available or are determined to be unreliable. These securities will be valued using the “fair value” procedures approved by the Board. The Board has delegated execution of these procedures to a fair value committee composed of one or more representatives from each of the (i) Trust, (ii) administrator, and (iii) adviser. The committee may also enlist third party consultants such as a valuation specialist at a public accounting firm, valuation consultant, or financial officer of a security issuer on an as-needed basis to assist in determining a security-specific fair value. The Board has also engaged a third-party valuation firm to attend valuation meetings held by the trust, review minutes of such meetings, and report to the Board on a quarterly basis. The Board reviews and ratifies the execution of this process and the resultant fair value prices at least quarterly to assure the process produces reliable results.
Fair Valuation Process. As noted above, the fair value committee is composed of one or more representatives from each of the (i) Trust, (ii) administrator, and (iii) adviser. The applicable investments are valued collectively via inputs from each of these groups. For example, fair value determinations are required for the following securities: (i) securities for which market
| Two Oaks Diversified Growth and Income Fund | |
| NOTES TO FINANCIAL STATEMENTS (Continued) | March 31, 2021 |
quotations are insufficient or not readily available on a particular business day (including securities for which there is a short and temporary lapse in the provision of a price by the regular pricing source), (ii) securities for which, in the judgment of the adviser, the prices or values available do not represent the fair value of the instrument. Factors which may cause the adviser to make such a judgment include, but are not limited to, the following: only a bid price or an asked price is available; the spread between bid and asked prices is substantial; the frequency of sales; the thinness of the market; the size of reported trades; and actions of the securities markets, such as the suspension or limitation of trading; (iii) securities determined to be illiquid; (iv) securities with respect to which an event that will affect the value thereof has occurred (a “significant event”) since the closing prices were established on the principal exchange on which they are traded, but prior to a Fund’s calculation of its net asset value. Specifically, interests in commodity pools or managed futures pools are valued on a daily basis by reference to the closing market prices of each futures contract or other asset held by a pool, as adjusted for pool expenses. Restricted or illiquid securities, such as private investments or non-traded securities are valued via inputs from the adviser based upon the current bid for the security from two or more independent dealers or other parties reasonably familiar with the facts and circumstances of the security (who should take into consideration all relevant factors as may be appropriate under the circumstances). If the adviser is unable to obtain a current bid from such independent dealers or other independent parties, the fair value committee shall determine the fair value of such security using the following factors: (i) the type of security; (ii) the cost at date of purchase; (iii) the size and nature of the Fund’s holdings; (iv) the discount from market value of unrestricted securities of the same class at the time of purchase and subsequent thereto; (v) information as to any transactions or offers with respect to the security; (vi) the nature and duration of restrictions on disposition of the security and the existence of any registration rights; (vii) how the yield of the security compares to similar securities of companies of similar or equal creditworthiness; (viii) the level of recent trades of similar or comparable securities; (ix) the liquidity characteristics of the security; (x) current market conditions; and (xi) the market value of any securities into which the security is convertible or exchangeable.
The Fund utilizes various methods to measure the fair value of most of its investments on a recurring basis. GAAP establishes a hierarchy that prioritizes inputs to valuation methods. The three levels of input are:
Level 1 – Unadjusted quoted prices in active markets for identical assets and liabilities that the Fund has the ability to access.
Level 2 – Observable inputs other than quoted prices included in level 1 that are observable for the asset or liability, either directly or indirectly. These inputs may include quoted prices for the identical instrument in an inactive market, prices for similar instruments, interest rates, prepayment speeds, credit risk, yield curves, default rates and similar data.
Level 3 – Unobservable inputs for the asset or liability, to the extent relevant observable inputs are not available, representing the Fund’s own assumptions about the assumptions a market participant would use in valuing the asset or liability, and would be based on the best information available.
The availability of observable inputs can vary from security to security and is affected by a wide variety of factors, including, for example, the type of security, whether the security is new and not yet established in the marketplace, the liquidity of markets, and other characteristics particular to the security. To the extent that valuation is based on models or inputs that are less observable or unobservable in the market, the determination of fair value requires more judgment. Accordingly, the degree of judgment exercised in determining fair value is greatest for instruments categorized in Level 3.
The inputs used to measure fair value may fall into different levels of the fair value hierarchy. In such cases, for disclosure purposes, the level in the fair value hierarchy within which the fair value measurement falls in its entirety, is determined based on the lowest level input that is significant to the fair value measurement in its entirety.
The inputs or methodology used for valuing securities are not necessarily an indication of the risk associated with investing in those securities. The following table summarizes the inputs used as of March 31, 2021 for the Fund’s assets measured at fair value:
| Assets* | | Level 1 | | | Level 2 | | | Level 3 | | | Total | |
| Common Stock | | $ | 19,642,970 | | | $ | — | | | $ | — | | | $ | 19,642,970 | |
| REITS | | | 5,659,650 | | | | — | | | | — | | | | 5,659,650 | |
| Corporate Bonds | | | — | | | | 2,573,130 | | | | — | | | | 2,573,130 | |
| Preferred Stock | | | 425,223 | | | | — | | | | — | | | | 425,223 | |
| Short-Term Investments | | | 1,383,734 | | | | — | | | | — | | | | 1,383,734 | |
| Total | | $ | 27,111,577 | | | $ | 2,573,130 | | | $ | — | | | $ | 29,684,707 | |
The Fund did not hold any Level 3 securities during the year.
| * | Please refer to the Schedule of Investments for industry classifications. |
| Two Oaks Diversified Growth and Income Fund | |
| NOTES TO FINANCIAL STATEMENTS (Continued) | March 31, 2021 |
Security transactions and related income – Security transactions are accounted for on trade date. Interest income is recognized on an accrual basis. Discounts are accreted and premiums are amortized on securities purchased over the lives of the respective securities using the effective yield method. Dividend income is recorded on the ex-dividend date. Realized gains or losses from sales of securities are determined by comparing the identified cost of the security lot sold with the net sales proceeds. Withholding taxes on foreign dividends have been provided for in accordance with the Fund’s understanding of the applicable country’s tax rules and rates.
Distributions received from investments in securities that represent a return of capital or capital gain are recorded as a reduction of cost of investment or as a realized gain, respectively. The calendar year-end amounts of ordinary income, capital gains, and return of capital included in distributions received from the Fund’s investments in real estate investment trusts (“REITS”) and master limited partnerships (“MLPS”) are reported to the Fund after the end of the calendar year; accordingly, the Fund estimates these amounts for accounting purposes until the characterization of REIT and MLP distributions is reported to the Fund after the end of the calendar year. Estimates are based on the most recent REIT and MLP distribution information available.
Dividends and distributions to shareholders – Dividends from net investment income, if any, are declared and paid quarterly. Distributable net realized capital gains, if any, are declared and distributed annually. Dividends from net investment income and distributions from net realized gains are determined in accordance with federal income tax regulations, which may differ from GAAP, and are recorded on the ex-dividend date. These “book/tax” differences are considered either temporary (e.g., deferred losses, capital loss carryforwards) or permanent in nature. To the extent these differences are permanent in nature, such amounts are reclassified within the composition of net assets based on their federal tax-basis treatment; temporary differences do not require reclassification. Any such reclassifications will have no effect on net assets, results of operations, or net asset values per share of the Fund.
Federal income tax – The Fund intends to continue to comply with the requirements of the Internal Revenue Code applicable to regulated investment companies and to distribute all of its taxable income to shareholders. Therefore, no provision for Federal income tax is required.
The Fund recognizes the tax benefits of uncertain tax positions only where the position is “more likely than not” to be sustained assuming examination by tax authorities. Management has analyzed the Fund’s tax positions and has concluded that no liability for unrecognized tax benefits should be recorded related to uncertain tax positions taken on returns filed for open tax years ended March 31, 2018 to March 31, 2020, or expected to be taken in the Fund’s March 31, 2021 year-end tax returns. The Fund identified its major tax jurisdictions as U.S. Federal, Ohio and foreign jurisdictions where the Fund makes significant investments; however, the Fund is not aware of any tax positions for which it is reasonably possible that the total amounts of unrecognized tax benefits will change materially in the next twelve months. The Fund recognizes interest and penalties, if any, related to unrecognized tax benefits as income tax expense in the Statement of Operations. During the year, the Fund did not incur any interest or penalties.
Foreign Currency – The accounting records of the Fund are maintained in U.S. dollars. Investment securities and other assets and liabilities denominated in a foreign currency, and income receipts and expense payments are translated into U.S. dollars using the prevailing exchange rate at the London market close. Purchases and sales of securities are translated into U.S. dollars at the contractual currency rates established at the approximate time of the trade. Net realized gains and losses on foreign currency transactions represent net gains and losses from currency realized between the trade and settlement dates on securities transactions and the difference between income accrued versus income received. The effects of changes in foreign currency exchange rates on investments in securities are included with the net realized and unrealized gain or loss on investment securities.
Expenses – Expenses of the Trust that are directly identifiable to a specific Fund are charged to that Fund. Expenses, which are not readily identifiable to a specific Fund, are allocated in such a manner as deemed equitable, taking into consideration the nature and type of expense and the relative sizes of the funds in the Trust.
Indemnification – The Trust indemnifies its officers and trustees for certain liabilities that may arise from the performance of their duties to the Trust. Additionally, in the normal course of business, the Fund enters into contracts that contain a variety of representations and warranties and which provide general indemnities. The Fund’s maximum exposure under these arrangements is unknown, as this would involve future claims that may be made against the Fund that have not yet occurred. However, based on experience, the risk of loss due to these warranties and indemnities appears to be remote.
| Two Oaks Diversified Growth and Income Fund | |
| NOTES TO FINANCIAL STATEMENTS (Continued) | March 31, 2021 |
| 3. | INVESTMENT ADVISORY AGREEMENT AND TRANSACTIONS WITH RELATED PARTIES |
Pursuant to the Investment Advisory Agreement (the “Advisory Agreement”), investment advisory services are provided to the Fund by Two Oaks Investment Management, LLC (the “Adviser”). Under the terms of the Advisory Agreement, the Adviser receives monthly fees calculated at an annual rate of 0.60% of the average daily net assets of the Fund. For the year ended March 31, 2021, the Adviser earned advisory fees of $159,212.
The Trust, on behalf of the Fund, has adopted the Trust’s Master Distribution and Shareholder Servicing Plan (the “Plan”) pursuant to Rule 12b-1 under the 1940 Act. The Plan provides that a monthly service and/or distribution fee is calculated by the Fund at an annual rate of 0.25% of the average daily net assets attributable to the Class A shares and is paid to Northern Lights Distributors, LLC (the “Distributor”) to provide compensation for ongoing distribution-related activities or services and/or maintenance of the Fund’s shareholder accounts, not otherwise required to be provided by the Adviser. The Plan is a compensation plan, which means that compensation is provided regardless of 12b-1 expenses incurred.
The Plan further provides for periodic payments to brokers, dealers and other financial intermediaries, for providing shareholder services and for promotional and other sales-related costs. For the year ended March 31, 2021, the Fund paid distribution fees of $66,339.
The Distributor acts as the Fund’s principal underwriter in a continuous public offering of the Funds’ shares. For the year ended March 31, 2021, the Distributor received $9,940 in underwriting commissions for sales of shares, of which $1,618 was retained by the principal underwriter.
In addition, certain affiliates of the Distributor provide services to the Fund as follows:
Gemini Fund Services, LLC (“GFS”), an affiliate of the Distributor, provides administration, fund accounting, and transfer agent services to the Trust. Pursuant to separate servicing agreements with GFS, the Fund pays GFS customary fees for providing administration, fund accounting, and transfer agency services to the Fund. Certain officers of the Trust are also officers of GFS, and are not paid any fees directly by the Fund for serving in such capacities.
Northern Lights Compliance Services, LLC (“NLCS”) – NLCS, an affiliate of GFS and the Distributor, provides a Chief Compliance Officer to the Trust, as well as related compliance services, pursuant to a consulting agreement between NLCS and the Trust. Under the terms of such agreement, NLCS receives customary fees from the Fund.
Blu Giant, LLC (“Blu Giant”) – Blu Giant, an affiliate of GFS and the Distributor, provides EDGAR conversion and filing services as well as print management services for the Fund on an ad-hoc basis. For the provision of these services, Blu Giant receives customary fees from the Fund.
| 4. | INVESTMENT TRANSACTIONS |
The cost of purchases and proceeds from the sale of securities, other than short-term securities, for the year ended March 31, 2021, amounted to $5,339,018 and $6,328,822, respectively.
| 5. | AGGREGATE UNREALIZED APPRECIATION AND DEPRECIATION – TAX BASIS |
The identified cost of investments in securities owned by the Fund for federal income tax purposes, and its respective gross unrealized appreciation and depreciation at March 31, 2021, were as follows:
| | | | Gross Unrealized | | | Gross Unrealized | | | Net Unrealized | |
| Tax Cost | | | Appreciation | | | (Depreciation) | | | Appreciation | |
| $ | 18,210,255 | | | $ | 11,706,276 | | | $ | (231,824 | ) | | $ | 11,474,452 | |
| Two Oaks Diversified Growth and Income Fund | |
| NOTES TO FINANCIAL STATEMENTS (Continued) | March 31, 2021 |
| 6. | DISTRIBUTIONS TO SHAREHOLDERS AND TAX COMPONENTS OF CAPITAL |
The tax character of fund distributions paid for the years ended March 31, 2021 and March 31, 2020 was as follows:
| | | Fiscal Year Ended | | | Fiscal Year Ended | |
| | | March 31, 2021 | | | March 31, 2020 | |
| Ordinary Income | | $ | 19,510 | | | $ | 289,966 | |
| Long-Term Capital Gain | | | — | | | | 425,814 | |
| Return of Capital | | | 218,828 | | | | — | |
| | | $ | 238,338 | | | $ | 715,780 | |
As of March 31, 2021, the components of accumulated earnings/ (deficit) on a tax basis were as follows:
| Undistributed | | | Undistributed | | | Post October Loss | | | Capital Loss | | | Other | | | Unrealized | | | Total | |
| Ordinary | | | Long-Term | | | and | | | Carry | | | Book/Tax | | | Appreciation/ | | | Accumulated | |
| Income | | | Gains | | | Late Year Loss | | | Forwards | | | Differences | | | (Depreciation) | | | Earnings/(Deficits) | |
| $ | — | | | $ | — | | | $ | (31,411 | ) | | $ | (948,528 | ) | | $ | — | | | $ | 11,474,452 | | | $ | 10,494,513 | |
Late year losses incurred after December 31 within the fiscal year are deemed to arise on the first business day of the following fiscal year for tax purposes. The Fund incurred and elected to defer such late year losses of $ 31,411.
The difference between book basis and tax basis unrealized appreciation and undistributed ordinary income/(loss) is primarily attributable to tax adjustments for partnerships.
At March 31, 2021, the Fund had capital loss carry forwards for federal income tax purposes available to offset future capital gains as follows:
| Non-Expiring | | | Non-Expiring | | | | | | | |
| Short-Term | | | Long-Term | | | Total | | | CLCF Utilized | |
| $ | 26,067 | | | $ | 922,461 | | | $ | 948,528 | | | $ | — | |
Permanent book and tax differences, primarily attributable to the book/tax basis treatment of net operating losses resulted in reclassifications for the Fund for the fiscal year ended March 31, 2021 as follows:
| Paid | | | | |
| In | | | Accumulated | |
| Capital | | | Earnings (Losses) | |
| $ | (2,778 | ) | | $ | 2,778 | |
Subsequent events after the date of the Statement of Assets and Liabilities have been evaluated through the date the financial statements were issued. Management has determined that no events or transactions occurred requiring adjustment or disclosure in the financial statements other than the following.
Pursuant to the approval of the Plan of Reorganization by the shareholders of the Fund on May 7, 2021, the Fund transferred all of the assets and liabilities of the Fund to the North Star Opportunity Fund solely in exchange for Class A shares of beneficial interest of the North Star Opportunity Fund.

REPORT OF INDEPENDENT REGISTERED PUBLIC ACCOUNTING FIRM
To the Shareholders of Two Oaks Diversified Growth and Income Fund and
Board of Trustees of Northern Lights Fund Trust II
Opinion on the Financial Statements
We have audited the accompanying statement of assets and liabilities, including the schedule of investments, of Two Oaks Diversified Growth and Income Fund (the “Fund”), a series of Northern Lights Fund Trust II, as of March 31, 2021, the related statement of operations for the year then ended, the statements of changes in net assets for each of the two years in the period then ended, the related notes, and the financial highlights for each of the five years in the period then ended (collectively referred to as the “financial statements”). In our opinion, the financial statements present fairly, in all material respects, the financial position of the Fund as of March 31, 2021, the results of its operations for the year then ended, the changes in net assets for each of the two years in the period then ended, and the financial highlights for each of the five years in the period then ended, in conformity with accounting principles generally accepted in the United States of America.
Basis for Opinion
These financial statements are the responsibility of the Fund’s management. Our responsibility is to express an opinion on the Fund’s financial statements based on our audits. We are a public accounting firm registered with the Public Company Accounting Oversight Board (United States) (“PCAOB”) and are required to be independent with respect to the Fund in accordance with the U.S. federal securities laws and the applicable rules and regulations of the Securities and Exchange Commission and the PCAOB.
We conducted our audits in accordance with the standards of the PCAOB. Those standards require that we plan and perform the audit to obtain reasonable assurance about whether the financial statements are free of material misstatement whether due to error or fraud.
Our audits included performing procedures to assess the risks of material misstatement of the financial statements, whether due to error or fraud, and performing procedures that respond to those risks. Such procedures included examining, on a test basis, evidence regarding the amounts and disclosures in the financial statements. Our procedures included confirmation of securities owned as of March 31, 2021, by correspondence with the custodian. Our audits also included evaluating the accounting principles used and significant estimates made by management, as well as evaluating the overall presentation of the financial statements. We believe that our audits provide a reasonable basis for our opinion.
We have served as the Fund’s auditor since 2004.

COHEN & COMPANY, LTD.
Cleveland, Ohio
May 25, 2021
COHEN & COMPANY, LTD.
800.229.1099 | 866.818.4538 fax | cohencpa.com
Registered with the Public Company Accounting Oversight Board
| Two Oaks Diversified Growth and Income Fund | |
| FUND EXPENSES (Unaudited) | March 31, 2021 |
As a shareholder of the Fund you incur two types of costs: (1) transaction costs, including sales charges (loads) on purchase payments and (2) ongoing costs, including management fees; distribution and/or service (12b-1 fees) fees; and other Fund expenses. This Example is intended to help you understand your ongoing costs (in dollars) of investing in the Funds and to compare these costs with the ongoing costs of investing in other mutual funds.
This Example is based on an investment of $1,000 invested at the beginning of the period and held for the entire period as indicated below.
Actual Expenses: The first section of the table provides information about actual account values and actual expenses. You may use the information in this line, together with the amount you invested, to estimate the expenses that you paid over the period. Simply divide your account value by $1,000 (for example, an $8,600 account value divided by $1,000 = 8.6), then multiply the result by the number in the first line under the heading entitled “Expenses Paid During the Period” to estimate the expenses you paid on your account during the period.
Hypothetical Examples for Comparison Purposes: The second section of the table below provides information about hypothetical account values and hypothetical expenses based on the Fund’s actual expense ratio and an assumed rate of return of 5% per year before expenses, which is not the Fund’s actual return. The hypothetical account values and expenses may not be used to estimate the actual ending account balance or expenses you paid for the period. You may use this information to compare the ongoing costs of investing in the Funds and other funds. To do so, compare this 5% hypothetical example with the 5% hypothetical examples that appear in the shareholder reports of the other funds.
Please note that the expenses shown in the table are meant to highlight your ongoing costs only and do not reflect any transactional costs, such as sales charges (loads) or contingent deferred sales charges on redemptions. Therefore, the second line of the table is useful in comparing ongoing costs only, and will not help you determine the relative total costs of owning different funds. In addition, if these transactional costs were included, your costs would have been higher.
| | | Beginning | | | | | | Expenses Paid |
| | | Account | | | | Expense | | During the |
| | | Value | | Ending Account Value | | Ratio | | Period* |
| | | (10/1/20) | | (3/31/21) | | (Annualized) | | (10/1/20-3/31/21) |
| Actual: | | | | | | | | |
| Class A | | $1,000.00 | | $1,189.50 | | 1.72% | | $9.39 |
| Hypothetical (5% return before expenses): | | | | | | | | |
| Class A | | $1,000.00 | | $1,016.36 | | 1.72% | | $8.65 |
| * | Expenses are equal to the Fund’s annualized expense ratio multiplied by the average account value over the period, multiplied by 182/365 (to reflect the one-half year period). |
| Two Oaks Diversified Growth and Income Fund | |
| SUPPLEMENTAL INFORMATION (Unaudited) | March 31, 2021 |
SHAREHOLDER MEETING
The Board of Trustees of Northern Lights Fund Trust II held a Special Meeting of the Shareholders of the Two Oaks Diversified Growth and Income Fund (the “Fund”), a series of the Trust, on May 7, 2021 (the “Special Meeting”), for the purpose of approving an Agreement and Plan of Reorganization and if necessary, to adjourn or postpone the Meeting to permit further solicitation of proxies in the event that a quorum does not exist or a quorum exists but there are not sufficient votes at the time of the Special Meeting to approve the Proposals.
At the close of business March 1, 2021, the record date for the Special Meeting of Shareholders, there were outstanding 1,885,062 shares of beneficial interest of the Fund. Accordingly, shares represented in person and by proxy at the Special Meeting equaled 58.47% of the outstanding shares of the Fund. Therefore, a quorum was present for the Fund.
With respect to the proposal to approve the Agreement and Plan of Reorganization the following votes were cast:
For Approval: 1,085,364 shares voted
Against Approval: 6,920 shares voted
Abstained: 9,861 shares voted
With respect to the proposal to adjourn or postpone the Special Meeting to permit further solicitation of proxies in the event that a quorum does not exist or a quorum exists but there are not sufficient votes at the time of the Special Meeting the following votes were cast:
For Approval: 1,092,285 shares voted
Against Approval: 0 shares voted
Abstained: 9,861 shares votes
| Two Oaks Diversified Growth and Income Fund |
| SUPPLEMENTAL INFORMATION (Unaudited) |
| March 31, 2021 |
The Trustees and the officers of the Trust are listed below with their present positions with the Trust and principal occupations over at least the last five years. The business address of each Trustee and Officer is 225 Pictoria Drive, Suite 450, Cincinnati, OH 45246. All correspondence to the Trustees and Officers should be directed to c/o Gemini Fund Services, LLC, P.O. Box 541150, Omaha, Nebraska 68154.
Independent Trustees
Name and
Year of Birth | Position/Term of
Office* | Principal Occupation
During the Past Five Years | Number of
Portfolios in
Fund
Complex
Overseen by
Trustee*** | Other Directorships held by
Trustee
During the Past Five Years |
Thomas T. Sarkany
1946 | Trustee Since October 2011 | President, TTS Consultants, LLC (financial services) (since 2010). | 1 | Director, Aquila Distributors; Trustee, Arrow ETF Trust; Trustee, Arrow Investments Trust; Trustee, Northern Lights Fund Trust IV |
Anthony H. Lewis
1946 | Trustee Since May 2011 | Chairman and CEO of The Lewis Group USA (executive consulting firm) (since 2007). | 1 | Director, Member of the Compensation Committee and Member of the Risk Committee of Torotel Inc. (Magnetics, Aerospace and Defense), Trustee, Chairman of the Fair Valuation Committee and Member of the Audit Committee of the Wildermuth Endowment Strategy Fund |
Keith Rhoades
1948 | Trustee Since May 2011 | Retired since 2008. | 1 | NONE |
Randal D. Skalla
1962 | Trustee Since May 2011 | President, L5 Enterprises, Inc. (financial services company) (since 2001). | 1 | Board Member, Orizon Investment Counsel (financial services company) (from 2001 to 2017) |
3/31/21 – NLII v1
| Two Oaks Diversified Growth and Income Fund |
| SUPPLEMENTAL INFORMATION (Unaudited)(Continued) |
| March 31, 2021 |
Interested Trustees and Officers
Name and
Year of Birth | Position/Term
of Office* | Principal Occupation
During the Past Five Years | Number of
Portfolios in
Fund
Complex
Overseen
by
Trustee*** | Other Directorships held by
Trustee
During the Past Five Years |
Brian Nielsen**
1972 | Trustee Since May 2011 | Trustee of Northern Lights Fund Trust II (since 2011); Special Projects Counsel of NorthStar Financial Services Group, LLC (from 2018 to 2019); Secretary of CLS Investments, LLC (from 2001 to 2018); Secretary of Orion Advisor Services, LLC (from 2001 to 2018); Manager (from 2012 to 2015), General Counsel and Secretary (from 2003 to 2018) of NorthStar Financial Services Group, LLC; CEO (from 2012 to 2018), Secretary (from 2003 to 2018) and Manager (from 2005 to 2018) of Northern Lights Distributors, LLC; Director, Secretary and General Counsel of Constellation Trust Company (from 2004 to 2018); CEO (from 2015 to 2018), Manager (from 2008 to 2015), General Counsel and Secretary (from 2011 to 2018) of Northern Lights Compliance Services, LLC; General Counsel and Secretary of Blu Giant, LLC (from 2011 to 2018); Secretary of Gemini Fund Services, LLC (from 2012 to 2018); Manager of Arbor Point Advisors, LLC (from 2012 to 2018); Secretary and General Counsel of NorthStar Holdings, LLC (from 2013 to 2015); Director, Secretary and General Counsel of NorthStar CTC Holdings, Inc. (from 2015 to 2018) and Secretary and Chief Legal Officer of AdvisorOne Funds (from 2003 to 2018). | 1 | Manager of Northern Lights Distributors, LLC (from 2005 to 2018); Manager of NorthStar Financial Services Group, LLC (from 2012 to 2015); Manager of Arbor Point Advisors, LLC (from 2012 to 2018); Director of Constellation Trust Company (from 2004 to 2018) |
Kevin E. Wolf
1969 | President Since January 2013 | Vice President of The Ultimus Group, LLC and Executive Vice President, Head of Fund Administration and Product, Gemini Fund Services, LLC (since 2019), President, Gemini Fund Services, LLC (2012 - 2019). | N/A | N/A |
| Richard Malinowski 1983 | Secretary Since January 2018 | Senior Vice President and Senior Managing Counsel, Gemini Fund Services, LLC, (since February 2020); Senior Vice President Legal Administration, Gemini Fund Services, LLC (April 2017 to February 2020); Vice President and Counsel (April 2016 to April 2017) and AVP and Staff Attorney (September 2012 to March 2016). | N/A | N/A |
Erik Naviloff
1968 | Treasurer Since January 2013 | Vice President of Gemini Fund Services, LLC (since 2011). | N/A | N/A |
Emile R. Molineaux
1962 | Chief Compliance Officer and Anti Money Laundering Officer Since May 2011 | Senior Compliance Officer and CCO of Various clients of Northern Lights Compliance Services, LLC (since 2011). | N/A | N/A |
| * | The term of office for each Trustee and Officer listed above will continue indefinitely. |
| ** | Brian Nielsen is an “interested person” of the Trust as that term is defined under the 1940 Act, because of his prior affiliation with Northern Lights Distributors, LLC (the Fund’s Distributor). |
| *** | As of March 31, 2021, the Trust was comprised of 17 active portfolios managed by unaffiliated investment advisers. The term “Fund Complex” applies only to the Fund, and not to any other series of the Trust. The Fund does not hold itself out as related to any other series within the Trust for investment purposes, nor does it share the same investment adviser with any other series. |
The Fund’s Statement of Additional Information (“SAI”) includes additional information about the Trustees and is available free of charge, upon request, by calling toll-free at 1-855-896-6257.
3/31/21 – NLII v1
Privacy Policy
Rev. May 2021
| FACTS | WHAT DOES NORTHERN LIGHTS FUND TRUST II (“NLFT II”) DO WITH YOUR PERSONAL INFORMATION? |
| Why? | Financial companies choose how they share your personal information. Federal law gives consumers the right to limit some but not all sharing. Federal law also requires us to tell you how we collect, share, and protect your personal information. Please read this notice carefully to understand what we do. |
| What? | The types of personal information we collect and share depend on the product or service you have with us. This information can include:
|
● Social Security number ● Employment information ● Account balances | ● Account transactions ● Income ● Investment experience |
When you are no longer our customer, we continue to share your information as described in this notice. |
| How? | All financial companies need to share a customer’s personal information to run their everyday business - to process transactions, maintain customer accounts, and report to credit bureaus. In the section below, we list the reasons financial companies can share their customer’s personal information; the reasons NLFT II chooses to share; and whether you can limit this sharing. |
| | |
| Reasons we can share your personal information | Does NLFT II
share? | Can you limit
this sharing? |
For our everyday business purposes —
such as to process your transactions, maintain your account(s), respond to court orders and legal investigations, or report to credit bureaus
| Yes | No |
For our marketing purposes —
to offer our products and services to you
| Yes | No |
For joint marketing with other financial companies
| Yes | No |
For our affiliates’ everyday business purposes —
information about your transactions and experiences
| Yes | No |
For our affiliates’ everyday business purposes —
information about your creditworthiness
| No | We don’t share |
For nonaffiliates to market to you
| No | We don’t share |
| Questions? | Call 1-631-490-4300 |
| Who we are |
| Who is providing this notice? | Northern Lights Fund Trust II |
| What we do |
| How does NLFT II protect my personal information? | To protect your personal information from unauthorized access and use, we use security measures that comply with federal law. These measures include computer safeguards and secured files and buildings. |
| How does NLFT II collect my personal information? | We collect your personal information, for example, when you
|
● open an account ● give us your income information ● provide employment information | ● provide account information ● give us your contact information |
| We also collect your personal information from others, such as credit bureaus, affiliates, or other companies. |
| Why can’t I limit all sharing? | Federal law gives you the right to limit only ● sharing for affiliates’ everyday business purposes—information about your creditworthiness ● affiliates from using your information to market to you ● sharing for nonaffiliates to market to you State laws and individual companies may give you additional rights to limit sharing. |
| Definitions |
| Affiliates | Companies related by common ownership or control. They can be financial and nonfinancial companies. ● NLFT II has no affiliates. |
| Nonaffiliates | Companies not related by common ownership or control. They can be financial and nonfinancial companies. ● NLFT II does not share with nonaffiliates so they can market to you. |
| Joint marketing | A formal agreement between nonaffiliated financial companies that together market financial products and services to you. ● Our joint marketing partners include other financial service companies. |
INVESTMENT ADVISOR
Two Oaks Investment Management, LLC
597 Goshen Avenue
Clovis, CA 93611
ADMINISTRATOR
Gemini Fund Services, LLC
4221 North 203rd Street, Suite 100
Elkhorn, NE 68022
How to Obtain Proxy Voting Information
Information regarding how the Fund votes proxies relating to portfolio securities for the 12 month period ended June 30th as well as a description of the policies and procedures that the Fund used to determine how to vote proxies is available without charge, upon request, by calling 1-855-896-6257 or by referring to the Securities and Exchange Commission’s (“SEC”) website at http://www.sec.gov.
How to Obtain 1st and 3rd Fiscal Quarter Portfolio Holdings
The Fund files its complete schedule of portfolio holdings with the SEC for the first and third quarters of each fiscal year as an exhibit to its reports on Form N-PORT, within sixty days after the end of the period. Form N-PORT reports are available on the SEC’s website at http://www.sec.gov. The information on Form N-PORT is available without charge, upon request, by calling 1-855-896-6257.
For more complete information about the Two Oaks Diversified Growth and Income Fund, including charges and expenses, please call (855) 896-6257 and request a free prospectus. Read the prospectus carefully before you invest or send money. For more information about the Fund’s Board of Trustees, please call or write to request the Fund’s Statement of Additional Information.

TWO OAKS DIVERSIFIED
GROWTH AND INCOME FUND
Annual Report
March 31, 2021
(b) Not applicable.
Item 2. Code of Ethics.
(a) As of the end of the period covered by this report, the registrant has adopted a code of ethics that applies to the registrant's principal executive officer, principal financial officer, principal accounting officer or controller, or persons performing similar functions, regardless of whether these individuals are employed by the registrant or a third party.
(b) For purposes of this item, “code of ethics” means written standards that are reasonably designed to deter wrongdoing and to promote:
| (1) | Honest and ethical conduct, including the ethical handling of actual or apparent conflicts of interest between personal and professional relationships; |
| (2) | Full, fair, accurate, timely, and understandable disclosure in reports and documents that a registrant files with, or submits to, the Commission and in other public communications made by the registrant; |
(3) Compliance with applicable governmental laws, rules, and regulations;
| (4) | The prompt internal reporting of violations of the code to an appropriate person or persons identified in the code; and |
(5) Accountability for adherence to the code.
(c) Amendments: During the period covered by the report, there have not been any amendments to the provisions of the code of ethics.
(d) Waivers: During the period covered by the report, the registrant has not granted any express or implicit waivers from the provisions of the code of ethics.
(e) The Code of Ethics is not posted on Registrant’ website.
(f) A copy of the Code of Ethics is attached as an exhibit.
Item 3. Audit Committee Financial Expert.
(a) The Registrant’s board of trustees has determined that Keith Rhoades is an audit committee financial expert, as defined in Item 3 of Form N-CSR. Mr. Rhoades is independent for purposes of this Item.
Item 4. Principal Accountant Fees and Services.
2021 - $14,500
2020 - $14,500
2021 – None
2020 – None
2021 – $3,000
2020 – $3,000
Preparation of Federal & State income tax returns, assistance with calculation of required income, capital gain and excise distributions and preparation of Federal excise tax returns.
2021 – None
2020 – None
| (e) | (1) Audit Committee’s Pre-Approval Policies |
The registrant’s Audit Committee is required to pre-approve all audit services and, when appropriate, any non-audit services (including audit-related, tax and all other services) to the registrant. The registrant’s Audit Committee also is required to pre-approve, when appropriate, any non-audit services (including audit-related, tax and all other services) to its adviser, or any entity controlling, controlled by or under common control with the adviser that provides ongoing services to the registrant, to the extent that the services may be determined to have an impact on the operations or financial reporting of the registrant. Services are reviewed on an engagement by engagement basis by the Audit Committee.
| (2) | Percentages of Services Approved by the Audit Committee |
| | | 2021 | | 2020 |
| Audit-Related Fees: | | | 0.00 | % | | | 0.00 | % |
| Tax Fees: | | | 0.00 | % | | | 0.00 | % |
| All Other Fees: | | | 0.00 | % | | | 0.00 | % |
| (f) | During the audit of registrant's financial statements for the most recent fiscal year, less than 50 percent of the hours expended on the principal accountant's engagement were attributed to work performed by persons other than the principal accountant's full-time, permanent employees. |
| (g) | The aggregate non-audit fees billed by the registrant's accountant for services rendered to the registrant, and rendered to the registrant's investment adviser (not including any sub-adviser whose role is primarily portfolio management and is subcontracted with or overseen by another investment adviser), and any entity controlling, controlled by, or under common control with the adviser that provides ongoing services to the registrant: |
2021 – $3,000
2020 – $3,000
(h) The registrant's audit committee has considered whether the provision of non-audit services to the registrant's investment adviser (not including any sub-adviser whose role is primarily portfolio management and is subcontracted with or overseen by another investment adviser), and any entity controlling, controlled by, or under common control with the investment adviser that provides ongoing services to the registrant, that were not pre-approved pursuant to paragraph (c)(7)(ii) of Rule 2-01 of Regulation S-X, is compatible with maintaining the principal accountant's independence.
Item 5. Audit Committee of Listed Companies. Not applicable to open-end investment companies.
Item 6. Schedule of Investments. Schedule of investments in securities of unaffiliated issuers is included under Item 1.
Item 7. Disclosure of Proxy Voting Policies and Procedures for Closed-End Funds. Not applicable to open-end investment companies.
Item 8. Portfolio Managers of Closed-End Management Investment Companies. Not applicable to open-end investment companies.
Item 9. Purchases of Equity Securities by Closed-End Funds. Not applicable to open-end investment companies.
Item 10. Submission of Matters to a Vote of Security Holders. None
Item 11. Controls and Procedures.
(a) Based on an evaluation of the Registrant’s disclosure controls and procedures as of a date within 90 days of filing date of this Form N-CSR, the principal executive officer and principal financial officer of the Registrant have concluded that the disclosure controls and procedures of the Registrant are reasonably designed to ensure that the information required in filings on Form N-CSR is recorded, processed, summarized, and reported by the filing date, including that information required to be disclosed is accumulated and communicated to the Registrant’s management, including the Registrant’s principal executive officer and principal financial officer, as appropriate to allow timely decisions regarding required disclosure.
(b) There were no significant changes in the Registrant’s internal control over financial reporting that occurred during the Registrant’s last fiscal half-year that have materially affected, or are reasonably likely to materially affect, the Registrant’s internal control over financial reporting.
Item 12. Disclosure of Securities Lending Activities for Closed-End Management Investment Companies. Not applicable.
Item 13. Exhibits.
(a)(1) Code of Ethics filed herewith.
(a)(2) Certifications required by Section 302 of the Sarbanes-Oxley Act of 2002 (and Item 11(a)(2) of Form N-CSR) are filed herewith.
(a)(3) Not applicable for open-end investment companies.
(b) Certifications required by Section 906 of the Sarbanes-Oxley Act of 2002 (and Item 11(b) of Form N-CSR) are filed herewith.
SIGNATURES
Pursuant to the requirements of the Securities Exchange Act of 1934 and the Investment Company Act of 1940, the registrant has duly caused this report to be signed on its behalf by the undersigned, thereunto duly authorized.
(Registrant) Northern Lights Fund Trust II
By (Signature and Title)
/s/ Kevin E. Wolf
Kevin E. Wolf, Principal Executive Officer/President
Date 6/1/21
Pursuant to the requirements of the Securities Exchange Act of 1934 and the Investment Company Act of 1940, this report has been signed below by the following persons on behalf of the registrant and in the capacities and on the dates indicated.
By (Signature and Title)
/s/ Kevin E. Wolf
Kevin E. Wolf, Principal Executive Officer/President
Date 6/1/21
By (Signature and Title)
/s/ Erik Naviloff
Erik Naviloff, Principal Financial Officer/Treasurer
Date 6/1/21