united states
securities and exchange commission
washington, d.c. 20549
form n-csr
certified shareholder report of registered management
investment companies
Investment Company Act file number 811-22549
Northern Lights Fund Trust II
(Exact name of registrant as specified in charter)
225 Pictoria Dr, Ste 450 Cincinnati, Ohio 45246
(Address of principal executive offices) (Zip code)
Kevin E. Wolf, Gemini Fund Services, LLC.
80 Arkay Drive, Suite 110., Hauppauge, NY 11788
(Name and address of agent for service)
Registrant's telephone number, including area code: 631-470-2600
Date of fiscal year end: 10/31
Date of reporting period: 10/31/21
Item 1. Reports to Stockholders.

Invenomic Fund
Institutional Class
BIVIX
Investor Class
BIVRX
Super Institutional Class
BIVSX
Annual Report
October 31, 2021
1-855-466-3406
www.Invenomic.com
Distributed by Northern Lights Distributors, LLC
Member FINRA
For the 12-month period ending 10/31/2021, the Invenomic Fund (ticker: BIVIX) returned 68.21%, net of fees, to investors compared to 43.66% for the S&P 1500 Index and 20.40% for the Morningstar Long/Short Category Average. The S&P 1500 Value Index returned 42.54% while the S&P 1500 Growth Index returned 45.07%, resulting in growth outperforming value by 2.53% during this period.
Our long portfolio returned 105.6% during this 12-month period while our short portfolio lost 18.0%, gross of fees. As value investors, we tend to be long attractively valued companies with strong free cash flow and short expensive companies with, in our opinion, little chance of being profitable. When the vaccines were announced in November of 2020, we saw a sharp reversal in the price of equities within the value indices. Many investors rotated out of defensive, stay at home stocks and into equites with a greater degree of economic sensitivity. Our portfolio benefited from this rotation, as value had underperformed growth by its widest margin in history at the end of October 2020.
From a sector perspective, Industrials was the biggest contributor during this period adding 11.3%, gross of fees. Net exposure to the Industrials sector averaged 5.6%. Consumer Discretionary was the second strongest contributing sector during this period adding 10.7%, gross of fees. Net exposure to the Consumer Discretionary sector averaged -0.9%. The Energy sector was the third strongest contributing sector during this period adding 9.2%, gross of fees. There were no sectors that detracted from performance during this period.
As we look forward, we continue to see a generational opportunity to profit from shorting stocks. Equity valuations remain at historically high levels. As illustrated in the chart below, non-profitable technology companies have performed exceptionally well, in our opinion, on the back of hopes and dreams. We believe that eventually a company’s profitability will be reflected in its stock price.
Goldman Sachs Non-Profitable Technology Basket (9/12/2014 – 10/31/2021)
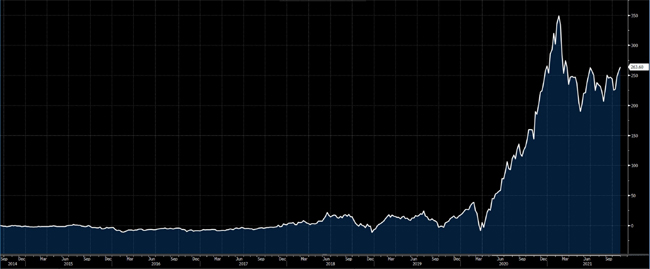
Source: Bloomberg.
We expect equity markets to remain volatile for the foreseeable future. We continue to trust our valuation driven investment process to guide us through these turbulent times. Please do not hesitate to reach out if you have any questions.
5719-NLD-12/3/2021
Invenomic Fund
PORTFOLIO REVIEW (Unaudited)
October 31, 2021
The fund’s performance figures* for the periods ended October 31, 2021, compared to its benchmark:
| | | Annualized | Annualized |
| | One Year | Since Inception (a) | Since Inception (b) |
| Invenomic Fund Institutional Class | 68.21% | N/A | 16.73% |
| Invenomic Fund Investor Class | 68.09% | N/A | 16.47% |
| Invenomic Fund Super Institutional Class | 68.58% | 21.78% | N/A |
| S&P Composite 1500 Total Return Index (c) | 43.66% | 22.48% | 17.21% |
Comparison of the Change in Value of a $50,000 Investment
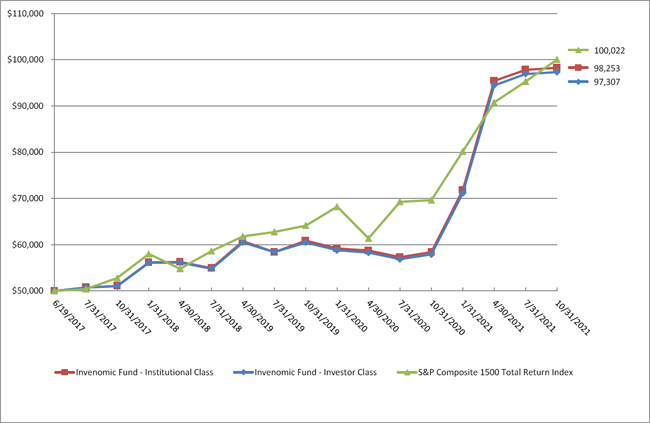
| * | The Performance data quoted is historical. Past performance is no guarantee of future results. Current performance may be higher or lower than the performance data quoted. The principal value and investment return of an investment will fluctuate so that your shares, when redeemed, may be worth more or less than their original cost. The returns shown do not reflect the deduction of taxes that a shareholder would pay on Fund distributions or on the redemptions of Fund shares. Returns greater than 1 year are annualized. The total operating expenses as stated in the fee table to the Fund’s prospectus dated March 1, 2021 are 2.98%, 3.23% and 2.73% for the Institutional Class, Investor Class and Super Institutional Class, respectively. For performance information current to the most recent month-end, please call 1-855-466-3406. |
| (a) | Inception date is May 10, 2019. |
| (b) | Inception date is June 19, 2017 |
| (c) | The S&P Composite 1500 Total Return Index combines three leading indices, the S&P 500, the S&P MidCap 400, and the S&P SmallCap 600, to cover approximately 90% of U.S. market capitalization. It is designed for investors seeking to replicate the performance of the U.S. equity market or benchmark against a representative universe of tradable stocks. Index returns assume reinvestment of dividends. Investors may not invest in the Index directly; unlike the Fund’s returns, the Index does not reflect any fees or expenses. |
| Holdings By Industry/Asset Type (1) | | % of Net Assets | |
| Health Care Facilities & Services | | | 8.1 | % |
| Chemicals | | | 6.9 | % |
| Metals & Mining | | | 5.9 | % |
| Oil & Gas Producers | | | 5.6 | % |
| Commercial Support Services | | | 5.0 | % |
| Telecommunications | | | 4.9 | % |
| Insurance | | | 4.8 | % |
| Banking | | | 4.6 | % |
| Retail - Discretionary | | | 4.2 | % |
| Consumer Services | | | 4.2 | % |
| Other Assets Less Liabilities | | | 45.8 | % |
| | | | 100.0 | % |
| (1) | Does not include securities sold short and derivatives in which the fund invests. |
Please refer to the Portfolio of Investments in this annual report for a detailed analysis of the Fund’s holdings.
| INVENOMIC FUND |
| SCHEDULE OF INVESTMENTS |
| October 31, 2021 |
| Shares | | | | | Fair Value | |
| | | | | CLOSED END FUNDS — 0.5% | | | | |
| | | | | MIXED ALLOCATION - 0.5% | | | | |
| | 127,172 | | | Goldman Sachs MLP Energy and Renaissance Fund | | $ | 1,426,870 | |
| | | | | | | | | |
| | | | | TOTAL CLOSED END FUNDS (Cost $1,197,882) | | | 1,426,870 | |
| | | | | | | | | |
| | | | | COMMON STOCKS — 109.0% | | | | |
| | | | | ADVERTISING & MARKETING - 0.0%(b) | | | | |
| | 4,406 | | | Tenerity, Inc.(c),(e) | | | — | |
| | | | | | | | | |
| | | | | APPAREL & TEXTILE PRODUCTS - 0.8% | | | | |
| | 27,380 | | | Capri Holdings Ltd.(a),(c) | | | 1,457,711 | |
| | 32,908 | | | Weyco Group, Inc. | | | 750,961 | |
| | | | | | | | 2,208,672 | |
| | | | | ASSET MANAGEMENT - 2.0% | | | | |
| | 13,204 | | | Diamond Hill Investment Group, Inc. | | | 2,863,419 | |
| | 7,050 | | | GoldMoney, Inc.(c) | | | 13,536 | |
| | 181,056 | | | Silvercrest Asset Management Group, Inc. | | | 2,896,896 | |
| | | | | | | | 5,773,851 | |
| | | | | AUTOMOTIVE - 4.0% | | | | |
| | 21,576 | | | BorgWarner, Inc. | | | 972,430 | |
| | 40,585 | | | Continental A.G.(a),(c) | | | 4,768,092 | |
| | 46,658 | | | Cooper-Standard Holdings, Inc.(c) | | | 1,210,309 | |
| | 51,521 | | | Holley, Inc.(c) | | | 561,579 | |
| | 6,896 | | | Lear Corporation(d) | | | 1,185,078 | |
| | 84,040 | | | Tenneco, Inc.(a),(c) | | | 1,115,211 | |
| | 28,865 | | | Vitesco Technologies Group A.G.(a),(c) | | | 1,656,840 | |
| | | | | | | | 11,469,539 | |
| | | | | BANKING - 4.6% | | | | |
| | 8,940 | | | Bank7 Corporation | | | 242,274 | |
| | 3,894 | | | CB Financial Services, Inc. | | | 93,456 | |
| | 311,361 | | | First BanCorporation(a) | | | 4,250,078 | |
| | 5,012 | | | Oak Valley Bancorp | | | 86,457 | |
| | 27,718 | | | OP Bancorp | | | 307,115 | |
| | 85,015 | | | Popular, Inc.(a) | | | 6,923,622 | |
| | | | | | | | | |
See accompanying notes to financial statements.
| INVENOMIC FUND |
| SCHEDULE OF INVESTMENTS (Continued) |
| October 31, 2021 |
| Shares | | | | | Fair Value | |
| | | | | COMMON STOCKS — 109.0% (Continued) | | | | |
| | | | | BANKING - 4.6% (Continued) | | | | |
| | 42,629 | | | TrustCompany Bank Corp. NY | | $ | 1,430,629 | |
| | | | | | | | 13,333,631 | |
| | | | | BEVERAGES - 0.6% | | | | |
| | 40,246 | | | Molson Coors Beverage Company(a)(d) | | | 1,774,446 | |
| | | | | | | | | |
| | | | | BIOTECH & PHARMA - 3.4% | | | | |
| | 113,808 | | | Bausch Health Companies, Inc.(a),(c) | | | 3,195,729 | |
| | 83,546 | | | Bayer A.G.(a) | | | 4,705,594 | |
| | 302,295 | | | Lexaria Bioscience Corporation(a),(c)(d) | | | 1,871,206 | |
| | 65,144 | | | Medexus Pharmaceuticals, Inc.(c) | | | 173,956 | |
| | | | | | | | 9,946,485 | |
| | | | | CHEMICALS - 6.9% | | | | |
| | 96,693 | | | AgroFresh Solutions, Inc.(c) | | | 196,287 | |
| | 18,584 | | | American Vanguard Corporation | | | 289,539 | |
| | 61,475 | | | Cabot Corporation(a) | | | 3,279,691 | |
| | 55,468 | | | Imerys S.A.(a) | | | 2,405,856 | |
| | 223,576 | | | Koppers Holdings, Inc.(a),(c) | | | 7,845,281 | |
| | 191,404 | | | Tronox Holdings PLC(a) | | | 4,463,541 | |
| | 68,779 | | | Valhi, Inc.(a) | | | 1,592,922 | |
| | | | | | | | 20,073,117 | |
| | | | | COMMERCIAL SUPPORT SERVICES - 5.0% | | | | |
| | 80,981 | | | Civeo Corporation(a),(c) | | | 1,827,741 | |
| | 338,686 | | | H&R Block, Inc.(a)(d) | | | 7,813,487 | |
| | 64,339 | | | Impellam Group PLC(c) | | | 445,373 | |
| | 344,156 | | | Mears Group PLC | | | 934,069 | |
| | 133,367 | | | TrueBlue, Inc.(a),(c)(d) | | | 3,714,272 | |
| | | | | | | | 14,734,942 | |
| | | | | CONSTRUCTION MATERIALS - 0.9% | | | | |
| | 33,837 | | | HeidelbergCement A.G. | | | 2,550,745 | |
| | | | | | | | | |
| | | | | CONSUMER SERVICES - 4.2% | | | | |
| | 120,024 | | | Adtalem Global Education, Inc.(c)(d) | | | 4,432,486 | |
| | 211,928 | | | Stride, Inc.(a),(c)(d) | | | 7,523,444 | |
| | | | | | | | 11,955,930 | |
| | | | | | | | | |
See accompanying notes to financial statements.
| INVENOMIC FUND |
| SCHEDULE OF INVESTMENTS (Continued) |
| October 31, 2021 |
| Shares | | | | | Fair Value | |
| | | | | COMMON STOCKS — 109.0% (Continued) | | | | |
| | | | | E-COMMERCE DISCRETIONARY - 1.4% | | | | |
| | 24,755 | | | Alibaba Group Holding Ltd. - ADR(a),(c) | | $ | 4,083,089 | |
| | | | | | | | | |
| | | | | ELECTRIC UTILITIES - 1.9% | | | | |
| | 140,375 | | | FirstEnergy Corporation(a) | | | 5,408,649 | |
| | | | | | | | | |
| | | | | ELECTRICAL EQUIPMENT - 1.6% | | | | |
| | 55,083 | | | Belden, Inc.(a) | | | 3,316,547 | |
| | 18,659 | | | Preformed Line Products Company(a) | | | 1,294,935 | |
| | | | | | | | 4,611,482 | |
| | | | | ENGINEERING & CONSTRUCTION - 2.0% | | | | |
| | 501,028 | | | Mistras Group, Inc.(a),(c) | | | 4,920,094 | |
| | 215,046 | | | Orion Group Holdings, Inc.(c) | | | 956,955 | |
| | | | | | | | 5,877,049 | |
| | | | | ENTERTAINMENT CONTENT - 1.4% | | | | |
| | 109,401 | | | Corus Entertainment, Inc.(a) | | | 495,131 | |
| | 91,349 | | | Discovery, Inc. - Series C(a),(c)(d) | | | 2,060,834 | |
| | 15,984 | | | ViacomCBS, Inc., Class B | | | 578,940 | |
| | 115,087 | | | Zynga, Inc., Class A(c) | | | 849,342 | |
| | | | | | | | 3,984,247 | |
| | | | | FOOD - 1.9% | | | | |
| | 74,230 | | | Herbalife Nutrition Ltd.(a),(c) | | | 3,444,272 | |
| | 38,201 | | | Seneca Foods Corporation(a),(c) | | | 1,972,318 | |
| | | | | | | | 5,416,590 | |
| | | | | FORESTRY, PAPER & WOOD PRODUCTS - 0.4% | | | | |
| | 31,163 | | | Schweitzer-Mauduit International, Inc. | | | 1,085,719 | |
| | | | | | | | | |
| | | | | GAS & WATER UTILITIES - 0.9% | | | | |
| | 62,203 | | | UGI Corporation | | | 2,700,232 | |
| | | | | | | | | |
| | | | | HEALTH CARE FACILITIES & SERVICES - 8.1% | | | | |
| | 137,495 | | | Cardinal Health, Inc.(a) | | | 6,573,636 | |
| | 19,742 | | | Cigna Corporation(a) | | | 4,217,089 | |
| | 19,863 | | | McKesson Corporation(a) | | | 4,129,120 | |
| | 106,170 | | | Psychemedics Corporation(c) | | | 882,273 | |
| | | | | | | | | |
See accompanying notes to financial statements.
| INVENOMIC FUND |
| SCHEDULE OF INVESTMENTS (Continued) |
| October 31, 2021 |
| Shares | | | | | Fair Value | |
| | | | | COMMON STOCKS — 109.0% (Continued) | | | | |
| | | | | HEALTH CARE FACILITIES & SERVICES - 8.1% (Continued) | | | | |
| | 230,492 | | | Triple-S Management Corporation(a),(c) | | $ | 8,134,063 | |
| | | | | | | | 23,936,181 | |
| | | | | HOME & OFFICE PRODUCTS - 3.2% | | | | |
| | 110,132 | | | Hamilton Beach Brands Holding Company(a) | | | 1,651,980 | |
| | 132,022 | | | Societe BIC S.A.(a) | | | 7,677,323 | |
| | | | | | | | 9,329,303 | |
| | | | | HOME CONSTRUCTION - 2.3% | | | | |
| | 219,291 | | | Caesarstone Ltd.(a) | | | 2,736,752 | |
| | 24,313 | | | Century Communities, Inc. | | | 1,630,430 | |
| | 117,052 | | | Cornerstone Building Brands, Inc.(a),(c) | | | 1,675,014 | |
| | 80,045 | | | Landsea Homes Corporation(c) | | | 724,407 | |
| | | | | | | | 6,766,603 | |
| | | | | INDUSTRIAL INTERMEDIATE PRODUCTION - 0.2% | | | | |
| | 18,925 | | | Strattec Security Corporation(c) | | | 656,130 | |
| | 682 | | | TerraVest Industries, Inc. | | | 14,278 | |
| | | | | | | | 670,408 | |
| | | | | INSURANCE - 4.8% | | | | |
| | 20,940 | | | MetLife, Inc.(a) | | | 1,315,032 | |
| | 53,070 | | | Prudential Financial, Inc.(a) | | | 5,840,354 | |
| | 59,133 | | | Reinsurance Group of America, Inc.(a) | | | 6,982,424 | |
| | | | | | | | 14,137,810 | |
| | | | | INTERNET MEDIA & SERVICES - 2.3% | | | | |
| | 8,799 | | | Airbnb, Inc.(c)(d) | | | 1,501,637 | |
| | 19,501 | | | Groupon, Inc.(c)(d) | | | 413,811 | |
| | 63,869 | | | HyreCar, Inc.(a),(c) | | | 433,671 | |
| | 355,665 | | | Travelzoo(a),(c) | | | 3,649,122 | |
| | 20,002 | | | Uber Technologies, Inc.(c)(d) | | | 876,488 | |
| | | | | | | | 6,874,729 | |
| | | | | LEISURE FACILITIES & SERVICES - 2.6% | | | | |
| | 407,825 | | | Del Taco Restaurants, Inc.(a) | | | 3,401,261 | |
| | 35,879 | | | Dine Brands Global, Inc.(a),(c) | | | 3,032,134 | |
| | 66,726 | | | Xponential Fitness, Inc.(c) | | | 1,127,669 | |
| | | | | | | | 7,561,064 | |
| | | | | | | | | |
See accompanying notes to financial statements.
| INVENOMIC FUND |
| SCHEDULE OF INVESTMENTS (Continued) |
| October 31, 2021 |
| Shares | | | | | Fair Value | |
| | | | | COMMON STOCKS — 109.0% (Continued) | | | | |
| | | | | MACHINERY - 0.8% | | | | |
| | 43,628 | | | Hurco Companies, Inc. | | $ | 1,415,729 | |
| | 168,454 | | | NN, Inc.(c) | | | 840,585 | |
| | | | | | | | 2,256,314 | |
| | | | | MEDICAL EQUIPMENT & DEVICES - 1.0% | | | | |
| | 65,695 | | | Fonar Corporation(c)(d) | | | 1,051,120 | |
| | 35,633 | | | Natus Medical, Inc.(c) | | | 892,607 | |
| | 234,605 | | | Sensus Healthcare, Inc.(a),(c) | | | 938,420 | |
| | | | | | | | 2,882,147 | |
| | | | | METALS & MINING - 5.9% | | | | |
| | 1,254,844 | | | Argonaut Gold, Inc.(a),(c) | | | 3,178,742 | |
| | 3,672,228 | | | Bushveld Minerals Ltd.(c) | | | 528,540 | |
| | 31,237 | | | Eldorado Gold Corporation(c) | | | 279,884 | |
| | 479,581 | | | Ferroglobe PLC(c) | | | 3,179,622 | |
| | 239,416 | | | Gold Standard Ventures Corporation(c) | | | 112,526 | |
| | 1,164,509 | | | Kinross Gold Corporation(a) | | | 6,998,698 | |
| | 1,732,989 | | | OceanaGold Corporation(a),(c) | | | 3,229,562 | |
| | 33,841 | | | Osisko Mining, Inc.(c) | | | 73,435 | |
| | | | | | | | 17,581,009 | |
| | | | | OIL & GAS PRODUCERS - 5.6% | | | | |
| | 97,268 | | | Bonanza Creek Energy, Inc.(a)(d) | | | 5,460,625 | |
| | 499,851 | | | Crescent Point Energy Corporation | | | 2,514,251 | |
| | 113,598 | | | Ovintiv, Inc.(a) | | | 4,262,197 | |
| | 147,509 | | | World Fuel Services Corporation(a)(d) | | | 4,503,450 | |
| | | | | | | | 16,740,523 | |
| | | | | OIL & GAS SERVICES & EQUIPMENT - 1.6% | | | | |
| | 111,521 | | | Halliburton Company(d) | | | 2,786,910 | |
| | 188,608 | | | US Silica Holdings, Inc.(c) | | | 1,825,725 | |
| | | | | | | | 4,612,635 | |
| | | | | REAL ESTATE OWNERS & DEVELOPERS - 0.5% | | | | |
| | 6,537 | | | Black Diamond Group Ltd.(c) | | | 23,890 | |
| | 16,035 | | | Howard Hughes Corporation (a),(c) | | | 1,397,129 | |
| | | | | | | | 1,421,019 | |
| | | | | | | | | |
See accompanying notes to financial statements.
| INVENOMIC FUND |
| SCHEDULE OF INVESTMENTS (Continued) |
| October 31, 2021 |
| Shares | | | | | Fair Value | |
| | | | | COMMON STOCKS — 109.0% (Continued) | | | | |
| | | | | REAL ESTATE SERVICES - 0.4% | | | | |
| | 29,577 | | | RMR Group, Inc.(a) | | $ | 1,028,984 | |
| | | | | | | | | |
| | | | | RENEWABLE ENERGY - 0.0%(b) | | | | |
| | 47,109 | | | Broadwind, Inc.(c)(d) | | | 137,087 | |
| | | | | | | | | |
| | | | | RETAIL - CONSUMER STAPLES - 1.5% | | | | |
| | 38,505 | | | Dollar Tree, Inc.(a),(c)(d) | | | 4,149,299 | |
| | | | | | | | | |
| | | | | RETAIL - DISCRETIONARY - 4.2% | | | | |
| | 17,582 | | | Foot Locker, Inc.(a) | | | 838,134 | |
| | 46,665 | | | Gaia, Inc.(c) | | | 452,651 | |
| | 79,115 | | | Gap, Inc.(d) | | | 1,795,119 | |
| | 88,065 | | | JOANN, Inc.(d) | | | 900,024 | |
| | 1,731,389 | | | Marks & Spencer Group PLC(a),(c) | | | 4,357,385 | |
| | 632,915 | | | Roots Corporation(c) | | | 1,485,848 | |
| | 110,987 | | | Sally Beauty Holdings, Inc.(c)(d) | | | 1,693,662 | |
| | 1,135,852 | | | SIG PLC(c) | | | 808,846 | |
| | | | | | | | 12,331,669 | |
| | | | | SEMICONDUCTORS - 1.5% | | | | |
| | 183,653 | | | Hensoldt A.G. | | | 2,971,205 | |
| | 10,042 | | | QUALCOMM, Inc. | | | 1,335,988 | |
| | | | | | | | 4,307,193 | |
| | | | | SOFTWARE - 3.4% | | | | |
| | 237,049 | | | Amesite, Inc.(c)(d) | | | 391,131 | |
| | 952,796 | | | Immersion Corporation(a),(c)(d) | | | 7,612,840 | |
| | 89,001 | | | Xperi Holding Corporation(a) | | | 1,594,898 | |
| | 200,344 | | | Zovio, Inc.(c) | | | 344,592 | |
| | | | | | | | 9,943,461 | |
| | | | | STEEL - 0.8% | | | | |
| | 157,612 | | | TimkenSteel Corporation(a),(c) | | | 2,198,687 | |
| | | | | | | | | |
| | | | | TECHNOLOGY HARDWARE - 2.2% | | | | |
| | 467,346 | | | Celestica, Inc.(a),(c) | | | 4,589,337 | |
| | 108,608 | | | PlayAGS, Inc.(c) | | | 957,923 | |
| | | | | | | | | |
See accompanying notes to financial statements.
| INVENOMIC FUND |
| SCHEDULE OF INVESTMENTS (Continued) |
| October 31, 2021 |
| Shares | | | | | Fair Value | |
| | | | | COMMON STOCKS — 109.0% (Continued) | | | | |
| | | | | TECHNOLOGY HARDWARE - 2.2% (Continued) | | | | |
| | 27,478 | | | Sanmina Corporation(a),(c)(d) | | $ | 1,037,295 | |
| | | | | | | | 6,584,555 | |
| | | | | TECHNOLOGY SERVICES - 1.9% | | | | |
| | 44,684 | | | Cass Information Systems, Inc.(d) | | | 1,831,597 | |
| | 213,266 | | | Priority Technology Holdings, Inc.(a),(c) | | | 1,126,044 | |
| | 240,259 | | | Sabre Corporation(c)(d) | | | 2,493,888 | |
| | | | | | | | 5,451,529 | |
| | | | | TELECOMMUNICATIONS - 4.9% | | | | |
| | 5,272,866 | | | Airtel Africa PLC(a) | | | 7,921,655 | |
| | 173,134 | | | AT&T, Inc.(a) | | | 4,373,365 | |
| | 60,386 | | | EchoStar Corporation(a),(c) | | | 1,416,656 | |
| | 18,065 | | | Lumen Technologies, Inc.(a) | | | 214,251 | |
| | 100,142 | | | VEON Ltd. - ADR(c) | | | 211,300 | |
| | | | | | | | 14,137,227 | |
| | | | | TOBACCO & CANNABIS - 1.6% | | | | |
| | 66,465 | | | Imperial Brands PLC | | | 1,404,869 | |
| | 410,894 | | | Swedish Match A.B. - ADR(a) | | | 3,615,867 | |
| | | | | | | | 5,020,736 | |
| | | | | TRANSPORTATION & LOGISTICS - 3.8% | | | | |
| | 29,267 | | | Atlas Air Worldwide Holdings, Inc.(a),(c)(d) | | | 2,374,138 | |
| | 27,293 | | | Bristow Group, Inc.(c)(d) | | | 944,338 | |
| | 122,127 | | | Capital Product Partners, L.P. | | | 1,648,715 | |
| | 180,541 | | | John Menzies PLC(c) | | | 737,481 | |
| | 20,279 | | | Knight-Swift Transportation Holdings, Inc.(d) | | | 1,149,617 | |
| | 244,050 | | | Radiant Logistics, Inc.(a),(c) | | | 1,642,456 | |
| | 46,441 | | | Schneider National, Inc. | | | 1,158,239 | |
| | 61,250 | | | Universal Logistics Holdings, Inc. | | | 1,291,150 | |
| | | | | | | | 10,946,134 | |
| | | | | | | | | |
| | | | | TOTAL COMMON STOCKS (Cost $281,061,857) | | | 317,994,721 | |
| | | | | | | | | |
See accompanying notes to financial statements.
| INVENOMIC FUND |
| SCHEDULE OF INVESTMENTS (Continued) |
| October 31, 2021 |
| Shares | | | | | | | | | | Fair Value | |
| | | | | EXCHANGE-TRADED FUNDS — 0.9% | | | | | | | | | | |
| | | | | EQUITY - 0.9% | | | | | | | | | | |
| | 66,283 | | | VanEck Vectors Junior Gold Miners ETF(d) | | | | | | | | $ | 2,868,065 | |
| | | | | | | | | | | | | | | |
| | | | | TOTAL EXCHANGE-TRADED FUNDS (Cost $2,695,240) | | | | | | | | | 2,868,065 | |
| | | | | | | | | | | | | | | |
| | | | | | | Expiration Date | | Exercise Price | | | | | |
| | | | | WARRANTS — 0.3% | | | | | | | | | | |
| | | | | ASSET MANAGEMENT - 0.3% | | | | | | | | | | |
| | 205,936 | | | Gores Metropoulos II, Inc. | | 01/31/2028 | | $ | 11.50 | | | | 374,804 | |
| | 289,602 | | | Merida Merger Corp I | | 11/07/2026 | | $ | 11.50 | | | | 611,060 | |
| | | | | | | | | | | | | | 985,864 | |
| | | | | | | | | | | | | | | |
| | | | | TOTAL WARRANTS (Cost $633,177) | | | | | | | | | 985,864 | |
| | | | | | | | | | | | | | | |
| | | | | SHORT-TERM INVESTMENTS — 13.2% | | | | | | | | | | |
| | | | | COLLATERAL FOR SECURITIES LOANED - 7.0% | | | | | | | | | | |
| | 20,517,527 | | | Mount Vernon Liquid Assets Portfolio, 0.10% (Cost $20,517,527)(f),(g) | | | | | | | | | 20,517,527 | |
| | | | | | | | | | | | | | | |
| | | | | MONEY MARKET FUND - 6.2% | | | | | | | | | | |
| | 18,198,294 | | | First American Government Obligations Fund, Class X, 0.03% (Cost $18,198,294)(g) | | | | | | | | | 18,198,294 | |
| | | | | | | | | | | | | | | |
| | | | | TOTAL SHORT-TERM INVESTMENTS (Cost $38,715,821) | | | | | | | | | 38,715,821 | |
| Contracts(h) | | | | | Counterparty | | Expiration Date | | Exercise Price | | | Notional Value | | | | |
| | | | | EQUITY OPTIONS PURCHASED - 0.4% | | | | | | | | | | | | | | | | |
| | | | | CALL OPTIONS PURCHASED - 0.2% | | | | | | | | | | | | | | | | |
| | 1,881 | | | H&R Block, Inc. | | GOL | | 01/21/2022 | | $ | 20 | | | $ | 4,339,467 | | | | 620,730 | |
| | | | | TOTAL CALL OPTIONS PURCHASED (Cost - $249,676) | | | | | | | | | | | | | | | | |
| | | | | | | | | | | | | | | | | | | | | |
| | | | | PUT OPTIONS PURCHASED - 0.2% | | | | | | | | | | | | | | | | |
| | 4,080 | | | Invesco Nasdaq Next Gen 100 ETF | | GOL | | 11/19/2021 | | $ | 31 | | | $ | 14,263,680 | | | | 30,600 | |
| | 7,305 | | | Invesco Nasdaq Next Gen 100 ETF | | GOL | | 11/19/2021 | | | 32 | | | | 25,538,280 | | | | 91,312 | |
| | 1,443 | | | Invesco Nasdaq Next Gen 100 ETF | | GOL | | 11/19/2021 | | | 33 | | | | 5,044,728 | | | | 28,860 | |
| | 6,829 | | | Invesco Nasdaq Next Gen 100 ETF | | GOL | | 12/17/2021 | | | 32 | | | | 23,874,184 | | | | 204,870 | |
| | 1,399 | | | SPDR S&P Retail ETF | | GOL | | 12/17/2021 | | | 81 | | | | 13,191,171 | | | | 235,032 | |
| | | | | TOTAL PUT OPTIONS PURCHASED (Cost - $760,658) | | | | | | | | | | | | | | | 590,674 | |
| | | | | | | | | | | | | | | | | | | | | |
See accompanying notes to financial statements.
| INVENOMIC FUND |
| SCHEDULE OF INVESTMENTS (Continued) |
| October 31, 2021 |
| | | | | | Fair Value | |
| | | | | | | | | |
| | | | | TOTAL EQUITY OPTIONS PURCHASED (Cost - $1,010,334) | | $ | 1,211,404 | |
| | | | | | | | | |
| | | | | TOTAL INVESTMENTS - 124.3% (Cost $325,314,311) | | $ | 363,202,745 | |
| | | | | LIABILITIES IN EXCESS OF OTHER ASSETS - (24.3)% | | | (70,377,953 | ) |
| | | | | NET ASSETS - 100.0% | | $ | 292,824,792 | |
| | | | | | | | | |
| Shares | | | | | | | |
| | | | | SECURITIES SOLD SHORT — (94.3)% | | | | |
| | | | | COMMON STOCKS — (92.7)% | | | | |
| | | | | ADVERTISING & MARKETING - (1.3)% | | | | |
| | (14,281 | ) | | Cardlytics, Inc. | | $ | (1,123,343 | ) |
| | (38,289 | ) | | ZoomInfo Technologies, Inc. | | | (2,573,787 | ) |
| | | | | | | | (3,697,130 | ) |
| | | | | AEROSPACE & DEFENSE - (1.1)% | | | | |
| | (15,584 | ) | | Boeing Company | | | (3,226,356 | ) |
| | | | | | | | | |
| | | | | APPAREL & TEXTILE PRODUCTS - (2.1)% | | | | |
| | (61,818 | ) | | Canada Goose Holdings, Inc. | | | (2,293,448 | ) |
| | (11,809 | ) | | Crocs, Inc. | | | (1,906,563 | ) |
| | (50,142 | ) | | Figs, Inc. | | | (1,685,273 | ) |
| | | | | | | | (5,885,284 | ) |
| | | | | ASSET MANAGEMENT - (1.3)% | | | | |
| | (21,447 | ) | | Hamilton Lane, Inc. | | | (2,241,426 | ) |
| | (33,079 | ) | | StepStone Group, Inc. | | | (1,554,051 | ) |
| | | | | | | | (3,795,477 | ) |
| | | | | AUTOMOTIVE - (2.2)% | | | | |
| | (130,310 | ) | | Canoo, Inc. | | | (1,045,086 | ) |
| | | | | | | | | |
See accompanying notes to financial statements.
| INVENOMIC FUND |
| SCHEDULE OF INVESTMENTS (Continued) |
| October 31, 2021 |
| Shares | | | | | Fair Value | |
| | | | | SECURITIES SOLD SHORT — (94.3)% (Continued) | | | | |
| | | | | COMMON STOCKS — (92.7)% (Continued) | | | | |
| | | | | AUTOMOTIVE - (2.2)% (Continued) | | | | |
| | (94,722 | ) | | Luminar Technologies, Inc. | | $ | (1,552,494 | ) |
| | (17,037 | ) | | QuantumScape Corporation | | | (493,051 | ) |
| | (2,826 | ) | | Tesla, Inc. | | | (3,148,164 | ) |
| | | | | | | | (6,238,795 | ) |
| | | | | BANKING - (0.9)% | | | | |
| | (52,084 | ) | | First Financial Bankshares, Inc. | | | (2,641,700 | ) |
| | | | | | | | | |
| | | | | BEVERAGES - (0.7)% | | | | |
| | (172,435 | ) | | Zevia PBC | | | (1,929,548 | ) |
| | | | | | | | | |
| | | | | BIOTECH & PHARMA - (1.7)% | | | | |
| | (13,857 | ) | | Heska Corporation | | | (3,097,455 | ) |
| | (14,927 | ) | | Twist Bioscience Corporation | | | (1,773,328 | ) |
| | | | | | | | (4,870,783 | ) |
| | | | | CHEMICALS - (1.6)% | | | | |
| | (171,473 | ) | | Amyris, Inc. | | | (2,541,230 | ) |
| | (77,270 | ) | | Danimer Scientific, Inc. | | | (1,140,505 | ) |
| | (3,555 | ) | | WD-40 Company | | | (806,985 | ) |
| | | | | | | | (4,488,720 | ) |
| | | | | COMMERCIAL SUPPORT SERVICES - (2.1)% | | | | |
| | (14,072 | ) | | Avalara, Inc. | | | (2,527,894 | ) |
| | (60,216 | ) | | R1 RCM, Inc. | | | (1,306,687 | ) |
| | (64,274 | ) | | Rollins, Inc. | | | (2,264,373 | ) |
| | | | | | | | (6,098,954 | ) |
| | | | | CONSTRUCTION MATERIALS - (0.2)% | | | | |
| | (5,680 | ) | | Advanced Drainage Systems, Inc. | | | (640,704 | ) |
| | | | | | | | | |
| | | | | CONSUMER SERVICES - (0.2)% | | | | |
| | (11,402 | ) | | Chegg, Inc. | | | (677,735 | ) |
| | | | | | | | | |
| | | | | E-COMMERCE DISCRETIONARY - (1.3)% | | | | |
| | (13,780 | ) | | Chewy, Inc. | | | (1,044,524 | ) |
| | (30,914 | ) | | Global-e Online Ltd. | | | (1,788,684 | ) |
| | | | | | | | | |
See accompanying notes to financial statements.
| INVENOMIC FUND |
| SCHEDULE OF INVESTMENTS (Continued) |
| October 31, 2021 |
| Shares | | | | | Fair Value | |
| | | | | SECURITIES SOLD SHORT — (94.3)% (Continued) | | | | |
| | | | | COMMON STOCKS — (92.7)% (Continued) | | | | |
| | | | | E-COMMERCE DISCRETIONARY - (1.3)% (Continued) | | | | |
| | (4,160 | ) | | Wayfair, Inc. | | $ | (1,036,256 | ) |
| | | | | | | | (3,869,464 | ) |
| | | | | ELECTRICAL EQUIPMENT - (1.7)% | | | | |
| | (6,517 | ) | | AAON, Inc. | | | (466,943 | ) |
| | (9,426 | ) | | Mesa Laboratories, Inc. | | | (2,881,528 | ) |
| | (125,122 | ) | | SmartRent, Inc. | | | (1,642,852 | ) |
| | | | | | | | (4,991,323 | ) |
| | | | | ENGINEERING & CONSTRUCTION - (0.5)% | | | | |
| | (20,528 | ) | | Montrose Environmental Group, Inc. | | | (1,407,194 | ) |
| | | | | | | | | |
| | | | | ENTERTAINMENT CONTENT - (0.3)% | | | | |
| | (8,415 | ) | | AppLovin Corporation | | | (826,774 | ) |
| | | | | | | | | |
| | | | | FOOD - (1.7)% | | | | |
| | (29,387 | ) | | Beyond Meat, Inc. | | | (2,908,725 | ) |
| | (160,929 | ) | | Oatly Group A.B. - ADR | | | (2,074,375 | ) |
| | | | | | | | (4,983,100 | ) |
| | | | | FORESTRY, PAPER & WOOD PRODUCTS - (1.4)% | | | | |
| | (36,706 | ) | | Trex Company, Inc. | | | (3,905,518 | ) |
| | | | | | | | | |
| | | | | HEALTH CARE FACILITIES & SERVICES - (3.1)% | | | | |
| | (39,696 | ) | | Accolade, Inc. | | | (1,579,504 | ) |
| | (17,371 | ) | | Apollo Medical Holdings, Inc. | | | (1,192,172 | ) |
| | (128,840 | ) | | dentalcorp Holdings Ltd. | | | (1,725,420 | ) |
| | (12,538 | ) | | Joint Corporation | | | (1,096,824 | ) |
| | (34,202 | ) | | NeoGenomics, Inc. | | | (1,573,292 | ) |
| | (49,408 | ) | | Surgery Partners, Inc. | | | (2,032,645 | ) |
| | | | | | | | (9,199,857 | ) |
| | | | | HOME & OFFICE PRODUCTS - (1.2)% | | | | |
| | (77,794 | ) | | Tempur Sealy International, Inc. | | | (3,459,499 | ) |
| | | | | | | | | |
See accompanying notes to financial statements.
| INVENOMIC FUND |
| SCHEDULE OF INVESTMENTS (Continued) |
| October 31, 2021 |
| Shares | | | | | Fair Value | |
| | | | | SECURITIES SOLD SHORT — (94.3)% (Continued) | | | | |
| | | | | COMMON STOCKS — (92.7)% (Continued) | | | | |
| | | | | HOUSEHOLD PRODUCTS - (0.7)% | | | | |
| | (59,422 | ) | | elf Beauty, Inc. | | $ | (1,919,925 | ) |
| | | | | | | | | |
| | | | | INDUSTRIAL INTERMEDIATE PRODUCTS - (1.0)% | | | | |
| | (14,995 | ) | | Omega Flex, Inc. | | | (2,170,677 | ) |
| | (18,303 | ) | | Xometry, Inc. | | | (988,362 | ) |
| | | | | | | | (3,159,039 | ) |
| | | | | INDUSTRIAL REIT - (0.2)% | | | | |
| | (9,910 | ) | | Terreno Realty Corporation | | | (724,718 | ) |
| | | | | | | | | |
| | | | | INSURANCE - (1.9)% | | | | |
| | (15,125 | ) | | Goosehead Insurance, Inc. | | | (2,182,538 | ) |
| | (26,896 | ) | | Lemonade, Inc. | | | (1,671,855 | ) |
| | (7,330 | ) | | RLI Corporation | | | (793,912 | ) |
| | (8,344 | ) | | Trupanion, Inc. | | | (854,426 | ) |
| | | | | | | | (5,502,731 | ) |
| | | | | INTERNET MEDIA & SERVICES - (5.7)% | | | | |
| | (90,338 | ) | | Angi, Inc. | | | (1,131,935 | ) |
| | (15,481 | ) | | DoorDash, Inc. | | | (3,015,699 | ) |
| | (9,440 | ) | | Fiverr International Ltd. | | | (1,608,104 | ) |
| | (81,072 | ) | | Hemnet Group A.B. | | | (1,622,195 | ) |
| | (4,927 | ) | | Netflix, Inc. | | | (3,401,157 | ) |
| | (182,910 | ) | | Opendoor Technologies, Inc. | | | (4,336,797 | ) |
| | (4,118 | ) | | Snap, Inc. | | | (216,524 | ) |
| | (4,891 | ) | | Spotify Technology S.A. | | | (1,415,455 | ) |
| | | | | | | | (16,747,866 | ) |
| | | | | LEISURE FACILITIES & SERVICES - (3.9)% | | | | |
| | (108,521 | ) | | AMC Entertainment Holdings, Inc. | | | (3,838,387 | ) |
| | (15,698 | ) | | DraftKings, Inc. | | | (731,370 | ) |
| | (2,774 | ) | | Dutch Bros, Inc. | | | (211,490 | ) |
| | (26,710 | ) | | First Watch Restaurant Group, Inc. | | | (576,402 | ) |
| | (12,362 | ) | | Planet Fitness, Inc. | | | (983,397 | ) |
| | (36,510 | ) | | Shake Shack, Inc. | | | (2,525,397 | ) |
| | (3,440 | ) | | Vail Resorts, Inc. | | | (1,185,802 | ) |
| | | | | | | | | |
See accompanying notes to financial statements.
| INVENOMIC FUND |
| SCHEDULE OF INVESTMENTS (Continued) |
| October 31, 2021 |
| Shares | | | | | Fair Value | |
| | | | | SECURITIES SOLD SHORT — (94.3)% (Continued) | | | | |
| | | | | COMMON STOCKS — (92.7)% (Continued) | | | | |
| | | | | LEISURE FACILITIES & SERVICES - (3.9)% (Continued) | | | | |
| | (62,567 | ) | | Virgin Galactic Holdings, Inc. | | $ | (1,173,131 | ) |
| | | | | | | | (11,225,376 | ) |
| | | | | LEISURE PRODUCTS - (3.8)% | | | | |
| | (17,726 | ) | | Axon Enterprise, Inc. | | | (3,189,971 | ) |
| | (39,167 | ) | | Clarus Corporation | | | (1,080,226 | ) |
| | (9,332 | ) | | LCI Industries | | | (1,303,120 | ) |
| | (45,660 | ) | | OneWater Marine, Inc. | | | (2,024,564 | ) |
| | (37,569 | ) | | Peloton Interactive, Inc. | | | (3,435,310 | ) |
| | | | | | | | (11,033,191 | ) |
| | | | | MACHINERY - (0.9)% | | | | |
| | (120,005 | ) | | Energy Recovery, Inc. | | | (2,438,502 | ) |
| | | | | | | | | |
| | | | | MEDICAL EQUIPMENT & DEVICES - (6.8)% | | | | |
| | (9,532 | ) | | 10X Genomics, Inc. | | | (1,537,226 | ) |
| | (212,192 | ) | | Bionano Genomics, Inc. | | | (1,077,935 | ) |
| | (9,772 | ) | | Intuitive Surgical, Inc. | | | (3,528,963 | ) |
| | (34,161 | ) | | LeMaitre Vascular, Inc. | | | (1,776,714 | ) |
| | (12,684 | ) | | Natera, Inc. | | | (1,453,206 | ) |
| | (69,431 | ) | | Neogen Corporation | | | (2,937,626 | ) |
| | (23,694 | ) | | Nevro Corporation | | | (2,694,956 | ) |
| | (3,419 | ) | | Penumbra, Inc. | | | (945,524 | ) |
| | (16,010 | ) | | Quanterix Corporation | | | (810,266 | ) |
| | (25,400 | ) | | Silk Road Medical, Inc. | | | (1,491,234 | ) |
| | (7,944 | ) | | STAAR Surgical Company | | | (941,046 | ) |
| | (131,633 | ) | | ViewRay, Inc. | | | (962,237 | ) |
| | | | | | | | (20,156,933 | ) |
| | | | | METALS & MINING - (0.3)% | | | | |
| | (6,972 | ) | | Encore Wire Corporation | | | (934,666 | ) |
| | | | | | | | | |
| | | | | REAL ESTATE SERVICES - (1.7)% | | | | |
| | (94,687 | ) | | Redfin Corporation | | | (4,861,230 | ) |
| | | | | | | | | |
See accompanying notes to financial statements.
| INVENOMIC FUND |
| SCHEDULE OF INVESTMENTS (Continued) |
| October 31, 2021 |
| Shares | | | | | Fair Value | |
| | | | | SECURITIES SOLD SHORT — (94.3)% (Continued) | | | | |
| | | | | COMMON STOCKS — (92.7)% (Continued) | | | | |
| | | | | RENEWABLE ENERGY - (0.9)% | | | | |
| | (49,979 | ) | | Ballard Power Systems, Inc. | | $ | (905,620 | ) |
| | (15,089 | ) | | Plug Power, Inc. | | | (577,456 | ) |
| | (9,831 | ) | | Sunrun, Inc. | | | (567,052 | ) |
| | (25,237 | ) | | TPI Composites, Inc. | | | (848,720 | ) |
| | | | | | | | (2,898,848 | ) |
| | | | | RETAIL - CONSUMER STAPLES - (0.3)% | | | | |
| | (31,651 | ) | | Albertsons Companies, Inc. | | | (979,598 | ) |
| | | | | | | | | |
| | | | | RETAIL - DISCRETIONARY - (5.4)% | | | | |
| | (15,918 | ) | | Carvana Company | | | (4,826,019 | ) |
| | (13,204 | ) | | Freshpet, Inc. | | | (2,058,636 | ) |
| | (22,767 | ) | | GameStop Corporation | | | (4,177,972 | ) |
| | (1,839 | ) | | Lovesac Company | | | (143,460 | ) |
| | (2,921 | ) | | MarineMax, Inc. | | | (151,279 | ) |
| | (48,256 | ) | | Mister Car Wash, Inc. | | | (885,015 | ) |
| | (2,164 | ) | | RH | | | (1,427,439 | ) |
| | (33,769 | ) | | Shoe Carnival, Inc. | | | (1,143,756 | ) |
| | (81,570 | ) | | Tile Shop Holdings, Inc. | | | (680,294 | ) |
| | (5,966 | ) | | Warby Parker, Inc. | | | (322,164 | ) |
| | | | | | | | (15,816,034 | ) |
| | | | | SEMICONDUCTORS - (1.2)% | | | | |
| | (24,520 | ) | | Atomera, Inc. | | | (529,877 | ) |
| | (8,190 | ) | | NVIDIA Corporation | | | (2,093,937 | ) |
| | (7,198 | ) | | Power Integrations, Inc. | | | (742,906 | ) |
| | | | | | | | (3,366,720 | ) |
| | | | | SOFTWARE - (22.6)% | | | | |
| | (4,306 | ) | | Appfolio, Inc. | | | (567,057 | ) |
| | (15,413 | ) | | Asana, Inc. | | | (2,093,085 | ) |
| | (9,274 | ) | | Bill.com Holdings, Inc. | | | (2,729,431 | ) |
| | (126,915 | ) | | Blend Labs, Inc. | | | (1,840,268 | ) |
| | (26,047 | ) | | Ceridian HCM Holding, Inc. | | | (3,262,387 | ) |
| | (23,705 | ) | | Clear Secure, Inc. | | | (1,059,376 | ) |
| | (7,708 | ) | | Cloudflare, Inc. | | | (1,500,902 | ) |
| | | | | | | | | |
See accompanying notes to financial statements.
| INVENOMIC FUND |
| SCHEDULE OF INVESTMENTS (Continued) |
| October 31, 2021 |
| Shares | | | | | Fair Value | |
| | | | | SECURITIES SOLD SHORT — (94.3)% (Continued) | | | | |
| | | | | COMMON STOCKS — (92.7)% (Continued) | | | | |
| | | | | SOFTWARE - (22.6)% (Continued) | | | | |
| | (9,181 | ) | | Coupa Software, Inc. | | $ | (2,090,514 | ) |
| | (34,750 | ) | | CS Disco, Inc. | | | (1,992,913 | ) |
| | (31,683 | ) | | DigitalOcean Holdings, Inc. | | | (3,091,944 | ) |
| | (15,196 | ) | | Docebo, Inc. | | | (1,135,700 | ) |
| | (19,058 | ) | | Domo, Inc. | | | (1,683,774 | ) |
| | (11,455 | ) | | Duck Creek Technologies, Inc. | | | (360,833 | ) |
| | (22,893 | ) | | Duolingo, Inc. | | | (3,976,285 | ) |
| | (79,864 | ) | | EngageSmart, Inc. | | | (2,677,840 | ) |
| | (31,704 | ) | | Fastly, Inc. | | | (1,604,539 | ) |
| | (14,049 | ) | | Gitlab, Inc. | | | (1,576,298 | ) |
| | (20,616 | ) | | Guidewire Software, Inc. | | | (2,592,050 | ) |
| | (8,462 | ) | | Lightspeed Commerce, Inc. | | | (826,653 | ) |
| | (20,389 | ) | | Magnet Forensics, Inc. | | | (633,275 | ) |
| | (2,467 | ) | | Monday.com Ltd. | | | (917,305 | ) |
| | (22,737 | ) | | nCino, Inc. | | | (1,652,070 | ) |
| | (45,177 | ) | | Olo, Inc. | | | (1,229,718 | ) |
| | (25,545 | ) | | Outset Medical, Inc. | | | (1,360,782 | ) |
| | (64,984 | ) | | Palantir Technologies, Inc. | | | (1,681,786 | ) |
| | (7,801 | ) | | Paycom Software, Inc. | | | (4,273,778 | ) |
| | (57,329 | ) | | Paycor HCM, Inc. | | | (1,859,753 | ) |
| | (117,255 | ) | | Porch Group, Inc. | | | (2,465,873 | ) |
| | (51,219 | ) | | PowerSchool Holdings, Inc. | | | (1,183,671 | ) |
| | (19,897 | ) | | Procore Technologies, Inc. | | | (1,819,581 | ) |
| | (2,730 | ) | | Shopify, Inc. | | | (4,004,173 | ) |
| | (7,263 | ) | | Snowflake, Inc. | | | (2,569,940 | ) |
| | (28,870 | ) | | UiPath, Inc. | | | (1,450,717 | ) |
| | (9,753 | ) | | Unity Software, Inc. | | | (1,475,726 | ) |
| | (8,355 | ) | | Workiva, Inc. | | | (1,249,490 | ) |
| | | | | | | | (66,489,487 | ) |
| | | | | SPECIALTY FINANCE - (0.5)% | | | | |
| | (1,881 | ) | | Credit Acceptance Corporation | | | (1,125,233 | ) |
| | (5,839 | ) | | Flywire Corporation | | | (277,002 | ) |
| | | | | | | | (1,402,235 | ) |
| | | | | | | | | |
See accompanying notes to financial statements.
| INVENOMIC FUND |
| SCHEDULE OF INVESTMENTS (Continued) |
| October 31, 2021 |
| Shares | | | | | Fair Value | |
| | | | | SECURITIES SOLD SHORT — (94.3)% (Continued) | | | | |
| | | | | COMMON STOCKS — (92.7)% (Continued) | | | | |
| | | | | TECHNOLOGY HARDWARE - (1.0)% | | | | |
| | (25,568 | ) | | Digimarc Corporation | | $ | (1,291,951 | ) |
| | (81,002 | ) | | MicroVision, Inc. | | | (616,425 | ) |
| | (43,639 | ) | | Sight Sciences, Inc. | | | (1,176,944 | ) |
| | | | | | | | (3,085,320 | ) |
| | | | | TECHNOLOGY SERVICES - (5.1)% | | | | |
| | (3,456 | ) | | Coinbase Global, Inc. | | | (1,103,916 | ) |
| | (36,325 | ) | | Dlocal Ltd. | | | (1,762,126 | ) |
| | (154,687 | ) | | HUMBL, Inc. | | | (101,784 | ) |
| | (175,505 | ) | | Hut 8 Mining Corporation | | | (2,351,767 | ) |
| | (8,631 | ) | | MarketAxess Holdings, Inc. | | | (3,527,230 | ) |
| | (73,002 | ) | | Riot Blockchain, Inc. | | | (1,987,114 | ) |
| | (9,352 | ) | | Square, Inc. | | | (2,380,084 | ) |
| | (28,151 | ) | | Toast, Inc. | | | (1,498,196 | ) |
| | | | | | | | (14,712,217 | ) |
| | | | | TELECOMMUNICATIONS - (0.5)% | | | | |
| | (119,931 | ) | | AST SpaceMobile, Inc. | | | (1,342,028 | ) |
| | | | | | | | | |
| | | | | TOBACCO & CANNABIS - (0.3)% | | | | |
| | (77,107 | ) | | Canopy Growth Corporation | | | (973,861 | ) |
| | | | | | | | | |
| | | | | TRANSPORTATION & LOGISTICS - (0.5)% | | | | |
| | (9,415 | ) | | Cargojet, Inc. | | | (1,496,693 | ) |
| | | | | | | | | |
| | | | | TRANSPORTATION EQUIPMENT - (0.6)% | | | | |
| | (42,250 | ) | | TuSimple Holdings, Inc. | | | (1,652,820 | ) |
| | | | | | | | | |
| | | | | WHOLESALE - DISCRETIONARY - (0.3)% | | | | |
| | (36,489 | ) | | ThredUp, Inc. | | | (789,622 | ) |
| | | | | | | | | |
See accompanying notes to financial statements.
| INVENOMIC FUND |
| SCHEDULE OF INVESTMENTS (Continued) |
| October 31, 2021 |
| Shares | | | | | Fair Value | |
| | | | | SECURITIES SOLD SHORT — (94.3)% | | | | |
| | | | | EXCHANGE-TRADED FUNDS — (1.6)% | | | | |
| | | | | EQUITY - (1.6)% | | | | |
| | (18,939 | ) | | Direxion Daily S&P 500 Bull 3X | | $ | (2,466,426 | ) |
| | (50,820 | ) | | Direxion Daily Semiconductors Bull 3x Shares | | | (2,421,573 | ) |
| | | | | | | | (4,887,999 | ) |
| | | | | | | | | |
| | | | | TOTAL SECURITIES SOLD SHORT - (Proceeds - $278,034,483) | | $ | (275,431,574 | ) |
| | | | | | | | | |
ADR - American Depositary Receipt
ETF - Exchange-Traded Fund
GOL - Goldman Sachs
LTD - Limited Company
PLC - Public Limited Company
REIT - Real Estate Investment Trust
S.A. - Société Anonyme
SPDR - Standard & Poor’s Depositary Receipt
| (a) | All or a portion of security segregated as collateral for short sales. |
| (b) | Percentage rounds to less than 0.1%. |
| (c) | Non-income producing security. |
| (d) | All or a portion of the security is on loan. The total fair value of the securities on loan as of October 31, 2021 was $19,796,214. |
| (e) | The value of this security has been determined in good faith under policies of the Board of Trustees. |
| (f) | Security was purchased with cash received as collateral for securities on loan at October 31, 2021. Total collateral had a value of $20,517,527 at October 31, 2021. |
| (g) | Rate disclosed is the seven day effective yield as of October 31, 2021. |
| (h) | Each option contract allows the holder of the option to purchase or sell 100 shares of the underlying security. |
See accompanying notes to financial statements.
| Invenomic Fund |
| STATEMENT OF ASSETS AND LIABILITIES |
| October 31, 2021 |
| ASSETS | | | |
| Investment securities: | | | | |
| At cost | | $ | 325,314,311 | |
| At value | | $ | 363,202,745 | |
| Cash collateral segregated for short sales | | | 226,776,601 | |
| Foreign Currency (Cost $7,384,123) | | | 7,461,578 | |
| Receivable for securities sold | | | 5,024,526 | |
| Dividends and interest receivable | | | 94,312 | |
| Prepaid expenses and other assets | | | 39,353 | |
| Receivable for Fund shares sold | | | 442,438 | |
| TOTAL ASSETS | | | 603,041,553 | |
| | | | | |
| LIABILITIES | | | | |
| Securities sold short (Proceeds - $278,034,483) | | | 275,431,574 | |
| Securities lending collateral | | | 20,517,527 | |
| Payable for investments purchased | | | 13,336,919 | |
| Investment advisory fees payable | | | 435,514 | |
| Payable for Fund shares redeemed | | | 291,932 | |
| Shareholder servicing fees payable | | | 62,198 | |
| Payable to related parties | | | 12,128 | |
| Distribution (12b-1) fees payable | | | 5,663 | |
| Dividends payable on securities sold short | | | 3,798 | |
| Accrued expenses and other liabilities | | | 119,508 | |
| TOTAL LIABILITIES | | | 310,216,761 | |
| NET ASSETS | | $ | 292,824,792 | |
| | | | | |
| NET ASSETS CONSIST OF: | | | | |
| Paid in capital | | $ | 217,088,597 | |
| Accumulated earnings | | | 75,736,195 | |
| NET ASSETS | | $ | 292,824,792 | |
| | | | | |
| NET ASSET VALUE PER SHARE: | | | | |
| Institutional Class: | | | | |
| Net Assets | | $ | 265,308,025 | |
| Shares of beneficial interest outstanding ($0 par value, unlimited shares authorized) | | | 15,249,080 | |
| Net asset value (Net Assets ÷ Shares Outstanding), offering price and redemption price per share (a) | | $ | 17.40 | |
| | | | | |
| Investor Class: | | | | |
| Net Assets | | $ | 27,456,735 | |
| Shares of beneficial interest outstanding ($0 par value, unlimited shares authorized) | | | 1,593,834 | |
| Net asset value (Net Assets ÷ Shares Outstanding), offering price and redemption price per share (a) | | $ | 17.23 | |
| | | | | |
| Super Institutional Class: | | | | |
| Net Assets | | $ | 60,032 | |
| Shares of beneficial interest outstanding ($0 par value, unlimited shares authorized) | | | 3,433 | |
| Net asset value (Net Assets ÷ Shares Outstanding), offering price and redemption price per share (a) | | $ | 17.49 | |
| (a) | Redemptions made within 60 days of purchases may be assessed a redemption fee of 1.00%. |
See accompanying notes to financial statements.
| Invenomic Fund |
| STATEMENT OF OPERATIONS |
| For the Year Ended October 31, 2021 |
| INVESTMENT INCOME | | | |
| Dividends (net of foreign tax withheld of $156,606) | | $ | 4,246,912 | |
| Interest | | | 2,857 | |
| Securities lending income - net | | | 65,728 | |
| TOTAL INVESTMENT INCOME | | | 4,315,497 | |
| | | | | |
| EXPENSES | | | | |
| Investment advisory fees | | | 4,063,887 | |
| Distribution (12b-1) fees: | | | | |
| Investor Class | | | 49,793 | |
| Shareholder service fees - Institutional Class | | | 533,964 | |
| Shareholder service fees - Investor Class | | | 49,793 | |
| Interest expense | | | 1,733,376 | |
| Dividends on securities sold short | | | 416,033 | |
| Administration fees | | | 259,933 | |
| Third party administrative servicing fees | | | 223,317 | |
| Registration fees | | | 90,499 | |
| Custodian fees | | | 58,149 | |
| Trustees fees and expenses | | | 35,031 | |
| Legal fees | | | 30,056 | |
| Compliance officer fees | | | 24,032 | |
| Printing expense | | | 22,539 | |
| Insurance expense | | | 20,538 | |
| Audit fees | | | 18,752 | |
| Other expenses | | | 15,226 | |
| TOTAL EXPENSES | | | 7,644,918 | |
| | | | | |
| Less: Fees waived by the Advisor | | | (226,230 | ) |
| | | | | |
| NET EXPENSES | | | 7,418,688 | |
| | | | | |
| NET INVESTMENT LOSS | | | (3,103,191 | ) |
| | | | | |
| REALIZED AND UNREALIZED GAIN (LOSS) ON INVESTMENTS | | | | |
| Net realized gain (loss) on: | | | | |
| Investments | | | 98,285,208 | |
| Foreign currency transactions | | | 21,646 | |
| Options purchased | | | (6,974,966 | ) |
| Options written | | | (691,460 | ) |
| Securities sold short | | | (36,523,870 | ) |
| | | | 54,116,558 | |
| Net change in unrealized appreciation (depreciation) on: | | | | |
| Investments | | | 33,584,590 | |
| Foreign currency translations | | | 36,453 | |
| Options purchased | | | 664,448 | |
| Options written | | | (79,571 | ) |
| Securities sold short | | | 9,479,854 | |
| | | | 43,685,774 | |
| | | | | |
| NET REALIZED AND UNREALIZED GAIN ON INVESTMENTS | | | 97,802,332 | |
| | | | | |
| NET INCREASE IN NET ASSETS | | $ | 94,699,141 | |
See accompanying notes to financial statements.
| Invenomic Fund |
| STATEMENTS OF CHANGES IN NET ASSETS |
| | | For the | | | For the | |
| | | Year Ended | | | Year Ended | |
| | | October 31, 2021 | | | October 31, 2020 | |
| FROM OPERATIONS | | | | | | | | |
| Net investment loss | | $ | (3,103,191 | ) | | $ | (1,257,216 | ) |
| Net realized gain (loss) from investments, foreign currency transactions, options purchased, and securities sold short | | | 54,116,558 | | | | (6,174,386 | ) |
| Net change in unrealized appreciation (depreciation) on investments, securities sold short, options purchased, options written and foreign currency translations | | | 43,685,774 | | | | (8,171,164 | ) |
| Net increase (decrease) in net assets resulting from operations | | | 94,699,141 | | | | (15,602,766 | ) |
| | | | | | | | | |
| DISTRIBUTIONS TO SHAREHOLDERS | | | | | | | | |
| Total Distributions Paid: | | | | | | | | |
| Institutional Class | | | (4,613,153 | ) | | | (6,409,033 | ) |
| Investor Class | | | (221,722 | ) | | | (482,116 | ) |
| Super Institutional Class | | | (1,301 | ) | | | (912,601 | ) |
| Net decrease in net assets resulting from distributions to shareholders | | | (4,836,176 | ) | | | (7,803,750 | ) |
| | | | | | | | | |
| FROM SHARES OF BENEFICIAL INTEREST | | | | | | | | |
| Proceeds from shares sold: | | | | | | | | |
| Institutional Class | | | 110,486,752 | | | | 57,388,260 | |
| Investor Class | | | 48,717,768 | | | | 6,506,133 | |
| Super Institutional Class | | | — | | | | 1,022,115 | |
| Net asset value of shares issued in reinvestment of distributions: | | | | | | | | |
| Institutional Class | | | 3,851,045 | | | | 5,743,554 | |
| Investor Class | | | 188,352 | | | | 481,013 | |
| Super Institutional Class | | | 1,297 | | | | 906,119 | |
| Redemption fee proceeds: | | | | | | | | |
| Institutional Class | | | 181,947 | | | | 15,681 | |
| Investor Class | | | 72,258 | | | | 9,072 | |
| Super Institutional Class | | | 42 | | | | 545 | |
| Payments for shares redeemed: | | | | | | | | |
| Institutional Class | | | (56,584,708 | ) | | | (120,184,821 | ) |
| Investor Class | | | (32,026,823 | ) | | | (14,813,753 | ) |
| Super Institutional Class | | | — | | | | (27,660,046 | ) |
| Net increase (decrease) in net assets from shares of beneficial interest | | | 74,887,930 | | | | (90,586,128 | ) |
| | | | | | | | | |
| TOTAL INCREASE (DECREASE) IN NET ASSETS | | | 164,750,895 | | | | (113,992,644 | ) |
| | | | | | | | | |
| NET ASSETS | | | | | | | | |
| Beginning of Year | | | 128,073,897 | | | | 242,066,541 | |
| End of Year | | $ | 292,824,792 | | | $ | 128,073,897 | |
| | | | | | | | | |
| SHARE ACTIVITY | | | | | | | | |
| Institutional Class: | | | | | | | | |
| Shares Sold | | | 6,932,319 | | | | 5,426,179 | |
| Shares Reinvested | | | 310,068 | | | | 505,594 | |
| Shares Redeemed | | | (3,434,296 | ) | | | (11,821,247 | ) |
| Net increase (decrease) in shares of beneficial interest outstanding | | | 3,808,091 | | | | (5,889,474 | ) |
| | | | | | | | | |
| Investor Class: | | | | | | | | |
| Shares Sold | | | 2,820,545 | | | | 641,855 | |
| Shares Reinvested | | | 15,313 | | | | 42,643 | |
| Shares Redeemed | | | (1,803,228 | ) | | | (1,448,909 | ) |
| Net increase (decrease) in shares of beneficial interest outstanding | | | 1,032,630 | | | | (764,411 | ) |
| | | | | | | | | |
| Super Institutional Class: | | | | | | | | |
| Shares Sold | | | — | | | | 88,241 | |
| Shares Reinvested | | | 104 | | | | 79,624 | |
| Shares Redeemed | | | — | | | | (2,604,421 | ) |
| Net increase (decrease) in shares of beneficial interest outstanding | | | 104 | | | | (2,436,556 | ) |
See accompanying notes to financial statements.
| Invenomic Fund |
| FINANCIAL HIGHLIGHTS |
Per Share Data and Ratios for a Share of Beneficial Interest Outstanding Throughout Each Period
| | | Institutional Class | |
| | | | | | | | | | | | | | | | |
| | | For the | | | For the | | | For the | | | For the | | | For the | |
| | | Year Ended | | | Year Ended | | | Year Ended | | | Year Ended | | | Period Ended | |
| | | October 31, 2021 | | | October 31, 2020 | | | October 31, 2019 | | | October 31, 2018 | | | October 31, 2017 (1) | |
| Net asset value, beginning of period | | $ | 10.67 | | | $ | 11.48 | | | $ | 11.07 | | | $ | 10.22 | | | $ | 10.00 | |
| Activity from investment operations: | | | | | | | | | | | | | | | | | | | | |
| Net investment loss (2) | | | (0.21 | ) | | | (0.08 | ) | | | (0.06 | ) | | | (0.12 | ) | | | (0.05 | ) |
| Net realized and unrealized gain (loss) on investments | | | 7.32 | | | | (0.36 | ) | | | 0.98 | | | | 1.10 | | | | 0.27 | |
| Total from investment operations | | | 7.11 | | | | (0.44 | ) | | | 0.92 | | | | 0.98 | | | | 0.22 | |
| Less distributions from: | | | | | | | | | | | | | | | | | | | | |
| Net investment income | | | (0.01 | ) | | | — | | | | — | | | | — | | | | — | |
| Net realized gains | | | (0.38 | ) | | | (0.37 | ) | | | (0.51 | ) | | | (0.13 | ) | | | — | |
| Total distributions | | | (0.39 | ) | | | (0.37 | ) | | | (0.51 | ) | | | (0.13 | ) | | | — | |
| Paid-in-Capital From Redemption Fees | | | 0.01 | | | | 0.00 | (3) | | | 0.00 | (3) | | | 0.00 | (3) | | | — | |
| Net asset value, end of period | | $ | 17.40 | | | $ | 10.67 | | | $ | 11.48 | | | $ | 11.07 | | | $ | 10.22 | |
| Total return (4) | | | 68.21 | % | | | (4.06 | )% | | | 8.67 | % | | | 9.63 | % | | | 2.20 | % (5) |
| Net assets, at end of period (000’s) | | $ | 265,308 | | | $ | 122,105 | | | $ | 198,929 | | | $ | 69,580 | | | $ | 28,354 | |
| Ratio of gross expenses to average net assets (6,8) | | | 3.25 | % | | | 2.97 | % | | | 2.83 | % | | | 2.91 | % | | | 3.07 | % (7) |
| Ratio of net expenses to average net assets (8) | | | 3.15 | % | | | 2.83 | % | | | 2.77 | % | | | 2.72 | % | | | 2.61 | % (7) |
| Ratio of net investment loss to average net assets | | | (1.31 | )% | | | (0.76 | )% | | | (0.57 | )% | | | (1.14 | )% | | | (1.25 | )% (7) |
| Portfolio Turnover Rate | | | 179 | % | | | 153 | % | | | 100 | % | | | 106 | % | | | 37 | % (5) |
| | | | | | | | | | | | | | | | | | | | | |
|
| (1) The Institutional Class commenced operations on June 19, 2017. |
|
| (2) Per share amounts calculated using the average shares method, which more appropriately presents the per share data for the period. |
|
| (3) Represents less than $0.01 per share. |
|
| (4) Total returns shown exclude the effect of applicable sales charges and redemption fees and assumes the reinvestment of distributions. |
|
| (5) Not Annualized. |
|
| (6) Represents the ratio of expenses to average net assets absent fee waivers and/or expense reimbursements by the Advisor. |
|
| (7) Annualized. |
|
| (8) Excluding dividends from securities sold short and interest expense, the ratio of expenses to average net assets would have been: |
|
| | | | 2.33 | % | | | 2.37 | % | | | 2.29 | % | | | 2.43 | % | | | 2.70 | % (7) |
| | | | 2.23 | % | | | 2.23 | % | | | 2.23 | % | | | 2.24 | % | | | 2.24 | % (7) |
See accompanying notes to financial statements.
| Invenomic Fund |
| FINANCIAL HIGHLIGHTS |
|
Per Share Data and Ratios for a Share of Beneficial Interest Outstanding Throughout Each Period
| | | Investor Class | |
| | | | | | | | | | | | | | | | |
| | | For the | | | For the | | | For the | | | For the | | | For the | |
| | | Year Ended | | | Year Ended | | | Year Ended | | | Year Ended | | | Period Ended | |
| | | October 31, 2021 | | | October 31, 2020 | | | October 31, 2019 | | | October 31, 2018 | | | October 31, 2017 (1) | |
| Net asset value, beginning of period | | $ | 10.57 | | | $ | 11.40 | | | $ | 11.02 | | | $ | 10.21 | | | $ | 10.00 | |
| Activity from investment operations: | | | | | | | | | | | | | | | | | | | | |
| Net investment loss (2) | | | (0.26 | ) | | | (0.11 | ) | | | (0.09 | ) | | | (0.16 | ) | | | (0.07 | ) |
| Net realized and unrealized gain (loss) on investments | | | 7.24 | | | | (0.36 | ) | | | 0.98 | | | | 1.10 | | | | 0.28 | |
| Total from investment operations | | | 6.98 | | | | (0.47 | ) | | | 0.89 | | | | 0.94 | | | | 0.21 | |
| Less distributions from: | | | | | | | | | | | | | | | | | | | | |
| Net realized gains | | | (0.38 | ) | | | (0.37 | ) | | | (0.51 | ) | | | (0.13 | ) | | | — | |
| Total distributions | | | (0.38 | ) | | | (0.37 | ) | | | (0.51 | ) | | | (0.13 | ) | | | — | |
| Paid-in-Capital From Redemption Fees | | | 0.06 | | | | 0.01 | | | | 0.00 | (3) | | | 0.00 | (3) | | | — | |
| Net asset value, end of period | | $ | 17.23 | | | $ | 10.57 | | | $ | 11.40 | | | $ | 11.02 | | | $ | 10.21 | |
| Total return (4) | | | 68.09 | % | | | (4.27 | )% | | | 8.43 | % | | | 9.25 | % | | | 2.10 | % (5) |
| Net assets, at end of period (000’s) | | $ | 27,457 | | | $ | 5,933 | | | $ | 15,113 | | | $ | 8,501 | | | $ | 1 | |
| Ratio of gross expenses to average net assets (6,8) | | | 3.50 | % | | | 3.22 | % | | | 3.08 | % | | | 3.21 | % | | | 3.32 | % (7) |
| Ratio of net expenses to average net assets (8) | | | 3.40 | % | | | 3.08 | % | | | 3.02 | % | | | 3.02 | % | | | 2.86 | % (7) |
| Ratio of net investment loss to average net assets | | | (1.56 | )% | | | (0.99 | )% | | | (0.84 | )% | | | (1.39 | )% | | | (2.85 | )% (7) |
| Portfolio Turnover Rate | | | 179 | % | | | 153 | % | | | 100 | % | | | 106 | % | | | 37 | % (5) |
| | | | | | | | | | | | | | | | | | | | | |
|
| (1) The Investor Class commenced operations on June 19, 2017. |
|
| (2) Per share amounts calculated using the average shares method, which more appropriately presents the per share data for the period. |
|
| (3) Represents less than $0.01 per share. |
|
| (4) Total returns shown exclude the effect of applicable sales charges and redemption fees and assumes the reinvestment of distributions. |
|
| (5) Not Annualized. |
|
| (6) Represents the ratio of expenses to average net assets absent fee waivers and/or expense reimbursements by the Advisor. |
|
| (7) Annualized. |
|
| (8) Excluding dividends from securities sold short and interest expense, the ratio of expenses to average net assets would have been: |
|
| | | | 2.58 | % | | | 2.62 | % | | | 2.54 | % | | | 2.73 | % | | | 2.95 | % (7) |
| | | | 2.48 | % | | | 2.48 | % | | | 2.48 | % | | | 2.54 | % | | | 2.49 | % (7) |
See accompanying notes to financial statements.
| Invenomic Fund |
| FINANCIAL HIGHLIGHTS |
Per Share Data and Ratios for a Share of Beneficial Interest Outstanding Throughout Each Period
| | | Super Institutional Class | |
| | | | | | | | | | |
| | | For the | | | For the | | | For the | |
| | | Period Ended | | | Period Ended | | | Period Ended | |
| | | October 31, 2021 | | | October 31, 2020 | | | October 31, 2019 (1) | |
| Net asset value, beginning of period | | $ | 10.70 | | | $ | 11.49 | | | $ | 11.43 | |
| Activity from investment operations: | | | | | | | | | | | | |
| Net investment loss (2) | | | (0.16 | ) | | | (0.07 | ) | | | (0.02 | ) |
| Net realized and unrealized gain (loss) on investments | | | 7.33 | | | | (0.35 | ) | | | 0.08 | |
| Total from investment operations | | | 7.17 | | | | (0.42 | ) | | | 0.06 | |
| Less distributions from: | | | | | | | | | | | | |
| Net investment income | | | (0.01 | ) | | | — | | | | — | |
| Net realized gains | | | (0.38 | ) | | | (0.37 | ) | | | — | |
| Total distributions | | | (0.39 | ) | | | (0.37 | ) | | | — | |
| Paid-in-Capital From Redemption Fees | | | 0.01 | | | | 0.00 | (3) | | | — | |
| Net asset value, end of period | | $ | 17.49 | | | $ | 10.70 | | | $ | 11.49 | |
| Total return (4) | | | 68.58 | % | | | (3.88 | )% | | | 0.52 | % (5) |
| Net assets, at end of period (000’s) | | $ | 60 | | | $ | 36 | | | $ | 28,024 | |
| Ratio of gross expenses to average net assets (6,8) | | | 3.00 | % | | | 2.72 | % | | | 2.58 | % (7) |
| Ratio of net expenses to average net assets (8) | | | 2.90 | % | | | 2.58 | % | | | 2.52 | % (7) |
| Ratio of net investment loss to average net assets | | | (1.04 | )% | | | (0.59 | )% | | | (0.30 | )% (7) |
| Portfolio Turnover Rate | | | 179 | % | | | 153 | % | | | 100 | % (5) |
| | | | | | | | | | | | | |
|
| (1) The Super Institutional Class commenced operations on May 10, 2019. |
|
| (2) Per share amounts calculated using the average shares method, which more appropriately presents the per share data for the period. |
|
| (3) Represents less than $0.01 per share. |
|
| (4) Total returns shown exclude the effect of applicable sales charges and redemption fees and assumes the reinvestment of distributions. |
|
| (5) Not Annualized. |
|
| (6) Represents the ratio of expenses to average net assets absent fee waivers and/or expense reimbursements by the Advisor. |
|
| (7) Annualized. |
|
| (8) Excluding dividends from securities sold short and interest expense, the ratio of expenses to average net assets would have been: |
|
| | | | | | | | | | | | | |
| Before fees waived | | | 2.08 | % | | | 2.12 | % | | | 2.04 | % (7) |
| After fees waived | | | 1.98 | % | | | 1.98 | % | | | 1.98 | % (7) |
See accompanying notes to financial statements.
Invenomic Fund
NOTES TO FINANCIAL STATEMENTS
October 31, 2021
The Invenomic Fund (the “Fund”) is a diversified series of shares of beneficial interest of Northern Lights Fund Trust II (the “Trust”), a statutory trust organized under the laws of the State of Delaware on August 26, 2010, and is registered under the Investment Company Act of 1940, as amended (the “1940 Act”), as an open-end management investment company.
The Fund’s investment objective is to seek to achieve long-term capital appreciation. The Fund offers three classes of shares: Institutional Class shares, Investor Class shares and Super Institutional Class shares. The Institutional Class Shares and Investor Class shares commenced operations on June 19, 2017. The Super Institutional Class shares commenced operations on May 10, 2019. Each class of shares is offered at their net asset value. Each class of shares has identical rights and privileges with respect to arrangements pertaining to shareholder servicing or distribution, class-related expenses, voting rights on matters affecting a single class of shares, and the exchange privilege of each class of shares. The share classes differ in the fees and expenses charged to shareholders. The Fund’s income, expenses (other than class specific distribution fees) and realized and unrealized gains and losses are allocated proportionately each day based upon the relative net assets of each class.
| 2. | SIGNIFICANT ACCOUNTING POLICIES |
The following is a summary of significant accounting policies followed by the Fund in preparation of its financial statements. These policies are in conformity with accounting principles generally accepted in the United States of America (“GAAP”). The preparation of financial statements in conformity with GAAP requires management to make estimates and assumptions that affect the reported amounts of assets and liabilities and disclosure of contingent assets and liabilities at the date of the financial statements and the reported amounts of increases and decreases in net assets from operations during the reporting period. Actual results could differ from those estimates. The Fund is an investment company and accordingly follow the investment company accounting and reporting guidance of the Financial Accounting Standards Board (FASB) Accounting Standard Codification Topic 946 “Financial Services – Investment Companies”.
Securities valuation – Securities listed on an exchange are valued at the last reported sale price at the close of the regular trading session of the primary exchange on the business day the value is being determined, or in the case of securities listed on NASDAQ at the NASDAQ Official Closing Price (“NOCP”). In the absence of a sale such securities shall be valued at the mean between the current bid and ask prices on the day of valuation. Options contracts listed on a securities exchange or board of trade for which market quotations are readily available shall be valued at the last quoted sales price or, in the absence of a sale, at the mean between the current bid and ask prices on the day of valuation. Option contracts not listed on a securities exchange or board of trade for which over-the-counter market quotations are readily available shall be valued at the mean between the current bid and ask prices on the day of valuation. Index options shall be valued at the mean between the current bid and ask prices on the day of valuation. Short- term debt obligations having 60 days or less remaining until maturity, at time of purchase may be valued at amortized cost. Investments in open-end investment companies are valued at net asset value.
Valuation of Fund of Funds – The Fund may invest in portfolios of open-end or closed-end investment companies (the “underlying funds”). Underlying open-end funds are valued at their respective net asset values as reported by such investment companies. The underlying funds value securities in their portfolios for which market quotations are readily available at their market values (generally the last reported sale price) and all other securities and assets at their fair value by the methods established by the Boards of the underlying funds. The shares of many closed-end investment companies, after their initial public offering, frequently trade at a price per share, which is different than the net asset value per share. The difference represents a market premium or market discount of such shares. There can be no assurances that the market discount or market premium on shares of any closed-end investment company purchased by the Fund will not change.
The Fund may hold securities, such as private investments, interests in commodity pools, other non-traded securities or temporarily illiquid securities, for which market quotations are not readily available or are determined to be unreliable. These securities will be valued using the “fair value” procedures approved by the Board. The Board has delegated execution of these procedures to a fair value committee composed of one or more representatives from each of the (i)
Invenomic Fund
NOTES TO FINANCIAL STATEMENTS (Continued)
October 31, 2021
Trust, (ii) administrator, and (iii) advisor. The committee may also enlist third party consultants such as a valuation specialist at a public accounting firm, valuation consultant or financial officer of a security issuer on an as-needed basis to assist in determining a security-specific fair value. The Board has also engaged a third party valuation firm to attend valuation meetings held by the Trust, review minutes of such meetings and report to the Board on a quarterly basis. The Board reviews and ratifies the execution of this process and the resultant fair value prices at least quarterly to assure the process produces reliable results.
Fair Valuation Process – As noted above, the fair value committee is composed of one or more representatives from each of the (i) Trust, (ii) administrator, and (iii) advisor. The applicable investments are valued collectively via inputs from each of these groups. For example, fair value determinations are required for the following securities: (i) securities for which market quotations are insufficient or not readily available on a particular business day (including securities for which there is a short and temporary lapse in the provision of a price by the regular pricing source), (ii) securities for which, in the judgment of the advisor the prices or values available do not represent the fair value of the instrument. Factors which may cause the advisor to make such a judgment include, but are not limited to, the following: only a bid price or an asked price is available; the spread between bid and asked prices is substantial; the frequency of sales; the thinness of the market; the size of reported trades; and actions of the securities markets, such as the suspension or limitation of trading; (iii) securities determined to be illiquid; (iv) securities with respect to which an event that will affect the value thereof has occurred (a “significant event”) since the closing prices were established on the principal exchange on which they are traded, but prior to a Fund’s calculation of its net asset value. Specifically, interests in commodity pools or managed futures pools are valued on a daily basis by reference to the closing market prices of each futures contract or other asset held by a pool, as adjusted for pool expenses. Restricted or illiquid securities, such as private investments or non-traded securities are valued via inputs from the advisor based upon the current bid for the security from two or more independent dealers or other parties reasonably familiar with the facts and circumstances of the security (who should take into consideration all relevant factors as may be appropriate under the circumstances). If the advisor is unable to obtain a current bid from such independent dealers or other independent parties, the fair value committee shall determine the fair value of such security using the following factors: (i) the type of security; (ii) the cost at date of purchase; (iii) the size and nature of the Fund’s holdings; (iv) the discount from market value of unrestricted securities of the same class at the time of purchase and subsequent thereto; (v) information as to any transactions or offers with respect to the security; (vi) the nature and duration of restrictions on disposition of the security and the existence of any registration rights; (vii) how the yield of the security compares to similar securities of companies of similar or equal creditworthiness; (viii) the level of recent trades of similar or comparable securities; (ix) the liquidity characteristics of the security; (x) current market conditions; and (xi) the market value of any securities into which the security is convertible or exchangeable.
The Fund utilizes various methods to measure the fair value of all of its investments on a recurring basis. GAAP establishes a hierarchy that prioritizes inputs to valuation methods. The three levels of input are:
Level 1 – Unadjusted quoted prices in active markets for identical assets and liabilities that the Fund has the ability to access.
Level 2 – Observable inputs other than quoted prices included in level 1 that are observable for the asset or liability, either directly or indirectly. These inputs may include quoted prices for the identical instrument on an inactive market, prices for similar instruments, interest rates, prepayment speeds, credit risk, yield curves, default rates and similar data.
Level 3 – Unobservable inputs for the asset or liability, to the extent relevant observable inputs are not available, representing the Fund’s own assumptions about the assumptions a market participant would use in valuing the asset or liability, and would be based on the best information available.
The availability of observable inputs can vary from security to security and is affected by a wide variety of factors, including, for example, the type of security, whether the security is new and not yet established in the marketplace, the liquidity of markets, and other characteristics particular to the security. To the extent that valuation is based on models or inputs that are less observable or unobservable in the market, the determination of fair value requires more judgment. Accordingly, the degree of judgment exercised in determining fair value is greatest for instruments categorized in Level 3.
Invenomic Fund
NOTES TO FINANCIAL STATEMENTS (Continued)
October 31, 2021
The inputs used to measure fair value may fall into different levels of the fair value hierarchy. In such cases, for disclosure purposes, the level in the fair value hierarchy within which the fair value measurement falls in its entirety, is determined based on the lowest level input that is significant to the fair value measurement in its entirety.
The inputs or methodology used for valuing securities are not necessarily an indication of the risk associated with investing in those securities. The following tables summarize the inputs used as of October 31, 2021 for the Fund’s investments measured at fair value:
| Assets * | | Level 1 | | | Level 2 | | | Level 3 | | | Total | |
| Common Stock | | $ | 317,994,721 | | | $ | — | | | $ | 0 | | | $ | 317,994,721 | |
| Closed End Fund | | | 1,426,870 | | | | — | | | | — | | | | 1,426,870 | |
| Exchange Traded Fund | | | 2,868,065 | | | | — | | | | — | | | | 2,868,065 | |
| Warrants | | | 985,864 | | | | — | | | | — | | | | 985,864 | |
| Call Options Purchased | | | — | | | | 620,730 | | | | — | | | | 620,730 | |
| Put Options Purchased | | | 28,860 | | | | 561,814 | | | | — | | | | 590,674 | |
| Collateral For Securities Loaned | | | 20,517,527 | | | | — | | | | — | | | | 20,517,527 | |
| Money Market Fund | | | 18,198,294 | | | | — | | | | — | | | | 18,198,294 | |
| Total | | $ | 362,020,201 | | | $ | 1,182,544 | | | $ | — | | | $ | 363,202,745 | |
| Liabilities* | | | | | | | | | | | | | | | | |
| Securities Sold Short | | $ | (275,431,574 | ) | | $ | — | | | $ | — | | | $ | (275,431,574 | ) |
| Total | | $ | (275,431,574 | ) | | $ | — | | | $ | — | | | $ | (275,431,574 | ) |
| * | Refer to the Portfolio of Investments for industry classification. |
The following is a reconciliation for which level 3 inputs were used in determining value.
| | | Tenerity, Inc. | |
| Beginning balance November 1, 2020 | | $ | 0 | |
| Purchases | | | — | |
| Proceeds from sales | | | — | |
| Total realized gain/(loss) | | | — | |
| Change in unrealized appreciation | | | — | |
| Ending balance October 31, 2021 | | $ | 0 | |
The total change in unrealized appreciation/(depreciation) included in the Statements of Operations attributable to Level 3 investments still held at October 31, 2021, was $0.
Quantitative disclosures of unobservable inputs and assumptions used by the Fund are below.
| Common Stock | | Fair Value | | Valuation Techniques | | Unobservable Input |
| Tenerity, Inc. | | $ | 0 | | Independent Valuation | | Adjusted for lack of marketability |
Security transactions and related income – Security transactions are accounted for on trade date. Interest income is recognized on an accrual basis. Discounts are accreted and premiums are amortized on securities purchased over the lives of the respective securities. Dividend income is recorded on the ex-dividend date. Realized gains or losses from sales of securities are determined by comparing the identified cost of the security lot sold with the net sales proceeds.
Dividends and distributions to shareholders – Dividends from net investment income, if any, are declared and paid annually. Distributable net realized capital gains, if any, are declared and distributed annually. Dividends from net investment income and distributions from net realized gains are recorded on ex dividend date and are determined in accordance with federal income tax regulations, which may differ from GAAP. These “book/tax” differences are considered either temporary (i.e., deferred losses, capital loss carry forwards) or permanent in nature. To the extent these differences
Invenomic Fund
NOTES TO FINANCIAL STATEMENTS (Continued)
October 31, 2021
are permanent in nature, such amounts are reclassified within the composition of net assets based on their federal tax-basis treatment; temporary differences do not require reclassification. These reclassifications have no effect on net assets, results from operations or net asset value per share of the Fund.
Exchange Traded Funds – The Fund may invest in exchange traded funds (“ETFs”). ETFs are a type of index fund bought and sold on a securities exchange. An ETF trades like common stock and represents a fixed portfolio of securities designed to track the performance and dividend yield of a particular domestic or foreign market index. A Fund may purchase an ETF to temporarily gain exposure to a portion of the U.S. or a foreign market while awaiting purchase of underlying securities. The risks of owning an ETF generally reflect the risks of owning the underlying securities they are designed to track, although the lack of liquidity on an ETF could result in it being more volatile. Additionally, ETFs have fees and expenses that reduce their value.
Foreign Currency Translations – The accounting records of the Fund are maintained in U.S. dollars. Investment securities and other assets and liabilities denominated in a foreign currency, and income receipts and expense payments are translated into U.S. dollars using the prevailing exchange rate at the London market close. Purchases and sales of securities are translated into U.S. dollars at the contractual currency rates established at the approximate time of the trade.
Option Transactions – When the Fund writes a call option, an amount equal to the premium received is included in the statement of assets and liabilities as a liability. The amount of the liability is subsequently marked-to-market to reflect the current market value of the option. If an option expires on its stipulated expiration date or if the Fund enters into a closing purchase transaction, a gain or loss is realized. If a written call option is exercised, a gain or loss is realized for the sale of the underlying security and the proceeds from the sale are increased by the premium originally received. As writer of an option, the Fund has no control over whether the option will be exercised and, as a result, retains the market risk of an unfavorable change in the price of the security underlying the written option.
The Fund may purchase put and call options. Put options are purchased to hedge against a decline in the value of securities held in the Fund’s portfolio. If such a decline occurs, the put options will permit the Fund to sell the securities underlying such options at the exercise price, or to close out the options at a profit. The premium paid for a put or call option plus any transaction costs will reduce the benefit, if any, realized by the Fund upon exercise of the option, and, unless the price of the underlying security rises or declines sufficiently, the option may expire worthless to the Fund. In addition, in the event that the price of the security in connection with which an option was purchased moves in a direction favorable to the Fund, the benefits realized by the Fund as a result of such favorable movement will be reduced by the amount of the premium paid for the option and related transaction costs. Written and purchased options are non-income producing securities. With purchased options, there is minimal counterparty risk to the Fund since these options are exchange traded and the exchange’s clearinghouse, as counterparty to all exchange traded options, guarantees against a possible default.
In conjunction with the use of written options contracts and short sales, the Fund may be required to maintain collateral in various forms. At October 31, 2021, such collateral is denoted in the Fund’s Schedule of Investments and Statements of Assets and Liabilities. Also, in conjunction with the use of written options contacts and short sales, the Fund, when appropriate, utilize a segregated margin deposit account with the counterparty. At October 31, 2021, these segregated margin deposit accounts are denoted in the Fund’s Statements of Assets and Liabilities.
Short Sales – A “short sale” is a transaction in which the Fund sells a security it does not own but has borrowed in anticipation that the market price of that security will decline. The Fund is obligated to replace the security borrowed by purchasing it on the open market at a later date. If the price of the security sold short increases between the time of the short sale and the time the Fund replaces the borrowed security, the Fund will incur a loss, unlimited in size. Conversely, if the price declines, the Fund will realize a gain, limited to the price at which the Fund sold the security short. Certain cash and securities are held as collateral.
Securities Lending Risk – The Fund may lend portfolio securities to institutions, such as banks and certain broker-dealers. A Fund may experience a loss or delay in the recovery of its securities if the borrowing institution breaches its agreement with the Fund.
Invenomic Fund
NOTES TO FINANCIAL STATEMENTS (Continued)
October 31, 2021
Federal income tax – It is the Fund’s policy to qualify as a regulated investment company by complying with the provisions of the Internal Revenue Code that are applicable to regulated investment companies and to distribute substantially all of its taxable income and net realized gains to shareholders. Therefore, no federal income tax provision is required. The Fund recognizes the tax benefits of uncertain tax positions only where the position is “more likely than not” to be sustained assuming examination by tax authorities. Management has analyzed the Fund’s tax positions and has concluded that no liability for unrecognized tax benefits should be recorded related to uncertain tax positions taken on returns filed for open tax years ended October 31, 2018 to October 31, 2020, or expected to be taken in the Fund’s October 31, 2021 year end tax returns. The Fund identifies its major tax jurisdictions as U.S. Federal and Ohio (Nebraska in years prior to 2019), and foreign jurisdictions where the Fund makes significant investments; however the Fund is not aware of any tax positions for which it is reasonably possible that the total amounts of unrecognized tax benefits will change materially in the next twelve months.
Expenses – Expenses of the Trust that are directly identifiable to a specific fund are charged to that fund. Expenses which are not readily identifiable to a specific fund are allocated in such a manner as deemed equitable, taking into consideration the nature and type of expense and the relative sizes of the funds in the Trust.
Indemnification – The Trust indemnifies its officers and Trustees for certain liabilities that may arise from the performance of their duties to the Trust. Additionally, in the normal course of business, the Fund enters into contracts that contain a variety of representations and warranties and which provide general indemnities. The Fund’s maximum exposure under these arrangements is unknown, as this would involve future claims that may be made against the Fund that have not yet occurred. However, based on experience, the risk of loss due to these warranties and indemnities appears to be remote.
| 3. | INVESTMENT TRANSACTIONS |
For the year ended October 31, 2021, cost of purchases and proceeds from sales of portfolio securities, other than short-term investments and securities sold short, amounted to the following:
| Purchases | | | Sales | |
| $ | 479,892,561 | | | $ | 430,901,701 | |
| 4. | INVESTMENT ADVISORY AGREEMENT AND TRANSACTIONS WITH RELATED PARTIES |
Invenomic Capital Management LP serves as the investment advisor to the Fund. Pursuant to an Investment Advisory Agreement with the Fund, the Advisor, under the oversight of the Board, directs the daily operations of the Fund and supervises the performance of administrative and professional services provided by others. As compensation for its services and the related expenses borne by the Advisor, the Fund pays the Advisor an investment advisory fee, computed and accrued daily and paid monthly, at an annual rate of 1.74%. For the year ended October 31, 2021, the Fund incurred advisory fees in the amount of $4,063,887.
The Fund’s Advisor has contractually agreed to reduce its fees and/or absorb expenses of the Fund, until at least February 28, 2022 to ensure that Total Annual Fund Operating Expenses after fee waiver and/or reimbursement (excluding interest and tax expenses, dividends on short positions and Acquired Fund Fees and Expenses) for the Fund do not exceed 2.23%, 2.48% and 1.98% of the Fund’s average net assets, for Institutional Class, Investor Class shares and Super Institutional Class shares, respectively; subject to possible recoupment from the Fund in future years on a rolling three year basis (within the three years after the fees have been waived or reimbursed) if such recoupment can be achieved within the foregoing expense limits. During the year ended October 31, 2021 the total amount of advisory fees waived was $226,230. As of October 31, 2021 the total amount of advisory fees waived subject to recapture is $512,279, of which $62,193 will expire on October 31, 2022, $223,856 will expire October 31, 2023 and $226,230 will expire on October 31, 2024.
Invenomic Capital Management LP serves as the Authorized Service Provider to the Fund. Pursuant to a Shareholder Services Plan with the Fund, the Advisor, under the oversight of the Board, provides customers who own shares of the fund with administrative support services. As compensation for its services and the related expenses borne by the Advisor, the Fund pays the Advisor a shareholder services fee, computed and accrued daily and paid monthly, at an annual rate of 0.25%
Invenomic Fund
NOTES TO FINANCIAL STATEMENTS (Continued)
October 31, 2021
of the Institutional Class and Investor Class Shares of the Fund. For the year ended October 31, 2021, the Fund incurred shareholder service fees in the amount of $533,964 and $49,793 for the Institutional Class and Investor Class Shares respectively.
Distributor – The distributor of the Fund is Northern Lights Distributors, LLC (the “Distributor”). The Board of Trustees of the Northern Lights Fund Trust II has adopted, on behalf of the Fund, the Trust’s Master Distribution and Shareholder Servicing Plan (the “Plan”), as amended, pursuant to Rule 12b-1 under the Investment Company Act of 1940, to pay for certain distribution activities and shareholder services. Under the Plan, the Fund may pay 0.25% per year of the average daily net assets of Investor Class shares for such distribution and shareholder service activities. For the year ended October 31, 2021, the Fund incurred distribution fees in the amount of $49,793.
In addition, certain affiliates of the Distributor provide services to the Fund as follows:
Ultimus Fund Solutions, LLC (“UFS”), an affiliate of the Distributor, provides administration, fund accounting, and transfer agent services to the Trust. Pursuant to separate servicing agreements with GFS, the Fund pays GFS customary fees for providing administration, fund accounting and transfer agency services to the Fund. Certain officers of the Trust are also officers of GFS, and are not paid any fees directly by the Fund for serving in such capacities.
Northern Lights Compliance Services, LLC (“NLCS”), an affiliate of UFS and the Distributor, provides a Chief Compliance Officer to the Trust, as well as related compliance services, pursuant to a consulting agreement between NLCS and the Trust. Under the terms of such agreement, NLCS receives customary fees from the Fund.
Blu Giant, LLC (“Blu Giant”), an affiliate of UFS and the Distributor, provides EDGAR conversion and filing services as well as print management services for the Fund on an ad-hoc basis. For the provision of these services, Blu Giant receives customary fees from the Fund.
| 5. | DERIVATIVE TRANSACTIONS |
The following is a summary of the effect of derivative instruments on the Fund’s Statement of Assets and Liabilities as of October 31, 2021.
| Contract Type/Primary Risk Exposure | | Statements of Assets and Liabilities | | Value | |
| Equity Contracts/Equity price risk | | Investment securities at value | | $ | 1,211,404 | |
The following is a summary of the effect of derivative instruments on the Fund’s Statement of Operations for the year ended October 31, 2021.
| | | | | | Change in Unrealized | |
| Contract type/ | | Realized Gain/(Loss) | | | Appreciation/(Depreciation) | |
| Primary Risk Exposure | | On Options Purchased | | | on Options Purchased | |
| Equity contracts/Equity Price Risk | | $ | (6,974,966 | ) | | $ | 664,448 | |
| | | | | | Change in Unrealized | |
| Contract type/ | | Realized Gain/(Loss) | | | Appreciation/(Depreciation) | |
| Primary Risk Exposure | | on Options Written | | | on Options Written | |
| Equity contracts/Equity Price Risk | | $ | (691,460 | ) | | $ | (79,571 | ) |
The notional value and contracts of the derivative instruments outstanding as of October 31, 2021 as disclosed in the Portfolio of Investments and the amounts realized and changes in unrealized gains and losses on derivative instruments during the period as disclosed above and within the Statement of Operations serve as indicators of the volume of derivative activity for the Fund.
Invenomic Fund
NOTES TO FINANCIAL STATEMENTS (Continued)
October 31, 2021
The Fund may assess a short-term redemption fee of 1.00% of the total redemption amount if a shareholder sells his shares after holding them for less than 60 days. The redemption fee is paid directly to the Fund. For the six months ended October 31, 2021 the redemption fees assessed by the Fund were as follows:
| Institutional | | | Investor | | | Super Institutional | |
| $ | 181,947 | | | $ | 72,258 | | | $ | 42 | |
| 7. | AGGREGATE UNREALIZED APPRECIATION AND DEPRECIATION – TAX BASIS |
The identified cost of investments in securities owned by the Fund for federal income tax purposes, and its respective gross unrealized appreciation and depreciation at October 31, 2021, was as follows:
| | | | Gross | | | Gross | | | Net Unrealized | |
| Tax | | | Unrealized | | | Unrealized | | | Appreciation | |
| Cost | | | Appreciation | | | Depreciation | | | (Depreciation) | |
| $ | 57,130,737 | | | $ | 68,328,880 | | | $ | (37,688,446 | ) | | $ | 30,640,434 | |
| 8. | DISTRIBUTIONS TO SHAREHOLDERS AND TAX COMPONENTS OF CAPITAL |
The tax character of distributions paid during the period ended October 31, 2021 and October 31, 2020 was as follows:
| | | Fiscal Year Ended | | | Fiscal Year Ended | |
| | | October 31, 2021 | | | October 31, 2020 | |
| Ordinary Income | | $ | 4,836,176 | | | $ | 7,686,875 | |
| Long-Term Capital Gain | | | — | | | | 116,875 | |
| Return of Capital | | | — | | | | — | |
| | | $ | 4,836,176 | | | $ | 7,803,750 | |
As of October 31, 2021, the components of accumulated earnings/ (deficit) on a tax basis were as follows:
| Undistributed | | | Undistributed | | | Post October Loss | | | Capital Loss | | | Other | | | Unrealized | | | Total | |
| Ordinary | | | Long-Term | | | and | | | Carry | | | Book/Tax | | | Appreciation/ | | | Accumulated | |
| Income | | | Gains | | | Late Year Loss | | | Forwards | | | Differences | | | (Depreciation) | | | Earnings/(Deficits) | |
| $ | 27,951,481 | | | $ | 17,090,013 | | | $ | — | | | $ | — | | | $ | (21,528 | ) | | $ | 30,716,229 | | | $ | 75,736,195 | |
The difference between book basis and tax basis undistributed net investment income/(loss), accumulated net realized gain/(loss), and unrealized appreciation/(depreciation) from investments is primarily attributable to the tax deferral of losses on wash sales, straddles and adjustments C-Corporation return of capital distributions.
During the fiscal year ended October 31, 2021, the Fund utilized tax equalization which is the use of earnings and profits distributions to shareholders on redemption of shares as part of the dividends paid deduction for income tax purposes. Permanent book and tax differences, primarily attributable to book/tax treatment of tax adjustment for equalization credits, resulted in reclassification for the year ended October 31, 2021 as follows:
| Paid | | | | |
| In | | | Accumulated | |
| Capital | | | Earnings (Losses) | |
| $ | 1,074,717 | | | $ | (1,074,717 | ) |
Invenomic Fund
NOTES TO FINANCIAL STATEMENTS (Continued)
October 31, 2021
Under an agreement with U.S. Bank National Association (The “Bank”) the Invenomic Fund (the “Fund”) can lend its portfolio securities to brokers, dealers and other financial institutions approved by the Board of Trustees to earn additional income. Loans are collateralized by cash, in an amount at least equal to the market value of the securities loaned plus accrued interest, which is invested in highly liquid, short-term instruments such as repurchase agreements collateralized by money market funds in accordance with the Fund’s security lending procedures. A portion of the income generated by the investment in the collateral, net of any rebates paid by the Bank to the borrowers is remitted to the Bank as lending agent, and the remainder is paid to the Fund. The Fund continues to receive interest or dividends on the securities loaned. The Fund has the right under the Master Securities Lending Agreement to recover the securities from the borrower on demand; if the borrower fails to deliver the securities on a timely basis, the Fund could experience delays or losses on recovery. Additionally, the Fund is subject to the risk of loss from investments made with the cash received as collateral. The Fund manages credit exposure arising from these lending transactions by, in appropriate circumstances, entering into master netting agreements and collateral agreements with third party borrowers that provide in the event of default (such as bankruptcy or a borrower’s failure to pay or perform), the right to net a third party borrower’s rights and obligations under such agreement and liquidate and set off collateral against the net amount owed by the counterparty.
At October 31, 2021, the Fund had loaned securities and received cash collateral for the loan. This cash was invested in the Mount Vernon Liquid Assets Portfolio, LLC as shown in the Schedules of Investments. The Fund receives compensation relating to the lending of the Fund’s securities.
The market value of loaned securities and collateral and percentage of total investment income the Fund received from the investment of cash collateral retained by the lending agent, U.S. Bank, were as follows:
| Market Value of | | | Market Value of | | | Percentage of Total | |
| Loaned Securities | | | Collateral | | | Investment Income | |
| $ | 19,796,214 | | | $ | 20,517,527 | | | | 1.52 | % |
| | | | | | Gross Amounts Not Offset in
the Statement of Assets and
Liabilities | | | | |
| | | Gross Amounts | | | | | | | | | | |
| | | Recognized in | | | Financial | | | Cash | | | | |
| | | Statements of Assets | | | Instruments | | | Collateral | | | Net Amount | |
| Invenomic Fund | | and Liabilities | | | Pledged | | | Pledged | | | of Assets | |
| Description of Liability | | | | | | | | | | | | | | | | |
| Securities lending collateral | | $ | 20,517,527 | | | $ | — | | | $ | 20,517,527 | (1) | | $ | — | |
| (1) | The amount is limited to the liability balance and accordingly does not include excess collateral pledged. The following table breaks out the holdings pledged as collateral as of October 31, 2021: |
| | | Overnight and | | | Up to | | | | | | Greater than | | | | |
| | | Continuous | | | 30 Days | | | 30-90 days | | | 90 days | | | Total | |
| Mount Vernon Liquid Assets Portfolio, LLC | | $ | 20,517,527 | | | $ | — | | | $ | — | | | $ | — | | | $ | 20,517,527 | |
The fair value of the securities loaned for the Fund totaled $19,796,214 at October 31, 2021. The securities loaned are noted in the Portfolios of Investments. The fair value of the “Collateral for Securities Loaned” on the Portfolio of Investments includes only cash collateral received and reinvested that totaled $20,517,527 for the Fund at October 31, 2021. These amounts are offset by a liability recorded as “Securities lending collateral.”
Invenomic Fund
NOTES TO FINANCIAL STATEMENTS (Continued)
October 31, 2021
| 10. | CONTROL OWNERSHIP (Unaudited) |
The beneficial ownership, either directly or indirectly, of more than 25% of the voting securities of a fund creates presumption of control of the fund, under Section 2(a)(9) of the 1940 Act. As of October 31, 2021, Charles Schwab & Co. and National Financial Services LLC held approximately 36.67% and 29.52%, respectively of the voting securities of the Fund for the benefit of others. The Fund has no knowledge as to whether all or any portion of the shares owned on record by Charles Schwab & Co. and National Financial Services LLC. are also owned beneficially by any party who would be presumed to control the Fund.
| 11. | NEW ACCOUNTING PRONOUNCEMENTS |
In October 2020, the Securities and Exchange Commission (“SEC”) adopted new regulations governing the use of derivative by registered investment companies (“Rule 18f-4”). Rule 18f-4 will impose limits on the amount of derivatives a Fund can enter into, eliminate the asset segregation framework currently used by funds to comply with Section 18 of the 1940 Act, and require funds whose use of derivatives is greater than a limited specified amount to establish and maintain a comprehensive derivatives risk management program and appoint a derivatives risk manager. Funds will be required to comply with Rule 18f-4 by August 19, 2022. It is not currently clear what impact, if any, Rule 18f-4 will have on the availability, liquidity or performance of derivatives. Management is currently evaluating the potential impact of Rule 18f-4 on the Funds. When fully implemented, Rule 18f-4 may require changes in how a Fund uses derivatives, adversely affect the Fund’s performance and increase costs related to the Funds’ use of derivatives.
Subsequent events after the date of the Statement of Assets and Liabilities have been evaluated through the date the financial statements were issued. Management has determined that no events or transactions occurred requiring adjustment or disclosure in the financial statements.
REPORT OF INDEPENDENT REGISTERED PUBLIC ACCOUNTING FIRM
To the Board of Trustees
of Northern Lights Fund Trust II and
Shareholders of
Invenomic Fund
Opinion on the Financial Statements
We have audited the accompanying statements of assets and liabilities of Invenomic Fund (the “Fund”), a series of Northern Lights Fund Trust II (the “Trust”), including the schedules of investments, as of October 31, 2021, the related statement of operations for the year then ended, the statements of changes in net assets for each of the two years in the period then ended, the financial highlights for each of the four years in the period then ended and the period from June 19, 2017 (commencement of operations) through October 31, 2017, and the related notes (collectively referred to as the “financial statements”). In our opinion, the financial statements present fairly, in all material respects, the financial position of the Fund as of October 31, 2021, the results of its operations for the year then ended, the changes in its net assets for each of the two years in the period then ended, and the financial highlights for each of the four years in the period then ended and the period from June 19, 2017 (commencement of operations) through October 31, 2017, in conformity with accounting principles generally accepted in the United States of America.
Basis for Opinion
These financial statements are the responsibility of the Fund’s management. Our responsibility is to express an opinion on the Fund’s financial statements based on our audits. We are a public accounting firm registered with the Public Company Accounting Oversight Board (United States) (“PCAOB”) and are required to be independent with respect to the Fund in accordance with the U.S. federal securities laws and the applicable rules and regulations of the Securities and Exchange Commission and the PCAOB. We have served as the auditor of one or more of the funds in the Trust since 2012.
We conducted our audits in accordance with the standards of the PCAOB. Those standards require that we plan and perform the audit to obtain reasonable assurance about whether the financial statements are free of material misstatement, whether due to error or fraud. The Fund is not required to have, nor were we engaged to perform, an audit of its internal control over financial reporting. As part of our audits we are required to obtain an understanding of internal control over financial reporting, but not for the purpose of expressing an opinion on the effectiveness of the Fund’s internal control over financial reporting. Accordingly, we express no such opinion.
Our audits included performing procedures to assess the risks of material misstatement of the financial statements, whether due to error or fraud, and performing procedures that respond to those risks. Such procedures included examining, on a test basis, evidence regarding the amounts and disclosures in the financial statements. Our audits also included evaluating the accounting principles used and significant estimates made by management, as well as evaluating the overall presentation of the financial statements. Our procedures included confirmation of securities owned as of October 31, 2021 by correspondence with the custodian and brokers; when replies were not received from brokers, we performed other auditing procedures. We believe that our audits provide a reasonable basis for our opinion.
TAIT, WELLER & BAKER LLP
Philadelphia, Pennsylvania
December 23, 2021
Invenomic Fund
EXPENSE EXAMPLES (Unaudited)
October 31, 2021
As a shareholder of a Fund, you incur two types of costs: (1) transaction costs, including sales charges (loads) on purchases and redemptions; and redemption fees; (2) ongoing costs, including management fees; distribution and/or service (12b-1) fees; and other Fund expenses. This example is intended to help you understand your ongoing costs (in dollars) of investing in the Funds and to compare these costs with the ongoing costs of investing in other mutual funds.
The example is based on an investment of $1,000 invested at the beginning of the period and held for the entire period as noted below.
Actual Expenses
The “Actual Expenses” line in the table below provides information about actual account values and actual expenses. You may use the information below; together with the amount you invested, to estimate the expenses that you paid over the period. Simply divide your account value by $1,000 (for example, an $8,600 account value divided by $1,000 = 8.6), then multiply the result by the number in the table under the heading entitled “Expenses Paid During Period” to estimate the expenses you paid on your account during this period.
Hypothetical Example for Comparison Purposes
The “Hypothetical” line in the table below provides information about hypothetical account values and hypothetical expenses based on the respective Fund’s actual expense ratio and an assumed rate of return of 5% per year before expenses, which is not the Fund’s actual return. The hypothetical account values and expenses may not be used to estimate the actual ending account balances or expenses you paid for the period. You may use this information to compare this 5% hypothetical example with the 5% hypothetical examples that appear in the shareholder reports of other funds.
Please note that the expenses shown in the table are meant to highlight your ongoing costs only and do not reflect any transactional costs, such as sales charges (loads). Therefore, the table is useful in comparing ongoing costs only, and will not help you determine the relative total costs of owning different funds. In addition, if these transactional costs were included, your costs would have been higher.
| | Beginning | Ending | Expenses Paid | Expense Ratio During the |
| | Account Value | Account Value | During Period | Period |
| Actual* | 5/1/21 | 10/31/21 | 5/1/21 – 10/31/21 | 5/1/21 – 10/31/21 |
| Institutional Class | $1,000.00 | $1,029.60 | $11.41 | 2.23% |
| Investor Class | $1,000.00 | $1,030.50 | $12.69 | 2.48% |
| Super Institutional Class | $1,000.00 | $1,031.30 | $10.14 | 1.98% |
| | Beginning | Ending | Expenses Paid | Expense Ratio During the |
| Hypothetical ** | Account Value | Account Value | During Period | Period |
| (5% return before expenses) | 5/1/21 | 10/31/21 | 5/1/21 – 10/31/21 | 5/1/21 – 10/31/21 |
| Institutional Class | $1,000.00 | $1,013.96 | $11.32 | 2.23% |
| Investor Class | $1,000.00 | $1,012.70 | $12.58 | 2.48% |
| Super Institutional Class | $1,000.00 | $1,015.22 | $10.06 | 1.98% |
| * | Expenses are equal to the average account value over the period, multiplied by the Fund’s annualized expense ratio, multiplied by the number of days in the period (184) divided by the number of days in the fiscal year (365). |
| ** | The hypothetical example assumes that the Fund was in operation for the full six months ended October 31, 2021. |
Invenomic Fund
SUPPLEMENTAL INFORMATION (Unaudited)
October 31, 2021
LIQUIDITY RISK MANAGEMENT PROGRAM
The Fund has adopted and implemented a written liquidity risk management program as required by Rule 22e-4 (the “Liquidity Rule”) under the 1940 Act. The program is reasonably designed to assess and manage the Fund’s liquidity risk, taking into consideration, among other factors, the Fund’s investment strategy and the liquidity of its portfolio investments during normal and reasonably foreseeable stressed conditions; its short and long-term cash flow projections; and its cash holdings and access to other funding sources.
During the fiscal year ended October 31, 2021, the Trust’s Liquidity Risk Management Program Committee (the “Committee”) reviewed the Fund’s investments and determined that the Fund held adequate levels of cash and highly liquid investments to meet shareholder redemption activities in accordance with applicable requirements. Accordingly, the Committee concluded that (i) the Fund’s liquidity risk management program is reasonably designed to prevent violations of the Liquidity Rule and (ii) the Fund’s liquidity risk management program has been effectively implemented.
Invenomic Fund
SUPPLEMENTAL INFORMATION (Unaudited)
October 31, 2021
FACTORS CONSIDERED BY THE TRUSTEES IN THE APPROVAL OF THE RENEWAL OF AN INVESTMENT ADVISORY AGREEMENT
At a meeting (the “Meeting”) of the Board of Trustees (the “Board”) of Northern Lights Fund Trust II (the “Trust”) held on April 27 and 28, 2021, the Board, including the disinterested Trustees (the “Independent Trustees”), considered the approval of the renewal of the advisory agreement between Invenomic Capital Management LP (“ICM”) and the Trust on behalf of the Invenomic Fund (the “Invenomic Advisory Agreement”)
Based on their evaluation of the information provided by ICM, in conjunction with the Invenomic Fund’s other service providers, the Board, by a unanimous vote (including a separate vote of the Independent Trustees), approved the renewal of the Advisory Agreement with respect to the Invenomic Fund.
In advance of the Meeting, the Board requested and received materials to assist them in considering the Invenomic Advisory Agreement. The materials provided contained information with respect to the factors enumerated below, including the Invenomic Advisory Agreement, a memorandum prepared by the Trust’s outside legal counsel discussing in detail the Trustees’ fiduciary obligations and the factors they should assess in considering the continuation of the Invenomic Advisory Agreement and comparative information relating to the advisory fee and other expenses of the Invenomic Fund. The materials also included due diligence materials relating to ICM (including due diligence questionnaires completed by ICM, select financial information of ICM, bibliographic information regarding ICM’s key management and investment advisory personnel, and comparative fee information relating to the Fund) and other pertinent information. At the Meeting, the Independent Trustees were advised by counsel that is experienced in Investment Company Act of 1940 matters and that is independent of fund management and met with such counsel separately from fund management.
The Board then reviewed and discussed the written materials that were provided in advance of the Meeting and deliberated on the approval of the renewal of the Invenomic Advisory Agreement with respect to the Invenomic Fund. The Board relied upon the advice of independent legal counsel and their own business judgment in determining the material factors to be considered in evaluating the Invenomic Advisory Agreement and the weight to be given to each such factor. The conclusions reached by the Board were based on a comprehensive evaluation of all of the information provided and were not the result of any one factor. Moreover, each Trustee may have afforded different weight to the various factors in reaching his conclusions with respect to the Invenomic Advisory Agreement. In considering the renewal of the Invenomic Advisory Agreement, the Board reviewed and analyzed various factors that they determined were relevant, including the factors enumerated below.
Nature, Extent and Quality of Services. During the discussions with ICM, the Board reviewed materials provided by ICM relating to the Invenomic Advisory Agreement, including a description of the manner in which investment decisions are made and executed and a review of the professional personnel performing services for Invenomic including the individuals that primarily monitor and execute the investment process. The Board discussed and noted they had met with ICM previously and were familiar with ICM’s capabilities and experience managing a mutual fund as well as its commitment to Invenomic. The Board then discussed ICM’s research capabilities, the quality of its compliance infrastructure and the experience of its fund management personnel. The Board considered ICM’s specific responsibilities in all aspects of the day-to-day management of Invenomic and concluded that ICM’s personnel have the qualifications and expertise to manage Invenomic. The Board also noted that ICM remained committed to Invenomic’s investment strategy. Additionally, the Board received responses from representatives of ICM with respect to a series of important questions, including: whether ICM is involved in any lawsuits or pending regulatory actions; whether the management of other accounts conflicts with its management of Invenomic; and whether ICM has procedures in place to adequately allocate trades among its respective clients. The Board also reviewed the descriptions provided by ICM of its practices for monitoring compliance with Invenomic’s investment limitations, noting that ICM’s chief compliance officer would continually review the portfolio managers’ performance of their duties with respect to Invenomic to ensure compliance under ICM’s compliance program. The Board then reviewed the capitalization of ICM based on financial information and other materials provided by and discussed with ICM and concluded that ICM was sufficiently well-capitalized, or that its control person had the ability to make additional contributions in order to meet its obligations to Invenomic. The Board discussed
Invenomic Fund
SUPPLEMENTAL INFORMATION (Unaudited)(Continued)
October 31, 2021
ICM’s compliance structure and broker selection process and engaged in a discussion with the Trust’s chief compliance officer regarding ICM’s business practices. The Board noted that the CCO of the Trust continued to represent that ICM’s policies and procedures were reasonably designed to prevent violations of applicable securities laws. The Board also noted ICM’s representation that the prospectus and statement of additional information for Invenomic accurately describe the investment strategies of Invenomic. The Board concluded that ICM had sufficient quality and depth of personnel, resources, investment methods and compliance policies and procedures necessary to perform its duties under the Invenomic Advisory Agreement with respect to Invenomic and that the nature, overall quality and extent of the management services to be provided by ICM were satisfactory.
Performance. The Board discussed the reports prepared by Broadridge and reviewed the performance of Invenomic as compared to its peer group, Morningstar category and benchmark for the one year, three year and since inception periods ended March 31, 2021. The Board noted that Invenomic outperformed its respective peer group, Morningstar category and benchmark for each period as of March 31, 2021. The Board noted the portfolio managers’ ability to manage risk and concluded that past performance was acceptable and generally in line with its risk level.
Fees and Expenses. As to the costs of the services to be provided by ICM, the Board discussed the comparison of Invenomic’s advisory fee and total operating expense data as compared to its peer group and Morningstar category as presented in the Broadridge Report. The Board noted that although the advisory fee was near the high end of its peer group and Morningstar category, it was not the highest in its peer group or Morningstar category. The Board reviewed the contractual arrangements for Invenomic, which stated that ICM had agreed to waive or limit its advisory fee and/or reimburse expenses at least until February 28, 2022, in order to limit net annual operating expenses, exclusive of certain fees, so as not to exceed 2.23%, 2.48% and 1.98% of Invenomic’s average net assets for Institutional Class shares, Investor Class shares and Super Institutional Class shares, respectively. The Board found such arrangements to be beneficial to shareholders although noting that the net total expense ratio was again higher than the peer group median and the Morningstar category median, but not the highest in its peer group or Morningstar category. After further consideration, it was the consensus of the Board that, based on ICM’s experience and expertise, and the services to be provided by ICM to Invenomic, the advisory fee charged by ICM to Invenomic was not unreasonable.
Profitability. The Board also considered the level of profits that could be expected to accrue to ICM with respect to Invenomic based on breakeven and profitability reports and analyses reviewed by the Board and the selected financial information provided by ICM. The Board concluded that anticipated profits from ICM’s relationship with Invenomic were not excessive.
Economies of Scale. As to the extent to which Invenomic will realize economies of scale as it grows, and whether the fee levels reflect these economies of scale for the benefit of investors, the Board discussed ICM’s expectations for growth of Invenomic. The Board noted ICM’s intentions to consider a soft close of the Invenomic when assets reach between $500 million in assets and the possibility of adding breakpoint at that time. After consideration, the Board concluded that any material economies of scale would not be achieved in the near term.
Conclusion. The Board relied upon the advice of counsel, and their own business judgment in determining the material factors to be considered in evaluating the Invenomic Advisory Agreement and the weight to be given to each such factor. Accordingly, having requested and received such information from ICM as the Trustees believed to be reasonably necessary to evaluate the terms of the Invenomic Advisory Agreement, and as assisted by the advice of independent counsel, the Board, including a majority of the Independent Trustees voting separately, determined that (a) the terms of the Invenomic Advisory Agreement are not unreasonable; (b) the investment advisory fee payable pursuant to the Invenomic Advisory Agreement is not unreasonable; and (c) the Invenomic Advisory Agreement is in the best interests of the Invenomic Fund and its shareholders. Moreover, the Board noted that each Trustee may have afforded different weight to the various factors in reaching his conclusions with respect to the Invenomic Advisory Agreement.
| Invenomic Fund |
| SUPPLEMENTAL INFORMATION (Unaudited) |
| October 31, 2021 |
The Trustees and the officers of the Trust are listed below with their present positions with the Trust and principal occupations over at least the last five years. The business address of each Trustee and Officer is 225 Pictoria Drive, Suite 450, Cincinnati, OH 45246. All correspondence to the Trustees and Officers should be directed to c/o Gemini Fund Services, LLC, P.O. Box 541150, Omaha, Nebraska 68154.
Independent Trustees
Name and Year
of Birth | Position/Term of
Office* | Principal Occupation
During the Past Five Years | Number of
Portfolios in
Fund Complex
Overseen by
Trustee*** | Other Directorships held by Trustee
During the Past Five Years |
Thomas T. Sarkany
1946 | Trustee Since October 2011 | President, TTS Consultants, LLC (financial services) (since 2010). | 1 | Director, Aquila Distributors; Trustee, Arrow ETF Trust; Trustee, Arrow Investments Trust; Trustee, Northern Lights Fund Trust IV |
Anthony H. Lewis
1946 | Trustee Since May 2011 | Chairman and CEO of The Lewis Group USA (executive consulting firm)(since 2007). | 1 | Director, Member of the Compensation Committee and Member of the Risk Committee of Torotel Inc. (Magnetics, Aerospace and Defense), Trustee, Chairman of the Fair Valuation Committee and Member of the Audit Committee of the Wildermuth Endowment Strategy Fund |
Keith Rhoades
1948 | Trustee Since May 2011 | Retired since 2008. | 1 | NONE |
Randal D. Skalla
1962 | Trustee Since May 2011 | President, L5 Enterprises, Inc. (financial services company) (since 2001). | 1 | Board Member, Orizon Investment Counsel (financial services company) (from 2001 to 2017) |
| Invenomic Fund |
| SUPPLEMENTAL INFORMATION (Unaudited)(Continued) |
| October 31, 2021 |
Interested Trustees and Officers
Name and Year
of Birth | Position/Term of
Office* | Principal Occupation
During the Past Five Years | Number of
Portfolios in
Fund Complex
Overseen by
Trustee*** | Other Directorships held by Trustee
During the Past Five Years |
Brian Nielsen**
1972 | Trustee Since May 2011 | Trustee of Northern Lights Fund Trust II(since 2011); Special Projects Counsel of NorthStar Financial Services Group, LLC (from 2018 to 2019); Secretary of CLS Investments, LLC(from 2001 to 2018); Secretary of Orion Advisor Services, LLC(from 2001 to 2018); General Counsel and Secretary (from 2003 to 2018) of NorthStar Financial Services Group, LLC; CEO (from 2012 to 2018), Secretary (from 2003 to 2018)and Manager (from 2005 to 2018) of Northern Lights Distributors, LLC; Director, Secretary and General Counsel of Constellation Trust Company(from 2004 to 2018); CEO (from 2015 to 2018), General Counsel and Secretary (from 2011 to 2018) of Northern Lights Compliance Services, LLC; General Counsel and Secretary of Blu Giant, LLC(from 2011 to 2018); Secretary of Gemini Fund Services, LLC (from 2012 to 2018); Manager of Arbor Point Advisors, LLC(from 2012 to 2018); Director, Secretary and General Counsel of NorthStar CTC Holdings, Inc. (from 2015 to 2018) and Secretary and Chief Legal Officer of AdvisorOne Funds(from 2003 to 2018). | 1 | Manager of Northern Lights Distributors, LLC (from 2005 to 2018); Manager of Arbor Point Advisors, LLC (from 2012 to 2018); Director of Constellation Trust Company (from 2004 to 2018) |
Kevin E. Wolf
1969 | President Since January 2013 | Vice President of The Ultimus Group, LLC; Executive Vice President, Head of Fund Administration and Product(since 2019) and President (2012 - 2019) of Ultimus Fund Solutions, LLC (formerly, Gemini Fund Services, LLC). | N/A | N/A |
Richard Malinowski
1983 | Secretary Since January 2018 | Senior Vice President and Senior Managing Counsel(since February 2020), Senior Vice President Legal Administration(April 2017 to February 2020) and Vice President and Counsel (April 2016 to April 2017) of Ultimus Fund Solutions, LLC (formerly, Gemini Fund Services, LLC). | N/A | N/A |
Erik Naviloff
1968 | Treasurer Since January 2013 | Vice President of Ultimus Fund Solutions, LLC (formerly, Gemini Fund Services, LLC) (since 2011). | N/A | N/A |
Emile R. Molineaux
1962 | Chief Compliance Officer and Anti Money Laundering Officer Since May 2011 | Senior Compliance Officer and CCO of Various clients of Northern Lights Compliance Services, LLC (since 2011). | N/A | N/A |
| * | The term of office for each Trustee and Officer listed above will continue indefinitely. |
| ** | Brian Nielsen is an “interested person” of the Trust as that term is defined under the 1940 Act, because of his prior affiliation with Northern Lights Distributors, LLC (the Fund’s Distributor). |
| *** | As of October, 2021, the Trust was comprised of 22 active portfolios managed by unaffiliated investment advisers. The term “Fund Complex” applies only to the Fund, and not to any other series of the Trust. The Fund does not hold itself out as related to any other series within the Trust for investment purposes, nor does it share the same investment adviser with any other series. |
The Fund’s Statement of Additional Information (“SAI”) includes additional information about the Trustees and is available free of charge, upon request, by calling toll-free at 1-855-466-3406.
Privacy Policy
Rev. May 2019
| FACTS | WHAT DOES NORTHERN LIGHTS FUND TRUST II (“NLFT II”) DO WITH YOUR PERSONAL INFORMATION? |
| Why? | Financial companies choose how they share your personal information. Federal law gives consumers the right to limit some but not all sharing. Federal law also requires us to tell you how we collect, share, and protect your personal information. Please read this notice carefully to understand what we do. |
| What? | The types of personal information we collect and share depend on the product or service you have with us. This information can include:
|
● Social Security number ● Employment information ● Account balances | ● Account transactions ● Income ● Investment experience |
When you are no longer our customer, we continue to share your information as described in this notice. |
| How? | All financial companies need to share a customer’s personal information to run their everyday business - to process transactions, maintain customer accounts, and report to credit bureaus. In the section below, we list the reasons financial companies can share their customer’s personal information; the reasons NLFT II chooses to share; and whether you can limit this sharing. |
| | |
| Reasons we can share your personal information | Does NLFT II
share? | Can you limit
this sharing? |
For our everyday business purposes —
such as to process your transactions, maintain your account(s), respond to court orders and legal investigations, or report to credit bureaus
| Yes | No |
For our marketing purposes —
to offer our products and services to you
| Yes | No |
For joint marketing with other financial companies
| Yes | No |
For our affiliates’ everyday business purposes —
information about your transactions and experiences
| Yes | No |
For our affiliates’ everyday business purposes —
information about your creditworthiness
| No | We don’t share |
For nonaffiliates to market to you
| No | We don’t share |
| Questions? | Call 1-402-493-4603 |
| | |
| Who we are |
| Who is providing this notice? | Northern Lights Fund Trust II |
| What we do |
| How does NLFT II protect my personal information? | To protect your personal information from unauthorized access and use, we use security measures that comply with federal law. These measures include computer safeguards and secured files and buildings.
|
| How does NLFT II collect my personal information? | We collect your personal information, for example, when you
|
● open an account ● give us your income information ● provide employment information | ● provide account information ● give us your contact information |
| We also collect your personal information from others, such as credit bureaus, affiliates, or other companies. |
| Why can’t I limit all sharing? | Federal law gives you the right to limit only ● sharing for affiliates’ everyday business purposes—information about your creditworthiness ● affiliates from using your information to market to you ● sharing for nonaffiliates to market to you State laws and individual companies may give you additional rights to limit sharing. |
| Definitions |
| Affiliates | Companies related by common ownership or control. They can be financial and nonfinancial companies. ● Northern Lights Fund Trust II has no affiliates. |
| Nonaffiliates | Companies not related by common ownership or control. They can be financial and nonfinancial companies. ● NLFT II does not share with nonaffiliates so they can market to you. |
| Joint marketing | A formal agreement between nonaffiliated financial companies that together market financial products and services to you. ● Our joint marketing partners include other financial service companies. |
PROXY VOTING POLICY
Information regarding how the Fund voted proxies relating to portfolio securities for the most recent twelve month period ended June 30 as well as a description of the policies and procedures that the Fund uses to determine how to vote proxies is available without charge, upon request, by calling 1- 855-466-3406 or by referring to the Securities and Exchange Commission’s (“SEC”) website at http://www.sec.gov.
PORTFOLIO HOLDINGS
The Fund files its complete schedule of portfolio holdings with the SEC for the first and third quarters of each fiscal year on Form N-PORT. Form N-PORT is available on the SEC’s website at http://www.sec.gov. The information on Form N-PORT is available without charge, upon request, by calling 1-855-466-3406.
| INVESTMENT ADVISOR |
| Invenomic Capital Management |
| 211 Congress Street, Floor 7 |
| Boston, Massachusetts 02110 |
| |
| ADMINISTRATOR |
| Ultimus Fund Solutions, LLC |
| 225 Pictoria Drive, Suite 450 |
| Cincinnati, OH 45246 |
| |
| |
| Invenomic-AR21 |
(a) Include a copy of the report transmitted to stockholders pursuant to Rule 30e-1 under the Act (17 CFR 270.30e-1).
(b) Include a copy of each notice transmitted to stockholders in reliance on Rule 30e-3 under the Act (17 CFR 270.30e-3) that contains disclosures specified by paragraph (c)(3) of that rule. Not applicable.
Item 2. Code of Ethics.
(a) As of the end of the period covered by this report, the registrant has adopted a code of ethics that applies to the registrant's principal executive officer, principal financial officer, principal accounting officer or controller, or persons performing similar functions, regardless of whether these individuals are employed by the registrant or a third party.
(b) For purposes of this item, “code of ethics” means written standards that are reasonably designed to deter wrongdoing and to promote:
| (1) | Honest and ethical conduct, including the ethical handling of actual or apparent conflicts of interest between personal and professional relationships; |
| (2) | Full, fair, accurate, timely, and understandable disclosure in reports and documents that a registrant files with, or submits to, the Commission and in other public communications made by the registrant; |
(3) Compliance with applicable governmental laws, rules, and regulations;
| (4) | The prompt internal reporting of violations of the code to an appropriate person or persons identified in the code; and |
(5) Accountability for adherence to the code.
(c) Amendments: During the period covered by the report, there have not been any amendments to the provisions of the code of ethics.
(d) Waivers: During the period covered by the report, the registrant has not granted any express or implicit waivers from the provisions of the code of ethics.
(e) The Code of Ethics is not posted on Registrant’ website.
(f) A copy of the Code of Ethics is attached as an exhibit.
Item 3. Audit Committee Financial Expert.
(a) The Registrant’s board of trustees has determined that Keith Rhoades is an audit committee financial expert, as defined in Item 3 of Form N-CSR. Mr. Rhoades is independent for purposes of this Item.
Item 4. Principal Accountant Fees and Services.
| | | 2019 | | 2020 | | 2021 |
| Invenomic Fund | | | | $15,500 | | | | $16,000 | | | | $16,000 | |
| | | | 2019 | | | | 2020 | | | | 2021 | |
| Invenomic Fund | | | None | | | | None | | | | None | |
| | | 2019 | | 2020 | | 2021 |
| Invenomic Fund | | | $ | 3,250 | | | $ | 3,250 | | | $ | 3,250 | |
Preparation of Federal & State income tax returns, assistance with calculation of required income, capital gain and excise distributions and preparation of Federal excise tax returns.
| | | | 2019 | | | | 2020 | | | | 2021 | |
| Invenomic Fund | | | None | | | | None | | | | None | |
| (e) | (1) Audit Committee’s Pre-Approval Policies |
The registrant’s Audit Committee is required to pre-approve all audit services and, when appropriate, any non-audit services (including audit-related, tax and all other services) to the registrant. The registrant’s Audit Committee also is required to pre-approve, when appropriate, any non-audit services (including audit-related, tax and all other services) to its adviser, or any entity controlling, controlled by or under common control with the adviser that provides ongoing services to the registrant, to the extent that the services may be determined to have an impact on the operations or financial reporting of the registrant. Services are reviewed on an engagement by engagement basis by the Audit Committee.
| (2) | Percentages of Services Approved by the Audit Committee |
Invenomic Fund
| | | 2019 | | 2020 | | 2021 |
| Audit-Related Fees: | | | 0.00% | | | | 0.00% | | | | 0.00% | |
| Tax Fees: | | | 0.00% | | | | 0.00% | | | | 0.00% | |
| All Other Fees: | | | 0.00% | | | | 0.00% | | | | 0.00% | |
| (f) | During the audit of registrant's financial statements for the most recent fiscal year, less than 50 percent of the hours expended on the principal accountant's engagement were attributed to work performed by persons other than the principal accountant's full-time, permanent employees. |
| (g) | The aggregate non-audit fees billed by the registrant's accountant for services rendered to the registrant, and rendered to the registrant's investment adviser (not including any sub-adviser whose role is primarily portfolio management and is subcontracted with or overseen by another investment adviser), and any entity controlling, controlled by, or under common control with the adviser that provides ongoing services to the registrant: |
| | | 2019 | | 2020 | | 2021 |
| Invenomic Fund | | | $ | 3,250 | | | $ | 3,250 | | | $ | 3,250 | |
(h) The registrant's audit committee has considered whether the provision of non-audit services to the registrant's investment adviser (not including any sub-adviser whose role is primarily portfolio management and is subcontracted with or overseen by another investment adviser), and any entity controlling, controlled by, or under common control with the investment adviser that provides ongoing services to the registrant, that were not pre-approved pursuant to paragraph (c)(7)(ii) of Rule 2-01 of Regulation S-X, is compatible with maintaining the principal accountant's independence.
Item 5. Audit Committee of Listed Companies. Not applicable to open-end investment companies.
Item 6. Schedule of Investments. Schedule of investments in securities of unaffiliated issuers is included under Item 1.
Item 7. Disclosure of Proxy Voting Policies and Procedures for Closed-End Funds. Not applicable to open-end investment companies.
Item 8. Portfolio Managers of Closed-End Management Investment Companies. Not applicable to open-end investment companies.
Item 9. Purchases of Equity Securities by Closed-End Funds. Not applicable to open-end investment companies.
Item 10. Submission of Matters to a Vote of Security Holders. None
Item 11. Controls and Procedures.
(a) Based on an evaluation of the Registrant’s disclosure controls and procedures as of a date within 90 days of filing date of this Form N-CSR, the principal executive officer and principal financial officer of the Registrant have concluded that the disclosure controls and procedures of the Registrant are reasonably designed to ensure that the information required in filings on Form N-CSR is recorded, processed, summarized, and reported by the filing date, including that information required to be disclosed is accumulated and communicated to the Registrant’s management, including the Registrant’s principal executive officer and principal financial officer, as appropriate to allow timely decisions regarding required disclosure.
(b) There were no significant changes in the Registrant’s internal control over financial reporting that occurred during the Registrant’s last fiscal half-year that have materially affected, or are reasonably likely to materially affect, the Registrant’s internal control over financial reporting.
Item 12. Disclosure of securities lending activities for closed-end management investment companies.
Not applicable to open-end investment companies.
Item 13. Exhibits.
(a)(1) Code of Ethics filed herewith.
(a)(2) Certifications required by Section 302 of the Sarbanes-Oxley Act of 2002 (and Item 11(a)(2) of Form N-CSR) are filed herewith.
(a)(3) Not applicable for open-end investment companies.
(b) Certifications required by Section 906 of the Sarbanes-Oxley Act of 2002 (and Item 11(b) of Form N-CSR) are filed herewith.
SIGNATURES
Pursuant to the requirements of the Securities Exchange Act of 1934 and the Investment Company Act of 1940, the registrant has duly caused this report to be signed on its behalf by the undersigned, thereunto duly authorized.
(Registrant) Northern Lights Fund Trust II
By (Signature and Title)
/s/ Kevin E. Wolf
Kevin E. Wolf, Principal Executive Officer/President
Date 1/5/22
Pursuant to the requirements of the Securities Exchange Act of 1934 and the Investment Company Act of 1940, this report has been signed below by the following persons on behalf of the registrant and in the capacities and on the dates indicated.
By (Signature and Title)
/s/Kevin E. Wolf
Kevin E. Wolf, Principal Executive Officer/President
Date 1/5/22
By (Signature and Title)
/s/ Erik Naviloff
Erik Naviloff, Principal Financial Officer/Treasurer
Date 1/5/22