united states
securities and exchange commission
washington, d.c. 20549
form n-csr
certified shareholder report of registered management
investment companies
Investment Company Act file number 811-22549
Northern Lights Fund Trust II
(Exact name of registrant as specified in charter)
225 Pictoria Drive, Suite 450 Cincinnati, OH 45246
(Address of principal executive offices) (Zip code)
The Corporation Trust Company
1209 Orang Street, Wilmington, DE 19801
(Name and address of agent for service)
Registrant's telephone number, including area code: 631-490-4300
Date of fiscal year end: 11/30
Date of reporting period: 11/30/21
Item 1. Reports to Stockholders.

FormulaFolios US Equity Fund
Annual Report
November 30, 2021
1-855-907-3233
www.formulafoliofunds.com
Distributed by Northern Lights Distributors, LLC
Member FINRA
FormulaFolio Investments (FormulaFolios) is a Registered Investment Advisor that offers a distinct approach compared to traditional asset management. FormulaFolios uses emotion-free, statistically significant quantitative algorithms to aid in the investment decision making process. Unlike many quantitative investment firms; however, FormulaFolios focuses on longer-term market trends and lower Fund turnover rather than using a high-frequency trading approach. With the ever-changing investment landscape, it is more important than ever to prepare for and adapt to new economic regimes. This is why FormulaFolios focuses time and talents on developing smarter investment formulas. By removing investing prejudices with an algorithmic based approach, FormulaFolios believes investors can substantially increase the statistical probability of successful investment outcomes over time.
Dear FormulaFolios US Equity Fund Shareholder,
The fiscal year 2021 ending November 2021 saw continued economic and market recovery from the pandemic lows of early 2020. Following a very strong recovery in 2020, US stocks continued to make new all-time highs as the year progressed. The COVID-19 and various strains continued to dominate the headlines, concerns around inflation crept into the economic and market landscape. The economy and markets were transitioning from recovery to expansion. Consumer spending rebounded from the pandemic lows and trended higher through the year. However, the recovery saw continued challenges with labor shortages and supply chain issues. Conditions that put upward pressure on inflation.
Although the economic conditions look poised to continue improve, it is important to remember the future is largely independent of the past - nobody knows exactly what the future holds. This is why it is so imperative to stay committed to a smart investment strategy over the course of many years.
The following pages of this annual report includes information about your Fund, as well as a discussion regarding the global economic environment during the fiscal year ended November 30, 2021 and how recent prevailing economic factors affected Fund performance.
Please remember all securities markets fluctuate, as do Fund prices. Though it is impossible to eliminate all market risk, we believe active investment management can help mitigate the downside risk of investing.
Sincerely,
Mark DiOrio
Chief Investment Officer
Founder FormulaFolio Investments
This letter reflects FormulaFolio Investments analysis and opinions as of November 30, 2021. The information is not a complete analysis of every aspect of any market, country, industry, security or Fund.
Global Economic Year in Review
The fiscal year 2021 ending November 2021 saw continued economic and market recovery from the pandemic lows of early 2020. Following a very strong recovery in 2020, US stocks continued to make new all-time highs as the year progressed. The COVID-19 and various strains continued to dominate the headlines, concerns around inflation crept into the economic and market landscape. The economy and markets were transitioning from recovery to expansion. Consumer spending rebounded from the pandemic lows and trended higher through the year. However, the recovery saw continued challenges with labor shortages and supply chain issues. Conditions that put upward pressure on inflation.
Although the economic conditions look poised to continue improve, it is important to remember the future is largely independent of the past - nobody knows exactly what the future holds. This is why it is so imperative to stay committed to a smart investment strategy over the course of many years.
Fund Performance Summary
For the fiscal year ended November 30, 2021, Institutional Class shares of the FormulaFolios US Equity Fund underperformed its primary benchmark on a total return basis. The Fund had a cumulative total return of 22.65% for the 12 months ended November 30, 2021. In comparison, the Fund’s primary benchmark, the S&P 500 Total Return, which is a broad measure of total US stock market performance, posted a 27.92% cumulative total return. Most of this underperformance relative to the benchmark can be attributed to the fact that this is a quantitatively driven strategy, that, given the market’s sharp sell-off and quick recovery, was unable to respond to changing market conditions. Additionally, during the most recent fiscal year, the Fund had a higher weight to mid-cap and small-cap companies than the S&P 500 Index. During the most recent fiscal year, large caps outperformed small caps.
Performance data represent past performance, which does not guarantee future results. Investment return and principal value will fluctuate, and you may have a gain or loss when you sell your shares. Current performance may differ from figures shown.
Investment Strategy
At FormulaFolio Investments, we are committed to our methods of asset management with the goal of achieving above average risk adjusted returns over a long-time horizon. We believe by using emotion free, statistically significant quantitative algorithms to aid in the investment decision making process and help avoid typical investing biases, we can achieve this goal. When selecting investments for the Fund, our models utilize a proprietary three factor model to select up to 50 stocks from the Russell 3000 Index. The three factors are fundamental, technical, and macro-economic. These factors aim to ensure the Fund selects only the most fundamentally sounds companies, only selects companies with positive interest in the markets, and only invests assets when the broad US stock market appears to be favorable for investing. The Fund does not have targeted industry exposure but is mindful of industry weightings. The Fund will typically hold 40-50 individual US equities, though the number may vary. Due to the diversity in how markets are measured and how holdings are selected, the Fund has built-in defensive measures that allow it to take defensive positions, including cash, to limit catastrophic losses and preserve capital during poor market conditions, while still seeking long-term participation in equity bull markets. For example, during adverse market, economic, political, or other prevailing conditions, the Fund may invest up to 100% of assets in cash or cash equivalent investments. Maintaining the ability to seek defensive positions is consistent with the overarching philosophy of FormulaFolio Investments, though it may cause the Fund to temporarily deviate from the objective of holding 40-50 individual US equities. By taking defensive positions, volatility and drawdowns may be minimized while giving the Fund the potential to achieve desirable returns during favorable investment environments.
How Market Conditions Affected the Fund
The quantitative strategy employed by the Fund was the largest contributor to Fund performance relative to the benchmark. Throughout the year, the Fund maintained a higher weight toward smaller companies compared to the S&P 500 Index benchmark. This also skewed returns as larger companies outperformed smaller companies.
A Look Ahead for Next Year
The Fund is approximately 80% invested in US equities as of the end of the fiscal year ended November 30, 2021, in line with the 80% or higher objective of the Fund. The continued growth of the economy will depend on the successful rollout of the vaccines as well as the size and the timing of the interest rate increases. At this point, we anticipate an uneven recovery; therefore, we will continue to maintain slightly defensive stand in the Fund while remaining cautiously optimistic going into Fiscal Year 2022. It is important to be mindful that markets are always unknown, and conditions can change without notice, but under current conditions, we believe equities have the potential for further gains over the next year. Thank you for your continued investment in the FormulaFolios US Equity Fund. As always, we are committed to working to achieve the most desirable risk adjusted returns over a full market cycle and bringing you value as a shareholder.
The views and opinions expressed within this letter are those of ForumulaFolio Investments. These views and opinions are subject to change at any time based on changes in the economy and financial markets. These views and opinions do not constitute investment advice or recommendations and investors should not act on the information discussed within this letter. The information provided is not a complete analysis of every market, country, industry, security, or the Fund. Statements of fact are from sources considered reliable, but FormulaFolio Investments makes no representation or warranty as to their completeness or accuracy. Although historical performance is no guarantee of future results, these insights may help you understand our investment management philosophy.
9077-NLD 02/01/2022
FORMULAFOLIOS US EQUITY FUND
PORTFOLIO REVIEW (Unaudited)
November 30, 2021
The Fund’s performance figures* for the years/periods ended November 30, 2021, as compared to its benchmarks:
| | | Annualized | Annualized | Annualized |
| | One Year | Three Year | Five Year | Since Inception (1) |
| FormulaFolios US Equity Fund - Institutional Class | 22.65% | 4.43% | 5.25% | 5.53% |
| FormulaFolios US Equity Fund - Investor Class | 21.49% | 3.38% | 4.17% | 4.52% |
| S&P 500 Total Return Index (2) | 27.92% | 20.38% | 17.90% | 16.67% |
Comparison of the Change in Value of a $10,000 Investment
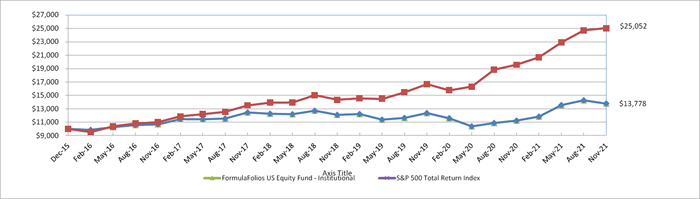
| * | The Performance data quoted is historical. Past performance is no guarantee of future results. Current performance may be higher or lower than the performance data quoted. The principal value and investment return of an investment will fluctuate so that your shares, when redeemed, may be worth more or less than their original cost. The returns shown do not reflect the deduction of taxes that a shareholder would pay on Fund distributions or on the redemptions of Fund shares. The total operating expenses as stated in the fee table to the Fund’s Prospectus dated April 1, 2021 are 1.24% and 2.24% for the Institutional Class and Investor Class, respectively. After fee waivers, the Fund’s total annual operating expenses are 1.16% and 2.16% for the Institutional Class and Investor Class, respectively. For performance information current to the most recent month-end, please call 1-855-907-3233. |
| (1) | Inception date was December 17, 2015. |
| (2) | The S&P 500 Total Return Index is an unmanaged market capitalization weighted index of 500 of the largest capitalized U.S. domiciled companies. Index returns assume reinvestment of dividends. Investors may not invest in the indexes directly; unlike the Fund’s returns, the indexes do not reflect any fees or expenses. |
| Top Ten Holdings By Industry Sector | | % of Net Assets | |
| Medical Equipment & Devices | | | 14.3 | % |
| Biotech & Pharma | | | 13.0 | % |
| Retail - Discretionary | | | 7.1 | % |
| Chemicals | | | 6.3 | % |
| Steel | | | 5.6 | % |
| Semiconductors | | | 5.1 | % |
| Transportation & Logistics | | | 4.8 | % |
| Technology Services | | | 4.7 | % |
| Banking | | | 3.4 | % |
| Specialty Finance | | | 3.4 | % |
| Other Assets in Excess of Liabilities | | | 32.3 | % |
| | | | 100.0 | % |
Please refer to the Portfolio of Investments in this annual report for a detailed analysis of the Fund’s holdings.
| FORMULAFOLIOS US EQUITY FUND |
| SCHEDULE OF INVESTMENTS |
| November 30, 2021 |
| Shares | | | | | Fair Value | |
| | | | | COMMON STOCKS — 96.3% | | | | |
| | | | | APPAREL & TEXTILE PRODUCTS - 1.8% | | | | |
| | 20,613 | | | PVH Corporation | | $ | 2,201,056 | |
| | | | | | | | | |
| | | | | ASSET MANAGEMENT -1.7% | | | | |
| | 93,863 | | | Invesco Ltd. | | | 2,095,961 | |
| | | | | | | | | |
| | | | | BANKING - 3.4% | | | | |
| | 27,239 | | | Popular, Inc. | | | 2,119,739 | |
| | 48,529 | | | Synovus Financial Corporation | | | 2,197,878 | |
| | | | | | | | 4,317,617 | |
| | | | | BEVERAGES - 3.2% | | | | |
| | 47,505 | | | Monster Beverage Corporation(a) | | | 3,979,969 | |
| | | | | | | | | |
| | | | | BIOTECH & PHARMA - 13.0% | | | | |
| | 14,377 | | | Biogen, Inc.(a) | | | 3,389,234 | |
| | 11,212 | | | Moderna, Inc.(a) | | | 3,951,445 | |
| | 91,443 | | | Pfizer, Inc. | | | 4,913,232 | |
| | 6,411 | | | Regeneron Pharmaceuticals, Inc.(a) | | | 4,080,794 | |
| | | | | | | | 16,334,705 | |
| | | | | CHEMICALS - 6.3% | | | | |
| | 11,720 | | | Celanese Corporation | | | 1,773,939 | |
| | 36,168 | | | Dow, Inc. | | | 1,986,708 | |
| | 17,628 | | | LyondellBasell Industries N.V., Class A | | | 1,535,928 | |
| | 74,849 | | | Mosaic Company (The) | | | 2,561,333 | |
| | | | | | | | 7,857,908 | |
| | | | | COMMERCIAL SUPPORT SERVICES - 2.0% | | | | |
| | 22,352 | | | Robert Half International, Inc. | | | 2,484,872 | |
| | | | | | | | | |
| | | | | ELECTRICAL EQUIPMENT - 1.8% | | | | |
| | 28,634 | | | A O Smith Corporation | | | 2,263,517 | |
| | | | | | | | | |
| | | | | FOOD - 3.3% | | | | |
| | 51,958 | | | Tyson Foods, Inc., Class A | | | 4,102,603 | |
| FORMULAFOLIOS US EQUITY FUND |
| SCHEDULE OF INVESTMENTS (Continued) |
| November 30, 2021 |
| Shares | | | | | | | | Fair Value |
| | | | | COMMON STOCKS — 96.3% (Continued) | | | | |
| | | | | HEALTH CARE FACILITIES & SERVICES - 1.5% | | | | |
| | 4,608 | | | Anthem, Inc. | | | | | | $1,871,908 |
| | | | | | | | | |
| | | | | HOME CONSTRUCTION - 2.7% | | | | |
| | 17,399 | | | DR Horton, Inc. | | | | | | 1,699,882 |
| | 16,451 | | | Lennar Corporation, Class A | | | | | | 1,728,178 |
| | | | | | | | | | | 3,428,060 |
| | | | | MACHINERY - 3.1% | | | ’ | |
| | 24,084 | | | Graco, Inc. | | | | | | 1,755,483 |
| | 20,532 | | | Toro Company | | | | | | 2,064,698 |
| | | | | | | | | | | 3,820,181 |
| | | | | MEDICAL EQUIPMENT & DEVICES - 14.3% | | | | |
| | 13,787 | | | Abbott Laboratories | | | | | | 1,733,991 |
| | 6,311 | | | Align Technology, Inc.(a) | | | | | | 3,859,366 |
| | 6,192 | | | IDEXX Laboratories, Inc.(a) | | | | | | 3,765,169 |
| | 11,259 | | | West Pharmaceutical Services, Inc. | | | | | | 4,983,909 |
| | 29,830 | | | Zimmer Biomet Holdings, Inc. | | | | | | 3,567,668 |
| | | | | | | | | | | 17,910,103 |
| | | | | OIL & GAS PRODUCERS -1.3% | | | | |
| | 84,023 | | | Coterra Energy, Inc. | | | | | | 1,687,182 |
| | | | | | | | | |
| | | | | OIL & GAS SERVICES & EQUIPMENT -1.5% | | | | |
| | 88,991 | | | Halliburton Company | | | | | | 1,921,316 |
| | | | | | | | | |
| | | | | PUBLISHING & BROADCASTING - 1.6% | | | | |
| | 93,690 | | | News Corporation, CLASS A - NON-VOTING | | | | | | 2,025,578 |
| | | | | | | | | |
| | | | | RETAIL - DISCRETIONARY - 7.1% | | | | |
| | 35,651 | | | Best Buy Company, Inc. | | | | | | 3,809,666 |
| | 15,890 | | | Dick’s Sporting Goods, Inc. | | | | | | 1,868,028 |
| | 69,546 | | | Gap, Inc. (The) | | | | | | 1,149,595 |
| | 10,367 | | | Williams-Sonoma, Inc. | | | | | | 2,019,906 |
| | | | | | | | | | | 8,847,195 |
| | | | | SEMICONDUCTORS - 5.1% | | | | |
| | 6,553 | | | KLA Corporation | | | | | | 2,674,476 |
| FORMULAFOLIOS US EQUITY FUND |
| SCHEDULE OF INVESTMENTS (Continued) |
| November 30, 2021 |
| Shares | | | | | Fair Value | |
| | | | | COMMON STOCKS — 96.3% (Continued) | | | | |
| | | | | SEMICONDUCTORS - 5.1% (Continued) | | | | |
| | 3,055 | | | Lam Research Corporation | | $ | 2,076,942 | |
| | 10,459 | | | Skyworks Solutions, Inc. | | | 1,586,212 | |
| | | | | | | | 6,337,630 | |
| | | | | SPECIALTY FINANCE - 3.4% | | | | |
| | 31,398 | | | First American Financial Corporation | | | 2,329,104 | |
| | 43,109 | | | Synchrony Financial | | | 1,930,852 | |
| | | | | | | | 4,259,956 | |
| | | | | STEEL - 5.6% | | | | |
| | 31,397 | | | Nucor Corporation | | | 3,336,245 | |
| | 12,208 | | | Reliance Steel & Aluminum Company | | | 1,814,475 | |
| | 30,935 | | | Steel Dynamics, Inc. | | | 1,849,913 | |
| | | | | | | | 7,000,633 | |
| | | | | TECHNOLOGY HARDWARE - 1.6% | | | | |
| | 140,850 | | | Hewlett Packard Enterprise Company | | | 2,021,198 | |
| | | | | | | | | |
| | | | | TECHNOLOGY SERVICES - 4.7% | | | | |
| | 27,410 | | | Amdocs Ltd. | | | 1,913,766 | |
| | 26,619 | | | Booz Allen Hamilton Holding Corporation | | | 2,234,400 | |
| | 88,009 | | | Nielsen Holdings PLC | | | 1,686,252 | |
| | | | | | | | 5,834,418 | |
| | | | | TIMBER REIT - 1.5% | | | | |
| | 50,485 | | | Weyerhaeuser Company | | | 1,898,741 | |
| | | | | | | | | |
| | | | | TRANSPORTATION & LOGISTICS - 4.8% | | | | |
| | 19,282 | | | CH Robinson Worldwide, Inc. | | | 1,833,525 | |
| | 17,242 | | | Expeditors International of Washington, Inc. | | | 2,096,972 | |
| | 11,985 | | | Landstar System, Inc. | | | 2,020,072 | |
| | | | | | | | 5,950,569 | |
| | | | | | | | | |
| | | | | TOTAL COMMON STOCKS (Cost$121,280,049) | | | 120,452,876 | |
| | | | | | | | | |
| | | | | TOTAL INVESTMENTS -96.3% (Cost $121,280,049) | | $ | 120,452,876 | |
| | | | | OTHER ASSETS IN EXCESS OF LIABILITIES- 3.7% | | | 4,733,520 | |
| | | | | NET ASSETS - 100.0% | | $ | 125,186,396 | |
| FORMULAFOLIOS US EQUITY FUND |
| SCHEDULE OF INVESTMENTS (Continued) |
| November 30, 2021 |
| PLC | -Public Limited Company |
| REIT | -Real Estate Investment Trust |
| (a) | Non-income producing security. |
See accompanying notes which are an integral part of these financial statements.
| FORMULAFOLIOS US EQUITY FUND |
| STATEMENT OF ASSETS & LIABILITIES |
| November 30, 2021 |
| ASSETS | | | |
| Investment securities: | | | | |
| At cost | | $ | 121,280,049 | |
| At value | | $ | 120,452,876 | |
| Receivable for fund shares sold | | | 50,173 | |
| Dividends and interest receivable | | | 184,493 | |
| Receivable for investments sold | | | 5,138,585 | |
| Prepaid expenses and other assets | | | 24,331 | |
| TOTAL ASSETS | | | 125,850,458 | |
| | | | | |
| LIABILITIES | | | | |
| Due to Custodian | | | 328,617 | |
| Payable for fund shares repurchased | | | 108,967 | |
| Investment advisory fees payable | | | 80,405 | |
| Distribution (12b-1) fees payable | | | 22 | |
| Payable to related parties | | | 56,463 | |
| Accrued expenses and other liabilities | | | 89,588 | |
| TOTAL LIABILITIES | | | 664,062 | |
| NET ASSETS | | $ | 125,186,396 | |
| | | | | |
| NET ASSETS CONSIST OF: | | | | |
| Paid in capital | | $ | 136,087,866 | |
| Accumulated deficit | | | (10,901,470 | ) |
| NET ASSETS | | $ | 125,186,396 | |
| | | | | |
| NET ASSET VALUE PER SHARE: | | | | |
| Institutional Class | | | | |
| Net Assets | | $ | 125,160,801 | |
| Shares of beneficial interest outstanding ($0 par value, unlimited shares authorized) | | | 10,946,815 | |
| Net asset value (Net Assets ÷ Shares Outstanding), offering price and redemption price per share (a) | | $ | 11.43 | |
| | | | | |
| Investor Class | | | | |
| Net Assets | | $ | 25,595 | |
| Shares of beneficial interest outstanding ($0 par value, unlimited shares authorized) | | | 2,346 | |
| Net asset value (Net Assets ÷ Shares Outstanding), offering price and redemption price per share (a) | | $ | 10.91 | |
| (a) | Redemption price per share. The Fund imposes a 1.00% redemption fee for any redemption of fund shares occurring within 30 days of purchase. |
See accompanying notes to financial statements.
| FORMULAFOLIOS US EQUITY FUND |
| STATEMENT OF OPERATIONS |
| For the Year Ended November 30, 2021 |
| INVESTMENT INCOME | | | |
| Dividends | | $ | 2,635,593 | |
| Interest | | | 678 | |
| Less: Foreign dividend tax withheld | | | (3,664 | ) |
| TOTAL INVESTMENT INCOME | | | 2,632,607 | |
| | | | | |
| EXPENSES | | | | |
| Investment advisory fees | | | 1,387,099 | |
| Distribution (12b-1) fees | | | | |
| Investor Class | | | 245 | |
| Administrative service fees | | | 215,424 | |
| Third party administrative servicing fees | | | 163,296 | |
| Printing and postage expenses | | | 42,211 | |
| Registration fees | | | 40,318 | |
| Trustees fees and expenses | | | 30,034 | |
| Custodian fees | | | 26,883 | |
| Legal fees | | | 26,743 | |
| Chief Compliance Officer fees | | | 22,345 | |
| Insurance expense | | | 18,753 | |
| Audit fees | | | 16,250 | |
| Other expenses | | | 577 | |
| TOTAL EXPENSES | | | 1,990,178 | |
| | | | | |
| Less: Fees waived by the Adviser | | | (205,862 | ) |
| | | | | |
| NET EXPENSES | | | 1,784,316 | |
| | | | | |
| NET INVESTMENT INCOME | | | 848,291 | |
| | | | | |
| REALIZED AND UNREALIZED GAIN ON INVESTMENTS | | | | |
| Net realized gain on investments | | | 38,982,892 | |
| Net change in unrealized appreciation/depreciation of investments | | | (4,943,272 | ) |
| NET REALIZED AND UNREALIZED GAIN ON INVESTMENTS | | | 34,039,620 | |
| | | | | |
| NET INCREASE IN NET ASSETS RESULTING FROM OPERATIONS | | $ | 34,887,911 | |
See accompanying notes to financial statements.
| FORMULAFOLIOS US EQUITY FUND |
| STATEMENTS OF CHANGES IN NET ASSETS |
| | | For the | | | For the | |
| | | Year Ended | | | Year Ended | |
| | | November 30, 2021 | | | November 30, 2020 | |
| | | | | | | |
| FROM OPERATIONS: | | | | | | | | |
| Net investment income | | $ | 848,291 | | | $ | 361,466 | |
| Net realized gain (loss) on investments | | | 38,982,892 | | | | (26,433,154 | ) |
| Net change in unrealized appreciation/depreciation of investments | | | (4,943,272 | ) | | | (6,896,518 | ) |
| Net increase (decrease) in net assets resulting from operations | | | 34,887,911 | | | | (32,968,206 | ) |
| | | | | | | | | |
| DISTRIBUTIONS TO SHAREHOLDERS: | | | | | | | | |
| Total Distributions Paid | | | | | | | | |
| Institutional Shares | | | (596,956 | ) | | | (1,273,441 | ) |
| Net decrease in net assets resulting from distributions to shareholders | | | (596,956 | ) | | | (1,273,441 | ) |
| | | | | | | | | |
| FROM SHARES OF BENEFICIAL INTEREST: | | | | | | | | |
| Institutional Class Shares: | | | | | | | | |
| Proceeds from shares sold | | | 27,057,461 | | | | 220,935,317 | |
| Reinvestment of distributions | | | 554,327 | | | | 1,219,734 | |
| Redemption fee proceeds | | | 6,178 | | | | 102,730 | |
| Payments for shares redeemed | | | (118,060,089 | ) | | | (317,901,335 | ) |
| | | | (90,442,123 | ) | | | (95,643,554 | ) |
| Investor Class Shares: | | | | | | | | |
| Proceeds from shares sold | | | — | | | | 12,384 | |
| Payments for shares redeemed | | | — | | | | (5,795 | ) |
| | | | — | | | | 6,589 | |
| | | | | | | | | |
| Net decrease in net assets resulting from shares of beneficial interest | | | (90,442,123 | ) | | | (95,636,965 | ) |
| | | | | | | | | |
| TOTAL DECREASE IN NET ASSETS | | | (56,151,168 | ) | | | (129,878,612 | ) |
| | | | | | | | | |
| NET ASSETS | | | | | | | | |
| Beginning of Year | | | 181,337,564 | | | | 311,216,176 | |
| End of Year | | $ | 125,186,396 | | | $ | 181,337,564 | |
| | | | | | | | | |
| SHARE ACTIVITY | | | | | | | | |
| Institutional Class Shares: | | | | | | | | |
| Shares Sold | | | 2,511,809 | | | | 24,381,021 | |
| Shares Reinvested | | | 58,228 | | | | 116,721 | |
| Shares Redeemed | | | (11,021,073 | ) | | | (35,224,637 | ) |
| Net decrease in shares of beneficial interest outstanding | | | (8,451,036 | ) | | | (10,726,895 | ) |
| | | | | | | | | |
| Investor Class Shares: | | | | | | | | |
| Shares Sold | | | — | | | | 1,345 | |
| Shares Redeemed | | | — | | | | (666 | ) |
| Net increase in shares of beneficial interest outstanding | | | — | | | | 679 | |
See accompanying notes to financial statements.
| FORMULAFOLIOS US EQUITY FUND |
| FINANCIAL HIGHLIGHTS |
Per Share Data and Ratios for a Share of Beneficial Interest Outstanding Throughout each Year indicated.
| | | Institutional Class |
| | | For the | | | For the | | | For the | | | For the | | | For the | |
| | | Year Ended | | | Year Ended | | | Year Ended | | | Year Ended | | | Year Ended | |
| | | November 30, 2021 | | | November 30, 2020 | | | November 30, 2019 | | | November 30, 2018 | | | November 30, 2017 | |
| Net asset value, beginning of year | | $ | 9.35 | | | $ | 10.33 | | | $ | 10.38 | | | $ | 11.78 | | | $ | 10.67 | |
| Income from investment operations: | | | | | | | | | | | | | | | | | | | | |
| Net investment income (1) | | | 0.06 | | | | 0.02 | | | | 0.05 | | | | 0.12 | | | | 0.09 | |
| Net realized and unrealized gain (loss) on investments | | | 2.05 | | | | (0.96 | ) | | | 0.13 | (7) | | | (0.42 | ) | | | 1.61 | |
| Total from investment operations | | | 2.11 | | | | (0.94 | ) | | | 0.18 | | | | (0.30 | ) | | | 1.70 | |
| Less distributions from: | | | | | | | | | | | | | | | | | | | | |
| Net investment income | | | (0.03 | ) | | | (0.04 | ) | | | (0.05 | ) | | | (0.08 | ) | | | (0.02 | ) |
| Net realized gains | | | — | | | | — | | | | (0.18 | ) | | | (1.02 | ) | | | (0.57 | ) |
| Total distributions | | | (0.03 | ) | | | (0.04 | ) | | | (0.23 | ) | | | (1.10 | ) | | | (0.59 | ) |
| Paid-in-Capital From Redemption Fees | | | 0.00 | (6) | | | 0.00 | (6) | | | 0.00 | (6) | | | 0.00 | (6) | | | 0.00 | (6) |
| Net asset value, end of year | | $ | 11.43 | | | $ | 9.35 | | | $ | 10.33 | | | $ | 10.38 | | | $ | 11.78 | |
| Total return (2) | | | 22.65 | % | | | (9.12 | )% | | | 2.16 | % | | | (2.75 | )% | | | 16.61 | % |
| Net assets, at end of year (000s) | | $ | 125,161 | | | $ | 181,316 | | | $ | 311,200 | | | $ | 345,446 | | | $ | 248,595 | |
| Ratio of gross expenses to average net assets (3,4,9) | | | 1.25 | % | | | 1.21 | % | | | 1.19 | % | | | 1.22 | % | | | 1.28 | % |
| Ratio of net expenses to average net assets (4,9) | | | 1.12 | % | | | 1.13 | % | | | 1.15 | % (8) | | | 1.18 | % | | | 1.22 | % |
| Ratio of net investment income to average net assets (5,9) | | | 0.53 | % | | | 0.18 | % | | | 0.52 | % | | | 1.08 | % | | | 0.84 | % |
| Portfolio Turnover Rate | | | 338 | % | | | 488 | % | | | 524 | % | | | 367 | % | | | 324 | % |
| | | | | | | | | | | | | | | | | | | | | |
| (1) | Per share amounts calculated using the average shares method, which more appropriately presents the per share data for the period. |
| (2) | Total returns are historical in nature and assume changes in share price, reinvestment of all dividends and distributions, if any. |
| (3) | Represents the ratio of expenses to average net assets absent fee waivers and/or expense reimbursements by the Adviser. |
| (4) | Does not include the expenses of other investment companies in which the Fund invests. |
| (5) | Recognition of investment income by the Fund is affected by the timing and declaration of dividends by the underlying investment companies in which the Fund invests. |
| (6) | Amount represents less than $0.01 per share. |
| (7) | Realized and unrealized gains and losses per share in this caption are balancing amounts necessary to reconcile the change in net asset value for the period, and may not reconcile with the aggregate gains and losses in the Statement of Operations due to share transactions for the period. |
| (8) | Effective April 1, 2019, the Adviser agreed to waive expenses greater than 1.12% per annum for the Portfolio’s average daily net assets. Prior to April 1, 2019, the agreement was 1.18% per annum for the Portfolio’s average daily net assets. |
| (9) | Excluding interest expense, the following ratios would have been: |
| Gross expenses to average net assets | | | 1.25 | % | | | 1.20 | % | | | 1.19 | % | | | 1.22 | % | | | 1.28 | % |
| Net expenses to average net assets | | | 1.12 | % | | | 1.12 | % | | | 1.15 | % | | | 1.18 | % | | | 1.22 | % |
| Net investment income to average net assets | | | 0.53 | % | | | 0.19 | % | | | 0.52 | % | | | 1.08 | % | | | 0.84 | % |
See accompanying notes to financial statements.
| FORMULAFOLIOS US EQUITY FUND |
| FINANCIAL HIGHLIGHTS |
Per Share Data and Ratios for a Share of Beneficial Interest Outstanding Throughout each Year indicated.
| | | Investor Class |
| | | For the | | | For the | | | For the | | | For the | | | For the | |
| | | Year Ended | | | Year Ended | | | Year Ended | | | Year Ended | | | Year Ended | |
| | | November 30, 2021 | | | November 30, 2020 | | | November 30, 2019 | | | November 30, 2018 | | | November 30, 2017 | |
| Net asset value, beginning of year | | $ | 8.98 | | | $ | 9.98 | | | $ | 10.08 | | | $ | 11.57 | | | $ | 10.61 | |
| Income from investment operations: | | | | | | | | | | | | | | | | | | | | |
| Net investment income (loss) (1) | | | (0.05 | ) | | | (0.08 | ) | | | 0.00 | (6) | | | 0.01 | | | | (0.03 | ) |
| Net realized and unrealized gain (loss) on investments | | | 1.98 | | | | (0.92 | ) | | | 0.08 | (7) | | | (0.41 | ) | | | 1.58 | |
| Total from investment operations | | | 1.93 | | | | (1.00 | ) | | | 0.08 | | | | (0.40 | ) | | | 1.55 | |
| Less distributions from: | | | | | | | | | | | | | | | | | | | | |
| Net investment income | | | — | | | | — | | | | — | | | | (0.07 | ) | | | (0.02 | ) |
| Net realized gains | | | — | | | | — | | | | (0.18 | ) | | | (1.02 | ) | | | (0.57 | ) |
| Total distributions | | | — | | | | — | | | | (0.18 | ) | | | (1.09 | ) | | | (0.59 | ) |
| Paid-in-Capital From Redemption Fees | | | — | | | | — | | | | — | | | | — | | | | — | |
| Net asset value, end of year | | $ | 10.91 | | | $ | 8.98 | | | $ | 9.98 | | | $ | 10.08 | | | $ | 11.57 | |
| Total return (2) | | | 21.49 | % | | | (10.02 | )% | | | 1.08 | % | | | (3.73 | )% | | | 15.29 | % |
| Net assets, at end of year (000s) | | $ | 26 | | | $ | 21 | | | $ | 17 | | | $ | 1 | | | $ | 1 | |
| Ratio of gross expenses to average net assets (3,4,9) | | | 2.25 | % | | | 2.21 | % | | | 2.19 | % | | | 2.22 | % | | | 2.28 | % |
| Ratio of net expenses to average net assets (4,9) | | | 2.12 | % | | | 2.13 | % | | | 2.15 | % (8) | | | 2.18 | % | | | 2.22 | % |
| Ratio of net investment income (loss)to average net assets (5,9) | | | (0.46 | )% | | | (0.89 | )% | | | 0.02 | % | | | 0.07 | % | | | (0.16 | )% |
| Portfolio Turnover Rate | | | 338 | % | | | 488 | % | | | 524 | % | | | 367 | % | | | 324 | % |
| | | | | | | | | | | | | | | | | | | | | |
| (1) | Per share amounts calculated using the average shares method, which more appropriately presents the per share data for the period. |
| (2) | Total returns are historical in nature and assume changes in share price, reinvestment of all dividends and distributions, if any. |
| (3) | Represents the ratio of expenses to average net assets absent fee waivers and/or expense reimbursements by the Adviser. |
| (4) | Does not include the expenses of other investment companies in which the Fund invests. |
| (5) | Recognition of investment income by the Fund is affected by the timing and declaration of dividends by the underlying investment companies in which the Fund invests. |
| (6) | Amount represents less than $0.01 per share. |
| (7) | Realized and unrealized gains and losses per share in this caption are balancing amounts necessary to reconcile the change in net asset value for the period, and may not reconcile with the aggregate gains and los Operations due to share transactions for the period. |
| (8) | Effective April 1, 2019, the Adviser agreed to waive expenses greater than 2.12% per annum for the Portfolio’s average daily net assets. Prior to April 1, 2019, the agreement was 2.18% per annum for the Portfolio’s |
| (9) | Excluding interest expense, the following ratios would have been: |
| Gross expenses to average net assets | | | 2.25 | % | | | 2.20 | % | | | 2.19 | % | | | 2.22 | % | | | 2.28 | % |
| Net expenses to average net assets | | | 2.12 | % | | | 2.12 | % | | | 2.15 | % | | | 2.18 | % | | | 2.22 | % |
| Net investment income to average net assets | | | (0.46 | )% | | | (0.88 | )% | | | 0.02 | % | | | 0.07 | % | | | (0.16 | )% |
See accompanying notes to financial statements.
FORMULAFOLIOS US EQUITY FUND
NOTES TO FINANCIAL STATEMENTS
November 30, 2021
The FormulaFolios US Equity Fund (the “Fund”) is a diversified series of shares of beneficial interest of Northern Lights Fund Trust II (the “Trust”), a statutory trust organized under the laws of the State of Delaware on August 26, 2010, and is registered under the Investment Company Act of 1940, as amended (the “1940 Act”), as an open-end management investment company. The Fund’s investment objective is to seek to achieve long-term capital appreciation. The Fund commenced operations on December 17, 2015.
The Fund offers two classes of shares designated as Institutional Class and Investor Class. Each class represents an interest in the same assets of the Fund and classes are identical except for differences in their ongoing service and distribution charges. All classes of shares have equal voting privileges except that each class has exclusive voting rights with respect to its service and/or distribution plans. The Fund’s income, expenses (other than class specific distribution fees) and realized and unrealized gains and losses are allocated proportionately each day based upon the relative net assets of each class.
| 2. | SIGNIFICANT ACCOUNTING POLICIES |
The following is a summary of significant accounting policies followed by the Fund in preparation of its financial statements. These policies are in conformity with accounting principles generally accepted in the United States of America (“GAAP”). The preparation of financial statements in conformity with GAAP requires management to make estimates and assumptions that affect the reported amounts of assets and liabilities and disclosure of contingent assets and liabilities at the date of the financial statements and the reported amounts of increases and decreases in net assets from operations during the reporting year. Actual results could differ from those estimates. The Fund is an investment company and accordingly follows the investment company accounting and reporting guidance of the Financial Accounting Standards Board (“FASB”) Accounting Standards Codification Topic 946 “Financial Services – Investment Companies”.
Securities Valuation – Securities listed on an exchange are valued at the last reported sale price at the close of the regular trading session of the primary exchange on the business day the value is being determined, or in the case of securities listed on NASDAQ at the NASDAQ Official Closing Price. In the absence of a sale such securities shall be valued at the mean between the current bid and ask prices on the day of valuation. Short-term debt obligations having 60 days or less remaining until maturity, at time of purchase, may be valued at amortized cost.
The Fund may hold securities, such as private investments, other non-traded securities or temporarily illiquid securities, for which market quotations are not readily available or are determined to be unreliable. These securities will be valued using the “fair value” procedures approved by the Trust’s Board of Trustees (the “Board”). The Board has delegated execution of these procedures to a fair value committee composed of one or more representatives from each of the (i) Trust, (ii) administrator, and (iii) adviser. The committee may also enlist third party consultants such as a valuation specialist at a public accounting firm, valuation consultant or financial officer of a security issuer on an as-needed basis to assist in determining a security-specific fair value. The Board has also engaged a third-party valuation firm to attend valuation meetings held by the Trust, review minutes of such meetings and report to the Board on a quarterly basis. The Board reviews and ratifies the execution of this process and the resultant fair value prices at least quarterly to assure the process produces reliable results.
Fair Valuation Process – As noted above, the fair value committee is composed of one or more representatives from each of the (i) Trust, (ii) administrator, and (iii) adviser. The applicable investments are valued collectively via inputs from each of these groups. For example, fair value determinations are required for the following securities: (i) securities for which market quotations are insufficient or not readily available on a particular business day (including securities for which there is a short and temporary lapse in the provision of a price by the regular pricing source), (ii) securities for which, in the judgment of the adviser, the prices or values available do not represent the fair value of the instrument. Factors which may cause the adviser to make such a judgment include, but are not limited to, the following: only a bid price or an ask price is available; the spread between bid and ask prices is substantial; the frequency of sales; the thinness of the market; the size of reported trades; and actions of the securities markets, such as the suspension or limitation of trading; (iii) securities determined to be
FORMULAFOLIOS US EQUITY FUND
NOTES TO FINANCIAL STATEMENTS (Continued)
November 30, 2021
illiquid; (iv) securities with respect to which an event that will affect the value thereof has occurred (a “significant event”) since the closing prices were established on the principal exchange on which they are traded, but prior to the Fund’s calculation of its net asset value. Specifically, interests in commodity pools or managed futures pools are valued on a daily basis by reference to the closing market prices of each futures contract or other asset held by a pool, as adjusted for pool expenses. Restricted or illiquid securities, such as private investments or non-traded securities are valued via inputs from the adviser based upon the current bid for the security from two or more independent dealers or other parties reasonably familiar with the facts and circumstances of the security (who should take into consideration all relevant factors as may be appropriate under the circumstances). If the adviser is unable to obtain a current bid from such independent dealers or other independent parties, the fair value committee shall determine the fair value of such security using the following factors: (i) the type of security; (ii) the cost at date of purchase; (iii) the size and nature of the Fund’s holdings; (iv) the discount from market value of unrestricted securities of the same class at the time of purchase and subsequent thereto; (v) information as to any transactions or offers with respect to the security; (vi) the nature and duration of restrictions on disposition of the security and the existence of any registration rights; (vii) how the yield of the security compares to similar securities of companies of similar or equal creditworthiness; (viii) the level of recent trades of similar or comparable securities; (ix) the liquidity characteristics of the security; (x) current market conditions; and (xi) the market value of any securities into which the security is convertible or exchangeable.
The Fund utilizes various methods to measure the fair value of all of its investments on a recurring basis. GAAP establishes a hierarchy that prioritizes inputs to valuation methods. The three levels of input are:
Level 1 – Unadjusted quoted prices in active markets for identical assets and liabilities that the Fund has the ability to access.
Level 2 – Observable inputs other than quoted prices included in level 1 that are observable for the asset or liability, either directly or indirectly. These inputs may include quoted prices for the identical instrument on an inactive market, prices for similar instruments, interest rates, prepayment speeds, credit risk, yield curves, default rates and similar data.
Level 3 – Unobservable inputs for the asset or liability, to the extent relevant observable inputs are not available representing the Fund’s own assumptions about the assumptions a market participant would use in valuing the asset or liability, and would be based on the best information available.
The availability of observable inputs can vary from security to security and is affected by a wide variety of factors, including, for example, the type of security, whether the security is new and not yet established in the marketplace, the liquidity of markets, and other characteristics particular to the security. To the extent that valuation is based on models or inputs that are less observable or unobservable in the market, the determination of fair value requires more judgment. Accordingly, the degree of judgment exercised in determining fair value is greatest for instruments categorized in Level 3.
The inputs used to measure fair value may fall into different levels of the fair value hierarchy. In such cases, for disclosure purposes, the level in the fair value hierarchy within which the fair value measurement falls in its entirety, is determined based on the lowest level input that is significant to the fair value measurement in its entirety.
The inputs or methodology used for valuing securities are not necessarily an indication of the risk associated with investing in those securities. The following tables summarize the inputs used as of November 30, 2021 for the Fund’s investments measured at fair value:
| Assets * | | Level 1 | | | Level 2 | | | Level 3 | | | Total | |
| Common Stock | | $ | 120,452,876 | | | $ | — | | | $ | — | | | $ | 120,452,876 | |
| Total | | $ | 120,452,876 | | | $ | — | | | $ | — | | | $ | 120,452,876 | |
The Fund did not hold any Level 3 securities during the period.
| * | Refer to the Portfolio of Investments for industry classification. |
FORMULAFOLIOS US EQUITY FUND
NOTES TO FINANCIAL STATEMENTS (Continued)
November 30, 2021
Security Transactions and Related Income – Security transactions are accounted for on trade date. Interest income is recognized on an accrual basis. Discounts are accreted and premiums are amortized on securities purchased over the lives of the respective securities using the effective interest method. Dividend income is recorded on the ex-dividend date. Realized gains or losses from sales of securities are determined by comparing the identified cost of the security lot sold with the net sales proceeds. Withholding taxes on foreign dividends have been provided for in accordance with the Fund’s understanding of the applicable country’s tax rules and rates.
Dividends and Distributions to Shareholders – Dividends from net investment income, if any, are declared and paid at least annually. Distributable net realized capital gains, if any, are declared and distributed annually. Dividends from net investment income and distributions from net realized gains are determined in accordance with federal income tax regulations, which may differ from GAAP. These “book/tax” differences are considered either temporary (i.e., deferred losses, capital loss carry forwards) or permanent in nature. To the extent these differences are permanent in nature, such amounts are reclassified within the composition of net assets based on their federal tax-basis treatment. These reclassifications have no effect on net assets, results from operations or net asset value per share of the Fund. Temporary differences do not require reclassification. Dividends and distributions to shareholders are recorded on ex-dividend date.
Federal Income Tax – The Fund intends to comply with the requirements of the Internal Revenue Code applicable to regulated investment companies and to distribute all of its taxable income to its shareholders. Therefore, no provision for Federal income tax is required. The Fund recognizes the tax benefits of uncertain tax positions only where the position is “more likely than not” to be sustained assuming examination by tax authorities. Management has analyzed the Fund’s tax positions and has concluded that no liability for unrecognized tax benefits should be recorded related to uncertain tax positions taken on returns filed for open tax years or expected to be taken in the Fund’s November 30, 2021 tax returns. The Fund identifies its major tax jurisdictions as U.S. Federal, Ohio and foreign jurisdictions where the Fund makes significant investments. The Fund is not aware of any tax positions for which it is reasonably possible that the total amounts of unrecognized tax benefits will change materially in the next twelve months.
Expenses – Expenses of the Trust that are directly identifiable to a specific fund are charged to that fund. Expenses which are not readily identifiable to a specific fund are allocated in such a manner as deemed equitable taking into consideration the nature and type of expense and the relative sizes of the funds in the Trust.
Indemnification – The Trust indemnifies its Officers and Trustees for certain liabilities that may arise from the performance of their duties to the Trust. Additionally, in the normal course of business, the Fund enters into contracts that contain a variety of representations and warranties and which provide general indemnities. The Fund’s maximum exposure under these arrangements is unknown, as this would involve future claims that may be made against the Fund that have not yet occurred. However, based on experience, the risk of loss due to these warranties and indemnities appears to be remote.
| 3. | INVESTMENT TRANSACTIONS |
For the year ended November 30, 2021, cost of purchases and proceeds from sales of portfolio securities, other than short-term investments and U.S. Government securities, amounted to $506,916,924 and $594,034,673, respectively.
| 4. | INVESTMENT ADVISORY AGREEMENT AND TRANSACTIONS WITH RELATED PARTIES |
The business activities of the Fund are overseen by the Board, which is responsible for the overall management of the Fund. FormulaFolio Investments, LLC serves as the Fund’s investment adviser (the “Adviser”).
Pursuant to an Investment Advisory Agreement with the Trust on behalf of the Fund, the Adviser, under the oversight of the Board, directs the daily operations of the Fund and supervises the performance of administrative and professional services provided by others. As compensation for its services and the related expenses borne by the Adviser, the Fund pays the Adviser an investment advisory fee, computed and accrued daily and paid monthly, at an annual rate of 0.87% of the Fund’s average daily net assets. For the year ended November 30, 2021, the Fund incurred $1,387,099 of advisory fees.
FORMULAFOLIOS US EQUITY FUND
NOTES TO FINANCIAL STATEMENTS (Continued)
November 30, 2021
Pursuant to a written contract (the “Expense Limitation”), the Adviser has agreed to waive a portion of its advisory fee and has agreed to reimburse the Fund for other expenses to the extent necessary so that the total expenses incurred by the Fund (excluding front-end or contingent deferred loads, taxes, borrowing costs, brokerage fees and commissions, acquired fund fees and expenses, expenses of other investment companies in which the Fund may invest or extraordinary expenses such as litigation) do not exceed 1.12% and 2.12% per annum of the Fund’s average daily net assets for Institutional Class and Investor Class shares, respectively, through March 31, 2022.
Fees waived or expenses reimbursed may be recouped by the Adviser from a Fund for a period up to three years from the date the fee or expense was waived or reimbursed. However, no recoupment payment will be made by a Fund if it would result in the Fund exceeding the contractual expense limitation described above. The Board may terminate this expense reimbursement arrangement at any time. For the year ended November 30, 2021, the Adviser waived $205,862 in advisory fees due to the Expense Limitation.
The following amounts are subject to recapture by the Fund until the following dates:
| 11/30/2022 | | | 11/30/2023 | | | 11/30/2024 | |
| $ | 132,086 | | | $ | 169,580 | | | $ | 205,862 | |
As of November 30, 2021, $119,488 of waived fees expired unrecouped.
Distributor – The Fund has adopted the Trust’s Master Distribution and Shareholder Servicing Plan (the “Plan”) pursuant to Rule 12b-1 under the 1940 Act. The Plan provides that a monthly service and/or distribution fee is paid to Northern Lights Distributors, LLC (the “Distributor” or “NLD”) to provide compensation for ongoing distribution-related activities or services and/or maintenance of the Fund’s shareholder accounts not otherwise required to be provided by the Adviser. The maximum amount of the fee authorized is 1.00% of the Fund’s average daily net assets for Investor Class shares. For the year ended November 30, 2021, the Fund incurred distribution fees of $245 for Investor Class shares.
The Distributor acts as the Fund’s principal underwriter in a continuous public offering of the Fund’s shares. For the year ended November 30, 2021, there were no underwriting commissions paid for sales of Institutional Class or Investor Class shares, respectively.
In addition, certain affiliates of the Distributor provide services to the Fund as follows:
Ultimus Fund Solutions, LLC (“UFS”), an affiliate of the Distributor, provides administration, fund accounting, and transfer agent services to the Trust. Pursuant to separate servicing agreements with UFS, the Fund pays UFS customary fees for providing administration, fund accounting and transfer agency services to the Fund. Certain officers of the Trust are also officers of UFS, and are not paid any fees directly by the Fund for serving in such capacities.
Northern Lights Compliance Services, LLC (“NLCS”), an affiliate of UFS and the Distributor, provides a Chief Compliance Officer to the Trust, as well as related compliance services, pursuant to a consulting agreement between NLCS and the Trust. Under the terms of such agreement, NLCS receives customary fees from the Fund.
Blu Giant, LLC (“Blu Giant”), an affiliate of UFS and the Distributor, provides EDGAR conversion and filing services as well as print management services for the Fund on an ad-hoc basis. For the provision of these services, Blu Giant receives customary fees from the Fund.
FORMULAFOLIOS US EQUITY FUND
NOTES TO FINANCIAL STATEMENTS (Continued)
November 30, 2021
The Fund may assess a short-term redemption fee of 1.00% of the total redemption amount if a shareholder sells their shares after holding them for less than 30 days. For the year ended November 30, 2021, the Fund assessed $6,178 in redemption fees.
Under an agreement (the “Securities Lending Agreement”) with the Securities Finance Trust Company (“SFTC”), the Fund can lend its portfolio securities to brokers, dealers and other financial institutions approved by the Board to earn additional income. For each securities loan, the borrower shall transfer collateral in an amount determined by applying the margin to the market value of the loaned available securities (102% for same currency and 105% for cross currency). Collateral is invested in highly liquid, short-term instruments such as money market funds in accordance with the Fund’s security lending procedures. The Fund continues to receive interest or dividends on the securities loaned. The Fund has the right under the Securities Lending Agreement to recover the securities from the borrower on demand; if the borrower fails to deliver the securities on a timely basis, the Fund could experience delays or losses on recovery. Additionally, the Fund is subject to the risk of loss from investments made with the cash received as collateral. The Fund manages credit exposure arising from these lending transactions by, in appropriate circumstances, entering into master netting agreements and collateral agreements with third party borrowers that provide in the event of default (such as bankruptcy or a borrower’s failure to pay or perform), the right to net a third-party borrower’s rights and obligations under such agreement and liquidate and set off collateral against the net amount owed by the counterparty. During year ended November 30, 2021, the Fund did not lend securities.
| 7. | AGGREGATE UNREALIZED APPRECIATION AND DEPRECIATION TAX BASIS |
The identified cost of investments in securities owned by the Fund for federal income tax purposes, and its respective gross unrealized appreciation and depreciation at November 30, 2021, were as follows:
| | | | | | Gross Unrealized | | | Gross Unrealized | | | Net Appreciation/ | |
| | | Tax Cost | | | Appreciation | | | Depreciation | | | (Depreciation) | |
| FormulaFolios US Equity Fund | | $ | 122,562,555 | | | $ | 5,197,232 | | | $ | (7,306,911 | ) | | $ | (2,109,679 | ) |
| 8. | MARKET RISK AND CORONAVIRUS |
Unexpected local, regional or global events, such as war; acts of terrorism; financial, political or social disruptions; natural, environmental or man-made disasters; the spread of infectious illnesses or other public health issues; and recessions and depressions could have a significant impact on the Fund and its investments and may impair market liquidity. Such events can cause investor fear, which can adversely affect the economies of nations, regions and the market in general, in ways that cannot necessarily be foreseen. An outbreak of infectious respiratory illness known as COVID-19, which is caused by a novel coronavirus (SARS-CoV-2), was first detected in China in December 2019 and subsequently spread globally. This coronavirus has resulted in, among other things, travel restrictions, closed international borders, enhanced health screenings at ports of entry and elsewhere, disruption of and delays in healthcare service preparation and delivery, prolonged quarantines, significant disruptions to business operations, market closures, cancellations and restrictions, supply chain disruptions, lower consumer demand, and significant volatility and declines in global financial markets, as well as general concern and uncertainty. The impact of COVID-19 has adversely affected, and other infectious illness outbreaks that may arise in the future could adversely affect, the economies of the U.S., many other nations and the entire global economy, as well as individual mortgage note borrowers and capital markets in ways that cannot necessarily be foreseen. Public health crises caused by the COVID-19 outbreak may exacerbate other pre-existing political, social and economic risks in the U.S., certain other countries or globally. The duration of the COVID-19 outbreak and its effects cannot be determined with certainty.
FORMULAFOLIOS US EQUITY FUND
NOTES TO FINANCIAL STATEMENTS (Continued)
November 30, 2021
| 9. | DISTRIBUTIONS TO SHAREHOLDERS AND TAX COMPONENTS OF CAPITAL |
The tax character of distributions paid during the fiscal years ended November 30, 2021 and November 30, 2020 was as follows:
| | | Fiscal Year Ended | | | Fiscal Year Ended | |
| | | November 30, 2021 | | | November 30, 2020 | |
| Ordinary Income | | $ | 596,956 | | | $ | 1,273,441 | |
| Long-Term Capital Gain | | | — | | | | — | |
| Return of Capital | | | — | | | | — | |
| | | $ | 596,956 | | | $ | 1,273,441 | |
As of November 30, 2021, the components of distributable earnings/(accumulated deficit) on a tax basis were as follows:
| Undistributed | | | Undistributed | | | Post October Loss | | | Capital Loss | | | Other | | | Unrealized | | | Total | |
| Ordinary | | | Long-Term | | | and | | | Carry | | | Book/Tax | | | Appreciation/ | | | Accumulated | |
| Income | | | Gains | | | Late Year Loss | | | Forwards | | | Differences | | | (Depreciation) | | | Earnings/(Losses) | |
| $ | 506,962 | | | $ | — | | | $ | — | | | $ | (9,298,753 | ) | | $ | — | | | $ | (2,109,679 | ) | | $ | (10,901,470 | ) |
The difference between book basis and tax basis unrealized depreciation and accumulated net realized losses from security transactions are primarily attributable to the tax deferral of losses on wash sales.
At November 30, 2021, the Fund had capital loss carry forwards for federal income tax purposes available to offset future capital gains, along with capital loss carry forwards utilized as follows:
| Non-Expiring | | | Non-Expiring | | | | | | | |
| Short-Term | | | Long-Term | | | Total | | | CLCF Utilized | |
| $ | 5,906,047 | | | $ | 3,392,706 | | | $ | 9,298,753 | | | $ | 38,041,900 | |
The beneficial ownership, either directly or indirectly, of more than 25% of the voting securities of a Fund creates presumption of the control of the Fund, under section 2(a)(9) of the 1940 Act. As of November 30, 2021, National Financial Services, LLC held 53.7% and TD Ameritrade, Inc. held 34.5% ownership of the voting securities of the Fund. Persons controlling the Fund can determine the outcome of any proposal submitted to the shareholders for approval, including changes to the Fund’s fundamental policies or the terms of the advisory agreement with the Adviser.
Subsequent events after the date of the Statement of Assets and Liabilities have been evaluated through the date the financial statements were issued.
Distributions: The Fund’s Board of Trustees declared the following distributions:
| Class | | Dividend Per Share | | | Record Date | | Ex-Date | | Payable Date |
| Institutional | | $ | 0.0574 | | | 12/17/2021 | | 12/20/2021 | | 12/21/2021 |
Management has determined that no events or transactions occurred requiring adjustment or disclosure in the financial statements except as disclosed.

REPORT OF INDEPENDENT REGISTERED PUBLIC ACCOUNTING FIRM
To the Shareholders of FormulaFolios US Equity Fund and
Board of Trustees of Northern Lights Fund Trust II
Opinion on the Financial Statements
We have audited the accompanying statement of assets and liabilities, including the schedule of investments, of FormulaFolios US Equity Fund (the “Fund”), a series of Northern Lights Fund Trust II, as of November 30, 2021, the related statement of operations for the year then ended, the statements of changes in net assets for each of the two years in the period then ended, the related notes, and the financial highlights for each of the five years in the period then ended (collectively referred to as the “financial statements”). In our opinion, the financial statements present fairly, in all material respects, the financial position of the Fund as of November 30, 2021, the results of its operations for the year then ended, the changes in net assets for each of the two years in the period then ended, and the financial highlights for each of the five years in the period then ended, in conformity with accounting principles generally accepted in the United States of America.
Basis for Opinion
These financial statements are the responsibility of the Fund’s management. Our responsibility is to express an opinion on the Fund’s financial statements based on our audits. We are a public accounting firm registered with the Public Company Accounting Oversight Board (United States) (“PCAOB”) and are required to be independent with respect to the Fund in accordance with the U.S. federal securities laws and the applicable rules and regulations of the Securities and Exchange Commission and the PCAOB.
We conducted our audits in accordance with the standards of the PCAOB. Those standards require that we plan and perform the audit to obtain reasonable assurance about whether the financial statements are free of material misstatement whether due to error or fraud.
Our audits included performing procedures to assess the risks of material misstatement of the financial statements, whether due to error or fraud, and performing procedures that respond to those risks. Such procedures included examining, on a test basis, evidence regarding the amounts and disclosures in the financial statements. Our procedures included confirmation of securities owned as of November 30, 2021, by correspondence with the custodian and brokers; when replies were not received from brokers, we performed other auditing procedures. Our audits also included evaluating the accounting principles used and significant estimates made by management, as well as evaluating the overall presentation of the financial statements. We believe that our audits provide a reasonable basis for our opinion.
We have served as the auditor of one or more investment companies advised by FormulaFolios Investments LLC since 2015.

COHEN & COMPANY, LTD.
Cleveland, Ohio
January 28, 2022
COHEN & COMPANY, LTD.
800.229.1099 | 866.818.4535 fax | cohencpa.com
Registered with the Public Company Accounting Oversight Board
FORMULAFOLIOS US EQUITY FUND
EXPENSE EXAMPLES (Unaudited)
November 30, 2021
As a shareholder of the Fund, you incur ongoing costs, including management fees; distribution and/or service (12b-1) fees; and other Fund expenses. This example is intended to help you understand your ongoing costs (in dollars) of investing in the Fund and to compare these costs with the ongoing costs of investing in other mutual funds.
The example is based on an investment of $1,000 invested at the beginning of the period and held for the entire period from June 1, 2021 through November 31, 2021.
Actual Expenses
The “Actual Expenses” line in the table below provides information about actual account values and actual expenses. You may use the information below; together with the amount you invested, to estimate the expenses that you paid over the period. Simply divide your account value by $1,000 (for example, an $8,600 account value divided by $1,000 = 8.6), then multiply the result by the number in the table under the heading entitled “Expenses Paid During Period” to estimate the expenses you paid on your account during this period.
Hypothetical Example for Comparison Purposes
The “Hypothetical” line in the table below provides information about hypothetical account values and hypothetical expenses based on the Fund’s actual expense ratio and an assumed rate of return of 5% per year before expenses, which is not the Fund’s actual return. The hypothetical account values and expenses may not be used to estimate the actual ending account balances or expenses you paid for the period. You may use this information to compare this 5% hypothetical example with the 5% hypothetical examples that appear in the shareholder reports of other funds.
The table is useful in comparing ongoing costs only, and will not help you determine the relative total costs of owning different funds.
| | | | | | | Hypothetical | |
| | | | Actual | | (5% return before expenses) | |
| | Fund’s | | Ending | | | | | |
| | Annualized | Beginning | Account | Expenses | | Ending | Expenses | |
| | Expense | Account Value | Value | Paid During | | Account Value | Paid During | |
| | Ratio | 6/1/21 | 11/30/21 | Period * | | 11/30/21 | Period * | |
| Institutional Class | 1.12% | $1,000.00 | $1,016.90 | $5.66 | | $1,019.45 | $5.67 | |
| Investor Class | 2.12% | $1,000.00 | $1,012.10 | $10.69 | | $1,014.44 | $10.71 | |
| * | Expenses are equal to the average account value over the period, multiplied by the Fund’s annualized expense ratio, multiplied by the number of days in the period (183) divided by the number of days in the fiscal year (365). |
FORMULAFOLIOS US EQUITY FUND
SUPPLEMENTAL INFORMATION (Unaudited)(Continued)
November 30, 2021
The Trustees and the officers of the Trust are listed below with their present positions with the Trust and principal occupations over at least the last five years. The business address of each Trustee and Officer is 225 Pictoria Drive, Suite 450, Cincinnati, OH 45246. All correspondence to the Trustees and Officers should be directed to c/o Gemini Fund Services, LLC, P.O. Box 541150, Omaha, Nebraska 68154.
Independent Trustees
Name and
Year of Birth | Position/Term of
Office* | Principal Occupation
During the Past Five Years | Number
of
Portfolios
in Fund
Complex
Overseen
by
Trustee*** | Other Directorships held by Trustee
During the Past Five Years |
Thomas T. Sarkany
1946 | Trustee Since October 2011 | President, TTS Consultants, LLC (financial services) (since 2010). | 1 | Director, Aquila Distributors; Trustee, Arrow ETF Trust; Trustee, Arrow Investments Trust; Trustee, Northern Lights Fund Trust IV |
Anthony H. Lewis
1946 | Trustee Since May 2011 | Chairman and CEO of The Lewis Group USA (executive consulting firm) (since 2007). | 1 | Director, Member of the Compensation Committee and Member of the Risk Committee of Torotel Inc. (Magnetics, Aerospace and Defense), Trustee, Chairman of the Fair Valuation Committee and Member of the Audit Committee of the Wildermuth Endowment Strategy Fund |
Keith Rhoades
1948 | Trustee Since May 2011 | Retired since 2008. | 1 | NONE |
Randal D. Skalla
1962 | Trustee Since May 2011 | President, L5 Enterprises, Inc. (financial services company) (since 2001). | 1 | Board Member, Orizon Investment Counsel (financial services company) (from 2001 to 2017) |
FORMULAFOLIOS US EQUITY FUND
SUPPLEMENTAL INFORMATION (Unaudited)(Continued)
November 30, 2021
Interested Trustees and Officers
Name and
Year of Birth | Position/Term of
Office* | Principal Occupation
During the Past Five Years | Number of
Portfolios in
Fund Complex
Overseen by
Trustee*** | Other Directorships held by Trustee
During the Past Five Years |
Brian Nielsen**
1972 | Trustee Since May 2011 | Trustee of Northern Lights Fund Trust II (since 2011); Special Projects Counsel of NorthStar Financial Services Group, LLC (from 2018 to 2019); Secretary of CLS Investments, LLC (from 2001 to 2018); Secretary of Orion Advisor Services, LLC (from 2001 to 2018); General Counsel and Secretary (from 2003 to 2018) of NorthStar Financial Services Group, LLC; CEO (from 2012 to 2018), Secretary (from 2003 to 2018) and Manager (from 2005 to 2018) of Northern Lights Distributors, LLC; Director, Secretary and General Counsel of Constellation Trust Company (from 2004 to 2018); CEO (from 2015 to 2018), General Counsel and Secretary (from 2011 to 2018) of Northern Lights Compliance Services, LLC; General Counsel and Secretary of Blu Giant, LLC (from 2011 to 2018); Secretary of Gemini Fund Services, LLC (from 2012 to 2018); Manager of Arbor Point Advisors, LLC (from 2012 to 2018); Director, Secretary and General Counsel of NorthStar CTC Holdings, Inc. (from 2015 to 2018) and Secretary and Chief Legal Officer of AdvisorOne Funds (from 2003 to 2018). | 1 | Manager of Northern Lights Distributors, LLC (from 2005 to 2018); Manager of Arbor Point Advisors, LLC (from 2012 to 2018); Director of Constellation Trust Company (from 2004 to 2018) |
Kevin E. Wolf
1969 | President Since January 2013 | Vice President of The Ultimus Group, LLC; Executive Vice President, Head of Fund Administration and Product (since 2019) and President (2012 - 2019) of Ultimus Fund Solutions, LLC (formerly, Gemini Fund Services, LLC). | N/A | N/A |
Richard Malinowski
1983 | Secretary Since January 2018 | Senior Vice President and Senior Managing Counsel (since February 2020), Senior Vice President Legal Administration (April 2017 to February 2020) and Vice President and Counsel (April 2016 to April 2017) of Ultimus Fund Solutions, LLC (formerly, Gemini Fund Services, LLC). | N/A | N/A |
Erik Naviloff
1968 | Treasurer Since January 2013 | Vice President of Ultimus Fund Solutions, LLC (formerly, Gemini Fund Services, LLC) (since 2011). | N/A | N/A |
Emile R. Molineaux
1962 | Chief Compliance Officer and Anti Money Laundering Officer Since May 2011 | Senior Compliance Officer and CCO of Various clients of Northern Lights Compliance Services, LLC (since 2011). | N/A | N/A |
| * | The term of office for each Trustee and Officer listed above will continue indefinitely. |
| ** | Brian Nielsen is an “interested person” of the Trust as that term is defined under the 1940 Act, because of his prior affiliation with Northern Lights Distributors, LLC (the Fund’s Distributor). |
| *** | As of November 30, 2021, the Trust was comprised of 22 active portfolios managed by unaffiliated investment advisers. The term “Fund Complex” applies only to the Fund, and not to any other series of the Trust. The Fund does not hold itself out as related to any other series within the Trust for investment purposes, nor does it share the same investment adviser with any other series. |
The Funds’ SAI includes additional information about the Trustees and is available free of charge, upon request, by calling toll-free at 1-855-907-3233.
FORMULAFOLIOS US EQUITY FUND
SUPPLEMENTAL INFORMATION (Unaudited)
November 30, 2021
LIQUIDITY RISK MANAGEMENT PROGRAM
The Fund has adopted and implemented a written liquidity risk management program as required by Rule 22e-4 (the “Liquidity Rule”) under the 1940 Act. The program is reasonably designed to assess and manage the Fund’s liquidity risk, taking into consideration, among other factors, the Fund’s investment strategy and the liquidity of its portfolio investments during normal and reasonably foreseeable stressed conditions; its short and long-term cash flow projections; and its cash holdings and access to other funding sources.
During the fiscal period ended June 30, 2021, the Trust’s Liquidity Risk Management Program Committee (the “Committee”) reviewed the Fund’s investments and determined that the Fund held adequate levels of cash and highly liquid investments to meet shareholder redemption activities in accordance with applicable requirements. Accordingly, the Committee concluded that (i) the Fund’s liquidity risk management program is reasonably designed to prevent violations of the Liquidity Rule and (ii) the Fund’s liquidity risk management program has been effectively implemented.
Privacy Policy
Rev. May 2021
| FACTS | WHAT DOES NORTHERN LIGHTS FUND TRUST II (“NLFT II”) DO WITH YOUR PERSONAL INFORMATION? |
| Why? | Financial companies choose how they share your personal information. Federal law gives consumers the right to limit some but not all sharing. Federal law also requires us to tell you how we collect, share, and protect your personal information. Please read this notice carefully to understand what we do. |
| What? | The types of personal information we collect and share depend on the product or service you have with us. This information can include:
|
● Social Security number ● Employment information ● Account balances | ● Account transactions ● Income ● Investment experience |
When you are no longer our customer, we continue to share your information as described in this notice. |
| How? | All financial companies need to share a customer’s personal information to run their everyday business - to process transactions, maintain customer accounts, and report to credit bureaus. In the section below, we list the reasons financial companies can share their customer’s personal information; the reasons NLFT II chooses to share; and whether you can limit this sharing. |
| | |
| Reasons we can share your personal information | Does NLFT II
share? | Can you limit
this sharing? |
For our everyday business purposes —
such as to process your transactions, maintain your account(s), respond to court orders and legal investigations, or report to credit bureaus
| Yes | No |
For our marketing purposes —
to offer our products and services to you
| Yes | No |
For joint marketing with other financial companies
| Yes | No |
For our affiliates’ everyday business purposes —
information about your transactions and experiences
| Yes | No |
For our affiliates’ everyday business purposes —
information about your creditworthiness
| No | We don’t share |
For nonaffiliates to market to you
| No | We don’t share |
| Questions? | Call 1-631-490-4300 |
| Who we are |
| Who is providing this notice? | Northern Lights Fund Trust II |
| What we do |
| How does NLFT II protect my personal information? | To protect your personal information from unauthorized access and use, we use security measures that comply with federal law. These measures include computer safeguards and secured files and buildings. |
| How does NLFT II collect my personal information? | We collect your personal information, for example, when you
|
● open an account ● give us your income information ● provide employment information | ● provide account information ● give us your contact information |
| We also collect your personal information from others, such as credit bureaus, affiliates, or other companies. |
| Why can’t I limit all sharing? | Federal law gives you the right to limit only ● sharing for affiliates’ everyday business purposes—information about your creditworthiness ● affiliates from using your information to market to you ● sharing for nonaffiliates to market to you State laws and individual companies may give you additional rights to limit sharing. |
| Definitions |
| Affiliates | Companies related by common ownership or control. They can be financial and nonfinancial companies. ● NLFT II has no affiliates. |
| Nonaffiliates | Companies not related by common ownership or control. They can be financial and nonfinancial companies. ● NLFT II does not share with nonaffiliates so they can market to you. |
| Joint marketing | A formal agreement between nonaffiliated financial companies that together market financial products and services to you. ● Our joint marketing partners include other financial service companies. |
This Page Intentionally Left Blank.
PROXY VOTING POLICY
Information regarding how the Fund voted proxies relating to portfolio securities for the most recent twelve month period ended June 30 as well as a description of the policies and procedures that the Fund uses to determine how to vote proxies is available without charge, upon request, by calling 1-855-907-3233 or by referring to the Securities and Exchange Commission’s (“SEC”) website at http://www.sec.gov.
PORTFOLIO HOLDINGS
The Fund files a complete schedule of portfolio holdings with the Securities and Exchange Commission (the “SEC”) for the first and third quarters of each fiscal years an exhibit to its reports on Form N-PORT, within sixty days after the end of the period. Form N-PORT reports are available at the SEC’s website at www.sec.gov.
INVESTMENT ADVISER
FormulaFolio Investments LLC
89 Ionia SW, Suite 600
Grand Rapids, MI 49503
ADMINISTRATOR
Ultimus Fund Solutions, LLC
4221 North 203rd Street, Suite 100
Elkhorn, NE 68022-3474
FFIFUND-AR21
Item 2. Code of Ethics.
(a) As of the end of the period covered by this report, the registrant has adopted a code of ethics that applies to the registrant's principal executive officer, principal financial officer, principal accounting officer or controller, or persons performing similar functions, regardless of whether these individuals are employed by the registrant or a third party.
(b) For purposes of this item, “code of ethics” means written standards that are reasonably designed to deter wrongdoing and to promote:
| (1) | Honest and ethical conduct, including the ethical handling of actual or apparent conflicts of interest between personal and professional relationships; |
| (2) | Full, fair, accurate, timely, and understandable disclosure in reports and documents that a registrant files with, or submits to, the Commission and in other public communications made by the registrant; |
(3) Compliance with applicable governmental laws, rules, and regulations;
| (4) | The prompt internal reporting of violations of the code to an appropriate person or persons identified in the code; and |
(5) Accountability for adherence to the code.
(c) Amendments: During the period covered by the report, there have not been any amendments to the provisions of the code of ethics.
(d) Waivers: During the period covered by the report, the registrant has not granted any express or implicit waivers from the provisions of the code of ethics.
(e) The Code of Ethics is not posted on Registrant’ website.
(f) A copy of the Code of Ethics is attached as an exhibit.
Item 3. Audit Committee Financial Expert.
(a) The Registrant’s board of trustees has determined that Keith Rhoades is an audit committee financial expert, as defined in Item 3 of Form N-CSR. Mr. Rhoades is independent for purposes of this Item.
Item 4. Principal Accountant Fees and Services.
2020 – $13,250
2021 -- $13,750
2020 – None
2021 -- None
2020 – $3,000
2021 -- $3,000
Preparation of Federal & State income tax returns, assistance with calculation of required income, capital gain and excise distributions and preparation of Federal excise tax returns.
2020 – None
2021 -- None
| (e) | (1) Audit Committee’s Pre-Approval Policies |
The registrant’s Audit Committee is required to pre-approve all audit services and, when appropriate, any non-audit services (including audit-related, tax and all other services) to the registrant. The registrant’s Audit Committee also is required to pre-approve, when appropriate, any non-audit services (including audit-related, tax and all other services) to its adviser, or any entity controlling, controlled by or under common control with the adviser that provides ongoing services to the registrant, to the extent that the services may be determined to have an impact on the operations or financial reporting of the registrant. Services are reviewed on an engagement by engagement basis by the Audit Committee.
| (2) | Percentages of Services Approved by the Audit Committee |
2021 2020
Audit-Related Fees: 0.00% 0.00%
Tax Fees: 0.00% 0.00%
All Other Fees: 0.00% 0.00%
| (f) | During the audit of registrant's financial statements for the most recent fiscal year, less than 50 percent of the hours expended on the principal accountant's engagement were attributed to work performed by persons other than the principal accountant's full-time, permanent employees. |
| (g) | The aggregate non-audit fees billed by the registrant's accountant for services rendered to the registrant, and rendered to the registrant's investment adviser (not including any sub-adviser whose role is primarily portfolio management and is subcontracted with or overseen by another investment adviser), and any entity controlling, controlled by, or under common control with the adviser that provides ongoing services to the registrant: |
2020 – $3,000
2021 -- $3,000
(h) The registrant's audit committee has considered whether the provision of non-audit services to the registrant's investment adviser (not including any sub-adviser whose role is primarily portfolio management and is subcontracted with or overseen by another investment adviser), and any entity controlling, controlled by, or under common control with the investment adviser that provides ongoing services to the registrant, that were not pre-approved pursuant to paragraph (c)(7)(ii) of Rule 2-01 of Regulation S-X, is compatible with maintaining the principal accountant's independence.
Item 5. Audit Committee of Listed Companies. Not applicable to open-end investment companies.
Item 6. Schedule of Investments. Schedule of investments in securities of unaffiliated issuers is included under Item 1.
Item 7. Disclosure of Proxy Voting Policies and Procedures for Closed-End Funds. Not applicable to open-end investment companies.
Item 8. Portfolio Managers of Closed-End Management Investment Companies. Not applicable to open-end investment companies.
Item 9. Purchases of Equity Securities by Closed-End Funds. Not applicable to open-end investment companies.
Item 10. Submission of Matters to a Vote of Security Holders. None
Item 11. Controls and Procedures.
(a) Based on an evaluation of the Registrant’s disclosure controls and procedures as of a date within 90 days of filing date of this Form N-CSR, the principal executive officer and principal financial officer of the Registrant have concluded that the disclosure controls and procedures of the Registrant are reasonably designed to ensure that the information required in filings on Form N-CSR is recorded, processed, summarized, and reported by the filing date, including that information required to be disclosed is accumulated and communicated to the Registrant’s management, including the Registrant’s
principal executive officer and principal financial officer, as appropriate to allow timely decisions regarding required disclosure.
(b) There were no significant changes in the Registrant’s internal control over financial reporting that occurred during the Registrant’s last fiscal half-year that have materially affected, or are reasonably likely to materially affect, the Registrant’s internal control over financial reporting.
Item 12. Disclosure of Securities Lending Activities for Closed-End Management Investment Companies. Not applicable to open-end investment companies.
Item 13. Exhibits.
(a)(1) Code of Ethics filed herewith.
(a)(2) Certifications required by Section 302 of the Sarbanes-Oxley Act of 2002 (and Item 11(a)(2) of Form N-CSR) are filed herewith.
(a)(3) Not applicable for open-end investment companies.
(b) Certifications required by Section 906 of the Sarbanes-Oxley Act of 2002 (and Item 11(b) of Form N-CSR) are filed herewith.
SIGNATURES
Pursuant to the requirements of the Securities Exchange Act of 1934 and the Investment Company Act of 1940, the registrant has duly caused this report to be signed on its behalf by the undersigned, thereunto duly authorized.
(Registrant) Northern Lights Fund Trust II
By (Signature and Title)
/s/ Kevin E. Wolf
Kevin E. Wolf, Principal Executive Officer/President
Date 2/5/22
Pursuant to the requirements of the Securities Exchange Act of 1934 and the Investment Company Act of 1940, this report has been signed below by the following persons on behalf of the registrant and in the capacities and on the dates indicated.
By (Signature and Title)
/s/Kevin E. Wolf
Kevin E. Wolf, Principal Executive Officer/President
Date 2/5/22
By (Signature and Title)
/s/ Erik Naviloff
Erik Naviloff, Principal Financial Officer/Treasurer
Date 2/5/22