united states
securities and exchange commission
washington, d.c. 20549
form n-csr
certified shareholder report of registered management
investment companies
Investment Company Act file number 811-22549
Northern Lights Fund Trust II
(Exact name of registrant as specified in charter)
225 Pictoria Drive, Cincinnati, Ohio 45246
(Address of principal executive offices) (Zip code)
Kevin Wolf, Ultimus Fund Solutions, LLC
80 Arkay Drive, Hauppauge, NY 11788
(Name and address of agent for service)
Registrant's telephone number, including area code: 631-470-2600
Date of fiscal year end: 12/31
Date of reporting period: 12/31/23
Item 1. Reports to Stockholders.
| |
| |
| |
| |
| |
 |
| |
| |
| |
| |
| |
| Dynamic International Opportunity Fund |
| |
| Dynamic U.S. Opportunity Fund |
| |
| |
| |
| |
| |
| Annual Report |
| |
| December 31, 2023 |
| |
| |
| |
| |
| |
| |
| |
| |
| |
| |
| www.innealtacapital.com |
| 1 (855) USE-ETFS |
| |
| |
| |
| |
| |
| |
| |
| |
| |
| |
| Distributed by Northern Lights Distributors, LLC |
| Member FINRA |
Dynamic Funds Annual Shareholder Letter
Dear Shareholder,
After a turbulent first half weighed down by aggressive Fed interest rate hikes to fight inflations and recession fears, both the equity and fixed-income markets staged an impressive rebound in the last quarter of 2023. The U.S. equities, represented by the S&P 500 Index, gained ~26% for the year, fueled by resilient economic performance, strong corporate earnings, and a late-year dovish pivot by the Fed. The bond market also benefited from easing inflation and hopes of early rate cuts. The broader fixed-income markets, represented by the Bloomberg U.S. Aggregate Bond Index, gained ~5% for the year. Within U.S. sectors, Information Technology and Communication Services outperformed while Utilities lagged.
Exhibit 1. 2023 U.S. Sector Performance Source: Innealta Capital uses data from Bloomberg. Time frame: 12/31/2022 to 12/31/2023. Frequency monthly. Past performance is not indicative of future results. | 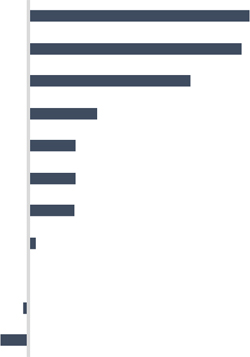 |
 | Looking abroad, the Global ex-U.S. market, as measured by the MSCI ACWI ex-U.S. Index, was up 15.62%. Across different regions, EM Latin America outperformed while EM Asia lagged. Exhibit 2. 2023 International Region Performance Source: Innealta Capital uses data from MSCI. Time frame: 12/31/2022 to 12/31/2023. Frequency monthly. Past performance is not indicative of future results. |
Our organization remains stable, and our research team continues to pursue an active agenda, enabling us to dynamically adjust funds in response to changing market conditions, with the goal of participating in up markets and managing risk in down markets.
Thank you for entrusting us with your investments.
Fund Performance
Dynamic International Opportunity Fund
In 2023, Dynamic International Opportunity Fund I Share class (“ICCIX”) was up 10.95%.
Exhibit 3. Quarterly Performance of ICCIX vs. MSCI ACWI ex U.S. NR Index as of December 31st, 2023
| 2023 Performance | Q1 | Q2 | Q3 | Q4 | YTD |
| | | | | | |
| ICCIX | 4.17% | 2.30% | -3.92% | 8.35% | 10.95% |
| | | | | | |
| MSCI ACWI ex U.S. | 6.87% | 2.44% | -3.77% | 9.76% | 15.62% |
| | | | | | |
To decompose fund performance, the overweight allocation to defensive fixed-income securities was the main detractor. On the other hand, the overweight allocation to Brazil and the underweight allocation to Hong Kong were the main contributors.
Dynamic U.S. Opportunity Fund
In 2023, Dynamic U.S. Opportunity Fund I Share class (“ICSIX”) was up 16.05%.
Exhibit 4. Quarterly Performance of ICSIX vs. S&P 500 TR Index as of December 31st, 2023
| 2023 Performance | Q1 | Q2 | Q3 | Q4 | YTD |
| | | | | | |
| ICSIX | 4.63% | 5.34% | -3.60% | 9.22% | 16.05% |
| | | | | | |
| S&P 500 | 7.50% | 8.74% | -3.27% | 11.69% | 26.29% |
| | | | | | |
To decompose fund performance, the overweight allocation to defensive fixed-income securities and underweight allocation to the information technology sector were the main detractors. In contrast, the underweight allocations to healthcare, consumer staples, and real estate sectors were the main contributors.
Disclosures and Important Information
S&P 500 Index is widely regarded as the best single gauge of large-cap U.S. equities and serves as the foundation for a wide range of investment products. MSCI All Country World ex US NR Index captures large- and mid-cap representation across 22 of 23 Developed Markets (DM) countries (excluding the US) and 24 Emerging Markets (EM) countries. The index covers approximately 85% of the global equity opportunity set outside the U.S. Bloomberg Barclays U.S. Aggregate Bond Index is representative of the entire universe of taxable fixed-income investments. It includes issues of the U.S. Government and any agency thereof, corporate issues of investment grade quality (Baa/BBB or better), and mortgage-backed securities.
Total return indices reinvest dividends. Net total return indices reinvest dividends after a deduction for withholding taxes. Indices do not reflect any fees, expenses, or sales charges and are not available for direct investment. Investments cannot be made in an index. Unmanaged index returns do not reflect any fees, expenses, or sales charges. Past performance is no guarantee of future results.
3465-INN-02/02/2024
3130-NLD-02/02/2024
DYNAMIC INTERNATIONAL OPPORTUNITY FUND
PORTFOLIO REVIEW (Unaudited)
December 31, 2023
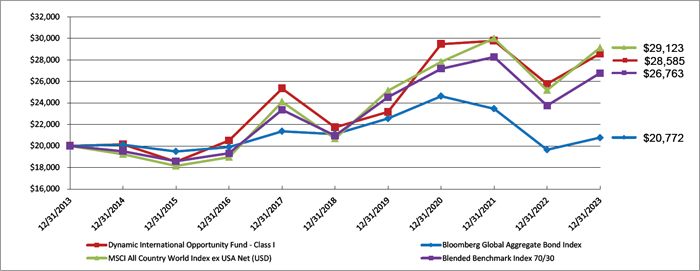
The Fund’s performance figures* for the periods ended December 31, 2023, compared to its benchmark:
| | | Annualized |
| | One Year | Five Year | Ten Year |
| Dynamic International Opportunity Fund - Class I | 10.95% | 5.64% | 3.64% |
| Dynamic International Opportunity Fund - Class N | 10.61% | 5.37% | 3.37% |
| MSCI All Country World Index ex USA Net (USD)** | 15.62% | 7.08% | 3.83% |
| Bloomberg Global Aggregate Bond Index *** | 5.72% | (0.32)% | 0.38% |
| Blended Benchmark Index 70/30 **** | 12.66% | 5.02% | 2.96% |
Comparison of the Change in Value of a $20,000 Investment
| * | The performance data quoted here represents past performance. The performance comparison includes reinvestment of all dividends and capital gain distributions, if any. Current performance may be lower or higher than the performance data quoted above. Past performance is no guarantee of future results. The investment return and principal value of an investment will fluctuate so that investor’s shares, when redeemed, may be worth more or less than their original cost. The returns shown do not reflect the deduction of taxes that a shareholder would pay on Fund distributions or on the redemption of Fund shares. The Fund’s total annual operating expenses are 1.63% for Class I shares and 1.88% for Class N shares per the May 1, 2023, prospectus. After fee waivers, the Fund’s total annual operating expenses are 1.51% for Class I shares and 1.76% for Class N shares. For performance information current to the most recent month-end, please call toll-free 1-855-873-3837 (1-855-USE-ETFS). Performance for periods prior to March 27, 2018, reflects the performance of the Fund’s prior investment advisor, AFAM Capital, Inc. (“AFAM”), and specifically the Innealta Capital division of AFAM (the “Innealta Division”). On March 27, 2018, shareholders approved the new investment advisory agreement with the Fund’s current advisor Innealta Capital, LLC, which was formed through a reorganization of the Innealta Division. |
| ** | The MSCI All Country World Index ex USA Net (USD) is a free float-adjusted market capitalization index maintained by Morgan Stanley Capital International (MSCI) and designed to provide a broad measure of stock performance throughout the world, with the exception of U.S.-based companies. The MSCI All Country World Index Ex-U.S. consists of 45 country indices comprising 24 developed and 21 emerging market country indices. Investors cannot invest directly in an index. |
| *** | Bloomberg Global Aggregate Bond Index is a flagship measure of global investment grade debt from twenty-four local currency markets. This multi-currency benchmark includes treasury, government-related, corporate and securitized fixed-rate bonds from both developed and emerging markets issuers. Investors cannot invest directly in an index. |
| **** | The Blended Benchmark Index 70/30 represents a blend of 70% MSCI All Country World Index ex USA Net (USD) and 30% Bloomberg Global Aggregate Bond Index. Investors cannot invest directly in an index. |
| Holdings By Asset Class as of December 31, 2023 | | % of Net Assets | |
| Exchange Traded Funds - Equity Funds | | | 85.5 | % |
| Short-Term Investments | | | 32.4 | % |
| Liabilities in Excess of Other Assets | | | (17.9 | )% |
| | | | 100.0 | % |
Please refer to the Schedule of Investments in this annual report for a detailed analysis of the Fund’s holdings.
DYNAMIC U.S. OPPORTUNITY FUND
PORTFOLIO REVIEW (Unaudited)
December 31, 2023
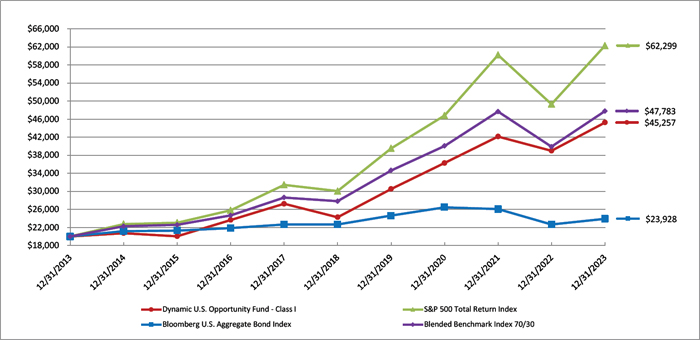
The Fund’s performance figures* for the periods ended December 31, 2023, compared to its benchmark:
| | | Annualized |
| | One Year | Five Year | Ten Year |
| Dynamic U.S. Opportunity Fund - Class I | 16.05% | 13.28% | 8.51% |
| Dynamic U.S. Opportunity Fund - Class N | 15.73% | 13.00% | 8.25% |
| S&P 500 Total Return Index** | 26.29% | 15.69% | 12.03% |
| Bloomberg U.S. Aggregate Bond Index *** | 5.53% | 1.10% | 1.81% |
| Blended Benchmark Index 70/30 **** | 19.78% | 11.43% | 9.10% |
Comparison of the Change in Value of a $20,000 Investment
| * | The performance data quoted here represents past performance. The performance comparison includes reinvestment of all dividends and capital gain distributions, if any. Current performance may be lower or higher than the performance data quoted above. Past performance is no guarantee of future results. The investment return and principal value of an investment will fluctuate so that investor’s shares, when redeemed, may be worth more or less than their original cost. The returns shown do not reflect the deduction of taxes that a shareholder would pay on Fund distributions or on the redemption of Fund shares. The Fund’s total annual operating expenses are 1.47% for Class I shares and 1.72% for Class N shares per the May 1, 2023, prospectus. After fee waivers, the Fund’s total annual operating expenses are 1.36% for Class I shares and 1.61% for Class N shares. For performance information current to the most recent month-end, please call toll-free 1-855-873-3837 (1-855-USE-ETFS). Performance for periods prior to March 27, 2018, reflects the performance of the Fund’s prior investment advisor, AFAM Capital, Inc. (“AFAM”), and specifically the Innealta Capital division of AFAM (the “Innealta Division”). On March 27, 2018, shareholders approved the new investment advisory agreement with the Fund’s current advisor Innealta Capital, LLC, which was formed through a reorganization of the Innealta Division. |
| ** | The S&P 500 Total Return Index is a widely accepted, unmanaged index of U.S. stock market performance which does not take into account charges, fees and other expenses. Investors cannot invest directly in an index. |
| *** | The Bloomberg US Aggregate Bond Index is a broad-based flagship benchmark that measures the investment grade, US dollar-denominated, fixed-rate taxable bond market. The index includes Treasuries, government-related and corporate securities, MBS (agency fixed-rate and hybrid ARM pass-throughs), ABS and CMBS (agency and non-agency). Investors cannot invest directly in an index. |
| **** | The Blended Benchmark Index 70/30 represents a blend of 70% S&P 500 Total Return Index and 30% Bloomberg Barclays U.S. Aggregate Bond Index. Investors cannot invest directly in an index. |
| Holdings By Asset Class as of December 31, 2023 | | % of Net Assets | |
| Exchange Traded Funds - Equity Funds | | | 75.8 | % |
| Exchange Traded Funds - Fixed Income Funds | | | 22.7 | % |
| Short-Term Investments | | | 14.8 | % |
| Liabilities in Excess of Other Assets | | | (13.3 | )% |
| | | | 100.0 | % |
Please refer to the Schedule of Investments in this annual report for a detailed analysis of the Fund’s holdings.
| DYNAMIC INTERNATIONAL OPPORTUNITY FUND |
| SCHEDULE OF INVESTMENTS |
| December 31, 2023 |
| Shares | | | | | Fair Value | |
| | | | | EXCHANGE-TRADED FUNDS — 85.5% | | | | |
| | | | | EQUITY - 85.5% | | | | |
| | 55,200 | | | Franklin FTSE Australia ETF(a) | | $ | 1,570,302 | |
| | 100,730 | | | Franklin FTSE Brazil ETF | | | 2,110,122 | |
| | 109,899 | | | Franklin FTSE Canada ETF | | | 3,653,043 | |
| | 122,989 | | | Franklin FTSE China ETF | | | 1,973,973 | |
| | 120,789 | | | Franklin FTSE Germany ETF(a) | | | 2,795,818 | |
| | 64,394 | | | Franklin FTSE Hong Kong ETF(a) | | | 1,171,552 | |
| | 60,893 | | | Franklin FTSE India ETF | | | 2,123,936 | |
| | 228,755 | | | Franklin FTSE Japan ETF | | | 6,402,853 | |
| | 69,765 | | | Franklin FTSE Russia ETF(a),(b)(c)(d) | | | 698 | |
| | 64,970 | | | Franklin FTSE South Korea ETF | | | 1,474,169 | |
| | 160,500 | | | Franklin FTSE Switzerland ETF(a) | | | 5,320,463 | |
| | 68,020 | | | Franklin FTSE Taiwan ETF | | | 2,809,865 | |
| | 132,701 | | | Franklin FTSE United Kingdom ETF | | | 3,336,767 | |
| | 176,425 | | | iShares China Large-Cap ETF(e) | | | 4,239,493 | |
| | 54,860 | | | iShares MSCI Australia ETF(e) | | | 1,335,292 | |
| | 32,798 | | | iShares MSCI Brazil ETF(e) | | | 1,146,618 | |
| | 4,700 | | | iShares MSCI Denmark ETF | | | 527,105 | |
| | 161,673 | | | iShares MSCI France ETF | | | 6,334,348 | |
| | 106,856 | | | iShares MSCI Germany ETF(e) | | | 3,172,555 | |
| | 616 | | | iShares MSCI Hong Kong ETF | | | 10,700 | |
| | 48,395 | | | iShares MSCI India ETF | | | 2,362,160 | |
| | 18,550 | | | iShares MSCI Indonesia ETF(e) | | | 414,036 | |
| | 50,735 | | | iShares MSCI Italy ETF(e) | | | 1,721,439 | |
| | 90,762 | | | iShares MSCI Japan ETF | | | 5,821,475 | |
| | 11,152 | | | iShares MSCI Malaysia ETF | | | 236,980 | |
| | 13,615 | | | iShares MSCI Mexico ETF(e) | | | 923,778 | |
| | 52,086 | | | iShares MSCI Netherlands ETF(e) | | | 2,324,598 | |
| | 22,374 | | | iShares MSCI Saudi Arabia ETF | | | 947,091 | |
| | 45,545 | | | iShares MSCI Singapore ETF | | | 851,692 | |
| | 23,112 | | | iShares MSCI South Africa ETF | | | 965,850 | |
| | 33,459 | | | iShares MSCI South Korea ETF(e) | | | 2,192,568 | |
| | 44,660 | | | iShares MSCI Spain ETF | | | 1,367,489 | |
| | 42,558 | | | iShares MSCI Sweden ETF | | | 1,679,764 | |
| | 60,564 | | | iShares MSCI Switzerland ETF | | | 2,923,424 | |
See accompanying notes to financial statements.
| DYNAMIC INTERNATIONAL OPPORTUNITY FUND |
| SCHEDULE OF INVESTMENTS (Continued) |
| December 31, 2023 |
| Shares | | | | | Fair Value | |
| | | | | EXCHANGE-TRADED FUNDS — 85.5% (Continued) | | | | |
| | | | | EQUITY - 85.5% (Continued) | | | | |
| | 41,302 | | | iShares MSCI Taiwan ETF(e) | | $ | 1,901,131 | |
| | 3,298 | | | iShares MSCI Thailand ETF(e) | | | 210,610 | |
| | 182,636 | | | iShares MSCI United Kingdom ETF(e) | | | 6,036,120 | |
| | 66,641 | | | JPMorgan BetaBuilders Canada ETF | | | 4,273,021 | |
| | 18,218 | | | JPMorgan BetaBuilders Europe ETF(e) | | | 1,030,957 | |
| | | | | TOTAL EXCHANGE-TRADED FUNDS (Cost $87,080,153) | | | 89,693,855 | |
| | | | | | | | | |
| | | | | SHORT-TERM INVESTMENTS — 32.4% | | | | |
| | | | | COLLATERAL FOR SECURITIES LOANED - 16.2% | | | | |
| | 17,007,596 | | | Mount Vernon Liquid Assets Portfolio, 5.55%(f),(g) | | | 17,007,596 | |
| | | | | | | | | |
| | | | | MONEY MARKET FUND - 16.2% | | | | |
| | 17,001,361 | | | First American Treasury Obligations Fund, Class X, 5.28%(f) | | | 17,001,361 | |
| | | | | | | | | |
| | | | | TOTAL SHORT-TERM INVESTMENTS (Cost $34,008,957) | | | 34,008,957 | |
| | | | | | | | | |
| | | | | TOTAL INVESTMENTS - 117.9% (Cost $121,089,110) | | $ | 123,702,812 | |
| | | | | LIABILITIES IN EXCESS OF OTHER ASSETS - (17.9)% | | | (18,817,028 | ) |
| | | | | NET ASSETS - 100.0% | | $ | 104,885,784 | |
| ETF | - Exchange-Traded Fund |
| | |
| MSCI | - Morgan Stanley Capital International |
| (a) | Affiliated Company – Dynamic International Opportunity Fund holds in excess of 5% of outstanding voting securities of this security. See Note 6. |
| (b) | Non-income producing security. |
| (c) | Security is currently being valued according to fair value procedures approved by the Board of Trustees. |
| (e) | All or a portion of the security is on loan. The total fair value of the securities on loan as of December 31, 2023 was $16,600,927. |
| (f) | Rate disclosed is the seven day effective yield as of December 31, 2023. |
| (g) | This security was purchased with cash collateral held from securities on loan. The total value of such securities as of December 31, 2023 is $17,007,596. |
See accompanying notes to financial statements.
| DYNAMIC U.S. OPPORTUNITY FUND |
| SCHEDULE OF INVESTMENTS |
| December 31, 2023 |
| Shares | | | | | Fair Value | |
| | | | | EXCHANGE-TRADED FUNDS — 98.5% | | | | |
| | | | | EQUITY - 75.8% | | | | |
| | 73,151 | | | Communication Services Select Sector SPDR Fund | | $ | 5,315,152 | |
| | 52,963 | | | Consumer Discretionary Select Sector SPDR Fund | | | 9,470,314 | |
| | 74,318 | | | Consumer Staples Select Sector SPDR Fund | | | 5,353,126 | |
| | 85,782 | | | Energy Select Sector SPDR Fund | | | 7,191,963 | |
| | 419,023 | | | Financial Select Sector SPDR Fund | | | 15,755,265 | |
| | 59,104 | | | Health Care Select Sector SPDR Fund(a) | | | 8,060,604 | |
| | 40,590 | | | Industrial Select Sector SPDR Fund(a) | | | 4,626,854 | |
| | 25,912 | | | Materials Select Sector SPDR Fund(a) | | | 2,216,512 | |
| | 73,235 | | | Real Estate Select Sector SPDR Fund | | | 2,933,794 | |
| | 95,632 | | | Technology Select Sector SPDR Fund | | | 18,407,247 | |
| | 32,665 | | | Utilities Select Sector SPDR Fund | | | 2,068,674 | |
| | 32,455 | | | Vanguard Small-Cap Value ETF | | | 5,840,926 | |
| | | | | | | | 87,240,431 | |
| | | | | FIXED INCOME - 22.7% | | | | |
| | 826,834 | | | SPDR Portfolio Long Term Treasury ETF | | | 23,994,723 | |
| | 29,647 | | | Vanguard Total Bond Market ETF | | | 2,180,537 | |
| | | | | | | | 26,175,260 | |
| | | | | | | | | |
| | | | | TOTAL EXCHANGE-TRADED FUNDS (Cost $89,383,383) | | | 113,415,691 | |
| | | | | | | | | |
| | | | | SHORT-TERM INVESTMENTS — 14.8% | | | | |
| | | | | COLLATERAL FOR SECURITIES LOANED - 12.9% | | | | |
| | 14,828,300 | | | Mount Vernon Liquid Assets Portfolio, 5.55%(b),(c) | | | 14,828,300 | |
| | | | | | | | | |
| | | | | MONEY MARKET FUND - 1.9% | | | | |
| | 2,186,839 | | | First American Treasury Obligations Fund, Class X, 5.28%(b) | | | 2,186,839 | |
| | | | | | | | | |
| | | | | TOTAL SHORT-TERM INVESTMENTS (Cost $17,015,139) | | | 17,015,139 | |
| | | | | | | | | |
| | | | | TOTAL INVESTMENTS - 113.3% (Cost $106,398,522) | | $ | 130,430,830 | |
| | | | | LIABILITIES IN EXCESS OF OTHER ASSETS - (13.3)% | | | (15,292,390 | ) |
| | | | | NET ASSETS - 100.0% | | $ | 115,138,440 | |
| ETF | - Exchange-Traded Fund |
| | |
| SPDR | - Standard & Poor’s Depositary Receipt |
| (a) | All or a portion of the security is on loan. The total fair value of the securities on loan as of December 31, 2023 was $14,522,638. |
| (b) | Rate disclosed is the seven day effective yield as of December 31, 2023. |
| (c) | This security was purchased with cash collateral held from securities on loan. The total value of such securities as of December 31, 2023 is $14,828,300. |
See accompanying notes to financial statements.
| The Dynamic Funds |
| STATEMENTS OF ASSETS AND LIABILITIES |
| December 31, 2023 |
| | | Dynamic International | | | Dynamic U.S. | |
| | | Opportunity Fund | | | Opportunity Fund | |
| ASSETS | | | | | | | | |
| Investments in unaffiliated securities, at cost | | $ | 107,136,639 | | | $ | 106,398,522 | |
| Investments in affiliated securities, at cost | | | 13,952,471 | | | | — | |
| Total Securities, at cost | | $ | 121,089,110 | | | $ | 106,398,522 | |
| Investments in unaffiliated securities, at fair value | | $ | 112,843,979 | | | $ | 130,430,830 | |
| Investments in affiliated securities, at fair value | | | 10,858,833 | | | | — | |
| Total Securities, at value | | $ | 123,702,812 | | | $ | 130,430,830 | |
| Receivable for investments sold | | | 570,197 | | | | — | |
| Receivable for Fund shares sold | | | 100 | | | | 39,976 | |
| Receivable for securities lending income | | | 25,535 | | | | 3,994 | |
| Dividends and interest receivable | | | 33,241 | | | | 21,891 | |
| Prepaid expenses and other assets | | | 10,111 | | | | 27,751 | |
| TOTAL ASSETS | | | 124,341,996 | | | | 130,524,442 | |
| | | | | | | | | |
| LIABILITIES | | | | | | | | |
| Collateral on securities loaned (see note 4) | | | 17,007,596 | | | | 14,828,300 | |
| Payable for investments purchased | | | 1,981,837 | | | | — | |
| Payable for Fund shares redeemed | | | 1,341 | | | | 13,269 | |
| Investment advisory fees payable | | | 401,118 | | | | 458,123 | |
| Distribution (12b-1) fees payable | | | 555 | | | | 1,699 | |
| Payable to related parties | | | 22,910 | | | | 30,363 | |
| Accrued expenses and other liabilities | | | 40,855 | | | | 54,248 | |
| TOTAL LIABILITIES | | | 19,456,212 | | | | 15,386,002 | |
| NET ASSETS | | $ | 104,885,784 | | | $ | 115,138,440 | |
| | | | | | | | | |
| Net Assets Consist Of: | | | | | | | | |
| Paid in capital | | $ | 103,986,330 | | | $ | 91,393,828 | |
| Accumulated earnings | | | 899,454 | | | | 23,744,612 | |
| NET ASSETS | | $ | 104,885,784 | | | $ | 115,138,440 | |
| | | | | | | | | |
| Net Asset Value Per Share: | | | | | | | | |
| Class I Shares: | | | | | | | | |
| Net Assets | | $ | 102,226,523 | | | $ | 106,992,333 | |
| Shares of beneficial interest outstanding ($0 par value, unlimited shares authorized) | | | 8,376,648 | | | | 6,844,073 | |
| Net asset value (Net Assets ÷ Shares Outstanding), offering price and redemption price per share | | $ | 12.20 | | | $ | 15.63 | |
| | | | | | | | | |
| Class N Shares: | | | | | | | | |
| Net Assets | | $ | 2,659,261 | | | $ | 8,146,107 | |
| Shares of beneficial interest outstanding ($0 par value, unlimited shares authorized) | | | 217,211 | | | | 520,424 | |
| Net asset value (Net Assets ÷ Shares Outstanding), offering price and redemption price per share | | $ | 12.24 | | | $ | 15.65 | |
See accompanying notes to financial statements.
| The Dynamic Funds |
| STATEMENTS OF OPERATIONS |
| For the Year Ended December 31, 2023 |
| | | Dynamic International | | | Dynamic U.S. | |
| | | Opportunity Fund | | | Opportunity Fund | |
| INVESTMENT INCOME | | | | | | | | |
| Dividends | | $ | 2,529,974 | | | $ | 2,454,387 | |
| Dividend income from affiliates | | | 329,324 | | | | — | |
| Interest | | | 735,273 | | | | 192,901 | |
| Securites Lending - Net of fees | | | 78,169 | | | | 19,988 | |
| TOTAL INVESTMENT INCOME | | | 3,672,740 | | | | 2,667,276 | |
| | | | | | | | | |
| EXPENSES | | | | | | | | |
| Investment advisory fees | | | 1,007,787 | | | | 1,285,956 | |
| Distribution (12b-1) fees: | | | | | | | | |
| Class N | | | 11,706 | | | | 21,063 | |
| Third party administrative services fees | | | 60,637 | | | | 89,291 | |
| Administration fees | | | 56,337 | | | | 65,194 | |
| Transfer agent fees | | | 40,639 | | | | 62,128 | |
| Fund accounting fees | | | 39,180 | | | | 50,315 | |
| Registration fees | | | 36,619 | | | | 35,341 | |
| Legal fees | | | 24,905 | | | | 25,093 | |
| Trustees’ fees | | | 28,906 | | | | 28,525 | |
| Shareholder reporting expense | | | 9,798 | | | | 13,489 | |
| Compliance officer fees | | | 15,655 | | | | 21,772 | |
| Audit fees | | | 15,797 | | | | 15,808 | |
| Custody fees | | | 10,619 | | | | 15,062 | |
| Insurance expense | | | 94 | | | | 150 | |
| Other expenses | | | 4,990 | | | | 4,274 | |
| TOTAL EXPENSES | | | 1,363,669 | | | | 1,733,461 | |
| | | | | | | | | |
| Less: Fees waived by the Adviser | | | (102,045 | ) | | | (117,206 | ) |
| | | | | | | | | |
| NET EXPENSES | | | 1,261,624 | | | | 1,616,255 | |
| NET INVESTMENT INCOME | | | 2,411,116 | | | | 1,051,021 | |
| | | | | | | | | |
| REALIZED AND UNREALIZED GAIN ON INVESTMENTS | | | | | | | | |
| Net realized gain from: | | | | | | | | |
| Investment transactions | | | 837,271 | | | | 1,187,528 | |
| Distributions of realized gains from underlying investment companies | | | 26,907 | | | | — | |
| | | | 864,178 | | | | 1,187,528 | |
| | | | | | | | | |
| Net change in unrealized appreciation on: | | | | | | | | |
| Unaffiliated investments | | | 6,090,988 | | | | 15,007,248 | |
| Affiliated investments | | | 1,043,179 | | | | — | |
| | | | 7,134,167 | | | | 15,007,248 | |
| | | | | | | | | |
| NET REALIZED AND UNREALIZED GAIN ON INVESTMENTS | | | 7,998,345 | | | | 16,194,776 | |
| | | | | | | | | |
| NET INCREASE IN NET ASSETS RESULTING FROM OPERATIONS | | $ | 10,409,461 | | | $ | 17,245,797 | |
See accompanying notes to financial statements.
| Dynamic International Opportunity Fund |
| STATEMENTS OF CHANGES IN NET ASSETS |
| | | For the Year Ended | | | For the Year Ended | |
| | | December 31, | | | December 31, | |
| | | 2023 | | | 2022 | |
| FROM OPERATIONS | | | | | | | | |
| Net investment income | | $ | 2,411,116 | | | $ | 1,153,737 | |
| Net realized gain from investment transactions | | | 837,271 | | | | 811,483 | |
| Distributions of realized gains from underlying investment companies | | | 26,907 | | | | — | |
| Net change in unrealized appreciation/(depreciation) of investments | | | 7,134,167 | | | | (17,324,429 | ) |
| Net increase/(decrease) in net assets resulting from operations | | | 10,409,461 | | | | (15,359,209 | ) |
| | | | | | | | | |
| DISTRIBUTIONS TO SHAREHOLDERS | | | | | | | | |
| From net investment income | | | | | | | | |
| Class I | | | (2,355,496 | ) | | | (1,115,370 | ) |
| Class N | | | (49,684 | ) | | | (86,943 | ) |
| Total distributions paid | | | (2,405,180 | ) | | | (1,202,313 | ) |
| | | | | | | | | |
| FROM SHARES OF BENEFICIAL INTEREST | | | | | | | | |
| Proceeds from shares sold | | | | | | | | |
| Class I | | | 16,306,392 | | | | 25,840,016 | |
| Class N | | | 1,171,980 | | | | 1,753,266 | |
| Net asset value of shares issued in reinvestment of distributions | | | | | | | | |
| Class I | | | 2,134,504 | | | | 1,034,546 | |
| Class N | | | 37,930 | | | | 67,547 | |
| Payments for shares redeemed | | | | | | | | |
| Class I | | | (11,193,009 | ) | | | (28,680,213 | ) |
| Class N | | | (7,528,886 | ) | | | (1,283,647 | ) |
| Net increase/(decrease) in net assets from shares of beneficial interest | | | 928,911 | | | | (1,268,485 | ) |
| | | | | | | | | |
| TOTAL INCREASE/(DECREASE) IN NET ASSETS | | | 8,933,192 | | | | (17,830,007 | ) |
| | | | | | | | | |
| NET ASSETS | | | | | | | | |
| Beginning of Year | | | 95,952,592 | | | | 113,782,599 | |
| End of Year | | $ | 104,885,784 | | | $ | 95,952,592 | |
See accompanying notes to financial statements.
| Dynamic International Opportunity Fund |
| STATEMENTS OF CHANGES IN NET ASSETS (Continued) |
| | | For the Year Ended | | | For the Year Ended | |
| | | December 31, | | | December 31, | |
| | | 2023 | | | 2022 | |
| SHARE ACTIVITY - CLASS I | | | | | | | | |
| Shares sold | | | 1,375,104 | | | | 2,204,539 | |
| Shares reinvested | | | 178,620 | | | | 92,288 | |
| Shares redeemed | | | (948,783 | ) | | | (2,457,493 | ) |
| Net increase/(decrease) in shares of beneficial interest outstanding | | | 604,941 | | | | (160,666 | ) |
| | | | | | | | | |
| SHARE ACTIVITY - CLASS N | | | | | | | | |
| Shares sold | | | 100,013 | | | | 150,322 | |
| Shares reinvested | | | 3,163 | | | | 6,015 | |
| Shares redeemed | | | (632,084 | ) | | | (108,186 | ) |
| Net increase/(decrease) in shares of beneficial interest outstanding | | | (528,908 | ) | | | 48,151 | |
See accompanying notes to financial statements.
| Dynamic U.S. Opportunity Fund |
| STATEMENTS OF CHANGES IN NET ASSETS |
| | | For the Year Ended | | | For the Year Ended | |
| | | December 31, | | | December 31, | |
| | | 2023 | | | 2022 | |
| FROM OPERATIONS | | | | | | | | |
| Net investment income | | $ | 1,051,021 | | | $ | 963,277 | |
| Net realized gain/(loss) from investment transactions | | | 1,187,528 | | | | (425,355 | ) |
| Net change in unrealized appreciation/(depreciation) of investments | | | 15,007,248 | | | | (8,444,900 | ) |
| Net increase/(decrease) in net assets resulting from operations | | | 17,245,797 | | | | (7,906,978 | ) |
| | | | | | | | | |
| DISTRIBUTIONS TO SHAREHOLDERS | | | | | | | | |
| From net investment income and net realized gains: | | | | | | | | |
| Class I | | | (1,031,339 | ) | | | (2,915,152 | ) |
| Class N | | | (57,869 | ) | | | (233,904 | ) |
| Total distributions paid | | | (1,089,208 | ) | | | (3,149,056 | ) |
| | | | | | | | | |
| FROM SHARES OF BENEFICIAL INTEREST | | | | | | | | |
| Proceeds from shares sold | | | | | | | | |
| Class I | | | 33,537,880 | | | | 65,715,297 | |
| Class N | | | 6,043,700 | | | | 3,033,264 | |
| Net asset value of shares issued in reinvestment of distributions | | | | | | | | |
| Class I | | | 746,850 | | | | 2,446,067 | |
| Class N | | | 53,104 | | | | 187,130 | |
| Payments for shares redeemed | | | | | | | | |
| Class I | | | (58,716,514 | ) | | | (39,471,949 | ) |
| Class N | | | (9,410,997 | ) | | | (2,532,063 | ) |
| Net increase/(decrease) in net assets from shares of beneficial interest | | | (27,745,977 | ) | | | 29,377,746 | |
| | | | | | | | | |
| TOTAL INCREASE/(DECREASE) IN NET ASSETS | | | (11,589,388 | ) | | | 18,321,712 | |
| | | | | | | | | |
| NET ASSETS | | | | | | | | |
| Beginning of Year | | | 126,727,828 | | | | 108,406,116 | |
| End of Year | | $ | 115,138,440 | | | $ | 126,727,828 | |
See accompanying notes to financial statements.
| Dynamic U.S. Opportunity Fund |
| STATEMENTS OF CHANGES IN NET ASSETS (Continued) |
| | | For the Year Ended | | | For the Year Ended | |
| | | December 31, | | | December 31, | |
| | | 2023 | | | 2022 | |
| SHARE ACTIVITY - CLASS I | | | | | | | | |
| Shares sold | | | 2,316,997 | | | | 4,710,503 | |
| Shares reinvested | | | 48,091 | | | | 180,922 | |
| Shares redeemed | | | (4,074,910 | ) | | | (2,814,443 | ) |
| Net increase/(decrease) in shares of beneficial interest outstanding | | | (1,709,822 | ) | | | 2,076,982 | |
| | | | | | | | | |
| SHARE ACTIVITY - CLASS N | | | | | | | | |
| Shares sold | | | 411,251 | | | | 214,121 | |
| Shares reinvested | | | 3,415 | | | | 13,821 | |
| Shares redeemed | | | (656,253 | ) | | | (177,418 | ) |
| Net increase/(decrease) in shares of beneficial interest outstanding | | | (241,587 | ) | | | 50,524 | |
See accompanying notes to financial statements.
| Dynamic International Opportunity Fund |
| FINANCIAL HIGHLIGHTS |
Per Share Data and Ratios for a Share of Beneficial Interest Outstanding Throughout Each Year/Period
| | | Class I | |
| | | Year Ended | | | Year Ended | | | Year Ended | | | Year Ended | | | Period* Ended | | | Year Ended | |
| | | December 31, | | | December 31, | | | December 31, | | | December 31, | | | December 31, | | | November 30, | |
| | | 2023 | | | 2022 | | | 2021 | | | 2020 | | | 2019 | | | 2019 | |
| Net asset value, beginning of year/period | | $ | 11.26 | | | $ | 13.18 | | | $ | 13.16 | | | $ | 10.43 | | | $ | 10.41 | | | $ | 10.47 | |
| Activity from investment operations: | | | | | | | | | | | | | | | | | | | | | | | | |
| Net investment income (1) | | | 0.29 | | | | 0.14 | | | | 0.12 | | | | 0.09 | | | | 0.10 | | | | 0.20 | |
| Net realized and unrealized gain/(loss) on investments | | | 0.94 | | | | (1.92 | ) | | | 0.02 | | | | 2.75 | | | | 0.10 | | | | (0.06 | ) |
| Total from investment operations | | | 1.23 | | | | (1.78 | ) | | | 0.14 | | | | 2.84 | | | | 0.20 | | | | 0.14 | |
| Less distributions from: | | | | | | | | | | | | | | | | | | | | | | | | |
| Net investment income | | | (0.29 | ) | | | (0.14 | ) | | | (0.12 | ) | | | (0.09 | ) | | | (0.17 | ) | | | (0.20 | ) |
| Return of capital | | | — | | | | — | | | | — | | | | (0.02 | ) | | | (0.01 | ) | | | — | |
| Total distributions | | | (0.29 | ) | | | (0.14 | ) | | | (0.12 | ) | | | (0.11 | ) | | | (0.18 | ) | | | (0.20 | ) |
| Paid in capital from redemption fees | | | — | | | | — | | | | — | | | | — | | | | — | | | | 0.00 | (6) |
| Net asset value, end of year/period | | $ | 12.20 | | | $ | 11.26 | | | $ | 13.18 | | | $ | 13.16 | | | $ | 10.43 | | | $ | 10.41 | |
| Total return (2) | | | 10.95 | % | | | (13.47 | )% | | | 1.05 | % | | | 27.20 | % | | | 1.91 | % (8) | | | 1.39 | % |
| Net assets, at end of year/period (000s) | | $ | 102,227 | | | $ | 87,534 | | | $ | 104,565 | | | $ | 102,191 | | | $ | 85,441 | | | $ | 84,257 | |
| Ratio of gross expenses to average net assets (3)(4) | | | 1.34 | % | | | 1.36 | % | | | 1.34 | % | | | 1.38 | % | | | 1.45 | % (7) | | | 1.41 | % |
| Ratio of net expenses to average net assets (4) | | | 1.24 | % | | | 1.24 | % | | | 1.24 | % | | | 1.24 | % | | | 1.24 | % (7) | | | 1.24 | % |
| Ratio of net investment income to average net assets (4)(5) | | | 2.46 | % | | | 1.17 | % | | | 0.91 | % | | | 0.82 | % | | | 11.59 | % (7) | | | 1.93 | % |
| Portfolio turnover rate | | | 62 | % | | | 115 | % | | | 54 | % | | | 180 | % | | | 0 | % (8) | | | 79 | % |
| * | For the period December 1, 2019 to December 31, 2019. Effective December 31, 2019, the Fund changed its fiscal year end. See Note 1. |
| (1) | Per share amounts calculated using the average shares method, which more appropriately presents the per share data for the year/period. |
| (2) | Total returns shown exclude the effect of applicable redemption fees. Had the Adviser not waived a portion of the Fund’s expenses, total returns would have been lower. |
| (3) | Represents the ratio of expenses to average net assets absent fee waivers and/or expense reimbursements by the Adviser. |
| (4) | Does not include the expenses of other investment companies in which the Fund invests. |
| (5) | Recognition of net investment income by the Fund is affected by the timing of declaration of dividends by the underlying investment companies in which the Fund invests. |
| (6) | Amount represents less than $0.005 per share. |
| (7) | Annualized for periods less than one full year. |
See accompanying notes to financial statements.
| Dynamic International Opportunity Fund |
| FINANCIAL HIGHLIGHTS |
Per Share Data and Ratios for a Share of Beneficial Interest Outstanding Throughout Each Year/Period
| | | Class N | |
| | | Year Ended | | | Year Ended | | | Year Ended | | | Year Ended | | | Period* Ended | | | Year Ended | |
| | | December 31, | | | December 31, | | | December 31, | | | December 31, | | | December 31, | | | November 30, | |
| | | 2023 | | | 2022 | | | 2021 | | | 2020 | | | 2019 | | | 2019 | |
| Net asset value, beginning of year/period | | $ | 11.28 | | | $ | 13.21 | | | $ | 13.18 | | | $ | 10.46 | | | $ | 10.40 | | | $ | 10.45 | |
| Activity from investment operations: | | | | | | | | | | | | | | | | | | | | | | | | |
| Net investment income (1) | | | 0.12 | | | | 0.12 | | | | 0.09 | | | | 0.07 | | | | 0.10 | | | | 0.18 | |
| Net realized and unrealized gain/(loss) on investments | | | 1.07 | | | | (1.93 | ) | | | 0.02 | | | | 2.73 | | | | 0.10 | | | | (0.07 | ) |
| Total from investment operations | | | 1.19 | | | | (1.81 | ) | | | 0.11 | | | | 2.80 | | | | 0.20 | | | | 0.11 | |
| Less distributions from: | | | | | | | | | | | | | | | | | | | | | | | | |
| Net investment income | | | (0.23 | ) | | | (0.12 | ) | | | (0.08 | ) | | | (0.06 | ) | | | (0.13 | ) | | | (0.16 | ) |
| Return of capital | | | — | | | | — | | | | — | | | | (0.02 | ) | | | (0.01 | ) | | | — | |
| Total distributions | | | (0.23 | ) | | | (0.12 | ) | | | (0.08 | ) | | | (0.08 | ) | | | (0.14 | ) | | | (0.16 | ) |
| Paid in capital from redemption fees | | | — | | | | — | | | | — | | | | — | | | | — | | | | 0.00 | (6) |
| Net asset value, end of year/period | | $ | 12.24 | | | $ | 11.28 | | | $ | 13.21 | | | $ | 13.18 | | | $ | 10.46 | | | $ | 10.40 | |
| Total return (2) | | | 10.61 | % | | | (13.72 | )% | | | 0.86 | % | | | 26.78 | % | | | 1.95 | % (8) | | | 1.09 | % |
| Net assets, at end of year/period (000s) | | $ | 2,659 | | | $ | 8,418 | | | $ | 9,217 | | | $ | 8,791 | | | $ | 7,052 | | | $ | 7,822 | |
| Ratio of gross expenses to average net assets (3)(4) | | | 1.61 | % | | | 1.61 | % | | | 1.59 | % | | | 1.63 | % | | | 1.70 | % (7) | | | 1.68 | % |
| Ratio of net expenses to average net assets (4) | | | 1.49 | % | | | 1.49 | % | | | 1.49 | % | | | 1.49 | % | | | 1.49 | % (7) | | | 1.49 | % |
| Ratio of net investment income to average net assets (4)(5) | | | 1.01 | % | | | 0.99 | % | | | 0.65 | % | | | 0.60 | % | | | 10.88 | % (7) | | | 1.83 | % |
| Portfolio turnover rate | | | 62 | % | �� | | 115 | % | | | 54 | % | | | 180 | % | | | 0 | % (8) | | | 79 | % |
| * | For the period December 1, 2019 to December 31, 2019. Effective December 31, 2019, the Fund changed its fiscal year end. See Note 1. |
| (1) | Per share amounts calculated using the average shares method, which more appropriately presents the per share data for the year/period. |
| (2) | Total returns shown exclude the effect of applicable redemption fees. Had the Adviser not waived a portion of the Fund’s expenses, total returns would have been lower. |
| (3) | Represents the ratio of expenses to average net assets absent fee waivers and/or expense reimbursements by the Adviser. |
| (4) | Does not include the expenses of other investment companies in which the Fund invests. |
| (5) | Recognition of net investment income by the Fund is affected by the timing of declaration of dividends by the underlying investment companies in which the Fund invests. |
| (6) | Amount represents less than $0.005 per share. |
| (7) | Annualized for periods less than one full year. |
See accompanying notes to financial statements.
| Dynamic U.S. Opportunity Fund |
| FINANCIAL HIGHLIGHTS |
Per Share Data and Ratios for a Share of Beneficial Interest Outstanding Throughout Each Year/Period
| | | Class I | |
| | | Year Ended | | | Year Ended | | | Year Ended | | | Year Ended | | | Period* Ended | | | Year Ended | |
| | | December 31, | | | December 31, | | | December 31, | | | December 31, | | | December 31, | | | November 30, | |
| | | 2023 | | | 2022 | | | 2021 | | | 2020 | | | 2019 | | | 2019 | |
| Net asset value, beginning of year/period | | $ | 13.60 | | | $ | 15.08 | | | $ | 13.71 | | | $ | 12.21 | | | $ | 12.04 | | | $ | 12.31 | |
| Activity from investment operations: | | | | | | | | | | | | | | | | | | | | | | | | |
| Net investment income (1) | | | 0.12 | | | | 0.12 | | | | 0.01 | | | | 0.05 | | | | 0.07 | | | | 0.13 | |
| Net realized and unrealized gain/(loss) on investments | | | 2.06 | | | | (1.25 | ) | | | 2.18 | | | | 2.24 | | | | 0.16 | | | | 0.83 | |
| Total from investment operations | | | 2.18 | | | | (1.13 | ) | | | 2.19 | | | | 2.29 | | | | 0.23 | | | | 0.96 | |
| Less distributions from: | | | | | | | | | | | | | | | | | | | | | | | | |
| Net investment income | | | (0.15 | ) | | | (0.11 | ) | | | (0.01 | ) | | | (0.11 | ) | | | (0.06 | ) | | | (0.09 | ) |
| Net realized gains | | | — | | | | (0.24 | ) | | | (0.81 | ) | | | (0.68 | ) | | | — | | | | (1.14 | ) |
| Total distributions | | | (0.15 | ) | | | (0.35 | ) | | | (0.82 | ) | | | (0.79 | ) | | | (0.06 | ) | | | (1.23 | ) |
| Paid in capital from redemption fees | | | — | | | | — | | | | — | | | | — | | | | — | | | | 0.00 | (6) |
| Net asset value, end of year/period | | $ | 15.63 | | | $ | 13.60 | | | $ | 15.08 | | | $ | 13.71 | | | $ | 12.21 | | | $ | 12.04 | |
| Total return (2) | | | 16.05 | % | | | (7.50 | )% | | | 16.19 | % | | | 18.86 | % (9) | | | 1.91 | % (8)(9) | | | 10.33 | % |
| Net assets, at end of year/period (000s) | | $ | 106,992 | | | $ | 116,352 | | | $ | 97,667 | | | $ | 74,289 | | | $ | 44,768 | | | $ | 44,097 | |
| Ratio of gross expenses to average net assets (3)(4) | | | 1.33 | % | | | 1.35 | % | | | 1.36 | % | | | 1.42 | % | | | 1.40 | % (7) | | | 1.42 | % |
| Ratio of net expenses to average net assets (4) | | | 1.24 | % | | | 1.24 | % | | | 1.24 | % | | | 1.24 | % | | | 1.24 | % (7) | | | 1.24 | % |
| Ratio of net investment income to average net assets (4)(5) | | | 0.83 | % | | | 0.83 | % | | | 0.04 | % | | | 0.40 | % | | | 6.50 | % (7) | | | 1.13 | % |
| Portfolio turnover rate | | | 70 | % | | | 184 | % | | | 95 | % | | | 306 | % | | | 13 | % (8) | | | 223 | % |
| * | For the period December 1, 2019 to December 31, 2019. Effective December 31, 2019, the Fund changed its fiscal year end. See Note 1. |
| (1) | Per share amounts calculated using the average shares method, which more appropriately presents the per share data for the year/period. |
| (2) | Total returns shown exclude the effect of applicable redemption fees. Had the Adviser not waived a portion of the Fund’s expenses, total returns would have been lower. |
| (3) | Represents the ratio of expenses to average net assets absent fee waivers and/or expense reimbursements by the Adviser. |
| (4) | Does not include the expenses of other investment companies in which the Fund invests. |
| (5) | Recognition of net investment income by the Fund is affected by the timing of declaration of dividends by the underlying investment companies in which the Fund invests. |
| (6) | Amount represents less than $0.005 per share. |
| (7) | Annualized for periods less than one full year. |
| (9) | Includes adjustments in accordance with accounting principles generally accepted in the United States and consequently, the net asset value for financial statement reporting purposes and the returns based upon those net assets may differ from the net asset values and returns for shareholder processing. |
See accompanying notes to financial statements.
| Dynamic U.S. Opportunity Fund |
| FINANCIAL HIGHLIGHTS |
Per Share Data and Ratios for a Share of Beneficial Interest Outstanding Throughout Each Year/Period
| | | Class N | |
| | | Year Ended | | | Year Ended | | | Year Ended | | | Year Ended | | | Period* Ended | | | Year Ended | |
| | | December 31, | | | December 31, | | | December 31, | | | December 31, | | | December 31, | | | November 30, | |
| | | 2023 | | | 2022 | | | 2021 | | | 2020 | | | 2019 | | | 2019 | |
| Net asset value, beginning of year/period | | $ | 13.62 | | | $ | 15.09 | | | $ | 13.74 | | | $ | 12.25 | | | $ | 12.05 | | | $ | 12.30 | |
| Activity from investment operations: | | | | | | | | | | | | | | | | | | | | | | | | |
| Net investment income/(loss) (1) | | | 0.08 | | | | 0.08 | | | | (0.03 | ) | | | 0.01 | | | | 0.06 | | | | 0.10 | |
| Net realized and unrealized gain/(loss) on investments | | | 2.06 | | | | (1.23 | ) | | | 2.19 | | | | 2.25 | | | | 0.17 | | | | 0.84 | |
| Total from investment operations | | | 2.14 | | | | (1.15 | ) | | | 2.16 | | | | 2.26 | | | | 0.23 | | | | 0.94 | |
| Less distributions from: | | | | | | | | | | | | | | | | | | | | | | | | |
| Net investment income | | | (0.11 | ) | | | (0.08 | ) | | | — | | | | (0.09 | ) | | | (0.03 | ) | | | (0.05 | ) |
| Net realized gains | | | — | | | | (0.24 | ) | | | (0.81 | ) | | | (0.68 | ) | | | — | | | | (1.14 | ) |
| Total distributions | | | (0.11 | ) | | | (0.32 | ) | | | (0.81 | ) | | | (0.77 | ) | | | (0.03 | ) | | | (1.19 | ) |
| Paid in capital from redemption fees | | | — | | | | — | | | | — | | | | — | | | | — | | | | 0.00 | (6) |
| Net asset value, end of year/period | | $ | 15.65 | | | $ | 13.62 | | | $ | 15.09 | | | $ | 13.74 | | | $ | 12.25 | | | $ | 12.05 | |
| Total return (2) | | | 15.73 | % | | | (7.66 | )% | | | 15.92 | % | | | 18.46 | % (9) | | | 1.88 | % (8) | | | 10.10 | % |
| Net assets, at end of year/period (000s) | | $ | 8,146 | | | $ | 10,375 | | | $ | 10,739 | | | $ | 9,616 | | | $ | 7,200 | | | $ | 7,186 | |
| Ratio of gross expenses to average net assets (3)(4) | | | 1.58 | % | | | 1.60 | % | | | 1.62 | % | | | 1.67 | % | | | 1.65 | % (7) | | | 1.70 | % |
| Ratio of net expenses to average net assets (4) | | | 1.49 | % | | | 1.49 | % | | | 1.49 | % | | | 1.49 | % | | | 1.49 | % (7) | | | 1.49 | % |
| Ratio of net investment income/(loss) to average net assets (4)(5) | | | 0.58 | % | | | 0.55 | % | | | (0.21 | )% | | | 0.11 | % | | | 6.24 | % (7) | | | 0.90 | % |
| Portfolio turnover rate | | | 70 | % | | | 184 | % | | | 95 | % | | | 306 | % | | | 13 | % (8) | | | 223 | % |
| * | For the period December 1, 2019 to December 31, 2019. Effective December 31, 2019, the Fund changed its fiscal year end. See Note 1. |
| (1) | Per share amounts calculated using the average shares method, which more appropriately presents the per share data for the year/period |
| (2) | Total returns shown exclude the effect of applicable redemption fees. Had the Adviser not waived a portion of the Fund’s expenses, total returns would have been lower. |
| (3) | Represents the ratio of expenses to average net assets absent fee waivers and/or expense reimbursements by the Adviser. |
| (4) | Does not include the expenses of other investment companies in which the Fund invests. |
| (5) | Recognition of net investment income/(loss) by the Fund is affected by the timing of declaration of dividends by the underlying investment companies in which the Fund invests. |
| (6) | Amount represents less than $0.005 per share. |
| (7) | Annualized for periods less than one full year. |
| (9) | Includes adjustments in accordance with accounting principles generally accepted in the United States and consequently, the net asset value for financial statement reporting purposes and the returns based upon those net assets may differ from the net asset values and returns for shareholder processing. |
See accompanying notes to financial statements.
The Dynamic Funds
NOTES TO FINANCIAL STATEMENTS
December 31, 2023
The Dynamic International Opportunity Fund (“DIOF”) and Dynamic U.S. Opportunity Fund (“DUOF”), (each a “Fund” and collectively the “Funds”), are each a diversified series of shares of beneficial interest of Northern Lights Fund Trust II (the “Trust”), a statutory trust organized under the laws of the State of Delaware on August 26, 2010, and are registered under the Investment Company Act of 1940, as amended (the “1940 Act”), as open-end management investment companies. The Funds commenced operations on December 30, 2011. The Funds are “fund of funds” in that each Fund will generally invest in other investment companies. The Funds seek long term capital appreciation.
The Funds currently offer Class I shares and Class N shares. Class I and Class N shares are offered at net asset value without an initial sales charge. Class N shares are subject to a 0.25% Rule 12b-1 distribution and shareholder servicing fee. Each class represents an interest in the same assets of the Fund and classes are identical except for differences in any applicable sales charge structures and ongoing service and distribution charges. All classes of shares have equal voting privileges except that each class has exclusive voting rights with respect to its shareholder service and/or distribution plans.
Effective December 31, 2019, the Funds changed their fiscal year-end from November 30 to December 31 for operational efficiencies.
| 2. | SIGNIFICANT ACCOUNTING POLICIES |
The following is a summary of significant accounting policies followed by the Funds in preparation of their financial statements. The policies are in conformity with accounting principles generally accepted in the United States of America (“GAAP”). The preparation of financial statements requires management to make estimates and assumptions that affect the reported amounts of assets and liabilities and disclosure of contingent assets and liabilities at the date of the financial statements and the reported amounts of income and expenses for the period. Actual results could differ from those estimates. Each Fund is an investment company and accordingly follows the investment company accounting and reporting guidance of the Financial Accounting Standards Board (“FASB”) Accounting Standard Codification Topic 946 “Financial Services – Investment Companies.”
Security Valuation – Securities listed on an exchange are valued at the last reported sale price at the close of the regular trading session of the primary exchange on the business day the value is being determined, or in the case of securities listed on NASDAQ at the NASDAQ Official Closing Price (“NOCP”). In the absence of a sale such securities shall be valued at the mean between the current bid and ask prices on the day of valuation. Investments valued in currencies other than the U.S. dollar are converted to U.S. dollars using exchange rates obtained from pricing services. Short-term debt obligations having 60 days or less remaining until maturity, at time of purchase, may be valued at amortized cost.
The Dynamic Funds
NOTES TO FINANCIAL STATEMENTS (Continued)
December 31, 2023
Valuation of Fund of Funds – The Funds may invest in portfolios of open-end or closed-end investment companies. Open-end funds are valued at their respective net asset values as reported by such investment companies. Open-ended funds value securities in their portfolios for which market quotations are readily available at their market values (generally the last reported sale price) and all other securities and assets at their fair value by the methods established by the Boards of the underlying funds. The shares of many closed-end investment companies, after their initial public offering, frequently trade at a price per share, which may be different than the net asset value per share. The difference represents a market premium or market discount of such shares. There can be no assurances that the market discount or market premium on shares of any closed-end investment company purchased by the Funds will not change.
The Funds may hold securities, such as private investments, interests in commodity pools, other non-traded securities or temporarily illiquid securities, for which market quotations are not readily available or are determined to be unreliable. These securities are valued using the “fair value” procedures approved by the Board. The Board has designated the adviser as its valuation designee (the “Valuation Designee”) to execute these procedures. The Board may also enlist third party consultants such as a valuation specialist at a public accounting firm, valuation consultant or financial officer of a security issuer on an as-needed basis to assist the Valuation Designee in determining a security-specific fair value. The Board is responsible for reviewing and approving fair value methodologies utilized by the Valuation Designee, approval of which shall be based upon whether the Valuation Designee followed the valuation procedures established by the Board.
Fair Valuation Process – The applicable investments are valued by the Valuation Designee pursuant to valuation procedures established by the Board. For example, fair value determinations are required for the following securities: (i) securities for which market quotations are insufficient or not readily available on a particular business day (including securities for which there is a short and temporary lapse in the provision of a price by the regular pricing source); (ii) securities for which, in the judgment of the Valuation Designee, the prices or values available do not represent the fair value of the instrument; factors which may cause the Valuation Designee to make such a judgment include, but are not limited to, the following: only a bid price or an asked price is available; the spread between bid and asked prices is substantial; the frequency of sales; the thinness of the market; the size of reported trades; and actions of the securities markets, such as the suspension or limitation of trading; (iii) securities determined to be illiquid; and (iv) securities with respect to which an event that affects the value thereof has occurred (a “significant event”) since the closing prices were established on the principal exchange on which they are traded, but prior to a Fund’s calculation of its net asset value. Specifically, interests in commodity pools or managed futures pools are valued on a daily basis by reference to the closing market prices of each futures contract or other asset held by a pool, as adjusted for pool expenses. Restricted or illiquid securities, such as private investments or non-traded securities are valued based upon the current bid for the security from two or more independent dealers or other parties reasonably familiar with the facts and circumstances of the security (who should take into consideration all relevant factors as may be appropriate under the circumstances). If a current bid from such independent dealers or other independent parties is unavailable, the Valuation Designee shall determine the fair value of such security using the following factors: (i) the type of security; (ii) the cost at date of purchase; (iii) the size and nature of the Fund’s holdings; (iv) the discount from market value of unrestricted securities of the same class at the time of purchase and
The Dynamic Funds
NOTES TO FINANCIAL STATEMENTS (Continued)
December 31, 2023
subsequent thereto; (v) information as to any transactions or offers with respect to the security; (vi) the nature and duration of restrictions on disposition of the security and the existence of any registration rights; (vii) how the yield of the security compares to similar securities of companies of similar or equal creditworthiness; (viii) the level of recent trades of similar or comparable securities; (ix) the liquidity characteristics of the security; (x) current market conditions; and (xi) the market value of any securities into which the security is convertible or exchangeable.
The Funds utilize various methods to measure fair value of all of their investments on a recurring basis. GAAP establishes the hierarchy that prioritizes inputs to valuation methods. The three levels of input are:
Level 1 – Unadjusted quoted prices in active markets for identical assets and liabilities that the Funds have the ability to access.
Level 2 – Observable inputs other than quoted prices included in Level 1 that are observable for the asset or liability, either directly or indirectly. These inputs may include quoted prices for the identical instrument in an inactive market, prices for similar instruments, interest rates, prepayment speeds, credit risk, yield curves, default rates and similar data.
Level 3 – Unobservable inputs for the asset or liability, to the extent relevant observable inputs are not available, representing the Funds’ own assumptions about the assumptions a market participant would use in valuing the asset or liability, and would be based on the best information available.
The availability of observable inputs can vary from security to security and is affected by a wide variety of factors, including, for example, the type of security, whether the security is new and not yet established in the marketplace, the liquidity of markets, and other characteristics particular to the security. To the extent that valuation is based on models or inputs that are less observable or unobservable in the market, the determination of fair value requires more judgment. Accordingly, the degree of judgment exercised in determining fair value is greatest for instruments categorized in Level 3.
The inputs used to measure fair value may fall into different levels of the fair value hierarchy. In such cases, for disclosure purposes, the level in the fair value hierarchy within which the fair value measurement falls in its entirety, is determined based on the lowest level input that is significant to the fair value measurement in its entirety.
The Dynamic Funds
NOTES TO FINANCIAL STATEMENTS (Continued)
December 31, 2023
The inputs or methodology used for valuing securities are not necessarily an indication of the risk associated with investing in those securities. The following tables summarize the inputs used as of December 31, 2023 for each Fund’s assets measured at fair value:
| Dynamic International Opportunity Fund |
| Assets* | | Level 1 | | | Level 2 | | | Level 3 | | | Total | |
| Exchange-Traded Funds | | $ | 89,693,855 | | | $ | — | | | $ | — | | | $ | 89,693,855 | |
| Short-Term Investments | | | 34,008,957 | | | | — | | | | — | | | | 34,008,957 | |
| Total | | $ | 123,702,812 | | | $ | — | | | $ | — | | | $ | 123,702,812 | |
| | | | | | | | | | | | | | | | | |
| Dynamic U.S. Opportunity Fund |
| Assets * | | Level 1 | | | Level 2 | | | Level 3 | | | Total | |
| Exchange-Traded Funds | | $ | 113,415,691 | | | $ | — | | | $ | — | | | $ | 113,415,691 | |
| Short-Term Investment | | | 17,015,139 | | | | — | | | | — | | | | 17,015,139 | |
| Total | | $ | 130,430,830 | | | $ | — | | | $ | — | | | $ | 130,430,830 | |
The Funds did not hold any Level 3 securities during the year ended December 31, 2023.
| * | See each Fund’s Schedule of Investments for classification. |
Security Transactions and Related Income – Security transactions are accounted for on trade date. Interest income is recognized on an accrual basis. Discounts are accreted and premiums are amortized on securities purchased over the lives of the respective securities. Dividend income is recorded on the ex-dividend date. Non-cash dividends are included in dividend income on the ex-date at the fair market value of the shares received. Realized gains or losses from sales of securities are determined by comparing the identified cost of the security lot sold with the net sales proceeds. The Funds’ income, expenses (other than class specific distribution fees) and realized and unrealized gains and losses are allocated proportionately each day based upon the relative net assets of each class.
Dividends and Distributions to Shareholders – Dividends from net investment income, if any, are declared and paid annually. Distributable net realized capital gains, if any, are declared and distributed annually in December. Dividends from net investment income and distributions from net realized gains are determined in accordance with Federal income tax regulations, which may differ from GAAP. These “book/tax” differences are considered either temporary (i.e., deferred losses) or permanent in nature. To the extent these differences are permanent in nature, such amounts are reclassified within the composition of net assets based on their Federal tax-basis treatment; temporary differences do not require reclassification. Dividends and distributions to shareholders are recorded on ex-dividend date.
Federal Income Taxes – The Funds intend to continue to comply with the requirements of the Internal Revenue Code applicable to regulated investment companies and to distribute all of their taxable income to their shareholders. Therefore, no provision for Federal income tax is required. The Funds recognize the tax benefits of uncertain tax positions only where the position is “more likely than not” to be sustained assuming examination by tax authorities. Management has analyzed each Fund’s tax positions and has concluded that no liability for unrecognized tax benefits should be recorded
The Dynamic Funds
NOTES TO FINANCIAL STATEMENTS (Continued)
December 31, 2023
related to uncertain tax positions taken on returns filed for open tax years ended December 31, 2020 to December 31, 2022, or expected to be taken in either Fund’s December 31, 2023 tax returns.
The Funds have identified their major tax jurisdictions as U.S. Federal, Ohio and foreign jurisdictions where the Funds make significant investments. The Funds are not aware of any tax positions for which it is reasonably possible that the total amounts of unrecognized tax benefits will change materially in the next twelve months.
Exchange Traded Funds – The Funds invest in exchange traded funds (“ETFs”). ETFs are a type of index fund bought and sold on a securities exchange. An ETF trades like common stock and represents a fixed portfolio of securities designed to track the performance and dividend yield of a particular domestic or foreign market index. The risks of owning an ETF generally reflect the risks of owning the underlying securities they are designed to track, although the lack of liquidity on an ETF could result in it being more volatile. Additionally, ETFs have fees and expenses that reduce their value.
Expenses – Expenses of the Trust that are directly identifiable to a specific fund are charged to that fund. Expenses, which are not readily identifiable to a specific fund, are allocated in such a manner as deemed equitable, taking into consideration the nature and type of expense and the relative sizes of the funds in the Trust.
Indemnification – The Trust indemnifies its officers and Trustees for certain liabilities that may arise from the performance of their duties to the Trust. Additionally, in the normal course of business, the Funds enter into contracts that contain a variety of representations and warranties and which provide general indemnities. The Funds’ maximum exposure under these arrangements is unknown, as this would involve future claims that may be made against the Funds that have not yet occurred. However, based on experience, the Funds expect the risk of loss due to these warranties and indemnities to be remote.
3. INVESTMENT TRANSACTIONS
For the year ended December 31, 2023, cost of purchases and proceeds from sales of portfolio securities, other than short-term investments, amounted to:
| | | | Purchases | | | Sales | |
| | DIOF | | | $ | 65,542,377 | | | $ | 52,411,566 | |
| | DUOF | | | | 88,195,900 | | | | 118,034,783 | |
The Funds have entered into a securities lending arrangement with U.S. Bank National Association (the “Borrower”). Under the terms of the agreement, the Funds were authorized to loan securities to the Borrower. In exchange, the Funds received cash collateral in the amount of at least 102% of the value of the securities loaned. Securities lending income, net of fees, is disclosed in the DIOF’s and DUOF’s
The Dynamic Funds
NOTES TO FINANCIAL STATEMENTS (Continued)
December 31, 2023
Statements of Operations. Although risk was mitigated by the collateral, the Funds could have experienced a delay in recovering their securities and possible loss of income or value if the Borrower failed to return such securities on loan.
Gain or loss in the fair value of securities loaned that may occur during the term of the loan will be recognized by DIOF and DUOF. DIOF and DUOF have the right under the securities lending agreement to recover the securities from the Borrower on demand. If the fair value of the collateral falls below 102% plus accrued interest of the loaned securities, the lender’s agent shall request additional collateral from the Borrower to bring the collateralization back to 102%. Under the terms of the securities lending agreement, the DIOF and DUOF are indemnified for such losses by the security lending agreement. Should the borrower of the securities fail financially, the Funds have the right to repurchase the securities using the collateral in the open market.
The following table represents financial instruments that are subject to enforceable netting arrangements as of December 31, 2023.
| | | | | | | | | | Gross Amounts not Offset in the
Statements of Assets and Liabilities | | | | |
Gross Amount of
Recognized
Assets | | | Gross Amounts offset
in the Statements of
Assets and Liabilities | | | Net Amounts of Assets
Presented in the
Statements of Assets and
Liabilities | | | Financial
Instruments | | | Cash Collateral
Pledged | | | Net Amount | |
| $ | 17,007,596 | | | $ | — | | | $ | 17,007,596 | | | $ | 17,007,596 | | | $ | — | | | $ | 17,007,596 | |
| $ | 14,828,300 | | | $ | — | | | $ | 14,828,300 | | | $ | 14,828,300 | | | $ | — | | | $ | 14,828,300 | |
The following table breaks out the holdings pledged as collateral as of December 31, 2023:
Secured Borrowings
Securities Lending Transactions
Overnight and Continuous
| DIOF | | | |
| Mount Vernon Liquid Assets Portfolio | | $ | 17,007,596 | |
| | | $ | 17,007,596 | |
| DUOF | | | | |
| Mount Vernon Liquid Assets Portfolio | | $ | 14,828,300 | |
| | | $ | 14,828,300 | |
.
| 5. | INVESTMENT ADVISORY AGREEMENT AND TRANSACTIONS WITH RELATED PARTIES |
Innealta Capital, LLC (the “Adviser”) serves as investment adviser to the Funds. Pursuant to an Advisory Agreement with the Funds, the Adviser, under the oversight of the Board, directs the daily operations of the Funds and supervises the performance of administrative and professional services
The Dynamic Funds
NOTES TO FINANCIAL STATEMENTS (Continued)
December 31, 2023
provided by others. As compensation for its services and the related expenses borne by the Adviser, each Fund pays the Adviser a management fee, computed and accrued daily and paid monthly, at an annual rate of 1.00% of such Fund’s average daily net assets.
For the year ended December 31, 2023, the Adviser earned the following:
| DIOF | | | DUOF | |
| $ | 1,007,787 | | | $ | 1,285,956 | |
Pursuant to a written contract (the “Waiver Agreement”), the Adviser has agreed, at least until April 30, 2025, to waive a portion of its advisory fee and has agreed to reimburse DIOF and DUOF for other expenses to the extent necessary so that the total expenses incurred by such Fund (excluding any front-end or contingent deferred sales loads, brokerage fees and commissions, acquired fund fees and expenses, borrowing costs (such as interest and dividend expense on securities sold short), taxes and extraordinary expenses such as litigation) do not exceed the following:
| | | Class I | | | Class N | |
| DIOF | | | 1.24 | % | | | 1.49 | % |
| DUOF | | | 1.24 | % | | | 1.49 | % |
If the Adviser waives any fee or reimburses any expenses pursuant to the Waiver Agreement for a Fund, and such Fund’s operating expenses are subsequently lower than its respective expense limitation, the Adviser shall be entitled to reimbursement by the Fund subject to the limitation that: (1) the reimbursement for fees and expenses will be made only if payable within three years from the date the fees and expenses were initially waived or reimbursed; and (2) the reimbursement may not be made if it would cause the expense limitation in effect at the time of the waiver or currently in effect, whichever is lower, to be exceeded. If such Fund’s operating expenses subsequently exceed the expense limitation, the reimbursements for such Fund shall be suspended. Expenses may only be reimbursed to the extent they were waived or paid after the date of the Waiver Agreement (or any similar agreement). The Board may terminate this expense reimbursement arrangement at any time. For the year ended December 31, 2023, the Adviser waived the following expenses:
| DIOF | | | DUOF | |
| $ | 102,045 | | | $ | 117,206 | |
The following amounts are subject to recapture by the Funds by the following dates:
| | | | 12/31/2024 | | | 12/31/2025 | | | 12/31/2026 | |
| DIOF | | | $ | 118,488 | | | $ | 120,203 | | | $ | 102,045 | |
| DUOF | | | $ | 122,993 | | | $ | 126,906 | | | $ | 117,206 | |
As of December 31, 2023, $130,063 and $114,884 in waived advisory fees expired unrecouped for DIOF and DUOF, respectively.
Distributor - The distributor for the Funds is Northern Lights Distributors, LLC (the “Distributor”). The Board has adopted the Trust’s Master Distribution and Shareholder Servicing Plans for Class N shares
The Dynamic Funds
NOTES TO FINANCIAL STATEMENTS (Continued)
December 31, 2023
(the “Plan”) pursuant to Rule 12b-1 under the 1940 Act to pay for ongoing distribution-related activities or shareholder services. Under the Plan, each Fund is permitted to pay a fee at an annual rate of 0.25% of the average daily net assets of Class N shares. For the year ended December 31, 2023, pursuant to the Class N Plan, DIOF paid $11,706 in 12b-1 fees and DUOF paid $21,063 in 12b-1 fees.
The Distributor acts as the Funds’ principal underwriter in a continuous public offering of the Funds’ shares.
In addition, certain affiliates of the Distributor provide services to the Funds as follows:
Ultimus Fund Solutions, LLC (“UFS”) – an affiliate of the Distributor, provides administration, fund accounting, and transfer agent services to the Trust. Pursuant to separate servicing agreements with UFS, the Funds pay UFS customary fees for providing administration, fund accounting, and transfer agency services to the Funds. Certain officers of the Trust are also officers of UFS and are not paid any fees directly by the Funds for serving in such capacities.
Northern Lights Compliance Services, LLC (“NLCS”) – an affiliate of UFS and the Distributor, provides a Chief Compliance Officer to the Trust, as well as related compliance services, pursuant to a consulting agreement between NLCS and the Trust. Under the terms of such agreement, NLCS receives customary fees from the Funds.
Blu Giant, LLC (“Blu Giant”) – an affiliate of UFS and the Distributor, provides EDGAR conversion and filing services as well as print management services for the Funds on an ad-hoc basis. For the provision of these services, Blu Giant receives customary fees from the Funds.
| 6. | INVESTMENT IN AFFILIATED COMPANIES |
An affiliated company is a company in which a Fund has ownership of at least 5% of the voting securities. Transactions for DIOF during the year ended December 31, 2023 with affiliated companies are as follows:
| | | | | | | | | | | | | | | | | | | | | | | | | | | | |
| CUSIP | | | Description | | Value-Beginning of
Year/Period | | | Purchases | | | Sales Proceeds | | | Net Realized
Gain | | | Change in
Unrealized
Appreciation/
(Depreciation) | | | Value-End of Year | | | Shares-End of
Year/Period | | | Dividends Credited to
Income | |
| 35473P843 | | | | Franklin FTSE Australia ETF * | | $ | 1,447,670 | | | $ | — | | | $ | — | | | $ | — | | | $ | 122,632 | | | $ | 1,570,302 | | | | 55,200 | | | $ | 56,812 | |
| 35473P785 | Franklin FTSE Germany ETF | | | 2,320,163 | | | | — | | | | — | | | | — | | | | 475,655 | | | | 2,795,818 | | | | 120,789 | | | | 83,631 | |
| 35473P777 | Franklin FTSE Hong Kong ETF | | | 1,379,783 | | | | — | | | | — | | | | — | | | | (208,231 | ) | | | 1,171,552 | | | | 64,394 | | | | 63,229 | |
| 35473P728 | Franklin FTSE Russia ETF | | | 698 | | | | — | | | | — | | | | — | | | | — | | | | 698 | | | | 69,765 | | | | — | |
| 35473P694 | Franklin FTSE Switzerland ETF | | | 4,667,340 | | | | — | | | | — | | | | — | | | | 653,123 | | | | 5,320,463 | | | | 160,500 | | | | 125,652 | |
| | | | | Total | | $ | 9,815,654 | | | | | | | | | | | | | | | $ | 1,043,179 | | | $ | 10,858,833 | | | | | | | $ | 329,324 | |
The Dynamic Funds
NOTES TO FINANCIAL STATEMENTS (Continued)
December 31, 2023
| 7. | AGGREGATE UNREALIZED APPRECIATION AND DEPRECIATION – TAX BASIS |
The identified cost of investments in securities owned by each Fund for federal income tax purposes, and its respective gross unrealized appreciation and depreciation at December 31, 2023, were as follows:
| | | | | | | Gross | | | Gross | | | Net Unrealized | |
| | | | Tax | | | Unrealized | | | Unrealized | | | Appreciation/ | |
| | | | Cost | | | Appreciation | | | Depreciation | | | (Depreciation) | |
| DIOF | | | $ | 121,305,069 | | | $ | 7,866,958 | | | $ | (5,469,215 | ) | | $ | 2,397,743 | |
| DUOF | | | | 106,800,755 | | | | 24,160,303 | | | | (530,228 | ) | | | 23,630,075 | |
| 8. | DISTRIBUTIONS TO SHAREHOLDERS AND TAX COMPONENTS OF CAPITAL |
The tax character of fund distributions paid for the year ended December 31, 2023 and December 31, 2022, and were as follows:
| For the year ended December 31, 2023: |
| | | Ordinary | | | Long-Term | | | | |
| Portfolio | | Income | | | Capital Gains | | | Total | |
| DIOF | | $ | 2,405,180 | | | $ | — | | | | $2,405,180 | |
| DUOF | | | 1,089,208 | | | | — | | | | 1,089,208 | |
| | | | | | | | | | | | | |
| For the year ended December 3 1,2022: |
| | | Ordinary | | | Long-Term | | | | |
| Portfolio | | Income | | | Capital Gains | | | Total | |
| DIOF | | $ | 1,202,313 | | | $ | — | | | $ | 1,202,313 | |
| DUOF | | | 1,609,983 | | | | 1,539,073 | | | | 3,149,056 | |
As of December 31, 2023, the components of accumulated earnings on a tax basis were as follows:
| | | | Undistributed | | | Undistributed | | | Undistributed | | | Post October Loss | | | Capital Loss | | | Other | | | Unrealized | | | Total | |
| | | | Ordinary | | | Ordinary | | | Long-Term | | | and | | | Carry | | | Book/Tax | | | Appreciation/ | | | Accumulated | |
| Portfolio | | | Tax-Exempt Income | | | Income | | | Capital Gains | | | Late Year Loss | | | Forwards | | | Differences | | | (Depreciation) | | | Earnings/(Deficit) | |
| DIOF | | | $ | — | | | $ | 5,936 | | | $ | — | | | $ | — | | | $ | (1,504,225 | ) | | $ | — | | | $ | 2,397,743 | | | $ | 899,454 | |
| DUOF | | | | — | | | | 114,537 | | | | — | | | | — | | | | — | | | | — | | | | 23,630,075 | | | | 23,744,612 | |
The difference between book basis and tax basis undistributed net investment income, accumulated net realized gain, and unrealized appreciation from investments is primarily attributable to the tax deferral of losses on wash sales.
The Dynamic Funds
NOTES TO FINANCIAL STATEMENTS (Continued)
December 31, 2023
At December 31, 2023, DIOF had capital loss carry forwards for federal income tax purposes available to offset future capital gains, along with capital loss carry forwards utilized as follows:
| | | | Non-Expiring | | | | | | | |
| Portfolio | | | Short-Term | | | Long-Term | | | Total | | | CLCF | |
| | DIOF | | | $ | 1,504,225 | | | $ | — | | | $ | 1,504,225 | | | $ | 864,178 | |
| 9. | FOREIGN TAX CREDIT (Unaudited) |
DIOF intends to elect to pass through to shareholders the income tax credit for taxes paid to foreign countries. Foreign source income and foreign tax expense per outstanding share as of fiscal year ended December 31, 2023 and December 31, 2022, were as follows:
For fiscal year ended
December 31, 2023 | | Foreign Taxes Paid | | | Foreign Source Income | |
| DIOF | | $ | 0.0266 | | | $ | 0.2802 | |
| | | | | | | | | |
For fiscal year ended
December 31, 2022 | | Foreign Taxes Paid | | | Foreign Source Income | |
| DIOF | | $ | 0.0140 | | | $ | 0.1466 | |
The beneficial ownership, either directly or indirectly, of more than 25% of the voting securities of a Fund creates presumption of control of the Fund, under Section 2(a)(9) of the 1940 Act. As of December 31, 2023, beneficial ownership in excess of 25% for the Funds is as follows:
| | | % of Outstanding | |
| Beneficial Owner | | Shares | |
| DIOF | | | |
| NFS | | | 62.4 | % |
| | | | | |
| DUOF | | | | |
| LPL Financial | | | 28.4 | % |
The Dynamic Funds
NOTES TO FINANCIAL STATEMENTS (Continued)
December 31, 2023
| 11. | RECENT REGULATORY UPDATES |
On January 24, 2023, the SEC adopted rule and form amendments to require mutual funds and ETFs to transmit concise and visually engaging streamlined annual and semiannual reports to shareholders that highlight key information. Other information, including financial statements, will not appear in a streamlined shareholder report but must be available online, delivered free of charge upon request, and filed on a semiannual basis on Form N-CSR. The rule and form amendments have a compliance date of July 24, 2024. At this time, management is evaluating the impact of these amendments on the shareholder reports for the Fund.
Subsequent events after the date of the Statements of Assets and Liabilities have been evaluated through the date the financial statements were issued. Management has determined that no events or transactions occurred requiring adjustment or disclosure in the financial statements.

REPORT OF INDEPENDENT REGISTERED PUBLIC ACCOUNTING FIRM
To the Shareholders of Dynamic International Opportunity Fund and Dynamic U.S. Opportunity Fund and Board of Trustees of Northern Lights Fund Trust II
Opinion on the Financial Statements
We have audited the accompanying statements of assets and liabilities, including the schedules of investments, of Dynamic International Opportunity Fund and Dynamic U.S. Opportunity Fund (the “Funds”), each a series of Northern Lights Fund Trust II, as of December 31, 2023, the related statements of operations and changes in net assets for the year then ended, and the related notes and the financial highlights for the year then ended (collectively referred to as the “financial statements”). In our opinion, the financial statements present fairly, in all material respects, the financial position of each of the Funds as of December 31, 2023, the results of their operations, the changes in net assets, and the financial highlights for the year then ended, in conformity with accounting principles generally accepted in the United States of America.
The Funds’ financial statements and financial highlights for the years or periods ended December 31, 2022, and prior, were audited by other auditors whose report dated March 1, 2023, expressed an unqualified opinion on those financial statements and financial highlights.
Basis for Opinion
These financial statements are the responsibility of the Funds’ management. Our responsibility is to express an opinion on the Funds’ financial statements based on our audits. We are a public accounting firm registered with the Public Company Accounting Oversight Board (United States) (“PCAOB”) and are required to be independent with respect to the Funds in accordance with the U.S. federal securities laws and the applicable rules and regulations of the Securities and Exchange Commission and the PCAOB.
We conducted our audits in accordance with the standards of the PCAOB. Those standards require that we plan and perform the audit to obtain reasonable assurance about whether the financial statements are free of material misstatement whether due to error or fraud. Our audits included performing procedures to assess the risks of material misstatement of the financial statements, whether due to error or fraud, and performing procedures that respond to those risks. Such procedures included examining, on a test basis, evidence regarding the amounts and disclosures in the financial statements. Our procedures included confirmation of securities owned as of December 31, 2023, by correspondence with the custodians and brokers. Our audits also included evaluating the accounting principles used and significant estimates made by management, as well as evaluating the overall presentation of the financial statements. We believe that our audits provide a reasonable basis for our opinion.
We have served as the Funds’ auditor since 2023.

COHEN & COMPANY, LTD.
Philadelphia, Pennsylvania
February 26, 2024
COHEN & COMPANY, LTD.
800.229.1099 | 866.818.4538 fax | cohencpa.com
Registered with the Public Company Accounting Oversight Board
The Dynamic Funds
EXPENSE EXAMPLES (Unaudited)
December 31, 2023
As a shareholder of Dynamic International Opportunity Fund and Dynamic U.S. Opportunity Fund, you incur two types of costs: (1) transaction costs; and (2) ongoing costs, including advisory fees; distribution and/or service (12b-1) fees; and other Fund expenses. This example is intended to help you understand your ongoing costs (in dollars) of investing in Dynamic International Opportunity Fund and Dynamic U.S. Opportunity Fund and to compare these costs with the ongoing costs of investing in other mutual funds.
The example is based on an investment of $1,000 invested at the beginning of the period and held for the entire period from July 1, 2023 through December 31, 2023.
Actual Expenses
The “Actual Expenses” line in the table below provides information about actual account values and actual expenses. You may use the information below together with the amount you invested, to estimate the expenses that you paid over the period. Simply divide your account value by $1,000 (for example, an $8,600 account value divided by $1,000 = 8.6), then multiply the result by the number in the table under the heading entitled “Expenses Paid During Period” to estimate the expenses you paid on your account during this period.
Hypothetical Example for Comparison Purposes
The “Hypothetical” line in the table below provides information about hypothetical account values and hypothetical expenses based on the Funds’ actual expense ratios and an assumed rate of return of 5% per year before expenses, which are not the Funds’ actual returns. The hypothetical account values and expenses may not be used to estimate the actual ending account balances or expenses you paid for the period. You may use this information to compare this 5% hypothetical example with the 5% hypothetical examples that appear in the shareholder reports of other funds.
Please note that the expenses shown in the table are meant to highlight your ongoing costs only and do not reflect any transactional costs. Therefore, the table is useful in comparing ongoing costs only, and will not help you determine the relative total costs of owning different funds. In addition, if these transactional costs were included, your costs would have been higher.
| | | Beginning | | | Ending Account | | | Expenses Paid | | | Expense Ratio | |
| | | Account Value | | | Value | | | During Period * | | | During Period ** | |
| Actual | | 7/1/2023 | | | 12/31/2023 | | | 7/1/23-12/31/23 | | | 7/1/23-12/31/23 | |
| Dynamic International Opportunity Fund | | | | | | | | | | | | | | | | |
| | Class I | $ | 1,000.00 | | | $ | 1,041.10 | | | $ | 6.38 | | | | 1.24 | % |
| | Class N | | 1,000.00 | | | | 1,039.70 | | | | 7.66 | | | | 1.49 | % |
| Dynamic U.S. Opportunity Fund | | | | | | | | | | | | | | | | |
| | Class I | $ | 1,000.00 | | | $ | 1,052.90 | | | $ | 6.42 | | | | 1.24 | % |
| | Class N | | 1,000.00 | | | | 1,051.50 | | | | 7.70 | | | | 1.49 | % |
| Hypothetical (5% return before Expenses) | | | | | | | | | | | | | | | | |
| Dynamic International Opportunity Fund | | | | | | | | | | | | | | | | |
| | Class I | $ | 1,000.00 | | | $ | 1,018.95 | | | $ | 6.31 | | | | 1.24 | % |
| | Class N | | 1,000.00 | | | | 1,017.69 | | | | 7.58 | | | | 1.49 | % |
| Dynamic U.S. Opportunity Fund | | | | | | | | | | | | | | | | |
| | Class I | $ | 1,000.00 | | | $ | 1,018.95 | | | $ | 6.31 | | | | 1.24 | % |
| | Class N | | 1,000.00 | | | | 1,017.69 | | | | 7.58 | | | | 1.49 | % |
| * | Expenses are equal to the average account value over the period, multiplied by the Fund’s annualized expense ratio, multiplied by the number of days in the period (184) divided by the number of days in the fiscal year (365). |
The Dynamic Funds
SUPPLEMENTAL INFORMATION (Unaudited)
December 31, 2023
FACTORS CONSIDERED BY THE TRUSTEES IN THE APPROVAL OF THE RENEWAL OF THE INVESTMENT ADVISORY AGREEMENT
At a Regular meeting (the “Meeting”) of the Board of Trustees (the “Board”) of Northern Lights Fund Trust II (the “Trust”) held on October 25, 2023, the Board, including the disinterested Trustees (the “Independent Trustees”), considered the renewal of the Investment Advisory Agreement between the Trust, on behalf of the Dynamic International Opportunity Fund (“Dynamic International”) and the Dynamic U.S. Opportunity Fund (“Dynamic U.S.” and together with Dynamic International, the “Dynamic Funds”) and Innealta Capital, LLC (“Innealta”) (the “Innealta Advisory Agreement”).
Based on their evaluation of the information provided by Innealta in conjunction with each Dynamic Fund’s other service providers, the Board, by a unanimous vote (including a separate vote of the Independent Trustees), approved the renewal of the Innealta Advisory Agreement with respect to each Dynamic Fund.
In advance of the Meeting, the Board requested and received materials to assist them in considering the renewal of the Innealta Advisory Agreement. The materials provided contained information with respect to the factors enumerated below, including the Innealta Advisory Agreement, a memorandum prepared by the Trust’s outside legal counsel discussing in detail the Trustees’ fiduciary obligations and the factors they should assess in considering the continuation of the Innealta Advisory Agreement and comparative information relating to the advisory fee and other expenses of each of the Dynamic Funds. The materials also included due diligence materials relating to Innealta (including due diligence questionnaires completed by Innealta, select financial information of Innealta, bibliographic information regarding Innealta’s key management and investment advisory personnel, and comparative fee information relating to each of the Dynamic Funds) and other pertinent information. At the Meeting, the Independent Trustees were advised by counsel that is experienced in Investment Company Act of 1940 matters and that is independent of fund management and met with such counsel separately from fund management.
The Board reviewed and discussed the written materials that were provided in advance of the Meeting and deliberated on the renewal of the Innealta Advisory Agreement with respect to each of the Dynamic Funds. The Board relied upon the advice of independent legal counsel and their own business judgment in determining the material factors to be considered in evaluating the Innealta Advisory Agreement and the weight to be given to each such factor. The conclusions reached by the Board were based on a comprehensive evaluation of all of the information provided and were not the result of any one factor. Moreover, each Trustee may have afforded different weight to the various factors in reaching his conclusions with respect to the Innealta Advisory Agreement. In considering the approval of the renewal of the Innealta Advisory Agreement, the Board reviewed and analyzed various factors that they determined were relevant, including the factors enumerated below.
The Dynamic Funds
SUPPLEMENTAL INFORMATION (Unaudited)(Continued)
December 31, 2023
Nature, Extent and Quality of Services. The Board reviewed materials provided by Innealta related to the proposed renewal of the Innealta Advisory Agreement, including Innealta’s Form ADV and related schedules, a description of the manner in which investment decisions are made and executed, a review of the personnel performing services for each of Dynamic U.S. and Dynamic International, including the team of individuals that primarily monitor and execute the investment process. The Board discussed Innealta’s research capabilities, the quality of Innealta’s compliance infrastructure and the experience of its management personnel. Additionally, the Board received satisfactory responses from the representative of Innealta with respect to a series of important questions, including: whether Innealta was involved in any lawsuits or pending regulatory actions; whether the management of other accounts would conflict with its management of Dynamic U.S. and Dynamic International; whether there were procedures in place to adequately allocate trades among Innealta’s respective clients; and whether Innealta’s CCO would routinely review the portfolio managers’ performance of their duties to ensure compliance under Innealta’s compliance program. The Board also reviewed the information provided on the practices for monitoring compliance with each of Dynamic U.S. and Dynamic International’s investment limitations. The Board also discussed details of Innealta’s compliance program with the CCO of the Trust. The Board noted that the CCO of the Trust continued to represent that Innealta’s policies and procedures were reasonably designed to prevent violations of applicable federal securities laws. The Board also noted Innealta’s representation that the prospectus and statement of additional information for Dynamic U.S. and Dynamic International accurately describe such Fund’s investment strategies. The Board then reviewed the capitalization of Innealta based on financial information provided, and representations made by Innealta and its representatives, and concluded that Innealta was sufficiently well-capitalized, or Innealta’s owners had the ability to make additional contributions, in order to meet its obligations to each of Dynamic U.S. and Dynamic International. The Board concluded that Innealta had sufficient quality and depth of personnel, resources, investment methods and compliance policies and procedures essential to performing its duties under the Innealta Advisory Agreement and that the nature, overall quality and extent of the management services to be provided by Innealta to each of Dynamic U.S. and Dynamic International were satisfactory.
Performance. The Board then discussed the reports prepared by Broadridge and reviewed the performance of Dynamic U.S. and Dynamic International as compared to its respective peer group, Morningstar category and benchmark for the one-year, three-year, five-year and since inception periods ended September 30, 2023. The Board noted that Dynamic International outperformed the peer group median, but underperformed the Morningstar category median and its benchmark (the MSCI ACWI ex USA Index (USD)) for the one-year period, underperformed the peer group median, Morningstar category median and benchmark for the three-year and since inception periods, but outperformed the peer group median, Morningstar category median and benchmark for the five-year period. The Board noted Dynamic International’s tactical approach and lower risk profile and improved performance over the last year. Regarding Dynamic U.S., the Board noted that Dynamic U.S. outperformed its peer group median and Morningstar category median (the Tactical Allocation category) but underperformed its benchmark (the S&P 500 Total Return Index) for the one-year, three-year, five-year and since inception periods. The Board noted the portfolio managers’ ability to manage risk and the robust investment team. After further discussion, the
The Dynamic Funds
SUPPLEMENTAL INFORMATION (Unaudited)(Continued)
December 31, 2023
Board concluded that the past performance of each of Dynamic U.S. and Dynamic International was acceptable and generally in line with its risk level.
Fees and Expenses. As to the costs of the services to be provided by Innealta, the Board reviewed and discussed each of Dynamic U.S. and Dynamic International’s advisory fee and total operating expenses as compared to its respective peer group and Morningstar category as presented in the Broadridge Report. The Board reviewed the contractual arrangements, noting that Innealta charges an advisory fee at an annual rate of 1.00% of the average daily net assets of each of Dynamic U.S. and Dynamic International under the Innealta Advisory Agreement. The Board noted that the advisory fee for Dynamic International was at the top of its peer group and Morningstar category while the advisory fee for Dynamic U.S. was slightly above the Morningstar category median and equal to the peer group median. The Board also reviewed the net expenses for each of Dynamic U.S. and Dynamic International as compared to its peer group and Morningstar category noting that Fund assets were well below the Morningstar category average and many funds in its peer group which likely contributed to higher net expenses for Dynamic International. The Board noted that Dynamic International was likely not benefiting from economies of scale like some of its peers. The Board then reviewed the Operating Expenses Limitation Agreement noting that Innealta had agreed to waive or limit its advisory fee and/or reimburse expenses at least until April 30, 2025, in order to limit net annual operating expenses, exclusive of certain fees, so as not to exceed 1.49% and 1.24% of Dynamic U.S. and Dynamic International’s average net assets for Class N and Class I Shares, respectively, and found such arrangements to be beneficial to shareholders. The Board concluded that, based on Innealta’s experience, expertise and services provided to each of Dynamic U.S. and Dynamic International, the advisory fee charged by Innealta for each of Dynamic U.S. and Dynamic International was not unreasonable and, while the advisory fee for Dynamic International was the highest in its peer group and Morningstar category, it was similar to another fund in the upper range in its peer group and Morningstar category.
Profitability. The Board also considered the level of profits that could be expected to accrue to Innealta with respect to each of Dynamic U.S. and Dynamic International based on profitability reports and analyses prepared by Innealta and reviewed by the Board and the selected financial information of Innealta provided by Innealta. After review and discussion, the Board concluded that the anticipated profit from Innealta’s relationship with each of Dynamic U.S. and Dynamic International was not excessive.
Economies of Scale. As to the extent to which each of Dynamic U.S. and Dynamic International would realize economies of scale as it grew, and whether the fee levels reflect these economies of scale for the benefit of investors, the Board discussed the current size of each of Dynamic U.S. and Dynamic International, and Innealta’s expectations for growth, and concluded that any material economies of scale would likely not be achieved in the near term.
Conclusion. The Board relied upon the advice of counsel, and their own business judgment in determining the material factors to be considered in evaluating the Innealta Advisory Agreement and the weight to be given to each such factor. Accordingly, having requested and received such information from Innealta as the Board believed to be reasonably necessary to evaluate the terms of the Innealta Advisory Agreement, and as assisted by the advice of independent counsel, the
The Dynamic Funds
SUPPLEMENTAL INFORMATION (Unaudited)(Continued)
December 31, 2023
Board, including a majority of the Independent Trustees voting separately, determined that with respect to each of the Dynamic Funds separately, (a) the terms of the Innealta Advisory Agreement are not unreasonable; (b) the investment advisory fee is not unreasonable; and (c) the Innealta Advisory Agreement is in the best interests of each of the Dynamic Funds and its shareholders. In considering the renewal of the Innealta Advisory Agreement, the Board did not identify any one factor as all important, but rather considered these factors collectively and determined that the renewal of the Innealta Advisory Agreement was in the best interest of each of the Dynamic Funds and its shareholders. Moreover, the Board noted that each Trustee may have afforded different weight to the various factors in reaching his conclusions with respect to the Innealta Advisory Agreement.
The Dynamic Funds
LIQUIDITY RISK MANAGEMENT PROGRAM (Unaudited)
December 31, 2023
The Funds have adopted and implemented a written liquidity risk management program as required by Rule 22e-4 (the “Liquidity Rule”) under the 1940 Act. The program is reasonably designed to assess and manage each Fund’s liquidity risk, taking into consideration, among other factors, the respective Fund’s investment strategy and the liquidity of its portfolio investments during normal and reasonably foreseeable stressed conditions; its short and long-term cash flow projections; and its cash holdings and access to other funding sources.
During the fiscal period ended December 31, 2023, the Trust’s Liquidity Risk Management Program Committee (the “Committee”) reviewed each Fund’s investments and determined that the Funds held adequate levels of cash and highly liquid investments to meet shareholder redemption activities in accordance with applicable requirements. Accordingly, the Committee concluded that (i) the Funds’ liquidity risk management program is reasonably designed to prevent violations of the Liquidity Rule and (ii) the Funds’ liquidity risk management program has been effectively implemented.
The Dynamic Funds
SUPPLEMENTAL INFORMATION (Unaudited)
December 31, 2023
The Trustees and the officers of the Trust are listed below with their present positions with the Trust and principal occupations over at least the last five years. The business address of each Trustee and Officer is 225 Pictoria Drive, Suite 450, Cincinnati, OH 45246. All correspondence to the Trustees and Officers should be directed to c/o Ultimus Fund Solutions, LLC, P.O. Box 541150, Omaha, Nebraska 68154.
Independent Trustees
Name and
Year of Birth | Position/Term of
Office* | Principal Occupation
During the Past Five Years | Number of
Portfolios in
Fund
Complex
Overseen by
Trustee** | Other Directorships held by
Trustee
During the Past Five Years |
Brian Nielsen
1972 | Trustee Since May 2011 | Trustee of Northern Lights Fund Trust II (since 2011); Special Projects Counsel of NorthStar Financial Services Group, LLC (from 2018 to 2019). | 4 | NONE |
Thomas T. Sarkany
1946 | Trustee Since October 2011 | President, TTS Consultants, LLC (financial services) (since 2010); President, TTS Associates, Inc. (financial services) (since December 2022). | 4 | Director, Aquila Distributors; Trustee, Arrow ETF Trust; Trustee, Arrow Investments Trust; Trustee, Northern Lights Fund Trust IV |
Anthony H. Lewis
1946 | Trustee Since May 2011 | Chairman and CEO of The Lewis Group USA (executive consulting firm) (since 2007). | 4 | Director, Member of the Compensation Committee and Member of the Risk Committee of Torotel Inc. (Magnetics, Aerospace and Defense), Trustee, Chairman of the Fair Valuation Committee and Member of the Audit Committee of the Wildermuth Endowment Strategy Fund |
Keith Rhoades
1948 | Trustee Since May 2011 | Retired since 2008. | 4 | NONE |
Randal D. Skalla
1962 | Trustee Since May 2011 | President, L5 Enterprises, Inc. (financial services company) (since 2001). | 4 | NONE |
The Dynamic Funds
SUPPLEMENTAL INFORMATION (Unaudited)
December 31, 2023
Officers
Name and
Year of Birth | Position/Term of
Office* | Principal Occupation
During the Past Five Years | Number of
Portfolios in
Fund
Complex
Overseen by
Trustee** | Other Directorships held by Trustee
During the Past Five Years |
Kevin E. Wolf
1969 | President Since January 2013 | Vice President of The Ultimus Group, LLC; Executive Vice President, Head of Fund Administration and Product (since 2019) and President (2012 - 2019) of Ultimus Fund Solutions, LLC (formerly, Gemini Fund Services, LLC). | N/A | N/A |
Erik Naviloff
1968 | Treasurer Since January 2013 | Vice President of Ultimus Fund Solutions, LLC (formerly, Gemini Fund Services, LLC) (since 2011). | N/A | N/A |
Jared Lahman
1986 | Anti-Money Laundering Officer since January 2022 | Compliance Analyst, Northern Lights Compliance Services, LLC (since January 2019). | N/A | N/A |
Emile R. Molineaux
1962 | Chief Compliance Officer Since May 2011 | Senior Compliance Officer and CCO of Various clients of Northern Lights Compliance Services, LLC (since 2011). | N/A | N/A |
| * | The term of office for each Trustee and Officer listed above will continue indefinitely. |
| ** | As of December 31, 2023, the Trust was comprised of 24 active portfolios managed by unaffiliated investment advisers. The term “Fund Complex” applies only to the Funds and the Acclivity Md Cap Multi-Style Fund and the Acclivity Small Cap Value Fund, and not to any |
The Dynamic Funds
SUPPLEMENTAL INFORMATION (Unaudited)
December 31, 2023
other series of the Trust. The Funds do not hold themselves out as related to any other series within the Trust for investment purposes, nor do they share the same investment adviser with any other series.
The Fund’s SAI includes additional information about the Trustees and is available free of charge, upon request, by calling toll-free at 1-855-USE-ETFS.
Privacy Policy
Rev. May 2021
| FACTS | WHAT DOES NORTHERN LIGHTS FUND TRUST II (“NLFT II”) DO WITH YOUR PERSONAL INFORMATION? |
| Why? | Financial companies choose how they share your personal information. Federal law gives consumers the right to limit some but not all sharing. Federal law also requires us to tell you how we collect, share, and protect your personal information. Please read this notice carefully to understand what we do. |
| What? | The types of personal information we collect and share depend on the product or service you have with us. This information can include:
|
● Social Security number ● Employment information ● Account balances | ● Account transactions ● Income ● Investment experience |
When you are no longer our customer, we continue to share your information as described in this notice. |
| How? | All financial companies need to share a customer’s personal information to run their everyday business - to process transactions, maintain customer accounts, and report to credit bureaus. In the section below, we list the reasons financial companies can share their customer’s personal information; the reasons NLFT II chooses to share; and whether you can limit this sharing. |
| | |
| Reasons we can share your personal information | Does NLFT II
share? | Can you limit
this sharing? |
For our everyday business purposes —
such as to process your transactions, maintain your account(s), respond to court orders and legal investigations, or report to credit bureaus
| Yes | No |
For our marketing purposes —
to offer our products and services to you
| Yes | No |
For joint marketing with other financial companies
| Yes | No |
For our affiliates’ everyday business purposes —
information about your transactions and experiences
| Yes | No |
For our affiliates’ everyday business purposes —
information about your creditworthiness
| No | We don’t share |
For nonaffiliates to market to you
| No | We don’t share |
| Questions? | Call 1-631-490-4300 |
| | |
| Who we are |
| Who is providing this notice? | Northern Lights Fund Trust II |
| What we do |
| How does NLFT II protect my personal information? | To protect your personal information from unauthorized access and use, we use security measures that comply with federal law. These measures include computer safeguards and secured files and buildings.
|
| How does NLFT II collect my personal information? | We collect your personal information, for example, when you
|
● open an account ● give us your income information ● provide employment information | ● provide account information ● give us your contact information |
| We also collect your personal information from others, such as credit bureaus, affiliates, or other companies. |
| Why can’t I limit all sharing? | Federal law gives you the right to limit only ● sharing for affiliates’ everyday business purposes—information about your creditworthiness ● affiliates from using your information to market to you ● sharing for nonaffiliates to market to you State laws and individual companies may give you additional rights to limit sharing. |
| Definitions |
| Affiliates | Companies related by common ownership or control. They can be financial and nonfinancial companies. ● NLFT II has no affiliates. |
| Nonaffiliates | Companies not related by common ownership or control. They can be financial and nonfinancial companies. ● NLFT II does not share with nonaffiliates so they can market to you. |
| Joint marketing | A formal agreement between nonaffiliated financial companies that together market financial products and services to you. ● Our joint marketing partners include other financial service companies. |
PROXY VOTING POLICY
Information regarding how the Funds voted proxies relating to portfolio securities for the most recent twelve month period ended June 30 as well as a description of the policies and procedures that the Funds use to determine how to vote proxies is available without charge, upon request, by calling 1-855 -USE-ETFS or by referring to the Securities and Exchange Commission’s (“SEC”) website at http://www.sec.gov.
PORTFOLIO HOLDINGS
Funds file a complete schedule of portfolio holdings with the Securities and Exchange Commission (the “SEC”) for the first and third quarters of each fiscal year as an exhibit to its reports on Form N-PORT, within sixty days after the end of the period. Form N-PORT reports are available at the SEC’s website at www.sec.gov.
INVESTMENT ADVISER
Innealta Capital, LLC
12117 FM 2244, Building 3, Suite 170
Austin, Texas 78738
ADMINISTRATOR
Ultimus Fund Solutions, LLC
225 Pictoria Drive, Suite 450
Cincinnati, OH 45246
Dynamic-AR-23
(a) Include a copy of the report transmitted to stockholders pursuant to Rule 30e-1 under the Act (17 CFR 270.30e-1).
(b) Include a copy of each notice transmitted to stockholders in reliance on Rule 30e-3 under the Act (17 CFR 270.30e-3) that contains disclosures specified by paragraph (c)(3) of that rule.
Item 2. Code of Ethics.
(a) As of the end of the period covered by this report, the registrant has adopted a code of ethics that applies to the registrant's principal executive officer, principal financial officer, principal accounting officer or controller, or persons performing similar functions, regardless of whether these individuals are employed by the registrant or a third party.
(b) For purposes of this item, “code of ethics” means written standards that are reasonably designed to deter wrongdoing and to promote:
| (1) | Honest and ethical conduct, including the ethical handling of actual or apparent conflicts of interest between personal and professional relationships; |
| (2) | Full, fair, accurate, timely, and understandable disclosure in reports and documents that a registrant files with, or submits to, the Commission and in other public communications made by the registrant; |
(3) Compliance with applicable governmental laws, rules, and regulations;
| (4) | The prompt internal reporting of violations of the code to an appropriate person or persons identified in the code; and |
(5) Accountability for adherence to the code.
(c) Amendments: During the period covered by the report, there have not been any amendments to the provisions of the code of ethics.
(d) Waivers: During the period covered by the report, the registrant has not granted any express or implicit waivers from the provisions of the code of ethics.
(e) The Code of Ethics is not posted on Registrant’ website.
(f) A copy of the Code of Ethics is attached as an exhibit.
Item 3. Audit Committee Financial Expert.
(a) The Registrant’s board of trustees has determined that Keith Rhoades is an audit committee financial expert, as defined in Item 3 of Form N-CSR. Mr. Rhoades is independent for purposes of this Item.
Item 4. Principal Accountant Fees and Services.
12/31/2023 – $ 25,000
12/31/2022 – $ 24,000
12/31/2021 – $ 24,000
12/31/2023 – None
12/31/2022 – None
12/31/2021 – None
12/31/2023 – $ 6,000
12/31/2022 – $ 6,000
12/31/2021 – $ 4,400
Preparation of Federal & State income tax returns, assistance with calculation of required income, capital gain and excise distributions and preparation of Federal excise tax returns.
12/31/2023 – None
12/31/2022 – None
12/31/2021 – None
| (e) | (1) Audit Committee’s Pre-Approval Policies |
The registrant’s Audit Committee is required to pre-approve all audit services and, when appropriate, any non-audit services (including audit-related, tax and all other services) to the registrant. The registrant’s Audit Committee also is required to pre-approve, when appropriate, any non-audit services (including audit-related, tax and all other services) to its adviser, or any entity controlling, controlled by or under common control with the adviser that provides ongoing services to the registrant, to the extent that the services may be determined to have an impact on the operations or financial reporting of the registrant. Services are reviewed on an engagement by engagement basis by the Audit Committee.
| (2) | Percentages of Services Approved by the Audit Committee |
12/31/23 12/31/22 12/31/21
Audit-Related Fees: 0.00% 0.00% 0.00%
Tax Fees: 0.00% 0.00% 0.00%
All Other Fees: 0.00% 0.00% 0.00%
| (f) | During the audit of registrant's financial statements for the most recent fiscal year, less than 50 percent of the hours expended on the principal accountant's engagement were attributed to work performed by persons other than the principal accountant's full-time, permanent employees. |
| (g) | The aggregate non-audit fees billed by the registrant's accountant for services rendered to the registrant, and rendered to the registrant's investment adviser (not including any sub-adviser whose role is primarily portfolio management and is subcontracted with or overseen by another investment adviser), and any entity controlling, controlled by, or under common control with the adviser that provides ongoing services to the registrant: |
12/31/2023 – $ 6,000
12/31/2022 – $ 6,000
12/31/2021 – $ 4,400
| (h) | The registrant's audit committee has considered whether the provision of non-audit services to the registrant's investment adviser (not including any sub-adviser whose role is primarily portfolio management and is subcontracted with or overseen by another investment adviser), and any entity controlling, controlled by, or under common control with the investment adviser that provides ongoing services to the registrant, that were not pre-approved pursuant to paragraph (c)(7)(ii) of Rule 2-01 of Regulation S-X, is compatible with maintaining the principal accountant's independence. |
Item 5. Audit Committee of Listed Companies. Not applicable to open-end investment companies.
Item 6. Schedule of Investments. See Item 1.
Item 7. Disclosure of Proxy Voting Policies and Procedures for Closed-End Funds. Not applicable to open-end investment companies.
Item 8. Portfolio Managers of Closed-End Management Investment Companies. Not applicable to open-end investment companies.
Item 9. Purchases of Equity Securities by Closed-End Funds. Not applicable to open-end investment companies.
Item 10. Submission of Matters to a Vote of Security Holders. None
Item 11. Controls and Procedures.
(a) Based on an evaluation of the Registrant’s disclosure controls and procedures as of a date within 90 days of filing date of this Form N-CSR, the principal executive officer and principal financial officer of the Registrant have concluded that the disclosure controls and procedures of the Registrant are reasonably designed to ensure that the information required in filings on Form N-CSR is recorded, processed, summarized, and reported by the filing date, including that information required to be
disclosed is accumulated and communicated to the Registrant’s management, including the Registrant’s principal executive officer and principal financial officer, as appropriate to allow timely decisions regarding required disclosure.
(b) There were no significant changes in the Registrant’s internal control over financial reporting that occurred during the period covered by this report that have materially affected, or are reasonably likely to materially affect, the Registrant’s internal control over financial reporting.
Item 12. Disclosure of Securities Lending Activities for Closed-End Management Investment Companies. Not applicable to open-end investment companies.
Item 13. Exhibits.
(a)(1) Code of Ethics herewith.
(a)(2) Certifications required by Section 302 of the Sarbanes-Oxley Act of 2002 (and Item 11(a)(2) of Form N-CSR) are filed herewith.
(a)(3) Not applicable for open-end investment companies.
(b) Certifications required by Section 906 of the Sarbanes-Oxley Act of 2002 (and Item 11(b) of Form N-CSR) are filed herewith.
SIGNATURES
Pursuant to the requirements of the Securities Exchange Act of 1934 and the Investment Company Act of 1940, the registrant has duly caused this report to be signed on its behalf by the undersigned, thereunto duly authorized.
(Registrant) Northern Lights Fund Trust II
By (Signature and Title)
/s/ Kevin E. Wolf
Kevin E. Wolf, Principal Executive Officer/President
Date 3/7/24
Pursuant to the requirements of the Securities Exchange Act of 1934 and the Investment Company Act of 1940, this report has been signed below by the following persons on behalf of the registrant and in the capacities and on the dates indicated.
By (Signature and Title)
/s/ Kevin E. Wolf
Kevin E. Wolf, Principal Executive Officer/President
Date 3/7/24
By (Signature and Title)
/s/ Erik Naviloff
Erik Naviloff, Principal Financial Officer/ Treasurer
Date 3/7/24