united states
securities and exchange commission
washington, d.c. 20549
form n-csr
certified shareholder report of registered
management investment companies
| Investment Company Act file number | 811-22549 | |
Northern Lights Fund Trust II
(Exact name of registrant as specified in charter)
| 225 Pictoria Drive, Suite 450 Cincinnati, OH | | 45246 |
| (Address of principal executive offices) | | (Zip code) |
The Corporation Trust Company
1209 Orange Street Wilmington, DE 19801
(Name and address of agent for service)
| Registrant’s telephone number, including area code: | (631) 490-4300 | |
| Date of fiscal year end: | 11/30 | |
| | | |
| Date of reporting period: | 11/30/2024 | |
Item 1. Reports to Stockholders.
Annual Shareholder Report - November 30, 2024
This annual shareholder report contains important information about North Star Bond Fund for the period of December 1, 2023 to November 30, 2024. You can find additional information about the Fund at www.nsinvestfunds.com. You can also request this information by contacting us at 1-855-580-0900.
What were the Fund’s costs for the last year?
(based on a hypothetical $10,000 investment)
| Class Name | Costs of a $10,000 investment | Costs paid as a percentage of a $10,000 investment |
|---|
| Class I | $164 | 1.59% |
|---|
How did the Fund perform during the reporting period?
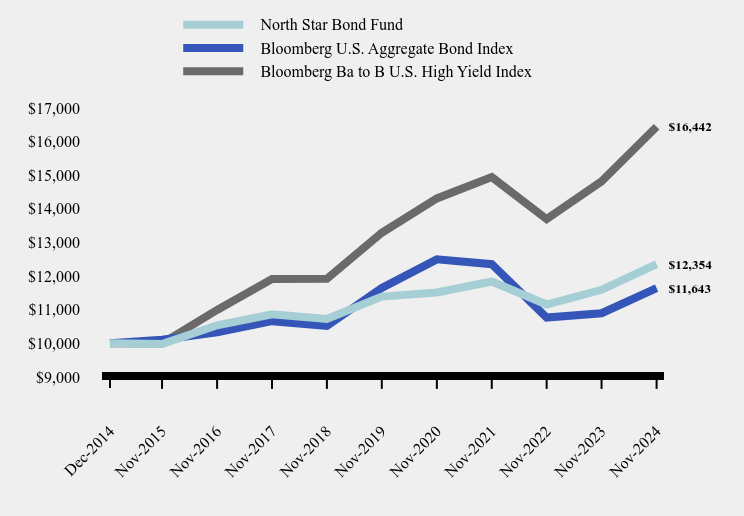
The Fund performed consistent with expectations and inline with its benchmark for the twelve-month period ending 11-30-2024, with a 6.58% positive return. There was little movement in the prevailing interest rates for our very short duration portfolio, which has a duration of less than 3-years. Meanwhile, the yield on the 10-year Treasury declined steeply and then recovered to finish the period down 32 basis points. Short term rates remained static, leading to a positive slope on the 10-2 spread and ending the lengthy period of an inverted yield curve. We had no credit issues and no material declines in any of our individual holdings
How has the Fund performed since inception?
Total Return Based on $10,000 Investment
| North Star Bond Fund | Bloomberg U.S. Aggregate Bond Index | Bloomberg Ba to B U.S. High Yield Index |
|---|
| Dec-2014 | $10,000 | $10,000 | $10,000 |
|---|
| Nov-2015 | $9,980 | $10,106 | $9,995 |
|---|
| Nov-2016 | $10,535 | $10,325 | $10,992 |
|---|
| Nov-2017 | $10,860 | $10,657 | $11,909 |
|---|
| Nov-2018 | $10,726 | $10,514 | $11,918 |
|---|
| Nov-2019 | $11,388 | $11,649 | $13,288 |
|---|
| Nov-2020 | $11,510 | $12,497 | $14,309 |
|---|
| Nov-2021 | $11,838 | $12,353 | $14,943 |
|---|
| Nov-2022 | $11,152 | $10,767 | $13,694 |
|---|
| Nov-2023 | $11,591 | $10,894 | $14,817 |
|---|
| Nov-2024 | $12,354 | $11,643 | $16,442 |
|---|
Average Annual Total Returns
| 1 Year | 5 Years | Since Inception (December 19, 2014) |
|---|
| North Star Bond Fund | 6.58% | 1.64% | 2.15% |
|---|
| Bloomberg U.S. Aggregate Bond Index | 6.88% | -0.01% | 1.54% |
|---|
| Bloomberg Ba to B U.S. High Yield Index | 10.96% | 4.35% | 5.13% |
|---|
The Fund's past performance is not a good predictor of how the Fund will perform in the future. The graph and table do not reflect the deduction of taxes that a shareholder would pay on fund distributions or redemption of fund shares.
| Net Assets | $32,609,397 |
|---|
| Number of Portfolio Holdings | 30 |
|---|
| Advisory Fee | $264,863 |
|---|
| Portfolio Turnover | 43% |
|---|
Asset Weighting (% of total investments)
| Value | Value |
|---|
| Corporate Bonds | 85.5% |
| Money Market Funds | 2.9% |
| Preferred Stocks | 7.0% |
| U.S. Government & Agencies | 4.6% |
What did the Fund invest in?
Sector Weighting (% of net assets)
| Value | Value |
|---|
| Other Assets in Excess of Liabilities | 1.2% |
| Money Market Funds | 2.9% |
| Materials | 3.7% |
| Health Care | 4.4% |
| U.S. Treasury Obligations | 4.6% |
| Industrials | 6.1% |
| Real Estate | 6.3% |
| Energy | 7.5% |
| Consumer Staples | 8.0% |
| Financials | 19.8% |
| Consumer Discretionary | 35.5% |
Top 10 Holdings (% of net assets)
| Holding Name | % of Net Assets |
| Wendy's International, LLC | 4.6% |
| Elanco Animal Health, Inc. | 4.4% |
| Wintrust Financial Corporation | 4.4% |
| Under Armour, Inc. | 4.4% |
| Hercules Capital, Inc. | 4.4% |
| Gulfport Energy Corporation | 4.3% |
| Cedar Fair, L.P./Canada's Wonderland Company/Magnum Management Corporation | 4.3% |
| J M Smucker Company (The) | 4.3% |
| EPR Properties | 4.2% |
| Ford Motor Company | 4.2% |
No material changes occurred during the year ended November 30, 2024.
North Star Bond Fund - Class I (NSBDX )
Annual Shareholder Report - November 30, 2024
Where can I find additional information about the Fund?
Additional information is available on the Fund's website ( www.nsinvestfunds.com ), including its:
Prospectus
Financial information
Holdings
Proxy voting information
Annual Shareholder Report - November 30, 2024
This annual shareholder report contains important information about North Star Dividend Fund for the period of December 1, 2023 to November 30, 2024. You can find additional information about the Fund at www.nsinvestfunds.com. You can also request this information by contacting us at 1-855-580-0900.
What were the Fund’s costs for the last year?
(based on a hypothetical $10,000 investment)
| Class Name | Costs of a $10,000 investment | Costs paid as a percentage of a $10,000 investment |
|---|
| Class I | $154 | 1.39% |
|---|
How did the Fund perform during the reporting period?
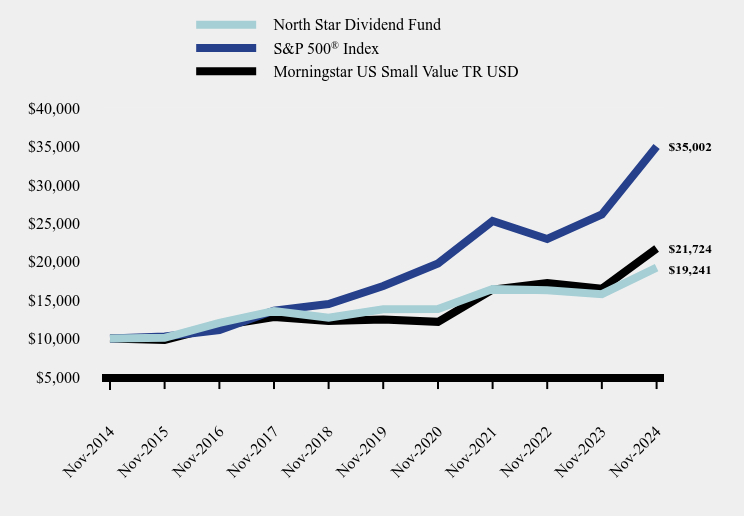
The Fund delivered a 21.91% positive return for the twelve-month period that modestly trailed its benchmark. Dividend paying securities are particularly sensitive to interest rates, as those rates provide an alternative for income-oriented investors. At the beginning of 2024 the consensus expectation was for short-term interest rates to decrease consistently in 2024, with six 25 basis points cuts in the Fed Funds rate as the base case scenario. Whereas the rate cutting cycle finally started in the final three months, investors tempered their expectations for the pace and size of future rate cuts. Nevertheless, many of the Fund’s holdings fared well, led by Flexsteel Industries, Bar Harbor Bankshares, and LSI Industries Inc. Flexsteel Industries Inc is a United States-based company that manufactures, imports, and markets residential upholstered wooden furniture products. Bar Harbor Bankshares Inc is a New England-based bank holding company that offers a full range of financial services products. LSI Industries Inc provides corporate visual image solutions to the petroleum and convenience store industry. The company's operating segments include Lighting and Display Solutions. It generates maximum revenue from the Lighting segment. Our consumer discretionary companies, such as Rocky Brands, were a drag on performance.
How has the Fund performed over the last ten years?
Total Return Based on $10,000 Investment
| North Star Dividend Fund | S&P 500® Index | Morningstar US Small Value TR USD |
|---|
| Nov-2014 | $10,000 | $10,000 | $10,000 |
|---|
| Nov-2015 | $10,109 | $10,275 | $9,827 |
|---|
| Nov-2016 | $12,060 | $11,103 | $11,650 |
|---|
| Nov-2017 | $13,597 | $13,642 | $12,799 |
|---|
| Nov-2018 | $12,733 | $14,498 | $12,296 |
|---|
| Nov-2019 | $13,810 | $16,834 | $12,483 |
|---|
| Nov-2020 | $13,860 | $19,773 | $12,181 |
|---|
| Nov-2021 | $16,451 | $25,294 | $16,366 |
|---|
| Nov-2022 | $16,294 | $22,964 | $17,223 |
|---|
| Nov-2023 | $15,783 | $26,142 | $16,489 |
|---|
| Nov-2024 | $19,241 | $35,002 | $21,724 |
|---|
Average Annual Total Returns
| 1 Year | 5 Years | 10 Years |
|---|
| North Star Dividend Fund | 21.91% | 6.86% | 6.76% |
|---|
S&P 500® Index | 33.89% | 15.77% | 13.35% |
|---|
| Morningstar US Small Value TR USD | 31.75% | 11.72% | 8.07% |
|---|
The Fund's past performance is not a good predictor of how the Fund will perform in the future. The graph and table do not reflect the deduction of taxes that a shareholder would pay on fund distributions or redemption of fund shares.
| Net Assets | $96,061,516 |
|---|
| Number of Portfolio Holdings | 50 |
|---|
| Advisory Fee | $903,054 |
|---|
| Portfolio Turnover | 34% |
|---|
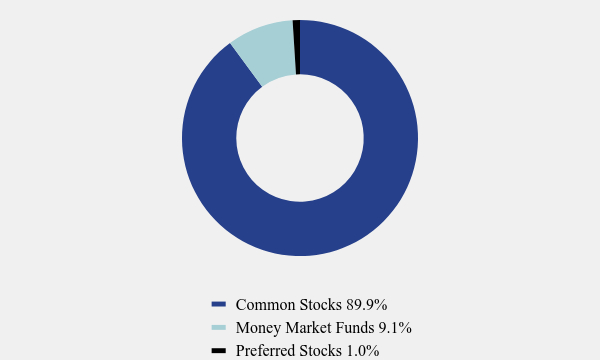
Asset Weighting (% of total investments)
| Value | Value |
|---|
| Common Stocks | 89.9% |
| Money Market Funds | 9.1% |
| Preferred Stocks | 1.0% |
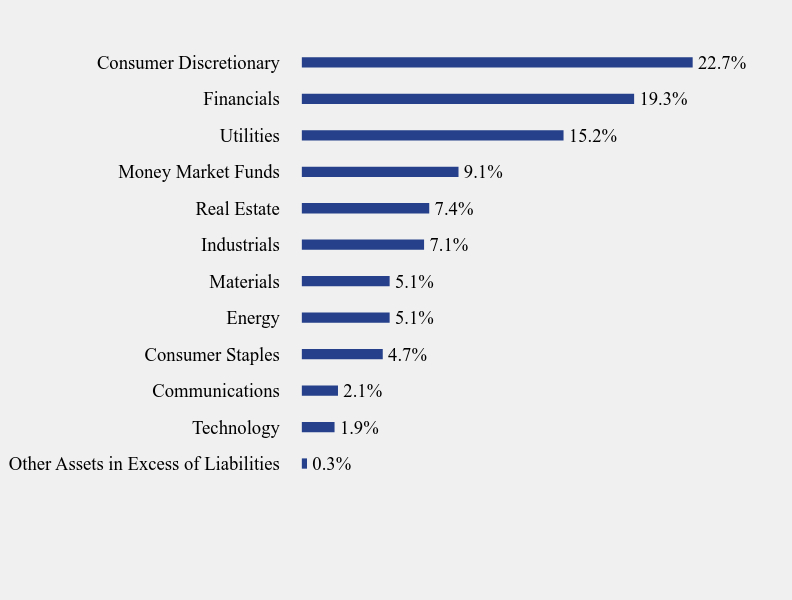
What did the Fund invest in?
Sector Weighting (% of net assets)
| Value | Value |
|---|
| Other Assets in Excess of Liabilities | 0.3% |
| Technology | 1.9% |
| Communications | 2.1% |
| Consumer Staples | 4.7% |
| Energy | 5.1% |
| Materials | 5.1% |
| Industrials | 7.1% |
| Real Estate | 7.4% |
| Money Market Funds | 9.1% |
| Utilities | 15.2% |
| Financials | 19.3% |
| Consumer Discretionary | 22.7% |
Top 10 Holdings (% of net assets)
| Holding Name | % of Net Assets |
| First American Treasury Obligations Fund, Class X | 9.1% |
| Flexsteel Industries, Inc. | 3.9% |
| LSI Industries, Inc. | 3.8% |
| Sprott, Inc. | 3.8% |
| Oil-Dri Corp of America | 3.5% |
| Ethan Allen Interiors, Inc. | 3.1% |
| Compass Diversified Holdings | 3.0% |
| Escalade, Inc. | 3.0% |
| Postal Realty Trust, Inc. | 2.9% |
| Bar Harbor Bankshares | 2.9% |
No material changes occurred during the year ended November 30, 2024.
North Star Dividend Fund - Class I (NSDVX )
Annual Shareholder Report - November 30, 2024
Where can I find additional information about the Fund?
Additional information is available on the Fund's website ( www.nsinvestfunds.com ), including its:
Prospectus
Financial information
Holdings
Proxy voting information
North Star Micro Cap Fund
Annual Shareholder Report - November 30, 2024
This annual shareholder report contains important information about North Star Micro Cap Fund for the period of December 1, 2023 to November 30, 2024. You can find additional information about the Fund at www.nsinvestfunds.com. You can also request this information by contacting us at 1-855-580-0900.
What were the Fund’s costs for the last year?
(based on a hypothetical $10,000 investment)
| Class Name | Costs of a $10,000 investment | Costs paid as a percentage of a $10,000 investment |
|---|
| Class I | $153 | 1.33% |
|---|
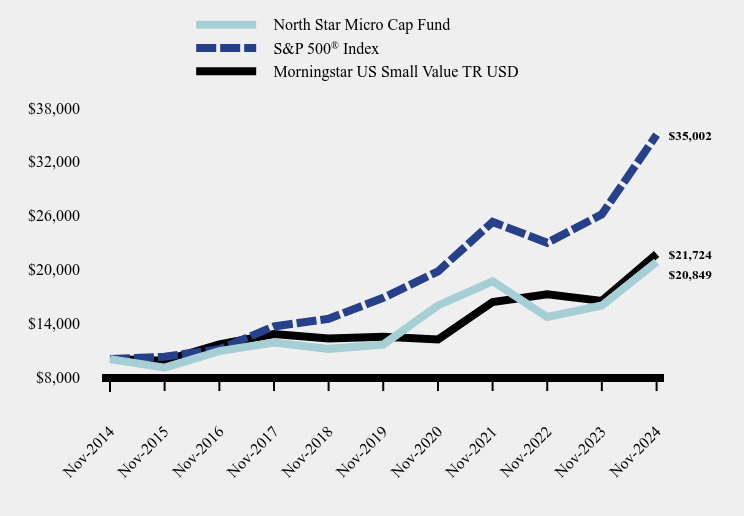
How did the Fund perform during the reporting period?
The Fund outperformed its benchmarks during the twelve-month period ending 11-30-2024, while producing a 30.50% gain. United States Lime & Minerals surged throughout the year as demand remained strong for construction materials. The Fund also enjoyed sizeable gains in Green Brick Partners, Hackett Group, and Interface. Green Brick Partners Inc is a homebuilding and land development company. Interface Inc is engaged in the design, production, and sale of carpet tiles for the institutional markets. Two of our holdings, Mitek Systems and Rocky Shoes & Boots, suffered substantial declines. Mitek Systems Inc is engaged in the development, sale, and service of proprietary software solutions related to mobile imaging. Rocky Brands Inc is a designer, manufacturer, and marketer of premium-quality footwear and apparel.
How has the Fund performed over the last ten years?
Total Return Based on $10,000 Investment
| North Star Micro Cap Fund | S&P 500® Index | Morningstar US Small Value TR USD |
|---|
| Nov-2014 | $10,000 | $10,000 | $10,000 |
|---|
| Nov-2015 | $9,051 | $10,275 | $9,827 |
|---|
| Nov-2016 | $10,889 | $11,103 | $11,650 |
|---|
| Nov-2017 | $11,838 | $13,642 | $12,799 |
|---|
| Nov-2018 | $11,143 | $14,498 | $12,296 |
|---|
| Nov-2019 | $11,617 | $16,834 | $12,483 |
|---|
| Nov-2020 | $15,981 | $19,773 | $12,181 |
|---|
| Nov-2021 | $18,679 | $25,294 | $16,366 |
|---|
| Nov-2022 | $14,693 | $22,964 | $17,223 |
|---|
| Nov-2023 | $15,976 | $26,142 | $16,489 |
|---|
| Nov-2024 | $20,849 | $35,002 | $21,724 |
|---|
Average Annual Total Returns
| 1 Year | 5 Years | 10 Years |
|---|
| North Star Micro Cap Fund | 30.50% | 12.41% | 7.62% |
|---|
S&P 500® Index | 33.89% | 15.77% | 13.35% |
|---|
| Morningstar US Small Value TR USD | 31.75% | 11.72% | 8.07% |
|---|
The Fund's past performance is not a good predictor of how the Fund will perform in the future. The graph and table do not reflect the deduction of taxes that a shareholder would pay on fund distributions or redemption of fund shares.
- Net Assets$126,324,274
- Number of Portfolio Holdings52
- Advisory Fee $1,124,152
- Portfolio Turnover26%
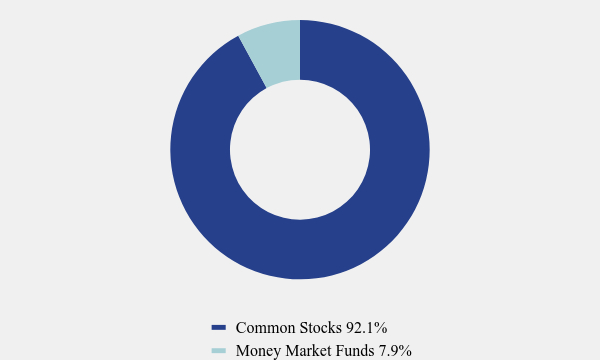
Asset Weighting (% of total investments)
| Value | Value |
|---|
| Common Stocks | 92.1% |
| Money Market Funds | 7.9% |
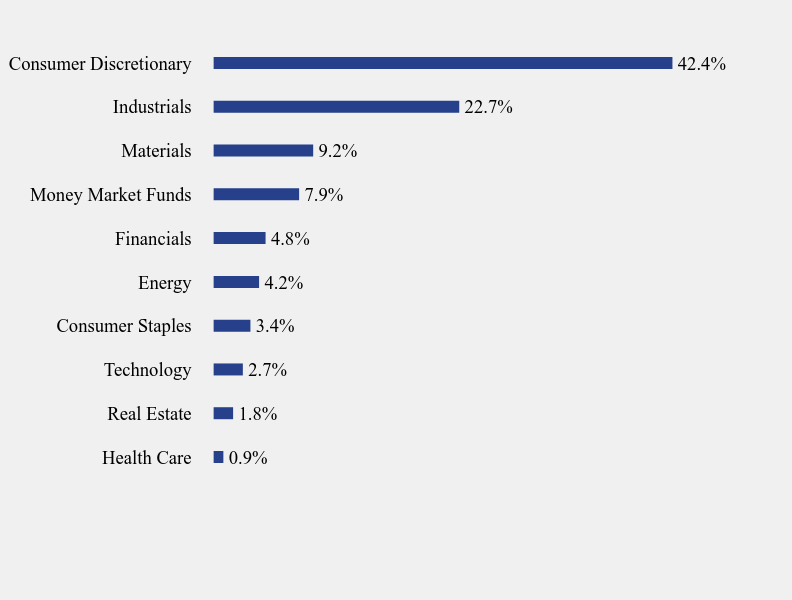
What did the Fund invest in?
Sector Weighting (% of net assets)
| Value | Value |
|---|
| Health Care | 0.9% |
| Real Estate | 1.8% |
| Technology | 2.7% |
| Consumer Staples | 3.4% |
| Energy | 4.2% |
| Financials | 4.8% |
| Money Market Funds | 7.9% |
| Materials | 9.2% |
| Industrials | 22.7% |
| Consumer Discretionary | 42.4% |
Top 10 Holdings (% of net assets)
| Holding Name | % of Net Assets |
| First American Treasury Obligations Fund, Class X | 7.9% |
| United States Lime & Minerals, Inc. | 7.9% |
| Build-A-Bear Workshop, Inc. | 4.9% |
| Green Brick Partners, Inc. | 4.3% |
| Barrett Business Services, Inc. | 3.8% |
| Blue Bird Corporation | 3.3% |
| Acme United Corporation | 3.2% |
| QEP Company, Inc. | 3.2% |
| Interface, Inc. | 3.0% |
| Miller Industries, Inc. | 2.9% |
No material changes occurred during the year ended November 30, 2024.
North Star Micro Cap Fund - Class I (NSMVX )
Annual Shareholder Report - November 30, 2024
Where can I find additional information about the Fund?
Additional information is available on the Fund's website ( www.nsinvestfunds.com ), including its:
Prospectus
Financial information
Holdings
Proxy voting information
North Star Opportunity Fund
Annual Shareholder Report - November 30, 2024
This annual shareholder report contains important information about North Star Opportunity Fund for the period of December 1, 2023 to November 30, 2024. You can find additional information about the Fund at www.nsinvestfunds.com. You can also request this information by contacting us at 1-855-580-0900.
What were the Fund’s costs for the last year?
(based on a hypothetical $10,000 investment)
| Class Name | Costs of a $10,000 investment | Costs paid as a percentage of a $10,000 investment |
|---|
| Class A | $171 | 1.55% |
|---|
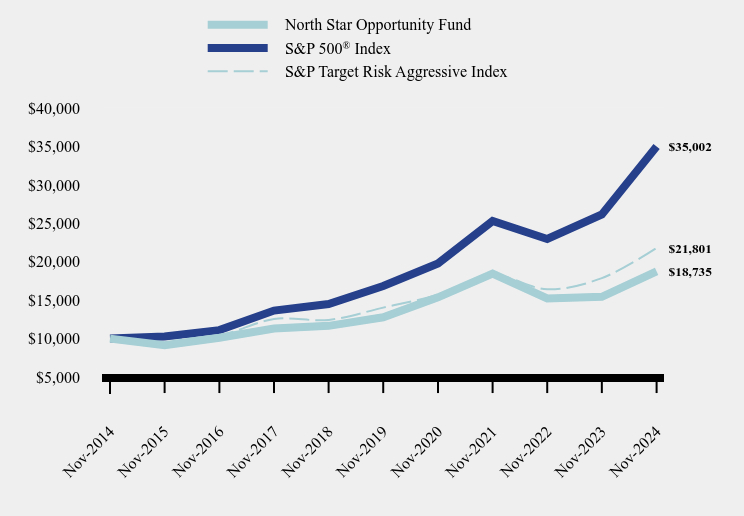
How did the fund perform last year?
The Fund performed in line with its benchmark for the twelve-month period ending 11-30-24, while posting a 21.07% and 21.42% positive return for Class A shares and Class I shares, respectively. The technology holdings provided mixed results, with nice returns from Apple, but sizeable losses from Advanced Micro Devices and Qualcomm. Big banks JPMorgan Chase and Bank of America performed well, and the biggest winners were private equity firms Blackstone Group and KKR & Co. As a group small caps produce returns consistent with the large cap equities in the portfolio, with no significant winners or losers. The fixed income sleeve of 15% of the Fund was positioned primarily in short-term Treasuries that performed as expected. Consumer Discretionary represents a significant sector allocation for the Fund, and produced mixed results, as lower-end consumers continued to be pressured by high prices and dialed back their spending.
How has the Fund performed over the last ten years?
Total Return Based on $10,000 Investment
| North Star Opportunity Fund | S&P 500® Index | S&P Target Risk Aggressive Index |
|---|
| Nov-2014 | $9,426 | $10,000 | $10,000 |
|---|
| Nov-2015 | $8,642 | $10,275 | $10,011 |
|---|
| Nov-2016 | $9,549 | $11,103 | $10,410 |
|---|
| Nov-2017 | $10,641 | $13,642 | $12,555 |
|---|
| Nov-2018 | $10,952 | $14,498 | $12,428 |
|---|
| Nov-2019 | $11,973 | $16,834 | $14,031 |
|---|
| Nov-2020 | $14,366 | $19,773 | $15,695 |
|---|
| Nov-2021 | $17,201 | $25,294 | $18,254 |
|---|
| Nov-2022 | $14,156 | $22,964 | $16,419 |
|---|
| Nov-2023 | $14,318 | $26,142 | $17,864 |
|---|
| Nov-2024 | $17,335 | $35,002 | $21,801 |
|---|
Average Annual Total Returns
| 1 Year | 5 Years | 10 Years |
|---|
| North Star Opportunity Fund | | | |
|---|
| Without Load | 21.07% | 7.68% | 6.28% |
|---|
| With Load | 14.13% | 6.41% | 5.66% |
|---|
S&P 500® Index | 33.89% | 15.77% | 13.35% |
|---|
| S&P Target Risk Aggressive Index | 22.04% | 9.21% | 8.11% |
|---|
The Fund's past performance is not a good predictor of how the Fund will perform in the future. The graph and table do not reflect the deduction of taxes that a shareholder would pay on fund distributions or redemption of fund shares.
| Net Assets | $138,507,500 |
|---|
| Number of Portfolio Holdings | 44 |
|---|
| Advisory Fee (net of waivers) | $1,259,055 |
|---|
| Portfolio Turnover | 21% |
|---|
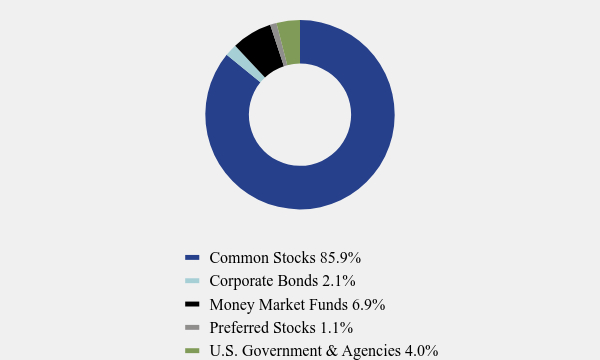
Asset Weighting (% of total investments)
| Value | Value |
|---|
| Common Stocks | 85.9% |
| Corporate Bonds | 2.1% |
| Money Market Funds | 6.9% |
| Preferred Stocks | 1.1% |
| U.S. Government & Agencies | 4.0% |
What did the Fund invest in?
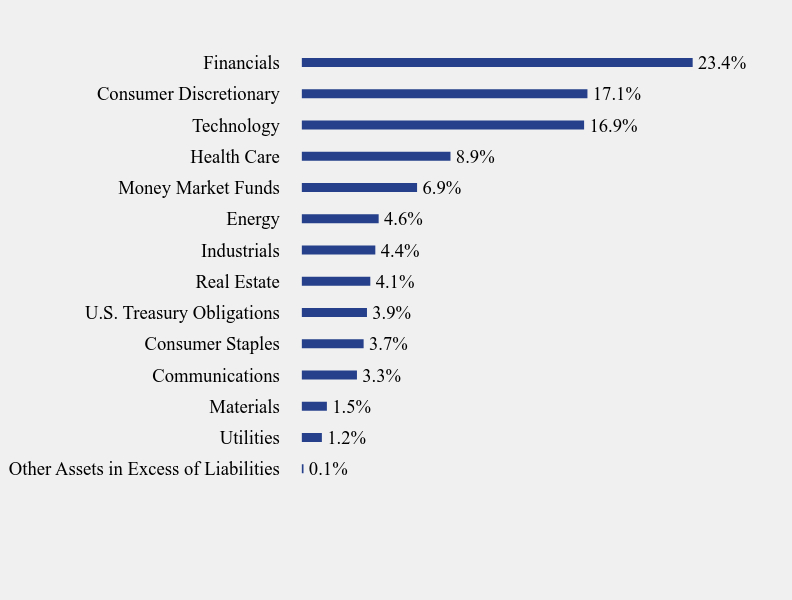
Sector Weighting (% of net assets)
| Value | Value |
|---|
| Other Assets in Excess of Liabilities | 0.1% |
| Utilities | 1.2% |
| Materials | 1.5% |
| Communications | 3.3% |
| Consumer Staples | 3.7% |
| U.S. Treasury Obligations | 3.9% |
| Real Estate | 4.1% |
| Industrials | 4.4% |
| Energy | 4.6% |
| Money Market Funds | 6.9% |
| Health Care | 8.9% |
| Technology | 16.9% |
| Consumer Discretionary | 17.1% |
| Financials | 23.4% |
Top 10 Holdings (% of net assets)
| Holding Name | % of Net Assets |
| First American Treasury Obligations Fund, Class X | 6.9% |
| Blackstone, Inc. | 5.4% |
| KKR & Company, Inc. | 5.4% |
| Apple, Inc. | 4.8% |
| JPMorgan Chase & Company | 4.3% |
| Bank of America Corporation | 3.7% |
| Advanced Micro Devices, Inc. | 3.5% |
| Amazon.com, Inc. | 3.3% |
| AbbVie, Inc. | 3.3% |
| Alphabet, Inc., Class A | 3.3% |
No material changes occurred during the year ended November 30, 2024.
North Star Opportunity Fund - Class A (NSOPX )
Annual Shareholder Report - November 30, 2024
Where can I find additional information about the Fund?
Additional information is available on the Fund's website ( www.nsinvestfunds.com ), including its:
Prospectus
Financial information
Holdings
Proxy voting information
North Star Opportunity Fund
Annual Shareholder Report - November 30, 2024
This annual shareholder report contains important information about North Star Opportunity Fund for the period of December 1, 2023 to November 30, 2024. You can find additional information about the Fund at www.nsinvestfunds.com. You can also request this information by contacting us at 1-855-580-0900.
What were the Fund’s costs for the last year?
(based on a hypothetical $10,000 investment)
| Class Name | Costs of a $10,000 investment | Costs paid as a percentage of a $10,000 investment |
|---|
| Class I | $144 | 1.30% |
|---|
How did the fund perform last year?
The Fund performed in line with its benchmark for the twelve-month period ending 11-30-24, while posting a 21.07% and 21.42% positive return for Class A shares and Class I shares, respectively. The technology holdings provided mixed results, with nice returns from Apple, but sizeable losses from Advanced Micro Devices and Qualcomm. Big banks JPMorgan Chase and Bank of America performed well, and the biggest winners were private equity firms Blackstone Group and KKR & Co. As a group small caps produce returns consistent with the large cap equities in the portfolio, with no significant winners or losers. The fixed income sleeve of 15% of the Fund was positioned primarily in short-term Treasuries that performed as expected. Consumer Discretionary represents a significant sector allocation for the Fund, and produced mixed results, as lower-end consumers continued to be pressured by high prices and dialed back their spending.
How has the Fund performed over the last ten years?
Total Return Based on $10,000 Investment
| North Star Opportunity Fund | S&P 500® Index | S&P Target Risk Aggressive Index |
|---|
| Nov-2014 | $10,000 | $10,000 | $10,000 |
|---|
| Nov-2015 | $9,153 | $10,275 | $10,011 |
|---|
| Nov-2016 | $10,115 | $11,103 | $10,410 |
|---|
| Nov-2017 | $11,305 | $13,642 | $12,555 |
|---|
| Nov-2018 | $11,659 | $14,498 | $12,428 |
|---|
| Nov-2019 | $12,779 | $16,834 | $14,031 |
|---|
| Nov-2020 | $15,371 | $19,773 | $15,695 |
|---|
| Nov-2021 | $18,446 | $25,294 | $18,254 |
|---|
| Nov-2022 | $15,222 | $22,964 | $16,419 |
|---|
| Nov-2023 | $15,430 | $26,142 | $17,864 |
|---|
| Nov-2024 | $18,735 | $35,002 | $21,801 |
|---|
Average Annual Total Returns
| 1 Year | 5 Years | 10 Years |
|---|
| North Star Opportunity Fund | 21.42% | 7.95% | 6.48% |
|---|
S&P 500® Index | 33.89% | 15.77% | 13.35% |
|---|
| S&P Target Risk Aggressive Index | 22.04% | 9.21% | 8.11% |
|---|
The Fund's past performance is not a good predictor of how the Fund will perform in the future. The graph and table do not reflect the deduction of taxes that a shareholder would pay on fund distributions or redemption of fund shares.
| Net Assets | $138,507,500 |
|---|
| Number of Portfolio Holdings | 44 |
|---|
| Advisory Fee (net of waivers) | $1,259,055 |
|---|
| Portfolio Turnover | 21% |
|---|
Asset Weighting (% of total investments)
| Value | Value |
|---|
| Common Stocks | 85.9% |
| Corporate Bonds | 2.1% |
| Money Market Funds | 6.9% |
| Preferred Stocks | 1.1% |
| U.S. Government & Agencies | 4.0% |
What did the Fund invest in?
Sector Weighting (% of net assets)
| Value | Value |
|---|
| Other Assets in Excess of Liabilities | 0.1% |
| Utilities | 1.2% |
| Materials | 1.5% |
| Communications | 3.3% |
| Consumer Staples | 3.7% |
| U.S. Treasury Obligations | 3.9% |
| Real Estate | 4.1% |
| Industrials | 4.4% |
| Energy | 4.6% |
| Money Market Funds | 6.9% |
| Health Care | 8.9% |
| Technology | 16.9% |
| Consumer Discretionary | 17.1% |
| Financials | 23.4% |
Top 10 Holdings (% of net assets)
| Holding Name | % of Net Assets |
| First American Treasury Obligations Fund, Class X | 6.9% |
| Blackstone, Inc. | 5.4% |
| KKR & Company, Inc. | 5.4% |
| Apple, Inc. | 4.8% |
| JPMorgan Chase & Company | 4.3% |
| Bank of America Corporation | 3.7% |
| Advanced Micro Devices, Inc. | 3.5% |
| Amazon.com, Inc. | 3.3% |
| AbbVie, Inc. | 3.3% |
| Alphabet, Inc., Class A | 3.3% |
No material changes occurred during the year ended November 30, 2024.
North Star Opportunity Fund - Class I (NSOIX )
Annual Shareholder Report - November 30, 2024
Where can I find additional information about the Fund?
Additional information is available on the Fund's website ( www.nsinvestfunds.com ), including its:
Prospectus
Financial information
Holdings
Proxy voting information
North Star Small Cap Value Fund
Institutional Class (WFICX)
Annual Shareholder Report - November 30, 2024
This annual shareholder report contains important information about North Star Small Cap Value Fund for the period of December 1, 2023 to November 30, 2024. You can find additional information about the Fund at www.nsinvestfunds.com. You can also request this information by contacting us at 1-855-580-0900.
What were the Fund’s costs for the last year?
(based on a hypothetical $10,000 investment)
| Class Name | Costs of a $10,000 investment | Costs paid as a percentage of a $10,000 investment |
|---|
| Institutional | $114 | 0.98% |
|---|
How did the Fund perform during the reporting period?
The Fund posted a 32.98% and 32.75% positive returns for Institutional Class shares and Investor Class shares, respectively, which was modestly above its benchmarks during the twelve -month period ending 11-30-2024. The top performer from the first half of the year, school bus manufacturer Blue Bird, reversed course and was a drag on performance during the back half. A top performer for the year was heating and cooling company Comfort Systems, with no significant detractors, although there were a handful of companies that experienced low double-digit declines. The other top performers were Champion Homes, Hackett Group, OSI Systems, QCR Holdings, and VSE Corp. Champion Homes Inc is a factory-built housing company. The Hackett Group Inc is an IP-based executive advisory, strategic consulting, and digital transformation firm. OSI Systems Inc is a designer and manufacturer of electronic systems and components for businesses in the homeland security, healthcare, defense, and aerospace markets. QCR Holdings Inc is a Midwest-based multi-bank holding company. VSE Corp is a diversified aftermarket products and services company.
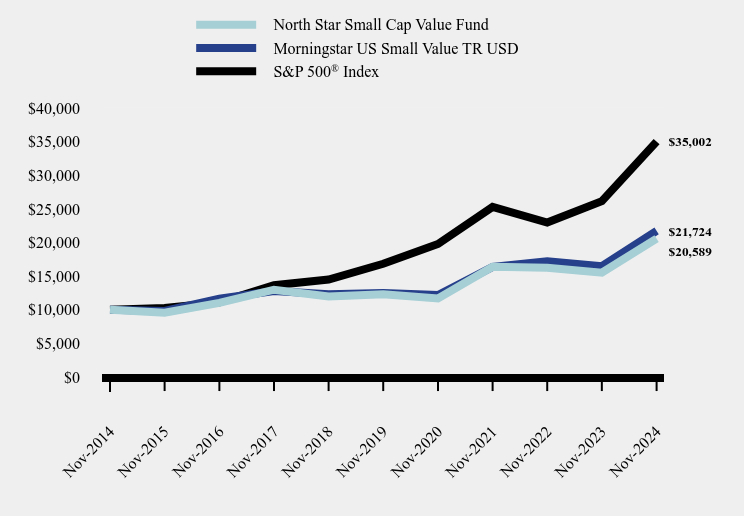
How has the Fund performed since inception?
Total Return Based on $100,000 Investment
| North Star Small Cap Value Fund | Morningstar US Small Value TR USD | S&P 500® Index |
|---|
| 12/31/18 | $100,000 | $100,000 | $100,000 |
|---|
| 11/30/19 | $118,073 | $116,049 | $127,634 |
|---|
| 11/30/20 | $112,533 | $113,246 | $149,914 |
|---|
| 11/30/21 | $158,322 | $152,152 | $191,772 |
|---|
| 11/30/22 | $157,185 | $160,122 | $174,110 |
|---|
| 11/30/23 | $150,305 | $153,298 | $198,206 |
|---|
| 11/30/24 | $199,872 | $201,965 | $265,380 |
|---|
Average Annual Total Returns
| 1 Year | 5 Years | Since Inception (December 31, 2018) |
|---|
| North Star Small Cap Value Fund | 32.98% | 11.10% | 12.42% |
|---|
S&P 500® Index | 33.89% | 15.77% | 17.94% |
|---|
| Morningstar US Small Value TR USD | 31.75% | 11.72% | 12.62% |
|---|
The Fund's past performance is not a good predictor of how the Fund will perform in the future. The graph and table do not reflect the deduction of taxes that a shareholder would pay on fund distributions or redemption of fund shares.
| Net Assets | $36,670,274 |
|---|
| Number of Portfolio Holdings | 38 |
|---|
| Advisory Fee (net of waivers) | $146,457 |
|---|
| Portfolio Turnover | 29% |
|---|
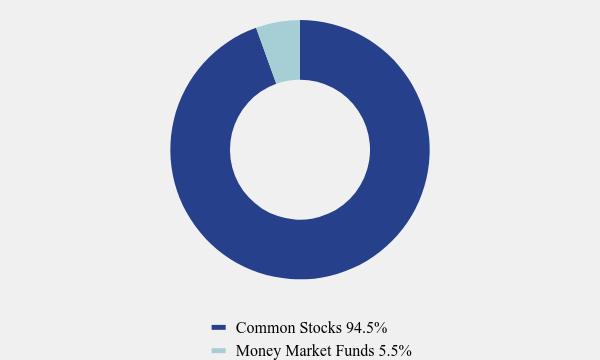
Asset Weighting (% of total investments)
| Value | Value |
|---|
| Common Stocks | 94.5% |
| Money Market Funds | 5.5% |
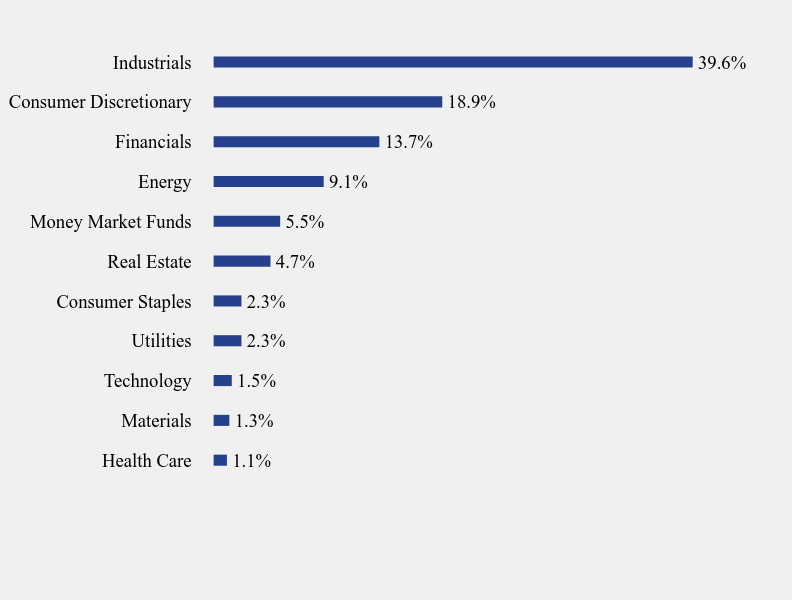
What did the Fund invest in?
| Value | Value |
|---|
| Health Care | 1.1% |
| Materials | 1.3% |
| Technology | 1.5% |
| Utilities | 2.3% |
| Consumer Staples | 2.3% |
| Real Estate | 4.7% |
| Money Market Funds | 5.5% |
| Energy | 9.1% |
| Financials | 13.7% |
| Consumer Discretionary | 18.9% |
| Industrials | 39.6% |
Top 10 Holdings (% of net assets)
| Holding Name | % of Net Assets |
| Comfort Systems USA, Inc. | 5.9% |
| VSE Corporation | 5.6% |
| First American Treasury Obligations Fund, Class X | 5.5% |
| OSI Systems, Inc. | 4.9% |
| AZZ, Inc. | 4.7% |
| Champion Homes, Inc. | 4.5% |
| Hackett Group, Inc. (The) | 4.0% |
| Alamo Group, Inc. | 3.3% |
| Blue Bird Corporation | 3.3% |
| Liquidity Services, Inc. | 3.2% |
No material changes occurred during the year ended November 30, 2024.
North Star Small Cap Value Fund
Annual Shareholder Report - November 30, 2024
Where can I find additional information about the Fund?
Additional information is available on the Fund's website ( www.nsinvestfunds.com ), including its:
Prospectus
Financial information
Holdings
Proxy voting information
North Star Small Cap Value Fund
Annual Shareholder Report - November 30, 2024
This annual shareholder report contains important information about North Star Small Cap Value Fund for the period of December 1, 2023 to November 30, 2024. You can find additional information about the Fund at www.nsinvestfunds.com. You can also request this information by contacting us at 1-855-580-0900.
What were the Fund’s costs for the last year?
(based on a hypothetical $10,000 investment)
| Class Name | Costs of a $10,000 investment | Costs paid as a percentage of a $10,000 investment |
|---|
| Investor | $141 | 1.21% |
|---|
How did the Fund perform during the reporting period?
The Fund posted a 32.98% and 32.75% positive returns for Institutional Class shares and Investor Class shares, respectively, which was modestly above its benchmarks during the twelve -month period ending 11-30-2024. The top performer from the first half of the year, school bus manufacturer Blue Bird, reversed course and was a drag on performance during the back half. A top performer for the year was heating and cooling company Comfort Systems, with no significant detractors, although there were a handful of companies that experienced low double-digit declines. The other top performers were Champion Homes, Hackett Group, OSI Systems, QCR Holdings, and VSE Corp. Champion Homes Inc is a factory-built housing company. The Hackett Group Inc is an IP-based executive advisory, strategic consulting, and digital transformation firm. OSI Systems Inc is a designer and manufacturer of electronic systems and components for businesses in the homeland security, healthcare, defense, and aerospace markets. QCR Holdings Inc is a Midwest-based multi-bank holding company. VSE Corp is a diversified aftermarket products and services company.
How has the Fund performed over the last ten years?
Total Return Based on $10,000 Investment
| North Star Small Cap Value Fund | Morningstar US Small Value TR USD | S&P 500® Index |
|---|
| Nov-2014 | $10,000 | $10,000 | $10,000 |
|---|
| Nov-2015 | $9,567 | $9,827 | $10,275 |
|---|
| Nov-2016 | $11,030 | $11,650 | $11,103 |
|---|
| Nov-2017 | $12,984 | $12,799 | $13,642 |
|---|
| Nov-2018 | $11,987 | $12,296 | $14,498 |
|---|
| Nov-2019 | $12,300 | $12,483 | $16,834 |
|---|
| Nov-2020 | $11,688 | $12,181 | $19,773 |
|---|
| Nov-2021 | $16,406 | $16,366 | $25,294 |
|---|
| Nov-2022 | $16,259 | $17,223 | $22,964 |
|---|
| Nov-2023 | $15,510 | $16,489 | $26,142 |
|---|
| Nov-2024 | $20,589 | $21,724 | $35,002 |
|---|
Average Annual Total Returns
| 1 Year | 5 Years | 10 Years |
|---|
| North Star Small Cap Value Fund | 32.75% | 10.85% | 7.49% |
|---|
S&P 500® Index | 33.89% | 15.77% | 13.35% |
|---|
| Morningstar US Small Value TR USD | 31.75% | 11.72% | 8.07% |
|---|
The Fund's past performance is not a good predictor of how the Fund will perform in the future. The graph and table do not reflect the deduction of taxes that a shareholder would pay on fund distributions or redemption of fund shares.
| Net Assets | $36,670,274 |
|---|
| Number of Portfolio Holdings | 38 |
|---|
| Advisory Fee (net of waivers) | $146,457 |
|---|
| Portfolio Turnover | 29% |
|---|
Asset Weighting (% of total investments)
| Value | Value |
|---|
| Common Stocks | 94.5% |
| Money Market Funds | 5.5% |
What did the Fund invest in?
| Value | Value |
|---|
| Health Care | 1.1% |
| Materials | 1.3% |
| Technology | 1.5% |
| Utilities | 2.3% |
| Consumer Staples | 2.3% |
| Real Estate | 4.7% |
| Money Market Funds | 5.5% |
| Energy | 9.1% |
| Financials | 13.7% |
| Consumer Discretionary | 18.9% |
| Industrials | 39.6% |
Top 10 Holdings (% of net assets)
| Holding Name | % of Net Assets |
| Comfort Systems USA, Inc. | 5.9% |
| VSE Corporation | 5.6% |
| First American Treasury Obligations Fund, Class X | 5.5% |
| OSI Systems, Inc. | 4.9% |
| AZZ, Inc. | 4.7% |
| Champion Homes, Inc. | 4.5% |
| Hackett Group, Inc. (The) | 4.0% |
| Alamo Group, Inc. | 3.3% |
| Blue Bird Corporation | 3.3% |
| Liquidity Services, Inc. | 3.2% |
No material changes occurred during the year ended November 30, 2024.
North Star Small Cap Value Fund
Annual Shareholder Report - November 30, 2024
Where can I find additional information about the Fund?
Additional information is available on the Fund's website ( www.nsinvestfunds.com ), including its:
Prospectus
Financial information
Holdings
Proxy voting information
Item 2. Code of Ethics.
| (a) | The registrant has, as of the end of the period covered by this report, adopted a code of ethics that applies to the registrant’s principal executive officer, principal financial officer, and principal accounting officer or controller, or persons performing similar functions, regardless of whether these individuals are employed by the registrant or a third party. |
| | |
| (b) | N/A |
| | |
| (c) | During the period covered by this report, there were no amendments to any provision of the code of ethics. |
| | |
| (d) | During the period covered by this report, there were no waivers or implicit waivers of a provision of the code of ethics. |
| | |
| (e) | N/A |
| | |
| (f) | See Item 19(a)(1) |
Item 3. Audit Committee Financial Expert.
| (a)(1) | The Registrant’s Board of Trustees has determined that Mr. Keith Rhoades are audit committee financial experts, as defined in Item 3 of Form N-CSR. Mr. Rhoades is independent for purposes of this Item. |
Item 4. Principal Accountant Fees and Services.
| (a) | Audit Fees. The aggregate fees billed for each of the last two fiscal years for professional services rendered by the registrant’s principal accountant for the audit of the registrant’s annual financial statements or services that are normally provided by the accountant in connection with statutory and regulatory filings or engagements for those fiscal years are as follows: |
| | 2024 | | | $ | 82,500 | |
| | 2023 | | | $ | 84,600 | |
| (b) | Audit-Related Fees. There were no fees billed in each of the last two fiscal years for assurances and related services by the principal accountant that are reasonably related to the performance of the audit of the registrant’s financial statements and are not reported under paragraph (a) of this Item. |
| (c) | Tax Fees. The aggregate fees billed in each of the last two fiscal years for professional services rendered by the principal accountant for tax compliance are as follows: |
| | 2024 | | | $ | 16,250 | |
| | 2023 | | | $ | 15,125 | |
Preparation of Federal & State income tax returns, assistance with calculation of required income, capital gain and excise distributions and preparation of Federal excise tax returns.
| (d) | All Other Fees. The aggregate fees billed in each of the last two fiscal years for products and services provided by the registrant’s principal accountant, other than the services reported in paragraphs (a) through (c) of this item were $0 and $0 for the fiscal years ended November 30, 2024 and 2023, respectively. |
| | |
| (e)(1) | The audit committee does not have pre-approval policies and procedures. Instead, the audit committee or audit committee chairman approves on a case-by-case basis each audit or non-audit service before the principal accountant is engaged by the registrant. |
| | |
| (e)(2) | There were no services described in each of paragraphs (b) through (d) of this Item that were approved by the audit committee pursuant to paragraph (c)(7)(i)(C) of Rule 2-01 of Regulation S-X. |
| | |
| (f) | Not applicable. |
| | |
| (g) | All non-audit fees billed by the registrant’s principal accountant for services rendered to the registrant for the fiscal years ended November 30, 2024 and 2023 respectively are disclosed in (b)-(d) above. There were no audit or non-audit services performed by the registrant’s principal accountant for the registrant’s adviser. |
| | |
| (h) | Not applicable. |
| | |
| (i) | Not applicable. |
| | |
| (j) | Not applicable. |
Item 5. Audit Committee of Listed Registrants.
Not applicable
Item 6. Investments.
The Registrant’s schedule of investments in unaffiliated issuers is included in the Financial Statements under Item 7 of this form.
Item 7. Financial Statements and Financial Highlights for Open-End Management Investment Companies.
| | | |
| | | |
| | | |
| |  | |
| | | |
| | | |
| | | |
| | North Star Opportunity Fund | |
| | Class I Shares (Symbol: NSOIX)
Class A Shares (Symbol: NSOPX) | |
| | | |
| | | |
| | North Star Micro Cap Fund | |
| | Class I Shares (Symbol: NSMVX) | |
| | | |
| | | |
| | North Star Dividend Fund | |
| | Class I Shares (Symbol: NSDVX) | |
| | | |
| | | |
| | North Star Bond Fund | |
| | Class I Shares (Symbol: NSBDX) | |
| | | |
| | | |
| | North Star Small Cap Value Fund | |
| | Investor Class Shares (Symbol: WSCVX)
Institutional Class Shares (Symbol: WFICX) | |
| | | |
| | Annual Financial Statements and Additional Information | |
| | November 30, 2024 | |
| | | |
| | | |
| | | |
| | | |
| | | |
| | | |
| | | |
| | | |
| | | |
| | | |
| | |
| | | |
North Star Opportunity Fund
SCHEDULE OF INVESTMENTS
November 30, 2024
| Shares | | | | | Fair Value | |
| | | | | COMMON STOCKS — 85.8% | | | | |
| | | | | ASSET MANAGEMENT - 8.1% | | | | |
| | 39,000 | | | Blackstone, Inc. | | $ | 7,452,510 | |
| | 165,000 | | | Compass Diversified Holdings | | | 3,910,500 | |
| | | | | | | | 11,363,010 | |
| | | | | BANKING - 8.0% | | | | |
| | 108,000 | | | Bank of America Corporation | | | 5,131,080 | |
| | 24,000 | | | JPMorgan Chase & Company | | | 5,993,280 | |
| | | | | | | | 11,124,360 | |
| | | | | BEVERAGES - 1.7% | | | | |
| | 14,000 | | | PepsiCo, Inc. | | | 2,288,300 | |
| | | | | | | | | |
| | | | | BIOTECH & PHARMA - 7.6% | | | | |
| | 25,000 | | | AbbVie, Inc. | | | 4,573,250 | |
| | 100,000 | | | Pfizer, Inc. | | | 2,621,000 | |
| | 19,000 | | | Zoetis, Inc. | | | 3,329,750 | |
| | | | | | | | 10,524,000 | |
| | | | | CAPITAL MARKETS - 5.4% | | | | |
| | 45,500 | | | KKR & Company, Inc. | | | 7,410,585 | |
| | | | | | | | | |
| | | | | E-COMMERCE DISCRETIONARY - 3.3% | | | | |
| | 22,000 | | | Amazon.com, Inc.(a) | | | 4,573,580 | |
| | | | | | | | | |
| | | | | ELECTRIC UTILITIES - 1.2% | | | | |
| | 125,000 | | | AES Corporation (The) | | | 1,630,000 | |
| | | | | | | | | |
| | | | | ELECTRICAL EQUIPMENT - 2.9% | | | | |
| | 31,000 | | | Carrier Global Corporation | | | 2,398,470 | |
| | 1,980,000 | | | Orion Energy Systems, Inc.(a),(b) | | | 1,659,240 | |
| | | | | | | | 4,057,710 | |
| | | | | HEALTH CARE FACILITIES & SERVICES - 1.3% | | | | |
| | 3,000 | | | UnitedHealth Group, Inc. | | | 1,830,600 | |
| | | | | | | | | |
| | | | | INTERNET MEDIA & SERVICES - 3.3% | | | | |
| | 27,000 | | | Alphabet, Inc., Class A | | | 4,561,650 | |
The accompanying notes are an integral part of theses financial statements.
North Star Opportunity Fund
SCHEDULE OF INVESTMENTS (Continued)
November 30, 2024
| Shares | | | | | Fair Value | |
| | | | | COMMON STOCKS — 85.8% (Continued) | | | | |
| | | | | LEISURE FACILITIES & SERVICES - 7.4% | | | | |
| | 83,000 | | | Madison Square Garden Entertainment Corporation(a) | | $ | 3,070,170 | |
| | 75,000 | | | Sphere Entertainment Company(a) | | | 3,086,250 | |
| | 8,500 | | | Vail Resorts, Inc. | | | 1,523,540 | |
| | 140,000 | | | Wendy’s Company (The), Class A | | | 2,570,400 | |
| | | | | | | | 10,250,360 | |
| | | | | METALS & MINING - 1.5% | | | | |
| | 48,000 | | | Freeport-McMoRan, Inc. | | | 2,121,600 | |
| | | | | | | | | |
| | | | | MULTI ASSET CLASS REITS - 1.2% | | | | |
| | 185,000 | | | LXP Industrial Trust | | | 1,729,750 | |
| | | | | | | | | |
| | | | | OIL & GAS PRODUCERS - 4.6% | | | | |
| | 24,000 | | | Exxon Mobil Corporation | | | 2,831,040 | |
| | 125,000 | | | Kinder Morgan, Inc. | | | 3,533,750 | |
| | | | | | | | 6,364,790 | |
| | | | | RETAIL - CONSUMER STAPLES - 2.0% | | | | |
| | 21,000 | | | Target Corporation | | | 2,778,510 | |
| | | | | | | | | |
| | | | | RETAIL - DISCRETIONARY - 2.4% | | | | |
| | 24,000 | | | Boot Barn Holdings, Inc.(a) | | | 3,291,360 | |
| | | | | | | | | |
| | | | | RETAIL REIT - 1.6% | | | | |
| | 38,000 | | | Realty Income Corporation | | | 2,199,820 | |
| | | | | | | | | |
| | | | | SEMICONDUCTORS - 7.6% | | | | |
| | 35,500 | | | Advanced Micro Devices, Inc.(a) | | | 4,869,713 | |
| | 11,000 | | | NVIDIA Corporation | | | 1,520,750 | |
| | 26,000 | | | QUALCOMM, Inc. | | | 4,121,780 | |
| | | | | | | | 10,512,243 | |
| | | | | SPECIALTY REIT - 1.3% | | | | |
| | 40,000 | | | EPR Properties | | | 1,814,800 | |
| | | | | | | | | |
| | | | | TECHNOLOGY HARDWARE - 6.7% | | | | |
| | 28,000 | | | Apple, Inc. | | | 6,645,240 | |
The accompanying notes are an integral part of theses financial statements.
North Star Opportunity Fund
SCHEDULE OF INVESTMENTS (Continued)
November 30, 2024
| Shares | | | | | Fair Value | |
| | | | | COMMON STOCKS — 85.8% (Continued) | | | | |
| | | | | TECHNOLOGY HARDWARE - 6.7% (Continued) | | | | |
| | 44,000 | | | Cisco Systems, Inc. | | $ | 2,605,240 | |
| | | | | | | | 9,250,480 | |
| | | | | TECHNOLOGY SERVICES - 2.6% | | | | |
| | 25,000 | | | Paychex, Inc. | | | 3,656,750 | |
| | | | | | | | | |
| | | | | TRANSPORTATION & LOGISTICS - 1.5% | | | | |
| | 15,000 | | | United Parcel Service, Inc., B | | | 2,035,800 | |
| | | | | | | | | |
| | | | | WHOLESALE - DISCRETIONARY - 2.6% | | | | |
| | 81,300 | | | Acme United Corporation | | | 3,618,663 | |
| | | | | | | | | |
| | | | | TOTAL COMMON STOCKS (Cost $55,365,687) | | | 118,988,721 | |
| Shares | | | | | Fair Value | |
| | | | | PREFERRED STOCKS — 1.1% | | | | |
| | | | | ASSET MANAGEMENT — 1.1% | | | | |
| | 64,000 | | | Compass Diversified Holdings, 7.875% | | | 1,512,320 | |
| | | | | | | | | |
| | | | | TOTAL PREFERRED STOCKS (Cost $1,441,399) | | | 1,512,320 | |
| Principal | | | | | Coupon Rate | | | | | | | |
| Amount ($) | | | | | (%) | | | Maturity | | | Fair Value | |
| | | | | CORPORATE BONDS — 2.1% | | | | | | | | | | |
| | | | | INSTITUTIONAL FINANCIAL SERVICES — 0.7% | | | | | | | | | | |
| | 1,000,000 | | | Lazard Group, LLC | | 3.7500 | | | 02/13/25 | | | | 999,448 | |
| | | | | | | | | | | | | | | |
| | | | | LEISURE FACILITIES & SERVICES — 1.4% | | | | | | | | | | |
| | 1,850,000 | | | Wendy’s International, LLC | | 7.0000 | | | 12/15/25 | | | | 1,880,771 | |
| | | | | | | | | | | | | | | |
| | | | | TOTAL CORPORATE BONDS (Cost $2,880,338) | | | | | | | | | 2,880,219 | |
The accompanying notes are an integral part of theses financial statements.
North Star Opportunity Fund
SCHEDULE OF INVESTMENTS (Continued)
November 30, 2024
| Principal | | | | | Coupon Rate | | | | | | | |
| Amount ($) | | | | | (%) | | | Maturity | | | Fair Value | |
| | | | | U.S. GOVERNMENT & AGENCIES — 4.0% | | | | | | | | | | |
| | | | | U.S. TREASURY BILLS — 1.8% | | | | | | | | | | |
| | 1,000,000 | | | United States Treasury Bill(c) | | 4.2600 | | | 12/26/24 | | | $ | 996,973 | |
| | 1,500,000 | | | United States Treasury Bill(c) | | 4.3400 | | | 01/23/25 | | | | 1,490,423 | |
| | | | | | | | | | | | | | 2,487,396 | |
| | | | | U.S. TREASURY NOTES — 2.2% | | | | | | | | | | |
| | 1,000,000 | | | United States Treasury Note | | 3.8750 | | | 03/31/25 | | | | 998,118 | |
| | 1,000,000 | | | United States Treasury Note | | 3.8750 | | | 04/30/25 | | | | 997,828 | |
| | 1,000,000 | | | United States Treasury Note | | 4.2500 | | | 05/31/25 | | | | 999,052 | |
| | | | | | | | | | | | | | 2,994,998 | |
| | | | | TOTAL U.S. GOVERNMENT & AGENCIES (Cost $5,471,342) | | | | | | | | | 5,482,394 | |
| Shares | | | | | Fair Value | |
| | | | | SHORT-TERM INVESTMENTS — 6.9% | | | | |
| | | | | MONEY MARKET FUNDS - 6.9% | | | | |
| | 9,545,705 | | | First American Treasury Obligations Fund, Class X, 4.55% (Cost $9,545,705)(d) | | | 9,545,705 | |
| | | | | | | | | |
| | | | | TOTAL INVESTMENTS - 99.9% (Cost $74,704,471) | | $ | 138,409,359 | |
| | | | | OTHER ASSETS IN EXCESS OF LIABILITIES - 0.1% | | | 98,141 | |
| | | | | NET ASSETS - 100.0% | | $ | 138,507,500 | |
| LLC | - Limited Liability Company |
| REIT | - Real Estate Investment Trust |
| (a) | Non-income producing security. |
| (b) | Affiliated Company – North Star Opportunity Fund holds in excess of 5% of outstanding voting securities of this security. |
| (c) | Zero coupon bond. Rate disclosed is the current yield as of November 30, 2024. |
| (d) | Rate disclosed is the seven day effective yield as of November 30, 2024. |
The accompanying notes are an integral part of theses financial statements.
North Star Micro Cap Fund
SCHEDULE OF INVESTMENTS
November 30, 2024
| Shares | | | | | Fair Value | |
| | | | | COMMON STOCKS — 92.1% | | | | |
| | | | | AEROSPACE & DEFENSE - 1.1% | | | | |
| | 20,300 | | | Ducommun, Inc.(a) | | $ | 1,360,100 | |
| | | | | | | | | |
| | | | | APPAREL & TEXTILE PRODUCTS - 7.7% | | | | |
| | 149,000 | | | Lakeland Industries, Inc. | | | 3,373,360 | |
| | 47,000 | | | Movado Group, Inc. | | | 956,450 | |
| | 112,500 | | | Rocky Brands, Inc. | | | 2,441,250 | |
| | 175,000 | | | Superior Group of Companies, Inc. | | | 2,962,750 | |
| | | | | | | | 9,733,810 | |
| | | | | ASSET MANAGEMENT - 1.2% | | | | |
| | 92,000 | | | Westwood Holdings Group, Inc. | | | 1,453,600 | |
| | | | | | | | | |
| | | | | AUTOMOTIVE - 2.9% | | | | |
| | 49,500 | | | Miller Industries, Inc. | | | 3,644,190 | |
| | | | | | | | | |
| | | | | BANKING - 2.4% | | | | |
| | 50,500 | | | Bar Harbor Bankshares | | | 1,817,495 | |
| | 50,000 | | | First Busey Corporation | | | 1,334,500 | |
| | | | | | | | 3,151,995 | |
| | | | | BEVERAGES - 0.0% | | | | |
| | 278,942 | | | Truett-Hurst, Inc.(a),(b),(c) | | | – | |
| | | | | | | | | |
| | | | | COMMERCIAL SUPPORT SERVICES - 8.3% | | | | |
| | 112,000 | | | Barrett Business Services, Inc. | | | 4,805,920 | |
| | 107,000 | | | Hackett Group, Inc. (The) | | | 3,353,380 | |
| | 100,000 | | | Healthcare Services Group, Inc.(a) | | | 1,234,000 | |
| | 150,000 | | | Quest Resource Holding Corporation(a) | | | 1,096,500 | |
| | | | | | | | 10,489,800 | |
| | | | | CONSTRUCTION MATERIALS - 9.1% | | | | |
| | 19,000 | | | Apogee Enterprises, Inc. | | | 1,599,990 | |
| | 65,000 | | | United States Lime & Minerals, Inc. | | | 9,945,000 | |
| | | | | | | | 11,544,990 | |
| | | | | CONSUMER SERVICES - 1.1% | | | | |
| | 85,000 | | | Lincoln Educational Services Corporation(a) | | | 1,396,550 | |
The accompanying notes are an integral part of these financial statements.
North Star Micro Cap Fund
SCHEDULE OF INVESTMENTS (Continued)
November 30, 2024
| Shares | | | | | Fair Value | |
| | | | | COMMON STOCKS — 92.1% (Continued) | | | | |
| | | | | E-COMMERCE DISCRETIONARY - 2.6% | | | | |
| | 126,000 | | | Liquidity Services, Inc.(a) | | $ | 3,221,820 | |
| | | | | | | | | |
| | | | | ELECTRICAL EQUIPMENT - 0.9% | | | | |
| | 43,000 | | | Allient, Inc. | | | 1,116,710 | |
| | | | | | | | | |
| | | | | FOOD - 2.1% | | | | |
| | 16,000 | | | Nathan’s Famous, Inc. | | | 1,400,000 | |
| | 72,000 | | | Nature’s Sunshine Products, Inc.(a) | | | 1,169,280 | |
| | | | | | | | 2,569,280 | |
| | | | | HOME & OFFICE PRODUCTS - 3.4% | | | | |
| | 203,000 | | | ACCO Brands Corporation | | | 1,181,460 | |
| | 88,051 | | | Hamilton Beach Brands Holding Company, Class A | | | 1,705,548 | |
| | 82,000 | | | Virco Mfg. Corporation | | | 1,346,440 | |
| | | | | | | | 4,233,448 | |
| | | | | HOME CONSTRUCTION - 7.3% | | | | |
| | 76,000 | | | Green Brick Partners, Inc.(a) | | | 5,430,960 | |
| | 143,000 | | | Interface, Inc. | | | 3,796,650 | |
| | | | | | | | 9,227,610 | |
| | | | | HOUSEHOLD PRODUCTS - 1.3% | | | | |
| | 19,800 | | | Central Garden & Pet Company(a) | | | 787,050 | |
| | 4,950 | | | Central Garden & Pet Company, Class A(a) | | | 167,261 | |
| | 157,000 | | | Crown Crafts, Inc. | | | 722,200 | |
| | | | | | | | 1,676,511 | |
| | | | | INDUSTRIAL INTERMEDIATE PROD - 2.7% | | | | |
| | 120,000 | | | Eastern Company (The) | | | 3,446,400 | |
| | | | | | | | | |
| | | | | INSURANCE - 1.2% | | | | |
| | 65,000 | | | Tiptree, Inc. | | | 1,481,350 | |
| | | | | | | | | |
| | | | | LEISURE PRODUCTS - 3.7% | | | | |
| | 238,000 | | | Escalade, Inc. | | | 3,570,000 | |
| | 32,101 | | | Johnson Outdoors, Inc., Class A | | | 1,080,520 | |
| | | | | | | | 4,650,520 | |
The accompanying notes are an integral part of these financial statements.
North Star Micro Cap Fund
SCHEDULE OF INVESTMENTS (Continued)
November 30, 2024
| Shares | | | | | Fair Value | |
| | | | | COMMON STOCKS — 92.1% (Continued) | | | | |
| | | | | MACHINERY - 6.4% | | | | |
| | 16,100 | | | Alamo Group, Inc. | | $ | 3,219,195 | |
| | 116,499 | | | QEP Company, Inc. | | | 3,991,839 | |
| | 10,500 | | | Tennant Company | | | 927,885 | |
| | | | | | | | 8,138,919 | |
| | | | | MEDICAL EQUIPMENT & DEVICES - 0.9% | | | | |
| | 483,000 | | | Accuray, Inc.(a) | | | 1,077,090 | |
| | | | | | | | | |
| | | | | OIL & GAS PRODUCERS - 3.2% | | | | |
| | 435,000 | | | Evolution Petroleum Corporation | | | 2,549,100 | |
| | 50,000 | | | World Kinect Corporation | | | 1,447,500 | |
| | | | | | | | 3,996,600 | |
| | | | | OIL & GAS SERVICES & EQUIPMENT - 1.0% | | | | |
| | 157,000 | | | ProPetro Holding Corporation(a) | | | 1,318,800 | |
| | | | | | | | | |
| | | | | RETAIL - DISCRETIONARY - 9.9% | | | | |
| | 21,000 | | | Boot Barn Holdings, Inc.(a) | | | 2,879,940 | |
| | 162,000 | | | Build-A-Bear Workshop, Inc. | | | 6,154,379 | |
| | 79,000 | | | Ethan Allen Interiors, Inc. | | | 2,427,670 | |
| | 33,000 | | | Shoe Carnival, Inc. | | | 1,114,080 | |
| | | | | | | | 12,576,069 | |
| | | | | SEMICONDUCTORS - 0.5% | | | | |
| | 35,000 | | | Penguin Solutions, Inc.(a) | | | 634,900 | |
| | | | | | | | | |
| | | | | SOFTWARE - 1.2% | | | | |
| | 170,000 | | | Cantaloupe, Inc.(a) | | | 1,543,600 | |
| | | | | | | | | |
| | | | | SPECIALTY REIT - 1.8% | | | | |
| | 163,000 | | | Postal Realty Trust, Inc. | | | 2,309,710 | |
| | | | | | | | | |
| | | | | TECHNOLOGY HARDWARE - 1.0% | | | | |
| | 83,000 | | | AstroNova, Inc.(a) | | | 1,275,710 | |
The accompanying notes are an integral part of these financial statements.
North Star Micro Cap Fund
SCHEDULE OF INVESTMENTS (Continued)
November 30, 2024
| Shares | | | | | Fair Value | |
| | | | | COMMON STOCKS — 92.1% (Continued) | | | | |
| | | | | TRANSPORTATION EQUIPMENT - 3.3% | | | | |
| | 102,000 | | | Blue Bird Corporation(a) | | $ | 4,146,300 | |
| | | | | | | | | |
| | | | | WHOLESALE - DISCRETIONARY - 3.9% | | | | |
| | 91,000 | | | Acme United Corporation | | | 4,050,410 | |
| | 144,000 | | | Hudson Technologies, Inc.(a) | | | 855,360 | |
| | | | | | | | 4,905,770 | |
| | | | | TOTAL COMMON STOCKS (Cost $62,285,955) | | | 116,322,152 | |
| Shares | | | | | Fair Value | |
| | | | | SHORT-TERM INVESTMENTS — 7.9% | | | | |
| | | | | MONEY MARKET FUNDS - 7.9% | | | | |
| | 10,021,203 | | | First American Treasury Obligations Fund, Class X, 4.55% (Cost $10,021,203)(d) | | | 10,021,203 | |
| | | | | | | | | |
| | | | | TOTAL INVESTMENTS - 100.0% (Cost $72,307,158) | | $ | 126,343,355 | |
| | | | | LIABILITIES IN EXCESS OF OTHER ASSETS - 0.0% | | | (19,081 | ) |
| | | | | NET ASSETS - 100.0% | | $ | 126,324,274 | |
| REIT | - Real Estate Investment Trust |
| (a) | Non-income producing security. |
| (b) | Affiliated Company – North Star Micro Cap Fund holds in excess of 5% of outstanding voting securities of this security. |
| (c) | Illiquid security. The total fair value of the securities at November 30, 2024 was $0 representing 0.0% of net assets. |
| (d) | Rate disclosed is the seven day effective yield as of November 30, 2024. |
The accompanying notes are an integral part of these financial statements.
North Star Dividend Fund
SCHEDULE OF INVESTMENTS
November 30, 2024
| Shares | | | | | Fair Value | |
| | | | | COMMON STOCKS — 89.6% | | | | |
| | | | | APPAREL & TEXTILE PRODUCTS - 7.6% | | | | |
| | 45,000 | | | Movado Group, Inc. | | $ | 915,750 | |
| | 87,000 | | | Rocky Brands, Inc. | | | 1,887,900 | |
| | 148,000 | | | Superior Group of Companies, Inc. | | | 2,505,640 | |
| | 59,000 | | | Weyco Group, Inc. | | | 2,106,890 | |
| | | | | | | | 7,416,180 | |
| | | | | ASSET MANAGEMENT - 10.3% | | | | |
| | 122,300 | | | Compass Diversified Holdings | | | 2,898,510 | |
| | 81,000 | | | Sprott, Inc. | | | 3,592,350 | |
| | 35,000 | | | Vitesse Energy, Inc. | | | 982,800 | |
| | 153,700 | | | Westwood Holdings Group, Inc. | | | 2,428,460 | |
| | | | | | | | 9,902,120 | |
| | | | | BANKING - 5.6% | | | | |
| | 15,850 | | | Bank of Hawaii Corporation | | | 1,251,833 | |
| | 76,500 | | | Bar Harbor Bankshares | | | 2,753,235 | |
| | 10,000 | | | Wintrust Financial Corporation | | | 1,380,100 | |
| | | | | | | | 5,385,168 | |
| | | | | CHEMICALS - 3.5% | | | | |
| | 49,000 | | | Oil-Dri Corp of America | | | 3,386,880 | |
| | | | | | | | | |
| | | | | COMMERCIAL SUPPORT SERVICES - 3.3% | | | | |
| | 23,200 | | | ABM Industries, Inc. | | | 1,326,344 | |
| | 45,000 | | | Ennis, Inc. | | | 959,850 | |
| | 106,000 | | | Resources Connection, Inc. | | | 894,640 | |
| | | | | | | | 3,180,834 | |
| | | | | CONSTRUCTION MATERIALS - 1.6% | | | | |
| | 18,100 | | | Apogee Enterprises, Inc. | | | 1,524,201 | |
| | | | | | | | | |
| | | | | ELECTRIC UTILITIES - 7.0% | | | | |
| | 46,000 | | | Avista Corporation | | | 1,779,740 | |
| | 38,000 | | | Northwestern Energy Group, Inc. | | | 2,099,120 | |
| | 10,500 | | | Otter Tail Corporation | | | 846,720 | |
| | 33,500 | | | Unitil Corporation | | | 2,010,670 | |
| | | | | | | | 6,736,250 | |
The accompanying notes are an integral part of these financial statements.
North Star Dividend Fund
SCHEDULE OF INVESTMENTS (Continued)
November 30, 2024
| Shares | | | | | Fair Value | |
| | | | | COMMON STOCKS — 89.6% (Continued) | | | | |
| | | | | ELECTRICAL EQUIPMENT - 3.8% | | | | |
| | 178,000 | | | LSI Industries, Inc. | | $ | 3,638,320 | |
| | | | | | | | | |
| | | | | GAS & WATER UTILITIES - 8.3% | | | | |
| | 51,000 | | | Artesian Resources Corporation, Class A | | | 1,771,740 | |
| | 162,000 | | | Global Water Resources, Inc. | | | 2,170,800 | |
| | 48,000 | | | Northwest Natural Holding Company | | | 2,103,360 | |
| | 90,000 | | | RGC Resources, Inc. | | | 1,872,000 | |
| | | | | | | | 7,917,900 | |
| | | | | HOME & OFFICE PRODUCTS - 6.2% | | | | |
| | 157,000 | | | ACCO Brands Corporation | | | 913,740 | |
| | 64,000 | | | Flexsteel Industries, Inc. | | | 3,777,920 | |
| | 64,000 | | | Hamilton Beach Brands Holding Company, Class A | | | 1,239,680 | |
| | | | | | | | 5,931,340 | |
| | | | | HOUSEHOLD PRODUCTS - 3.4% | | | | |
| | 169,000 | | | Crown Crafts, Inc. | | | 777,400 | |
| | 66,000 | | | Energizer Holdings, Inc. | | | 2,515,260 | |
| | | | | | | | 3,292,660 | |
| | | | | INSURANCE - 1.0% | | | | |
| | 79,000 | | | Crawford & Company | | | 936,150 | |
| | | | | | | | | |
| | | | | LEISURE FACILITIES & SERVICES - 0.1% | | | | |
| | 6,000 | | | Wendy’s Company (The), Class A | | | 110,160 | |
| | | | | | | | | |
| | | | | LEISURE PRODUCTS - 3.0% | | | | |
| | 190,000 | | | Escalade, Inc. | | | 2,850,000 | |
| | | | | | | | | |
| | | | | MULTI ASSET CLASS REITS - 2.0% | | | | |
| | 48,000 | | | Alexander & Baldwin, Inc. | | | 944,640 | |
| | 107,000 | | | LXP Industrial Trust | | | 1,000,450 | |
| | | | | | | | 1,945,090 | |
| | | | | OIL & GAS PRODUCERS - 3.2% | | | | |
| | 367,000 | | | Evolution Petroleum Corporation | | | 2,150,620 | |
| | 149,000 | | | Granite Ridge Resources, Inc. | | | 961,050 | |
| | | | | | | | 3,111,670 | |
The accompanying notes are an integral part of these financial statements.
North Star Dividend Fund
SCHEDULE OF INVESTMENTS (Continued)
November 30, 2024
| Shares | | | | | Fair Value | |
| | | | | COMMON STOCKS — 89.6% (Continued) | | | | |
| | | | | OIL & GAS SERVICES & EQUIPMENT - 1.9% | | | | |
| | 121,000 | | | Select Water Solutions, Inc., Class A | | $ | 1,787,170 | |
| | | | | | | | | |
| | | | | RESIDENTIAL REIT - 2.5% | | | | |
| | 125,000 | | | UMH Properties, Inc. | | | 2,400,000 | |
| | | | | | | | | |
| | | | | RETAIL - CONSUMER STAPLES - 1.3% | | | | |
| | 38,000 | | | Village Super Market, Inc., Class A | | | 1,230,060 | |
| | | | | | | | | |
| | | | | RETAIL - DISCRETIONARY - 4.7% | | | | |
| | 22,000 | | | Buckle, Inc. (The) | | | 1,145,980 | |
| | 96,300 | | | Ethan Allen Interiors, Inc. | | | 2,959,299 | |
| | 14,000 | | | Monro, Inc. | | | 393,680 | |
| | | | | | | | 4,498,959 | |
| | | | | SOFTWARE - 1.0% | | | | |
| | 96,000 | | | Logility Supply Chain Solutions, Inc., Class A | | | 1,010,880 | |
| | | | | | | | | |
| | | | | SPECIALTY FINANCE - 2.4% | | | | |
| | 14,000 | | | GATX Corporation | | | 2,298,240 | |
| | | | | | | | | |
| | | | | SPECIALTY REIT - 2.9% | | | | |
| | 196,000 | | | Postal Realty Trust, Inc. | | | 2,777,320 | |
| | | | | | | | | |
| | | | | TECHNOLOGY SERVICES - 0.9% | | | | |
| | 16,100 | | | Value Line, Inc. | | | 838,166 | |
| | | | | | | | | |
| | | | | TELECOMMUNICATIONS - 2.1% | | | | |
| | 122,000 | | | Spok Holdings, Inc. | | | 2,002,020 | |
| | | | | | | | | |
| | | | | TOTAL COMMON STOCKS (Cost $60,995,358) | | | 86,107,738 | |
The accompanying notes are an integral part of these financial statements.
North Star Dividend Fund
SCHEDULE OF INVESTMENTS (Continued)
November 30, 2024
| Shares | | | | | Fair Value | |
| | | | | PREFERRED STOCKS — 1.0% | | | | |
| | | | | HOME CONSTRUCTION — 1.0% | | | | |
| | 40,000 | | | Green Brick Partners, Inc., 5.750% | | $ | 950,052 | |
| | | | | | | | | |
| | | | | TOTAL PREFERRED STOCKS (Cost $846,709) | | | 950,052 | |
| Shares | | | | | Fair Value | |
| | | | | SHORT-TERM INVESTMENTS — 9.1% | | | | |
| | | | | MONEY MARKET FUNDS - 9.1% | | | | |
| | 8,724,386 | | | First American Treasury Obligations Fund, Class X, 4.55% (Cost $8,724,386)(a) | | | 8,724,386 | |
| | | | | | | | | |
| | | | | TOTAL INVESTMENTS - 99.7% (Cost $70,566,453) | | $ | 95,782,176 | |
| | | | | OTHER ASSETS IN EXCESS OF LIABILITIES - 0.3% | | | 279,340 | |
| | | | | NET ASSETS - 100.0% | | $ | 96,061,516 | |
| REIT | - Real Estate Investment Trust |
| (a) | Rate disclosed is the seven day effective yield as of November 30, 2024. |
The accompanying notes are an integral part of these financial statements.
North Star Bond Fund
SCHEDULE OF INVESTMENTS
November 30, 2024
| Shares | | | | | Fair Value | |
| | | | | PREFERRED STOCKS — 6.9% | | | | |
| | | | | ASSET MANAGEMENT — 2.1% | | | | |
| | 29,000 | | | Compass Diversified Holdings, 7.875% | | $ | 685,270 | |
| | | | | | | | | |
| | | | | BANKING — 2.0% | | | | |
| | 27,000 | | | Bank of America Corporation, 4.000% | | | 663,660 | |
| | | | | | | | | |
| | | | | INSTITUTIONAL FINANCIAL SERVICES — 0.7% | | | | |
| | 250,000 | | | Mellon Capital IV - Series 1, 5.6400% | | | 220,101 | |
| | | | | | | | | |
| | | | | REAL ESTATE INVESTMENT TRUSTS — 2.1% | | | | |
| | 31,000 | | | EPR Properties - Series C, 5.7500% | | | 665,260 | |
| | | | | | | | | |
| | | | | TOTAL PREFERRED STOCKS (Cost $2,176,741) | | | 2,234,291 | |
Principal
Amount ($) | | | | | Coupon Rate
(%) | | | Maturity | | | Fair Value | |
| | | | | CORPORATE BONDS — 84.4% | | | | | | | | | | |
| | | | | AEROSPACE & DEFENSE — 3.0% | | | | | | | | | | |
| | 1,000,000 | | | TransDigm, Inc. | | 5.5000 | | | 11/15/27 | | | | 992,354 | |
| | | | | | | | | | | | | | | |
| | | | | APPAREL & TEXTILE PRODUCTS — 4.4% | | | | | | | | | | |
| | 1,475,000 | | | Under Armour, Inc. | | 3.2500 | | | 06/15/26 | | | | 1,428,947 | |
| | | | | | | | | | | | | | | |
| | | | | ASSET MANAGEMENT — 6.9% | | | | | | | | | | |
| | 850,000 | | | Blackstone Private Credit Fund | | 2.6250 | | | 12/15/26 | | | | 805,304 | |
| | 1,500,000 | | | Hercules Capital, Inc. | | 2.6250 | | | 09/16/26 | | | | 1,426,666 | |
| | | | | | | | | | | | | | 2,231,970 | |
| | | | | AUTOMOTIVE — 4.2% | | | | | | | | | | |
| | 1,350,000 | | | Ford Motor Company | | 7.1250 | | | 11/15/25 | | | | 1,371,254 | |
| | | | | | | | | | | | | | | |
| | | | | BANKING — 4.4% | | | | | | | | | | |
| | 1,500,000 | | | Wintrust Financial Corporation | | 4.8500 | | | 06/06/29 | | | | 1,436,380 | |
| | | | | | | | | | | | | | | |
| | | | | BIOTECH & PHARMA — 4.4% | | | | | | | | | | |
| | 1,400,000 | | | Elanco Animal Health, Inc. | | 6.6500 | | | 08/28/28 | | | | 1,448,539 | |
The accompanying notes are an integral part of these financial statements.
North Star Bond Fund
SCHEDULE OF INVESTMENTS (Continued)
November 30, 2024
Principal
Amount ($) | | | | | Coupon Rate
(%) | | | Maturity | | | Fair Value | |
| | | | | CORPORATE BONDS — 84.4% (Continued) | | | | | | | | | | |
| | | | | CONTAINERS & PACKAGING — 3.7% | | | | | | | | | | |
| | 1,200,000 | | | Ball Corporation | | 5.2500 | | | 07/01/25 | | | $ | 1,200,857 | |
| | | | | | | | | | | | | | | |
| | | | | FOOD — 4.3% | | | | | | | | | | |
| | 1,400,000 | | | J M Smucker Company (The) | | 3.5000 | | | 03/15/25 | | | | 1,393,033 | |
| | | | | | | | | | | | | | | |
| | | | | HOME & OFFICE PRODUCTS — 11.2% | | | | | | | | | | |
| | 1,000,000 | | | ACCO Brands Corporation(a) | | 4.2500 | | | 03/15/29 | | | | 929,515 | |
| | 1,360,000 | | | Scotts Miracle-Gro Company (The) | | 5.2500 | | | 12/15/26 | | | | 1,351,885 | |
| | 1,400,000 | | | Steelcase, Inc. | | 5.1250 | | | 01/18/29 | | | | 1,362,931 | |
| | | | | | | | | | | | | | 3,644,331 | |
| | | | | HOME CONSTRUCTION — 6.8% | | | | | | | | | | |
| | 1,250,000 | | | Beazer Homes USA, Inc. | | 5.8750 | | | 10/15/27 | | | | 1,247,228 | |
| | 1,000,000 | | | Interface, Inc.(a) | | 5.5000 | | | 12/01/28 | | | | 981,375 | |
| | | | | | | | | | | | | | 2,228,603 | |
| | | | | HOUSEHOLD PRODUCTS — 3.7% | | | | | | | | | | |
| | 1,200,000 | | | Energizer Holdings, Inc.(a) | | 6.5000 | | | 12/31/27 | | | | 1,217,194 | |
| | | | | | | | | | | | | | | |
| | | | | INDUSTRIAL SUPPORT SERVICES — 3.1% | | | | | | | | | | |
| | 1,000,000 | | | United Rentals North America, Inc. | | 5.5000 | | | 05/15/27 | | | | 1,000,457 | |
| | | | | | | | | | | | | | | |
| | | | | INSTITUTIONAL FINANCIAL SERVICES — 3.7% | | | | | | | | | | |
| | 1,250,000 | | | Lazard Group, LLC | | 3.6250 | | | 03/01/27 | | | | 1,218,537 | |
| | | | | | | | | | | | | | | |
| | | | | LEISURE FACILITIES & SERVICES — 8.9% | | | | | | | | | | |
| | 1,400,000 | | | Cedar Fair, L.P./Canada’s Wonderland Company/Magnum Management Corporation | | 5.3750 | | | 04/15/27 | | | | 1,393,396 | |
| | 1,471,000 | | | Wendy’s International, LLC | | 7.0000 | | | 12/15/25 | | | | 1,495,467 | |
| | | | | | | | | | | | | | 2,888,863 | |
| | | | | OIL & GAS PRODUCERS — 4.3% | | | | | | | | | | |
| | 1,390,000 | | | Gulfport Energy Corporation | | 8.0000 | | | 05/17/26 | | | | 1,407,878 | |
| | | | | | | | | | | | | | | |
| | | | | OIL & GAS SERVICES & EQUIPMENT — 3.2% | | | | | | | | | | |
| | 1,050,000 | | | Oceaneering International, Inc. | | 6.0000 | | | 02/01/28 | | | | 1,042,832 | |
The accompanying notes are an integral part of these financial statements.
North Star Bond Fund
SCHEDULE OF INVESTMENTS (Continued)
November 30, 2024
Principal
Amount ($) | | | | | Coupon Rate
(%) | | | Maturity | | | Fair Value | |
| | | | | CORPORATE BONDS — 84.4% (Continued) | | | | | | | | | | |
| | | | | REAL ESTATE INVESTMENT TRUSTS — 4.2% | | | | | | | | | | |
| | 1,400,000 | | | EPR Properties | | 4.9500 | | | 04/15/28 | | | $ | 1,381,832 | |
| | | | | | | | | | | | | | | |
| | | | | TOTAL CORPORATE BONDS (Cost $27,170,679) | | | | | | | | | 27,533,861 | |
Principal
Amount ($) | | | | | Coupon Rate
(%) | | | Maturity | | | Fair Value | |
| | | | | U.S. GOVERNMENT & AGENCIES — 4.6% | | | | | | | | | | |
| | | | | U.S. TREASURY BILLS — 1.5% | | | | | | | | | | |
| | 500,000 | | | United States Treasury Bill(b) | | 4.3800 | | | 02/13/25 | | | | 495,539 | |
| | | | | | | | | | | | | | | |
| | | | | U.S. TREASURY NOTES — 3.1% | | | | | | | | | | |
| | 500,000 | | | United States Treasury Note | | 3.8750 | | | 03/31/25 | | | | 499,059 | |
| | 500,000 | | | United States Treasury Note | | 3.8750 | | | 04/30/25 | | | | 498,914 | |
| | | | | | | | | | | | | | 997,973 | |
| | | | | TOTAL U.S. GOVERNMENT & AGENCIES (Cost $1,490,261) | | | | | | | | | 1,493,512 | |
| Shares | | | | | Fair Value | |
| | | | | SHORT-TERM INVESTMENTS — 2.9% | | | | |
| | | | | MONEY MARKET FUNDS - 2.9% | | | | |
| | 945,459 | | | First American Treasury Obligations Fund, Class X, 4.55% (Cost $945,459)(c) | | | 945,459 | |
| | | | | | | | | |
| | | | | TOTAL INVESTMENTS - 98.8% (Cost $31,783,140) | | $ | 32,207,123 | |
| | | | | OTHER ASSETS IN EXCESS OF LIABILITIES - 1.2% | | | 402,274 | |
| | | | | NET ASSETS - 100.0% | | $ | 32,609,397 | |
| LLC | - Limited Liability Company |
| (a) | Security exempt from registration under Rule 144A or Section 4(2) of the Securities Act of 1933. The security may be resold in transactions exempt from registration, normally to qualified institutional buyers. As of November 30, 2024 the total market value of 144A securities is $3,128,084 or 9.6% of net assets. |
| (b) | Zero coupon bond. Rate disclosed is the current yield as of November 30, 2024. |
| (c) | Rate disclosed is the seven day effective yield as of November 30, 2024. |
The accompanying notes are an integral part of these financial statements.
North Star Small Cap Value Fund
SCHEDULE OF INVESTMENTS
November 30, 2024
| Shares | | | | | Fair Value | |
| | | | | COMMON STOCKS — 94.5% | | | | |
| | | | | ASSET MANAGEMENT - 6.1% | | | | |
| | 18,000 | | | Compass Diversified Holdings | | $ | 426,600 | |
| | 22,000 | | | Sprott, Inc. | | | 975,700 | |
| | 69,000 | | | WisdomTree, Inc. | | | 824,550 | |
| | | | | | | | 2,226,850 | |
| | | | | BANKING - 7.6% | | | | |
| | 15,500 | | | Bar Harbor Bankshares | | | 557,845 | |
| | 3,710 | | | City Holding Company | | | 487,197 | |
| | 12,000 | | | NBT Bancorp, Inc. | | | 601,440 | |
| | 12,460 | | | QCR Holdings, Inc. | | | 1,147,691 | |
| | | | | | | | 2,794,173 | |
| | | | | COMMERCIAL SUPPORT SERVICES - 7.0% | | | | |
| | 46,861 | | | Hackett Group, Inc. (The) | | | 1,468,624 | |
| | 18,225 | | | V2X, Inc.(a) | | | 1,098,056 | |
| | | | | | | | 2,566,680 | |
| | | | | E-COMMERCE DISCRETIONARY - 3.2% | | | | |
| | 45,200 | | | Liquidity Services, Inc.(a) | | | 1,155,764 | |
| | | | | | | | | |
| | | | | ELECTRICAL EQUIPMENT - 9.8% | | | | |
| | 27,000 | | | Allient, Inc. | | | 701,190 | |
| | 53,000 | | | LSI Industries, Inc. | | | 1,083,320 | |
| | 10,152 | | | OSI Systems, Inc.(a) | | | 1,800,965 | |
| | | | | | | | 3,585,475 | |
| | | | | ENGINEERING & CONSTRUCTION - 11.5% | | | | |
| | 4,400 | | | Comfort Systems USA, Inc. | | | 2,170,389 | |
| | 17,500 | | | VSE Corporation | | | 2,052,050 | |
| | | | | | | | 4,222,439 | |
| | | | | GAS & WATER UTILITIES - 2.3% | | | | |
| | 63,000 | | | Global Water Resources, Inc. | | | 844,200 | |
| | | | | | | | | |
| | | | | HOME CONSTRUCTION - 4.5% | | | | |
| | 15,980 | | | Champion Homes, Inc.(a) | | | 1,657,605 | |
The accompanying notes are an integral part of theses financial statements.
North Star Small Cap Value Fund
SCHEDULE OF INVESTMENTS (Continued)
November 30, 2024
| Shares | | | | | Fair Value | |
| | | | | COMMON STOCKS — 94.5% (Continued) | | | | |
| | | | | HOUSEHOLD PRODUCTS - 2.3% | | | | |
| | 11,000 | | | Central Garden & Pet Company(a) | | $ | 437,250 | |
| | 11,000 | | | Energizer Holdings, Inc. | | | 419,210 | |
| | | | | | | | 856,460 | |
| | | | | INDUSTRIAL INTERMEDIATE PROD - 4.7% | | | | |
| | 18,574 | | | AZZ, Inc. | | | 1,729,982 | |
| | | | | | | | | |
| | | | | LEISURE FACILITIES & SERVICES - 4.5% | | | | |
| | 60,000 | | | Lucky Strike Entertainment Corporation | | | 738,600 | |
| | 22,400 | | | Sphere Entertainment Company(a) | | | 921,760 | |
| | | | | | | | 1,660,360 | |
| | | | | MACHINERY - 3.3% | | | | |
| | 6,063 | | | Alamo Group, Inc. | | | 1,212,297 | |
| | | | | | | | | |
| | | | | MEDICAL EQUIPMENT & DEVICES - 1.1% | | | | |
| | 4,675 | | | Haemonetics Corporation(a) | | | 408,922 | |
| | | | | | | | | |
| | | | | OIL & GAS PRODUCERS - 2.8% | | | | |
| | 5,900 | | | Gulfport Energy Corporation(a) | | | 1,037,220 | |
| | | | | | | | | |
| | | | | OIL & GAS SERVICES & EQUIPMENT - 6.3% | | | | |
| | 65,000 | | | Helix Energy Solutions Group, Inc.(a) | | | 694,850 | |
| | 100,000 | | | ProPetro Holding Corporation(a) | | | 840,000 | |
| | 24,200 | | | Thermon Group Holdings, Inc.(a) | | | 763,752 | |
| | | | | | | | 2,298,602 | |
| | | | | RESIDENTIAL REIT - 2.6% | | | | |
| | 49,561 | | | UMH Properties, Inc. | | | 951,571 | |
| | | | | | | | | |
| | | | | RETAIL - DISCRETIONARY - 6.0% | | | | |
| | 6,800 | | | Boot Barn Holdings, Inc.(a) | | | 932,552 | |
| | 21,817 | | | Shoe Carnival, Inc. | | | 736,542 | |
| | 5,300 | | | Signet Jewelers Ltd. | | | 531,060 | |
| | | | | | | | 2,200,154 | |
The accompanying notes are an integral part of theses financial statements.
North Star Small Cap Value Fund
SCHEDULE OF INVESTMENTS (Continued)
November 30, 2024
| Shares | | | | | Fair Value | |
| | | | | COMMON STOCKS — 94.5% (Continued) | | | | |
| | | | | SEMICONDUCTORS - 1.5% | | | | |
| | 7,392 | | | Axcelis Technologies, Inc.(a) | | $ | 548,782 | |
| | | | | | | | | |
| | | | | SPECIALTY REIT - 2.1% | | | | |
| | 55,500 | | | Postal Realty Trust, Inc. | | | 786,435 | |
| | | | | | | | | |
| | | | | STEEL - 1.3% | | | | |
| | 7,800 | | | Commercial Metals Company | | | 481,182 | |
| | | | | | | | | |
| | | | | TRANSPORTATION EQUIPMENT - 3.3% | | | | |
| | 29,400 | | | Blue Bird Corporation(a) | | | 1,195,110 | |
| | | | | | | | | |
| | | | | WHOLESALE - DISCRETIONARY - 0.7% | | | | |
| | 44,000 | | | Hudson Technologies, Inc.(a) | | | 261,360 | |
| | | | | | | | | |
| | | | | TOTAL COMMON STOCKS (Cost $18,361,760) | | | 34,681,623 | |
| Shares | | | | | Fair Value | |
| | | | | SHORT-TERM INVESTMENTS — 5.5% | | | | |
| | | | | MONEY MARKET FUNDS - 5.5% | | | | |
| | 2,005,942 | | | First American Treasury Obligations Fund, Class X, 4.55% (Cost $2,005,942)(b) | | | 2,005,942 | |
| | | | | | | | | |
| | | | | TOTAL INVESTMENTS - 100.0% (Cost $20,367,702) | | $ | 36,687,565 | |
| | | | | LIABILITIES IN EXCESS OF OTHER ASSETS - 0.0% | | | (17,291 | ) |
| | | | | NET ASSETS - 100.0% | | $ | 36,670,274 | |
| REIT | - Real Estate Investment Trust |
| (a) | Non-income producing security. |
| (b) | Rate disclosed is the seven day effective yield as of November 30, 2024. |
The accompanying notes are an integral part of theses financial statements.
North Star Funds
STATEMENTS OF ASSETS AND LIABILITIES
November 30, 2024
| | | North Star
Opportunity
Fund | | | North Star
Micro Cap
Fund | | | North Star
Dividend
Fund | | | North Star
Bond
Fund | | | North Star
Small Cap Value
Fund | |
| Assets: | | | | | | | | | | | | | | | | | | | | |
| Investments in Unaffiliated Securities at Cost | | $ | 72,477,723 | | | $ | 72,307,158 | | | $ | 70,566,453 | | | $ | 31,783,140 | | | $ | 20,367,702 | |
| Investments in Non-controlled Affiliated Securities at Cost | | | 2,226,748 | | | | - | | | | - | | | | - | | | | - | |
| Total Securities at Cost | | | 74,704,471 | | | | 72,307,158 | | | | 70,566,453 | | | | 31,783,140 | | | | 20,367,702 | |
| | | | | | | | | | | | | | | | | | | | | |
| Investments in Unaffiliated Securities at Value | | $ | 136,750,119 | | | $ | 126,343,355 | | | $ | 95,782,176 | | | $ | 32,207,123 | | | $ | 36,687,565 | |
| Investments in Non-controlled Affiliated Securities at Value | | | 1,659,240 | | | | - | | | | - | | | | - | | | | - | |
| Total Securities at Value | | | 138,409,359 | | | | 126,343,355 | | | | 95,782,176 | | | | 32,207,123 | | | | 36,687,565 | |
| | | | | | | | | | | | | | | | | | | | | |
| Cash | | | 21,250 | | | | - | | | | - | | | | - | | | | | |
| Dividends and Interest Receivable | | | 245,898 | | | | 140,763 | | | | 393,564 | | | | 465,918 | | | | 36,995 | |
| Receivable for Fund Shares Sold | | | 594 | | | | 25 | | | | 700 | | | | - | | | | 97 | |
| Prepaid Expenses and Other Assets | | | 9,977 | | | | 10,619 | | | | 16,565 | | | | 4,255 | | | | 6,662 | |
| Total Assets | | | 138,687,078 | | | | 126,494,762 | | | | 96,193,005 | | | | 32,677,296 | | | | 36,731,319 | |
| | | | | | | | | | | | | | | | | | | | | |
| Liabilities: | | | | | | | | | | | | | | | | | | | | |
| Payable for Fund Shares Redeemed | | | - | | | | 20,000 | | | | - | | | | - | | | | 1,177 | |
| Investment Advisory Fees Payable | | | 111,895 | | | | 98,602 | | | | 77,366 | | | | 22,754 | | | | 10,024 | |
| Distribution (12b-1) Fees Payable | | | 3,127 | | | | - | | | | - | | | | - | | | | 6,337 | |
| Payable to Related Parties | | | 19,840 | | | | 14,673 | | | | 14,803 | | | | 13,244 | | | | 9,616 | |
| Audit and Tax Fees Payable | | | 19,249 | | | | 19,293 | | | | 19,182 | | | | 19,014 | | | | 22,305 | |
| Accrued Expenses and Other Liabilities | | | 25,467 | | | | 17,920 | | | | 20,138 | | | | 12,887 | | | | 11,586 | |
| Total Liabilities | | | 179,578 | | | | 170,488 | | | | 131,489 | | | | 67,899 | | | | 61,045 | |
| | | | | | | | | | | | | | | | | | | | | |
| Net Assets | | $ | 138,507,500 | | | $ | 126,324,274 | | | $ | 96,061,516 | | | $ | 32,609,397 | | | $ | 36,670,274 | |
| | | | | | | | | | | | | | | | | | | | | |
| Composition of Net Assets: | | | | | | | | | | | | | | | | | | | | |
| At November 30, 2024, Net Assets consisted of: | | | | | | | | | | | | | | | | | | | | |
| Paid-in-Capital | | $ | 70,647,152 | | | $ | 68,768,036 | | | $ | 68,864,381 | | | $ | 35,588,624 | | | $ | 16,169,779 | |
| Accumulated Earnings/(Losses) | | | 67,860,348 | | | | 57,556,238 | | | | 27,197,135 | | | | (2,979,227 | ) | | | 20,500,495 | |
| Net Assets | | $ | 138,507,500 | | | $ | 126,324,274 | | | $ | 96,061,516 | | | $ | 32,609,397 | | | $ | 36,670,274 | |
| | | | | | | | | | | | | | | | | | | | | |
| Net Asset Value Per Share: | | | | | | | | | | | | | | | | | | | | |
| Class I Shares: | | | | | | | | | | | | | | | | | | | | |
| Net Assets | | $ | 126,785,855 | | | $ | 126,324,274 | | | $ | 96,061,516 | | | $ | 32,609,397 | | | | | |
| Shares of Beneficial Interest Outstanding ($0 par value, unlimited shares authorized) | | | 6,928,406 | | | | 2,827,202 | | | | 4,014,862 | | | | 3,643,572 | | | | | |
| Net Asset Value (Net Assets/Shares Outstanding), Offering Price and Redemption Price Per Share* | | $ | 18.30 | | | $ | 44.68 | | | $ | 23.93 | | | $ | 8.95 | | | | | |
| | | | | | | | | | | | | | | | | | | | | |
| Class A Shares: | | | | | | | | | | | | | | | | | | | | |
| Net Assets | | $ | 11,721,645 | | | | | | | | | | | | | | | | | |
| Shares of Beneficial Interest Outstanding ($0 par value, unlimited shares authorized) | | | 636,352 | | | | | | | | | | | | | | | | | |
| Net Asset Value (Net Assets/Shares Outstanding) and Redemption Price Per Share* | | $ | 18.42 | | | | | | | | | | | | | | | | | |
| Maximum Offering Price Per Share (Maximum Sales Charge of 5.75%) | | $ | 19.54 | | | | | | | | | | | | | | | | | |
| | | | | | | | | | | | | | | | | | | | | |
| Institutional Class Shares: | | | | | | | | | | | | | | | | | | | | |
| Net Assets | | | | | | | | | | | | | | | | | | $ | 4,661,899 | |
| Shares of Beneficial Interest Outstanding ($0 par value, unlimited shares authorized) | | | | | | | | | | | | | | | | | | | 266,990 | |
| Net Asset Value (Net Assets/Shares Outstanding), Offering Price and Redemption Price Per Share | | | | | | | | | | | | | | | | | | $ | 17.46 | |
| | | | | | | | | | | | | | | | | | | | | |
| Investor Class Shares: | | | | | | | | | | | | | | | | | | | | |
| Net Assets | | | | | | | | | | | | | | | | | | $ | 32,008,375 | |
| Shares of Beneficial Interest Outstanding ($0 par value, unlimited shares authorized) | | | | | | | | | | | | | | | | | | | 1,828,209 | |
| Net Asset Value (Net Assets/Shares Outstanding), Offering Price and Redemption Price Per Share | | | | | | | | | | | | | | | | | | $ | 17.51 | |
| * | The Fund charges a fee of 2.00% on redemptions of shares held for less than 30 days. |
The accompanying notes are an integral part of these financial statements.
North Star Funds
STATEMENTS OF OPERATIONS
For the Year Ended November 30, 2024
| | | North Star Opportunity
Fund | | | North Star Micro Cap
Fund | | | North Star Dividend
Fund | | | North Star Bond
Fund | | | North Star Small Cap Value Fund | |
| Investment Income | | | | | | | | | | | | | | | | | | | | |
| Dividends from Unaffiliated Investments (net of $0, $0, $13,939, $0, and $3,466 in foreign dividend tax withheld) | | $ | 2,252,711 | | | $ | 1,982,285 | | | $ | 3,337,073 | | | $ | 183,003 | | | $ | 303,727 | |
| Interest | | | 944,162 | | | | 426,559 | | | | 438,537 | | | | 1,657,558 | | | | 103,384 | |
| Total Investment Income | | | 3,196,873 | | | | 2,408,844 | | | | 3,775,610 | | | | 1,840,561 | | | | 407,111 | |
| | | | | | | | | | | | | | | | | | | | | |
| Expenses | | | | | | | | | | | | | | | | | | | | |
| Investment Advisory Fees | | | 1,310,548 | | | | 1,124,152 | | | | 903,054 | | | | 264,863 | | | | 362,782 | |
| Distribution (12b-1) Fees - Class A | | | 30,630 | | | | - | | | | - | | | | - | | | | - | |
| Distribution (12b-1) Fees - Investor Class | | | - | | | | - | | | | - | | | | - | | | | 80,070 | |
| Third Party Administrative Servicing Fees | | | 121,288 | | | | 94,225 | | | | 85,355 | | | | 28,383 | | | | 5,134 | |
| Administrative Service Fees | | | 121,267 | | | | 106,970 | | | | 88,341 | | | | 51,737 | | | | 45,613 | |
| Accounting Service Fees | | | 55,358 | | | | 41,008 | | | | 32,166 | | | | 18,019 | | | | 18,761 | |
| Registration Fees | | | 44,234 | | | | 26,849 | | | | 23,828 | | | | 27,275 | | | | 36,682 | |
| Transfer Agent Fees | | | 35,253 | | | | 17,146 | | | | 23,385 | | | | 16,131 | | | | 14,568 | |
| Trustees’ Fees and Expenses | | | 23,349 | | | | 23,216 | | | | 23,346 | | | | 23,346 | | | | 21,486 | |
| Legal Fees | | | 23,311 | | | | 22,880 | | | | 22,943 | | | | 23,153 | | | | 18,438 | |
| Audit and Tax Fees | | | 18,407 | | | | 18,483 | | | | 15,722 | | | | 20,886 | | | | 23,478 | |
| Chief Compliance Officer Fees | | | 12,819 | | | | 11,373 | | | | 10,050 | | | | 6,926 | | | | 6,536 | |
| Insurance Expense | | | 11,930 | | | | 8,407 | | | | 8,347 | | | | 5,872 | | | | 6,312 | |
| Custodian Fees | | | 10,532 | | | | 10,213 | | | | 7,283 | | | | 3,768 | | | | 2,970 | |
| Printing Expense | | | 7,550 | | | | 5,653 | | | | 6,179 | | | | 2,923 | | | | 2,435 | |
| Other Expenses | | | 4,572 | | | | 8,146 | | | | 7,531 | | | | 2,554 | | | | 221 | |
| Total Expenses | | | 1,831,048 | | | | 1,518,721 | | | | 1,257,530 | | | | 495,836 | | | | 645,486 | |
| Fees Waived by the Adviser | | | (51,493 | ) | | | - | | | | - | | | | - | | | | (216,325 | ) |
| | | | | | | | | | | | | | | | | | | | | |
| Net Expenses | | | 1,779,555 | | | | 1,518,721 | | | | 1,257,530 | | | | 495,836 | | | | 429,161 | |
| | | | | | | | | | | | | | | | | | | | | |
| Net Investment Income (Loss) | | | 1,417,318 | | | | 890,123 | | | | 2,518,080 | | | | 1,344,725 | | | | (22,050 | ) |
| | | | | | | | | | | | | | | | | | | | | |
| Net Realized and Unrealized Gain (Loss) on Investments | | | | | | | | | | | | | | | | | | | | |
| Net Realized Gain (Loss): | | | | | | | | | | | | | | | | | | | | |
| on Unaffiliated Investments | | | 3,927,275 | | | | 4,090,583 | | | | 1,988,710 | | | | (1,040,045 | ) | | | 4,864,891 | |
| on Affiliated Investments | | | - | | | | (710,922 | ) | | | - | | | | - | | | | - | |
| on Foreign Currency Transactions | | | - | | | | - | | | | 9 | | | | - | | | | 560 | |
| Total Net Realized Gain (Loss) | | | 3,927,275 | | | | 3,379,661 | | | | 1,988,719 | | | | (1,040,045 | ) | | | 4,865,451 | |
| Net Change in Unrealized Appreciation (Depreciation): | | | | | | | | | | | | | | | | | | | | |
| on Unaffiliated Investments | | | 20,712,838 | | | | 25,028,571 | | | | 13,143,629 | | | | 1,665,089 | | | | 5,432,963 | |
| on Affiliated Investments | | | (109,841 | ) | | | 719,291 | | | | - | | | | - | | | | - | |
| on Foreign Currency Translations | | | - | | | | - | | | | 45 | | | | - | | | | (11 | ) |
| Total Net Change in Unrealized Appreciation (Depreciation) | | | 20,602,997 | | | | 25,747,862 | | | | 13,143,674 | | | | 1,665,089 | | | | 5,432,952 | |
| | | | | | | | | | | | | | | | | | | | | |
| Net Realized and Unrealized Gain on Investments | | | 24,530,272 | | | | 29,127,523 | | | | 15,132,393 | | | | 625,044 | | | | 10,298,403 | |
| | | | | | | | | | | | | | | | | | | | | |
| Net Increase in Net Assets Resulting From Operations | | $ | 25,947,590 | | | $ | 30,017,646 | | | $ | 17,650,473 | | | $ | 1,969,769 | | | $ | 10,276,353 | |
The accompanying notes are an integral part of these financial statements.
North Star Funds
STATEMENTS OF CHANGES IN NET ASSETS
| | | North Star
Opportunity Fund | |
| | | For the
Year Ended
November 30,
2024 | | | For the
Year Ended
November 30,
2023 | |
| Operations | | | | | | | | |
| Net Investment Income | | $ | 1,417,318 | | | $ | 1,830,317 | |
| Net Realized Gain on Investments | | | 3,927,275 | | | | 1,961,738 | |
| Net Change in Unrealized Appreciation (Depreciation) on Investments | | | 20,602,997 | | | | (2,261,161 | ) |
| Net Increase in Net Assets Resulting From Operations | | | 25,947,590 | | | | 1,530,894 | |
| | | | | | | | | |
| Distributions to Shareholders: | | | | | | | | |
| Distributions Paid | | | | | | | | |
| Class I | | | (3,456,120 | ) | | | (5,349,666 | ) |
| Class A | | | (348,867 | ) | | | (743,561 | ) |
| Total Distributions Paid | | | (3,804,987 | ) | | | (6,093,227 | ) |
| | | | | | | | | |
| Capital Shares of Beneficial Interest | | | | | | | | |
| Class I Shares: | | | | | | | | |
| Proceeds from Shares Sold (133,168 and 187,829 shares, respectively) | | | 2,268,584 | | | | 2,877,411 | |
| Distributions Reinvested (164,824 and 281,389 shares, respectively) | | | 2,669,997 | | | | 4,254,728 | |
| Cost of Shares Redeemed (712,977 and 500,072 shares, respectively) | | | (12,168,988 | ) | | | (7,616,496 | ) |
| Redemption Fee Proceeds | | | 393 | | | | 3,895 | |
| Total Class I Shares | | | (7,230,014 | ) | | | (480,462 | ) |
| | | | | | | | | |
| Class A Shares: | | | | | | | | |
| Proceeds from Shares Sold (1,181 and 9,278 shares, respectively) | | | 20,106 | | | | 143,675 | |
| Distributions Reinvested (21,328 and 48,411 shares, respectively) | | | 343,831 | | | | 735,500 | |
| Cost of Shares Redeemed (286,583 and 367,336 shares, respectively) | | | (4,804,359 | ) | | | (5,615,833 | ) |
| Redemption Fee Proceeds | | | 15 | | | | 274 | |
| Total Class A Shares | | | (4,440,407 | ) | | | (4,736,384 | ) |
| | | | | | | | | |
| Net Decrease in Net Assets From Shares of Beneficial Interest | | | (11,670,421 | ) | | | (5,216,846 | ) |
| | | | | | | | | |
| Total Increase (Decrease) in Net Assets | | | 10,472,182 | | | | (9,779,179 | ) |
| | | | | | | | | |
| Net Assets | | | | | | | | |
| Beginning of Year | | | 128,035,318 | | | | 137,814,497 | |
| End of Year | | $ | 138,507,500 | | | $ | 128,035,318 | |
The accompanying notes are an integral part of these financial statements.
North Star Funds
STATEMENTS OF CHANGES IN NET ASSETS
| | | North Star
Micro Cap Fund | |
| | | For the
Year Ended
November 30,
2024 | | | For the
Year Ended
November 30,
2023 | |
| Operations | | | | | | | | |
| Net Investment Income | | $ | 890,123 | | | $ | 826,484 | |
| Net Realized Gain (Loss) on Investments | | | 3,379,661 | | | | (173,498 | ) |
| Net Change in Unrealized Appreciation on Investments | | | 25,747,862 | | | | 7,470,617 | |
| Net Increase in Net Assets Resulting From Operations | | | 30,017,646 | | | | 8,123,603 | |
| | | | | | | | | |
| Distributions to Shareholders: | | | | | | | | |
| Class I Shares: | | | | | | | | |
| Distributions Paid | | | (782,956 | ) | | | (237,830 | ) |
| Total Distributions to Shareholders | | | (782,956 | ) | | | (237,830 | ) |
| | | | | | | | | |
| Capital Shares of Beneficial Interest | | | | | | | | |
| Class I Shares: | | | | | | | | |
| Proceeds from Shares Sold (60,497 and 83,879 shares, respectively) | | | 2,369,809 | | | | 2,717,433 | |
| Distributions Reinvested (17,936 and 6,281 and shares, respectively) | | | 632,955 | | | | 197,108 | |
| Cost of Shares Redeemed (155,735 and 130,149 shares, respectively) | | | (6,128,214 | ) | | | (4,249,162 | ) |
| Redemption Fee Proceeds | | | 109 | | | | 5 | |
| Total Class I Shares | | | (3,125,341 | ) | | | (1,334,616 | ) |
| | | | | | | | | |
| Total Increase in Net Assets | | | 26,109,349 | | | | 6,551,157 | |
| | | | | | | | | |
| Net Assets | | | | | | | | |
| Beginning of Year | | | 100,214,925 | | | | 93,663,768 | |
| End of Year | | $ | 126,324,274 | | | $ | 100,214,925 | |
The accompanying notes are an integral part of these financial statements.
North Star Funds
STATEMENTS OF CHANGES IN NET ASSETS
| | | North Star
Dividend Fund | |
| | | For the
Year Ended
November 30,
2024 | | | For the
Year Ended
November 30,
2023 | |
| Operations | | | | | | | | |
| Net Investment Income | | $ | 2,518,080 | | | $ | 2,213,480 | |
| Net Realized Gain on Investments and Foreign Currency Transactions | | | 1,988,719 | | | | 164,313 | |
| Net Change in Unrealized Appreciation (Depreciation) on Investments and Foreign Currency Translations | | | 13,143,674 | | | | (5,194,381 | ) |
| Net Increase (Decrease) in Net Assets Resulting From Operations | | | 17,650,473 | | | | (2,816,588 | ) |
| | | | | | | | | |
| Distributions to Shareholders: | | | | | | | | |
| Class I Shares: | | | | | | | | |
| Distributions Paid | | | (3,268,884 | ) | | | (5,134,817 | ) |
| Total Distributions to Shareholders | | | (3,268,884 | ) | | | (5,134,817 | ) |
| | | | | | | | | |
| Capital Shares of Beneficial Interest | | | | | | | | |
| Class I Shares: | | | | | | | | |
| Proceeds from Shares Sold (231,543 and 194,450 shares, respectively) | | | 5,093,719 | | | | 4,050,836 | |
| Distributions Reinvested (102,774 and 186,029 shares, respectively) | | | 2,275,639 | | | | 3,895,799 | |
| Cost of Shares Redeemed (372,666 and 235,580 shares, respectively) | | | (8,179,918 | ) | | | (4,784,931 | ) |
| Redemption Fee Proceeds | | | 143 | | | | 240 | |
| Total Class I Shares | | | (810,417 | ) | | | 3,161,944 | |
| | | | | | | | | |
| Total Increase (Decrease) in Net Assets | | | 13,571,172 | | | | (4,789,461 | ) |
| | | | | | | | | |
| Net Assets | | | | | | | | |
| Beginning of Year | | | 82,490,344 | | | | 87,279,805 | |
| End of Year | | $ | 96,061,516 | | | $ | 82,490,344 | |
The accompanying notes are an integral part of these financial statements.
North Star Funds
STATEMENTS OF CHANGES IN NET ASSETS
| | | North Star
Bond Fund | |
| | | For the
Year Ended
November 30,
2024 | | | For the
Year Ended
November 30,
2023 | |
| Operations | | | | | | | | |
| Net Investment Income | | $ | 1,344,725 | | | $ | 949,004 | |
| Net Realized Loss on Investments | | | (1,040,045 | ) | | | (491,037 | ) |
| Net Change in Unrealized Appreciation on Investments | | | 1,665,089 | | | | 595,416 | |
| Net Increase in Net Assets Resulting From Operations | | | 1,969,769 | | | | 1,053,383 | |
| | | | | | | | | |
| Distributions to Shareholders: | | | | | | | | |
| Class I Shares: | | | | | | | | |
| Total Distributions Paid | | | (1,355,084 | ) | | | (900,562 | ) |
| | | | | | | | | |
| Capital Shares of Beneficial Interest | | | | | | | | |
| Class I Shares: | | | | | | | | |
| Proceeds from Shares Sold (487,320 and 333,162 shares, respectively) | | | 4,331,800 | | | | 2,900,450 | |
| Distributions Reinvested (99,696 and 73,750 shares, respectively) | | | 885,234 | | | | 642,505 | |
| Cost of Shares Redeemed (252,883 and 218,938 shares, respectively) | | | (2,250,386 | ) | | | (1,908,370 | ) |
| Redemption Fee Proceeds | | | - | | | | 4 | |
| Total Class I Shares | | | 2,966,648 | | | | 1,634,589 | |
| | | | | | | | | |
| Total Increase in Net Assets | | | 3,581,333 | | | | 1,787,410 | |
| | | | | | | | | |
| Net Assets | | | | | | | | |
| Beginning of Year | | | 29,028,064 | | | | 27,240,654 | |
| End of Year | | $ | 32,609,397 | | | $ | 29,028,064 | |
The accompanying notes are an integral part of these financial statements.
North Star Funds
STATEMENTS OF CHANGES IN NET ASSETS
| | | North Star
Small Cap Value Fund | |
| | | For the
Year Ended
November 30,
2024 | | | For the
Period Ended
November 30,
2023* | | | For the
Year Ended
January 31,
2023 | |
| Operations | | | | | | | | | | | | |
| Net Investment Income (Loss) | | $ | (22,050 | ) | | $ | (18,727 | ) | | $ | 145,368 | |
| Net Realized Gain on Investments and Foreign Currency Transactions | | | 4,865,451 | | | | 1,338,607 | | | | 9,338,442 | |
| Net Change in Unrealized Appreciation (Depreciation) on Investments and Foreign Currency Translations | | | 5,432,952 | | | | (4,603,098 | ) | | | (11,219,799 | ) |
| Net Increase (Decrease) in Net Assets Resulting From Operations | | | 10,276,353 | | | | (3,283,218 | ) | | | (1,735,989 | ) |
| | | | | | | | | | | | | |
| Distributions to Shareholders: | | | | | | | | | | | | |
| Distributions Paid | | | | | | | | | | | | |
| Institutional Class | | | - | | | | (373,561 | ) | | | (1,977,553 | ) |
| Investor Class | | | - | | | | (2,961,837 | ) | | | (6,665,839 | ) |
| Total Distributions Paid | | | - | | | | (3,335,398 | ) | | | (8,643,392 | ) |
| | | | | | | | | | | | | |
| Capital Shares of Beneficial Interest | | | | | | | | | | | | |
| Institutional Class Shares: | | | | | | | | | | | | |
| Proceeds from Shares Sold (41,144, 16,210 and 77,629 shares, respectively) | | | 648,488 | | | | 232,515 | | | | 1,347,209 | |
| Distributions Reinvested (0, 27,490 and 135,878 shares, respectively) | | | - | | | | 361,492 | | | | 1,952,563 | |
| Cost of Shares Redeemed (76,862, 111,845 and 1,819,201(b) shares, respectively) | | | (1,135,445 | ) | | | (1,628,067 | ) | | | (30,141,680 | )(a) |
| Total Institutional Class Shares | | | (486,957 | ) | | | (1,034,060 | ) | | | (26,841,908 | ) |
| | | | | | | | | | | | | |
| Investor Class Shares: | | | | | | | | | | | | |
| Proceeds from Shares Sold (51,941, 22,580 and 38,334(b) shares, respectively) | | | 802,503 | | | | 337,520 | | | | 641,095 | (a) |
| Distributions Reinvested (0, 221,195 and 455,336 shares, respectively) | | | - | | | | 2,924,194 | | | | 6,575,061 | |
| Cost of Shares Redeemed (648,916, 496,067 and 1,326,693 shares, respectively) | | | (9,888,213 | ) | | | (7,285,006 | ) | | | (22,365,104 | ) |
| Total Investor Class Shares | | | (9,085,710 | ) | | | (4,023,292 | ) | | | (15,148,948 | ) |
| | | | | | | | | | | | | |
| Net Decrease in Net Assets From Shares of Beneficial Interest | | | (9,572,667 | ) | | | (5,057,352 | ) | | | (41,990,856 | ) |
| | | | | | | | | | | | | |
| Total Increase (Decrease) in Net Assets | | | 703,686 | | | | (11,675,968 | ) | | | (52,370,237 | ) |
| | | | | | | | | | | | | |
| Net Assets | | | | | | | | | | | | |
| Beginning of Period | | | 35,966,588 | | | | 47,642,556 | | | | 100,012,793 | |
| End of Period | | $ | 36,670,274 | | | $ | 35,966,588 | | | $ | 47,642,556 | |
| * | For the period February 1, 2023 to November 30, 2023. The Fund’s fiscal year end changed from January 31 to November 30. |
| (a) | Includes $2,504 of exchanges from Institutional Class to Investor Class. |
| (b) | Includes the exchange of 149 shares from Institutional Class to 149 shares of Investor Class from prior year. |
The accompanying notes are an integral part of these financial statements.
North Star Funds
FINANCIAL HIGHLIGHTS
The table below sets forth financial data for one share of beneficial interest outstanding throughout each year.
| | North Star Opportunity Fund
Class I | |
| | | For the
Year Ended
November 30,
2024 | | | For the
Year Ended
November 30,
2023 | | | For the
Year Ended
November 30,
2022 | | | For the
Year Ended
November 30,
2021 | | | For the
Year Ended
November 30, 2020 | |
| Net Asset Value, Beginning of Year | | $ | 15.52 | | | $ | 16.05 | | | $ | 20.00 | | | $ | 16.71 | | | $ | 14.00 | |
| Activity From Investment Operations: | | | | | | | | | | | | | | | | | | | | |
| Net investment income (a) | | | 0.18 | | | | 0.22 | | | | 0.16 | | | | 0.10 | | | | 0.13 | |
| Net gain (loss) from securities (both realized and unrealized) | | | 3.08 | | | | (0.02 | ) | | | (3.57 | ) | | | 3.23 | | | | 2.69 | |
| Total from operations | | | 3.26 | | | | 0.20 | | | | (3.41 | ) | | | 3.33 | | | | 2.82 | |
| | | | | | | | | | | | | | | | | | | | | |
| Less Distributions From: | | | | | | | | | | | | | | | | | | | | |
| Net investment income | | | (0.23 | ) | | | (0.21 | ) | | | (0.11 | ) | | | (0.04 | ) | | | (0.10 | ) |
| Net realized gains on investments | | | (0.25 | ) | | | (0.52 | ) | | | (0.43 | ) | | | (0.00 | )(b) | | | - | |
| Return of Capital | | | - | | | | - | | | | - | | | | - | | | | (0.01 | ) |
| Total Distributions | | | (0.48 | ) | | | (0.73 | ) | | | (0.54 | ) | | | (0.04 | ) | | | (0.11 | ) |
| | | | | | | | | | | | | | | | | | | | | |
| Redemption Fees | | | 0.00 | (b) | | | 0.00 | (b) | | | 0.00 | (b) | | | 0.00 | (b) | | | - | |
| | | | | | | | | | | | | | | | | | | | | |
| Net Asset Value, End of Year | | $ | 18.30 | | | $ | 15.52 | | | $ | 16.05 | | | $ | 20.00 | | | $ | 16.71 | |
| | | | | | | | | | | | | | | | | | | | | |
| Total Return (c) | | | 21.42 | % | | | 1.37 | % | | | (17.48 | )% | | | 20.00 | % | | | 20.29 | % |
| | | | | | | | | | | | | | | | | | | | | |
| Ratios/Supplemental Data | | | | | | | | | | | | | | | | | | | | |
| Net assets, end of year (in 000’s) | | $ | 126,786 | | | $ | 113,975 | | | $ | 118,346 | | | $ | 146,910 | | | $ | 114,330 | |
| Ratio to average net assets: | | | | | | | | | | | | | | | | | | | | |
| Expenses, Gross (d) | | | 1.34 | % | | | 1.35 | % | | | 1.35 | % | | | 1.27 | % | | | 1.37 | % |
| Expenses, Net of waiver or recapture | | | 1.30 | % | | | 1.30 | % | | | 1.30 | % | | | 1.30 | % | | | 1.30 | % |
| Net investment income | | | 1.08 | % | | | 1.44 | % | | | 0.93 | % | | | 0.52 | % | | | 0.90 | % |
| Portfolio turnover rate | | | 21 | % | | | 24 | % | | | 31 | % | | | 30 | % | | | 59 | % |
| (a) | Per share amounts are calculated using the average shares method, which more appropriately presents the per share data for the year. |
| (b) | Less than $0.005 per share. |
| (c) | Total returns are historical in nature and assume changes in share price, reinvestment of dividends and capital gains distributions, if any. Had the Adviser not absorbed a portion of the expenses for the year ended November 30, 2020, November 30, 2022, November 30, 2023 and November 30, 2024, total returns would have been lower. Had the Advisor not recaptured expenses for the year ended November 30, 2021, total return would have been higher. |
| (d) | Represents the ratio of expenses to average net assets absent any fee waivers, expense reimbursements and/or expense recapture by the Adviser. |
The accompanying notes are an integral part of these financial statements.
North Star Funds
FINANCIAL HIGHLIGHTS
The table below sets forth financial data for one share of beneficial interest outstanding throughout each year.
| | | North Star Opportunity Fund
Class A | |
| | | For the
Year Ended
November 30,
2024 | | | For the
Year Ended
November 30,
2023 | | | For the
Year Ended
November 30,
2022 | | | For the
Year Ended
November 30,
2021 | | | For the
Year Ended
November 30,
2020 | |
| Net Asset Value, Beginning of Year | | $ | 15.62 | | | $ | 16.09 | | | $ | 20.05 | | | $ | 16.76 | | | $ | 14.05 | |
| Activity From Investment Operations: | | | | | | | | | | | | | | | | | | | | |
| Net investment income (a) | | | 0.14 | | | | 0.18 | | | | 0.11 | | | | 0.05 | | | | 0.10 | |
| Net gain (loss) from securities (both realized and unrealized) | | | 3.09 | | | | (0.01 | ) | | | (3.58 | ) | | | 3.26 | | | | 2.69 | |
| Total from operations | | | 3.23 | | | | 0.17 | | | | (3.47 | ) | | | 3.31 | | | | 2.79 | |
| | | | | | | | | | | | | | | | | | | | | |
| Less Distributions From: | | | | | | | | | | | | | | | | | | | | |
| Net investment income | | | (0.18 | ) | | | (0.12 | ) | | | (0.06 | ) | | | (0.02 | ) | | | (0.07 | ) |
| Net realized gains on investments | | | (0.25 | ) | | | (0.52 | ) | | | (0.43 | ) | | | - | | | | - | |
| Return of Capital | | | - | | | | - | | | | - | | | | - | | | | (0.01 | ) |
| Total Distributions | | | (0.43 | ) | | | (0.64 | ) | | | (0.49 | ) | | | (0.02 | ) | | | (0.08 | ) |
| | | | | | | | | | | | | | | | | | | | | |
| Redemption Fees | | | 0.00 | (b) | | | 0.00 | (b) | | | - | | | | 0.00 | (b) | | | 0.00 | (b) |
| | | | | | | | | | | | | | | | | | | | | |
| Net Asset Value, End of Year | | | 18.42 | | | | 15.62 | | | | 16.09 | | | | 20.05 | | | | 16.76 | |
| | | | | | | | | | | | | | | | | | | | | |
| Total Return (c) | | | 21.07 | % | | | 1.15 | % | | | (17.70 | )% | | | 19.73 | % | | | 19.99 | % |
| | | | | | | | | | | | | | | | | | | | | |
| Ratios/Supplemental Data | | | | | | | | | | | | | | | | | | | | |
| Net assets, end of year (in 000’s) | | $ | 11,722 | | | $ | 14,061 | | | $ | 19,469 | | | $ | 31,276 | | | $ | 26,940 | |
| Ratio to average net assets: | | | | | | | | | | | | | | | | | | | | |
| Expenses, Gross (d) | | | 1.59 | % | | | 1.60 | % | | | 1.60 | % | | | 1.51 | % | | | 1.62 | % |
| Expenses, Net of waiver or recapture | | | 1.55 | % | | | 1.55 | % | | | 1.55 | % | | | 1.54 | % | | | 1.55 | % |
| Net investment income | | | 0.81 | % | | | 1.17 | % | | | 0.65 | % | | | 0.26 | % | | | 0.67 | % |
| Portfolio turnover rate | | | 21 | % | | | 24 | % | | | 31 | % | | | 30 | % | | | 59 | % |
| (a) | Per share amounts are calculated using the average shares method, which more appropriately presents the per share data for the year. |
| (b) | Less than $0.005 per share. |
| (c) | Total returns are historical in nature and assume changes in share price, reinvestment of dividends and capital gains distributions, if any. Had the Adviser not absorbed a portion of the expenses for the year ended November 30, 2019, November 30, 2020, November 30, 2022, November 30, 2023 and November 30, 2024, total returns would have been lower. Had the Advisor not recaptured expenses for the year ended November 30, 2021, total return would have been higher. |
| (d) | Represents the ratio of expenses to average net assets absent any fee waivers, expense reimbursements and/or expense recapture by the Adviser. |
The accompanying notes are an integral part of these financial statements.
North Star Funds
FINANCIAL HIGHLIGHTS
The table below sets forth financial data for one share of beneficial interest outstanding throughout each year.
| | | North Star Micro Cap Fund
Class I | |
| | | For the Year Ended
November 30,
2024 | | | For the
Year Ended
November 30,
2023 | | | For the
Year Ended
November 30,
2022 | | | For the
Year Ended
November 30,
2021 | | | For the
Year Ended
November 30,
2020 | |
| Net Asset Value, Beginning of Year | | $ | 34.50 | | | $ | 31.81 | | | $ | 41.77 | | | $ | 35.74 | | | $ | 26.11 | |
| Activity From Investment Operations: | | | | | | | | | | | | | | | | | | | | |
| Net investment income (loss) (a) | | | 0.31 | | | | 0.28 | | | | 0.19 | | | | (0.00 | )(b) | | | (0.00 | )(b) |
| Net gain (loss) from securities (both realized and unrealized) | | | 10.14 | | | | 2.49 | | | | (8.80 | ) | | | 6.03 | | | | 9.76 | |
| Total from operations | | | 10.45 | | | | 2.77 | | | | (8.61 | ) | | | 6.03 | | | | 9.76 | |
| | | | | | | | | | | | | | | | | | | | | |
| Less Distributions From: | | | | | | | | | | | | | | | | | | | | |
| Net investment income | | | (0.27 | ) | | | (0.08 | ) | | | (0.10 | ) | | | (0.00 | )(b) | | | (0.08 | ) |
| Net realized gains on investments | | | - | | | | - | | | | (1.25 | ) | | | - | | | | - | |
| Return of Capital | | | - | | | | - | | | | - | | | | - | | | | (0.05 | ) |
| Total Distributions | | | (0.27 | ) | | | (0.08 | ) | | | (1.35 | ) | | | (0.00 | ) | | | (0.13 | ) |
| | | | | | | | | | | | | | | | | | | | | |
| Redemption Fees | | | 0.00 | (b) | | | 0.00 | (b) | | | 0.00 | (b) | | | 0.00 | (b) | | | 0.00 | (b) |
| | | | | | | | | | | | | | | | | | | | | |
| Net Asset Value, End of Year | | $ | 44.68 | | | $ | 34.50 | | | $ | 31.81 | | | $ | 41.77 | | | $ | 35.74 | |
| | | | | | | | | | | | | | | | | | | | | |
| Total Return (c) | | | 30.50 | % | | | 8.74 | % | | | (21.34 | )% | | | 16.88 | % | | | 37.57 | % |
| | | | | | | | | | | | | | | | | | | | | |
| Ratios/Supplemental Data | | | | | | | | | | | | | | | | | | | | |
| Net assets, end of year (in 000’s) | | $ | 126,324 | | | $ | 100,215 | | | $ | 93,664 | | | $ | 126,281 | | | $ | 97,262 | |
| Ratio to average net assets: | | | | | | | | | | | | | | | | | | | | |
| Expenses | | | 1.33 | % | | | 1.38 | % | | | 1.41 | % | | | 1.29 | % | | | 1.38 | % |
| Net investment income (loss) | | | 0.78 | % | | | 0.85 | % | | | 0.55 | % | | | (0.01 | )% | | | (0.00 | )%(d) |
| Portfolio turnover rate | | | 26 | % | | | 18 | % | | | 11 | % | | | 9 | % | | | 35 | % |
| (a) | Per share amounts are calculated using the average shares method, which more appropriately presents the per share data for the year. |
| (b) | Less than $0.005 per share. |
| (c) | Total returns are historical in nature and assume changes in share price, reinvestment of dividends and capital gains distributions, if any. |
| (d) | Less than 0.005%. |
The accompanying notes are an integral part of these financial statements.
North Star Funds
FINANCIAL HIGHLIGHTS
The table below sets forth financial data for one share of beneficial interest outstanding throughout each year.
| |
| North Star Dividend Fund
Class I |
|
| | | For the
Year Ended
November 30,
2024 | | | For the
Year Ended
November 30,
2023 | | | For the
Year Ended
November 30,
2022 | | | For the
Year Ended
November 30,
2021 | | | For the
Year Ended
November 30,
2020 | |
| Net Asset Value, Beginning of Year | | $ | 20.35 | | | $ | 22.33 | | | $ | 23.43 | | | $ | 20.05 | | | $ | 20.35 | |
| Activity From Investment Operations: | | | | | | | | | | | | | | | | | | | | |
| Net investment income (a) | | | 0.61 | | | | 0.54 | | | | 0.53 | | | | 0.43 | | | | 0.37 | |
| Net gain (loss) from securities (both realized and unrealized) | | | 3.77 | | | | (1.23 | ) | | | (0.76 | ) | | | 3.32 | | | | (0.35 | ) |
| Total from operations | | | 4.38 | | | | (0.69 | ) | | | (0.23 | ) | | | 3.75 | | | | 0.02 | |
| | | | | | | | | | | | | | | | | | | | | |
| Less Distributions From: | | | | | | | | | | | | | | | | | | | | |
| Net investment income | | | (0.67 | ) | | | (0.50 | ) | | | (0.48 | ) | | | (0.37 | ) | | | (0.30 | ) |
| Net realized gains on investments | | | (0.13 | ) | | | (0.79 | ) | | | (0.39 | ) | | | - | | | | - | |
| Return of Capital | | | - | | | | - | | | | - | | | | - | | | | (0.02 | ) |
| Total Distributions | | | (0.80 | ) | | | (1.29 | ) | | | (0.87 | ) | | | (0.37 | ) | | | (0.32 | ) |
| | | | | | | | | | | | | | | | | | | | | |
| Redemption Fees (b) | | | 0.00 | | | | 0.00 | | | | 0.00 | | | | 0.00 | | | | 0.00 | |
| | | | | | | | | | | | | | | | | | | | | |
| Net Asset Value, End of Year | | $ | 23.93 | | | $ | 20.35 | | | $ | 22.33 | | | $ | 23.43 | | | $ | 20.05 | |
| | | | | | | | | | | | | | | | | | | | | |
| Total Return (c) | | | 21.91 | % | | | (3.14 | )% | | | (0.96 | )% | | | 18.70 | % | | | 0.36 | % |
| | | | | | | | | | | | | | | | | | | | | |
| Ratios/Supplemental Data | | | | | | | | | | | | | | | | | | | | |
| Net assets, end of year (in 000’s) | | $ | 96,062 | | | $ | 82,490 | | | $ | 87,280 | | | $ | 88,006 | | | $ | 75,296 | |
| Ratio to average net assets: | | | | | | | | | | | | | | | | | | | | |
| Expenses | | | 1.39 | % | | | 1.45 | % | | | 1.45 | % | | | 1.36 | % | | | 1.48 | % |
| Net investment income | | | 2.79 | % | | | 2.63 | % | | | 2.40 | % | | | 1.79 | % | | | 2.08 | % |
| Portfolio turnover rate | | | 34 | % | | | 23 | % | | | 22 | % | | | 12 | % | | | 54 | % |
| (a) | Per share amounts are calculated using the average shares method, which more appropriately presents the per share data for the year. |
| (b) | Less than $0.005 per share. |
| (c) | Total returns are historical in nature and assume changes in share price, reinvestment of dividends and capital gains distributions, if any. |
The accompanying notes are an integral part of these financial statements.
North Star Funds
FINANCIAL HIGHLIGHTS
The table below sets forth financial data for one share of beneficial interest outstanding throughout each year.
| |
| North Star Bond Fund
Class I |
|
| | | For the
Year Ended
November 30,
2024 | | | For the
Year Ended
November 30, 2023 | | | For the
Year Ended
November 30,
2022 | | | For the
Year Ended
November 30,
2021 | | | For the
Year Ended
November 30,
2020 | |
| Net Asset Value, Beginning of Year | | $ | 8.77 | | | $ | 8.73 | | | $ | 9.49 | | | $ | 9.49 | | | $ | 9.69 | |
| Activity From Investment Operations: | | | | | | | | | | | | | | | | | | | | |
| Net investment income (a) | | | 0.38 | | | | 0.30 | | | | 0.22 | | | | 0.25 | | | | 0.31 | |
| Net gain (loss) from securities (both realized and unrealized) | | | 0.19 | | | | 0.03 | | | | (0.76 | ) | | | 0.02 | | | | (0.22 | ) |
| Total from operations | | | 0.57 | | | | 0.33 | | | | (0.54 | ) | | | 0.27 | | | | 0.09 | |
| | | | | | | | | | | | | | | | | | | | | |
| Less Distributions From: | | | | | | | | | | | | | | | | | | | | |
| Net investment income | | | (0.39 | ) | | | (0.29 | ) | | | (0.22 | ) | | | (0.27 | ) | | | (0.29 | ) |
| Total Distributions | | | (0.39 | ) | | | (0.29 | ) | | | (0.22 | ) | | | (0.27 | ) | | | (0.29 | ) |
| | | | | | | | | | | | | | | | | | | | | |
| Redemption Fees | | | - | | | | 0.00 | (b) | | | - | | | | - | | | | 0.00 | (b) |
| | | | | | | | | | | | | | | | | | | | | |
| Net Asset Value, End of Year | | $ | 8.95 | | | $ | 8.77 | | | $ | 8.73 | | | $ | 9.49 | | | $ | 9.49 | |
| | | | | | | | | | | | | | | | | | | | | |
| Total Return (c) | | | 6.58 | % | | | 3.82 | % | | | (5.69 | )% | | | 2.85 | % | | | 1.07 | % |
| | | | | | | | | | | | | | | | | | | | | |
| Ratios/Supplemental Data | | | | | | | | | | | | | | | | | | | | |
| Net assets, end of year (in 000’s) | | $ | 32,609 | | | $ | 29,028 | | | $ | 27,241 | | | $ | 31,113 | | | $ | 27,837 | |
| Ratio to average net assets: | | | | | | | | | | | | | | | | | | | | |
| Expenses, Gross | | | 1.59 | % | | | 1.65 | % | | | 1.63 | % | | | 1.59 | % | | | 1.63 | % |
| Expenses, Net of expense waiver or recapture | | | 1.59 | % | | | 1.65 | % | | | 1.63 | % | | | 1.59 | % | | | 1.63 | % |
| Net investment income | | | 4.31 | % | | | 3.48 | % | | | 2.48 | % | | | 2.56 | % | | | 3.35 | % |
| Portfolio turnover rate | | | 43 | % | | | 48 | % | | | 27 | % | | | 42 | % | | | 55 | % |
| (a) | Per share amounts are calculated using the average shares method, which more appropriately presents the per share data for the year. |
| (b) | Less than $0.005 per share. |
| (c) | Total return represents aggregate total return based on Net Asset Value. Total returns are historical in nature and assume changes in share price, reinvestment of dividends and capital gains distributions, if any. |
The accompanying notes are an integral part of these financial statements.
North Star Funds
FINANCIAL HIGHLIGHTS
The table below sets forth financial data for one share of beneficial interest outstanding throughout each period.
| | | North Star Small Cap Value Fund
Investor Class | |
| | | For the
Year Ended November 30,
2024 | | | For the
Period Ended
November 30,
2023* | | | For the
Year Ended
January 31,
2023 | | | For the
Year Ended
January 31,
2022 | | | For the
Year Ended
January 31,
2021 | | | For the
Year Ended
January 31,
2020 | |
| Net Asset Value, Beginning of Period | | $ | 13.19 | | | $ | 15.64 | | | $ | 18.23 | | | $ | 20.49 | | | $ | 18.80 | | | $ | 18.71 | |
| Activity From Investment Operations: | | | | | | | | | | | | | | | | | | | | | | | | |
| Net investment income (loss) (a) | | | (0.01 | ) | | | (0.01 | ) | | | 0.02 | | | | 0.00 | (b) | | | 0.05 | | | | 0.07 | |
| Net gain (loss) from securities (both realized and unrealized) | | | 4.33 | | | | (1.11 | ) | | | 0.21 | | | | 5.12 | | | | 1.83 | | | | 0.43 | |
| Total from operations | | | 4.32 | | | | (1.12 | ) | | | 0.23 | | | | 5.12 | | | | 1.88 | | | | 0.50 | |
| | | | | | | | | | | | | | | | | | | | | | | | | |
| Less Distributions From: | | | | | | | | | | | | | | | | | | | | | | | | |
| Net investment income | | | - | | | | (0.03 | ) | | | (0.05 | ) | | | (0.00 | )(b) | | | (0.19 | ) | | | (0.02 | ) |
| Net realized gains on investments | | | - | | | | (1.30 | ) | | | (2.77 | ) | | | (7.38 | ) | | | - | | | | (0.39 | ) |
| Total Distributions | | | - | | | | (1.33 | ) | | | (2.82 | ) | | | (7.38 | ) | | | (0.19 | ) | | | (0.41 | ) |
| | | | | | | | | | | | | | | | | | | | | | | | | |
| Redemption Fees (h) | | | - | | | | - | | | | - | | | | 0.00 | (b) | | | 0.00 | (b) | | | 0.00 | (b) |
| | | | | | | | | | | | | | | | | | | | | | | | | |
| Net Asset Value, End of Period | | $ | 17.51 | | | $ | 13.19 | | | $ | 15.64 | | | $ | 18.23 | | | $ | 20.49 | | | $ | 18.80 | |
| | | | | | | | | | | | | | | | | | | | | | | | | |
| Total Return (c) | | | 32.75 | % | | | (7.18 | )%(e) | | | 2.55 | % | | | 23.66 | % | | | 10.04 | % | | | 2.55 | % |
| | | | | | | | | | | | | | | | | | | | | | | | | |
| Ratios/Supplemental Data | | | | | | | | | | | | | | | | | | | | | | | | |
| Net assets, end of period (in 000’s) | | $ | 32,008 | | | $ | 31,993 | | | $ | 41,871 | | | $ | 64,007 | | | $ | 71,784 | | | $ | 177,627 | |
| Ratio to average net assets: | | | | | | | | | | | | | | | | | | | | | | | | |
| Expenses, Gross (d) | | | 1.81 | % | | | 1.88 | %(f) | | | 1.47 | % | | | 1.38 | % | | | 1.35 | % | | | 1.30 | % |
| Expenses, Net of expense waiver or recapture (h) | | | 1.21 | % | | | 1.21 | %(f) | | | 1.21 | % | | | 1.21 | % | | | 1.21 | % | | | 1.21 | % |
| Net investment income (loss) | | | (0.09 | )%(i) | | | (0.08 | )%(f) | | | 0.13 | % | | | 0.00 | %(g) | | | 0.30 | % | | | 0.36 | % |
| Portfolio turnover rate | | | 29 | % | | | 6 | %(e) | | | 28 | % | | | 71 | % | | | 66 | % | | | 57 | % |
| * | For the period February 1, 2023 to November 30, 2023. The Fund’s fiscal year end changed from January 31 to November 30, effective February 1, 2023. |
| (a) | Per share amounts are calculated using the average shares method, which more appropriately presents the per share data for the period. |
| (b) | Less than $0.005 per share. |
| (c) | Total return represents aggregate total return based on Net Asset Value. Total returns are historical in nature and assume changes in share price, reinvestment of dividends and capital gains distributions, if any. |
| (d) | Represents the ratio of expenses to average net assets absent fee waivers, expense reimbursements and/or recapture by the Adviser. |
| (e) | Not annualized. |
| (f) | Annualized. |
| (g) | Less than 0.005%. |
| (h) | Prior to June 1, 2021, shares were subject to a redemption fee of 2% if redeemed after holding them for 90 days or less. |
| (i) | Due to the timing of shareholder transactions, and allocations of expenses among share classes, the per unit amounts represented may not coincide with the aggregate presentation of the Statements of Operations. |
The accompanying notes are an integral part of these financial statements.
North Star Funds
FINANCIAL HIGHLIGHTS
The table below sets forth financial data for one share of beneficial interest outstanding throughout each period.
| | | North Star Small Cap Value Fund
Institutional Class | |
| | | For the
Year Ended
November 30,
2024 | | | For the
Period Ended
November 30, 2023* | | | For the
Year Ended
January 31,
2023 | | | For the
Year Ended
January 31,
2022 | | | For the
Year Ended
January 31,
2021 | | | For the
Year Ended
January 31, 2020 | |
| Net Asset Value, Beginning of Period | | $ | 13.13 | | | $ | 15.56 | | | $ | 18.22 | | | $ | 20.53 | | | $ | 18.83 | | | $ | 18.70 | |
| Activity From Investment Operations: | | | | | | | | | | | | | | | | | | | | | | | | |
| Net investment income (a) | | | 0.02 | | | | 0.02 | | | | 0.06 | | | | 0.05 | | | | 0.09 | | | | 0.11 | |
| Net gain (loss) from securities (both realized and unrealized) | | | 4.31 | | | | (1.10 | ) | | | 0.19 | | | | 5.14 | | | | 1.84 | | | | 0.43 | |
| Total from operations | | | 4.33 | | | | (1.08 | ) | | | 0.25 | | | | 5.19 | | | | 1.93 | | | | 0.54 | |
| | | | | | | | | | | | | | | | | | | | | | | | | |
| Less Distributions From: | | | | | | | | | | | | | | | | | | | | | | | | |
| Net investment income | | | - | | | | (0.05 | ) | | | (0.14 | ) | | | (0.12 | ) | | | (0.23 | ) | | | (0.02 | ) |
| Net realized gains on investments | | | - | | | | (1.30 | ) | | | (2.77 | ) | | | (7.38 | ) | | | - | | | | (0.39 | ) |
| Total Distributions | | | - | | | | (1.35 | ) | | | (2.91 | ) | | | (7.50 | ) | | | (0.23 | ) | | | (0.41 | ) |
| | | | | | | | | | | | | | | | | | | | | | | | | |
| Redemption Fees (g) | | | - | | | | - | | | | - | | | | 0.00 | (b) | | | 0.00 | (b) | | | 0.00 | (b) |
| | | | | | | | | | | | | | | | | | | | | | | | | |
| Net Asset Value, End of Period | | $ | 17.46 | | | $ | 13.13 | | | $ | 15.56 | | | $ | 18.22 | | | $ | 20.53 | | | $ | 18.83 | |
| | | | | | | | | | | | | | | | | | | | | | | | | |
| Total Return (c) | | | 32.98 | % | | | (6.95 | )%(e) | | | 2.71 | % | | | 23.92 | % | | | 10.33 | % | | | 2.80 | % |
| | | | | | | | | | | | | | | | | | | | | | | | | |
| Ratios/Supplemental Data | | | | | | | | | | | | | | | | | | | | | | | | |
| Net assets, end of period (in 000’s) | | $ | 4,662 | | | $ | 3,974 | | | $ | 5,771 | | | $ | 36,005 | | | $ | 96,863 | | | $ | 132,207 | |
| Ratio to average net assets: | | | | | | | | | | | | | | | | | | | | | | | | |
| Expenses, Gross (d) | | | 1.56 | % | | | 1.73 | %(f) | | | 1.45 | % | | | 1.38 | % | | | 1.35 | % | | | 1.30 | % |
| Expenses, Net of expense waiver or recapture (g) | | | 0.98 | % | | | 0.98 | %(f) | | | 0.98 | % | | | 0.98 | % | | | 0.98 | % | | | 0.98 | % |
| Net investment income | | | 0.15 | % | | | 0.14 | %(f) | | | 0.34 | % | | | 0.20 | % | | | 0.52 | % | | | 0.55 | % |
| Portfolio turnover rate | | | 29 | % | | | 6 | %(e) | | | 28 | % | | | 71 | % | | | 66 | % | | | 57 | % |
| * | For the period February 1, 2023 to November 30, 2023. The Fund’s fiscal year end changed from January 31 to November 30, effective February 1, 2023. |
| (a) | Per share amounts are calculated using the average shares method, which more appropriately presents the per share data for the period. |
| (b) | Less than $0.005 per share. |
| (c) | Total return represents aggregate total return based on Net Asset Value. Total returns are historical in nature and assume changes in share price, reinvestment of dividends and capital gains distributions, if any. |
| (d) | Represents the ratio of expenses to average net assets absent fee waivers, expense reimbursements and/or recapture by the Adviser. |
| (e) | Not annualized. |
| (f) | Annualized. |
| (g) | Prior to June 1, 2021, shares were subject to a redemption fee of 2% if redeemed after holding them for 90 days or less. |
The accompanying notes are an integral part of these financial statements.
North Star Funds
NOTES TO FINANCIAL STATEMENTS
November 30, 2024
The North Star Opportunity Fund, the North Star Micro Cap Fund, the North Star Dividend Fund, the North Star Bond Fund and the North Star Small Cap Value Fund (each a “Fund,” and together the “Funds”) are each a series of shares of beneficial interest of the Northern Lights Fund Trust II (the “Trust”), a trust organized under the laws of the State of Delaware on August 26, 2010, and are registered under the Investment Company Act of 1940, as amended (the “1940 Act”), as open-ended management investment companies.
The Trust acquired the Walthausen Small Cap Value Fund (the “Predecessor Fund”), in a tax-free reorganization as of the close of business on May 12, 2023 (the “Reorganization”) and changed its name to the North Star Small Cap Value Fund. As a series of the Trust, the North Star Small Cap Value Fund is a continuation of the Predecessor Fund, and has adopted its financial reporting history. The Fund changed its year end to November 30 from January 31.
The diversification policy of each Fund is as follows:
| Fund | | |
| North Star Opportunity Fund | | Diversified |
| North Star Micro Cap Fund | | Diversified |
| North Star Dividend Fund | | Diversified |
| North Star Bond Fund | | Diversified |
| North Star Small Cap Value Fund | | Diversified |
The investment objective of each Fund is as follows:
| Fund | | Primary Objective |
| North Star Opportunity Fund | | To seek long-term capital appreciation |
| North Star Micro Cap Fund | | Capital appreciation and to derive income from short term liquid securities |
| North Star Dividend Fund | | To generate dividend income and to seek capital appreciation |
| North Star Bond Fund | | To generate income, with preservation of capital |
| North Star Small Cap Value Fund | | To seek long-term capital appreciation |
The North Star Micro Cap Fund is the successor to the Kuby Gottlieb Special Value Fund, L.P. (the “Predecessor Micro Cap Fund”), which transferred its assets to the North Star Micro Cap Fund in connection with the North Star Micro Cap Fund’s commencement of operations. The North Star Dividend Fund is the successor to the North Star Dividend Fund, L.P. (the “Predecessor Dividend Fund”), which transferred its assets to the North Star Dividend Fund in connection with the North Star Dividend Fund’s commencement of operations. The North Star Opportunity Fund is the successor to the North Star Opportunity Fund, L.P. (the “Predecessor North Star Opportunity Fund”), which transferred its assets to the Fund in connection with the North Star Opportunity Fund’s commencement of operations. The Predecessor Funds were managed by the same adviser who currently manages the Funds, and have substantially similar investment objectives and strategies to those of the Funds.
North Star Funds
NOTES TO FINANCIAL STATEMENTS (Continued)
November 30, 2024
Each Fund commenced operations on the following dates:
| Fund | | Date |
| North Star Opportunity Fund | | December 15, 2011 |
| North Star Micro Cap Fund | | May 31, 2013 |
| North Star Dividend Fund | | May 31, 2013 |
| North Star Bond Fund | | December 19, 2014 |
| North Star Small Cap Value Fund | | February 1, 2008 (Commencement of operations of the Predecessor Fund) |
The North Star Micro Cap Fund, the North Star Dividend Fund and the North Star Bond Fund currently offer Class I shares. The North Star Opportunity Fund currently offers Class I and Class A shares. Class A shares are offered at net asset value plus a maximum sales charge of 5.75%. Class I shares are offered at net asset value. The North Star Small Cap Value Fund currently offers Investor Class and Institutional Class shares, both classes are offered at net asset value. Each class represents an interest in the same assets of the Fund and classes are identical except for differences in their sales charge structures and ongoing service and distribution charges. All classes of shares have equal voting privileges except that each class has exclusive voting rights with respect to its service and/or distribution plans. The Funds’ income, expenses (other than class specific distribution fees) and realized and unrealized gains and losses are allocated proportionately each day based upon the relative net assets of each class.
| 2. | SUMMARY OF SIGNIFICANT ACCOUNTING POLICIES |
The following is a summary of significant accounting policies followed by the Funds in preparation of their financial statements. These policies are in conformity with accounting principles generally accepted in the United States of America (“GAAP”). The preparation of financial statements requires management to make estimates and assumptions that affect the reported amounts of assets and liabilities and disclosure of contingent assets and liabilities at the date of the financial statements and the reported amounts of income and expenses for the period. Actual results could differ from those estimates. The Funds are investment companies and accordingly follow the investment company accounting and reporting guidance of the Financial Accounting Standards Board (FASB) Accounting Standard Codification Topic 946 “Financial Services – Investment Companies”.
Securities valuation – Securities listed on an exchange are valued at the last reported sale price at the close of the regular trading session of the primary exchange on the business day the value is being determined, or in the case of securities listed on NASDAQ at the NASDAQ Official Closing Price. In the absence of a sale such securities shall be valued at the mean between the current bid and ask prices on the day of valuation. Short-term investments that mature in 60 days or less may be valued at amortized cost, provided such valuations represent approximate fair value. Debt securities (other than short-term obligations) are valued each day by an independent pricing service approved by the Board of Trustees (the “Board”) based on methods which include consideration of: yields or prices of securities of comparable quality, coupon, maturity and type, indications as to values from dealers, and general market conditions or market quotations from a major market maker in the securities. The independent pricing service does not distinguish between smaller‐sized bond positions known as “odd lots” and larger institutional‐sized bond positions known as “round lots”. The Funds may fair value a particular bond if the adviser does not believe that the round lot value provided by the independent pricing service reflects fair value of the Funds’ holding. Investments in open-ended investment companies are valued at net asset value.
North Star Funds
NOTES TO FINANCIAL STATEMENTS (Continued)
November 30, 2024
The Fund may hold securities, such as private investments, interests in commodity pools, other non-traded securities or temporarily illiquid securities, for which market quotations are not readily available or are determined to be unreliable. These securities are valued using the “fair value” procedures approved by the Board. The Board has designated the adviser as its valuation designee (the “Valuation Designee”) to execute these procedures. The Board may also enlist third party consultants such a valuation specialist at a public accounting firm, valuation consultant or financial officer of a security issuer on an as-needed basis to assist the Valuation Designee in determining a security-specific fair value. The Board is responsible for reviewing and approving fair value methodologies utilized by the Valuation Designee, approval of which shall be based upon whether the Valuation Designee followed the valuation procedures established by the Board.
Fair Valuation Process –The applicable investments are valued by the Valuation Designee pursuant to valuation procedures established by the Board. For example, fair value determinations are required for the following securities: (i) securities for which market quotations are insufficient or not readily available on a particular business day (including securities for which there is a short and temporary lapse in the provision of a price by the regular pricing source); (ii) securities for which, in the judgment of the Valuation Designee, the prices or values available do not represent the fair value of the instrument; factors which may cause the Valuation Designee to make such a judgment include, but are not limited to, the following: only a bid price or an asked price is available; the spread between bid and asked prices is substantial; the frequency of sales; the thinness of the market; the size of reported trades; and actions of the securities markets, such as the suspension or limitation of trading; (iii) securities determined to be illiquid; and (iv) securities with respect to which an event that affects the value thereof has occurred (a “significant event”) since the closing prices were established on the principal exchange on which they are traded, but prior to a Fund’s calculation of its net asset value. Specifically, interests in commodity pools or managed futures pools are valued on a daily basis by reference to the closing market prices of each futures contract or other asset held by a pool, as adjusted for pool expenses. Restricted or illiquid securities, such as private investments or non-traded securities are valued based upon the current bid for the security from two or more independent dealers or other parties reasonably familiar with the facts and circumstances of the security (who should take into consideration all relevant factors as may be appropriate under the circumstances). If a current bid from such independent dealers or other independent parties is unavailable, the Valuation Designee shall determine the fair value of such security using the following factors: (i) the type of security; (ii) the cost at date of purchase; (iii) the size and nature of the Fund’s holdings; (iv) the discount from market value of unrestricted securities of the same class at the time of purchase and subsequent thereto; (v) information as to any transactions or offers with respect to the security; (vi) the nature and duration of restrictions on disposition of the security and the existence of any registration rights; (vii) how the yield of the security compares to similar securities of companies of similar or equal creditworthiness; (viii) the level of recent trades of similar or comparable securities; (ix) the liquidity characteristics of the security; (x) current market conditions; and (xi) the market value of any securities into which the security is convertible or exchangeable.
The Funds utilize various methods to measure the fair value of all of their investments on a recurring basis. GAAP establishes a hierarchy that prioritizes inputs to valuation methods. The three levels of input are:
Level 1 – Unadjusted quoted prices in active markets for identical assets and liabilities that the Fund has the ability to access.
Level 2 – Observable inputs other than quoted prices included in Level 1 that are observable for the asset or liability, either directly or indirectly. These inputs may include quoted prices for the identical instrument on an inactive market, prices for similar instruments, interest rates, prepayment speeds, credit risk, yield curves, default rates and similar data.
Level 3 – Unobservable inputs for the asset or liability, to the extent relevant observable inputs are not available, representing the Fund’s own assumptions about the assumptions a market participant would use in valuing the asset or liability, and would be based on the best information available.
North Star Funds
NOTES TO FINANCIAL STATEMENTS (Continued)
November 30, 2024
The availability of observable inputs can vary from security to security and is affected by a wide variety of factors, including, for example, the type of security, whether the security is new and not yet established in the marketplace, the liquidity of markets, and other characteristics particular to the security. To the extent that valuation is based on models or inputs that are less observable or unobservable in the market, the determination of fair value requires more judgment. Accordingly, the degree of judgment exercised in determining fair value is greatest for instruments categorized in Level 3.
The inputs used to measure fair value may fall into different levels of the fair value hierarchy. In such cases, for disclosure purposes, the level in the fair value hierarchy within which the fair value measurement falls in its entirety, is determined based on the lowest level input that is significant to the fair value measurement in its entirety.
The inputs or methodology used for valuing securities are not necessarily an indication of the risk associated with investing in those securities. The following tables summarize the inputs used as of November 30, 2024 for the Funds’ investments measured at fair value:
North Star Opportunity Fund
| Assets* | | Level 1 | | | Level 2 | | | Level 3 | | | Total | |
| Common Stocks | | $ | 118,988,721 | | | $ | - | | | $ | - | | | $ | 118,988,721 | |
| Preferred Stocks | | | 1,512,320 | | | | - | | | | - | | | | 1,512,320 | |
| Corporate Bonds | | | - | | | | 2,880,219 | | | | - | | | | 2,880,219 | |
| U.S. Government & Agencies | | | - | | | | 5,482,394 | | | | - | | | | 5,482,394 | |
| Short-Term Investment | | | 9,545,705 | | | | - | | | | - | | | | 9,545,705 | |
| Total | | $ | 130,046,746 | | | $ | 8,362,613 | | | $ | - | | | $ | 138,409,359 | |
North Star Micro Cap Fund
| Assets* | | Level 1 | | | Level 2 | | | Level 3 ** | | | Total | |
| Common Stocks | | $ | 116,322,152 | | | | - | | | $ | - | | | $ | 116,322,152 | |
| Short-Term Investment | | | 10,021,203 | | | | - | | | | - | | | | 10,021,203 | |
| Total | | $ | 126,343,355 | | | $ | - | | | $ | - | | | $ | 126,343,355 | |
North Star Dividend Fund
| Assets* | | Level 1 | | | Level 2 | | | Level 3 | | | Total | |
| Common Stocks | | $ | 86,107,738 | | | $ | - | | | $ | - | | | $ | 86,107,738 | |
| Preferred Stock | | | 950,052 | | | | - | | | | - | | | | 950,052 | |
| Short-Term Investment | | | 8,724,386 | | | | - | | | | - | | | | 8,724,386 | |
| Total | | $ | 95,782,176 | | | $ | - | | | $ | - | | | $ | 95,782,176 | |
North Star Bond Fund
| Assets* | | Level 1 | | | Level 2 | | | Level 3 | | | Total | |
| Preferred Stocks | | $ | 2,234,291 | | | $ | - | | | $ | - | | | $ | 2,234,291 | |
| Corporate Bonds | | | - | | | | 27,533,861 | | | | - | | | | 27,533,861 | |
| U.S. Government & Agencies | | | - | | | | 1,493,512 | | | | - | | | | 1,493,512 | |
| Short-Term Investment | | | 945,459 | | | | - | | | | - | | | | 945,459 | |
| Total | | $ | 3,179,750 | | | $ | 29,027,373 | | | $ | - | | | $ | 32,207,123 | |
North Star Funds
NOTES TO FINANCIAL STATEMENTS (Continued)
November 30, 2024
North Star Small Cap Value Fund
| Assets * | | Level 1 | | | Level 2 | | | Level 3 | | | Total | |
| Common Stocks | | $ | 34,681,623 | | | $ | - | | | $ | - | | | $ | 34,681,623 | |
| Short-Term Investment | | | 2,005,942 | | | | - | | | | - | | | | 2,005,942 | |
| Total | | $ | 36,687,565 | | | $ | - | | | $ | - | | | $ | 36,687,565 | |
| * | Refer to the Schedules of Investments for security classifications. |
| ** | During the year ended November 30, 2024, investments with a fair value of $0 were transferred into Level 3 in the North Star Micro Cap Fund. Additional disclosures surrounding Level 3 investments were not significant to the financial statements. |
The North Star Opportunity Fund, the North Star Dividend Fund, the North Star Bond Fund and the North Star Small Cap Value Fund did not hold any Level 3 securities during the year.
Security Transactions and Investment Income – Investment security transactions are accounted for on a trade date basis. Cost is determined and gains and losses are based upon the specific identification method for both financial statement and federal income tax purposes. Dividend income is recorded on the ex-dividend date and interest income is recorded on the accrual basis. Purchase discounts and premiums on securities are accreted and amortized over the life of the respective securities.
Expenses – Expenses of the Trust that are directly identifiable to a specific fund are charged to that fund. Expenses, which are not readily identifiable to a specific fund, are allocated in such a manner as deemed equitable, taking into consideration the nature and type of expense and the relative sizes of the funds in the Trust.
Federal Income Taxes – Each Fund intends to comply with the requirements of Subchapter M of the Internal Revenue Code applicable to regulated investment companies and will distribute all of its taxable income, if any, to shareholders. Accordingly, no provision for Federal income taxes is required in the financial statements.
Each Fund recognizes the tax benefits of uncertain tax positions only where the position is “more likely than not” to be sustained assuming examination by tax authorities. Management has analyzed the Fund’s tax positions and has concluded that no liability for unrecognized tax benefits should be recorded related to uncertain tax positions taken on returns filed for open tax years November 30, 2021 to November 30, 2023 or expected to be taken in the Fund’s November 30, 2024 tax returns. Each Fund identifies its major tax jurisdictions as U.S. Federal, Ohio and foreign jurisdictions where the Fund may make significant investments. However, the Funds are not aware of any tax positions for which it is reasonably possible that the total amounts of unrecognized tax benefits will change materially in the next twelve months.
Distributions to Shareholders – The following table summarizes each Fund’s Investment Income and Capital Gain declaration policy:
| Fund | | Income Dividends | | Capital Gains |
| North Star Opportunity Fund | | Quarterly | | Annually |
| North Star Micro Cap Fund | | Annually | | Annually |
| North Star Dividend Fund | | Monthly | | Annually |
| North Star Bond Fund | | Monthly | | Annually |
| North Star Small Cap Value Fund | | Annually | | Annually |
North Star Funds
NOTES TO FINANCIAL STATEMENTS (Continued)
November 30, 2024
Each Fund records dividends and distributions to its shareholders on the ex-dividend date. Dividends from net investment income and distributions from net realized gains are determined in accordance with federal income tax regulations, which may differ from GAAP. These “book/tax” differences are considered either temporary (e.g., deferred losses, capital loss carryforwards) or permanent in nature. To the extent these differences are permanent in nature, such amounts are reclassified within the composition of net assets based on their federal tax-basis treatment; temporary differences do not require reclassification. Any such reclassifications will have no effect on net assets, results of operations or net asset values per share of each Fund.
Indemnification – The Trust indemnifies its officers and trustees for certain liabilities that may arise from the performance of their duties to the Trust. Additionally, in the normal course of business, the Funds enter into contracts that contain a variety of representations and warranties and which provide general indemnities. Each Fund’s maximum exposure under these arrangements is unknown, as this would involve future claims that may be made against the Fund that have not yet occurred. However, based on experience, the risk of loss due to these warranties and indemnities appears to be remote.
| 3. | INVESTMENT ADVISORY AGREEMENT AND TRANSACTIONS WITH RELATED PARTIES |
Advisory Fees – North Star Investment Management Corp. serves as the Funds’ Investment Adviser (the “Adviser”). Pursuant to an Investment Advisory Agreement with the Funds, the Adviser, under the oversight of the Board, directs the daily operations of the Funds and supervises the performance of administrative and professional services provided by others. Under the terms of the Advisory Agreement, the Adviser receives monthly fees calculated at an annual rate of the average daily net assets of each Fund:
| Fund | | Advisory Fee |
| North Star Opportunity Fund | | 1.00% on the first $100 million in net assets 0.90% on net assets greater than $100 million |
| North Star Micro Cap Fund | | 1.00% on the first $100 million in net assets 0.90% on net assets greater than $100 million |
| North Star Dividend Fund | | 1.00% on the first $100 million in net assets 0.90% on net assets greater than $100 million |
| North Star Bond Fund | | 0.85% |
| North Star Small Cap Value Fund | | 1.00% |
For the year ended November 30, 2024, the Adviser earned advisory fees of:
| Fund | | Advisory Fee | |
| North Star Opportunity Fund | | $ | 1,310,548 | |
| North Star Micro Cap Fund | | | 1,124,152 | |
| North Star Dividend Fund | | | 903,054 | |
| North Star Bond Fund | | | 264,863 | |
| North Star Small Cap Value Fund | | | 362,782 | |
North Star Funds
NOTES TO FINANCIAL STATEMENTS (Continued)
November 30, 2024
The Adviser has contractually agreed, at least until March 31, 2026 for North Star Opportunity, North Star Micro Cap, North Star Dividend and North Star Bond Funds, to waive all or part of its management fees and/or make payments to limit Funds expenses (exclusive of any front-end or contingent deferred loads, taxes, leverage interest, brokerage commissions, expenses incurred in connection with any merger or reorganization, dividend expense on securities sold short, acquired fund fees and expenses, or extraordinary expenses such as litigation) so that the total annual operating expenses of the Funds do not exceed 1.55% and 1.30% of the North Star Opportunity Fund’s average net assets, for Class A and Class I shares, respectively, 1.74% of the North Star Micro Cap Fund’s average net assets for Class I shares, 1.74% of the North Star Dividend Fund’s average net assets for Class I shares and 1.79% of the North Star Bond Fund’s average net assets for Class I shares. For the year ended November 30, 2024, the Adviser waived fees in the amount of $51,493 for the Opportunity Fund.
The Adviser has agreed contractually, at least until May 31, 2026 for North Star Small Cap Value Fund to waive its management fee and to reimburse operating expenses (excluding front-end or contingent deferred loads, brokerage fees and commissions, acquired fund fees and expenses, borrowing costs (such as interest and dividend expense on securities sold short), taxes and extraordinary expenses such as litigation) such that net annual fund operating expenses of the Fund do not exceed 0.98% and 1.21% of the North Star Small Cap Value Fund’s average net assets for Institutional Class and Investor Class shares, respectively. For the year ended November 30, 2024, the Adviser waived fees in the amount of $216,325 for the Small Cap Value Fund.
If the Adviser waives any fee or reimburses any expense pursuant to the Waiver Agreement, and the Fund’s Operating Expenses are subsequently lower than their respective expense limitation, the Adviser shall be entitled to recapture by the Funds for such waived fees or reimbursed expenses provided that such reimbursement does not cause the Funds expenses to exceed their respective expense limitation. If Fund Operating Expenses subsequently exceed 1.55% and 1.30% of the North Star Opportunity Fund’s Class A and Class I shares respectively, 1.74% of the North Star Micro Cap Fund’s and North Star Dividend Fund’s Class I shares, 1.79% of the North Star Bond Fund’s Class I shares and 0.98% and 1.21% of the North Star Small Cap Value Fund’s average daily net assets for Institutional Class and Investor Class shares per annum of the average daily net assets, the reimbursements shall be suspended.
The Adviser may seek reimbursement only for expenses waived or paid by it during the three fiscal years prior to such reimbursement; provided, however, that such expenses may only be reimbursed to the extent they were waived or paid after the date of the Waiver Agreement (or any similar agreement.) The Adviser may recapture expenses only if the expenses are below the expense limitation at the time of the waiver, for North Star Opportunity Fund. The Board may terminate this expense reimbursement arrangement at any time. For the fiscal year ended November 30, 2024, the North Star Micro Cap, North Star Dividend and North Star Bond Funds had no recapture available. Cumulative expenses subject to recapture pursuant to the aforementioned conditions as of November 30, 2024 will expire on November 30 of the following years:
| Fund | | Amount | | | Expiring | |
| North Star Opportunity Fund | | $ | 70,810 | | | 2025 | |
| | | $ | 64,483 | | | 2026 | |
| | | $ | 51,493 | | | 2027 | |
| North Star Small Cap Value Fund | | $ | 130,403 | | | 2026 | |
| | | $ | 216,325 | | | 2027 | |
Despite the contractual terms, the Adviser has determined and represented to the North Star Small Cap Value Fund that it will not seek to recoup any waived fees or expenses reimbursed prior to the close of the reorganization on May 12, 2023.
North Star Funds
NOTES TO FINANCIAL STATEMENTS (Continued)
November 30, 2024
Distributor – The Board has adopted the Trust’s Master Distribution and Shareholder Service Plan (the “Plan”) pursuant to Rule 12b-1 under the 1940 Act. The distributor of the Funds is Northern Lights Distributors, LLC (the “Distributor”). The Board of Trustees of the Northern Lights Fund Trust II has adopted, on behalf of the North Star Opportunity Fund and the North Star Small Cap Value Fund, a Distribution Plan pursuant to Rule 12b-1 under the Investment Company Act of 1940 (the “Plan”), as amended, to pay for certain distribution activities and shareholder services. Under the Plan, the Funds are permitted to pay 0.25% per year of the average daily net assets of Class A shares and Investor Class shares for such distribution and shareholder service activities. For the year ended November 30, 2024, the North Star Opportunity Fund Class A shares incurred $30,630 in distribution fees and the North Star Small Cap Value Investor Class shares incurred $80,070 in distribution fees.
The Distributor acts as the Funds’ principal underwriter in a continuous offering of each Fund’s shares For the year ended November 30, 2024, the Distributor received $1,144 in underwriting commissions, of which $104 was retained by the principal underwriter for sales of the North Star Opportunity Fund’s Class A shares.
During the year ended November 30, 2024, NewEdge Group, a registered broker/dealer and an affiliate of the Funds, executed trades on behalf of the Funds. These trades were cleared through National Financial Services, LLC. During the year ended November 30, 2024, NewEdge Group received trade commissions as follows:
| Fund | | Amount | |
| North Star Opportunity Fund | | $ | 33,244 | |
| North Star Micro Cap Fund | | $ | 38,157 | |
| North Star Dividend Fund | | $ | 22,659 | |
| North Star Bond Fund | | $ | 2,460 | |
In addition, certain affiliates of the Distributor provide services to the Funds as follows:
Ultimus Fund Solutions, LLC (“UFS”) – an affiliate of the Distributor, provides administration, fund accounting, and transfer agent services to the Trust. Pursuant to separate servicing agreements with UFS, the Fund pays UFS customary fees for providing administration, fund accounting and transfer agency services to the Fund. Certain officers of the Trust are also officers of UFS, and are not paid any fees directly by the Fund for serving in such capacities.
Northern Lights Compliance Services, LLC (“NLCS”) - NLCS, an affiliate of UFS and the Distributor, provides a Chief Compliance Officer to the Trust, as well as related compliance services, pursuant to a consulting agreement between NLCS and the Trust. Under the terms of such agreement, NLCS receives customary fees from the Funds.
Blu Giant, LLC (“Blu Giant”) – Blu Giant, an affiliate of UFS and the Distributor, provides EDGAR conversion and filing services as well as print management services for the Funds on an ad-hoc basis. For the provision of these services, Blu Giant receives customary fees from the Funds.
North Star Funds
NOTES TO FINANCIAL STATEMENTS (Continued)
November 30, 2024
| 4. | INVESTMENT TRANSACTIONS |
The cost of purchases and proceeds from the sale of securities, other than short-term securities, for the year ended November 30, 2024 were as follows:
| Fund | | Purchases | | | Sales | |
| North Star Opportunity Fund | | $ | 25,454,652 | | | $ | 42,742,446 | |
| North Star Micro Cap Fund | | | 27,526,981 | | | | 34,723,014 | |
| North Star Dividend Fund | | | 27,886,687 | | | | 30,307,713 | |
| North Star Bond Fund | | | 15,445,477 | | | | 11,398,006 | |
| North Star Small Cap Value Fund | | | 9,943,733 | | | | 18,885,171 | |
The beneficial ownership, either directly or indirectly, of more than 25% of the voting securities of a Fund creates presumption of control of the Fund, under Section 2(a)(9) of the 1940 Act. As of November 30, 2024, NFS LLC held approximately 72.3% of the voting securities of the North Star Opportunity Fund, 69.5% of the North Star Micro Cap Fund, 78.1% of the North Star Dividend Fund, 80.4% of the North Star Bond Fund and 55.2% of the North Star Small Cap Value Fund. As of November 30, 2024, Charles Schwab held approximately 29.2% of the voting securities of the North Star Small Cap Value Fund. The Trust has no knowledge as to whether all or any portion of the shares owned of record are also beneficially owned by NFS LLC or Charles Schwab.
The Funds may assess a short-term redemption fee of 2.00% of the total redemption amount if shareholders sell their shares after holding them for less than 30 days. The redemption fee is paid directly to the Funds. For the year ended November 30, 2024, the North Star Opportunity Fund had $15 and $393 in redemption fees for Class A and Class I, respectively. The North Star Micro Cap Fund had $109 in redemption fees, the North Star Dividend Fund had $143 in redemption fees and the North Star Bond Fund had $0 in redemption fees. Effective June 1, 2021, the North Star Small Cap Value Fund eliminated the redemption fee.
| 7. | INVESTMENTS IN AFFILIATED ISSUERS |
An affiliated issuer is an issuer in which the Fund has ownership of at least 5% of the voting securities. Issuers which are affiliates of the North Star Opportunity Fund and North Star Micro Cap Fund at November 30, 2024, are noted in the Fund’s Schedule of Investments.
Transactions during the period with companies which are affiliates are as follows:
North Star Opportunity Fund
| Description | | Fair Value
November 30,
2023 | | | Purchases | | | Sales | | | Dividends
Credited to
Income | | | Realized
Gain/(Loss) | | | Net Change in
Unrealized
Appreciation
(Depreciation) | | | Fair Value
November 30,
2024 | | | Shares
November 30,
2024 | |
| Orion Energy Systems, Inc. 1 | | $ | 1,513,000 | | | $ | 256,081 | | | $ | - | | | $ | - | | | $ | - | | | $ | (109,841 | ) | | $ | 1,659,240 | | | | 1,980,000 | |
| 1. | Not affiliated November 30,2023 |
North Star Funds
NOTES TO FINANCIAL STATEMENTS (Continued)
November 30, 2024
North Star Micro Cap Fund
| Description | | Fair Value
November 30,
2023 | | | Purchases | | | Sales | | | Dividends
Credited to
Income | | | Realized
Gain/(Loss) | | | Net Change in
Unrealized
Appreciation
(Depreciation) | | | Fair Value
November 30,
2024 | | | Shares
November 30,
2024 | |
| Truett-Hurst, Inc. - Class A | | $ | 75,314 | | | $ | - | | | $ | (83,683 | ) | | $ | - | | | $ | (710,922 | ) | | $ | 719,291 | | | $ | - | | | | 278,942 | |
| 8. | AGGREGATE UNREALIZED APPRECIATION AND DEPRECIATION |
The identified cost of investments in securities owned by each Fund for federal income tax purposes, and their respective gross unrealized appreciation and depreciation at November 30, 2024, were as follows:
Fund | |
Tax Cost | | |
Gross Unrealized
Appreciation | | |
Gross Unrealized
Depreciation | | | Net Unrealized
Appreciation/
(Depreciation) | |
| North Star Opportunity Fund | | $ | 74,299,064 | | | $ | 65,492,173 | | | $ | (1,381,878 | ) | | $ | 64,110,295 | |
| North Star Micro Cap Fund | | | 72,571,219 | | | | 55,172,613 | | | | (1,400,477 | ) | | | 53,772,136 | |
| North Star Dividend Fund | | | 70,685,590 | | | | 26,361,061 | | | | (1,264,475 | ) | | | 25,096,586 | |
| North Star Bond Fund | | | 31,735,254 | | | | 587,330 | | | | (115,461 | ) | | | 471,869 | |
| North Star Small Cap Value Fund | | | 20,470,621 | | | | 16,451,313 | | | | (234,369 | ) | | | 16,216,944 | |
| 9. | DISTRIBUTIONS TO SHAREHOLDERS AND TAX COMPONENTS OF CAPITAL |
The tax character of fund distributions for the following years were as follows:
| | | For the
year ended
November 30, 2024 | |
Fund | | Ordinary
Income | | | Long-Term
Capital Gains | | |
Total
| |
| North Star Opportunity Fund | | $ | 1,762,325 | | | $ | 2,042,662 | | | $ | 3,804,987 | |
| North Star Micro Cap Fund | | | 782,956 | | | | - | | | | 782,956 | |
| North Star Dividend Fund | | | 2,685,840 | | | | 583,044 | | | | 3,268,884 | |
| North Star Bond Fund | | | 1,355,084 | | | | - | | | | 1,355,084 | |
| North Star Small Cap Value Fund | | | - | | | | - | | | | - | |
| | | For the
year ended
November 30, 2023 | |
Fund | | Ordinary
Income | | | Long-Term
Capital Gains | | |
Total
| |
| North Star Opportunity Fund | | $ | 1,655,854 | | | $ | 4,437,373 | | | $ | 6,093,227 | |
| North Star Micro Cap Fund | | | 237,830 | | | | - | | | | 237,830 | |
| North Star Dividend Fund | | | 2,073,985 | | | | 3,060,832 | | | | 5,134,817 | |
| North Star Bond Fund | | | 900,562 | | | | - | | | | 900,562 | |
| North Star Small Cap Value Fund | | | 75,442 | | | | 3,259,956 | | | | 3,335,398 | |
North Star Funds
NOTES TO FINANCIAL STATEMENTS (Continued)
November 30, 2024
As of November 30, 2024, the components of accumulated earnings/(deficit) on a tax basis were as follows:
Fund | | Undistributed
Ordinary
Income | | | Undistributed
Long-Term
Capital Gains | | | Post October Loss
and
Late Year Loss | | | Capital Loss
Carry
Forwards | | | Other
Book/Tax
Differences | | | Unrealized
Appreciation/
(Depreciation) | | | Total
Accumulated
Earnings/(Deficits) | |
| North Star Opportunity Fund | | $ | 7,888 | | | $ | 3,792,966 | | | $ | - | | | $ | - | | | $ | (50,801 | ) | | $ | 64,110,295 | | | $ | 67,860,348 | |
| North Star Micro Cap Fund | | | 868,466 | | | | 2,651,575 | | | | - | | | | - | | | | 264,061 | | | | 53,772,136 | | | | 57,556,238 | |
| North Star Dividend Fund | | | 188,364 | | | | 1,900,400 | | | | - | | | | - | | | | 11,763 | | | | 25,096,608 | | | | 27,197,135 | |
| North Star Bond Fund | | | 81,394 | | | | - | | | | - | | | | (3,532,490 | ) | | | - | | | | 471,869 | | | | (2,979,227 | ) |
| North Star Small Cap Value Fund | | | - | | | | 4,306,524 | | | | (22,962 | ) | | | - | | | | - | | | | 16,216,933 | | | | 20,500,495 | |
The difference between book basis and tax basis unrealized appreciation (depreciation), undistributed ordinary income (loss) and accumulated net realized gain (loss) from investments is primarily attributable to the tax deferral of losses on wash sales, adjustments for tax gain/loss due to the Funds’ conversion from limited partnerships, unamortized organizational costs from fund mergers and tax adjustments for real estate investment trusts, trust preferred securities, C-Corporations with return of capital distributions and perpetual bonds. The unrealized appreciation (depreciation) in the table above includes unrealized foreign currency gains (losses) of $(22) and $11 for North Star Dividend Fund and North Star Small Cap Value Fund, respectively.
Late year losses incurred after December 31 within the fiscal year are deemed to arise on the first business day of the following fiscal year for tax purposes. The North Star Small Cap Value Fund incurred and elected to defer such late year losses of $22,962.
At November 30, 2024, the following Funds had capital loss carry forwards for federal income tax purposes available to offset future capital gains, along with capital loss carryforwards utilized as follows:
| | | Non-Expiring | | | | | | CLCF | |
| Fund | | Short-Term | | | Long-Term | | | Total | | | Utilized | |
| North Star Micro Cap Fund | | $ | - | | | $ | - | | | $ | - | | | $ | 639,799 | |
| North Star Bond Fund | | | 948,163 | | | | 2,584,327 | | | | 3,532,490 | | | | - | |
During the fiscal year ended November 30, 2024, certain of the Funds utilized tax equalization which is the use of earnings and profits distributions to shareholders on redemption of shares as part of the dividends paid deduction for income tax purposes. Permanent book and tax differences, primarily attributable to net operating losses, use of tax equalization credits, and adjustments for prior year tax returns, resulted in reclassification for the following Funds for the year ended November 30, 2024, as follows:
Fund | | Paid In
Capital | | | Accumulated
Earnings
(Losses) | |
| North Star Opportunity Fund | | $ | 217,574 | | | $ | (217,574 | ) |
| North Star Micro Cap Fund | | | 88,287 | | | | (88,287 | ) |
| North Star Dividend Fund | | | 95,292 | | | | (95,292 | ) |
| North Star Bond Fund | | | (492 | ) | | | 492 | |
| North Star Small Cap Value Fund | | | 540,237 | | | | (540,237 | ) |
North Star Funds
NOTES TO FINANCIAL STATEMENTS (Continued)
November 30, 2024
Subsequent events have been evaluated from the date of the Statement of Assets and Liabilities through the date the financial statements were issued. Management has determined that no events or transactions occurred requiring adjustment or disclosure in the financial statements.
Report of Independent Registered Public Accounting Firm
To the Board of Trustees of North Lights Fund Trust II
and the Shareholders of North Star Opportunity Fund, North Star Micro Cap Fund,
North Star Dividend Fund, and North Star Bond Fund
Opinion on the Financial Statements
We have audited the accompanying statements of assets and liabilities of North Star Opportunity Fund, North Star Micro Cap Fund, North Star Dividend Fund, and North Star Bond Fund (collectively, the Funds), each a separate series of the Northern Lights Fund Trust II, including the schedules of investments, as of November 30, 2024, the related statements of operations for the year then ended, the statements of changes in net assets for each of the two years in the period then ended, and the related notes to the financial statements (collectively, the financial statements), and the financial highlights for each of the five years in the period then ended. In our opinion, the financial statements and financial highlights present fairly, in all material respects, the financial position of the Funds as of November 30, 2024, the results of their operations for the year then ended, the changes in net assets for each of the two years in the period then ended, and the financial highlights for each of the five years in the period then ended, in conformity with accounting principles generally accepted in the United States of America.
Basis for Opinion
These financial statements are the responsibility of the Funds’ management. Our responsibility is to express an opinion on the Funds’ financial statements and financial highlights based on our audits. We are a public accounting firm registered with the Public Company Accounting Oversight Board (United States) (PCAOB) and are required to be independent with respect to the Funds in accordance with U.S. federal securities laws and the applicable rules and regulations of the Securities and Exchange Commission and the PCAOB.
We conducted our audits in accordance with the standards of the PCAOB. Those standards require that we plan and perform the audit to obtain reasonable assurance about whether the financial statements are free of material misstatement, whether due to error or fraud. The Funds are not required to have, nor were we engaged to perform, an audit of their internal control over financial reporting. As part of our audits, we are required to obtain an understanding of internal control over financial reporting but not for the purpose of expressing an opinion on the effectiveness of the Funds’ internal control over financial reporting. Accordingly, we express no such opinion.
Our audits included performing procedures to assess the risks of material misstatement of the financial statements, whether due to error or fraud, and performing procedures that respond to those risks. Such procedures included examining, on a test basis, evidence regarding the amounts and disclosures in the financial statements. Our procedures included confirmation of investments owned as of November 30, 2024, by correspondence with the custodian and broker. Our audits also included evaluating the accounting principles used and significant estimates made by management, as well as evaluating the overall presentation of the financial statements. We believe that our audits provide a reasonable basis for our opinion.
/s/ RSM US LLP
We have served as the auditor of one or more investment companies in the North Star fund complex since 2015.
Denver, Colorado
January 29, 2025
Report of Independent Registered Public Accounting Firm
To the Board of Trustees of North Lights Funds Trust II
and the Shareholders of North Star Small Cap Value Fund
Opinion on the Financial Statements
We have audited the accompanying statement of assets and liabilities of North Star Small Cap Value Fund (the Fund), including the schedule of investments, as of November 30, 2024, the related statements of operations for the year then ended, the statements of changes in net assets for year ended November 30, 2024 and the period from February 1, 2023 to November 30, 2023, and the related notes to the financial statements (collectively, the financial statements), and the financial highlights for the year ended November 30, 2024 and the period from February 1, 2023 to November 30, 2023. In our opinion, the financial statements and financial highlights present fairly, in all material respects, the financial position of the Fund as of November 30, 2024, the results of its operations for the year then ended, and the changes in net assets and the financial highlights for the year ended November 30, 2024 and the period from February 1, 2023 to November 30, 2023, in conformity with accounting principles generally accepted in the United States of America.
The statements of changes in net assets of the Fund for the year ended January 31, 2023, and the financial highlights for the years ended January 31, 2023, January 31, 2022, January 31, 2021, and January 31, 2020, for the Fund were audited by other auditors. Those auditors expressed an unqualified opinion on those financial statements and financial highlights in their report dated March 29, 2023.
Basis for Opinion
These financial statements are the responsibility of the Fund’s management. Our responsibility is to express an opinion on the Fund’s financial statements and financial highlights based on our audit. We are a public accounting firm registered with the Public Company Accounting Oversight Board (United States) (PCAOB) and are required to be independent with respect to the Fund in accordance with U.S. federal securities laws and the applicable rules and regulations of the Securities and Exchange Commission and the PCAOB.
We conducted our audits in accordance with the standards of the PCAOB. Those standards require that we plan and perform the audit to obtain reasonable assurance about whether the financial statements are free of material misstatement, whether due to error or fraud. The Fund is not required to have, nor were we engaged to perform, an audit of its internal control over financial reporting. As part of our audit, we are required to obtain an understanding of internal control over financial reporting but not for the purpose of expressing an opinion on the effectiveness of the Fund’s internal control over financial reporting. Accordingly, we express no such opinion.
Our audits included performing procedures to assess the risks of material misstatement of the financial statements, whether due to error or fraud, and performing procedures that respond to those risks. Such procedures included examining, on a test basis, evidence regarding the amounts and disclosures in the financial statements. Our procedures included confirmation of investments owned as of November 30, 2024, by correspondence with the custodian and broker. Our audits also included evaluating the accounting principles used and significant estimates made by management, as well as evaluating the overall presentation of the financial statements. We believe that our audits provide a reasonable basis for our opinion.
/s/ RSM US LLP
We have served as the auditor of one or more investment companies in the North Star fund complex since 2015.
Denver, Colorado
January 29, 2025
North Star Funds
ADDITIONAL INFORMATION (Unaudited)
November 30, 2024
Changes in and Disagreements with Accountants
There were no changes in or disagreements with accountants during the period covered by this report.
Proxy Disclosures
Not applicable.
Remuneration Paid to Directors, Officers and Others
Refer to the financial statements included herein.
Statement Regarding Basis for Approval of Investment Advisory Agreement
FACTORS CONSIDERED BY THE TRUSTEES IN THE APPROVAL OF THE RENEWAL OF AN INVESTMENT ADVISORY AGREEMENT
At a Regular meeting (the “Meeting”) of the Board of Trustees (the “Board”) of Northern Lights Fund Trust II (the “Trust”) held on October 15, 2024, the Board, including the disinterested Trustees (the “Independent Trustees”), considered the renewal of the Investment Advisory Agreement (the “North Star Advisory Agreement”) between the Trust, on behalf of the North Star Opportunity Fund, North Star Dividend Fund, North Star Micro Cap Fund and the North Star Bond Fund (the “North Star Funds”), and North Star Investment Management Corporation (“North Star”).
Based on their evaluation of the information provided by North Star, in conjunction with each North Star Fund’s other service providers, the Board, by a unanimous vote (including a separate vote of the Independent Trustees), approved the renewal of the North Star Advisory Agreement with respect to each of the North Star Funds.
In advance of the Meeting, the Board requested and received materials to assist them in considering the North Star Advisory Agreement. The materials provided contained information with respect to the factors enumerated below, including the North Star Advisory Agreement, a memorandum prepared by the Independent Trustees’ legal counsel discussing in detail the Trustees’ fiduciary obligations and the factors they should assess in considering the continuation of the North Star Advisory Agreement and comparative information relating to the advisory fee and other expenses of each of the North Star Funds. The materials also included due diligence materials relating to North Star (including due diligence questionnaires completed by North Star, select financial information of North Star, bibliographic information regarding North Star’s key management and investment advisory personnel, and comparative fee information relating to each North Star Fund) and other pertinent information. At the Meeting, the Independent Trustees were advised by counsel that is experienced in Investment Company Act of 1940 matters and that is independent of fund management and met with such counsel separately from fund management.
The Board then reviewed and discussed the written materials that were provided in advance of the Meeting and deliberated on the renewal of the North Star Advisory Agreement. The Board relied upon the advice of independent legal counsel and their own business judgment in determining the material factors to be considered in evaluating the North Star Advisory Agreement and the weight to be given to each such factor. The conclusions reached by the Board were based on a comprehensive evaluation of all of the information provided and were not the result of any one factor. Moreover, each Trustee may have afforded different weight to the various factors in reaching his conclusions with respect to the North Star Advisory Agreement. In considering the renewal of the North Star Advisory Agreement, the Board reviewed and analyzed various factors that they determined were relevant, including the factors enumerated below.
North Star Funds
ADDITIONAL INFORMATION (Continued) (Unaudited)
November 30, 2024
Nature, Extent and Quality of Services. The Board reviewed materials provided by North Star related to the proposed renewal of the North Star Advisory Agreement with respect to each of the North Star Funds, including its Form ADV and related schedules, a description of the manner in which investment decisions are made and executed, and a review of the personnel performing services for each of the North Star Funds, including the individuals that primarily monitor and execute the investment process. The Board discussed North Star’s research capabilities, the quality of North Star’s compliance infrastructure and the experience of its investment advisory personnel. The Board noted that North Star is an experienced investment adviser with seasoned senior management. Additionally, the Board received satisfactory responses from the representatives of North Star with respect to a series of important questions, including: whether North Star was involved in any lawsuits or pending regulatory actions; whether the advisory services provided to its other accounts would conflict with the advisory services provided to each of the North Star Funds; whether there were procedures in place to adequately allocate trades among its respective clients; and whether North Star’s CCO had processes in place to review the portfolio managers’ performance of their duties to ensure compliance under North Star’s compliance program. The Board reviewed the information provided on the practices for monitoring compliance with each of the North Star Fund’s investment limitations and discussed North Star’s compliance program with the CCO of the Trust. The Board noted that the CCO of the Trust continued to represent, based on his review, that North Star’s policies and procedures were reasonably designed to prevent violations of applicable federal securities laws. The Board also noted North Star’s representation that the prospectus and statement of additional information for the North Star Funds accurately describe the investment strategies of each of the North Star Funds. The Board then reviewed the capitalization of North Star based on financial information provided by and representations made by North Star and its representatives and concluded that North Star was sufficiently well-capitalized in order to meet its obligations to each of the North Star Funds. The Board concluded that North Star had sufficient quality and depth of personnel, resources, investment methods and compliance policies and procedures essential to performing its duties under the North Star Advisory Agreement and that the nature, overall quality and extent of the advisory services provided by North Star to each of the North Star Funds were satisfactory.
Performance. The Board discussed the report prepared by Broadridge and reviewed the performance of each of the North Star Funds as compared to its respective peer group, Morningstar category and benchmark for the one-year, three-year, five-year, ten-year and since inception periods ended September 30, 2024, as applicable. With respect to North Star Opportunity, the Board noted that North Star Opportunity underperformed its peer group median, Morningstar category median, and benchmark (S&P Target Risk Aggressive Index) for the one-year, three-year, five-year, ten-year and since inception periods although modestly in many cases. The Board reviewed the performance of North Star Micro Cap noting that North Star Micro Cap had outperformed its peer group median, benchmark (Morningstar US Small Cap Value PR Index) and Morningstar category median for the one-year and five-year periods, had underperformed its peer group median, benchmark and Morningstar category median for the three-year period, had underperformed its peer group median and Morningstar category median but outperformed its benchmark for the ten-year period, and had outperformed its peer group median and benchmark but underperformed the Morningstar category median for the since inception period. The Board next reviewed the performance of North Star Dividend noting that North Star Dividend had underperformed its benchmark (Morningstar US Small Cap Value PR Index), peer group median and Morningstar category median for the one-year, three-year and five-year periods, and underperformed its peer group median and Morningstar category median, but outperformed its benchmark, for the ten-year and since inception periods. The Board also reviewed the performance of North Star Bond noting that North Star Bond had underperformed its benchmark (Bloomberg Barclays Ba/B U.S. High Yield Index), peer group median and Morningstar category median for the one-year, three-year, five-year and since inception periods. After further discussion, the Board concluded that the performance of each of North Star Opportunity, North Star Micro Cap, North Star Dividend and North Star Bond was acceptable although the Board would continue to monitor the performance of each of the North Star Funds.
North Star Funds
ADDITIONAL INFORMATION (Continued) (Unaudited)
November 30, 2024
Fees and Expenses. As to the costs of the services provided by North Star, the Board reviewed and discussed each of the North Star Fund’s advisory fee and total operating expenses as compared to its peer group and its Morningstar category as presented in the Broadridge Report. The Board noted that the advisory fee for each North Star Fund was near or at the high end of its respective peer group and Morningstar category ranges. The Board further noted that, reflecting the application of advisory fee breakpoints, North Star Opportunity, North Star Micro Cap and North Star Dividend were being charged a 0.97%, 0.99% and 1.00% advisory fee by North Star, respectively, which was above the Morningstar category median and peer group median for each Fund although not the highest in their respective peer groups or Morningstar categories. The Board also noted that, with respect to each of North Star Opportunity, North Star Micro Cap and North Star Dividend, the advisory fee was 1.00% with a reduction to 0.90% on assets above $100 million. With respect to North Star Bond, the Board noted that the Fund’s 0.85% advisory fee was in line with the peer group median but higher than Morningstar category median.
The Board discussed North Star’s similarly managed accounts which were comparable to North Star Micro Cap noting the advisory fee of 0.50% was substantially less than the 1.00% advisory fee charged by North Star for North Star Micro Cap. The Board noted, however, that North Star had represented to the Board that it charged a lower fee for such accounts as they are sub-advisory accounts where North Star only manages a portion of an account portfolio, did not have direct contact with the client and, overall, North Star provided fewer services and devoted substantially less time and attention to such accounts.
The Board then reviewed the contractual arrangements for each of the North Star Funds, which stated that North Star had agreed to waive or limit its advisory fee and/or reimburse expenses at least until March 31, 2026, in order to limit net annual operating expenses, exclusive of certain fees, so as not to exceed: 1.55%, 1.55%, and 1.30%, of North Star Opportunity’s average annual net assets for Class A, Class R and Class I Shares, respectively; 1.74% and 1.99% of North Star Dividend’s average annual net assets for Class I and Class R shares, respectively; 1.74% and 1.99% of North Star Micro Cap’s average annual net assets for Class I and Class R shares, respectively; and 1.79% of North Star Bond’s average annual net assets for Class I shares. The Board found such arrangements to be beneficial to shareholders. The Board further noted that each North Star Fund was currently operating below each of these expense caps. The Board concluded that based on North Star’s experience, expertise and services provided to the Funds, the advisory fee charged by North Star for each North Star Fund, although at or near the high end of each North Star Fund’s peer group, was not unreasonable.
Profitability. The Board also considered the level of profits that have accrued and could be expected to accrue to North Star with respect to each of North Star Opportunity, North Star Dividend, North Star Micro Cap and North Star Bond based on profitability reports and profitability analyses provided by North Star with respect to each of the North Star Funds. The Board also reviewed the selected financial information of North Star provided by North Star. After review and discussion, the Board concluded that the profit from North Star’s relationship with each of the North Star Funds was not excessive.
Economies of Scale. As to the extent to which each of the North Star Funds would realize economies of scale as it grew, and whether the fee levels reflect these economies of scale for the benefit of investors, the Board discussed the current size of each of the North Star Funds, noting the existing advisory fee reduction when assets of North Star Opportunity, North Star Dividend or North Star Micro Cap reach $100 million. The Board further considered North Star’s expectations for growth, and concluded that additional material economies of scale would likely not be achieved in the near term.
North Star Funds
ADDITIONAL INFORMATION (Continued) (Unaudited)
November 30, 2024
Conclusion. The Board relied upon the advice of counsel, and their own business judgment in determining the material factors to be considered in evaluating the North Star Advisory Agreement and the weight to be given to each such factor. Accordingly, having requested and received such information from North Star as the Trustees believed to be reasonably necessary to evaluate the terms of the North Star Advisory Agreement, and as assisted by the advice of independent counsel, the Board, including a majority of the Independent Trustees, determined that, with respect to the North Star Advisory Agreement, (a) the terms of the North Star Advisory Agreement are not unreasonable; (b) the advisory fee is not unreasonable; and (c) the North Star Advisory Agreement is in the best interests of each North Star Fund and its respective shareholders. In considering the renewal of the North Star Advisory Agreement, the Board did not identify any one factor as all important, but rather considered these factors collectively and determined that approval of the renewal of the North Star Advisory Agreement was in the best interest of each North Star Fund and its respective shareholders. Moreover, the Board noted that each Trustee may have afforded different weight to the various factors in reaching his conclusions with respect to the North Star Advisory Agreement.
Proxy Voting Policy
Information regarding how the Funds vote proxies relating to portfolio securities for the 12 month period ended June 30th as well as a description of the policies and procedures that the Funds used to determine how to vote proxies is available without charge, upon request, by calling 855-580-0900 or by referring to the Securities and Exchange Commission’s (“SEC”) website at http://www.sec.gov.
Item 8. Changes in and Disagreements with Accountants for Open-End Management Investment Companies.
Not applicable
Item 9. Proxy Disclosures for Open-End Management Investment Companies.
Not applicable
Item 10. Remuneration Paid to Directors, Officers, and Others of Open-End Management Investment Companies.
Included under Item 7
Item 11. Statement Regarding Basis for Approval of Investment Advisory Contract.
Included under Item 7
Item 12. Disclosure of Proxy Voting Policies and Procedures for Closed-End Management Investment Companies.
Not applicable
Item 13. Portfolio Managers of Closed-End Management Investment Companies.
Not applicable
Item 14. Purchases of Equity Securities by Closed-End Management Investment Company and Affiliated Purchasers.
Not applicable
Item 15. Submission of Matters to a Vote of Security Holders.
None
Item 16. Controls and Procedures
| (a) | The registrant’s Principal Executive Officer and Principal Financial Officer have concluded that the registrant’s disclosure controls and procedures (as defined in Rule 30a-3(c) under the Act) are effective in design and operation and are sufficient to form the basis of the certifications required by Rule 30a-(2) under the Act, based on their evaluation of these disclosure controls and procedures as of a date within 90 days of this report on Form N-CSR. |
| (b) | There were no changes in the registrant’s internal control over financial reporting (as defined in Rule 30a-3(d) under the Act) during the period covered by this report that have materially affected, or are reasonably likely to materially affect, the registrant’s internal control over financial reporting. |
Item 17. Disclosure of Securities Lending Activities for Closed-End Management Investment Companies.
Not applicable
Item 18. Recovery of Erroneously Awarded Compensation.
Item 19. Exhibits.
| (a)(3) | A separate certification for each principal executive officer and principal financial officer of the registrant as required by Rule 30a-2(a) under the Act (17 CFR 270.30a-2(a)): Attached hereto. |
| (b) | Certifications required by Rule 30a-2(b) under the Act (17 CFR 270.30a-2(b)): Attached hereto. |
SIGNATURES
Pursuant to the requirements of the Securities Exchange Act of 1934 and the Investment Company Act of 1940, the registrant has duly caused this report to be signed on its behalf by the undersigned, thereunto duly authorized.
| Northern Lights Fund Trust II | |
| By | /s/ Kevin E. Wolf | |
| | Kevin E. Wolf
Principal Executive Officer | |
Pursuant to the requirements of the Securities Exchange Act of 1934 and the Investment Company Act of 1940, this report has been signed below by the following persons on behalf of the registrant and in the capacities and on the dates indicated.
| By | /s/ Kevin E. Wolf | |
| | Kevin E. Wolf
Principal Executive Officer | |
| By | /s/ Erik Naviloff | |
| | Erik Naviloff
Principal Financial Officer | |