|
| OMB APPROVAL |
OMB Number: 3235-0570 Expires: January 31, 2017 Estimated average burden hours per response. . . . . . .20.6 |
UNITED STATES
SECURITIES AND EXCHANGE COMMISSION
Washington, D.C. 20549
Form N-CSR
CERTIFIED SHAREHOLDER REPORT OF REGISTERED MANAGEMENT
INVESTMENT COMPANIES
Investment Company Act File Number 811-22551
MAINSTAY DEFINEDTERM
MUNICIPAL OPPORTUNITIES FUND
(Exact name of Registrant as specified in charter)
51 Madison Avenue, New York, NY 10010
(Address of principal executive offices) (Zip code)
J. Kevin Gao, Esq.
169 Lackawanna Avenue
Parsippany, New Jersey 07054
(Name and address of agent for service)
Registrant’s telephone number, including area code: (212) 576-7000
Date of fiscal year end: May 31
Date of reporting period: May 31, 2014
| Item 1. | Reports to Stockholders. |
MainStay DefinedTerm Municipal Opportunities Fund
Message from the President and Annual Report
May 31, 2014 | NYSE Symbol MMD


This page intentionally left blank
Message from the President
Municipal bonds generally provided positive returns for the 12 months ended May 31, 2014. Their performance, however, was affected by a variety of factors.
At the beginning of the reporting period, interest rates were rising in response to a suggestion by then-chairman of the Federal Reserve, Ben Bernanke, that the Federal Open Market Committee (“FOMC”) might begin tapering its extensive bond-purchase program, widely known as quantitative easing.
Interest rates later declined on assurances from the FOMC that economic progress did not yet warrant tapering. In December 2013, however, the FOMC announced that it would begin tapering its bond purchases in January 2014. The tapering program began on schedule, and the FOMC has continued to reduce its open-market bond purchases.
In the municipal market, yields rose in the latter half of 2013, fueled by reduced liquidity, the anticipated tapering of quantitative easing and persistent redemptions for tax-loss harvesting. These net redemptions stopped in January 2014, and the next four months were dominated by a scarcity of municipal supply. The lack of supply helped push municipal bond prices higher, spreads tighter and the yield curve flatter as U.S. Treasury rates declined and municipal credit fundamentals improved.
During the reporting period, the FOMC sought to maximize employment and maintain price stability by keeping the federal funds target rate in a near-zero range. Over the same period, the portfolio managers of MainStay DefinedTerm Municipal Opportunities Fund sought to make the most of shifting market opportunities while seeking to minimize exposure to unnecessary risks.
The report that follows provides additional information about the decisions, securities and market forces that affected the Fund during the 12 months ended May 31, 2014. We encourage you to read the report carefully, and we thank you for choosing MainStay DefinedTerm Municipal Opportunities Fund.
Sincerely,

Stephen P. Fisher
President
The opinions expressed are as of the date of this report and are subject to change. There is no guarantee that any forecast made will come to pass. This material does not constitute investment advice and is not intended as an endorsement of any specific investment. Past performance is no guarantee of future results.
Not part of the Annual Report
Table of Contents
Certain material in this report may include statements that constitute “forward-looking statements” under the U.S. securities laws. Forward-looking statements include, among other things, projections, estimates and information about possible or future results or events related to the Fund, market or regulatory developments. The views expressed herein are not guarantees of future performance or economic results and involve certain risks, uncertainties and assumptions that could cause actual outcomes and results to differ materially from the views expressed herein. The views expressed herein are subject to change at any time based upon economic, market, or other conditions and the Fund undertakes no obligation to update the views expressed herein.
Fund Performance and Statistics (Unaudited)
Performance data quoted represents past performance. Past performance is no guarantee of future results. Because of market volatility, current performance may be lower or higher than the figures shown. Index performance is shown for illustration purposes only. You cannot invest directly into an index. Investment return and principal value will fluctuate, and as a result, when shares are sold, they may be worth more or less than their original cost. For performance information current to the most recent month-end, please visit mainstayinvestments.com/mmd.
| | | | | | | | |
| Total Returns | | One Year | | | Since Inception
6/26/12 | |
| | |
| Net Asset Value (“NAV”)1 | | | 2.36 | % | | | 6.60 | % |
| | |
| Market Price1 | | | 3.81 | | | | 1.77 | |
| | |
| Barclays Municipal Bond Index2 | | | 3.05 | | | | 3.24 | |
| | |
| Average Lipper general & insured municipal debt fund (leveraged)3 | | | 4.04 | | | | 6.62 | |
| | | | | | | | | | |
| Fund Statistics (as of May 31, 2014) | | | | | | | | |
| | | |
| NYSE Symbol | | | MMD | | | Premium/Discount4 | | | –4.42 | % |
| | | |
| CUSIP | | | 56064K100 | | | Total Net Assets (millions) | | $ | 517.0 | |
| | | |
| Inception Date | | | 6/26/12 | | | Total Managed Assets (millions)5 | | $ | 801.4 | |
| | | |
| Market Price | | | $17.93 | | | Leverage6 | | | 35.4 | % |
| | | |
| NAV | | | $18.76 | | | Percent of AMT Bonds7 | | | 3.78 | % |
| 1. | Total returns assume dividends and capital gains distributions are reinvested. |
| 2. | The Barclays Municipal Bond Index is considered representative of the broad market for investment-grade, tax-exempt bonds with a maturity of at least one year. Bonds subject to the alternative minimum tax or with floating or zero coupons are excluded. An investment cannot be made directly in an index. |
| 3. | The average Lipper general & insured municipal debt fund (leveraged) is representative of funds that either invest primarily in municipal debt issues rated in the top four credit ratings or invest primarily in municipal debt issues insured as to timely payment. These funds can be leveraged via use of debt, preferred equity, and/or reverse repurchase agreements. This benchmark is a product of Lipper Inc. Lipper Inc. is an independent monitor of fund performance. Results are based on average total returns of similar funds with all dividend and capital gain distributions reinvested. |
| 4. | Premium/Discount is the percentage (%) difference between the market price and the NAV price. When the market price exceeds the NAV, the Fund is trading at a Premium. When the market price is less than the NAV, the Fund is trading at a Discount. |
| 5. | “Managed Assets” is defined as the Fund’s total assets, minus the sum of its accrued liabilities (other than Fund liabilities incurred for the purpose of creating effective leverage (i.e. tender option bonds) or Fund liabilities related to liquidation preference of any preferred shares issued). |
| 6. | Leverage is based on the use of proceeds received from tender option bond transactions, issuing Preferred Shares, funds borrowed from banks or other institutions or derivative transactions, expressed as a percentage of Managed Assets. |
| 7. | Alternative Minimum Tax (“AMT”) is a separate tax computation under the Internal Revenue Code that, in effect, eliminates many deductions and credits and creates a tax liability for an individual who would otherwise pay little or no tax. |
Portfolio Composition as of May 31, 2014† (Unaudited)
| | | | |
| California | | | 19.3 | % |
| Illinois | | | 12.3 | |
| Michigan | | | 6.5 | |
| Texas | | | 6.3 | |
| Pennsylvania | | | 5.5 | |
| Virginia | | | 4.6 | |
| Florida | | | 4.4 | |
| Ohio | | | 3.4 | |
| New Jersey | | | 3.4 | |
| Guam | | | 3.2 | |
| Puerto Rico | | | 3.0 | |
| Maryland | | | 2.9 | |
| Kansas | | | 2.7 | |
| Nebraska | | | 2.7 | |
| Washington | | | 2.6 | |
| Rhode Island | | | 2.1 | |
| Tennessee | | | 2.0 | |
| Nevada | | | 1.6 | |
| Louisiana | | | 1.4 | |
| | | | |
| Arizona | | | 1.3 | % |
| New York | | | 1.2 | |
| U.S. Virgin Islands | | | 1.0 | |
| Colorado | | | 0.7 | |
| Iowa | | | 0.7 | |
| Alabama | | | 0.6 | |
| Alaska | | | 0.5 | |
| District of Columbia | | | 0.5 | |
| Missouri | | | 0.4 | |
| New Hampshire | | | 0.3 | |
| Vermont | | | 0.2 | |
| Georgia | | | 0.1 | |
| Indiana | | | 0.1 | |
| Massachusetts | | | 0.1 | |
| West Virginia | | | 0.1 | |
| Other Assets, Less Liabilities | | | 2.3 | |
| | | | |
| | | 100.0 | % |
| | | | |
See Portfolio of Investments beginning on page 9 for specific holdings within these categories.
Top Ten Holdings or Issuers Held as of May 31, 2014# (Unaudited)
| 1. | Texas Municipal Gas Acquisition & Supply Corp. III, Revenue Bonds, 5.00%, due 12/15/29–12/15/32 |
| 2. | Chicago Board of Education, Unlimited General Obligation, 5.50%, due 12/1/39 |
| 3. | University of California, Regents Medical Center, Revenue Bonds, 5.00%, due 5/15/43 |
| 4. | Virginia Commonwealth Transportation Board, Capital Projects, Revenue Bonds, 5.00%, due 5/15/31 |
| 5. | Golden State Tobacco Securitization Corp., Asset Backed, Revenue Bonds, 4.50%–5.30%,
due 6/1/27–6/1/37 |
| 6. | Maryland Health & Higher Educational Facilities Authority, Johns Hopkins Health System Obligated Group, Revenue Bonds, 5.00%, due 5/15/43 |
| 7. | Riverside County Transportation Commission, Limited Tax, Revenue Bonds, 5.25%, due 6/1/39 |
| 8. | State of Illinois, Unlimited General Obligation, 5.25%, due 7/1/31 |
| 9. | City of Sacramento, California, Water, Revenue Bonds, 5.00%, due 9/1/42 |
| 10. | Metropolitan Pier & Exposition Authority, McCormick Place Expansion, Revenue Bonds, 5.50%, due 6/15/50 |
Credit Quality as of May 31, 2014† (Unaudited)
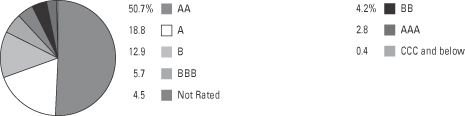
Ratings apply to the underlying portfolio of bonds held by the Fund and are rated by an independent rating agency, such as Standard & Poor’s (“S&P”), Moody’s Investors Service, Inc. and/or Fitch Ratings, Inc. If ratings are provided by the ratings agencies, but differ, the higher rating will be utilized. If only one rating is provided, the available rating will be utilized. Securities that are unrated by the rating agencies are reflected as such in the breakdown. Unrated securities do not necessarily indicate low quality. S&P rates borrowers on a scale from AAA to D. AAA through BBB represent investment grade, while BB through D represent non-investment grade.
| † | As a percentage of Managed Assets. |
| # | Some of these holdings have been transferred to a Tender Option Bond (‘TOB”) Issuer in exchange for the TOB residuals and cash. |
| | |
| 6 | | MainStay DefinedTerm Municipal Opportunities Fund |
Portfolio Management Discussion and Analysis (Unaudited)
Questions answered by portfolio managers Robert DiMella, CFA, John Loffredo, CFA, Michael Petty, Scott Sprauer and David Dowden of MacKay Shields LLC, the Fund’s Subadvisor.
How did MainStay DefinedTerm Municipal Opportunities Fund perform relative to its benchmark and peers for the 12 months ended May 31, 2014?
For the 12 months ended May 31, 2014, MainStay DefinedTerm Municipal Opportunities Fund returned 2.36% at net asset value applicable to Common shares and 3.81% at market price. At net asset value, the Fund underperformed—and at market price, the Fund outperformed—the 3.05% return of the Barclays Municipal Bond Index1 over the same period. At net asset value and at market price, the Fund underperformed the 4.04% return of the average Lipper2 general & insured municipal debt fund (leveraged) for the 12 months ended May 31, 2014.
What factors affected the Fund’s relative performance during the reporting period?
The Fund was positioned with a longer-maturity, lower investment-grade rating profile than the Barclays Municipal Bond Index. This strategy performed well as the municipal yield curve3 flattened and credit spreads4 narrowed. Additionally, while the Fund’s benchmark contains only investment-grade bonds, the Fund can invest a portion of its assets in bonds rated below investment grade. During the latter half of the reporting period, these lower-rated securities produced higher returns as credit spreads tightened. The Fund was also able to invest in some attractive new issues. These securities have shown strong performance in the first four months of 2014.
How was the Fund’s leverage strategy implemented during the reporting period?
Overall, the Fund’s leverage percentage stayed within a specified range during the reporting period. The decline in municipal prices during last summer’s sell-off, however, resulted in correspondingly higher yields. While yields on most municipal bonds increased during the reporting period, the Fund’s cost of borrowing on its leverage remained stable.
What was the Fund’s duration5 strategy during the reporting period?
The Fund’s duration during most of the reporting period was longer than that of the Barclays Municipal Bond Index. This positioning resulted from what we viewed to be a significant buying opportunity during the technical dislocation that occurred in the second half of 2013. We have since brought the Fund’s duration closer to neutral in relation to the Barclays Municipal Bond Index after the strong returns realized year-to-date. We continue to use a position in U.S. Treasury futures to hedge some of the Fund’s higher exposure in longer-maturity issues. At the end of the reporting period, the Fund’s unlevered duration to worst was 6.65 years and the Fund’s leveraged duration to worst was 10.27 years.6
What specific factors, risks or market forces prompted significant decisions for the Fund during the reporting period?
A combination of factors affected the municipal market during the reporting period. Among these were stronger economic data, which prompted speculation about a rotation from bonds to equities, and the Federal Reserve’s tapering of its bond purchases. Financial difficulties in Detroit and Puerto Rico also affected the municipal market. Together, these forces drew money away from municipal mutual funds in 2013. As a closed-end fund, the Fund was not directly subject to the industry-wide outflows. Nevertheless, these redemptions caused municipal yields to move materially higher and drove bond prices lower. This rapid change in market sentiment created opportunities for the Fund to reposition itself in several ways. We focused on selling securities that had fallen in value, as we sought to realize losses that could offset current and future gains for the Fund. During periods of institutional market illiquidity, we targeted the strong appetite for individual bonds among retail investors to execute sales at prices we viewed as favorable relative to the market. We used the proceeds to buy bonds from funds that were forced to sell because of severe outflows.
| 1. | See footnote on page 5 for more information on Barclays Municipal Bond Index. |
| 2. | See footnote on page 5 for more information on Lipper Inc. |
| 3. | The yield curve is a line that plots the yield of various securities of similar quality—typically U.S. Treasury issues—across a wide range of maturities. The U.S. Treasury yield curve serves as a benchmark for other debt and is used in economic forecasting. |
| 4. | The terms “spread” and “yield spread” may refer to the difference in yield between a security or type of security and comparable U.S. Treasury issues. The terms may also refer to the difference in yield between two specific securities or types of securities at a given time. The term “credit spread” typically refers to the difference in yield between corporate or municipal bonds (or a specific category of these bonds) and comparable U.S. Treasury issues. |
| 5. | Duration is a measure of the price sensitivity of a fixed-income investment to changes in interest rates. Duration is expressed as a number of years and is considered a more accurate sensitivity gauge than average maturity. |
| 6. | Duration to worst is the duration of a bond computed using the bond’s nearest call date or maturity, whichever comes first. This measure ignores future cash flow fluctuations due to embedded optionality. Leverage-adjusted duration is a measure of the price sensitivity of a bond or a bond fund to changes in market interest rates. Generally, the longer a bond’s or fund’s duration, the more the price of the bond of fund will change as interest rates change. Leverage-adjusted duration takes into account the leveraging process for a fund and therefore results in a duration that is longer than the duration of the fund’s portfolio of bonds. |
Puerto Rico bonds significantly underperformed the general municipal market during the reporting period, and the Fund’s decision to have minimal exposure to these securities proved beneficial for the Fund. Yield-curve positioning, credit quality and longer-maturity municipals all helped the Fund’s performance during the reporting period.
During the reporting period, which market segments were the strongest positive contributors to the Fund’s performance and which market segments were particularly weak?
The strongest positive contributors to the Fund’s performance were overweight positions among bonds with longer maturities and bonds that tend to be more credit-sensitive. (Contributions take weightings and total returns into account.) An overweight position in bonds wrapped by insurers also added to the Fund’s performance, as these securities outperformed. Hospitals, charter schools and local general obligation bonds also contributed to the Fund’s performance. Currently callable securities detracted from the Fund’s performance. While these securities continued to provide a superior yield, their short duration structure kept prices more muted than the general market.
How did the Fund’s sector and state weightings change during the reporting period?
Because the Fund’s strategy did not materially change during the reporting period, there were no major changes to the Fund’s sector and state weightings. Sectors that we continued to favor were marginally increased, including transportation and water/sewer bonds. During the reporting period, we took the opportunity to lower the Fund’s exposure to the special tax and health care sectors.
From a state perspective, we opportunistically increased the Fund’s exposure to Illinois bonds after a sell-off during the summer pushed prices lower. We also reduced exposure to Ohio, Texas and Virginia bonds.
How was the Fund positioned at the end of the reporting period?
As of May 31, 2014, the Fund was overweight relative to the Barclays Municipal Bond Index in the special tax and health care sectors. As of the same date, the Fund still favored credits rated A and BBB,7 but we increased the overall credit quality of the Fund during the reporting period by increasing exposure to AA-rated8 credits.
| 7. | An obligation rated ‘A’ by Standard & Poor’s (“S&P”) is deemed by S&P to be somewhat more susceptible to the adverse effects of changes in circumstances and economic conditions than obligations in higher-rated categories. In the opinion of S&P, however, the obligor’s capacity to meet its financial commitment on the obligation is still strong. An obligation rated ‘BBB’ by S&P is deemed by S&P to exhibit adequate protection parameters. It is the opinion of S&P, however, that adverse economic conditions or changing circumstances are more likely to lead to a weakened capacity of the obligor to meet its financial commitment on the obligation. When applied to Fund holdings, ratings are based solely on the creditworthiness of the bonds in the portfolio and are not meant to represent the security or safety of the Fund. |
| 8. | An obligation rated ‘AA’ by S&P is deemed by S&P to differ from the highest-rated obligations only to a small degree. In the opinion of S&P, the obligor’s capacity to meet its financial commitment on the obligation is very strong. When applied to Fund holdings, ratings are based solely on the creditworthiness of the bonds in the portfolio and are not meant to represent the security or safety of the Fund. |
The opinions expressed are those of the portfolio managers as of the date of this report and are subject to change. There is no guarantee that any forecast made will come to pass. This material does not constitute investment advice and is not intended as an endorsement of any specific investment.
| | |
| 8 | | MainStay DefinedTerm Municipal Opportunities Fund |
Portfolio of Investments May 31, 2014
| | | | | | | | |
| | | Principal
Amount | | | Value | |
| Municipal Bonds 151.2% † | |
Alabama 0.9% (0.6% of Managed Assets) | |
Birmingham Jefferson Civic Center Authority, Special Tax | | | | | | | | |
Series A, Insured: AMBAC
4.125%, due 7/1/14 | | $ | 250,000 | | | $ | 250,190 | |
Jefferson County, Limited Obligation School, Revenue Bonds | | | | | | | | |
Series A, Insured: AMBAC
4.75%, due 1/1/25 | | | 250,000 | | | | 243,317 | |
Jefferson County, Public Building Authority, Revenue Bonds | | | | | | | | |
Insured: AMBAC
5.00%, due 4/1/26 | | | 4,500,000 | | | | 3,989,115 | |
| | | | | | | | |
| | | | | | | 4,482,622 | |
| | | | | | | | |
Alaska 0.8% (0.5% of Managed Assets) | |
Northern Tobacco Securitization Corp., Tobacco Settlement, Asset-Backed, Revenue Bonds | | | | | | | | |
Series A
5.00%, due 6/1/46 | | | 5,295,000 | | | | 4,003,285 | |
| | | | | | | | |
|
Arizona 2.0% (1.3% of Managed Assets) | |
Arizona Department of Transportation State Highway Fund, Revenue Bonds | | | | | | | | |
Series A
5.00%, due 7/1/38 | | | 5,750,000 | | | | 6,419,185 | |
Phoenix Industrial Development Authority, Downtown Phoenix Student LLC, Revenue Bonds | | | | | | | | |
Series A, Insured: AMBAC
4.50%, due 7/1/32 | | | 1,000,000 | | | | 907,620 | |
Series A, Insured: AMBAC
4.50%, due 7/1/42 | | | 150,000 | | | | 126,590 | |
Phoenix Industrial Development Authority, Espiritu Community Development Corp., Revenue Bonds | | | | | | | | |
Series A
6.25%, due 7/1/36 | | | 2,000,000 | | | | 2,006,520 | |
Pima County Industrial Development Authority, PLC Charter Schools Project, Revenue Bonds
6.75%, due 4/1/36 | | | 1,075,000 | | | | 1,082,213 | |
| | | | | | | | |
| | | | | | | 10,542,128 | |
| | | | | | | | |
| | | | | | | | |
| | | Principal
Amount | | | Value | |
California 30.0% (19.3% of Managed Assets) | |
California County Tobacco Securitization Agency, Asset Backed, Revenue Bonds | | | | | | | | |
Series A
5.125%, due 6/1/38 | | $ | 3,860,000 | | | $ | 3,194,961 | |
5.60%, due 6/1/36 | | | 2,575,000 | | | | 2,240,765 | |
California Municipal Finance Authority, Southwestern Law School, Revenue Bonds
6.50%, due 11/1/41 | | | 2,165,000 | | | | 2,577,541 | |
California Statewide Communities Development Authority, Sutter Health, Revenue Bonds | | | | | | | | |
Series A
5.00%, due 11/15/42 | | | 1,900,000 | | | | 1,999,313 | |
Carson Redevelopment Agency, Redevelopment Project Area 1, Tax Allocation | | | | | | | | |
Series B, Insured: NATL-RE
(zero coupon), due 10/1/25 | | | 75,000 | | | | 44,135 | |
Ceres Unified School District, Cabs-Election, Unlimited General Obligation | | | | | | | | |
Series A
(zero coupon), due 8/1/43 | | | 6,375,000 | | | | 924,757 | |
¨City of Sacramento, California, Water, Revenue Bonds
5.00%, due 9/1/42 (a)(b) | | | 19,500,000 | | | | 21,622,965 | |
Fontana Unified School District, Cabs Unlimited General Obligation | | | | | | | | |
Series C
(zero coupon), due 8/1/34 | | | 14,000,000 | | | | 4,986,940 | |
Series C
(zero coupon), due 8/1/40 | | | 10,000,000 | | | | 2,392,500 | |
Series C
(zero coupon), due 8/1/41 | | | 19,700,000 | | | | 4,430,924 | |
Series C
(zero coupon), due 8/1/42 | | | 18,600,000 | | | | 3,935,202 | |
Foothill-Eastern Transportation Corridor Agency, Revenue Bonds | | | | | | | | |
Series A
6.00%, due 1/15/49 | | | 5,000,000 | | | | 5,727,600 | |
¨Golden State Tobacco Securitization Corp., Asset Backed, Revenue Bonds | | | | | | | | |
Series A-1
4.50%, due 6/1/27 | | | 2,500,000 | | | | 2,282,975 | |
Series A, Insured: AGC, FGIC
5.00%, due 6/1/35 (a)(b) | | | 16,110,000 | | | | 16,699,465 | |
Series A-2
5.30%, due 6/1/37 (c) | | | 5,000,000 | | | | 4,118,900 | |
| † | Percentages indicated are based on Fund net assets applicable to Common Shares, unless otherwise noted. |
| ¨ | | Among the Fund’s 10 largest holdings or issuers held, as of May 31, 2014. May be subject to change daily. |
| | | | | | |
The notes to the financial statements are an integral part of,
and should be read in conjunction with, the financial statements. | | | | | 9 | |
Portfolio of Investments May 31, 2014 (continued)
| | | | | | | | |
| | | Principal
Amount | | | Value | |
| Municipal Bonds (continued) | |
California 30.0% (19.3% of Managed Assets) (continued) | |
Inglewood Public Financing Authority, Cabs-Lease, Revenue Bonds | | | | | | | | |
(zero coupon), due 8/1/30 | | $ | 2,530,000 | | | $ | 835,153 | |
(zero coupon), due 8/1/31 | | | 2,530,000 | | | | 767,577 | |
Lancaster Financing Authority, Subordinated Project No. 5 & 6, Redevelopment Projects, Tax Allocation | | | | | | | | |
Series B, Insured: NATL-RE
4.625%, due 2/1/24 | | | 215,000 | | | | 215,155 | |
Marysville Joint Unified School District, Capital Project, Certificates of Participation | | | | | | | | |
Insured: AGM
(zero coupon), due 6/1/25 | | | 1,850,000 | | | | 1,076,015 | |
Insured: AGM
(zero coupon), due 6/1/27 | | | 2,445,000 | | | | 1,248,588 | |
Insured: AGM
(zero coupon), due 6/1/33 | | | 2,800,000 | | | | 943,740 | |
Insured: AGM
(zero coupon), due 6/1/34 | | | 2,820,000 | | | | 892,051 | |
Insured: AGM
(zero coupon), due 6/1/38 | | | 2,820,000 | | | | 678,154 | |
Insured: AGM
(zero coupon), due 6/1/39 | | | 2,820,000 | | | | 635,995 | |
Insured: AGM
(zero coupon), due 6/1/40 | | | 2,820,000 | | | | 596,825 | |
Merced Union High School District, Cabs-Election, Unlimited General Obligation | | | | | | | | |
Series C
(zero coupon), due 8/1/41 | | | 16,780,000 | | | | 3,156,654 | |
Oceanside, California Unified School District, Unlimited General Obligation | | | | | | | | |
Series C
(zero coupon), due 8/1/50 | | | 20,190,000 | | | | 2,281,268 | |
¨Riverside County Transportation Commission, Limited Tax, Revenue Bonds | | | | | | | | |
Series A
5.25%, due 6/1/39 (a)(b) | | | 19,100,000 | | | | 21,988,476 | |
San Bernardino City Unified School District, Unlimited General Obligation | | | | | | | | |
Series C, Insured: NATL-RE
(zero coupon), due 8/1/31 | | | 5,000,000 | | | | 2,191,800 | |
San Joaquin Hills Transportation Corridor Agency, Revenue Bonds | | | | | | | | |
Series A, Insured: NATL-RE
(zero coupon), due 1/15/31 | | | 150,000 | | | | 59,547 | |
Series A, Insured: NATL-RE
5.25%, due 1/15/30 | | | 900,000 | | | | 900,153 | |
| | | | | | | | |
| | | Principal
Amount | | | Value | |
California 30.0% (19.3% of Managed Assets) (continued) | |
Stockton Public Financing Authority, Parking & Capital Projects, Revenue Bonds | | | | | | | | |
Insured: NATL-RE
4.25%, due 9/1/14 | | $ | 50,000 | | | $ | 49,918 | |
Insured: NATL-RE
4.50%, due 9/1/17 | | | 100,000 | | | | 97,937 | |
Insured: NATL-RE
4.80%, due 9/1/20 | | | 105,000 | | | | 101,200 | |
Stockton Public Financing Authority, Redevelopment Projects, Revenue Bonds | | | | | | | | |
Series A, Insured: RADIAN
5.25%, due 9/1/31 | | | 630,000 | | | | 532,199 | |
Series A, Insured: RADIAN
5.25%, due 9/1/34 | | | 2,925,000 | | | | 2,418,887 | |
Stockton Public Financing Authority, Water System, Capital Improvement Projects, Revenue Bonds | | | | | | | | |
Series A, Insured: NATL-RE
5.00%, due 10/1/31 | | | 175,000 | | | | 176,598 | |
Stockton, California Unified School District, Unlimited General Obligation | | | | | | | | |
Series D, Insured: AGM
(zero coupon), due 8/1/35 | | | 4,165,000 | | | | 1,397,399 | |
Series D, Insured: AGM
(zero coupon), due 8/1/40 | | | 13,930,000 | | | | 3,525,544 | |
Tobacco Securitization Authority of Southern California, Asset-Backed, Revenue Bonds | | | | | | | | |
Series A-1
5.00%, due 6/1/37 | | | 3,000,000 | | | | 2,479,050 | |
¨University of California, Regents Medical Center, Revenue Bonds | | | | | | | | |
Series J
5.00%, due 5/15/43 (a)(b) | | | 23,260,000 | | | | 25,426,824 | |
Westminster School District, Cabs-Election 2008, Unlimited General Obligation | | | | | | | | |
Series B, Insured: BAM
(zero coupon), due 8/1/48 | | | 27,045,000 | | | | 3,140,195 | |
| | | | | | | | |
| | | | | | | 154,991,845 | |
| | | | | | | | |
Colorado 1.1% (0.7% of Managed Assets) | |
Colorado Health Facilities Authority, Revenue Bonds
5.625%, due 6/1/43 | | | 5,000,000 | | | | 5,525,600 | |
E-470 Public Highway Authority, Revenue Bonds | | | | | | | | |
Series B, Insured: NATL-RE
(zero coupon), due 9/1/29 | | | 660,000 | | | | 296,380 | |
| | | | | | | | |
| | | | | | | 5,821,980 | |
| | | | | | | | |
| | | | |
| 10 | | MainStay DefinedTerm Municipal Opportunities Fund | | The notes to the financial statements are an integral part of,
and should be read in conjunction with, the financial statements. |
| | | | | | | | |
| | | Principal
Amount | | | Value | |
| Municipal Bonds (continued) | |
District of Columbia 0.8% (0.5% of Managed Assets) | |
Metropolitan Washington Airports Authority, Revenue Bonds | | | | | | | | |
Series C, Insured: GTY
0.00%, due 10/1/41 (c) | | $ | 3,900,000 | | | $ | 4,224,870 | |
| | | | | | | | |
|
Florida 6.8% (4.4% of Managed Assets) | |
City of Orlando, Tourist Development Tax Revenue, 3rd Lien, 6th Cent Contract, Revenue Bonds | | | | | | | | |
Insured: GTY
5.50%, due 11/1/38 | | | 20,000,000 | | | | 20,706,600 | |
JEA Electric System, Revenue Bonds | | | | | | | | |
Series C
5.00%, due 10/1/37 (a)(b) | | | 12,980,000 | | | | 14,381,542 | |
| | | | | | | | |
| | | | | | | 35,088,142 | |
| | | | | | | | |
Georgia 0.1% (0.1% of Managed Assets) | |
Marietta Development Authority, University Facilities-Life University, Inc. Project, Revenue Bonds
6.25%, due 6/15/20 | | | 440,000 | | | | 452,496 | |
| | | | | | | | |
|
Guam 4.9% (3.2% of Managed Assets) | |
Guam Economic Development & Commerce Authority, Tobacco Settlement Asset Backed, Revenue Bonds
5.625%, due 6/1/47 | | | 350,000 | | | | 278,163 | |
Guam Government, Waterworks Authority, Revenue Bonds
5.50%, due 7/1/43 | | | 10,025,000 | | | | 10,739,181 | |
Guam International Airport Authority, Revenue Bonds | | | | | | | | |
Series C
5.00%, due 10/1/21 (d) | | | 5,500,000 | | | | 6,188,435 | |
Series C, Insured: AGM
6.00%, due 10/1/34 (d) | | | 3,425,000 | | | | 3,874,942 | |
Territory of Guam, Unlimited General Obligation | | | | | | | | |
Series A
7.00%, due 11/15/39 | | | 4,000,000 | | | | 4,358,040 | |
| | | | | | | | |
| | | | | | | 25,438,761 | |
| | | | | | | | |
Illinois 19.1% (12.3% of Managed Assets) | |
¨Chicago Board of Education, Unlimited General Obligation | | | | | | | | |
Series A
5.50%, due 12/1/39 | | | 5,000,000 | | | | 5,284,450 | |
Series A, Insured: AGM
5.50%, due 12/1/39 (a)(b) | | | 20,000,000 | | | | 21,531,800 | |
| | | | | | | | |
| | | Principal
Amount | | | Value | |
Illinois 19.1% (12.3% of Managed Assets) (continued) | |
Chicago, Illinois O’ Hare International Airport, Revenue Bonds | | | | | | | | |
Series A, Insured: AGM
5.00%, due 1/1/38 | | $ | 3,000,000 | | | $ | 3,104,760 | |
Insured: AGM
5.75%, due 1/1/38 | | | 5,000,000 | | | | 5,632,300 | |
Chicago, Unlimited General Obligation | | | | | | | | |
Series C
5.00%, due 1/1/40 (a)(b) | | | 19,570,000 | | | | 19,837,130 | |
¨Metropolitan Pier & Exposition Authority, McCormick Place Expansion, Revenue Bonds | | | | | | | | |
Series A
5.50%, due 6/15/50 (a)(b) | | | 20,000,000 | | | | 21,490,148 | |
¨State of Illinois, Unlimited General Obligation
5.25%, due 7/1/31 (a)(b) | | | 20,000,000 | | | | 21,784,758 | |
| | | | | | | | |
| | | | | | | 98,665,346 | |
| | | | | | | | |
Indiana 0.2% (0.1% of Managed Assets) | |
Anderson Economic Development Revenue, Anderson University Project, Revenue Bonds
5.00%, due 10/1/32 | | | 1,105,000 | | | | 1,058,844 | |
| | | | | | | | |
|
Iowa 1.1% (0.7% of Managed Assets) | |
Coralville Urban Renewal Revenue, Tax Increment, Tax Allocation | | | | | | | | |
Series C
5.00%, due 6/1/47 | | | 4,220,000 | | | | 3,388,069 | |
Iowa Higher Education Loan Authority, Private College Facility, Wartburg College, Revenue Bonds | | | | | | | | |
Series B
5.50%, due 10/1/31 | | | 2,075,000 | | | | 2,047,465 | |
| | | | | | | | |
| | | | | | | 5,435,534 | |
| | | | | | | | |
Kansas 4.2% (2.7% of Managed Assets) | |
Kansas Development Finance Authority, Adventist Health Sunbelt Obligated Group, Revenue Bonds | | | | | | | | |
Series A
5.00%, due 11/15/32 (a)(b) | | | 19,290,000 | | | | 21,477,458 | |
| | | | | | | | |
|
Louisiana 2.2% (1.4% of Managed Assets) | |
Louisiana Public Facilities Authority, Archdiocese of New Orleans Project, Revenue Bonds | | | | | | | | |
Insured: CIFG
4.50%, due 7/1/37 | | | 6,685,000 | | | | 6,330,762 | |
| | | | | | |
The notes to the financial statements are an integral part of,
and should be read in conjunction with, the financial statements. | | | | | 11 | |
Portfolio of Investments May 31, 2014 (continued)
| | | | | | | | |
| | | Principal
Amount | | | Value | |
| Municipal Bonds (continued) | |
Louisiana 2.2% (1.4% of Managed Assets) (continued) | |
Louisiana Public Facilities Authority, Black & Gold Facilities Project, Revenue Bonds | | | | | | | | |
Series A, Insured: CIFG
4.50%, due 7/1/38 | | $ | 405,000 | | | $ | 323,303 | |
Series A, Insured: CIFG
5.00%, due 7/1/22 | | | 1,105,000 | | | | 1,089,077 | |
Series A, Insured: CIFG
5.00%, due 7/1/24 | | | 1,200,000 | | | | 1,157,568 | |
Series A, Insured: CIFG
5.00%, due 7/1/30 | | | 2,870,000 | | | | 2,603,865 | |
| | | | | | | | |
| | | | | | | 11,504,575 | |
| | | | | | | | |
Maryland 4.5% (2.9% of Managed Assets) | |
¨Maryland Health & Higher Educational Facilities Authority, Johns Hopkins Health System Obligated Group, Revenue Bonds | | | | | | | | |
Series C
5.00%, due 5/15/43 (a)(b) | | | 20,870,000 | | | | 23,098,521 | |
| | | | | | | | |
|
Massachusetts 0.1% (0.1% of Managed Assets) | |
Massachusetts Development Finance Agency, Seven Hills Foundation & Affiliates, Revenue Bonds | | | | | | | | |
Insured: RADIAN
5.00%, due 9/1/35 | | | 435,000 | | | | 436,040 | |
| | | | | | | | |
|
Michigan 10.1% (6.5% of Managed Assets) | |
Detroit, Michigan Water and Sewerage Department, Senior Lien, Revenue Bonds | | | | | | | | |
Series A
5.00%, due 7/1/32 | | | 1,500,000 | | | | 1,486,725 | |
Series A
5.25%, due 7/1/39 | | | 10,730,000 | | | | 10,692,445 | |
Series C-1, Insured: AGM
7.00%, due 7/1/27 | | | 3,450,000 | | | | 3,763,571 | |
Detroit, Michigan Water Supply System, Revenue Bonds | | | | | | | | |
Series A, Insured: NATL-RE
4.50%, due 7/1/31 | | | 760,000 | | | | 724,637 | |
Series B, Insured: NATL-RE
5.00%, due 7/1/34 | | | 3,840,000 | | | | 3,839,731 | |
Series C
5.00%, due 7/1/41 | | | 1,005,000 | | | | 981,342 | |
Series A
5.25%, due 7/1/41 | | | 2,385,000 | | | | 2,372,932 | |
Series A
5.75%, due 7/1/37 | | | 5,000,000 | | | | 4,990,200 | |
| | | | | | | | |
| | | Principal
Amount | | | Value | |
Michigan 10.1% (6.5% of Managed Assets) (continued) | |
Michigan Finance Authority, Limited Obligation, Public School Academy, University Learning, Revenue Bonds
7.375%, due 11/1/30 | | $ | 2,920,000 | | | $ | 3,180,873 | |
Michigan Finance Authority, Public School Academy, Revenue Bonds
7.50%, due 11/1/40 | | | 2,745,000 | | | | 2,991,117 | |
Michigan Public Educational Facilities Authority, Dr. Joseph F. Pollack, Revenue Bonds | | | | | | | | |
8.00%, due 4/1/30 | | | 1,195,000 | | | | 1,294,137 | |
8.00%, due 4/1/40 | | | 500,000 | | | | 539,960 | |
Michigan Tobacco Settlement Finance Authority, Revenue Bonds | | | | | | | | |
Series A
6.00%, due 6/1/34 | | | 5,000,000 | | | | 4,224,750 | |
Series A
6.00%, due 6/1/48 | | | 13,435,000 | | | | 11,136,406 | |
| | | | | | | | |
| | | | | | | 52,218,826 | |
| | | | | | | | |
Missouri 0.6% (0.4% of Managed Assets) | |
St. Louis County Industrial Development Authority, Nazareth Living Center, Revenue Bonds | | | | | | | | |
5.875%, due 8/15/32 | | | 750,000 | | | | 758,070 | |
6.125%, due 8/15/42 | | | 2,120,000 | | | | 2,177,494 | |
| | | | | | | | |
| | | | | | | 2,935,564 | |
| | | | | | | | |
Nebraska 4.1% (2.7% of Managed Assets) | |
Central Plains Energy, Project No. 3, Revenue Bonds
5.25%, due 9/1/37 (a)(b) | | | 20,000,000 | | | | 21,335,600 | |
| | | | | | | | |
|
Nevada 2.5% (1.6% of Managed Assets) | |
City of Sparks, Tourism Improvement District No. 1, Senior Sales Tax Anticipation, Revenue Bonds | | | | | | | | |
Series A
6.75%, due 6/15/28 (a) | | | 12,500,000 | | | | 13,057,750 | |
| | | | | | | | |
|
New Hampshire 0.4% (0.3% of Managed Assets) | |
Manchester Housing & Redevelopment Authority Inc., Revenue Bonds | | | | | | | | |
Series B, Insured: ACA
(zero coupon), due 1/1/24 | | | 4,740,000 | | | | 2,238,797 | |
| | | | | | | | |
|
New Jersey 5.2% (3.4% of Managed Assets) | |
New Jersey Economic Development Authority, Continental Airlines, Inc. Project, Revenue Bonds | | | | | | | | |
5.25%, due 9/15/29 (d) | | | 9,120,000 | | | | 9,447,773 | |
| | | | |
| 12 | | MainStay DefinedTerm Municipal Opportunities Fund | | The notes to the financial statements are an integral part of,
and should be read in conjunction with, the financial statements. |
| | | | | | | | |
| | | Principal
Amount | | | Value | |
| Municipal Bonds (continued) | |
New Jersey 5.2% (3.4% of Managed Assets) (continued) | |
New Jersey Economic Development Authority, Continental Airlines, Inc. Project, Revenue Bonds (continued) | | | | | | | | |
Series B
5.625%, due 11/15/30 (d) | | $ | 2,500,000 | | | $ | 2,671,600 | |
New Jersey Economic Development Authority, UMM Energy Partners, Revenue Bonds | | | | | | | | |
Series A
5.00%, due 6/15/37 (d) | | | 1,000,000 | | | | 1,018,330 | |
New Jersey Health Care Facilities Financing Authority, Hospital Asset Transformation Program, Revenue Bonds | | | | | | | | |
Series A
5.75%, due 10/1/31 | | | 2,480,000 | | | | 2,880,545 | |
New Jersey Tobacco Settlement Financing Corp., Revenue Bonds | | | | | | | | |
Series 1A
5.00%, due 6/1/41 | | | 14,000,000 | | | | 11,061,540 | |
| | | | | | | | |
| | | | | | | 27,079,788 | |
| | | | | | | | |
New York 1.8% (1.2% of Managed Assets) | |
Onondaga Civic Development Corp., St. Joseph’s Hospital Health Center, Revenue Bonds
5.00%, due 7/1/42 | | | 2,000,000 | | | | 1,958,540 | |
Riverhead Industrial Development Agency, Revenue Bonds | | | | | | | | |
7.00%, due 8/1/43 | | | 5,595,000 | | | | 6,339,023 | |
7.00%, due 8/1/48 | | | 1,000,000 | | | | 1,122,650 | |
| | | | | | | | |
| | | | | | | 9,420,213 | |
| | | | | | | | |
Ohio 5.3% (3.4% of Managed Assets) | |
Buckeye Tobacco Settlement Financing Authority, Asset-Backed, Senior Turbo, Revenue Bonds | | | | | | | | |
Series A-2
5.75%, due 6/1/34 | | | 2,425,000 | | | | 2,008,482 | |
Series A-2
5.875%, due 6/1/30 | | | 10,600,000 | | | | 8,923,292 | |
Series A-2
6.00%, due 6/1/42 | | | 5,915,000 | | | | 4,948,252 | |
Southeastern Ohio Port Authority, Hospital Facilities Revenue, Memorial Health Systems, Revenue Bonds | | | | | | | | |
5.75%, due 12/1/32 | | | 6,700,000 | | | | 6,737,989 | |
6.00%, due 12/1/42 | | | 4,900,000 | | | | 4,948,657 | |
| | | | | | | | |
| | | | | | | 27,566,672 | |
| | | | | | | | |
| | | | | | | | |
| | | Principal
Amount | | | Value | |
Pennsylvania 8.5% (5.5% of Managed Assets) | |
Bristol Township School District, Limited General Obligation
5.25%, due 6/1/43 | | $ | 2,000,000 | | | $ | 2,223,400 | |
Harrisburg, Capital Appreciation, Unlimited General Obligation | | | | | | | | |
Series F, Insured: AMBAC
(zero coupon), due 9/15/21 | | | 95,000 | | | | 56,005 | |
Pennsylvania Economic Development Financing Authority, Capitol Region Parking System, Revenue Bonds
6.00%, due 7/1/53 (a)(b) | | | 14,260,000 | | | | 16,603,740 | |
Pennsylvania Turnpike Commission, Revenue Bonds | | | | | | | | |
Series C
5.00%, due 12/1/43 | | | 12,570,000 | | | | 13,758,494 | |
Philadelphia Authority for Industrial Development, Nueva Esperanza Inc., Revenue Bonds
8.20%, due 12/1/43 | | | 2,000,000 | | | | 2,109,780 | |
Philadelphia Authority for Industrial Development, Please Touch Museum Project, Revenue Bonds
5.25%, due 9/1/31 | | | 2,500,000 | | | | 874,975 | |
Philadelphia Water and Wastewater Revenue, Revenue Bonds | | | | | | | | |
Series A
5.00%, due 1/1/36 | | | 2,830,000 | | | | 3,061,239 | |
Philadelphia, Unlimited General Obligation
6.00%, due 8/1/36 | | | 4,625,000 | | | | 5,284,756 | |
| | | | | | | | |
| | | | | | | 43,972,389 | |
| | | | | | | | |
Puerto Rico 4.7% (3.0% of Managed Assets) | |
Puerto Rico Commonwealth, Public Improvement, Unlimited General Obligation | | | | | | | | |
Series A-4, Insured: AGM
5.25%, due 7/1/30 | | | 7,000,000 | | | | 7,026,740 | |
Series A, Insured: NATL-RE
5.50%, due 7/1/20 | | | 575,000 | | | | 626,641 | |
Puerto Rico Highways & Transportation Authority, Revenue Bonds | | | | | | | | |
Series K, Insured: CIFG
5.00%, due 7/1/18 | | | 530,000 | | | | 538,633 | |
Series N, Insured: NATL-RE
5.25%, due 7/1/32 | | | 5,000,000 | | | | 4,913,850 | |
Series N, Insured: AGM, GTY
5.50%, due 7/1/29 | | | 6,000,000 | | | | 6,211,740 | |
Series C, Insured: AGM
5.50%, due 7/1/30 | | | 4,705,000 | | | | 4,790,443 | |
| | | | | | | | |
| | | | | | | 24,108,047 | |
| | | | | | | | |
| | | | | | |
The notes to the financial statements are an integral part of,
and should be read in conjunction with, the financial statements. | | | | | 13 | |
Portfolio of Investments May 31, 2014 (continued)
| | | | | | | | |
| | | Principal
Amount | | | Value | |
| Municipal Bonds (continued) | |
Rhode Island 3.2% (2.1% of Managed Assets) | |
Narragansett Bay Commission Wastewater System, Revenue Bonds | | | | | | | | |
Series A
5.00%, due 9/1/38 (a)(b) | | $ | 15,000,000 | | | $ | 16,515,150 | |
| | | | | | | | |
|
Tennessee 3.2% (2.0% of Managed Assets) | |
Chattanooga, TN, Industrial Development Board, Lease Rental, Revenue Bonds | | | | | | | | |
Insured: AGM
5.00%, due 10/1/30 (a)(b) | | | 15,000,000 | | | | 16,368,750 | |
| | | | | | | | |
|
Texas 9.8% (6.3% of Managed Assets) | |
Harris County-Houston Sports Authority, Revenue Bonds | | | | | | | | |
Series H, Insured: NATL-RE
(zero coupon), due 11/15/28 | | | 50,000 | | | | 23,669 | |
Series H, Insured: NATL-RE
(zero coupon), due 11/15/30 | | | 8,775,000 | | | | 3,763,685 | |
Series H, Insured: NATL-RE
(zero coupon), due 11/15/33 | | | 1,320,000 | | | | 449,645 | |
Series A, Insured: NATL-RE
(zero coupon), due 11/15/34 | | | 2,520,000 | | | | 833,868 | |
Series H, Insured: NATL-RE
(zero coupon), due 11/15/35 | | | 2,080,000 | | | | 586,186 | |
Series H, Insured: NATL-RE
(zero coupon), due 11/15/37 | | | 6,705,000 | | | | 1,695,627 | |
Series A, Insured: NATL-RE
(zero coupon), due 11/15/38 | | | 175,000 | | | | 44,179 | |
Series H, Insured: NATL-RE
(zero coupon), due 11/15/38 | | | 260,000 | | | | 61,256 | |
Series A, Insured: NATL-RE
(zero coupon), due 11/15/40 | | | 1,000,000 | | | | 214,630 | |
Series B, Insured: NATL-RE
5.25%, due 11/15/40 | | | 755,000 | | | | 755,325 | |
New Hope Cultural Education Facilities Corp., Student Housing, CHF-Stephenville Tarleton State University Project, Revenue Bonds | | | | | | | | |
Series A
5.375%, due 4/1/28 | | | 1,845,000 | | | | 1,950,958 | |
Newark Cultural Education Facilities Finance Corp., A. W. Brown-Fellowship Leadership Academy, Revenue Bonds | | | | | | | | |
Series A
6.00%, due 8/15/42 | | | 5,640,000 | | | | 5,854,940 | |
¨Texas Municipal Gas Acquisition & Supply Corp. III, Revenue Bonds | | | | | | | | |
5.00%, due 12/15/29 | | | 880,000 | | | | 942,471 | |
| | | | | | | | |
| | | Principal
Amount | | | Value | |
Texas 9.8% (6.3% of Managed Assets) (continued) | |
Texas Municipal Gas Acquisition & Supply Corp. III, Revenue Bonds (continued) | | | | | | | | |
5.00%, due 12/15/30 | | $ | 5,500,000 | | | $ | 5,857,665 | |
5.00%, due 12/15/32 (a)(b) | | | 20,000,000 | | | | 20,860,763 | |
Texas State Turnpike Authority, Central Texas System, Revenue Bonds | | | | | | | | |
Insured: AMBAC
(zero coupon), due 8/15/35 | | | 23,750,000 | | | | 6,664,488 | |
| | | | | | | | |
| | | | | | | 50,559,355 | |
| | | | | | | | |
U.S. Virgin Islands 1.5% (1.0% of Managed Assets) | |
Virgin Islands Public Finance Authority, Gross Receipts Taxes Loan, Revenue Bonds | | | | | | | | |
Insured: AGM
5.00%, due 10/1/32 | | | 2,475,000 | | | | 2,717,822 | |
Virgin Islands Public Finance Authority, Revenue Bonds | | | | | | | | |
Series A, Insured: AGM
5.00%, due 10/1/32 | | | 4,650,000 | | | | 5,106,212 | |
| | | | | | | | |
| | | | | | | 7,824,034 | |
| | | | | | | | |
Vermont 0.3% (0.2% of Managed Assets) | |
Vermont State Student Assistance Corp., Revenue Bonds | | | | | | | | |
Series A
5.10%, due 6/15/32 (d) | | | 1,545,000 | | | | 1,580,257 | |
| | | | | | | | |
|
Virginia 7.0% (4.6% of Managed Assets) | |
Tobacco Settlement Financing Corp., Revenue Bonds | | | | | | | | |
Series B1
5.00%, due 6/1/47 | | | 10,760,000 | | | | 7,698,134 | |
¨Virginia Commonwealth Transportation Board, Capital Projects, Revenue Bonds
5.00%, due 5/15/31 (a)(b) | | | 20,315,000 | | | | 23,195,432 | |
Virginia Small Business Financing Authority, Senior Lien, Elizabeth River Crossing, Revenue Bonds
6.00%, due 1/1/37 (d) | | | 5,000,000 | | | | 5,539,150 | |
| | | | | | | | |
| | | | | | | 36,432,716 | |
| | | | | | | | |
Washington 4.0% (2.6% of Managed Assets) | |
Washington Health Care Facilities Authority, Multicare Health System, Revenue Bonds | | | | | | | | |
Series A
5.00%, due 8/15/44 (a)(b) | | | 19,665,000 | | | | 20,936,146 | |
| | | | | | | | |
| | | | |
| 14 | | MainStay DefinedTerm Municipal Opportunities Fund | | The notes to the financial statements are an integral part of,
and should be read in conjunction with, the financial statements. |
| | | | | | | | |
| | | Principal
Amount | | | Value | |
| Municipal Bonds (continued) | |
West Virginia 0.2% (0.1% of Managed Assets) | |
Ohio County, Wheeling Jesuit, Revenue Bonds | | | | | | | | |
Series A
5.50%, due 6/1/36 | | $ | 845,000 | | | $ | 835,435 | |
| | | | | | | | |
Total Investments
(Cost $743,632,197) (h) | | | 151.2 | % | | | 781,707,936 | |
Floating Rate Note Obligations (e) | | | (41.3 | ) | | | (213,380,000 | ) |
Fixed Rate Municipal Term Preferred Shares, at Liquidation Value | | | (13.5 | ) | | | (70,000,000 | ) |
Other Assets, Less Liabilities | | | 3.6 | | | | 18,632,055 | |
Net Assets Applicable to Common Shares | | | 100.0 | % | | $ | 516,959,991 | |
| | |
| | | | | | | | |
| | | | | | | | |
| | | Contracts
Short | | | Unrealized
Appreciation
(Depreciation) (f) | |
| Futures Contracts 0.0%‡ | | | | | | | | |
United States Treasury Note September 2014 (10 Year) (g) | | | (625 | ) | | $ | 48,512 | |
| | | | | | | | |
Total Futures Contracts Short
(Notional Amount $78,447,266) | | | | | | $ | 48,512 | |
| | | | | | | | |
| ‡ | Less than one-tenth of a percent. |
| (a) | May be sold to institutional investors only under Rule 144A or securities offered pursuant to Section 4(a)(2) of the Securities Act of 1933, as amended. |
| (b) | All or portion of principal amount transferred to a Tender Option Bond (“TOB”) Issuer in exchange for TOB Residuals and cash. |
| (c) | Step coupon – Rate shown was the rate in effect as of May 31, 2014. |
| (d) | Interest on these securities was subject to alternative minimum tax. |
| (e) | Face value of Floating Rate Notes received from TOB transactions. |
| (f) | Represents the difference between the value of the contracts at the time they were opened and the value as of May 31, 2014. |
| (g) | As of May 31, 2014, cash in the amount of $812,500 was on deposit with a broker for futures transactions. |
| (h) | As of May 31, 2014, cost was $532,952,394 for federal income tax purposes and net unrealized appreciation was as follows: |
| | | | |
Gross unrealized appreciation | | $ | 42,276,621 | |
Gross unrealized depreciation | | | (6,088,579 | ) |
| | | | |
Net unrealized appreciation | | $ | 36,188,042 | |
| | | | |
“Managed Assets” is defined as the Fund’s total assets, minus the sum of its accrued liabilities (other than Fund liabilities incurred for the purpose of creating effective leverage (i.e. tender option bonds) or Fund liabilities related to liquidation preference of any preferred shares issued).
The following abbreviations are used in the above portfolio:
ACA—ACA Financial Guaranty Corp.
AGC—Assured Guaranty Corp.
AGM—Assured Guaranty Municipal Corp.
AMBAC—Ambac Assurance Corp.
BAM—Build America Mutual Assurance Co.
CIFG—CIFG Group
FGIC—Financial Guaranty Insurance Co.
GTY—Assured Guaranty Corp.
NATL-RE—National Public Finance Guarantee Corp.
RADIAN—Radian Asset Assurance, Inc.
The following is a summary of the fair valuations according to the inputs used as of May 31, 2014, for valuing the Fund’s assets.
Asset Valuation Inputs
| | | | | | | | | | | | | | | | |
Description | | Quoted
Prices in
Active
Markets for
Identical
Assets (Level 1) | | | Significant
Other
Observable
Inputs (Level 2) | | | Significant
Unobservable
Inputs (Level 3) | | | Total | |
| Investments in Securities (a) | | | | | | | | | | | | | | | | |
| Municipal Bonds | | $ | — | | | $ | 781,707,936 | | | $ | — | | | $ | 781,707,936 | |
| | | | | | | | | | | | | | | | |
| Other Financial Instruments | | | | | | | | | | | | | | | | |
Futures Contracts Short (b) | | | 48,512 | | | | — | | | | — | | | | 48,512 | |
| | | | | | | | | | | | | | | | |
| Total Investments in Securities and Other Financial Instruments | | $ | 48,512 | | | $ | 781,707,936 | | | $ | — | | | $ | 781,756,448 | |
| | | | | | | | | | | | | | | | |
| (a) | For a complete listing of investments and their industries, see the Portfolio of Investments. |
| (b) | The value listed for these securities reflects unrealized appreciation (depreciation) as shown on the Portfolio of Investments. |
The Fund recognizes transfers between the levels as of the beginning of the period.
For the year ended May 31, 2014, the Fund did not have any transfers between Level 1 and Level 2 fair value measurements. (See Note 2)
As of May 31, 2014, the Fund did not hold any investments with significant unobservable inputs (Level 3). (See Note 2)
| | | | | | |
The notes to the financial statements are an integral part of,
and should be read in conjunction with, the financial statements. | | | | | 15 | |
Statement of Assets and Liabilities as of May 31, 2014
| | | | |
| Assets | |
Investment in securities, at value (identified cost $743,632,197) | | $ | 781,707,936 | |
Cash collateral on deposit at broker | | | 812,500 | |
Cash | | | 256,572 | |
Receivables: | | | | |
Interest | | | 12,660,484 | |
Investment securities sold | | | 6,299,275 | |
Variation margin on futures contracts | | | 47,168 | |
Deferred offering costs (See Note 2 (M)) | | | 225,868 | |
Other assets | | | 48,120 | |
| | | | |
Total assets | | | 802,057,923 | |
| | | | |
| |
| Liabilities | | | | |
Payable for Floating Rate Note Obligations | | | 213,380,000 | |
Fixed Rate Municipal Term Preferred Shares, at liquidation value, Series A (a) | | | 35,000,000 | |
Fixed Rate Municipal Term Preferred Shares, at liquidation value, Series B (a) | | | 35,000,000 | |
Payables: | | | | |
Manager (See Note 3) | | | 404,281 | |
Professional fees | | | 81,999 | |
Shareholder communication | | | 25,107 | |
Transfer agent | | | 3,061 | |
Custodian | | | 953 | |
Trustees | | | 503 | |
Accrued expenses | | | 1,810 | |
Interest expense and fees payable | | | 1,010,312 | |
Common share dividend payable | | | 189,906 | |
| | | | |
Total liabilities | | | 285,097,932 | |
| | | | |
Net assets applicable to Common shares | | $ | 516,959,991 | |
| | | | |
Common shares outstanding | | | 27,554,564 | |
| | | | |
Net asset value per Common share (Net assets applicable to Common shares divided by Common shares outstanding) | | $ | 18.76 | |
| | | | |
|
Net assets applicable to Common Shares
consist of | |
Common shares, $0.001 par value per share, unlimited number of shares authorized | | $ | 27,555 | |
Additional paid-in capital | | | 524,930,310 | |
| | | | |
| | | 524,957,865 | |
Undistributed net investment income | | | 2,708,187 | |
Accumulated net realized gain (loss) on investments and futures transactions | | | (48,830,312 | ) |
Net unrealized appreciation (depreciation) on investments and futures contracts | | | 38,124,251 | |
| | | | |
Net assets applicable to Common shares | | $ | 516,959,991 | |
| | | | |
| (a) | Unlimited authorized shares, $0.01 par value, liquidation preference of $100,000 per share (See Note 2 (J)). |
| | | | |
| 16 | | MainStay DefinedTerm Municipal Opportunities Fund | | The notes to the financial statements are an integral part of,
and should be read in conjunction with, the financial statements. |
Statement of Operations for the year ended May 31, 2014
| | | | |
| Investment Income (Loss) | |
Income | | | | |
Interest | | $ | 40,000,500 | |
| | | | |
Expenses | | | | |
Manager (See Note 3) | | | 4,511,721 | |
Interest expense and fees | | | 3,100,895 | |
Professional fees | | | 137,617 | |
Shareholder communication | | | 49,381 | |
Transfer agent | | | 37,701 | |
Trustees | | | 31,104 | |
Custodian | | | 11,878 | |
Miscellaneous | | | 134,964 | |
| | | | |
Total expenses | | | 8,015,261 | |
| | | | |
Net investment income (loss) | | | 31,985,239 | |
| | | | |
|
Realized and Unrealized Gain (Loss) on Investments
and Futures Contracts | |
Net realized gain (loss) on: | | | | |
Investment transactions | | | (44,126,423 | ) |
Futures transactions | | | (1,464,031 | ) |
| | | | |
Net realized gain (loss) on investments and futures transactions | | | (45,590,454 | ) |
| | | | |
Net change in unrealized appreciation (depreciation) on: | | | | |
Investments | | | 22,011,802 | |
Futures contracts | | | (910,551 | ) |
| | | | |
Net change in unrealized appreciation (depreciation) on investments and futures contracts | | | 21,101,251 | |
| | | | |
Net realized and unrealized gain (loss) on investments and futures transactions | | | (24,489,203 | ) |
| | | | |
Net increase (decrease) in net assets to Common shares resulting from operations | | $ | 7,496,036 | |
| | | | |
| | | | | | |
The notes to the financial statements are an integral part of,
and should be read in conjunction with, the financial statements. | | | | | 17 | |
Statement of Changes in Net Assets
| | | | | | | | |
| | | Year ended May 31, 2014 | | | June 26, 2012* through May 31, 2013 | |
Net Increase (Decrease) in Net Assets Applicable
to Common Shares | |
Operations: | | | | | | | | |
Net investment income (loss) | | $ | 31,985,239 | | | $ | 25,313,226 | |
Net realized gain (loss) on investments and futures transactions | | | (45,590,454 | ) | | | 12,431,388 | |
Net change in unrealized appreciation (depreciation) on investments and futures contracts | | | 21,101,251 | | | | 17,023,000 | |
| | | | |
Net increase (decrease) in net assets applicable to Common shares resulting from operations | | | 7,496,036 | | | | 54,767,614 | |
| | | | |
Dividends and distributions to Common shareholders: | | | | | | | | |
From net investment income | | | (31,720,814 | ) | | | (23,745,652 | ) |
From net realized gain on investments | | | (9,582,651 | ) | | | (5,481,764 | ) |
| | | | |
Total dividends and distributions to Common shareholders | | | (41,303,465 | ) | | | (29,227,416 | ) |
| | | | |
Capital share transactions (Common shares): | | | | | | | | |
Net proceeds issued to shareholders resulting from initial public offering | | | — | | | | 524,508,195 | |
Net proceeds issued to shareholders from reinvestment of dividends and distributions | | | — | | | | 619,027 | |
| | | | |
Increase (decrease) in net assets applicable to Common shares from capital share transactions | | | — | | | | 525,127,222 | |
| | | | |
Net increase (decrease) in net assets applicable to Common shares | | | (33,807,429 | ) | | | 550,667,420 | |
|
| Net Assets Applicable to Common Shares | |
Beginning of period | | | 550,767,420 | | | | 100,000 | |
| | | | |
End of period | | $ | 516,959,991 | | | $ | 550,767,420 | |
| | | | |
Undistributed net investment income at end of period | | $ | 2,708,187 | | | $ | 1,974,196 | |
| | | | |
| | | | |
| 18 | | MainStay DefinedTerm Municipal Opportunities Fund | | The notes to the financial statements are an integral part of,
and should be read in conjunction with, the financial statements. |
Statement of Cash Flows for the year ended May 31, 2014
| | | | |
| Cash flows used in operating activities: | |
Net increase in net assets resulting from operations | | $ | 7,496,036 | |
Adjustments to reconcile net increase in net assets resulting from operations to net cash provided by operating activities: | | | | |
Investments purchased | | | (999,892,881 | ) |
Investments sold | | | 993,835,406 | |
Amortization (accretion) of discount and premium, net | | | (3,216,962 | ) |
Increase in interest receivable | | | (1,481,094 | ) |
Decrease in cash collateral on deposit at broker | | | 12,500 | |
Decrease in variation margin on futures contracts | | | 128,613 | |
Increase in other assets | | | (3,863 | ) |
Increase in professional fees payable | | | 18,098 | |
Decrease in custodian payable | | | (652 | ) |
Decrease in shareholder communication payable | | | (9,176 | ) |
Increase in interest expense and fees payable | | | 120,114 | |
Decrease in due to Trustees | | | (122 | ) |
Decrease in due to manager | | | (15,088 | ) |
Decrease in due to transfer agent | | | (6,109 | ) |
Increase in accrued expenses | | | 1,810 | |
Net change in unrealized (appreciation) depreciation on investments | | | (22,011,802 | ) |
Net realized (gain) loss from investments | | | 44,126,423 | |
| | | | |
Net cash provided by operating activities | | | 19,101,251 | |
| | | | |
| |
| Cash flows from financing activities: | | | | |
Issuance of floating rate note obligations | | | 186,185,000 | |
Redemption of floating rate note obligations | | | (164,185,000 | ) |
Cash distributions paid | | | (41,227,755 | ) |
| | | | |
Net cash from financing activities | | | (19,227,755 | ) |
| | | | |
Net decrease in cash: | | | (126,504 | ) |
Cash at beginning of year | | | 383,076 | |
| | | | |
Cash at end of year | | $ | 256,572 | |
| | | | |
Cash payments recognized as interest expense on the Fund’s Fixed Rate Municipal Term Preferred Shares for the year ended May 31, 2014, was $1,257,203. Net increase in net assets result from operations for the year ended May 31, 2014, includes $1,696,959 of non-cash interest income and non-cash interest expense on floating rate note obligations related to the Fund’s tender option bonds.
| | | | | | |
The notes to the financial statements are an integral part of,
and should be read in conjunction with, the financial statements. | | | | | 19 | |
Financial Highlights selected per share data and ratios
| | | | | | | | |
| | | Year ended
May 31,
2014 | | | June 26, 2012* through May 31,
2013 | |
Net asset value at beginning of period applicable to Common shares | | $ | 19.99 | | | $ | 19.06 | (a) |
| | | | | | | | |
Net investment income (loss) | | | 1.16 | | | | 0.92 | |
Net realized and unrealized gain (loss) on investments | | | (0.89 | ) | | | 1.11 | |
| | | | | | | | |
Total from investment operations | | | 0.27 | | | | 2.03 | |
| | | | | | | | |
| Less dividends and distributions to Common shareholders: | | | | | | | | |
From net investment income | | | (1.15 | ) | | | (0.86 | ) |
From net realized gain on investments | | | (0.35 | ) | | | (0.20 | ) |
| | | | | | | | |
Total dividends and distributions to Common shareholders | | | (1.50 | ) | | | (1.06 | ) |
| | | | | | | | |
Dilution effect on net asset value from overallotment issuance | | | — | | | | (0.04 | ) |
| | | | | | | | |
Net asset value at end of period applicable to Common shares | | $ | 18.76 | | | $ | 19.99 | |
| | | | | | | | |
Market price at end of period applicable to Common shares | | $ | 17.93 | | | $ | 18.91 | |
| | | | | | | | |
Total investment return on net asset value | | | 2.36 | % | | | 10.52 | % (b) |
Total investment return on market price | | | 3.81 | % | | | (0.36 | %)(b) |
| Ratios (to average net assets of Common shareholders)/Supplemental Data: | | | | | | | | |
Net investment income (loss) | | | 6.67 | % | | | 5.01 | % †† |
Net expenses (excluding interest expense and fees) | | | 1.02 | % | | | 0.89 | % ††(c) |
Expenses (including interest expense and fees) | | | 1.67 | % | | | 1.32 | % ††(c) |
Interest expense and fees (d) | | | 0.65 | % | | | 0.43 | % †† |
Portfolio turnover rate | | | 83 | % | | | 64 | % |
Net assets applicable to Common shareholders end of period (in 000’s) | | $ | 516,960 | | | $ | 550,767 | |
Preferred shares outstanding at $100,000 liquidation preference, end of period (in 000’s) | | $ | 70,000 | | | $ | 70,000 | |
Assets coverage per Preferred share, end of period (e) | | $ | 838,514 | | | $ | 886,811 | |
Average market value per Preferred share: | | | | | | | | |
Series A | | $ | 100,006 | | | $ | 100,008 | |
Series B | | $ | 100,006 | | | $ | 100,007 | |
| (a) | Net asset value at beginning of period reflects the deduction of the sales load of $0.90 per share and offering costs of $0.04 per share from the $20.00 offering price. |
| (b) | Total investment return is not annualized. |
| (c) | The Manager has agreed to reimburse all organizational expenses. |
| (d) | Interest expense and fees relate to the costs of tender option bond transactions (See Note 2 (I)) and the issuance of fixed rate municipal term preferred shares (See Note 2 (J)). |
| (e) | Calculated by subtracting the Fund’s total liabilities (not including the Preferred shares) from the Fund’s total assets, and dividing the result by the number of Preferred shares outstanding. |
| | | | |
| 20 | | MainStay DefinedTerm Municipal Opportunities Fund | | The notes to the financial statements are an integral part of,
and should be read in conjunction with, the financial statements. |
Notes to Financial Statements
Note 1–Organization and Business
MainStay DefinedTerm Municipal Opportunities Fund (the “Fund”) was organized as a Delaware statutory trust on April 20, 2011, pursuant to an agreement and declaration of trust, which was amended and restated on May 16, 2012 (“Declaration of Trust’’). The Fund is registered under the Investment Company Act of 1940, as amended (the “1940 Act”), as a diversified, closed-end management investment company. The Fund first offered Common shares through an initial public offering on June 26, 2012.
Pursuant to the terms of the Declaration of Trust, the Fund will commence the process of liquidation and dissolution at the close of business on December 31, 2024 (the “Termination Date”) unless otherwise extended by a majority of the Board of Trustees (the “Board”) (as discussed in further detail below). During the six-month period preceding the Termination Date or Extended Termination Date (as defined below), the Board may, without shareholder approval unless such approval is required by the 1940 Act, determine to (i) merge or consolidate the Fund so long as the surviving or resulting entity is an open-end registered investment company that is managed by the same investment adviser which serves as the investment adviser to the Fund at that time or is an affiliate of such investment adviser; or (ii) convert the Fund from a closed-end fund into an open-end registered investment company. Upon liquidation and termination of the Fund, shareholders will receive an amount equal to the Fund’s net asset value (“NAV”) at that time, which may be greater or less than the price at which Common shares were issued. The Fund’s investment objectives and policies are not designed to return to investors who purchased Common shares in the initial offering of such shares their initial investment on the Termination Date and such initial investors may receive more or less than their original investment upon termination.
Prior to the commencement of the six-month period preceding the Termination Date, a majority of the Board may extend the Termination Date for a period of not more than two years or such shorter time as may be determined (the “Extended Termination Date”), upon a determination that taking such actions as described in (i) or (ii) above would not, given prevailing market conditions, be in the best interests of the Fund’s shareholders. The Termination Date may be extended an unlimited number of times by the Board prior to the first business day of the sixth month before the next occurring Extended Termination Date.
The Fund’s primary investment objective is to seek current income exempt from regular U.S. Federal income taxes (but which may be includable in taxable income for purpose of the Federal alternative minimum tax). Total return is a secondary objective.
Note 2–Significant Accounting Policies
The Fund prepares its financial statements in accordance with generally accepted accounting principles (“GAAP”) in the United States of America and follows the significant accounting policies described below.
(A) Securities Valuation. Investments are valued as of the close of regular trading on the New York Stock Exchange (“Exchange”) (generally 4:00 p.m. Eastern time) on each day the Fund is open for business (“valuation date”).
The Board adopted procedures for the valuation of the Fund’s securities and delegated the responsibility for valuation determinations under
those procedures to the Valuation Committee of the Fund (the “Valuation Committee”). The Board authorized the Valuation Committee to appoint a Valuation Sub-Committee (the “Sub-Committee”) to deal in the first instance with questions that arise or cannot be resolved under these procedures. The Sub-Committee meets (in person, via electronic mail or via teleconference) on an as-needed basis. The Valuation Committee meets at a later time, as necessary, to ensure that actions taken by the Sub-Committee were appropriate. The procedures recognize that, subject to the oversight of the Board and unless otherwise noted, the responsibility for day-to-day valuation of portfolio assets (including securities for which market prices are not readily available) rests with New York Life Investment Management LLC (“New York Life Investments” or the “Manager”), aided to whatever extent necessary by the Subadvisor (as defined in Note 3(A)) to the Fund.
To assess the appropriateness of security valuations, the Manager or the Fund’s third party service provider, who is subject to oversight by the Manager, regularly compares prior day prices, prices on comparable securities, and the sale prices to the prior and current day prices and challenges prices exceeding certain tolerance levels with third party pricing services or broker sources. For those securities valued through either a standardized fair valuation methodology or a fair valuation measurement, the Sub-Committee deals in the first instance with such valuation and the Valuation Committee reviews and affirms the reasonableness of the valuation based on such methodologies and measurements on a regular basis after considering all relevant information that is reasonably available. Any action taken by the Sub-Committee with respect to the valuation of a portfolio security is submitted by the Valuation Committee to the Board for its review at its next regularly scheduled meeting immediately after such action.
“Fair value” is defined as the price that the Fund would receive upon selling an asset or liability in an orderly transaction to an independent buyer in the principal or most advantageous market for the asset or liability. Fair value measurements are determined within a framework that established a three-tier hierarchy which maximizes the use of observable market data and minimizes the use of unobservable inputs to establish a classification of fair value measurements for disclosure purposes. “Inputs” refer broadly to the assumptions that market participants would use in pricing the asset or liability, including assumptions about risk, such as the risk inherent in a particular valuation technique used to measure fair value using a pricing model and/or the risk inherent in the inputs for the valuation technique. Inputs may be observable or unobservable. Observable inputs reflect the assumptions market participants would use in pricing the asset or liability based on market data obtained from sources independent of the Fund. Unobservable inputs reflect the Fund’s own assumptions about the assumptions market participants would use in pricing the asset or liability based on the information available. The inputs or methodology used for valuing securities may not be an indication of the risks associated with investing in those securities. The three-tier hierarchy of inputs is summarized below.
| • | | Level 1—quoted prices in active markets for an identical asset or liability |
| • | | Level 2—other significant observable inputs (including quoted prices for a similar asset or liability in active markets, interest rates and yield curves, prepayment speeds, credit risk, etc.) |
Notes to Financial Statements (continued)
| • | | Level 3—significant unobservable inputs (including the Fund’s own assumptions about the assumptions that market participants would use in measuring fair value of an asset or liability) |
The aggregate value by input level, as of May 31, 2014, for the Fund’s assets or liabilities is included at the end of the Fund’s Portfolio of Investments.
The Fund may use third party vendor evaluations, whose prices may be derived from one or more of the following standard inputs among others:
| | |
• Benchmark Yields | | • Reported Trades |
• Broker Dealer Quotes | | • Issuer Spreads |
• Two-sided markets | | • Benchmark securities |
• Bids/Offers | | • Reference Data (corporate actions or material event notices) |
• Industry and economic events | | • Comparable bonds |
• Monthly payment information | | |
An asset or liability for which market values cannot be measured using the methodologies described above are valued by methods deemed reasonable and in good faith by the Valuation Committee, following the procedures established by the Board, to represent fair value. Under these procedures, the Fund generally uses a market-based approach which may use related or comparable assets or liabilities, recent transactions, market multiples, book values, and other relevant information. The Fund may also use an income-based valuation approach in which the anticipated future cash flows of the asset or liability are discounted to calculate fair value. Discounts may also be applied due to the nature and/or duration of any restrictions on the disposition of the asset or liability. Due to the inherent valuation uncertainty of such assets or liabilities, fair values may differ significantly from values that would have been used had an active market existed. For the year ended May 31, 2014, there have been no material changes to the fair value methodologies.
Securities which may be valued in this manner include, but are not limited to: (i) a security for which trading has been halted or suspended; (ii) a debt security that has recently gone into default and for which there is not a current market quotation; (iii) a security of an issuer that has entered into a restructuring; (iv) a security that has been de-listed from a national exchange; (v) a security for which the market price is not readily available from a third party pricing source or, if so provided, does not, in the opinion of the Manager or Subadvisor reflect the security’s market value; (vi) a security subject to trading collars for which no or limited trading takes place; and (vii) a security whose principal market has been temporarily closed at a time when, under normal conditions, it would be open. Securities for which market quotations or observable inputs are not readily available are generally categorized as Level 3 in the hierarchy. As of May 31, 2014, the Fund did not hold any securities that were fair valued in such a manner.
Futures contracts are valued at the last posted settlement price on the market where such futures are primarily traded and are generally categorized as Level 1 in the hierarchy.
Municipal debt securities are valued at the evaluated mean prices supplied by a pricing agent or broker selected by the Manager, in con-
sultation with the Subadvisor. Those prices reflect broker/dealer supplied valuations and electronic data processing techniques, if such prices are deemed by the Manager, in consultation with the Subadvisor, to be representative of market values, at the regular close of trading of the Exchange on each valuation date. Debt securities purchased on a delayed delivery basis are marked to market daily until settlement at the forward settlement date. Municipal debt securities are generally categorized as Level 2 in the hierarchy.
Temporary cash investments acquired in excess of 60 days to maturity are valued using the latest bid prices or using valuations based on a matrix system (which considers such factors as security prices, yields, maturities, and ratings), both as furnished by independent pricing services. Other temporary cash investments which mature in 60 days or less at the time of purchase (“Short-Term Investments”) are valued at amortized cost. The amortized cost method involves valuing a security at its cost on the date of purchase and thereafter assuming a constant amortization to maturity of the difference between such cost and the value on maturity date. Amortized cost approximates the current fair value of a security. Securities valued at amortized cost are not valued using a quoted price in an active market. These securities are generally categorized as Level 2 in the hierarchy.
(B) Income Taxes. The Fund’s policy is to comply with the requirements of the Internal Revenue Code of 1986, as amended (the “Internal Revenue Code”), applicable to regulated investment companies and to distribute all of the taxable income to the shareholders of the Fund within the allowable time limits. Therefore, no federal, state and local income tax provisions are required.
Management evaluates the Fund’s tax positions to determine if the tax positions taken meet the minimum recognition threshold in connection with accounting for uncertainties in income tax positions taken or expected to be taken for the purposes of measuring and recognizing tax liabilities in the financial statements. Recognition of tax benefits of an uncertain tax position is required only when the position is “more likely than not” to be sustained assuming examination by taxing authorities. Management has analyzed the Fund’s tax positions taken on federal, state and local income tax returns for all open tax years (for up to two tax years), and has concluded that no provisions for federal, state and local income tax are required in the Fund’s financial statements. The Fund’s federal, state and local income and federal excise tax returns for tax years for which the applicable statutes of limitations have not expired are subject to examination by the Internal Revenue Service and state and local departments of revenue.
(C) Dividends and Distributions to Common Shareholders. Dividends and distributions are recorded on the ex-dividend date. The Fund intends to declare dividends from net investment income, after payment of any dividends on any outstanding Preferred shares, if any, at least monthly and declares and pays distributions from net realized capital gains, if any, at least annually. To the extent that the Fund realizes any capital gains or ordinary taxable income, it will be required to allocate such income between the Common shares and Preferred shares issued by the Fund, in proportion to the total dividends paid to each share class for the year in which the income is realized.
(D) Security Transactions and Investment Income. The Fund records security transactions on the trade date. Realized gains and
| | |
| 22 | | MainStay DefinedTerm Municipal Opportunities Fund |
losses on security transactions are determined using the identified cost method. Interest income is accrued as earned using the effective interest rate method. Discounts and premiums on securities purchased, other than Short-Term Investments, for the Fund are accreted and amortized, respectively, on the effective interest rate method over the life of the respective securities or, in the case of a callable security, over the period to the first date of call. Discounts and premiums on Short-Term Investments are accreted and amortized, respectively, on the straight-line method. The straight-line method approximates the effective interest method for short-term investments. Income from payment-in-kind securities is recorded daily based on the effective interest method of accrual.
The Fund may place a debt obligation on non-accrual status and reduce related interest income by ceasing current accruals and writing off interest receivables when the collection of all or a portion of interest has become doubtful based on consistently applied procedures. A debt obligation is removed from non-accrual status when the issuer resumes interest payments or when collectability of interest is reasonably assured.
(E) Expenses. Expenses of the Fund are recorded on the date the expenses are incurred. The expenses borne by the Fund, including those incurred with related parties of the Fund, are shown in the Statement of Operations.
(F) Use of Estimates. In preparing financial statements in conformity with GAAP, management makes estimates and assumptions that affect the reported amounts and disclosures in the financial statements. Actual results could differ from those estimates.
(G) Futures Contracts. A futures contract is an agreement to purchase or sell a specified quantity of an underlying instrument at a specified future date and price, or to make or receive a cash payment based on the value of a financial instrument (e.g., interest rate, security, or securities index). The Fund is subject to market price risk and/or interest rate risk in the normal course of investing in these transactions. During the period the futures contract is open, changes in the value of the contract are recognized as unrealized appreciation or depreciation by marking-to-market such contract on a daily basis to reflect the market value of the contract at the end of each day’s trading. The Fund agrees to receive from or pay to the broker an amount of cash equal to the daily fluctuation in the value of the contract. Such receipts or payments are known as ‘‘variation margin.’’ When the futures contract is closed, the Fund records a realized gain or loss equal to the difference between the proceeds from (or cost of) the closing transaction and the Fund’s basis in the contract.
The use of futures contracts involves, to varying degrees, elements of market risk in excess of the amount recognized in the Statement of Assets and Liabilities. The contract or notional amounts and variation margin reflect the extent of the Fund’s involvement in open futures positions. Risks arise from the possible imperfect correlation in movements in the price of futures contracts, interest rates and the underlying hedged assets, and the possible inability of counterparties to meet the terms of their contracts. However, the Fund’s activities in futures contracts have minimal counterparty risk as they are conducted through regulated exchanges that guarantee the futures against default by the counterparty. In the event of a bankruptcy or insolvency of a futures
commission merchant that holds margin on behalf of the Fund, the Fund may not be entitled to the return of all of the margin owed to the Fund, potentially resulting in a loss. The Fund may invest in futures contracts to help manage the duration and yield curve of the portfolio while minimizing the exposure to wider bid/ask spreads in traditional bonds. The Fund’s investment in futures contracts and other derivatives may increase the volatility of the Fund’s NAV and may result in a loss to the Fund.
(H) Securities Lending. In order to realize additional income, the Fund may engage in securities lending, subject to the limitations set forth in the 1940 Act and relevant guidance by the staff of the Securities and Exchange Commission. In the event the Fund does engage in securities lending, the Fund will lend through its custodian, State Street Bank and Trust Company (“State Street”). State Street will manage the Fund’s cash collateral in accordance with the lending agreement between the Fund and State Street, and indemnify the Fund’s portfolio against counterparty risk. The loans will be collateralized by cash or securities at least equal at all times to the market value of the securities loaned. Collateral will consist of U.S. government securities, cash equivalents or irrevocable letters of credit. The Fund may bear the risk of delay in recovery of, or loss of rights in, the securities loaned should the borrower of the securities experience financial difficulty. The Fund may also record realized gain or loss on securities deemed sold due to a borrower’s inability to return securities on loan. The Fund will receive compensation for lending its securities in the form of fees or the retention of a portion of the interest on the investment of any cash received as collateral. The Fund also will continue to receive interest and dividends on the securities loaned and any gain or loss in the market price of the securities loaned that may occur during the term of the loan will be for the account of the Fund.
Although the Fund and New York Life Investments have temporarily suspended securities lending, the Fund and New York Life Investments reserve the right to reinstitute lending when deemed appropriate. The Fund did not have any portfolio securities on loan as of May 31, 2014.
(I) Tender Option Bonds. The Fund may leverage its assets through the use of proceeds received from tender option bond transactions. In a tender option bond transaction, a tender option bond trust (a “TOB Issuer”) is typically established by a third party sponsor forming a special purpose trust into which the Fund, or an agent on behalf of the Fund, transfers municipal bonds or other municipal securities (“Underlying Securities”). A TOB Issuer typically issues two classes of beneficial interests: short-term floating rate notes (“TOB Floaters”), which are sold to third party investors, and residual interest municipal tender option bonds (“TOB Residuals”), which are generally issued to the Fund. The Fund may invest in both TOB Floaters and TOB Residuals. The Fund may not invest more than 5% of its Managed Assets (as defined in Note 3(A)) in any single TOB Issuer. The Fund may invest in both TOB Floaters and TOB Residuals issued by the same TOB Issuer.
The TOB Issuer receives Underlying Securities from the Fund through the sponsor and then issues TOB Floaters to third party investors and TOB Residuals to the Fund. The Fund is paid the cash (less transaction expenses, which are borne by the Fund) received by the TOB Issuer from the sale of TOB Floaters and typically will invest the cash in additional municipal bonds or other investments permitted by its investment policies. TOB Floaters may have first priority on the cash flow from the
Notes to Financial Statements (continued)
securities held by the TOB Issuer and are enhanced with a liquidity support arrangement from a bank or an affiliate of the sponsor (the “liquidity provider”), which allows holders to tender their position back to the TOB Issuer at par (plus accrued interest). The Fund, in addition to receiving cash from the sale of TOB Floaters, also receives TOB Residuals. TOB Residuals provide the Fund with the right to (1) cause the holders of TOB Floaters to tender their notes to the TOB Issuer at par (plus accrued interest), and (2) acquire the Underlying Securities from the TOB Issuer. In addition, all voting rights and decisions to be made with respect to any other rights relating to the Underlying Securities deposited in the TOB Issuer are passed through to the Fund, as the holder of TOB Residuals. Such a transaction, in effect, creates exposure for the Fund to the entire return of the Underlying Securities deposited in the TOB Issuer, with a net cash investment by the Fund that is less than the value of the Underlying Securities deposited in the TOB Issuer. This multiplies the positive or negative impact of the Underlying Securities’ return within the Fund (thereby creating leverage).
Income received by TOB Residuals will vary inversely with the short-term rate paid to holders of TOB Floaters and in most circumstances, TOB Residuals bear substantially all of the Underlying Securities’ downside investment risk and also benefits disproportionally from any potential appreciation of the Underlying Securities’ value. The amount of such increase or decrease is a function, in part, of the amount of TOB Floaters sold by the TOB Issuer of these securities relative to the amount of TOB Residuals that it sells. The greater the amount of TOB Floaters sold relative to TOB Residuals, the more volatile the income paid on TOB Residuals will be. The price of TOB Residuals will be more volatile than that of the Underlying Securities because the interest rate is dependent on not only the fixed coupon rate of the Underlying Securities but also on the short-term interest rate paid on TOB Floaters.
For TOB Floaters, generally, the interest rate earned will be based upon the market rates for municipal securities with maturities or remarketing provisions that are comparable in duration to the periodic interval of the tender option, which may vary from weekly, to monthly, to extended periods of one year or multiple years. Since the option feature has a shorter term than the final maturity or first call date of the Underlying Securities deposited in the TOB Issuer, the Fund, if it is the holder of the TOB Floaters, relies upon the terms of the agreement with the financial institution furnishing the option as well as the credit strength of that institution. As further assurance of liquidity, the terms of the TOB Issuer provide for a liquidation of the Underlying Security deposited in the TOB Issuer and the application of the proceeds to pay off the TOB Floaters.
The TOB Issuer may be terminated without the consent of the Fund upon the occurrence of certain events, such as the bankruptcy or default of the issuer of the Underlying Securities deposited in the TOB Issuer, a substantial downgrade in the credit quality of the issuer of the securities deposited in the TOB Issuer, the inability of the TOB Issuer to obtain liquidity support for the TOB Floaters, a substantial decline in the market value of the Underlying Securities deposited in the TOB Issuer, or the inability of the sponsor to remarket any TOB Floaters tendered to it by holders of the TOB Floaters. In such an event, the TOB Floaters would be redeemed by the TOB Issuer at par (plus accrued interest) out of the proceeds from a sale of the Underlying Securities deposited in the TOB Issuer. If this happens, the Fund would be entitled to the assets of the TOB Issuer, if any, that remain after the TOB Floaters have been
redeemed at par (plus accrued interest). If there are insufficient proceeds from the sale of these securities to redeem all of the TOB Floaters at par (plus accrued interest), the liquidity provider or holders of the TOB Floaters would bear the losses on those securities and there would be no recourse to the Fund’s assets (unless the Fund held a recourse TOB Residual).
For financial reporting purposes, Underlying Securities that are deposited into a TOB Issuer are treated as investments of the Fund, and are presented on the Fund’s Portfolio of Investments. Outstanding TOB Floaters issued by a TOB Issuer are presented at their face value as “Payable for Floating Rate Note Obligations” in the Fund’s Statement of Assets and Liabilities. The face value approximates the fair value of the floating rate notes. Interest income from Underlying Securities are recorded by the Fund on an accrual basis. Interest expense incurred on the TOB Floaters and other expense related to remarketing, administration and trustee services to a TOB Issuer are recognized as a component of “Interest expense and fees” on the Statement of Operations.
At May 31, 2014, the aggregate value of the Underlying Securities transferred to the TOB Issuer and the related liability for TOB Floaters were as follows:
| | | | |
Underlying
Securities Transferred
to TOB Issuers | | Liability for
Floating Rate Note
Obligations | |
| $365,154,669 | | $ | 213,380,000 | |
As of May 31, 2014, the Fund’s average TOB Floaters outstanding and the daily weighted average interest rate, including fees, were as follows:
| | | | |
Average
Floating Rate Note
Obligations Outstanding | | Daily Weighted
Average
Interest Rate | |
| $217,198,644 | | | 0.78 | % |
(J) Fixed Rate Municipal Term Preferred Shares. On October 4, 2012, the Fund issued and has outstanding, two series of Fixed Rate Municipal Term Preferred Shares (“Series A FMTP Shares” and “Series B FMTP Shares”, collectively, “FMTP Shares”), each with a liquidation preference of $100,000 per share (“Liquidation Preference”). Dividends on FMTP Shares, which are recognized as interest expense for financial reporting purposes, are paid semiannually at a fixed annual rate, subject to adjustments in certain circumstances. The FMTP Shares were issued in a private offering exempt from registration under the Securities Act of 1933, as amended. As of May 31, 2014, the number of FMTP Shares outstanding and annual interest rate were as follows:
| | | | | | | | | | |
Series | | Dates of Issuance | | Shares
Outstanding | | | Annual
Interest Rate | |
A | | October 4, 2012 | | | 350 | | | | 1.48 | % |
B | | October 4, 2012 | | | 350 | | | | 1.58 | % |
The Fund is obligated to redeem its FMTP Shares by the date as specified in its offering document (“Term Redemption”), unless earlier redeemed by the Fund. FMTP Shares are subject to optional and mandatory redemption in certain circumstances. FMTP Shares will be subject to redemption, at the option of the Fund (“Optional Redemption”), in whole or in part at any time only for the purposes of decreasing leverage of the Fund. The Fund may be obligated to redeem
| | |
| 24 | | MainStay DefinedTerm Municipal Opportunities Fund |
certain of the FMTP Shares if the Fund fails to maintain certain asset coverage and leverage ratio requirements and such failures are not cured by the applicable cure date. The Optional Redemption price per share is equal to the sum of the Liquidation Preference per share plus any accrued but unpaid dividends. As of May 31, 2014, the Term Redemption date and liquidation value for the FMTP Shares outstanding were as follows:
| | | | | | | | |
Series | | Term
Redemption Date | | | Liquidation
Value | |
A | | | October 15, 2015 | | | $ | 35,237,417 | |
B | | | March 15, 2016 | | | $ | 35,253,457 | |
For financial reporting purposes only, the liquidation value of FMTP Shares is recorded as a liability on the Statement of Assets and Liabilities. Unpaid dividends on FMTP Shares are recognized as a component of “Interest expense and fees payable” on the Statement of Assets and Liabilities. Dividends accrued on FMTP Shares are recognized as a component of “Interest expense and fees” in the Statement of Operations. As of May 31, 2014, the fair value of the FMTP Shares for Series A and Series B were $35,001,750 and $35,001,750, respectively and are categorized as Level 2 in the fair value hierarchy.
(K) Statement of Cash Flows. The cash amount shown in the Fund’s Statement of Cash Flows is the amount included in the Fund’s Statement of Assets and Liabilities and represents the cash on hand at its custodian and does not include any Short-Term Investments or restricted cash.
(L) Concentration of Risk. The ability of issuers of debt securities held by the Fund to meet their obligations may be affected by economic or political developments in a specific country, industry or region.
(M) Offering Costs. Costs were incurred by the Fund in connection with the offering of FMTP Shares were recorded as deferred charges, which are amortized over the life of the shares. The Fund’s amortized deferred charges are recognized as “Interest expense and fees” on the Statement of Operations.
(N) Indemnifications. Under the Fund’s organizational documents, its officers and trustees are indemnified against certain liabilities that may arise out of performance of their duties to the Fund. Additionally, in the normal course of business, the Fund enters into contracts with third-party service providers that contain a variety of representations and warranties and which may provide general indemnifications. The Fund’s maximum exposure under these arrangements is unknown, as this would involve future claims that may be made against the Fund that have not yet occurred. Based on experience, management is of the view that the risk of loss in connection with these potential indemnification obligations is remote. However, there can be no assurance that material liabilities related to such obligations will not arise in the future, which could adversely impact the Fund.
(O) Quantitative Disclosure of Derivative Holdings. The following tables show additional disclosures about the Fund’s derivative and hedging activities, including how such activities are accounted for and their effect on the Fund’s financial positions, performance and cash flows. These derivatives are not accounted for as hedging instruments. The amount disclosed in the table represent the monthly average held during the year ended May 31, 2014.
Fair value of derivatives instruments as of May 31, 2014:
Asset Derivatives
| | | | | | | | | | |
| | | Statement of
Assets and
Liabilities
Location | | Interest Rate
Contracts
Risk | | | Total | |
Futures Contracts | | Net Assets-Net unrealized appreciation (depreciation) on investments and futures contracts (a) | | $ | 48,512 | | | $ | 48,512 | |
| | | | | | |
Total Fair Value | | $ | 48,512 | | | $ | 48,512 | |
| | | | | | |
| (a) | Includes cumulative appreciation (depreciation) of futures contracts as reported in the Portfolio of Investments. Only current day’s variation margin is reported within the Statement of Assets and Liabilities. |
The effect of derivative instruments on the Statement of Operations for the year ended May 31, 2014:
Realized Gain (Loss)
| | | | | | | | | | |
| | | Statement of
Operations
Location | | Interest Rate
Contracts
Risk | | | Total | |
Futures Contracts | | Net realized gain (loss) on futures transactions | | $ | (1,464,031 | ) | | $ | (1,464,031 | ) |
| | | | | | |
Total Realized Gain (Loss) | | $ | (1,464,031 | ) | | $ | (1,464,031 | ) |
| | | | | | |
Change in Unrealized Appreciation (Depreciation)
| | | | | | | | | | |
| | | Statement of
Operations
Location | | Interest Rate
Contracts
Risk | | | Total | |
Futures Contracts | | Net change in unrealized appreciation (depreciation) on futures contracts | | $ | (910,551 | ) | | $ | (910,551 | ) |
| | | | | | |
Total Change in Unrealized Appreciation (Depreciation) | | $ | (910,551 | ) | | $ | (910,551 | ) |
| | | | | | |
Number of Contracts, Notional Amounts or Shares/Units
| | | | | | | | |
| | | Interest Rate
Contracts
Risk | | | Total | |
Futures Contracts Short (Average number of contracts) | | | (625 | ) | | | (625 | ) |
| | | | |
Note 3–Fees and Related Party Transactions
(A) Manager and Subadvisor. New York Life Investments, a registered investment adviser and an indirect, wholly-owned subsidiary of New York Life Insurance Company (“New York Life”), serves as the Fund’s Manager, pursuant to a Management Agreement. The Manager
Notes to Financial Statements (continued)
provides offices, conducts clerical, recordkeeping and bookkeeping services, and keeps most of the financial and accounting records required to be maintained by the Fund. Except for the portion of salaries and expenses that are the responsibility of the Fund, the Manager pays the salaries and expenses of all personnel affiliated with the Fund and certain operational expenses of the Fund. The Fund reimburses New York Life Investments in an amount equal to a portion of the compensation of the Chief Compliance Officer (“CCO”) of the Fund. MacKay Shields LLC (“MacKay Shields” or the ‘‘Subadvisor’’), a registered investment adviser and an indirect, wholly-owned subsidiary of New York Life, serves as Subadvisor to the Fund and is responsible for the day-to-day portfolio management of the Fund. Pursuant to the terms of a Subadvisory Agreement (“Subadvisory Agreement”) between New York Life Investments and MacKay Shields, New York Life Investments pays for the services of the Subadvisor.
The Fund pays the Manager a monthly fee for services performed and facilities furnished at an annual rate of 0.60% of the “Managed Assets”. Managed Assets is defined as the Fund’s total assets, minus the sum of its accrued liabilities (other than Fund liabilities incurred for the purpose of creating effective leverage (i.e. tender option bonds) or Fund liabilities related to liquidation preference of any preferred shares issued).
For the year ended May 31, 2014, New York Life Investments earned fees from the Fund in the amount of $4,511,721.
State Street, 1 Lincoln Street, Boston, Massachusetts 02111, provides sub-administration and sub-accounting services to the Fund pursuant to an agreement with New York Life Investments. These services include calculating the daily NAVs of the Fund, maintaining the general ledger and sub-ledger accounts for the calculation of the Fund’s respective NAVs, and assisting New York Life Investments in conducting various aspects of the Fund’s administrative operations. For providing these services to the Fund, State Street is compensated by New York Life Investments.
(B) Transfer, Dividend Disbursing and Shareholder Servicing Agent. Computershare Trust Company, N.A. (“Computershare”), 250 Royall Street, Canton, Massachusetts, 02021, is the Fund’s transfer, dividend disbursing and shareholder servicing agent pursuant to an agreement between New York Life Investments and Computershare.
(C) Capital. As of May 31, 2014, New York Life beneficially held 6,039 Common shares of the Fund with a value and percentage of net assets applicable to Common shares of $113,292 and 0.02%, respectively.
Note 4–Federal Income Tax
As of May 31, 2014, the components of accumulated gain (loss) on a tax basis were as follows:
| | | | | | | | |
Undistributed Tax
Exempt Income | | Accumulated
Capital
and Other
Gain (Loss) | | Other
Temporary
Differences | | Unrealized
Appreciation
(Depreciation) | | Total
Accumulated
Gain (Loss) |
| $3,826,625 | | $(47,287,137) | | $(725,405) | | $36,188,043 | | $(7,997,874) |
The difference between book basis and tax basis unrealized appreciation (depreciation) is due to wash sales and tender option bond transactions.
The other temporary differences are primarily due to dividends payable.
The following table discloses the current year reclassifications between accumulated undistributed net investment income, accumulated net realized loss on investments and additional paid-in capital arising from permanent differences; net assets as of May 31, 2014 were not affected.
| | | | |
Accumulated Undistributed Net Investment Income (Loss) | | Accumulated
Net Realized
Gain (Loss) on
Investments | | Additional
Paid-In
Capital |
$469,566 | | $(322,640) | | $(146,926) |
The reclassifications for the Fund are primarily due to distribution redesignations and non-deductible expenses.
As of May 31, 2014, for federal income tax purposes, capital loss carryforwards of $47,287,137 were available as shown in the table below, to the extent provided by the regulations to offset future realized gains of the Fund through the years indicated. To the extent that these capital loss carryforwards are used to offset future capital gains, it is probable that the capital gains so offset will not be distributed to shareholders. No capital gain distributions shall be made until any capital loss carryforwards have been fully utilized or expired.
| | | | | | | | |
Capital Loss
Available Through | | Short-Term Capital Loss
Amounts (000’s) | | | Long-Term Capital Loss
Amounts (000’s) | |
Unlimited | | $ | 21,807 | | | $ | 25,480 | |
| | |
| 26 | | MainStay DefinedTerm Municipal Opportunities Fund |
The tax character of distributions paid during the year ended May 31, 2014 and period ended May 31, 2013 to Common shareholders (shown in the Statement of Changes in Net Assets) and Preferred shareholders (included as interest expense for financial statement purposes (See Note 2(J)) were as follows:
| | | | | | | | | | | | | | | | | | | | | | | | |
| | | 2014 | | | 2013 | |
| Distributions paid from: | | Ordinary
Income | | | Exempt
Interest
Dividends | | | Long-Term
Capital
Gain | | | Ordinary Income | | | Exempt
Interest
Dividends | | | Long-Term
Capital
Gain | |
Common shares | | $ | 9,873,371 | | | $ | 30,937,969 | | | $ | 492,125 | | | $ | 6,232,103 | | | $ | 22,827,363 | | | $ | 167,950 | |
Preferred shares | | | 334,070 | | | | 906,667 | | | | 16,466 | | | | 186,420 | | | | 581,704 | | | | 3,382 | |
Total | | $ | 10,207,441 | | | $ | 31,844,636 | | | $ | 508,591 | | | $ | 6,418,523 | | | $ | 23,409,067 | | | $ | 171,332 | |
Note 5–Custodian
State Street is the custodian of cash and securities held by the Fund. Custodial fees are charged to the Fund based on the Fund’s net assets and/or the market value of securities held by the Fund and the number of certain cash transactions incurred by the Fund.
Note 6–Purchases and Sales of Securities (in 000’s)
For the year ended May 31, 2014, purchases and sales of securities, other than short-term securities, were $616,130 and $632,577, respectively.
Note 7–Capital Share Transactions
| | | | |
Common Shares (a): | | Shares | |
For the period June 26, 2012 through May 31, 2013: | | | | |
Common shares issued resulting from initial public offering on June 26, 2012 (b) | | | 27,524,029 | |
Common shares issued in reinvestment of dividends | | | 30,535 | |
| | | | |
Common shares outstanding at the end of the period | | | 27,554,564 | |
| | | | |
| | | | | | | | |
Preferred Shares (a): | | Shares | | | Amount | |
For the period June 26, 2012 through May 31, 2013: | | | | | | | | |
Series A Shares Issued | | | 350 | | | $ | 35,000,000 | |
Series B Shares Issued | | | 350 | | | $ | 35,000,000 | |
| | | | |
| (a) | For the year ended May 31, 2014, there were no new shares issued or redeemed. |
| (b) | Includes 5,236 shares held by New York Life at inception date and 2,768,793 shares resulting from overallotment issuance on August 15, 2012. |
Note 8–Subsequent Events
In connection with the preparation of the financial statements of the Fund as of and for the year ended May 31, 2014, events and
transactions subsequent to May 31, 2014, through the date the financial statements were issued have been evaluated by the Fund’s management for possible adjustment and/or disclosure. No subsequent events requiring financial statement adjustment or disclosure have been identified, other than the following:
On June 16, 2014, the Fund paid its semiannual distribution to Series A and Series B Preferred shareholders in the amounts of $740.00 and $790.00, per share, respectively.
On July 1, 2014, the Fund declared dividends for the upcoming quarter as shown in the following schedule:
| | | | | | | | | | | | | | | | |
Month | | Ex-Date | | | Record Date | | | Payable Date | | | Amount | |
| July | | | 07/11/14 | | | | 07/15/14 | | | | 07/31/14 | | | $ | 0.097 | |
| August | | | 08/13/14 | | | | 08/15/14 | | | | 08/29/14 | | | $ | 0.097 | |
| September | | | 09/11/14 | | | | 09/15/14 | | | | 09/30/14 | | | $ | 0.097 | |
Note 9–Recent Accounting Pronouncement
In June 2013, the FASB issued ASU No. 2013-08, Amendments to the Scope, Measurement, and Disclosure Requirements (“ASU 2013-08”) to clarify the characteristics of an investment company and to provide guidance for assessing whether an entity is an investment company. Consistent with existing guidance for investment companies, all investments are to be measured at fair value including non-controlling ownership interests in other investment companies. There are no changes to the current requirements relating to the retention of specialized accounting in the Fund’s financial statements. The guidance is effective for interim and annual periods beginning after December 15, 2013 and early application is prohibited. Adoption is not expected to have a material impact on the Fund’s financial statements.
Report of Independent Registered Public Accounting Firm
To the Board of Trustees and Shareholders of
MainStay DefinedTerm Municipal Opportunities Fund:
In our opinion, the accompanying statement of assets and liabilities, including the portfolio of investments, and the related statements of operations, of changes in net assets and of cash flows and the financial highlights present fairly, in all material respects, the financial position MainStay DefinedTerm Municipal Opportunities Fund (the “Fund”) at May 31, 2014, and the results of its operations and its cash flows for the year then ended and the changes in its net assets and the financial highlights for the year then ended and for the period June 26, 2012 (commencement of operations) through May 31, 2013, in conformity with accounting principles generally accepted in the United States of America. These financial statements and financial highlights (hereafter referred to as “financial statements”) are the responsibility of the Fund’s management. Our responsibility is to express an opinion on these financial statements based on our audits. We conducted our audits of these financial statements in accordance with the standards of the Public Company Accounting Oversight Board (United States). Those standards require that we plan and perform the audit to obtain reasonable assurance about whether the financial statements are free of material misstatement. An audit includes examining, on a test basis, evidence supporting the amounts and disclosures in the financial statements, assessing the accounting principles used and significant estimates made by management, and evaluating the overall financial statement presentation. We believe that our audits, which included confirmation of securities at May 31, 2014 by correspondence with the custodian, trustees, and brokers, provide a reasonable basis for our opinion.
PricewaterhouseCoopers LLP
New York, New York
July 24, 2014
| | |
| 28 | | MainStay DefinedTerm Municipal Opportunities Fund |
Board Consideration and Approval of Management Agreement and
Subadvisory Agreement (Unaudited)
Section 15(c) of the Investment Company Act of 1940, as amended (the “1940 Act”) requires that each investment company’s board of trustees, including a majority of the independent trustees, annually review and approve the investment company’s investment advisory agreements. At its December 10-11, 2013 meeting, the Board of Trustees (“Board”) of MainStay DefinedTerm Municipal Opportunities Fund (the “Fund”) unanimously approved the Management Agreement between the Fund and New York Life Investment Management LLC (“New York Life Investments”) and the Subadvisory Agreement between New York Life Investments and MacKay Shields LLC (“MacKay Shields”) with respect to the Fund.
In reaching its decision to approve the Agreements, the Board considered information furnished by New York Life Investments and MacKay Shields in connection with a contract review process that took place at various meetings of the Board and its Contracts Committee between September 2013 and December 2013 as well as other relevant information furnished to the Board and its Alternative and Closed-End Funds Oversight Committee (the “ACE Committee”) throughout the year by New York Life Investments and MacKay Shields. Information requested by and furnished to the Board in connection with the contract review process included, among other items, reports on the Fund and “peer investment companies” prepared by Strategic Insight Mutual Fund Research and Consulting, LLC (“Strategic Insight”), an independent third-party service provider engaged by the Board to report objectively on the Fund’s investment performance, management and subadvisory fees and ordinary operating expenses. The Board also considered information provided by New York Life Investments and MacKay Shields on the fees charged to other investment advisory clients (including institutional separate accounts) that follow investment strategies similar to the Fund and the rationale for any differences in the Fund’s management and subadvisory fees and the fees charged to those other investment advisory clients. In addition, the Board requested and received information on the profitability of the Fund to New York Life Investments and its affiliates, including MacKay Shields as subadvisor to the Fund and responses from New York Life Investments and MacKay Shields to a series of questions encompassing a variety of topics prepared on behalf of the Board by independent legal counsel to the Board and its independent trustees (the “Independent Trustees”). Information provided to the Board and the ACE Committee at their meetings throughout the year included, among other items, detailed investment performance reports on the Fund prepared by the Investment Consulting Group at New York Life Investments. The structure and format for this regular reporting were developed in consultation with the Board and the ACE Committee. The Board and the ACE Committee also received from New York Life Investments throughout the year, among other items, periodic reports on legal and compliance matters, leverage, portfolio turnover, and trading in fund shares.
In considering the Agreements, the members of the Board reviewed and evaluated all of the information and factors they believed to be relevant and appropriate in light of legal advice furnished to them by independent legal counsel and through the exercise of their own business judgment. The broad factors considered by the Board are discussed in greater detail below and included, among other items: (i) the nature, scope and quality of the services provided to the Fund by New York Life Investments and MacKay Shields; (ii) the investment
performance of the Fund, New York Life Investments and MacKay Shields; (iii) the costs of the services provided, and profits realized, by New York Life Investments and MacKay Shields] from their relationships with the Fund; (iv) the extent to which economies of scale may be realized as the Fund grows and the extent to which economies of scale may benefit Fund investors; and (v) the reasonableness of the Fund’s management and subadvisory fees and overall total ordinary operating expenses, particularly as compared to similar investment companies and accounts managed by New York Life Investments and MacKay Shields and peer investment companies identified by Strategic Insight.
While individual members of the Board may have weighed certain factors differently, the Board’s decision to approve the Agreements was based on a consideration of all the information provided to the Board, including information provided to the Board and the ACE Committee throughout the year and to the Board and the Contracts Committee specifically in connection with the contract review process. The Board’s conclusions with respect to the Agreements also were based, in part, on the Board’s consideration of the Agreements in prior years. In addition to considering the above-referenced factors, the Board observed that in the marketplace there are a range of investment options available to shareholders of the Fund and that the Fund’s shareholders, having had the opportunity to consider other investment options, have chosen to invest in the Fund. A more detailed discussion of the factors that figured prominently in the Board’s decisions to approve the Agreements is provided below.
Nature, Scope and Quality of Services to Be Provided by New York Life Investments and MacKay Shields
The Board examined the nature, scope and quality of the services that New York Life Investments provides to the Fund. The Board evaluated New York Life Investments’ experience in serving as manager of the Fund, noting that New York Life Investments manages other investment companies, serves a variety of other investment advisory clients, including other pooled investment vehicles, and has experience with overseeing investment company service providers, including subadvisors. The Board also noted that the services provided to the Fund as a closed-end fund may differ from the services provided to mutual funds and other investment advisory clients, such as compliance services provided in connection with the Fund’s use of leverage and trading of Fund shares on the New York Stock Exchange. The Board considered the experience of senior personnel at New York Life Investments providing management and administrative services to the Fund as well as New York Life Investments’ reputation and financial condition. The Board also considered the full range of non-advisory services that New York Life Investments supplies to the Fund under the terms of the Management Agreement, including: (i) fund accounting and oversight services provided by New York Life Investments’ Fund Accounting and Administration Group; (ii) investment oversight and analytical services provided by New York Life Investments’ Investment Consulting Group; (iii) compliance services provided by the Fund’s Chief Compliance Officer as well as New York Life Investments’ compliance department, including oversight and implementation of the Fund’s compliance program; and (iv) legal services provided by New York Life Investments’ Office of the General Counsel. Additional information about the non-advisory services provided by New York Life Investments is set forth in
Board Consideration and Approval of Management Agreement and
Subadvisory Agreement (Unaudited) (continued)
the Fund’s Management Agreement. The Board also considered New York Life Investments’ willingness to invest in personnel and infrastructure that benefit the Fund and noted that New York Life Investments is responsible for compensating the Fund’s officers.
The Board also examined the nature, scope and quality of the advisory services that MacKay Shields provides to the Fund. The Board evaluated MacKay Shields’ experience in serving as subadvisor to the Fund and managing other portfolios. It examined MacKay Shields’ track record and experience in providing investment advisory services, the experience of investment advisory, senior management and administrative personnel at MacKay Shields, and MacKay Shields’ overall legal and compliance environment. The Board also reviewed MacKay Shields’ willingness to invest in personnel that benefit the Fund. In this regard, the Board considered the experience of the Fund’s portfolio managers, the number of accounts managed by the portfolio managers and the method for compensating portfolio managers.
Based on these considerations, the Board concluded, within the context of its overall determinations regarding the Agreements, that the Fund should continue to benefit from the nature, scope and quality of these services as a result of New York Life Investments’ and MacKay Shields’ experience, personnel, operations and resources.
Investment Performance
In evaluating the Fund’s investment performance, the Board considered investment performance results in light of the Fund’s investment objective, strategies and risks, as disclosed in the Fund’s prospectus. The Board particularly considered detailed investment reports on the Fund’s performance provided to the Board and the ACE Committee throughout the year by the Investment Consulting Group of New York Life Investments. These reports include, among other items, information on the Fund’s use of leverage, Fund’s gross and net returns, the Fund’s investment performance relative to relevant investment categories and Fund benchmarks, the Fund’s risk-adjusted investment performance, and the Fund’s investment performance as compared to peer investment companies, as appropriate. The Board also considered information provided by Strategic Insight showing the investment performance of the Fund as compared to peer investment companies.
In evaluating the performance of the Fund, the Board considered that the Fund had not been in operation for a sufficient time period to establish a meaningful investment performance track record. The Board also gave weight to its ongoing discussions with senior management at New York Life Investments concerning the Fund’s investment performance as well as discussions between the Fund’s portfolio managers and the Board that generally occur on an annual basis, including at quarterly meetings of the Board and at quarterly and special meetings of the ACE Committee. In addition, the Board considered any specific actions that New York Life Investments or MacKay Shields had taken, or had agreed with the Board to take, to enhance Fund investment performance and the results of those actions.
Based on these considerations, the Board concluded, within the context of its overall determinations regarding the Agreements, that the long-term investment performance of the Fund, along with ongoing efforts by New York Life Investments and MacKay Shields to enhance investment returns, supported a determination to approve the Agreements. The
Fund discloses more information about investment performance in the Portfolio Management Discussion and Analysis, Investment and Performance Comparison and Financial Highlights sections of this Semiannual Report.
Costs of the Services Provided, and Profits Realized, by New York Life Investments and MacKay Shields
The Board considered the costs of the services provided by New York Life Investments and MacKay Shields under the Agreements and the profits realized by New York Life Investments and its affiliates, including MacKay Shields, due to their relationships with the Fund. Because MacKay Shields is an affiliate of New York Life Investments whose subadvisory fees are paid directly by New York Life Investments, the Board considered cost and profitability information for New York Life Investments and MacKay Shields in the aggregate.
In evaluating the costs and profits of New York Life Investments and its affiliates, including MacKay Shields, the Board considered, among other factors, each party’s investments in personnel, systems, equipment and other resources necessary to manage the Fund, and that New York Life Investments is responsible for paying the subadvisory fees for the Fund. The Board acknowledged that New York Life Investments and MacKay Shields must be in a position to pay and retain experienced professional personnel to provide services to the Fund and that the ability to maintain a strong financial position is important in order for New York Life Investments and MacKay Shields to continue to provide high-quality services to the Fund. The Board also noted that the Fund benefits from the allocation of certain fixed costs across the MainStay Group of Funds.
In addition, the Board noted the difficulty in obtaining reliable comparative data about investment company managers’ profitability, since such information generally is not publicly available and may be impacted by numerous factors, including the structure of a manager’s organization, the types of investment companies it manages, the methodology used to allocate certain fixed costs to specific investment companies, and the manager’s capital structure and costs of capital. While recognizing the difficulty in evaluating a manager’s profitability with respect to the Fund and noting that other profitability methodologies may also be reasonable, the Board concluded that the profitability methodology presented by New York Life Investments to the Board, which was developed by New York Life Investments in consultation with an independent consultant, was reasonable in all material respects.
In considering the costs and profitability of the Fund, the Board also considered certain fall-out benefits that may be realized by New York Life Investments and its affiliates due to their relationships with the Fund.
After evaluating the information presented to the Board, the Board concluded, within the context of its overall determinations regarding the Agreements, that any profits realized by New York Life Investments and its affiliates, including MacKay Shields, due to their relationships with the Fund supported the Board’s decision to approve the Agreements.
| | |
| 30 | | MainStay DefinedTerm Municipal Opportunities Fund |
Extent to Which Economies of Scale May Be Realized as the Fund Grows
The Board considered whether the Fund’s expense structure permits economies of scale to be shared with Fund investors. The Board reviewed information from New York Life Investments showing how the Fund’s management fee schedule compared to fee schedules of other investment companies and accounts managed by New York Life Investments. The Board also reviewed information from Strategic Insight showing how the Fund’s management fee schedule hypothetically would compare with fees paid for similar services by peer investment companies at varying asset levels. While recognizing the difficulty of determining economies of scale with precision, the Board acknowledged that economies of scale may be shared with the Fund in a number of ways, including, for example, through the imposition of management fee breakpoints and by initially setting relatively low management fees. The Board also took into account that, as a closed-end investment company, the Fund does not currently intend to raise additional assets, so the assets of the Fund will grow (if at all) only through the investment performance of the Fund.
Based on this information, the Board concluded, within the context of its overall determinations regarding the Agreements, that the Fund’s expense structure appropriately reflects economies of scale for the benefit of Fund investors. The Board noted, however, that it would continue to evaluate the reasonableness of the Fund’s expense structure as the Fund grows over time.
Management and Subadvisory Fees and Total Ordinary Operating Expenses
The Board evaluated the reasonableness of the fees to be paid under the Agreements and the Fund’s expected total ordinary operating expenses. The Board primarily considered the reasonableness of the management fee paid by the Fund to New York Life Investments, since the fees paid to MacKay Shields are paid by New York Life Investments, not the Fund.
In assessing the reasonableness of the Fund’s fees and expenses, the Board primarily considered comparative data provided by Strategic Insight on the fees and expenses charged by similar investment companies managed by other investment advisers. In addition, the Board considered information provided by New York Life Investments and MacKay Shields on fees charged to other investment advisory clients, including institutional separate accounts and other investment companies with similar investment objectives as the Fund. The Board also took into account explanations provided by New York Life Investments about the different scope of services provided to closed-ends funds as compared to mutual funds and other investment advisory clients. Additionally, the Board considered the impact of any contractual breakpoints, voluntary waivers and expense limitation arrangements on the Fund’s net management fee and expenses.
The Board also considered that, unlike with respect to the open-end funds in the MainStay Group of Funds, the management fee for the Fund is based on the “managed assets” of the Fund, which includes assets attributable to the Fund’s use of “effective leverage,” as defined in the Fund’s prospectus. The Board acknowledged that New York Life Investments and MacKay Shields have the ability to increase the amount
of the Fund’s managed assets through the use of effective leverage, which may cause a conflict of interest. In assessing the reasonableness of the management fee and the methodology for its calculation, the Board took into account, among other factors, representations from MacKay Shields and New York Life Investments that they provide services of the same nature, scope and quality with respect to assets of the Fund that are created through effective leverage as they would with respect to other assets of the Fund.
After considering all of the factors outlined above, the Board concluded that the Fund’s management and subadvisory fees and total ordinary operating expenses were within a range that is competitive and, within the context of the Board’s overall conclusions regarding the Agreements, support a conclusion that these fees and expenses are reasonable.
Conclusion
On the basis of the information provided to it and its evaluation thereof, the Board, including the Independent Trustees, unanimously voted to approve the Agreements.
Dividend Reinvestment Plan (Unaudited)
Pursuant to the Fund’s Dividend Reinvestment Plan (the “Plan”) shareholders whose shares are registered in their own name may “opt-in” to the Plan and elect to reinvest all or a portion of their distributions in the Common shares by providing the required enrollment notice to Com-putershare Trust Company, N.A., the Plan Administrator (“Plan Administrator”). Shareholders whose shares are held in the name of a broker or other nominee may have distributions reinvested only if such a service is provided by the broker or the nominee or if the broker or the nominee permits participation in the Plan. Shareholders whose shares are held in the name of a broker or other nominee should contact the broker or nominee for details. A shareholder may terminate participation in the Plan at any time by notifying the Plan Administrator before the record date of the next distribution through the Internet, by telephone or in writing. All distributions to shareholders who do not participate in the Plan, or have elected to terminate their participation in the Plan, will be paid by check mailed directly to the record holder by or under the direction of the Plan Administrator when the Fund declares a distribution.
When the Fund declares a dividend or other distribution (together, a “Dividend”) payable in cash, non-participants in the Plan will receive cash and participants in the Plan (i.e., those holders of Common shares who (“opt-in”) will receive the equivalent in Common shares. The Common shares will be acquired by the Plan Administrator for the participants’ accounts, depending upon the circumstances described below, either (i) through receipt of additional unissued but authorized Common shares from the Fund (“Newly Issued Common Shares”) or (ii) by purchase of outstanding Common shares on the open market (“Open-Market Purchases”) on the NYSE or elsewhere. If, on the payment date for any Dividend, the closing market price per Common share plus estimated per share fees, which include any brokerage commissions the Plan Administrator is required to pay, is equal to or greater than the NAV per Common share, the Plan Administrator will invest the Dividend amount in Newly Issued Common shares on behalf of the participants. The number of Newly Issued Common Shares to be credited to each participant’s account will be determined by dividing the dollar amount of the Dividend by the NAV per Common share on the payment date; provided that, if the NAV is less or equal to 95% of the closing market value on the payment date, the dollar amount of the Dividend will be divided by 95% of the closing market price per Common share on the payment date. If, on the payment date for any Dividend, the NAV per Common share is greater than the closing market value plus estimated per share fees, the Plan Administrator will invest the Dividend amount in Common shares acquired on behalf of the participants in Open-Market Purchases. In the event of a market discount on the payment date for any Dividend, the Plan Administrator will have until the last business day before the next date on which the Common shares trade on an “ex-dividend” basis or 30 days after the payment date for such Dividend, whichever is sooner (the “Last Purchase Date”), to invest the Dividend amount in Common shares acquired in Open-Market Purchases. It is contemplated that the Fund will pay monthly income Dividends. Therefore, the period during which Open-Market Purchases can be made will exist only from the payment date of each Dividend through the date before the next “ex-dividend” date which typically will be approximately ten days. If, before the Plan Administrator has completed its Open-Market Purchases, the market price per Common share exceeds the NAV per Common shares, the average per Common share purchase price paid by the Plan
Administrator may exceed the NAV of the Common shares, resulting in the acquisition of fewer Common shares than if the Dividend had been paid in Newly Issued Common Shares on the Dividend payment date. Because of the foregoing difficulty with respect to Open-Market Purchases, the Plan provides that if the Plan Administrator is unable to invest the full Dividend amount in Open-Market Purchases during the purchase period or if the market discount shifts to a market premium during the purchase period, the Plan Administrator may cease making Open-Market Purchases and may invest the uninvested portion of the Dividend amount in Newly Issued Common Shares at the NAV per Common share at the close of business on the Last Purchase Date provided that, if the NAV per Common share is less than or equal to 95% of the then current market price per Common share; the dollar amount of the Dividend will be divided by 95% of the market price per Common share on the payment date.
The Plan Administrator maintains all shareholders’ accounts in the Plan and furnishes written confirmation of all transactions in the accounts, including information needed by shareholders for tax records. Common shares In the account of each Plan participant will be held by the Plan Administrator on behalf of the Plan participant, and each shareholder proxy will include those shares purchased or received pursuant to the Plan The Plan Administrator will forward all proxy solicitation materials to participants and vote proxies for shares held under the Plan in accordance with the instructions of the participants.
In the case of shareholders such as banks, brokers or nominees which hold shares for others who are the beneficial owners, the Plan Administrator will administer the Plan on the basis of the number of Common shares certified from time to time by the record shareholder’s name and held for the account of beneficial owners who participate in the Plan.
There will be no charges with respect to Common shares issued directly by the Fund as a result of dividends or capital gains distributions payable either in Common shares or in cash. The Plan Administrator’s fees for the handling of the reinvestment of dividends and distributions will be paid by the Fund. However, each participant will pay a per share fee incurred in connection with Open-Market Purchases. The reinvestment of Dividends will not relieve participants of any Federal, state or local income tax that may be payable (or required to be withheld) on such dividends. See “U.S. Federal Income Tax Matters.” Participants that request a sale of shares through the Plan Administrator are subject to a $2.50 sales fee and a $.15 per share sold fee. All per share fees include any brokerage commission the Plan Administrator is required to pay.
The Fund reserves the right to amend or terminate the Plan. There is no direct service charge to participants with regard to purchases in the Plan; however, the Fund reserves the right to amend the Plan to include a service charge payable by the participants.
All correspondence or questions concerning the Plan should be directed to the Plan Administrator, Computershare Trust Company, N.A., by telephone (855) 456-9683, through the internet at www.computershare.com/investor or in writing to P.O. Box 43078, Providence, Rhode Island 02940-3078.
| | |
| 32 | | MainStay DefinedTerm Municipal Opportunities Fund |
Proxy Results (Unaudited)
The Annual Meeting of Shareholders was held on September 26, 2013, to elect Class I Trustees for the Fund by shareholders of record as of July 15, 2013. Listed below are the results of this voting.
Please note that owners of Common shares and Preferred shares each voted in regards to the election of Trustee nominees Susan B. Kerley and Peter Meenan. Preferred shares owners also voted in regards to Trustee nominee John A. Weisser.
| | | | | | | | | | | | | | | | |
| | | Votes For | | | Votes Against | | | Abestentions | | | Total | |
Susan B. Kerley | | | 10,473,552 | | | | 101,813 | | | | 0 | | | | 10,575,365 | |
| | | | | | | | | | | | | | | | |
| | | Votes For | | | Votes Against | | | Abestentions | | | Total | |
Peter Meenan | | | 10,477,192 | | | | 98,173 | | | | 0 | | | | 10,575,365 | |
| | | | | | | | | | | | | | | | |
| | | Votes For | | | Votes Against | | | Abestentions | | | Total | |
John A. Weisser | | | 700 | | | | 0 | | | | 0 | | | | 700 | |
Federal Income Tax Information
(Unaudited)
The Fund is required under the Internal Revenue Code to advise shareholders in a written statement as to the federal tax status of dividends paid by the Fund during such fiscal years. Accordingly, the Fund paid $508,591 as a long term capital gain distribution.
For Federal individual income tax purposes, the Fund designates 75.70% of the ordinary income dividends paid during its fiscal year ended May 31, 2014, as attributable to interest income from Tax Exempt Municipal Bonds. Such dividends are currently exempt from Federal income taxes under section 103(a) of the Internal Revenue Code.
In February 2015, Common shareholders will receive an IRS Form 1090-DIV or substitute Form 1099, which will show the federal tax status of the distributions received by Common shareholders in calendar year 2014. The amounts that will be reported on such Form 1099-DIV or substitute Form 1099 will be the amounts you are to use on your federal income tax return and will differ from the amounts which have been reported for the Funds’ fiscal year ended May 31, 2014.
Proxy Voting Policies and Procedures and Proxy Voting Record
A description of the policies and procedures that New York Life Investments uses to vote proxies related to the Fund’s securities is available without charge, upon request, (i) by visiting the Fund’s website at mainstayinvestments.com; or (ii) on the Securities and Exchange Commission’s (“SEC”) website at www.sec.gov.
The Fund is required to file with the SEC its proxy voting record for the 12-month period ending June 30 on Form N-PX. The Fund’s most recent Form N-PX is available free of charge upon request (i) by calling 800-MAINSTAY (624-6782); (ii) by visiting the Fund’s website at mainstayinvestments.com; or (iii) on the SEC’s website at www.sec.gov.
Shareholder Reports and Quarterly Portfolio Disclosure
The Fund is required to file its complete schedule of portfolio holdings with the SEC for its first and third fiscal quarters on Form N-Q. The Fund’s Form N-Q is available without charge on the SEC’s website at www.sec.gov or by calling MainStay Investments at 800-MAINSTAY (624-6782). You also can obtain and review copies of Form N-Q by visiting the SEC’s Public Reference Room in Washington, DC (information on the operation of the Public Reference Room may be obtained by calling 1-800-SEC-0330).
Board of Trustees and Officers
Management
The Board oversees the Fund, the Manager, the Subadvisor and other service providers to the Fund. Information pertaining to the Trustees and officers is set forth below. The Board is divided into three classes: Class I, Class II and Class III. In connection with the organization of the Fund, each Trustee has been elected for one initial term, the length of which depends on the class, as more fully described in the first footnote to the table below. Subsequent to their initial election at an annual meeting called for the purpose of electing Trustees, the Trustees in
each class will be elected to serve for a term expiring at the third succeeding annual shareholder meeting subsequent to their election at an annual meeting, in each case until their respective successors are duly elected and qualified, as described below. The Retirement Policy provides that a Trustee shall tender his or her resignation by the end of the calendar year during which he or she reaches the age of 75. Officers serve a term of one year and are elected annually by the Trustees. The business address of each Trustee and officer listed below is 51 Madison Avenue, New York, New York 10010.
| | | | | | | | | | | | |
| | | | | Name and Date Of Birth | | Position Held
with the Fund Term of Office(1),
and Year First
Elected or Appointed | | Principal Occupation(s)
During Past Five Years | | Number of
Portfolios in
Fund Complex(3)
Overseen by
Trustee | | Other Directorships
Held by Trustee(4)(5) |
Interested Trustee | | | | John Y. Kim 9/24/60(2) | | Trustee, Class III (since 2011) | | Vice Chairman (since January 2014), Chief Investment Officer (since 2011), New York Life Insurance Company; President, Investments Group—New York Life Insurance Company (since 2012); Chairman of the Board of Managers and Chief Executive Officer, New York Life Investment Management Holdings LLC (since 2008); Chairman of the Board of Managers (since 2008) and Chief Executive Officer (2008 to 2013), New York Life Investment Management LLC; Member of the Board, MCF Capital Management LLC (since 2012), Private Advisors, L.L.C. (since 2010); MacKay Shields LLC and Madison Capital Funding LLC (since 2008); and Member of the Board of Managers, McMorgan and Company LLC and GoldPoint Partners (fka NYLCAP Manager LLC) (2008-2012) | | 79 | | Trustee, MainStay Funds Trust since 2008 (35 funds); Trustee, The MainStay Funds since 2008 (12 funds); Trustee, MainStay VP Funds Trust since 2008 (29 portfolios); Trustee, Private Advisors Alternative Strategies Master Fund since 2011; Trustee, Private Advisors Alternative Strategies Fund since 2011 |
| | |
| 34 | | MainStay DefinedTerm Municipal Opportunities Fund |
| | | | | | | | | | | | |
| | | | | Name and Date Of Birth | | Term of Office,
Position Held
and Length
of Service | | Principal Occupation(s)
During Past Five Years | | Number of
Portfolios in
Fund Complex(3)
Overseen by
Trustee | | Other Directorships
Held by Trustee(4)(5) |
Independent Trustees | | | | Susan B. Kerley 8/12/51 | | Trustee, Class I (since 2011) | | President, Strategic Management Advisors (since 1990) | | 79 | | Trustee, MainStay Funds Trust since 1990 (35 funds); Trustee, The MainStay Funds since 2007 (12 funds); Trustee, MainStay VP Funds Trust since 2007 (29 portfolios); Trustee, Legg Mason Partners Funds, Inc. since 1991 (54 portfolios); Trustee, Private Advisors Alternative Strategies Master Fund since 2011; Trustee, Private Advisors Alternative Strategies Fund since 2011 |
| | | | Alan R. Latshaw 3/27/51 | | Trustee and Audit Committee Financial Expert and Trustee, Class II (since 2011) | | Retired; Partner, Ernst & Young LLP (2002 to 2003); Partner, Arthur Andersen LLP (1989 to 2002); Consultant to the MainStay Funds Audit and Compliance Committee (2004 to 2006) | | 79 | | Trustee and Audit Committee Financial Expert, MainStay Funds Trust since 2007 (35 funds); Trustee and Audit Committee Financial Expert, The MainStay Funds since 2006 (12 funds); Trustee and Audit Committee Financial Expert, MainStay VP Funds Trust since 2007 (29 portfolios); Trustee, State Farm Associates Funds Trusts since 2005 (4 portfolios); Trustee, State Farm Mutual Fund Trust since 2005 (15 portfolios); Trustee, State Farm Variable Product Trust since 2005 (9 portfolios); Trustee and Audit Committee Financial Expert, Private Advisors Alternative Strategies Master Fund since 2011; Trustee and Audit Committee Financial Expert, Private Advisors Alternative Strategies Fund since 2011 |
| | | | Peter Meenan 12/5/41 | | Chairman (since 2013) and Trustee, Class I (since 2011) | | Retired; Independent Consultant; (2004-2013) President and Chief Executive Officer, Babson—United, Inc. (financial services firm) (2000 to 2004); Independent Consultant (1999 to 2000); Head of Global Funds, Citicorp (1995 to 1999) | | 79 | | Chairman since 2013 and Trustee since 2002, MainStay Funds Trust (35 funds); Chairman since 2013 and Trustee since 2007, The MainStay Funds (12 funds); Chairman since 2013 and Trustee since 2007, MainStay VP Funds Trust (29 Portfolios); Chairman since 2013 and Trustee since 2011, Private Advisors Alternative Strategies Master Fund; Chairman since 2013 and Trustee since 2011, Private Advisors Alternative Strategies Fund |
| | | | Richard H. Nolan, Jr. 11/16/46 | | Trustee, Class II (since 2011) | | Managing Director, ICC Capital Management; President—Shields/Alliance, Alliance Capital Management (1994 to 2004) | | 79 | | Trustee, MainStay Funds Trust since 2007 (35 funds); Trustee, The MainStay Funds since 2007 (12 funds); Trustee, MainStay VP Funds Trust since 2006 (29 portfolios); Trustee, Private Advisors Alternative Strategies Master Fund since 2011; Trustee, Private Advisors Alternative Strategies Fund since 2011 |
| | | | Richard S. Trutanic 2/13/52 | | Trustee, Class III (since 2011) | | Chairman and Chief Executive Officer, Somerset & Company (financial advisory firm) (since 2004); Managing Director, The Carlyle Group (private investment firm) (2002 to 2004); Senior Managing Director, Partner and Trustee, Groupe Arnault S.A. (private investment firm) (1999 to 2002) | | 79 | | Trustee, MainStay Funds Trust since 2007 (35 funds); Trustee, The MainStay Funds since 1994 (12 funds); Trustee, MainStay VP Funds Trust since 2007 (29 portfolios); Trustee, Private Advisors Alternative Strategies Master Fund since 2011; Trustee, Private Advisors Alternative Strategies Fund since 2011 |
| | | | | | | | | | | | |
| | | | | Name and Date Of Birth | | Term of Office,
Position Held
and Length
of Service | | Principal Occupation(s)
During Past Five Years | | Number of
Portfolios in
Fund Complex(3)
Overseen by
Trustee | | Other Directorships
Held by Trustee(4)(5) |
Independent Trustees | | | | Roman L. Weil 5/22/40 | | Audit Committee Financial Expert and Trustee, Class III (since 2011) | | President, Roman L. Weil Associates, Inc. (consulting firm) (since 1981); V. Duane Rath Professor Emeritus of Accounting, Chicago Booth School of Business, University of Chicago (since 2008); Visiting Professor, Johns Hopkins University (2013); Visiting Professor, University of California—San Diego (since 2012); Visiting Professor, Southern Methodist University (2011); Visiting Professor, NYU Stern School of Business, New York University (2011) | | 79 | | Trustee and Audit Committee Financial Expert, MainStay Funds Trust since 2007 (35 funds); Trustee and Audit Committee Financial Expert, The MainStay Funds since 2007 (12 funds); Trustee since 1994 and Audit Committee Financial Expert since 2003, MainStay VP Funds Trust (29 portfolios); Trustee and Audit Committee Financial Expert, Private Advisors Alternative Strategies Master Fund since 2011; Trustee and Audit Committee Financial Expert, Private Advisors Alternative Strategies Fund since 2011 |
| | | | John A. Weisser 10/22/41 | | Trustee, Class I (since 2011) | | Retired; Managing Director, Salomon Brothers, Inc. (1971 to 1995) | | 79 | | Trustee, MainStay Funds Trust since 2007 (35 funds); Trustee, The MainStay Funds since 2007 (12 funds); Trustee, MainStay VP Funds Trust since 1997 (29 portfolios); Trustee, Direxion Funds since 2007 (18 portfolios); Direxion Insurance Trust since 2007 (1 portfolio); Trustee, Direxion Shares ETF Trust since 2008 (52 portfolios); Trustee, Private Advisors Alternative Strategies Master Fund since 2011; Trustee, Private Advisors Alternative Strategies Fund since 2011 |
| (1) | After a Trustee’s initial term, each Trustee is expected to serve a three-year term concurrent with the class of Trustees in which he or she serves: |
| | • | | Class I Trustees serve an initial term until the first annual shareholder meeting. |
| | • | | Class II Trustees serve an initial term until the second annual shareholder meeting or special meeting held in lieu of the annual meeting subsequent to their initial election. |
| | • | | Class III Trustees serve an initial term until the third annual shareholder meeting or special meeting held in lieu of the annual meeting subsequent to their initial election. |
| (2) | Trustee considered to be an “interested person” of the Master and Feeder Funds within the meaning of the 1940 Act because of his affiliation with New York Life Insurance Company, New York Life Investment Management LLC, and MacKay Shields LLC, as described in detail above in the column entitled “Principal Occupation(s) During Past Five Years.” |
| (3) | The fund complex consists of the Private Advisors Alternative Strategies Fund, Private Advisors Alternative Strategies Master Fund, MainStay DefinedTerm Municipal Opportunities Fund and series of MainStay Funds Trust, The MainStay Funds and MainStay VP Funds Trust (“MainStay Group of Funds”). |
| (4) | Includes prior services as a Director/Trustee of certain predecessor entities to MainStay Funds Trust. |
| (5) | Includes prior services as a Director of MainStay VP Funds Trust’s predecessor, MainStay VP Series Fund, Inc., a Maryland corporation. |
| | |
| 36 | | MainStay DefinedTerm Municipal Opportunities Fund |
| | | | | | | | | | |
| | | | | Name and
Date of Birth | | Position with Funds | | Year First
Elected or
Appointed | | Principal Occupation(s) During Past Five Years** |
Officers (Who are not Trustees)* | | | | Jack R. Benintende 5/12/64 | | Treasurer and Principal Financial and Accounting Officer | | (since 2011) | | Managing Director, New York Life Investment Management LLC (since 2007); Treasurer and Principal Financial and Accounting Officer, Private Advisors Alternative Strategies Master Fund and Private Advisors Alternative Strategies Fund (since 2011), MainStay Funds Trust (since 2009), and The MainStay Funds (since 2007); and Assistant Treasurer, New York Life Investment Management Holdings LLC (2008 to 2012) |
| | | | Jeffrey A. Engelsman 9/28/67 | | Vice President and Chief Compliance Officer | | (since 2011) | | Managing Director, Compliance, New York Life Investment Management LLC (since 2009), Vice President and Chief Compliance Officer, MainStay Funds Trust , MainStay VP Funds Trust, and The MainStay Funds (since 2009), Private Advisors Alternative Strategies Master Fund and Private Advisors Alternative Strategies Fund (since 2011) |
| | | | Stephen P. Fisher 2/22/59 | | President | | (since 2011) | | Chairman and Chief Executive Officer (since January 2014), President and Chief Operating Officer (2008 to 2013), NYLIFE Distributors LLC; Senior Managing Director (since 2012) and Chairman of the Board (since 2008), NYLIM Service Company LLC; Senior Managing Director (since 2005) and Co-President (since January 2014), New York Life Investment Management LLC; President, Private Advisors Alternative Strategies Master Fund and Private Advisors Alternative Strategies Fund (since 2011), MainStay Funds Trust (since 2009) and The MainStay Funds (since 2007) |
| | | | J. Kevin Gao 10/13/67 | | Secretary and Chief Legal Officer | | (since 2011) | | Managing Director and Associate General Counsel, New York Life Investment Management LLC (since 2010); Secretary and Chief Legal Officer, MainStay Funds Trust, MainStay VP Funds Trust and The MainStay Funds (since 2010), and Private Advisors Alternative Strategies Master Fund and Private Advisors Alternative Strategies Fund (since 2011); Director and Counsel, Credit Suisse; Chief Legal Officer and Secretary, Credit Suisse Asset Management LLC and Credit Suisse Funds (2003-2010) |
| | | | Scott T. Harrington 2/8/59 | | Vice President— Administration | | (since 2011) | | Director, New York Life Investment Management LLC (including predecessor advisory organizations) (since 2000); Member of the Board of Directors, New York Life Trust Company (since 2009); Vice President—Administration, MainStay VP Funds Trust, The MainStay Funds and MainStay Funds Trust (since 2005), and Private Advisors Alternative Strategies Master Fund and Private Advisors Alternative Strategies Fund (since 2011) |
| | * | The Officers listed above are considered to be “interested persons” of the Fund within the 1940 Act because of their affiliation with the Fund, New York Life Insurance Company and New York Life Investments as described in detail in the column captioned “Principal Occupation(s) During Past Five Years.” |
| | ** | Terms of service for MainStay VP Funds Trust includes services as a Director of MainStay VP Funds Trust’s predecessor, MainStay VP Series Fund, Inc., a Maryland corporation. |
This page intentionally left blank
This page intentionally left blank
Manager
New York Life Investment Management LLC
New York, New York
Subadvisor
MacKay Shields LLC1
New York, New York
Legal Counsel
Dechert LLP
Independent Registered Public Accounting Firm
PricewaterhouseCoopers LLP
Transfer, Dividend Disbursing and Shareholder Servicing Agent
Computershare Trust Company, N.A.
P.O. Box 43078
Providence, Rhode Island, 02940-3078
(855) 456-9683
mainstayinvestments.com/mmd
1. An affiliate of New York Life Investment Management LLC.
MainStay Investments® is a registered service mark and name under which New York Life Investment Management LLC does business. MainStay Investments, an indirect subsidiary of New York Life Insurance Company, New York, NY 10010, provides investment advisory products and services.
| | | | | | | | |
| Not FDIC/NCUA Insured | | Not a Deposit | | May Lose Value | | No Bank Guarantee | | Not Insured by Any Government Agency |
| | | | |
| 1610899 MS207-14 | | | MSMHI11-07/14 | |
Item 2. Code of Ethics.
As of the end of the period covered by this report, the Registrant has adopted a code of ethics (the “Code”) that applies to the Registrant’s principal executive officer (“PEO”) and principal financial officer (“PFO”). A copy of the Code is filed herewith. The Registrant did not make any amendments to the Code during the period covered by this report. The Registrant did not grant any waivers, including implicit waivers, from any provisions of the Code to the PEO or PFO during the period covered by this report.
Item 3. Audit Committee Financial Experts.
The Board of Trustees (“Board”) has determined that the Registrant has two audit committee financial experts serving on its Audit Committee. The Audit Committee financial experts are Alan R. Latshaw and Roman L. Weil. Messrs. Latshaw and Weil are “independent” as defined by Item 3 of Form N-CSR.
Item 4. Principal Accountant Fees and Services.
The aggregate fees billed for the fiscal year ended May 31, 2014 for professional services rendered by PricewaterhouseCoopers LLP (“PwC”) for the audit of the Registrant’s annual financial statements or services that are normally provided by PwC in connection with statutory and regulatory filings or engagements for that fiscal year were $52,000.
The aggregate fees billed for the fiscal year ended May 31, 2013 for professional services rendered by PwC for the audit of the Registrant’s annual financial statements or services that are normally provided by PwC in connection with statutory and regulatory filings or engagements for that fiscal year were $50,000.
The aggregate fees billed for assurance and related services by PwC that are reasonably related to the performance of the audit of the Registrant’s financial statements and are not reported under paragraph (a) of this Item were: (i) $0 for the fiscal year ended May 31, 2014, and (ii) $0 for the fiscal year ended May 31, 2013.
The aggregate fees billed for professional services rendered by PwC for tax compliance, tax advice, and tax planning were: (i) $3,000 during the fiscal year ended May 31, 2014, and (ii) $7,300 during the fiscal year ended May 31, 2013. These services primarily included preparation of federal, state and local income tax returns and excise tax returns, as well as services relating to excise tax distribution requirements.
The aggregate fees billed for products and services provided by PwC, other than the services reported in paragraphs (a) through (c) of this Item were: (i) $0 during the fiscal year ended May 31, 2014, and (ii) $0 during the fiscal year ended May 31, 2013.
| | |
| (e) | | Pre-Approval Policies and Procedures |
| | (1) | The Registrant’s Audit Committee has adopted pre-approval policies and procedures (the “Procedures”) to govern the Committee’s pre-approval of (i) all audit services and permissible non-audit services to be provided to the Registrant by its independent accountant, and (ii) all permissible non-audit services to be provided by such independent accountant to the Registrant’s investment adviser and to any entity controlling, controlled by or under common control with the investment adviser that provides ongoing services to the Registrant (collectively, “Service Affiliates”) if the services directly relate to the Registrant’s operations and financial reporting. In accordance with the Procedures, the Audit Committee is responsible for the engagement of the independent accountant to certify the Registrant’s financial statements for each fiscal year. With respect to the pre-approval of non-audit services provided to the Registrant and its Service Affiliates, the Procedures provide that the Audit Committee may annually pre-approve a list of the types of services that may be provided to the Registrant or its Service Affiliates, or the Audit Committee may pre-approve such services on a project-by-project basis as they arise. Unless a type of service has received general pre-approval, it will require specific pre-approval by the Audit Committee if it is to be provided by the independent accountant. The Procedures also permit the Audit Committee to delegate authority to one or more of its members to pre-approve any proposed non-audit services that have not been previously pre-approved by the Audit Committee, subject to the ratification by the full Audit Committee no later than its next scheduled meeting. To date, the Audit Committee has not delegated such authority. |
| | (2) | With respect to the services described in paragraphs (b) through (d) of this Item 4, no amount was approved by the Audit Committee pursuant to paragraph (c)(7)(i)(C) of Rule 2-01 of Regulation S-X. |
(f) There were no hours expended on PwC’s engagement to audit the Registrant’s financial statements for the most recent fiscal year was attributable to work performed by persons other than PwC’s full-time, permanent employees.
(g) All non-audit fees billed by PwC for services rendered to the Registrant for the fiscal year ended May 31, 2014 are disclosed in 4(b)-(d) above.
The aggregate non-audit fees billed by PwC for services rendered to the Registrant’s investment adviser (not including any subadviser whose role is primarily portfolio management and is subcontracted with or overseen by another investment adviser), and any entity controlling, controlled by, or under common control with the adviser that provides ongoing services to the Registrant were approximately: (i) $2.7 million for the fiscal year ended May 31, 2014, and (ii) $2.4 million for the fiscal year ended May 31, 2013.
(h) The Registrant’s Audit Committee has determined that the non-audit services rendered by PwC for the fiscal year ended May 31, 2014 to the Registrant’s investment adviser and any entity controlling, controlled by, or under common control with the Registrant’s investment adviser that provides ongoing services to the Registrant that were not required to be pre-approved by the Audit Committee because they did not relate directly to the operations and financial reporting of the Registrant were compatible with maintaining the respective independence of PwC during the relevant time period.
Item 5. Audit Committee of Listed Registrants
(a) The Board has a separately-designated Audit Committee established in accordance with Section 3(a)(58)(A) of the Securities Exchange Act (“Exchange Act”) (15 U.S.C. 78c(a)(58)(A)). The members of the Audit Committee are Alan R. Latshaw, Roman L. Weil and John A. Weisser, Jr.
(b) Not applicable.
Item 6. Schedule of Investments
(a) The Schedule of Investments is included as part of Item 1 of this report.
(b) Not applicable.
Item 7. Disclosure of Proxy Voting Policies and Procedures for Closed-End Management Investment
Companies.
It is the policy of the Registrant that proxies received by the Registrant are voted in the best interests of the Registrant’s shareholders. The Board has adopted Proxy Voting Policies and Procedures for the Registrant that delegate all responsibility for voting proxies received relating to the Registrant’s portfolio securities to New York Life Investment Management LLC (“New York Life Investments” or “Manager”), subject to the oversight of the Board. The Manager has adopted its own Proxy Voting Policies and Procedures in order to assure that proxies voted on behalf of the Registrant are voted in the best interests of the Registrant and its shareholders. The Manager has delegated proxy voting authority to MacKay Shields LLC (“MacKay Shields” or “Sub-Advisor”); provided that, as specified in the Manager’s Proxy Voting Policies and Procedures, the Sub-Advisor either (1) follows the Manager’s Proxy Voting Policy and the Registrant’s Procedures; or (2) has demonstrated that its proxy voting policies and procedures are consistent with the Manager’s Proxy Voting Policies and Procedures or are otherwise implemented in the best interests of the Manager’s clients and appear to comply with governing regulations. The Registrant may revoke all or part of this delegation (to the Manager and/or Sub-Advisor as applicable) at any time by a vote of the Board.
Conflicts of Interest. When a proxy presents a conflict of interest, such as when the Manager has actual knowledge of a material business arrangement between a particular proxy issuer or closely affiliated entity and the Manager or an affiliated entity of the Manager, both the Registrant’s and the Manager’s proxy voting policies and procedures mandate that the Manager follow an alternative voting procedure rather than voting proxies in its sole discretion. In these cases, the Manager may: (1) cause the proxies to be voted in accordance with the recommendations of an independent service provider; (2) notify the Board or a designated committee of the Manager, or a representative of either, and seek a waiver of the conflict to permit the Manager to vote the proxies as it deems appropriate and in the best interest of Registrant shareholders, under its usual policy; or (3) forward the proxies to the Board, or a designated committee of the Manager, so that the Board or the committee may vote the proxies itself. In the case of proxies received in connection with a fund of funds structure, whereby the Manager, on behalf of the Registrant, receives proxies in its capacity as a shareholder in an underlying fund, the Manager may vote in accordance with the recommendations of an independent service provider who has been retained to assist in voting proxies or echo the vote of the other shareholders in those underlying funds. As part of its delegation of proxy voting responsibility to the Manager, the Registrant also delegated to the Manager responsibility for resolving conflicts of interest based on the use of acceptable alternative voting procedures, as described above. If the Manager chooses to override a voting recommendation made by Institutional Shareholder Services Inc. (‘‘ISS’’), the Manager’s compliance department will review the override prior to voting to determine the existence of any potential conflicts of interest. If the compliance department determines a material conflict may exist, the issue is referred to the Manager’s Proxy Voting Committee who will consider the facts and circumstances and determine whether to allow the override or take other action, such as the alternative voting procedures just mentioned.
Item 8. Portfolio Managers of Closed-End Management Investment Companies.
(a)(1) The Registrant’s portfolio is managed on a team basis. As of July 30, 2014, the following persons are primarily responsible for the day-to-day management of the registrant’s portfolio.
Robert DiMella, CFA. Mr. DiMella is an Executive Managing Director of MacKay Shields. He has managed the Registrant’s portfolio since inception. Mr. DiMella has also managed the MainStay Tax Free Bond Fund since 2009, the MainStay High Yield Municipal Fund since 2010, the MainStay New York Tax Free Opportunities Fund since 2012 and the MainStay California Tax Free Opportunities Fund since 2013. Previously, he co-founded Mariner Municipal Managers LLC (2007 to 2009). Prior to BlackRock’s merger with Merrill Lynch Investment Managers (“MLIM”), he served as a Senior Portfolio Manager and Managing Director of the Municipal Products Group. Mr. DiMella earned his Master’s degree at Rutgers University Business School and a Bachelors Degree at the University of Connecticut. He is a Chartered Financial Analyst® (“CFA®”) charterholder.
John Loffredo, CFA. Mr. Loffredo is an Executive Managing Director of MacKay Shields. He has managed the Registrant’s portfolio since inception. Mr. Loffredo has also managed the MainStay Tax Free Bond Fund since 2009, the MainStay High Yield Municipal Bond Fund since 2010, the MainStay New York Tax Free Opportunities Fund since 2012 and the MainStay California Tax Free Opportunities Fund since 2013. He has been a municipal portfolio manager and/or municipal analyst on Wall Street since 1990, with a broad range of portfolio management and analytic experience in the municipal markets. He previously co-founded Mariner Municipal Managers LLC (2007 to 2009). Prior to BlackRock’s merger with MLIM, he served as Chief Investment Officer of the Municipal Products Group of MLIM. Mr. Loffredo graduated cum laude with an MBA from Utah State University where he was a Harry S. Truman Scholar. He also has a Certificate of Public Management from Boston University. He is a CFA® charterholder.
Michael Petty. Mr. Petty is a Senior Managing Director and portfolio manager for MacKay Shields. He has managed the Registrant’s portfolio since inception. Mr. Petty has also managed the MainStay High Yield Municipal Bond Fund since 2010, the MainStay Tax Free Bond Fund since 2011, the MainStay New York Tax Free Opportunities Fund since 2012 and the MainStay California Tax Free Opportunities Fund since 2013. Prior to joining MacKay Shields, Mr. Petty was a portfolio manager with Mariner Municipal Managers LLC during 2009. From 1997 through 2009, he was a Senior Portfolio Manager at Dreyfus Corporation, overseeing $2.1 billion in assets. Mr. Petty graduated from Hobart College with a BS in Mathematics and Economics.
Scott Sprauer. Mr. Sprauer is a Managing Director. He joined MacKay Shields in 2009 as a Portfolio Manager in the Municipal Bond Division. He has managed the Registrant’s portfolio since inception. He has also managed the MainStay New York Tax Free Opportunities Fund since 2012, the MainStay California Tax Free Opportunities Fund since 2013 and the MainStay High Yield Municipal Bond Fund and MainStay Tax Free Bond Fund since February 2014. Prior to joining MacKay Shields, he was the Head Trader, Fixed Income at Financial Guaranty Insurance Company from 2006 to 2009. He has a BSBA from Villanova University, and has been in the investment management industry since 1991.
David Dowden. Mr. Dowden is a Managing Director. He joined MacKay Shields in 2009 as a Portfolio Manager in the Municipal Bond Division. He has managed the Registrant’s portfolio since inception. He has managed the MainStay New York Tax Free Opportunities Fund since 2012, the MainStay California Tax Free Opportunities Fund since 2013 and the MainStay High Yield Municipal Bond Fund and MainStay Tax Free Bond Fund since February 2014. Prior to joining MacKay Shields, he was the Chief Investment Officer at Financial Guaranty Insurance
Company from 2006 to 2009. He has a BA from Brown University and an MBA from Columbia University. He has been in the investment management industry since 1989.
(a)(2) Other Accounts Managed by Portfolio Managers or Management Team Member and Potential Conflicts of Interest as of May 31, 2014.
| | | | | | | | | | | | |
| | | NUMBER OF OTHER ACCOUNTS MANAGED AND
ASSETS BY ACCOUNT TYPE | | NUMBER OF ACCOUNTS AND ASSETS
MANAGED FOR WHICH THE ADVISORY FEE
IS BASED ON PERFORMANCE |
PORTFOLIO MANAGER | | REGISTERED
INVESTMENT
COMPANY | | OTHER
POOLED
INVESTMENT
VEHICLES | | OTHER
ACCOUNTS | | REGISTERED
INVESTMENT
COMPANY | | OTHER
POOLED
INVESTMENT
VEHICLES | | OTHER
ACCOUNTS |
Robert DiMella | | 5 RICs
$2,968,858,497 | | 3 Accounts
$1,577,131,654 | | 27 Accounts
$3,206,656,971 | | 0 | | 1 Account
$92,062,303 | | 0 |
David Dowden | | 5 RICs
$2,968,858,497 | | 3 Accounts
$1,577,131,654 | | 27 Accounts
$3,206,656,971 | | 0 | | 1 Account
$92,062,303 | | 0 |
John Loffredo | | 5 RICs
$2,968,858,497 | | 3 Accounts
$1,577,131,654 | | 27 Accounts
$3,206,656,971 | | 0 | | 1 Account
$92,062,303 | | 0 |
Michael Petty | | 5 RICs
$2,968,858,497 | | 3 Accounts
$1,577,131,654 | | 27 Accounts
$3,206,656,971 | | 0 | | 1 Account
$92,062,303 | | 0 |
Scott Sprauer | | 5 RICs
$2,968,858,497 | | 3 Accounts
$1,577,131,654 | | 27 Accounts
$3,206,656,971 | | 0 | | 1 Account
$92,062,303 | | 0 |
Potential Conflicts of Interest
Certain portfolio managers of MacKay Shields who are responsible for managing certain institutional accounts share a performance fee based on the performance of the account. A portfolio manager who makes investment decisions with respect to other accounts, including accounts in which the portfolio manager is personally invested, may be presented with one or more of the following potential conflicts:
| | — | | The management of multiple funds and/or accounts may result in the portfolio manager devoting unequal time and attention to the management of each fund and/or account; |
| | — | | If a portfolio manager identifies a limited investment opportunity which may be suitable for more than one fund or account managed by the portfolio manager, a fund may not be able to take full advantage of that opportunity due to an allocation of filled purchase or sale orders across all eligible funds and accounts managed by the portfolio manager; |
| | — | | A portfolio manager may take a position for a fund or account in a security that is contrary to the position held in the same security by other funds or accounts managed by the portfolio manager. For example, the portfolio manager may sell certain securities short for one fund or account while other funds or accounts managed by the portfolio manager simultaneously hold the same or related securities long; and |
| | — | | An apparent conflict may arise where an adviser receives higher fees from certain funds or accounts that it manages than from others, or where an adviser receives a performance-based fee from certain funds or accounts that it manages and not from others. In these cases, there may be an incentive for a portfolio manager to favor the higher and/or performance-based fee funds or accounts over other funds or accounts managed by the portfolio manager. |
To address potential conflicts of interest, the Manager and the Sub-Advisor have adopted various policies and procedures to provide for equitable treatment of trading activity and to ensure that investment opportunities are allocated in a fair and appropriate manner. In addition, New York Life Investments has adopted a Code of Ethics that recognizes the Manager’s obligation to treat all of its
clients, including the Registrant, fairly and equitably. These policies, procedures and the Code of Ethics are designed to restrict the portfolio manager from favoring one client over another. There is no guarantee that the policies, procedures and the Code of Ethics will be successful in every instance.
(a)(3) Portfolio Managers or Management Team Members’ Compensation Structure
MacKay Shields establishes salaries at competitive levels, verified through industry surveys, to attract and maintain the best professional talent. In addition, an incentive bonus equal to a significant percentage of the firm’s pre-tax profits is paid annually to the firm’s employees based upon an individual’s performance and the profitability of the firm. The bonus generally represents a sizable amount relative to the base salary, and when considered with the base salary, results in a highly attractive level of total cash compensation for the firm’s professional employees. Certain other accounts at MacKay Shields pay the firm a fee based on performance, a portion of which forms a part of the bonus pool for all employees. Every MacKay Shields employee participates in the bonus pool. This approach instills a strong sense of commitment on the part of each employee towards the overall success of the firm. There is no difference between the method used in determining a portfolio manager’s compensation with respect to the Registrant and other accounts. MacKay Shields has adopted a long-term incentive plan, which enhances the firm’s ability to attract, retain, motivate and reward key executives. Awards can be made annually and vesting takes place over a period of several subsequent years.
(a)(4) Disclosure of Securities Ownership
The following table states, as of May 31, 2014, the dollar range of fund securities beneficially owned by each Portfolio Manager in the Registrant ($1-$10,000, $10,001-$50,000, $50,001-$100,000, $100,001- $500,000, $500,001-$1,000,000, or over $1,000,000).
| | | | |
PORTFOLIO MANAGER | | RANGE OF OWNERSHIP | | |
Robert DiMella | | $100,001 - $500,000 | | |
David Dowden | | $50,001 - $100,000 | | |
John Loffredo | | $100,001 - $500,000 | | |
Michael Petty | | $10,001 - $50,000 | | |
Scott Sprauer | | $10,001 - $50,000 | | |
(b) Changes in Portfolio Management
There have been no changes to the portfolio management team since inception on June 26, 2012.
Item 9. Purchases of Equity Securities by Closed-End Management Investment Company and Affiliated Purchasers.
Not applicable.
Item 10. Submission of Matters to a Vote of Security Holders.
Since the Registrant’s last response to this Item, there have been no material changes to the procedures by which shareholders may recommend nominees to the Board.
Item 11. Controls and Procedures.
(a) Based on an evaluation of the Registrant’s Disclosure Controls and Procedures (as defined in Rule 30a-3(c) under the Investment Company Act of 1940, as amended (“1940 Act”) and Rules 13a-15(b) or 15d-15(b) under the Exchange Act) (“Disclosure Controls”), as of a date within 90 days prior to the filing date (“Filing Date”) of this Form N-CSR (“Report”), the Registrant’s principal executive officer and principal financial officer have concluded that the Disclosure Controls are reasonably designed to ensure that information required to be disclosed by the Registrant in the Report is recorded, processed, summarized and reported by the Filing Date, including ensuring that information required to be disclosed in the Report is accumulated and communicated to the Registrant’s management, including the Registrant’s principal executive officer and principal financial officer, as appropriate to allow timely decisions regarding required disclosure.
(b) There were no changes in the Registrant’s internal control over financial reporting (as defined in Rule 30a-3(d)) under the 1940 Act that occurred during the second fiscal quarter of the period covered by this report that has materially affected, or is reasonably likely to materially affect, the Registrant’s internal control over financial reporting.
Item 12. Exhibits.
(a)(1) Code of Ethics
(a)(2) Certifications of principal executive officer and principal financial officer as required by Rule 30a-2 under the 1940 Act.
(a)(3) Not applicable
(b) Certifications of principal executive officer and principal financial officer as required by Section 906 of the Sarbanes-Oxley Act of 2002.
SIGNATURES
Pursuant to the requirements of the Securities Exchange Act of 1934 and the Investment Company Act of 1940, the Registrant has duly caused this Report to be signed on its behalf by the undersigned, thereunto duly authorized.
MAINSTAY DEFINEDTERM MUNICIPAL OPPORTUNITIES FUND
| | |
| By: | | /s/ Stephen P. Fisher |
| | Stephen P. Fisher |
| | President and Principal Executive Officer |
Date: August 7, 2014
Pursuant to the requirements of the Securities Exchange Act of 1934 and the Investment Company Act of 1940, this Report has been signed below by the following persons on behalf of the Registrant and in the capacities and on the dates indicated.
| | |
| By: | | /s/ Stephen P. Fisher |
| | Stephen P. Fisher |
| | President and Principal Executive Officer |
Date: August 7, 2014
| | |
| By: | | /s/ Jack R. Benintende |
| | Jack R. Benintende |
| | Treasurer and Principal Financial and Accounting Officer |
Date: August 7, 2014
EXHIBIT INDEX
| | |
| (a)(1) | | Code of Ethics |
| |
| (a)(2) | | Certifications of principal executive officer and principal financial officer as required by Rule 30a-2 under the Investment Company Act of 1940. |
| |
| (b) | | Certification of principal executive officer and principal financial officer as required by Section 906 of the Sarbanes-Oxley Act of 2002. |