 |
 Notices Please read the following notices before reviewing the information contained herein: The information in this document has been prepared solely for informational purposes and does not constitute an offer to sell or the solicitation of an offer to purchase any securities from any entities described herein. Any such offer will be made solely by means of the prospectus contained in the registration statement (collectively, the “Registration Statement”) filed by HomeStreet Inc. (the “Company”) with the Securities and Exchange Commission (the “SEC”). The information contained herein may not be used in connection with an offer or solicitation by anyone in any jurisdiction in which such offer or solicitation is not permitted by law or in which the person making the offer or solicitation is not qualified to do so or to any person to whom it is unlawful to make such offer or solicitation. All information herein is subject to revision. No representation or warranty can be given with respect to the accuracy or completeness of the information herein, or with respect to the terms of any future offer of securities conforming to the terms hereof. Any information herein shall be deemed superseded, amended, and supplemented in its entirety by the Registration Statement (and any free writing prospectus relating thereto) and any decision to invest in the securities offered thereby should be made solely in reliance upon the Registration Statement (and any free writing prospectus relating thereto). Unless, and until, this document has been publicly disclosed by the Company, this document is confidential and is intended solely for the information of the person to whom it has been presented and it may not be retained, reproduced or distributed, in whole or in part, by any means (including electronically), without the prior written consent of the Company. Nothing contained herein should be construed as tax, accounting or legal advice. Neither the Company nor any of its affiliates or representatives accept any responsibility for the tax treatment of any investment in the securities of the Company. You (and each of your employees, representatives or other agents) may disclose to any and all persons, without limitation of any kind, this tax treatment and tax structure of the transactions contemplated by these materials and all materials of any kind (including opinions or other tax analyses) that are provided to you relating to such tax treatment and structure. For this purpose, the tax treatment of a transaction is the purported or claimed U.S. federal income tax treatment of the transaction and the tax structure of a transaction is any fact that may be relevant to understanding the purported or claimed U.S. federal income tax treatment of the transaction. INVESTING IS SPECULATIVE AND INVOLVES RISK OF LOSS. YOU SHOULD REVIEW CAREFULLY THE REGISTRATION STATEMENT, INCLUDING THE DESCRIPTION OF THE RISKS AND OTHER TERMS BEFORE MAKING A DECISION TO INVEST. The Company has filed a Registration Statement (including a prospectus) with the SEC for the offering to which this presentation relates. Before you invest, you should read the prospectus contained in the Registration Statement and other documents the Company has filed with the SEC for more complete information about the Company and the offering. You may get these documents for free by visiting EDGAR on the SEC website at www.sec.gov. Alternatively, the Company, any underwriter or any dealer participating in the offering will arrange to send you the prospectus contained in the Registration Statement if you request it by calling FBR Capital Markets & Co. toll free at (800) 846 – 5050. The information contained herein contains forward-looking statements. These forward-looking statements are based on the Company’s current expectations, beliefs, projections, future plans and strategies, anticipated events or trends and similar expressions concerning matters that are not historical facts, as well as a number of assumptions concerning future events. These statements are subject to risks, uncertainties, assumptions and other important factors set forth in the Registration Statement, many of which are outside the Company’s control, that could cause actual results to differ materially from the results discussed in the forward-looking statements. Actual results may vary materially from those expressed or implied, and there can be no assurance that estimated returns or projections will be realized or that actual returns will not be materially different than estimated herein. Accordingly, you are cautioned not to place undue reliance on such forward-looking statements. You should conduct your own analysis, using such assumptions as you deem appropriate, and should fully consider other available information, including the information described under “Forward-Looking Statements” and “Risk Factors” in the Registration Statement, in making a decision to invest. Past performance is not necessarily indicative of future results. All forward-looking statements are based on information available to the Company as of the date hereof and the Company assumes no obligation to, and expressly disclaims any obligation to, update or revise any forward-looking statements, whether as a result of new information, future events or otherwise. To supplement the Company’s financial statements presented in accordance with generally accepted accounting principles (“GAAP”), the Company uses non-GAAP measures of certain components of financial performance. These non-GAAP measures are provided to enhance investors’ overall understanding of the Company’s current financial performance and its prospects for the future. Specifically, the Company believes the non-GAAP results provide useful information to both management and investors. These measures should be considered in addition to results prepared in accordance with GAAP, but should not be considered a substitute for, or superior to, GAAP results. |
 Offering Summary (1) Includes proceeds from side-by-side private placement, but excludes over-allotment shares. (2) Assumes offering price of $44.00 per share (midpoint of the offering range of $43.00 to $45.00 per share). Of these shares, 1,250,000 shares are offered in the public offering and 113,636 in the private placement. Excludes 36,681 shares subject to restricted stock awards to be issued to certain employees and our non-employee directors upon the closing of this offering. 3 Issuer HomeStreet Inc. Ticker NASDAQ: HMST Offering Type Initial public offering of common stock Offering Size (1) $60,000,000 Over-allotment Option 15% Total Shares Offered (2) 1,363,636 Pro Forma Shares (2) 2,714,510 Offering Range $43.00 - $45.00 per share Use of Proceeds Increase capital levels Fund growth in commercial banking activities General corporate purposes Underwriter FBR Capital Markets |
 Recent Developments Q4 2011 and January 2012 Financial Results Earned $7.0 million in Q4 and $8.2 million in January 2012 driven by high mortgage banking revenue – Q4 write-offs of $2.4 million of IPO-related costs – Q4 adjusted ROAE of 45.1% (1) – January 2012 NIM of 2.50% increased 12 bps since Q3 2011 Increased single family closed loan production by ~33% in Q4 to $624 million; January 2012 application locks of $267 million and closed loan production of $162 million – Low rates and market share gains - deconsolidation from large originators Tangible book value increased 20% from $79.9 million in Q3 to $95.6 million (2) Dramatic Credit Improvement Q3 2011 through January 2012 NPAs down ~30% to $111 million – NPA/Assets declined to 4.9% OREO down 45% to $36 million Classified assets decreased 15% to $191 million 4 Source: S-1 filing and HomeStreet Inc. (1) Net income of $7.0 million adjusted for $2.4 million of IPO related expenses (2) Represents tangible book as of January 31, 2012 . See Appendix for reconciliation of non-GAAP financial measures. |
 Recent Developments Regulatory Update Management expects the Tier 1 Leverage ratio requirement to be 8.5% Pro forma for this offering, the Bank’s capital levels will meet or exceed the anticipated regulatory target Upon completion of the offering and subject to successful outcome of the FDIC’s on-site visit in February / March, we expect replacement of the C&D order with another form of enforcement agreement MetLife Mortgage Origination Team Addition Hired a team of 140+ mortgage originators in the Pacific Northwest from MetLife – 100% retail This team was responsible for $1.2 billion of originations in 2011 5 |
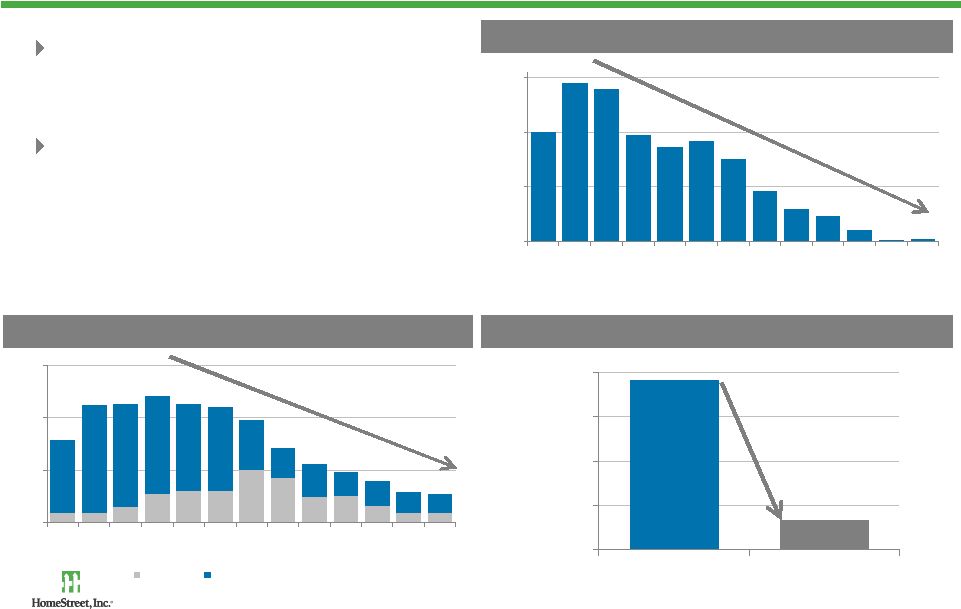
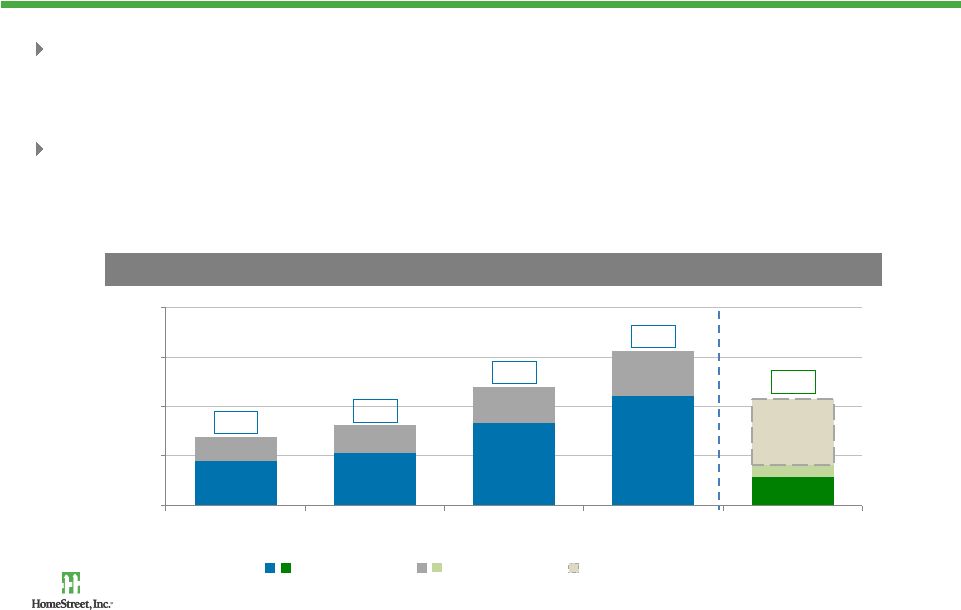 $177 $210 $336 $444 $114 $99 $114 $142 $180 $48 $267 $276 $324 $478 $624 $429 $0 $200 $400 $600 $800 Q1 11 Q2 11 Q3 11 Q4 11 Jan 12 Highly Profitable Mortgage Origination Franchise High loan origination volume in Q4 and continuing in January 2012 – Driven by low interest rates and HARP 2.0 230 retail loan producers (1) including the addition of 70 loan producers in February from MetLife; no brokered originations Source: HomeStreet Inc. (1) Includes Windermere Real Estate Services. (2) Represents single family held for sale production. 6 Single Family Closed Loan Production (2) ($ mm) HomeStreet Windermere January Application Lock Volume |
 $9.3 $25.7 $12.6 $8.9 $0 $10 $20 $30 Q2 11 Q3 11 Q4 11 Jan 12 Significant increase in noninterest income driven by higher originations and gain on sale margins Operating efficiency ratio improved to 46.3% in January 2012 from its peak of 156.4% (1) $1.3 $15.3 $7.0 $8.2 $0 $4 $8 $12 $16 Q2 11 Q3 11 Q4 11 Jan 12 Third Consecutive Quarter of Profitability Source: S-1 filing and HomeStreet Inc. (1) Operating efficiency peak as of December 31, 2009. See Appendix for reconciliation of non-GAAP financial measures. (2) Calculated as pre-tax earnings + OREO expense + IPO-related expense + provision expense. See Appendix for reconciliation of non-GAAP financial measures. 7 Pre-Tax Pre-Provision (2) ($ millions) Net Income ($ millions) |
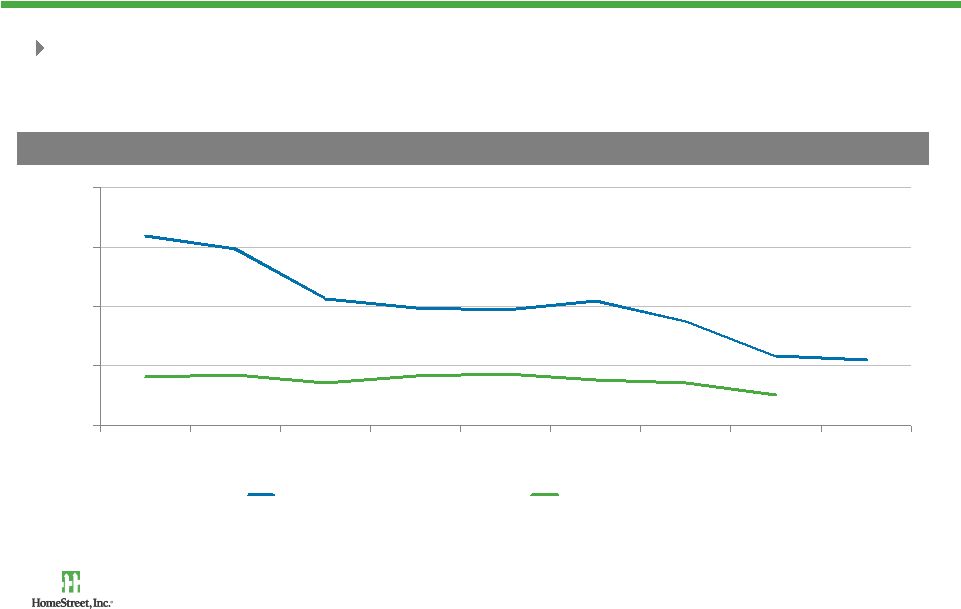
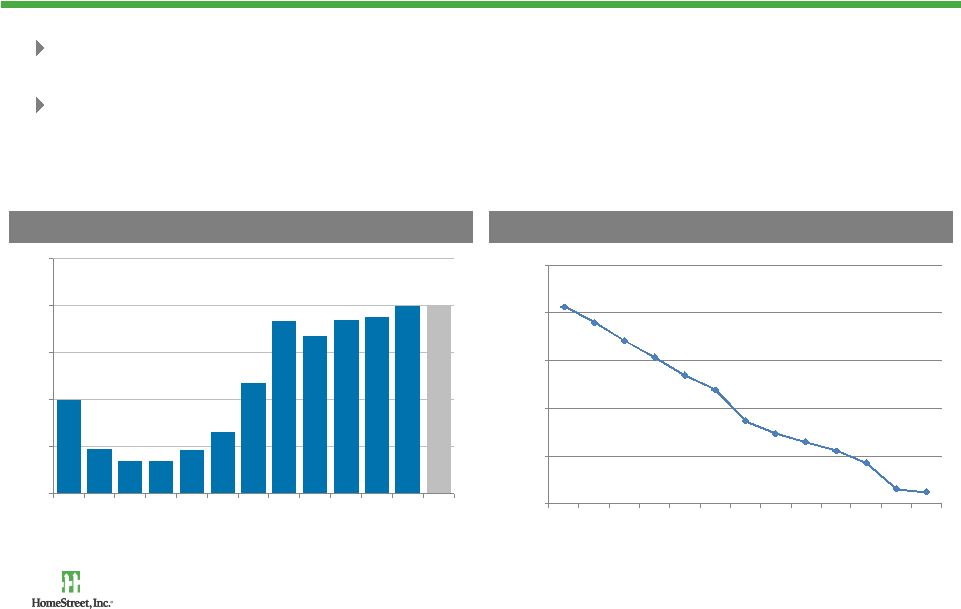 Efficient Retail Deposit Funding Base NIM increased 165 bps to 2.50% in January 2012 from a low of 0.85% (1) Cost of funding declined 333 bps to 1.13% in January from a high of 4.46% (2) Source: S-1 filing and HomeStreet Inc. (1) For the quarter ended September 30, 2009. (2) Simple average of the cost of funds for the three months in Q3 2007. Bank Cost of Funding (%) Net Interest Margin (%) 8 3.07% 2.90% 2.71% 2.54% 2.35% 2.20% 1.87% 1.74% 1.65% 1.56% 1.43% 1.16% 1.13% 1.00% 1.50% 2.00% 2.50% 3.00% 3.50% Q1 09 Q2 09 Q3 09 Q4 09 Q1 10 Q2 10 Q3 10 Q4 10 Q1 11 Q2 11 Q3 11 Q4 11 Jan 12 1.50% 0.98% 0.85% 0.85% 0.96% 1.16% 1.68% 2.34% 2.17% 2.35% 2.38% 2.50% 2.50% 0.5% 1.0% 1.5% 2.0% 2.5% 3.0% Q1 09 Q2 09 Q3 09 Q4 09 Q1 10 Q2 10 Q3 10 Q4 10 Q1 11 Q2 11 Q3 11 Q4 11 Jan 12 |
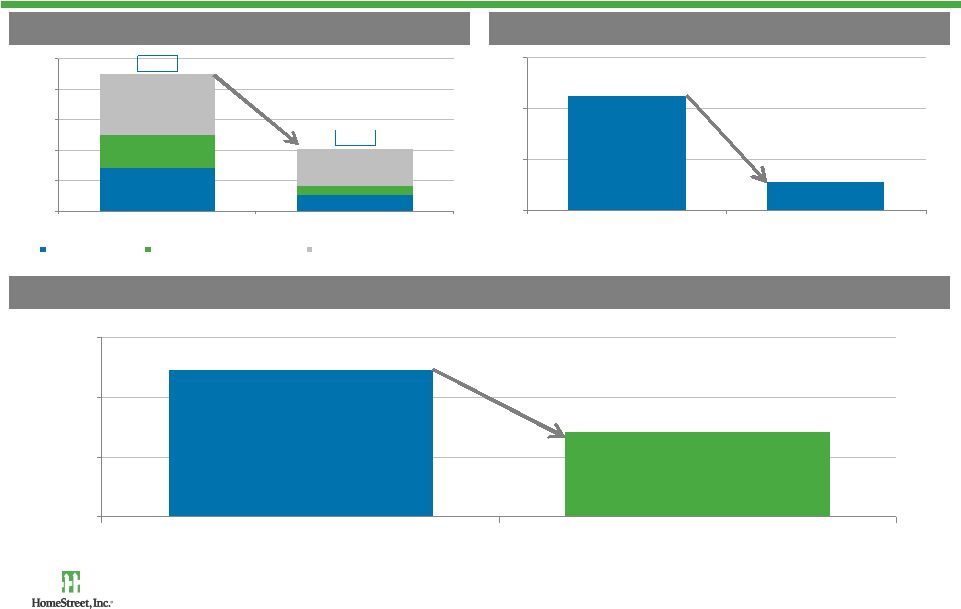 Significant Credit Improvement Since Q3 9 $225.0 $191.2 $180 $200 $220 $240 Q3 2011 Jan 2012 (15%) $98.5 $80.7 $21.1 $5.5 $39.9 $24.7 $159.5 $110.9 $70 $90 $110 $130 $150 $170 Q3 2011 Jan 2012 Adjusted NPAs OREO Contracted for Sale NPLs, Paying as Agreed (30%) Nonperforming Assets ($ mm) Classified Assets / (Tier 1 + ALLL) (1) Classified Assets ($ mm) 123% 71% 0.0% 50.0% 100.0% 150.0% Actual January 2012 Pro Forma Adjusted January 2012 (1) (42%) Source: S-1 filing and HomeStreet Inc. (1) Assumes initial public offering of $55 million plus a $5 million private placement net of transaction expenses of $6.8 million. Assumes an additional $17.6 mm of trust preferred securities receive tier 1 capital treatment. Classified assets adjusted for $5 .5 million of OREO contracted for sale and $24.7 million of current NPLs, paying as agreed. Represents holding company tier 1 capital. |
 Aggressive OREO Sales OREO declined 45% since Q3 driven by accelerated sales Balances greater than 180 days decreased 27% (1) 16% or $5.5 million of existing OREO is already contracted for sale (2) 10 Days in OREO ($ mm) Source: S-1 filing and HomeStreet Inc. (1) Decline from Q3 2011. (2) As of January 31, 2012. $18.6 $2.6 $4.5 $2.6 $41.3 $30.3 $64.4 $35.5 $0 $25 $50 $75 Q3 2011 Jan 2012 Less than 90 Days 90 Days - 180 Days Greater than 180 Days (45%) |
 Conservatively Marked Portfolio OREO has been sold to date at 63% (1) of unpaid principal balance NPAs currently carried at 54% (2) of UPB Carrying Value of Nonperforming Assets 11 Source: HomeStreet Inc. (1) Represents quarterly average of OREO sales from Q3 2009 to Q4 2011. (2) As of January 31, 2012. (3) Includes loan charge offs of $29.5 million and OREO writedowns of $21.6 million. (4) In addition to specific reserves of $15.6 million on nonperforming loans, the Company has remaining reserves of $26.3 million. (4) (3) ($ in millions) Category Unpaid Principal Balance LTD Charge Offs / Write Downs Net Book Value at 1/31/2012 Specific Reserves at 1/31/2012 CV - Specific Reserves CV - Specific Reserves % of Unpaid Principal Balance Remaining Reserves on all other Loans 1-4 Family 15.2 $ 1.2 $ 14.0 $ 0.2 $ 13.8 $ 90.8% CRE - Owner Occupied 7.7 0.5 7.2 0.3 6.9 89.6% CRE - Non Owner Occupied 3.3 0.4 2.9 0.0 2.9 87.9% C&I 1.2 0.2 1.0 0.4 0.6 50.0% Construction 60.1 12.0 48.1 14.7 33.4 55.6% Consumer 2.5 0.3 2.2 0.0 2.2 88.0% Nonperforming Loans 90.0 $ 14.6 $ 75.4 $ 15.6 $ 59.8 $ 66.4% 26.3 $ OREO 86.6 51.1 35.5 0.0 35.5 41.0% Nonperforming Assets 176.6 $ 65.7 $ 110.9 $ 15.6 $ 95.3 $ 54.0% 26.3 $ |
 Strong Reserves HomeStreet’s reserves / loans are 28% above peer averages (1)(2) Source: S-1 filing, HomeStreet Inc. and SNL Financial. (1) Company-identified peers include BANR, CACB, COBZ, COLB, CPF, CVBF, GBCI, PACW, PCBC, STSA, TCBK, UMPQ, WABC, WAL, WCBO and WFSL . Represents the median of peers’ reserves / loans ratio. Q4 2011 data non available for CACB. (2) As of December 31, 2011. 12 5.2% 5.0% 4.1% 4.0% 4.0% 4.1% 3.8% 3.2% 3.1% 2.8% 2.9% 2.7% 2.8% 2.9% 2.8% 2.7% 2.5% 2.0% 3.0% 4.0% 5.0% 6.0% Q1 10 Q2 10 Q3 10 Q4 10 Q1 11 Q2 11 Q3 11 Q4 11 Jan 12 Reserves / Loans Peer Reserves / Loans (1) Reserves ($ mm) |
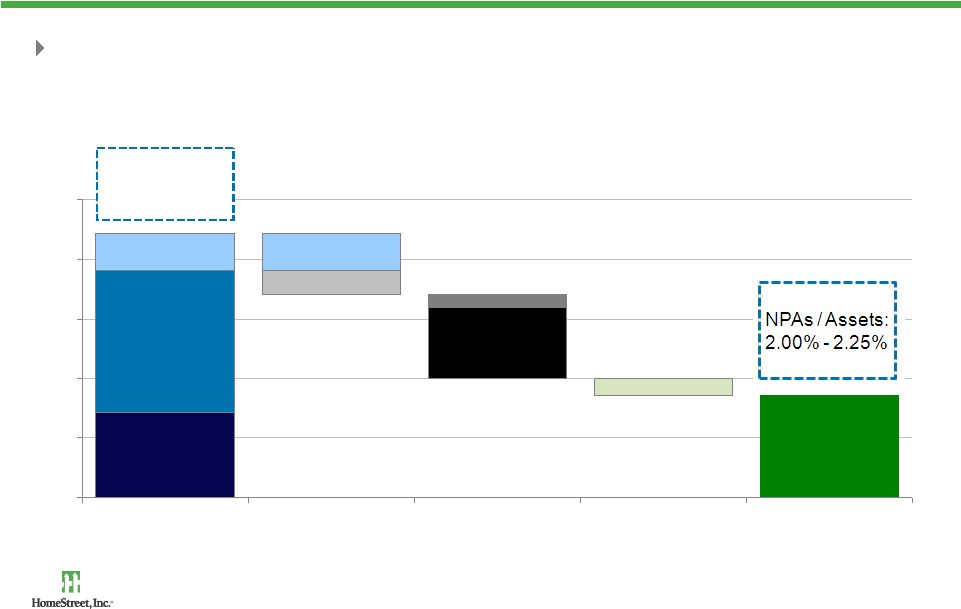 Net NPLs $59.8 $40 - $51 OREO $35.5 General Reserves $9 - $11 Additional: $25 - $30 $5 - $9 Specific Reserves $15.6 Specific Reserves $15.6 $0 $25 $50 $75 $100 $125 NPA Balance Jan 2012 Utilization of Existing Reserves Anticipated OREO Sales Net NPL Outflows Projected NPA Balance Q3 2012 Contracted as of 1/31/2012: $5.5 (1) (2) Near Term Projected Credit Resolutions Approximately $30 - $35 million of anticipated OREO sales through Q3 2012 – 16% is contracted for sale and scheduled to close in Q1 2012 13 Total: $111 4.9% Source: HomeStreet Inc. (1) Includes $15.6 million of chargeoffs of specific reserves existing as of January 31, 2012. Remaining chargeoffs primarily relate to anticipated migration of single family loans. (2) Net NPL outflows include scheduled principal payoffs, NPL upgrades, note sales and anticipated additions to NPLs. |
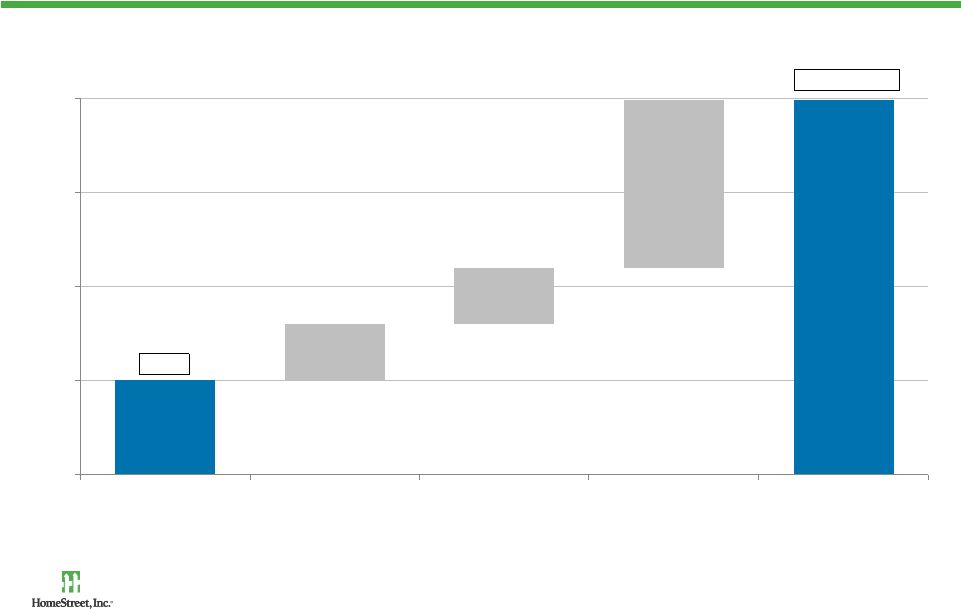 2.50% 3.75% - 4.00% 0.20% - 0.30% 0.20% - 0.30% 0.80% - 0.90% 2.0% 2.5% 3.0% 3.5% 4.0% 1/31/2012 NIM Investment of Net Proceeds Increase in yields & reduction in NPLs Change in securities / loan / deposit mix Near Term Target NIM Net Interest Margin Expansion Opportunities 14 (1) Source: HomeStreet Inc. (1) Margin expansion opportunities from 1/31/2012 net interest margin are based upon management’s assumptions of post recapitalization restructuring opportunities and will differ from future results. |
 Earnings Potential Source: HomeStreet Inc. (1) These are not projections of future earnings, nor a complete listing of all potential impacts at the proposed recapitalization. Future results will differ from the opportunities outlined. (2) NIM reflects restructured balance sheet for securities, loans and deposits. (3) Provision for loan losses reflects providing for growth in loan portfolio to achieve target mix (i.e., 1/3 consumer, commercial real estate and C&I). (4) Single family gain on sale and servicing, as well as income from WMS adjustments reflect both reduction of volume to eliminate refinance activity and robust refinance "boom" margins which are consistent with Q2 2011 results. (5) Eliminated securities gains. (6) OREO expense adjusted to reflect reduction of OREO and substantial elimination of risk. (7) FDIC insurance fees reflect elimination of Regulatory Order at the Bank. (8) Adjusted salaries and benefits to reflect a decrease in commissions related to single family refinance boom, offset by increases in salaries and benefits to achieve loan and deposit mix changes. Aligned professional fees to reflect lower risk operating environment. Marketing expenses increased to achieve balance sheet restructuring of customers. (9) Assumes effective tax rate of 37%. (10) Noninterest expense adjusted for OREO expense. See Appendix for reconciliation of non-GAAP financial measures. 15 Unaudited Quarter Ended Normalizing Pro Forma ($ in millions) 12/31/2011 Adjustments (1) Normalized (1) Net Interest Income (2) 12.9 $ 7.1 $ 20.0 $ Provisions for Loan Losses (3) 0.0 2.0 2.0 Gain on Sale of Mortgage Loans (4) 18.8 (6.6) 12.2 Mortgage Servicing (4) 6.0 0.2 6.2 Other Noninterest Income (5) 2.6 (0.9) 1.7 Operating Revenue 40.3 (2.2) 38.1 OREO-Related Expense (6) 3.7 (3.6) 0.1 FDIC Assessment Fees (7) 1.3 (0.9) 0.3 Other Noninterest Expense (8) 28.9 (6.5) 22.5 Total Noninterest Expense 33.9 (11.0) 22.9 Pretax Income 6.4 8.8 15.3 Taxes (9) (0.6) 6.3 5.7 Net Income 7.0 $ 2.6 $ 9.6 $ Net Interest Margin (2) 2.50% 3.75% Operating Efficiency Ratio (10) 74.8% 56.7% ROAA 1.2% 1.7% ROAE 33.4% 27.0% |
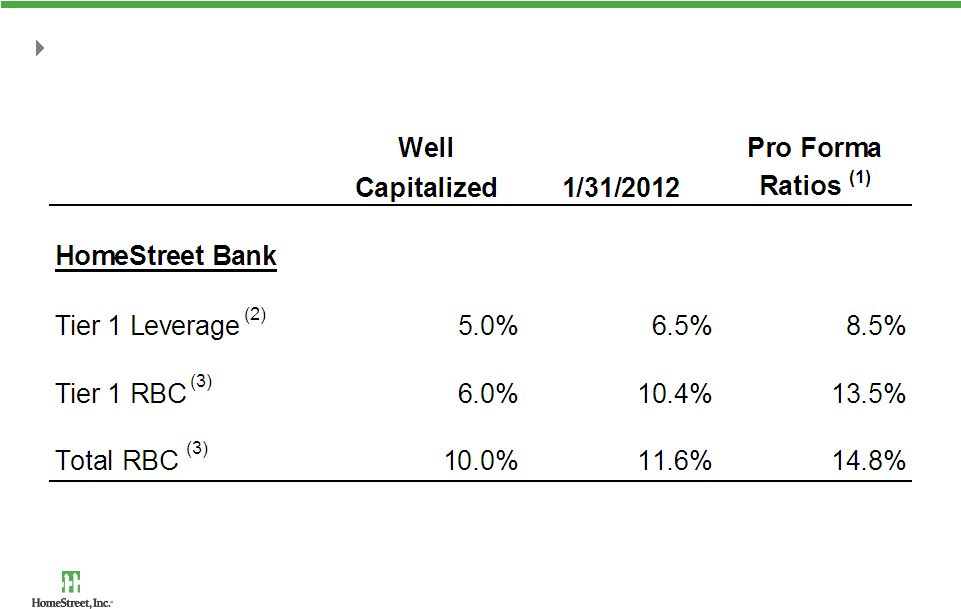 Recapitalized HomeStreet Base offering structured to meet anticipated regulatory requirements Note: The Company is not currently subject to holding company regulatory capital requirements. (1) Assumes base initial public offering of $55 million plus $5 million side-by-side private placement, net of transaction expenses of $6.8 million. Assumes $9 million is retained at the holding company for working capital needs and the remaining net proceeds of $44.2 million are downstreamed to the bank. (2) Pro forma tier 1 leverage calculation assumes no addition of net proceeds to average assets. (3) Pro forma tier 1 RBC and total RBC ratios assume 0% risk weighting assigned to net proceeds for risk weighted assets calculation. 16 |
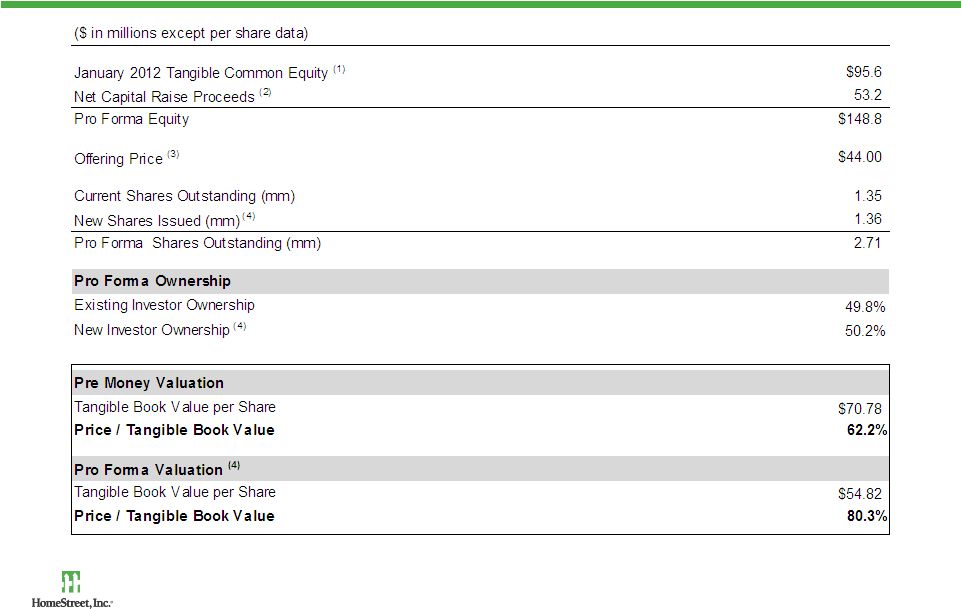 Pro Forma Valuation 17 Source: Derived from S-1 filings and HomeStreet Inc. (1) Tangible common equity calculated as common equity of $96.0 million less intangible assets of $0.4 million. See Appendix for reconciliation of non-GAAP financial measures. (2) Net proceeds of $53.2 mm is calculated using gross initial public offering of $55.0 mm plus $5.0 million private placement less assumed capital raise expenses of $6.8 mm. (3) Assumes offering price at the midpoint offering range of $43.00 and $45.00 per share. (4) Shares issued of 1,363,636 for pro forma shares outstanding of 2,714,510. Of the shares issued, 1,250,000 shares are offered in the public offering and 113,636 in the private placement. Excludes 36,681 shares subject to restricted stock awards to be issued to certain employees and our non-employee directors upon the closing of this offering. |
 Investment Highlights Established and well-respected Pacific Northwest franchise Highly profitable conforming single family mortgage origination and servicing platform Significantly improved credit profile driven by aggressive problem asset resolution Management’s turnaround plan resulted in three consecutive quarters of profitability Commercial banking and diversified real estate lending provides loan and funding growth opportunities Offering designed to qualify for the replacement of the regulatory order with another form of enforcement agreement ROE's substantially higher than peers driven by increased NIM and significant noninterest income 18 |
 Established Pacific Northwest Franchise $2.2 billion (1) institution with 20 deposit branches and 20 lending centers (2) – Average deposits per branch of $98 million (1) – No brokered deposits Largest community bank headquartered in Seattle Over 35,000 demand deposit accounts representing 60% of total accounts Improved competitive banking landscape in the PacNW HomeStreet Bank Branches (20) Current HomeStreet Loan Offices (9) (2) Seattle Bellevue Tacoma Aberdeen Spokane Vancouver Portland Salem Honolulu Pearl City Hilo Maui H A W A I I W A S H I N G T O N O R E G O N Source: HomeStreet Inc. and SNL Financial. (1) As of January 31, 2012. (2) HomeStreet currently has 9 lending centers and will be opening 11 additional lending centers with the addition of MetLife personnel. (3) As of June 30, 2011. # of Market State Branches Rank (3) Share (3) Washington 15 13 1.58% Oregon 2 27 0.47% Hawaii 3 7 1.32% 19 |
 Highly Profitable Mortgage Origination Franchise 70% conventional / 30% government; 70% purchase / 30% refinance Hired a team of 140+ retail mortgage bankers in the Pacific Northwest from MetLife Joint venture with Windermere Real Estate Services, the largest real estate brokerage company in the Pacific Northwest 2009, 2010 and 2011 mortgage originations of $2.7, $2.1 and $1.7 billion Nominal repurchase claims and losses Source: HomeStreet Inc. (1) Basis points on closed loan production. 20 January 2012 Mortgage Originations FY2011 Mortgage Originations |
 Growing & Profitable Servicing Platform Highly valuable SFR servicing portfolio relative to peers – High concentration of FHA/VA loans – low defaults – low coupons – Delinquencies below 1%, less than 1/3 of Fannie Mae’s national average (1) – Low weighted average coupon (4.9%) resulting in lower prepayment speeds – FY2011 net servicing income of 22 bps Highly attractive multifamily servicing platform – Low prepayments and higher servicing fees – One of only 25 Fannie Mae DUS lenders nationwide Servicing Portfolio ($ mm) 21 $3,389 $3,775 $4,696 $5,821 $6,343 $6,521 $6,603 $6,650 $6,885 $6,891 $783 $793 $897 $881 $835 $843 $857 $828 $815 $832 $4,172 $4,569 $5,593 $6,702 $7,179 $7,364 $7,460 $7,477 $7,700 $7,723 $0 $2,000 $4,000 $6,000 $8,000 2006 2007 2008 2009 2010 Q1 2011 Q2 2011 Q3 2011 Q4 2011 Jan 2012 Single-family Multi-family / Other Source: S-1 filing and HomeStreet Inc. (1) Represents serious delinquency rate (loans over 90 days delinquent). |
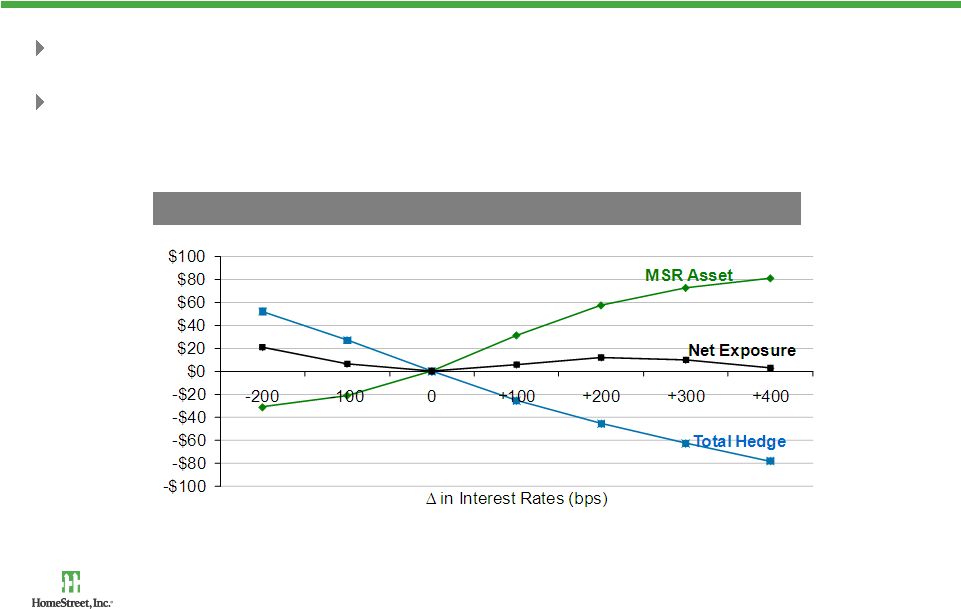 Effective Hedging Strategy “Long position” in interest rates that offsets the “short position” of the MSRs Hedge strategy models maximum loss to $500,000 for a + / - 25 bps rate change, and $2 million for an extreme rate increase scenario MSR Interest Rate Shock Scenarios ($ mm) Source: HomeStreet Inc. As of January 31, 2012. Note: No hedging program can effectively hedge model risk (actual versus modeled prepayment rates) and basis risk (mortgage/swap rates spread). 22 |
 Source: S-1 filing. Seasoned Management Team Executive / Director Joined Company Years in Industry Relevant Experience Mark K. Mason Director, Vice Chairman, President and CEO Sept 2009 25 Seasoned banking executive with a proven track record of successfully implementing turnaround and growth strategies Former Chairman and CEO of Fidelity Federal Bank David E. Hooston EVP and CFO Aug 2009 30 Extensive turnaround, capital raising and M&A experience Previously was Managing Partner at Granite Bay Partners; Portfolio Manager at Belvedere Capital Partners and concurrently served as President, CFO and COO at Placer Sierra Bancshares and subsidiaries Jay C. Iseman EVP and Chief Credit Officer Aug 2009 20 Significant experience in troubled loan workouts, special assets and credit administration at major national banks Previously served as Senior Vice President and Senior Portfolio Manager of commercial special assets with Bank of America Godfrey B. Evans EVP, General Counsel and CAO Nov 2009 30 Significant experience in banking and corporate securities law, including recapitalization/ restructuring of financial institutions Previously served as General Counsel and CAO at Fidelity Federal Bank and corporate lawyer at Gibson, Dunn & Crutcher 23 |
 Turnaround Progress Entered into C&D Developed plan to reduce classified assets, upgrade management, improve earnings and increase capital Restructured credit administration Accelerated problem asset resolution Instituted interest rate floors Expanded NIM – Improved asset yields – Reduced non-core funding – Restructured deposit products/pricing Filed IPO Third party loan review confirms valuation / reserves Noncore funding (4) reduced by 94% (5) from 9/30/2009 Achieved three consecutive quarters of profitability Appointed new CEO, CFO, CAO Appointed new CCO 2009 2010 2011 - 2012 Management Changes Management Actions Restructured Board (3) Source: S-1 filing and HomeStreet Inc. (1) Represents peak levels in 2009. (2) Represents NIM for Q3 2009. (3) Contingent upon the successful closing of this offering and regulatory approval. (4) Noncore funding represents brokered deposits and FHLB borrowings. (5) As of or for month ended January 31, 2012. 24 Classified Assets $761 million (1) $482 million (1) 0.85% (2) $364 million $284 million 1.49% $191 million (5) $111 million (5) 2.50% (5) NPAs NIM |
 $581 $761 $738 $570 $526 $546 $484 $364 $299 $276 $225 $188 $191 $180 $380 $580 $780 Q1 09 Q2 09 Q3 09 Q4 09 Q1 10 Q2 10 Q3 10 Q4 10 Q1 11 Q2 11 Q3 11 Q4 11 Jan 12 37 38 63 108 123 122 202 170 99 103 64 39 36 278 410 389 374 327 321 189 113 124 91 95 77 75 $314 $449 $452 $482 $450 $442 $391 $284 $223 $194 $159 $115 $111 $0 $200 $400 $600 Q1 09 Q2 09 Q3 09 Q4 09 Q1 10 Q2 10 Q3 10 Q4 10 Q1 11 Q2 11 Q3 11 Q4 11 Jan 12 OREO Nonperforming Loans $959 $171 $0 $250 $500 $750 $1,000 Q4 2008 Jan-12 (82%) Significant Improvement in Asset Quality NPAs down 77% and classified assets down 75% from 2009 peak levels (1) Driven by significantly reduced high risk construction loans Nonperforming Assets ($ mm) Source: S-1 filing and HomeStreet Inc. (1) Represents change from peak levels. (77%) Classified Assets ($ mm) (75%) 25 Construction and Land Loans ($ mm) |
 Significant NPA Outflows Eight consecutive quarters of NPA outflows totaling ~$370 million (1) NPA Migration 26 Source: HomeStreet Inc. (1) Since Q4 2009. ($ in millions) Q1 10 Q2 10 Q3 10 Q4 10 Q1 11 Q2 11 Q3 11 Q4 11 Jan 12 Beginning Balance 482.0 $ 450.4 $ 442.2 $ 390.6 $ 283.7 $ 223.0 $ 193.6 $ 159.5 $ 115.1 $ Additions to NPLs 20.6 83.5 37.8 22.3 28.9 14.2 20.9 7.3 2.9 Charge-Offs 11.7 20.6 36.2 14.6 2.1 4.7 7.7 10.6 0.8 OREO Sales 14.8 41.3 21.9 21.2 67.0 17.6 33.8 26.0 2.8 OREO Writedowns (1.2) 5.1 7.2 16.3 10.6 4.7 8.2 3.6 0.6 Principal Paydown, Payoff, Advances 10.3 17.6 19.0 10.9 5.6 6.0 2.4 3.9 0.5 Transferred Back to Accrual Status 16.6 7.1 5.1 66.2 4.3 10.6 2.9 7.6 2.4 Subtractions from NPAs 52.2 91.7 89.4 129.2 89.6 43.6 55.0 51.7 7.1 Net Inflows / (Outflows) (31.6) (8.2) (51.6) (106.9) (60.7) (29.4) (34.1) (44.4) (4.2) Ending Balance 450.4 $ 442.2 $ 390.6 $ 283.7 $ 223.0 $ 193.6 $ 159.5 $ 115.1 $ 110.9 $ |
 Growth Strategies Organic growth opportunities driven by attractive market demographics – Job growth and housing recovery is expected to outpace the overall economy – Well educated workforce, high incomes and strong population trends Expand commercial and consumer banking activities – Commercial: lending, cash management, insurance – Consumer: mortgage loans, deposits, investments, insurance Expand single family mortgage banking activities – Increase retail, correspondent and internet production channels Expand multifamily mortgage banking through the Fannie Mae DUS program Restart traditional portfolio lending 27 |
 Investment Highlights Established and well-respected Pacific Northwest franchise Highly profitable conforming single family mortgage origination and servicing platform Significantly improved credit profile driven by aggressive problem asset resolution Management’s turnaround plan resulted in three consecutive quarters of profitability Commercial banking and diversified real estate lending provides loan and funding growth opportunities Offering designed to qualify for the replacement of the regulatory order with another form of enforcement agreement ROE's substantially higher than peers driven by increased NIM and significant noninterest income 28 |
 Appendix |
 Director Joined Relevant Experience David A. Ederer Chairman (since 2009) 2004 Currently serves as Chairman of Ederer Investment Company, a private investment company as well as Director in several other local foundations Mark K. Mason Vice Chairman 2009 Currently serves as President & CEO of HomeStreet Inc and HomeStreet Bank; former Chairman and CEO of Fidelity Federal Bank Scott Boggs (1)(2) 2006 Former Corporate Controller at Microsoft Corporation and adjunct accounting professor at Seattle University Albers School of Business Brian P. Dempsey (2) 1996 Previously served on the Board of Directors of Golden State Bancorp and Federal Home Loan Bank of Seattle and was President and Chairman of University Savings Bank Victor H. Indiek (1) 2012 Project Manager at Quantum Partners managing FDIC receiverships and previously President, CEO, CFO of Freddie Mac and CFO of American Savings Thomas E. King (1)(2) 2010 Consultant to banks; previously CEO or COO of San Diego Community Bank, Fullerton Community Bank, Bank of So. Cal, CapitolBank, credit & lending officer at Sec Pac George Kirk (1)(2) 2007 Former President and CEO of Port Blakely Communities and President of Skinner Development Company and Chair of Real Estate Dept at Davis Wright Tremaine LLP Michael J. Malone (1) 2012 CEO of Hunters Capital, member of the Board of Directors of Expeditors International; previously founder, Chairman and CEO of AEI/DMX Music Gerhardt Morrison (2) 1986 Former Chairman of the Business Law Department at Bogle & Gates, a Seattle-based law firm; previously served as trustee of the Northwest Hospital Doug Smith (1) 2012 President of Miller and Smith, a residential home building company Bruce W. Williams 1994 Previously served as President and CEO of Homestreet Inc and Homestreet Bank Pro Forma Board of Directors Source: S-1 filing (1) Appointment subject to regulatory approval. (2) Currently Director for HomeStreet Bank. Reflects date joined HomeStreet Bank’s Board. 30 |
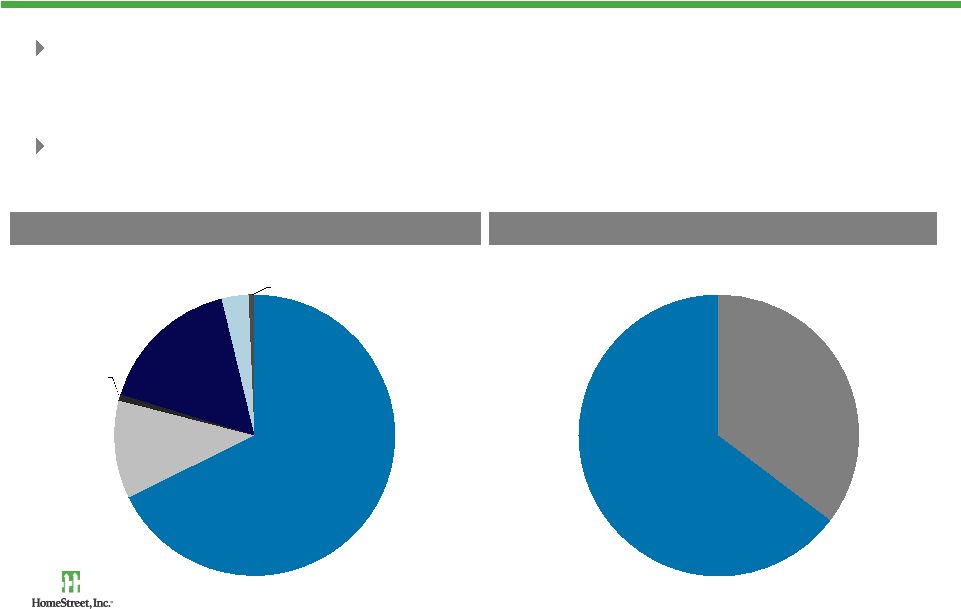
 Loan Portfolio Characteristics New management team has focused on reducing exposure to real estate developers and higher risk property types Increased emphasis on business banking and multifamily mortgage lending Q4 2011 Loan Composition Q4 2011 CRE by Property Type 31 Source: HomeStreet Inc. 1-4 Family $497 (37%) CRE - Non Owner Occupied $300 (22%) C&I $60 (4%) Consumer $159 (12%) Construction $173 (13%) Multifamily $56 (4%) CRE - Owner Occupied $102 (8%) Mixed Use 17% Office 18% Other 6% Retail 30% Multifamily 13% Industrial Warehouse 16% |
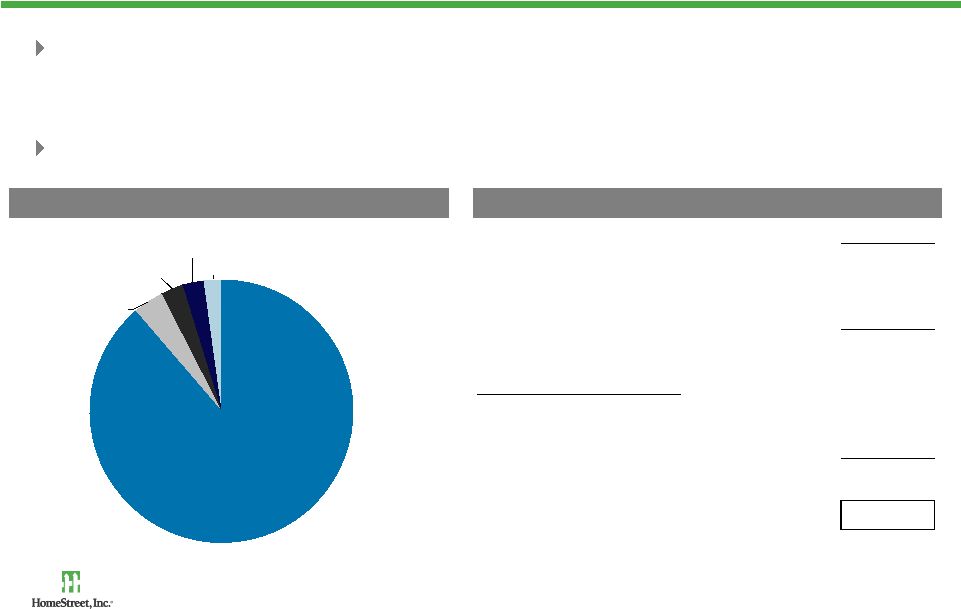
 Fixed Rate 35% Adjustable Rate 65% Loan Portfolio Characteristics (cont.) Loan portfolio concentrated in the Puget Sound area, which has been less impacted by the economic downturn compared to eastern Washington Adjustable rate loans comprise approximately 65% of the loan portfolio Q4 2011 Loans by Geography Q4 2011 Loan Interest Rate Mix Source: HomeStreet Inc. 32 Puget Sound 68% Idaho (Boise) 1% Oregon 16% Hawaii 3% Other 1% Washington Other 11% |
 Strong Liquidity Position Proactively reduced brokered deposits and reliance on wholesale funding sources – Available capacity under FHLB and FRB of $231 million and $100 million, respectively Substantial excess liquidity with a primary liquidity ratio of 35% (1) Total Sources of Liquidity ($ mm) Funding Sources ($ mm) Source: HomeStreet Inc. (1) Primary liquidity ratio is defined as net cash, short-term investments and other marketable assets as a percent of net deposits and short-term borrowings. Ratio as of December 31, 2011. (2) Represents market value of unpledged securities. 33 Q4 2011 Cash $263.3 Unpledged Securities (2) 302.8 Loans Held for Sale 150.4 Total On-Balance Sheet Liquidity 716.5 Additional Borrowing Capacity FHLB 231.4 FRB SF 99.9 Total Available Capacity $331.3 Total Direct Sources of Liquidity $1,047.8 Total Funding: $2,265 million Deposits $2,010 (89%) Capital $86 (4%) Borrowings $62 (3%) FHLB $58 (2%) Other $49 (2%) |
 Balance Sheet Month Ended Quarter Ended ($ in millions) 1/31/2012 12/31/2011 9/30/2011 6/30/2011 3/31/2011 Cash 202.9 $ 263.3 $ 138.4 $ 108.2 $ 170.8 $ Investments 381.3 329.0 339.5 315.7 304.4 Loans Held for Sale 123.4 150.4 226.6 121.2 82.8 Loans Held for Investment 1,350.1 1,343.6 1,413.4 1,451.9 1,562.7 Allowance for Loan Losses (41.9) (42.7) (53.2) (59.7) (62.1) Net Loans 1,308.2 1,300.9 1,360.2 1,392.2 1,500.6 Other Real Estate Owned 35.5 38.6 64.4 102.7 98.9 Mortgage Servicing Rights 75.7 77.3 74.1 94.3 96.0 Federal Home Loan Bank Stock 37.0 37.0 37.0 37.0 37.0 Other Assets 80.2 68.4 76.6 62.2 52.1 Total Assets 2,244.2 $ 2,264.9 $ 2,316.8 $ 2,233.5 $ 2,342.6 $ Deposits 1,977.1 $ 2,009.8 $ 2,057.0 $ 1,993.7 $ 2,066.8 $ Federal Home Loan Bank Borrowings 57.9 57.9 67.9 77.9 114.5 Other 113.2 110.8 111.6 103.6 110.1 Total Liabilities 2,148.2 2,178.5 2,236.5 2,175.2 2,291.4 Equity 96.0 86.4 80.3 58.3 51.2 Total Liabilities and Equity 2,244.2 $ 2,264.9 $ 2,316.8 $ 2,233.5 $ 2,342.6 $ Source: S-1 filing and HomeStreet Inc. 34 |
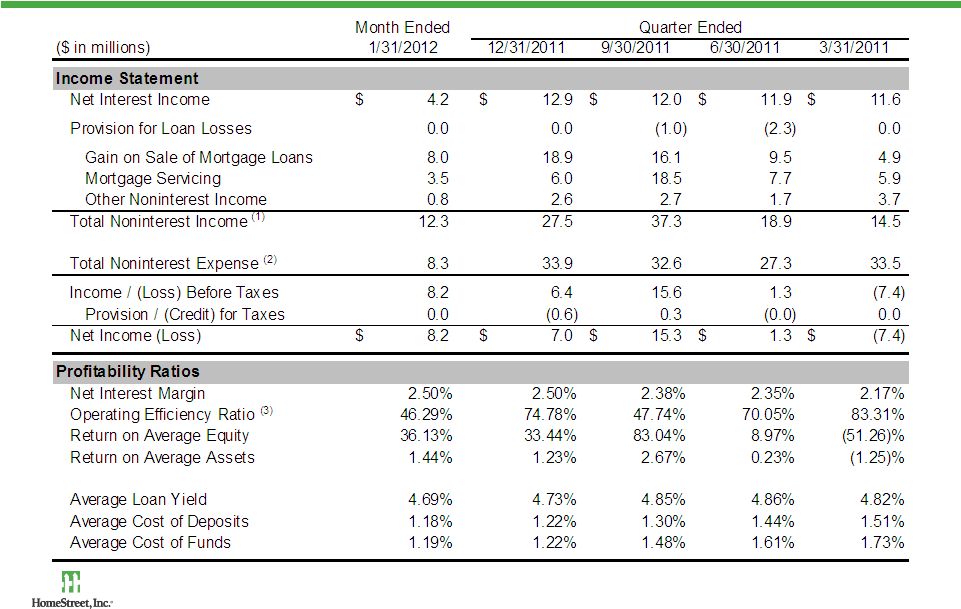 Income Statement & Profitability Ratios 35 Source: S-1 filing and HomeStreet Inc. (1) Includes net MSR/hedge valuation (loss) gains of $1.6 million, $(189,000), $12.2 million, $1.3 million, $91,000 and $1.6 million for January 2012, Q4 2011, Q3 2011, Q2 2011 and Q1 2011, respectively. (2) Q4 2011 OREO expenses were $3.7 million vs. $9.1 million in Q3 2011. (3) Operating efficiency ratio adjusted for OREO expense. See Appendix for reconciliation of non-GAAP financial measures. |
 Asset Quality & Capital Adequacy Source: S-1 filing and HomeStreet Inc. (1) Calculation based on Bank Tier 1 capital. 36 |
 15 Largest Nonperforming Loans Data as of January 31, 2012 ID Loan Type Unpaid Principal Balance Partial Charge Offs Net Commitment Net Book Balance Specific Reserves Book Balance Net of Specific Reserves TDR Description 1 Construction/Land Development 21,809,726 $ - $ 21,875,566 $ 21,809,726 $ 11,638,065 $ 10,171,661 $ No • 340 acre Community in Thurston County, WA with 124 acres zoned for residential development and 215 acres zoned for Commercial. 2 Construction/Land Development 4,279,044 $ - $ 4,279,044 $ 4,279,044 $ - $ 4,279,044 $ Yes • 121 finished detached lots in Yakima (28), Clark (24) and Grant (69) Counties in WA. Construction/Land Development 2,841,025 $ - $ 2,841,025 $ 2,841,025 $ - $ 2,841,025 $ Yes • 550 residential detached lots with preliminary plat approval located in Yakima (58), Grant (475) and Clark (17) Counties in WA. Construction/Land Development 1,977,587 $ (870,210) $ 1,107,377 $ 1,107,377 $ - $ 1,107,377 $ Yes • 8 detached single family residences in Clark (5) and Grant (3) Counties in WA. TOTAL 9,097,656 $ (870,210) $ 8,227,446 $ 8,227,446 $ - $ 8,227,446 $ 3 Construction/ Land Development $ 4,399,850 - $ 4,399,850 $ 4,399,850 $ 2,046,690 $ 2,353,160 $ No • 63 Completed attached lots including four with foundations and three partially Completed townhomes (averaging 1,657sqft) located in Clark County, WA. Construction/Land Development $ 412,398 - $ 467,673 $ 412,398 $ - $ 412,398 $ No • Three substantially completed single family townhomes averaging 1,740sqft located in Clark County, WA. Consumer $ 165,180 (50,680) $ 128,820 $ 114,500 $ - $ 114,500 $ No • One single family residence in Clark County, WA. TOTAL 4,977,429 $ (50,680) $ 4,996,343 $ 4,926,748 $ 2,046,690 $ 2,880,058 $ 4 Construction/Land Development 6,605,737 $ (2,075,278) $ 4,539,996 $ 4,530,459 $ 408,600 $ 4,121,859 $ Yes • 17 single family residences in King County, WA. 5 Construction/Land Development 9,722,371 $ (5,977,383) $ 3,744,988 $ 3,744,988 $ - $ 3,744,988 $ Yes • 65 residential finished lots, 7.72 acres partially improved land, and 67.45 acres of raw land zoned for 338 residential lots in Lane County, OR. 6 Commercial Real Estate 3,668,539 $ - $ 3,668,539 $ 3,668,539 $ - $ 3,668,539 $ No • Five gas stations in King County, WA. Received outside legal counsel's recommendations on collection strategies which include appointment of a general receiver, with likely Chapter 11 filings by all 5 debtors, costs of collection etc. Final strategy pen 37 |
 15 Largest Nonperforming Loans (cont.) Data as of January 31, 2012 ID Loan Type Unpaid Principal Balance Partial Charge Offs Net Commitment Net Book Balance Specific Reserves Book Balance Net of Specific Reserves TDR Description 7 Construction/Land Development 2,817,054 $ - $ 2,817,054 $ 2,817,054 $ - $ 2,817,054 $ No • One 41,431sqft single-tenant retail building located in Pierce County, WA. 8 Commercial Real Estate 2,196,594 $ - $ 2,196,594 $ 2,196,594 $ - $ 2,196,594 $ No • One gas station in Clackamas County, OR. Borrower is current with respect to loan payments and real estate taxes and compliance with contractual DSCR. Guarantor's global DSCR remains less than 1.0 to 1. 9 Commercial Real Estate 1,828,044 $ - $ 1,828,044 $ 1,828,044 $ - $ 1,828,044 $ No • Four industrial/warehouse buildings totaling 33,617sqft in King County, WA. 10 1-4 Family 1,296,906 $ - $ 1,296,906 $ 1,296,906 $ - $ 1,296,906 $ No • One owner occupied single family residence in Clackamas County, OR with current value of $1.8MM. 11 Construction/Land Development 1,500,000 $ (442,500) $ 1,057,500 $ 1,057,500 $ 319,610 $ 737,890 $ Yes • Subordinated deed of trust secured by Borrower's 5,600sqft single family personal residence and 36,202sqft office building, both located in King County, WA. 12 Commercial Business 116,826 $ - $ 116,826 $ 116,826 $ - $ 116,826 $ No • One furniture store in King County, WA. Debtor has sold the real property for $1.6MM with closing set for no later than 03/05/2012. SAG LO has confirmed the buyer's loan is approved and accepted (copy of commitment letter). Forbearance agreement in nego Commercial Real Estate 901,350 $ - $ 901,350 $ 901,350 $ - $ 901,350 $ No • One furniture store in King County, WA. See above. TOTAL 1,018,175 $ - $ 1,018,175 $ 1,018,175 $ - $ 1,018,175 $ GRAND TOTAL $ 66,538,231 $ (9,416,052) $ 57,267,151 $ 57,122,180 $ 14,412,965 $ 42,709,215 38 |
 10 Largest OREO Properties Data as of January 31, 2012 ID Description Location Property Type Sales Status Original Loan Balance LTD Charge- Offs Amount Transferred to OREO OREO Writedowns Carrying Value of OREO 1 40.73 acres of commercially zoned land Thurston County, WA Commercial Real Estate Unsold $9,286,525 ($2,216,137) $7,070,388 ($3,660) $7,066,728 2 Excess raw land planned for 344 residential lots, 298 multi-family units; and two finished commercial tracts totaling Thurston County, WA Construction/ Land Development Unsold $9,447,348 $530,303 $9,977,651 ($6,131,801) $3,845,850 3 Raw land entitlements for 53 residential lots and 14 multi-family pads supporting 451 units Pierce County, WA Construction/ Land Development Unsold $6,212,938 ($1,680,358) $4,532,580 ($993,555) $3,539,025 4 71 residential detached lots and 29 residential attached lots Thurston County, WA Construction/ Land Development Sold; feasibility through 02/26/12, Closing 03/15/12. $4,000,000 $0 $4,000,000 ($2,387,448) $1,612,552 5 68 residential finished lots Kitsap County, WA Construction/ Land Development Unsold $3,515,177 ($996,178) $2,518,999 ($1,186,397) $1,332,602 6 35 acres of raw land with partial entitlements for 333 future lots Kitsap County, WA Construction/ Land Development Unsold $4,461,390 ($997,822) $3,463,568 ($2,210,276) $1,253,292 7 67 residential finished lots Pierce County, WA Construction/ Land Development Sold; set to close on or before 02/28/12. $7,782,200 ($6,200,064) $1,582,136 ($452,278) $1,129,857 8 25.62 acres of raw land with approvals for 64 attached lots and 49 detached residential lots. Thurston County, WA Construction/ Land Development Unsold $1,637,299 $0 $1,637,299 ($856,574) $780,725 9 18.69 acres of raw land with approval for 84 single family lots. King County, WA Construction/ Land Development Sold; feasibility ends 02/09/12 and set to close on or before 04/01/12. $4,150,000 ($2,413,000) $1,737,000 ($1,010,625) $726,375 10 1.0 acre containing 99-unit mini storage facility, plus 0.5 acres additional land Pierce County, WA Construction/ Land Development Unsold $616,565 $227,362 $843,927 ($139,095) $704,832 $51,109,443 ($13,745,894) $37,363,549 ($15,371,709) $21,991,840 Sales Status Summary TOTAL Sold 16% 3,468,784 $ Unsold 84% 18,523,055 $ GRAND TOTAL Source: HomeStreet Inc. 39 |
 Non-GAAP Reconciliation 40 Source: S-1 filing and HomeStreet Inc. Tangible Common Equity Month Ended ($ in millions) 1/31/2012 Common Equity $96.0 Less: Intangible Assets 0.4 Tangible Common Equity $95.6 Pre-Tax, Pre-Provision Earnings Month Ended Quarter Ended ($ in millions) 1/31/2012 12/31/2011 9/30/2011 6/30/2011 Income / (loss) before income taxes $8.2 $6.4 $15.6 $1.3 Add: Provision for loan losses 0.0 0.0 1.0 2.3 Add: OREO expenses 0.7 3.7 9.1 5.7 Add: IPO-related expense 0.0 2.5 0.0 0.0 Pre-tax, pre-provision earnings 8.9 12.6 25.7 9.3 Efficiency Ratio Month Ended Quarter Ended ($ in millions) 1/31/2012 12/31/2011 9/30/2011 6/30/2011 3/31/2011 12/31/2009 Noninterest expense $8.3 $33.9 $32.6 $27.3 $33.5 $29.2 Less: OREO expense 0.7 3.7 9.1 5.7 11.8 4.2 Adjusted noninterest expense $7.6 $30.2 $23.5 $21.6 $21.7 $25.0 Net interest income before provisions 4.2 12.9 12.0 11.9 11.6 6.4 Noninterest income 12.3 27.5 37.3 18.9 14.5 9.6 Operating Revenue 16.5 40.4 49.3 30.8 26.1 16.0 Operating efficiency ratio 46.29% 74.78% 47.74% 70.05% 83.31% 156.37% Efficiency ratio 50.24% 84.08% 66.25% 88.43% 128.42% 182.62% |