 Investor Presentation December 2011 Free Writing Prospectus (To Preliminary Prospectus dated November 3, 2011) Filed Pursuant to Rule 433 Registration Statement No. 333-173980 Dated December 5, 2011 |
 2 Notices Please read the following notices before reviewing the information contained herein: The information in this document has been prepared solely for informational purposes and does not constitute an offer to sell or the solicitation of an offer to purchase any securities from any entities described herein. Any such offer will be made solely by means of the prospectus contained in the registration statement (collectively, the “Registration Statement”) filed by HomeStreet, Inc. (the “Company”) with the Securities and Exchange Commission (the “SEC”). The information contained herein may not be used in connection with an offer or solicitation by anyone in any jurisdiction in which such offer or solicitation is not permitted by law or in which the person making the offer or solicitation is not qualified to do so or to any person to whom it is unlawful to make such offer or solicitation. All information herein is subject to revision. No representation or warranty can be given with respect to the accuracy or completeness of the information herein, or with respect to the terms of any future offer of securities conforming to the terms hereof. Any information herein shall be deemed superseded, amended, and supplemented in its entirety by the Registration Statement and any decision to invest in the securities offered thereby should be made solely in reliance upon the Registration Statement. This document is confidential and is intended solely for the information of the person to whom it has been presented. It may not be retained, reproduced or distributed, in whole or in part, by any means (including electronically), without the prior written consent of the Company. Nothing contained herein should be construed as tax, accounting or legal advice. Neither the Company nor any of its affiliates or representatives accept any responsibility for the tax treatment of any investment in the securities of the Company. You (and each of your employees, representatives or other agents) may disclose to any and all persons, without limitation of any kind, this tax treatment and tax structure of the transactions contemplated by these materials and all materials of any kind (including opinions or other tax analyses) that are provided to you relating to such tax treatment and structure. For this purpose, the tax treatment of a transaction is the purported or claimed U.S. federal income tax treatment of the transaction and the tax structure of a transaction is any fact that may be relevant to understanding the purported or claimed U.S. federal income tax treatment of the transaction. INVESTING IS SPECULATIVE AND INVOLVES RISK OF LOSS. YOU SHOULD REVIEW CAREFULLY THE REGISTRATION STATEMENT, INCLUDING THE DESCRIPTION OF THE RISKS AND OTHER TERMS BEFORE MAKING A DECISION TO INVEST. The Company has filed a Registration Statement (including a prospectus) with the SEC for the offering to which this presentation relates. Before you invest, you should read the prospectus contained in the Registration Statement and other documents the Company has filed with the SEC for more complete information about the Company and the offering. You may get these documents for free by visiting EDGAR on the SEC website at www.sec.gov. Alternatively, the Company, any underwriter or any dealer participating in the offering will arrange to send you the prospectus contained in the Registration Statement if you request it by calling FBR Capital Markets & Co. toll free at (800) 846–5050. The information contained herein contains forward-looking statements. These forward-looking statements are based on the Company’s current expectations, beliefs, projections, future plans and strategies, anticipated events or trends and similar expressions concerning matters that are not historical facts, as well as a number of assumptions concerning future events. These statements are subject to risks, uncertainties, assumptions and other important factors set forth in the Registration Statement, many of which are outside the Company’s control, that could cause actual results to differ materially from the results discussed in the forward-looking statements. Actual results may vary materially from those expressed or implied, and there can be no assurance that estimated returns or projections will be realized or that actual returns will not be materially different than estimated herein. Accordingly, you are cautioned not to place undue reliance on such forward-looking statements. You should conduct your own analysis, using such assumptions as you deem appropriate, and should fully consider other available information, including the information described under “Forward-Looking Statements” and “Risk Factors” in the Registration Statement, in making a decision to invest. Past performance is not necessarily indicative of future results. All forward-looking statements are based on information available to the Company as of the date hereof and the Company assumes no obligation to, and expressly disclaims any obligation to, update or revise any forward-looking statements, whether as a result of new information, future events or otherwise. To supplement the Company’s financial statements presented in accordance with generally accepted accounting principles (“GAAP”), the Company uses non-GAAP measures of certain components of financial performance. These non-GAAP measures are provided to enhance investors’ overall understanding of the Company’s current financial performance and its prospects for the future. This document includes an explanation of the non-GAAP measures presented and a reconciliation to measurement under GAAP. Specifically, the Company believes the non-GAAP results provide useful information to both management and investors. These measures should be considered in addition to results prepared in accordance with GAAP, but should not be considered a substitute for, or superior to, GAAP results. |
 3 November and Quarter to Date Highlights Continued strong profitability and improvement in asset quality metrics Net income of $7.2 million quarter to date - $3.7 million for November • Net interest margin of 2.49% quarter to date vs 2.38% for 3Q • Results exclude loan loss provision which will be determined at quarter end • Noninterest income of $18.1 million quarter to date vs $37.3 million 3Q – Continuing high single family loan originations and profit margins due to low mortgage interest rates – $12.9 million lower net MSR/hedge valuation adjustments quarter to date vs. 3Q due to stable spreads and lower volatility • Lower OREO expenses - $2.7 million quarter to date vs $9.1 million in 3Q • Operating efficiency ratio (1) declined to 60.2% vs. 61.7% in 3Q Asset quality improvement - November 30, 2011 vs September 30, 2011 • Classified assets declined $20.5 million or 9.1% • NPAs declined to 5.9% of total assets vs. 6.9% – Non performing loans decreased 11% to $85.1 million – OREO decreased 25.5% to $48.0 million (1) Operating efficiency is a Non-GAAP financial measure – see page 20 for description and discussion |
 4 Income Statement & Profitability Ratios 4 Q4 QTD Quarter Ended ($ in millions) 11/30/2011 9/30/2011 Income Statement Net Interest Income 8.6 $ 12.0 $ Provision for Loan Losses (1) 0.0 (1.0) Total Noninterest Income (2) 18.1 37.3 Total Noninterest Expense (3) 19.5 32.6 Income Before Taxes 7.2 15.7 Income Tax Expense 0.0 0.4 Net Income 7.2 $ 15.3 $ Profitability Ratios Net Interest Margin 2.49% 2.38% Operating Efficiency Ratio (4) 60.19% 61.72% Return on Average Equity 52.22% 83.04% Return on Average Assets 1.90% 2.67% Average Loan Yield (5) 4.74% 4.85% Average Cost of Deposits 1.23% 1.30% Average Cost of Funds 1.40% 1.48% Source: S-1 filing and HomeStreet Inc. (1) HomeStreet generally records provision expense at the end of each quarter. (2) Includes net MSR/hedge valuation (loss) gains of $(272,000), $(472,000) and $12.2 million in November, October and Q3 2011, respectively. (3) November OREO expenses were $219,000 vs. $2.4 million and $9.1 million in October and Q3 2011, respectively. (4) Noninterest expense adjusted for OREO expense. Noninterest income adjusted for net hedge gains (losses) and gains on AFS securities. See Appendix page 20 for reconciliation of non-GAAP financial measures. (5) Before impact of nonaccrual loans. |
 5 Balance Sheet 5 Source: S-1 and HomeStreet Inc. ($ in millions) 11/30/2011 10/31/2011 9/30/2011 Cash 215.8 $ 306.3 $ 138.4 $ Investments 340.9 282.7 339.5 Loans Held for Sale 158.1 132.0 226.6 Loans Held for Investment 1,369.4 1,401.1 1,413.4 Allowance for Loan Losses (50.9) (52.0) (53.2) Net Loans 1,318.5 1,349.1 1,360.2 Other Real Estate Owned 48.0 51.8 64.4 Mortgage Servicing Rights 79.6 80.7 74.1 Federal Home Loan Bank Stock 37.0 37.0 37.0 Other Assets 61.9 63.2 76.6 Total Assets 2,259.8 $ 2,302.8 $ 2,316.8 $ Deposits 2,007.1 $ 2,051.9 $ 2,057.0 $ Federal Home Loan Bank Borrowings 57.9 57.9 67.9 Other 108.5 109.8 111.6 Total Liabilities 2,173.5 2,219.6 2,236.5 Equity 86.3 83.2 80.3 Total Liabilities and Equity 2,259.8 $ 2,302.8 $ 2,316.8 $ |
 6 Asset Quality & Capital Adequacy 6 Source: S-1 filing and HomeStreet Inc. (1) Calculation based on Bank Tier 1 capital. Month Month Ended Ended Quarter Ended ($ in millions) 11/30/2011 10/31/2011 9/30/2011 Asset Quality Net Charge Offs 1.1 $ 1.1 $ 7.7 $ Nonperforming Loans 85.1 93.2 95.1 Other Real Estate Owned 48.0 51.8 64.4 Nonperforming Assets 133.1 $ 145.0 $ 159.5 $ Classified Assets 204.5 $ 213.4 $ 225.0 $ NPLs / Total Loans 6.2% 6.7% 6.7% NPAs / Total Assets 5.9% 6.3% 6.9% Classified Assets / Total Assets 9.0% 9.3% 9.7% Total Delinquencies / Total Loans 10.8% 11.1% 10.2% Reserves / Loans 3.7% 3.7% 3.8% Reserves / NPLs 59.8% 55.8% 55.9% NPAs / Tier 1 + ALLL (1) 72.5% 80.1% 89.0% Classified Assets / Tier 1 + ALLL (1) 111.4% 117.9% 125.6% Bank Capital Adequacy Tier 1 Leverage Ratio 5.9% 5.7% 5.6% Risk Based Capital Ratio 10.8% 10.5% 9.8% |
 7 Significant NPA Outflows Seven consecutive quarters of NPA outflows totaling ~$350 million (1) NPA Migration Source: HomeStreet Inc. (1) Since Q4 2009. (2) As of November 30, 2011. ($ in millions) Q4 09 Q1 10 Q2 10 Q3 10 Q4 10 Q1 11 Q2 11 Q3 11 10/31/2011 11/30/2011 Beginning Balance $452.0 $482.0 $450.4 $442.2 $390.6 $283.7 $223.0 $193.6 $159.5 $145.0 Additions to NPLs 117.9 20.7 83.5 37.8 22.3 28.9 14.2 20.9 2.3 2.3 Net Charge-Offs 26.7 11.7 20.6 36.2 14.6 2.1 4.7 7.7 1.1 1.1 OREO Sales 9.0 14.8 41.3 21.9 21.2 67.0 17.6 33.8 10.9 4.8 OREO Writedowns 3.7 (1.2) 5.1 7.2 16.4 10.6 4.7 8.2 2.5 0.2 Principal Paydown, Payoff, Advances 21.4 10.2 17.6 19.0 10.9 5.6 6.0 2.4 1.8 2.1 Transferred Back to Accrual Status 27.2 16.6 7.1 5.1 66.2 4.3 10.6 2.9 0.4 6.0 Subtractions from NPAs 87.9 52.2 91.7 89.4 129.2 89.6 43.6 55.0 16.7 14.2 Net Inflows / (Outflows) 30.0 (31.6) (8.2) (51.6) (106.9) (60.7) (29.4) (34.1) (14.4) (11.9) Ending Balance $482.0 $450.4 $442.2 $390.6 $283.7 $223.0 $193.6 $159.5 $145.0 $133.1 |
 8 Appendix |
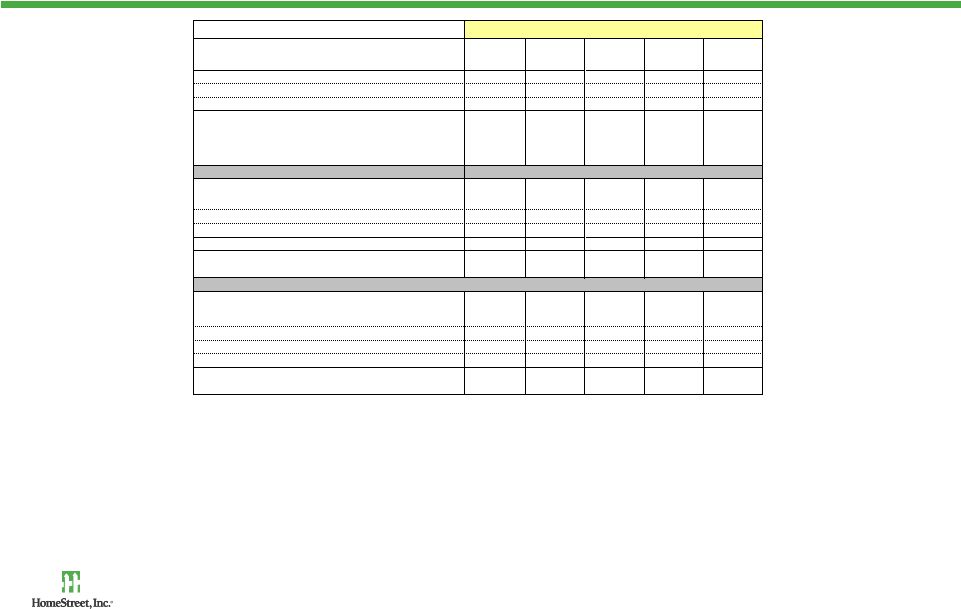
 9 Mortgage Banking Platform 2009, 2010 and YTD 2011 (1) mortgage originations of $2.7, $2.1 and $1.5 billion Source: S-1 filing and HomeStreet Inc. (1) As of November 30, 2011. (2) Excludes net MSR / hedge valuation gains/losses. (3) Basis points on closed loan production. Year to Date 11/30/2011 Quarter Ended 9/30/2011 Quarter to Date 11/30/2011 Revenue 35 36 37 Cost of Servicing 12 12 14 Servicing Income 23 24 23 Servicing Income (2) (bps) November 2011 QTD Mortgage Originations Q3 2011 Mortgage Originations HomeStreet Windermere Total Closed Loan Production 284 $ 113 $ 397 $ Rate Lock Commitments 259 106 365 Gain on Sale Income (bps) (3) Gross Revenue 370 236 332 Production Expense (181) (17) (186) Net Income 189 219 146 Quarter Ended 9/30/2011 ($ mm) HomeStreet Windermere Total Single Family Closed Loan Production 336 $ 142 $ 478 $ Rate Lock Commitments 462 169 631 Gain on Sale Income (bps) (3) Gross Revenue 403 185 338 Production Expense (222) (20) (228) Net Income 181 165 110 |
 10 Delinquency Trends Nov-11 3Q11 2Q11 1Q11 4Q10 Total Loans 1,369,446 1,413,386 1,451,930 1,562,706 1,602,698 30-59 Days Past Due 19,356 12,426 7,196 11,335 8,388 60-89 Days Past Due 8,741 6,615 8,709 8,494 13,185 90+ Days Past Due / Accruing 34,722 29,998 25,664 44,066 43,503 Non-Performing Loans (Non-Accrual) 85,107 95,094 90,912 124,118 113,210 Total Delinquency (includes NPLs) 147,926 144,132 132,481 188,013 178,286 Total Delinquency as % of Total Loans 10.8% 10.2% 9.1% 12.0% 11.1% NPLs w/ Current Payments 34,859 39,908 28,795 57,529 36,283 NPLs w/ Current Payments as % of NPLs 41.0% 42.0% 31.7% 46.4% 32.0% GNMA/Govt-Guar Delinquencies Total GNMA Loans 57,249 53,128 50,220 54,712 47,573 30-59 Days Past Due 4,107 3,987 3,641 4,088 2,366 60-89 Days Past Due 3,538 3,265 4,663 3,685 3,538 90+ Days Past Due / Accruing 34,722 29,998 25,664 31,584 30,174 Non-Performing Loans (Non-Accrual) 0 0 0 0 0 Total Delinquency (includes NPLs) 42,367 37,250 33,968 39,357 36,078 Total Delinquency as % of Total Loans 74.0% 70.1% 67.6% 71.9% 75.8% Total Delinquencies Less GNMA/Govt-Guar Delinquencies Total Loans 1,312,197 1,360,258 1,401,710 1,507,994 1,555,125 30-59 Days Past Due 15,249 8,439 3,554 7,247 6,022 60-89 Days Past Due 5,203 3,349 4,046 4,809 9,647 90+ Days Past Due / Accruing 0 0 0 12,482 13,329 Non-Performing Loans (Non-Accrual) 85,107 95,094 90,912 124,118 113,210 Total Delinquency (includes NPLs) 105,559 106,882 98,512 148,656 142,209 Total Delinquency as % of Total Loans 8.0% 7.9% 7.0% 9.9% 9.1% Credit Trends ($000's) November total delinquent loans excluding Single Family GNMA loans decreased $1.3 million or 1.2% from Q3 2011. • 30-59 days past due includes one new delinquent commercial real estate loan - $9.9 million unpaid principal balance for which we maintain specific reserves of $1.8 million (payment consistently running one month behind – modification with new investor under negotiation - see appendix page 15 – loan relationship ID #15). • 60-89 days past due increased due to Single Family loans, primarily in the core portfolio. • 90+ days past due increased due to Single Family GNMA loans. • For the quarter to date, nonperforming loans includes 28 new non-accrual Single Family/Home Equity loans totaling $4.3 million and no new commercial loans. |
 11 Nonperforming Loans (Dollars in Thousands) Nonperforming Loans Highlights • In November, nonperforming loans decreased $10.0 million from September primarily due to the upgrade of one commercial land loan ($1.4 million in unpaid principal balance), upgrade of one multifamily residential loan ($2.8 million in unpaid principal balance), pay-downs, charge-offs and transfers to OREO. November September June March December 2011 2011 2011 2011 2010 Single family 12,538 $ 15,469 $ 16,229 $ 14,732 $ 13,938 $ Commercial real estate 10,278 10,959 10,081 19,815 20,259 Multifamily residential 2,399 5,196 5,265 5,302 8,167 Construction/land development 55,977 58,705 53,955 77,811 65,952 Commercial business 987 1,993 2,762 3,355 2,359 Home equity 2,928 2,772 2,620 3,103 2,535 Total nonperforming loans 85,107 $ 95,094 $ 90,912 $ 124,118 $ 113,210 $ |
 12 Other Real Estate Owned (Dollars in Thousands) Days in OREO OREO Highlights November September June March December 2011 2011 2011 2011 2010 Single family 7,899 $ 10,419 $ 14,287 $ 14,897 $ 18,839 $ Commercial real estate 2,055 2,152 2,152 8,045 6,257 Multifamily residential - - - - - Construction/land development 38,083 51,797 86,029 75,688 145,359 Commercial business - - - - - Home equity - - 229 233 - Total OREO 48,037 $ 64,368 $ 102,697 $ 98,863 $ 170,455 $ November OREO balances decreased $16.3 million from September due to OREO sales of $15.7 million, valuation adjustments of $2.8 million and charge-offs of $0.5 million offset by transfers totaling $2.7 million. $12.8 million (27%) of OREO is contracted for sale, $12.7 million of which is scheduled to close in December. November gain on OREO sales 1.3% - year to date gain on sale is 0.3%. Days in OREO Total ($000's) % of Total Greater than 1 Year $25,437 53% 180 Days - 1 Year $4,822 10% 90 Days - 180 Days $13,913 29% Less than 90 Days $3,864 8% OREO Total $48,037 100.0% |
 13 25 Largest Performing Loan Relationships ID Loan Type Unpaid Principal Balance Partial Charge Offs Net Commitment Net Book Balance Specific Reserves Book Balance Net of Specific Reserves TDR Description 1 Commercial Real Estate $ 12,019,575 - $ 12,019,575 $ 12,019,575 $ - $ 12,019,575 $ No • One 40,000sqft two-story medical office building in Snohomish County, WA. Commercial Real Estate $ 7,672,008 - $ 7,672,008 $ 7,672,008 $ - $ 7,672,008 $ No • One 45,055sqft unanchored strip retail center in Pierce County, WA. Construction/Land Development $ 750,000 - $ 750,000 $ 750,000 $ - $ 750,000 $ No • 2.58 acres of commercial land approved for 77 potential apartment units and one commercial pad in Snohomish County, WA. Multifamily Residential $ 6,830,000 - $ 6,830,000 $ 6,830,000 $ - $ 6,830,000 $ No • One 97 unit 68,897sqft garden style apartment in Pierce County, WA Multifamily Residential $ 9,358,406 - $ 9,360,000 $ 9,358,406 $ - $ 9,358,406 $ No • One 180 unit 164,814sqft garden style apartment in Spokane County, WA Multifamily Residential $ 17,598,614 - $ 17,600,000 $ 17,598,614 $ - $ 17,598,614 $ No • One 210 unit 162,822sqft garden style apartment in Washington County, OR. TOTAL $ 54,228,603 $ - $ 54,231,582 $ 54,228,603 54,228,603 2 Commercial Real Estate $ 6,764,127 - $ 6,764,127 $ 6,764,127 $ - $ 6,764,127 $ No • One 30,258sqft three-building retail/office center in King County, WA. Construction/Land Development $ 27,265,000 - $ 29,600,000 $ 27,265,000 $ - $ 27,265,000 $ No • One 120,356sqft eight-building retail center in Pierce County, WA. TOTAL $ 34,029,127 $ - $ 36,364,127 $ 34,029,127 $ 34,029,127 3 Commercial Real Estate $ 25,869,994 - $ 25,869,994 $ 25,869,994 $ - $ 25,869,994 $ No • One 83,047sqft two-building mixed use office/retail development in King County, WA. 4 Construction/Land Development $ 22,270,500 - $ 22,270,500 $ 22,270,500 $ - $ 22,270,500 $ No • 148,289sqft of commercial land in King County, WA zoned for up to 800 multi-family units, but currently occupied by a 60,123sqft shopping center. Single Family $ 510,000 - $ 510,000 $ 510,000 $ 510,000 $ No • One condominium in King County, WA. TOTAL $ 22,780,500 $ - $ 22,780,500 $ 22,780,500 $ - $ 22,780,500 5 Commercial Real Estate $ 21,113,525 - $ 21,223,583 $ 21,113,525 $ - $ 21,113,525 $ No • One 97,888sqft retail center in Snohomish County, WA. 6 Construction/Land Development $ 15,750,000 - $ 15,750,000 $ 15,750,000 $ - $ 15,750,000 $ No • One retail mixed use center w/ 44,083sqft of office & retail plus 153 apartment units in King County, WA. 7 Commercial Real Estate $ 15,744,614 - $ 15,744,614 $ 15,744,614 $ - $ 15,744,614 $ Yes • Two office buildings with 88,757 sqft rentable area in Clackamas County, OR. • Additional collateral of a 63,546sqft three-story Class A office building in Clackamas County, OR. $ - $ $ - |
 14 25 Largest Performing Loan Relationships (continued) ID Loan Type Unpaid Principal Balance Partial Charge Offs Net Commitment Net Book Balance Specific Reserves Book Balance Net of Specific Reserves TDR Description 8 Commercial Real Estate $ 13,190,222 - $ 13,190,222 $ 13,190,222 $ - $ 13,190,222 $ No • One 41,951sqft office mixed use building in King County, WA. Commercial Real Estate $ 2,184,057 - $ 2,184,057 $ 2,184,057 $ - $ 2,184,057 $ No • One 9,209sqft retail center in Snohomish County, WA. TOTAL $ 15,374,278 $ - $ 15,374,278 $ 15,374,278 $ - $ 15,374,278 9 Commercial Business $ 13,115,161 - $ 14,734,999 $ 13,115,161 $ - $ 13,115,161 $ No • Heating and air conditioner contractor in King County, WA. 10 Construction/Land Development $ 309,741 - $ 309,741 $ 309,741 $ - $ 309,741 $ No • 26 finished detached residential lots in Thurston County, WA. Construction/Land Development $ 9,116,803 - $ 9,136,021 $ 9,116,803 $ - $ 9,116,803 $ No • 20.54-acres of residential land with preliminary plat approval for 120 detached lots located in Thurston County, WA. • 239-acres of raw land zoned for residential development of approximately 1,000 lots, located in Thurston Co, WA. Construction/Land Development $ 1,799,997 - $ 3,500,000 $ 1,799,997 $ - $ 1,799,997 $ No • 17 single family detached homes in Thurston County, WA. Single Family $ 177,300 - $ 177,300 $ 177,300 $ - $ 177,300 $ No • One single family residence in Thurston County, WA. Single Family $ 779,982 - $ 779,982 $ 779,982 $ 779,982 $ No • One single family residence in King County, WA. TOTAL $ 12,183,823 $ - $ 13,903,044 $ 12,183,823 $ - $ 12,183,823 11 Commercial Business $ 5,880,670 - $ 8,380,670 $ 5,880,670 $ - $ 5,880,670 $ No • Salvage and repair contractor in King & Mason, County, WA & Anchorage, AK. Commercial Real Estate $ 3,279,813 - $ 3,279,813 $ 3,279,813 $ - $ 3,279,813 $ No • One industrial/warehouses in King County, WA. • One industrial/warehouses in Anchorage, AK. Commercial Real Estate $ 1,117,277 - $ 1,117,277 $ 1,117,277 $ - $ 1,117,277 $ No • One office building in King County, WA. Single Family $ 514,186 - $ 514,186 $ 514,186 $ - $ 514,186 $ No • One condominium in King County, WA. Home Equity $ 163,389 - $ 163,389 $ 163,389 $ - $ 163,389 $ No • One single family residence in King County, WA. Home Equity $ 127,246 - $ 127,246 $ 127,246 $ - $ 127,246 $ No • One single family residence in Mason County, WA. TOTAL $ 11,082,580 $ - $ 13,582,580 $ 11,082,580 $ - $ 11,082,580 12 Commercial Real Estate $ 1,275,441 - $ 1,275,441 $ 1,275,441 $ - $ 1,275,441 $ No • One 21,560sqft office mixed use building in Whatcom County, WA. Commercial Real Estate $ 9,551,306 - $ 9,551,306 $ 9,551,306 $ - $ 9,551,306 $ No • One 42,036sqft retail center plus restaurant in Whatcom County, WA. Commercial Real Estate $ 1,787,513 - $ 1,787,513 $ 1,787,513 $ - $ 1,787,513 $ No • One 5,432sqft retail center in Whatcom County WA. TOTAL $ 12,614,260 $ - $ 12,614,260 $ 12,614,260 $ - $ 12,614,260 |
 15 25 Largest Performing Loan Relationships (continued) ID Loan Type Unpaid Principal Balance Partial Charge Offs Net Commitment Net Book Balance Specific Reserves Book Balance Net of Specific Reserves TDR Description 13 Single Family $ 10,482,497 - $ 10,482,497 $ 10,482,497 $ - $ 10,482,497 $ Yes/No * • 35 single family residences in Clark County, WA. • 18 single family residences in Clark County, WA. Home Equity $ 1,103,430 - $ 1,103,952 $ 1,103,430 $ - $ 1,103,430 $ Yes • 21 single family residences in Clark County, WA. TOTAL $ 11,585,928 $ - $ 11,586,449 $ 11,585,928 $ - $ 11,585,928 14 Commercial Real Estate $ 5,280,216 - $ 5,280,216 $ 5,280,216 $ - $ 5,280,216 $ No • One 24,100sqft office building in King County, WA. Commercial Real Estate $ 5,791,803 - $ 5,791,803 $ 5,791,803 $ - $ 5,791,803 $ No • One 54,726sqft multi-tenant office/industrial building in King County, WA. TOTAL $ 11,072,018 $ - $ 11,072,018 $ 11,072,018 $ - $ 11,072,018 15 Construction/Land Development $ 9,915,773 - $ 10,000,000 $ 9,915,773 $ 1,844,015 $ 8,071,758 $ No • One 45,587sqft office building in Multnomah County, OR. Single Family $ 1,002,362 - $ 1,002,362 $ 1,002,362 $ - $ 1,002,362 $ No • One single family residence in San Juan County, WA. TOTAL $ 10,918,135 $ - $ 11,002,362 $ 10,918,135 $ 1,844,015 $ 9,074,120 16 Commercial Real Estate $ 4,692,647 - $ 4,692,647 $ 4,692,647 $ - $ 4,692,647 $ No • One 50,439sqft office building in King County, WA. Commercial Real Estate $ 5,763,933 - $ 5,763,933 $ 5,763,933 $ - $ 5,763,933 $ No • One 70,066sqft multi-tenant light industrial building in King County, WA. TOTAL $ 10,456,580 $ - $ 10,456,580 $ 10,456,580 $ - $ 10,456,580 17 Commercial Real Estate $ 2,115,402 - $ 2,115,402 $ 2,115,402 $ - $ 2,115,402 $ No • One 12,714sqft multi-tenant office building in Marion County, OR. Commercial Real Estate $ 4,804,085 - $ 4,804,085 $ 4,804,085 $ - $ 4,804,085 $ No • One 34,585sqft laboratory building in Marion County, OR. Construction/Land Development $ 3,060,751 - $ 3,292,500 $ 3,060,751 $ - $ 3,060,751 $ No • One 21,747sqft medical office building in Marion County, OR. TOTAL $ 9,980,239 $ - $ 10,211,988 $ 9,980,239 $ - $ 9,980,239 18 Commercial Real Estate $ 8,547,971 - $ 8,547,971 $ 8,547,971 $ - $ 8,547,971 $ No • One 25,831sqft retail property in Snohomish County, WA. Construction/Land Development $ 839,948 - $ 839,948 $ 839,948 $ - $ 839,948 $ No • 12 finished lots in Snohomish County, WA. Construction/Land Development $ 482,288 - $ 490,665 $ 482,288 $ - $ 482,288 $ No • Four single family residences in Snohomish County, WA. TOTAL $ 9,870,206 $ - $ 9,878,583 $ 9,870,206 $ - $ 9,870,206 *Large borrower with multiple loans, some modified, some not. |
 16 25 Largest Performing Loan Relationships (continued) ID Loan Type Unpaid Principal Balance Partial Charge Offs Net Commitment Net Book Balance Specific Reserves Book Balance Net of Specific Reserves TDR Description 19 Commercial Real Estate $ 9,734,698 - $ 9,734,698 $ 9,734,698 $ - $ 9,734,698 $ No • One 31,100sqft retail center in Lewis County, WA. 20 Commercial Real Estate $ 2,594,103 - $ 2,594,103 $ 2,594,103 $ - $ 2,594,103 $ No • One 56,408sqft office mixed use building in Kitsap County, WA. Commercial Real Estate $ 2,283,507 - $ 2,283,507 $ 2,283,507 $ - $ 2,283,507 $ No • One 23,728sqft office building in Kitsap County, WA. Commercial Real Estate $ 1,779,124 - $ 1,779,124 $ 1,779,124 $ - $ 1,779,124 $ No • One 25,623sqft retail mixed use center in Kitsap County, WA. Commercial Real Estate $ 2,679,716 - $ 2,679,716 $ 2,679,716 $ - $ 2,679,716 $ No • One 56,104sqft retail center in Kitsap County, WA. TOTAL $ 9,336,450 $ - $ 9,336,450 $ 9,336,450 $ - $ 9,336,450 21 Commercial Real Estate $ 9,287,737 - $ 9,287,737 $ 9,287,737 $ - $ 9,287,737 $ Yes • One 127,818sqft retail center in Pierce County, WA. 22 Commercial Real Estate $ 8,988,716 - $ 8,988,716 $ 8,988,716 $ - $ 8,988,716 $ No Four separate 1st DOT loans on the following assets: • 18,511sqft work loft facility divided into 127 individual units in Multnomah County OR. • 16,645sqft work loft facility divided into 124 individual units in Multnomah County OR. • 20,376sqft work loft facility divided into 191 individual units in King County, WA. • 23,106sqft work loft facility divided into 202 individual units in King County, WA. 23 Construction/Land Development $ 191,000 - $ 191,000 $ 191,000 $ - $ 191,000 $ No • 15 finished lots in Spokane County, WA. Single Family $ 8,152,968 - $ 8,152,968 $ 8,152,968 $ - $ 8,152,968 $ No • 29 single family residences in Spokane County, WA. • 32 single family residences in Spokane County, WA. TOTAL $ 8,343,968 $ - $ 8,343,968 $ 8,343,968 $ - $ 8,343,968 24 Commercial Real Estate $ 8,214,006 - $ 8,269,521 $ 8,214,006 $ - $ 8,214,006 $ No • One 9,837sqft retail center and one 9,601sqft retail center in King County, WA. 25 Commercial Real Estate $ 7,525,971 - $ 7,525,971 $ 7,525,971 $ - $ 7,525,971 $ No • Two multi-tenant office buildings totaling 33,845sqft in Clackamas County, OR. GRAND TOTAL $ 379,201,118 $ - $ 387,868,603 $ 379,201,118 $ 1,844,015 $ 377,357,103 |
 17 Larger Non-Performing Relationships over $1MM ID Loan Type Unpaid Principal Balance Partial Charge Offs Net Commitment Net Book Balance Specific Reserves Book Balance Net of Specific Reserves TDR Description 1 Construction/Land Development 21,809,726 $ - $ 21,875,566 $ 21,809,726 $ 11,638,065 $ 10,171,661 $ No • 340 acre Community in Thurston County, WA with 124 acres zoned for residential development and 215 acres zoned for Commercial. 2 Construction/Land Development 5,340,827 $ - $ 5,340,827 $ 5,340,827 $ 535,048 $ 4,805,780 $ No • 125 finished detached lots in Yakima (31), Clark (24) and Grant (70) Counties in WA. Construction/Land Development 2,919,560 $ - $ 2,919,560 $ 2,919,560 $ 344,623 $ 2,574,937 $ No • 557 residential detached lots with preliminary plat approval located in Yakima (58), Grant (475) and Clark (24) Counties in WA. Construction/Land Development 1,495,460 $ - $ 4,892,990 $ 1,495,460 $ 59,958 $ 1,435,502 $ No • 13 detached single family residences in Clark (9) and Grant (4) Counties in WA. TOTAL 9,755,848 $ - $ 13,153,378 $ 9,755,848 $ 939,629 $ 8,816,218 $ 3 Construction/Land Development 9,747,383 $ - $ 10,269,201 $ 9,747,383 $ 5,916,902 $ 3,830,481 $ Yes • 65 residential finished lots, 7.72 acres partially improved land, and 67.45 acres of raw land zoned for 300 residential lots in Lane County, OR. 4 Construction/ Land Development $ 4,399,850 - $ 4,399,850 $ 4,399,850 $ 2,046,690 $ 2,353,160 $ No • 63 Completed attached lots including four with foundations and three partially Completed townhomes (averaging 1,657sqft) located in Clark County, WA. Construction/Land Development $ 412,398 - $ 467,673 $ 412,398 $ - $ 412,398 $ No • Three substantially completed single family townhomes averaging 1,740sqft located in Clark County, WA. Home Equity $ 165,180 (50,680) $ 128,820 $ 114,500 $ 114,500 $ No • One single family residence in Clark County, WA. TOTAL 4,977,429 $ (50,680) $ 4,996,343 $ 4,926,748 $ 2,046,690 $ 2,880,058 $ 5 Construction/Land Development 6,551,574 $ (1,877,331) $ 4,737,943 $ 4,674,243 $ 406,165 $ 4,268,078 $ Yes • 17 single family residences in King County, WA. 6 Commercial Real Estate 3,749,119 $ - $ 3,749,119 $ 3,749,119 $ - $ 3,749,119 $ No • Five gas stations in King County, WA. 7 Construction/Land Development 2,817,054 $ - $ 2,817,054 $ 2,817,054 $ - $ 2,817,054 $ No • One 41,431sqft single-tenant retail building located in Pierce County, WA. |
 18 Larger Non-Performing Relationships over $1MM (Continued) ID Loan Type Unpaid Principal Balance Partial Charge Offs Net Commitment Net Book Balance Specific Reserves Book Balance Net of Specific Reserves TDR Description 8 Construction/Land Development 345,688 $ (224,000) $ 121,688 $ 121,688 $ - $ 121,688 $ No • 51,299sqft of land with a farm house and several out buildings in Snohomish County, WA zoned for eight single family lots. Construction/Land Development 465,628 $ (272,637) $ 193,564 $ 192,991 $ 318 $ 192,673 $ No • 1.74 acres of land in Snohomish County, WA zoned for 20 townhomes. Multifamily Residential 2,398,952 $ - $ 2,465,236 $ 2,398,952 $ - $ 2,398,952 $ No • 13 unit apartment units plus a 3,500sqft office building in Snohomish County, WA. TOTAL 3,210,268 $ (496,637) $ 2,780,487 $ 2,713,631 $ 318 $ 2,713,313 $ 9 Commercial Real Estate 2,230,948 $ - $ 2,230,948 $ 2,230,948 $ - $ 2,230,948 $ No • One gas station in Clackamas County, OR. 10 Commercial Real Estate 1,828,044 $ - $ 1,828,044 $ 1,828,044 $ - $ 1,828,044 $ No • Four industrial/warehouse buildings totaling 33,617sqft in King County, WA. 11 Construction/Land Development 1,500,000 $ (442,500) $ 1,057,500 $ 1,057,500 $ 341,150 $ 716,350 $ Yes • Subordinated deed of trust secured by Borrower's 5,600sqft single family personal residence and 36,202sqft office building, both located in King County, WA. 12 Commercial Business - $ - $ 1,052,366 $ - $ - $ - $ No • Construction business in King County, WA. 13 Commercial Business 118,381 $ - $ 118,381 $ 118,381 $ - $ 118,381 $ No • One furniture store in King County, WA. Commercial Real Estate 916,095 $ - $ 916,095 $ 916,095 $ - $ 916,095 $ No • One furniture store in King County, WA. TOTAL 1,034,475 $ - $ 1,034,475 $ 1,034,475 $ - $ 1,034,475 $ GRAND TOTAL $ 69,211,867 $ (2,867,148) $ 71,582,424 $ 66,344,718 $ 21,288,919 $ 45,055,799 |
 19 10 Largest OREO Properties ID Description Location Property Type Sales Status Original Loan Balance LTD Charge-Offs Amount Transferred to OREO OREO Writedowns Carrying Value of OREO 1 40 acres of commercial land with zoning Thurston County, WA Construction/ Land Development Unsold $9,286,525 ($2,216,137) $7,070,388 ($3,660) $7,066,728 2 101 finished condo lots and land for 90 future condo units Snohomish County, WA Construction/ Land Development Sold: contracted to close in December $13,008,596 ($5,968,427) $7,040,169 ($2,681,919) $4,358,250 3 Excess raw land planned for 344 residential lots, 298 multi-family units; and two finished commercial tracts totaling 13.72 acres (7.5 acres useable) Thurston County, WA Construction/ Land Development Unsold $9,447,348 $530,303 $9,977,651 ($6,032,865) $3,944,786 4 Raw land entitlements for 53 residential lots and 14 multi-family pads supporting 451 units Pierce County, WA Construction/ Land Development Unsold $6,212,938 ($1,680,358) $4,532,580 ($993,555) $3,539,025 5 61 residential attached lots and 21 residential detached lots Pierce County, WA Construction/ Land Development Sold; contracted to close in December $6,516,372 ($4,583,431) $1,932,941 $0 $1,932,941 6 Two industrial buildings totaling 20,976 sqft Kitsap County, WA Commercial Real Estate Sold; contracted to close in December $2,193,458 ($41,775) $2,151,683 ($380,558) $1,771,125 7 71 residential detached lots and 29 residential attached lots Thurston County, WA Construction/ Land Development Unsold $4,000,000 $0 $4,000,000 ($2,387,448) $1,612,552 8 68 residential finished lots Kitsap County, WA Construction/ Land Development Unsold $3,515,177 ($996,178) $2,518,999 ($1,186,397) $1,332,602 9 35 acres of raw land with partial entitlements for 333 future lots Kitsap County, WA Construction/ Land Development Unsold $4,461,390 ($997,822) $3,463,568 ($2,210,275) $1,253,293 10 67 residential finished lots Pierce County, WA Construction/ Land Development Unsold $7,782,200 ($6,201,904) $1,580,297 ($452,278) $1,128,018 $66,424,005 ($22,155,729) $44,268,276 ($16,328,955) $27,939,321 Sales Status Summary TOTAL Sold 29% 8,062,316 $ Unsold 71% 19,877,005 $ GRAND TOTAL |
 20 Operating Efficiency Ratios We include an operating efficiency ratio which is not calculated based on accounting principles generally accepted in the United States (“GAAP”), but which we believe provides important information regarding our result of operations. Our calculation of the operating efficiency ratio is computed by dividing noninterest expense less costs related to OREO (gains (losses) on sales, valuation allowance adjustments, and maintenance and taxes) by total revenue (net interest income and noninterest income). Management uses this non-GAAP measurement as part of its assessment of performance in managing noninterest expense. We believe that costs related to OREO, net MSR hedge gain (loss) and AFS securities gains are more appropriately excluded from our calculation as an indication of our operating efficiency. The following table provides a reconciliation of non-GAAP to GAAP measurement. Nov / Oct 2011 3Q 2011 Efficiency Ratio 72.90% 66.25% Less impact of OREO Expense, net MSR hedge gain (loss) and AFS security gains -12.71% -4.53% Operating Efficiency Ratio 60.19% 61.72 |