Free Writing Prospectus
(To Preliminary Prospectus dated August 9, 2011)
Filed Pursuant to Rule 433
Registration Statement No. 333-173980
Dated September 13, 2011
Investor Presentation September 2011
Explanatory Note
The information set forth in this free writing prospectus amends and supersedes in its entirety that certain free writing prospectus filed on September 12, 2011 (SEC File No. 333-173980, Accession No. 0001193125-11-246140), which document should not be relied upon.
2
Notices
Please read the following notices before reviewing the information contained herein:
The information in this document has been prepared solely for informational purposes and does not constitute an offer to sell or the solicitation of an offer to purchase any securities from any entities described herein. Any such offer will be made solely by means of the prospectus contained in the registration statement (collectively, the “Registration Statement”) filed by HomeStreet Inc. (the “Company”) with the Securities and Exchange Commission (the “SEC”). The information contained herein may not be used in connection with an offer or solicitation by anyone in any jurisdiction in which such offer or solicitation is not permitted by law or in which the person making the offer or solicitation is not qualified to do so or to any person to whom it is unlawful to make such offer or solicitation.
All information herein is subject to revision. No representation or warranty can be given with respect to the accuracy or completeness of the information herein, or with respect to the terms of any future offer of securities conforming to the terms hereof. Any information herein shall be deemed superseded, amended, and supplemented in its entirety by the Registration Statement and any decision to invest in the securities offered thereby should be made solely in reliance upon the Registration Statement.
Nothing contained herein should be construed as tax, accounting or legal advice. Neither the Company nor any of its affiliates or representatives accept any responsibility for the tax treatment of any investment in the securities of the Company. You (and each of your employees, representatives or other agents) may disclose to any and all persons, without limitation of any kind, this tax treatment and tax structure of the transactions contemplated by these materials and all materials of any kind (including opinions or other tax analyses) that are provided to you relating to such tax treatment and structure. For this purpose, the tax treatment of a transaction is the purported or claimed U.S. federal income tax treatment of the transaction and the tax structure of a transaction is any fact that may be relevant to understanding the purported or claimed U.S. federal income tax treatment of the transaction.
INVESTING IS SPECULATIVE AND INVOLVES RISK OF LOSS. YOU SHOULD REVIEW CAREFULLY THE REGISTRATION STATEMENT, INCLUDING THE DESCRIPTION OF THE RISKS AND OTHER TERMS BEFORE MAKING A DECISION TO INVEST. The Company has filed a Registration Statement (including a prospectus) with the SEC for the offering to which this presentation relates. Before you invest, you should read the prospectus contained in the Registration Statement and other documents the Company has filed with the SEC for more complete information about the Company and the offering. You may get these documents for free by visiting EDGAR on the SEC website at www.sec.gov. Alternatively, the Company, any underwriter or any dealer participating in the offering will arrange to send you the prospectus contained in the Registration Statement if you request it by calling FBR Capital Markets & Co. toll free at (800) 846 – 5050.
The information contained herein contains forward-looking statements. These forward-looking statements are based on the Company’s current expectations, beliefs, projections, future plans and strategies, anticipated events or trends and similar expressions concerning matters that are not historical facts, as well as a number of assumptions concerning future events. These statements are subject to risks, uncertainties, assumptions and other important factors set forth in the Registration Statement, many of which are outside the Company’s control, that could cause actual results to differ materially from the results discussed in the forward-looking statements. Actual results may vary materially from those expressed or implied, and there can be no assurance that estimated returns or projections will be realized or that actual returns will not be materially different than estimated herein. Accordingly, you are cautioned not to place undue reliance on such forward-looking statements. You should conduct your own analysis, using such assumptions as you deem appropriate, and should fully consider other available information, including the information described under “Forward-Looking Statements” and “Risk Factors” in the Registration Statement, in making a decision to invest. Past performance is not necessarily indicative of future results.
All forward-looking statements are based on information available to the Company as of the date hereof and the Company assumes no obligation to, and expressly disclaims any obligation to, update or revise any forward-looking statements, whether as a result of new information, future events or otherwise. To supplement the Company’s financial statements presented in accordance with generally accepted accounting principles (“GAAP”), the Company uses non-GAAP measures of certain components of financial performance. These non-GAAP measures are provided to enhance investors’ overall understanding of the Company’s current financial performance and its prospects for the future. Specifically, the Company believes the non-GAAP results provide useful information to both management and investors. These measures should be considered in addition to results prepared in accordance with GAAP, but should not be considered a substitute for, or superior to, GAAP results.
3 |
|
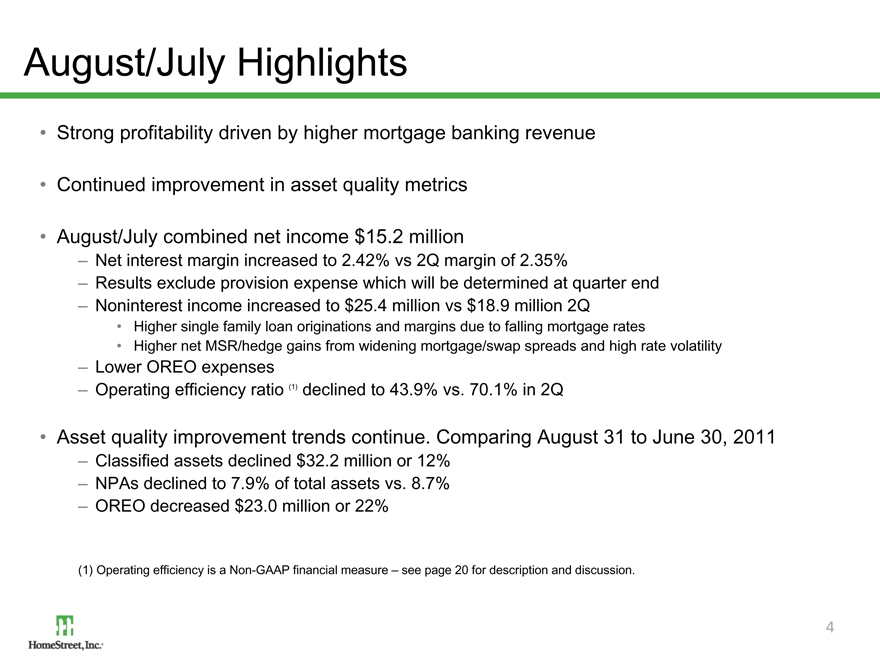
August/July Highlights
Strong profitability driven by higher mortgage banking revenue
Continued improvement in asset quality metrics
August/July combined net income $15.2 million
Net interest margin increased to 2.42% vs 2Q margin of 2.35%
Results exclude provision expense which will be determined at quarter end
Noninterest income increased to $25.4 million vs $18.9 million 2Q
Higher single family loan originations and margins due to falling mortgage rates
Higher net MSR/hedge gains from widening mortgage/swap spreads and high rate volatility
Lower OREO expenses
Operating efficiency ratio (1) declined to 43.9% vs. 70.1% in 2Q
Asset quality improvement trends continue. Comparing August 31 to June 30, 2011
Classified assets declined $32.2 million or 12%
NPAs declined to 7.9% of total assets vs. 8.7%
OREO decreased $23.0 million or 22%
(1) Operating efficiency is a Non-GAAP financial measure – see page 20 for description and discussion.
4
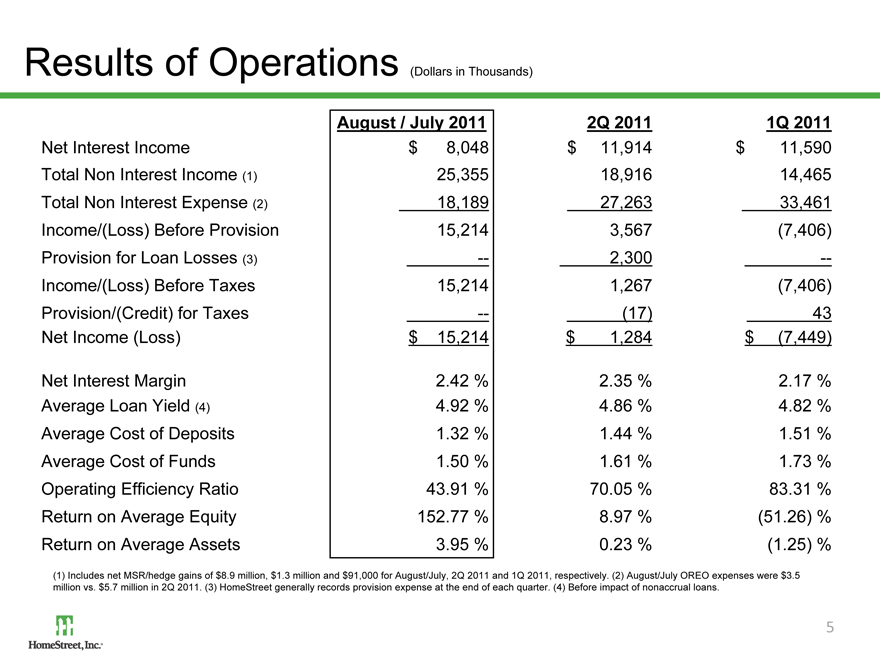
Results of Operations (Dollars in Thousands)
August / July 2011 2Q 2011 1Q 2011
Net Interest Income $ 8,048 $ 11,914 $ 11,590
Total Non Interest Income (1) 25,355 18,916 14,465
Total Non Interest Expense (2) 18,189 27,263 33,461
Income/(Loss) Before Provision 15,214 3,567(7,406)
Provision for Loan Losses (3) — 2,300 —
Income/(Loss) Before Taxes 15,214 1,267(7,406)
Provision/(Credit) for Taxes — (17) 43
Net Income (Loss) $ 15,214 $ 1,284 $ (7,449)
Net Interest Margin 2.42 % 2.35 % 2.17 %
Average Loan Yield (4) 4.92 % 4.86 % 4.82 %
Average Cost of Deposits 1.32 % 1.44 % 1.51 %
Average Cost of Funds 1.50 % 1.61 % 1.73 %
Operating Efficiency Ratio 43.91 % 70.05 % 83.31 %
Return on Average Equity 152.77 % 8.97 %(51.26) %
Return on Average Assets 3.95 % 0.23 % (1.25) %
(1) Includes net MSR/hedge gains of $8.9 million, $1.3 million and $91,000 for August/July, 2Q 2011 and 1Q 2011, respectively. (2) August/July OREO expenses were $3.5 million vs. $5.7 million in 2Q 2011. (3) HomeStreet generally records provision expense at the end of each quarter. (4) Before impact of nonaccrual loans.
5
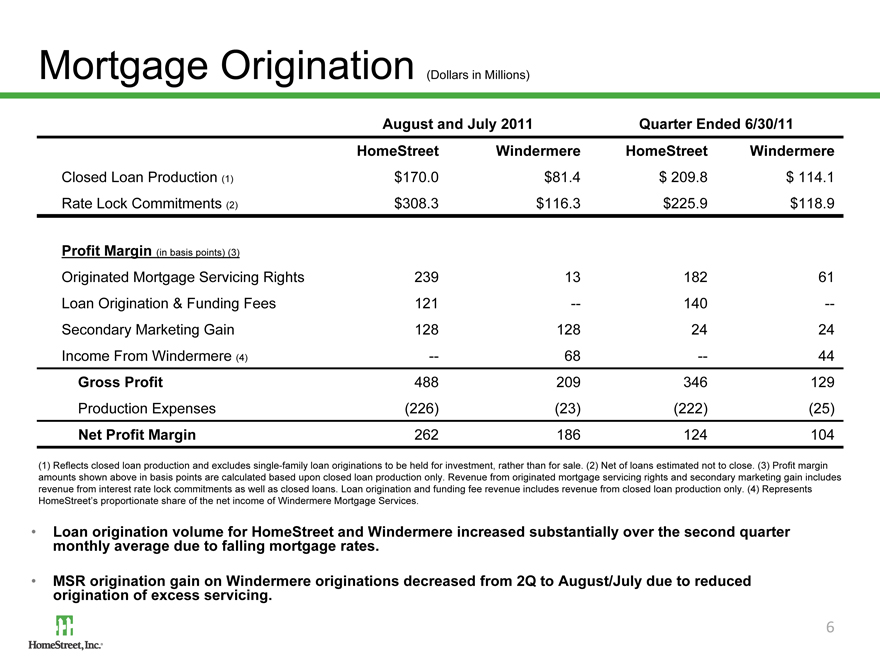
Mortgage Origination (Dollars in Millions)
August and July 2011 Quarter Ended 6/30/11
HomeStreet Windermere HomeStreet Windermere
Closed Loan Production (1) $170.0 $81.4 $ 209.8 $ 114.1
Rate Lock Commitments (2) $308.3 $116.3 $225.9 $118.9
Profit Margin (in basis points) (3)
Originated Mortgage Servicing Rights 239 13 182 61
Loan Origination & Funding Fees 121 — 140 —
Secondary Marketing Gain 128 128 24 24
Income From Windermere (4) — 68 — 44
Gross Profit 488 209 346 129
Production Expenses (226)(23)(222)(25)
Net Profit Margin 262 186 124 104
(1) Reflects closed loan production and excludes single-family loan originations to be held for investment, rather than for sale. (2) Net of loans estimated not to close. (3) Profit margin amounts shown above in basis points are calculated based upon closed loan production only. Revenue from originated mortgage servicing rights and secondary marketing gain includes revenue from interest rate lock commitments as well as closed loans. Loan origination and funding fee revenue includes revenue from closed loan production only. (4) Represents HomeStreet’s proportionate share of the net income of Windermere Mortgage Services.
6
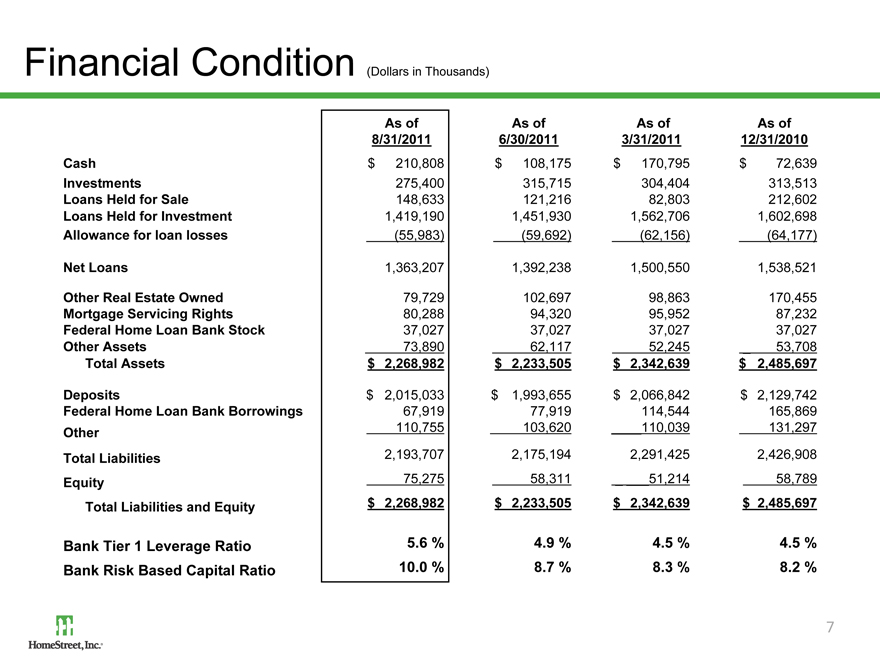
Financial Condition (Dollars in Thousands)
As of 8/31/2011 As of 6/30/2011 As of
3/31/2011 As of
12/31/2010
Cash $ 210,808 $ 108,175 $ 170,795 $ 72,639
Investments 275,400 315,715 304,404 313,513
Loans Held for Sale 148,633 121,216 82,803 212,602
Loans Held for Investment 1,419,190 1,451,930 1,562,706 1,602,698
Allowance for loan losses (55,983) (59,692) (62,156) (64,177)
Net Loans 1,363,207 1,392,238 1,500,550 1,538,521
Other Real Estate Owned 79,729 102,697 98,863 170,455
Mortgage Servicing Rights 80,288 94,320 95,952 87,232
Federal Home Loan Bank Stock 37,027 37,027 37,027 37,027
Other Assets 73,890 62,117 52,245 53,708
Total Assets $ 2,268,982 $ 2,233,505 $ 2,342,639 $ 2,485,697
Deposits $ 2,015,033 $ 1,993,655 $ 2,066,842 $ 2,129,742
Federal Home Loan Bank Borrowings 67,919 77,919 114,544 165,869
Other 110,755 103,620 110,039 131,297
Total Liabilities 2,193,707 2,175,194 2,291,425 2,426,908
Equity 75,275 58,311 51,214 58,789
Total Liabilities and Equity $ 2,268,982 $ 2,233,505 $ 2,342,639 $ 2,485,697
Bank Tier 1 Leverage Ratio 5.6 % 4.9 % 4.5 % 4.5 %
Bank Risk Based Capital Ratio 10.0 % 8.7 % 8.3 % 8.2 %
7
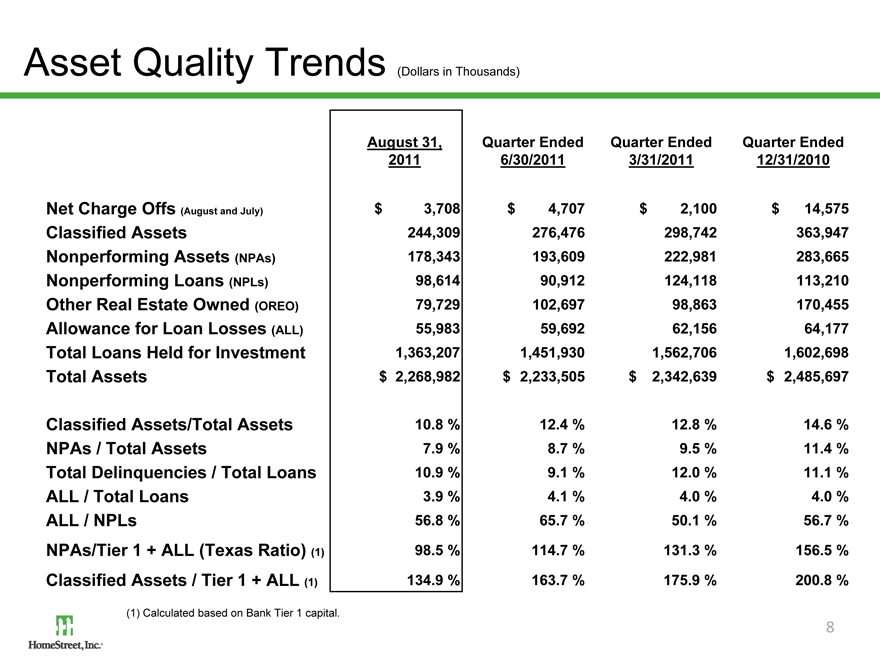
Asset Quality Trends (Dollars in Thousands)
August 31, 2011 Quarter Ended 6/30/2011 Quarter Ended 3/31/2011 Quarter Ended 12/31/2010
Net Charge Offs (August and July) $ 3,708 $ 4,707 $ 2,100 $ 14,575
Classified Assets 244,309 276,476 298,742 363,947
Nonperforming Assets (NPAs) 178,343 193,609 222,981 283,665
Nonperforming Loans (NPLs) 98,614 90,912 124,118 113,210
Other Real Estate Owned (OREO) 79,729 102,697 98,863 170,455
Allowance for Loan Losses (ALL) 55,983 59,692 62,156 64,177
Total Loans Held for Investment 1,363,207 1,451,930 1,562,706 1,602,698
Total Assets $ 2,268,982 $ 2,233,505 $ 2,342,639 $ 2,485,697
Classified Assets/Total Assets 10.8 % 12.4 % 12.8 % 14.6 %
NPAs / Total Assets 7.9 % 8.7 % 9.5 % 11.4 %
Total Delinquencies / Total Loans 10.9 % 9.1 % 12.0 % 11.1 %
ALL / Total Loans 3.9 % 4.1 % 4.0 % 4.0 %
ALL / NPLs 56.8 % 65.7 % 50.1 % 56.7 %
NPAs/Tier 1 + ALL (Texas Ratio) (1) 98.5 % 114.7 % 131.3 % 156.5 %
Classified Assets / Tier 1 + ALL (1) 134.9 % 163.7 % 175.9 % 200.8 %
(1) Calculated based on Bank Tier 1 capital.
8
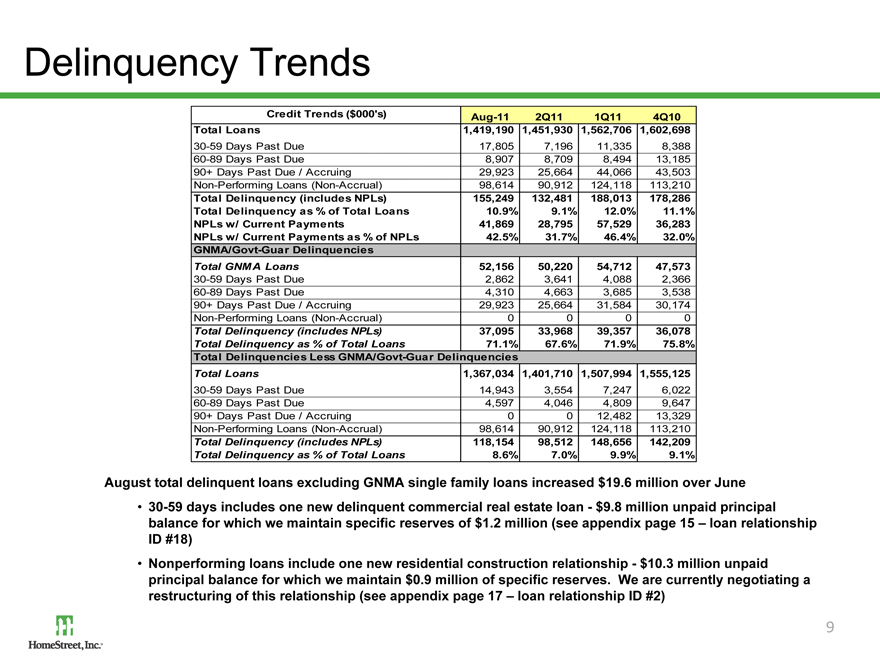
Delinquency Trends
Credit Trends ($000’s) Aug-11 2Q11 1Q11 4Q10 Total Loans 1,419,190 1,451,930 1,562,706 1,602,698
30-59 Days Past Due 17,805 7,196 11,335 8,388
60-89 Days Past Due 8,907 8,709 8,494 13,185 90+ Days Past Due / Accruing 29,923 25,664 44,066 43,503 Non-Performing Loans (Non-Accrual) 98,614 90,912 124,118 113,210
Total Delinquency (includes NPLs) 155,249 132,481 188,013 178,286 Total Delinquency as % of Total Loans 10.9% 9.1% 12.0% 11.1% NPLs w/ Current Payments 41,869 28,795 57,529 36,283 NPLs w/ Current Payments as % of NPLs 42.5% 31.7% 46.4% 32.0% GNMA/Govt-Guar Delinquencies Total GNMA Loans 52,156 50,220 54,712 47,573
30-59 Days Past Due 2,862 3,641 4,088 2,366
60-89 Days Past Due 4,310 4,663 3,685 3,538 90+ Days Past Due / Accruing 29,923 25,664 31,584 30,174 Non-Performing Loans (Non-Accrual) 0 0 0 0
Total Delinquency (includes NPLs) 37,095 33,968 39,357 36,078 Total Delinquency as % of Total Loans 71.1% 67.6% 71.9% 75.8% Total Delinquencies Less GNMA/Govt-Guar Delinquencies Total Loans 1,367,034 1,401,710 1,507,994 1,555,125
30-59 Days Past Due 14,943 3,554 7,247 6,022
60-89 Days Past Due 4,597 4,046 4,809 9,647 90+ Days Past Due / Accruing 0 0 12,482 13,329 Non-Performing Loans (Non-Accrual) 98,614 90,912 124,118 113,210
Total Delinquency (includes NPLs) 118,154 98,512 148,656 142,209 Total Delinquency as % of Total Loans 8.6% 7.0% 9.9% 9.1%
August total delinquent loans excluding GNMA single family loans increased $19.6 million over June
30-59 days includes one new delinquent commercial real estate loan—$9.8 million unpaid principal balance for which we maintain specific reserves of $1.2 million (see appendix page 15 – loan relationship ID #18)
Nonperforming loans include one new residential construction relationship—$10.3 million unpaid principal balance for which we maintain $0.9 million of specific reserves. We are currently negotiating a restructuring of this relationship (see appendix page 17 – loan relationship ID #2)
9
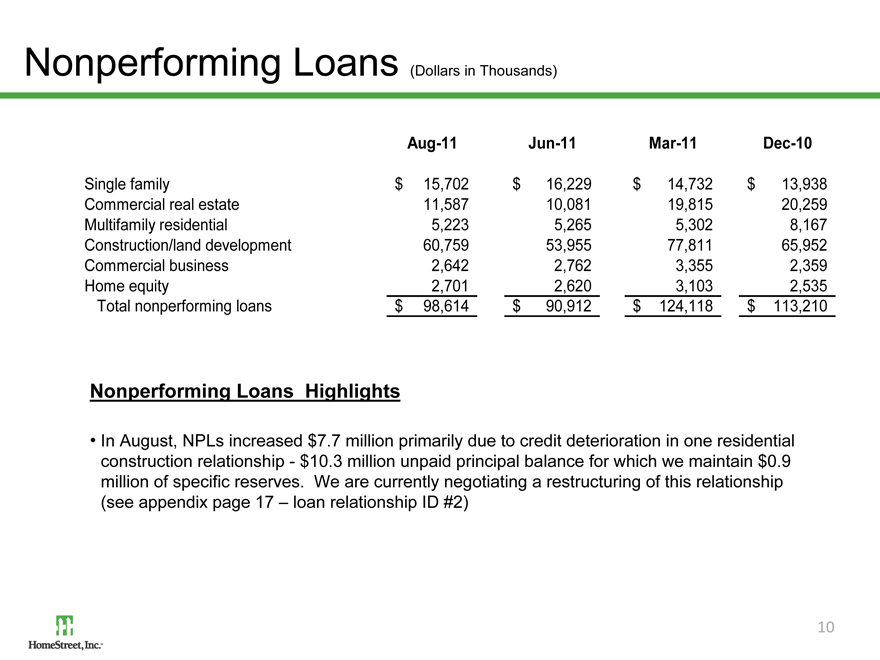
Nonperforming Loans (Dollars in Thousands)
Aug-11 Jun-11 Mar-11 Dec-10
Single family $ 15,702 $ 16,229 $ 14,732 $ 13,938
Commercial real estate 11,587 10,081 19,815 20,259
Multifamily residential 5,223 5,265 5,302 8,167
Construction/land development 60,759 53,955 77,811 65,952
Commercial business 2,642 2,762 3,355 2,359
Home equity 2,701 2,620 3,103 2,535
Total nonperforming loans $ 98,614 $ 90,912 $ 124,118 $ 113,210
Nonperforming Loans Highlights
In August, NPLs increased $7.7 million primarily due to credit deterioration in one residential construction relationship—$10.3 million unpaid principal balance for which we maintain $0.9 million of specific reserves. We are currently negotiating a restructuring of this relationship (see appendix page 17 – loan relationship ID #2)
10
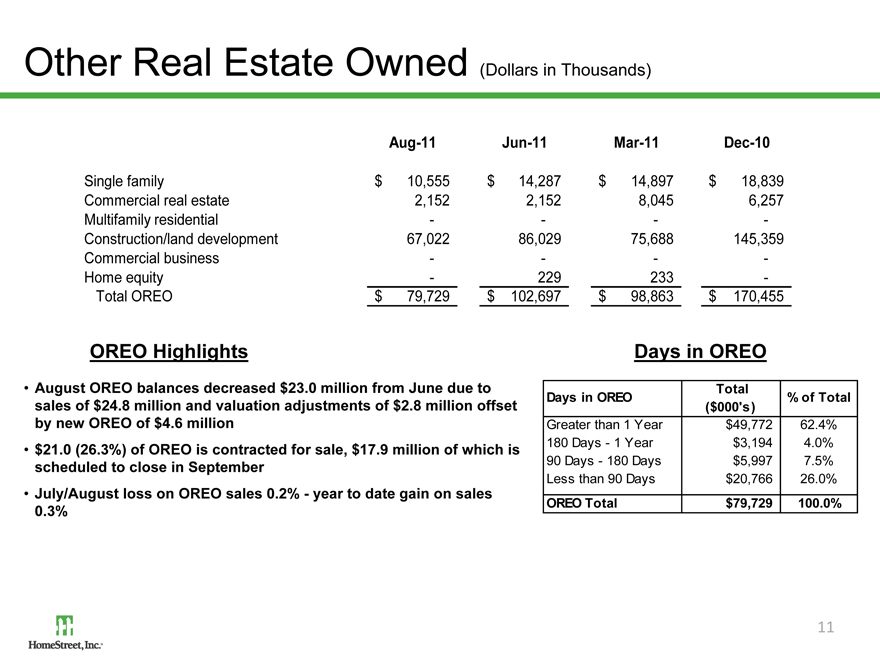
Other Real Estate Owned (Dollars in Thousands)
Aug-11 Jun-11 Mar-11 Dec-10
Single family $ 10,555 $ 14,287 $ 14,897 $ 18,839
Commercial real estate 2,152 2,152 8,045 6,257
Multifamily residential—— -
Construction/land development 67,022 86,029 75,688 145,359
Commercial business—— -
Home equity—229 233 -
Total OREO $ 79,729 $ 102,697 $ 98,863 $ 170,455
OREO Highlights
August OREO balances decreased $23.0 million from June due to sales of $24.8 million and valuation adjustments of $2.8 million offset by new OREO of $4.6 million
$21.0 (26.3%) of OREO is contracted for sale, $17.9 million of which is scheduled to close in September
July/August loss on OREO sales 0.2%—year to date gain on sales 0.3%
Days in OREO
Total
Days in OREO% of Total
($000’s)
Greater than 1 Year $49,772 62.4%
180 Days—1 Year $3,194 4.0%
90 Days—180 Days $5,997 7.5%
Less than 90 Days $20,766 26.0%
OREO Total $79,729 100.0%
11
Appendix
12
25 Largest Performing Loan Relationships
Unpaid Balance Net
Principal Partial Net Net Book Specific of Specific Description
ID Loan Type Balance Charge Offs Commitment Balance Reserves Reserves TDR
One 40,000sqft two-story medical office building
1 Commercial Real Estate $ 12,425,544 $—$ 12,425,544 $ 12,425,544 $—$ 12,425,544 No in Snohomish Co., WA.
Commercial Real Estate $ 7,736,659 $—$ 7,736,659 $ 7,736,659 $—$ 7,736,659 No • One 45,055sqft unanchored strip retail center in
Pierce Co., WA.
One 97 unit 68,897sqft garden style apartment
Multifamily Residential $ 6,830,000 $—$ 6,830,000 $ 6,830,000 $—$ 6,830,000 No in Pierce Co., WA
One 180 unit 164,814sqft garden style
Multifamily Residential $ 9,358,406 $—$ 9,360,000 $ 9,358,406 $—$ 9,358,406 No apartment in Spokane Co., WA
One 210 unit 162,822sqft garden style
Multifamily Residential $ 17,598,614 $—$ 17,600,000 $ 17,598,614 $—$ 17,598,614 No apartment in Washington Co., OR.
TOTAL $ 53,949,224 $—$ 53,952,203 $ 53,949,224 $—$ 53,949,224
2 Commercial Real Estate $ 6,764,127 $—$ 6,950,000 $ 6,764,127 $—$ 6,764,127 No • One 30,258sqft three-building retail/office
center in King Co., WA.
Construction/Land • One 120,356sqft eight-building retail center in
$ 27,265,000 $—$ 29,600,000 $ 27,265,000 $—$ 27,265,000 No
Development Pierce Co., WA.
TOTAL $ 34,029,127 $—$ 36,550,000 $ 34,029,127 $—$ 34,029,127
One 83,047sqft tw o-building mixed use
3 Commercial Real Estate $ 25,869,994 $—$ 25,869,994 $ 25,869,994 $—$ 25,869,994 No office/retail development in King Co., WA.
148,289sqft of commercial land in King Co., WA
Construction/Land zoned for up to 800 multi-family units, but
4 $ 22,270,500 $—$ 22,270,500 $ 22,270,500 $—$ 22,270,500 No
Development currently occupied by a 60,123sqft shopping
center.
Single Family $ 510,000 $—$ 510,000 $ 510,000 $ 510,000 No • One condominium in King Co., WA.
TOTAL $ 22,780,500 $—$ 22,780,500 $ 22,780,500 $—$ 22,780,500
One 97,888sqft retail center in Snohomish Co.,
5 Commercial Real Estate $ 21,113,525 $—$ 21,113,525 $ 21,113,525 $—$ 21,113,525 No WA.
Construction/Land • One retail mixed use center w / 44,083sqft of
6 $ 21,005,595 $—$ 21,005,595 $ 21,005,595 $—$ 21,005,595 No office & retail plus 153 apartment units in King Co.,
Development
WA.
Two office buildings with 89,435sqft rentable
area in Clackamas Co., OR.
7 Commercial Real Estate $ 15,769,667 $—$ 15,769,667 $ 15,769,667 $—$ 15,769,667 Yes • Additional collateral of a 63,546sqft three-story
Class A office building in Clackamas Co., OR.
13
25 Largest Performing Loan Relationships (continued)
Book
Unpaid Balance Net
Principal Partial Net Net Book Specific of Specific Description
ID Loan Type Balance Charge Offs Commitment Balance Reserves Reserves TDR
8 Commercial Real Estate $ 13,264,398 $—$ 13,264,398 $ 13,264,398 $—$ 13,264,398 No • One 41,951sqft office mixed use building in
King Co., WA.
Commercial Real Estate $ 2,194,026 $—$ 2,194,026 $ 2,194,026 $—$ 2,194,026 No • One 9,209sqft retail center in Snohomish Co.,
WA.
TOTAL $ 15,458,424 $—$ 15,458,424 $ 15,458,424 $—$ 15,458,424
• Heating and air conditioner contractor in King Co.
9 Commercial Business $ 13,637,149 $—$ 14,734,999 $ 13,637,149 $—$ 13,637,149 No WA.
Construction/Land • 43 finished detached residential lots in Thurston
10 $ 605,741 $—$ 605,741 $ 605,741 $—$ 605,741 No
Development Co., WA.
• 20.54-acres of residential land with preliminary
plat approval for 120 detached lots located in
Construction/Land Thurston Co., WA.
$ 9,256,803 $—$ 9,276,021 $ 9,256,803 $—$ 9,256,803 No
Development • 239-acres of raw land zoned for residential
development of approximately 1,000 lots, located
in Thurston Co, WA.
Construction/Land • Eight single family detached homes in Thurston
$ 1,061,914 $—$ 3,500,000 $ 1,061,914 $—$ 1,061,914 No
Development Co., WA.
Single Family $ 177,300 $—$ 177,300 $ 177,300 $—$ 177,300 No • One single family residence in Thurston Co.,
WA.
Single Family $ 783,214 $—$ 783,214 $ 783,214 $—$ 783,214 No • One single family residence in King Co., WA.
TOTAL $ 11,884,971 $—$ 14,342,275 $ 11,884,971 $—$ 11,884,971
11 Commercial Business $ 7,006,593 $—$ 8,506,593 $ 7,006,593 $—$ 7,006,593 No • Salvage and repair contractor in King & Mason,
Co., WA & Anchorage, AK.
Commercial Real Estate $ 3,299,481 $—$ 3,299,481 $ 3,299,481 $—$ 3,299,481 No • One industrial/warehouses in King Co., WA.
• One industrial/warehouses in Anchorage, AK.
Commercial Real Estate $ 1,124,804 $—$ 1,124,804 $ 1,124,804 $—$ 1,124,804 No • One office building in King Co., WA.
Single Family $ 516,038 $—$ 516,038 $ 516,038 $—$ 516,038 No • One condominium in King Co., WA.
• One single family residence in King Co., WA.
Home Equity $ 291,157 $—$ 291,157 $ 291,157 $—$ 291,157 No • One single family residence in Mason Co., WA.
TOTAL $ 12,238,073 $—$ 13,738,073 $ 12,238,073 $—$ 12,238,073
12 Commercial Real Estate $ 1,280,752 $—$ 1,280,752 $ 1,280,752 $—$ 1,280,752 No • One 21,560sqft office mixed use building in
Whatcom Co., WA.
Commercial Real Estate $ 9,588,930 $—$ 9,588,930 $ 9,588,930 $—$ 9,588,930 No • One 42,036sqft retail center plus restaurant in
Whatcom Co., WA.
Commercial Real Estate $ 1,794,957 $—$ 1,794,957 $ 1,794,957 $—$ 1,794,957 No • One 5,432sqft retail center in Whatcom Co. WA.
TOTAL $ 12,664,638 $—$ 12,664,638 $ 12,664,638 $—$ 12,664,638
14
25 Largest Performing Loan Relationships (continued)
Book
Unpaid Balance Net
Principal Partial Net Net Book Specific of Specific Description
ID Loan Type Balance Charge Offs Commitment Balance Reserves Reserves TDR
13 Single Family $ 7,842,926 $—$ 7,842,926 $ 7,842,926 $—$ 7,842,926 Yes • 35 single family residences in Clark Co., WA.
Single Family $ 2,644,974 $—$ 2,644,974 $ 2,644,974 $—$ 2,644,974 Yes • 18 single family residences in Clark Co., WA.
Home Equity $ 1,103,354 $—$ 1,103,952 $ 1,103,354 $—$ 1,103,354 Yes • 21 single family residences in Clark Co., WA.
TOTAL $ 11,591,253 $—$ 11,591,852 $ 11,591,253 $—$ 11,591,253
14 Commercial Real Estate $ 5,310,081 $—$ 5,310,081 $ 5,310,081 $—$ 5,310,081 No • One 24,100sqft office building in King Co., WA.
Commercial Real Estate $ 5,831,562 $—$ 5,831,562 $ 5,831,562 $—$ 5,831,562 No • One 54,726sqft multi-tenant office/industrial
building in King Co., WA.
TOTAL $ 11,141,643 $—$ 11,141,643 $ 11,141,643 $—$ 11,141,643
15 Commercial Real Estate $ 4,714,451 $—$ 4,714,451 $ 4,714,451 $—$ 4,714,451 No • One 50,439sqft office building in King Co., WA.
Commercial Real Estate $ 5,784,038 $—$ 5,784,038 $ 5,784,038 $—$ 5,784,038 No • One 70,066sqft multi-tenant light industrial
building in King Co., WA.
TOTAL $ 10,498,489 $—$ 10,498,489 $ 10,498,489 $—$ 10,498,489
16 Commercial Real Estate $ 2,123,432 $—$ 2,123,432 $ 2,123,432 $—$ 2,123,432 No • One 12,714sqft multi-tenant office building in
Marion Co., OR.
Commercial Real Estate $ 4,823,974 $—$ 4,823,974 $ 4,823,974 $—$ 4,823,974 No • One 34,585sqft laboratory building in Marion
Co., OR.
Construction/Land • One 21,747sqft medical office building in
$ 3,060,751 $—$ 3,292,500 $ 3,060,751 $—$ 3,060,751 No
Development Marion Co., OR.
TOTAL $ 10,008,157 $—$ 10,239,906 $ 10,008,157 $—$ 10,008,157
17 Commercial Real Estate $ 8,588,486 $—$ 8,588,486 $ 8,588,486 $—$ 8,588,486 No • One 25,831sqft retail property in Snohomish
Co., WA.
Construction/Land $ 839,948 $—$ 839,948 $ 839,948 $—$ 839,948 No • 15 finished lots in Snohomish Co., WA.
Development
Construction/Land • One single family residence in Snohomish Co.,
$ 397,276 $—$ 646,865 $ 397,276 $—$ 397,276 No
Development WA.
TOTAL $ 9,825,709 $—$ 10,075,298 $ 9,825,709 $—$ 9,825,709
Construction/Land • One 44,818sqft office building in Multnomah Co.,
18 $ 9,807,928 $—$ 10,000,000 $ 9,807,928 $ 1,904,640 $ 7,903,288 No
Development OR.
19 Commercial Real Estate $ 9,768,246 $—$ 9,768,246 $ 9,768,246 $—$ 9,768,246 No • One 31,100sqft retail center in Lew is Co., WA.
15
25 Largest Performing Loan Relationships (continued)
Book
Unpaid Balance Net
Principal Partial Net Net Book Specific of Specific Description
ID Loan Type Balance Charge Offs Commitment Balance Reserves Reserves TDR
20 Commercial Real Estate $ 2,606,354 $—$ 2,606,354 $ 2,606,354 $—$ 2,606,354 No • One 56,408sqft office mixed use building in
Kitsap Co., WA.
Commercial Real Estate $ 2,289,486 $—$ 2,289,486 $ 2,289,486 $—$ 2,289,486 No • One 23,728sqft office building in Kitsap Co.,
WA.
Commercial Real Estate $ 1,786,912 $—$ 1,786,912 $ 1,786,912 $—$ 1,786,912 No • One 25,623sqft retail mixed use center in Kitsap
Co., WA.
Commercial Real Estate $ 2,689,233 $—$ 2,689,233 $ 2,689,233 $—$ 2,689,233 No • One 56,104sqft retail center in Kitsap Co., WA.
TOTAL $ 9,371,986 $—$ 9,371,986 $ 9,371,986 $—$ 9,371,986
21 Commercial Real Estate $ 9,336,255 $—$ 9,336,255 $ 9,336,255 $—$ 9,336,255 Yes • One 127,818sqft retail center in Pierce Co., WA.
Four separate 1st DOT loans on the following
assets:
• 18,511sqft work loft facility divided into 127
individual units in Multnomah Co. OR.
• 16,645sqft work loft facility divided into 124
22 Commercial Real Estate $ 9,061,073 $—$ 9,061,073 $ 9,061,073 $—$ 9,061,073 No individual units in Multnomah Co. OR.
• 20,376sqft work loft facility divided into 191
individual units in King Co., WA.
• 23,106sqft work loft facility divided into 202
individual units in King Co., WA.
23 Commercial Real Estate $ 1,328,198 $—$ 1,328,198 $ 1,328,198 $—$ 1,328,198 No • One 19,422sqft office over retail mixed use
building in Multnomah Co., OR.
Commercial Real Estate $ 7,575,738 $—$ 7,575,738 $ 7,575,738 $—$ 7,575,738 No • Two multi-tenant office buildings totaling
33,845sqft in Clackamas Co., OR.
TOTAL $ 8,903,936 $—$ 8,903,936 $ 8,903,936 $—$ 8,903,936
Construction/Land
24 $ 461,000 $—$ 461,000 $ 461,000 $—$ 461,000 No • 17 finished lots in Spokane Co., WA.
Development
Single Family $ 3,883,917 $—$ 3,883,917 $ 3,883,917 $—$ 3,883,917 No • 29 single family residences in Spokane Co.,
WA.
Single Family $ 4,299,312 $—$ 4,299,312 $ 4,299,312 $—$ 4,299,312 No • 32 single family residences in Spokane Co.,
WA.
TOTAL $ 8,644,229 $—$ 8,644,229 $ 8,644,229 $—$ 8,644,229
• One 9,837sqft retail center and one 9,601sqft
25 Commercial Real Estate $ 8,234,627 $—$ 8,297,362 $ 8,234,627 $—$ 8,234,627 No retail center in King Co., WA.
GRAND TOTAL $386,594,420 $—$394,910,169 $386,594,420 $ 1,904,640 $384,689,780
16

15 Largest Non-Performing Loan Relationships
Book
Unpaid Balance Net
Principal Partial Net Net Book Specific of Specific
ID Loan Type Balance Charge Offs Commitment Balance Reserves Reserves TDR Description
• 340 acre community in Thurston Co., WA w ith
Construction/Land
1 $ 21,809,726 $—$ 21,875,566 $ 21,809,726 $ 11,442,592 $ 10,367,134 No 124 acres zoned for residential development and
Development 215 acres zoned for commercial.
Construction/Land • 124 finished detached lots in Yakima (33),
2 $ 5,435,327 $—$ 5,435,327 $ 5,435,327 $ 558,435 $ 4,876,892 No
Development Clark (19) and Grant (72) counties in WA.
Construction/Land • 554 residential detached lots with preliminary
Development $ 2,969,764 $—$ 2,969,764 $ 2,969,764 $ 247,074 $ 2,722,690 No plat approval located in Yakima (55), Grant (475) and Clark (24) counties in WA.
Construction/Land • 17 detached single family residences in Yakima
$ 1,936,580 $—$ 5,126,689 $ 1,936,580 $ 42,489 $ 1,894,091 No
Development(2), Clark (10) and Grant (5) counties in WA.
TOTAL $ 10,341,671 $—$ 13,531,780 $ 10,341,671 $ 847,998 $ 9,493,673
• 72 residential finished lots, 7.72 acres partially
Construction/Land
3 $ 10,152,383 $—$ 10,674,201 $ 10,152,383 $ 5,062,043 $ 5,090,340 Yes improved land, and 67.45 acres of raw land zoned
Development for 300 residential lots in Lane Co., OR.
Construction/Land • 17 single family residences in King Co., WA.
4 $ 6,434,976 $ (1,667,331) $ 4,947,943 $ 4,767,645 $ 462,229 $ 4,305,417 Yes
Development • One single family residences in Kitsap Co., WA.
• 63 completed attached lots including four with
Construction/ Land foundations and three partially completed
5 $ 4,399,850 $—$ 4,399,850 $ 4,399,850 $ 2,047,601 $ 2,352,249 No
Development townhomes (averaging 1,657sqft) located in Clark
Co., WA.
Construction/Land • Three completed single family townhomes
$ 412,398 $—$ 467,673 $ 412,398 $—$ 412,398 No
Development averaging 1,740sqft located in Clark Co., WA.
Home Equity $ 165,180 $ (50,680) $ 128,820 $ 114,500 $—$ 114,500 No • One single family residence in Clark Co., WA.
TOTAL $ 4,977,429 $ (50,680) $ 4,996,343 $ 4,926,748 $ 2,047,601 $ 2,879,147
Construction/Land • 6.88 acres of land in Multnomah Co., OR for
6 $ 1,414,993 $—$ 1,414,993 $ 1,414,993 $—$ 1,414,993 Yes multi-family (rentals) development up to 147
Development
units.
Multifamily Residential $ 2,808,429 $—$ 2,808,429 $ 2,808,429 $—$ 2,808,429 Yes • 38 unit garden apartment in Multnomah Co.,
OR.
TOTAL $ 4,223,422 $—$ 4,223,422 $ 4,223,422 $—$ 4,223,422
7 Commercial Real Estate $ 3,890,182 $—$ 3,890,182 $ 3,890,182 $—$ 3,890,182 No • Five gas stations in King Co., WA.
17
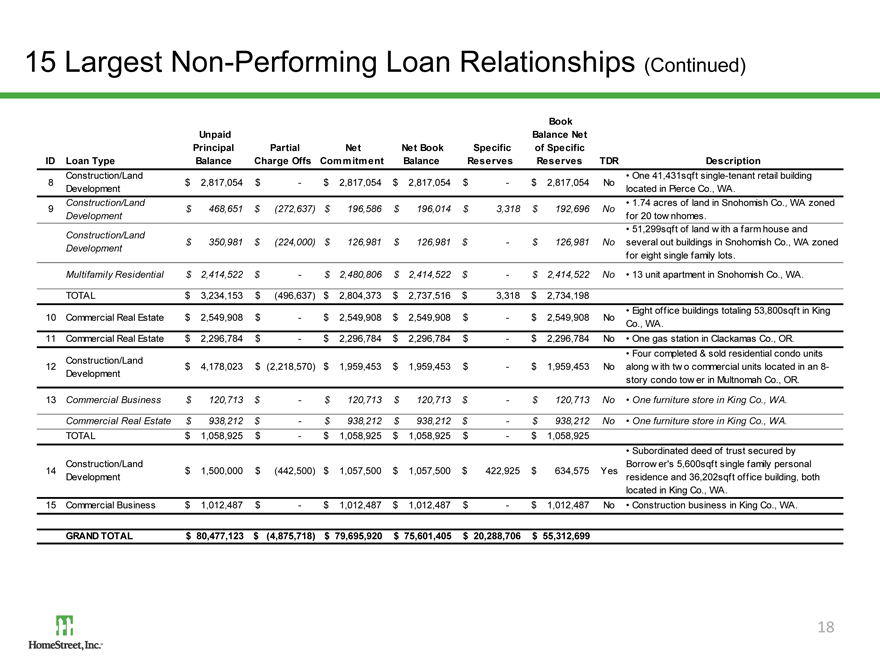
15 Largest Non-Performing Loan Relationships (Continued)
Book
Unpaid Balance Net
Principal Partial Net Net Book Specific of Specific
ID Loan Type Balance Charge Offs Commitment Balance Reserves Reserves TDR Description
Construction/Land • One 41,431sqft single-tenant retail building
8 $ 2,817,054 $—$ 2,817,054 $ 2,817,054 $—$ 2,817,054 No
Development located in Pierce Co., WA.
Construction/Land • 1.74 acres of land in Snohomish Co., WA zoned
9 $ 468,651 $ (272,637) $ 196,586 $ 196,014 $ 3,318 $ 192,696 No
Development for 20 tow nhomes.
Construction/Land • 51,299sqft of land w ith a farm house and
Development $ 350,981 $ (224,000) $ 126,981 $ 126,981 $—$ 126,981 No several out buildings in Snohomish Co., WA zoned
for eight single family lots.
Multifamily Residential $ 2,414,522 $—$ 2,480,806 $ 2,414,522 $—$ 2,414,522 No • 13 unit apartment in Snohomish Co., WA.
TOTAL $ 3,234,153 $ (496,637) $ 2,804,373 $ 2,737,516 $ 3,318 $ 2,734,198
• Eight office buildings totaling 53,800sqft in King
10 Commercial Real Estate $ 2,549,908 $—$ 2,549,908 $ 2,549,908 $—$ 2,549,908 No Co., WA.
11 Commercial Real Estate $ 2,296,784 $—$ 2,296,784 $ 2,296,784 $—$ 2,296,784 No • One gas station in Clackamas Co., OR.
• Four completed & sold residential condo units
Construction/Land
12 $ 4,178,023 $ (2,218,570) $ 1,959,453 $ 1,959,453 $—$ 1,959,453 No along w ith tw o commercial units located in an 8-
Development story condo tow er in Multnomah Co., OR.
13 Commercial Business $ 120,713 $—$ 120,713 $ 120,713 $—$ 120,713 No • One furniture store in King Co., WA.
Commercial Real Estate $ 938,212 $—$ 938,212 $ 938,212 $—$ 938,212 No • One furniture store in King Co., WA.
TOTAL $ 1,058,925 $—$ 1,058,925 $ 1,058,925 $—$ 1,058,925
• Subordinated deed of trust secured by
Construction/Land Borrow er’s 5,600sqft single family personal
14 $ 1,500,000 $ (442,500) $ 1,057,500 $ 1,057,500 $ 422,925 $ 634,575 Yes
Development residence and 36,202sqft office building, both
located in King Co., WA.
15 Commercial Business $ 1,012,487 $—$ 1,012,487 $ 1,012,487 $—$ 1,012,487 No • Construction business in King Co., WA.
GRAND TOTAL $ 80,477,123 $ (4,875,718) $ 79,695,920 $ 75,601,405 $ 20,288,706 $ 55,312,699
18
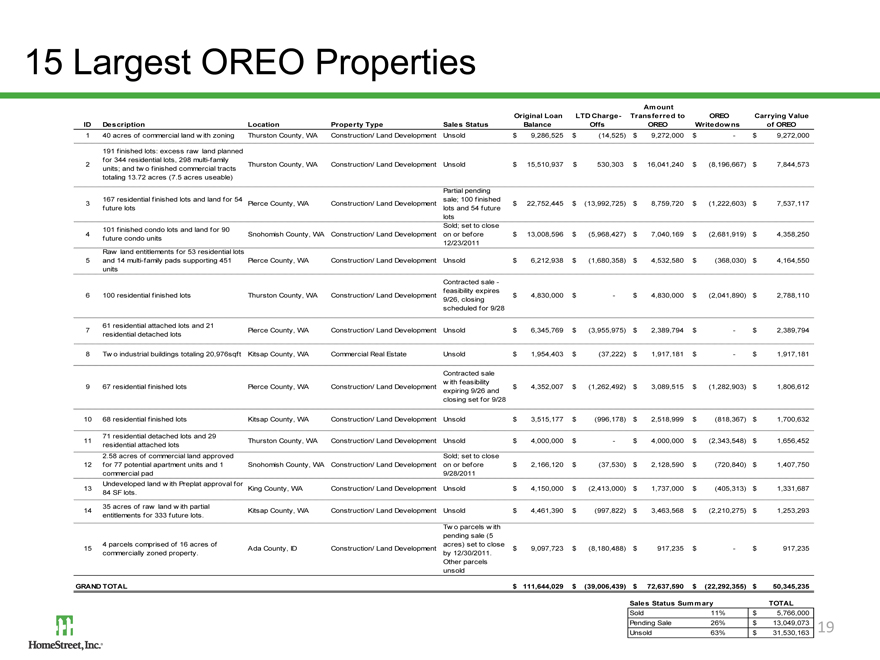
15 Largest OREO Properties
Amount
Original Loan LTD Charge- Transferred to OREO Carrying Value
ID Description Location Property Type Sales Status Balance Offs OREO Writedowns of OREO
1 40 acres of commercial land w ith zoning Thurston County, WA Construction/ Land Development Unsold $ 9,286,525 $(14,525) $ 9,272,000 $—$ 9,272,000
191 finished lots: excess raw land planned
for 344 residential lots, 298 multi-family
2 Thurston County, WA Construction/ Land Development Unsold $ 15,510,937 $ 530,303 $ 16,041,240 $ (8,196,667) $ 7,844,573
units; and tw o finished commercial tracts
totaling 13.72 acres (7.5 acres useable)
Partial pending
167 residential finished lots and land for 54 sale; 100 finished
3 |
| Pierce County, WA Construction/ Land Development $ 22,752,445 $ (13,992,725) $ 8,759,720 $ (1,222,603) $ 7,537,117 |
future lots lots and 54 future
lots
101 finished condo lots and land for 90 Sold; set to close
4 Snohomish County, WA Construction/ Land Development on or before $ 13,008,596 $ (5,968,427) $ 7,040,169 $ (2,681,919) $ 4,358,250
future condo units
12/23/2011
Raw land entitlements for 53 residential lots
5 and 14 multi-family pads supporting 451 Pierce County, WA Construction/ Land Development Unsold $ 6,212,938 $ (1,680,358) $ 4,532,580 $ (368,030) $ 4,164,550
units
Contracted sale -
feasibility expires
6 100 residential finished lots Thurston County, WA Construction/ Land Development $ 4,830,000 $—$ 4,830,000 $ (2,041,890) $ 2,788,110
9/26, closing
scheduled for 9/28
61 |
| residential attached lots and 21 |
7 |
| Pierce County, WA Construction/ Land Development Unsold $ 6,345,769 $ (3,955,975) $ 2,389,794 $—$ 2,389,794 |
residential detached lots
8 Tw o industrial buildings totaling 20,976sqft Kitsap County, WA Commercial Real Estate Unsold $ 1,954,403 $(37,222) $ 1,917,181 $—$ 1,917,181
Contracted sale
w ith feasibility
9 67 residential finished lots Pierce County, WA Construction/ Land Development $ 4,352,007 $ (1,262,492) $ 3,089,515 $ (1,282,903) $ 1,806,612
expiring 9/26 and
closing set for 9/28
10 68 residential finished lots Kitsap County, WA Construction/ Land Development Unsold $ 3,515,177 $(996,178) $ 2,518,999 $ (818,367) $ 1,700,632
71 |
| residential detached lots and 29 |
11 |
| Thurston County, WA Construction/ Land Development Unsold $ 4,000,000 $—$ 4,000,000 $ (2,343,548) $ 1,656,452 |
residential attached lots
2.58 |
| acres of commercial land approved Sold; set to close |
12 for 77 potential apartment units and 1 Snohomish County, WA Construction/ Land Development on or before $ 2,166,120 $(37,530) $ 2,128,590 $ (720,840) $ 1,407,750
commercial pad 9/28/2011
Undeveloped land w ith Preplat approval for
13 |
| King County, WA Construction/ Land Development Unsold $ 4,150,000 $ (2,413,000) $ 1,737,000 $ (405,313) $ 1,331,687 |
84 |
| SF lots. |
35 |
| acres of raw land w ith partial |
14 Kitsap County, WA Construction/ Land Development Unsold $ 4,461,390 $(997,822) $ 3,463,568 $ (2,210,275) $ 1,253,293
entitlements for 333 future lots.
Tw o parcels w ith
pending sale (5
4 |
| parcels comprised of 16 acres of acres) set to close |
15 |
| Ada County, ID Construction/ Land Development $ 9,097,723 $ (8,180,488) $ 917,235 $—$ 917,235 |
commercially zoned property. by 12/30/2011.
Other parcels
unsold
GRAND TOTAL $ 111,644,029 $ (39,006,439) $ 72,637,590 $ (22,292,355) $ 50,345,235
Sales Status Summary TOTAL
Sold 11% $ 5,766,000
Pending Sale 26% $ 13,049,073
Unsold 63% $ 31,530,163
19
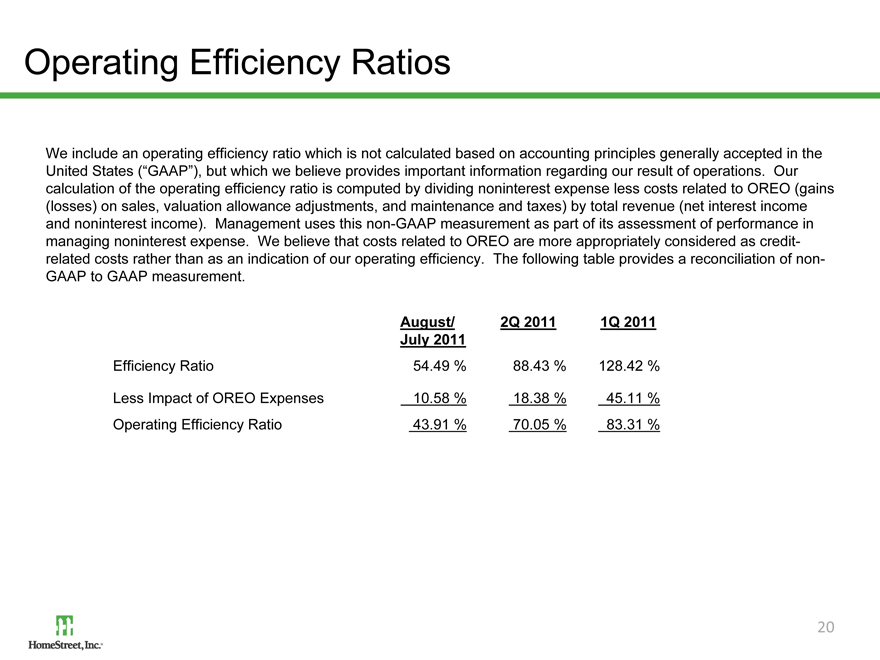
Operating Efficiency Ratios
We include an operating efficiency ratio which is not calculated based on accounting principles generally accepted in the United States (“GAAP”), but which we believe provides important information regarding our result of operations. Our calculation of the operating efficiency ratio is computed by dividing noninterest expense less costs related to OREO (gains (losses) on sales, valuation allowance adjustments, and maintenance and taxes) by total revenue (net interest income and noninterest income). Management uses this non-GAAP measurement as part of its assessment of performance in managing noninterest expense. We believe that costs related to OREO are more appropriately considered as credit-related costs rather than as an indication of our operating efficiency. The following table provides a reconciliation of non-GAAP to GAAP measurement.
August/ 2Q 2011 1Q 2011
July 2011
Efficiency Ratio 54.49% 88.43% 128.42%
Less Impact of OREO Expenses 10.58% 18.38% 45.11%
Operating Efficiency Ratio 43.91% 70.05% 83.31%
20