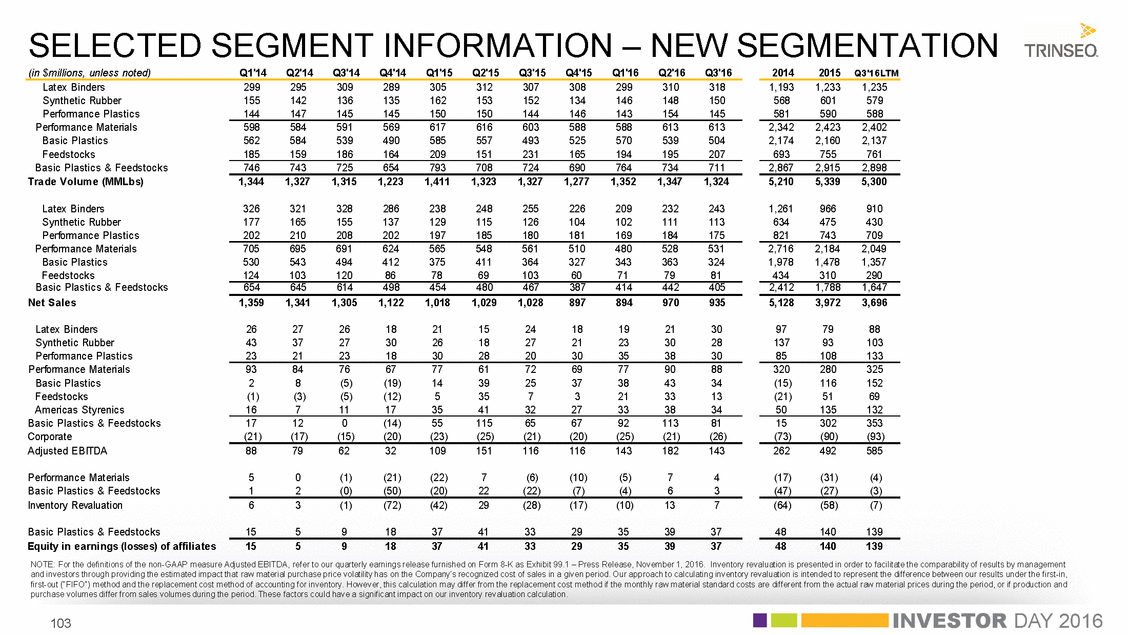
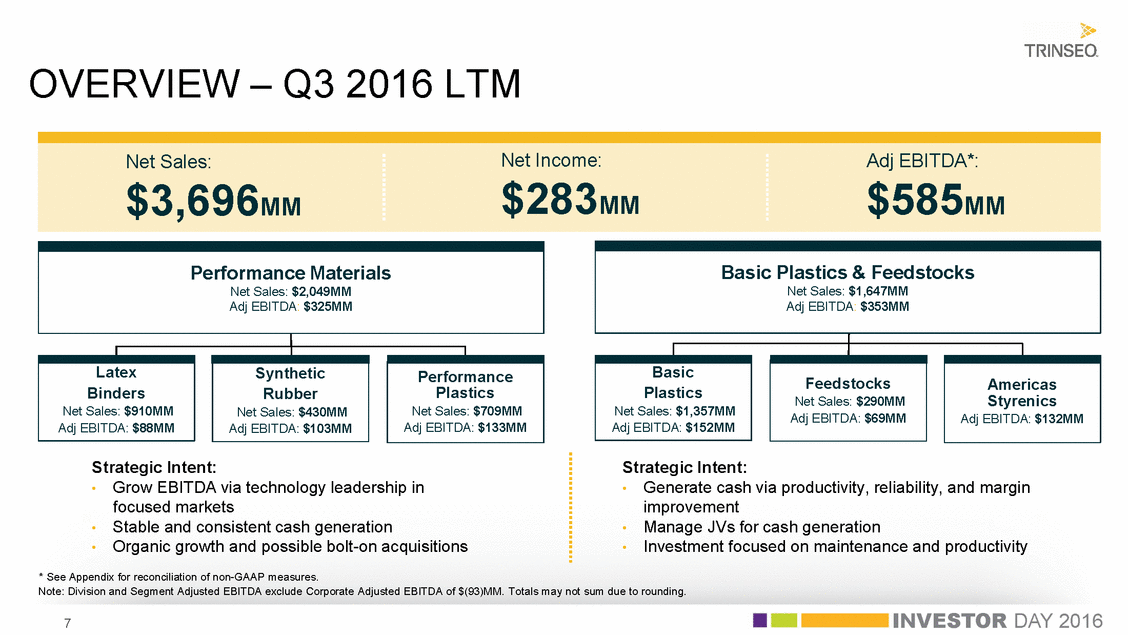
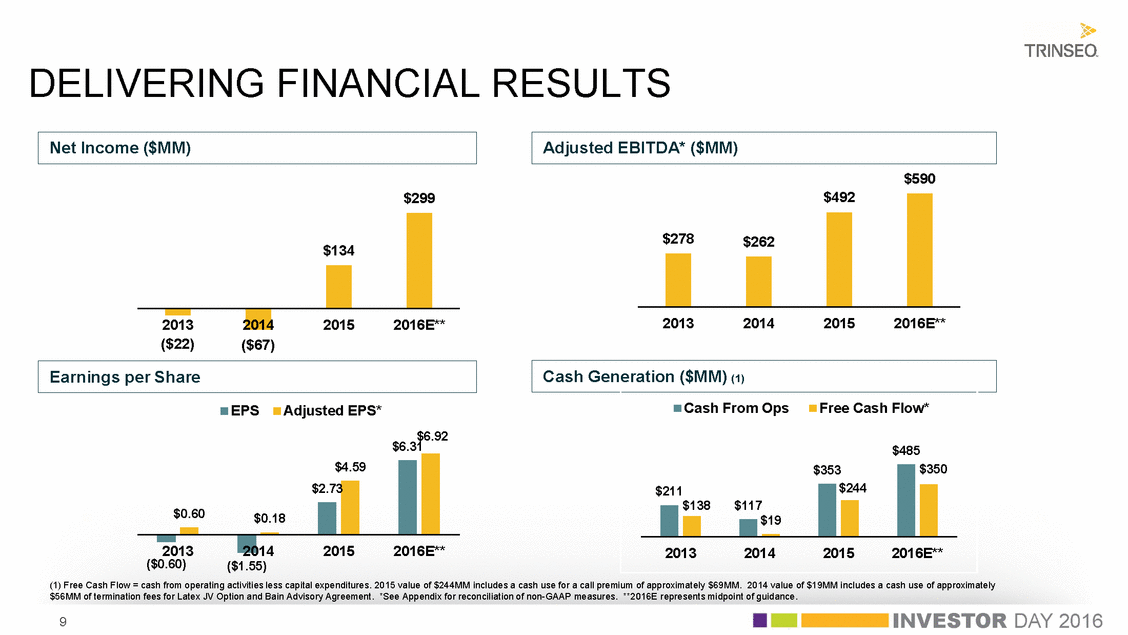
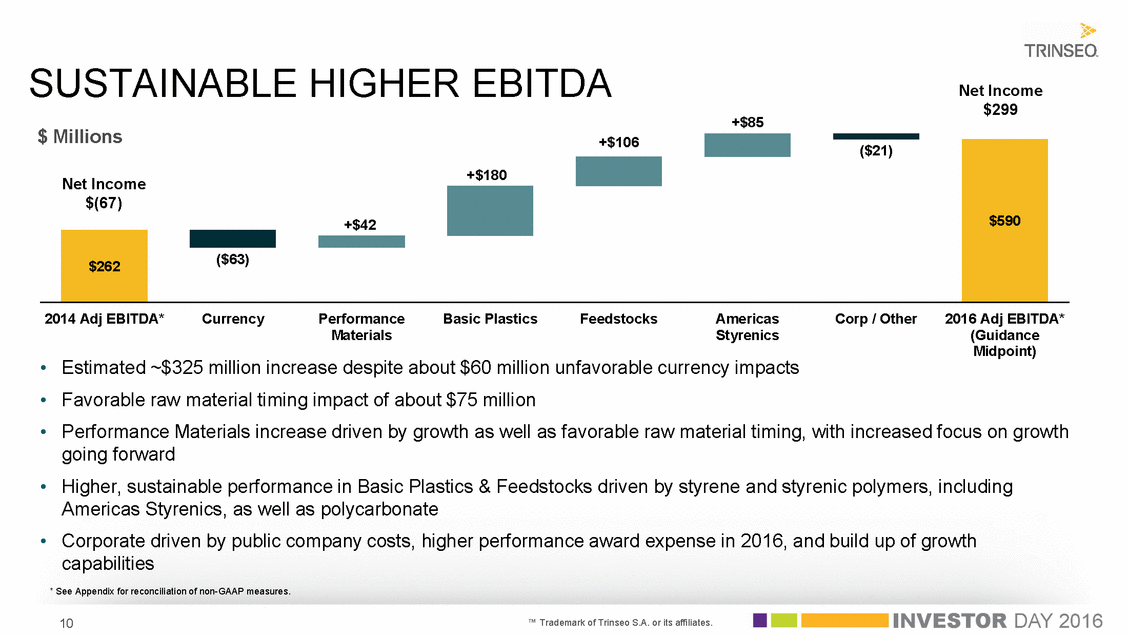
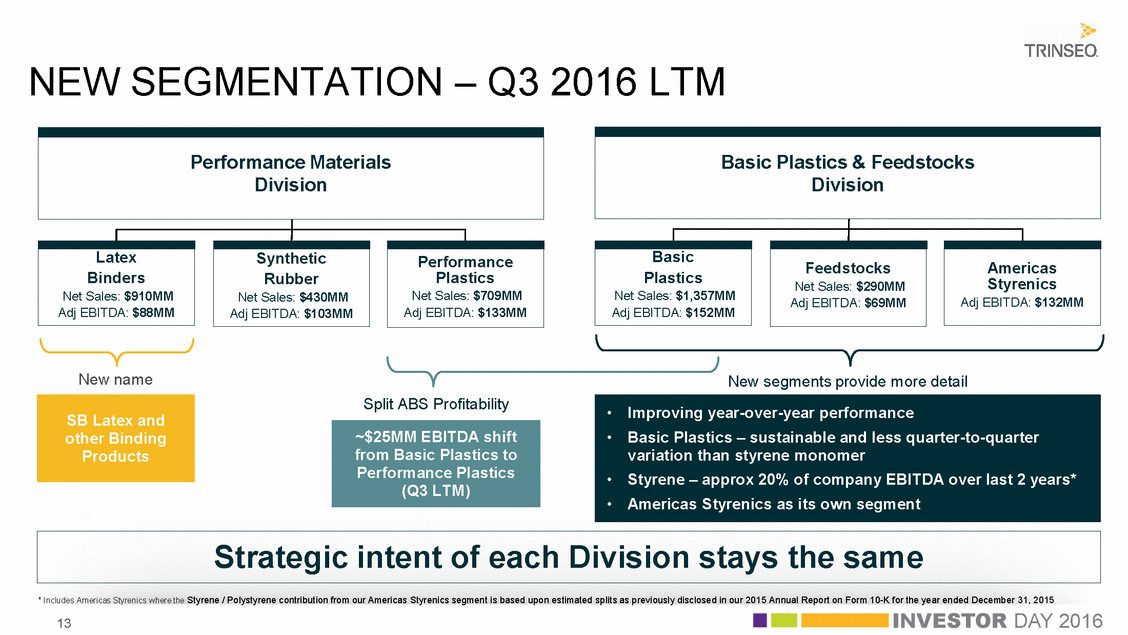
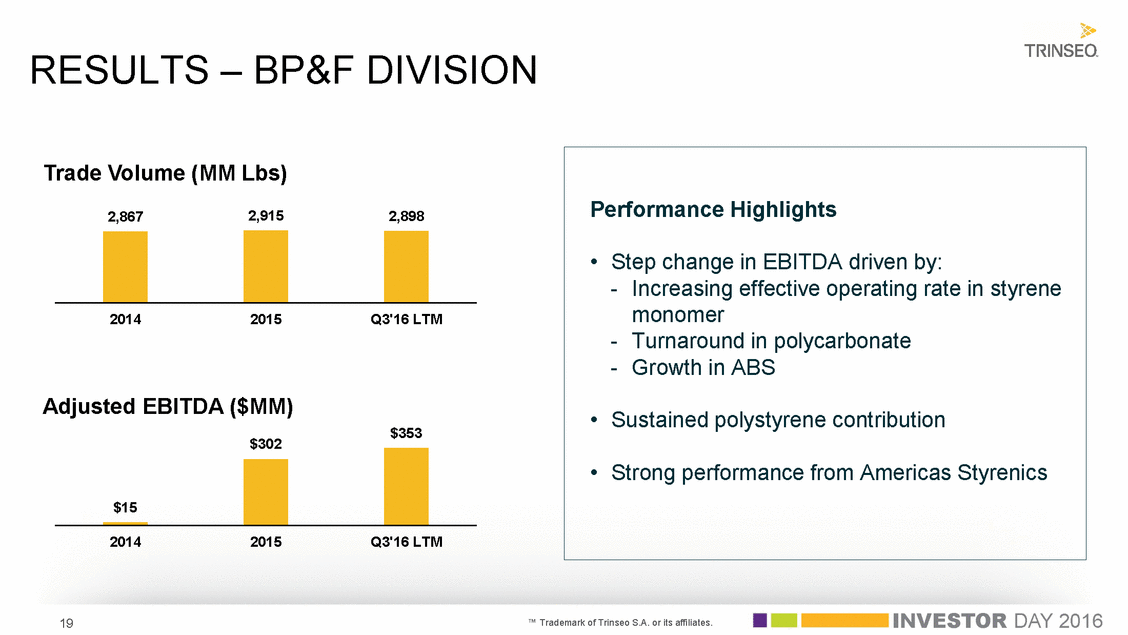
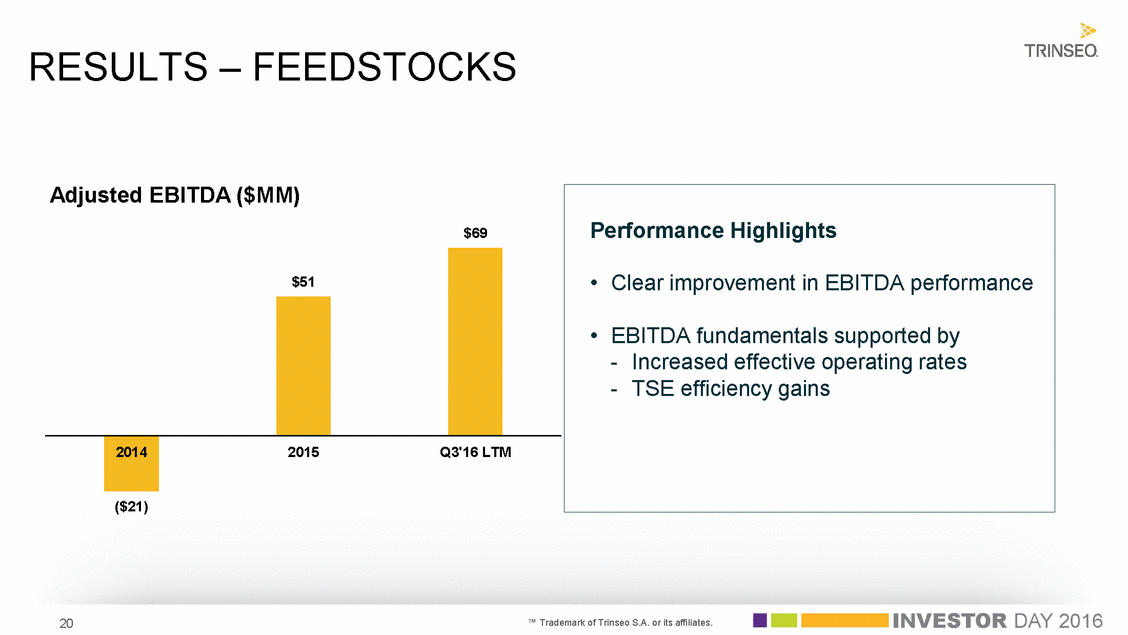
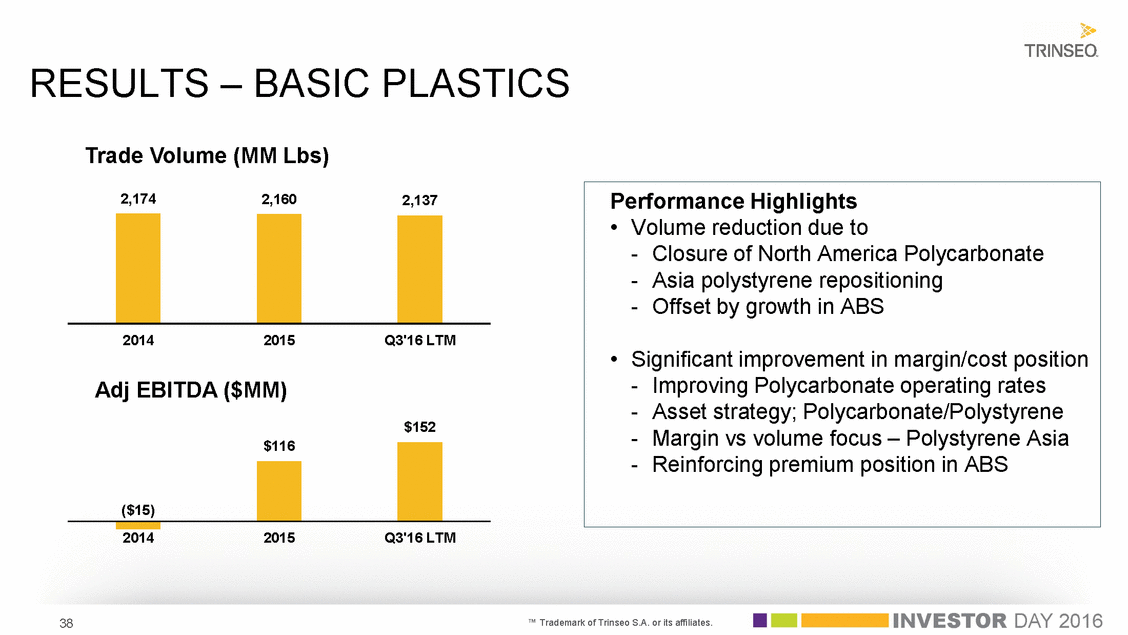
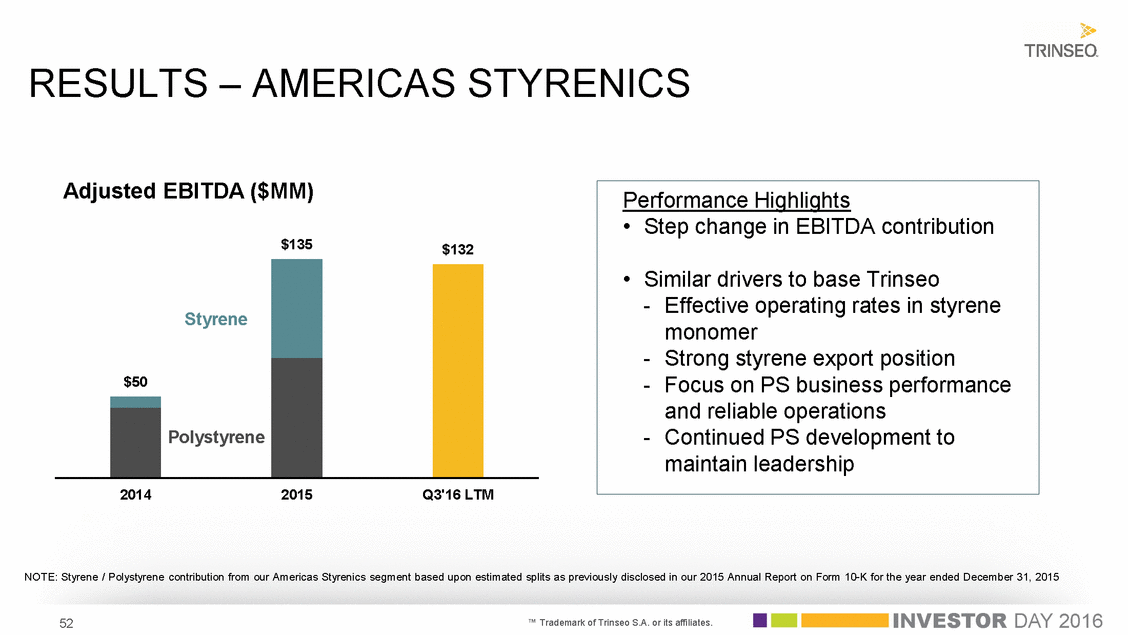
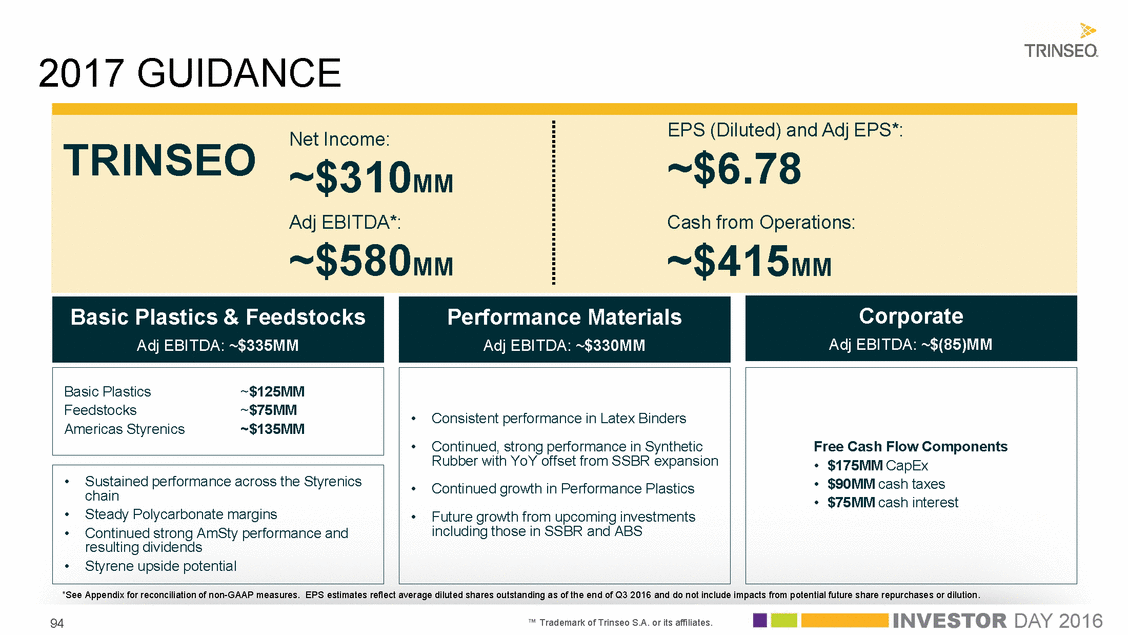
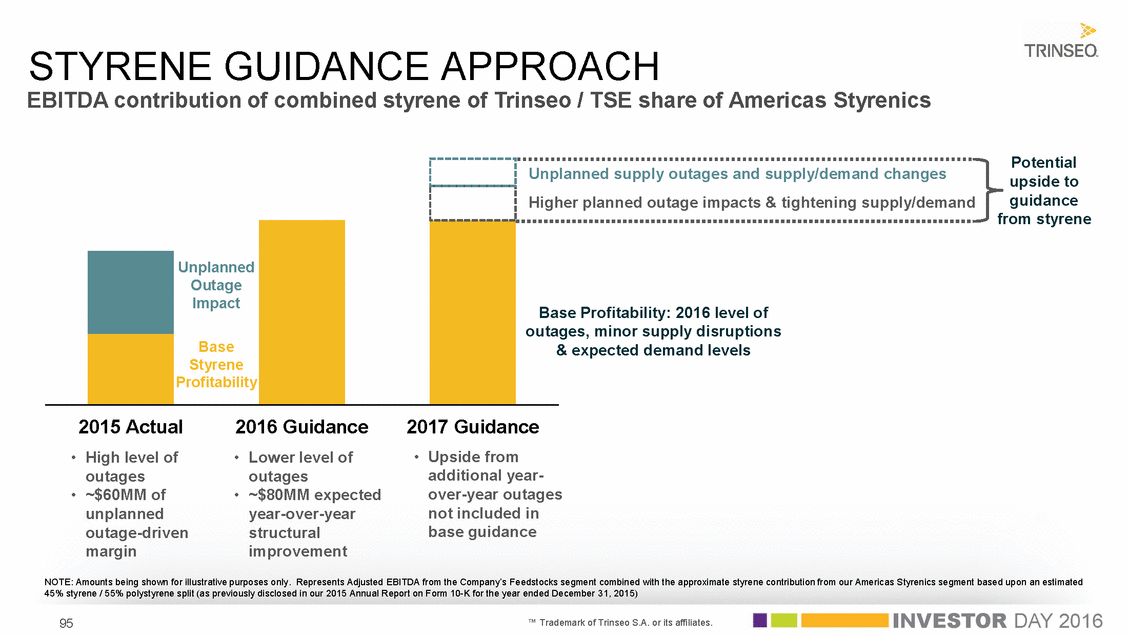
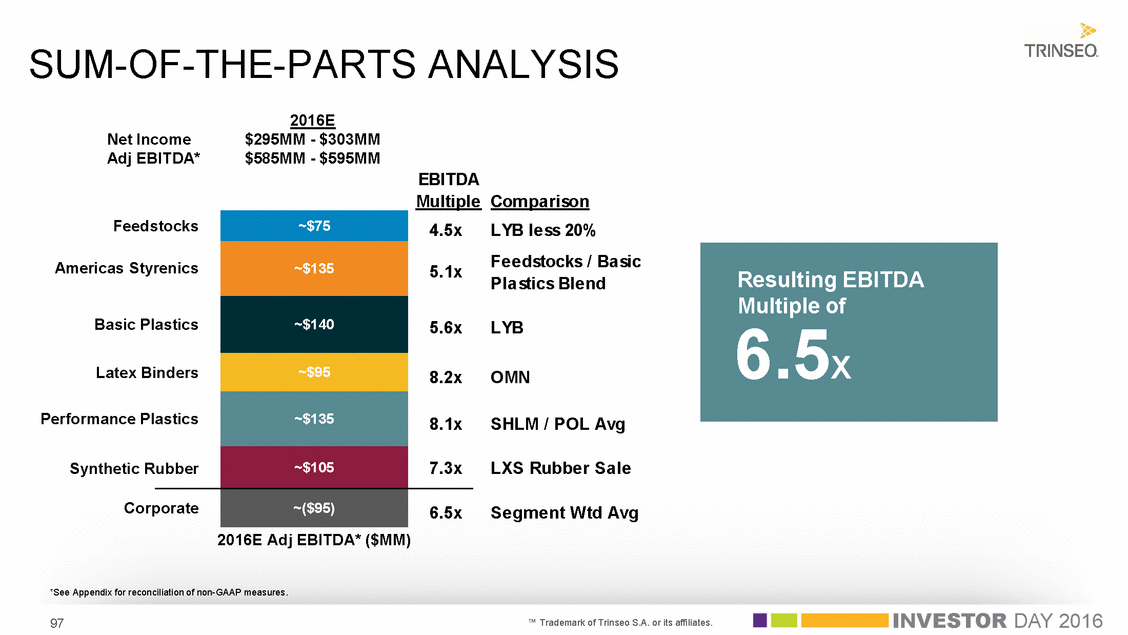
SELECTED (in $millions, unless noted) SEGMENT INFORMATION – NEW SEGMENTATION Q1'14 Q2'14 Q3'14 Q4'14 Q1'15 Q2'15 Q3'15 Q4'15 Q1'16 Q2'16 Q3'16 2014 2015 Q3'16LTM Latex Binders Synthetic Rubber Performance Plastics Performance Materials Basic Plastics Feedstocks Basic Plastics & Feedstocks Trade Volume (MMLbs) 299 155 144 295 142 147 309 136 145 289 135 145 305 162 150 312 153 150 307 152 144 308 134 146 299 146 143 310 148 154 318 150 145 1,193 568 581 1,233 601 590 1,235 579 588 598 562 185 584 584 159 591 539 186 569 490 164 617 585 209 616 557 151 603 493 231 588 525 165 588 570 194 613 539 195 613 504 207 2,342 2,174 693 2,423 2,160 755 2,402 2,137 761 746 743 725 654 793 708 724 690 764 734 711 2,867 2,915 2,898 1,344 1,327 1,315 1,223 1,411 1,323 1,327 1,277 1,352 1,347 1,324 5,210 5,339 5,300 Latex Binders Synthetic Rubber Performance Plastics Performance Materials Basic Plastics Feedstocks Basic Plastics & Feedstocks Net Sales 326 177 202 321 165 210 328 155 208 286 137 202 238 129 197 248 115 185 255 126 180 226 104 181 209 102 169 232 111 184 243 113 175 1,261 634 821 966 475 743 910 430 709 705 530 124 695 543 103 691 494 120 624 412 86 565 375 78 548 411 69 561 364 103 510 327 60 480 343 71 528 363 79 531 324 81 2,716 1,978 434 2,184 1,478 310 2,049 1,357 290 654 645 614 498 454 480 467 387 414 442 405 2,412 1,788 1,647 1,359 1,341 1,305 1,122 1,018 1,029 1,028 897 894 970 935 5,128 3,972 3,696 Latex Binders Synthetic Rubber Performance Plastics Performance Materials Basic Plastics Feedstocks Americas Styrenics Basic Plastics & Feedstocks Corporate Adjusted EBITDA 26 43 23 27 37 21 26 27 23 18 30 18 21 26 30 15 18 28 24 27 20 18 21 30 19 23 35 21 30 38 30 28 30 97 137 85 79 93 108 88 103 133 93 2 (1) 16 84 8 (3) 7 76 (5) (5) 11 67 (19) (12) 17 77 14 5 35 61 39 35 41 72 25 7 32 69 37 3 27 77 38 21 33 90 43 33 38 88 34 13 34 320 (15) (21) 50 280 116 51 135 325 152 69 132 17 (21) 12 (17) 0 (15) (14) (20) 55 (23) 115 (25) 65 (21) 67 (20) 92 (25) 113 (21) 81 (26) 15 (73) 302 (90) 353 (93) 88 79 62 32 109 151 116 116 143 182 143 262 492 585 Performance Materials Basic Plastics & Feedstocks Inventory Revaluation 5 1 0 2 (1) (0) (21) (50) (22) (20) 7 22 (6) (22) (10) (7) (5) (4) 7 6 4 3 (17) (47) (31) (27) (4) (3) 6 3 (1) (72) (42) 29 (28) (17) (10) 13 7 (64) (58) (7) Basic Plastics & Feedstocks Equity in earnings (losses) of affiliates 15 5 9 18 37 41 33 29 35 39 37 48 140 139 15 5 9 18 37 41 33 29 35 39 37 48 140 139 NOTE: For the definitions of the non-GAAP measure Adjusted EBITDA, refer to our quarterly earnings release furnished on Form 8-K as Exhibit 99.1 – Press Release, November 1, 2016. Inventory revaluation is presented in order to facilitate the comparability of results by management and investors through providing the estimated impact that raw material purchase price volatility has on the Company’s recognized cost of sales in a given period. Our approach to calculating inventory revaluation is intended to represent the difference between our results under the first-in, first-out (“FIFO”) method and the replacement cost method of accounting for inventory. However, this calculation may differ from the replacement cost method if the monthly raw material standard costs are different from the actual raw material prices during the period, or if production and purchase volumes differ from sales volumes during the period. These factors could have a significant impact on our inventory revaluation calculation. 103
