UNITED STATES
SECURITIES AND EXCHANGE COMMISSION
Washington, D.C. 20549
FORM N-CSR
CERTIFIED SHAREHOLDER REPORT OF REGISTERED
MANAGEMENT INVESTMENT COMPANIES
Investment Company Act file number 811-22563
Mairs & Power Funds Trust
(Exact name of registrant as specified in charter)
332 Minnesota Street, Suite W1520, St. Paul, MN 55101
(Address of principal executive offices) (Zip code)
Andrea C. Stimmel, Treasurer, 332 Minnesota Street, Suite W1520, St. Paul, MN 55101
(Name and address of agent for service)
651-222-8478
Registrant's telephone number, including area code
Date of fiscal year end: December 31, 2020
Date of reporting period: June 30, 2020
Item 1. Reports to Stockholders.

SEMI-ANNUAL REPORT
JUNE 30, 2020
- GROWTH FUND (MPGFX)
est. 1958
- BALANCED FUND (MAPOX)
est. 1961
- SMALL CAP FUND (MSCFX)
est. 2011
Beginning in February 2021, as permitted by regulations adopted by the U.S. Securities and Exchange Commission, paper copies of the Mairs & Power Funds' shareholder reports will no longer be sent by mail, unless you specifically request paper copies of the reports from the Mairs & Power Funds or from your Financial Intermediary. Instead, the reports will be made available on the Mairs & Power Funds' website, and you will be notified each time a report is posted and provided with a website link to access the report. If you already elected to receive shareholder reports electronically for the Mairs & Power Funds, you will not be affected by this change and you need not take any action.
Mairs & Power Funds Direct Shareholders
You may elect to receive shareholder reports and other communications electronically or in paper from the Mairs & Power Funds by electing one of the following options:
1. Receive Fund Communication by Email: Contact Shareholder Services at (800) 304-7404 or consent through the direct shareholder portal online at www.mairsandpower.com. You may also elect to receive account statements, tax forms and confirmations through this means.
2. Receive Fund Communication by Mail: Contact Shareholder Services at (800) 304-7404.You may elect to continue receiving paper copies of the shareholder reports and other communications, free of charge, by contacting Shareholder Services at (800) 304-7404.
Mairs & Power Fund Shareholder through a Financial Intermediary (such as broker-dealer or bank)
Contact your Financial Intermediary to make your election. Your election will apply to all Mairs & Power Funds held through your Financial Intermediary.
MAIRS & POWER FUNDS MARKET COMMENTARY (unaudited)
June 30, 2020
After the storms of the first quarter, the financial climate felt a little more settled in the second quarter. True, there is still a great deal of uncertainty in the air. Companies are still reporting layoffs, earnings remain under pressure, and the novel coronavirus is yet to be contained. But there are some hopeful signs. One notably encouraging sign, of course, is the overall market's dramatic recovery in the second quarter.
The numbers tell a tale of two very different quarters. The S&P 500 Total Return (TR) Index rose 20.54% for the second quarter, compared to being down 19.60% in the first quarter, and was down 3.08% year-to-date. The Dow Jones Industrial Average TR Index was up 18.51% for the second quarter, down 22.73% in the first quarter, and down 8.43% for the first six months of 2020. Overall, the Technology and Healthcare sectors have posted the highest gains year-to-date. Energy and Financials have been the weakest sectors.
By contrast, in the fixed-income market, the Bloomberg Barclays U.S. Government/Credit Bond Index returned 3.71% and 7.21% for the second quarter and first six months, respectively.
Future Outlook
Several governmental actions provided a measure of stability to the economy in the second quarter. The Federal Reserve (FED) has kept interest rates low and used several monetary tools to provide liquidity and assure efficient trading of financial instruments, especially corporate bonds. And the federal Paycheck Protection Program (PPP) has allowed numerous smaller businesses to keep their lights on and their employees paid. The support to the economy that has come from massive stimulus, both fiscally (via the federal government) and monetarily (through the FED), has certainly boosted the confidence of the markets.
We have a long way to go to get to full recovery, but there are several data points that give us reason to feel hopeful. The June jobs report provided some particularly good news. The unemployment rate continues to fall – from 13.3% in May to 11.1% – and the economy gained 4.8 million new jobs.
While a broad portion of the economy was all but shut down following the onset of the pandemic, a great deal of corporate and consumer money sat on the sidelines. The personal savings rate in April, for instance, was an astounding 33%. But in May, local economies began the process of gradual reopening, and the May retail sales report was significantly stronger than expected, posting a record 18% jump. This suggests that there is a great deal of pent-up demand. People want to get out and resume their normal lives, go to restaurants and spend money.
Complicating economic recovery locally and around the globe is, of course, the novel coronavirus. There have been some positive signs. European infection and death rates have declined significantly from where they were a few months ago in countries including Spain, Italy and France. In the U.S., it's a mixed picture, with some states showing significant improvement, while others see cases spike to new highs. There have been signs that some states reopened too quickly, or with insufficient care regarding social distancing and mask wearing. The resulting spikes in COVID-19 infections have caused some states to institute or reinstitute restrictions. We need to get the virus under control before we can have a true recovery.
In addition, the economic effects of the social unrest following George Floyd's death in late May have yet to play out. So far, they've fallen mostly on those who are already economically vulnerable. Businesses, government and the public will need to work together to address and ameliorate these effects.
So how do we explain the market's strong comeback in the second quarter? There was some volatility, to be sure, due mostly to the ups and downs in COVID-19 infection-rate reports. In general, we believe that the market is looking past what's likely to be a weak economy and lower profits in 2020 and focusing instead on recovery and accelerating growth in 2021. The market might seem expensive, if valuations are based on this year's depressed earnings. But it's a different story if we have recovering earnings in 2021, making valuations look more reasonable.
1
MAIRS & POWER FUNDS MARKET COMMENTARY (unaudited) (continued)
As for the fixed income market, it has settled down after the uncertainties of the first quarter. In general, returns here have been steady.
Past Performance is not a guarantee of future results.
S&P 500 TR (Total Return) Index is an unmanaged index of 500 common stocks that is generally considered representative of the U.S. stock market. It tracks both the capital gains of a group of stocks over time and assumes that any cash distributions, such as dividends, are reinvested back into the index. It is not possible to invest directly in an index.
Dow Jones Industrial Average TR Index is a price-weighted average of 30 significant stocks traded on the New York Stock Exchange and the NASDAQ. It is not possible to invest directly in an index.
Bloomberg Barclays U.S. Government/Credit Bond Index is a broad-based flagship benchmark that measures the non-securitized component of the U.S. Aggregate Index. It includes investment-grade, U.S. dollar-denominated, fixed-rate Treasuries, government-related and corporate securities. It is not possible to invest directly in an index.
2
MAIRS & POWER GROWTH FUND (unaudited)
To Our Shareholders: June 30, 2020
The Mairs & Power Growth Fund's performance reflects the tale of two quarters we noted earlier. The Fund gained 17.36% in the second quarter, but is down 4.75% for the first six months of 2020. The Fund's benchmarks tell the same story. The S&P 500 Total Return (TR) benchmark was up 20.54% and down 3.08% over the same periods, while the Lipper Multi Cap Core Funds Index of peers has posted a gain of 23.14% in the second quarter and a decline of 3.46% year-to-date.
The Growth Fund managed to stay fairly close to the S&P 500 in terms of performance despite a number of macro headwinds. Our bias toward small- and mid-cap stocks relative to the S&P 500 has hurt relative performance so far this year, with the mid-cap index trailing the larger S&P 500 Index by nearly 10% year-to-date. Historically, investors have been rewarded for holding smaller stocks, since they have typically exhibited better growth characteristics. While smaller stocks have significantly underperformed large stocks over the last five years, we are expecting the pendulum will eventually shift back to favor smaller companies, and so we have been adding to positions in some of the smaller firms we hold.
A second headwind to relative performance is the result of the Fund investing more heavily in Industrial sector stocks while being underweighted in the Technology sector. For several years, we have been reducing the size of that relative "bet" as we have purchased Technology stocks that we find attractive for the long term. The two largest holdings in the Fund now are Microsoft (MSFT) and Google parent Alphabet (GOOG). At the end of the second quarter, those stocks represented 6.7% and 6.2% of the total portfolio, respectively. The Technology sector has outperformed the Industrial sector so far this year by nearly 30%. We believe this gap will narrow as the economy recovers and industrial activity accelerates; the Fund could benefit in the future if that happens.
We also added two new technology stocks earlier this year that have already contributed to the Fund's performance. One is Workiva (WK), a software-as-a-service technology company based in Iowa. We have held it for years in the Mairs & Power Small Cap Fund, but saw the opportunity with the market correction earlier this year to add it to the Growth Fund as well. Workiva provides software designed to ease the burden of regulatory reporting for corporations of all sizes. This year, it is expanding aggressively into Europe as new regulatory reporting requirements are being put in place there.
MAIRS & POWER GROWTH FUND (MPGFX)
Top Relative Performers
| Second Quarter (3/31/20 – 6/30/20) | | Year To Date (12/31/19 – 6/30/20) | |
Bio-Techne Corporation | | | 18.88 | % | | NVIDIA Corporation | | | 64.71 | % | |
H.B. Fuller Company | | | 40.01 | % | | Bio-Techne Corporation | | | 23.71 | % | |
NVIDIA Corporation | | | 23.64 | % | | Fastenal Company | | | 20.61 | % | |
Fastenal Company | | | 17.47 | % | | Roche Holdings LTD | | | 11.74 | % | |
Ecolab Inc. | | | 7.43 | % | | Alphabet Inc. | | | 8.81 | % | |
Weak Relative Performers
| Second Quarter (3/31/20 – 6/30/20) | | Year To Date (12/31/19 – 6/30/20) | |
Medtronic PLC | | | -18.20 | % | | U.S. Bancorp | | | -33.37 | % | |
Graco Inc. | | | -21.70 | % | | Medtronic PLC | | | -15.09 | % | |
U.S. Bancorp | | | -12.43 | % | | Walt Disney Company | | | -19.82 | % | |
Roche Holdings LTD | | | -13.62 | % | | Donaldson Company, Inc. | | | -15.49 | % | |
Toro Company | | | -18.24 | % | | Principal Financial Group, Inc. | | | -19.33 | % | |
Performance shown is relative to the S&P 500 TR Index as of June 30, 2020. Relative return is the difference between the absolute return and the performance of the market, in which the position is held. Relative contribution is used for ranking, which considers average daily weightings for each holding. Past performance does not guarantee future results.
3
MAIRS & POWER GROWTH FUND (unaudited) (continued)
The other is Activision (ATVI), one of the largest video game companies in the world. We believe it has a strong competitive position as its franchises – which include World of Warcraft, Call of Duty and Candy Crush – have attracted legions of loyal fans. Sheltering in place has provided a short-term benefit to the company, but will likely lure new customers to try out the games, and thus grow the video game industry overall. The longer we stay sheltered in place, the more Activision will likely benefit.
Another fairly recent addition to the Fund in the Technology sector is Nvidia (NVDA). This California-based designer and manufacturer of computer graphics processors was the largest contributor by far to the Fund's performance in the first half of the year, posting a share price gain of 61%. Its competitive advantage stems from its share and scale in the graphics card industry and the head start it has in providing chips being utilized for machine learning and artificial intelligence.
The largest detractor to relative performance in the Fund in the first half was U.S. Bancorp (USB). The combination of lower interest rates and credit concerns has hit the banking industry hard this year. But we believe U.S. Bank continues to have one of the best underwritten loan portfolios, and that it will emerge from the economic downturn in a better position than the vast majority of its competitors. We have taken advantage of the stock's weakness to add to our position.
During the quarter, we eliminated our small position in the Energy sector, namely the Fund's holdings in petroleum industry services provider Core Laboratories (CLB). The sector's long-term prospects are bleak.
Andrew R. Adams
Lead Manager | | Mark L. Henneman
Co-Manager | | Peter J. Johnson
Co-Manager | |
The Fund's investment objective, risks, charges and expenses must be considered carefully before investing. The summary prospectus or full prospectus contains this and other important information about the Fund and they may be obtained by calling Shareholder Services at (800) 304-7404 or by visiting www.mairsandpower.com. Read the summary prospectus or full prospectus carefully before investing.
All holdings in the portfolio are subject to change without notice and may or may not represent current or future portfolio composition. The mention of specific securities is not intended as a recommendation or an offer of a particular security, nor is it intended to be a solicitation for the purchase or sale of any security.
All investments have risks. The Growth Fund is designed for long-term investors. Equity investments are subject to market fluctuations and the Fund's share price can fall because of weakness in the broad market, a particular industry or specific holdings. Investments in small and midcap companies generally are more volatile. International investing risks include among others political, social or economic instability, difficulty in predicting international trade patterns, taxation and foreign trading practices and greater fluctuations in price than U.S. corporations.
This commentary includes forward-looking statements such as economic predictions and portfolio manager opinions. The statements are subject to change at any time based on market and other conditions. No predictions, forecasts, outlooks, expectations or beliefs are guaranteed.
Diversification does not guarantee profit or protect against loss.
S&P 500 TR (Total Return) Index is an unmanaged index of 500 common stocks that is generally considered representative of the U.S. stock market. It tracks both the capital gains of a group of stocks over time and assumes that any cash distributions, such as dividends, are reinvested back into the index. It is not possible to invest directly in an index.
Lipper Multi-Cap Core Funds Index measures the performance of the 30 largest mutual funds that invest in a variety of capitalization ranges, without concentrating 75% or more of their equity assets in any one market capitalization range over an extended period of time, as determined by Lipper, Inc. It is not possible to invest directly in an index.
4
Mairs & Power Growth Fund
PERFORMANCE INFORMATION (unaudited) June 30, 2020
Ten years of investment performance (through June 30, 2020)
This chart illustrates the performance of a hypothetical $10,000 investment made in the Fund 10 years ago.
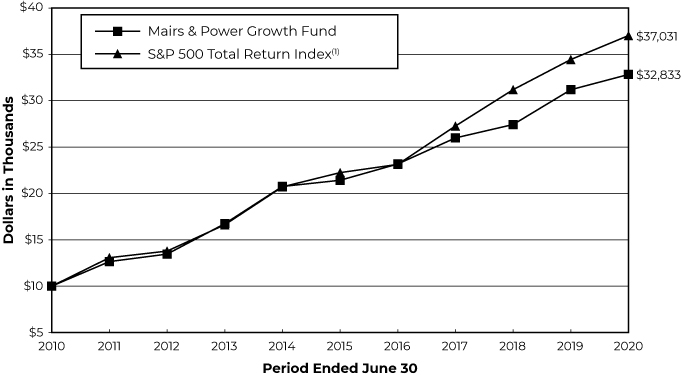
Average annual total returns for periods ended June 30, 2020
| | | 1 year | | 5 years | | 10 years | | 20 years | |
Mairs & Power Growth Fund | | | 5.27 | % | | | 8.92 | % | | | 12.62 | % | | | 9.23 | % | |
S&P 500 Total Return Index(1) | | | 7.51 | % | | | 10.73 | % | | | 13.99 | % | | | 5.91 | % | |
Performance data quoted represents past performance and does not guarantee future results. All performance information shown includes the reinvestment of dividend and capital gain distributions, but does not reflect the deduction of taxes that a shareholder would pay on Fund distributions or the redemption of Fund shares. The investment return and principal value of an investment will fluctuate so that an investor's shares, when redeemed, may be worth more or less than their original cost. Current performance of the Fund may be lower or higher than the performance quoted. For the most recent month-end performance figures, visit the Fund's website at www.mairsandpower.com or call Shareholder Services at (800) 304-7404. Per the Prospectus dated April 30, 2020, the expense ratio for the Fund is 0.65%.
(1) The S&P 500 Total Return Index is an unmanaged index of 500 common stocks that is generally considered representative of the U.S. stock market. It tracks both the capital gains of a group of stocks over time and assumes that any cash distributions, such as dividends, are reinvested back into the index. It is not possible to invest directly in an index.
5
Mairs & Power Growth Fund
FUND INFORMATION (unaudited) June 30, 2020
Portfolio Managers
Andrew R. Adams, CFA, lead manager since April 1, 2019, co-manager from January 1, 2015 through April 1, 2019, University of Wisconsin-Madison, MS Finance 1997
Peter J. Johnson, CFA, co-manager since April 1, 2019, University of Wisconsin-Madison, MBA 2010
Mark L. Henneman, CFA, co-manager since April 1, 2019 and from January 1, 2006 through July 1, 2013, lead manager from July 1, 2013 to April 1, 2019, University of Minnesota, MBA Finance 1990
General Information
Fund Symbol | | | MPGFX | | |
Net Asset Value (NAV) Per Share | | $ | 120.42 | | |
Expense Ratio | | | 0.65 | %1 | |
Portfolio Turnover Rate
(1/1/20 to 6/30/20, not annualized) | | | 8.84 | % | |
Sales Charge | | | None2 | | |
Fund Inception Year | | | 1958 | | |
Portfolio Composition
Top Ten Portfolio Holdings
(Percent of Total Net Assets) 3
Microsoft Corp | | | 6.7 | % | |
Alphabet Inc | | | 6.2 | | |
Ecolab Inc | | | 4.3 | | |
US Bancorp/MN | | | 4.2 | | |
Medtronic PLC | | | 3.7 | | |
UnitedHealth Group Inc | | | 3.6 | | |
Roche Holding AG | | | 3.3 | | |
NVIDIA Corp | | | 3.2 | | |
Bio-Techne Corp | | | 3.2 | | |
Walt Disney Co/The | | | 2.9 | | |
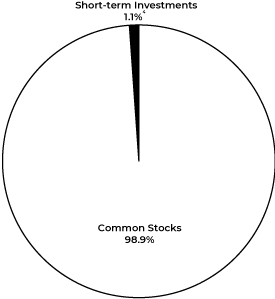
Portfolio Diversification
(Percent of Total Net Assets)
Common Stocks 98.9% | |
Health Care | | | 22.2 | % | |
Information Technology | | | 21.1 | | |
Industrials | | | 19.7 | | |
Financials | | | 10.9 | | |
Communication Services | | | 10.1 | | |
Materials | | | 6.8 | | |
Consumer Staples | | | 3.7 | | |
Real Estate | | | 2.5 | | |
Consumer Discretionary | | | 1.9 | | |
Short-term Investments 1.1%4 | | | 1.1 | | |
| | | | 100.0 | % | |
1 Ratio has been annualized for the six month period ended June 30, 2020.
2 Although the Fund is no-load, investment management fees and other expenses still apply.
3 All holdings in the portfolio are subject to change without notice and may or may not represent current or future portfolio composition. The mention of specific securities is not intended as a recommendation or offer for a particular security, nor is it intended to be a solicitation for the purchase or sale of any security.
4 Represents short-term investments and other assets and liabilities (net).
The Schedule of Investments and portfolio diversification utilize the Global Industry Classification Standard (GICS®) which was developed by and/or is the exclusive property of MSCI, Inc. and Standard & Poor's Financial Services LLC ("S&P"). GICS is a service mark of MSCI, Inc. and S&P and has been licensed for use by Mairs & Power, Inc. (the "Adviser").
6
Mairs & Power Growth Fund
SCHEDULE OF INVESTMENTS (unaudited) June 30, 2020
Shares | | Security Description | | Fair Value | |
| | | COMMON STOCKS 98.9% | |
| | | COMMUNICATION SERVICES 10.1% | |
| | 575,000 | | | Activision Blizzard Inc | | $ | 43,642,500 | | |
| | 182,300 | | | Alphabet Inc (a) | | | 257,701,103 | | |
| | 1,078,600 | | | Walt Disney Co/The | | | 120,274,686 | | |
| | | | 421,618,289 | | |
| | | CONSUMER DISCRETIONARY 1.9% | |
| | 242,100 | | | Gentherm Inc (a) | | | 9,417,690 | | |
| | 190,000 | | | Home Depot Inc/The | | | 47,596,900 | | |
| | 180,000 | | | Target Corp | | | 21,587,400 | | |
| | | | 78,601,990 | | |
| | | CONSUMER STAPLES 3.7% | |
| | 180,000 | | | General Mills Inc | | | 11,097,000 | | |
| | 2,263,592 | | | Hormel Foods Corp | | | 109,263,586 | | |
| | 650,000 | | | Sysco Corp | | | 35,529,000 | | |
| | | | 155,889,586 | | |
| | | FINANCIALS 10.9% | |
| | 780,000 | | | American Express Co | | | 74,256,000 | | |
| | 841,300 | | | Charles Schwab Corp/The | | | 28,385,462 | | |
| | 1,280,000 | | | Great Western Bancorp Inc | | | 17,612,800 | | |
| | 2,240,000 | | | Principal Financial Group Inc | | | 93,049,600 | | |
| | 4,780,000 | | | US Bancorp/MN | | | 175,999,600 | | |
| | 2,650,000 | | | Wells Fargo & Co | | | 67,840,000 | | |
| | | | 457,143,462 | | |
| | | HEALTH CARE 22.2% | |
| | 560,000 | | | Abbott Laboratories | | | 51,200,800 | | |
| | 225,000 | | | Baxter International Inc | | | 19,372,500 | | |
| | 502,200 | | | Bio-Techne Corp | | | 132,615,954 | | |
| | 505,527 | | | Elanco Animal Health Inc (a) | | | 10,843,554 | | |
| | 255,000 | | | Eli Lilly & Co | | | 41,865,900 | | |
| | 795,000 | | | Johnson & Johnson | | | 111,800,850 | | |
| | 1,690,000 | | | Medtronic PLC (d) | | | 154,973,000 | | |
| | 1,300,000 | | | Pfizer Inc | | | 42,510,000 | | |
| | 3,185,000 | | | Roche Holding AG (c) | | | 138,165,300 | | |
| | 503,600 | | | UnitedHealth Group Inc | | | 148,536,820 | | |
| | 643,500 | | | Zimmer Holdings Inc | | | 76,808,160 | | |
| | | | 928,692,838 | | |
| | | INDUSTRIALS 19.7% | |
| | 731,900 | | | 3M Co | | | 114,169,081 | | |
| | 1,065,000 | | | CH Robinson Worldwide Inc | | | 84,198,900 | | |
| | 1,800,000 | | | Donaldson Co Inc | | | 83,736,000 | | |
| | 2,300,000 | | | Fastenal Co | | | 98,532,000 | | |
7
Mairs & Power Growth Fund
SCHEDULE OF INVESTMENTS (unaudited) (continued) June 30, 2020
Shares | | Security Description | | Fair Value | |
| | | COMMON STOCKS (continued) | |
| | | INDUSTRIALS (continued) | |
| | 2,350,000 | | | Graco Inc | | $ | 112,776,500 | | |
| | 521,700 | | | Honeywell International Inc | | | 75,432,603 | | |
| | 2,781,066 | | | nVent Electric PLC (d) | | | 52,089,366 | | |
| | 108,000 | | | Proto Labs Inc (a) | | | 12,146,760 | | |
| | 125,000 | | | Rockwell Automation Inc | | | 26,625,000 | | |
| | 939,966 | | | Tennant Co (e) | | | 61,107,190 | | |
| | 1,570,000 | | | Toro Co/The | | | 104,153,800 | | |
| | | | 824,967,200 | | |
| | | INFORMATION TECHNOLOGY 21.1% | |
| | 1,260,000 | | | Corning Inc | | | 32,634,000 | | |
| | 1,391,333 | | | Digi International Inc (a) | | | 16,209,029 | | |
| | 995,000 | | | Fiserv Inc (a) | | | 97,131,900 | | |
| | 364,000 | | | Littelfuse Inc | | | 62,109,320 | | |
| | 1,370,000 | | | Microsoft Corp | | | 278,808,700 | | |
| | 520,000 | | | Motorola Solutions Inc | | | 72,867,600 | | |
| | 220,000 | | | NVE Corp | | | 13,602,600 | | |
| | 350,000 | | | NVIDIA Corp | | | 132,968,500 | | |
| | 622,100 | | | QUALCOMM Inc | | | 56,741,741 | | |
| | 540,000 | | | Visa Inc | | | 104,311,800 | | |
| | 300,000 | | | Workiva Inc (a) | | | 16,047,000 | | |
| | | | 883,432,190 | | |
| | | MATERIALS 6.8% | |
| | 895,000 | | | Ecolab Inc | | | 178,060,250 | | |
| | 1,710,000 | | | HB Fuller Co | | | 76,266,000 | | |
| | 49,000 | | | Sherwin-Williams Co/The | | | 28,314,650 | | |
| | | | 282,640,900 | | |
| | | REAL ESTATE 2.5% | |
| | 870,000 | | | CoreSite Realty Corp | | | 105,322,200 | | |
| | | | TOTAL COMMON STOCKS
(cost $2,282,564,904) | | $ | 4,138,308,655 | | |
| | | SHORT-TERM INVESTMENTS 0.9% | |
| 38,997,857 | | | First American Government Obligations Fund, Class X, 0.091% (b)
(cost $38,997,857) | | $ | 38,997,857 | | |
| | | | TOTAL INVESTMENTS 99.8%
(cost $2,321,562,761) | | $ | 4,177,306,512 | | |
| | | | | OTHER ASSETS AND LIABILITIES (NET) 0.2% | | | 6,536,820 | | |
| | | | | TOTAL NET ASSETS 100.0% | | $ | 4,183,843,332 | | |
8
Mairs & Power Growth Fund
SCHEDULE OF INVESTMENTS (unaudited) (continued) June 30, 2020
(a) Non-income producing.
(b) The rate quoted is the annualized seven-day effective yield as of June 30, 2020.
(c) American Depositary Receipt.
(d) Issuer headquartered overseas but considered domestic. The Adviser defines foreign issuers as those whose operational leadership or headquarters is located in a foreign country; provided, however, if an issuer is believed by the Adviser to be headquartered in a jurisdiction primarily for tax purposes, the Adviser will consider the following additional factors: 1) the location of the primary exchange trading its securities; 2) where it derives the majority of its revenues, and/or 3) where it earns the majority of its profits.
(e) Affiliated company at June 30, 2020.
The Global Industry Classification Standard (GICS®) was developed by and/or is the exclusive property of MSCI, Inc. and Standard & Poor's Financial Services LLC ("S&P"). GICS is a service mark of MSCI, Inc. and S&P and has been licensed for use by the Adviser.
See accompanying Notes to Financial Statements.
9
MAIRS & POWER BALANCED FUND (unaudited)
To Our Shareholders: June 30, 2020
The Balanced Fund finished the quarter up 11.99%, while its benchmark composite index (60% S&P 500 TR Index and 40% Bloomberg Barclays U.S. Government/Credit Bond Index) gained 13.66%. Six months year-to-date, the Fund is down 4.96% and the benchmark is up 1.37%. The Fund's peer group, as measured by the Morningstar U.S. Fund Allocation Index, gained 13.04% in the second quarter and was down 3.59% in the first six months of 2020.
The biggest contributor to the Fund's underperformance was our underweight stance in Technology, which was the market's top performing sector in the first half of the year. Besides the underweight, our selection was less than favorable. The Fund's two largest holdings, Alphabet (GOOG) and Microsoft (MSFT), performed well during the period, but Motorola Solutions (MSI) underperformed due to concerns about pressure on municipal budgets and related spending on public safety communication systems.
The other sector that hurt the Fund was the Financials. This sector has been a poor performer relative to the market in 2020, and the Fund is a little overweight here. The stocks in that sector that particularly hit the Fund's performance were the larger bank holding companies, notably JPMorgan Chase (JPM), Wells Fargo (WFC) and U.S. Bancorp (USB). The potential for increased credit losses due to the economic slowdown is one of the chief factors. Another is the negative impact of a flat yield curve, which makes it difficult for banks to earn interest income on their balance sheets.
By contrast, Healthcare and Consumer Staples held up reasonably well during the first half of the year, particularly during the market selloff in the first quarter. The Fund's top performers were Eli Lilly (LLY) and Roche (RHHBY) in Healthcare and Hormel (HRL) in the Consumer sector. As these stocks approached the high end of their valuation ranges in the heat of the first quarter's downdraft, we reduced their weights in order to pursue new buying opportunities.
MAIRS & POWER BALANCED FUND (MAPOX)
Top Relative Performers
| Second Quarter (3/31/20 – 6/30/20) | | Year To Date (12/31/19 – 6/30/20) | |
H.B. Fuller Company | | | 40.01 | % | | Eli Lilly & Company | | | 29.24 | % | |
Principal Financial Group, Inc. | | | 13.92 | % | | Roche Holdings Ltd ADR | | | 11.74 | % | |
Fastenal Company | | | 17.47 | % | | Fastenal Company | | | 20.61 | % | |
Ecolab Inc. | | | 7.43 | % | | Alphabet Inc. | | | 8.81 | % | |
Bio-Techne Corporation | | | 18.88 | % | | Bio-Techne Corporation | | | 23.71 | % | |
Weak Relative Performers
| Second Quarter (3/31/20 – 6/30/20) | | Year To Date (12/31/19 – 6/30/20) | |
Graco Inc. | | | -21.70 | % | | U.S. Bancorp | | | -33.37 | % | |
Medtronic PLC | | | -18.20 | % | | Schlumberger | | | -50.20 | % | |
U.S. Bancorp | | | -12.43 | % | | Medtronic PLC | | | -15.09 | % | |
Roche Holdings Ltd ADR | | | -13.62 | % | | Principal Financial Group, Inc. | | | -19.33 | % | |
Hormel Foods Corporation | | | -16.54 | % | | Great Western Bancorp, Inc. | | | -56.42 | % | |
Performance shown is relative to the S&P 500 TR Index as of June 30, 2020. Relative return is the difference between the absolute return and the performance of the market, in which the position is held. Relative contribution is used for ranking, which considers average daily weightings for each holding. Past performance does not guarantee future results.
10
MAIRS & POWER BALANCED FUND (unaudited) (continued)
In the second quarter, the Fund added Tennant (TNC), a Minneapolis-based industrial company that has a leading market share position in commercial and industrial scrubbers. What we particularly like is its development of an autonomous scrubbing unit. Industry research shows that the majority of the cost of operating a scrubber is the person operating it, so we expect there to be heavy demand for Tennant's autonomous scrubber as it enters the market. In the near term, we admit that capital spending for industrial and commercial customers is likely to be slow, thus dampening Tennant's short-term performance. But in the longer term, we like the share-gain opportunity associated with this innovation.
Turning to fixed income, the first quarter's downturn caused corporate bond spreads to widen from roughly 100 basis points over Treasuries to nearly 350 basis points. Our long-term overweight in corporate bonds took a heavy toll on relative performance, as it always has during recessions.
However, the Fund's corporate bonds have always rallied back strongly, and over the full economic cycle, we have generally earned the excess spreads that corporate bonds pay over Treasuries. Aside from a small allocation to Airline Equipment Trusts, which are secured by airplanes, the Fund has minimal to no exposure to the sectors that are being the most negatively impacted by the virus's economic fallout. In addition, we believe we have been trading up in quality over the past year and a half, believing that the long economic expansion would end at some point. Overall, we believe the Fund's credit book is very high-quality.
And in fact, the Fund did get back about a third of that underperformance in the second quarter. Corporate bond spreads have tightened significantly, though they still have a ways to go to reach where they were at the beginning of 2020. That noted, we believe our fixed income holdings are well positioned to make up more ground in the second half of the year.
In sum, interest rates have generally been stable in the second quarter, and the corporate bond outlook has been improving. Whether that improvement continues depends largely, of course, on the overall economy and how quickly the spread of COVID-19 can be contained.
Kevin V. Earley
Lead Manager | | Robert W. Thompson
Co-Manager | |
The Fund's investment objective, risks, charges and expenses must be considered carefully before investing. The summary prospectus or full prospectus contains this and other important information about the Fund and they may be obtained by calling Shareholder Services at (800) 304-7404 or by visiting www.mairsandpower.com. Read the summary prospectus or full prospectus carefully before investing.
All holdings in the portfolio are subject to change without notice and may or may not represent current or future portfolio composition. The mention of specific securities is not intended as a recommendation or an offer of a particular security, nor is it intended to be a solicitation for the purchase or sale of any security.
All investments have risks. The Balanced Fund is designed for long-term investors. Equity investments are subject to market fluctuations and the Fund's share price can fall because of weakness in the broad market, a particular industry or specific holdings. Investments in small and midcap companies generally are more volatile. International investing risks include among others political, social or economic instability, difficulty in predicting international trade patterns, taxation and foreign trading practices, and greater fluctuations in price than U.S. corporations. The Fund is subject to yield and share price variances with changes in interest rates and market conditions. Investors should note that if interest rates rise significantly from current levels, bond total returns will decline and may even turn negative in the short-term. There is also a chance that some of the Fund's holdings may have their credit rating downgraded or may default.
Investments in debt securities typically decrease in value when interest rates rise. This risk is usually greater for longer-term debt securities. Investments in lower rated and non-rated securities present a greater risk of loss to principal and interest than higher rated securities.
This commentary includes forward-looking statements such as economic predictions and portfolio manager opinions. The statements are subject to change at any time based on market and other conditions. No predictions, forecasts, outlooks, expectations or beliefs are guaranteed.
11
MAIRS & POWER BALANCED FUND (unaudited) (continued)
Yield curve is a visual representation of the yield relationship between bonds of the same credit quality and different maturities.
Basis Point is a unit of measure used to describe the percentage change in the value or rate of a financial instrument. One basis point is equivalent to 0.01%
Diversification does not guarantee profit or protect against loss.
Composite Index reflects an unmanaged portfolio of 60% of the S&P 500 TR Index and 40% of the Bloomberg Barclays U.S. Government/Credit Bond Index. It is not possible to invest directly in an index.
Morningstar U.S. Fund Allocation Index is designed to benchmark target-date and target-risk investment products. Index is based on well-established asset allocation methodology from Ibbotson Associates, a Morningstar company. Index has 60% global equity exposure and 40% global bond exposure. It is not possible to invest directly in an index.
S&P 500 TR (Total Return) Index is an unmanaged index of 500 common stocks that is generally considered representative of the U.S. stock market. It tracks both the capital gains of a group of stocks over time and assumes that any cash distributions, such as dividends, are reinvested back into the index. It is not possible to invest directly in an index.
Bloomberg Barclays U.S. Government/Credit Bond Index is a broad-based flagship benchmark that measures the non-securitized component of the U.S. Aggregate Index. It includes investment-grade, U.S. dollar-denominated, fixed-rate Treasuries, government-related and corporate securities. It is not possible to invest directly in an index.
12
Mairs & Power Balanced Fund
PERFORMANCE INFORMATION (unaudited) June 30, 2020
Ten years of investment performance (through June 30, 2020)
This chart illustrates the performance of a hypothetical $10,000 investment made in the Fund 10 years ago.
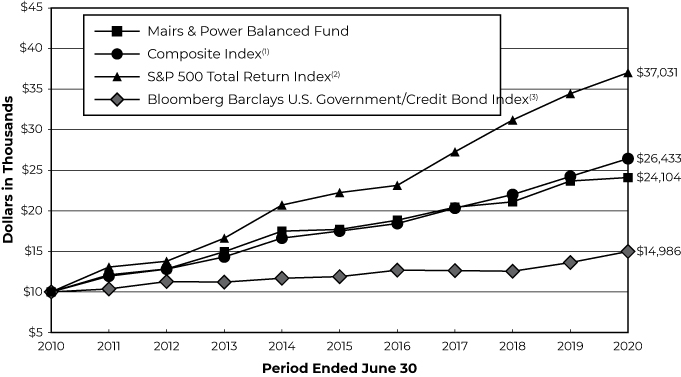
Average annual total returns for periods ended June 30, 2020
| | | 1 year | | 5 years | | 10 years | | 20 years | |
Mairs & Power Balanced Fund | | | 1.81 | % | | | 6.37 | % | | | 9.20 | % | | | 7.10 | % | |
Composite Index(1) | | | 9.08 | % | | | 8.59 | % | | | 10.21 | % | | | 5.99 | % | |
S&P 500 Total Return Index(2) | | | 7.51 | % | | | 10.73 | % | | | 13.99 | % | | | 5.91 | % | |
Bloomberg Barclays U.S.
Government/Credit Bond Index(3) | | | 10.02 | % | | | 4.74 | % | | | 4.13 | % | | | 5.30 | % | |
Performance data quoted represents past performance and does not guarantee future results. All performance information shown includes the reinvestment of dividend and capital gain distributions, but does not reflect the deduction of taxes that a shareholder would pay on Fund distributions or the redemption of Fund shares. The investment return and principal value of an investment will fluctuate so that an investor's shares, when redeemed, may be worth more or less than their original cost. Current performance of the Fund may be lower or higher than the performance quoted. For the most recent month-end performance figures, visit the Fund's website at www.mairsandpower.com or call Shareholder Services at (800) 304-7404. Per the Prospectus dated April 30, 2020, the expense ratio for the Fund is 0.71%.
(1) The Composite Index reflects an unmanaged portfolio comprised of 60% of the S&P 500 Total Return Index and 40% of the Bloomberg Barclays U.S. Government/Credit Bond Index. It is not possible to invest directly in an index.
(2) The S&P 500 Total Return Index is an unmanaged index of 500 common stocks that is generally considered representative of the U.S. stock market. It tracks both the capital gains of a group of stocks over time and assumes that any cash distributions, such as dividends, are reinvested back into the index. It is not possible to invest directly in an index.
(3) The Bloomberg Barclays U.S. Government/Credit Bond Index is a broad-based flagship benchmark that measures the non-securitized component of the U.S. Aggregate Index. It includes investment-grade, U.S. dollar-denominated, fixed-rate Treasuries, government-related and corporate securities. It is not possible to invest directly in an index.
13
Mairs & Power Balanced Fund
FUND INFORMATION (unaudited) June 30, 2020
Portfolio Managers
Kevin V. Earley, CFA, lead manager since April 1, 2018, co-manager from January 1, 2015 through April 1, 2018, University of Minnesota, MBA Finance 1990
Robert W. Thompson, CFA, co-manager since April 1, 2018, University of Minnesota, MBA Finance 1995
General Information
Fund Symbol | | MAPOX | |
Net Asset Value (NAV) Per Share | | $ | 93.71 | | |
Expense Ratio | | | 0.71 | %1 | |
Portfolio Turnover Rate
(1/1/20 to 6/30/20, not annualized) | | | 9.89 | % | |
Sales Charge | | | None2 | | |
Fund Inception Year | | | 1961 | | |
Portfolio Composition
Top Ten Common Stock Holdings
(Percent of Total Net Assets) 3
Alphabet Inc | | | 3.5 | % | |
Microsoft Corp | | | 3.3 | | |
US Bancorp/MN | | | 2.7 | | |
Ecolab Inc | | | 2.3 | | |
UnitedHealth Group Inc | | | 2.2 | | |
Medtronic PLC | | | 2.2 | | |
Eli Lilly & Co | | | 2.0 | | |
Abbott Laboratories | | | 1.9 | | |
Johnson & Johnson | | | 1.9 | | |
Roche Holding AG | | | 1.9 | | |
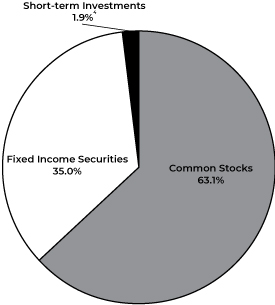
Portfolio Diversification
(Percent of Total Net Assets)
Fixed Income Securities 35.0% | |
Corporate Bonds | | | 30.4 | % | |
Asset Backed Securities | | | 2.0 | | |
Municipal Bonds | | | 1.3 | | |
U.S. Government Obligations | | | 1.3 | | |
Common Stocks 63.1% | |
Health Care | | | 14.9 | | |
Industrials | | | 12.2 | | |
Information Technology | | | 9.7 | | |
Financials | | | 8.9 | | |
Communications Services | | | 5.1 | | |
Materials | | | 4.6 | | |
Consumer Staples | | | 3.6 | | |
Consumer Discretionary | | | 2.0 | | |
Energy | | | 1.1 | | |
Real Estate | | | 0.5 | | |
Utilities | | | 0.5 | | |
Short-term Investments 1.9%4 | | | 1.9 | | |
| | | | 100.0 | % | |
1 Ratio has been annualized for the six month period ended June 30, 2020.
2 Although the Fund is no-load, investment management fees and other expenses still apply.
3 All holdings in the portfolio are subject to change without notice and may or may not represent current or future portfolio composition. The mention of specific securities is not intended as a recommendation or offer for a particular security, nor is it intended to be a solicitation for the purchase or sale of any security.
4 Represents short-term investments and other assets and liabilities (net).
The Schedule of Investments and portfolio diversification utilize the Global Industry Classification Standard (GICS®) which was developed by and/or is the exclusive property of MSCI, Inc. and Standard & Poor's Financial Services LLC ("S&P"). GICS is a service mark of MSCI, Inc. and S&P and has been licensed for use by the Adviser.
14
Mairs & Power Balanced Fund
SCHEDULE OF INVESTMENTS (unaudited) June 30, 2020
Par Value | | Security Description | | Fair Value | |
| | | FIXED INCOME SECURITIES 35.0% | |
| | | CORPORATE BONDS 30.4% | |
| | | COMMUNICATION SERVICES 1.3% | |
$ | 1,000,000 | | | Time Warner Cable Inc | | | 4.125 | % | | 02/15/21 | | $ | 1,011,464 | | |
| | 1,000,000 | | | Viacom Inc | | | 3.875 | % | | 04/01/24 | | | 1,076,025 | | |
| | 500,000 | | | Interpublic Group of Cos Inc/The | | | 4.200 | % | | 04/15/24 | | | 545,841 | | |
| | 1,000,000 | | | CBS Corp | | | 3.500 | % | | 01/15/25 | | | 1,089,760 | | |
| | 1,688,000 | | | Netflix Inc | | | 5.875 | % | | 11/15/28 | | | 1,922,210 | | |
| | 2,000,000 | | | Comcast Corp | | | 4.250 | % | | 01/15/33 | | | 2,453,659 | | |
| | 1,000,000 | | | Verizon Communications Inc | | | 4.400 | % | | 11/01/34 | | | 1,245,118 | | |
| | 1,000,000 | | | AT&T Inc | | | 4.500 | % | | 05/15/35 | | | 1,186,699 | | |
| | | | 10,530,776 | | |
| | | CONSUMER DISCRETIONARY 3.2% | |
| | 1,000,000 | | | Best Buy Co Inc | | | 5.500 | % | | 03/15/21 | | | 1,021,831 | | |
| | 1,000,000 | | | Harley-Davidson Financial Services Inc (g) | | | 4.050 | % | | 02/04/22 | | | 1,030,716 | | |
| | 500,000 | | | Whirlpool Corp | | | 4.700 | % | | 06/01/22 | | | 535,316 | | |
| | 1,000,000 | | | Block Financial LLC | | | 5.500 | % | | 11/01/22 | | | 1,065,674 | | |
| | 1,000,000 | | | General Motors Financial Co Inc | | | 3.700 | % | | 05/09/23 | | | 1,027,680 | | |
| | 1,000,000 | | | General Motors Financial Co Inc | | | 4.250 | % | | 05/15/23 | | | 1,044,205 | | |
| | 1,000,000 | | | Advance Auto Parts Inc | | | 4.500 | % | | 12/01/23 | | | 1,084,888 | | |
| | 1,000,000 | | | General Motors Financial Co Inc | | | 3.950 | % | | 04/13/24 | | | 1,034,502 | | |
| | 2,000,000 | | | Coach Inc | | | 4.250 | % | | 04/01/25 | | | 1,936,884 | | |
| | 250,000 | | | General Motors Co | | | 4.000 | % | | 04/01/25 | | | 259,421 | | |
| | 1,000,000 | | | General Motors Financial Co Inc | | | 4.300 | % | | 07/13/25 | | | 1,042,560 | | |
| | 1,064,000 | | | Block Financial LLC | | | 5.250 | % | | 10/01/25 | | | 1,154,295 | | |
| | 1,500,000 | | | Ford Motor Co | | | 4.346 | % | | 12/08/26 | | | 1,399,200 | | |
| | 2,245,000 | | | Lear Corp | | | 3.800 | % | | 09/15/27 | | | 2,278,735 | | |
| | 1,000,000 | | | General Motors Co | | | 4.200 | % | | 10/01/27 | | | 1,018,952 | | |
| | 1,000,000 | | | AutoNation Inc | | | 3.800 | % | | 11/15/27 | | | 1,034,451 | | |
| | 923,000 | | | Whirlpool Corp | | | 4.750 | % | | 02/26/29 | | | 1,089,060 | | |
| | 2,000,000 | | | Hasbro Inc | | | 3.900 | % | | 11/19/29 | | | 2,082,698 | | |
| | 2,000,000 | | | Advance Auto Parts Inc (g) | | | 3.900 | % | | 04/15/30 | | | 2,139,621 | | |
| | 1,000,000 | | | Mohawk Industries Inc | | | 3.625 | % | | 05/15/30 | | | 1,089,334 | | |
| | 1,000,000 | | | Metropolitan Opera Association Inc | | | 4.349 | % | | 10/01/32 | | | 1,182,179 | | |
| | 750,000 | | | Hasbro Inc | | | 5.100 | % | | 05/15/44 | | | 766,498 | | |
| | | | 26,318,700 | | |
| | | CONSUMER STAPLES 1.3% | |
| | 2,430,000 | | | Land O' Lakes Inc (g) | | | 6.000 | % | | 11/15/22 | | | 2,502,900 | | |
| | 500,000 | | | Land O' Lakes Inc | | | 7.250 | % | | 07/14/27 | | | 455,000 | | |
| | 1,949,000 | | | Land O' Lakes Capital Trust I (g) | | | 7.450 | % | | 03/15/28 | | | 2,134,155 | | |
| | 2,500,000 | | | Land O' Lakes Inc | | | 7.000 | % | | 12/18/28 | | | 2,253,125 | | |
| | 1,000,000 | | | Anheuser-Busch Cos LLC / Anheuser-Busch
InBev Worldwide Inc | | | 4.700 | % | | 02/01/36 | | | 1,178,074 | | |
15
Mairs & Power Balanced Fund
SCHEDULE OF INVESTMENTS (unaudited) (continued) June 30, 2020
Par Value | | Security Description | | Fair Value | |
| | | FIXED INCOME SECURITIES (continued) | |
| | | CORPORATE BONDS (continued) | |
| | | CONSUMER STAPLES (continued) | |
$ | 1,000,000 | | | Walgreens Boots Alliance Inc | | | 4.800 | % | | 11/18/44 | | $ | 1,082,836 | | |
| | 1,000,000 | | | Molson Coors Brewing Co | | | 4.200 | % | | 07/15/46 | | | 973,128 | | |
| | | | 10,579,218 | | |
| | | ENERGY 0.6% | |
| | 1,170,000 | | | ONEOK Inc | | | 4.250 | % | | 02/01/22 | | | 1,209,832 | | |
| | 140,000 | | | Gulf South Pipeline Co LP | | | 4.000 | % | | 06/15/22 | | | 142,538 | | |
| | 300,000 | | | TechnipFMC PLC (b) | | | 3.450 | % | | 10/01/22 | | | 305,127 | | |
| | 1,500,000 | | | Sunoco Logistics Partners Operations LP | | | 3.450 | % | | 01/15/23 | | | 1,550,835 | | |
| | 500,000 | | | Kinder Morgan Energy Partners LP | | | 4.250 | % | | 09/01/24 | | | 550,245 | | |
| | 1,000,000 | | | Boardwalk Pipelines LP | | | 4.950 | % | | 12/15/24 | | | 1,070,797 | | |
| | 500,000 | | | Murphy Oil Corp (f) | | | 5.875 | % | | 12/01/42 | | | 387,950 | | |
| | | | 5,217,324 | | |
| | | FINANCIALS 12.6% | |
| | 1,000,000 | | | Nationwide Financial Services Inc (g) | | | 5.375 | % | | 03/25/21 | | | 1,028,456 | | |
| | 1,000,000 | | | Capital One Financial Corp | | | 4.750 | % | | 07/15/21 | | | 1,042,733 | | |
| | 500,000 | | | Goldman Sachs Group Inc/The | | | 5.250 | % | | 07/27/21 | | | 525,003 | | |
| | 3,000,000 | | | Primerica Inc | | | 4.750 | % | | 07/15/22 | | | 3,227,462 | | |
| | 2,833,000 | | | Infinity Property & Casualty Corp | | | 5.000 | % | | 09/19/22 | | | 2,989,485 | | |
| | 2,000,000 | | | OneBeacon US Holdings Inc | | | 4.600 | % | | 11/09/22 | | | 2,078,557 | | |
| | 1,000,000 | | | Standard Chartered PLC (b) (g) | | | 3.950 | % | | 01/11/23 | | | 1,037,102 | | |
| | 500,000 | | | First American Financial Corp | | | 4.300 | % | | 02/01/23 | | | 526,204 | | |
| | 4,073,000 | | | Assurant Inc | | | 4.000 | % | | 03/15/23 | | | 4,344,457 | | |
| | 3,000,000 | | | Liberty Mutual Group Inc (g) | | | 4.250 | % | | 06/15/23 | | | 3,256,233 | | |
| | 500,000 | | | Assurant Inc | | | 4.200 | % | | 09/27/23 | | | 530,003 | | |
| | 500,000 | | | CNA Financial Corp | | | 7.250 | % | | 11/15/23 | | | 582,873 | | |
| | 500,000 | | | Pacific Life Insurance Co (g) | | | 7.900 | % | | 12/30/23 | | | 598,406 | | |
| | 1,000,000 | | | Moody's Corp | | | 4.875 | % | | 02/15/24 | | | 1,130,037 | | |
| | 1,000,000 | | | HSBC Holdings PLC (b) | | | 4.250 | % | | 03/14/24 | | | 1,078,938 | | |
| | 540,000 | | | Wintrust Financial Corp | | | 5.000 | % | | 06/13/24 | | | 575,435 | | |
| | 2,250,000 | | | Assured Guaranty US Holdings Inc | | | 5.000 | % | | 07/01/24 | | | 2,512,530 | | |
| | 3,088,000 | | | Legg Mason Inc | | | 3.950 | % | | 07/15/24 | | | 3,322,917 | | |
| | 1,500,000 | | | Symetra Financial Corp | | | 4.250 | % | | 07/15/24 | | | 1,613,815 | | |
| | 1,500,000 | | | Stifel Financial Corp | | | 4.250 | % | | 07/18/24 | | | 1,593,299 | | |
| | 1,000,000 | | | Citigroup Inc | | | 4.000 | % | | 08/05/24 | | | 1,090,691 | | |
| | 3,000,000 | | | Synchrony Financial | | | 4.250 | % | | 08/15/24 | | | 3,150,396 | | |
| | 2,800,000 | | | Brown & Brown Inc | | | 4.200 | % | | 09/15/24 | | | 3,036,111 | | |
| | 2,000,000 | | | Old Republic International Corp | | | 4.875 | % | | 10/01/24 | | | 2,163,005 | | |
| | 2,000,000 | | | TIAA Asset Management Finance Co LLC (g) | | | 4.125 | % | | 11/01/24 | | | 2,255,743 | | |
| | 1,627,000 | | | Associated Banc-Corp | | | 4.250 | % | | 01/15/25 | | | 1,706,206 | | |
16
Mairs & Power Balanced Fund
SCHEDULE OF INVESTMENTS (unaudited) (continued) June 30, 2020
Par Value | | Security Description | | Fair Value | |
| | | FIXED INCOME SECURITIES (continued) | |
| | | CORPORATE BONDS (continued) | |
| | | FINANCIALS (continued) | |
$ | 4,000,000 | | | Kemper Corp | | | 4.350 | % | | 02/15/25 | | $ | 4,313,998 | | |
| | 1,050,000 | | | TCF National Bank | | | 4.600 | % | | 02/27/25 | | | 1,083,394 | | |
| | 1,000,000 | | | BBVA USA | | | 3.875 | % | | 04/10/25 | | | 1,056,406 | | |
| | 250,000 | | | Liberty Mutual Insurance Co (g) | | | 8.500 | % | | 05/15/25 | | | 321,785 | | |
| | 1,000,000 | | | Prudential Insurance Co of America/The (g) | | | 8.300 | % | | 07/01/25 | | | 1,297,603 | | |
| | 3,000,000 | | | American International Group Inc | | | 3.750 | % | | 07/10/25 | | | 3,319,923 | | |
| | 1,000,000 | | | Synchrony Financial | | | 4.500 | % | | 07/23/25 | | | 1,062,502 | | |
| | 2,000,000 | | | Janus Capital Group Inc (b) | | | 4.875 | % | | 08/01/25 | | | 2,208,698 | | |
| | 2,000,000 | | | HSBC Holdings PLC (b) | | | 4.250 | % | | 08/18/25 | | | 2,182,032 | | |
| | 4,000,000 | | | Capital One Financial Corp | | | 4.200 | % | | 10/29/25 | | | 4,443,308 | | |
| | 1,520,000 | | | Legg Mason Inc | | | 4.750 | % | | 03/15/26 | | | 1,719,709 | | |
| | 2,000,000 | | | Hanover Insurance Group Inc/The | | | 4.500 | % | | 04/15/26 | | | 2,193,131 | | |
| | 1,000,000 | | | Wells Fargo & Co | | | 4.100 | % | | 06/03/26 | | | 1,127,715 | | |
| | 2,000,000 | | | MSCI Inc (g) | | | 4.750 | % | | 08/01/26 | | | 2,068,980 | | |
| | 3,290,000 | | | Old Republic International Corp | | | 3.875 | % | | 08/26/26 | | | 3,516,852 | | |
| | 500,000 | | | Morgan Stanley | | | 4.350 | % | | 09/08/26 | | | 576,540 | | |
| | 500,000 | | | Raymond James Financial Inc | | | 3.625 | % | | 09/15/26 | | | 555,241 | | |
| | 1,000,000 | | | Citigroup Inc | | | 4.300 | % | | 11/20/26 | | | 1,135,750 | | |
| | 1,000,000 | | | JPMorgan Chase & Co | | | 4.125 | % | | 12/15/26 | | | 1,163,869 | | |
| | 4,000,000 | | | Mercury General Corp | | | 4.400 | % | | 03/15/27 | | | 4,363,205 | | |
| | 450,000 | | | Athene Holding Ltd (b) | | | 4.125 | % | | 01/12/28 | | | 464,230 | | |
| | 250,000 | | | Provident Cos Inc | | | 7.250 | % | | 03/15/28 | | | 293,277 | | |
| | 2,000,000 | | | E*TRADE Financial Corp | | | 4.500 | % | | 06/20/28 | | | 2,312,848 | | |
| | 500,000 | | | Farmers Exchange Capital (g) | | | 7.050 | % | | 07/15/28 | | | 613,601 | | |
| | 1,000,000 | | | Lazard Group LLC | | | 4.375 | % | | 03/11/29 | | | 1,119,278 | | |
| | 2,500,000 | | | Wintrust Financial Corp | | | 4.850 | % | | 06/06/29 | | | 2,654,836 | | |
| | 500,000 | | | Goldman Sachs Group Inc/The | | | 4.250 | % | | 11/15/30 | | | 552,924 | | |
| | 500,000 | | | Goldman Sachs Group Inc/The | | | 4.000 | % | | 02/15/31 | | | 533,010 | | |
| | 500,000 | | | Goldman Sachs Group Inc/The | | | 4.300 | % | | 12/15/32 | | | 527,448 | | |
| | 538,000 | | | Bank of America Corp | | | 4.000 | % | | 08/15/34 | | | 590,486 | | |
| | 3,000,000 | | | Fulton Financial Corp (f) | | | 3.750 | % | | 03/15/35 | | | 2,864,525 | | |
| | 500,000 | | | Swiss Re Treasury US Corp (g) | | | 4.250 | % | | 12/06/42 | | | 611,294 | | |
| | 500,000 | | | Principal Financial Group Inc | | | 4.350 | % | | 05/15/43 | | | 594,893 | | |
| | 2,500,000 | | | M&T Bank Corp (f) | | | 5.125 | % | | 12/29/49 | | | 2,492,175 | | |
| | | | 102,931,563 | | |
| | | HEALTH CARE 1.4% | |
| | 1,000,000 | | | Quest Diagnostics Inc | | | 4.700 | % | | 04/01/21 | | | 1,030,139 | | |
| | 500,000 | | | Wyeth LLC | | | 6.450 | % | | 02/01/24 | | | 601,955 | | |
| | 3,000,000 | | | AbbVie Inc (g) | | | 3.800 | % | | 03/15/25 | | | 3,328,547 | | |
| | 1,400,000 | | | Baxalta Inc | | | 4.000 | % | | 06/23/25 | | | 1,586,816 | | |
17
Mairs & Power Balanced Fund
SCHEDULE OF INVESTMENTS (unaudited) (continued) June 30, 2020
Par Value | | Security Description | | Fair Value | |
| | | FIXED INCOME SECURITIES (continued) | |
| | | CORPORATE BONDS (continued) | |
| | | HEALTH CARE (continued) | |
$ | 400,000 | | | Bristol-Myers Squibb Co (g) | | | 3.875 | % | | 08/15/25 | | $ | 455,036 | | |
| | 1,000,000 | | | Cigna Corp (g) | | | 4.500 | % | | 02/25/26 | | | 1,163,305 | | |
| | 1,400,000 | | | CVS Health Corp | | | 4.780 | % | | 03/25/38 | | | 1,739,643 | | |
| | 1,000,000 | | | UnitedHealth Group Inc | | | 3.500 | % | | 08/15/39 | | | 1,162,831 | | |
| | | | 11,068,272 | | |
| | | INDUSTRIALS 3.0% | |
| | 500,000 | | | IDEX Corp | | | 4.200 | % | | 12/15/21 | | | 515,175 | | |
| | 500,000 | | | GATX Corp | | | 4.750 | % | | 06/15/22 | | | 527,103 | | |
| | 500,000 | | | Penske Truck Leasing Co Lp / PTL Finance Corp (g) | | | 4.875 | % | | 07/11/22 | | | 532,603 | | |
| | 1,850,000 | | | MasTec Inc | | | 4.875 | % | | 03/15/23 | | | 1,836,125 | | |
| | 1,000,000 | | | GATX Corp | | | 3.900 | % | | 03/30/23 | | | 1,052,386 | | |
| | 1,000,000 | | | Flowserve Corp | | | 4.000 | % | | 11/15/23 | | | 1,028,530 | | |
| | 2,126,000 | | | Air Lease Corp | | | 4.850 | % | | 02/01/24 | | | 2,067,143 | | |
| | 2,350,000 | | | Tennant Co | | | 5.625 | % | | 05/01/25 | | | 2,373,500 | | |
| | 1,500,000 | | | Hillenbrand Inc (f) | | | 4.500 | % | | 09/15/26 | | | 1,506,090 | | |
| | 500,000 | | | Toro Co/The | | | 7.800 | % | | 06/15/27 | | | 605,665 | | |
| | 2,000,000 | | | Kennametal Inc | | | 4.625 | % | | 06/15/28 | | | 2,143,270 | | |
| | 500,000 | | | Fluor Corp | | | 4.250 | % | | 09/15/28 | | | 429,375 | | |
| | 3,000,000 | | | Steelcase Inc | | | 5.125 | % | | 01/18/29 | | | 3,184,899 | | |
| | 1,000,000 | | | Oshkosh Corp | | | 3.100 | % | | 03/01/30 | | | 1,007,060 | | |
| | 2,000,000 | | | GATX Corp | | | 4.000 | % | | 06/30/30 | | | 2,140,883 | | |
| | 2,000,000 | | | Eaton Corp | | | 4.000 | % | | 11/02/32 | | | 2,364,932 | | |
| | 1,000,000 | | | FedEx Corp | | | 4.100 | % | | 04/15/43 | | | 1,040,128 | | |
| | | | 24,354,867 | | |
| | | INFORMATION TECHNOLOGY 4.0% | |
| | 500,000 | | | Broadridge Financial Solutions Inc | | | 3.950 | % | | 09/01/20 | | | 502,779 | | |
| | 500,000 | | | Diamond 1 Finance Corp / Diamond 2 Finance Corp (g) | | | 4.420 | % | | 06/15/21 | | | 513,975 | | |
| | 2,000,000 | | | NetApp Inc | | | 3.375 | % | | 06/15/21 | | | 2,044,261 | | |
| | 1,500,000 | | | Symantec Corp | | | 3.950 | % | | 06/15/22 | | | 1,520,625 | | |
| | 500,000 | | | Western Union Co/The | | | 4.250 | % | | 06/09/23 | | | 538,695 | | |
| | 2,000,000 | | | Diamond 1 Finance Corp / Diamond 2 Finance Corp (g) | | | 5.450 | % | | 06/15/23 | | | 2,187,625 | | |
| | 700,000 | | | DXC Technology Co | | | 4.250 | % | | 04/15/24 | | | 752,671 | | |
| | 1,031,000 | | | Arrow Electronics Inc | | | 4.000 | % | | 04/01/25 | | | 1,114,589 | | |
| | 1,000,000 | | | Juniper Networks Inc | | | 4.350 | % | | 06/15/25 | | | 1,110,242 | | |
| | 2,000,000 | | | Hewlett Packard Enterprise Co (f) | | | 4.900 | % | | 10/15/25 | | | 2,308,544 | | |
| | 1,500,000 | | | Dell International LLC / EMC Corp (g) | | | 6.020 | % | | 06/15/26 | | | 1,719,713 | | |
| | 1,000,000 | | | DXC Technology Co | | | 4.750 | % | | 04/15/27 | | | 1,096,439 | | |
| | 2,500,000 | | | Motorola Solutions Inc | | | 4.600 | % | | 02/23/28 | | | 2,843,309 | | |
| | 1,500,000 | | | Trimble Inc | | | 4.900 | % | | 06/15/28 | | | 1,721,809 | | |
| | 1,000,000 | | | Fiserv Inc | | | 4.200 | % | | 10/01/28 | | | 1,173,406 | | |
18
Mairs & Power Balanced Fund
SCHEDULE OF INVESTMENTS (unaudited) (continued) June 30, 2020
Par Value | | Security Description | | Fair Value | |
| | | FIXED INCOME SECURITIES (continued) | |
| | | CORPORATE BONDS (continued) | |
| | | INFORMATION TECHNOLOGY (continued) | |
$ | 1,500,000 | | | Broadcom Inc (g) | | | 4.750 | % | | 04/15/29 | | $ | 1,702,702 | | |
| | 1,000,000 | | | Juniper Networks Inc | | | 3.750 | % | | 08/15/29 | | | 1,117,950 | | |
| | 1,000,000 | | | Dell International LLC / EMC Corp (g) | | | 5.300 | % | | 10/01/29 | | | 1,103,729 | | |
| | 3,000,000 | | | Intel Corp | | | 4.000 | % | | 12/15/32 | | | 3,687,510 | | |
| | 2,000,000 | | | Leidos Inc | | | 5.500 | % | | 07/01/33 | | | 2,248,100 | | |
| | 1,500,000 | | | Western Union Co/The | | | 6.200 | % | | 11/17/36 | | | 1,699,642 | | |
| | | | 32,708,315 | | |
| | | MATERIALS 2.3% | |
| | 500,000 | | | Carpenter Technology Corp | | | 5.200 | % | | 07/15/21 | | | 504,718 | | |
| | 175,000 | | | Mosaic Co/The | | | 3.750 | % | | 11/15/21 | | | 179,126 | | |
| | 1,000,000 | | | Domtar Corp | | | 4.400 | % | | 04/01/22 | | | 1,021,728 | | |
| | 750,000 | | | RPM International Inc | | | 3.450 | % | | 11/15/22 | | | 774,100 | | |
| | 2,000,000 | | | Mosaic Co/The | | | 4.250 | % | | 11/15/23 | | | 2,098,625 | | |
| | 1,000,000 | | | Steel Dynamics Inc | | | 5.500 | % | | 10/01/24 | | | 1,027,500 | | |
| | 1,000,000 | | | Freeport-McMoRan Inc | | | 4.550 | % | | 11/14/24 | | | 1,016,250 | | |
| | 756,000 | | | Eastman Chemical Co | | | 3.800 | % | | 03/15/25 | | | 820,778 | | |
| | 865,000 | | | Union Carbide Corp | | | 7.500 | % | | 06/01/25 | | | 1,047,045 | | |
| | 2,000,000 | | | DowDuPont Inc | | | 4.493 | % | | 11/15/25 | | | 2,300,408 | | |
| | 200,000 | | | Worthington Industries Inc | | | 4.550 | % | | 04/15/26 | | | 227,272 | | |
| | 1,500,000 | | | Cabot Corp | | | 3.400 | % | | 09/15/26 | | | 1,537,475 | | |
| | 782,000 | | | HB Fuller Co | | | 4.000 | % | | 02/15/27 | | | 758,305 | | |
| | 1,500,000 | | | Cabot Corp | | | 4.000 | % | | 07/01/29 | | | 1,549,961 | | |
| | 1,250,000 | | | Dow Chemical Co/The | | | 4.250 | % | | 10/01/34 | | | 1,394,249 | | |
| | 1,000,000 | | | Alcoa Inc | | | 5.950 | % | | 02/01/37 | | | 1,037,601 | | |
| | 1,000,000 | | | Newmont Mining Corp | | | 4.875 | % | | 03/15/42 | | | 1,288,755 | | |
| | 325,000 | | | Albemarle Corp | | | 5.450 | % | | 12/01/44 | | | 341,551 | | |
| | | | 18,925,447 | | |
| | | REAL ESTATE 0.2% | |
| | 1,000,000 | | | CBRE Services Inc | | | 5.250 | % | | 03/15/25 | | | 1,126,191 | | |
| | 350,000 | | | CBRE Services Inc | | | 4.875 | % | | 03/01/26 | | | 397,283 | | |
| | | | 1,523,474 | | |
| | | UTILITIES 0.5% | |
| | 75,000 | | | National Fuel Gas Co | | | 3.750 | % | | 03/01/23 | | | 76,442 | | |
| | 1,060,000 | | | PSEG Power LLC | | | 4.300 | % | | 11/15/23 | | | 1,169,419 | | |
| | 250,000 | | | Jersey Central Power & Light Co (g) | | | 4.300 | % | | 01/15/26 | | | 289,073 | | |
| | 2,000,000 | | | National Fuel Gas Co | | | 3.950 | % | | 09/15/27 | | | 1,961,059 | | |
| | 1,000,000 | | | National Fuel Gas Co | | | 4.750 | % | | 09/01/28 | | | 1,015,000 | | |
| | | | 4,510,993 | | |
| | | TOTAL CORPORATE BONDS | | | 248,668,949 | | |
19
Mairs & Power Balanced Fund
SCHEDULE OF INVESTMENTS (unaudited) (continued) June 30, 2020
Par Value | | Security Description | | Fair Value | |
| | | FIXED INCOME SECURITIES (continued) | |
| | | ASSET BACKED SECURITIES 2.0% | |
$ | 327,160 | | | America West Airlines 2000-1 Pass Through Trust | | | 8.057 | % | | 07/02/20 | | $ | 327,071 | | |
| | 325,458 | | | American Airlines 2011-1 Class A Pass Through Trust | | | 5.250 | % | | 01/31/21 | | | 275,102 | | |
| | 250,317 | | | Air Canada 2013-1 Class B Pass Through Trust (b) (g) | | | 5.375 | % | | 05/15/21 | | | 229,482 | | |
| | 195,018 | | | Northwest Airlines 2002-1 Class G-2 Pass Through Trust | | | 6.264 | % | | 11/20/21 | | | 186,655 | | |
| | 272,512 | | | United Airlines 2014-1 Class B Pass Through Trust | | | 4.750 | % | | 04/11/22 | | | 240,582 | | |
| | 142,678 | | | Continental Airlines 2007-1 Class A Pass Through Trust | | | 5.983 | % | | 04/19/22 | | | 132,996 | | |
| | 171,146 | | | Southwest Airlines Co 2007-1 Pass Through Trust | | | 6.150 | % | | 08/01/22 | | | 170,775 | | |
| | 444,502 | | | Delta Air Lines 2007-1 Class B Pass Through Trust | | | 8.021 | % | | 08/10/22 | | | 401,234 | | |
| | 43,566 | | | United Airlines 2014-2 Class B Pass Through Trust | | | 4.625 | % | | 09/03/22 | | | 38,302 | | |
| | 343,960 | | | American Airlines 2014-1 Class B Pass Through Trust | | | 4.375 | % | | 10/01/22 | | | 249,453 | | |
| | 1,000,000 | | | United Airlines 2015-1 Class A Pass Through Trust | | | 3.700 | % | | 12/01/22 | | | 923,029 | | |
| | 427,347 | | | US Airways 2010-1 Class A Pass Through Trust | | | 6.250 | % | | 04/22/23 | | | 346,144 | | |
| | 1,049,634 | | | Delta Air Lines 2015-1 Class B Pass Through Trust | | | 4.250 | % | | 07/30/23 | | | 931,883 | | |
| | 609,211 | | | American Airlines 2015-2 Class B Pass Through Trust | | | 4.400 | % | | 09/22/23 | | | 416,389 | | |
| | 230,881 | | | US Airways 2011-1 Class A Pass Through Trust | | | 7.125 | % | | 10/22/23 | | | 186,553 | | |
| | 2,606,944 | | | American Airlines 2016-1 Class B Pass Through Trust | | | 5.250 | % | | 01/15/24 | | | 1,708,925 | | |
| | 819,186 | | | Spirit Airlines Pass Through Trust 2015-1B | | | 4.450 | % | | 04/01/24 | | | 615,763 | | |
| | 1,254,586 | | | Continental Airlines 2012-2 Class A Pass Through Trust | | | 4.000 | % | | 10/29/24 | | | 1,130,433 | | |
| | 897,518 | | | American Airlines 2017-1 Class B Pass Through Trust | | | 4.950 | % | | 02/15/25 | | | 673,870 | | |
| | 764,113 | | | United Airlines 2013-1 Class A Pass Through Trust | | | 4.300 | % | | 08/15/25 | | | 698,209 | | |
| | 779,041 | | | American Airlines 2016-3 Class B Pass Through Trust | | | 3.750 | % | | 10/15/25 | | | 545,405 | | |
| | 616,761 | | | US Airways 2013-1 Class A Pass Through Trust | | | 3.950 | % | | 11/15/25 | | | 508,889 | | |
| | 1,775,385 | | | Hawaiian Airlines 2013-1 Class A Pass Through Certificates | | | 3.900 | % | | 01/15/26 | | | 1,510,348 | | |
| | 619,563 | | | United Airlines 2014-1 Class A Pass Through Trust | | | 4.000 | % | | 04/11/26 | | | 566,815 | | |
| | 518,344 | | | United Airlines 2014-2 Class A Pass Through Trust | | | 3.750 | % | | 09/03/26 | | | 471,717 | | |
| | 1,364,559 | | | American Airlines 2014-1 Class A Pass Through Trust | | | 3.700 | % | | 10/01/26 | | | 1,127,869 | | |
| | 349,856 | | | American Airlines 2015-1 Class A Pass Through Trust | | | 3.375 | % | | 05/01/27 | | | 292,608 | | |
| | 155,625 | | | American Airlines 2015-2 Class AA Pass Through Trust | | | 3.600 | % | | 09/22/27 | | | 143,580 | | |
| | 507,405 | | | American Airlines 2015-2 Class A Pass Through Trust | | | 4.000 | % | | 09/22/27 | | | 419,742 | | |
| | 98,852 | | | Spirit Airlines Pass Through Trust 2015-1A | | | 4.100 | % | | 04/01/28 | | | 83,086 | | |
| | 905,159 | | | British Airways 2018-1 Class A Pass Through Trust (b) (g) | | | 4.125 | % | | 09/20/31 | | | 746,853 | | |
| | | | 16,299,762 | | |
| | | MUNICIPAL BONDS 1.3% | |
| | 650,000 | | | Glendale Community College District/CA | | | 2.113 | % | | 08/01/31 | | | 655,785 | | |
| | 500,000 | | | Socorro Independent School District | | | 2.125 | % | | 08/15/31 | | | 524,570 | | |
| | 400,000 | | | County of Hennepin MN | | | 4.800 | % | | 12/01/35 | | | 510,368 | | |
| | 500,000 | | | DeKalb Kane & LaSalle Counties Etc Community
College District No 523 Kishwaukee | | | 3.017 | % | | 02/01/36 | | | 507,270 | | |
| | 305,000 | | | State of California | | | 4.600 | % | | 04/01/38 | | | 356,414 | | |
| | 1,000,000 | | | Crowley Independent School District | | | 3.010 | % | | 08/01/38 | | | 1,024,660 | | |
| | 850,000 | | | Worthington Independent School District No 518 | | | 3.300 | % | | 02/01/39 | | | 862,087 | | |
20
Mairs & Power Balanced Fund
SCHEDULE OF INVESTMENTS (unaudited) (continued) June 30, 2020
Par Value/Shares | | Security Description | | Fair Value | |
| | | FIXED INCOME SECURITIES (continued) | |
| | | MUNICIPAL BONDS (continued) | |
$ | 750,000 | | | Allen Independent School District | | | 3.148 | % | | 02/15/39 | | $ | 795,075 | | |
| | 610,000 | | | Rockwall Independent School District | | | 3.091 | % | | 02/15/39 | | | 633,808 | | |
| | 945,000 | | | City of Minnetonka MN | | | 3.050 | % | | 02/01/40 | | | 974,683 | | |
| | 505,000 | | | Village of Ashwaubenon WI | | | 2.970 | % | | 06/01/40 | | | 514,130 | | |
| | 800,000 | | | Utah Transit Authority | | | 3.443 | % | | 12/15/42 | | | 829,104 | | |
| | 500,000 | | | BAC Capital Trust XIV (f) | | | 4.000 | % | | 03/15/43 | | | 446,875 | | |
| | 600,000 | | | San Diego Community College District | | | 3.336 | % | | 08/01/43 | | | 646,836 | | |
| | 1,000,000 | | | Michigan State University | | | 4.496 | % | | 08/15/48 | | | 1,131,260 | | |
| | | | 10,412,925 | | |
| | | U.S. GOVERNMENT OBLIGATIONS 1.3% | |
| | 7,000,000 | | | United States Treasury Note/Bond | | | 2.625 | % | | 02/15/29 | | | 8,202,578 | | |
| | 2,000,000 | | | United States Treasury Note/Bond | | | 3.000 | % | | 02/15/49 | | | 2,761,250 | | |
| | | | 10,963,828 | | |
| | TOTAL FIXED INCOME SECURITIES
(cost $272,131,759) | | $ | 286,345,464 | | |
| | | COMMON STOCKS 63.1% | |
| | | COMMUNICATION SERVICES 5.1% | |
| | 20,000 | | | Alphabet Inc (a) | | | | | | | | | | $ | 28,272,200 | | |
| | 120,000 | | | Walt Disney Co/The | | | | | | | | | | | 13,381,200 | | |
| | | | 41,653,400 | | |
| | | CONSUMER DISCRETIONARY 2.0% | |
| | 45,000 | | | Home Depot Inc/The | | | | | | | | | | | 11,272,950 | | |
| | 45,000 | | | Target Corp | | | | | | | | | | | 5,396,850 | | |
| | | | 16,669,800 | | |
| | | CONSUMER STAPLES 3.6% | |
| | 83,000 | | | General Mills Inc | | | | | | | | | | | 5,116,950 | | |
| | 50,000 | | | Hershey Co/The | | | | | | | | | | | 6,481,000 | | |
| | 255,000 | | | Hormel Foods Corp | | | | | | | | | | | 12,308,850 | | |
| | 95,000 | | | Sysco Corp | | | | | | | | | | | 5,192,700 | | |
| | | | 29,099,500 | | |
| | | ENERGY 1.1% | |
| | 82,000 | | | Chevron Corp | | | | | | | | | | | 7,316,860 | | |
| | 84,000 | | | Schlumberger Ltd (b) | | | | | | | | | | | 1,544,760 | | |
| | | | 8,861,620 | | |
| | | FINANCIALS 8.9% | |
| | 133,000 | | | American Express Co | | | | | | | | | | | 12,661,600 | | |
| | 198,000 | | | Great Western Bancorp Inc | | | | | | | | | | | 2,724,480 | | |
| | 140,000 | | | JPMorgan Chase & Co | | | | | | | | | | | 13,168,400 | | |
21
Mairs & Power Balanced Fund
SCHEDULE OF INVESTMENTS (unaudited) (continued) June 30, 2020
Shares | | Security Description | | Fair Value | |
| | | COMMON STOCKS (continued) | |
| | | FINANCIALS (continued) | |
| | 339,000 | | | Principal Financial Group Inc | | $ | 14,082,060 | | |
| | 27,000 | | | Travelers Cos Inc/The | | | 3,079,350 | | |
| | 591,000 | | | US Bancorp/MN | | | 21,760,620 | | |
| | 221,000 | | | Wells Fargo & Co | | | 5,657,600 | | |
| | | | 73,134,110 | | |
| | | HEALTH CARE 14.9% | |
| | 174,000 | | | Abbott Laboratories | | | 15,908,820 | | |
| | 57,000 | | | Baxter International Inc | | | 4,907,700 | | |
| | 29,000 | | | Bio-Techne Corp | | | 7,658,030 | | |
| | 175,000 | | | Elanco Animal Health Inc (a) | | | 3,753,750 | | |
| | 100,000 | | | Eli Lilly & Co | | | 16,418,000 | | |
| | 113,000 | | | Johnson & Johnson | | | 15,891,190 | | |
| | 192,000 | | | Medtronic PLC (e) | | | 17,606,400 | | |
| | 201,000 | | | Pfizer Inc | | | 6,572,700 | | |
| | 352,000 | | | Roche Holding AG (d) | | | 15,269,760 | | |
| | 60,000 | | | UnitedHealth Group Inc | | | 17,697,000 | | |
| | | | 121,683,350 | | |
| | | INDUSTRIALS 12.2% | |
| | 96,000 | | | 3M Co | | | 14,975,040 | | |
| | 86,000 | | | CH Robinson Worldwide Inc | | | 6,799,160 | | |
| | 212,000 | | | Donaldson Co Inc | | | 9,862,240 | | |
| | 234,000 | | | Fastenal Co | | | 10,024,560 | | |
| | 273,000 | | | Graco Inc | | | 13,101,270 | | |
| | 97,000 | | | Honeywell International Inc | | | 14,025,230 | | |
| | 225,000 | | | nVent Electric PLC (e) | | | 4,214,250 | | |
| | 24,000 | | | Rockwell Automation Inc | | | 5,112,000 | | |
| | 55,000 | | | Tennant Co | | | 3,575,550 | | |
| | 195,000 | | | Toro Co/The | | | 12,936,300 | | |
| | 42,000 | | | United Parcel Service Inc, Class B | | | 4,669,560 | | |
| | | | 99,295,160 | | |
| | | INFORMATION TECHNOLOGY 9.7% | |
| | 236,000 | | | Corning Inc | | | 6,112,400 | | |
| | 103,000 | | | Fiserv Inc (a) | | | 10,054,860 | | |
| | 23,000 | | | Littelfuse Inc | | | 3,924,490 | | |
| | 131,000 | | | Microsoft Corp | | | 26,659,810 | | |
| | 71,000 | | | Motorola Solutions Inc | | | 9,949,230 | | |
| | 100,000 | | | QUALCOMM Inc | | | 9,121,000 | | |
| | 68,000 | | | Visa Inc | | | 13,135,560 | | |
| | | | 78,957,350 | | |
22
Mairs & Power Balanced Fund
SCHEDULE OF INVESTMENTS (unaudited) (continued) June 30, 2020
Shares | | Security Description | | Fair Value | |
| | | COMMON STOCKS (continued) | |
| | | MATERIALS 4.6% | |
| | 95,000 | | | Ecolab Inc | | $ | 18,900,250 | | |
| | 188,000 | | | HB Fuller Co | | | 8,384,800 | | |
| | 18,000 | | | Sherwin-Williams Co/The | | | 10,401,300 | | |
| | | | 37,686,350 | | |
| | | REAL ESTATE 0.5% | |
| | 34,000 | | | CoreSite Realty Corp | | | 4,116,040 | | |
| | | UTILITIES 0.5% | |
| | 65,000 | | | Xcel Energy Inc | | | 4,062,500 | | |
| | | | TOTAL COMMON STOCKS
(cost $328,158,910) | | $ | 515,219,180 | | |
| | | SHORT-TERM INVESTMENTS 1.1% | |
| 9,000,895 | | | First American Government Obligations Fund, Class X, 0.091% (c)
(cost $9,000,895) | | $ | 9,000,895 | | |
| | | | TOTAL INVESTMENTS 99.2%
(cost $609,291,564) | | $ | 810,565,539 | | |
| | | | | OTHER ASSETS AND LIABILITIES (NET) 0.8% | | | 6,487,945 | | |
| | | | | TOTAL NET ASSETS 100.0% | | $ | 817,053,484 | | |
(a) Non-income producing.
(b) Foreign security denominated in U.S. dollars. As of June 30, 2020, these securities represented $9,797,222 or 1.2% of total net assets.
(c) The rate quoted is the annualized seven-day effective yield as of June 30, 2020.
(d) American Depositary Receipt.
(e) Issuer headquartered overseas but considered domestic. The Adviser defines foreign issuers as those whose operational leadership or headquarters is located in a foreign country; provided, however, if an issuer is believed by the Adviser to be headquartered in a jurisdiction primarily for tax purposes, the Adviser will consider the following additional factors: 1) the location of the primary exchange trading its securities; 2) where it derives the majority of its revenues, and/or 3) where it earns the majority of its profits.
(f) Step Bonds - Securities for which the coupon rate of interest will adjust on specified future date(s). The rate disclosed represents the coupon rate in effect as of June 30, 2020.
(g) Securities exempt from registration under Rule 144A of the Securities Act of 1933. These securities may be resold in transactions exempt from registration, normally to qualified institutional buyers. These securities have been determined to be liquid under the Fund's Liquidity Risk Management Program. As of June 30, 2020, these securities represented $34,869,238 or 4.3% of total net assets.
The Global Industry Classification Standard (GICS®) was developed by and/or is the exclusive property of MSCI, Inc. and Standard & Poor's Financial Services LLC ("S&P"). GICS is a service mark of MSCI, Inc. and S&P and has been licensed for use by the Adviser.
See accompanying Notes to Financial Statements.
23
MAIRS & POWER SMALL CAP FUND (unaudited)
To Our Shareholders: June 30, 2020
Here is a particularly remarkable demonstration of the tale of two quarters. In the second quarter, the Mairs & Power Small Cap Fund gained 19.03%, the benchmark S&P Small Cap 600 Total Return (TR) Index was up 21.94% and the Fund's peer group of small cap funds as measured by the Morningstar U.S. Fund Small Blend category was up 22.86%. But six months year-to-date, the Fund has lost 15.68%, the S&P Small Cap 600 TR Index was down 17.85% and the Morningstar peer group lost 16.99%.
The Fund's relative outperformance in the first half compared to the S&P 600 benchmark was driven mainly by the strength of the fund's Healthcare sector holdings. Top performers in this sector were Bio-Techne (TECH), Catalent (CTLT), and Inspire Medical Systems (INSP). All were up during the quarter versus the index, and all have significant weights in the Fund's portfolio. Catalent, for instance, is providing manufacturing and packaging capabilities to multiple pharmaceutical firms developing vaccines for COVID-19. Minnesota-based Inspire has succeeded in getting Medicare and most private-pay insurers to cover its sleep apnea device. They are having good success in rolling out this product.
The sector that most detracted from the Fund's performance was the Financial sector. Economic turmoil leading to falling interest rates and credit losses have caused our holdings in banks and insurance companies to significantly underperform. Examples of Fund holdings in this sector that underperformed significantly include Great Western Bancorp (GWB), Associated Banc-Corp (ASB) and Wintrust Financial (WTFC). Another of our Financial holdings, United Fire Group (UFCS), was impacted by both falling yields on their investment portfolio as well as large catastrophe losses.
MAIRS & POWER SMALL CAP FUND (MSCFX)
Top Relative Performers
| Second Quarter (3/31/20 – 6/30/20) | | Year To Date (12/31/19 – 6/30/20) | |
Catalent, Inc. | | | 19.15 | % | | Catalent, Inc. | | | 48.05 | % | |
Workiva, Inc. | | | 43.51 | % | | Bio-Techne Corporation | | | 38.48 | % | |
H.B. Fuller Company | | | 38.61 | % | | CyberOptics Corporation | | | 93.10 | % | |
CyberOptics Corporation | | | 66.31 | % | | CoreSite Realty Corporation | | | 28.10 | % | |
Bio-Techne Corporation | | | 17.48 | % | | Inspire Medical Systems, Inc. | | | 35.12 | % | |
Weak Relative Performers
| Second Quarter (3/31/20 – 6/30/20) | | Year To Date (12/31/19 – 6/30/20) | |
Black Hills Corporation | | | -32.61 | % | | Great Western Bancorp, Inc. | | | -41.64 | % | |
Great Western Bancorp, Inc. | | | -53.90 | % | | AAR Corporation | | | -36.05 | % | |
United Fire Group, Inc. | | | -36.00 | % | | Wintrust Financial Corporation | | | -19.88 | % | |
CoreSite Realty Corporation | | | -16.42 | % | | Marcus Corporation | | | -40.11 | % | |
Northwestern Corporation | | | -29.84 | % | | Associated Bancorp | | | -18.61 | % | |
Performance shown is relative to the S&P SmallCap 600 TR Index as of June 30, 2020. Relative return is the difference between the absolute return and the performance of the market, in which the position is held. Relative contribution is used for ranking, which considers average daily weightings for each holding.
We did take advantage of the market turmoil in the first quarter to add four new names to the Fund. These were stocks that we had been following for some time, and whose valuations became particularly compelling in the selloff. In the Technology sector, we added two companies:
• Envestnet (ENV) is a Chicago-based firm that develops back-office systems for financial planners. Its business has been growing as more and more financial planners leave large brokerages to strike out on their own.
24
MAIRS & POWER SMALL CAP FUND (unaudited) (continued)
Envestnet provides the support these financial planners need, including portfolio analytics, portfolio management and other wealth management tools.
• Plexus (PLXS) is a contract manufacturer in Wisconsin that over the years has improved its business model. Plexus has improved its customer mix and has had a much more consistent revenue base with good overall returns.
In the Industrial sector, the fund added nVent Electric (NVT), which was spun off from Pentair in 2018. The company manufactures enclosure systems and provides connectivity solutions for telecommunications and electronics equipment. While NVT was hit hard in the first half of 2020, we believe it remains a very solid company with very promising opportunities with the rollout of 5G and the growth of Internet of Things technologies.
In the Consumer sector, the Fund added Sleep Number (SNBR). We had been looking at this Minnesota-based company for quite some time, and were waiting for the right opportunity to add it to the portfolio. We got that valuation in the first half of the year.
The Fund also exited a couple of companies in the second quarter. One was United Bankshares (UBSI), which operates primarily in the Mid-Atlantic states. We didn't have as much confidence in the credit strength and long-term prospects of this bank as we do in the others that we hold. In the Technology sector, we exited FireEye (FEYE), whose cybersecurity product rollout was not as strong as we had expected.
In addition, we sold some positions in Healthcare companies that had held up well in the first quarter in order to take advantage of the buying opportunities mentioned earlier. But by and large, the Fund has not changed a great deal in terms of positioning or overall strategy as a result of market turmoil in the first half of the year.
Allen D. Steinkopf
Lead Manager | | Andrew R. Adams
Co-Manager | |
The Fund's investment objective, risks, charges and expenses must be considered carefully before investing. The summary prospectus or full prospectus contains this and other important information about the Fund and they may be obtained by calling Shareholder Services at (800) 304-7404 or by visiting www.mairsandpower.com. Read the summary prospectus or full prospectus carefully before investing.
All holdings in the portfolio are subject to change without notice and may or may not represent current or future portfolio composition. The mention of specific securities is not intended as a recommendation or an offer of a particular security, nor is it intended to be a solicitation for the purchase or sale of any security.
All investments have risks. The Small Cap Fund is designed for long-term investors. Equity investments are subject to market fluctuations and the Fund's share price can fall because of weakness in the broad market, a particular industry or specific holdings. Investments in small and midcap companies generally are more volatile. International investing risks include among others political, social or economic instability, difficulty in predicting international trade patterns, taxation and foreign trading practices, and greater fluctuations in price than U.S. corporations. The Fund may invest in initial public offerings by small cap companies, which can involve greater risk than investments in companies that are already publicly traded.
This commentary includes forward-looking statements such as economic predictions and portfolio manager opinions. The statements are subject to change at any time based on market and other conditions. No predictions, forecasts, outlooks, expectations or beliefs are guaranteed.
Diversification does not guarantee profit or protect against loss.
S&P 600 Small Cap Total Return (S&P 600) is an index of small company stocks managed by Standard & Poor's Financial Services LLC that covers a broad range of small cap stocks in the U.S. The index is weighted according to market capitalization and covers about 3-4% of the total market for equities in the U.S. It tracks both the capital gains of a group of stocks over time and assumes that any cash distributions, such as dividends, are reinvested back into the index. It is not possible to invest directly in an index.
25
MAIRS & POWER SMALL CAP FUND (unaudited) (continued)
Morningstar Small Blend Category, as defined by Morningstar are stocks in the bottom 10% of the capitalization of the U.S. equity market and are defined as small cap. The blend style is assigned to portfolios where neither growth nor value characteristics predominate. It is not possible to invest directly in an index.
26
Mairs & Power Small Cap Fund
PERFORMANCE INFORMATION (unaudited) June 30, 2020
Investment performance since commencement of operations (through June 30, 2020)
This chart illustrates the performance of a hypothetical $10,000 investment made in the Fund since commencement of operations.
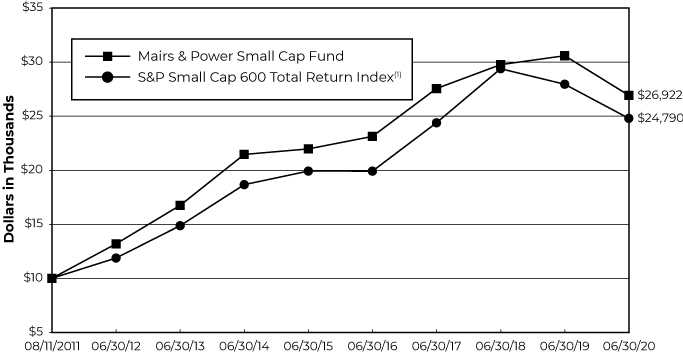
Average annual total returns for periods ended June 30, 2020
| | | 1 Year | | 3 Year | | 5 Year | | Since Inception(2) | |
Mairs & Power Small Cap Fund | | | -11.96 | % | | | -0.76 | % | | | 4.15 | % | | | 11.79 | % | |
S&P Small Cap 600 Total Return Index (1) | | | -11.29 | % | | | 0.56 | % | | | 4.48 | % | | | 10.75 | % | |
Performance data quoted represents past performance and does not guarantee future results. All performance information shown includes the reinvestment of dividend and capital gain distributions, but does not reflect the deduction of taxes that a shareholder would pay on Fund distributions or the redemption of Fund shares. The investment return and principal value of an investment will fluctuate so that an investor's shares, when redeemed, may be worth more or less than their original cost. Current performance of the Fund may be lower or higher than the performance quoted. For the most recent month-end performance figures, visit the Fund's website at www.mairsandpower.com or call Shareholder Services at (800) 304-7404. Per the Prospectus dated April 30, 2020, the expense ratio for the Fund is 1.05%.
(1) The S&P Small Cap 600 Total Return Index is an index of small-company stocks managed by Standard & Poor's Financial Services LLC that covers a broad range of small cap stocks in the U.S. The index is weighted according to market capitalization and covers about 3-4% of the total market for equities in the U.S. It tracks both the capital gains of a group of stocks over time and assumes that any cash distributions, such as dividends, are reinvested back into the index. It is not possible to invest directly in an index.
(2) Since inception performance is as of August 11, 2011, which is the offering date of the Small Cap Fund.
27
Mairs & Power Small Cap Fund
FUND INFORMATION (unaudited) June 30, 2020
Portfolio Managers
Allen D. Steinkopf, CFA, lead manager since April 1, 2019, co-manager from January 1, 2015 through April 1, 2019, University of Minnesota, MBA Finance 1986
Andrew R. Adams, CFA, co-manager since April 1, 2019, lead manager from 2011 to April 1, 2019, University of Wisconsin-Madison, MS Finance 1997
General Information
Fund Symbol | | MSCFX | |
Net Asset Value (NAV) Per Share | | $ | 22.27 | | |
Expense Ratio | | | 1.06 | %1 | |
Portfolio Turnover Rate
(1/1/20 to 6/30/20, not annualized) | | | 9.49 | % | |
Sales Charge | | | None2 | | |
Fund Inception Year | | | 2011 | | |
Portfolio Composition
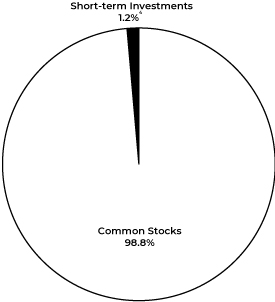
Top Ten Portfolio Holdings
(Percent of Total Net Assets) 3
Catalent Inc | | | 4.3 | % | |
Wintrust Financial Corp | | | 4.0 | | |
Tennant Co | | | 3.9 | | |
Cabot Microelectronics Corp | | | 3.5 | | |
Oshkosh Corp | | | 3.5 | | |
Cullen/Frost Bankers Inc | | | 3.4 | | |
Bio-Techne Corp | | | 3.2 | | |
CoreSite Realty Corp | | | 3.1 | | |
Glacier Bancorp Inc | | | 3.1 | | |
Littelfuse Inc | | | 3.1 | | |
Portfolio Diversification
(Percent of Total Net Assets)
Common Stocks 98.8% | |
Industrials | | | 24.6 | % | |
Financials | | | 17.4 | | |
Information Technology | | | 16.8 | | |
Health Care | | | 15.8 | | |
Real Estate | | | 6.0 | | |
Utilities | | | 5.2 | | |
Consumer Staples | | | 4.1 | | |
Consumer Discretionary | | | 3.3 | | |
Materials | | | 3.3 | | |
Communication Services | | | 1.3 | | |
Energy | | | 1.0 | | |
Short-term Investments 1.2%4 | | | 1.2 | | |
| | | | 100.0 | % | |
1 Ratio has been annualized for the six month period ended June 30, 2020.
2 Although the Fund is no-load, investment management fees and other expenses still apply.
3 All holdings in the portfolio are subject to change without notice and may or may not represent current or future portfolio composition. The mention of specific securities is not intended as a recommendation or offer for a particular security, nor is it intended to be a solicitation for the purchase or sale of any security.
4 Represents short-term investments and other assets and liabilities (net).
The Schedule of Investments and portfolio diversification utilize the Global Industry Classification Standard (GICS®) which was developed by and/or is the exclusive property of MSCI, Inc. and Standard & Poor's Financial Services LLC ("S&P"). GICS is a service mark of MSCI, Inc. and S&P and has been licensed for use by the Adviser.
28
Mairs & Power Small Cap Fund
SCHEDULE OF INVESTMENTS (unaudited) June 30, 2020
Shares | | Security Description | | Fair Value | |
| | | COMMON STOCKS 98.8% | |
| | | COMMUNICATION SERVICES 1.3% | |
| | 320,523 | | | Marcus Corp/The | | $ | 4,253,340 | | |
| | | CONSUMER DISCRETIONARY 3.3% | |
| | 192,480 | | | Gentherm Inc (a) | | | 7,487,472 | | |
| | 74,445 | | | Sleep Number Corp (a) | | | 3,099,890 | | |
| | | | 10,587,362 | | |
| | | CONSUMER STAPLES 4.1% | |
| | 57,400 | | | Casey's General Stores Inc | | | 8,582,448 | | |
| | 116,400 | | | MGP Ingredients Inc | | | 4,272,462 | | |
| | | | 12,854,910 | | |
| | | ENERGY 1.0% | |
| | 160,300 | | | Core Laboratories NV (b) | | | 3,257,296 | | |
| | | FINANCIALS 17.4% | |
| | 571,961 | | | Associated Banc-Corp | | | 7,824,426 | | |
| | 143,300 | | | Cullen/Frost Bankers Inc | | | 10,705,943 | | |
| | 274,400 | | | Glacier Bancorp Inc | | | 9,683,576 | | |
| | 329,800 | | | Great Western Bancorp Inc | | | 4,538,048 | | |
| | 145,778 | | | QCR Holdings Inc | | | 4,545,358 | | |
| | 187,387 | | | United Fire Group Inc | | | 5,192,494 | | |
| | 287,600 | | | Wintrust Financial Corp | | | 12,545,112 | | |
| | | | 55,034,957 | | |
| | | HEALTH CARE 15.8% | |
| | 38,000 | | | Bio-Techne Corp | | | 10,034,660 | | |
| | 218,240 | | | Calyxt Inc (a) | | | 1,075,923 | | |
| | 109,615 | | | Cardiovascular Systems Inc (a) | | | 3,458,353 | | |
| | 185,600 | | | Catalent Inc (a) | | | 13,604,480 | | |
| | 101,800 | | | Inspire Medical Systems Inc (a) | | | 8,858,636 | | |
| | 346,292 | | | IntriCon Corp (a) | | | 4,681,868 | | |
| | 164,400 | | | Patterson Cos Inc | | | 3,616,800 | | |
| | 75,049 | | | Premier Inc (a) | | | 2,572,680 | | |
| | 43,227 | | | SurModics Inc (a) | | | 1,869,135 | | |
| | | | 49,772,535 | | |
| | | INDUSTRIALS 24.6% | |
| | 268,778 | | | AAR Corp | | | 5,555,641 | | |
| | 392,700 | | | Apogee Enterprises Inc | | | 9,047,808 | | |
| | 141,504 | | | Donaldson Co Inc | | | 6,582,766 | | |
| | 391,510 | | | Enerpac Tool Group Corp | | | 6,890,576 | | |
29
Mairs & Power Small Cap Fund
SCHEDULE OF INVESTMENTS (unaudited) (continued) June 30, 2020
Shares | | Security Description | | Fair Value | |
| | | COMMON STOCKS (continued) | |
| | | INDUSTRIALS (continued) | |
| | 30,172 | | | Generac Holdings Inc (a) | | $ | 3,678,872 | | |
| | 96,700 | | | Graco Inc | | | 4,640,633 | | |
| | 132,500 | | | Hub Group Inc, Class A (a) | | | 6,341,450 | | |
| | 253,100 | | | nVent Electric PLC (d) | | | 4,740,563 | | |
| | 154,600 | | | Oshkosh Corp | | | 11,072,452 | | |
| | 33,300 | | | Proto Labs Inc (a) | | | 3,745,251 | | |
| | 137,586 | | | Raven Industries Inc | | | 2,959,475 | | |
| | 188,751 | | | Tennant Co | | | 12,270,703 | | |
| | | | 77,526,190 | | |
| | | INFORMATION TECHNOLOGY 16.8% | |
| | 51,865 | | | Badger Meter Inc | | | 3,263,346 | | |
| | 79,900 | | | Cabot Microelectronics Corp | | | 11,149,246 | | |
| | 68,578 | | | CyberOptics Corp (a) | | | 2,208,898 | | |
| | 575,829 | | | Digi International Inc (a) | | | 6,708,408 | | |
| | 16,600 | | | Envestnet Inc (a) | | | 1,220,764 | | |
| | 56,700 | | | Littelfuse Inc | | | 9,674,721 | | |
| | 131,698 | | | NVE Corp | | | 8,142,887 | | |
| | 30,400 | | | Plexus Corp (a) | | | 2,145,024 | | |
| | 156,680 | | | Workiva Inc (a) | | | 8,380,813 | | |
| | | | 52,894,107 | | |
| | | MATERIALS 3.3% | |
| | 34,863 | | | Hawkins Inc | | | 1,484,467 | | |
| | 199,300 | | | HB Fuller Co | | | 8,888,780 | | |
| | | | 10,373,247 | | |
| | | REAL ESTATE 6.0% | |
| | 81,828 | | | CoreSite Realty Corp | | | 9,906,098 | | |
| | 510,400 | | | Physicians Realty Trust | | | 8,942,208 | | |
| | | | 18,848,306 | | |
| | | UTILITIES 5.2% | |
| | 168,600 | | | Black Hills Corp | | | 9,552,876 | | |
| | 125,600 | | | NorthWestern Corp | | | 6,847,712 | | |
| | | | 16,400,588 | | |
| | | | TOTAL COMMON STOCKS
(cost $279,645,249) | | $ | 311,802,838 | | |
30
Mairs & Power Small Cap Fund
SCHEDULE OF INVESTMENTS (unaudited) (continued) June 30, 2020
Shares | | Security Description | | Fair Value | |
| | | SHORT-TERM INVESTMENTS 1.2% | |
| 3,861,681 | | | First American Government Obligations Fund, Class X, 0.091% (c)
(cost $3,861,681) | | $ | 3,861,681 | | |
| | TOTAL INVESTMENTS 100.0%
(cost $283,506,930) | | $ | 315,664,519 | | |
| | | OTHER ASSETS AND LIABILITIES (NET) 0.0% | | | (78,389 | ) | |
| | | TOTAL NET ASSETS 100.0% | | $ | 315,586,130 | | |
(a) Non-income producing.
(b) Foreign security denominated in U.S. dollars. As of June 30, 2020, these securities represented $3,257,296 or 1.0% of total net assets.
(c) The rate quoted is the annualized seven-day effective yield as of June 30, 2020.
(d) Issuer headquartered overseas but considered domestic. The Adviser defines foreign issuers as those whose operational leadership or headquarters is located in a foreign country; provided, however, if an issuer is believed by the Adviser to be headquartered in a jurisdiction primarily for tax purposes, the Adviser will consider the following additional factors: 1) the location of the primary exchange trading its securities; 2) where it derives the majority of its revenues, and/or 3) where it earns the majority of its profits.
The Global Industry Classification Standard (GICS®) was developed by and/or is the exclusive property of MSCI, Inc. and Standard & Poor's Financial Services LLC ("S&P"). GICS is a service mark of MSCI, Inc. and S&P and has been licensed for use by the Adviser.
See accompanying Notes to Financial Statements.
31
STATEMENTS OF ASSETS AND LIABILITIES (unaudited) June 30, 2020
| | | Mairs & Power
Growth Fund | | Mairs & Power
Balanced Fund | | Mairs & Power
Small Cap Fund | |
ASSETS | |
| Investments, at fair value (Note 1) *: | |
Unaffiliated securities * | | $ | 4,116,199,322 | | | $ | 810,565,539 | | | $ | 315,664,519 | | |
| Affiliated securities (Note 5) * | | | 61,107,190 | | | | - | | | | - | | |
| | | | 4,177,306,512 | | | | 810,565,539 | | | | 315,664,519 | | |
Receivable for Fund shares sold | | | 1,387,660 | | | | 88,286 | | | | 362,327 | | |
Receivable for securities sold | | | 6,321,694 | | | | 3,988,364 | | | | - | | |
Dividends and interest receivable | | | 5,425,863 | | | | 3,812,881 | | | | 143,990 | | |
Prepaid expenses and other assets | | | 108,603 | | | | 48,351 | | | | 40,821 | | |
| | | | 4,190,550,332 | | | | 818,503,421 | | | | 316,211,657 | | |
LIABILITIES | |
Payable for Fund shares redeemed | | | 1,656,519 | | | | 184,007 | | | | 261,171 | | |
Payable for securities purchased | | | 2,255,030 | | | | 650,000 | | | | - | | |
| Accrued investment management fees (Note 2) | | | 1,910,306 | | | | 392,215 | | | | 234,330 | | |
Accrued Fund administration fees | | | 250,651 | | | | 55,103 | | | | 26,571 | | |
Accrued audit and tax fees | | | 21,092 | | | | 25,729 | | | | 19,958 | | |
Accrued transfer agent fees | | | 337,407 | | | | 60,939 | | | | 43,149 | | |
Other accrued fees | | | 275,995 | | | | 81,944 | | | | 40,348 | | |
| | | | 6,707,000 | | | | 1,449,937 | | | | 625,527 | | |
NET ASSETS | | $ | 4,183,843,332 | | | $ | 817,053,484 | | | $ | 315,586,130 | | |
NET ASSETS CONSIST OF | |
Portfolio capital | | $ | 2,036,600,988 | | | $ | 598,589,421 | | | $ | 280,338,263 | | |
Total distributable earnings | | | 2,147,242,344 | | | | 218,464,063 | | | | 35,247,867 | | |
TOTAL NET ASSETS | | $ | 4,183,843,332 | | | $ | 817,053,484 | | | $ | 315,586,130 | | |
Fund shares, par value | | $ | 0.01 | | | $ | 0.01 | | | $ | 0.01 | | |
Authorized | | | unlimited | | | | unlimited | | | | unlimited | | |
Fund shares issued and outstanding | | | 34,743,542 | | | | 8,719,146 | | | | 14,172,660 | | |
Net asset value per share | | $ | 120.42 | | | $ | 93.71 | | | $ | 22.27 | | |
* Cost of investments | |
Cost of unaffiliated securities | | $ | 2,257,790,275 | | | $ | 609,291,564 | | | $ | 283,506,930 | | |
| Cost of affiliated securities (Note 5) | | | 63,772,486 | | | | - | | | | - | | |
| | | $ | 2,321,562,761 | | | $ | 609,291,564 | | | $ | 283,506,930 | | |
See accompanying Notes to Financial Statements.
32
STATEMENT OF OPERATIONS (unaudited) Six Months Ended June 30, 2020
| | | Mairs & Power
Growth Fund | | Mairs & Power
Balanced Fund | | Mairs & Power
Small Cap Fund | |
INVESTMENT INCOME | |
Income: | |
Dividends from unaffiliated securities * | | $ | 42,162,695 | | | $ | 6,489,981 | | | $ | 3,097,968 | | |
| Dividends from affiliated securities (Note 5) | | | 409,297 | | | | - | | | | - | | |
Interest income | | | - | | | | 5,931,749 | | | | - | | |
TOTAL INCOME | | | 42,571,992 | | | | 12,421,730 | | | | 3,097,968 | | |
Expenses: | |
| Investment management fees (Note 2) | | | 11,629,176 | | | | 2,511,239 | | | | 1,562,150 | | |
Fund administration fees | | | 370,865 | | | | 81,289 | | | | 39,101 | | |
Fund accounting fees | | | 227,547 | | | | 73,126 | | | | 33,739 | | |
| Trustees' fees (Note 2) | | | 142,121 | | | | 29,700 | | | | 12,604 | | |
Transfer agent fees | | | 753,063 | | | | 169,742 | | | | 115,743 | | |
Custodian fees | | | 108,086 | | | | 24,257 | | | | 11,032 | | |
Legal and audit fees | | | 68,211 | | | | 32,447 | | | | 21,019 | | |
Printing and mailing fees | | | 87,452 | | | | 22,692 | | | | 15,100 | | |
Other fees | | | 95,039 | | | | 38,836 | | | | 27,881 | | |
TOTAL EXPENSES | | | 13,481,560 | | | | 2,983,328 | | | | 1,838,369 | | |
NET INVESTMENT INCOME | | | 29,090,432 | | | | 9,438,402 | | | | 1,259,599 | | |
| REALIZED AND UNREALIZED GAIN (Note 4) | |
Net realized gain on investments | |
Unaffiliated issuers | | | 203,626,172 | | | | 12,600,175 | | | | 2,156,886 | | |
Change in net unrealized depreciation
on investments | |
Unaffiliated issuers | | | (454,620,020 | ) | | | (72,087,593 | ) | | | (75,066,838 | ) | |
| Affiliated issuers (Note 5) | | | (11,727,007 | ) | | | - | | | | - | | |
| | | | (466,347,027 | ) | | | (72,087,593 | ) | | | (75,066,838 | ) | |
NET LOSS ON INVESTMENTS | | | (262,720,855 | ) | | | (59,487,418 | ) | | | (72,909,952 | ) | |
NET DECREASE IN NET ASSETS FROM
OPERATIONS | | $ | (233,630,423 | ) | | $ | (50,049,016 | ) | | $ | (71,650,353 | ) | |
* Net of foreign taxes withheld of: | | $ | 611,044 | | | $ | 74,506 | | | $ | 2,524 | | |
See accompanying Notes to Financial Statements.
33
Mairs & Power Growth Fund
STATEMENTS OF CHANGES IN NET ASSETS
| | | Six Months Ended
June 30, 2020
(Unaudited) | | Year Ended
December 31,
2019 | |
OPERATIONS | |
Net investment income | | $ | 29,090,432 | | | $ | 55,764,139 | | |
Net realized gain on investments sold | | | 203,626,172 | | | | 345,728,849 | | |
Net change in unrealized appreciation (depreciation) of investments | | | (466,347,027 | ) | | | 678,657,381 | | |
NET INCREASE (DECREASE) IN NET ASSETS FROM OPERATIONS | | | (233,630,423 | ) | | | 1,080,150,369 | | |
DISTRIBUTIONS TO SHAREHOLDERS | | | (25,924,232 | ) | | | (325,706,532 | ) | |
CAPITAL TRANSACTIONS | |
Proceeds from shares sold | | | 95,357,033 | | | | 183,032,904 | | |
Reinvestment of distributions from net investment income and
net realized gains | | | 23,782,718 | | | | 303,147,958 | | |
Cost of shares redeemed | | | (309,678,364 | ) | | | (545,630,903 | ) | |
DECREASE IN NET ASSETS FROM CAPITAL TRANSACTIONS | | | (190,538,613 | ) | | | (59,450,041 | ) | |
TOTAL INCREASE (DECREASE) IN NET ASSETS | | | (450,093,268 | ) | | | 694,993,796 | | |
NET ASSETS | |
Beginning of period | | | 4,633,936,600 | | | | 3,938,942,804 | | |
End of period | | $ | 4,183,843,332 | | | $ | 4,633,936,600 | | |
FUND SHARE TRANSACTIONS | |
Shares sold | | | 824,190 | | | | 1,499,072 | | |
Shares issued for reinvested distributions | | | 200,208 | | | | 2,381,520 | | |
Shares redeemed | | | (2,706,074 | ) | | | (4,459,363 | ) | |
NET DECREASE IN FUND SHARES | | | (1,681,676 | ) | | | (578,771 | ) | |
See accompanying Notes to Financial Statements.
34
Mairs & Power Balanced Fund
STATEMENTS OF CHANGES IN NET ASSETS
| | | Six Months Ended
June 30, 2020
(Unaudited) | | Year Ended
December 31,
2019 | |
OPERATIONS | |
Net investment income | | $ | 9,438,402 | | | $ | 19,580,534 | | |
Net realized gain on investments sold | | | 12,600,175 | | | | 26,796,877 | | |
Net change in unrealized appreciation (depreciation) of investments | | | (72,087,593 | ) | | | 115,588,923 | | |
NET INCREASE (DECREASE) IN NET ASSETS FROM OPERATIONS | | | (50,049,016 | ) | | | 161,966,334 | | |
DISTRIBUTIONS TO SHAREHOLDERS | | | (9,026,229 | ) | | | (41,682,895 | ) | |
CAPITAL TRANSACTIONS | |
Proceeds from shares sold | | | 38,456,129 | | | | 101,678,402 | | |
Reinvestment of distributions from net investment income and
net realized gains | | | 8,755,252 | | | | 40,446,847 | | |
Cost of shares redeemed | | | (99,910,550 | ) | | | (141,035,720 | ) | |
INCREASE (DECREASE) IN NET ASSETS FROM CAPITAL
TRANSACTIONS | | | (52,699,169 | ) | | | 1,089,529 | | |
TOTAL INCREASE (DECREASE) IN NET ASSETS | | | (111,774,414 | ) | | | 121,372,968 | | |
NET ASSETS | |
Beginning of period | | | 928,827,898 | | | | 807,454,930 | | |
End of period | | $ | 817,053,484 | | | $ | 928,827,898 | | |
FUND SHARE TRANSACTIONS | |
Shares sold | | | 412,439 | | | | 1,074,318 | | |
Shares issued for reinvested distributions | | | 98,976 | | | | 411,102 | | |
Shares redeemed | | | (1,105,143 | ) | | | (1,476,161 | ) | |
NET INCREASE (DECREASE) IN FUND SHARES | | | (593,728 | ) | | | 9,259 | | |
See accompanying Notes to Financial Statements.
35
Mairs & Power Small Cap Fund
STATEMENTS OF CHANGES IN NET ASSETS
| | | Six Months Ended
June 30, 2020
(Unaudited) | | Year Ended
December 31,
2019 | |
OPERATIONS | |
Net investment income | | $ | 1,259,599 | | | $ | 2,029,476 | | |
Net realized gain on investments sold | | | 2,156,886 | | | | 9,301,124 | | |
Net change in unrealized appreciation (depreciation) of investments | | | (75,066,838 | ) | | | 66,187,132 | | |
NET INCREASE (DECREASE) IN NET ASSETS FROM OPERATIONS | | | (71,650,353 | ) | | | 77,517,732 | | |
DISTRIBUTIONS TO SHAREHOLDERS | | | - | | | | (13,263,989 | ) | |
CAPITAL TRANSACTIONS | |
Proceeds from shares sold | | | 28,647,270 | | | | 61,554,115 | | |
Reinvestment of distributions from net investment income and
net realized gains | | | - | | | | 12,982,051 | | |
Cost of shares redeemed* | | | (78,711,218 | ) | | | (68,966,536 | ) | |
INCREASE (DECREASE) IN NET ASSETS FROM CAPITAL
TRANSACTIONS | | | (50,063,948 | ) | | | 5,569,630 | | |
TOTAL INCREASE (DECREASE) IN NET ASSETS | | | (121,714,301 | ) | | | 69,823,373 | | |
NET ASSETS | |
Beginning of period | | | 437,300,431 | | | | 367,477,058 | | |
End of period | | $ | 315,586,130 | | | $ | 437,300,431 | | |
FUND SHARE TRANSACTIONS | |
Shares sold | | | 1,302,826 | | | | 2,447,445 | | |
Shares issued for reinvested distributions | | | - | | | | 491,744 | | |
Shares redeemed | | | (3,690,451 | ) | | | (2,727,309 | ) | |
NET INCREASE (DECREASE) IN FUND SHARES | | | (2,387,625 | ) | | | 211,880 | | |
| * Net of redemption fees of: | | $ | 8,206 | | | $ | 65,810 | | |
See accompanying Notes to Financial Statements.
36
NOTES TO FINANCIAL STATEMENTS (unaudited) June 30, 2020
Note 1 – Organization and Significant Accounting Policies
Mairs & Power Funds Trust (the Trust) is a no-load, diversified, open-end management investment company registered under the Investment Company Act of 1940, as amended (the 1940 Act). Mairs & Power Growth Fund (the Growth Fund), Mairs & Power Balanced Fund (the Balanced Fund) and Mairs & Power Small Cap Fund (the Small Cap Fund) (individually a Fund and collectively the Funds) are series within the Trust. Mairs & Power, Inc. (the Adviser) is the investment adviser of each Fund. The objective of the Growth Fund is to provide shareholders with a diversified portfolio of common stocks, which have the potential for above-average, long-term appreciation. The objective of the Balanced Fund is to provide capital growth, current income and preservation of capital. The objective of the Small Cap Fund is to seek above-average, long-term appreciation. Each Fund is an investment company and accordingly follows the investment company accounting and reporting guidance of the Financial Accounting Standards Board (FASB) Accounting Standard Codification Topic 946 "Financial Services – Investment Companies."
Significant accounting policies of the Funds are as follows:
Security Valuations
Security valuations for each Fund's investments are furnished by independent pricing services that have been approved by the Trust's Board of Trustees (the Board). Investments in listed equity securities are valued at the last quoted sale price on the securities exchange on which such securities are principally traded or at the NASDAQ Official Closing Price if readily available for such securities on each business day. Other equity securities traded in the over-the-counter market and listed equity securities for which no sale was reported on that date are valued at the last quoted bid price. Debt obligations exceeding 60 days to maturity are valued at the bid price furnished by an independent pricing service. Debt obligations with 60 days or less remaining until maturity may be valued at the bid price furnished by an independent pricing service and in certain circumstances may be valued at their amortized cost, which approximates fair value. Pricing service prices for debt obligations are based on various evaluative and matrix-based methodologies and models that use market inputs such as market transactions, dealer quotations, benchmark yields and issuer, industry and economic events. These techniques generally consider overall market conditions and such factors as yields or prices of bonds of comparable quality, type of issue, coupon, maturity and ratings.
Debt securities for which prices are not available from an independent pricing service, but where an active market exists, are valued using market quotations obtained from two or more dealers that make markets in the securities. When market quotations are not readily available, or when the last quoted sale price is not considered representative of the value of the security if it were to be sold on that day, the security will be valued at fair value as determined in good faith by the Fair Value Committee appointed by the Board, pursuant to procedures approved by the Board.
When determining the value of a security, the Fair Value Committee takes into consideration all indications of value that appear relevant under the particular circumstances, as well as fundamental analytical data relating to the security, the nature and duration of any restrictions on the disposition of the security, and the forces influencing the market in which the security is purchased or sold in addition to other more specific factors that may be applied on a case-by-case basis. Consequently, the value of the security used by a Fund may differ from a quoted or published price for the same security. Fair value pricing involves subjective judgments and it is possible that the fair value determined for the security is materially different than the value that could be realized upon the sale of that security. As of June 30, 2020, no securities were valued using this method.
37
NOTES TO FINANCIAL STATEMENTS (unaudited) (continued) June 30, 2020
Note 1 – Organization and Significant Accounting Policies (continued)
Fair Valuation Measurements
The Trust has adopted authoritative fair valuation accounting standards, which establish a definition of fair value and set out a hierarchy for measuring fair value. These standards require additional disclosures about the various inputs and valuation techniques used to develop the measurements of fair value and changes in valuation techniques and related inputs during the period. These inputs are summarized in the three broad levels listed below:
• Level 1 – Quoted prices in active markets for identical securities.
• Level 2 – Other significant observable inputs (including quoted prices for similar securities, interest rates, prepayment speeds, credit risk, etc.).
• Level 3 – Significant unobservable inputs (including the Funds' own assumptions in determining the fair value of investments).
The inputs or methodologies used for valuing securities are not necessarily an indication of the risk associated with investing in those securities. The following is a summary of the inputs used to value the securities held by each Fund as of June 30, 2020:
| | | Growth Fund | | Balanced Fund | | Small Cap Fund | |
Level 1* | | $ | 4,177,306,512 | | | $ | 524,220,075 | | | $ | 315,664,519 | | |
Level 2** | | | - | | | | 286,345,464 | | | | - | | |
Level 3 | | | - | | | | - | | | | - | | |
Total | | $ | 4,177,306,512 | | | $ | 810,565,539 | | | $ | 315,664,519 | | |
* All Level 1 investments are equity securities (common stocks) and short-term investments.
** All Level 2 investments are fixed income securities.
For detail of securities by major sector classification for the Funds, please refer to the Schedules of Investments.
The Funds did not hold any level 3 investments during the six months ended June 30, 2020.
Security Transactions and Investment Income
Security transactions are recorded on the date on which securities are purchased or sold. Dividend income and corporate action transactions are recorded on the ex-dividend date. Interest income, including the accretion of discounts and amortization of premiums, is recorded on an accrual basis. Premiums and discounts are amortized using the effective interest method. Realized gains and losses are reported on an identified cost basis.
Income Taxes
Each Fund is a "regulated investment company" as defined in Subtitle A, Chapter 1, Subchapter M of the Internal Revenue Code of 1986, as amended (the Code). No provisions have been made for federal income taxes as it is the intention of each Fund to comply with the provisions of the Code applicable to regulated investment companies and to make distributions of income and realized gains sufficient to relieve it from all or substantially all excise and income taxes.
As of June 30, 2020, the Trust did not have any tax positions that did not meet the "more-likely-than-not" threshold of being sustained by the applicable tax authority. Generally, tax authorities can examine all tax returns filed for the last three years.
As of December 31, 2019, none of the Funds had capital loss carryforwards nor did they have any qualified later year losses for federal tax purposes.
38
NOTES TO FINANCIAL STATEMENTS (unaudited) (continued) June 30, 2020
Note 1 – Organization and Significant Accounting Policies (continued)
The preparation of financial statements in conformity with U.S. generally accepted accounting principles (GAAP) requires management to make estimates and assumptions that affect the reported amount of net assets and liabilities and disclosure of contingent assets and liabilities at the date of the financial statements and the reported results of operations during the reporting period. Actual results could differ from those estimates.
In preparing these financial statements, the Funds have evaluated events and transactions for potential recognition or disclosure through the date the financial statements were available to be issued. This evaluation did not result in any subsequent events that necessitated recognition of disclosures.
Expense Allocation
Common expenses incurred by the Trust are allocated among the Funds based on their relative assets. Fund specific expenses are charged directly to the Fund that incurred the expense.
Note 2 – Related-Party Transactions
Investment Management Fees
The Adviser provides investment management services and various administrative services to the Funds under a written agreement for Investment Counsel Service (the Investment Advisory Agreement) approved by the Board. Pursuant to the Investment Advisory Agreement, the Adviser is paid a monthly fee on average daily net assets at the following annual rates:
| | | Growth Fund | | Balanced Fund | | Small Cap Fund | |
Up to $2.5 Billion | | | 0.60 | % | | | 0.60 | % | | | 0.90 | % | |
Over $2.5 Billion | | | 0.50 | % | | | 0.60 | % | | | 0.90 | % | |
Trustees' Fees
The Funds pay compensation to the disinterested Trustees of the Trust. The Funds do not pay remuneration to officers or to Trustees who are officers, directors or employees of the Adviser or Trustees who are otherwise "interested persons" of the Trust.
Note 3 – Indemnifications
In the normal course of business, the Trust enters into contracts that contain general indemnifications to other parties. The Trust's maximum exposure under these contracts is unknown as this would involve future claims that may be made against the Trust that have not yet occurred. The Trust expects the risk of loss to be remote.
Note 4 – Distributions Paid, Distributable Earnings and Investment Transactions
Net investment income and net realized capital gains (losses) may differ for financial reporting and tax purposes because of temporary or permanent book/tax differences.
Distributions to shareholders are determined in accordance with income tax regulations that may differ from GAAP, and due to the timing of the distributions, the fiscal year in which the amounts are distributed may differ from the year that the income or realized gains (losses) were recorded by each Fund.
39
NOTES TO FINANCIAL STATEMENTS (unaudited) (continued) June 30, 2020
Note 4 – Distributions Paid, Distributable Earnings and Investment Transactions (continued)
The tax character of distributions paid during the six months ended June 30, 2020 and year ended December 31, 2019, were as follows:
Six months ended June 30, 2020 | |
Distributions paid from: | | Growth Fund | | Balanced Fund | | Small Cap Fund | |
Ordinary income | | $ | 25,924,232 | | | $ | 9,026,229 | | | $ | - | | |
Long-term capital gains | | | - | | | | - | | | | - | | |
Total distributions paid | | $ | 25,924,232 | | | $ | 9,026,229 | | | $ | - | | |
Year ended December 31, 2019 | |
Distributions paid from: | | Growth Fund | | Balanced Fund | | Small Cap Fund | |
Ordinary income | | $ | 55,405,543 | | | $ | 19,590,959 | | | $ | 1,830,885 | | |
Long-term capital gains | | | 270,300,989 | | | | 22,091,936 | | | | 11,433,104 | | |
Total distributions paid | | $ | 325,706,532 | | | $ | 41,682,895 | | | $ | 13,263,989 | | |
Ordinary income distributions include net short-term capital gains. The Funds are designating as long-term capital gain dividends, pursuant to Section 852(b)(3) of the Code, the amount necessary to reduce the earnings and profits of the Funds related to net capital gain to zero. To the extent necessary to fully distribute such capital gain, the Funds also designate earnings and profits distributed to shareholders on the redemption of shares.
At December 31, 2019, the components of accumulated earnings (losses) on a tax basis were as follows:
| | | Growth Fund | | Balanced Fund | | Small Cap Fund | |
Cost of investments | | $ | 2,295,253,787 | | | $ | 651,015,496 | | | $ | 330,588,911 | | |
Gross unrealized appreciation | | $ | 2,352,857,589 | | | $ | 279,593,972 | | | $ | 127,515,959 | | |
Gross unrealized depreciation | | | (31,558,708 | ) | | | (6,235,880 | ) | | | (20,816,330 | ) | |
Net unrealized appreciation | | $ | 2,321,298,881 | | | $ | 273,358,092 | | | $ | 106,699,629 | | |
Undistributed ordinary income | | $ | 986,019 | | | $ | 121,273 | | | $ | 198,591 | | |
Undistributed long-term capital gains | | | 84,512,099 | | | | 4,059,943 | | | | - | | |
Total distributable earnings | | $ | 85,498,118 | | | $ | 4,181,216 | | | $ | 198,591 | | |
Other accumulated earnings | | | - | | | | - | | | | - | | |
Total accumulated earnings | | $ | 2,406,796,999 | | | $ | 277,539,308 | | | $ | 106,898,220 | | |
The difference between book basis and tax basis unrealized appreciation is attributable primarily to the tax deferral of losses on wash sales.
Purchases and sales of investment securities, excluding government securities, short-term securities and temporary cash investments, during the six months ended June 30, 2020 were as follows:
| | | Purchases | | Sales | |
Growth Fund | | $ | 366,516,688 | | | $ | 557,265,995 | | |
Balanced Fund | | | 81,427,654 | | | | 129,608,230 | | |
Small Cap Fund | | | 33,130,551 | | | | 80,494,214 | | |
Purchases and sales of government securities during the six months ended June 30, 2020 were as follows:
| | | Purchases | | Sales | |
Growth Fund | | $ | - | | | $ | - | | |
Balanced Fund | | | - | | | | 1,143,125 | | |
Small Cap Fund | | | - | | | | - | | |
40
NOTES TO FINANCIAL STATEMENTS (unaudited) (continued) June 30, 2020
Note 5 – Transactions With Affiliated Companies
The Growth Fund owned 5% or more of the voting securities of the following company during the six months ended June 30, 2020. As a result, this company is deemed an affiliate of the Growth Fund as defined by the 1940 Act. Transactions during the period in this security were as follows:
Growth Fund
Security
Name | | Share
Balance
06/30/20 | | Fair
Value at
12/31/19 | | Purchases | | Sales | | Realized
Gain
(Loss)(1) | | Change in
Unrealized
Appreciation | | Fair
Value at
06/30/20 | | Dividend
Income(1) | |
Tennant Co | | | 939,966 | | | $ | 69,315,684 | | | $ | 3,518,513 | | | $ | - | | | $ | - | | | $ | (11,727,007 | ) | | $ | 61,107,190 | | | $ | 409,297 | | |
(1) Dividend income and realized gain amounts are reported for the period in which the security was deemed an affiliate.
Note 6 – Impacts of COVID-19
The recent global outbreak of COVID-19 has disrupted financial markets and the prolonged economic impact is uncertain. The performance of the Funds' investments depends on future developments, including the duration and spread of the outbreak. Events related to COVID-19 may result in further global economic disruption and market volatility which in turn may impact the value of each of the Fund's investments.
41
Mairs & Power Growth Fund
FINANCIAL HIGHLIGHTS
SELECTED DATA AND RATIOS
(for a share outstanding throughout each period)
| | | Six Months
Ended | | Year Ended December 31, | |
| | | June 30, 2020 (1) | | 2019 | | 2018 | | 2017 | | 2016 | | 2015 | |
| | | (unaudited) | | | | | | | | | | | |
Per Share | |
Net asset value, beginning of period | | $ | 127.22 | | | $ | 106.45 | | | $ | 121.12 | | | $ | 113.83 | | | $ | 104.44 | | | $ | 116.20 | | |
Income from investment operations: | |
Net investment income | | | 0.84 | | | | 1.59 | | | | 1.61 | | | | 1.60 | | | | 1.61 | | | | 1.68 | | |
Net realized and unrealized
gain (loss) | | | (6.89 | ) | | | 28.59 | | | | (6.96 | ) | | | 17.16 | | | | 14.43 | | | | (5.17 | ) | |
Total from investment operations | | | (6.05 | ) | | | 30.18 | | | | (5.35 | ) | | | 18.76 | | | | 16.04 | | | | (3.49 | ) | |
Distributions to shareholders from: | |
Net investment income | | | (0.75 | ) | | | (1.58 | ) | | | (1.59 | ) | | | (1.66 | ) | | | (1.61 | ) | | | (1.67 | ) | |
Net realized gains on
investments sold | | | - | | | | (7.83 | ) | | | (7.73 | ) | | | (9.81 | ) | | | (5.04 | ) | | | (6.60 | ) | |
Total distributions | | | (0.75 | ) | | | (9.41 | ) | | | (9.32 | ) | | | (11.47 | ) | | | (6.65 | ) | | | (8.27 | ) | |
Net asset value, end of period | | $ | 120.42 | | | $ | 127.22 | | | $ | 106.45 | | | $ | 121.12 | | | $ | 113.83 | | | $ | 104.44 | | |
Total investment return | | | (4.75 | )% | | | 28.39 | % | | | (4.34 | )% | | | 16.52 | % | | | 15.38 | % | | | (3.07 | )% | |
Net assets, end of period,
in thousands | | $ | 4,183,843 | | | $ | 4,633,937 | | | $ | 3,938,943 | | | $ | 4,731,156 | | | $ | 4,392,473 | | | $ | 3,837,264 | | |
Ratios/supplemental data: | |
Ratio of expenses to average
net assets | | | 0.65 | % | | | 0.65 | % | | | 0.64 | % | | | 0.64 | % | | | 0.66 | % | | | 0.65 | % | |
Ratio of net investment income
to average net assets | | | 1.40 | | | | 1.28 | | | | 1.27 | | | | 1.30 | | | | 1.42 | | | | 1.43 | | |
Portfolio turnover rate | | | 8.84 | | | | 10.77 | | | | 9.25 | | | | 8.84 | | | | 10.99 | | | | 9.64 | | |
(1) For the six months ended June 30, 2020, all ratios have been annualized except total investment return and portfolio turnover.
See accompanying Notes to Financial Statements.
42
Mairs & Power Balanced Fund
FINANCIAL HIGHLIGHTS
SELECTED DATA AND RATIOS
(for a share outstanding throughout each period)
| | | Six Months
Ended | | Year Ended December 31, | |
| | | June 30, 2020 (1) | | 2019 | | 2018 | | 2017 | | 2016 | | 2015 | |
| | | (unaudited) | | | | | | | | | | | |
Per Share | |
Net asset value, beginning of period | | $ | 99.74 | | | $ | 86.79 | | | $ | 94.01 | | | $ | 87.29 | | | $ | 81.16 | | | $ | 86.79 | | |
Income from investment operations: | |
Net investment income | | | 1.07 | | | | 2.13 | | | | 2.09 | | | | 2.04 | | | | 1.99 | | | | 2.14 | | |
Net realized and unrealized
gain (loss) | | | (6.08 | ) | | | 15.39 | | | | (4.71 | ) | | | 8.26 | | | | 7.21 | | | | (4.34 | ) | |
Total from investment operations | | | (5.01 | ) | | | 17.52 | | | | (2.62 | ) | | | 10.30 | | | | 9.20 | | | | (2.20 | ) | |
Distributions to shareholders from: | |
Net investment income | | | (1.02 | ) | | | (2.12 | ) | | | (2.09 | ) | | | (2.07 | ) | | | (1.99 | ) | | | (2.13 | ) | |
Net realized gains on
investments sold | | | - | | | | (2.45 | ) | | | (2.51 | ) | | | (1.51 | ) | | | (1.08 | ) | | | (1.30 | ) | |
Total distributions | | | (1.02 | ) | | | (4.57 | ) | | | (4.60 | ) | | | (3.58 | ) | | | (3.07 | ) | | | (3.43 | ) | |
Net asset value, end of period | | $ | 93.71 | | | $ | 99.74 | | | $ | 86.79 | | | $ | 94.01 | | | $ | 87.29 | | | $ | 81.16 | | |
Total investment return | | | (4.96 | )% | | | 20.32 | % | | | (2.80 | )% | | | 11.90 | % | | | 11.42 | % | | | (2.54 | )% | |
Net assets, end of period,
in thousands | | $ | 817,053 | | | $ | 928,828 | | | $ | 807,455 | | | $ | 984,788 | | | $ | 861,426 | | | $ | 667,680 | | |
Ratios/supplemental data: | |
Ratio of expenses to average
net assets | | | 0.71 | % | | | 0.71 | % | | | 0.72 | % | | | 0.71 | % | | | 0.72 | % | | | 0.73 | % | |
Ratio of net investment income
to average net assets | | | 2.26 | | | | 2.22 | | | | 2.20 | | | | 2.24 | | | | 2.37 | | | | 2.49 | | |
Portfolio turnover rate | | | 9.89 | | | | 13.60 | | | | 9.01 | | | | 13.13 | | | | 14.10 | | | | 14.05 | | |
(1) For the six months ended June 30, 2020, all ratios have been annualized except total investment return and portfolio turnover.
See accompanying Notes to Financial Statements.
43
Mairs & Power Small Cap Fund
FINANCIAL HIGHLIGHTS
SELECTED DATA AND RATIOS
(for a share outstanding throughout each period)
| | | Six Months
Ended | | Year Ended December 31, | |
| | | June 30, 2020 (1) | | 2019 | | 2018 | | 2017 | | 2016 | | 2015 | |
| | | (unaudited) | | | | | | | | | | | |
Per Share | |
Net asset value, beginning of period | | $ | 26.41 | | | $ | 22.48 | | | $ | 25.32 | | | $ | 24.33 | | | $ | 19.48 | | | $ | 20.67 | | |
Income from investment operations: | |
Net investment income | | | 0.09 | | | | 0.13 | | | | 0.15 | | | | 0.13 | | | | 0.08 | | | | 0.08 | | |
Net realized and unrealized
gain (loss) | | | (4.23 | ) | | | 4.62 | | | | (1.92 | ) | | | 1.73 | | | | 5.24 | | | | (1.04 | ) | |
Total from investment operations | | | (4.14 | ) | | | 4.75 | | | | (1.77 | ) | | | 1.86 | | | | 5.32 | | | | (0.96 | ) | |
Distributions to shareholders from: | |
Net investment income | | | - | | | | (0.11 | ) | | | (0.15 | ) | | | (0.13 | ) | | | (0.08 | ) | | | (0.08 | ) | |
Net realized gains on
investments sold | | | - | | | | (0.71 | ) | | | (0.92 | ) | | | (0.74 | ) | | | (0.39 | ) | | | (0.15 | ) | |
Redemption fees (2)(3) | | | 0.00 | | | | 0.00 | | | | 0.00 | | | | 0.00 | | | | 0.00 | | | | 0.00 | | |
Total distributions | | | - | | | | (0.82 | ) | | | (1.07 | ) | | | (0.87 | ) | | | (0.47 | ) | | | (0.23 | ) | |
Net asset value, end of period | | $ | 22.27 | | | $ | 26.41 | | | $ | 22.48 | | | $ | 25.32 | | | $ | 24.33 | | | $ | 19.48 | | |
Total investment return | | | (15.68 | )% | | | 21.13 | % | | | (6.91 | )% | | | 7.64 | % | | | 27.27 | % | | | (4.68 | )% | |
Net assets, end of period,
in thousands | | $ | 315,586 | | | $ | 437,300 | | | $ | 367,477 | | | $ | 435,507 | | | $ | 382,443 | | | $ | 193,837 | | |
Ratios/supplemental data: | |
Ratio of expenses to average
net assets | | | 1.06 | % | | | 1.05 | % | | | 1.04 | % | | | 1.04 | % | | | 1.05 | % | | | 1.06 | % | |
Ratio of net investment income
to average net assets | | | 0.73 | | | | 0.48 | | | | 0.54 | | | | 0.48 | | | | 0.48 | | | | 0.43 | | |
Portfolio turnover rate | | | 9.49 | | | | 15.07 | | | | 20.40 | | | | 19.27 | | | | 21.26 | | | | 23.27 | | |
(1) For the six months ended June 30, 2020, all ratios have been annualized except total investment return and portfolio turnover.
(2) The Fund charges a 1.00% redemption fee on shares held 180 days or less.
(3) Amount per share is less than $0.005.
See accompanying Notes to Financial Statements.
44
FUND EXPENSES (unaudited)
As a shareholder of the Funds, you incur two types of costs: (1) transaction costs including redemption fees and (2) ongoing expenses for the operation of the Funds (e.g., asset-based charges, such as investment management fees). The Funds are "no-load" mutual funds. As a result, shareholders pay no commissions, fees, or expenses associated with sales representatives or sales charges.
This example is intended to help you understand your ongoing costs (in dollars) of investing in the Funds and to compare these costs with the ongoing costs of investing in other mutual funds. The table below reports the Funds' expenses during the period January 1, 2020 through June 30, 2020 and includes the costs associated with a $1,000 investment.
Actual Expenses
The first line in the tables below may be used to estimate the actual expenses you paid over the reporting period. You can do this by dividing your account value by $1,000 and multiplying the result by the expense shown in the table below. For example, if your account value is $8,600, divided by $1,000 = $8.60. Multiply the result by the number in the first line under the heading entitled "Expenses Paid During Period." By doing this you can estimate the expenses you paid on your account during this period.
Hypothetical Example
The second line of the tables below provides information about hypothetical account values and hypothetical expenses based on the Funds' actual expenses and assumed returns of 5% per year before expenses, which are not the Funds' actual returns. The results may be used to provide you with a basis for comparing the ongoing costs of investing in the Funds with the ongoing costs of investing in other funds. To do so, compare these 5% hypothetical examples with the 5% hypothetical examples that appear in the shareholder reports of other funds. Please note that these hypothetical examples highlight ongoing costs only and do not reflect any transactional fees, such as redemption fees. In addition, if these transactional fees were included, your costs would have been higher. These hypothetical expense examples may not be used to estimate the actual ending account balances or expenses you paid during the period and will not help you determine the relative total costs of owning different funds.
Mairs & Power Growth Fund
| | | Beginning Account
Value 01/01/2020 | | Ending Account
Value 06/30/2020 | | Expenses Paid
During Period * | |
Actual return | | $ | 1,000.00 | | | $ | 952.50 | | | $ | 3.16 | | |
Hypothetical assumed 5% return | | $ | 1,000.00 | | | $ | 1,021.63 | | | $ | 3.27 | | |
* The Fund's expenses are equal to the Fund's annualized expense ratio for the most recent six-month period of 0.65%, multiplied by the average account value over the Fund's first fiscal half-year, multiplied by the number of days in the Fund's first fiscal half-year (182 days), divided by 366 days.
Mairs & Power Balanced Fund
| | | Beginning Account
Value 01/01/2020 | | Ending Account
Value 06/30/2020 | | Expenses Paid
During Period * | |
Actual return | | $ | 1,000.00 | | | $ | 950.40 | | | $ | 3.44 | | |
Hypothetical assumed 5% return | | $ | 1,000.00 | | | $ | 1,021.33 | | | $ | 3.57 | | |
* The Fund's expenses are equal to the Fund's annualized expense ratio for the most recent six-month period of 0.71%, multiplied by the average account value over the Fund's first fiscal half-year, multiplied by the number of days in the Fund's first fiscal half-year (182 days), divided by 366 days.
45
FUND EXPENSES (unaudited) (continued)
Mairs & Power Small Cap Fund
| | | Beginning Account
Value 01/01/2020 | | Ending Account
Value 06/30/2020 | | Expenses Paid
During Period * | |
Actual return | | $ | 1,000.00 | | | $ | 843.20 | | | $ | 4.86 | | |
Hypothetical assumed 5% return | | $ | 1,000.00 | | | $ | 1,019.59 | | | $ | 5.32 | | |
* The Fund's expenses are equal to the Fund's annualized expense ratio for the most recent six-month period of 1.06%, multiplied by the average account value over the Fund's first fiscal half-year, multiplied by the number of days in the Fund's first fiscal half-year (182 days), divided by 366 days.
46
Proxy Voting Policies and Procedures that the Trust uses to determine how to vote proxies relating to portfolio securities are available (i) without charge, upon request, by calling Shareholder Services at (800) 304-7404 and requesting a copy of the Statement of Additional Information (SAI) and (ii) on the Securities and Exchange Commission's (SEC's) website at www.sec.gov (access Form N-1A).
Information on how the Trust voted proxies relating to portfolio securities during the most recent 12-month period ended June 30 is available at www.mairsandpower.com and on the SEC's website at www.sec.gov on Form N-PX.
DISCLOSURE OF PORTFOLIO HOLDINGS (unaudited)
A description of the Funds' policies and procedures with respect to the disclosure of portfolio holdings is available in the SAI and on the Funds' website. A complete list of each Fund's holdings is available on or about 15 days after each quarter-end at www.mairsandpower.com. This list remains available on the website until it is replaced with the following quarter-end list. The portfolio holdings list is also filed in the Funds' annual and semi-annual reports to shareholders filed with the SEC on Form N-CSR and as an exhibit to Form N-PORT following the end of each quarter. Form N-CSR and the public portion of Form N-PORT, when available, may be viewed on the SEC's website at www.sec.gov.
2020 BOARD APPROVAL OF INVESTMENT ADVISORY AGREEMENT (unaudited)
The Board of Trustees (the Board) of Mairs & Power Funds Trust (the Trust), including the Trustees who are not "interested persons" of the Trust for purposes of the Investment Company Act of 1940, as amended (the Independent Trustees), unanimously approved the renewal of the Amended and Restated Agreement for Investment Counsel Service (the Investment Advisory Agreement) between the Trust on behalf of the Mairs & Power Growth Fund (the Growth Fund), the Mairs & Power Balanced Fund (the Balanced Fund) and the Mairs & Power Small Cap Fund (the Small Cap Fund) (each, a Fund and together, the Funds) and Mairs & Power, Inc. (the Adviser) at a meeting of the Board held on May 21, 2020.
In evaluating the Investment Advisory Agreement, the Trustees took into account their cumulative experience with the Adviser and their ongoing review of the Funds and discussions with the Funds' portfolio managers and management of the Trust at meetings throughout the year. The Trustees also considered information provided to the Board throughout the year regarding the Adviser's investment process, personnel, performance, Fund expenses, brokerage and trading, compliance issues and operational initiatives. The Trustees' approval was based on their consideration and evaluation of a variety of factors, which included, among other things: (1) the nature, extent, and quality of the services provided by the Adviser, including the investment process used by the Adviser; (2) the performance of each Fund in comparison to its benchmark index, a peer group and a comparison universe of similar mutual funds; (3) the management fees and total net expenses of the Funds, including comparative information with respect to a peer group and a comparison universe of similar mutual funds; (4) a comparison of the Adviser's services and the amounts paid by the Funds with those under the Adviser's agreements with other clients; (5) the profitability of the Adviser with respect to the Funds; (6) the extent to which economies of scale may be realized as the Funds grow and whether fee levels reflect these economies of scale for the benefit of Fund investors; and (7) any benefits accruing to the Adviser from its relationship with the Funds.
In preparation for the meeting, the Adviser provided the Trustees with extensive materials that were relevant to the Trustees' consideration of the Investment Advisory Agreement, including the Adviser's narrative responses to the Section 15(c) request submitted on behalf of the Trustees providing information about the factors set forth above. The Board was also provided with a report prepared by Broadridge Financial Solutions (Broadridge), an independent third party data provider, providing various data, including the Funds' investment performance over different time periods compared to each Fund's benchmark index, peer group and a comparison universe of similar mutual funds as well as the contractual and net management fees and
47
2020 BOARD APPROVAL OF INVESTMENT ADVISORY AGREEMENT (unaudited) (continued)
total net expenses of the Funds in comparison to their Morningstar category and comparative groups selected by Broadridge. The Board also considered information provided by the Adviser regarding the implementation of the Adviser's business continuity plan and the performance and operations of the Funds during the COVID-19 pandemic.
At the May 21, 2020 meeting, the Board discussed the Adviser's 15(c) response and related matters with management. The Trustees also considered their responsibilities and duties in considering the renewal of the Investment Advisory Agreement. The Independent Trustees met separately to discuss the proposed renewal of the Investment Advisory Agreement in executive session with legal counsel present, but with no representatives of the Adviser present. In reaching their decision to renew the Investment Advisory Agreement with the Adviser, the Trustees considered all factors they believed to be relevant, including the factors below, and made the following conclusions. In their deliberations, the Trustees did not identify any single factor as determinative.
Nature, Extent and Quality of Services
With respect to the nature, extent and quality of the Adviser's services provided to the Funds, the Trustees noted each Fund's performance record, as discussed in more detail below under "Investment Performance." The Trustees considered the Adviser's experience as an investment adviser since 1931 and its consistent investment process, including its emphasis on companies located in the Upper Midwest and the analysis performed to identify companies with sustainable long-term growth. The Trustees also considered the resources of the Adviser that benefit the Funds, including the depth and expertise of the Adviser's investment management, operations and compliance personnel and investments in compliance and technology support. The Trustees also took into account the Adviser's role in the Funds' distribution strategy, risk management system, liquidity risk management program, business continuity plan and compliance program. The Trustees considered administrative services provided by the Adviser under the Investment Advisory Agreement, such as the provision of office space and Fund officers, information technology, recordkeeping, operational support, compliance services, financial reporting services, service provider oversight and general fund management. The Trustees considered information regarding purchases and redemptions of the Funds' shares as well as the Adviser's brokerage and soft dollars policies. The Trustees concluded that they were satisfied with the nature, extent and quality of services provided by the Adviser under the Investment Advisory Agreement.
Investment Performance
In reviewing each Fund's performance, the Trustees considered the information provided in connection with the May 21, 2020 Board meeting, noting that they also receive detailed performance information at each regular Board meeting during the year as well as an in-depth review of prior year performance and risk metrics for the Funds at the first quarter meeting. In addition, the Board noted it has been receiving regular reports from the Adviser regarding the Funds' performance following the market downturn in March 2020. At the May 21, 2020 meeting, the Trustees considered the investment results for each Fund compared to 1) a peer group of similar funds selected by Broadridge (the Performance Group); 2) a performance universe of similar funds selected by Broadridge (the Performance Universe); and 3) each Fund's respective benchmark index for the applicable periods ended December 31, 2019. The Board considered management's discussion of the factors contributing to differences in performance as compared to each Fund's benchmark index, including differences in investment strategies and risks, as well as management's view that performance must be considered over complete market cycles.
The Trustees noted that while the Growth Fund had underperformed the Fund's benchmark (the S&P 500 Total Return Index) over most periods and had underperformed the Performance Group average for the one-year period, its performance was generally in line with or outperformed the Performance Group and the Performance Universe averages for longer time periods. In addition, the Growth Fund had outperformed the S&P 500 Total Return Index for the since-inception (1958) period. The Trustees noted that the performance of the Growth Fund was in the third or fourth quintile of the Performance Group and Performance Universe for the one-, three- and five-year periods ended December 31, 2019 and in the second quintile for the ten-year period ended December 31, 2019, with the first quintile representing the highest performance and the fifth quintile
48
2020 BOARD APPROVAL OF INVESTMENT ADVISORY AGREEMENT (unaudited) (continued)
representing the lowest performance. The Board considered the Fund's strong absolute performance for the one-year period, its good annualized performance for the 10-year and since-inception periods and its good relative performance for the since-inception period. The Board noted that the Adviser's investment strategy and portfolio risk management techniques can cause the Fund's performance to vary from the S&P 500 Total Return Index, particularly over the short to intermediate term.
The Trustees noted that the Balanced Fund's performance ranged from the second to fourth quintile for the one-year and three-year periods, was in the third quintile of the Performance Group and the first quintile of the Performance Universe for the five-year period and was in the first quintile of the Performance Group and the Performance Universe for the 10-year period. The Balanced Fund's performance trailed its benchmark composite index (60% S&P 500 Total Return Index and 40% Bloomberg Barclays U.S. Government/Credit Bond Index) for more recent periods but was in line with the composite index for the 10-year period and outperformed the index for the since-inception (1961) period. The Trustees considered the Fund's strong absolute performance for the one-year period ended December 31, 2019 and noted the Fund's good annualized performance for the 10-year and since-inception periods.
The Trustees noted that the Small Cap Fund's performance was in the third and fourth quintiles of the Performance Group and the Performance Universe for the three-year and one-year periods ended December 31, 2019, respectively, in the second quintile for the five-year period and was in the first quintile for the since-inception (2011) period. The Trustees noted that the Fund has underperformed its benchmark index over the one-, three- and five-year periods and has outperformed the index for the since-inception period. The Board considered the Adviser's commentary regarding stock selection being the primary driver of relative performance and management's view that the Fund's underperformance will be short-term in nature. The Trustees considered the Fund's strong absolute performance for the one-year period ended December 31, 2019 as well as the Fund's good relative and annualized performance for the since-inception period.
The Trustees observed that while the Funds have had periods of underperformance, the Funds have had good absolute performance over longer time periods. The Trustees believe that the Adviser's philosophy of investing in quality, predominantly Upper Midwest, companies with favorable long-term growth potential should produce positive results for shareholders in the long-term. The Trustees concluded, in the context of their full deliberations, that the Funds' performance results were sufficient to support the renewal of the Investment Advisory Agreement.
Management Fees and Expenses
In evaluating the level of the management fees paid to the Adviser, the Trustees considered both the amount of the fees and the overall expenses of each Fund compared to (1) the Morningstar category and (2) the smaller peer group of similar funds selected by Broadridge (the Expense Group). The Trustees noted that the net management fee paid to the Adviser by the Growth Fund was above Morningstar's Large Blend category median but below the Expense Group median. The Trustees noted that the management fee for the Balanced Fund was above the median fee for its Morningstar category (50% to 70% Equity) and above the Expense Group median. However, the Trustees noted that the Growth Fund's and Balanced Fund's total net expense ratios were below the median total net expense ratios of funds in their respective Morningstar category and Expense Group. With respect to the Small Cap Fund, the Trustees noted that the net management fee was above Morningstar's Small Blend category median and the Expense Group median but the Fund's total net expense ratio was below the Expense Group median and the Morningstar category median.
The Trustees then reviewed the fees the Adviser charges its non-mutual fund advisory clients (Advisory Clients) and the reasons noted by the Adviser for the differences in fees charged to Advisory Clients. In addition, the Trustees reviewed the investment advisory fee charged to an institutional client of the Adviser for sub-advisory services in the small-cap mandate. The Trustees noted that the Adviser provides certain resources and services to the Small Cap Fund that are not provided to the sub-advised account, and the level of risk assumed by the Adviser for the Small Cap Fund is greater than for the sub-advised account. In addition, the level of investment decision-making is generally higher with respect to the Funds because cash flows result in purchase and sale decisions made by the Adviser almost every trading day. Having considered all of these factors, the Trustees concluded that each Fund's management fee is fair and reasonable for the services provided.
49
2020 BOARD APPROVAL OF INVESTMENT ADVISORY AGREEMENT (unaudited) (continued)
Costs of Services Provided and Profitability to the Adviser
The Trustees reviewed information regarding the Adviser's profitability from its relationship with each Fund over the past two calendar years. The Trustees reaffirmed their belief that the Adviser should be entitled to earn a reasonable level of profit for the services it provides to the Funds. Based on their review, the Trustees concluded that the Adviser's level of profitability from its relationship with each Fund is reasonable. The Trustees also reviewed the Adviser's financial condition and determined it to be sound.
Other Benefits
The Trustees considered the benefits to the Adviser from soft dollar arrangements whereby the Adviser receives proprietary and third-party investment research services from an executing broker-dealer and through commission sharing arrangements with agency broker-dealers that execute the Funds' purchases and sales of securities. The Trustees considered that the research services received from broker-dealers are used to service all accounts that invest in equity securities and that the Adviser's Advisory Clients benefit from the research obtained from research broker-dealers. While difficult to measure, the Trustees concluded that the benefits the Adviser receives are fairly modest, given the Funds' relatively low portfolio turnover rates and the Adviser's out of pocket payments for other research services. The Trustees noted that the Adviser derives reputational benefits from its association with the Funds as well. The Trustees concluded that the other benefits realized by the Adviser from its relationship with the Funds were reasonable.
Economies of Scale
The Trustees reviewed the extent to which economies of scale may be realized as the Funds increase in size. In order to provide an "economies of scale" benefit to shareholders of the Growth Fund, the Adviser previously had established a breakpoint at the $2.5 billion asset level under the Investment Advisory Agreement for the Growth Fund. The breakpoint reduces the management fee applicable to assets managed in excess of $2.5 billion from 0.60% to 0.50%. The Trustees reaffirmed their conclusion that establishing this breakpoint at $2.5 billion forms a reasonable basis for having management fee levels reflect economies of scale for the benefit of Growth Fund shareholders at the Fund's current asset levels. Considering the current level of assets in each of the Balanced Fund and the Small Cap Fund, the Trustees concurred with management's view that the absence of breakpoints in the management fee for the Balanced Fund and Small Cap Fund is reasonable at this time. The Trustees also noted that the Adviser has shared economies of scale with shareholders through its investments in resources and services that benefit the Funds.
On the basis of its review of the foregoing information, the Board found that the terms of the Investment Advisory Agreement were fair and reasonable and in the best interests of each Fund's shareholders.
HOUSEHOLDING (unaudited)
In an effort to decrease costs, the Trust intends to reduce the number of duplicate Summary Prospectuses and Annual and Semi-Annual Reports you receive by sending only one copy of each to those addresses shared by two or more accounts and to shareholders reasonably believed to be from the same family or household. Once implemented, if you would like to discontinue householding for your accounts, please call Shareholder Services at (800) 304-7404 to request individual copies of these documents. Once notification to stop householding is received, the Trust will begin sending individual copies thirty days after receiving your request. This policy does not apply to account statements.
eDelivery is available to all direct shareholders. eDelivery provides your tax statements, account statements, trade confirmation statements and shareholder reports online rather than by regular mail. In addition to reducing paper waste, eDelivery may reduce your Fund fees by lowering printing and mailing costs over time. To receive materials electronically, please contact Shareholder Services at (800) 304-7404 or visit www.mairsandpower.com to sign up for eDelivery. If you hold your Fund shares through a Financial Intermediary, please contact your Financial Intermediary regarding electronic delivery options.
50
LIQUIDITY RISK MANAGEMENT (unaudited)
The Funds have adopted and implemented a written Liquidity Risk Management Program ("Trust LRM Program") as required by Rule 22e-4 under the Investment Company Act of 1940. The Trust LRM Program is overseen by the Program Administrator, comprised of qualified individuals of the Funds' Adviser. The Funds' Board has approved the designation of the Program Administrator to oversee the Trust LRM Program. The Trust LRM Program's principal objectives include assessing, managing and periodically reviewing each Fund's liquidity risk and providing an annual report to the Board on the operating effectiveness of the Trust LRM Program to mitigate the risk that a Fund will be unable to meet its redemption obligations on a timely basis without significant dilution of the remaining Fund investors' interests in such Fund.
The Trust LRM Program takes into consideration the Fund's investment strategy, liquidity classifications of portfolio investments, short-term and long-term cash flow projections, and holdings of cash and cash equivalents during both normal and reasonably foreseeable stressed conditions as part of the management and assessment of liquidity risk.
On February 27, 2020, the Board reviewed the Program Adminstrator's annual report. During the period covered by the report, there were no liquidity events that impacted the Funds or their respective ability to timely meet redemptions without dilution to existing shareholders. The Program Administrator has determined, and reported to the Board, that the Trust LRM Program has operated adequately and effectively to manage the Funds' liquidity risk since implementation. There can be no assurance that the Trust LRM Program will achieve its objectives in the future. Please refer to your Fund's prospectus for more information regarding the Fund's exposure to liquidity risk and other principal risks to which an investment in the Fund may be subject.
51
PRIVACY POLICY NOTICE (unaudited)
Our Promise to You
As a shareholder of the Mairs & Power Mutual Funds (Funds), you share both personal and financial information with us. Your privacy is important to us, and we are dedicated to safeguarding your personal and financial information.
Information Provided by Shareholders
In the normal course of doing business, we typically obtain the following non-public personal information about our shareholders:
• Personal information regarding our shareholders' identity such as name, address and social security number;
• Information regarding fund transactions effected by us; and
• Shareholder financial information such as net-worth, assets, income, bank account information and account balances.
How We Manage and Protect Your Personal Information
We do not sell information about current or former shareholders to third parties, nor is it our practice to disclose such information to third parties unless requested or permitted to do so by a shareholder or shareholder representative or, if necessary, in order to process a transaction, service an account or as permitted by law. Additionally, we may share information with outside companies that perform administrative services for us. However, our arrangements with these service providers require them to treat your information as confidential.
In order to protect your personal information, we maintain physical, electronic and procedural safeguards to protect your personal information. Our Privacy Policy restricts the use of shareholder information and requires that it be held in strict confidence.
Shareholder Notifications
We provide a notice annually describing our privacy policy. In addition, we will inform you promptly if there are changes to our policy. Please contact us at (800) 304-7404 with questions about this notice.
OTHER INFORMATION (unaudited)
This report is submitted for the general information of the shareholders of the Funds. It is not authorized for distribution to prospective investors unless accompanied or preceded by an effective prospectus. An investor should consider the Funds' investment objectives, risks and expenses carefully before investing or sending money. This and other important information can be found in the Funds' summary prospectuses and full prospectus. To obtain a prospectus, please call Shareholder Services at (800) 304-7404 or visit the Funds' website at www.mairsandpower.com. Please read the prospectus carefully before investing.
This report includes forward-looking statements such as economic predictions and portfolio manager opinions. The statements are subject to change at any time based on market and other conditions. No predictions, forecasts, outlooks, expectations or beliefs are guaranteed.
52
MAIRS & POWER FUNDS TRUST
Mairs & Power Growth Fund, established 1958
Mairs & Power Balanced Fund, established 1961
Mairs & Power Small Cap Fund, established 2011
A No-Load Funds Trust
For Shareholder Services
Call (800) 304-7404
Or write to:
(via Regular Mail)
c/o U.S. Bancorp Fund Services, LLC
615 East Michigan Street
P. O. Box 701
Milwaukee, WI 53201-0701 | | (via Overnight or Express Mail)
c/o U.S. Bancorp Fund Services, LLC
3rd Floor
615 East Michigan Street
Milwaukee, WI 53202-0701 | |
For Fund literature and information, visit the Trust's website at:
www.mairsandpower.com
Investment Manager
Mairs & Power, Inc.
W1520 First National Bank Building
332 Minnesota Street
Saint Paul, MN 55101
Custodian
U.S. Bank, N.A.
Custody Operations
1555 North River Center Drive, Suite 302
Milwaukee, WI 53212
Distributor
ALPS Distributors, Inc.
1290 Broadway, Suite 1000
Denver, CO 80203
Mairs & Power, Inc.
c/o U.S. Bancorp Fund Services, LLC
3rd Floor
615 East Michigan Street
Milwaukee, WI 53202-0701
Item 2. Code of Ethics.
Not applicable for semi-annual reports.
Item 3. Audit Committee Financial Expert.
Not applicable for semi-annual reports.
Item 4. Principal Accountant Fees and Services.
Not applicable for semi-annual reports.
Item 5. Audit Committee of Listed Registrants.
Not applicable to registrant.
Item 6. Investments.
| (a) | Schedule of Investments is included as part of the report to shareholders filed under Item 1 of this Form |
Item 7. Disclosure of Proxy Voting Policies and Procedures for Closed-End Management Investment Companies.
Not applicable to open-end investment companies.
Item 8. Portfolio Managers of Closed-End Management Investment Companies.
Not applicable to open-end investment companies.
Item 9. Purchases of Equity Securities by Closed-End Management Investment Company and Affiliated Purchasers.
Not applicable to open-end investment companies.
Item 10. Submission of Matters to a Vote of Security Holders.
There has been no material change to the procedures by which shareholders may recommend nominees to the registrant’s board of directors.
Item 11. Controls and Procedures.
| (a) | The registrant’s principal executive officer and principal financial officer have evaluated the registrant’s disclosure controls and procedures as of a date within 90 days of the filing of this report and have concluded that the registrant’s disclosure controls and procedures were effective, as of that date, in ensuring that information required to be disclosed by the registrant in this Form N-CSR was recorded, processed, summarized and reported within the time period specified by the SEC’s rules and forms. |
| (b) | There were no changes in the Registrant's internal control over financial reporting (as defined in Rule 30a-3(d) under the Act) that occurred during the second fiscal quarter of the period covered by this report that has materially affected, or is reasonably likely to materially affect, the Registrant's internal control over financial reporting. |
Item 12. Disclosure of Securities Lending Activities for Closed-End Management Investment Companies
Not applicable to open-end investment companies.
Item 13. Exhibits.
Mairs & Power Funds Trust Code of Ethics for Principal Executive Officer and Principal Financial Officer.
Incorporated by reference to previous Form N-CSR filing, filed August 31, 2018.
(2) Certifications required by Rule 30a-2(a) under the Investment Company Act of 1940.
Attached as exhibits 99.CERT to this form.
(3) Any written solicitation to purchase securities under Rule 23c-1 under the Act sent or given during the period covered by the report by or on behalf of the registrant to 10 or more persons. Not applicable to open-end investment companies.
(b) Certifications pursuant to Section 906 of the Sarbanes-Oxley Act of 2002.
Attached as exhibit 99.906CERT to this form.
SIGNATURES
Pursuant to the requirements of the Securities Exchange Act of 1934 and the Investment Company Act of 1940, the registrant has duly caused this report to be signed on its behalf by the undersigned, thereunto duly authorized.
| | (Registrant) | Mairs & Power Funds Trust | |
| | By (Signature and Title)* | /s/ Mark Henneman | |
| | | Mark L. Henneman, President | |
| | | Principal Executive Officer | |
Pursuant to the requirements of the Securities Exchange Act of 1934 and the Investment Company Act of 1940, this report has been signed below by the following persons on behalf of the registrant and in the capacities and on the dates indicated.
| | By (Signature and Title)* | /s/ Mark Henneman | |
| | | Mark L. Henneman, President | |
| | | Principal Executive Officer | |
| | By (Signature and Title)* | /s/ Andrea Stimmel | |
| | | Andrea C. Stimmel, Treasurer | |
| | | Principal Financial Officer | |
* Print the name and title of each signing officer under his or her signature.