UNITED STATES
SECURITIES AND EXCHANGE COMMISSION
Washington, D.C. 20549
FORM N-CSR
CERTIFIED SHAREHOLDER REPORT OF REGISTERED
MANAGEMENT INVESTMENT COMPANIES
Investment Company Act file number | 811-22563 |
|
Mairs & Power Funds Trust |
(Exact name of registrant as specified in charter) |
|
332 Minnesota Street, Suite W1520, St. Paul, MN | | 55101 |
(Address of principal executive offices) | | (Zip code) |
|
Andrea C. Stimmel, Treasurer, 332 Minnesota Street, Suite W1520, St. Paul, MN 55101 |
(Name and address of agent for service) |
|
Registrant’s telephone number, including area code: | 651-222-8478 | |
|
Date of fiscal year end: | December 31, 2018 | |
|
Date of reporting period: | June 30, 2018 | |
| | | | | | | | |
Item 1. Reports to Stockholders.

Investing for the long-term
SEMI-ANNUAL REPORT
JUNE 30, 2018
- GROWTH FUND (MPGFX)
est. 1958
- BALANCED FUND (MAPOX)
est. 1961
- SMALL CAP FUND (MSCFX)
est. 2011
Mairs & Power W1520 First National Bank Building, 332 Minnesota Street, St. Paul, Minnesota 55101 www.mairsandpower.com
MAIRS & POWER FUNDS MARKET COMMENTARY (unaudited)
June 30, 2018
As has been the case for several quarters, market sentiment remains locked in a tug-of-war between optimism and caution and Tech continues to lead all other sectors, driven by the largest names in the space including Google parent, Alphabet (GOOG), Facebook (FB), Netflix (NFLX), Microsoft (MSFT) and Apple (AAPL). Amazon (AMZN), while not a technology company, also had an outsized impact on the market this year. On the encouraging side of the ledger, the U.S. economic expansion remains on track, solid profit growth continues and measures of business and consumer confidence remain at very high levels. In June, the unemployment rate fell to 4.0%, only the fourth time in the last 50 years that it has fallen at or below 4%, and earnings for the S&P 500 surged 26.6% in Q1, driven by a strong economy and boosted further by the recently enacted tax cuts.
While the positive news buoys investor confidence, we are also seeing some caution signs as the market faces headwinds from rising interest rates, higher labor costs and an upward tilt to inflation. Growth in Europe has softened and U.S. GDP (Gross Domestic Product) grew 2.3% in Q1, slower than many expected considering the help from tax cuts. The stock market appears to have already priced in the surge in corporate profits and was virtually flat through April as earnings were being reported. Many companies are reporting higher transportation costs and a tight labor market, putting upward pressure on operating expenses. With cost pressure increasing, earnings growth will slow and profit margins may have peaked. To top off the list of worries, uncertainty over the possibility of a trade war is feeding market anxiety and volatility.
After a prolonged period of little or no inflation, the price indices have now gone past the Federal Reserve Bank (the Fed) target rate of 2%. In June the federal funds rate was increased by another 25 basis points and the Fed Board of Governors indicated that two additional hikes are likely this year, creating a difficult environment for bond returns. The U.S. central bank continues to shrink its balance sheet, removing liquidity from the market by selling mortgage-backed securities it acquired during the recession. The Fed's action stands in contrast to central banks in Europe and Japan which are still holding rates artificially low. In the U.S. the Prime Rate recently hit 5% which will increase borrowing costs and access to capital for smaller companies. The yield curve continues to flatten, as the difference between short- and long-term rates narrows, a common occurrence late in the economic cycle.
For the second quarter, the S&P 500 Total Return (TR) was 3.43% and was 2.65% for the first six months of the year. The Dow Jones Industrial Average (TR) was 1.26% and -0.73% and the Bloomberg Barclay U.S. Government/Credit Bond Index return was -0.33% and -1.90% for the second quarter and first six months, respectively.
Outlook
We remain cautious in our outlook for the year. Given the cross-currents described above, we are entering a period of increasing uncertainty where our disciplined approach is designed to mitigate risk for investors on the downside, while remaining poised for opportunities the market may present. In the midst of one of the longest bull markets in history, now in its tenth year, the market remains growth-obsessed, willing to pay a premium for growth but unforgiving when faced with even temporarily slowing momentum. Given the current market focus on a narrow selection of growth stocks, some investors may wonder if they should change their plan and join the crowd. While one style of investing often dominates the market for a period of time and overpaying for the current winners can feel good in the short-term, it often proves very costly in the long-term. We believe that avoiding the highflyer that corrects to a proper valuation and instead adding to the company that is out of favor, but well positioned for the long-term is how long-term investors succeed.
Past Performance is not a guarantee of future results.
Basis Point is a unit of measure for interest rates and other percentages in finance.
1
MAIRS & POWER FUNDS MARKET COMMENTARY (unaudited) (continued)
S&P 500 TR (Total Return) Index is an unmanaged index of 500 common stocks that is generally considered representative of the U.S. stock market. It tracks both the capital gains of a group of stocks over time and assumes that any cash distributions, such as dividends, are reinvested back into the index. It is not possible to invest directly in an index.
Dow Jones Industrial Average TR Index is a price-weighted average of 30 significant stocks traded on the New York Stock Exchange and the NASDAQ. It is not possible to invest directly in an index.
Bloomberg Barclays U.S. Government/Credit Bond Index is a broad-based flagship benchmark that measures the non-securitized component of the U.S. Aggregate Index. It includes investment-grade, U.S. dollar-denominated, fixed-rate Treasuries, government-related and corporate securities. It is not possible to invest directly in an index.
2
MAIRS & POWER GROWTH FUND (unaudited)
To Our Shareholders: June 30, 2018
While the Growth Fund has delivered good absolute performance over the past two years (up 8.80%), it has underperformed the S&P 500 in each of the last eight quarters.
Given that relative underperformance compared to the S&P 500, we think now is an appropriate time to review our strategy with our investors to:
• assess the long-term viability of the strategy;
• ensure that we are delivering on the strategy; and
• help our shareholders determine if our strategy is still appropriate for their needs.
As a result, this second quarter and six-month review is a little longer and follows a different format than previous letters.
The Mairs & Power Investment Philosophy
Our strategy is built on:
1. Long-Term Focus: We believe long-term commitment offers significantly more opportunity to take advantage of market inefficiencies.
2. Upper Midwest Emphasis: We focus on stocks in Minnesota and the Upper Midwest.
3. Multi-Cap Approach: In addition to owning large-cap stocks, we also make investments in small and mid-size companies that we believe have the ability to grow faster and perform better than large-cap stocks over time.
4. Seeking Higher Average Returns at Attractive Valuations: We buy quality growth companies with a durable competitive advantage at an attractive valuation.
MAIRS & POWER GROWTH FUND (MPGFX)
Top Relative Performers
Second Quarter (3/31/18 – 6/30/18) | | Year To Date (12/31/17 – 6/30/18) | |
NVE Corp. | | | 44.56 | % | | Bio-Techne Corp. | | | 12.05 | % | |
Hormel Foods Corp. | | | 5.57 | % | | Fiserv, Inc. | | | 10.35 | % | |
UnitedHealth Group, Inc. | | | 11.61 | % | | NVE Corp. | | | 42.05 | % | |
Alphabet, Inc. | | | 4.69 | % | | Target Corp. | | | 16.00 | % | |
Tennant Company | | | 13.56 | % | | Abbott Laboratories | | | 5.24 | % | |
Weak Relative Performers
Second Quarter (3/31/18 – 6/30/18) | | Year To Date (12/31/17 – 6/30/18) | |
| 3M Company | | | -13.21 | % | | 3M Company | | | -18.02 | % | |
Fastenal Company | | | -14.60 | % | | Principal Financial Group, Inc. | | | -26.28 | % | |
Principal Financial Group, Inc. | | | -15.70 | % | | Johnson & Johnson | | | -14.60 | % | |
C.H. Robinson Worldwide, Inc. | | | -13.69 | % | | General Mills, Inc. | | | -26.56 | % | |
Johnson & Johnson | | | -8.05 | % | | U.S. Bancorp | | | -8.17 | % | |
Performance shown is relative to the S&P 500 TR Index as of June 30, 2018. Relative return is the difference between the absolute return and the performance of the market, in which the position is held. Relative contribution is used for ranking, which considers average daily weightings for each holding. Past performance does not guarantee future results.
3
MAIRS & POWER GROWTH FUND (unaudited) (continued)
Because we are a private company owned by our Investment Managers, we are able to stick with our strategy and avoid the temptation to stray from our investment discipline. Though simple in principle, a rules-based approach is difficult to follow in practice, especially when it seems that following investment trends yields quick and positive results. Such frustration can tempt investors to abandon their strategy when things go against them, which usually ends poorly for the investor. We intend to stick with our strategy. Here is why:
Leg #1: Valuation Discipline
Mutual Fund assessment firms (most notably Morningstar and Lipper) consider the Mairs & Power Growth Fund to be a core fund, and that is what we strive to be. Our strategy is often referred to as Growth at a Reasonable Price (GARP). Following our GARP discipline, we seek out companies with an above-average growth rate and above-average returns, but impose a strict discipline regarding how much we will pay for those stocks. This value discipline shows up in historical returns for the Growth Fund which is more highly correlated with the S&P 500 Value Index than the Index for the overall S&P 500. That does not mean we are a "value" fund, however, as those funds are often heavily exposed to Financial and Energy stocks, sectors where the Growth Fund has less exposure than the overall market.
We invest in companies over a long-term horizon. The Mairs & Power Growth Fund strives to outperform the S&P 500 and its peers over complete market cycles (Growth Fund Market Cycle Chart at www.mairsandpower.com). It also strives to have lower volatility than the S&P 500 over the long-term. Through consistent application of our investment discipline, the Fund has been successful in both pursuits over decades and through generations of investment managers adhering to the same approach. We recognize, however, that in periods such as the current one where the market favors growth stocks over value stocks, we tend to underperform the broad market. The S&P 500 Value Index has underperformed the broader S&P 500 for seven of the past eight quarters. Over that same period, Mairs & Power Growth Fund has underperformed the S&P 500 each quarter.
We believe our investment discipline has added value to the performance of the Growth Fund and believe it will continue to do so in the future. Over 10- and 20-year annualized returns, the Mairs & Power Growth Fund has delivered returns superior to the S&P 500 Total Return index and the Lipper Multi-Cap Core category of peer funds. This result is consistent with research from Noble Prize winning economist Eugene Fama and his colleague Kenneth French, who have demonstrated that both small cap and large cap "value" stocks have significantly outperformed "growth" stocks over the very long-term.
Leg #2: Upper Midwest
We principally invest in companies that are close to our headquarters in Saint Paul, Minnesota. This 'home court' advantage allows us to observe company management teams close up, watch how they perform under different circumstances and various business environments, and easily stay abreast of developments. This approach has long characterized Mairs & Power, serving us and our investors well over decades. We believe the advantages to be gained by investing in Minnesota companies continue to exist.
The focus on Minnesota and upper Midwest-based companies has led to significant portfolio weighting in Industrial and Health Care sector stocks located here. It has also resulted in under-exposure to Technology. While this portfolio weighting has been persistent through time, it has worked against relative performance of the Growth Fund the last two years in particular, as the market has favored a narrow selection of technology growth stocks. To illustrate, five large tech stocks (Facebook, Apple, Netflix, Google and Microsoft) and Amazon (AMZN), not a tech stock, make up more than 15% of the total value of the S&P 500 and their stocks drive much of the performance, up and down, of the index.
Despite the market's current narrow focus, we remain confident in all these sector "bets" in the Growth Fund. First, we like the Healthcare sector. With an aging population and rising wealth in emerging economies, healthcare in general is a growth sector we remain invested in. Despite the negative attitude of the market towards the Industrial sector, we understand that these stocks (particularly the ones we invest in possessing durable competitive advantages) have long product cycles that may allow them to generate excess returns
4
MAIRS & POWER GROWTH FUND (unaudited) (continued)
over time. For example, 3M (MMM) has absorbed one of its largest one quarter declines by 10.39%, after slightly reducing its sales growth forecast for the year. We had been selling 3M opportunistically last year because the stock was very expensive. With the aggressive move down so far this year, the stock is once again attractive and we bought back shares in the second quarter.
And we are not ignoring the Tech sector. While Information Technology is growing more rapidly than the overall economy, many companies in this sector tend toward short product cycles with intense competition and generally weak durable competitive advantages, so we remain selective. Having said that, we are impressed by the durable competitive advantages we find in a number of internet related companies. Applying our value discipline approach, we have been adding to existing positions in Google parent, Alphabet (GOOG) and CoreSite Realty (COR), a cloud computing data center management company. We also improved the quality of our Information Technology holdings by selling Western Union (WU) and establishing new positions in Microsoft (MSFT), Visa (V), and Littelfuse (LFUS), a manufacturer of circuit protection products and components.
Leg #3: Multi-Cap Approach
Mid-cap stocks have outperformed large cap stocks over the long-term with only slightly higher volatility (risk). The multi-cap approach we take with the Growth Fund naturally results in more exposure to small and especially mid-cap stocks than the S&P 500. As a result, the Growth Fund tends to outperform the S&P 500 in years where the S&P Mid-cap 400 Index outperforms the market. Since 1994, the S&P 400 Mid-cap Index has seen an annualized return of 11.80% while the S&P 500 has delivered 9.58% annualized return. Over that same period, the Growth Fund has seen 11.92% annualized return.
While Mid-cap stocks detracted from the Fund's relative performance in 2017, they helped performance in 2016 and so far in 2018. Examples of smaller companies in the Growth Fund that did well in the quarter are NVE Corp. (NVEC) up 46.5% and Tennant (TNC) up 16.7%.
Putting it all Together
The Growth Fund participates in but often lags the market in strong up years. This spread is particularly evident towards the end of economic cycles. We recognize that our strategy can cause performance to vary greatly from the S&P 500 over the short to intermediate term and the Mairs & Power Growth Fund trails the S&P 500 so far this cycle.
Despite that, the Growth Fund has performed well over the long-term in part because it has tended to perform better when the market is performing poorly. As the Growth Fund historically does not lose as much ground when the overall market weakens during an economic slowdown, it has less to make up when the economy and the markets recover. As a result, patient, long-term investors benefit over a full cycle. We are not predicting the end of the current economic cycle. However, using history as our guide, we are overdue for a recession and a subsequent soft equity market. Since 1945, the average cycle has lasted 5.7 years, while the current expansion is moving into its 10th year. Given these facts, it's important to bear in mind that during periods when the market was anticipating a recession, the Growth Fund has historically outperformed. To sum up, we remain committed at Mairs & Power to our strategy built on valuation discipline, focus on the upper Midwest and a multi-cap approach. It has been a formula for success for more than eight decades that we intend to continue.
Mark L. Henneman
Lead Manager | | Andrew R. Adams
Co-Manager | |
The Fund's investment objective, risks, charges and expenses must be considered carefully before investing. The summary prospectus or full prospectus contains this and other important information about the Fund and they may be obtained by calling Shareholder Services at (800) 304-7404 or by visiting www.mairsandpower.com. Read the summary prospectus or full prospectus carefully before investing.
5
MAIRS & POWER GROWTH FUND (unaudited) (continued)
All holdings in the portfolio are subject to change without notice and may or may not represent current or future portfolio composition. The mention of specific securities is not intended as a recommendation or an offer of a particular security, nor is it intended to be a solicitation for the purchase or sale of any security.
All investments have risks. The Growth Fund is designed for long-term investors. Equity investments are subject to market fluctuations and the Fund's share price can fall because of weakness in the broad market, a particular industry or specific holdings. Investments in small and midcap companies generally are more volatile. International investing risks include among others political, social or economic instability, difficulty in predicting international trade patterns, taxation and foreign trading practices and greater fluctuations in price than U.S. corporations.
Diversification does not guarantee profit or protect against loss.
S&P 500 TR (Total Return) Index is an unmanaged index of 500 common stocks that is generally considered representative of the U.S. stock market. It tracks both the capital gains of a group of stocks over time and assumes that any cash distributions, such as dividends, are reinvested back into the index. It is not possible to invest directly in an index.
The S&P MidCap 400 Index measures the performance of mid-sized companies, reflecting the distinctive risk and return characteristics of this market segment. It is not possible to invest directly in an index.
Lipper Multi-Cap Core Funds Index measures the performance of the 30 largest mutual funds that invest in a variety of capitalization ranges, without concentrating 75% or more of their equity assets in any one market capitalization range over an extended period of time, as determined by Lipper, Inc. It is not possible to invest directly in an index.
The S&P 500 Value Index is a market-capitalization-weighted index of the 500 largest U.S. publicly traded companies by market value. It is not possible to invest directly in an index.
6
Mairs & Power Growth Fund
PERFORMANCE INFORMATION (unaudited) June 30, 2018
Ten years of investment performance (through June 30, 2018)
This chart illustrates the performance of a hypothetical $10,000 investment made in the Fund 10 years ago.
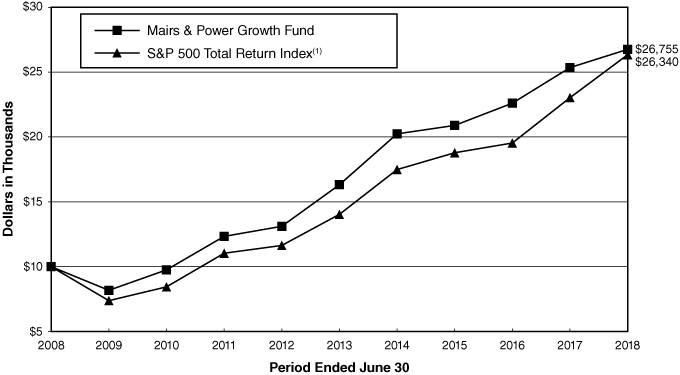
Average annual total returns for periods ended June 30, 2018
| | | 1 year | | 5 years | | 10 years | | 20 years | |
Mairs & Power Growth Fund | | | 5.55 | % | | | 10.39 | % | | | 10.34 | % | | | 9.13 | % | |
S&P 500 Total Return Index(1) | | | 14.37 | % | | | 13.42 | % | | | 10.17 | % | | | 6.46 | % | |
Performance data quoted represents past performance and does not guarantee future results. All performance information shown includes the reinvestment of dividend and capital gain distributions, but does not reflect the deduction of taxes that a shareholder would pay on Fund distributions or the redemption of Fund shares. The investment return and principal value of an investment will fluctuate so that an investor's shares, when redeemed, may be worth more or less than their original cost. Current performance of the Fund may be lower or higher than the performance quoted. For the most recent month-end performance figures, visit the Fund's website at www.mairsandpower.com or call Shareholder Services at (800) 304-7404.
(1) The S&P 500 Total Return Index is an unmanaged index of 500 common stocks that is generally considered representative of the U.S. stock market. It tracks both the capital gains of a group of stocks over time and assumes that any cash distributions, such as dividends, are reinvested back into the index. It is not possible to invest directly in an index.
7
Mairs & Power Growth Fund
FUND INFORMATION (unaudited) June 30, 2018
Portfolio Managers
Mark L. Henneman, CFA, lead manager since July 1, 2013, co-manager from January 1, 2006 through June 30, 2013, University of Minnesota, MBA Finance 1990
Andrew R. Adams, CFA, co-manager since January 1, 2015, University of Wisconsin-Madison, MS Finance 1997
General Information
Fund Symbol | | | MPGFX | | |
Net Asset Value (NAV) Per Share | | $ | 117.74 | | |
Expense Ratio | | | 0.64 | %1 | |
Portfolio Turnover Rate (1/1/18 to 6/30/18,
not annualized) | | | 5.32 | % | |
Sales Charge | | | None2 | | |
Fund Inception Year | | | 1958 | | |
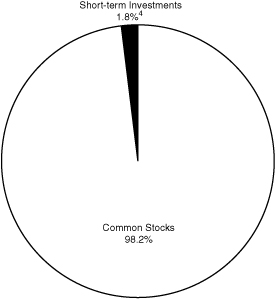
Portfolio Composition
Top Ten Portfolio Holdings
(Percent of Total Net Assets) 3
US Bancorp/MN | | | 4.7 | % | |
Ecolab Inc | | | 4.6 | | |
Alphabet Inc | | | 4.2 | | |
Medtronic PLC | | | 4.0 | | |
Hormel Foods Corp | | | 3.7 | | |
Honeywell International Inc | | | 3.7 | | |
Johnson & Johnson | | | 3.6 | | |
| 3M Co | | | 3.5 | | |
Donaldson Co Inc | | | 3.4 | | |
Abbott Laboratories | | | 3.2 | | |
Portfolio Diversification
(Percent of Total Net Assets)
Common Stocks 98.2% | |
Industrials | | | 25.9 | % | |
Health Care | | | 22.8 | | |
Financials | | | 13.6 | | |
Information Technology | | | 13.4 | | |
Materials | | | 8.7 | | |
Consumer Staples | | | 5.5 | | |
Consumer Discretionary | | | 5.0 | | |
Energy | | | 2.0 | | |
Real Estate | | | 1.3 | | |
Short-term Investments 1.8%4 | | | 1.8 | | |
| | | | 100.0 | % | |
1 Ratio has been annualized for the six month period ended June 30, 2018.
2 Although the Fund is no-load, investment management fees and other expenses still apply.
3 All holdings in the portfolio are subject to change without notice and may or may not represent current or future portfolio composition. The mention of specific securities is not intended as a recommendation or offer for a particular security, nor is it intended to be a solicitation for the purchase or sale of any security.
4 Represents short-term investments and other assets and liabilities (net).
The Schedule of Investments and portfolio diversification utilize the Global Industry Classification Standard (GICS®) which was developed by and/or is the exclusive property of MSCI, Inc. and Standard & Poor's Financial Services LLC ("S&P"). GICS is a service mark of MSCI, Inc. and S&P and has been licensed for use by Mairs & Power, Inc. (the "Adviser").
8
Mairs & Power Growth Fund
SCHEDULE OF INVESTMENTS (unaudited) June 30, 2018
Shares | | Security Description | | Fair Value | |
| | | COMMON STOCKS 98.2% | |
| | | CONSUMER DISCRETIONARY 5.0% | |
| | 380,000 | | | Gentherm Inc (b) | | $ | 14,934,000 | | |
| | 80,000 | | | Home Depot Inc/The | | | 15,608,000 | | |
| | 692,500 | | | Target Corp | | | 52,713,100 | | |
| | 1,275,000 | | | Walt Disney Co/The | | | 133,632,750 | | |
| | | | 216,887,850 | | |
| | | CONSUMER STAPLES 5.5% | |
| | 1,800,000 | | | General Mills Inc | | | 79,668,000 | | |
| | 4,310,000 | | | Hormel Foods Corp | | | 160,375,100 | | |
| | | | 240,043,100 | | |
| | | ENERGY 2.0% | |
| | 1,325,000 | | | Schlumberger Ltd (a) | | | 88,814,750 | | |
| | | FINANCIALS 13.6% | |
| | 800,000 | | | American Express Co | | | 78,400,000 | | |
| | 1,210,000 | | | Associated Banc-Corp | | | 33,033,000 | | |
| | 450,000 | | | Charles Schwab Corp/The | | | 22,995,000 | | |
| | 1,255,000 | | | Great Western Bancorp Inc | | | 52,697,450 | | |
| | 1,520,000 | | | Principal Financial Group Inc | | | 80,484,000 | | |
| | 4,095,000 | | | US Bancorp/MN | | | 204,831,900 | | |
| | 335,000 | | | Visa Inc | | | 44,370,750 | | |
| | 1,325,000 | | | Wells Fargo & Co | | | 73,458,000 | | |
| | | | 590,270,100 | | |
| | | HEALTH CARE 22.8% | |
| | 2,290,000 | | | Abbott Laboratories | | | 139,667,100 | | |
| | 295,000 | | | Baxter International Inc | | | 21,782,800 | | |
| | 795,000 | | | Bio-Techne Corp | | | 117,620,250 | | |
| | 460,000 | | | Eli Lilly & Co | | | 39,251,800 | | |
| | 1,285,000 | | | Johnson & Johnson | | | 155,921,900 | | |
| | 2,030,000 | | | Medtronic PLC (e) | | | 173,788,300 | | |
| | 480,000 | | | Patterson Cos Inc | | | 10,881,600 | | |
| | 2,115,000 | | | Pfizer Inc | | | 76,732,200 | | |
| | 3,530,000 | | | Roche Holding AG (d) | | | 97,533,900 | | |
| | 305,000 | | | UnitedHealth Group Inc | | | 74,828,700 | | |
| | 745,000 | | | Zimmer Holdings Inc | | | 83,022,800 | | |
| | | | 991,031,350 | | |
9
Mairs & Power Growth Fund
SCHEDULE OF INVESTMENTS (unaudited) (continued) June 30, 2018
Shares | | Security Description | | Fair Value | |
| | | COMMON STOCKS (continued) | |
| | | INDUSTRIALS 25.9% | |
| | 775,000 | | | 3M Co | | $ | 152,458,000 | | |
| | 1,070,000 | | | CH Robinson Worldwide Inc | | | 89,516,200 | | |
| | 3,310,000 | | | Donaldson Co Inc | | | 149,347,200 | | |
| | 1,915,000 | | | Fastenal Co | | | 92,168,950 | | |
| | 415,000 | | | Generac Holdings Inc (b) | | | 21,467,950 | | |
| | 2,855,000 | | | Graco Inc | | | 129,103,100 | | |
| | 1,105,000 | | | Honeywell International Inc | | | 159,175,250 | | |
| | 1,280,000 | | | nVent Electric PLC (a) (b) | | | 32,128,000 | | |
| | 1,250,000 | | | Pentair PLC (a) | | | 52,600,000 | | |
| | 170,000 | | | Proto Labs Inc (b) | | | 20,221,500 | | |
| | 215,000 | | | Snap-on Inc | | | 34,554,800 | | |
| | 713,572 | | | Tennant Co | | | 56,372,188 | | |
| | 1,610,000 | | | Toro Co/The | | | 97,002,500 | | |
| | 380,000 | | | United Parcel Service Inc, Class B | | | 40,367,400 | | |
| | | | 1,126,483,038 | | |
| | | INFORMATION TECHNOLOGY 13.4% | |
| | 164,000 | | | Alphabet Inc (b) | | | 182,966,600 | | |
| | 945,000 | | | Badger Meter Inc | | | 42,241,500 | | |
| | 1,300,000 | | | Corning Inc | | | 35,763,000 | | |
| | 1,375,000 | | | Cray Inc (b) | | | 33,825,000 | | |
| | 1,400,000 | | | Fiserv Inc (b) | | | 103,726,000 | | |
| | 55,000 | | | Littelfuse Inc | | | 12,549,900 | | |
| | 760,000 | | | Microsoft Corp | | | 74,943,600 | | |
| | 195,500 | | | NVE Corp | | | 23,807,990 | | |
| | 925,000 | | | QUALCOMM Inc | | | 51,911,000 | | |
| | 1,120,000 | | | Western Union Co/The | | | 22,769,600 | | |
| | | | 584,504,190 | | |
| | | MATERIALS 8.7% | |
| | 2,040,000 | | | Bemis Co Inc | | | 86,108,400 | | |
| | 1,430,000 | | | Ecolab Inc | | | 200,671,900 | | |
| | 1,672,098 | | | HB Fuller Co | | | 89,758,220 | | |
| | | | 376,538,520 | | |
| | | REAL ESTATE 1.3% | |
| | 525,000 | | | CoreSite Realty Corp | | | 58,180,500 | | |
| | | | TOTAL COMMON STOCKS
(cost $2,361,859,229) | | $ | 4,272,753,398 | | |
10
Mairs & Power Growth Fund
SCHEDULE OF INVESTMENTS (unaudited) (continued) June 30, 2018
Shares | | Security Description | | Fair Value | |
| | | SHORT-TERM INVESTMENTS 1.7% | |
| 73,263,624 | | | First American Government Obligations Fund, Class Z, 1.80% (c)
(cost $73,263,624) | | $ | 73,263,624 | | |
| | TOTAL INVESTMENTS 99.9%
(cost $2,435,122,853) | | $ | 4,346,017,022 | | |
| | | OTHER ASSETS AND LIABILITIES (NET) 0.1% | | | 4,267,645 | | |
| | | TOTAL NET ASSETS 100.0% | | $ | 4,350,284,667 | | |
(a) Foreign security denominated in U.S. dollars. As of June 30, 2018, these securities represented $173,542,750 or 4.0% of total net assets.
(b) Non-income producing.
(c) The rate quoted is the annualized seven-day effective yield as of June 30, 2018.
(d) American Depositary Receipt.
(e) Issuer headquartered overseas but considered domestic. In determining whether a security is foreign or domestic, the Adviser will generally look at the location of the headquarters of the issuer. However, if the issuer is believed by the Adviser to be headquartered in a jurisdiction primarily for tax purposes, the Adviser will consider the following additional factors: 1) the location of the primary exchange trading its securities; 2) where it derives the majority of its revenues, and/or 3) where it earns the majority of its profits.
The Global Industry Classification Standard (GICS®) was developed by and/or is the exclusive property of MSCI, Inc. and Standard & Poor's Financial Services LLC ("S&P"). GICS is a service mark of MSCI, Inc. and S&P and has been licensed for use by the Adviser.
See accompanying Notes to Financial Statements.
11
MAIRS & POWER BALANCED FUND (unaudited)
To Our Shareholders: June 30, 2018
The Balanced Fund finished the quarter up 0.95% compared to its benchmark composite index (60% S&P 500 TR Index and 40% Bloomberg Barclays U.S. Government/Credit Bond Index) which gained 1.92%. Six months year-to-date, the Fund is down -2.67% and the benchmark is up 0.88%.
While stock selection was a slight positive contributor to relative performance in the quarter, relative underperformance in both the second quarter and first six months was driven by the Fund's overweight position in industrial stocks, which were weak in the quarter, and underweight position in the Information Technology sector, which continues to lead the overall market. In addition, stock selection was a factor in relative underperformance year-to-date.
As we have noted before, these portfolio weightings have worked against relative performance of the Fund recently, as the market has favored a narrow selection of technology growth stocks. To illustrate, five large tech stocks (Facebook, Apple, Netflix, Google and Microsoft) and Amazon (AMZN), not a tech stock, make up more than 15% of the total value of the S&P 500 and their stocks drive much of the performance, up and down, of the index.
Despite the market's current narrow focus, we remain confident in our sector "bets" in the Balanced Fund. First, we like the Healthcare sector. With an aging population and rising wealth in emerging economies, healthcare in general is a growth sector we remain invested in. Despite the negative attitude of the market towards the Industrial sector driven by concerns over a trade war, as discussed in the market overview above, we understand that these stocks (particularly the ones we invest in possessing durable competitive advantages) have long product cycles that may allow them to generate excess returns over time. For example, 3M (MMM) has absorbed one of its largest one quarter declines of 10.39% after slightly reducing its sales growth forecast for the year. We think the market has over-reacted. As a relatively large holding within the Fund, this was a significant contributor to underperformance in both the quarter and first six months. We had been selling 3M opportunistically early this year because the stock was very expensive. With the aggressive move down so far this year, the stock is once again attractive and we bought back shares in the second quarter.
MAIRS & POWER BALANCED FUND (MAPOX)
Top Relative Performers
| Second Quarter (3/31/18 – 6/30/18) | | Year To Date (12/31/17 – 6/30/18) | |
UnitedHealth Group Inc. | | | 11.61 | % | | UnitedHealth Group Inc. | | | 9.40 | % | |
Chevron Corp. | | | 8.39 | % | | Abbott Laboratories | | | 5.24 | % | |
Home Depot, Inc. | | | 6.63 | % | | Target Corp. | | | 16.00 | % | |
Exxon Mobil Corp. | | | 8.57 | % | | Medtronic plc | | | 3.99 | % | |
Hormel Foods Corp. | | | 5.57 | % | | Alphabet Inc. | | | 3.97 | % | |
Weak Relative Performers
| Second Quarter (3/31/18 – 6/30/18) | | Year To Date (12/31/17 – 6/30/18) | |
Principal Financial Group, Inc. | | | -15.70 | % | | Principal Financial Group, Inc. | | | -26.28 | % | |
| 3M Company | | | -13.21 | % | | 3M Company | | | -18.02 | % | |
C.H. Robinson Worldwide, Inc. | | | -13.69 | % | | Johnson & Johnson | | | -14.60 | % | |
Johnson & Johnson | | | -8.05 | % | | United Parcel Service, Inc. Class B | | | -12.02 | % | |
JPMorgan Chase & Company | | | -8.21 | % | | U.S. Bancorp | | | -8.17 | % | |
Performance shown is relative to the S&P 500 TR Index as of June 30, 2018. Relative return is the difference between the absolute return and the performance of the market, in which the position is held. Relative contribution is used for ranking, which considers average daily weightings for each holding. Past performance does not guarantee future results.
12
MAIRS & POWER BALANCED FUND (unaudited) (continued)
And we are not ignoring the Tech sector. While Information Technology is growing more rapidly than the overall economy, many companies in this sector tend toward short product cycles with intense competition and generally weak durable competitive advantages, so we remain selective. Having said that, we are impressed by the durable competitive advantages we find in a number of internet related companies. Applying our value discipline approach, we have been adding to existing positions in Google parent, Alphabet (GOOG). In addition, we established a new position in Microsoft (MSFT) during the first quarter.
We sold out of our position in Physicians' Realty Trust (DOC) in the quarter, after evaluating the impact of the company's changed strategy on its durable competitive advantage going forward. The company has adopted a more aggressive acquisition strategy, taking on increased debt and accepting lower returns on transactions than we are willing to accept.
Our portfolio of fixed income securities declined, which is similar to the corporate investment grade index and paralleling the Bloomberg Barclays U.S. Government/Credit Bond Index, which was down 1.9% year-to-date. Interest rates have moved up this year and the Fed has signaled continued rate increases out to 2020, putting pressure on fixed income securities.
As we have said previously, a portfolio of high-quality bonds still provides a good counterbalance should we experience a difficult equity market environment. In this circumstance, we continue to favor a defensive posture with high quality corporate debt of shorter duration, allowing us to capture excess yield over both treasuries and the longer duration corporate debt index. Our portfolio currently earns an average coupon of over 4.5% and should continue to both provide stable income for shareholders and offset equity volatility during economic and market corrections.
Kevin V. Earley
Lead Manager | | Ronald L. Kaliebe
Co-Manager | | Robert W. Thompson
Co-Manager | |
The Fund's investment objective, risks, charges and expenses must be considered carefully before investing. The summary prospectus or full prospectus contains this and other important information about the Fund and they may be obtained by calling Shareholder Services at (800) 304-7404 or by visiting www.mairsandpower.com. Read the summary prospectus or full prospectus carefully before investing.
All holdings in the portfolio are subject to change without notice and may or may not represent current or future portfolio composition. The mention of specific securities is not intended as a recommendation or an offer of a particular security, nor is it intended to be a solicitation for the purchase or sale of any security.
All investments have risks. The Balanced Fund is designed for long-term investors. Equity investments are subject to market fluctuations and the Fund's share price can fall because of weakness in the broad market, a particular industry or specific holdings. Investments in small and midcap companies generally are more volatile. International investing risks include among others political, social or economic instability, difficulty in predicting international trade patterns, taxation and foreign trading practices, and greater fluctuations in price than U.S. corporations. The Fund is subject to yield and share price variances with changes in interest rates and market conditions. Investors should note that if interest rates rise significantly from current levels, bond total returns will decline and may even turn negative in the short-term. There is also a chance that some of the Fund's holdings may have their credit rating downgraded or may default.
Diversification does not guarantee profit or protect against loss.
Composite Index reflects an unmanaged portfolio of 60% of the S&P 500 TR Index and 40% of the Bloomberg Barclays U.S. Government/Credit Bond Index. It is not possible to invest directly in an index.
Bloomberg Barclays U.S. Government/Credit Bond Index is a broad-based flagship benchmark that measures the non-securitized component of the U.S. Aggregate Index. It includes investment-grade, U.S. dollar-denominated, fixed-rate Treasuries, government-related and corporate securities. It is not possible to invest directly in an index.
13
MAIRS & POWER BALANCED FUND (unaudited) (continued)
S&P 500 TR (Total Return) Index is an unmanaged index of 500 common stocks that is generally considered representative of the U.S. stock market. It tracks both the capital gains of a group of stocks over time and assumes that any cash distributions, such as dividends, are reinvested back into the index. It is not possible to invest directly in an index.
A coupon is the annual interest rate paid on a bond, expressed as a percentage of the face value.
14
Mairs & Power Balanced Fund
PERFORMANCE INFORMATION (unaudited) June 30, 2018
Ten years of investment performance (through June 30, 2018)
This chart illustrates the performance of a hypothetical $10,000 investment made in the Fund 10 years ago.
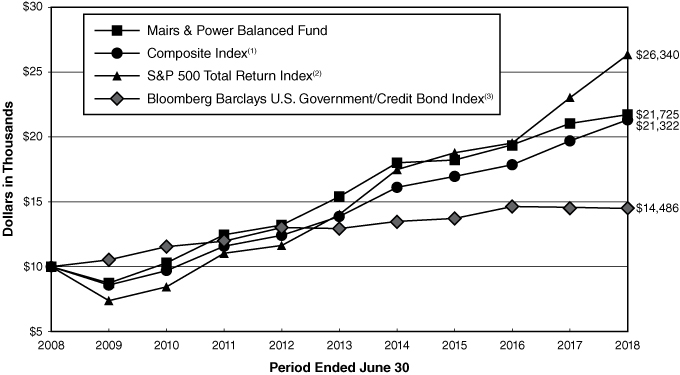
Average annual total returns for periods ended June 30, 2018
| | | 1 year | | 5 years | | 10 years | | 20 years | |
Mairs & Power Balanced Fund | | | 3.25 | % | | | 7.12 | % | | | 8.07 | % | | | 7.15 | % | |
Composite Index(1) | | | 8.24 | % | | | 8.98 | % | | | 7.87 | % | | | 6.09 | % | |
S&P 500 Total Return Index(2) | | | 14.37 | % | | | 13.42 | % | | | 10.17 | % | | | 6.46 | % | |
Bloomberg Barclays U.S. Government/Credit
Bond Index(3) | | | -0.63 | % | | | 2.29 | % | | | 3.78 | % | | | 4.73 | % | |
Performance data quoted represents past performance and does not guarantee future results. All performance information shown includes the reinvestment of dividend and capital gain distributions, but does not reflect the deduction of taxes that a shareholder would pay on Fund distributions or the redemption of Fund shares. The investment return and principal value of an investment will fluctuate so that an investor's shares, when redeemed, may be worth more or less than their original cost. Current performance of the Fund may be lower or higher than the performance quoted. For the most recent month-end performance figures, visit the Fund's website at www.mairsandpower.com or call Shareholder Services at (800) 304-7404.
(1) The Composite Index reflects an unmanaged portfolio comprised of 60% of the S&P 500 Total Return Index and 40% of the Bloomberg Barclays U.S. Government/Credit Bond Index. It is not possible to invest directly in an index.
(2) The S&P 500 Total Return Index is an unmanaged index of 500 common stocks that is generally considered representative of the U.S. stock market. It tracks both the capital gains of a group of stocks over time and assumes that any cash distributions, such as dividends, are reinvested back into the index. It is not possible to invest directly in an index.
(3) The Bloomberg Barclays U.S. Government/Credit Bond Index is a broad-based flagship benchmark that measures the non-securitized component of the U.S. Aggregate Index. It includes investment-grade, U.S. dollar-denominated, fixed-rate treasuries, government-related and corporate securities. It is not possible to invest directly in an index.
15
Mairs & Power Balanced Fund
FUND INFORMATION (unaudited) June 30, 2018
Portfolio Managers
Kevin V. Earley, CFA, lead manager since April 1, 2018, co-manager from January 1, 2015 through March 31, 2018, University of Minnesota, MBA Finance 1990
Ronald L. Kaliebe, CFA, co-manager since April 1, 2018, lead manager from July 1, 2013 through March 31, 2018, co-manager from January 1, 2006 through June 30, 2013, University of Wisconsin-Madison, MBA Finance 1980
Robert W. Thompson, CFA, co-manager since April 1, 2018, University of Minnesota, MBA Finance 1995
General Information
Fund Symbol | | MAPOX | |
Net Asset Value (NAV) Per Share | | $ | 90.51 | | |
Expense Ratio | | | 0.72 | %1 | |
Portfolio Turnover Rate (1/1/18 to 6/30/18,
not annualized) | | | 4.91 | % | |
Sales Charge | | | None2 | | |
Fund Inception Year | | | 1961 | | |
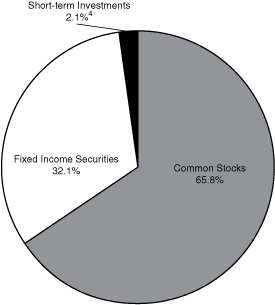
Portfolio Composition
Top Ten Common Stock Holdings
(Percent of Total Net Assets) 3
Medtronic PLC | | | 3.3 | % | |
US Bancorp/MN | | | 3.0 | | |
Ecolab Inc | | | 2.7 | | |
Honeywell International Inc | | | 2.6 | | |
Alphabet Inc | | | 2.5 | | |
Johnson & Johnson | | | 2.3 | | |
Abbott Laboratories | | | 2.3 | | |
| 3M Co | | | 2.3 | | |
Hormel Foods Corp | | | 2.2 | | |
Pfizer Inc | | | 2.1 | | |
Portfolio Diversification
(Percent of Total Net Assets)
Fixed Income Securities 32.1% | |
Corporate Bonds | | | 29.0 | % | |
Asset Backed Securities | | | 3.1 | | |
Common Stocks 65.8% | |
Health Care | | | 17.6 | | |
Industrials | | | 14.3 | | |
Financials | | | 10.2 | | |
Information Technology | | | 5.8 | | |
Consumer Staples | | | 4.6 | | |
Materials | | | 4.5 | | |
Consumer Discretionary | | | 4.1 | | |
Energy | | | 4.0 | | |
Utilities | | | 0.7 | | |
Short-term Investments 2.1%4 | | | 2.1 | | |
| | | | 100.0 | % | |
1 Ratio has been annualized for the six month period ended June 30, 2018.
2 Although the Fund is no-load, investment management fees and other expenses still apply.
3 All holdings in the portfolio are subject to change without notice and may or may not represent current or future portfolio composition. The mention of specific securities is not intended as a recommendation or offer for a particular security, nor is it intended to be a solicitation for the purchase or sale of any security.
4 Represents short-term investments and other assets and liabilities (net).
The Schedule of Investments and portfolio diversification utilize the Global Industry Classification Standard (GICS®) which was developed by and/or is the exclusive property of MSCI, Inc. and Standard & Poor's Financial Services LLC ("S&P"). GICS is a service mark of MSCI, Inc. and S&P and has been licensed for use by the Adviser.
16
Mairs & Power Balanced Fund
SCHEDULE OF INVESTMENTS (unaudited) June 30, 2018
Par Value | | Security Description | | Fair Value | |
| | | FIXED INCOME SECURITIES 32.1% | |
| | | CORPORATE BONDS 29.0% | |
| | | CONSUMER DISCRETIONARY 2.9% | |
$ | 500,000 | | | Best Buy Co Inc | | | 5.000 | % | | 08/01/18 | | $ | 500,799 | | |
| | 1,000,000 | | | Ford Motor Credit Co LLC | | | 3.000 | % | | 12/20/18 | | | 997,401 | | |
| | 1,000,000 | | | Time Warner Cable Inc | | | 4.125 | % | | 02/15/21 | | | 1,005,090 | | |
| | 1,000,000 | | | Best Buy Co Inc | | | 5.500 | % | | 03/15/21 | | | 1,048,282 | | |
| | 555,000 | | | Kohl's Corp | | | 4.000 | % | | 11/01/21 | | | 562,606 | | |
| | 500,000 | | | Whirlpool Corp | | | 4.700 | % | | 06/01/22 | | | 518,731 | | |
| | 750,000 | | | Newell Rubbermaid Inc | | | 4.000 | % | | 06/15/22 | | | 748,815 | | |
| | 1,000,000 | | | Block Financial LLC | | | 5.500 | % | | 11/01/22 | | | 1,034,070 | | |
| | 1,000,000 | | | Wyndham Worldwide Corp | | | 3.900 | % | | 03/01/23 | | | 937,500 | | |
| | 2,702,000 | | | LKQ Corp | | | 4.750 | % | | 05/15/23 | | | 2,695,245 | | |
| | 500,000 | | | Hyatt Hotels Corp | | | 3.375 | % | | 07/15/23 | | | 492,117 | | |
| | 1,000,000 | | | Viacom Inc | | | 4.250 | % | | 09/01/23 | | | 994,291 | | |
| | 2,000,000 | | | Viacom Inc | | | 3.875 | % | | 04/01/24 | | | 1,934,999 | | |
| | 500,000 | | | Tiffany & Co | | | 3.800 | % | | 10/01/24 | | | 496,618 | | |
| | 1,000,000 | | | CBS Corp | | | 3.500 | % | | 01/15/25 | | | 956,392 | | |
| | 2,000,000 | | | Coach Inc | | | 4.250 | % | | 04/01/25 | | | 1,976,090 | | |
| | 250,000 | | | General Motors Co | | | 4.000 | % | | 04/01/25 | | | 242,641 | | |
| | 1,500,000 | | | Ford Motor Credit Co LLC | | | 4.134 | % | | 08/04/25 | | | 1,462,335 | | |
| | 1,064,000 | | | Block Financial LLC | | | 5.250 | % | | 10/01/25 | | | 1,066,968 | | |
| | 1,000,000 | | | Ford Motor Co | | | 4.346 | % | | 12/08/26 | | | 981,412 | | |
| | 1,000,000 | | | General Motors Co | | | 4.200 | % | | 10/01/27 | | | 957,887 | | |
| | 1,000,000 | | | L Brands Inc | | | 5.250 | % | | 02/01/28 | | | 888,750 | | |
| | 1,000,000 | | | Metropolitan Opera Association Inc | | | 4.349 | % | | 10/01/32 | | | 964,835 | | |
| | 2,000,000 | | | Comcast Corp | | | 4.250 | % | | 01/15/33 | | | 1,953,100 | | |
| | | | 25,416,974 | | |
| | | CONSUMER STAPLES 0.7% | |
| | 2,250,000 | | | Land O' Lakes Inc (g) | | | 6.000 | % | | 11/15/22 | | | 2,385,000 | | |
| | 1,000,000 | | | Walgreens Boots Alliance Inc | | | 3.800 | % | | 11/18/24 | | | 985,759 | | |
| | 500,000 | | | Land O' Lakes Inc (g) (h) | | | 7.250 | % | | 04/04/27 | | | 545,000 | | |
| | 1,949,000 | | | Land O' Lakes Capital Trust I (g) | | | 7.450 | % | | 03/15/28 | | | 2,182,880 | | |
| | | | 6,098,639 | | |
| | | ENERGY 0.8% | |
| | 140,000 | | | Gulf South Pipeline Co LP | | | 4.000 | % | | 06/15/22 | | | 139,691 | | |
| | 500,000 | | | Western Gas Partners LP | | | 4.000 | % | | 07/01/22 | | | 494,144 | | |
| | 1,020,000 | | | TechnipFMC PLC (a) (g) | | | 3.450 | % | | 10/01/22 | | | 991,073 | | |
| | 1,500,000 | | | Sunoco Logistics Partners Operations LP | | | 3.450 | % | | 01/15/23 | | | 1,455,750 | | |
17
Mairs & Power Balanced Fund
SCHEDULE OF INVESTMENTS (unaudited) (continued) June 30, 2018
Par Value | | Security Description | | Fair Value | |
| | | FIXED INCOME SECURITIES (continued) | |
| | | CORPORATE BONDS (continued) | |
| | | ENERGY (continued) | |
$ | 2,300,000 | | | Murphy Oil Corp | | | 6.875 | % | | 08/15/24 | | $ | 2,415,000 | | |
| | 500,000 | | | Kinder Morgan Energy Partners LP | | | 4.250 | % | | 09/01/24 | | | 501,053 | | |
| | 1,000,000 | | | Boardwalk Pipelines LP | | | 4.950 | % | | 12/15/24 | | | 1,018,056 | | |
| | 500,000 | | | Murphy Oil Corp (f) | | | 5.875 | % | | 12/01/42 | | | 452,500 | | |
| | | | 7,467,267 | | |
| | | FINANCIALS 13.2% | |
| | 500,000 | | | Provident Cos Inc | | | 7.000 | % | | 07/15/18 | | | 499,813 | | |
| | 500,000 | | | MetLife Inc | | | 6.817 | % | | 08/15/18 | | | 502,572 | | |
| | 500,000 | | | Hartford Financial Services Group Inc/The | | | 6.000 | % | | 01/15/19 | | | 508,075 | | |
| | 500,000 | | | Royal Bank of Scotland Group PLC (a) | | | 5.250 | % | | 02/15/19 | | | 504,696 | | |
| | 500,000 | | | BB&T Corp | | | 6.850 | % | | 04/30/19 | | | 517,030 | | |
| | 250,000 | | | WR Berkley Corp | | | 6.150 | % | | 08/15/19 | | | 257,669 | | |
| | 500,000 | | | Protective Life Corp | | | 7.375 | % | | 10/15/19 | | | 526,379 | | |
| | 500,000 | | | Credit Suisse/New York NY (a) | | | 5.400 | % | | 01/14/20 | | | 514,412 | | |
| | 500,000 | | | Prospect Capital Corp | | | 4.000 | % | | 01/15/20 | | | 494,444 | | |
| | 500,000 | | | Morgan Stanley | | | 5.500 | % | | 01/26/20 | | | 517,294 | | |
| | 500,000 | | | Hartford Financial Services Group Inc/The | | | 5.500 | % | | 03/30/20 | | | 519,377 | | |
| | 450,000 | | | Compass Bank | | | 5.500 | % | | 04/01/20 | | | 462,961 | | |
| | 1,000,000 | | | HSBC Holdings PLC (a) | | | 3.400 | % | | 03/08/21 | | | 999,640 | | |
| | 1,000,000 | | | Nationwide Financial Services Inc (g) | | | 5.375 | % | | 03/25/21 | | | 1,042,614 | | |
| | 500,000 | | | Markel Corp | | | 5.350 | % | | 06/01/21 | | | 524,680 | | |
| | 500,000 | | | Diamond 1 Finance Corp / Diamond 2 Finance Corp (g) | | | 4.420 | % | | 06/15/21 | | | 507,311 | | |
| | 1,000,000 | | | Capital One Financial Corp | | | 4.750 | % | | 07/15/21 | | | 1,033,531 | | |
| | 500,000 | | | Goldman Sachs Group Inc/The | | | 5.250 | % | | 07/27/21 | | | 525,465 | | |
| | 500,000 | | | Aflac Inc | | | 4.000 | % | | 02/15/22 | | | 510,244 | | |
| | 3,000,000 | | | Primerica Inc | | | 4.750 | % | | 07/15/22 | | | 3,070,855 | | |
| | 2,833,000 | | | Infinity Property & Casualty Corp | | | 5.000 | % | | 09/19/22 | | | 2,900,531 | | |
| | 2,000,000 | | | OneBeacon US Holdings Inc | | | 4.600 | % | | 11/09/22 | | | 2,017,677 | | |
| | 1,000,000 | | | Standard Chartered PLC (a) (g) | | | 3.950 | % | | 01/11/23 | | | 976,934 | | |
| | 500,000 | | | First American Financial Corp | | | 4.300 | % | | 02/01/23 | | | 498,498 | | |
| | 2,000,000 | | | Wells Fargo & Co | | | 3.450 | % | | 02/13/23 | | | 1,960,064 | | |
| | 4,073,000 | | | Assurant Inc | | | 4.000 | % | | 03/15/23 | | | 4,045,982 | | |
| | 1,000,000 | | | Markel Corp | | | 3.625 | % | | 03/30/23 | | | 982,956 | | |
| | 1,000,000 | | | General Motors Financial Co Inc | | | 3.700 | % | | 05/09/23 | | | 981,055 | | |
| | 1,500,000 | | | Citigroup Inc | | | 3.500 | % | | 05/15/23 | | | 1,466,862 | | |
| | 1,000,000 | | | General Motors Financial Co Inc | | | 4.250 | % | | 05/15/23 | | | 997,597 | | |
| | 500,000 | | | Morgan Stanley | | | 4.100 | % | | 05/22/23 | | | 501,909 | | |
18
Mairs & Power Balanced Fund
SCHEDULE OF INVESTMENTS (unaudited) (continued) June 30, 2018
Par Value | | Security Description | | Fair Value | |
| | | FIXED INCOME SECURITIES (continued) | |
| | | CORPORATE BONDS (continued) | |
| | | FINANCIALS (continued) | |
$ | 3,000,000 | | | Liberty Mutual Group Inc (g) | | | 4.250 | % | | 06/15/23 | | $ | 3,030,321 | | |
| | 2,000,000 | | | Diamond 1 Finance Corp / Diamond 2 Finance Corp (g) | | | 5.450 | % | | 06/15/23 | | | 2,093,275 | | |
| | 500,000 | | | Assurant Inc | | | 4.200 | % | | 09/27/23 | | | 499,685 | | |
| | 500,000 | | | Ameriprise Financial Inc | | | 4.000 | % | | 10/15/23 | | | 511,401 | | |
| | 500,000 | | | CNA Financial Corp | | | 7.250 | % | | 11/15/23 | | | 571,983 | | |
| | 500,000 | | | Pacific Life Insurance Co (g) | | | 7.900 | % | | 12/30/23 | | | 592,782 | | |
| | 1,000,000 | | | Moody's Corp | | | 4.875 | % | | 02/15/24 | | | 1,049,831 | | |
| | 1,000,000 | | | HSBC Holdings PLC (a) | | | 4.250 | % | | 03/14/24 | | | 994,898 | | |
| | 1,000,000 | | | General Motors Financial Co Inc | | | 3.950 | % | | 04/13/24 | | | 978,607 | | |
| | 1,000,000 | | | NASDAQ OMX Group Inc/The | | | 4.250 | % | | 06/01/24 | | | 1,009,294 | | |
| | 540,000 | | | Wintrust Financial Corp | | | 5.000 | % | | 06/13/24 | | | 541,295 | | |
| | 2,250,000 | | | Assured Guaranty US Holdings Inc | | | 5.000 | % | | 07/01/24 | | | 2,351,216 | | |
| | 3,088,000 | | | Legg Mason Inc | | | 3.950 | % | | 07/15/24 | | | 3,059,787 | | |
| | 1,500,000 | | | Symetra Financial Corp | | | 4.250 | % | | 07/15/24 | | | 1,484,064 | | |
| | 1,500,000 | | | Stifel Financial Corp | | | 4.250 | % | | 07/18/24 | | | 1,494,507 | | |
| | 1,000,000 | | | Citigroup Inc | | | 4.000 | % | | 08/05/24 | | | 983,170 | | |
| | 3,000,000 | | | Synchrony Financial | | | 4.250 | % | | 08/15/24 | | | 2,940,940 | | |
| | 1,000,000 | | | Bank of America Corp | | | 4.200 | % | | 08/26/24 | | | 1,005,219 | | |
| | 2,800,000 | | | Brown & Brown Inc | | | 4.200 | % | | 09/15/24 | | | 2,807,160 | | |
| | 2,000,000 | | | Old Republic International Corp | | | 4.875 | % | | 10/01/24 | | | 2,073,388 | | |
| | 2,000,000 | | | TIAA Asset Management Finance Co LLC (g) | | | 4.125 | % | | 11/01/24 | | | 1,989,011 | | |
| | 3,000,000 | | | American Express Co | | | 3.625 | % | | 12/05/24 | | | 2,954,727 | | |
| | 3,500,000 | | | Associated Banc-Corp | | | 4.250 | % | | 01/15/25 | | | 3,518,017 | | |
| | 4,000,000 | | | Kemper Corp | | | 4.350 | % | | 02/15/25 | | | 3,978,218 | | |
| | 1,050,000 | | | TCF National Bank | | | 4.600 | % | | 02/27/25 | | | 1,000,329 | | |
| | 1,000,000 | | | Compass Bank | | | 3.875 | % | | 04/10/25 | | | 964,440 | | |
| | 250,000 | | | Liberty Mutual Insurance Co (g) | | | 8.500 | % | | 05/15/25 | | | 308,704 | | |
| | 1,000,000 | | | Prudential Insurance Co of America/The (g) | | | 8.300 | % | | 07/01/25 | | | 1,246,398 | | |
| | 3,000,000 | | | American International Group Inc | | | 3.750 | % | | 07/10/25 | | | 2,897,788 | | |
| | 1,000,000 | | | General Motors Financial Co Inc | | | 4.300 | % | | 07/13/25 | | | 981,065 | | |
| | 1,000,000 | | | Synchrony Financial | | | 4.500 | % | | 07/23/25 | | | 982,110 | | |
| | 2,000,000 | | | Janus Capital Group Inc | | | 4.875 | % | | 08/01/25 | | | 2,044,706 | | |
| | 3,000,000 | | | HSBC Holdings PLC (a) | | | 4.250 | % | | 08/18/25 | | | 2,945,353 | | |
| | 4,000,000 | | | Capital One Financial Corp | | | 4.200 | % | | 10/29/25 | | | 3,884,657 | | |
| | 1,520,000 | | | Legg Mason Inc | | | 4.750 | % | | 03/15/26 | | | 1,544,257 | | |
| | 2,000,000 | | | Hanover Insurance Group Inc/The | | | 4.500 | % | | 04/15/26 | | | 1,998,111 | | |
| | 1,000,000 | | | Wells Fargo & Co | | | 4.100 | % | | 06/03/26 | | | 979,901 | | |
| | 2,000,000 | | | MSCI Inc (g) | | | 4.750 | % | | 08/01/26 | | | 1,935,000 | | |
19
Mairs & Power Balanced Fund
SCHEDULE OF INVESTMENTS (unaudited) (continued) June 30, 2018
Par Value | | Security Description | | Fair Value | |
| | | FIXED INCOME SECURITIES (continued) | |
| | | CORPORATE BONDS (continued) | |
| | | FINANCIALS (continued) | |
$ | 3,290,000 | | | Old Republic International Corp | | | 3.875 | % | | 08/26/26 | | $ | 3,164,692 | | |
| | 500,000 | | | Morgan Stanley | | | 4.350 | % | | 09/08/26 | | | 493,176 | | |
| | 1,000,000 | | | Citigroup Inc | | | 4.300 | % | | 11/20/26 | | | 975,791 | | |
| | 1,000,000 | | | JPMorgan Chase & Co | | | 4.125 | % | | 12/15/26 | | | 987,369 | | |
| | 4,000,000 | | | Mercury General Corp | | | 4.400 | % | | 03/15/27 | | | 3,890,519 | | |
| | 250,000 | | | Provident Cos Inc | | | 7.250 | % | | 03/15/28 | | | 296,693 | | |
| | 500,000 | | | Farmers Exchange Capital (g) | | | 7.050 | % | | 07/15/28 | | | 591,493 | | |
| | 500,000 | | | Goldman Sachs Group Inc/The | | | 4.250 | % | | 11/15/30 | | | 483,864 | | |
| | 500,000 | | | Goldman Sachs Group Inc/The | | | 4.000 | % | | 02/15/31 | | | 478,152 | | |
| | 500,000 | | | Goldman Sachs Group Inc/The | | | 4.300 | % | | 12/15/32 | | | 486,107 | | |
| | 250,000 | | | Citigroup Inc (f) | | | 4.000 | % | | 06/27/34 | | | 239,812 | | |
| | 538,000 | | | Bank of America Corp | | | 4.000 | % | | 08/15/34 | | | 516,084 | | |
| | 1,000,000 | | | Goldman Sachs Group Inc/The | | | 4.000 | % | | 01/30/35 | | | 936,750 | | |
| | 300,000 | | | Goldman Sachs Group Inc/The (f) | | | 3.750 | % | | 05/31/36 | | | 275,287 | | |
| | 500,000 | | | Swiss Re Treasury US Corp (g) | | | 4.250 | % | | 12/06/42 | | | 500,941 | | |
| | 500,000 | | | Principal Financial Group Inc | | | 4.350 | % | | 05/15/43 | | | 477,535 | | |
| | 2,500,000 | | | M&T Bank Corp (f) (h) | | | 5.125 | % | | 11/01/26 | | | 2,484,375 | | |
| | | | 114,873,382 | | |
| | | HEALTH CARE 1.5% | |
| | 1,000,000 | | | Quest Diagnostics Inc | | | 4.700 | % | | 04/01/21 | | | 1,032,688 | | |
| | 1,000,000 | | | Laboratory Corp of America Holdings | | | 3.750 | % | | 08/23/22 | | | 1,006,102 | | |
| | 1,000,000 | | | Laboratory Corp of America Holdings | | | 4.000 | % | | 11/01/23 | | | 1,010,489 | | |
| | 2,000,000 | | | Mylan Inc/PA | | | 4.200 | % | | 11/29/23 | | | 2,001,875 | | |
| | 500,000 | | | Wyeth LLC | | | 6.450 | % | | 02/01/24 | | | 577,542 | | |
| | 3,000,000 | | | Actavis Funding SCS (a) | | | 3.800 | % | | 03/15/25 | | | 2,913,136 | | |
| | 1,500,000 | | | Baxalta Inc | | | 4.000 | % | | 06/23/25 | | | 1,468,459 | | |
| | 1,000,000 | | | Celgene Corp | | | 3.875 | % | | 08/15/25 | | | 973,163 | | |
| | 1,000,000 | | | Biogen Inc | | | 4.050 | % | | 09/15/25 | | | 1,005,167 | | |
| | 1,000,000 | | | Express Scripts Holding Co | | | 4.500 | % | | 02/25/26 | | | 992,751 | | |
| | | | 12,981,372 | | |
| | | INDUSTRIALS 2.2% | |
| | 65,000 | | | Masco Corp | | | 7.125 | % | | 03/15/20 | | | 68,849 | | |
| | 500,000 | | | IDEX Corp | | | 4.200 | % | | 12/15/21 | | | 504,177 | | |
| | 500,000 | | | GATX Corp | | | 4.750 | % | | 06/15/22 | | | 518,146 | | |
| | 500,000 | | | Penske Truck Leasing Co Lp / PTL Finance Corp (g) | | | 4.875 | % | | 07/11/22 | | | 519,879 | | |
| | 2,000,000 | | | Dun & Bradstreet Corp/The (f) | | | 4.625 | % | | 12/01/22 | | | 1,984,397 | | |
| | 2,000,000 | | | Crown Americas LLC / Crown Americas Capital Corp IV | | | 4.500 | % | | 01/15/23 | | | 1,960,000 | | |
20
Mairs & Power Balanced Fund
SCHEDULE OF INVESTMENTS (unaudited) (continued) June 30, 2018
Par Value | | Security Description | | Fair Value | |
| | | FIXED INCOME SECURITIES (continued) | |
| | | CORPORATE BONDS (continued) | |
| | | INDUSTRIALS (continued) | |
$ | 1,850,000 | | | MasTec Inc | | | 4.875 | % | | 03/15/23 | | $ | 1,791,041 | | |
| | 1,000,000 | | | GATX Corp | | | 3.900 | % | | 03/30/23 | | | 1,001,747 | | |
| | 500,000 | | | Ingersoll-Rand Global Holding Co Ltd (a) | | | 4.250 | % | | 06/15/23 | | | 514,116 | | |
| | 1,000,000 | | | Flowserve Corp | | | 4.000 | % | | 11/15/23 | | | 992,696 | | |
| | 2,126,000 | | | Air Lease Corp | | | 4.850 | % | | 02/01/24 | | | 2,125,967 | | |
| | 2,617,000 | | | Oshkosh Corp | | | 5.375 | % | | 03/01/25 | | | 2,682,425 | | |
| | 2,000,000 | | | Tennant Co | | | 5.625 | % | | 05/01/25 | | | 1,985,000 | | |
| | 500,000 | | | Toro Co/The | | | 7.800 | % | | 06/15/27 | | | 599,949 | | |
| | 2,000,000 | | | Eaton Corp | | | 4.000 | % | | 11/02/32 | | | 1,990,849 | | |
| | | | 19,239,238 | | |
| | | INFORMATION TECHNOLOGY 3.6% | |
| | 500,000 | | | Broadridge Financial Solutions Inc | | | 3.950 | % | | 09/01/20 | | | 507,185 | | |
| | 81,000 | | | Hewlett-Packard Co | | | 3.750 | % | | 12/01/20 | | | 81,638 | | |
| | 750,000 | | | Hewlett-Packard Co | | | 4.300 | % | | 06/01/21 | | | 768,710 | | |
| | 2,000,000 | | | NetApp Inc | | | 3.375 | % | | 06/15/21 | | | 1,981,833 | | |
| | 1,000,000 | | | eBay Inc | | | 3.800 | % | | 03/09/22 | | | 1,009,622 | | |
| | 2,000,000 | | | Western Union Co/The | | | 3.600 | % | | 03/15/22 | | | 1,986,260 | | |
| | 500,000 | | | Motorola Solutions Inc | | | 3.750 | % | | 05/15/22 | | | 498,382 | | |
| | 2,000,000 | | | Symantec Corp | | | 3.950 | % | | 06/15/22 | | | 1,947,798 | | |
| | 1,000,000 | | | Hewlett-Packard Co | | | 4.050 | % | | 09/15/22 | | | 1,007,693 | | |
| | 1,000,000 | | | DXC Technology Co | | | 4.450 | % | | 09/18/22 | | | 1,029,301 | | |
| | 1,025,000 | | | Fiserv Inc | | | 3.500 | % | | 10/01/22 | | | 1,009,469 | | |
| | 2,000,000 | | | Autodesk Inc | | | 3.600 | % | | 12/15/22 | | | 2,000,162 | | |
| | 1,352,000 | | | Total System Services Inc | | | 3.750 | % | | 06/01/23 | | | 1,339,860 | | |
| | 1,000,000 | | | Altera Corp | | | 4.100 | % | | 11/15/23 | | | 1,034,421 | | |
| | 1,000,000 | | | Juniper Networks Inc | | | 4.500 | % | | 03/15/24 | | | 1,016,417 | | |
| | 500,000 | | | Motorola Solutions Inc | | | 4.000 | % | | 09/01/24 | | | 484,852 | | |
| | 2,000,000 | | | Lam Research Corp | | | 3.800 | % | | 03/15/25 | | | 1,993,260 | | |
| | 1,031,000 | | | Arrow Electronics Inc | | | 4.000 | % | | 04/01/25 | | | 1,008,241 | | |
| | 1,000,000 | | | Juniper Networks Inc | | | 4.350 | % | | 06/15/25 | | | 996,926 | | |
| | 2,000,000 | | | Hewlett Packard Enterprise Co (f) | | | 4.900 | % | | 10/15/25 | | | 2,041,393 | | |
| | 1,500,000 | | | Dell International LLC / EMC Corp (g) | | | 6.020 | % | | 06/15/26 | | | 1,575,587 | | |
| | 4,000,000 | | | Intel Corp | | | 4.000 | % | | 12/15/32 | | | 4,105,716 | | |
| | 1,500,000 | | | Western Union Co/The | | | 6.200 | % | | 11/17/36 | | | 1,535,900 | | |
| | | | 30,960,626 | | |
21
Mairs & Power Balanced Fund
SCHEDULE OF INVESTMENTS (unaudited) (continued) June 30, 2018
Par Value | | Security Description | | Fair Value | |
| | | FIXED INCOME SECURITIES (continued) | |
| | | CORPORATE BONDS (continued) | |
| | | MATERIALS 2.5% | |
$ | 500,000 | | | Carpenter Technology Corp | | | 5.200 | % | | 07/15/21 | | $ | 512,428 | | |
| | 500,000 | | | Freeport-McMoRan Inc | | | 4.000 | % | | 11/14/21 | | | 487,500 | | |
| | 175,000 | | | Mosaic Co/The | | | 3.750 | % | | 11/15/21 | | | 175,058 | | |
| | 500,000 | | | Barrick Gold Corp (a) | | | 3.850 | % | | 04/01/22 | | | 507,320 | | |
| | 1,000,000 | | | Domtar Corp | | | 4.400 | % | | 04/01/22 | | | 1,018,445 | | |
| | 1,000,000 | | | RPM International Inc | | | 3.450 | % | | 11/15/22 | | | 985,123 | | |
| | 1,000,000 | | | Carpenter Technology Corp | | | 4.450 | % | | 03/01/23 | | | 1,007,090 | | |
| | 1,402,000 | | | Reliance Steel & Aluminum Co | | | 4.500 | % | | 04/15/23 | | | 1,433,609 | | |
| | 2,000,000 | | | Nucor Corp | | | 4.000 | % | | 08/01/23 | | | 2,034,542 | | |
| | 1,000,000 | | | BP Capital Markets PLC (a) | | | 3.994 | % | | 09/26/23 | | | 1,022,595 | | |
| | 2,000,000 | | | Mosaic Co/The | | | 4.250 | % | | 11/15/23 | | | 2,011,789 | | |
| | 1,000,000 | | | International Paper Co | | | 3.650 | % | | 06/15/24 | | | 988,549 | | |
| | 1,000,000 | | | Steel Dynamics Inc | | | 5.500 | % | | 10/01/24 | | | 1,018,750 | | |
| | 1,000,000 | | | Freeport-McMoRan Inc | | | 4.550 | % | | 11/14/24 | | | 950,000 | | |
| | 756,000 | | | Eastman Chemical Co | | | 3.800 | % | | 03/15/25 | | | 746,934 | | |
| | 865,000 | | | Union Carbide Corp | | | 7.500 | % | | 06/01/25 | | | 1,014,694 | | |
| | 200,000 | | | Worthington Industries Inc | | | 4.550 | % | | 04/15/26 | | | 201,428 | | |
| | 2,782,000 | | | HB Fuller Co | | | 4.000 | % | | 02/15/27 | | | 2,496,845 | | |
| | 1,250,000 | | | Dow Chemical Co/The | | | 4.250 | % | | 10/01/34 | | | 1,201,531 | | |
| | 1,000,000 | | | Alcoa Inc | | | 5.950 | % | | 02/01/37 | | | 965,000 | | |
| | 1,000,000 | | | Newmont Mining Corp | | | 4.875 | % | | 03/15/42 | | | 998,880 | | |
| | | | 21,778,110 | | |
| | | REAL ESTATE 0.3% | |
| | 1,000,000 | | | CBRE Services Inc | | | 5.250 | % | | 03/15/25 | | | 1,052,493 | | |
| | 350,000 | | | CBRE Services Inc | | | 4.875 | % | | 03/01/26 | | | 362,171 | | |
| | 1,000,000 | | | Physicians Realty LP | | | 4.300 | % | | 03/15/27 | | | 964,721 | | |
| | | | 2,379,385 | | |
| | | TELECOMMUNICATION SERVICES 0.4% | |
| | 500,000 | | | CenturyLink Inc | | | 6.150 | % | | 09/15/19 | | | 510,000 | | |
| | 1,150,000 | | | AT&T Inc | | | 3.800 | % | | 03/01/24 | | | 1,127,822 | | |
| | 500,000 | | | Qwest Capital Funding Inc | | | 6.875 | % | | 07/15/28 | | | 457,025 | | |
| | 1,000,000 | | | Verizon Communications Inc | | | 4.400 | % | | 11/01/34 | | | 932,633 | | |
| | 1,000,000 | | | AT&T Inc | | | 4.500 | % | | 05/15/35 | | | 924,944 | | |
| | | | 3,952,424 | | |
22
Mairs & Power Balanced Fund
SCHEDULE OF INVESTMENTS (unaudited) (continued) June 30, 2018
Par Value | | Security Description | | Fair Value | |
| | | FIXED INCOME SECURITIES (continued) | |
| | | CORPORATE BONDS (continued) | |
| | | UTILITIES 0.9% | |
$ | 250,000 | | | Vectren Utility Holdings Inc | | | 5.750 | % | | 08/01/18 | | $ | 250,629 | | |
| | 250,000 | | | South Jersey Gas Co | | | 7.125 | % | | 10/22/18 | | | 252,273 | | |
| | 250,000 | | | United Utilities PLC (a) | | | 5.375 | % | | 02/01/19 | | | 253,204 | | |
| | 1,170,000 | | | ONEOK Inc | | | 4.250 | % | | 02/01/22 | | | 1,188,755 | | |
| | 1,000,000 | | | Exelon Generation Co LLC | | | 4.250 | % | | 06/15/22 | | | 1,023,543 | | |
| | 1,565,000 | | | National Fuel Gas Co | | | 3.750 | % | | 03/01/23 | | | 1,542,407 | | |
| | 1,060,000 | | | PSEG Power LLC | | | 4.300 | % | | 11/15/23 | | | 1,078,398 | | |
| | 550,000 | | | Dominion Resources Inc/VA | | | 3.625 | % | | 12/01/24 | | | 539,339 | | |
| | 1,500,000 | | | National Fuel Gas Co | | | 3.950 | % | | 09/15/27 | | | 1,424,088 | | |
| | | | 7,552,636 | | |
| | | TOTAL CORPORATE BONDS | | | 252,700,053 | | |
| | | ASSET BACKED SECURITIES 3.1% | |
| | 19,586 | | | Continental Airlines 1999-1 Class B Pass Through Trust | | | 6.795 | % | | 08/02/18 | | | 19,574 | | |
| | 162,073 | | | Continental Airlines 2010-1 Class B Pass Through Trust | | | 6.000 | % | | 01/12/19 | | | 163,791 | | |
| | 203,757 | | | Delta Air Lines 2011-1 Class A Pass Through Trust | | | 5.300 | % | | 04/15/19 | | | 206,427 | | |
| | 419,644 | | | Delta Air Lines 2012-1 Class B Pass Through Trust (g) | | | 6.875 | % | | 05/07/19 | | | 426,190 | | |
| | 383,445 | | | America West Airlines 2000-1 Pass Through Trust | | | 8.057 | % | | 07/02/20 | | | 414,120 | | |
| | 470,307 | | | American Airlines 2011-1 Class A Pass Through Trust | | | 5.250 | % | | 01/31/21 | | | 490,013 | | |
| | 327,143 | | | Air Canada 2013-1 Class B Pass Through Trust (a) (g) | | | 5.375 | % | | 05/15/21 | | | 334,307 | | |
| | 668,837 | | | Northwest Airlines 2002-1 Class G-2 Pass Through Trust | | | 6.264 | % | | 11/20/21 | | | 692,247 | | |
| | 362,390 | | | United Airlines 2014-1 Class B Pass Through Trust | | | 4.750 | % | | 04/11/22 | | | 365,688 | | |
| | 164,818 | | | Continental Airlines 2007-1 Class A Pass Through Trust | | | 5.983 | % | | 04/19/22 | | | 175,350 | | |
| | 278,924 | | | Southwest Airlines Co 2007-1 Pass Through Trust | | | 6.150 | % | | 08/01/22 | | | 294,794 | | |
| | 653,219 | | | Delta Air Lines 2007-1 Class B Pass Through Trust (g) | | | 8.021 | % | | 08/10/22 | | | 720,762 | | |
| | 57,360 | | | United Airlines 2014-2 Class B Pass Through Trust | | | 4.625 | % | | 09/03/22 | | | 57,217 | | |
| | 470,814 | | | American Airlines 2014-1 Class B Pass Through Trust | | | 4.375 | % | | 10/01/22 | | | 470,249 | | |
| | 1,000,000 | | | United Airlines 2015-1 Class A Pass Through Trust | | | 3.700 | % | | 12/01/22 | | | 982,600 | | |
| | 559,048 | | | US Airways 2010-1 Class A Pass Through Trust | | | 6.250 | % | | 04/22/23 | | | 598,181 | | |
| | 1,654,168 | | | American Airlines 2015-1 Class B Pass Through Trust | | | 3.700 | % | | 05/01/23 | | | 1,607,851 | | |
| | 1,251,230 | | | Delta Air Lines 2015-1 Class B Pass Through Trust | | | 4.250 | % | | 07/30/23 | | | 1,248,102 | | |
| | 787,597 | | | American Airlines 2015-2 Class B Pass Through Trust | | | 4.400 | % | | 09/22/23 | | | 796,024 | | |
| | 295,196 | | | US Airways 2011-1 Class A Pass Through Trust | | | 7.125 | % | | 10/22/23 | | | 327,667 | | |
| | 3,306,205 | | | American Airlines 2016-1 Class B Pass Through Trust | | | 5.250 | % | | 01/15/24 | | | 3,374,312 | | |
| | 1,012,044 | | | Spirit Airlines Pass Through Trust 2015-1B | | | 4.450 | % | | 04/01/24 | | | 1,005,770 | | |
| | 1,436,951 | | | Continental Airlines 2012-2 Class A Pass Through Trust | | | 4.000 | % | | 10/29/24 | | | 1,441,693 | | |
| | 1,129,838 | | | American Airlines 2017-1 Class B Pass Through Trust | | | 4.950 | % | | 02/15/25 | | | 1,141,814 | | |
23
Mairs & Power Balanced Fund
SCHEDULE OF INVESTMENTS (unaudited) (continued) June 30, 2018
Par Value/Shares | | Security Description | | Fair Value | |
| | | FIXED INCOME SECURITIES (continued) | |
| | | ASSET BACKED SECURITIES (continued) | |
$ | 868,776 | | | United Airlines 2013-1 Class A Pass Through Trust | | | 4.300 | % | | 08/15/25 | | $ | 883,197 | | |
| | 955,808 | | | American Airlines 2016-3 Class B Pass Through Trust | | | 3.750 | % | | 10/15/25 | | | 919,392 | | |
| | 743,675 | | | US Airways 2013-1 Class A Pass Through Trust | | | 3.950 | % | | 11/15/25 | | | 739,064 | | |
| | 2,000,000 | | | United Airlines 2016-1 Class B Pass Through Trust | | | 3.650 | % | | 01/07/26 | | | 1,921,200 | | |
| | 2,034,398 | | | Hawaiian Airlines 2013-1 Class A Pass Through Certificates | | | 3.900 | % | | 01/15/26 | | | 2,008,358 | | |
| | 1,563,792 | | | American Airlines 2014-1 Class A Pass Through Trust | | | 3.700 | % | | 10/01/26 | | | 1,530,327 | | |
| | 396,809 | | | American Airlines 2015-1 Class A Pass Through Trust | | | 3.375 | % | | 05/01/27 | | | 380,461 | | |
| | 566,717 | | | American Airlines 2015-2 Class A Pass Through Trust | | | 4.000 | % | | 09/22/27 | | | 564,053 | | |
| | 173,816 | | | American Airlines 2015-2 Class AA Pass Through Trust | | | 3.600 | % | | 09/22/27 | | | 169,089 | | |
| | 116,629 | | | Spirit Airlines Pass Through Trust 2015-1A | | | 4.100 | % | | 04/01/28 | | | 116,046 | | |
| | | | 26,585,930 | | |
| | TOTAL FIXED INCOME SECURITIES
(cost $281,525,066) | | $ | 279,285,983 | | |
| | | COMMON STOCKS 65.8% | |
| | | CONSUMER DISCRETIONARY 4.1% | |
| | 86,000 | | | Home Depot Inc/The | | | | | | | | | | $ | 16,778,600 | | |
| | 74,000 | | | Target Corp | | | | | | | | | | | 5,632,880 | | |
| | 125,000 | | | Walt Disney Co/The | | | | | | | | | | | 13,101,250 | | |
| | | | 35,512,730 | | |
| | | CONSUMER STAPLES 4.6% | |
| | 166,000 | | | General Mills Inc | | | | | | | | | | | 7,347,160 | | |
| | 77,000 | | | Hershey Co/The | | | | | | | | | | | 7,165,620 | | |
| | 515,000 | | | Hormel Foods Corp | | | | | | | | | | | 19,163,150 | | |
| | 57,000 | | | Kimberly-Clark Corp | | | | | | | | | | | 6,004,380 | | |
| | | | 39,680,310 | | |
| | | ENERGY 4.0% | |
| | 87,000 | | | Chevron Corp | | | | | | | | | | | 10,999,410 | | |
| | 134,000 | | | Exxon Mobil Corp | | | | | | | | | | | 11,085,820 | | |
| | 186,000 | | | Schlumberger Ltd (a) | | | | | | | | | | | 12,467,580 | | |
| | | | 34,552,810 | | |
| | | FINANCIALS 10.2% | |
| | 105,000 | | | American Express Co | | | | | | | | | | | 10,290,000 | | |
| | 239,000 | | | Associated Banc-Corp | | | | | | | | | | | 6,524,700 | | |
| | 101,000 | | | Great Western Bancorp Inc | | | | | | | | | | | 4,240,990 | | |
| | 140,000 | | | JPMorgan Chase & Co | | | | | | | | | | | 14,588,000 | | |
| | 271,000 | | | Principal Financial Group Inc | | | | | | | | | | | 14,349,450 | | |
| | 27,000 | | | Travelers Cos Inc/The | | | | | | | | | | | 3,303,180 | | |
24
Mairs & Power Balanced Fund
SCHEDULE OF INVESTMENTS (unaudited) (continued) June 30, 2018
Shares | | Security Description | | Fair Value | |
| | | COMMON STOCKS (continued) | |
| | | FINANCIALS (continued) | |
| | 527,000 | | | US Bancorp/MN | | | | | | | | | | $ | 26,360,540 | | |
| | 175,000 | | | Wells Fargo & Co | | | | | | | | | | | 9,702,000 | | |
| | | | 89,358,860 | | |
| | | HEALTH CARE 17.6% | |
| | 330,000 | | | Abbott Laboratories | | | | | | | | | | | 20,126,700 | | |
| | 28,000 | | | AbbVie Inc | | | | | | | | | | | 2,594,200 | | |
| | 62,000 | | | Baxter International Inc | | | | | | | | | | | 4,578,080 | | |
| | 28,000 | | | Bio-Techne Corp | | | | | | | | | | | 4,142,600 | | |
| | 98,500 | | | Bristol-Myers Squibb Co | | | | | | | | | | | 5,450,990 | | |
| | 157,000 | | | Eli Lilly & Co | | | | | | | | | | | 13,396,810 | | |
| | 167,000 | | | Johnson & Johnson | | | | | | | | | | | 20,263,780 | | |
| | 331,000 | | | Medtronic PLC (e) | | | | | | | | | | | 28,336,910 | | |
| | 137,000 | | | Patterson Cos Inc | | | | | | | | | | | 3,105,790 | | |
| | 499,000 | | | Pfizer Inc | | | | | | | | | | | 18,103,720 | | |
| | 554,000 | | | Roche Holding AG (d) | | | | | | | | | | | 15,307,020 | | |
| | 73,000 | | | UnitedHealth Group Inc | | | | | | | | | | | 17,909,820 | | |
| | | | 153,316,420 | | |
| | | INDUSTRIALS 14.3% | |
| | 100,000 | | | 3M Co | | | | | | | | | | | 19,672,000 | | |
| | 153,000 | | | CH Robinson Worldwide Inc | | | | | | | | | | | 12,799,980 | | |
| | 177,000 | | | Donaldson Co Inc | | | | | | | | | | | 7,986,240 | | |
| | 83,000 | | | Emerson Electric Co | | | | | | | | | | | 5,738,620 | | |
| | 117,000 | | | Fastenal Co | | | | | | | | | | | 5,631,210 | | |
| | 370,000 | | | General Electric Co | | | | | | | | | | | 5,035,700 | | |
| | 377,000 | | | Graco Inc | | | | | | | | | | | 17,047,940 | | |
| | 159,000 | | | Honeywell International Inc | | | | | | | | | | | 22,903,950 | | |
| | 137,000 | | | nVent Electric PLC (a) (b) | | | | | | | | | | | 3,438,700 | | |
| | 137,000 | | | Pentair PLC (a) | | | | | | | | | | | 5,764,960 | | |
| | 80,000 | | | Toro Co/The | | | | | | | | | | | 4,820,000 | | |
| | 133,000 | | | United Parcel Service Inc, Class B | | | | | | | | | | | 14,128,590 | | |
| | | | 124,967,890 | | |
| | | INFORMATION TECHNOLOGY 5.8% | |
| | 19,200 | | | Alphabet Inc (b) | | | | | | | | | | | 21,420,480 | | |
| | 378,000 | | | Corning Inc | | | | | | | | | | | 10,398,780 | | |
| | 25,000 | | | International Business Machines Corp | | | | | | | | | | | 3,492,500 | | |
| | 73,000 | | | Microsoft Corp | | | | | | | | | | | 7,198,530 | | |
| | 100,000 | | | QUALCOMM Inc | | | | | | | | | | | 5,612,000 | | |
| | 130,000 | | | Western Union Co/The | | | | | | | | | | | 2,642,900 | | |
| | | | 50,765,190 | | |
25
Mairs & Power Balanced Fund
SCHEDULE OF INVESTMENTS (unaudited) (continued) June 30, 2018
Shares | | Security Description | | Fair Value | |
| | | COMMON STOCKS (continued) | |
| | | MATERIALS 4.5% | |
| | 210,000 | | | Bemis Co Inc | | | | | | | | | | $ | 8,864,100 | | |
| | 167,000 | | | Ecolab Inc | | | | | | | | | | | 23,435,110 | | |
| | 136,000 | | | HB Fuller Co | | | | | | | | | | | 7,300,480 | | |
| | | | 39,599,690 | | |
| | | UTILITIES 0.7% | |
| | 35,000 | | | ALLETE Inc | | | | | | | | | | | 2,709,350 | | |
| | 67,000 | | | Xcel Energy Inc | | | | | | | | | | | 3,060,560 | | |
| | | | 5,769,910 | | |
| | TOTAL COMMON STOCKS
(cost $393,641,404) | | | | | | | | | | $ | 573,523,810 | | |
| | | SHORT-TERM INVESTMENTS 1.8% | |
| 16,033,093 | | | First American Government Obligations Fund, Class Z, 1.80% (c)
(cost $16,033,093) | | | | | | | | | | $ | 16,033,093 | | |
| | TOTAL INVESTMENTS 99.7%
(cost $691,199,563) | | | | | | | | | | $ | 868,842,886 | | |
| | | OTHER ASSETS AND LIABILITIES (NET) 0.3% | | | | | | | | | | | 2,726,501 | | |
| | | TOTAL NET ASSETS 100.0% | | | | | | | | | | $ | 871,569,387 | | |
(a) Foreign security denominated in U.S. dollars. As of June 30, 2018, these securities represented $35,142,924 or 4.0% of total net assets.
(b) Non-income producing.
(c) The rate quoted is the annualized seven-day effective yield as of June 30, 2018.
(d) American Depositary Receipt.
(e) Issuer headquartered overseas but considered domestic. In determining whether a security is foreign or domestic, the Adviser will generally look at the location of the headquarters of the issuer. However, if the issuer is believed by the Adviser to be headquartered in a jurisdiction primarily for tax purposes, the Adviser will consider the following additional factors: 1) the location of the primary exchange trading its securities; 2) where it derives the majority of its revenues, and/or 3) where it earns the majority of its profits.
(f) Step Bonds – Securities for which the coupon rate of interest will adjust on specified future date(s). The rate disclosed represents the coupon rate in effect as of June 30, 2018.
(g) Securities exempt from registration under Rule 144A of the Securities Act of 1933. These securities may be resold in transactions exempt from registration, normally to qualified institutional buyers. These securities have been determined to be liquid under guidelines established by the Fund's Board of Trustees. As of June 30, 2018, these securities represented $24,495,462 or 2.8% of total net assets.
(h) Perpetual bond. Maturity date shown is the next callable date.
The Global Industry Classification Standard (GICS®) was developed by and/or is the exclusive property of MSCI, Inc. and Standard & Poor's Financial Services LLC ("S&P"). GICS is a service mark of MSCI, Inc. and S&P and has been licensed for use by the Adviser.
See accompanying Notes to Financial Statements.
26
MAIRS & POWER SMALL CAP FUND (unaudited)
To Our Shareholders: June 30, 2018
Small cap stocks performed well in the second quarter with the Fund gaining 8.66% and the S&P SmallCap 600 TR Index up 8.77%. While the Fund didn't quite keep up with the index in the quarter, it did make up some ground on our peer group of small cap funds as measured by the Morningstar Small Blend category which was up 6.31%. Six months year-to-date, the Fund gained 5.09%, the index was up 9.39% and the peer group category gained 5.26%.
Stock selection was the most meaningful driver and a positive contributor to relative performance, but sector weighting negatively impacted relative performance in the quarter. The Fund's underweight position in the Energy sector, which was the strongest performing sector, hurt relative performance as did an overweight position in the Industrial sector which was one of the weaker performing sectors in the quarter.
Positive contributors to performance in both the quarter and year-to-date included IntriCon (IIC), Oasis Petroleum (OAS) and NVE Corp. (NVEC). IntriCon, a small Twin Cities-based medical device company, has benefited significantly as the investment community has come to understand the manufacturing value they bring to continuous glucose monitoring products for the medical device global leader Medtronic. Intricon is the sole supplier for a number of parts in this quickly growing market segment. Another growth area for the company, which has traditionally been a key supplier to the manufacturers of high-end hearing aids, is the OTC (over the counter) market for hearing aids. This is already a growing market and regulatory changes in the works to make it easier for self-fitting should give the market even better growth. IntriCon believes it has the ability to be an original equipment provider of hearing aids at very low cost and will likely increase their market opportunity significantly as hearing aid prices come down.
Oasis Petroleum, a leading independent oil producer in the Williston Basin in North Dakota, has benefited as oil prices have recovered and the value of its U.S. shale acreage has moved up significantly. The company's focus on operational efficiency has resulted in a good job delivering on its drilling schedule and production targets. Finally, it has recently been able to de-lever its balance sheet a bit as it sold some of its non-core North Dakota assets at fairly good prices.
MAIRS & POWER SMALL CAP FUND (MSCFX)
Top Relative Performers
| Second Quarter (3/31/18 – 6/30/18) | | Year To Date (12/31/17 – 6/30/18) | |
IntriCon Corp. | | | 92.73 | % | | IntriCon Corp. | | | 94.15 | % | |
Oasis Petroleum Inc. | | | 51.35 | % | | NVE Corp. | | | 35.31 | % | |
NVE Corp. | | | 39.22 | % | | Oasis Petroleum Inc. | | | 44.83 | % | |
Actuant Corp. | | | 17.46 | % | | Gentherm Inc. | | | 14.39 | % | |
Tile Shop Holdings, Inc. | | | 20.48 | % | | Premier Inc. | | | 15.24 | % | |
Weak Relative Performers
| Second Quarter (3/31/18 – 6/30/18) | | Year To Date (12/31/17 – 6/30/18) | |
Oshkosh Corp. | | | -17.47 | % | | Oshkosh Corp. | | | -31.55 | % | |
Bio-Techne Corp. | | | -10.61 | % | | Donaldson Company, Inc. | | | -16.49 | % | |
Badger Meter, Inc. | | | -13.69 | % | | Physicians Realty Trust | | | -18.26 | % | |
Casey's General Stores, Inc. | | | -12.79 | % | | Tile Shop Holdings, Inc. | | | -27.88 | % | |
Donaldson Company, Inc. | | | -8.22 | % | | Casey's General Stores, Inc. | | | -15.06 | % | |
Performance shown is relative to the S&P SmallCap 600 TR Index as of June 30, 2018. Relative return is the difference between the absolute return and the performance of the market, in which the position is held. Relative contribution is used for ranking, which considers average daily weightings for each holding.
27
MAIRS & POWER SMALL CAP FUND (unaudited) (continued)
NVEC is another small local company we invested in a while ago that has recently hit other investors' radar screens. The company makes high-end sensors and couplers that can be used in a variety of applications such as pacemakers, hearing aids, and industrial automation. Now, growing talk of applications for the company's products in electric and hybrid vehicles as well as internet-of-things devices has sparked new investor enthusiasm. The company is also working on a commercial scale food safety system that could be a meaningful future driver of revenue as well.
It is worth mentioning the two other companies that round out the top five contributors in the quarter have been significant underperformers in the recent past, Tile Shop (TTS) and Actuant (ACU). We evaluated the challenges each company was facing, management's efforts to address those issues and closely monitored their progress. As we have written in previous quarterly reports, we have stuck with both names and actually added to our positions in previous quarters. It is both positive to our performance and a validation of our methodical investment process as both Tile Shop and Actuant finally started seeing an improvement in their respective businesses.
One of the stocks negatively impacting performance in the quarter was Oshkosh Corp. (OSK). While their business is as strong as it has ever been, driven by a strong market for aerial lift platforms, concern that steel and other tariffs will have a significant negative impact has hurt the stock. We believe the fears are overdone and have added to our position as we anticipate the company will be able to pass on most of any raw material inflation and they still have room to run in their residential and commercial construction end markets.
One new stock was added in the quarter; Inspire Medical (INSP), a local company with an FDA approved medical device for treatment of sleep apnea. We are excited about the market opportunity for this device as many people are diagnosed with sleep apnea, but a significant percentage are not satisfied with the currently available treatment options, primarily CPAP machines.
In general, we see valuations of growth stocks somewhat stretched and have been taking profits where it makes sense. On another positive note, we are happy to see a couple of recent IPOs (Initial Public Offerings) in our own backyard after a prolonged drought of launches. Two names, a food science leader, Calyxt (CLXT) and the previously mentioned Inspire recently went public, and we are now holders of both companies.
Finally, small cap stocks have rebounded sharply in the first half of the year and have made up significant ground on larger companies as investors, concerned about a trade war, have shifted to companies that are more domestically focused, which describes the great majority of small cap companies. This has moved the relative valuation up a bit compared to larger companies, but the small cap premium still trails its historical average. So, there may be more room to run if the domestic economy continues to look more attractive to investors than the global economy.
Andrew R. Adams
Lead Manager | | Allen D. Steinkopf
Co-Manager | |
The Fund's investment objective, risks, charges and expenses must be considered carefully before investing. The summary prospectus or full prospectus contains this and other important information about the Fund and they may be obtained by calling Shareholder Services at (800) 304-7404 or by visiting www.mairsandpower.com. Read the summary prospectus or full prospectus carefully before investing.
All holdings in the portfolio are subject to change without notice and may or may not represent current or future portfolio composition. The mention of specific securities is not intended as a recommendation or an offer of a particular security, nor is it intended to be a solicitation for the purchase or sale of any security.
All investments have risks. The Small Cap Fund is designed for long-term investors. Equity investments are subject to market fluctuations and the Fund's share price can fall because of weakness in the broad market, a particular industry or specific holdings. Investments in small and midcap companies generally are more volatile. International investing risks include among
28
MAIRS & POWER SMALL CAP FUND (unaudited) (continued)
others political, social or economic instability, difficulty in predicting international trade patterns, taxation and foreign trading practices, and greater fluctuations in price than U.S. corporations. The Fund may invest in initial public offerings by small cap companies, which can involve greater risk than investments in companies that are already publicly traded.
Diversification does not guarantee profit or protect against loss.
S&P 600 Small Cap Total Return (S&P 600) is an index of small company stocks managed by Standard & Poor's that covers a broad range of small cap stocks in the U.S. The index is weighted according to market capitalization and covers about 3-4% of the total market for equities in the U.S. It tracks both the capital gains of a group of stocks over time and assumes that any cash distributions, such as dividends, are reinvested back into the index. It is not possible to invest directly in an index.
Morningstar Small Blend Category, as defined by Morningstar are stocks in the bottom 10% of the capitalization of the U.S. equity market are defined as small cap. The blend style is assigned to portfolios where neither growth nor value characteristics predominate. It is not possible to invest directly in an index.
The Mairs & Power Small Cap Fund is closed to new investors.
29
Mairs & Power Small Cap Fund
PERFORMANCE INFORMATION (unaudited) June 30, 2018
Investment performance since commencement of operations (through June 30, 2018)
This chart illustrates the performance of a hypothetical $10,000 investment made in the Fund since commencement of operations.
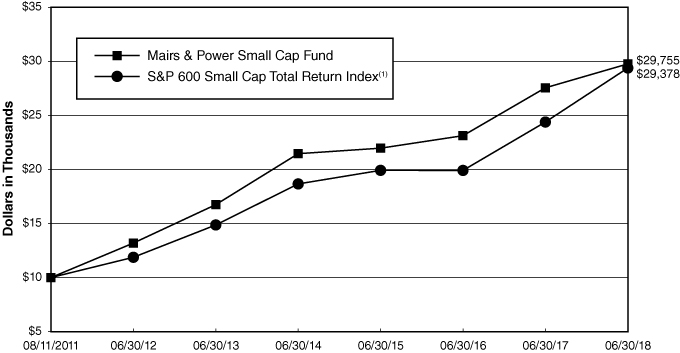
Average annual total returns for periods ended June 30, 2018 _
| | | 1 Year | | 3 Year | | 5 Year | | Since Inception(2) | |
Mairs & Power Small Cap Fund | | | 8.02 | % | | | 10.65 | % | | | 12.19 | % | | | 17.15 | % | |
S&P Small Cap 600 Total Return Index(1) | | | 20.50 | % | | | 13.84 | % | | | 14.60 | % | | | 16.94 | % | |
Performance data quoted represents past performance and does not guarantee future results. All performance information shown includes the reinvestment of dividend and capital gain distributions, but does not reflect the deduction of taxes that a shareholder would pay on Fund distributions or the redemption of Fund shares. The investment return and principal value of an investment will fluctuate so that an investor's shares, when redeemed, may be worth more or less than their original cost. Current performance of the Fund may be lower or higher than the performance quoted. For the most recent month-end performance figures, visit the Fund's website at www.mairsandpower.com or call Shareholder Services at (800) 304-7404.
(1) The S&P Small Cap 600 Total Return Index is an index of small-company stocks managed by Standard & Poor's that covers a broad range of small cap stocks in the U.S. The index is weighted according to market capitalization and covers about 3-4% of the total market for equities in the U.S. It tracks both the capital gains of a group of stocks over time and assumes that any cash distributions, such as dividends, are reinvested back into the index. It is not possible to invest directly in an index.
(2) Since inception performance is as of August 11, 2011, which is the offering date of the Small Cap Fund.
30
Mairs & Power Small Cap Fund
FUND INFORMATION (unaudited) June 30, 2018
Portfolio Managers
Andrew R. Adams, CFA, lead manager since 2011, University of Wisconsin-Madison, MS Finance 1997
Allen D. Steinkopf, CFA, co-manager since January 1, 2015, University of Minnesota, MBA Finance 1986
General Information
Fund Symbol | | MSCFX | |
Net Asset Value (NAV) Per Share | | $ | 26.61 | | |
Expense Ratio | | | 1.04 | %1 | |
Portfolio Turnover Rate (1/1/18 to 6/30/18,
not annualized) | | | 6.78 | % | |
Sales Charge | | | None2 | | |
Fund Inception Year | | | 2011 | | |
Portfolio Composition

Top Ten Portfolio Holdings
(Percent of Total Net Assets) 3
Tennant Co | | | 3.7 | % | |
CoreSite Realty Corp | | | 3.7 | | |
Bio-Techne Corp | | | 3.7 | | |
Apogee Enterprises Inc | | | 3.5 | | |
Great Western Bancorp Inc | | | 3.5 | | |
Glacier Bancorp Inc | | | 3.3 | | |
Cullen/Frost Bankers Inc | | | 3.3 | | |
Catalent Inc | | | 3.2 | | |
Donaldson Co Inc | | | 3.1 | | |
Wintrust Financial Corp | | | 3.1 | | |
Portfolio Diversification
(Percent of Total Net Assets)
Common Stocks 98.5% | |
Industrials | | | 28.6 | % | |
Financials | | | 22.1 | | |
Health Care | | | 12.4 | | |
Information Technology | | | 11.0 | | |
Consumer Discretionary | | | 6.7 | | |
Real Estate | | | 6.6 | | |
Materials | | | 4.1 | | |
Utilities | | | 2.9 | | |
Consumer Staples | | | 2.7 | | |
Energy | | | 1.4 | | |
Short-term Investments 1.5%4 | | | 1.5 | | |
| | | | 100.0 | % | |
1 Ratio has been annualized for the six month period ended June 30, 2018.
2 Although the Fund is no-load, investment management fees and other expenses still apply.
3 All holdings in the portfolio are subject to change without notice and may or may not represent current or future portfolio composition. The mention of specific securities is not intended as a recommendation or offer for a particular security, nor is it intended to be a solicitation for the purchase or sale of any security.
4 Represents short-term investments and other assets and liabilities (net).
The Schedule of Investments and portfolio diversification utilize the Global Industry Classification Standard (GICS®) which was developed by and/or is the exclusive property of MSCI, Inc. and Standard & Poor's Financial Services LLC ("S&P"). GICS is a service mark of MSCI, Inc. and S&P and has been licensed for use by the Adviser.
31
Mairs & Power Small Cap Fund
SCHEDULE OF INVESTMENTS (unaudited) June 30, 2018
Shares | | Security Description | | Fair Value | |
| | | COMMON STOCKS 98.5% | |
| | | CONSUMER DISCRETIONARY 6.7% | |
| | 286,785 | | | Gentherm Inc (a) | | $ | 11,270,650 | | |
| | 300,923 | | | Marcus Corp/The | | | 9,779,998 | | |
| | 981,700 | | | Tile Shop Holdings Inc | | | 7,559,090 | | |
| | | | 28,609,738 | | |
| | | CONSUMER STAPLES 2.7% | |
| | 107,600 | | | Casey's General Stores Inc | | | 11,306,608 | | |
| | | ENERGY 1.4% | |
| | 454,700 | | | Oasis Petroleum Inc (a) | | | 5,897,459 | | |
| | | FINANCIALS 22.1% | |
| | 437,761 | | | Associated Banc-Corp | | | 11,950,875 | | |
| | 127,700 | | | Cullen/Frost Bankers Inc | | | 13,822,248 | | |
| | 193,148 | | | EMC Insurance Group Inc | | | 5,365,652 | | |
| | 363,200 | | | Glacier Bancorp Inc | | | 14,048,576 | | |
| | 354,000 | | | Great Western Bancorp Inc | | | 14,864,460 | | |
| | 89,725 | | | QCR Holdings Inc | | | 4,257,451 | | |
| | 154,215 | | | United Bankshares Inc/WV | | | 5,613,426 | | |
| | 193,312 | | | United Fire Group Inc | | | 10,537,437 | | |
| | 150,900 | | | Wintrust Financial Corp | | | 13,135,845 | | |
| | | | 93,595,970 | | |
| | | HEALTH CARE 12.4% | |
| | 106,100 | | | Bio-Techne Corp | | | 15,697,495 | | |
| | 212,936 | | | Calyxt Inc (a) | | | 3,975,515 | | |
| | 76,815 | | | Cardiovascular Systems Inc (a) | | | 2,484,197 | | |
| | 318,800 | | | Catalent Inc (a) | | | 13,354,532 | | |
| | 116,500 | | | Inspire Medical Systems Inc (a) | | | 4,154,390 | | |
| | 131,300 | | | Patterson Cos Inc | | | 2,976,571 | | |
| | 270,149 | | | Premier Inc (a) | | | 9,828,021 | | |
| | | | 52,470,721 | | |
| | | INDUSTRIALS 28.6% | |
| | 72,400 | | | AAR Corp | | | 3,365,876 | | |
| | 410,212 | | | Actuant Corp | | | 12,039,722 | | |
| | 309,700 | | | Apogee Enterprises Inc | | | 14,918,249 | | |
| | 291,468 | | | Donaldson Co Inc | | | 13,151,036 | | |
| | 189,272 | | | Generac Holdings Inc (a) | | | 9,791,041 | | |
| | 199,400 | | | Graco Inc | | | 9,016,868 | | |
32
Mairs & Power Small Cap Fund
SCHEDULE OF INVESTMENTS (unaudited) (continued) June 30, 2018
Shares | | Security Description | | Fair Value | |
| | | COMMON STOCKS (continued) | |
| | | INDUSTRIALS (continued) | |
| | 185,800 | | | Hub Group Inc, Class A (a) | | $ | 9,252,840 | | |
| | 168,900 | | | Oshkosh Corp | | | 11,877,048 | | |
| | 52,200 | | | Proto Labs Inc (a) | | | 6,209,190 | | |
| | 159,676 | | | Raven Industries Inc | | | 6,139,542 | | |
| | 52,900 | | | Snap-on Inc | | | 8,502,088 | | |
| | 198,943 | | | Tennant Co | | | 15,716,497 | | |
| | 17,300 | | | Toro Co/The | | | 1,042,325 | | |
| | | | 121,022,322 | | |
| | | INFORMATION TECHNOLOGY 11.0% | |
| | 228,165 | | | Badger Meter Inc | | | 10,198,976 | | |
| | 249,240 | | | Cray Inc (a) | | | 6,131,304 | | |
| | 263,500 | | | CyberOptics Corp (a) | | | 4,584,900 | | |
| | 108,093 | | | IntriCon Corp (a) | | | 4,356,148 | | |
| | 25,000 | | | Littelfuse Inc | | | 5,704,500 | | |
| | 70,613 | | | NVE Corp | | | 8,599,251 | | |
| | 16,148 | | | SPS Commerce Inc (a) | | | 1,186,555 | | |
| | 236,980 | | | Workiva Inc (a) | | | 5,782,312 | | |
| | | | 46,543,946 | | |
| | | MATERIALS 4.1% | |
| | 111,300 | | | Bemis Co Inc | | | 4,697,973 | | |
| | 115,136 | | | Hawkins Inc | | | 4,070,057 | | |
| | 162,800 | | | HB Fuller Co | | | 8,739,104 | | |
| | | | 17,507,134 | | |
| | | REAL ESTATE 6.6% | |
| | 141,700 | | | CoreSite Realty Corp | | | 15,703,194 | | |
| | 775,200 | | | Physicians Realty Trust | | | 12,356,688 | | |
| | | | 28,059,882 | | |
| | | UTILITIES 2.9% | |
| | 29,503 | | | ALLETE Inc | | | 2,283,827 | | |
| | 164,300 | | | Black Hills Corp | | | 10,056,803 | | |
| | | | 12,340,630 | | |
| | | | | TOTAL COMMON STOCKS
(cost $316,973,355) | | $ | 417,354,410
| | |
33
Mairs & Power Small Cap Fund
SCHEDULE OF INVESTMENTS (unaudited) (continued) June 30, 2018
Shares | | Security Description | | Fair Value | |
| | | SHORT-TERM INVESTMENTS 1.6% | |
| | 6,603,764 | | | First American Government Obligations Fund, Class Z, 1.80% (b)
(cost $6,603,764) | | $ | 6,603,764
| | |
| | | TOTAL INVESTMENTS 100.1%
(cost $323,577,119) | | $ | 423,958,174
| | |
| | | OTHER ASSETS AND LIABILITIES (NET) (0.1)% | | | (538,234 | ) | |
| | | TOTAL NET ASSETS 100.0% | | $ | 423,419,940 | | |
(a) Non-income producing.
(b) The rate quoted is the annualized seven-day effective yield as of June 30, 2018.
The Global Industry Classification Standard (GICS®) was developed by and/or is the exclusive property of MSCI, Inc. and Standard & Poor's Financial Services LLC ("S&P"). GICS is a service mark of MSCI, Inc. and S&P and has been licensed for use by the Adviser.
See accompanying Notes to Financial Statements.
34
STATEMENTS OF ASSETS AND LIABILITIES (unaudited) June 30, 2018
| | | Mairs & Power
Growth Fund | | Mairs & Power
Balanced Fund | | Mairs & Power
Small Cap Fund | |
ASSETS | |
| Investments, at fair value (Note 1)*: | | $ | 4,346,017,022 | | | $ | 868,842,886 | | | $ | 423,958,174 | | |
Cash | | | - | | | | 19,750 | | | | - | | |
Receivable for Fund shares sold | | | 843,855 | | | | 162,199 | | | | 261,561 | | |
Receivable for securities sold | | | 6,750,597 | | | | 1,869,060 | | | | 486,473 | | |
Dividends and interest receivable | | | 3,689,277 | | | | 3,921,486 | | | | 215,705 | | |
Prepaid expenses and other assets | | | 116,298 | | | | 42,879 | | | | 36,683 | | |
| | | | 4,357,417,049 | | | | 874,858,260 | | | | 424,958,596 | | |
LIABILITIES | |
Payable for Fund shares redeemed | | | 3,121,310 | | | | 2,641,801 | | | | 641,639 | | |
Payable for securities purchased | | | 1,121,372 | | | | - | | | | 466,959 | | |
| Accrued investment management fees (Note 2) | | | 2,000,780 | | | | 424,155 | | | | 308,936 | | |
Accrued Fund administration fees | | | 262,256 | | | | 56,163 | | | | 24,061 | | |
Accrued audit and tax fees | | | 27,669 | | | | 24,386 | | | | 18,667 | | |
Accrued transfer agent fees | | | 338,321 | | | | 63,584 | | | | 36,904 | | |
Other accrued fees | | | 260,674 | | | | 78,784 | | | | 41,490 | | |
| | | | 7,132,382 | | | | 3,288,873 | | | | 1,538,656 | | |
NET ASSETS | | $ | 4,350,284,667 | | | $ | 871,569,387 | | | $ | 423,419,940 | | |
NET ASSETS CONSIST OF | |
Portfolio capital | | $ | 2,324,317,173 | | | $ | 680,009,996 | | | $ | 314,146,241 | | |
Undistributed net investment income | | | 4,451,268 | | | | 615,018 | | | | 1,138,773 | | |
Undistributed net realized gain on investments | | | 110,622,057 | | | | 13,301,050 | | | | 7,753,871 | | |
Net unrealized appreciation on investments | | | 1,910,894,169 | | | | 177,643,323 | | | | 100,381,055 | | |
TOTAL NET ASSETS | | $ | 4,350,284,667 | | | $ | 871,569,387 | | | $ | 423,419,940 | | |
Fund shares, par value | | $ | 0.01 | | | $ | 0.01 | | | $ | 0.01 | | |
Authorized | | | unlimited | | | | unlimited | | | | unlimited | | |
Fund shares issued and outstanding | | | 36,948,655 | | | | 9,629,963 | | | | 15,910,724 | | |
Net asset value per share | | $ | 117.74 | | | $ | 90.51 | | | $ | 26.61 | | |
* Cost of investments | | $ | 2,435,122,853 | | | $ | 691,199,563 | | | $ | 323,577,119 | | |
See accompanying Notes to Financial Statements.
35
STATEMENT OF OPERATIONS (unaudited) Six Months Ended June 30, 2018
| | | Mairs & Power
Growth Fund | | Mairs & Power
Balanced Fund | | Mairs & Power
Small Cap Fund | |
INVESTMENT INCOME | |
Income: | |
Dividends from unaffiliated securities * | | $ | 39,377,477 | | | $ | 6,829,405 | | | $ | 3,217,849 | | |
| Dividends from affiliated securities (Note 5) | | | 520,000 | | | | - | | | | - | | |
Interest income | | | 528,799 | | | | 6,495,149 | | | | 38,828 | | |
TOTAL INCOME | | | 40,426,276 | | | | 13,324,554 | | | | 3,256,677 | | |
Expenses: | |
| Investment management fees (Note 2) | | | 12,513,366 | | | | 2,789,096 | | | | 1,871,802 | | |
Fund administration fees | | | 403,162 | | | | 85,403 | | | | 36,681 | | |
Fund accounting fees | | | 241,298 | | | | 84,881 | | | | 41,347 | | |
| Trustees' fees (Note 2) | | | 125,812 | | | | 26,146 | | | | 11,686 | | |
Transfer agent fees | | | 813,549 | | | | 200,760 | | | | 125,479 | | |
Custodian fees | | | 133,653 | | | | 30,056 | | | | 13,699 | | |
Legal and audit fees | | | 73,124 | | | | 33,402 | | | | 22,372 | | |
Printing and mailing fees | | | 84,245 | | | | 28,006 | | | | 14,949 | | |
Other fees | | | 110,182 | | | | 49,373 | | | | 33,200 | | |
TOTAL EXPENSES | | | 14,498,391 | | | | 3,327,123 | | | | 2,171,215 | | |
NET INVESTMENT INCOME | | | 25,927,885 | | | | 9,997,431 | | | | 1,085,462 | | |
| REALIZED AND UNREALIZED GAIN (LOSS) (Note 4) | |
Net realized gain on investments | |
Unaffiliated issuers | | | 146,031,141 | | | | 13,726,215 | | | | 8,444,863 | | |
| Affiliated issuers (Note 5) | | | 3,702,621 | | | | - | | | | - | | |
| | | | 149,733,762 | | | | 13,726,215 | | | | 8,444,863 | | |
Change in net unrealized appreciation
(depreciation) on investments | |
Unaffiliated issuers | | | (283,353,422 | ) | | | (49,765,304 | ) | | | 10,933,708 | | |
| Affiliated issuers (Note 5) | | | 4,638,067 | | | | - | | | | - | | |
| | | | (278,715,355 | ) | | | (49,765,304 | ) | | | 10,933,708 | | |
NET GAIN (LOSS) ON INVESTMENTS | | | (128,981,593 | ) | | | (36,039,089 | ) | | | 19,378,571 | | |
NET INCREASE (DECREASE) IN NET ASSETS
FROM OPERATIONS | | $ | (103,053,708 | ) | | $ | (26,041,658 | ) | | $ | 20,464,033 | | |
* Net of foreign taxes withheld of: | | $ | 572,982 | | | $ | 89,924 | | | $ | - | | |
See accompanying Notes to Financial Statements.
36
Mairs & Power Growth Fund
STATEMENTS OF CHANGES IN NET ASSETS
| | | Six Months Ended
June 30, 2018
(Unaudited) | | Year Ended
December 31,
2017 | |
OPERATIONS | |
Net investment income | | $ | 25,927,885 | | | $ | 59,569,965 | | |
Net realized gain on investments sold | | | 149,733,762 | | | | 371,311,138 | | |
Net change in unrealized appreciation (depreciation) of investments | | | (278,715,355 | ) | | | 273,018,406 | | |
NET INCREASE (DECREASE) IN NET ASSETS FROM OPERATIONS | | | (103,053,708 | ) | | | 703,899,509 | | |
DISTRIBUTIONS TO SHAREHOLDERS FROM | |
Net investment income | | | (23,928,073 | ) | | | (61,398,855 | ) | |
Net realized gain on investments sold | | | - | | | | (356,488,970 | ) | |
TOTAL DISTRIBUTIONS TO SHAREHOLDERS | | | (23,928,073 | ) | | | (417,887,825 | ) | |
CAPITAL TRANSACTIONS | |
Proceeds from shares sold | | | 128,272,548 | | | | 332,459,406 | | |
Reinvestment of distributions from net investment income and net
realized gains | | | 21,848,349 | | | | 392,161,854 | | |
Cost of shares redeemed | | | (404,010,874 | ) | | | (671,949,109 | ) | |
INCREASE (DECREASE) IN NET ASSETS FROM CAPITAL
TRANSACTIONS | | | (253,889,977 | ) | | | 52,672,151 | | |
TOTAL INCREASE (DECREASE) IN NET ASSETS | | | (380,871,758 | ) | | | 338,683,835 | | |
NET ASSETS | |
Beginning of period | | | 4,731,156,425 | | | | 4,392,472,590 | | |
End of period (including undistributed net investment income of $4,451,268
and $0, respectively) | | $ | 4,350,284,667 | | | $ | 4,731,156,425 | | |
FUND SHARE TRANSACTIONS | |
Shares sold | | | 1,069,291 | | | | 2,751,714 | | |
Shares issued for reinvested distributions | | | 185,879 | | | | 3,232,258 | | |
Shares redeemed | | | (3,368,731 | ) | | | (5,510,724 | ) | |
NET INCREASE (DECREASE) IN FUND SHARES | | | (2,113,561 | ) | | | 473,248 | | |
See accompanying Notes to Financial Statements.
37
Mairs & Power Balanced Fund
STATEMENTS OF CHANGES IN NET ASSETS
| | | Six Months Ended
June 30, 2018
(Unaudited) | | Year Ended
December 31,
2017 | |
OPERATIONS | |
Net investment income | | $ | 9,997,431 | | | $ | 21,218,201 | | |
Net realized gain on investments sold | | | 13,726,215 | | | | 21,065,004 | | |
Net change in unrealized appreciation (depreciation) of investments | | | (49,765,304 | ) | | | 64,015,054 | | |
NET INCREASE (DECREASE) IN NET ASSETS FROM OPERATIONS | | | (26,041,658 | ) | | | 106,298,259 | | |
DISTRIBUTIONS TO SHAREHOLDERS FROM | |
Net investment income | | | (9,726,191 | ) | | | (21,491,676 | ) | |
Net realized gain on investments sold | | | - | | | | (15,460,648 | ) | |
TOTAL DISTRIBUTIONS TO SHAREHOLDERS | | | (9,726,191 | ) | | | (36,952,324 | ) | |
CAPITAL TRANSACTIONS | |
Proceeds from shares sold | | | 45,498,178 | | | | 191,669,011 | | |
Reinvestment of distributions from net investment income and net
realized gains | | | 9,350,788 | | | | 35,764,487 | | |
Cost of shares redeemed | | | (132,299,791 | ) | | | (173,416,913 | ) | |
INCREASE (DECREASE) IN NET ASSETS FROM CAPITAL
TRANSACTIONS | | | (77,450,825 | ) | | | 54,016,585 | | |
TOTAL INCREASE (DECREASE) IN NET ASSETS | | | (113,218,674 | ) | | | 123,362,520 | | |
NET ASSETS | |
Beginning of period | | | 984,788,061 | | | | 861,425,541 | | |
End of period (including undistributed net investment income of $615,018
and $0, respectively) | | $ | 871,569,387 | | | $ | 984,788,061 | | |
FUND SHARE TRANSACTIONS | |
Shares sold | | | 489,173 | | | | 2,125,650 | | |
Shares issued for reinvested distributions | | | 104,095 | | | | 385,666 | | |
Shares redeemed | | | (1,438,855 | ) | | | (1,904,005 | ) | |
NET INCREASE (DECREASE) IN FUND SHARES | | | (845,587 | ) | | | 607,311 | | |
See accompanying Notes to Financial Statements.
38
Mairs & Power Small Cap Fund
STATEMENTS OF CHANGES IN NET ASSETS
| | | Six Months Ended
June 30, 2018
(Unaudited) | | Year Ended
December 31,
2017 | |
OPERATIONS | |
Net investment income | | $ | 1,085,462 | | | $ | 2,081,695 | | |
Net realized gain on investments sold | | | 8,444,863 | | | | 13,347,731 | | |
Net change in unrealized appreciation of investments | | | 10,933,708 | | | | 15,568,831 | | |
NET INCREASE IN NET ASSETS FROM OPERATIONS | | | 20,464,033 | | | | 30,998,257 | | |
DISTRIBUTIONS TO SHAREHOLDERS FROM | |
Net investment income | | | - | | | | (2,239,108 | ) | |
Net realized gain on investments sold | | | - | | | | (12,299,082 | ) | |
TOTAL DISTRIBUTIONS TO SHAREHOLDERS | | | - | | | | (14,538,190 | ) | |
CAPITAL TRANSACTIONS | |
Proceeds from shares sold | | | 32,551,516 | | | | 106,501,120 | | |
Reinvestment of distributions from net investment income and net
realized gains | | | - | | | | 13,896,464 | | |
Cost of shares redeemed | | | (65,102,925 | ) | | | (83,793,304 | ) | |
INCREASE (DECREASE) IN NET ASSETS FROM CAPITAL
TRANSACTIONS | | | (32,551,409 | ) | | | 36,604,280 | | |
TOTAL INCREASE (DECREASE) IN NET ASSETS | | | (12,087,376 | ) | | | 53,064,347 | | |
NET ASSETS | |
Beginning of period | | | 435,507,316 | | | | 382,442,969 | | |
End of period (including undistributed net investment income of $1,138,773
and $0, respectively) | | $ | 423,419,940 | | | $ | 435,507,316 | | |
FUND SHARE TRANSACTIONS | |
Shares sold | | | 1,289,416 | | | | 4,264,177 | | |
Shares issued for reinvested distributions | | | - | | | | 548,833 | | |
Shares redeemed | | | (2,581,634 | ) | | | (3,328,524 | ) | |
NET INCREASE (DECREASE) IN FUND SHARES | | | (1,292,218 | ) | | | 1,484,486 | | |
| * Net of redemption fees of: | | $ | 16,345 | | | $ | 58,709 | | |
See accompanying Notes to Financial Statements.
39
NOTES TO FINANCIAL STATEMENTS (unaudited) June 30, 2018
Note 1 – Organization and Significant Accounting Policies
Mairs & Power Funds Trust (the Trust) is a no-load, diversified, open-end management investment company registered under the Investment Company Act of 1940, as amended (the 1940 Act). Mairs & Power Growth Fund (the Growth Fund), Mairs & Power Balanced Fund (the Balanced Fund) and Mairs & Power Small Cap Fund (the Small Cap Fund) (individually a Fund and collectively the Funds) are series within the Trust. Mairs & Power, Inc. (the Adviser) is the investment adviser of each Fund. The objective of the Growth Fund is to provide shareholders with a diversified portfolio of common stocks, which have the potential for above-average, long-term appreciation. The objective of the Balanced Fund is to provide capital growth, current income and preservation of capital. The objective of the Small Cap Fund is to seek above-average, long-term appreciation. Each Fund is an investment company and accordingly follows the investment company accounting and reporting guidance of the Financial Accounting Standards Board (FASB) Accounting Standard Codification Topic 946 "Financial Services – Investment Companies."
Significant accounting policies of the Funds are as follows:
Security Valuations
Security valuations for each Fund's investments are furnished by independent pricing services that have been approved by the Trust's Board of Trustees (the Board). Investments in listed equity securities are valued at the last quoted sale price on the securities exchange on which such securities are principally traded or at the NASDAQ Official Closing Price if readily available for such securities on each business day. Other equity securities traded in the over-the-counter market and listed equity securities for which no sale was reported on that date are valued at the last quoted bid price. Debt obligations exceeding 60 days to maturity are valued at the bid price furnished by an independent pricing service. Debt obligations with 60 days or less remaining until maturity may be valued at the bid price furnished by an independent pricing service and in certain circumstances may be valued at their amortized cost, which approximates fair value. Pricing service prices for debt obligations are based on various evaluative and matrix-based methodologies and models that use market inputs such as market transactions, dealer quotations, benchmark yields and issuer, industry and economic events. These techniques generally consider overall market conditions and such factors as yields or prices of bonds of comparable quality, type of issue, coupon, maturity and ratings.
Debt securities for which prices are not available from an independent pricing service, but where an active market exists, are valued using market quotations obtained from two or more dealers that make markets in the securities. When market quotations are not readily available, or when the last quoted sale price is not considered representative of the value of the security if it were to be sold on that day, the security will be valued at fair value as determined in good faith by the Fair Value Committee appointed by the Board, pursuant to procedures approved by the Board.
When determining the value of a security, the Fair Value Committee takes into consideration all indications of value that appear relevant under the particular circumstances as well as fundamental analytical data relating to the security, the nature and duration of any restrictions on the disposition of the security, and the forces influencing the market in which the security is purchased or sold in addition to other more specific factors that may be applied on a case-by-case basis. Consequently, the value of the security used by a Fund may differ from a quoted or published price for the same security. Fair value pricing involves subjective judgments and it is possible that the fair value determined for the security is materially different than the value that could be realized upon the sale of that security. As of June 30, 2018, no securities were valued using this method.
Fair Valuation Measurements
The Trust has adopted authoritative fair valuation accounting standards, which establish a definition of fair value and set out a hierarchy for measuring fair value. These standards require additional disclosures about the various inputs and valuation techniques used to develop the measurements of fair value and changes in valuation
40
NOTES TO FINANCIAL STATEMENTS (unaudited) (continued) June 30, 2018
Note 1 – Organization and Significant Accounting Policies (continued)
Fair Valuation Measurements (continued)
techniques and related inputs during the period. These inputs are summarized in the three broad levels listed below:
• Level 1 – Quoted prices in active markets for identical securities.
• Level 2 – Other significant observable inputs (including quoted prices for similar securities, interest rates, prepayment speeds, credit risk, etc.).
• Level 3 – Significant unobservable inputs (including the Funds' own assumptions in determining the fair value of investments).
The inputs or methodologies used for valuing securities are not necessarily an indication of the risk associated with investing in those securities. The following is a summary of the inputs used to value the securities held by each Fund as of June 30, 2018:
| | | Growth Fund | | Balanced Fund | | Small Cap Fund | |
Level 1* | | $ | 4,346,017,022 | | | $ | 589,556,903 | | | $ | 423,958,174 | | |
Level 2** | | | - | | | | 279,285,983 | | | | - | | |
Level 3 | | | - | | | | - | | | | - | | |
Total | | $ | 4,346,017,022 | | | $ | 868,842,886 | | | $ | 423,958,174 | | |
* All Level 1 investments are equity securities (common stocks) and short-term investments.
** All Level 2 investments are fixed income securities.
For detail of securities by major sector classification for the Funds, please refer to the Schedules of Investments.
The Funds had no transfers amongst levels during the period and did not hold any Level 3 investments during the six months ended June 30, 2018.
Security Transactions and Investment Income
Security transactions are recorded on the date on which securities are purchased or sold. Dividend income and corporate action transactions are recorded on the ex-dividend date. Interest income, including the accretion of discounts and amortization of premiums, is recorded on an accrual basis. Premiums and discounts are amortized using the effective interest method. Realized gains and losses are reported on an identified cost basis.
Income Taxes
Each Fund is a "regulated investment company" as defined in Subtitle A, Chapter 1, Subchapter M of the Internal Revenue Code of 1986, as amended (the Code). No provisions have been made for federal income taxes as it is the intention of each Fund to comply with the provisions of the Code applicable to regulated investment companies and to make distributions of income and realized gains sufficient to relieve it from all or substantially all excise and income taxes.
As of June 30, 2018, the Trust did not have any tax positions that did not meet the "more-likely-than-not" threshold of being sustained by the applicable tax authority. Generally, tax authorities can examine all tax returns filed for the last three years.
As of December 31, 2017, none of the Funds had capital loss carryforwards nor did they have any qualified later year losses for federal tax purposes.
41
NOTES TO FINANCIAL STATEMENTS (unaudited) (continued) June 30, 2018
Note 1 – Organization and Significant Accounting Policies (continued)
The preparation of financial statements in conformity with U.S. generally accepted accounting principles (GAAP) requires management to make estimates and assumptions that affect the reported amount of net assets and liabilities and disclosure of contingent assets and liabilities at the date of the financial statements and the reported results of operations during the reporting period. Actual results could differ from those estimates.
In preparing these financial statements, the Funds have evaluated events and transactions for potential recognition or disclosure through the date the financial statements were available to be issued. This evaluation did not result in any subsequent events that necessitated recognition of disclosures.
Expense Allocation
Common expenses incurred by the Trust are allocated among the Funds based on their relative assets. Fund specific expenses are charged directly to the Fund that incurred the expense.
Note 2 – Related-Party Transactions
Investment Management Fees
The Adviser provides investment management and administrative services to the Funds under a written agreement for Investment Counsel Service (the Investment Advisory Agreement) approved by the Board. Pursuant to the Investment Advisory Agreement, the Adviser is paid a monthly fee on average daily net assets at the following rates:
| | | Growth Fund | | Balanced Fund | | Small Cap Fund | |
Up to $2.5 Billion | | | 0.60 | % | | | 0.60 | % | | | 0.90 | % | |
Over $2.5 Billion | | | 0.50 | % | | | 0.60 | % | | | 0.90 | % | |
Trustees' Fees
The Funds pay compensation to the disinterested Trustees of the Trust. The Funds do not pay remuneration to officers or to Trustees who are officers, directors or employees of the Adviser or Trustees who are otherwise "interested persons" of the Trust.
Note 3 – Indemnifications
In the normal course of business, the Trust enters into contracts that contain general indemnifications to other parties. The Trust's maximum exposure under these contracts is unknown as this would involve future claims that may be made against the Trust that have not yet occurred. The Trust expects the risk of loss to be remote.
Note 4 – Distributions Paid, Distributable Earnings and Investment Transactions
Net investment income and net realized capital gains (losses) may differ for financial reporting and tax purposes because of temporary or permanent book/tax differences. To the extent these differences are permanent, reclassifications are made to the appropriate equity accounts in the period that the difference arises.
Distributions to shareholders are determined in accordance with income tax regulations that may differ from GAAP, and due to the timing of the distributions, the fiscal year in which the amounts are distributed may differ from the year that the income or realized gains (losses) were recorded by each Fund.
42
NOTES TO FINANCIAL STATEMENTS (unaudited) (continued) June 30, 2018
Note 4 – Distributions Paid, Distributable Earnings and Investment Transactions (continued)
The tax character of distributions paid during the six months ended June 30, 2018 and year ended December 31, 2017, were as follows:
Six months ended June 30, 2018 | |
Distributions paid from: | | Growth Fund | | Balanced Fund | | Small Cap Fund | |
Ordinary income | | $ | 23,928,073 | | | $ | 9,726,191 | | | $ | - | | |
Long-term capital gains | | | - | | | | - | | | | - | | |
Total distributions paid | | $ | 23,928,073 | | | $ | 9,726,191 | | | $ | - | | |
Year ended December 31, 2017 | |
Distributions paid from: | | Growth Fund | | Balanced Fund | | Small Cap Fund | |
Ordinary income | | $ | 74,645,854 | | | $ | 21,141,023 | | | $ | 2,185,797 | | |
Long-term capital gains | | | 343,241,971 | | | | 15,811,301 | | | | 12,352,393 | | |
Total distributions paid | | $ | 417,887,825 | | | $ | 36,952,324 | | | $ | 14,538,190 | | |
Ordinary income distributions include net short-term capital gains. The Funds are designating as long-term capital gain dividends, pursuant to Section 852(b)(3) of the Code, the amount necessary to reduce the earnings and profits of the Funds related to net capital gain to zero. To the extent necessary to fully distribute such capital gain, the Funds also designate earnings and profits distributed to shareholders on the redemption of shares.
At December 31, 2017, the components of accumulated earnings (losses) on a tax basis were as follows:
| | | Growth Fund | | Balanced Fund | | Small Cap Fund | |
Cost of investments | | $ | 2,525,479,693 | | | $ | 752,892,481 | | | $ | 344,328,020 | | |
Gross unrealized appreciation | | $ | 2,240,110,614 | | | $ | 236,331,664 | | | $ | 100,785,433 | | |
Gross unrealized depreciation | | | (51,292,987 | ) | | | (8,929,281 | ) | | | (11,764,179 | ) | |
Net unrealized appreciation | | $ | 2,188,817,627 | | | $ | 227,402,383 | | | $ | 89,021,254 | | |
Undistributed ordinary income | | $ | - | | | $ | - | | | $ | - | | |
Undistributed long-term capital gains | | | 11,174,066 | | | | 3,341,989 | | | | 2,613,381 | | |
Total distributable earnings | | $ | 11,174,066 | | | $ | 3,341,989 | | | $ | 2,613,381 | | |
Other accumulated earnings | | | - | | | | - | | | | - | | |
Total accumulated earnings | | $ | 2,199,991,693 | | | $ | 230,744,372 | | | $ | 91,634,635 | | |
The difference between book basis and tax basis unrealized appreciation is attributable primarily to the tax deferral of losses on wash sales.
Purchases and sales of investment securities, excluding government securities, short-term securities and temporary cash investments, during the six months ended June 30, 2018 were as follows:
| | | Purchases | | Sales | |
Growth Fund | | $ | 236,463,719 | | | $ | 504,775,787 | | |
Balanced Fund | | | 43,754,671 | | | | 113,703,236 | | |
Small Cap Fund | | | 27,923,786 | | | | 60,577,163 | | |
Purchases and sales of government securities during the six months ended June 30, 2018 were as follows:
| | | Purchases | | Sales | |
Growth Fund | | $ | - | | | $ | - | | |
Balanced Fund | | | 1,000,000 | | | | 1,962,270 | | |
Small Cap Fund | | | - | | | | - | | |
43
NOTES TO FINANCIAL STATEMENTS (unaudited) (continued) June 30, 2018
Note 5 – Transactions With Affiliated Companies
The Growth Fund owned 5% or more of the voting securities of the following company during the six months ended June 30, 2018. As a result, this company is deemed to be an affiliate of the Growth Fund as defined by the 1940 Act. Transactions during the period in this security were as follows:
Growth Fund
| | | Share Activity | | | | | | | | | |
Security Name | | Balance
12/31/17 | | Acquisitions | | Sales | | Balance
6/30/18 | | Dividend
Income | | Fair Value at
6/30/18 | | Realized
Gain | | Change in
Unrealized
Appreciation | |
NVE Corp (1) | | | 270,000 | | | | - | | | | 74,500 | | | | 195,500 | | | $ | 520,000 | | | $ | 23,807,990 | | | $ | 3,702,621 | | | $ | 4,638,067 | | |
(1) Issuer was not an affiliate as of June 30, 2018 due to sales during the period.
44
Mairs & Power Growth Fund
FINANCIAL HIGHLIGHTS
SELECTED DATA AND RATIOS
(for a share outstanding throughout each period)
| | | Six Months
Ended | | Year Ended December 31, | |
| | | June 30, 2018 (1) | | 2017 | | 2016 | | 2015 | | 2014 | | 2013 | |
| | | (unaudited) | | | | | | | | | | | |
Per Share | |
Net asset value, beginning of period | | $ | 121.12 | | | $ | 113.83 | | | $ | 104.44 | | | $ | 116.20 | | | $ | 111.09 | | | $ | 83.95 | | |
Income from investment operations: | |
Net investment income | | | 0.77 | | | | 1.60 | | | | 1.61 | | | | 1.68 | | | | 1.54 | | | | 1.23 | | |
Net realized and unrealized gain (loss) | | | (3.50 | ) | | | 17.16 | | | | 14.43 | | | | (5.17 | ) | | | 7.48 | | | | 28.58 | | |
Total from investment operations | | | (2.73 | ) | | | 18.76 | | | | 16.04 | | | | (3.49 | ) | | | 9.02 | | | | 29.81 | | |
Distributions to shareholders from: | |
Net investment income | | | (0.65 | ) | | | (1.66 | ) | | | (1.61 | ) | | | (1.67 | ) | | | (1.53 | ) | | | (1.23 | ) | |
Net realized gains on investments sold | | | - | | | | (9.81 | ) | | | (5.04 | ) | | | (6.60 | ) | | | (2.38 | ) | | | (1.44 | ) | |
Total distributions | | | (0.65 | ) | | | (11.47 | ) | | | (6.65 | ) | | | (8.27 | ) | | | (3.91 | ) | | | (2.67 | ) | |
Net asset value, end of period | | $ | 117.74 | | | $ | 121.12 | | | $ | 113.83 | | | $ | 104.44 | | | $ | 116.20 | | | $ | 111.09 | | |
Total investment return | | | (2.25 | %) | | | 16.52 | % | | | 15.38 | % | | | (3.07 | %) | | | 8.12 | % | | | 35.64 | % | |
Net assets, end of period, in thousands | | $ | 4,350,285 | | | $ | 4,731,156 | | | $ | 4,392,473 | | | $ | 3,837,264 | | | $ | 4,297,475 | | | $ | 3,964,530 | | |
Ratios/supplemental data: | |
Ratio of expenses to average net assets | | | 0.64 | % | | | 0.64 | % | | | 0.66 | % | | | 0.65 | % | | | 0.65 | % | | | 0.67 | % | |
Ratio of net investment income to average net assets | | | 1.15 | | | | 1.30 | | | | 1.42 | | | | 1.43 | | | | 1.36 | | | | 1.27 | | |
Portfolio turnover rate | | | 5.32 | | | | 8.84 | | | | 10.99 | | | | 9.64 | | | | 6.42 | | | | 3.79 | | |
(1) For the six months ended June 30, 2018, all ratios have been annualized except total investment return and portfolio turnover.
See accompanying Notes to Financial Statements.
45
Mairs & Power Balanced Fund
FINANCIAL HIGHLIGHTS
SELECTED DATA AND RATIOS
(for a share outstanding throughout each period)
| | | Six Months
Ended | | Year Ended December 31, | |
| | | June 30, 2018 (1) | | 2017 | | 2016 | | 2015 | | 2014 | | 2013 | |
| | | (unaudited) | | | | | | | | | | | |
Per Share | |
Net asset value, beginning of period | | $ | 94.01 | | | $ | 87.29 | | | $ | 81.16 | | | $ | 86.79 | | | $ | 82.31 | | | $ | 70.83 | | |
Income from investment operations: | |
Net investment income | | | 1.04 | | | | 2.04 | | | | 1.99 | | | | 2.14 | | | | 1.98 | | | | 1.79 | | |
Net realized and unrealized gain (loss) | | | (3.56 | ) | | | 8.26 | | | | 7.21 | | | | (4.34 | ) | | | 4.59 | | | | 11.58 | | |
Total from investment operations | | | (2.52 | ) | | | 10.30 | | | | 9.20 | | | | (2.20 | ) | | | 6.57 | | | | 13.37 | | |
Distributions to shareholders from: | |
Net investment income | | | (0.98 | ) | | | (2.07 | ) | | | (1.99 | ) | | | (2.13 | ) | | | (2.00 | ) | | | (1.78 | ) | |
Net realized gains on investments sold | | | - | | | | (1.51 | ) | | | (1.08 | ) | | | (1.30 | ) | | | (0.09 | ) | | | (0.11 | ) | |
Total distributions | | | (0.98 | ) | | | (3.58 | ) | | | (3.07 | ) | | | (3.43 | ) | | | (2.09 | ) | | | (1.89 | ) | |
Net asset value, end of period | | $ | 90.51 | | | $ | 94.01 | | | $ | 87.29 | | | $ | 81.16 | | | $ | 86.79 | | | $ | 82.31 | | |
Total investment return | | | (2.67 | )% | | | 11.90 | % | | | 11.42 | % | | | (2.54 | )% | | | 8.04 | % | | | 19.02 | % | |
Net assets, end of period, in thousands | | $ | 871,569 | | | $ | 984,788 | | | $ | 861,426 | | | $ | 667,680 | | | $ | 722,863 | | | $ | 564,315 | | |
Ratios/supplemental data: | |
Ratio of expenses to average net assets | | | 0.72 | % | | | 0.71 | % | | | 0.72 | % | | | 0.73 | % | | | 0.72 | % | | | 0.72 | % | |
Ratio of net investment income to average net assets | | | 2.15 | | | | 2.24 | | | | 2.37 | | | | 2.49 | | | | 2.39 | | | | 2.43 | | |
Portfolio turnover rate | | | 4.91 | | | | 13.13 | | | | 14.10 | | | | 14.05 | | | | 4.53 | | | | 3.02 | | |
(1) For the six months ended June 30, 2018, all ratios have been annualized except total investment return and portfolio turnover.
See accompanying Notes to Financial Statements.
46
Mairs & Power Small Cap Fund
FINANCIAL HIGHLIGHTS
SELECTED DATA AND RATIOS
(for a share outstanding throughout each period)
| | | Six Months
Ended | | Year Ended December 31, | |
| | | June 30, 2018 (1) | | 2017 | | 2016 | | 2015 | | 2014 | | 2013 | |
| | | (unaudited) | | | | | | | | | | | |
Per Share | |
Net asset value, beginning of period | | $ | 25.32 | | | $ | 24.33 | | | $ | 19.48 | | | $ | 20.67 | | | $ | 19.78 | | | $ | 14.49 | | |
Income from investment operations: | |
Net investment income | | | 0.07 | | | | 0.13 | | | | 0.08 | | | | 0.08 | | | | 0.08 | | | | 0.06 | | |
Net realized and unrealized gain (loss) | | | 1.22 | | | | 1.73 | | | | 5.24 | | | | (1.04 | ) | | | 1.25 | | | | 5.56 | | |
Total from investment operations | | | 1.29 | | | | 1.86 | | | | 5.32 | | | | (0.96 | ) | | | 1.33 | | | | 5.62 | | |
Distributions to shareholders from: | |
Net investment income | | | - | | | | (0.13 | ) | | | (0.08 | ) | | | (0.08 | ) | | | (0.07 | ) | | | (0.06 | ) | |
Net realized gains on investments sold | | | - | | | | (0.74 | ) | | | (0.39 | ) | | | (0.15 | ) | | | (0.37 | ) | | | (0.27 | ) | |
Redemption fees(2) | | | (0.00 | )(3) | | | (0.00 | )(3) | | | (0.00 | )(3) | | | (0.00 | )(3) | | | (0.00 | )(3) | | | (0.00 | )(3) | |
Total distributions | | | - | | | | (0.87 | ) | | | (0.47 | ) | | | (0.23 | ) | | | (0.44 | ) | | | (0.33 | ) | |
Net asset value, end of period | | $ | 26.61 | | | $ | 25.32 | | | $ | 24.33 | | | $ | 19.48 | | | $ | 20.67 | | | $ | 19.78 | | |
Total investment return | | | 5.09 | % | | | 7.64 | % | | | 27.27 | % | | | (4.68 | )% | | | 6.73 | % | | | 38.75 | % | |
Net assets, end of period, in thousands | | $ | 423,420 | | | $ | 435,507 | | | $ | 382,443 | | | $ | 193,837 | | | $ | 162,230 | | | $ | 111,486 | | |
Ratios/supplemental data: | |
Ratio of expenses to average net assets | | | 1.04 | % | | | 1.04 | % | | | 1.05 | % | | | 1.06 | % | | | 1.07 | % | | | 1.17 | % | |
Ratio of net investment income to average net assets | | | 0.52 | | | | 0.48 | | | | 0.48 | | | | 0.43 | | | | 0.43 | | | | 0.37 | | |
Portfolio turnover rate | | | 6.78 | | | | 19.27 | | | | 21.26 | | | | 23.27 | | | | 15.85 | | | | 34.91 | | |
(1) For the six months ended June 30, 2018, all ratios have been annualized except total investment return and portfolio turnover.
(2) The Fund charges a 1.00% redemption fee on shares held 180 days or less.
(3) Amount per share is less than $0.005.
See accompanying Notes to Financial Statements.
47
FUND EXPENSES (unaudited)
As a shareholder of the Funds, you incur two types of costs: (1) transaction costs including redemption fees and (2) ongoing expenses for the operation of the Funds (e.g., asset-based charges, such as investment management fees). The Funds are "no-load" mutual funds. As a result, shareholders pay no commissions, fees, or expenses associated with sales representatives or sales charges.
This example is intended to help you understand your ongoing costs (in dollars) of investing in the Funds and to compare these costs with the ongoing costs of investing in other mutual funds. The table below reports the Funds' expenses during the period January 1, 2018 through June 30, 2018 and includes the costs associated with a $1,000 investment.
Actual Expenses
The first line in the tables below may be used to estimate the actual expenses you paid over the reporting period. You can do this by dividing your account value by $1,000 and multiplying the result by the expense shown in the table below. For example, if your account value is $8,600, divided by $1,000 = $8.60. Multiply the result by the number in the first line under the heading entitled "Expenses Paid During Period." By doing this you can estimate the expenses you paid on your account during this period.
Hypothetical Example
The second line of the tables below provides information about hypothetical account values and hypothetical expenses based on the Funds' actual expenses and assumed returns of 5% per year before expenses, which are not the Funds' actual returns. The results may be used to provide you with a basis for comparing the ongoing costs of investing in the Funds with the ongoing costs of investing in other funds. To do so, compare these 5% hypothetical examples with the 5% hypothetical examples that appear in the shareholder reports of other funds. Please note that these hypothetical examples highlight ongoing costs only. They may not be used to estimate the actual ending account balances or expenses you paid during the period and will not help you determine the relative total costs of owning different funds.
Mairs & Power Growth Fund
| | | Beginning Account
Value 01/01/2018 | | Ending Account
Value 06/30/2018 | | Expenses Paid
During Period * | |
Actual return | | $ | 1,000.00 | | | $ | 977.50 | | | $ | 3.14 | | |
Hypothetical assumed 5% return | | $ | 1,000.00 | | | $ | 1,021.62 | | | $ | 3.21 | | |
* The Fund's expenses are equal to the Fund's annualized expense ratio for the most recent six-month period of 0.64%, multiplied by the average account value over the Fund's first fiscal half-year, multiplied by the number of days in the Fund's first fiscal half-year (181 days), divided by 365 days.
Mairs & Power Balanced Fund
| | | Beginning Account
Value 01/01/2018 | | Ending Account
Value 06/30/2018 | | Expenses Paid
During Period * | |
Actual return | | $ | 1,000.00 | | | $ | 973.30 | | | $ | 3.52 | | |
Hypothetical assumed 5% return | | $ | 1,000.00 | | | $ | 1,021.22 | | | $ | 3.61 | | |
* The Fund's expenses are equal to the Fund's annualized expense ratio for the most recent six-month period of 0.72%, multiplied by the average account value over the Fund's first fiscal half-year, multiplied by the number of days in the Fund's first fiscal half-year (181 days), divided by 365 days.
48
FUND EXPENSES (unaudited) (continued)
Mairs & Power Small Cap Fund
| | | Beginning Account
Value 01/01/2018 | | Ending Account
Value 06/30/2018 | | Expenses Paid
During Period * | |
Actual return | | $ | 1,000.00 | | | $ | 1,050.90 | | | $ | 5.29 | | |
Hypothetical assumed 5% return | | $ | 1,000.00 | | | $ | 1,019.64 | | | $ | 5.21 | | |
* The Fund's expenses are equal to the Fund's annualized expense ratio for the most recent six-month period of 1.04%, multiplied by the average account value over the Fund's first fiscal half-year, multiplied by the number of days in the Fund's first fiscal half-year (181 days), divided by 365 days.
49
Proxy Voting Policies and Procedures that the Trust uses to determine how to vote proxies relating to portfolio securities are available (i) without charge, upon request, by calling Shareholder Services at (800) 304-7404 and requesting a copy of the Statement of Additional Information (SAI) and (ii) on the Securities and Exchange Commission's (SEC's) website at www.sec.gov (access Form N-1A).
Information on how the Trust voted proxies relating to portfolio securities during the most recent 12-month period ended June 30 is available at www.mairsandpower.com and on the SEC's website at www.sec.gov.
DISCLOSURE OF PORTFOLIO HOLDINGS (unaudited)
The Trust files a complete schedule of portfolio holdings on Form N-Q for the first and third quarter-ends and on Form N-CSR for the second and fourth quarter-ends with the SEC. The Trust's Forms N-Q and N-CSR are available on the SEC's website at www.sec.gov. Forms N-Q and N-CSR may also be reviewed and copied at the SEC's Public Reference Room in Washington, D.C. Information on the operation of the Public Reference Room may be obtained by calling (800) SEC-0330.
The schedule of portfolio holdings is also printed in the Trust's semi-annual and annual reports to shareholders, which are available without charge by calling Shareholder Services at (800) 304-7404 or by visiting www.mairsandpower.com.
A complete copy of the Trust's portfolio holdings will also be available on or about 15 days following each quarter-end on the Fund's website at www.mairsandpower.com.
2018 BOARD APPROVAL OF INVESTMENT ADVISORY AGREEMENT (unaudited)
The Board of Trustees (the Board) of Mairs & Power Funds Trust (the Trust), including the Trustees who are not "interested persons" of the Trust for purposes of the Investment Company Act of 1940, as amended (the Independent Trustees), unanimously approved the renewal of the Agreement for Investment Counsel Service (the Investment Advisory Agreement) between the Trust on behalf of the Mairs & Power Growth Fund (the Growth Fund), the Mairs & Power Balanced Fund (the Balanced Fund) and the Mairs & Power Small Cap Fund (the Small Cap Fund) (each, a Fund and together, the Funds) and Mairs & Power, Inc. (the Adviser) at a meeting of the Board held on May 17, 2018. In evaluating the Investment Advisory Agreement, the Trustees took into account their cumulative experience with the Adviser and their ongoing review of the Funds and discussions with the Funds' portfolio managers and officers at meetings throughout the year. The Trustees also considered information provided at quarterly meetings of the Board throughout the year regarding the nature, extent and quality of services provided by the Adviser, the performance of the Funds, brokerage and trading, Fund expenses, compliance issues and other matters.
In preparation for the May 17, 2018 meeting, the Adviser provided the Trustees with extensive materials that were relevant to the Trustees' consideration of the Investment Advisory Agreement, including performance assessments for each Fund against the respective peer group and benchmark index, comparative fee and expense information and information about the Adviser's compliance program, personnel and financial condition. The Board was also provided with the Adviser's narrative responses to the Section 15(c) request submitted by the Trust's legal counsel on behalf of the Trustees. The Board also reviewed a memorandum prepared by the Trust's legal counsel regarding the Board's responsibilities in evaluating the Investment Advisory Agreement.
As part of their discussion at the May 17 meeting, the Independent Trustees discussed the materials and the proposed renewal of the Investment Advisory Agreement in executive session with legal counsel present, but with no representatives of the Adviser present. In reaching their decision to renew the Investment Advisory Agreement with the Adviser, the Trustees considered all factors they believed to be relevant, including the factors below, and
50
2018 BOARD APPROVAL OF INVESTMENT ADVISORY AGREEMENT(unaudited) (continued)
made the following conclusions. In their deliberations, the Trustees did not identify any single factor as determinative.
Nature, Extent and Quality of Services
With respect to the quality and extent of the Adviser's services provided to the Funds, the Trustees noted each Fund's performance record, as discussed in more detail below under "Investment Performance." The Trustees considered the Adviser's experience as an investment adviser, the investments it has made in the advisory business, including the hiring of new personnel who help support the Funds, and the services it would continue to provide the Funds and their shareholders under the Investment Advisory Agreement. The Trustees noted recent leadership changes as a result of long-term succession planning by the Adviser, which were well executed without any impact on the services provided to the Funds. The Trustees considered the Adviser's disciplined investment decision-making process, including its emphasis on companies located in the Upper Midwest and the Durable Competitive Advantage analysis performed to identify companies with sustainable long-term growth. The Trustees also took into account the Adviser's distribution strategy, the Adviser's risk management system and results of the most recent compliance review. The Trustees considered administrative services provided by the Adviser under the Investment Advisory Agreement, such as the provision of office space and Fund officers, operational support, compliance services, service provider oversight and general fund management. They noted that the Adviser has added resources to the Funds' compliance and risk management functions. The Trustees concluded that they were satisfied with the nature, extent and quality of services provided by the Adviser under the Investment Advisory Agreement.
Investment Performance
In reviewing each Fund's performance, the Trustees considered the information provided in connection with the May 17, 2018 Board meeting, noting that they also receive detailed performance information at each regular Board meeting during the year as well as an in depth review of prior year performance and risk metrics for the Funds at the first quarter meeting. At the May 17, 2018 meeting, the Trustees considered the investment results for the Funds compared to 1) mutual funds in each Fund's Morningstar category; 2) a representative peer group of funds with similar investment objectives and strategies, as determined by the Adviser; and 3) each Fund's respective performance benchmark. With respect to the Growth Fund and the Balanced Fund, the Trustees reviewed comparative performance information for the one-, three-, five-, ten-year and, with respect to the benchmark index, since-inception periods ended December 31, 2017. The Trustees noted that the performance of the Growth Fund trailed the Morningstar category average return and the S&P 500 benchmark return for the one- and three-year periods, was in line with the Morningstar category average return but trailed the S&P 500 benchmark return for the five-year period, exceeded the Morningstar category average and the S&P 500 return for the ten-year period and exceeded the S&P 500 return for the since-inception period beginning in 1958. The Growth Fund's returns trailed the peer group average for the one-year period but exceeded the peer group average for the three-, five- and ten-year periods.
The Balanced Fund's performance trailed the average return of the peer group, Morningstar category and composite index for the one-year period and was in line with the peer group average for the three-year and five-year periods. The Balanced Fund exceeded the Morningstar average for the three-year and five-year periods but trailed the composite index for the three-year and five-year periods. The Balanced Fund exceeded the peer group, Morningstar category average and composite index for the ten-year period and was in line with the composite index return for the since inception period, beginning in 1961.
With respect to the Small Cap Fund, the Trustees reviewed comparative performance information for the one-year, three-year, five-year and, with respect to the S&P 600 index, the since-inception periods ended December 31, 2017. The Trustees noted that the Small Cap Fund's performance trailed its peer group average, Morningstar category average and benchmark for the one-year period, the Fund outperformed the peer group index and Morningstar
51
2018 BOARD APPROVAL OF INVESTMENT ADVISORY AGREEMENT(unaudited) (continued)
category for the three-year and five-year periods but underperformed the S&P 600 benchmark return for these periods. The Fund outperformed the benchmark index for the since-inception period beginning in 2011.
The Trustees observed that while the Funds have had periods of underperformance, the Funds have good absolute and relative performance over longer time periods. They discussed the reasons for the underperformance with representatives of the Adviser. The Trustees believe that the Adviser's long term philosophy of investing in strong, predominantly Midwestern companies with a Durable Competitive Advantage should produce more favorable results for shareholders in the long term. The Trustees concluded, in the context of their full deliberations, that the Funds' performance results were sufficient to support the renewal of the Investment Advisory Agreement.
Management Fees
In evaluating the level of the management fees paid to the Adviser, the Trustees considered both the amount of the fees and the overall expenses of the Funds compared to those of other similar mutual funds, both as compared to (1) the Morningstar category and (2) a smaller group of funds with a similar expense structure and distribution channels (the "Morningstar Distribution Group"), as well as the quality and quantity of advisory and other services provided by the Adviser under the Investment Advisory Agreement. The Trustees noted that the net management fee paid to the Adviser by the Growth Fund was the same as the average fee for the Large Blend Morningstar category, below the Morningstar Distribution Group average, and below the average fee for the peer group of competitive funds identified by the Adviser. The Trustees noted that the management fee for the Balanced Fund was above the category average for all funds in its Morningstar category (50% to 70% Equity) and above the average for the Morningstar Distribution Group but slightly below the peer group average. Additionally, the Trustees noted that the Growth Fund's and Balanced Fund's total expense ratios were well below the average total expense ratios of funds in their Morningstar category and Morningstar Distribution Group and the average expenses of competitive funds identified by the Adviser. With respect to the Small Cap Fund, the Trustees noted that while the management fee was above the Morningstar category and Morningstar Distribution Group averages, the management fee was below the peer group average and the Fund's total expense ratio was below the Morningstar category, Morningstar Distribution Group and peer group averages. In addition, the Trustees observed that the Funds' operating expenses have historically been very low in comparison to similar funds, which is meaningful to shareholders.
The Trustees then reviewed the fees the Adviser charges its non-mutual fund advisory clients, including retirement funds, other institutional clients and individuals (Advisory Clients) with investment objectives similar to those of the Growth Fund and Balanced Fund. The Adviser provided the Trustees with information about the fee schedule for Advisory Clients and discussed the differences in the scope of services provided to its Advisory Clients compared with the scope of those it provides to the Funds. In addition, the Trustees reviewed the investment advisory fee charged to an institutional client of the Adviser for sub-advisory services in the small-cap mandate. The Trustees noted that the Adviser provides certain resources and services to the Funds that are not provided to Advisory Clients and the sub-advised account, such as office facilities, Fund officers and other administrative services. In addition, the level of investment decision-making is generally higher with respect to the Funds because cash flows result in purchase and sale decisions made by the Adviser almost every trading day. Having considered all of these factors, the Trustees concluded that each Fund's management fee is fair and reasonable for the services provided.
Costs of Services Provided and Profitability to the Adviser
The Trustees reviewed information regarding the Adviser's profitability from its relationship with the Growth, Balanced and Small Cap Funds over the past two calendar years. The Trustees reviewed the Adviser's financial assumptions and methods of expense allocation used. The Trustees noted that the Adviser provides administrative services to the Funds that were previously provided under the Fund Administration Servicing Agreement, at no extra cost to the Funds. The Trustees reaffirmed their belief that the Adviser should be entitled to earn a reasonable level of profit for the services it provides to the Funds. Based on their review, the Trustees concluded that the Adviser's level of profitability from its relationship with each Fund is reasonable. The Trustees also reviewed the Adviser's financial condition and determined it to be sound.
52
2018 BOARD APPROVAL OF INVESTMENT ADVISORY AGREEMENT(unaudited) (continued)
Other Benefits
The Trustees considered the benefits to the Adviser from soft dollar arrangements whereby the Adviser receives proprietary investment research services from broker-dealers that execute the Funds' purchases and sales of securities, including invitations to conferences, meetings with company management and general research. The Trustees considered that the research services received from broker-dealers are used to service all accounts that invest in equity securities and that the Adviser's Advisory Clients benefit from access to and research obtained from brokers executing trades on behalf of the Funds. While difficult to measure, the Trustees concluded that the benefits the Adviser receives are fairly modest, given the Funds' relatively low portfolio turnover rates and the research capability that the Adviser itself maintains. The Trustees noted that the Adviser derives reputational benefits from its association with the Funds as well. The Trustees concluded that the other benefits realized by the Adviser from its relationship with the Funds were reasonable.
Economies of Scale
The Trustees reviewed the extent to which economies of scale may be realized as the Funds increase in size. The Trustees considered the asset levels in each of the Funds. The Trustees noted that the Adviser's approach has been to keep the Funds' total expenses as low as reasonably possible, including management fee levels. In order to provide an "economies of scale" benefit to shareholders of the Growth Fund, the Adviser previously had established a breakpoint at the $2.5 billion asset level under the Investment Advisory Agreement for the Growth Fund. The breakpoint reduces the management fee applicable to assets managed in excess of $2.5 billion from 60 basis points (0.6 of 1%) to 50 basis points (0.5 of 1%). The Trustees reaffirmed their conclusion that establishing this breakpoint at $2.5 billion forms a reasonable basis for having management fee levels reflect economies of scale for the benefit of Growth Fund shareholders. The Trustees agreed with the Adviser's view that the consideration of establishing a breakpoint at certain asset levels would be an appropriate way for the Adviser to share its economies of scale at some point in the future, in the event that the Balanced Fund continues to increase in size. The Trustees considered the Adviser's commitment to consider such a breakpoint in the future. The Trustees noted that the Small Cap Fund has implemented a soft close and the Adviser is closely monitoring flows into the Fund, but the Adviser does not believe that a breakpoint is appropriate given the Fund's current size. Considering their current level of assets, the Trustees concluded that the absence of breakpoints in the management fee for the Balanced Fund and Small Cap Fund is reasonable at this time.
On the basis of its review of the foregoing information, the Board found that the terms of the Investment Advisory Agreement were fair and reasonable and in the best interests of each Fund's shareholders.
HOUSEHOLDING (unaudited)
In an effort to decrease costs, the Trust intends to reduce the number of duplicate Summary Prospectuses and Annual and Semi-Annual Reports you receive by sending only one copy of each to those addresses shared by two or more accounts and to shareholders reasonably believed to be from the same family or household. Once implemented, if you would like to discontinue householding for your accounts, please call Shareholder Services at (800) 304-7404 to request individual copies of these documents. Once notification to stop householding is received, the Trust will begin sending individual copies thirty days after receiving your request. This policy does not apply to account statements.
eDelivery is available to all direct shareholders. eDelivery provides your tax statements, account statements and trade confirmation statements online rather than by regular mail. In addition to reducing paper waste, eDelivery may reduce your Fund fees by lowering printing and mailing costs over time. To receive materials electronically, please contact Shareholder Servicing at (800) 304-7404 or visit www.mairsandpower.com to sign up for eDelivery. If you hold your Fund shares through a Financial Intermediary, please contact your Financial Intermediary regarding electronic delivery options.
53
PRIVACY POLICY NOTICE (unaudited)
Our Promise to You
As a shareholder of the Mairs & Power Mutual Funds (Funds), you share both personal and financial information with us. Your privacy is important to us, and we are dedicated to safeguarding your personal and financial information.
Information Provided by Shareholders
In the normal course of doing business, we typically obtain the following non-public personal information about our shareholders:
• Personal information regarding our shareholders' identity such as name, address and social security number;
• Information regarding fund transactions effected by us; and
• Shareholder financial information such as net-worth, assets, income, bank account information and account balances.
How We Manage and Protect Your Personal Information
We do not sell information about current or former shareholders to third parties, nor is it our practice to disclose such information to third parties unless requested or permitted to do so by a shareholder or shareholder representative or, if necessary, in order to process a transaction, service an account or as permitted by law. Additionally, we may share information with outside companies that perform administrative services for us. However, our arrangements with these service providers require them to treat your information as confidential.
In order to protect your personal information, we maintain physical, electronic and procedural safeguards to protect your personal information. Our Privacy Policy restricts the use of shareholder information and requires that it be held in strict confidence.
Shareholder Notifications
We provide a notice annually describing our privacy policy. In addition, we will inform you promptly if there are changes to our policy. Please contact us at (800) 304-7404 with questions about this notice.
OTHER INFORMATION (unaudited)
This report is submitted for the general information of the shareholders of the Funds. It is not authorized for distribution to prospective investors unless accompanied or preceded by an effective prospectus. An investor should consider the Funds' investment objectives, risks and expenses carefully before investing or sending money. This and other important information can be found in the Funds' summary prospectuses and full prospectus. To obtain a prospectus, please call Shareholder Services at (800) 304-7404 or visit the Funds' website at www.mairsandpower.com. Please read the prospectus carefully before investing.
This report includes forward-looking statements such as economic predictions and portfolio manager opinions. The statements are subject to change at any time based on market and other conditions. No predictions, forecasts, outlooks, expectations or beliefs are guaranteed.
54
MAIRS & POWER FUNDS TRUST
Mairs & Power Growth Fund, established 1958
Mairs & Power Balanced Fund, established 1961
Mairs & Power Small Cap Fund, established 2011
A No-Load Funds Trust
For Shareholder Services
Call (800) 304-7404
Or write to:
(via Regular Mail)
c/o U.S. Bancorp Fund Services, LLC
615 East Michigan Street
P. O. Box 701
Milwaukee, WI 53201-0701 | | (via Overnight or Express Mail)
c/o U.S. Bancorp Fund Services, LLC
3rd Floor
615 East Michigan Street
Milwaukee, WI 53202-0701 | |
For Fund literature and information, visit the Trust's website at:
www.mairsandpower.com
Investment Manager
Mairs & Power, Inc.
W1520 First National Bank Building
332 Minnesota Street
Saint Paul, MN 55101
Custodian
U.S. Bank, N.A.
Custody Operations
1555 North River Center Drive, Suite 302
Milwaukee, WI 53212
Distributor
ALPS Distributors, Inc.
1290 Broadway, Suite 1100
Denver, CO 80203
Mairs & Power Funds Trust
c/o U.S. Bancorp Fund Services, LLC
3rd Floor
615 East Michigan Street
Milwaukee, WI 53202-0701
Item 2. Code of Ethics.
Not applicable for semi-annual reports.
Item 3. Audit Committee Financial Expert.
Not applicable for semi-annual reports.
Item 4. Principal Accountant Fees and Services.
Not applicable for semi-annual reports.
Item 5. Audit Committee of Listed Registrants.
Not applicable to registrant.
Item 6. Investments.
(a) Schedule of Investments is included as part of the report to shareholders filed under Item 1 of this Form
(b) Not Applicable.
Item 7. Disclosure of Proxy Voting Policies and Procedures for Closed-End Management Investment Companies.
Not applicable to open-end investment companies.
Item 8. Portfolio Managers of Closed-End Management Investment Companies.
Not applicable to open-end investment companies.
Item 9. Purchases of Equity Securities by Closed-End Management Investment Company and Affiliated Purchasers.
Not applicable to open-end investment companies.
Item 10. Submission of Matters to a Vote of Security Holders.
There has been no material change to the procedures by which shareholders may recommend nominees to the registrant’s board of trustees.
Item 11. Controls and Procedures.
(a) The registrant’s principal executive officer and principal financial officer have evaluated the registrant’s disclosure controls and procedures as of a date within 90 days of the filing of this report and have concluded that the registrant’s disclosure controls and procedures were effective, as of that date, in ensuring that information required to be disclosed by the registrant in this Form N-CSR was recorded, processed, summarized and reported within the time period specified by the SEC’s rules and forms.
(b) There were no changes in the Registrant’s internal control over financial reporting (as defined in Rule 30a-3(d) under the Act) that occurred during the second fiscal quarter of the period covered by this report that has materially affected, or is reasonably likely to materially affect, the Registrant’s internal control over financial reporting.
Item 12. Disclosure of Securities Lending Activities for Closed-End Management Investment Companies
Not applicable to open-end investment companies.
Item 13. Exhibits.
(a) (1) Code of Ethics
Mairs & Power Funds Trust Code of Ethics for Principal Executive Officer and Principal Financial Officer.
Filed herewith.
(2) Certifications required by Rule 30a-2(a) under the Investment Company Act of 1940.
Attached as exhibits 12(a)(2).1 and 12(a)(2).2 to this form.
(3) Any written solicitation to purchase securities under Rule 23c-1 under the Act sent or given during the period covered by the report by or on behalf of the registrant to 10 or more persons. Not applicable to open-end investment companies.
(b) Certifications pursuant to Section 906 of the Sarbanes-Oxley Act of 2002.
Attached as exhibit 12(b) to this form.
2
SIGNATURES
Pursuant to the requirements of the Securities Exchange Act of 1934 and the Investment Company Act of 1940, the registrant has duly caused this report to be signed on its behalf by the undersigned, thereunto duly authorized.
(Registrant) | Mairs & Power Funds Trust | |
| | |
By (Signature and Title)* | /s/ Mark L. Henneman | |
| Mark L. Henneman, President | |
| Principal Executive Officer | |
| | |
Date | 8/31/18 | | |
| | | | | |
Pursuant to the requirements of the Securities Exchange Act of 1934 and the Investment Company Act of 1940, this report has been signed below by the following persons on behalf of the registrant and in the capacities and on the dates indicated.
By (Signature and Title)* | /s/ Mark L. Henneman | |
| Mark L. Henneman, President | |
| Principal Executive Officer | |
| | |
Date | 8/31/18 | | |
| | | | |
By (Signature and Title)* | /s/ Andrea C. Stimmel | |
| Andrea C. Stimmel, Treasurer | |
| Principal Financial Officer | |
| | |
Date | 8/31/18 | | |
| | | | |
* Print the name and title of each signing officer under his or her signature.
3