UNITED STATES
SECURITIES AND EXCHANGE COMMISSION
Washington, D.C. 20549
FORM N-CSR
CERTIFIED SHAREHOLDER REPORT OF REGISTERED
MANAGEMENT INVESTMENT COMPANIES
Investment Company Act file number | 811-22563 |
|
Mairs & Power Funds Trust |
(Exact name of registrant as specified in charter) |
|
332 Minnesota Street, Suite W1520, St. Paul, MN | | 55101 |
(Address of principal executive offices) | | (Zip code) |
|
Andrea C. Stimmel, Chief Compliance Officer & Treasurer, 332 Minnesota Street, Suite
W1520, St. Paul, MN 55101 |
(Name and address of agent for service) |
|
Registrant’s telephone number, including area code: | 651-222-8478 | |
|
Date of fiscal year end: | December 31, 2016 | |
|
Date of reporting period: | June 30, 2016 | |
| | | | | | | | |
Item 1. Reports to Stockholders.

Investing for the long-term
SEMI-ANNUAL REPORT
JUNE 30, 2016
- GROWTH FUND (MPGFX)
est. 1958
- BALANCED FUND (MAPOX)
est. 1961
- SMALL CAP FUND (MSCFX)
est. 2011
Mairs & Power W1520 First National Bank Building, 332 Minnesota Street, St. Paul, Minnesota 55101 www.mairsandpower.com
MAIRS & POWER FUNDS MARKET COMMENTARY (unaudited)
June 30, 2016
Market Overview
The market turned a page at the start of the year and we are seeing a very different story play out compared to a year ago. In 2015, the consumer sectors were the only parts of the economy that seemed to work for investors as the market struggled with the impacts of a rapid fall in oil prices and rapid rise of the dollar against most foreign currencies, hurting the energy sector and export-oriented industrial companies in particular.
With those rapid and dramatic price adjustments now behind us, both factors are neutral to slight tailwinds on a year-over-year basis. In addition, the first half of 2016 saw broad participation across most sectors accompanied by encouraging signs of accelerating economic growth. In the second quarter of this year, forecasted Gross Domestic Product (GDP) growth was revised upward from 0.8% to an annual rate approaching 3%. The services sector remained fairly strong in the second quarter and continues to be the primary driver of economic growth. Industrial and materials sector stocks, having risen sharply in the first quarter as the market anticipated manufacturers would begin to feel less headwind from the strong dollar, continued to benefit from positive economic news. Toward the end of the second quarter, a survey of manufacturers reported new orders grew for the fifth consecutive month, the best streak for this survey since last summer. In addition, the composite Purchasing Managers' Index (PMI), which measures several manufacturing indicators, including employment, inventories, orders, and production, was also up. It looks like the worst of the manufacturing slowdown is behind us.
The consumer side of the economy delivered mixed signals, however. Weaker than expected job growth in May and continued moderate wage growth put a damper on consumer spending expectations as stocks in the consumer discretionary sector remained weak. On the other hand, housing remained surprisingly strong, mortgage applications were well ahead of expectations, auto sales remain at all-time highs and retail sales were robust.
The decision by British voters on June 23rd to leave the European Union within two years caused a sharp two day decline in the U.S. market with the S&P 500 down more than 5%. It was followed by a quick recovery that brought the market nearly back to the level where the decline started and up 2% for the quarter. The Federal Reserve once again took a pass on raising interest rates as the negative interest rates in Europe and Japan on over $9 trillion in government issued debt are beginning to spill into our fixed income markets. As the market searches for yield, the overall corporate bond market has been strong, with longer maturity instruments outperforming equities in the quarter.
Outlook
A look at valuations indicates a market that, while not overpriced, is near its long-term average based on dividend yield and is slightly above its long-term average on a forward price per earnings (P/E) ratio. The market has been strong the first six months, and while we remain positive on equities for the long run, we may be entering a period of lower returns in the near-term. In this environment, stock selection is increasingly important and we continue to find plenty of stock positions worth adding to.
The historic Brexit vote has added a degree of uncertainty and volatility to the market but the ultimate outcome and impacts are unknown. While the British pound weakened after the vote, the Euro has come back near its pre-Brexit vote level. The biggest potential currency risk we see would result from Japan attempting to generate growth by devaluing the yen relative to the dollar which would potentially impact companies that compete against Japanese exporters. We will continue to stay on top of developments, but won't make investment decisions based on day-to-day news. In this environment, we may see short-term market displacements which present opportunities. Our focus will continue to be on identifying strong companies with a durable competitive advantage that are well positioned to outperform their peers over the long-term.
1
MAIRS & POWER FUNDS MARKET COMMENTARY (unaudited) (continued)
Gross Domestic Product (GDP) is the monetary value of all the finished goods and services produced within a country's borders in a specific time period, though GDP is usually calculated on an annual basis.
Purchasing Managers' Index (PMI) is an indicator of the economic health of the manufacturing sector. The PMI is based on five major indicators: new orders, inventory levels, production, supplier deliveries and the employment environment.
Dividend Yield is a ratio that shows how much a company pays out in dividends each year relative to its share price.
P/E (price per earnings) Ratio is the ratio of a company's share price to its per-share earnings.
S&P 500 Total Return (TR) Index (S&P 500) is an unmanaged index of 500 common stocks that is generally considered representative of the U.S. stock market. It tracks both the capital gains of a group of stocks over time and assumes that any cash distributions, such as dividends, are reinvested back into the index. It is not possible to invest directly in an index.
2
MAIRS & POWER GROWTH FUND (unaudited)
To Our Shareholders: June 30, 2016
Stock selection drove relative performance as the Growth Fund gained 3.78% in the second quarter and 11.03% for the first six months of the year, outpacing its benchmark index and peer group for both periods. The S&P 500 Total Return (TR) benchmark was up 2.46% and 3.84% and the Lipper Multi-Cap Core Funds Index of peers gained 2.18% and 3.21% for the quarter and the first six months, respectively. On a sector basis, health care, industrials and materials were the leading contributors to performance while consumer discretionary was weak on a relative basis in both periods.
The Fund's strong performance year-to-date demonstrates the benefits of our long-term investment approach and reinforces the effectiveness of our disciplined investment process. As the market struggled last year with the rapid decline in oil prices and strengthening dollar against other major currencies, we used the weakness to increase positions selectively where we found attractive valuations, focusing, as always, on companies with a durable competitive advantage. In 2016, the market again began to recognize the attractiveness of these great companies, benefiting Fund performance.
Despite market valuations near their long-term averages, we continue to find plenty of opportunity to put money to work and have been buying names such as U.S. Bancorp (USB), Hormel (HRL) and Disney (DIS) as well as establishing new positions in United Health Group (UNH) and Great Western Bank (GWB).
MAIRS & POWER GROWTH FUND (MPGFX)
Top Performers
Second Quarter (3/31/16 – 6/30/16) | | Year To Date (12/31/15 – 6/30/16) | |
St. Jude Medical, Inc. | | | 39.36 | % | | Valspar Corp. | | | 26.40 | % | |
Bio-Techne Corporation | | | 16.85 | % | | St. Jude Medical, Inc. | | | 22.43 | % | |
Pfizer Inc. | | | 16.33 | % | | General Mills, Inc. | | | 19.85 | % | |
Medtronic, Inc. | | | 13.23 | % | | Toro Co. | | | 16.87 | % | |
Johnson & Johnson | | | 9.65 | % | | Johnson & Johnson | | | 14.25 | % | |
Weak Performers
Second Quarter (3/31/16 – 6/30/16) | | Year To Date (12/31/15 – 6/30/16) | |
Cray Inc. | | | -31.07 | % | | MTS Systems Corp. | | | -34.70 | % | |
MTS Systems Corp. | | | -30.41 | % | | Wells Fargo & Co. | | | -16.77 | % | |
Hormel Foods Corp. | | | -17.82 | % | | Principal Financial Group | | | -12.44 | % | |
Target Corp. | | | -17.60 | % | | Hormel Foods Corp. | | | -11.28 | % | |
Graco, Inc. | | | -8.38 | % | | U.S. Bancorp | | | -9.32 | % | |
Past performance is no guarantee of future results.
We are not the only investors finding compelling values in some of these stocks. During the first half of the year, we saw announcements that two of our long time portfolio companies were being acquired for substantial premiums over their recent trading ranges, further contributing to the Fund's performance. In the first quarter report, we mentioned that the paint and coatings company Valspar (VAL) is being bought by Sherwin Williams (SHW), with the transaction expected to close in the first quarter of next year. As we discussed last quarter, Valspar complements Sherwin Williams' U.S. presence with a solid international footprint. In the second quarter, Minneapolis-based medical device maker St. Jude Medical (STJ) announced it is being bought by Abbott Laboratories (ABT), with the sale expected to close by the end of this year, creating a clear global leader in cardiac devices. Both of these strategic buyers recognized some of the same competitive strengths that had originally attracted our investment interest and over time continued to reinforce our conviction. In fact, St. Jude was one of the companies we were opportunistically buying on weakness prior to the acquisition
3
MAIRS & POWER GROWTH FUND (unaudited) (continued)
announcement. Both transactions will result in large capital gains for the Fund. We have taken advantage of strength in Valspar to pare back our positions allowing us to redeploy the funds elsewhere.
Mark L. Henneman
Lead Manager | | Andrew R. Adams
Co-Manager | |
The Fund's investment objective, risks, charges and expenses must be considered carefully before investing. The summary prospectus or full prospectus contains this and other important information about the Fund and they may be obtained by calling Shareholder Services at (800) 304-7404 or by visiting www.mairsandpower.com. Read the summary prospectus or full prospectus carefully before investing.
All holdings in the portfolio are subject to change without notice and may or may not represent current or future portfolio composition. The mention of specific securities is not intended as a recommendation or an offer of a particular security, nor is it intended to be a solicitation for the purchase or sale of any security.
All investments have risks. The Growth Fund is designed for long-term investors. Equity investments are subject to market fluctuations and the Fund's share price can fall because of weakness in the broad market, a particular industry or specific holdings. Investments in small and midcap companies generally are more volatile. International investing risks include among others political, social or economic instability, difficulty in predicting international trade patterns, taxation and foreign trading practices and greater fluctuations in price than U.S. corporations.
Diversification does not guarantee profit or protect against loss.
S&P 500 Total Return (TR) Index is an unmanaged index of 500 common stocks that is generally considered representative of the U.S. stock market. It tracks both the capital gains of a group of stocks over time and assumes that any cash distributions, such as dividends, are reinvested back into the index. It is not possible to invest directly in an index.
Lipper Multi-Cap Core Funds Index measures the performance of the 30 largest mutual funds that invest in a variety of capitalization ranges, without concentrating 75% or more of their equity assets in any one market capitalization range over an extended period of time, as determined by Lipper, Inc. It is not possible to invest directly in an index.
4
Mairs & Power Growth Fund
PERFORMANCE INFORMATION (unaudited) June 30, 2016
Ten years of investment performance (through June 30, 2016)
This chart illustrates the performance of a hypothetical $10,000 investment made in the Fund 10 years ago.
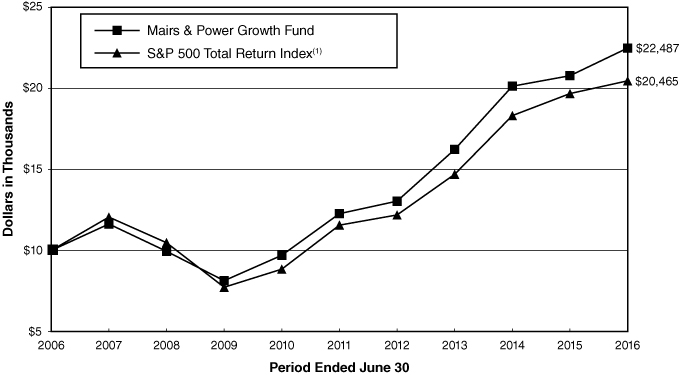
Average annual total returns for periods ended June 30, 2016
| | | 1 year | | 5 years | | 10 years | | 20 years | |
Mairs & Power Growth Fund | | | 8.21 | % | | | 12.88 | % | | | 8.44 | % | | | 10.72 | % | |
S&P 500 Total Return Index(1) | | | 3.99 | % | | | 12.10 | % | | | 7.42 | % | | | 7.87 | % | |
Performance data quoted represents past performance and does not guarantee future results. All performance information shown includes the reinvestment of dividend and capital gain distributions, but does not reflect the deduction of taxes that a shareholder would pay on Fund distributions or the redemption of Fund shares. The investment return and principal value of an investment will fluctuate so that an investor's shares, when redeemed, may be worth more or less than their original cost. Current performance of the Fund may be lower or higher than the performance quoted. For the most recent month-end performance figures, visit the Fund's website at www.mairsandpower.com or call Shareholder Services at (800) 304-7404.
(1) The S&P 500 Total Return Index is an unmanaged index of 500 common stocks that is generally considered representative of the U.S. stock market. It tracks both the capital gains of a group of stocks over time and assumes that any cash distributions, such as dividends, are reinvested back into the index. It is not possible to invest directly in an index.
5
Mairs & Power Growth Fund
FUND INFORMATION (unaudited) June 30, 2016
Portfolio Managers
Mark L. Henneman, lead manager since July 1, 2013, co-manager from January 1, 2006 through June 30, 2013
University of Minnesota, MBA Finance 1990
Andrew R. Adams, co-manager since January 1, 2015,
University of Wisconsin-Madison, MS Finance 1997
General Information
Fund Symbol | | | MPGFX | | |
Net Asset Value (NAV) Per Share | | $ | 115.16 | | |
Expense Ratio | | | 0.66 | %1 | |
Portfolio Turnover Rate | | | 6.30 | % | |
Sales Charge | | | None2 | | |
Fund Inception Year | | | 1958 | | |
Portfolio Composition
Top Ten Portfolio Holdings
(Percent of Total Net Assets) 3
Ecolab Inc | | | 4.4 | % | |
US Bancorp/MN | | | 4.2 | | |
St Jude Medical Inc | | | 4.0 | | |
| 3M Co | | | 3.9 | | |
Honeywell International Inc | | | 3.7 | | |
Johnson & Johnson | | | 3.7 | | |
Medtronic PLC | | | 3.6 | | |
Bemis Co Inc | | | 3.5 | | |
General Mills Inc | | | 3.4 | | |
Graco Inc | | | 3.4 | | |
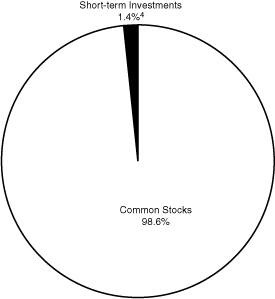
Portfolio Diversification
(Percent of Total Net Assets)
Common Stocks 98.6% | |
Industrials | | | 28.7 | % | |
Health Care | | | 23.2 | | |
Materials | | | 12.9 | | |
Financials | | | 10.9 | | |
Information Technology | | | 9.7 | | |
Consumer Staples | | | 5.8 | | |
Consumer Discretionary | | | 4.7 | | |
Energy | | | 2.7 | | |
Short-term Investments 1.4%4 | | | 1.4 | | |
| | | | 100.0 | % | |
1 Ratio has been annualized for the six month period ended June 30, 2016.
2 Although the Fund is no-load, investment management fees and other expenses still apply.
3 All holdings in the portfolio are subject to change without notice and may or may not represent current or future portfolio composition. The mention of specific securities is not intended as a recommendation or offer for a particular security, nor is it intended to be a solicitation for the purchase or sale of any security.
4 Represents short-term investments and other assets and liabilities (net).
The Global Industry Classification Standard (GICS®) was developed by and/or is the exclusive property of MSCI, Inc. and Standard & Poor's Financial Services LLC ("S&P"). GICS is a service mark of MSCI, Inc. and S&P and has been licensed for use by Mairs & Power, Inc. (the "Adviser").
6
Mairs & Power Growth Fund
SCHEDULE OF INVESTMENTS (unaudited) June 30, 2016
Shares | | Security Description | | Fair Value | |
| | | COMMON STOCKS 98.6% | |
| | | CONSUMER DISCRETIONARY 4.7% | |
| | 1,420,000 | | | Target Corp | | $ | 99,144,400 | | |
| | 1,020,000 | | | Walt Disney Co/The | | | 99,776,400 | | |
| | | | 198,920,800 | | |
| | | CONSUMER STAPLES 5.8% | |
| | 2,030,000 | | | General Mills Inc | | | 144,779,600 | | |
| | 2,770,000 | | | Hormel Foods Corp | | | 101,382,000 | | |
| | | | 246,161,600 | | |
| | | ENERGY 2.7% | |
| | 1,450,000 | | | Schlumberger Ltd (a) | | | 114,666,000 | | |
| | | FINANCIALS 10.9% | |
| | 670,000 | | | American Express Co | | | 40,709,200 | | |
| | 1,910,000 | | | Associated Banc-Corp | | | 32,756,500 | | |
| | 660,000 | | | Great Western Bancorp Inc | | | 20,816,400 | | |
| | 1,730,000 | | | Principal Financial Group Inc | | | 71,120,300 | | |
| | 270,000 | | | Travelers Cos Inc/The | | | 32,140,800 | | |
| | 4,470,000 | | | US Bancorp/MN | | | 180,275,100 | | |
| | 1,850,000 | | | Wells Fargo & Co | | | 87,560,500 | | |
| | | | 465,378,800 | | |
| | | HEALTH CARE 23.2% | |
| | 60,000 | | | Abbott Laboratories | | | 2,358,600 | | |
| | 1,160,000 | | | Baxter International Inc | | | 52,455,200 | | |
| | 890,000 | | | Bio-Techne Corp | | | 100,365,300 | | |
| | 1,290,000 | | | Johnson & Johnson | | | 156,477,000 | | |
| | 1,790,000 | | | Medtronic PLC (f) | | | 155,318,300 | | |
| | 880,000 | | | Patterson Cos Inc | | | 42,143,200 | | |
| | 2,650,000 | | | Pfizer Inc | | | 93,306,500 | | |
| | 2,680,000 | | | Roche Holding AG ADR (e) | | | 88,306,000 | | |
| | 102,258 | | | Shire PLC ADR (e) | | | 18,823,653 | | |
| | 2,180,000 | | | St Jude Medical Inc | | | 170,040,000 | | |
| | 245,000 | | | UnitedHealth Group Inc | | | 34,594,000 | | |
| | 600,000 | | | Zimmer Holdings Inc | | | 72,228,000 | | |
| | | | 986,415,753 | | |
| | | INDUSTRIALS 28.7% | |
| | 950,000 | | | 3M Co | | | 166,364,000 | | |
| | 1,320,000 | | | CH Robinson Worldwide Inc | | | 98,010,000 | | |
| | 3,630,000 | | | Donaldson Co Inc | | | 124,726,800 | | |
| | 1,200,000 | | | Emerson Electric Co | | | 62,592,000 | | |
| | 1,450,000 | | | Fastenal Co | | | 64,365,500 | | |
7
Mairs & Power Growth Fund
SCHEDULE OF INVESTMENTS (unaudited) (continued) June 30, 2016
Shares | | Security Description | | Fair Value | |
| | | COMMON STOCKS (continued) | |
| | | INDUSTRIALS (continued) | |
| | 280,000 | | | G&K Services Inc, Class A | | $ | 21,439,600 | | |
| | 540,000 | | | Generac Holdings Inc (b) | | | 18,878,400 | | |
| | 2,170,000 | | | General Electric Co | | | 68,311,600 | | |
| | 1,810,000 | | | Graco Inc | | | 142,971,900 | | |
| | 1,360,000 | | | Honeywell International Inc | | | 158,195,200 | | |
| | 1,660,000 | | | Pentair PLC (a) | | | 96,761,400 | | |
| | 230,000 | | | Proto Labs Inc (b) | | | 13,238,800 | | |
| | 1,400,000 | | | Toro Co/The | | | 123,480,000 | | |
| | 590,000 | | | United Parcel Service Inc, Class B | | | 63,554,800 | | |
| | | | 1,222,890,000 | | |
| | | INFORMATION TECHNOLOGY 9.7% | |
| | 610,000 | | | Badger Meter Inc | | | 44,548,300 | | |
| | 1,700,000 | | | Corning Inc | | | 34,816,000 | | |
| | 2,000,000 | | | Cray Inc (b) | | | 59,840,000 | | |
| | 780,000 | | | Fiserv Inc (b) | | | 84,809,400 | | |
| | 723,135 | | | MTS Systems Corp | | | 31,702,239 | | |
| | 348,891 | | | NVE Corp (d) | | | 20,462,457 | | |
| | 1,020,000 | | | QUALCOMM Inc | | | 54,641,400 | | |
| | 930,000 | | | Stratasys Ltd (a) (b) | | | 21,287,700 | | |
| | 3,050,000 | | | Western Union Co/The | | | 58,499,000 | | |
| | | | 410,606,496 | | |
| | | MATERIALS 12.9% | |
| | 2,920,000 | | | Bemis Co Inc | | | 150,350,800 | | |
| | 1,589,999 | | | Ecolab Inc | | | 188,573,881 | | |
| | 2,481,600 | | | HB Fuller Co | | | 109,165,584 | | |
| | 950,000 | | | Valspar Corp/The | | | 102,628,500 | | |
| | | | 550,718,765 | | |
| | | | TOTAL COMMON STOCKS
(cost $2,318,555,556) | | $ | 4,195,758,214 | | |
| | | SHORT-TERM INVESTMENTS 1.1% | |
| 48,777,404 | | | First American Prime Obligations Fund, Class Z, 0.27% (c)
(cost $48,777,404) | | $ | 48,777,404 | | |
| | | | TOTAL INVESTMENTS 99.7%
(cost $2,367,332,960) | | $ | 4,244,535,618 | | |
| | | | | OTHER ASSETS AND LIABILITIES (NET) 0.3% | | | 11,088,305 | | |
| | | | | TOTAL NET ASSETS 100.0% | | $ | 4,255,623,923 | | |
8
Mairs & Power Growth Fund
SCHEDULE OF INVESTMENTS (unaudited) (continued) June 30, 2016
(a) Foreign security denominated in U.S. dollars. As of June 30, 2016, these securities represented $232,715,100 or 5.5% of total net assets.
(b) Non-income producing.
(c) The rate quoted is the annualized seven-day effective yield as of June 30, 2016.
(d) Affiliated company at June 30, 2016.
(e) American Depositary Receipt.
(f) Issuer headquartered overseas but considered domestic. In determining whether a security is foreign or domestic, the Adviser will generally look at the location of the headquarters of the issuer. However, if the issuer is believed by the Adviser to be headquartered in a jurisdiction primarily for tax purposes, the Adviser will consider the following additional factors: 1) the location of the primary exchange trading its securities; 2) where it derives the majority of its revenues, or 3) where it earns the majority of its profits.
The Global Industry Classification Standard (GICS®) was developed by and/or is the exclusive property of MSCI, Inc. and Standard & Poor's Financial Services LLC ("S&P"). GICS is a service mark of MSCI, Inc. and S&P and has been licensed for use by the Adviser.
See accompanying Notes to Financial Statements.
9
MAIRS & POWER BALANCED FUND (unaudited)
To Our Shareholders: June 30, 2016
The Balanced Fund gained 3.99% for the quarter and 8.35% for the first six months of the year, outperforming its benchmark composite index (60% S&P 500 Total Return Index and 40% Barclays Government/Credit Bond Index), which was up 2.55% in the quarter and up 4.89% for the first half. Stock selection was the primary driver of outperformance for the first six months of the year while both stock selection and sector allocation benefited Fund relative performance in the quarter.
A broad swath of stocks across multiple sectors contributed to performance. Health care, energy, industrials and materials sectors were the leading contributors to performance while the consumer discretionary sector was weak on a relative basis in both periods. Overweight positions in health care and energy and underweight positions in information technology and consumer discretionary sectors benefited performance in the quarter. Notably, the energy sector, which had been under pressure all of last year due to falling oil prices, had seen stocks beaten down. The market recognized that some names were oversold and as a result, one of our portfolio holdings, Exxon (XOM), was a top contributor to performance for both the quarter and first six months.
Despite market valuations near their long-term averages, we continue to find plenty of opportunity to put money to work in existing positions, such as Ecolab Inc. (ECL), Graco Inc. (GGG) and Target Corporation (TGT), as well as to establish a new position in United Health Group (UNH). We are not the only investors finding compelling values in some of these stocks as mergers and acquisition activity also was a significant factor in the Fund's performance. During the first half of the year, we saw announcements that two of our portfolio companies were being considered for acquisition for substantial premiums over their recent trading ranges. In the first quarter, as we had previously reported, the paint and coatings company Valspar (VAL) is being acquired by Sherwin Williams (SHW), with the transaction expected to close in the first quarter of next year. As we discussed last quarter, Valspar complements Sherwin Williams' U.S. presence with a solid international footprint. At the end of the quarter, news broke that Mondelez (MDLZ) had expressed interest in acquiring Hershey (HSY) which is also one of the Fund's portfolio companies. While the ultimate outcome is still uncertain, as Hershey's trustees and shareholders need to approve the deal, the news drove the stock to close up nearly 17%, which also benefited Fund performance.
MAIRS & POWER BALANCED FUND (MAPOX)
Top Performers
Second Quarter (3/31/16 – 6/30/16) | | Year To Date (12/31/15 – 6/30/16) | |
The Hershey Co. | | | 20.78 | % | | Valspar Corp. | | | 26.40 | % | |
Pfizer Inc. | | | 16.33 | % | | Exxon Mobil Corp. | | | 16.42 | % | |
Medtronic, Inc. | | | 13.23 | % | | Johnson & Johnson | | | 14.25 | % | |
Exxon Mobil Corp. | | | 9.68 | % | | 3M Company | | | 12.41 | % | |
Johnson & Johnson | | | 9.65 | % | | Medtronic, Inc. | | | 8.97 | % | |
Weak Performers
Second Quarter (3/31/16 – 6/30/16) | | Year To Date (12/31/15 – 6/30/16) | |
MTS Systems Corp. | | | -30.41 | % | | MTS Systems Corp. | | | -34.70 | % | |
Hormel Foods Corp. | | | -17.82 | % | | Wells Fargo & Co. | | | -16.77 | % | |
Target Corp. | | | -17.60 | % | | Abbott Laboratories | | | -16.31 | % | |
Graco, Inc. | | | -8.38 | % | | Principal Financial Group | | | -12.44 | % | |
Emerson Electric Co. | | | -6.54 | % | | U.S. Bancorp | | | -9.32 | % | |
Past performance is no guarantee of future results.
10
MAIRS & POWER BALANCED FUND (unaudited) (continued)
On the fixed income side of the Fund, the historic low interest rate environment persists. As discussed above in the market overview section, the Federal Reserve once again took a pass on raising interest rates. With unemployment continuing to decline, we may see one small rate hike before the end of the year, but do not expect any significant moves. Corporate America is taking the opportunity presented by low interest rates to extend out the maturity of its debt and the overall corporate bond market has been strong, with longer maturity instruments outperforming equities in the quarter.
Our goal is to position the duration, or maturity, of our fixed income portfolio to be neutral compared to the benchmark Barclays Government/Credit Bond Index. In the first half, as the duration of the benchmark came up, we came down to meet it by selling into the strength in longer maturity instruments.
Ronald L. Kaliebe
Lead Manager | | Kevin V. Earley
Co-Manager | |
The Fund's investment objective, risks, charges and expenses must be considered carefully before investing. The summary prospectus or full prospectus contains this and other important information about the Fund and they may be obtained by calling Shareholder Services at (800) 304-7404 or by visiting www.mairsandpower.com. Read the summary prospectus or full prospectus carefully before investing.
All holdings in the portfolio are subject to change without notice and may or may not represent current or future portfolio composition. The mention of specific securities is not intended as a recommendation or an offer of a particular security, nor is it intended to be a solicitation for the purchase or sale of any security.
All investments have risks. The Balanced Fund is designed for long-term investors. Equity investments are subject to market fluctuations and the Fund's share price can fall because of weakness in the broad market, a particular industry or specific holdings. Investments in small and midcap companies generally are more volatile. International investing risks include among others political, social or economic instability, difficulty in predicting international trade patterns, taxation and foreign trading practices, and greater fluctuations in price than U.S. corporations. The Fund is subject to yield and share price variances with changes in interest rates and market conditions. Investors should note that if interest rates rise significantly from current levels, bond total returns will decline and may even turn negative in the short-term. There is also a chance that some of the Fund's holdings may have their credit rating downgraded or may default.
Diversification does not guarantee profit or protect against loss.
Barclays Government/Credit Bond Index is composed of high-quality, investment-grade U.S. Government and corporate fixed income securities with maturities greater than one year. It is not possible to invest directly in an index.
S&P 500 Total Return (TR) Index is an unmanaged index of 500 common stocks that is generally considered representative of the U.S. stock market. It tracks both the capital gains of a group of stocks over time and assumes that any cash distributions, such as dividends, are reinvested back into the index. It is not possible to invest directly in an index.
11
Mairs & Power Balanced Fund
PERFORMANCE INFORMATION (unaudited) June 30, 2016
Ten years of investment performance (through June 30, 2016)
This chart illustrates the performance of a hypothetical $10,000 investment made in the Fund 10 years ago.
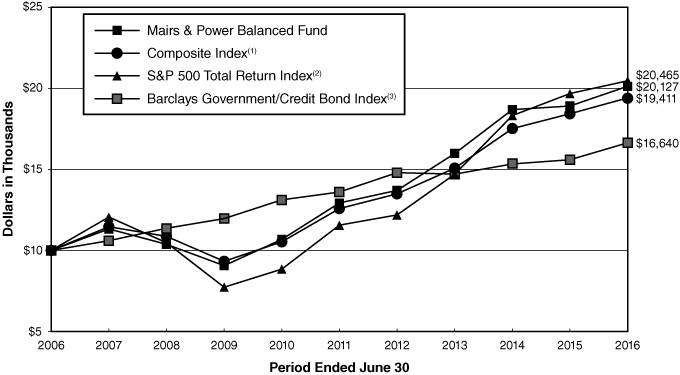
Average annual total returns for periods ended June 30, 2016
| | | 1 year | | 5 years | | 10 years | | 20 years | |
Mairs & Power Balanced Fund | | | 6.44 | % | | | 9.25 | % | | | 7.24 | % | | | 8.88 | % | |
Composite Index(1) | | | 5.31 | % | | | 9.06 | % | | | 6.86 | % | | | 7.35 | % | |
S&P 500 Total Return Index(2) | | | 3.99 | % | | | 12.10 | % | | | 7.42 | % | | | 7.87 | % | |
Barclays Government/Credit
Bond Index(3) | | | 6.70 | % | | | 4.11 | % | | | 5.22 | % | | | 5.74 | % | |
Performance data quoted represents past performance and does not guarantee future results. All performance information shown includes the reinvestment of dividend and capital gain distributions, but does not reflect the deduction of taxes that a shareholder would pay on Fund distributions or the redemption of Fund shares. The investment return and principal value of an investment will fluctuate so that an investor's shares, when redeemed, may be worth more or less than their original cost. Current performance of the Fund may be lower or higher than the performance quoted. For the most recent month-end performance figures, visit the Fund's website at www.mairsandpower.com or call Shareholder Services at (800) 304-7404.
(1) The Composite Index reflects an unmanaged portfolio comprised of 60% of the S&P 500 Total Return Index and 40% of the Barclays Government/Credit Bond Index. It is not possible to invest directly in an index.
(2) The S&P 500 Total Return Index is an unmanaged index of 500 common stocks that is generally considered representative of the U.S. stock market. It tracks both the capital gains of a group of stocks over time and assumes that any cash distributions, such as dividends, are reinvested back into the index. It is not possible to invest directly in an index.
(3) The Barclays Government/Credit Bond Index is composed of high-quality, investment-grade U.S. Government and corporate fixed income securities with maturities greater than one year. It is not possible to invest directly in an index.
12
Mairs & Power Balanced Fund
FUND INFORMATION (unaudited) June 30, 2016
Portfolio Managers
Ronald L. Kaliebe, lead manager since July 1, 2013,
co-manager from January 1, 2006 through June 30, 2013
University of Wisconsin-Madison, MBA Finance 1980
Kevin V. Earley, co-manager since January 1, 2015, University of Minnesota, MBA Finance 1990
General Information
Fund Symbol | | MAPOX | |
Net Asset Value (NAV) Per Share | | $ | 86.91 | | |
Expense Ratio | | | 0.72 | %1 | |
Portfolio Turnover Rate | | | 8.78 | % | |
Sales Charge | | | None2 | | |
Fund Inception Year | | | 1961 | | |
Portfolio Composition
Top Ten Common Stock Holdings
(Percent of Total Net Assets) 3
United Parcel Service Inc, Class B | | | 2.9 | % | |
Medtronic PLC | | | 2.9 | | |
US Bancorp/MN | | | 2.7 | | |
Ecolab Inc | | | 2.6 | | |
Johnson & Johnson | | | 2.5 | | |
Exxon Mobil Corp | | | 2.4 | | |
Pfizer Inc | | | 2.1 | | |
| 3M Co | | | 2.1 | | |
Valspar Corp/The | | | 2.0 | | |
Honeywell International Inc | | | 2.0 | | |
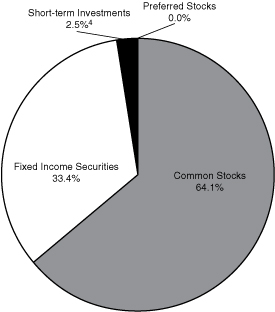
Portfolio Diversification
(Percent of Total Net Assets)
Fixed Income Securities 33.4% | |
Corporate Bonds | | | 30.7 | % | |
Asset Backed Securities | | | 2.1 | | |
Preferred Securities | | | 0.6 | | |
Common Stocks 64.1% | |
Industrials | | | 14.9 | | |
Health Care | | | 14.5 | | |
Financials | | | 8.9 | | |
Materials | | | 6.6 | | |
Energy | | | 6.2 | | |
Information Technology | | | 5.3 | | |
Consumer Staples | | | 3.3 | | |
Consumer Discretionary | | | 3.0 | | |
Utilities | | | 1.4 | | |
Preferred Stocks 0.0% | | | 0.0 | | |
Short-term Investments 2.5%4 | | | 2.5 | | |
| | | | 100.0 | % | |
1 Ratio has been annualized for the six month period ended June 30, 2016.
2 Although the Fund is no-load, investment management fees and other expenses still apply.
3 All holdings in the portfolio are subject to change without notice and may or may not represent current or future portfolio composition. The mention of specific securities is not intended as a recommendation or offer for a particular security, nor is it intended to be a solicitation for the purchase or sale of any security.
4 Represents short-term investments and other assets and liabilities (net).
The Global Industry Classification Standard (GICS®) was developed by and/or is the exclusive property of MSCI, Inc. and Standard & Poor's Financial Services LLC ("S&P"). GICS is a service mark of MSCI, Inc. and S&P and has been licensed for use by the Adviser.
13
Mairs & Power Balanced Fund
SCHEDULE OF INVESTMENTS (unaudited) June 30, 2016
Par Value | | Security Description | | Fair Value | |
| | | FIXED INCOME SECURITIES 33.4% | |
| | | CORPORATE BONDS 30.7% | |
| | | CONSUMER DISCRETIONARY 3.5% | |
$ | 250,000 | | | ServiceMaster Co LLC/The | | | 7.100 | % | | 03/01/18 | | $ | 258,750 | | |
| | 500,000 | | | Best Buy Co Inc | | | 5.000 | % | | 08/01/18 | | | 526,560 | | |
| | 1,000,000 | | | Ford Motor Credit Co LLC | | | 3.000 | % | | 12/20/18 | | | 1,009,550 | | |
| | 500,000 | | | Ford Motor Credit Co LLC | | | 3.450 | % | | 08/20/20 | | | 500,252 | | |
| | 1,000,000 | | | Time Warner Cable Inc | | | 4.125 | % | | 02/15/21 | | | 1,058,639 | | |
| | 1,000,000 | | | Best Buy Co Inc | | | 5.500 | % | | 03/15/21 | | | 1,065,000 | | |
| | 555,000 | | | Kohl's Corp | | | 4.000 | % | | 11/01/21 | | | 580,526 | | |
| | 500,000 | | | Whirlpool Corp | | | 4.700 | % | | 06/01/22 | | | 558,522 | | |
| | 750,000 | | | Newell Rubbermaid Inc | | | 4.000 | % | | 06/15/22 | | | 795,887 | | |
| | 1,000,000 | | | Block Financial LLC | | | 5.500 | % | | 11/01/22 | | | 1,081,286 | | |
| | 1,000,000 | | | Staples Inc | | | 4.375 | % | | 01/12/23 | | | 1,018,406 | | |
| | 2,000,000 | | | Kohl's Corp | | | 3.250 | % | | 02/01/23 | | | 2,004,904 | | |
| | 1,000,000 | | | Wyndham Worldwide Corp | | | 3.900 | % | | 03/01/23 | | | 1,023,801 | | |
| | 500,000 | | | Hyatt Hotels Corp | | | 3.375 | % | | 07/15/23 | | | 505,843 | | |
| | 1,000,000 | | | Viacom Inc | | | 4.250 | % | | 09/01/23 | | | 1,038,925 | | |
| | 2,000,000 | | | Viacom Inc | | | 3.875 | % | | 04/01/24 | | | 2,031,398 | | |
| | 1,000,000 | | | Ford Motor Credit Co LLC | | | 4.000 | % | | 04/20/24 | | | 990,212 | | |
| | 2,000,000 | | | Macy's Retail Holdings Inc | | | 3.625 | % | | 06/01/24 | | | 1,970,862 | | |
| | 1,000,000 | | | Tiffany & Co | | | 3.800 | % | | 10/01/24 | | | 1,054,256 | | |
| | 1,000,000 | | | Coach Inc | | | 4.250 | % | | 04/01/25 | | | 1,021,146 | | |
| | 1,000,000 | | | Ford Motor Credit Co LLC | | | 4.134 | % | | 08/04/25 | | | 1,072,151 | | |
| | 2,000,000 | | | Priceline Group Inc/The | | | 3.600 | % | | 06/01/26 | | | 2,065,600 | | |
| | 1,000,000 | | | Metropolitan Opera Association Inc | | | 4.349 | % | | 10/01/32 | | | 1,052,058 | | |
| | 2,000,000 | | | Comcast Corp | | | 4.250 | % | | 01/15/33 | | | 2,206,730 | | |
| | | | 26,491,264 | | |
| | | CONSUMER STAPLES 0.6% | |
| | 525,000 | | | Cargill Inc (d) | | | 6.000 | % | | 11/27/17 | | | 560,030 | | |
| | 1,000,000 | | | Walgreens Boots Alliance Inc | | | 3.800 | % | | 11/18/24 | | | 1,059,482 | | |
| | 1,449,000 | | | Land O'Lakes Capital Trust I (d) | | | 7.450 | % | | 03/15/28 | | | 1,568,542 | | |
| | 500,000 | | | Altria Group Inc | | | 4.250 | % | | 08/09/42 | | | 545,909 | | |
| | 1,000,000 | | | Cargill Inc (d) | | | 4.100 | % | | 11/01/42 | | | 1,050,140 | | |
| | | | 4,784,103 | | |
| | | ENERGY 2.3% | |
| | 250,000 | | | ConocoPhillips Co | | | 6.650 | % | | 07/15/18 | | | 271,726 | | |
| | 2,000,000 | | | ConocoPhillips Co | | | 4.200 | % | | 03/15/21 | | | 2,165,482 | | |
| | 1,500,000 | | | Murphy Oil Corp | | | 4.000 | % | | 06/01/22 | | | 1,330,557 | | |
| | 500,000 | | | Western Gas Partners LP | | | 4.000 | % | | 07/01/22 | | | 487,186 | | |
14
Mairs & Power Balanced Fund
SCHEDULE OF INVESTMENTS (unaudited) (continued) June 30, 2016
Par Value | | Security Description | | Fair Value | |
| | | FIXED INCOME SECURITIES (continued) | |
| | | CORPORATE BONDS (continued) | |
| | | ENERGY (continued) | |
$ | 655,000 | | | FMC Technologies Inc | | | 3.450 | % | | 10/01/22 | | $ | 624,618 | | |
| | 1,500,000 | | | Transocean Inc (a) (c) | | | 4.300 | % | | 10/15/22 | | | 1,061,250 | | |
| | 1,000,000 | | | Murphy Oil Corp (c) | | | 3.700 | % | | 12/01/22 | | | 914,872 | | |
| | 1,500,000 | | | Sunoco Logistics Partners Operations LP | | | 3.450 | % | | 01/15/23 | | | 1,479,171 | | |
| | 2,000,000 | | | Williams Cos Inc/The | | | 3.700 | % | | 01/15/23 | | | 1,770,000 | | |
| | 1,945,000 | | | Boardwalk Pipelines LP | | | 3.375 | % | | 02/01/23 | | | 1,783,219 | | |
| | 575,000 | | | DCP Midstream Operating LP | | | 3.875 | % | | 03/15/23 | | | 523,250 | | |
| | 2,000,000 | | | Halliburton Co | | | 3.500 | % | | 08/01/23 | | | 2,074,526 | | |
| | 1,000,000 | | | Diamond Offshore Drilling Inc | | | 3.450 | % | | 11/01/23 | | | 835,693 | | |
| | 500,000 | | | Kinder Morgan Energy Partners LP | | | 4.250 | % | | 09/01/24 | | | 506,266 | | |
| | 1,000,000 | | | ConocoPhillips Co | | | 3.350 | % | | 11/15/24 | | | 1,030,142 | | |
| | 500,000 | | | Murphy Oil Corp (c) | | | 5.125 | % | | 12/01/42 | | | 434,750 | | |
| | 500,000 | | | Apache Corp | | | 4.250 | % | | 01/15/44 | | | 484,020 | | |
| | | | 17,776,728 | | |
| | | FINANCIALS 12.4% | |
| | 500,000 | | | National City Bank/Cleveland OH | | | 5.250 | % | | 12/15/16 | | | 509,425 | | |
| | 500,000 | | | M&I Marshall & Ilsley Bank | | | 5.000 | % | | 01/17/17 | | | 509,160 | | |
| | 500,000 | | | Citigroup Inc | | | 5.500 | % | | 02/15/17 | | | 512,868 | | |
| | 500,000 | | | Sirius International Group Ltd (a) (d) | | | 6.375 | % | | 03/20/17 | | | 511,047 | | |
| | 250,000 | | | Bank of America Corp | | | 5.700 | % | | 05/02/17 | | | 258,794 | | |
| | 500,000 | | | Royal Bank of Scotland Group PLC (a) | | | 4.250 | % | | 07/15/17 | | | 496,495 | | |
| | 500,000 | | | Comerica Bank | | | 5.200 | % | | 08/22/17 | | | 520,601 | | |
| | 500,000 | | | Bank of America Corp | | | 6.000 | % | | 09/01/17 | | | 525,653 | | |
| | 500,000 | | | American Express Bank FSB | | | 6.000 | % | | 09/13/17 | | | 526,751 | | |
| | 500,000 | | | Bear Stearns Cos LLC/The | | | 6.400 | % | | 10/02/17 | | | 531,220 | | |
| | 500,000 | | | Prudential Financial Inc | | | 6.000 | % | | 12/01/17 | | | 532,641 | | |
| | 500,000 | | | Barclays Bank PLC (a) (d) | | | 6.050 | % | | 12/04/17 | | | 523,616 | | |
| | 1,000,000 | | | Morgan Stanley | | | 5.950 | % | | 12/28/17 | | | 1,063,440 | | |
| | 500,000 | | | Goldman Sachs Group Inc/The | | | 5.950 | % | | 01/18/18 | | | 532,644 | | |
| | 500,000 | | | Wachovia Corp | | | 5.750 | % | | 02/01/18 | | | 535,116 | | |
| | 250,000 | | | Lincoln National Corp | | | 7.000 | % | | 03/15/18 | | | 270,355 | | |
| | 500,000 | | | SunTrust Bank/Atlanta GA | | | 7.250 | % | | 03/15/18 | | | 544,965 | | |
| | 500,000 | | | Morgan Stanley | | | 6.625 | % | | 04/01/18 | | | 541,887 | | |
| | 1,000,000 | | | Jefferies Group LLC | | | 5.125 | % | | 04/13/18 | | | 1,045,950 | | |
| | 500,000 | | | Bank of America Corp | | | 6.875 | % | | 04/25/18 | | | 545,874 | | |
| | 500,000 | | | Provident Cos Inc | | | 7.000 | % | | 07/15/18 | | | 546,156 | | |
| | 500,000 | | | MetLife Inc | | | 6.817 | % | | 08/15/18 | | | 558,226 | | |
15
Mairs & Power Balanced Fund
SCHEDULE OF INVESTMENTS (unaudited) (continued) June 30, 2016
Par Value | | Security Description | | Fair Value | |
| | | FIXED INCOME SECURITIES (continued) | |
| | | CORPORATE BONDS (continued) | |
| | | FINANCIALS (continued) | |
$ | 500,000 | | | Hartford Financial Services Group Inc/The | | | 6.000 | % | | 01/15/19 | | $ | 548,825 | | |
| | 500,000 | | | Royal Bank of Scotland Group PLC (a) | | | 5.250 | % | | 02/15/19 | | | 519,241 | | |
| | 500,000 | | | BB&T Corp | | | 6.850 | % | | 04/30/19 | | | 573,842 | | |
| | 250,000 | | | WR Berkley Corp | | | 6.150 | % | | 08/15/19 | | | 278,647 | | |
| | 500,000 | | | Protective Life Corp | | | 7.375 | % | | 10/15/19 | | | 580,257 | | |
| | 500,000 | | | Prospect Capital Corp | | | 5.125 | % | | 11/15/19 | | | 495,008 | | |
| | 500,000 | | | Credit Suisse/New York NY (a) | | | 5.400 | % | | 01/14/20 | | | 542,790 | | |
| | 500,000 | | | Prospect Capital Corp | | | 4.000 | % | | 01/15/20 | | | 489,015 | | |
| | 500,000 | | | Morgan Stanley | | | 5.500 | % | | 01/26/20 | | | 556,106 | | |
| | 500,000 | | | Hartford Financial Services Group Inc/The | | | 5.500 | % | | 03/30/20 | | | 564,597 | | |
| | 450,000 | | | Compass Bank | | | 5.500 | % | | 04/01/20 | | | 485,011 | | |
| | 1,000,000 | | | Barclays PLC (a) | | | 3.250 | % | | 01/12/21 | | | 996,497 | | |
| | 1,000,000 | | | Regions Financial Corp | | | 3.200 | % | | 02/08/21 | | | 1,029,298 | | |
| | 2,000,000 | | | American International Group Inc | | | 3.300 | % | | 03/01/21 | | | 2,066,210 | | |
| | 1,000,000 | | | HSBC Holdings PLC (a) | | | 3.400 | % | | 03/08/21 | | | 1,030,424 | | |
| | 1,000,000 | | | Nationwide Financial Services Inc (d) | | | 5.375 | % | | 03/25/21 | | | 1,116,920 | | |
| | 500,000 | | | Markel Corp | | | 5.350 | % | | 06/01/21 | | | 560,089 | | |
| | 1,000,000 | | | Capital One Financial Corp | | | 4.750 | % | | 07/15/21 | | | 1,113,137 | | |
| | 500,000 | | | Goldman Sachs Group Inc/The | | | 5.250 | % | | 07/27/21 | | | 564,241 | | |
| | 500,000 | | | Genworth Holdings Inc | | | 7.625 | % | | 09/24/21 | | | 425,625 | | |
| | 500,000 | | | Aflac Inc | | | 4.000 | % | | 02/15/22 | | | 551,595 | | |
| | 2,000,000 | | | OneBeacon US Holdings Inc | | | 4.600 | % | | 11/09/22 | | | 2,033,970 | | |
| | 1,000,000 | | | Invesco Finance PLC (a) | | | 3.125 | % | | 11/30/22 | | | 1,043,527 | | |
| | 1,000,000 | | | Standard Chartered PLC (a) (d) | | | 3.950 | % | | 01/11/23 | | | 969,583 | | |
| | 2,000,000 | | | Wells Fargo & Co | | | 3.450 | % | | 02/13/23 | | | 2,069,456 | | |
| | 2,500,000 | | | Assurant Inc | | | 4.000 | % | | 03/15/23 | | | 2,575,710 | | |
| | 1,000,000 | | | Markel Corp | | | 3.625 | % | | 03/30/23 | | | 1,033,539 | | |
| | 1,500,000 | | | Citigroup Inc | | | 3.500 | % | | 05/15/23 | | | 1,530,775 | | |
| | 500,000 | | | Morgan Stanley | | | 4.100 | % | | 05/22/23 | | | 518,431 | | |
| | 2,000,000 | | | Liberty Mutual Group Inc (d) | | | 4.250 | % | | 06/15/23 | | | 2,124,474 | | |
| | 500,000 | | | Ameriprise Financial Inc | | | 4.000 | % | | 10/15/23 | | | 541,213 | | |
| | 500,000 | | | CNA Financial Corp | | | 7.250 | % | | 11/15/23 | | | 606,715 | | |
| | 500,000 | | | Pacific Life Insurance Co (d) | | | 7.900 | % | | 12/30/23 | | | 645,662 | | |
| | 1,000,000 | | | Moody's Corp | | | 4.875 | % | | 02/15/24 | | | 1,134,190 | | |
| | 1,000,000 | | | NASDAQ OMX Group Inc/The | | | 4.250 | % | | 06/01/24 | | | 1,054,595 | | |
| | 500,000 | | | Wintrust Financial Corp | | | 5.000 | % | | 06/13/24 | | | 513,448 | | |
| | 250,000 | | | Assured Guaranty US Holdings Inc | | | 5.000 | % | | 07/01/24 | | | 271,550 | | |
| | 510,000 | | | Legg Mason Inc | | | 3.950 | % | | 07/15/24 | | | 515,551 | | |
16
Mairs & Power Balanced Fund
SCHEDULE OF INVESTMENTS (unaudited) (continued) June 30, 2016
Par Value | | Security Description | | Fair Value | |
| | | FIXED INCOME SECURITIES (continued) | |
| | | CORPORATE BONDS (continued) | |
| | | FINANCIALS (continued) | |
$ | 500,000 | | | Symetra Financial Corp | | | 4.250 | % | | 07/15/24 | | $ | 519,579 | | |
| | 1,000,000 | | | Stifel Financial Corp | | | 4.250 | % | | 07/18/24 | | | 1,025,609 | | |
| | 1,000,000 | | | Citigroup Inc | | | 4.000 | % | | 08/05/24 | | | 1,027,950 | | |
| | 1,500,000 | | | Synchrony Financial | | | 4.250 | % | | 08/15/24 | | | 1,552,395 | | |
| | 1,000,000 | | | Bank of America Corp | | | 4.200 | % | | 08/26/24 | | | 1,033,718 | | |
| | 1,800,000 | | | Brown & Brown Inc | | | 4.200 | % | | 09/15/24 | | | 1,835,701 | | |
| | 2,000,000 | | | Old Republic International Corp | | | 4.875 | % | | 10/01/24 | | | 2,136,254 | | |
| | 1,000,000 | | | TIAA Asset Management Finance Co LLC (d) | | | 4.125 | % | | 11/01/24 | | | 1,050,495 | | |
| | 2,000,000 | | | American Express Co | | | 3.625 | % | | 12/05/24 | | | 2,051,222 | | |
| | 1,000,000 | | | Associated Banc-Corp | | | 4.250 | % | | 01/15/25 | | | 1,032,334 | | |
| | 2,000,000 | | | Kemper Corp | | | 4.350 | % | | 02/15/25 | | | 2,073,492 | | |
| | 1,050,000 | | | TCF National Bank | | | 4.600 | % | | 02/27/25 | | | 1,069,334 | | |
| | 1,000,000 | | | Lincoln National Corp | | | 3.350 | % | | 03/09/25 | | | 993,171 | | |
| | 250,000 | | | Liberty Mutual Insurance Co (d) | | | 8.500 | % | | 05/15/25 | | | 313,180 | | |
| | 3,000,000 | | | American International Group Inc | | | 3.750 | % | | 07/10/25 | | | 3,057,615 | | |
| | 1,000,000 | | | Synchrony Financial | | | 4.500 | % | | 07/23/25 | | | 1,036,899 | | |
| | 1,000,000 | | | Janus Capital Group Inc | | | 4.875 | % | | 08/01/25 | | | 1,081,345 | | |
| | 2,000,000 | | | HSBC Holdings PLC (a) | | | 4.250 | % | | 08/18/25 | | | 2,018,246 | | |
| | 1,520,000 | | | Legg Mason Inc | | | 4.750 | % | | 03/15/26 | | | 1,602,840 | | |
| | 2,000,000 | | | Hanover Insurance Group Inc/The | | | 4.500 | % | | 04/15/26 | | | 2,064,746 | | |
| | 1,000,000 | | | Wells Fargo & Co | | | 4.100 | % | | 06/03/26 | | | 1,069,611 | | |
| | 2,000,000 | | | Voya Financial Inc | | | 3.650 | % | | 06/15/26 | | | 2,009,424 | | |
| | 500,000 | | | Morgan Stanley | | | 4.350 | % | | 09/08/26 | | | 523,059 | | |
| | 1,000,000 | | | National Rural Utilities Cooperative Finance Corp | | | 3.000 | % | | 11/15/26 | | | 997,846 | | |
| | 1,000,000 | | | Citigroup Inc | | | 4.300 | % | | 11/20/26 | | | 1,030,259 | | |
| | 1,000,000 | | | JPMorgan Chase & Co | | | 4.125 | % | | 12/15/26 | | | 1,059,517 | | |
| | 250,000 | | | Provident Cos Inc | | | 7.250 | % | | 03/15/28 | | | 308,315 | | |
| | 1,000,000 | | | JPMorgan Chase & Co (c) | | | 3.000 | % | | 03/21/28 | | | 986,244 | | |
| | 1,000,000 | | | Royal Bank of Canada (a) | | | 3.000 | % | | 05/10/28 | | | 934,562 | | |
| | 500,000 | | | Farmers Exchange Capital (d) | | | 7.050 | % | | 07/15/28 | | | 604,119 | | |
| | 500,000 | | | Goldman Sachs Group Inc/The | | | 4.250 | % | | 11/15/30 | | | 496,464 | | |
| | 500,000 | | | Goldman Sachs Group Inc/The | | | 4.000 | % | | 02/15/31 | | | 489,665 | | |
| | 500,000 | | | Goldman Sachs Group Inc/The | | | 4.300 | % | | 12/15/32 | | | 503,983 | | |
| | 1,000,000 | | | JPMorgan Chase & Co (c) | | | 3.250 | % | | 01/31/33 | | | 1,000,180 | | |
| | 649,000 | | | Lloyds Bank PLC (a) (c) | | | 3.400 | % | | 01/31/33 | | | 630,297 | | |
| | 250,000 | | | Citigroup Inc (c) | | | 4.000 | % | | 06/27/34 | | | 246,113 | | |
| | 538,000 | | | Bank of America Corp | | | 4.000 | % | | 08/15/34 | | | 549,385 | | |
| | 1,000,000 | | | Prudential Financial Inc | | | 4.050 | % | | 11/15/34 | | | 988,989 | | |
17
Mairs & Power Balanced Fund
SCHEDULE OF INVESTMENTS (unaudited) (continued) June 30, 2016
Par Value | | Security Description | | Fair Value | |
| | | FIXED INCOME SECURITIES (continued) | |
| | | CORPORATE BONDS (continued) | |
| | | FINANCIALS (continued) | |
$ | 1,000,000 | | | Goldman Sachs Group Inc/The | | | 4.000 | % | | 01/30/35 | | $ | 1,000,016 | | |
| | 1,000,000 | | | Berkshire Hathaway Finance Corp | | | 4.400 | % | | 05/15/42 | | | 1,122,520 | | |
| | 500,000 | | | MetLife Inc | | | 4.125 | % | | 08/13/42 | | | 497,764 | | |
| | 500,000 | | | Swiss Re Treasury US Corp (d) | | | 4.250 | % | | 12/06/42 | | | 528,203 | | |
| | 500,000 | | | Pacific LifeCorp (d) | | | 5.125 | % | | 01/30/43 | | | 547,437 | | |
| | 500,000 | | | Berkshire Hathaway Finance Corp | | | 4.300 | % | | 05/15/43 | | | 554,936 | | |
| | 500,000 | | | Principal Financial Group Inc | | | 4.350 | % | | 05/15/43 | | | 507,570 | | |
| | | | 94,175,251 | | |
| | | HEALTH CARE 1.0% | |
| | 500,000 | | | UnitedHealth Group Inc | | | 6.000 | % | | 02/15/18 | | | 539,166 | | |
| | 1,000,000 | | | Quest Diagnostics Inc | | | 4.700 | % | | 04/01/21 | | | 1,100,333 | | |
| | 1,000,000 | | | Laboratory Corp of America Holdings | | | 3.750 | % | | 08/23/22 | | | 1,052,936 | | |
| | 1,000,000 | | | Laboratory Corp of America Holdings | | | 4.000 | % | | 11/01/23 | | | 1,070,815 | | |
| | 1,000,000 | | | Mylan Inc/PA | | | 4.200 | % | | 11/29/23 | | | 1,056,148 | | |
| | 500,000 | | | Wyeth LLC | | | 6.450 | % | | 02/01/24 | | | 642,265 | | |
| | 2,000,000 | | | Actavis Funding SCS (a) | | | 3.800 | % | | 03/15/25 | | | 2,083,656 | | |
| | | | 7,545,319 | | |
| | | INDUSTRIALS 2.4% | |
| | 500,000 | | | Masco Corp | | | 7.125 | % | | 03/15/20 | | | 575,750 | | |
| | 150,000 | | | Pentair Finance SA (a) | | | 3.625 | % | | 09/15/20 | | | 153,769 | | |
| | 500,000 | | | Pentair Finance SA (a) | | | 5.000 | % | | 05/15/21 | | | 538,952 | | |
| | 500,000 | | | IDEX Corp | | | 4.200 | % | | 12/15/21 | | | 536,865 | | |
| | 500,000 | | | GATX Corp | | | 4.750 | % | | 06/15/22 | | | 537,637 | | |
| | 500,000 | | | Penske Truck Leasing Co Lp / PTL Finance Corp (d) | | | 4.875 | % | | 07/11/22 | | | 545,269 | | |
| | 818,000 | | | Pentair Finance SA (a) | | | 3.150 | % | | 09/15/22 | | | 810,956 | | |
| | 2,000,000 | | | Dun & Bradstreet Corp/The | | | 4.375 | % | | 12/01/22 | | | 2,048,354 | | |
| | 1,000,000 | | | GATX Corp | | | 3.900 | % | | 03/30/23 | | | 1,017,676 | | |
| | 500,000 | | | Ingersoll-Rand Global Holding Co Ltd (a) | | | 4.250 | % | | 06/15/23 | | | 555,058 | | |
| | 1,000,000 | | | Flowserve Corp | | | 4.000 | % | | 11/15/23 | | | 1,028,262 | | |
| | 2,126,000 | | | Air Lease Corp | | | 4.850 | % | | 02/01/24 | | | 2,120,685 | | |
| | 500,000 | | | Pitney Bowes Inc | | | 4.625 | % | | 03/15/24 | | | 527,599 | | |
| | 500,000 | | | Toro Co/The | | | 7.800 | % | | 06/15/27 | | | 656,837 | | |
| | 500,000 | | | General Electric Capital Corp | | | 3.500 | % | | 05/15/32 | | | 503,893 | | |
| | 2,000,000 | | | Eaton Corp | | | 4.000 | % | | 11/02/32 | | | 2,134,266 | | |
| | 2,000,000 | | | General Electric Capital Corp | | | 4.000 | % | | 02/14/33 | | | 1,980,880 | | |
| | 1,000,000 | | | Pitney Bowes Inc | | | 5.250 | % | | 01/15/37 | | | 1,048,048 | | |
| | 590,000 | | | Eaton Corp | | | 4.150 | % | | 11/02/42 | | | 635,462 | | |
| | 500,000 | | | Lockheed Martin Corp | | | 4.070 | % | | 12/15/42 | | | 532,292 | | |
| | | | 18,488,510 | | |
18
Mairs & Power Balanced Fund
SCHEDULE OF INVESTMENTS (unaudited) (continued) June 30, 2016
Par Value | | Security Description | | Fair Value | |
| | | FIXED INCOME SECURITIES (continued) | |
| | | CORPORATE BONDS (continued) | |
| | | INFORMATION TECHNOLOGY 3.7% | |
$ | 500,000 | | | Western Union Co/The | | | 5.930 | % | | 10/01/16 | | $ | 504,891 | | |
| | 500,000 | | | Broadridge Financial Solutions Inc | | | 6.125 | % | | 06/01/17 | | | 519,185 | | |
| | 500,000 | | | Broadridge Financial Solutions Inc | | | 3.950 | % | | 09/01/20 | | | 533,571 | | |
| | 81,000 | | | Hewlett-Packard Co | | | 3.750 | % | | 12/01/20 | | | 85,561 | | |
| | 750,000 | | | Hewlett-Packard Co | | | 4.300 | % | | 06/01/21 | | | 796,486 | | |
| | 2,000,000 | | | NetApp Inc | | | 3.375 | % | | 06/15/21 | | | 2,032,376 | | |
| | 1,000,000 | | | eBay Inc | | | 3.800 | % | | 03/09/22 | | | 1,062,579 | | |
| | 500,000 | | | Motorola Solutions Inc | | | 3.750 | % | | 05/15/22 | | | 499,778 | | |
| | 2,000,000 | | | Symantec Corp | | | 3.950 | % | | 06/15/22 | | | 2,027,708 | | |
| | 1,000,000 | | | Computer Sciences Corp | | | 4.450 | % | | 09/15/22 | | | 1,066,067 | | |
| | 1,000,000 | | | Hewlett-Packard Co | | | 4.050 | % | | 09/15/22 | | | 1,060,118 | | |
| | 1,025,000 | | | Fiserv Inc | | | 3.500 | % | | 10/01/22 | | | 1,086,125 | | |
| | 2,000,000 | | | Autodesk Inc | | | 3.600 | % | | 12/15/22 | | | 2,044,864 | | |
| | 500,000 | | | Motorola Solutions Inc | | | 3.500 | % | | 03/01/23 | | | 482,687 | | |
| | 2,000,000 | | | Fidelity National Information Services Inc | | | 3.500 | % | | 04/15/23 | | | 2,076,562 | | |
| | 1,352,000 | | | Total System Services Inc | | | 3.750 | % | | 06/01/23 | | | 1,373,126 | | |
| | 2,000,000 | | | Diamond 1 Finance Corp / Diamond 2 Finance Corp (d) | | | 5.450 | % | | 06/15/23 | | | 2,075,146 | | |
| | 1,000,000 | | | Altera Corp | | | 4.100 | % | | 11/15/23 | | | 1,136,795 | | |
| | 500,000 | | | Motorola Solutions Inc | | | 4.000 | % | | 09/01/24 | | | 489,037 | | |
| | 1,000,000 | | | Lam Research Corp | | | 3.800 | % | | 03/15/25 | | | 1,033,780 | | |
| | 500,000 | | | Arrow Electronics Inc | | | 4.000 | % | | 04/01/25 | | | 511,518 | | |
| | 4,000,000 | | | Intel Corp | | | 4.000 | % | | 12/15/32 | | | 4,327,408 | | |
| | 1,500,000 | | | Western Union Co/The | | | 6.200 | % | | 11/17/36 | | | 1,602,633 | | |
| | | | 28,428,001 | | |
| | | MATERIALS 2.9% | |
| | 500,000 | | | Valspar Corp/The | | | 6.050 | % | | 05/01/17 | | | 516,623 | | |
| | 500,000 | | | Carpenter Technology Corp | | | 5.200 | % | | 07/15/21 | | | 499,757 | | |
| | 500,000 | | | Freeport-McMoRan Inc | | | 4.000 | % | | 11/14/21 | | | 451,719 | | |
| | 175,000 | | | Mosaic Co/The | | | 3.750 | % | | 11/15/21 | | | 185,857 | | |
| | 1,000,000 | | | Freeport-McMoRan Inc | | | 3.550 | % | | 03/01/22 | | | 880,000 | | |
| | 1,500,000 | | | Newmont Mining Corp | | | 3.500 | % | | 03/15/22 | | | 1,557,572 | | |
| | 500,000 | | | Barrick Gold Corp (a) | | | 3.850 | % | | 04/01/22 | | | 515,752 | | |
| | 1,000,000 | | | Domtar Corp | | | 4.400 | % | | 04/01/22 | | | 1,036,955 | | |
| | 1,000,000 | | | RPM International Inc | | | 3.450 | % | | 11/15/22 | | | 1,020,167 | | |
| | 500,000 | | | Carpenter Technology Corp | | | 4.450 | % | | 03/01/23 | | | 482,422 | | |
| | 500,000 | | | Freeport-McMoRan Inc | | | 3.875 | % | | 03/15/23 | | | 437,500 | | |
| | 1,402,000 | | | Reliance Steel & Aluminum Co | | | 4.500 | % | | 04/15/23 | | | 1,433,314 | | |
19
Mairs & Power Balanced Fund
SCHEDULE OF INVESTMENTS (unaudited) (continued) June 30, 2016
Par Value | | Security Description | | Fair Value | |
| | | FIXED INCOME SECURITIES (continued) | |
| | | CORPORATE BONDS (continued) | |
| | | MATERIALS (continued) | |
$ | 1,750,000 | | | Barrick Gold Corp (a) | | | 4.100 | % | | 05/01/23 | | $ | 1,846,014 | | |
| | 2,000,000 | | | Nucor Corp | | | 4.000 | % | | 08/01/23 | | | 2,135,922 | | |
| | 1,000,000 | | | BP Capital Markets PLC (a) | | | 3.994 | % | | 09/26/23 | | | 1,085,814 | | |
| | 1,000,000 | | | Mosaic Co/The | | | 4.250 | % | | 11/15/23 | | | 1,077,057 | | |
| | 1,000,000 | | | Eastman Chemical Co | | | 3.800 | % | | 03/15/25 | | | 1,056,881 | | |
| | 865,000 | | | Union Carbide Corp | | | 7.500 | % | | 06/01/25 | | | 1,083,112 | | |
| | 2,000,000 | | | CF Industries Inc | | | 5.150 | % | | 03/15/34 | | | 1,952,678 | | |
| | 1,250,000 | | | Dow Chemical Co/The | | | 4.250 | % | | 10/01/34 | | | 1,290,215 | | |
| | 1,000,000 | | | Alcoa Inc | | | 5.950 | % | | 02/01/37 | | | 935,000 | | |
| | 1,000,000 | | | Newmont Mining Corp | | | 4.875 | % | | 03/15/42 | | | 988,799 | | |
| | | | 22,469,130 | | |
| | | TELECOMMUNICATION SERVICES 0.7% | |
| | 500,000 | | | CenturyLink Inc | | | 6.150 | % | | 09/15/19 | | | 531,875 | | |
| | 3,000,000 | | | AT&T Inc | | | 3.000 | % | | 06/30/22 | | | 3,072,222 | | |
| | 500,000 | | | Qwest Capital Funding Inc | | | 6.875 | % | | 07/15/28 | | | 405,000 | | |
| | 1,000,000 | | | Verizon Communications Inc | | | 4.400 | % | | 11/01/34 | | | 1,031,147 | | |
| | | | 5,040,244 | | |
| | | UTILITIES 1.2% | |
| | 500,000 | | | Commonwealth Edison Co | | | 6.150 | % | | 09/15/17 | | | 530,043 | | |
| | 1,000,000 | | | Tampa Electric Co | | | 6.100 | % | | 05/15/18 | | | 1,082,056 | | |
| | 250,000 | | | Vectren Utility Holdings Inc | | | 5.750 | % | | 08/01/18 | | | 269,169 | | |
| | 250,000 | | | South Jersey Gas Co | | | 7.125 | % | | 10/22/18 | | | 275,741 | | |
| | 250,000 | | | United Utilities PLC (a) | | | 5.375 | % | | 02/01/19 | | | 268,129 | | |
| | 1,170,000 | | | ONEOK Inc | | | 4.250 | % | | 02/01/22 | | | 1,076,400 | | |
| | 785,000 | | | SCANA Corp | | | 4.125 | % | | 02/01/22 | | | 815,580 | | |
| | 1,000,000 | | | Exelon Generation Co LLC | | | 4.250 | % | | 06/15/22 | | | 1,066,560 | | |
| | 900,000 | | | National Fuel Gas Co | | | 3.750 | % | | 03/01/23 | | | 874,092 | | |
| | 1,060,000 | | | PSEG Power LLC | | | 4.300 | % | | 11/15/23 | | | 1,113,328 | | |
| | 1,550,000 | | | Dominion Resources Inc/VA | | | 3.625 | % | | 12/01/24 | | | 1,630,285 | | |
| | | | 9,001,383 | | |
| | | TOTAL CORPORATE BONDS | | | 234,199,933 | | |
| | | ASSET BACKED SECURITIES 2.1% | |
| | 325,471 | | | Continental Airlines 2009-1 Pass Through Trust | | | 9.000 | % | | 01/08/18 | | | 325,471 | | |
| | 220,865 | | | Continental Airlines 1997-4 Class B Pass Through Trust | | | 6.900 | % | | 07/02/18 | | | 224,178 | | |
| | 317,357 | | | American Airlines 2011-1 Class B Pass Through Trust (d) | | | 7.000 | % | | 07/31/19 | | | 332,019 | | |
20
Mairs & Power Balanced Fund
SCHEDULE OF INVESTMENTS (unaudited) (continued) June 30, 2016
Par Value | | Security Description | | Fair Value | |
| | | FIXED INCOME SECURITIES (continued) | |
| | | ASSET BACKED SECURITIES (continued) | |
$ | 49,319 | | | Continental Airlines 1999-1 Class B Pass Through Trust | | | 6.795 | % | | 02/02/20 | | $ | 51,139 | | |
| | 407,081 | | | Continental Airlines 2010-1 Class B Pass Through Trust | | | 6.000 | % | | 07/12/20 | | | 420,556 | | |
| | 278,907 | | | Delta Air Lines 2011-1 Class A Pass Through Trust | | | 5.300 | % | | 10/15/20 | | | 297,036 | | |
| | 506,350 | | | America West Airlines 2000-1 Pass Through Trust | | | 8.057 | % | | 01/02/22 | | | 566,150 | | |
| | 636,022 | | | American Airlines 2011-1 Class A Pass Through Trust | | | 5.250 | % | | 07/31/22 | | | 685,314 | | |
| | 453,213 | | | United Airlines 2014-1 Class B Pass Through Trust | | | 4.750 | % | | 10/11/23 | | | 454,936 | | |
| | 181,505 | | | Continental Airlines 2007-1 Class A Pass Through Trust | | | 5.983 | % | | 10/19/23 | | | 203,285 | | |
| | 340,798 | | | Southwest Airlines Co 2007-1 Pass Through Trust | | | 6.150 | % | | 02/01/24 | | | 382,102 | | |
| | 583,591 | | | American Airlines 2014-1 Class B Pass Through Trust | | | 4.375 | % | | 04/01/24 | | | 591,644 | | |
| | 1,000,000 | | | United Airlines 2015-1 Class A Pass Through Trust | | | 3.700 | % | | 06/01/24 | | | 1,010,000 | | |
| | 690,749 | | | US Airways 2010-1 Class A Pass Through Trust | | | 6.250 | % | | 10/22/24 | | | 768,873 | | |
| | 908,262 | | | American Airlines 2015-1 Class B Pass Through Trust | | | 3.700 | % | | 11/01/24 | | | 887,826 | | |
| | 1,452,826 | | | Delta Air Lines 2015-1 Class B Pass Through Trust | | | 4.250 | % | | 01/30/25 | | | 1,470,986 | | |
| | 362,459 | | | US Airways 2011-1 Class A Pass Through Trust | | | 7.125 | % | | 04/22/25 | | | 429,296 | | |
| | 2,138,622 | | | Hawaiian Airlines 2013-1 Class A Pass Through Certificates | | | 3.900 | % | | 01/15/26 | | | 2,103,977 | | |
| | 536,332 | | | Continental Airlines 2012-2 Class A Pass Through Trust | | | 4.000 | % | | 04/29/26 | | | 564,490 | | |
| | 927,072 | | | United Airlines 2013-1 Class A Pass Through Trust | | | 4.300 | % | | 02/15/27 | | | 995,490 | | |
| | 871,543 | | | US Airways 2013-1 Class A Pass Through Trust | | | 3.950 | % | | 05/15/27 | | | 915,120 | | |
| | 1,411,190 | | | American Airlines 2014-1 Class A Pass Through Trust | | | 3.700 | % | | 04/01/28 | | | 1,466,932 | | |
| | 500,000 | | | American Airlines 2015-2 Class A Pass Through Trust | | | 4.000 | % | | 03/22/29 | | | 516,250 | | |
| | | | 15,663,070 | | |
| | | PREFERRED SECURITIES 0.6% | |
| | 23,000 | | | Stifel Financial Corp | | | 5.375 | % | | 12/31/22 | | | 579,830 | | |
| | 10,000 | | | Raymond James Financial Inc | | | 6.900 | % | | 03/15/42 | | | 264,000 | | |
| | 20,000 | | | Protective Life Corp | | | 6.000 | % | | 09/01/42 | | | 524,600 | | |
| | 20,000 | | | Selective Insurance Group Inc | | | 5.875 | % | | 02/09/43 | | | 525,600 | | |
| | 40,000 | | | WR Berkley Corp | | | 5.625 | % | | 04/30/53 | | | 1,019,600 | | |
| | 20,000 | | | Verizon Communications Inc | | | 5.900 | % | | 02/15/54 | | | 550,000 | | |
| | 20,000 | | | American Financial Group Inc/OH | | | 6.250 | % | | 09/30/54 | | | 538,000 | | |
| | 20,000 | | | Qwest Corp | | | 6.875 | % | | 10/01/54 | | | 523,400 | | |
| | 10,000 | | | NextEra Energy Capital Holdings Inc | | | 5.700 | % | | 03/01/72 | | | 265,800 | | |
| | | | 4,790,830 | | |
| | TOTAL FIXED INCOME SECURITIES
(cost $245,910,769) | | $ | 254,653,833 | | |
21
Mairs & Power Balanced Fund
SCHEDULE OF INVESTMENTS (unaudited) (continued) June 30, 2016
Shares | | Security Description | | Fair Value | |
| | | COMMON STOCKS 64.1% | |
| | | CONSUMER DISCRETIONARY 3.0% | |
| | 72,000 | | | Home Depot Inc/The | | $ | 9,193,680 | | |
| | 192,000 | | | Target Corp | | | 13,405,440 | | |
| | | | 22,599,120 | | |
| | | CONSUMER STAPLES 3.3% | |
| | 90,000 | | | General Mills Inc | | | 6,418,800 | | |
| | 64,000 | | | Hershey Co/The | | | 7,263,360 | | |
| | 204,000 | | | Hormel Foods Corp | | | 7,466,400 | | |
| | 31,000 | | | Kimberly-Clark Corp | | | 4,261,880 | | |
| | | | 25,410,440 | | |
| | | ENERGY 6.2% | |
| | 76,000 | | | Chevron Corp | | | 7,967,080 | | |
| | 172,000 | | | ConocoPhillips Co | | | 7,499,200 | | |
| | 197,000 | | | Exxon Mobil Corp | | | 18,466,780 | | |
| | 166,000 | | | Schlumberger Ltd (a) | | | 13,127,280 | | |
| | | | 47,060,340 | | |
| | | FINANCIALS 8.9% | |
| | 78,000 | | | American Express Co | | | 4,739,280 | | |
| | 414,000 | | | Associated Banc-Corp | | | 7,100,100 | | |
| | 144,000 | | | JPMorgan Chase & Co | | | 8,948,160 | | |
| | 271,000 | | | Principal Financial Group Inc | | | 11,140,810 | | |
| | 35,000 | | | Travelers Cos Inc/The | | | 4,166,400 | | |
| | 519,000 | | | US Bancorp/MN | | | 20,931,270 | | |
| | 230,000 | | | Wells Fargo & Co | | | 10,885,900 | | |
| | | | 67,911,920 | | |
| | | HEALTH CARE 14.5% | |
| | 173,500 | | | Abbott Laboratories | | | 6,820,285 | | |
| | 84,000 | | | AbbVie Inc | | | 5,200,440 | | |
| | 131,000 | | | Baxter International Inc | | | 5,923,820 | | |
| | 74,500 | | | Bristol-Myers Squibb Co | | | 5,479,475 | | |
| | 71,000 | | | Eli Lilly & Co | | | 5,591,250 | | |
| | 160,000 | | | Johnson & Johnson | | | 19,408,000 | | |
| | 252,500 | | | Medtronic PLC (f) | | | 21,909,425 | | |
| | 458,000 | | | Pfizer Inc | | | 16,126,180 | | |
| | 419,000 | | | Roche Holding AG ADR (e) | | | 13,806,050 | | |
| | 19,414 | | | Shire PLC ADR (e) | | | 3,573,766 | | |
| | 51,000 | | | UnitedHealth Group Inc | | | 7,201,200 | | |
| | | | 111,039,891 | | |
22
Mairs & Power Balanced Fund
SCHEDULE OF INVESTMENTS (unaudited) (continued) June 30, 2016
Shares | | Security Description | | Fair Value | |
| | | COMMON STOCKS (continued) | |
| | | INDUSTRIALS 14.9% | |
| | 91,000 | | | 3M Co | | $ | 15,935,920 | | |
| | 127,000 | | | CH Robinson Worldwide Inc | | | 9,429,750 | | |
| | 26,000 | | | Deluxe Corp | | | 1,725,620 | | |
| | 256,000 | | | Emerson Electric Co | | | 13,352,960 | | |
| | 412,000 | | | General Electric Co | | | 12,969,760 | | |
| | 145,000 | | | Graco Inc | | | 11,453,550 | | |
| | 129,000 | | | Honeywell International Inc | | | 15,005,280 | | |
| | 138,000 | | | Pentair PLC (a) | | | 8,044,020 | | |
| | 40,000 | | | Toro Co/The | | | 3,528,000 | | |
| | 204,100 | | | United Parcel Service Inc, Class B | | | 21,985,652 | | |
| | | | 113,430,512 | | |
| | | INFORMATION TECHNOLOGY 5.3% | |
| | 420,000 | | | Corning Inc | | | 8,601,600 | | |
| | 60,000 | | | International Business Machines Corp | | | 9,106,800 | | |
| | 87,100 | | | MTS Systems Corp | | | 3,818,464 | | |
| | 125,000 | | | QUALCOMM Inc | | | 6,696,250 | | |
| | 637,000 | | | Western Union Co/The | | | 12,217,660 | | |
| | | | 40,440,774 | | |
| | | MATERIALS 6.6% | |
| | 164,000 | | | Bemis Co Inc | | | 8,444,360 | | |
| | 165,000 | | | Ecolab Inc | | | 19,569,000 | | |
| | 156,000 | | | HB Fuller Co | | | 6,862,440 | | |
| | 142,000 | | | Valspar Corp/The | | | 15,340,260 | | |
| | | | 50,216,060 | | |
| | | UTILITIES 1.4% | |
| | 88,000 | | | ALLETE Inc | | | 5,687,440 | | |
| | 119,000 | | | Xcel Energy Inc | | | 5,328,820 | | |
| | | | 11,016,260 | | |
| | | | TOTAL COMMON STOCKS
(cost $346,775,361) | | $ | 489,125,317 | | |
| | | PREFERRED STOCKS 0.0% (g) | |
| | | UTILITIES 0.0% (g) | |
| | 10,000 | | | SCE Trust I | | | 265,300 | | |
| | | | TOTAL PREFERRED STOCKS
(cost $250,000) | | $ | 265,300 | | |
23
Mairs & Power Balanced Fund
SCHEDULE OF INVESTMENTS (unaudited) (continued) June 30, 2016
Shares | | Security Description | | Fair Value | |
| | | SHORT-TERM INVESTMENTS 2.2% | |
| 16,644,486 | | | First American Prime Obligations Fund, Class Z, 0.27% (b)
(cost $16,644,486) | | $ | 16,644,486 | | |
| | TOTAL INVESTMENTS 99.7%
(cost $609,580,616) | | $ | 760,688,936 | | |
| | | OTHER ASSETS AND LIABILITIES (NET) 0.3% | | | 2,124,831 | | |
| | | TOTAL NET ASSETS 100.0% | | $ | 762,813,767 | | |
(a) Foreign security denominated in U.S. dollars. As of June 30, 2016, these securities represented $40,306,975 or 5.3% of total net assets.
(b) The rate quoted is the annualized seven-day effective yield as of June 30, 2016.
(c) Step Bonds – securities for which the interest rate will adjust on specified future date(s). The rate disclosed represents the coupon rate in effect as of June 30, 2016.
(d) Securities exempt from registration under Rule 144A of the Securities Act of 1933. These securities may be resold in transactions exempt from registration, normally to qualified institutional buyers. These securities have been determined to be liquid under guidelines established by the Fund's Board of Trustees. As of June 30, 2016, these securities represented $15,065,882 or 2.0% of total net assets.
(e) American Depositary Receipt.
(f) Issuer headquartered overseas but considered domestic. In determining whether a security is foreign or domestic, the Adviser will generally look at the location of the headquarters of the issuer. However, if the issuer is believed by the Adviser to be headquartered in a jurisdiction primarily for tax purposes, the Adviser will consider the following additional factors: 1) the location of the primary exchange trading its securities; 2) where it derives the majority of its revenues, or 3) where it earns the majority of its profits.
(g) Percentage is less than 0.05%.
The Global Industry Classification Standard (GICS®) was developed by and/or is the exclusive property of MSCI, Inc. and Standard & Poor's Financial Services LLC ("S&P"). GICS is a service mark of MSCI, Inc. and S&P and has been licensed for use by the Adviser.
See accompanying Notes to Financial Statements.
24
MAIRS & POWER SMALL CAP FUND (unaudited)
To Our Shareholders: June 30, 2016
The Small Cap Fund is up 6.81% in the second quarter and up 11.86% for the first six months of the year, significantly outperforming both the index and peers over both periods. The S&P Small Cap 600 Total Return (TR) is up 3.48% for the second quarter and 6.23% for the first half of the year while the Morningstar Small Cap Blend Category is up 2.43% and 2.98% over the same periods respectively.
Stock selection was the primary factor driving outperformance in the first half of the year, but sector allocation also played a positive role. Specifically, the Fund's underweight position in small cap healthcare stocks helped performance in the first six months of the year as that sector was the worst performing in the S&P 600. An overweight position in the materials sector also added a small amount to relative performance.
The benefit of stock selection has been quite strong as individual holdings have performed well for the first half of the year, rewarding our patient approach to investing. Agree Realty (ADC) has been one of the strongest contributors to relative performance in the first half of 2016. This REIT (Real Estate Investment Trust), based in Bloomfield Hills, Michigan, invests primarily in properties that are leased to industry-leading retail tenants like Walgreens (WBA) and CVS (CVS). As larger retailers look to expand in smaller-footprint urban stores, Agree's real estate portfolio has become more attractive. Also, with interest rates remaining under pressure in the first half of the year, stocks like Agree paying higher dividend yields have become more attractive to investors.
MDU Resources (MDU), a utility based in Bismarck, North Dakota, was also a strong contributor to performance in both the quarter and first half. The stock also benefited from the strength among higher dividend paying stocks as well as the recovery in energy prices in the first half of the year as much of its rate base is impacted to some degree by oil prices in the Bakken.
Bio-Techne (TECH) was another stock that performed well in the second quarter and the first half of the year. Organic growth has accelerated nicely at this bio-tech research and diagnostics company as it has transformed itself under the leadership of a new CEO, Chuck Kummeth. In our opinion, he has done a good job leveraging Bio-Techne's historically strong product portfolio across a broader delivery platform resulting in better distribution. Bio-Techne continues to be a core holding of the Fund as we look for the company to continue to execute on Mr. Kummeth's long-term plan.
MAIRS & POWER SMALL CAP FUND (MSCFX)
Top Performers
Second Quarter (3/31/16 – 6/30/16) | | Year To Date (12/31/15 – 6/30/16) | |
Cardiovascular Systems Inc. | | | 73.71 | % | | Agree Realty Corporation | | | 35.69 | % | |
Agree Realty Corporation | | | 21.92 | % | | MDU Resources Group, Inc. | | | 24.77 | % | |
MDU Resources Group, Inc. | | | 19.85 | % | | Bio-Techne Corporation | | | 19.07 | % | |
Bio-Techne Corporation | | | 15.83 | % | | Badger Meter, Inc. | | | 18.42 | % | |
Oshkosh Corporation | | | 13.26 | % | | Physicians Realty Trust | | | 18.38 | % | |
Weak Performers
Second Quarter (3/31/16 – 6/30/16) | | Year To Date (12/31/15 – 6/30/16) | |
Cray Inc. | | | -32.09 | % | | MTS Systems Corp. | | | -37.09 | % | |
MTS Systems Corp. | | | -31.43 | % | | Gentherm, Inc. | | | -33.97 | % | |
Proto Labs, Inc. | | | -28.81 | % | | SPS Commerce, Inc. | | | -19.92 | % | |
Gentherm, Inc. | | | -21.13 | % | | Buffalo Wild Wings, Inc. | | | -19.20 | % | |
Actuant Corp | | | -11.98 | % | | Cray Inc. | | | -14.03 | % | |
Past performance is no guarantee of future results.
25
MAIRS & POWER SMALL CAP FUND (unaudited) (continued)
The Fund established a new position in Marcus Corp. (MCS) in the second quarter. Marcus, based in Milwaukee, Wisconsin, owns and operates 53 theatres and 18 hotels. In the theatre segment, Marcus typically holds a number one or number two position in the markets in which it competes (focused in the Midwest) and has been investing relative to competitors. So, despite slow market growth, we anticipate the company will continue to take market share at a pretty strong clip. The addition of food and alcohol sales in select theatres should also benefit margins over time.
With the recovery in energy prices, the stock of Northern Oil and Gas (NOG) moved up sharply in the second quarter from its lows, giving us the opportunity to exit a relatively small position that we had held in the portfolio for some time.
While valuations are high on an absolute basis relative to historical norms, and we have been hindered somewhat by the current low-rate and strong-dollar environment in the short-term, we believe there are still pockets of opportunity to invest in companies with strong competitive positions. The Fund saw strong cash inflows in the second quarter and we have been putting that cash to work in companies we feel have strong competitive positions over the long-term. We have been pleased with the interest in the Fund and its growth over the last several years and we are looking forward to celebrating the Fund's five-year anniversary this coming August 11th.
Andrew R. Adams
Lead Manager | | Allen D. Steinkopf
Co-Manager | |
The Fund's investment objective, risks, charges and expenses must be considered carefully before investing. The summary prospectus or full prospectus contains this and other important information about the Fund and they may be obtained by calling Shareholder Services at (800) 304-7404 or by visiting www.mairsandpower.com. Read the summary prospectus or full prospectus carefully before investing.
All holdings in the portfolio are subject to change without notice and may or may not represent current or future portfolio composition. The mention of specific securities is not intended as a recommendation or an offer of a particular security, nor is it intended to be a solicitation for the purchase or sale of any security.
All investments have risks. The Small Cap Fund is designed for long-term investors. Equity investments are subject to market fluctuations and the Fund's share price can fall because of weakness in the broad market, a particular industry or specific holdings. Investments in small and midcap companies generally are more volatile. International investing risks include among others political, social or economic instability, difficulty in predicting international trade patterns, taxation and foreign trading practices, and greater fluctuations in price than U.S. corporations. The Fund may invest in initial public offerings by small cap companies, which can involve greater risk than investments in companies that are already publicly traded.
Diversification does not guarantee profit or protect against loss.
S&P 600 Small Cap Total Return (TR) (S&P 600) is an index of small company stocks managed by Standard & Poor's that covers a broad range of small cap stocks in the U.S. The index is weighted according to market capitalization and covers about 3-4% of the total market for equities in the U.S. It tracks both the capital gains of a group of stocks over time and assumes that any cash distributions, such as dividends, are reinvested back into the index. It is not possible to invest directly in an index.
Morningstar Small Blend Category, as defined by Morningstar, are stocks in the bottom 10% of the capitalization of the U.S. equity market are defined as small cap. The blend style is assigned to portfolios where neither growth nor value characteristics predominate. It is not possible to invest directly in an index.
26
Mairs & Power Small Cap Fund
PERFORMANCE INFORMATION (unaudited) June 30, 2016
Investment performance since commencement of operations (through June 30, 2016)
This chart illustrates the performance of a hypothetical $10,000 investment made in the Fund since commencement of operations.
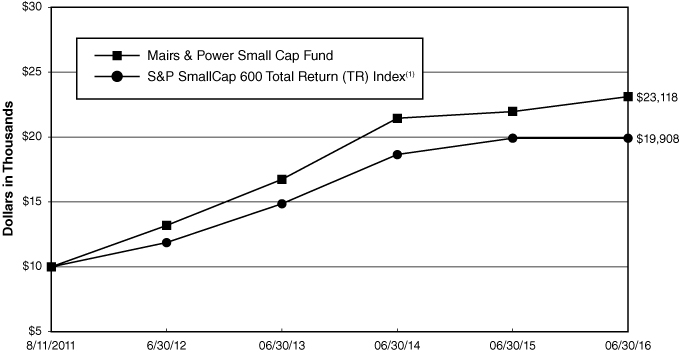
Average annual total returns for periods ended June 30, 2016
| | | 1 Year | | 3 Year | | Since Inception(2) | |
Mairs & Power Small Cap Fund | | | 5.25 | % | | | 11.36 | % | | | 18.70 | % | |
S&P SmallCap 600 Total Return (TR) Index(1) | | | -0.03 | % | | | 10.23 | % | | | 15.13 | % | |
Performance data quoted represents past performance and does not guarantee future results. All performance information shown includes the reinvestment of dividend and capital gain distributions, but does not reflect the deduction of taxes that a shareholder would pay on Fund distributions or the redemption of Fund shares. The investment return and principal value of an investment will fluctuate so that an investor's shares, when redeemed, may be worth more or less than their original cost. Current performance of the Fund may be lower or higher than the performance quoted. For the most recent month-end performance figures, visit the Fund's website at www.mairsandpower.com or call Shareholder Services at (800) 304-7404.
(1) The S&P Small Cap 600 Total Return (TR) Index is an index of small-company stocks managed by Standard & Poor's that covers a broad range of small cap stocks in the U.S. The index is weighted according to market capitalization and covers about 3-4% of the total market for equities in the U.S. It tracks both the capital gains of a group of stocks over time and assumes that any cash distributions, such as dividends, are reinvested back into the index. It is not possible to invest directly in an index.
(2) Since inception performance is as of August 11, 2011, which is the offering date of the Small Cap Fund.
27
Mairs & Power Small Cap Fund
FUND INFORMATION (unaudited) June 30, 2016
Portfolio Managers
Andrew R. Adams, lead manager since 2011
University of Wisconsin-Madison, MS Finance 1997
Allen D. Steinkopf, co-manager since January 1, 2015,
University of Minnesota, MBA Finance 1986
General Information
Fund Symbol | | MSCFX | |
Net Asset Value (NAV) Per Share | | $ | 21.79 | | |
Expense Ratio | | | 1.07 | %1 | |
Portfolio Turnover Rate | | | 14.34 | % | |
Sales Charge | | | None2 | | |
Fund Inception Year | | | 2011 | | |
Portfolio Composition
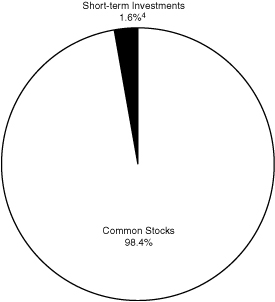
Top Ten Portfolio Holdings
(Percent of Total Net Assets) 3
PrivateBancorp Inc | | | 3.6 | % | |
Oshkosh Corp | | | 3.5 | | |
Bio-Techne Corp | | | 3.5 | | |
Donaldson Co Inc | | | 3.5 | | |
Apogee Enterprises Inc | | | 3.4 | | |
Bemis Co Inc | | | 3.2 | | |
Wintrust Financial Corp | | | 3.2 | | |
ALLETE Inc | | | 3.1 | | |
United Fire Group Inc | | | 3.0 | | |
Great Western Bancorp Inc | | | 3.0 | | |
Portfolio Diversification
(Percent of Total Net Assets)
Common Stocks 98.4% | |
Industrials | | | 28.7 | % | |
Financials | | | 26.1 | | |
Information Technology | | | 12.9 | | |
Materials | | | 8.3 | | |
Health Care | | | 7.5 | | |
Utilities | | | 5.9 | | |
Consumer Discretionary | | | 5.4 | | |
Consumer Staples | | | 3.0 | | |
Energy | | | 0.6 | | |
Short-term Investments 1.6%4 | | | 1.6 | | |
| | | | 100.0 | % | |
1 Ratio has been annualized for the six month period ended June 30, 2016.
2 Although the Fund is no-load, investment management fees and other expenses still apply.
3 All holdings in the portfolio are subject to change without notice and may or may not represent current or future portfolio composition. The mention of specific securities is not intended as a recommendation or offer for a particular security, nor is it intended to be a solicitation for the purchase or sale of any security.
4 Represents short-term investments and other assets and liabilities (net).
The Global Industry Classification Standard (GICS®) was developed by and/or is the exclusive property of MSCI, Inc. and Standard & Poor's Financial Services LLC ("S&P"). GICS is a service mark of MSCI, Inc. and S&P and has been licensed for use by the Adviser.
28
Mairs & Power Small Cap Fund
SCHEDULE OF INVESTMENTS (unaudited) June 30, 2016
Shares | | Security Description | | Fair Value | |
| | | COMMON STOCKS 98.4% | |
| | | CONSUMER DISCRETIONARY 5.4% | |
| | 30,600 | | | Buffalo Wild Wings Inc (b) | | $ | 4,251,870 | | |
| | 185,985 | | | Gentherm Inc (b) | | | 6,369,986 | | |
| | 138,985 | | | Marcus Corp/The | | | 2,932,584 | | |
| | | | 13,554,440 | | |
| | | CONSUMER STAPLES 3.0% | |
| | 57,000 | | | Casey's General Stores Inc | | | 7,496,070 | | |
| | | ENERGY 0.6% | |
| | 173,500 | | | Oasis Petroleum Inc (b) | | | 1,620,490 | | |
| | | FINANCIALS 26.1% | |
| | 155,306 | | | Agree Realty Corp | | | 7,491,961 | | |
| | 366,900 | | | Associated Banc-Corp | | | 6,292,335 | | |
| | 262,613 | | | Bank Mutual Corp | | | 2,016,868 | | |
| | 305,716 | | | Cardinal Financial Corp | | | 6,707,409 | | |
| | 160,196 | | | EMC Insurance Group Inc | | | 4,440,633 | | |
| | 237,700 | | | Great Western Bancorp Inc | | | 7,497,058 | | |
| | 323,000 | | | Physicians Realty Trust | | | 6,786,230 | | |
| | 203,150 | | | PrivateBancorp Inc | | | 8,944,695 | | |
| | 177,112 | | | United Fire Group Inc | | | 7,514,862 | | |
| | 157,400 | | | Wintrust Financial Corp | | | 8,027,400 | | |
| | | | 65,719,451 | | |
| | | HEALTH CARE 7.5% | |
| | 77,500 | | | Bio-Techne Corp | | | 8,739,675 | | |
| | 115,715 | | | Cardiovascular Systems Inc (b) | | | 2,126,263 | | |
| | 100,700 | | | Patterson Cos Inc | | | 4,822,523 | | |
| | 74,173 | | | Vascular Solutions Inc (b) | | | 3,090,047 | | |
| | | | 18,778,508 | | |
| | | INDUSTRIALS 28.7% | |
| | 276,800 | | | Actuant Corp | | | 6,258,448 | | |
| | 182,900 | | | Apogee Enterprises Inc | | | 8,477,415 | | |
| | 33,000 | | | Deluxe Corp | | | 2,190,210 | | |
| | 252,868 | | | Donaldson Co Inc | | | 8,688,544 | | |
| | 74,139 | | | G&K Services Inc, Class A | | | 5,676,823 | | |
| | 144,500 | | | Generac Holdings Inc (b) | | | 5,051,720 | | |
| | 78,700 | | | Graco Inc | | | 6,216,513 | | |
| | 151,400 | | | Hub Group Inc, Class A (b) | | | 5,809,218 | | |
| | 184,400 | | | Oshkosh Corp | | | 8,797,724 | | |
29
Mairs & Power Small Cap Fund
SCHEDULE OF INVESTMENTS (unaudited) (continued) June 30, 2016
Shares | | Security Description | | Fair Value | |
| | | COMMON STOCKS (continued) | |
| | | INDUSTRIALS (continued) | |
| | 32,600 | | | Proto Labs Inc (b) | | $ | 1,876,456 | | |
| | 320,572 | | | Raven Industries Inc | | | 6,071,634 | | |
| | 32,200 | | | Snap-on Inc | | | 5,081,804 | | |
| | 23,200 | | | Toro Co/The | | | 2,046,240 | | |
| | | | 72,242,749 | | |
| | | INFORMATION TECHNOLOGY 12.9% | |
| | 83,696 | | | Badger Meter Inc | | | 6,112,319 | | |
| | 230,689 | | | Cray Inc (b) | | | 6,902,215 | | |
| | 161,675 | | | MOCON Inc | | | 2,289,318 | | |
| | 33,665 | | | MTS Systems Corp | | | 1,475,874 | | |
| | 67,034 | | | NVE Corp | | | 3,931,544 | | |
| | 42,700 | | | SPS Commerce Inc (b) | | | 2,587,620 | | |
| | 135,000 | | | Stratasys Ltd (a) (b) | | | 3,090,150 | | |
| | 211,887 | | | VASCO Data Security International Inc (b) | | | 3,472,828 | | |
| | 179,520 | | | Workiva Inc (b) | | | 2,452,243 | | |
| | | | 32,314,111 | | |
| | | MATERIALS 8.3% | |
| | 156,100 | | | Bemis Co Inc | | | 8,037,589 | | |
| | 153,980 | | | Hawkins Inc | | | 6,684,272 | | |
| | 99,400 | | | HB Fuller Co | | | 4,372,606 | | |
| | 16,900 | | | Valspar Corp/The | | | 1,825,707 | | |
| | | | 20,920,174 | | |
| | | UTILITIES 5.9% | |
| | 122,000 | | | ALLETE Inc | | | 7,884,860 | | |
| | 289,700 | | | MDU Resources Group Inc | | | 6,952,800 | | |
| | | | 14,837,660 | | |
| | | | TOTAL COMMON STOCKS
(cost $206,082,808) | | $ | 247,483,653 | | |
| | | SHORT-TERM INVESTMENTS 1.7% | |
| 4,369,726 | | | First American Prime Obligations Fund, Class Z, 0.27% (c)
(cost $4,369,726) | | $ | 4,369,726 | | |
| | | | TOTAL INVESTMENTS 100.1%
(cost $210,452,534) | | $ | 251,853,379 | | |
| | | | | OTHER ASSETS AND LIABILITIES (NET) (0.1)% | | | (273,954 | ) | |
| | | | | TOTAL NET ASSETS 100.0% | | $ | 251,579,425 | | |
30
Mairs & Power Small Cap Fund
SCHEDULE OF INVESTMENTS (unaudited) (continued) June 30, 2016
(a) Foreign security denominated in U.S. dollars. As of June 30, 2016, these securities represented $3,090,150 or 1.2% of total net assets.
(b) Non-income producing.
(c) The rate quoted is the annualized seven-day effective yield as of June 30, 2016.
The Global Industry Classification Standard (GICS®) was developed by and/or is the exclusive property of MSCI, Inc. and Standard & Poor's Financial Services LLC ("S&P"). GICS is a service mark of MSCI, Inc. and S&P and has been licensed for use by the Adviser.
See accompanying Notes to Financial Statements.
31
STATEMENTS OF ASSETS AND LIABILITIES June 30, 2016
| | | Mairs & Power
Growth Fund | | Mairs & Power
Balanced Fund | | Mairs & Power
Small Cap Fund | |
ASSETS | |
| Investments, at fair value (Note 1): | |
Unaffiliated securities * | | $ | 4,224,073,161 | | | $ | 760,688,936 | | | $ | 251,853,379 | | |
| Affiliated securities (Note 5) * | | | 20,462,457 | | | | - | | | | - | | |
| | | | 4,244,535,618 | | | | 760,688,936 | | | | 251,853,379 | | |
Receivable for Fund shares sold | | | 8,719,258 | | | | 2,602,513 | | | | 3,190,829 | | |
Receivable for securities sold | | | 6,841,342 | | | | - | | | | - | | |
Dividends and interest receivable | | | 4,738,919 | | | | 3,269,347 | | | | 231,961 | | |
Prepaid expenses and other assets | | | 130,302 | | | | 49,508 | | | | 34,236 | | |
| | | | 4,264,965,439 | | | | 766,610,304 | | | | 255,310,405 | | |
LIABILITIES | |
Payable for Fund shares redeemed | | | 1,616,181 | | | | 505,232 | | | | 163,827 | | |
Payable for securities purchased | | | 5,324,984 | | | | 2,799,367 | | | | 3,341,599 | | |
| Accrued investment management fees (Note 2) | | | 1,889,174 | | | | 352,975 | | | | 172,538 | | |
| Accrued Fund administration fees (Note 2) | | | 131,175 | | | | 22,781 | | | | 5,033 | | |
Accrued audit and tax expense | | | 35,286 | | | | 32,118 | | | | 17,033 | | |
Accrued transfer agent fees | | | 184,229 | | | | 34,263 | | | | 15,919 | | |
Other accrued expenses | | | 160,487 | | | | 49,801 | | | | 15,031 | | |
| | | | 9,341,516 | | | | 3,796,537 | | | | 3,730,980 | | |
NET ASSETS | | $ | 4,255,623,923 | | | $ | 762,813,767 | | | $ | 251,579,425 | | |
NET ASSETS CONSIST OF | |
Portfolio capital | | $ | 2,243,472,656 | | | $ | 600,363,016 | | | $ | 208,668,070 | | |
Undistributed net investment income | | | 338,540 | | | | 112,087 | | | | 763,781 | | |
Undistributed net realized gain on investments | | | 134,610,069 | | | | 11,230,344 | | | | 746,729 | | |
Net unrealized appreciation on investments | | | 1,877,202,658 | | | | 151,108,320 | | | | 41,400,845 | | |
TOTAL NET ASSETS | | $ | 4,255,623,923 | | | $ | 762,813,767 | | | $ | 251,579,425 | | |
Fund shares, par value | | $ | 0.01 | | | $ | 0.01 | | | $ | 0.01 | | |
Authorized | | | unlimited | | | | unlimited | | | | unlimited | | |
Fund shares issued and outstanding | | | 36,953,065 | | | | 8,777,303 | | | | 11,543,130 | | |
Net asset value per share | | $ | 115.16 | | | $ | 86.91 | | | $ | 21.79 | | |
* Cost of investments | |
Cost of unaffiliated securities | | $ | 2,348,849,502 | | | $ | 609,580,616 | | | $ | 210,452,534 | | |
| Cost of affiliated securities (Note 5) | | | 18,483,458 | | | | - | | | | - | | |
| | | $ | 2,367,332,960 | | | $ | 609,580,616 | | | $ | 210,452,534 | | |
See accompanying Notes to Financial Statements.
32
STATEMENTS OF OPERATIONS Six Months Ended June 30, 2016
| | | Mairs & Power
Growth Fund | | Mairs & Power
Balanced Fund | | Mairs & Power
Small Cap Fund | |
INVESTMENT INCOME | |
Income: | |
Dividends from unaffiliated securities * | | $ | 41,318,261 | | | $ | 6,081,426 | | | $ | 1,783,321 | | |
| Dividends from affiliated securities (Note 5) | | | 934,782 | | | | - | | | | - | | |
Interest income | | | 75,609 | | | | 4,901,660 | | | | 6,029 | | |
TOTAL INCOME | | | 42,328,652 | | | | 10,983,086 | | | | 1,789,350 | | |
Expenses: | |
| Investment management fees (Note 2) | | | 11,061,713 | | | | 2,057,415 | | | | 907,800 | | |
| Fund administration fees (Note 2) | | | 416,428 | | | | 72,285 | | | | 16,172 | | |
Fund accounting fees | | | 206,438 | | | | 69,937 | | | | 26,380 | | |
| Trustees' fees (Note 2) | | | 138,265 | | | | 23,322 | | | | 4,998 | | |
Transfer agent fees | | | 758,174 | | | | 154,852 | | | | 64,629 | | |
Custodian fees | | | 119,195 | | | | 22,291 | | | | 6,155 | | |
Legal and audit fees | | | 74,798 | | | | 25,150 | | | | 19,487 | | |
Printing and mailing fees | | | 77,196 | | | | 12,561 | | | | 8,641 | | |
Other fees | | | 102,024 | | | | 44,177 | | | | 22,408 | | |
TOTAL EXPENSES | | | 12,954,231 | | | | 2,481,990 | | | | 1,076,670 | | |
NET INVESTMENT INCOME | | | 29,374,421 | | | | 8,501,096 | | | | 712,680 | | |
| REALIZED AND UNREALIZED GAIN (LOSS) (Note 4) | |
Net realized gain (loss) on investments | |
Unaffiliated issuers | | | 123,004,731 | | | | 11,230,760 | | | | (408,369 | ) | |
| Affiliated issuers (Note 5) | | | 9,381,415 | | | | - | | | | - | | |
| | | | 132,386,146 | | | | 11,230,760 | | | | (408,369 | ) | |
Change in net unrealized appreciation
on investments | | | 255,067,062 | | | | 35,832,592 | | | | 23,031,379 | | |
NET GAIN ON INVESTMENTS | | | 387,453,208 | | | | 47,063,352 | | | | 22,623,010 | | |
NET INCREASE IN NET ASSETS FROM
OPERATIONS | | $ | 416,827,629 | | | $ | 55,564,448 | | | $ | 23,335,690 | | |
* Net of foreign taxes withheld of: | | $ | 268,707 | | | $ | 46,566 | | | $ | - | | |
See accompanying Notes to Financial Statements.
33
Mairs & Power Growth Fund
STATEMENTS OF CHANGES IN NET ASSETS
| | | Six Months Ended
June 30, 2016
(Unaudited) | | Year Ended
December 31,
2015 | |
OPERATIONS | |
Net investment income | | $ | 29,374,421 | | | $ | 59,065,735 | | |
Net realized gain on investments sold | | | 132,386,146 | | | | 252,006,785 | | |
Net change in unrealized appreciation (depreciation) of investments | | | 255,067,062 | | | | (439,524,058 | ) | |
NET INCREASE (DECREASE) IN NET ASSETS FROM OPERATIONS | | | 416,827,629 | | | | (128,451,538 | ) | |
DISTRIBUTIONS TO SHAREHOLDERS FROM | |
Net investment income | | | (29,347,042 | ) | | | (58,959,603 | ) | |
Net realized gain on investments sold | | | - | | | | (228,500,497 | ) | |
TOTAL DISTRIBUTIONS TO SHAREHOLDERS | | | (29,347,042 | ) | | | (287,460,100 | ) | |
CAPITAL TRANSACTIONS | |
Proceeds from shares sold | | | 299,026,726 | | | | 331,027,955 | | |
Reinvestment of distributions from net investment income and net
realized gains | | | 27,341,401 | | | | 270,332,473 | | |
Cost of shares redeemed | | | (295,489,054 | ) | | | (645,659,818 | ) | |
INCREASE (DECREASE) IN NET ASSETS FROM CAPITAL
TRANSACTIONS | | | 30,879,073 | | | | (44,299,390 | ) | |
TOTAL INCREASE (DECREASE) IN NET ASSETS | | | 418,359,660 | | | | (460,211,028 | ) | |
NET ASSETS | |
Beginning of period | | | 3,837,264,263 | | | | 4,297,475,291 | | |
End of period (including undistributed net investment income of $338,540
and $311,161, respectively) | | $ | 4,255,623,923 | | | $ | 3,837,264,263 | | |
FUND SHARE TRANSACTIONS | |
Shares sold | | | 2,734,906 | | | | 2,892,783 | | |
Shares issued for reinvested distributions | | | 241,553 | | | | 2,541,574 | | |
Shares redeemed | | | (2,763,262 | ) | | | (5,676,993 | ) | |
NET INCREASE (DECREASE) IN FUND SHARES | | | 213,197 | | | | (242,636 | ) | |
See accompanying Notes to Financial Statements.
34
Mairs & Power Balanced Fund
STATEMENTS OF CHANGES IN NET ASSETS
| | | Six Months Ended
June 30, 2016
(Unaudited) | | Year Ended
December 31,
2015 | |
OPERATIONS | |
Net investment income | | $ | 8,501,096 | | | $ | 17,755,547 | | |
Net realized gain on investments sold | | | 11,230,760 | | | | 12,964,451 | | |
Net change in unrealized appreciation (depreciation) of investments | | | 35,832,592 | | | | (48,688,684 | ) | |
NET INCREASE (DECREASE) IN NET ASSETS FROM OPERATIONS | | | 55,564,448 | | | | (17,968,686 | ) | |
DISTRIBUTIONS TO SHAREHOLDERS FROM | |
Net investment income | | | (8,440,903 | ) | | | (17,726,802 | ) | |
Net realized gain on investments sold | | | - | | | | (10,512,671 | ) | |
TOTAL DISTRIBUTIONS TO SHAREHOLDERS | | | (8,440,903 | ) | | | (28,239,473 | ) | |
CAPITAL TRANSACTIONS | |
Proceeds from shares sold | | | 104,683,300 | | | | 129,627,679 | | |
Reinvestment of distributions from net investment income and net
realized gains | | | 8,140,278 | | | | 27,208,349 | | |
Cost of shares redeemed | | | (64,813,617 | ) | | | (165,811,060 | ) | |
INCREASE (DECREASE) IN NET ASSETS FROM CAPITAL TRANSACTIONS | | | 48,009,961 | | | | (8,975,032 | ) | |
TOTAL INCREASE (DECREASE) IN NET ASSETS | | | 95,133,506 | | | | (55,183,191 | ) | |
NET ASSETS | |
Beginning of period | | | 667,680,261 | | | | 722,863,452 | | |
End of period (including undistributed net investment income of $112,087
and $51,894, respectively) | | $ | 762,813,767 | | | $ | 667,680,261 | | |
FUND SHARE TRANSACTIONS | |
Shares sold | | | 1,248,455 | | | | 1,515,184 | | |
Shares issued for reinvested distributions | | | 95,747 | | | | 329,306 | | |
Shares redeemed | | | (793,248 | ) | | | (1,947,368 | ) | |
NET INCREASE (DECREASE) IN FUND SHARES | | | 550,954 | | | | (102,878 | ) | |
See accompanying Notes to Financial Statements.
35
Mairs & Power Small Cap Fund
STATEMENTS OF CHANGES IN NET ASSETS
| | | Six Months Ended
June 30, 2016
(Unaudited) | | Year Ended
December 31,
2015 | |
OPERATIONS | |
Net investment income | | $ | 712,680 | | | $ | 818,141 | | |
Net realized gain (loss) on investments sold | | | (408,369 | ) | | | 3,703,249 | | |
Net change in unrealized appreciation (depreciation) of investments | | | 23,031,379 | | | | (14,284,540 | ) | |
NET INCREASE (DECREASE) IN NET ASSETS FROM OPERATIONS | | | 23,335,690 | | | | (9,763,150 | ) | |
DISTRIBUTIONS TO SHAREHOLDERS FROM | |
Net investment income | | | - | | | | (775,082 | ) | |
Net realized gain on investments sold | | | - | | | | (1,448,411 | ) | |
TOTAL DISTRIBUTIONS TO SHAREHOLDERS | | | - | | | | (2,223,493 | ) | |
CAPITAL TRANSACTIONS | |
Proceeds from shares sold | | | 55,228,774 | | | | 73,280,213 | | |
Reinvestment of distributions from net investment income and net
realized gains | | | - | | | | 2,142,806 | | |
Cost of shares redeemed* | | | (20,822,087 | ) | | | (31,829,601 | ) | |
INCREASE IN NET ASSETS FROM CAPITAL TRANSACTIONS | | | 34,406,687 | | | | 43,593,418 | | |
TOTAL INCREASE IN NET ASSETS | | | 57,742,377 | | | | 31,606,775 | | |
NET ASSETS | |
Beginning of period | | | 193,837,048 | | | | 162,230,273 | | |
End of period (including undistributed net investment income of $763,781
and $51,101, respectively) | | $ | 251,579,425 | | | $ | 193,837,048 | | |
FUND SHARE TRANSACTIONS | |
Shares sold | | | 2,677,182 | | | | 3,559,455 | | |
Shares issued for reinvested distributions | | | - | | | | 108,496 | | |
Shares redeemed | | | (1,084,251 | ) | | | (1,567,067 | ) | |
NET INCREASE IN FUND SHARES | | | 1,592,931 | | | | 2,100,884 | | |
| * Net of redemption fees of: | | $ | 7,256 | | | $ | 35,663 | | |
See accompanying Notes to Financial Statements.
36
NOTES TO FINANCIAL STATEMENTS (unaudited) June 30, 2016
Note 1 – Organization and Significant Accounting Policies
Mairs & Power Funds Trust (the Trust) is a no-load, diversified, open-end management investment company registered under the Investment Company Act of 1940, as amended (the 1940 Act). Mairs & Power Growth Fund (the Growth Fund), Mairs & Power Balanced Fund (the Balanced Fund) and Mairs & Power Small Cap Fund (the Small Cap Fund) (individually a Fund and collectively the Funds) are series within the Trust. The objective of the Growth Fund is to provide shareholders with a diversified portfolio of common stocks, which have the potential for above-average, long-term appreciation. The objective of the Balanced Fund is to provide capital growth, current income and preservation of capital. The objective of the Small Cap Fund is to seek above-average, long-term appreciation. Each Fund is an investment company and accordingly follows the investment company accounting and reporting guidance of the Financial Accounting Standards Board (FASB) Accounting Standard Codification Topic 946 "Financial Services – Investment Companies."
Significant accounting policies of the Funds are as follows:
Security Valuations
Security valuations for each Fund's investments are furnished by independent pricing services that have been approved by the Trust's Board of Trustees (the Board). Investments in listed equity securities are valued at the last quoted sale price on the securities exchange on which such securities are principally traded or at the NASDAQ Official Closing Price if readily available for such securities on each business day. Other equity securities traded in the over-the-counter market and listed equity securities for which no sale was reported on that date are valued at the last quoted bid price. Debt obligations exceeding 60 days to maturity are valued at the bid price furnished by an independent pricing service. Debt obligations with 60 days or less remaining until maturity may be valued at the bid price furnished by an independent pricing service and in certain circumstances may be valued at their amortized cost, which approximates fair value. Pricing service prices for debt obligations are based on various evaluative and matrix-based methodologies and models that use market inputs such as market transactions, dealer quotations, benchmark yields and issuer, industry and economic events. These techniques generally consider overall market conditions and such factors as yields or prices of bonds of comparable quality, type of issue, coupon, maturity and ratings.
Securities for which prices are not available from an independent pricing service, but where an active market exists, are valued using market quotations obtained from two or more dealers that make markets in the securities. When market quotations are not readily available, or when the last quoted sale price is not considered representative of the value of the security if it were to be sold on that day, the security will be valued at fair value as determined in good faith by the Fair Value Committee appointed by the Board, pursuant to procedures approved by the Board.
When determining the value of a security, the Fair Value Committee takes into consideration all indications of value that appear relevant under the particular circumstances as well as fundamental analytical data relating to the security, the nature and duration of any restrictions on the disposition of the security, and the forces influencing the market in which the security is purchased or sold in addition to other more specific factors that may be applied on a case-by-case basis. Consequently, the value of the security used by a Fund may differ from a quoted or published price for the same security. Fair value pricing involves subjective judgments and it is possible that the fair value determined for the security is materially different than the value that could be realized upon the sale of that security. As of June 30, 2016, no securities were valued using this method.
Fair Valuation Measurements
The Trust has adopted authoritative fair valuation accounting standards, which establish a definition of fair value and set out a hierarchy for measuring fair value. These standards require additional disclosures about the various inputs
37
NOTES TO FINANCIAL STATEMENTS (unaudited) (continued) June 30, 2016
Note 1 – Organization and Significant Accounting Policies (continued)
Fair Valuation Measurements (continued)
and valuation techniques used to develop the measurements of fair value and changes in valuation techniques and related inputs during the period. These inputs are summarized in the three broad levels listed below:
• Level 1 – Quoted prices in active markets for identical securities.
• Level 2 – Other significant observable inputs (including quoted prices for similar securities, interest rates, prepayment speeds, credit risk, etc.).
• Level 3 – Significant unobservable inputs (including the Funds' own assumptions in determining the fair value of investments).
The inputs or methodologies used for valuing securities are not necessarily an indication of the risk associated with investing in those securities. The following is a summary of the inputs used to value the securities held by each Fund as of June 30, 2016:
| | | Growth Fund | | Balanced Fund | | Small Cap Fund | |
Level 1* | | $ | 4,244,535,618 | | | $ | 510,825,933 | | | $ | 251,853,379 | | |
Level 2** | | | - | | | | 249,863,003 | | | | - | | |
Level 3 | | | - | | | | - | | | | - | | |
Total | | $ | 4,244,535,618 | | | $ | 760,688,936 | | | $ | 251,853,379 | | |
* All Level 1 investments are equity securities (common stocks and preferred securities) and short-term investments.
** All Level 2 investments are fixed income securities, excluding preferred securities.
For detail of securities by major sector classification for the Funds, please refer to the Schedules of Investments.
The Funds had no transfers amongst levels and did not hold any Level 3 investments during the period ended June 30, 2016.
Security Transactions and Investment Income
Security transactions are recorded on the date on which securities are purchased or sold. Dividend income and corporate action transactions are recorded on the ex-dividend date. Interest income, including the accretion of discounts and amortization of premiums, is recorded on an accrual basis. Premiums and discounts are amortized using the effective interest method. Realized gains and losses are reported on an identified cost basis.
Income Taxes
Each Fund is a "regulated investment company" as defined in Subtitle A, Chapter 1, Subchapter M of the Internal Revenue Code of 1986, as amended (the Code). No provisions have been made for federal income taxes as it is the intention of each Fund to comply with the provisions of the Code applicable to regulated investment companies and to make distributions of income and realized gains sufficient to relieve it from all or substantially all excise and income taxes.
As of June 30, 2016, the Trust did not have any tax positions that did not meet the "more-likely-than-not" threshold of being sustained by the applicable tax authority. Generally, tax authorities can examine all tax returns filed for the last three years.
At December 31, 2015, none of the Funds had capital loss carryforwards nor did they have any post-October losses for federal tax purposes.
38
NOTES TO FINANCIAL STATEMENTS (unaudited) (continued) June 30, 2016
Note 1 – Organization and Significant Accounting Policies (continued)
Basis of Presentation
The preparation of financial statements in conformity with U.S. generally accepted accounting principles (GAAP) requires management to make estimates and assumptions that affect the reported amount of net assets and liabilities and disclosure of contingent assets and liabilities at the date of the financial statements and the reported results of operations during the reporting period. Actual results could differ from those estimates.
In preparing these financial statements, the Funds have evaluated events and transactions for potential recognition or disclosure through the date the financial statements were available to be issued. Per a proposal presented and approved at the quarterly meeting of the Board held on May 17, 2016, the Trust will submit a request for a Private Letter Ruling to the Internal Revenue Service (IRS) on behalf of the Growth Fund and Balanced Fund requesting a change to the Funds' excise tax year end from December 31 to October 31. As of August 1, 2016, the Private Letter Ruling was submitted to the IRS.
Expense Allocation
Common expenses incurred by the Trust are allocated among the Funds based on their relative assets. Fund specific expenses are charged directly to the Fund that incurred the expense.
Recent Accounting Pronouncement
In August 2014, the FASB issued ASU No. 2014, Disclosure of Uncertainties about an Entity's Ability to Continue as a Going Concern (ASU 2014-15). ASU 2014-15 requires management to evaluate whether there are conditions and events that raise substantial doubt about the entity's ability to continue as a going concern for annual reporting periods. The ASU will result in additional disclosures and will require certain disclosures if an entity concludes that substantial doubt exists and will require disclosure of plans to alleviate that doubt. It is effective for annual periods ending after December 15, 2016, and for annual periods thereafter, with early adoption permitted. This ASU is not expected to have any impact on the Funds' statements of assets and liabilities or statements of operations.
Note 2 – Related-Party Transactions
Investment Management and Fund Administration Fees
The Adviser provides investment management services to the Funds under a written agreement (the Management Agreement) approved by the Board. Pursuant to the Management Agreement, the Adviser is paid a monthly fee on average daily net assets at the following annual rates:
| | | Growth Fund | | Balanced Fund | | Small Cap Fund | |
Up to $2.5 Billion | | | 0.60 | % | | | 0.60 | % | | | 0.90 | % | |
Over $2.5 Billion | | | 0.50 | % | | | 0.60 | % | | | 0.90 | % | |
The Adviser provides fund administration services to the Funds under a written fund administration servicing agreement approved by the Board. The fund administration fee paid to the Adviser is computed at an annual rate of 0.00281% of average daily net assets. Fund administration fees incurred for the six months ended June 30, 2016 and fund administration fees payable to the Adviser as of June 30, 2016 were as follows:
| | | Growth Fund | | Balanced Fund | | Small Cap Fund | |
Fund administration fees incurred | | $ | 55,180 | | | $ | 9,636 | | | $ | 2,834 | | |
Fund administration fees payable | | | 9,697 | | | | 1,717 | | | | 549 | | |
39
NOTES TO FINANCIAL STATEMENTS (unaudited) (continued) June 30, 2016
Note 2 – Related-Party Transactions (continued)
Investment Management and Fund Administration Fees (continued)
Pursuant to a sub-administration agreement between the Funds and U.S. Bancorp Fund Services, LLC (USBFS), the Funds are charged a sub-administration fee paid to USBFS. Sub-administration fees from USBFS incurred for the six months ended June 30, 2016 and sub-administration fees payable to USBFS as of June 30, 2016 were as follows:
| | | Growth Fund | | Balanced Fund | | Small Cap Fund | |
Sub-administration fees paid | | $ | 361,248 | | | $ | 62,649 | | | $ | 13,338 | | |
Sub-administration fees payable | | | 121,478 | | | | 21,064 | | | | 4,484 | | |
Trustees' Fees
The Funds pay compensation to the disinterested Trustees of the Trust. The Funds do not pay remuneration to officers or to Trustees who are officers, directors or employees of the Adviser.
Note 3 – Indemnifications
In the normal course of business, the Trust enters into contracts that contain general indemnifications to other parties. The Trust's maximum exposure under these contracts is unknown as this would involve future claims that may be made against the Trust that have not yet occurred. The Trust expects the risk of loss to be remote.
Note 4 – Distributions Paid, Distributable Earnings and Investment Transactions
Net investment income and net realized capital gains (losses) may differ for financial reporting and tax purposes because of temporary or permanent book/tax differences. To the extent these differences are permanent, reclassifications are made to the appropriate equity accounts in the period that the difference arises.
Distributions to shareholders are determined in accordance with income tax regulations that may differ from GAAP, and due to the timing of the distributions, the fiscal year in which the amounts are distributed may differ from the year that the income or realized gains (losses) were recorded by each Fund.
The tax character of distributions paid during the six months ended June 30, 2016 and December 31, 2015, were as follows:
Six months ended June 30, 2016 | |
Distributions paid from: | | Growth Fund | | Balanced Fund | | Small Cap Fund | |
Ordinary income | | $ | 29,347,042 | | | $ | 8,440,903 | | | $ | - | | |
Long-term capital gains | | | - | | | | - | | | | - | | |
Total distributions paid | | $ | 29,347,042 | | | $ | 8,440,903 | | | $ | - | | |
Year ended December 31, 2015 | |
Distributions paid from: | | Growth Fund | | Balanced Fund | | Small Cap Fund | |
Ordinary income | | $ | 58,959,603 | | | $ | 17,726,802 | | | $ | 775,082 | | |
Long-term capital gains | | | 228,500,497 | | | | 10,512,671 | | | | 1,448,411 | | |
Total distributions paid | | $ | 287,460,100 | | | $ | 28,239,473 | | | $ | 2,223,493 | | |
Ordinary income distributions include net short-term capital gains. The Funds designate the long-term capital gains presented above as capital gains dividends under the Internal Revenue Code.
40
NOTES TO FINANCIAL STATEMENTS (unaudited) (continued) June 30, 2016
Note 4 – Distributions Paid, Distributable Earnings and Investment Transactions (continued)
At December 31, 2015, the components of accumulated earnings (losses) on a tax basis were as follows:
| | | Growth Fund | | Balanced Fund | | Small Cap Fund | |
Cost of investments | | $ | 2,201,372,074 | | | $ | 548,315,260 | | | $ | 175,662,747 | | |
Gross unrealized appreciation | | $ | 1,726,586,535 | | | $ | 138,348,665 | | | $ | 34,471,597 | | |
Gross unrealized depreciation | | | (105,265,948 | ) | | | (23,073,353 | ) | | | (16,308,276 | ) | |
Net unrealized appreciation | | $ | 1,621,320,587 | | | $ | 115,275,312 | | | $ | 18,163,321 | | |
Undistributed ordinary income | | $ | 311,161 | | | $ | 51,894 | | | $ | 51,101 | | |
Undistributed long-term capital gains | | | 3,038,932 | | | | - | | | | 1,361,243 | | |
Total distributable earnings | | $ | 3,350,093 | | | $ | 51,894 | | | $ | 1,412,344 | | |
Other accumulated earnings | | | - | | | | - | | | | - | | |
Total accumulated earnings | | $ | 1,624,670,680 | | | $ | 115,327,206 | | | $ | 19,575,665 | | |
The difference between book basis and tax basis unrealized appreciation is attributed primarily to the tax deferral of losses on wash sales and the tax cost basis adjustment due to receipt of return of capital distributions from certain investments.
Purchases and sales of investment securities, excluding government securities, short-term securities and temporary cash investments, during the six months ended June 30, 2016 were as follows:
| | | Purchases | | Sales | |
Growth Fund | | $ | 283,049,439 | | | $ | 247,388,447 | | |
Balanced Fund | | | 105,014,737 | | | | 39,914,330 | | |
Small Cap Fund | | | 64,008,684 | | | | 29,176,693 | | |
Purchases and sales of government securities during the six months ended June 30, 2016 were as follows:
| | | Purchases | | Sales | |
Growth Fund | | $ | - | | | $ | - | | |
Balanced Fund | | | 1,857,143 | | | | 19,239,143 | | |
Small Cap Fund | | | - | | | | - | | |
Note 5 – Transactions With Affiliated Companies
The Growth Fund owned 5% or more of the voting securities of the following companies during the six months ended June 30, 2016. As a result, these companies are deemed to be affiliates of the Growth Fund as defined by the 1940 Act. Transactions during the period in these securities of affiliated companies were as follows:
Growth Fund
| | | Share Activity | | | | | |
Security Name | | Balance
12/31/15 | | Purchases | | Sales | | Balance
06/30/16 | | Dividend
Income | | Fair Value at
06/30/16 | |
MTS Systems Corp (1) | | | 982,849 | | | | - | | | | 259,714 | | | | 723,135 | | | $ | 237,000 | | | $ | 31,702,239 | | |
NVE Corp | | | 348,891 | | | | - | | | | - | | | | 348,891 | | | | 697,782 | | | | 20,462,457 | | |
| | | | | | | | | | | $ | 934,782 | | | $ | 52,164,696 | | |
(1) Issuer was not an affiliate as of June 30, 2016 due to sales during the period. Dividend income is for the period in 2016 that the company was deemed an affiliate.
41
NOTES TO FINANCIAL STATEMENTS (unaudited) (continued) June 30, 2016
Note 6 – Subsequent Events
On August 15, 2016, the Small Cap Fund filed a supplement to its Statutory Prospectus, Summary Prospectus and Statement of Additional Information. Effective as of the close of business on September 30, 2016, the Small Cap Fund will be closed to new investors. The closing is intended to promote long-term investments in the Fund, thereby contributing to a more stable asset base and the continued efficient management of the Fund.
42
Mairs & Power Growth Fund
FINANCIAL HIGHLIGHTS
SELECTED DATA AND RATIOS
(for a share outstanding throughout each period)
| | | Six Months
Ended | | Year Ended December 31, | |
| | | June 30, 2016 (1) | | 2015 | | 2014 | | 2013 | | 2012 | | 2011 | |
| | | (unaudited) | | | | | | | | | | | |
Per Share | |
Net asset value, beginning of period | | $ | 104.44 | | | $ | 116.20 | | | $ | 111.09 | | | $ | 83.95 | | | $ | 70.78 | | | $ | 72.16 | | |
Income from investment operations: | |
Net investment income | | | 0.81 | | | | 1.68 | | | | 1.54 | | | | 1.23 | | | | 1.33 | | | | 1.01 | | |
Net realized and unrealized gain (loss) | | | 10.71 | | | | (5.17 | ) | | | 7.48 | | | | 28.58 | | | | 14.08 | | | | (0.45 | ) | |
Total from investment operations | | | 11.52 | | | | (3.49 | ) | | | 9.02 | | | | 29.81 | | | | 15.41 | | | | 0.56 | | |
Distributions to shareholders from: | |
Net investment income | | | (0.80 | ) | | | (1.67 | ) | | | (1.53 | ) | | | (1.23 | ) | | | (1.34 | ) | | | (1.00 | ) | |
Net realized gains on investments sold | | | - | | | | (6.60 | ) | | | (2.38 | ) | | | (1.44 | ) | | | (0.90 | ) | | | (0.94 | ) | |
Total distributions | | | (0.80 | ) | | | (8.27 | ) | | | (3.91 | ) | | | (2.67 | ) | | | (2.24 | ) | | | (1.94 | ) | |
Net asset value, end of period | | $ | 115.16 | | | $ | 104.44 | | | $ | 116.20 | | | $ | 111.09 | | | $ | 83.95 | | | $ | 70.78 | | |
Total investment return | | | 11.03 | % | | | (3.07 | )% | | | 8.12 | % | | | 35.64 | % | | | 21.91 | % | | | 0.74 | % | |
Net assets, end of period, in thousands | | $ | 4,255,624 | | | $ | 3,837,264 | | | $ | 4,297,475 | | | $ | 3,964,530 | | | $ | 2,498,207 | | | $ | 1,975,127 | | |
Ratios/supplemental data: | |
Ratio of expenses to average net assets | | | 0.66 | % | | | 0.65 | % | | | 0.65 | % | | | 0.67 | % | | | 0.70 | % | | | 0.72 | % | |
Ratio of net investment income to average net assets | | | 1.50 | | | | 1.43 | | | | 1.36 | | | | 1.27 | | | | 1.69 | | | | 1.40 | | |
Portfolio turnover rate | | | 6.30 | | | | 9.64 | | | | 6.42 | | | | 3.79 | | | | 1.58 | | | | 2.78 | | |
(1) For the six months ended June 30, 2016, all ratios have been annualized except total investment return and portfolio turnover.
See accompanying Notes to Financial Statements.
43
Mairs & Power Balanced Fund
FINANCIAL HIGHLIGHTS
SELECTED DATA AND RATIOS
(for a share outstanding throughout each period)
| | | Six Months
Ended | | Year Ended December 31, | |
| | | June 30, 2016 (1) | | 2015 | | 2014 | | 2013 | | 2012 | | 2011 | |
| | | (unaudited) | | | | | | | | | | | |
Per Share | |
Net asset value, beginning of period | | $ | 81.16 | | | $ | 86.79 | | | $ | 82.31 | | | $ | 70.83 | | | $ | 62.15 | | | $ | 62.01 | | |
Income from investment operations: | |
Net investment income | | | 1.01 | | | | 2.14 | | | | 1.98 | | | | 1.79 | | | | 1.89 | | | | 1.85 | | |
Net realized and unrealized gain (loss) | | | 5.74 | | | | (4.34 | ) | | | 4.59 | | | | 11.58 | | | | 8.79 | | | | 0.13 | | |
Total from investment operations | | | 6.75 | | | | (2.20 | ) | | | 6.57 | | | | 13.37 | | | | 10.68 | | | | 1.98 | | |
Distributions to shareholders from: | |
Net investment income | | | (1.00 | ) | | | (2.13 | ) | | | (2.00 | ) | | | (1.78 | ) | | | (1.91 | ) | | | (1.83 | ) | |
Net realized gains on investments sold | | | - | | | | (1.30 | ) | | | (0.09 | ) | | | (0.11 | ) | | | (0.09 | ) | | | (0.01 | ) | |
Total distributions | | | (1.00 | ) | | | (3.43 | ) | | | (2.09 | ) | | | (1.89 | ) | | | (2.00 | ) | | | (1.84 | ) | |
Net asset value, end of period | | $ | 86.91 | | | $ | 81.16 | | | $ | 86.79 | | | $ | 82.31 | | | $ | 70.83 | | | $ | 62.15 | | |
Total investment return | | | 8.35 | % | | | (2.54 | )% | | | 8.04 | % | | | 19.02 | % | | | 17.34 | % | | | 3.23 | % | |
Net assets, end of period, in thousands | | $ | 762,814 | | | $ | 667,680 | | | $ | 722,863 | | | $ | 564,315 | | | $ | 286,910 | | | $ | 186,660 | | |
Ratios/supplemental data: | |
Ratio of expenses to average net assets | | | 0.72 | % | | | 0.73 | % | | | 0.72 | % | | | 0.72 | % | | | 0.74 | % | | | 0.79 | % | |
Ratio of net investment income to average net assets | | | 2.48 | | | | 2.49 | | | | 2.39 | | | | 2.43 | | | | 2.94 | | | | 2.99 | | |
Portfolio turnover rate | | | 8.78 | | | | 14.05 | | | | 4.53 | | | | 3.02 | | | | 5.46 | | | | 9.12 | | |
(1) For the six months ended June 30, 2016, all ratios have been annualized except total investment return and portfolio turnover.
See accompanying Notes to Financial Statements.
44
Mairs & Power Small Cap Fund
FINANCIAL HIGHLIGHTS
SELECTED DATA AND RATIOS
(for a share outstanding throughout each period)
| | | Six Months
Ended | |
Year Ended December 31, | | August 11, 2011 *
Through | |
| | �� | June 30, 2016 (1) | | 2015 | | 2014 | | 2013 | | 2012 | | December 31, 2011 (1) | |
| | | (unaudited) | | | | | | | | | | | |
Per Share | |
Net asset value, beginning of period | | $ | 19.48 | | | $ | 20.67 | | | $ | 19.78 | | | $ | 14.49 | | | $ | 11.21 | | | $ | 10.00 | | |
Income from investment operations: | |
Net investment income | | | 0.07 | | | | 0.08 | | | | 0.08 | | | | 0.06 | | | | 0.01 | | | | 0.01 | | |
Net realized and unrealized gain (loss) | | | 2.24 | | | | (1.04 | ) | | | 1.25 | | | | 5.56 | | | | 3.42 | | | | 1.20 | | |
Total from investment operations | | | 2.31 | | | | (0.96 | ) | | | 1.33 | | | | 5.62 | | | | 3.43 | | | | 1.21 | | |
Distributions to shareholders from: | |
Net investment income | | | — | | | | (0.08 | ) | | | (0.07 | ) | | | (0.06 | ) | | | (0.02 | ) | | | — | | |
Net realized gains on investments sold | | | — | | | | (0.15 | ) | | | (0.37 | ) | | | (0.27 | ) | | | (0.13 | ) | | | — | | |
Redemption fees (2) | | | — | (3) | | | (0.00 | )(3) | | | (0.00 | )(3) | | | (0.00 | )(3) | | | — | | | | — | | |
Total distributions | | | — | | | | (0.23 | ) | | | (0.44 | ) | | | (0.33 | ) | | | (0.15 | ) | | | — | | |
Net asset value, end of period | | $ | 21.79 | | | $ | 19.48 | | | $ | 20.67 | | | $ | 19.78 | | | $ | 14.49 | | | $ | 11.21 | | |
Total investment return | | | 11.86 | % | | | (4.68 | )% | | | 6.73 | % | | | 38.75 | % | | | 30.60 | % | | | 12.10 | % | |
Net assets, end of period, in thousands | | $ | 251,579 | | | $ | 193,837 | | | $ | 162,230 | | | $ | 111,486 | | | $ | 41,644 | | | $ | 5,194 | | |
Ratios/supplemental data: | |
Ratio of expenses to average net assets | |
Before expense reimbursement(4) | | | 1.07 | % | | | 1.06 | % | | | 1.07 | % | | | 1.17 | % | | | 1.73 | % | | | 7.98 | % | |
After expense reimbursement(4) | | | 1.07 | | | | 1.06 | | | | 1.07 | | | | 1.17 | | | | 1.25 | | | | 1.25 | | |
Ratio of net investment income to average
net assets | |
Before expense reimbursement(4) | | | 0.71 | % | | | 0.43 | % | | | 0.43 | % | | | 0.37 | % | | | (0.14 | )% | | | (6.41 | )% | |
After expense reimbursement(4) | | | 0.71 | | | | 0.43 | | | | 0.43 | | | | 0.37 | | | | 0.34 | | | | 0.32 | | |
Portfolio turnover rate | | | 14.34 | | | | 23.27 | | | | 15.85 | | | | 34.91 | | | | 6.93 | | | | 4.52 | | |
* Commencement of operations.
(1) For the periods ended June 30, 2016 and December 31, 2011, all ratios have been annualized except total investment return and portfolio turnover.
(2) The Fund charges a 1.00% redemption fee on shares held 180 days or less.
(3) Amount per share is less than $0.005.
(4) The Adviser has agreed to waive the Small Cap Fund's investment management and fund administration fees and reimburse expenses to the extent necessary to prevent total annual fund operating expenses (excluding interest, taxes, brokerage commissions, acquired fund fees and expenses (which are indirect fees and expenses that funds incur from investing in the shares of other mutual funds, such as money market funds), other investment-related costs and other extraordinary expenses, such as litigation and other expenses not incurred in the ordinary course of the Small Cap Fund's business) from exceeding 1.25% of daily net assets through April 30, 2015. The arrangement terminated on April 30, 2015.
See accompanying Notes to Financial Statements.
45
FUND EXPENSES (unaudited)
As a shareholder of the Funds, you incur two types of costs: (1) transaction costs including redemption fees and (2) ongoing expenses for the operation of the Funds (e.g., asset-based charges, such as investment management fees). The Funds are "no-load" mutual funds. As a result, shareholders pay no commissions, fees, or expenses associated with sales representatives or sales charges.
This example is intended to help you understand your ongoing costs (in dollars) of investing in the Funds and to compare these costs with the ongoing costs of investing in other mutual funds. The table below reports the Funds' expenses during the period January 1, 2016 through June 30, 2016 and includes the costs associated with a $1,000 investment.
Actual Expenses
The first line in the tables below may be used to estimate the actual expenses you paid over the reporting period. You can do this by dividing your account value by $1,000 and multiplying the result by the expense shown in the table below. For example, if your account value is $8,600, divided by $1,000 = $8.60. Multiply the result by the number in the first line under the heading entitled "Expenses Paid During Period." By doing this you can estimate the expenses you paid on your account during this period.
Hypothetical Example
The second line of the tables below provides information about hypothetical account values and hypothetical expenses based on the Funds' actual expenses and assumed returns of 5% per year before expenses, which are not the Funds' actual returns. The results may be used to provide you with a basis for comparing the ongoing costs of investing in the Funds with the ongoing costs of investing in other funds. To do so, compare these 5% hypothetical examples with the 5% hypothetical examples that appear in the shareholder reports of other funds. Please note that these hypothetical examples highlight ongoing costs only. They may not be used to estimate the actual ending account balances or expenses you paid during the period and will not help you determine the relative total costs of owning different funds.
Mairs & Power Growth Fund
| | | Beginning Account
Value 01/01/2016 | | Ending Account
Value 06/30/2016 | | Expenses Paid
During Period * | |
Actual return | | $ | 1,000.00 | | | $ | 1,110.30 | | | $ | 3.46 | | |
Hypothetical assumed 5% return | | $ | 1,000.00 | | | $ | 1,021.58 | | | $ | 3.32 | | |
* The Fund's expenses are equal to the Fund's annualized expense ratio for the most recent six-month period of 0.66%, multiplied by the average account value over the Fund's first fiscal half-year, multiplied by the number of days in the Fund's first fiscal half-year (182 days), divided by 366 days.
Mairs & Power Balanced Fund
| | | Beginning Account
Value 01/01/2016 | | Ending Account
Value 06/30/2016 | | Expenses Paid
During Period * | |
Actual return | | $ | 1,000.00 | | | $ | 1,083.50 | | | $ | 3.73 | | |
Hypothetical assumed 5% return | | $ | 1,000.00 | | | $ | 1,021.28 | | | $ | 3.62 | | |
* The Fund's expenses are equal to the Fund's annualized expense ratio for the most recent six-month period of 0.72%, multiplied by the average account value over the Fund's first fiscal half-year, multiplied by the number of days in the Fund's first fiscal half-year (182 days), divided by 366 days.
46
FUND EXPENSES (unaudited) (continued)
Mairs & Power Small Cap Fund
| | | Beginning Account
Value 01/01/2016 | | Ending Account
Value 06/30/2016 | | Expenses Paid
During Period * | |
Actual return | | $ | 1,000.00 | | | $ | 1,118.60 | | | $ | 5.64 | | |
Hypothetical assumed 5% return | | $ | 1,000.00 | | | $ | 1,019.54 | | | $ | 5.37 | | |
* The Fund's expenses are equal to the Fund's annualized expense ratio for the most recent six-month period of 1.07%, multiplied by the average account value over the Fund's first fiscal half-year, multiplied by the number of days in the Fund's first fiscal half-year (182 days), divided by 366 days.
47
Proxy Voting Policies and Procedures that the Trust uses to determine how to vote proxies relating to portfolio securities are available (i) without charge, upon request, by calling Shareholder Services at (800) 304-7404 and requesting a copy of the Statement of Additional Information (SAI) and (ii) on the Securities and Exchange Commission's (SEC's) website at www.sec.gov (access Form N-1A).
Information on how the Trust voted proxies relating to portfolio securities during the most recent 12-month period ended June 30 is available at www.mairsandpower.com and on the SEC's website at www.sec.gov.
DISCLOSURE OF PORTFOLIO HOLDINGS (unaudited)
The Trust files a complete schedule of portfolio holdings on Form N-Q for the first and third quarter-ends and on Form N-CSR for the second and fourth quarter-ends with the SEC. The Trust's Forms N-Q and N-CSR are available on the SEC's website at www.sec.gov. Forms N-Q and N-CSR may also be reviewed and copied at the SEC's Public Reference Room in Washington, D.C. Information on the operation of the Public Reference Room may be obtained by calling (800) SEC-0330.
The schedule of portfolio holdings is also printed in the Trust's semi-annual and annual reports to shareholders, which are available without charge by calling Shareholder Services at (800) 304-7404 or by visiting www.mairsandpower.com.
A complete copy of the Trust's portfolio holdings will also be available on or about 15 days following each quarter-end on the Fund's website at www.mairsandpower.com.
BOARD OF TRUSTEES' APPROVAL OF INVESTMENT ADVISORY CONTRACT (unaudited)
The Board of Trustees (the Trustees) unanimously approved the renewal of the Agreement for Investment Counsel Service (the Advisory Contract) between Mairs & Power Funds Trust (the Trust) on behalf of the Mairs & Power Growth Fund (the Growth Fund), the Mairs & Power Balanced Fund (the Balanced Fund) and the Mairs & Power Small Cap Fund (the Small Cap Fund) (each, a Fund and together, the Funds) and Mairs & Power, Inc. (the Adviser) at a meeting of the Board of Trustees held on May 17, 2016. In evaluating the Advisory Contract, the Trustees took into account their cumulative experience with the Adviser and their ongoing review and discussion with the Funds' portfolio managers at meetings throughout the year.
In preparation for the May 17, 2016 meeting, the Adviser provided the Trustees with extensive materials that are relevant to the Trustees' consideration of the Advisory Contract. As part of their discussion at the May 17 meeting, the independent Trustees discussed the materials and the proposed renewal of the Advisory Contract in executive session with legal counsel present, but with no representatives of the Adviser being present. In reaching their decision to renew the Advisory Contract with the Adviser, the Trustees considered all factors they believed to be relevant. Each of these factors and the conclusions reached by the Trustees with respect to these factors helped form the basis for the decision to renew the Advisory Contract with the Adviser and are discussed below. In their deliberations, the Trustees did not identify any single factor as determinative.
Nature, Extent and Quality of Services
With respect to the quality and extent of the Adviser's services provided to the Funds, the Trustees noted the Funds' long-term performance record, as discussed in more detail below under "Investment Performance." The Trustees considered the Adviser's experience as an investment adviser, the investments it has made in the advisory business, including the hiring of new personnel, and the services it would continue to provide the Funds and their shareholders under the Advisory Contract. The Trustees considered the Adviser's disciplined investment decision-making process, including its emphasis on companies located in the Upper Midwest and the Durable
48
BOARD OF TRUSTEES' APPROVAL OF INVESTMENT ADVISORY CONTRACT (unaudited) (continued)
Competitive Advantage analysis performed to identify companies with sustainable long-term growth. With respect to the Balanced Fund, the Trustees considered the Adviser's fundamental analysis and credit monitoring of debt securities. The Trustees also took into account other components of the services provided by the Adviser to the Funds, such as the Adviser's distribution strategy, the Adviser's risk management system and results of the most recent compliance review. The Trustees concluded that they were satisfied with the nature, extent and quality of services provided by the Adviser under the Advisory Contract.
Investment Performance
In reviewing the Funds' performance, the Trustees considered the information provided in connection with the May 17, 2016 Board meeting, noting that they also receive detailed performance information at each regular Board meeting during the year as well as an in depth review of prior year performance at the February Board meeting. At the May 17, 2016 meeting, the Trustees considered the investment results for the Funds compared to those mutual funds with similar investment objectives as determined by Morningstar, a representative peer group of funds with similar investment objectives and strategies as determined by the Adviser and to each Fund's respective performance benchmarks. With respect to the Growth Fund and the Balanced Fund, the Trustees reviewed comparative performance information for the one-, three-, five-, ten-year and since-inception periods ending December 31, 2015. The Trustees noted that the performance of the Growth Fund had trailed the benchmark and Morningstar category averages over the one-year period but had exceeded the peer group average over such period. The Board considered the Adviser's commentary with respect to the Growth Fund's relative performance in 2015, including the effect of the Adviser's multi-cap approach. The Trustees noted that the Growth Fund had outperformed the average return of the peer group and Morningstar category for the five- and ten-year periods, had underperformed the benchmark for the five-year period and had outperformed the benchmark for the ten-year period.
The Balanced Fund's performance trailed the average return of the peer group, Morningstar category and composite index for the one-year period. The Board considered the Adviser's explanation for the Fund's underperformance in 2015, including the effect of certain sectors and the poor performance of corporate bonds. The Balanced Fund's performance exceeded the returns of the peer group and Morningstar category over the five- and ten-year periods, lagged the composite index for the five-year period and outperformed the composite index for the ten-year period.
With respect to the Small Cap Fund, the Trustees reviewed comparative performance information for the one-year, three-year and since-inception periods ended December 31, 2015. The Trustees noted that the Small Cap Fund's performance has exceeded its peer group average and Morningstar category average but trailed its benchmark index during the one- and three-year periods. The Board noted the Adviser's discussion of stock selection as the driver of relative performance in 2015. The Fund outperformed the benchmark index and peer group average for the since-inception period. Based upon their review, the Trustees concluded that each Fund's investment performance has been satisfactory.
Management Fees
In evaluating the level of the management fees paid to the Adviser, the Trustees considered both the amount of the fees and the overall expenses of the Funds, compared to those of other similar mutual funds, as well as the quality and quantity of advisory and other services provided by the Adviser. The Trustees noted that the net management fee paid to the Adviser by the Growth Fund is below the average fees for the Morningstar peer group and for the peer group of competitive funds identified by the Adviser. The management fee for the Balanced Fund is below the Morningstar category average and the peer group average. Additionally, the Trustees noted that the Growth Fund's and Balanced Fund's total expense ratios are below the average total expense ratios of funds in their Morningstar peer groups and the competitive funds identified by the Adviser. With respect to the Small Cap Fund, the Trustees noted that while the management fee was slightly above the Morningstar average, the management fee was below the peer group average and the Fund's total expense ratio was below the Morningstar and peer group averages.
The Trustees then reviewed the fees the Adviser charges its non-mutual fund advisory clients, including retirement funds, other institutional clients and individuals (Advisory Clients) with investment objectives similar to those of
49
BOARD OF TRUSTEES' APPROVAL OF INVESTMENT ADVISORY CONTRACT (unaudited) (continued)
the Growth Fund and Balanced Fund. The Adviser provided the Trustees with information about the fee schedule for Advisory Clients and the differences in the scope of services provided to its Advisory Clients compared with the scope of those it provides to the Funds. In addition, the Trustees reviewed the investment advisory fee charged to an institutional client of the Adviser for sub-advisory services in the small cap mandate. The Trustees noted that the Adviser provides certain services to the Funds that are not provided to Advisory Clients and the sub-advised account, such as office facilities and Fund officers. In addition, the level of investment decision-making is generally higher with respect to the Funds, particularly for the Growth Fund and Balanced Fund where cash flows result in purchase and sale decisions made by the Adviser almost every trading day. Having considered all of these factors, the Trustees concluded that the Funds' management fees are fair and reasonable for the services provided.
Costs of Services Provided and Profitability to the Adviser
The Trustees reviewed information regarding the Adviser's overall profitability as well as the allocation of profitability between Advisory Clients and the Funds. The profitability of the mutual fund business was further broken down among the Growth, Balanced and Small Cap Funds, as applicable. The Trustees reviewed the Adviser's financial assumptions and methods of expense allocation used. The Trustees noted that the profitability calculation includes fees received by the Adviser under both the Fund Administration Servicing Agreement and the Advisory Contract. The Trustees believe that the Adviser should be entitled to earn a reasonable level of profit for the services it provides to the Funds. The Trustees also reviewed the Adviser's financial condition and determined it to be sound. Based on their review, the Trustees concluded that the Adviser's level of profitability from its relationship with the Funds is reasonable.
Other Benefits
The Trustees considered the benefits to the Adviser from soft dollar arrangements whereby the Adviser receives proprietary investment research services from broker-dealers that execute the Funds' purchases and sales of securities, including invitations to conferences, meetings with company management and general research. As a general matter, the research services received from broker-dealers are used to service all accounts that invest in equity securities. The Trustees received and reviewed information concerning the Funds' brokerage commissions and allocation of Fund brokerage. The Trustees recognized that the Adviser's profitability would be lower if it did not receive proprietary research for soft dollars in connection with the Funds' brokerage activity. In addition, the Trustees considered that the Adviser's Advisory Clients benefit from access to and research obtained from brokers executing trades on behalf of the Funds. While difficult to measure, the Trustees concluded that the benefits the Adviser receives in this way are fairly modest, given the Funds' relatively low portfolio turnover rates and the research capability that the Adviser itself maintains. The Trustees noted that the Adviser derives reputational benefits from its association with the Funds as well. The Trustees considered the nature and amount of fees paid by the Funds for administrative services provided by the Adviser under the Fund Administration Servicing Agreement. The Trustees concluded that the other benefits realized by the Adviser from its relationship with the Funds were reasonable.
Economies of Scale
The Trustees reviewed the extent to which economies of scale may be realized as the Funds increase in size. The Trustees considered the asset levels in each of the Funds. The Trustees noted that the Adviser's approach has been to keep costs to the Funds as low as reasonably possible, including management fee levels. At the same time, the Adviser believes, and the Trustees concur, that it is entitled to earn reasonable returns on its mutual fund business. The Adviser acknowledged that while it is difficult to pinpoint the economies of scale to be realized by the Funds at any particular asset level, there is no question that such economies exist. Accordingly, the Adviser, under the terms of the Advisory Contract for the Growth Fund, established a breakpoint at the $2.5 billion asset level. The breakpoint reduces the management fee applicable to assets managed in excess of $2.5 billion from 60 basis points (0.6 of 1%) to 50 basis points (0.5 of 1%). The Trustees reaffirmed their conclusion that establishing this breakpoint at $2.5 billion forms a reasonable basis for having management fee levels reflect economies of scale for the benefit of Growth Fund shareholders. The Adviser believes, and the Trustees concur, that the consideration of establishing a breakpoint at certain asset levels would be an appropriate way for the Adviser to share its economies of scale in the
50
BOARD OF TRUSTEES' APPROVAL OF INVESTMENT ADVISORY CONTRACT (unaudited) (continued)
event that the Balanced Fund continues to increase in size. The Trustees considered the Adviser's commitment to consider such a breakpoint in the future. Considering their current level of assets, the Trustees concluded that the absence of breakpoints in the management fee for the Balanced Fund and Small Cap Fund is reasonable at this time.
HOUSEHOLDING (unaudited)
In an effort to decrease costs, the Trust intends to reduce the number of duplicate Summary Prospectuses and Annual and Semi-Annual Reports you receive by sending only one copy of each to those addresses shared by two or more accounts and to shareholders reasonably believed to be from the same family or household. Once implemented, if you would like to discontinue householding for your accounts, please call Shareholder Services at (800) 304-7404 to request individual copies of these documents. Once notification to stop householding is received, the Trust will begin sending individual copies thirty days after receiving your request. This policy does not apply to account statements.
PRIVACY POLICY NOTICE (unaudited)
Our Promise to You
As a shareholder of the Mairs & Power Mutual Funds (Funds), you share both personal and financial information with us. Your privacy is important to us, and we are dedicated to safeguarding your personal and financial information.
Information Provided by Shareholders
In the normal course of doing business, we typically obtain the following non-public personal information about our shareholders:
�� Personal information regarding our shareholders' identity such as name, address and social security number;
• Information regarding fund transactions effected by us; and
• Shareholder financial information such as net-worth, assets, income, bank account information and account balances.
How We Manage and Protect Your Personal Information
We do not sell information about current or former shareholders to third parties, nor is it our practice to disclose such information to third parties unless requested or permitted to do so by a shareholder or shareholder representative or, if necessary, in order to process a transaction, service an account or as permitted by law. Additionally, we may share information with outside companies that perform administrative services for us. However, our arrangements with these service providers require them to treat your information as confidential.
In order to protect your personal information, we maintain physical, electronic and procedural safeguards to protect your personal information. Our Privacy Policy restricts the use of shareholder information and requires that it be held in strict confidence.
Shareholder Notifications
We are required by law to annually provide a notice describing our privacy policy. In addition, we will inform you promptly if there are changes to our policy. Please contact us at (800) 304-7404 with questions about this notice.
51
OTHER INFORMATION (unaudited)
This report is submitted for the general information of the shareholders of the Funds. It is not authorized for distribution to prospective investors unless accompanied or preceded by an effective prospectus. An investor should consider the Funds' investment objectives, risks and expenses carefully before investing or sending money. This and other important information can be found in the Funds' summary prospectuses and full prospectus. To obtain a prospectus, please call Shareholder Services at (800) 304-7404 or visit the Funds' website at www.mairsandpower.com. Please read the prospectus carefully before investing.
This report includes forward-looking statements such as economic predictions and portfolio manager opinions. The statements are subject to change at any time based on market and other conditions. No predictions, forecasts, outlooks, expectations or beliefs are guaranteed.
52
MAIRS & POWER FUNDS TRUST
Mairs & Power Growth Fund, established 1958
Mairs & Power Balanced Fund, established 1961
Mairs & Power Small Cap Fund, established 2011
A No-Load Funds Trust
For Shareholder Services
Call (800) 304-7404
Or write to:
(via Regular Mail)
c/o U.S. Bancorp Fund Services, LLC
615 East Michigan Street
P. O. Box 701
Milwaukee, WI 53201-0701 | | (via Overnight or Express Mail)
c/o U.S. Bancorp Fund Services, LLC
3rd Floor
615 East Michigan Street
Milwaukee, WI 53202-0701 | |
For Fund literature and information, visit the Trust's website at:
www.mairsandpower.com
Investment Manager
Mairs & Power, Inc.
W1520 First National Bank Building
332 Minnesota Street
Saint Paul, MN 55101
Custodian
U.S. Bank, N.A.
Custody Operations
1555 North River Center Drive, Suite 302
Milwaukee, WI 53212
Distributor
ALPS Distributors, Inc.
1290 Broadway, Suite 1100
Denver, CO 80203
Mairs & Power Funds Trust
c/o U.S. Bancorp Fund Services, LLC
3rd Floor
615 East Michigan Street
Milwaukee, WI 53202-0701
Item 2. Code of Ethics.
Not applicable for semi-annual reports.
Item 3. Audit Committee Financial Expert.
Not applicable for semi-annual reports.
Item 4. Principal Accountant Fees and Services.
Not applicable for semi-annual reports.
Item 5. Audit Committee of Listed Registrants.
Not applicable to registrant.
Item 6. Investments.
(a) Schedule of Investments is included as part of the report to shareholders filed under Item 1 of this Form
(b) Not Applicable.
Item 7. Disclosure of Proxy Voting Policies and Procedures for Closed-End Management Investment Companies.
Not applicable to open-end investment companies.
Item 8. Portfolio Managers of Closed-End Management Investment Companies.
Not applicable to open-end investment companies.
Item 9. Purchases of Equity Securities by Closed-End Management Investment Company and Affiliated Purchasers.
Not applicable to open-end investment companies.
Item 10. Submission of Matters to a Vote of Security Holders.
There has been no material change to the procedures by which shareholders may recommend nominees to the registrant’s board of directors.
1
Item 11. Controls and Procedures.
(a) The registrant’s principal executive officer and principal financial officer have evaluated the registrant’s disclosure controls and procedures as of a date within 90 days of the filing of this report and have concluded that the registrant’s disclosure controls and procedures were effective, as of that date, in ensuring that information required to be disclosed by the registrant in this Form N-CSR was recorded, processed, summarized and reported within the time period specified by the SEC’s rules and forms.
(b) There were no changes in the Registrant’s internal control over financial reporting (as defined in Rule 30a-3(d) under the Act) that occurred during the second fiscal quarter of the period covered by this report that has materially affected, or is reasonably likely to materially affect, the Registrant’s internal control over financial reporting.
Item 12. Exhibits.
(a) (1) Code of Ethics
Mairs & Power Funds Trust Code of Ethics for Principal Executive Officer and Principal Financial Officer.
Attached as exhibit 12(a)(1) to this form.
(2) Certifications required by Rule 30a-2(a) under the Investment Company Act of 1940.
Attached as exhibits 12(a)(2).1 and 12(a)(2).2 to this form.
(3) Any written solicitation to purchase securities under Rule 23c-1 under the Act sent or given during the period covered by the report by or on behalf of the registrant to 10 or more persons. Not applicable to open-end investment companies.
(b) Certifications pursuant to Section 906 of the Sarbanes-Oxley Act of 2002.
Attached as exhibit 12(b) to this form.
2
SIGNATURES
Pursuant to the requirements of the Securities Exchange Act of 1934 and the Investment Company Act of 1940, the registrant has duly caused this report to be signed on its behalf by the undersigned, thereunto duly authorized.
(Registrant) | Mairs & Power Funds Trust | |
| |
By (Signature and Title)* | /s/ Mark L. Henneman | |
| Mark L. Henneman, President |
| Principal Executive Officer |
| |
| |
Date | 9-1-16 | |
| | | | |
Pursuant to the requirements of the Securities Exchange Act of 1934 and the Investment Company Act of 1940, this report has been signed below by the following persons on behalf of the registrant and in the capacities and on the dates indicated.
By (Signature and Title)* | /s/ Mark L. Henneman | |
| Mark L. Henneman, President |
| Principal Executive Officer |
| |
| |
Date | 9-1-16 | |
| | | |
By (Signature and Title)* | /s/ Andrea C. Stimmel | |
| Andrea C. Stimmel, Treasurer |
| Principal Financial Officer |
| |
| |
Date | 9-1-16 | |
| | | |
* Print the name and title of each signing officer under his or her signature.
3