UNITED STATES
SECURITIES AND EXCHANGE COMMISSION
Washington, D.C. 20549
FORM N-CSR
CERTIFIED SHAREHOLDER REPORT OF REGISTERED
MANAGEMENT INVESTMENT COMPANIES
Investment Company Act file number | 811-22563 |
|
Mairs & Power Funds Trust |
(Exact name of registrant as specified in charter) |
|
332 Minnesota Street, Suite W1520, St. Paul, MN | | 55101 |
(Address of principal executive offices) | | (Zip code) |
|
Andrea C. Stimmel, Chief Compliance Officer & Treasurer, 332 Minnesota Street, Suite W1520, St. Paul, MN 55101 |
(Name and address of agent for service) |
|
Registrant’s telephone number, including area code: | 651-222-8478 | |
|
Date of fiscal year end: | December 31, 2014 | |
|
Date of reporting period: | June 30, 2014 | |
| | | | | | | | |
Item 1. Reports to Stockholders.

Investing for the long-term
SEMI-ANNUAL REPORT
JUNE 30, 2014
- GROWTH FUND (MPGFX)
est. 1958
- BALANCED FUND (MAPOX)
est. 1961
- SMALL CAP FUND (MSCFX)
est. 2011
Mairs & Power W1520 First National Bank Building, 332 Minnesota Street, St. Paul, Minnesota 55101 www.mairsandpower.com
MAIRS & POWER FUNDS MARKET COMMENTARY (unaudited)
June 30, 2014
While the pace of the economic recovery was somewhat better than expected during the quarter, we continued to keep our primary focus on the long-term fundamental attributes that make companies profitable. While attentive, we are not swayed by the macro-economic details underpinning global market events. By emphasizing the long-term view, we can make the subtle, opportunistic adjustments to company positions over time that keep portfolio turnover low and tax consequences in check. Our first mutual fund, the Mairs & Power Growth Fund, founded in 1958, provides a good illustration of this approach, which is employed by the Mairs & Power Balanced and Mairs & Power Small Cap Funds as well. Portfolio turnover for the Growth Fund, compared to its peers, the Morningstar U.S. Large Cap Blend category, was substantially lower for each of the past 10 years. As a result, the Fund's annual realized taxable capital gains exceeded $1.00 per share in only two of the past 10 years.
As measured by the S&P 500 Index, the stock market advanced 5.23% for the quarter ending June 30, 2014. The market's strength occurred against a mixed backdrop characterized by a downbeat adjustment to the Gross Domestic Product (GDP) (a key barometer of economic health), a rekindling of the war in Iraq, and hints that higher inflation and rising yields might be just around the corner.
The quarter's biggest economic news was the unexpectedly sharp downward revision of the first quarter's GDP growth rate from -1% to -2.9%. Like a house guest who won't leave, the effects of winter's record cold snap endured and played a major role in depressing the benchmark growth measure, which opened up questions about the long-term hardiness of the U.S. recovery.
Meanwhile, as the Iraq war began appearing on the front pages again, the markets experienced some déjà vu: Would this be like 2003 all over again, when America first conquered Baghdad? The answer turned out to be a "no." Shrugging off short-term inflationary fears from rising energy prices, the markets behaved with much more equanimity than they did 11 years ago when America's energy independence goals were still far in the future. Instead, our energy selections were able to benefit from new access to cheaper domestic oil reserves as well as growing demand for improved technologies related to fracking.
Concerns about rising yields and the inflation rate were short-lived as well. Analysts found their expectations subverted when the benchmark 10-year Treasury rate declined from a high of more than 2.80% earlier in the quarter to 2.53% by the end of the period, and the Barclays Government/Credit Bond Index gained 1.92%. Elsewhere, the Federal Reserve (Fed) continued to dial back its monthly bond purchases by an additional $10 billion more per month. In short, the combined threats of the seemingly everlasting Polar Vortex, the Iraq war and inflationary fears could not dampen investor enthusiasm for stocks during the second quarter.
Future Outlook
Everybody likes a winner. And, if the stock market was any gauge during the second quarter, there was a lot to like. Stocks extended their winning streak for the sixth consecutive quarter, as measured by the Standard & Poor's 500 Index – a phenomenon surpassed only six other times since 1928. After such historic gains, though, should cautious investors grow concerned about the second half of the year? We don't think so. Successful investment approaches never depend on the positive or negative market performance of any single quarter. At Mairs & Power, we base our portfolio decisions on the facts about companies, not the markets. In particular, we endeavor to identify and invest in those companies that have shown their ability to achieve consistent, above-average growth from a position of demonstrable and durable competitive advantage.
Looking toward year-end, we will continue to closely evaluate corporate earnings and revenue against the multiples we view to be still slightly above historical levels. The price/earnings (P/E) multiple of the S&P 500 Index, a key gauge of corporate earnings health, stood just above its long term average of around 15.5 at quarter-end, almost exactly where it ended the first quarter. This is further proof to us that stock prices
1
MAIRS & POWER FUNDS MARKET COMMENTARY (unaudited) (continued)
continue to be influenced more by actual, organic company earnings and revenue growth than by the Federal Reserve's waning stimulus program.
While we believe economic conditions appear sufficiently strong to support this current, positive earnings trend, a market correction in the near term would not surprise us. The advantages of investing in well-diversified portfolios, rebalanced regularly, provide one of the better, more reliable routes for meeting long-term goals regardless of the quarter. By focusing our attention on companies and how they perform, we remain confident in our ability to identify, over the course of a full market cycle, those profitable, well-managed firms likely to outperform their competitors regardless of marketplace events.
Gross Domestic Product (GDP) is the monetary value of all the finished goods and services produced within a country's borders in a specific time period, though GDP is usually calculated on an annual basis.
The Price to Earnings (P/E) Ratio is a common tool for comparing the prices of different common stocks and is calculated by dividing the current market price of a stock by the earnings per share. The P/E ratio is not a measure of future performance or growth.
Barclays Government/Credit Bond Index is composed of high-quality, investment-grade United States government and corporate fixed income securities with maturities greater than one year. It is not possible to invest directly in an index.
The S&P 500 Index is an unmanaged index of 500 common stocks that is generally considered representative of the U.S. stock market. It is not possible to invest directly in an index.
2
MAIRS & POWER GROWTH FUND (unaudited)
To Our Shareholders: June 30, 2014
For the second quarter and six months ending June 30, 2014, the Mairs & Power Growth Fund gained 2.87% and 4.18% respectively, underperforming its benchmark, the S&P 500 Index, which gained 5.23% and 7.14%, and the Lipper Multi Cap Core, its peer group, at 4.52% and 6.25%, for the periods.
The world's leading supplier of energy industry technology solutions, Schlumberger, was a top contributor to performance for both the past quarter and the past six months through June 30, gaining 20.97% and 30.90%, respectively. America's move to greater energy independence that began more than a decade ago has continued to benefit firms like Schlumberger whose businesses are concentrated in the area of oil and gas exploration. Many factors, however, like global economics and shifting political allegiances can affect both energy prices and exploration budgets. Since 2008, Schlumberger has endeavored to temper the impact of such cyclical influences through major investments in technology innovations, product reliability and better processes. As it gains market share, Schlumberger continues to hold leading market positions in proprietary software, patents, and major equipment.
Freight shipper and global supply chain consultant C.H. Robinson Worldwide, Inc. gained 21.76% and 9.34% respectively for the second quarter and first six months, and was a strong contributor to Fund performance. The firm's efforts to better service high-end customers resulted in a favorable report in the first quarter and helped reverse a lackluster, two-year performance trend. As the requirement for "just-in-time" freight delivery becomes increasingly important to a company's profitability, customers will turn to third-party logistics firms like C.H. Robinson to coordinate shipments and generate the information customers need in real time to manage their inventories and deliveries.
MAIRS & POWER GROWTH FUND
Top Performers
Second Quarter (3/31/14 – 6/30/14) | | Year To Date (12/31/13 – 6/30/14) | |
CH ROBINSON WORLDWIDE INC. | | | 21.76 | % | | SCHLUMBERGER, LTD. | | | 30.90 | % | |
SCHLUMBERGER, LTD. | | | 20.97 | % | | CORNING, INC. | | | 23.18 | % | |
INTEL CORP. | | | 19.72 | % | | WELLS FARGO & CO. | | | 15.77 | % | |
ZIMMER HOLDINGS, INC. | | | 9.81 | % | | JOHNSON & JOHNSON | | | 14.23 | % | |
PRINCIPAL FINANCIAL GROUP | | | 9.76 | % | | MEDTRONIC, INC. | | | 11.10 | % | |
Weak Performers
Second Quarter (3/31/14 – 6/30/14) | | Year To Date (12/31/13 – 6/30/14) | |
CRAY INC. | | | -28.72 | % | | TARGET CORP. | | | -8.41 | % | |
PENTAIR LTD. | | | -9.10 | % | | H.B. FULLER CO. | | | -7.57 | % | |
TARGET CORP. | | | -4.23 | % | | PENTAIR LTD. | | | -7.15 | % | |
BAXTER INTERNATIONAL INC. | | | -1.74 | % | | EMERSON ELECTRIC CO. | | | -5.44 | % | |
EMERSON ELECTRIC CO. | | | -0.66 | % | | DONALDSON CO., INC. | | | -2.62 | % | |
Past performance is no guarantee of future results.
Healthcare company Medtronic, Inc. also contributed to performance, gaining 3.61% and 11.10% for the second quarter and first six months, respectively. Pending a shareholder vote later this year or in 2015, however, Medtronic is expected to merge with medical device supplier Covidien Plc and change its legal domicile to Ireland. Once completed, the merger will create a taxable event for Fund shareholders who will realize a long-term capital gain estimated at $60 million or $1.50 a share. We also anticipate the Fund may realize another $1.50 per share in non-Medtronic capital gains by year-end. As you know, Mairs & Power is committed to a policy of low portfolio turnover, and reduced tax exposure; and we consider this tax event to be an
3
MAIRS & POWER GROWTH FUND (unaudited) (continued)
anomaly. Through our long-term approach, we make adjustments to company positions over time that keep portfolio turnover low and tax consequences in check. The Fund, founded in 1958, actually provides a good illustration of this approach. Compared to its Morningstar U.S. Large Cap Blend category, portfolio turnover for the Fund was substantially lower for each of the past 10 years, while realized annual taxable capital gains exceeded $1.00 per share in only two of the past 10 years.
The largest detractor from performance during the quarter was Cray Inc., a major super computer manufacturer. However, given our long-term view of the company, we took advantage of this attractive valuation to increase our position. A number of other industrial companies in our portfolio detracted from performance, including Toro Company, a major provider of landscape maintenance equipment. Due, in part, to last winter's unseasonably cold weather, the firm lowered earnings expectations. Prior to the disappointing earnings report, we had scaled back our position somewhat, while retaining the firm as a top 10 holding based on our conviction that Toro's strong product lineup is likely to deliver revenue growth later in the year. We continue to be enthusiastic about the long-term prospects of three other industrial companies, Pentair, Graco and 3M. Portfolio adjustments are part of our overall strategy; to keep portfolio turnover low, while still taking advantage of opportunities when the market presents them to us.
Mark L. Henneman
Lead Manager | | William B. Frels
Co-Manager | |
The Fund's investment objective, risks, charges and expenses must be considered carefully before investing. The summary prospectus or full prospectus contains this and other important information about the Fund, and they may be obtained by calling Shareholder Services at (800) 304-7404 or visiting www.mairsandpower.com. Read the summary prospectus or full prospectus carefully before investing.
All investments have risks. The Growth Fund is designed for long-term investors. Equity investments are subject to market fluctuations, and the Fund's share price can fall because of weakness in the broad market, a particular industry, or specific holdings. Investments in small and midcap companies generally are more volatile. International investing risks include among others political, social or economic instability, difficulty in predicting international trade patterns, taxation and foreign trading practices, and greater fluctuations in price than United States corporations.
Diversification does not guarantee profit or protect against loss.
Lipper Multi-Cap Core Funds Index is an unmanaged index considered representative of multi-cap core funds tracked by Lipper. It is not possible to invest directly in an index.
The S&P 500 Index is an unmanaged index of 500 common stocks that is generally considered representative of the U.S. stock market. It is not possible to invest directly in an index.
4
Mairs & Power Growth Fund
PERFORMANCE INFORMATION (unaudited) June 30, 2014
Ten years of investment performance (through June 30, 2014)
This chart illustrates the performance of a hypothetical $10,000 investment made in the Fund 10 years ago.
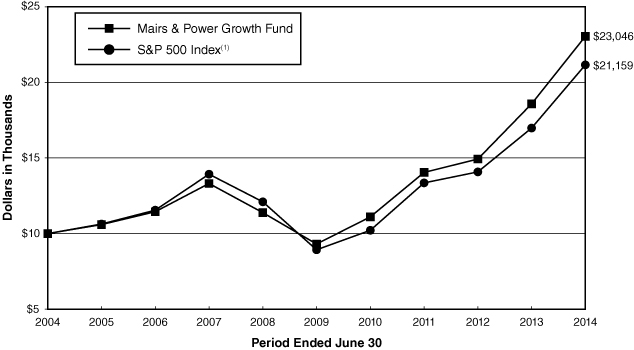
Average annual total returns for periods ended June 30, 2014
| | | 1 year | | 5 years | | 10 years | | 20 years | |
Mairs & Power Growth Fund | | | 24.03 | % | | | 19.87 | % | | | 8.71 | % | | | 13.27 | % | |
S&P 500 Index(1) | | | 24.61 | % | | | 18.83 | % | | | 7.78 | % | | | 9.79 | % | |
Performance data quoted represents past performance and does not guarantee future results. All performance information shown includes the reinvestment of dividend and capital gain distributions, but does not reflect the deduction of taxes that a shareholder would pay on Fund distributions or the redemption of Fund shares. The investment return and principal value of an investment will fluctuate so that an investor's shares, when redeemed, may be worth more or less than their original cost. Current performance of the Fund may be lower or higher than the performance quoted. For the most recent month-end performance figures, visit the Fund's website at www.mairsandpower.com or call Shareholder Services at (800) 304-7404.
(1) The S&P 500 Index is an unmanaged index of 500 common stocks that is generally considered representative of the United States stock market. It is not possible to invest directly in an index.
5
Mairs & Power Growth Fund
FUND INFORMATION (unaudited) June 30, 2014
Portfolio Managers
Mark L. Henneman, lead manager since July 1, 2013,
co-manager since 2006
University of Minnesota, MBA Finance 1990
William B. Frels, co-manager from 1999-2004, and from July 1, 2013, lead manager from 2004-2013
University of Wisconsin-Madison, BBA Finance 1962
General Information
Fund Symbol | | | MPGFX | | |
Net Asset Value (NAV) Per Share | | $ | 114.94 | | |
Expense Ratio | | | 0.65 | %1 | |
Portfolio Turnover Rate | | | 1.18 | % | |
Sales Charge | | | None2 | | |
Fund Inception Year | | | 1958 | | |
Portfolio Composition
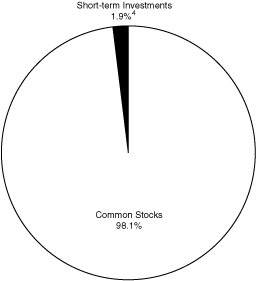
Top Ten Portfolio Holdings
(Percent of Total Net Assets) 3
US Bancorp | | | 4.1 | % | |
| 3M Co | | | 4.0 | | |
Ecolab Inc | | | 4.0 | | |
Valspar Corp/The | | | 3.9 | | |
Schlumberger Ltd | | | 3.8 | | |
Medtronic Inc | | | 3.8 | | |
Honeywell International Inc | | | 3.4 | | |
Emerson Electric Co | | | 3.4 | | |
Toro Co/The | | | 3.2 | | |
Johnson & Johnson | | | 3.0 | | |
Portfolio Diversification
(Percent of Total Net Assets)
Common Stocks 98.1% | |
Industrials | | | 30.2 | % | |
Health Care | | | 18.6 | | |
Materials | | | 13.7 | | |
Financials | | | 11.0 | | |
Information Technology | | | 10.7 | | |
Consumer Staples | | | 5.1 | | |
Consumer Discretionary | | | 4.3 | | |
Energy | | | 3.8 | | |
Utilities | | | 0.7 | | |
Short-term Investments 1.9%4 | | | 1.9 | | |
| | | | 100.0 | % | |
1 Ratio has been annualized for the six month period ended June 30, 2014.
2 Although the Fund is no-load, investment management fees and other expenses still apply.
3 All holdings in the portfolio are subject to change without notice and may or may not represent current or future portfolio composition. The mention of specific securities is not intended as a recommendation or offer for a particular security, nor is it intended to be a solicitation for the purchase or sale of any security.
4 Represents short-term investments and other assets and liabilities (net).
The Global Industry Classification Standard (GICS®) was developed by and/or is the exclusive property of MSCI, Inc. and Standard & Poor's Financial Services LLC ("S&P"). GICS is a service mark of MSCI and S&P and has been licensed for use by Mairs and Power, Inc.
6
Mairs & Power Growth Fund
SCHEDULE OF INVESTMENTS (unaudited) June 30, 2014
Shares | | Security Description | | Fair Value | |
| | | COMMON STOCKS 98.1% | |
| | | CONSUMER DISCRETIONARY 4.3% | |
| | 2,186,800 | | | Target Corp | | $ | 126,725,060 | | |
| | 640,000 | | | Walt Disney Co/The | | | 54,873,600 | | |
| | | | 181,598,660 | | |
| | | CONSUMER STAPLES 5.1% | |
| | 2,020,000 | | | General Mills Inc | | | 106,130,800 | | |
| | 2,230,000 | | | Hormel Foods Corp | | | 110,050,500 | | |
| | | | 216,181,300 | | |
| | | ENERGY 3.8% | |
| | 1,390,000 | | | Schlumberger Ltd (a) | | | 163,950,500 | | |
| | | FINANCIALS 11.0% | |
| | 1,910,000 | | | Associated Banc-Corp | | | 34,532,800 | | |
| | 1,730,000 | | | Principal Financial Group Inc | | | 87,330,400 | | |
| | 3,060,000 | | | TCF Financial Corp | | | 50,092,200 | | |
| | 300,000 | | | Travelers Cos Inc/The | | | 28,221,000 | | |
| | 4,000,000 | | | US Bancorp | | | 173,280,000 | | |
| | 1,800,000 | | | Wells Fargo & Co | | | 94,608,000 | | |
| | | | 468,064,400 | | |
| | | HEALTH CARE 18.6% | |
| | 1,450,000 | | | Baxter International Inc | | | 104,835,000 | | |
| | 1,240,000 | | | Johnson & Johnson | | | 129,728,800 | | |
| | 2,560,000 | | | Medtronic Inc | | | 163,225,600 | | |
| | 1,280,000 | | | Patterson Cos Inc | | | 50,572,800 | | |
| | 1,550,000 | | | Pfizer Inc | | | 46,004,000 | | |
| | 1,760,000 | | | Roche Holding AG ADR (f) | | | 65,648,000 | | |
| | 1,540,000 | | | St Jude Medical Inc | | | 106,645,000 | | |
| | 628,800 | | | SurModics Inc (b) | | | 13,468,896 | | |
| | 720,000 | | | Techne Corp | | | 66,650,400 | | |
| | 430,300 | | | Zimmer Holdings Inc | | | 44,690,958 | | |
| | | | 791,469,454 | | |
| | | INDUSTRIALS 30.2% | |
| | 1,190,000 | | | 3M Co | | | 170,455,600 | | |
| | 1,430,000 | | | CH Robinson Worldwide Inc | | | 91,219,700 | | |
| | 283,853 | | | Deluxe Corp | | | 16,628,109 | | |
| | 3,045,000 | | | Donaldson Co Inc | | | 128,864,400 | | |
| | 2,160,000 | | | Emerson Electric Co | | | 143,337,600 | | |
| | 1,180,000 | | | Fastenal Co | | | 58,398,200 | | |
| | 442,192 | | | G&K Services Inc, Class A | | | 23,024,937 | | |
7
Mairs & Power Growth Fund
SCHEDULE OF INVESTMENTS (unaudited) (continued) June 30, 2014
Shares | | Security Description | | Fair Value | |
| | | COMMON STOCKS (continued) | |
| | | INDUSTRIALS (continued) | |
| | 3,040,000 | | | General Electric Co | | $ | 79,891,200 | | |
| | 1,440,000 | | | Graco Inc | | | 112,435,200 | | |
| | 1,550,000 | | | Honeywell International Inc | | | 144,072,500 | | |
| | 1,600,000 | | | Pentair PLC (a) | | | 115,392,000 | | |
| | 2,126,149 | | | Toro Co/The | | | 135,223,076 | | |
| | 640,000 | | | United Parcel Service Inc, Class B | | | 65,702,400 | | |
| | | | 1,284,644,922 | | |
| | | INFORMATION TECHNOLOGY 10.7% | |
| | 784,299 | | | Badger Meter Inc (d) | | | 41,293,342 | | |
| | 1,950,000 | | | Corning Inc | | | 42,802,500 | | |
| | 1,715,152 | | | Cray Inc (b) | | | 45,623,043 | | |
| | 1,293,120 | | | Fiserv Inc (b) | | | 78,000,999 | | |
| | 780,000 | | | Intel Corp | | | 24,102,000 | | |
| | 1,200,000 | | | MTS Systems Corp (d) | | | 81,312,000 | | |
| | 486,185 | | | NVE Corp (b) (d) (e) | | | 27,027,024 | | |
| | 630,000 | | | QUALCOMM Inc | | | 49,896,000 | | |
| | 3,910,000 | | | Western Union Co/The | | | 67,799,400 | | |
| | | | 457,856,308 | | |
| | | MATERIALS 13.7% | |
| | 3,140,000 | | | Bemis Company | | | 127,672,400 | | |
| | 1,520,153 | | | Ecolab Inc | | | 169,253,835 | | |
| | 2,481,600 | | | HB Fuller Co | | | 119,364,960 | | |
| | 2,190,000 | | | Valspar Corp/The | | | 166,856,100 | | |
| | | | 583,147,295 | | |
| | | UTILITIES 0.7% | |
| | 899,400 | | | MDU Resources Group Inc | | | 31,568,940 | | |
| | | | | TOTAL COMMON STOCKS
(cost $2,188,457,165) | | $ | 4,178,481,779
| | |
| | | SHORT-TERM INVESTMENTS 1.9% | |
| 82,028,716
| | | First American Prime Obligations Fund, Class Z, 0.02% (c)
(cost $82,028,716) | | $ | 82,028,716
| | |
| | | | | TOTAL INVESTMENTS 100.0%
(cost $2,270,485,881) | | $ | 4,260,510,495
| | |
| | | | | OTHER ASSETS AND LIABILITIES (NET) 0.0% | | | (1,298,921 | ) | |
| | | | | TOTAL NET ASSETS 100.0% | | $ | 4,259,211,574 | | |
8
Mairs & Power Growth Fund
SCHEDULE OF INVESTMENTS (unaudited) (continued) June 30, 2014
(a) Foreign security denominated in U.S. dollars. As of June 30, 2014, these securities represented $279,342,500 or 6.6% of total net assets.
(b) Non-income producing.
(c) The rate quoted is the annualized seven-day effective yield as of June 30, 2014.
(d) Affiliated company (Note 5).
(e) Illiquid security.
(f) American Depositary Receipt.
The Global Industry Classification Standard (GICS®) was developed by and/or is the exclusive property of MSCI, Inc. and Standard & Poor's Financial Services LLC ("S&P"). GICS is a service mark of MSCI and S&P and has been licensed for use by Mairs and Power, Inc.
See accompanying Notes to Financial Statements.
9
MAIRS & POWER BALANCED FUND (unaudited)
To Our Shareholders: June 30, 2014
For the second quarter and six months ending June 30, 2014, the Mairs & Power Balanced Fund gained 3.82% and 5.92% respectively, in line with its benchmark composite index (60% S&P 500 Index and 40% Barclays Government/Credit Bond Index), which gained 3.90% and 5.90% for the periods.
The pace of the economic recovery continued steadily through the first half of the year. It seems a little surprising that it was only 12 months ago last May when the market went into full flight to safety mode after the Federal Reserve (Fed) announced it would scale back the stimulus policy of quantitative easing (QE) sometime in the fall of 2013. All in all, the market stayed in a cool, calm and collected mood during the first half of the year and took war, stimulus tapering, hints of inflation and rising yields in stride.
In general, our selections in energy and higher dividend stocks benefited the portfolio. America's move to greater energy independence which began more than a decade ago has continued to benefit firms like Schlumberger whose businesses are concentrated in oil and gas exploration. Accordingly, Schlumberger proved to be a top contributor to Fund performance for both the past quarter and the past six months through June 30, and gained 20.97% and 30.90%, respectively. Since 2008, Schlumberger has made major investments in technology innovations, product reliability and better processes. As it gains market share, the firm continues to hold leading market positions in proprietary software, patents, and major equipment.
Another strong contributor to performance in the first half of the year was global supply chain consultant C.H. Robinson Worldwide, Inc., which gained 21.76% and 9.34% respectively for the second quarter and first six months. The firm's efforts to better service high-end customers resulted in a favorable report in the first quarter and helped reverse a downbeat, two-year performance trend. At its attractive levels of value, we continued to add to our position in C.H. Robinson during the first half of the year.
Healthcare company Medtronic, Inc. also contributed to performance, gaining 3.61% and 11.10% for the second quarter and first six months, respectively. Pending a shareholder vote either later this year or in 2015, however, Medtronic is expected to merge with medical device supplier Covidien Plc and change its legal domicile to Ireland. Once completed, the merger will create a taxable event for Fund shareholders who will realize a long-term capital gain estimated at $5.5 million or $0.75 a share. As always, Mairs & Power is committed to a policy of low portfolio turnover, and low exposure to taxable gains; we view this tax event as an anomaly.
Performance detractors included Pentair, IBM and Target. However, we did not trim any of our positions as we continue to view these selections favorably over the long-term.
MAIRS & POWER BALANCED FUND
Top Performers
Second Quarter (3/31/14 – 6/30/14) | | Year To Date (12/31/13 – 6/30/14) | |
CONOCOPHILIPS | | | 21.86 | % | | SCHLUMBERGER, LTD. | | | 30.90 | % | |
CH ROBINSON WORLDWIDE INC. | | | 21.76 | % | | CORNING INC. | | | 23.18 | % | |
SCHLUMBERGER, LTD. | | | 20.97 | % | | CONOCOPHILIPS | | | 21.34 | % | |
DELUXE CORP. | | | 11.64 | % | | WELLS FARGO & CO. | | | 15.77 | % | |
PRINCIPAL FINANCIAL GROUP | | | 9.76 | % | | DELUXE CORP. | | | 12.24 | % | |
Weak Performers
Second Quarter (3/31/14 – 6/30/14) | | Year To Date (12/31/13 – 6/30/14) | |
PENTAIR LTD. | | | -9.10 | % | | TARGET CORP. | | | -8.41 | % | |
INT'L BUSINESS | | | | PENTAIR LTD. | | | -7.15 | % | |
MACHINES CORP. | | | -5.83 | % | | GENERAL ELECTRIC CO. | | | -6.24 | % | |
TARGET CORP. | | | -4.23 | % | | EMERSON ELECTRIC CO. | | | -5.44 | % | |
BAXTER INTERNATIONAL INC. | | | -1.74 | % | | UNITED PARCEL SERVICE, INC., | | | |
EMERSON ELECTRIC CO. | | | -0.66 | % | | CLASS B | | | -2.30 | % | |
Past performance is no guarantee of future results.
10
MAIRS & POWER BALANCED FUND (unaudited) (continued)
On the income side, we saw our companies increase their dividends at a rate that outpaced the dividend for our benchmark through the first half of the year. Additionally, interest rates generally declined, especially bonds with durations of 10 years and beyond on the Treasury curve. Overall, bond prices improved during the first half of the year. Accordingly, we maintained a concentration in investment-grade bonds with longer durations as we saw a tightening in yield spreads in the U.S. Government sector. We still think more may be gained on the fixed income side as the Federal Reserve continues to taper back on quantitative easing. For investors who prefer a single vehicle that can straddle the equity and fixed income markets to take advantage of growth opportunities as well as favorable movements in the debt markets, we believe the Mairs & Power Balanced Fund continues to offer an effective way to do so.
Ronald L. Kaliebe
Lead Manager | | William B. Frels
Co-Manager | |
The Fund's investment objective, risks, charges and expenses must be considered carefully before investing. The summary prospectus or full prospectus contains this and other important information about the Fund, and they may be obtained by calling Shareholder Services at (800) 304-7404 or visiting www.mairsandpower.com. Read the summary prospectus or full prospectus carefully before investing.
All investments have risks. The Balanced Fund is designed for long-term investors. Equity investments are subject to market fluctuations, and the Fund's share price can fall because of weakness in the broad market, a particular industry, or specific holdings. Investments in small and midcap companies generally are more volatile. International investing risks include among others political, social or economic instability, difficulty in predicting international trade patterns, taxation and foreign trading practices, and greater fluctuations in price than United States corporations.
Diversification does not guarantee profit or protect against loss.
Barclays Government/Credit Bond Index is composed of high-quality, investment-grade United States government and corporate fixed income securities with maturities greater than one year. It is not possible to invest directly in an index.
Quantitative Easing is an unconventional monetary policy in which a central bank purchases government securities or other securities from the market in order to lower interest rates and increase the money supply.
The S&P 500 Index is an unmanaged index of 500 common stocks that is generally considered representative of the U.S. stock market. It is not possible to invest directly in an index.
11
Mairs & Power Balanced Fund
PERFORMANCE INFORMATION (unaudited) June 30, 2014
Ten years of investment performance (through June 30, 2014)
This chart illustrates the performance of a hypothetical $10,000 investment made in the Fund 10 years ago.
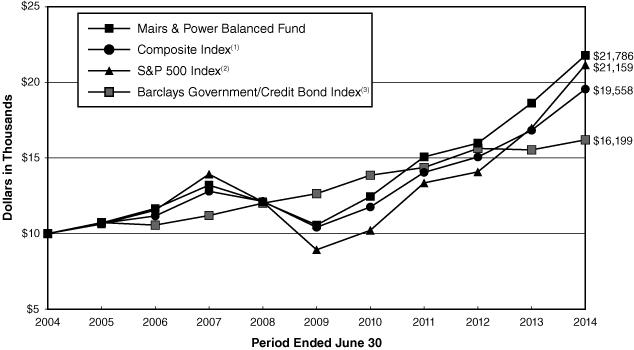
Average annual total returns for periods ended June 30, 2014
| | | 1 year | | 5 years | | 10 years | | 20 years | |
Mairs & Power Balanced Fund | | | 16.93 | % | | | 15.57 | % | | | 8.10 | % | | | 10.29 | % | |
Composite Index(1) | | | 16.20 | % | | | 13.43 | % | | | 6.94 | % | | | 8.66 | % | |
S&P 500 Index(2) | | | 24.61 | % | | | 18.83 | % | | | 7.78 | % | | | 9.79 | % | |
Barclays Government/
Credit Bond Index(3) | | | 4.28 | % | | | 5.09 | % | | | 4.94 | % | | | 6.18 | % | |
Performance data quoted represents past performance and does not guarantee future results. All performance information shown includes the reinvestment of dividend and capital gain distributions, but does not reflect the deduction of taxes that a shareholder would pay on Fund distributions or the redemption of Fund shares. The investment return and principal value of an investment will fluctuate so that an investor's shares, when redeemed, may be worth more or less than their original cost. Current performance of the Fund may be lower or higher than the performance quoted. For the most recent month-end performance figures, visit the Fund's website at www.mairsandpower.com or call Shareholder Services at (800) 304-7404.
(1) The Composite Index reflects an unmanaged portfolio comprised of 60% of the S&P 500 Index and 40% of the Barclays Government/Credit Bond Index. It is not possible to invest directly in an index.
(2) The S&P 500 Index is an unmanaged index of 500 common stocks that is generally considered representative of the United States stock market. It is not possible to invest directly in an index.
(3) The Barclays Government/Credit Bond Index is composed of high-quality, investment-grade United States government and corporate fixed income securities with maturities greater than one year. It is not possible to invest directly in an index.
12
Mairs & Power Balanced Fund
FUND INFORMATION (unaudited) June 30, 2014
Portfolio Managers
Ronald L. Kaliebe, lead manager since July 1, 2013,
co-manager since 2006
University of Wisconsin-Madison, MBA Finance 1980
William B. Frels, co-manager since July 1, 2013,
lead manager from 1992 – July 1, 2013
University of Wisconsin-Madison, BBA Finance 1962
General Information
Fund Symbol | | MAPOX | |
Net Asset Value (NAV) Per Share | | $ | 86.20 | | |
Expense Ratio | | | 0.73 | %1 | |
Portfolio Turnover Rate | | | 1.45 | % | |
Sales Charge | | | None2 | | |
Fund Inception Year | | | 1961 | | |
Portfolio Composition
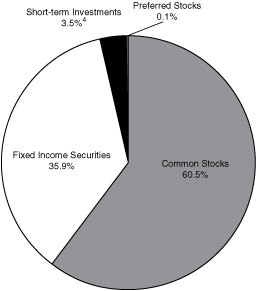
Top Ten Common Stock Holdings
(Percent of Total Net Assets) 3
Schlumberger Ltd | | | 2.8 | % | |
United Parcel Service Inc, Class B | | | 2.7 | | |
Emerson Electric Co | | | 2.4 | | |
Medtronic Inc | | | 2.4 | | |
Exxon Mobil Corp | | | 2.4 | | |
US Bancorp | | | 2.3 | | |
Deluxe Corp | | | 2.2 | | |
ConocoPhillips | | | 2.0 | | |
Target Corp | | | 2.0 | | |
| 3M Co | | | 1.9 | | |
Portfolio Diversification
(Percent of Total Net Assets)
Fixed Income Securities 35.9% | |
Corporate Bonds | | | 29.1 | % | |
Federal Agency Obligations | | | 4.3 | | |
Asset Backed Securities | | | 1.5 | | |
Preferred Securities | | | 1.0 | | |
Common Stocks 60.5% | |
Industrials | | | 16.1 | | |
Financials | | | 9.1 | | |
Health Care | | | 9.0 | | |
Energy | | | 8.2 | | |
Information Technology | | | 5.4 | | |
Materials | | | 4.4 | | |
Consumer Discretionary | | | 3.3 | | |
Consumer Staples | | | 2.8 | | |
Utilities | | | 2.2 | | |
Preferred Stocks 0.1% | | | 0.1 | | |
Short-term Investments 3.5%4 | | | 3.5 | | |
| | | | 100.0 | % | |
1 Ratio has been annualized for the six month period ended June 30, 2014.
2 Although the Fund is no-load, investment management fees and other expenses still apply.
3 All holdings in the portfolio are subject to change without notice and may or may not represent current or future portfolio composition. The mention of specific securities is not intended as a recommendation or offer for a particular security, nor is it intended to be a solicitation for the purchase or sale of any security.
4 Represents short-term investments and other assets and liabilities (net).
The Global Industry Classification Standard (GICS®) was developed by and/or is the exclusive property of MSCI, Inc. and Standard & Poor's Financial Services LLC ("S&P"). GICS is a service mark of MSCI and S&P and has been licensed for use by Mairs and Power, Inc.
13
Mairs & Power Balanced Fund
SCHEDULE OF INVESTMENTS (unaudited) June 30, 2014
Par Value | | Security Description | | Fair Value | |
| | | FIXED INCOME SECURITIES 35.9% | |
| | | FEDERAL AGENCY OBLIGATIONS 4.3% | |
$ | 1,000,000 | | | Federal National Mortgage Association | | | 3.250 | % | | 03/27/28 | | $ | 962,125 | | |
| | 875,000 | | | Federal Farm Credit Banks | | | 3.450 | % | | 06/05/28 | | | 852,056 | | |
| | 1,000,000 | | | Federal Farm Credit Banks | | | 3.700 | % | | 06/20/28 | | | 1,000,375 | | |
| | 1,000,000 | | | Federal Farm Credit Banks | | | 4.240 | % | | 07/17/28 | | | 1,001,672 | | |
| | 500,000 | | | Federal Farm Credit Banks | | | 4.000 | % | | 08/01/28 | | | 501,374 | | |
| | 1,000,000 | | | Federal Farm Credit Banks | | | 4.080 | % | | 08/15/28 | | | 1,002,514 | | |
| | 1,040,000 | | | Federal Farm Credit Banks | | | 4.150 | % | | 11/20/28 | | | 1,047,305 | | |
| | 1,084,000 | | | Federal Farm Credit Banks | | | 3.200 | % | | 04/24/30 | | | 1,004,756 | | |
| | 1,000,000 | | | Federal Home Loan Banks | | | 3.300 | % | | 05/07/32 | | | 925,122 | | |
| | 500,000 | | | Federal National Mortgage Association | | | 3.400 | % | | 09/27/32 | | | 465,229 | | |
| | 1,000,000 | | | Federal Home Loan Banks | | | 3.180 | % | | 12/06/32 | | | 904,448 | | |
| | 1,000,000 | | | Federal Home Loan Banks | | | 3.250 | % | | 01/18/33 | | | 910,136 | | |
| | 1,000,000 | | | Federal Farm Credit Banks | | | 3.480 | % | | 02/07/33 | | | 932,507 | | |
| | 1,000,000 | | | Federal Home Loan Banks | | | 3.230 | % | | 02/07/33 | | | 896,953 | | |
| | 2,000,000 | | | Federal Home Loan Banks | | | 3.500 | % | | 02/22/33 | | | 1,864,250 | | |
| | 1,000,000 | | | Federal Farm Credit Banks | | | 3.500 | % | | 02/28/33 | | | 949,041 | | |
| | 1,500,000 | | | Federal National Mortgage Association | | | 3.500 | % | | 03/07/33 | | | 1,400,786 | | |
| | 3,000,000 | | | Federal National Mortgage Association | | | 3.250 | % | | 03/25/33 | | | 2,684,406 | | |
| | 500,000 | | | Federal National Mortgage Association | | | 3.250 | % | | 04/29/33 | | | 466,549 | | |
| | 1,000,000 | | | Federal Home Loan Banks | | | 3.300 | % | | 05/09/33 | | | 907,751 | | |
| | 500,000 | | | Federal National Mortgage Association | | | 3.430 | % | | 05/27/33 | | | 472,099 | | |
| | 1,000,000 | | | Federal Farm Credit Banks | | | 4.100 | % | | 07/01/33 | | | 1,000,422 | | |
| | 500,000 | | | Federal Home Loan Banks | | | 3.730 | % | | 07/01/33 | | | 479,808 | | |
| | 500,000 | | | Federal Home Loan Banks | | | 4.700 | % | | 07/25/33 | | | 511,607 | | |
| | 840,000 | | | Federal Farm Credit Banks | | | 3.125 | % | | 12/05/33 | | | 773,365 | | |
| | 1,000,000 | | | Federal Farm Credit Banks | | | 4.375 | % | | 02/21/34 | | | 1,033,531 | | |
| | 500,000 | | | Federal Home Loan Banks | | | 4.000 | % | | 05/19/34 | | | 499,700 | | |
| | 1,000,000 | | | Federal Home Loan Banks | | | 4.000 | % | | 06/12/34 | | | 1,001,484 | | |
| | 1,000,000 | | | Federal Home Loan Banks | | | 4.050 | % | | 07/14/34 | | | 997,069 | | |
| | 1,000,000 | | | Federal Home Loan Banks | | | 3.480 | % | | 10/09/37 | | | 874,301 | | |
| | | | 28,322,741 | | |
| | | CORPORATE BONDS 29.1% | |
| | | CONSUMER DISCRETIONARY 3.3% | |
| | 250,000 | | | Maytag Corp | | | 5.000 | % | | 05/15/15 | | | 258,800 | | |
| | 500,000 | | | Gannett Co Inc | | | 6.375 | % | | 09/01/15 | | | 527,500 | | |
| | 340,000 | | | Johnson Controls Inc | | | 5.500 | % | | 01/15/16 | | | 363,727 | | |
| | 250,000 | | | ServiceMaster Co/The | | | 7.100 | % | | 03/01/18 | | | 263,750 | | |
| | 500,000 | | | Best Buy Co Inc | | | 5.000 | % | | 08/01/18 | | | 524,375 | | |
14
Mairs & Power Balanced Fund
SCHEDULE OF INVESTMENTS (unaudited) (continued) June 30, 2014
Par Value | | Security Description | | Fair Value | |
| | | FIXED INCOME SECURITIES (continued) | |
| | | CORPORATE BONDS (continued) | |
| | | CONSUMER DISCRETIONARY (continued) | |
$ | 1,000,000 | | | Ford Motor Credit Co LLC | | | 3.000 | % | | 12/20/18 | | $ | 1,014,853 | | |
| | 500,000 | | | Ford Motor Credit Co LLC | | | 3.450 | % | | 08/20/20 | | | 499,972 | | |
| | 1,000,000 | | | Time Warner Cable Inc | | | 4.125 | % | | 02/15/21 | | | 1,079,748 | | |
| | 1,000,000 | | | Best Buy Co Inc | | | 5.500 | % | | 03/15/21 | | | 1,025,000 | | |
| | 1,500,000 | | | Time Warner Cable Inc | | | 4.000 | % | | 09/01/21 | | | 1,602,354 | | |
| | 555,000 | | | Kohl's Corp | | | 4.000 | % | | 11/01/21 | | | 578,415 | | |
| | 500,000 | | | Whirlpool Corp | | | 4.700 | % | | 06/01/22 | | | 541,998 | | |
| | 1,750,000 | | | Newell Rubbermaid Inc | | | 4.000 | % | | 06/15/22 | | | 1,818,714 | | |
| | 1,000,000 | | | Block Financial LLC | | | 5.500 | % | | 11/01/22 | | | 1,091,755 | | |
| | 2,200,000 | | | Darden Restaurants Inc | | | 3.350 | % | | 11/01/22 | | | 2,158,167 | | |
| | 1,000,000 | | | Staples Inc | | | 4.375 | % | | 01/12/23 | | | 1,003,410 | | |
| | 2,000,000 | | | Kohl's Corp | | | 3.250 | % | | 02/01/23 | | | 1,934,898 | | |
| | 1,000,000 | | | Wyndham Worldwide Corp | | | 3.900 | % | | 03/01/23 | | | 1,004,557 | | |
| | 500,000 | | | Hyatt Hotels Corp | | | 3.375 | % | | 07/15/23 | | | 487,388 | | |
| | 1,000,000 | | | Ford Motor Credit Co LLC | | | 4.000 | % | | 04/20/24 | | | 1,000,039 | | |
| | 1,000,000 | | | Metropolitan Opera Association Inc | | | 4.349 | % | | 10/01/32 | | | 996,592 | | |
| | 2,000,000 | | | Comcast Corp | | | 4.250 | % | | 01/15/33 | | | 2,054,470 | | |
| | | | 21,830,482 | | |
| | | CONSUMER STAPLES 1.4% | |
| | 500,000 | | | SUPERVALU Inc | | | 8.000 | % | | 05/01/16 | | | 549,375 | | |
| | 525,000 | | | Cargill Inc (e) | | | 6.000 | % | | 11/27/17 | | | 598,853 | | |
| | 1,000,000 | | | Avon Products Inc | | | 4.200 | % | | 07/15/18 | | | 1,038,737 | | |
| | 1,000,000 | | | Safeway Inc | | | 3.950 | % | | 08/15/20 | | | 1,018,781 | | |
| | 500,000 | | | Safeway Inc | | | 4.750 | % | | 12/01/21 | | | 513,621 | | |
| | 1,274,000 | | | Avon Products Inc | | | 5.000 | % | | 03/15/23 | | | 1,289,506 | | |
| | 2,949,000 | | | Land O'Lakes Capital Trust I (e) | | | 7.450 | % | | 03/15/28 | | | 2,971,117 | | |
| | 500,000 | | | Altria Group Inc | | | 4.250 | % | | 08/09/42 | | | 465,842 | | |
| | 1,000,000 | | | Cargill Inc (e) | | | 4.100 | % | | 11/01/42 | | | 962,661 | | |
| | | | 9,408,493 | | |
| | | ENERGY 2.2% | |
| | 500,000 | | | Anadarko Petroleum Corp | | | 5.950 | % | | 09/15/16 | | | 553,778 | | |
| | 250,000 | | | ConocoPhillips | | | 6.650 | % | | 07/15/18 | | | 298,076 | | |
| | 1,500,000 | | | Murphy Oil Corp | | | 4.000 | % | | 06/01/22 | | | 1,518,197 | | |
| | 500,000 | | | Western Gas Partners LP | | | 4.000 | % | | 07/01/22 | | | 517,843 | | |
| | 3,000,000 | | | Transocean Inc (a) | | | 3.800 | % | | 10/15/22 | | | 2,969,169 | | |
| | 500,000 | | | Murphy Oil Corp | | | 3.700 | % | | 12/01/22 | | | 497,627 | | |
| | 1,500,000 | | | Sunoco Logistics Partners Operations LP | | | 3.450 | % | | 01/15/23 | | | 1,479,674 | | |
15
Mairs & Power Balanced Fund
SCHEDULE OF INVESTMENTS (unaudited) (continued) June 30, 2014
Par Value | | Security Description | | Fair Value | |
| | | FIXED INCOME SECURITIES (continued) | |
| | | CORPORATE BONDS (continued) | |
| | | ENERGY (continued) | |
$ | 3,000,000 | | | Williams Cos Inc/The | | | 3.700 | % | | 01/15/23 | | $ | 2,885,811 | | |
| | 1,945,000 | | | Boardwalk Pipelines LP | | | 3.375 | % | | 02/01/23 | | | 1,797,732 | | |
| | 575,000 | | | DCP Midstream Operating LP | | | 3.875 | % | | 03/15/23 | | | 582,146 | | |
| | 500,000 | | | Global Marine Inc | | | 7.000 | % | | 06/01/28 | | | 562,807 | | |
| | 500,000 | | | Murphy Oil Corp | | | 5.125 | % | | 12/01/42 | | | 493,731 | | |
| | 500,000 | | | Apache Corp | | | 4.250 | % | | 01/15/44 | | | 491,746 | | |
| | | | 14,648,337 | | |
| | | FINANCIALS 9.3% | |
| | 500,000 | | | Citigroup Inc | | | 5.000 | % | | 09/15/14 | | | 504,427 | | |
| | 500,000 | | | Regions Financial Corp | | | 7.750 | % | | 11/10/14 | | | 512,490 | | |
| | 500,000 | | | Navient Corp | | | 5.050 | % | | 11/14/14 | | | 506,875 | | |
| | 500,000 | | | Ally Financial Inc | | | 6.750 | % | | 12/01/14 | | | 511,875 | | |
| | 500,000 | | | Principal Life Global Funding I (e) | | | 5.050 | % | | 03/15/15 | | | 515,849 | | |
| | 500,000 | | | M&I Marshall & Ilsley Bank | | | 4.850 | % | | 06/16/15 | | | 519,884 | | |
| | 500,000 | | | TCF National Bank | | | 5.500 | % | | 02/01/16 | | | 508,098 | | |
| | 500,000 | | | KeyBank NA/Cleveland OH | | | 5.450 | % | | 03/03/16 | | | 537,742 | | |
| | 500,000 | | | Symetra Financial Corp (e) | | | 6.125 | % | | 04/01/16 | | | 536,616 | | |
| | 250,000 | | | Security Benefit Life Insurance Co (e) | | | 8.750 | % | | 05/15/16 | | | 273,574 | | |
| | 500,000 | | | Bank of America Corp | | | 6.050 | % | | 05/16/16 | | | 543,833 | | |
| | 500,000 | | | Torchmark Corp | | | 6.375 | % | | 06/15/16 | | | 548,723 | | |
| | 500,000 | | | National City Bank/Cleveland OH | | | 5.250 | % | | 12/15/16 | | | 548,104 | | |
| | 500,000 | | | M&I Marshall & Ilsley Bank | | | 5.000 | % | | 01/17/17 | | | 541,065 | | |
| | 500,000 | | | Citigroup Inc | | | 5.500 | % | | 02/15/17 | | | 549,881 | | |
| | 500,000 | | | Sirius International Group Ltd (a) (e) | | | 6.375 | % | | 03/20/17 | | | 552,990 | | |
| | 250,000 | | | Bank of America Corp | | | 5.700 | % | | 05/02/17 | | | 277,430 | | |
| | 500,000 | | | Royal Bank of Scotland Group PLC (a) | | | 4.250 | % | | 07/15/17 | | | 530,783 | | |
| | 500,000 | | | Comerica Bank | | | 5.200 | % | | 08/22/17 | | | 554,645 | | |
| | 500,000 | | | Bank of America Corp | | | 6.000 | % | | 09/01/17 | | | 564,868 | | |
| | 500,000 | | | American Express Bank FSB | | | 6.000 | % | | 09/13/17 | | | 571,401 | | |
| | 500,000 | | | Bear Stearns Cos LLC/The | | | 6.400 | % | | 10/02/17 | | | 576,465 | | |
| | 500,000 | | | Hartford Financial Services Group Inc/The | | | 4.000 | % | | 10/15/17 | | | 539,532 | | |
| | 500,000 | | | Prudential Financial Inc | | | 6.000 | % | | 12/01/17 | | | 572,530 | | |
| | 500,000 | | | Barclays Bank PLC (a) (e) | | | 6.050 | % | | 12/04/17 | | | 567,207 | | |
| | 1,000,000 | | | Morgan Stanley | | | 5.950 | % | | 12/28/17 | | | 1,138,469 | | |
| | 500,000 | | | Goldman Sachs Group Inc/The | | | 5.950 | % | | 01/18/18 | | | 568,025 | | |
| | 500,000 | | | Wachovia Corp | | | 5.750 | % | | 02/01/18 | | | 572,398 | | |
| | 250,000 | | | Lincoln National Corp | | | 7.000 | % | | 03/15/18 | | | 291,954 | | |
16
Mairs & Power Balanced Fund
SCHEDULE OF INVESTMENTS (unaudited) (continued) June 30, 2014
Par Value | | Security Description | | Fair Value | |
| | | FIXED INCOME SECURITIES (continued) | |
| | | CORPORATE BONDS (continued) | |
| | | FINANCIALS (continued) | |
$ | 500,000 | | | SunTrust Bank/Atlanta GA | | | 7.250 | % | | 03/15/18 | | $ | 592,043 | | |
| | 500,000 | | | Morgan Stanley | | | 6.625 | % | | 04/01/18 | | | 584,487 | | |
| | 1,000,000 | | | Jefferies Group LLC | | | 5.125 | % | | 04/13/18 | | | 1,095,623 | | |
| | 500,000 | | | Bank of America Corp | | | 6.875 | % | | 04/25/18 | | | 589,066 | | |
| | 500,000 | | | Provident Cos Inc | | | 7.000 | % | | 07/15/18 | | | 585,663 | | |
| | 500,000 | �� | | MetLife Inc | | | 6.817 | % | | 08/15/18 | | | 597,663 | | |
| | 500,000 | | | Hartford Financial Services Group Inc/The | | | 6.000 | % | | 01/15/19 | | | 580,195 | | |
| | 500,000 | | | Royal Bank of Scotland Group PLC (a) | | | 5.250 | % | | 02/15/19 | | | 536,615 | | |
| | 500,000 | | | BB&T Corp | | | 6.850 | % | | 04/30/19 | | | 607,455 | | |
| | 250,000 | | | WR Berkley Corp | | | 6.150 | % | | 08/15/19 | | | 282,548 | | |
| | 500,000 | | | Prospect Capital Corp | | | 5.950 | % | | 09/15/19 | | | 494,030 | | |
| | 500,000 | | | Protective Life Corp | | | 7.375 | % | | 10/15/19 | | | 618,654 | | |
| | 500,000 | | | Prospect Capital Corp | | | 5.125 | % | | 11/15/19 | | | 491,131 | | |
| | 1,629,000 | | | Zions Bancorporation | | | 4.150 | % | | 11/15/19 | | | 1,633,073 | | |
| | 500,000 | | | Credit Suisse/New York NY (a) | | | 5.400 | % | | 01/14/20 | | | 561,851 | | |
| | 500,000 | | | Prospect Capital Corp | | | 4.000 | % | | 01/15/20 | | | 491,232 | | |
| | 500,000 | | | Morgan Stanley | | | 5.500 | % | | 01/26/20 | | | 572,284 | | |
| | 500,000 | | | Hartford Financial Services Group Inc/The | | | 5.500 | % | | 03/30/20 | | | 572,161 | | |
| | 450,000 | | | Compass Bank | | | 5.500 | % | | 04/01/20 | | | 489,971 | | |
| | 537,000 | | | Manufacturers & Traders Trust Co (d) | | | 5.585 | % | | 12/28/20 | | | 559,829 | | |
| | 500,000 | | | Wells Fargo & Co (d) | | | 2.000 | % | | 01/31/21 | | | 493,772 | | |
| | 1,000,000 | | | Nationwide Financial Services Inc (e) | | | 5.375 | % | | 03/25/21 | | | 1,113,628 | | |
| | 500,000 | | | Markel Corp | | | 5.350 | % | | 06/01/21 | | | 561,682 | | |
| | 500,000 | | | Goldman Sachs Group Inc/The | | | 5.250 | % | | 07/27/21 | | | 561,466 | | |
| | 500,000 | | | Genworth Holdings Inc | | | 7.625 | % | | 09/24/21 | | | 626,428 | | |
| | 500,000 | | | Aflac Inc | | | 4.000 | % | | 02/15/22 | | | 535,003 | | |
| | 2,000,000 | | | OneBeacon US Holdings Inc | | | 4.600 | % | | 11/09/22 | | | 2,064,864 | | |
| | 1,000,000 | | | Standard Chartered PLC (a) (e) | | | 3.950 | % | | 01/11/23 | | | 994,749 | | |
| | 500,000 | | | Wells Fargo & Co | | | 3.450 | % | | 02/13/23 | | | 497,554 | | |
| | 2,500,000 | | | Assurant Inc | | | 4.000 | % | | 03/15/23 | | | 2,515,137 | | |
| | 1,000,000 | | | Markel Corp | | | 3.625 | % | | 03/30/23 | | | 997,657 | | |
| | 1,500,000 | | | Citigroup Inc | | | 3.500 | % | | 05/15/23 | | | 1,460,169 | | |
| | 500,000 | | | Morgan Stanley | | | 4.100 | % | | 05/22/23 | | | 507,207 | | |
| | 2,000,000 | | | Liberty Mutual Group Inc (e) | | | 4.250 | % | | 06/15/23 | | | 2,072,934 | | |
| | 500,000 | | | Ameriprise Financial Inc | | | 4.000 | % | | 10/15/23 | | | 527,115 | | |
| | 500,000 | | | CNA Financial Corp | | | 7.250 | % | | 11/15/23 | | | 625,164 | | |
| | 500,000 | | | Pacific Life Insurance Co (e) | | | 7.900 | % | | 12/30/23 | | | 649,711 | | |
| | 1,000,000 | | | Moody's Corp | | | 4.875 | % | | 02/15/24 | | | 1,070,397 | | |
17
Mairs & Power Balanced Fund
SCHEDULE OF INVESTMENTS (unaudited) (continued) June 30, 2014
Par Value | | Security Description | | Fair Value | |
| | | FIXED INCOME SECURITIES (continued) | |
| | | CORPORATE BONDS (continued) | |
| | | FINANCIALS (continued) | |
$ | 1,000,000 | | | NASDAQ OMX Group Inc/The | | | 4.250 | % | | 06/01/24 | | $ | 1,013,782 | | |
| | 500,000 | | | Wintrust Financial Corp | | | 5.000 | % | | 06/13/24 | | | 521,238 | | |
| | 250,000 | | | Assured Guaranty US Holdings Inc | | | 5.000 | % | | 07/01/24 | | | 248,511 | | |
| | 250,000 | | | Liberty Mutual Insurance Co (e) | | | 8.500 | % | | 05/15/25 | | | 316,229 | | |
| | 1,000,000 | | | National Rural Utilities Cooperative Finance Corp | | | 3.000 | % | | 11/15/26 | | | 960,055 | | |
| | 500,000 | | | Citigroup Inc | | | 5.200 | % | | 01/25/27 | | | 503,238 | | |
| | 250,000 | | | Provident Cos Inc | | | 7.250 | % | | 03/15/28 | | | 316,289 | | |
| | 1,000,000 | | | JPMorgan Chase & Co. (d) | | | 3.000 | % | | 03/21/28 | | | 895,135 | | |
| | 1,000,000 | | | JPMorgan Chase & Co (d) | | | 3.000 | % | | 03/22/28 | | | 971,377 | | |
| | 1,000,000 | | | Royal Bank of Canada (a) | | | 3.000 | % | | 05/10/28 | | | 917,879 | | |
| | 500,000 | | | Farmers Exchange Capital (e) | | | 7.050 | % | | 07/15/28 | | | 641,527 | | |
| | 500,000 | | | Goldman Sachs Group Inc/The (d) | | | 4.000 | % | | 07/30/28 | | | 493,987 | | |
| | 500,000 | | | Goldman Sachs Group Inc/The | | | 4.250 | % | | 11/15/30 | | | 493,009 | | |
| | 500,000 | | | Goldman Sachs Group Inc/The | | | 4.000 | % | | 02/15/31 | | | 509,212 | | |
| | 500,000 | | | Goldman Sachs Group Inc/The | | | 4.300 | % | | 12/15/32 | | | 491,833 | | |
| | 1,000,000 | | | JPMorgan Chase & Co (d) | | | 3.250 | % | | 01/31/33 | | | 910,150 | | |
| | 649,000 | | | Lloyds Bank PLC (a) (d) | | | 3.400 | % | | 01/31/33 | | | 599,098 | | |
| | 250,000 | | | Citigroup Inc (d) | | | 4.000 | % | | 06/27/34 | | | 233,275 | | |
| | 500,000 | | | Barclays Bank PLC (a) (d) | | | 4.000 | % | | 10/09/37 | | | 476,176 | | |
| | 1,000,000 | | | Berkshire Hathaway Finance Corp | | | 4.400 | % | | 05/15/42 | | | 1,011,266 | | |
| | 500,000 | | | MetLife Inc | | | 4.125 | % | | 08/13/42 | | | 486,605 | | |
| | 500,000 | | | Swiss Re Treasury US Corp (e) | | | 4.250 | % | | 12/06/42 | | | 481,623 | | |
| | 500,000 | | | Pacific Life Corp (e) | | | 5.125 | % | | 01/30/43 | | | 518,775 | | |
| | 500,000 | | | Berkshire Hathaway Finance Corp | | | 4.300 | % | | 05/15/43 | | | 496,726 | | |
| | 500,000 | | | Principal Financial Group Inc | | | 4.350 | % | | 05/15/43 | | | 493,519 | | |
| | | | 60,948,458 | | |
| | | HEALTH CARE 0.8% | |
| | 500,000 | | | UnitedHealth Group Inc | | | 6.000 | % | | 02/15/18 | | | 576,872 | | |
| | 1,000,000 | | | Quest Diagnostics Inc | | | 4.700 | % | | 04/01/21 | | | 1,078,591 | | |
| | 1,000,000 | | | Laboratory Corp of America Holdings | | | 3.750 | % | | 08/23/22 | | | 1,011,867 | | |
| | 1,000,000 | | | Laboratory Corp of America Holdings | | | 4.000 | % | | 11/01/23 | | | 1,013,229 | | |
| | 1,000,000 | | | Mylan Inc | | | 4.200 | % | | 11/29/23 | | | 1,032,177 | | |
| | 500,000 | | | Wyeth LLC | | | 6.450 | % | | 02/01/24 | | | 618,403 | | |
| | | | 5,331,139 | | |
| | | INDUSTRIALS 3.5% | |
| | 500,000 | | | Deluxe Corp | | | 7.000 | % | | 03/15/19 | | | 535,000 | | |
| | 500,000 | | | Masco Corp | | | 7.125 | % | | 03/15/20 | | | 588,360 | | |
18
Mairs & Power Balanced Fund
SCHEDULE OF INVESTMENTS (unaudited) (continued) June 30, 2014
Par Value | | Security Description | | Fair Value | |
| | | FIXED INCOME SECURITIES (continued) | |
| | | CORPORATE BONDS (continued) | |
| | | INDUSTRIALS (continued) | |
$ | 500,000 | | | Pentair Finance SA (a) | | | 5.000 | % | | 05/15/21 | | $ | 552,689 | | |
| | 500,000 | | | IDEX Corp | | | 4.200 | % | | 12/15/21 | | | 518,696 | | |
| | 500,000 | | | Masco Corp | | | 5.950 | % | | 03/15/22 | | | 552,500 | | |
| | 1,500,000 | | | URS Corp (d) | | | 5.000 | % | | 04/01/22 | | | 1,528,497 | | |
| | 500,000 | | | GATX Corp | | | 4.750 | % | | 06/15/22 | | | 539,222 | | |
| | 500,000 | | | Penske Truck Leasing Co Lp / PTL Finance Corp (e) | | | 4.875 | % | | 07/11/22 | | | 547,136 | | |
| | 1,000,000 | | | ADT Corp/The | | | 3.500 | % | | 07/15/22 | | | 910,000 | | |
| | 225,000 | | | Pentair Finance SA (a) | | | 3.150 | % | | 09/15/22 | | | 219,955 | | |
| | 2,000,000 | | | Dun & Bradstreet Corp/The | | | 4.375 | % | | 12/01/22 | | | 2,050,958 | | |
| | 1,000,000 | | | GATX Corp | | | 3.900 | % | | 03/30/23 | | | 1,016,573 | | |
| | 500,000 | | | ADT Corp/The | | | 4.125 | % | | 06/15/23 | | | 461,250 | | |
| | 500,000 | | | Ingersoll-Rand Global Holding Co Ltd (a) | | | 4.250 | % | | 06/15/23 | | | 526,001 | | |
| | 1,000,000 | | | Flowserve Corp | | | 4.000 | % | | 11/15/23 | | | 1,017,912 | | |
| | 1,626,000 | | | Air Lease Corp | | | 4.850 | % | | 02/01/24 | | | 1,626,000 | | |
| | 500,000 | | | Pitney Bowes Inc | | | 4.625 | % | | 03/15/24 | | | 517,175 | | |
| | 500,000 | | | Toro Co/The | | | 7.800 | % | | 06/15/27 | | | 633,591 | | |
| | 500,000 | | | General Electric Capital Corp | | | 3.500 | % | | 05/15/32 | | | 478,168 | | |
| | 1,375,000 | | | General Electric Capital Corp | | | 4.000 | % | | 09/17/32 | | | 1,346,185 | | |
| | 3,000,000 | | | Eaton Corp | | | 4.000 | % | | 11/02/32 | | | 3,001,911 | | |
| | 2,000,000 | | | General Electric Capital Corp | | | 4.000 | % | | 02/14/33 | | | 1,956,180 | | |
| | 1,000,000 | | | Pitney Bowes Inc | | | 5.250 | % | | 01/15/37 | | | 1,087,756 | | |
| | 590,000 | | | Eaton Corp | | | 4.150 | % | | 11/02/42 | | | 570,886 | | |
| | 500,000 | | | Lockheed Martin Corp | | | 4.070 | % | | 12/15/42 | | | 482,036 | | |
| | | | 23,264,637 | | |
| | | INFORMATION TECHNOLOGY 4.0% | |
| | 500,000 | | | Western Union Co/The | | | 5.930 | % | | 10/01/16 | | | 548,849 | | |
| | 500,000 | | | Broadridge Financial Solutions Inc | | | 6.125 | % | | 06/01/17 | | | 547,450 | | |
| | 500,000 | | | Dell Inc | | | 5.875 | % | | 06/15/19 | | | 533,750 | | |
| | 500,000 | | | Broadridge Financial Solutions Inc | | | 3.950 | % | | 09/01/20 | | | 523,386 | | |
| | 500,000 | | | Hewlett-Packard Co | | | 3.750 | % | | 12/01/20 | | | 522,624 | | |
| | 500,000 | | | Dell Inc | | | 4.625 | % | | 04/01/21 | | | 490,000 | | |
| | 750,000 | | | Hewlett-Packard Co | | | 4.300 | % | | 06/01/21 | | | 802,478 | | |
| | 500,000 | | | Motorola Solutions Inc | | | 3.750 | % | | 05/15/22 | | | 497,086 | | |
| | 2,000,000 | | | Symantec Corp | | | 3.950 | % | | 06/15/22 | | | 2,024,436 | | |
| | 1,000,000 | | | Computer Sciences Corp | | | 4.450 | % | | 09/15/22 | | | 1,048,540 | | |
| | 1,000,000 | | | Hewlett-Packard Co | | | 4.050 | % | | 09/15/22 | | | 1,039,883 | | |
| | 2,025,000 | | | Fiserv Inc | | | 3.500 | % | | 10/01/22 | | | 2,036,794 | | |
| | 1,000,000 | | | Autodesk Inc | | | 3.600 | % | | 12/15/22 | | | 991,638 | | |
19
Mairs & Power Balanced Fund
SCHEDULE OF INVESTMENTS (unaudited) (continued) June 30, 2014
Par Value | | Security Description | | Fair Value | |
| | | FIXED INCOME SECURITIES (continued) | |
| | | CORPORATE BONDS (continued) | |
| | | INFORMATION TECHNOLOGY (continued) | |
$ | 2,500,000 | | | Arrow Electronics Inc | | | 4.500 | % | | 03/01/23 | | $ | 2,612,870 | | |
| | 1,500,000 | | | Motorola Solutions Inc | | | 3.500 | % | | 03/01/23 | | | 1,451,265 | | |
| | 2,000,000 | | | Fidelity National Information Services Inc | | | 3.500 | % | | 04/15/23 | | | 1,967,798 | | |
| | 2,352,000 | | | Total System Services Inc | | | 3.750 | % | | 06/01/23 | | | 2,289,973 | | |
| | 1,000,000 | | | Altera Corp | | | 4.100 | % | | 11/15/23 | | | 1,034,108 | | |
| | 4,000,000 | | | Intel Corp | | | 4.000 | % | | 12/15/32 | | | 3,992,308 | | |
| | 1,500,000 | | | Western Union Co/The | | | 6.200 | % | | 11/17/36 | | | 1,555,428 | | |
| | | | 26,510,664 | | |
| | | MATERIALS 3.1% | |
| | 500,000 | | | International Paper Co | | | 5.250 | % | | 04/01/16 | | | 534,409 | | |
| | 500,000 | | | Valspar Corp/The | | | 6.050 | % | | 05/01/17 | | | 557,413 | | |
| | 500,000 | | | Cliffs Natural Resources Inc | | | 3.950 | % | | 01/15/18 | | | 506,664 | | |
| | 350,000 | | | PPG Industries Inc | | | 7.400 | % | | 08/15/19 | | | 427,030 | | |
| | 500,000 | | | Cliffs Natural Resources Inc | | | 4.800 | % | | 10/01/20 | | | 489,283 | | |
| | 1,000,000 | | | Cliffs Natural Resources Inc | | | 4.875 | % | | 04/01/21 | | | 986,321 | | |
| | 500,000 | | | Carpenter Technology Corp | | | 5.200 | % | | 07/15/21 | | | 537,938 | | |
| | 175,000 | | | Mosaic Co/The | | | 3.750 | % | | 11/15/21 | | | 182,014 | | |
| | 1,000,000 | | | Freeport-McMoRan Copper & Gold Inc | | | 3.550 | % | | 03/01/22 | | | 990,300 | | |
| | 1,500,000 | | | Newmont Mining Corp | | | 3.500 | % | | 03/15/22 | | | 1,446,213 | | |
| | 500,000 | | | Barrick Gold Corp (a) | | | 3.850 | % | | 04/01/22 | | | 497,460 | | |
| | 1,000,000 | | | Domtar Corp | | | 4.400 | % | | 04/01/22 | | | 1,029,521 | | |
| | 2,000,000 | | | RPM International Inc | | | 3.450 | % | | 11/15/22 | | | 1,945,128 | | |
| | 500,000 | | | Carpenter Technology Corp | | | 4.450 | % | | 03/01/23 | | | 514,275 | | |
| | 500,000 | | | Freeport-McMoRan Copper & Gold Inc | | | 3.875 | % | | 03/15/23 | | | 498,478 | | |
| | 1,000,000 | | | Reliance Steel & Aluminum Co | | | 4.500 | % | | 04/15/23 | | | 1,020,161 | | |
| | 1,750,000 | | | Barrick Gold Corp (a) | | | 4.100 | % | | 05/01/23 | | | 1,742,736 | | |
| | 2,000,000 | | | Nucor Corp | | | 4.000 | % | | 08/01/23 | | | 2,072,166 | | |
| | 1,000,000 | | | Mosaic Co/The | | | 4.250 | % | | 11/15/23 | | | 1,055,657 | | |
| | 865,000 | | | Union Carbide Corp | | | 7.500 | % | | 06/01/25 | | | 1,100,875 | | |
| | 1,000,000 | | | Alcoa Inc | | | 5.950 | % | | 02/01/37 | | | 1,013,051 | | |
| | 1,000,000 | | | Newmont Mining Corp | | | 4.875 | % | | 03/15/42 | | | 901,121 | | |
| | | | 20,048,214 | | |
| | | TELECOMMUNICATION SERVICES 0.3% | |
| | 250,000 | | | Verizon Communications Inc | | | 6.350 | % | | 04/01/19 | | | 295,652 | | |
| | 500,000 | | | CenturyLink Inc | | | 6.150 | % | | 09/15/19 | | | 545,000 | | |
| | 500,000 | | | Qwest Capital Funding Inc | | | 6.875 | % | | 07/15/28 | | | 511,250 | | |
| | 550,000 | | | Qwest Corp | | | 6.875 | % | | 09/15/33 | | | 553,291 | | |
| | | | 1,905,193 | | |
20
Mairs & Power Balanced Fund
SCHEDULE OF INVESTMENTS (unaudited) (continued) June 30, 2014
Par Value | | Security Description | | Fair Value | |
| | | FIXED INCOME SECURITIES (continued) | |
| | | CORPORATE BONDS (continued) | |
| | | UTILITIES 1.2% | |
$ | 500,000 | | | Commonwealth Edison Co | | | 6.150 | % | | 09/15/17 | | $ | 574,543 | | |
| | 250,000 | | | Vectren Utility Holdings Inc | | | 5.750 | % | | 08/01/18 | | | 278,658 | | |
| | 250,000 | | | South Jersey Gas Co | | | 7.125 | % | | 10/22/18 | | | 290,915 | | |
| | 250,000 | | | United Utilities PLC (a) | | | 5.375 | % | | 02/01/19 | | | 273,774 | | |
| | 2,000,000 | | | PPL Energy Supply LLC | | | 4.600 | % | | 12/15/21 | | | 1,991,726 | | |
| | 2,170,000 | | | ONEOK Inc | | | 4.250 | % | | 02/01/22 | | | 2,170,493 | | |
| | 785,000 | | | SCANA Corp | | | 4.125 | % | | 02/01/22 | | | 820,798 | | |
| | 1,000,000 | | | Exelon Generation Co LLC | | | 4.250 | % | | 06/15/22 | | | 1,044,153 | | |
| | 500,000 | | | Entergy Gulf States Inc | | | 6.180 | % | | 03/01/35 | | | 500,105 | | |
| | | | 7,945,165 | | |
| | | TOTAL CORPORATE BONDS | | | 191,840,782 | | |
| | | ASSET BACKED SECURITIES 1.5% | |
| | 31,719 | | | General American Transportation Corp 1996-1
Pass-Through Trust | | | 7.500 | % | | 02/28/15 | | | 32,433 | | |
| | 450,000 | | | American Airlines Inc (e) | | | 7.500 | % | | 03/15/16 | | | 467,438 | | |
| | 500,000 | | | Delta Air Lines 2010-2 Class B Pass Through Trust (e) | | | 6.750 | % | | 05/23/17 | | | 526,250 | | |
| | 387,488 | | | Continental Airlines 2009-1 Pass Through Trust | | | 9.000 | % | | 01/08/18 | | | 437,862 | | |
| | 389,554 | | | American Airlines 2011-1 Class B Pass Through Trust (e) | | | 7.000 | % | | 07/31/19 | | | 424,614 | | |
| | 192,448 | | | Continental Airlines 1999-1 Class B Pass Through Trust | | | 6.795 | % | | 02/02/20 | | | 205,077 | | |
| | 672,447 | | | Continental Airlines 2010-1 Class B Pass Through Trust | | | 6.000 | % | | 07/12/20 | | | 702,707 | | |
| | 360,888 | | | Delta Air Lines 2011-1 Class A Pass Through Trust | | | 5.300 | % | | 10/15/20 | | | 393,368 | | |
| | 730,688 | | | America West Airlines 2000-1 Pass Through Trust | | | 8.057 | % | | 01/02/22 | | | 823,850 | | |
| | 812,141 | | | American Airlines 2011-1 Class A Pass Through Trust | | | 5.250 | % | | 07/31/22 | | | 888,319 | | |
| | 198,046 | | | Continental Airlines 2007-1 Class A Pass Through Trust | | | 5.983 | % | | 10/19/23 | | | 222,307 | | |
| | 375,893 | | | Southwest Airlines Co 2007-1 Pass Through Trust | | | 6.150 | % | | 02/01/24 | | | 433,686 | | |
| | 822,451 | | | US Airways 2010-1 Class A Pass Through Trust | | | 6.250 | % | | 10/22/24 | | | 937,594 | | |
| | 423,163 | | | US Airways 2011-1 Class A Pass Through Trust | | | 7.125 | % | | 04/22/25 | | | 495,101 | | |
| | 597,558 | | | Continental Airlines 2012-2 Class A Pass Through Trust | | | 4.000 | % | | 04/29/26 | | | 611,779 | | |
| | 1,000,000 | | | United Airlines 2013-1 Class A Pass Through Trust | | | 4.300 | % | | 02/15/27 | | | 1,043,800 | | |
| | 1,000,000 | | | US Airways 2013-1 Class A Pass Through Trust | | | 3.950 | % | | 05/15/27 | | | 1,020,000 | | |
| | | | 9,666,185 | | |
| | | PREFERRED SECURITIES 1.0% | |
| | 105,000 | | | Affiliated Managers Group Inc | | | 5.250 | % | | 10/15/22 | | | 2,761,500 | | |
| | 20,000 | | | Pitney Bowes Inc | | | 5.250 | % | | 11/27/22 | | | 520,400 | | |
| | 23,000 | | | Stifel Financial Corp | | | 5.375 | % | | 12/31/22 | | | 593,170 | | |
21
Mairs & Power Balanced Fund
SCHEDULE OF INVESTMENTS (unaudited) (continued) June 30, 2014
Par Value/Shares | | Security Description | | Fair Value | |
| | | FIXED INCOME SECURITIES (continued) | |
| | | PREFERRED SECURITIES (continued) | |
$ | 10,000 | | | Raymond James Financial Inc | | | 6.900 | % | | 03/15/42 | | $ | 269,600 | | |
| | 20,000 | | | Protective Life Corp | | | 6.000 | % | | 09/01/42 | | | 500,400 | | |
| | 20,000 | | | Selective Insurance Group Inc | | | 5.875 | % | | 02/09/43 | | | 472,200 | | |
| | 40,000 | | | WR Berkley Corp | | | 5.625 | % | | 04/30/53 | | | 930,000 | | |
| | 20,000 | | | Verizon Communications Inc | | | 5.900 | % | | 02/15/54 | | | 515,200 | | |
| | 10,000 | | | NextEra Energy Capital Holdings Inc | | | 5.700 | % | | 03/01/72 | | | 242,100 | | |
| | | | 6,804,570 | | |
| | TOTAL FIXED INCOME SECURITIES
(cost $229,418,738) | | $ | 236,634,278 | | |
| | | COMMON STOCKS 60.5% | |
| | | CONSUMER DISCRETIONARY 3.3% | |
| | 13,000 | | | Genuine Parts Co | | | | | | | 1,141,400 | | |
| | 74,000 | | | Home Depot Inc/The | | | | | | | 5,991,040 | | |
| | 12,500 | | | Murphy USA Inc (b) | | | | | | | 611,125 | | |
| | 13,000 | | | Sturm Ruger & Co Inc | | | | | | | 767,130 | | |
| | 227,500 | | | Target Corp | | | | | | | 13,183,625 | | |
| | | | 21,694,320 | | |
| | | CONSUMER STAPLES 2.8% | |
| | 88,000 | | | General Mills Inc | | | | | | | 4,623,520 | | |
| | 54,000 | | | Hershey Co/The | | | | | | | 5,257,980 | | |
| | 120,000 | | | Hormel Foods Corp | | | | | | | 5,922,000 | | |
| | 26,000 | | | Kimberly-Clark Corp | | | | | | | 2,891,720 | | |
| | | | 18,695,220 | | |
| | | ENERGY 8.2% | |
| | 63,000 | | | BP PLC ADR (f) | | | | | | | 3,323,250 | | |
| | 154,000 | | | ConocoPhillips | | | | | | | 13,202,420 | | |
| | 157,000 | | | Exxon Mobil Corp | | | | | | | 15,806,760 | | |
| | 50,000 | | | Murphy Oil Corp | | | | | | | 3,324,000 | | |
| | 156,000 | | | Schlumberger Ltd (a) | | | | | | | 18,400,200 | | |
| | | | 54,056,630 | | |
| | | FINANCIALS 9.1% | |
| | 26,000 | | | American Express Co | | | | | | | 2,466,620 | | |
| | 404,000 | | | Associated Banc-Corp | | | | | | | 7,304,320 | | |
| | 59,000 | | | Bank of America Corp | | | | | | | 906,830 | | |
| | 136,000 | | | JPMorgan Chase & Co | | | | | | | 7,836,320 | | |
| | 20,000 | | | Lincoln National Corp | | | | | | | 1,028,800 | | |
22
Mairs & Power Balanced Fund
SCHEDULE OF INVESTMENTS (unaudited) (continued) June 30, 2014
Shares | | Security Description | | Fair Value | |
| | | COMMON STOCKS (continued) | |
| | | FINANCIALS (continued) | |
| | 239,000 | | | Principal Financial Group Inc | | | | | | $ | 12,064,720 | | |
| | 118,000 | | | TCF Financial Corp | | | | | | | 1,931,660 | | |
| | 35,000 | | | Travelers Cos Inc/The | | | | | | | 3,292,450 | | |
| | 343,000 | | | US Bancorp | | | | | | | 14,858,760 | | |
| | 156,000 | | | Wells Fargo & Co | | | | | | | 8,199,360 | | |
| | | | 59,889,840 | | |
| | | HEALTH CARE 9.0% | |
| | 148,500 | | | Abbott Laboratories | | | | | | | 6,073,650 | | |
| | 84,000 | | | AbbVie Inc | | | | | | | 4,740,960 | | |
| | 131,000 | | | Baxter International Inc | | | | | | | 9,471,300 | | |
| | 72,500 | | | Bristol-Myers Squibb Co | | | | | | | 3,516,975 | | |
| | 74,000 | | | Eli Lilly & Co | | | | | | | 4,600,580 | | |
| | 94,000 | | | Johnson & Johnson | | | | | | | 9,834,280 | | |
| | 252,500 | | | Medtronic Inc | | | | | | | 16,099,400 | | |
| | 165,000 | | | Pfizer Inc | | | | | | | 4,897,200 | | |
| | | | 59,234,345 | | |
| | | INDUSTRIALS 16.1% | |
| | 86,000 | | | 3M Co | | | | | | | 12,318,640 | | |
| | 7,666 | | | Allegion PLC (a) | | | | | | | 434,509 | | |
| | 115,000 | | | CH Robinson Worldwide Inc | | | | | | | 7,335,850 | | |
| | 251,000 | | | Deluxe Corp | | | | | | | 14,703,580 | | |
| | 243,000 | | | Emerson Electric Co | | | | | | | 16,125,480 | | |
| | 420,000 | | | General Electric Co | | | | | | | 11,037,600 | | |
| | 80,000 | | | Graco Inc | | | | | | | 6,246,400 | | |
| | 90,000 | | | Honeywell International Inc | | | | | | | 8,365,500 | | |
| | 23,000 | | | Ingersoll-Rand PLC (a) | | | | | | | 1,437,730 | | |
| | 108,000 | | | Pentair PLC (a) | | | | | | | 7,788,960 | | |
| | 40,000 | | | Toro Co/The | | | | | | | 2,544,000 | | |
| | 174,100 | | | United Parcel Service Inc, Class B | | | | | | | 17,873,106 | | |
| | | | 106,211,355 | | |
| | | INFORMATION TECHNOLOGY 5.4% | |
| | 420,000 | | | Corning Inc | | | | | | | 9,219,000 | | |
| | 54,000 | | | International Business Machines Corp | | | | | | | 9,788,580 | | |
| | 94,000 | | | MTS Systems Corp | | | | | | | 6,369,440 | | |
| | 601,000 | | | Western Union Co/The | | | | | | | 10,421,340 | | |
| | | | 35,798,360 | | |
23
Mairs & Power Balanced Fund
SCHEDULE OF INVESTMENTS (unaudited) (continued) June 30, 2014
Shares | | Security Description | | Fair Value | |
| | | COMMON STOCKS (continued) | |
| | | MATERIALS 4.4% | |
| | 118,000 | | | Bemis Co Inc | | | | | | $ | 4,797,880 | | |
| | 67,000 | | | Ecolab Inc | | | | | | | 7,459,780 | | |
| | 156,000 | | | HB Fuller Co | | | | | | | 7,503,600 | | |
| | 124,000 | | | Valspar Corp/The | | | | | | | 9,447,560 | | |
| | | | 29,208,820 | | |
| | | UTILITIES 2.2% | |
| | 57,000 | | | ALLETE Inc | | | | | | | 2,926,950 | | |
| | 166,000 | | | MDU Resources Group Inc | | | | | | | 5,826,600 | | |
| | 173,000 | | | Xcel Energy Inc | | | | | | | 5,575,790 | | |
| | | | 14,329,340 | | |
| | | TOTAL COMMON STOCKS
(cost $247,588,251) | | $ | 399,118,230
| | |
| | | PREFERRED STOCKS 0.1% | |
| | | UTILITIES 0.1% | |
| | 10,000 | | | SCE Trust I | | | | | | | | | 237,000 | | |
| | TOTAL PREFERRED STOCKS
(cost $250,000) | | $ | 237,000 | | |
| | | SHORT-TERM INVESTMENTS 3.4% | |
| 22,513,689
| | | First American Prime Obligations Fund, Class Z, 0.02% (c)
(cost $22,513,689) | |
| | | | | | $ | 22,513,689
| | |
| | | TOTAL INVESTMENTS 99.9%
(cost $499,770,678) | |
| |
| | $ | 658,503,197
| | |
| | | OTHER ASSETS AND LIABILITIES (NET) 0.1% | | | | | | | | | | | 800,247 | | |
| | | TOTAL NET ASSETS 100.0% | | | | | | | | | | $ | 659,303,444 | | |
(a) Foreign security denominated in U.S. dollars. As of June 30, 2014, these securities represented $40,580,531 or 6.2% of total net assets.
(b) Non-income producing.
(c) The rate quoted is the annualized seven-day effective yield as of June 30, 2014.
(d) Step Bonds – Securities for which the coupon rate of interest will adjust on specified future date(s). The rate disclosed represents the coupon rate in effect as of June 30, 2014.
(e) Securities exempt from registration under Rule 144A of the Securities Act of 1933. These securities may be resold in transactions exempt from registration, normally to qualified institutional buyers. These securities have been determined to be liquid under guidelines established by the Fund's Board of Trustees. As of June 30, 2014, these securities represented $15,733,481 or 2.4% of total net assets.
(f) American Depositary Receipt.
The Global Industry Classification Standard (GICS®) was developed by and/or is the exclusive property of MSCI, Inc. and Standard & Poor's Financial Services LLC ("S&P"). GICS is a service mark of MSCI and S&P and has been licensed for use by Mairs and Power, Inc.
See accompanying Notes to Financial Statements.
24
MAIRS & POWER SMALL CAP FUND (unaudited)
To Our Shareholders: June 30, 2014
The Mairs & Power Small Cap Fund turned in a solid performance for the first half of the year returning 5.61% compared to 3.22% for its benchmark, the S&P SmallCap 600 Index. For the same period, the Lipper Small Cap Core Funds Index, its peer group, returned 3.83%. Additionally, for the quarter, the Fund gained 2.30%, outperforming its benchmark at 2.07% and slightly lagging the Lipper peer group at 2.57%.
It's encouraging to see the Fund continue to make up lost ground on the index after last year's modest underperformance, and continue to perform well relative to its peers. By design, sector allocation had little impact on relative performance. In keeping with Mairs & Power's approach, it was individual stock selection that once again drove outperformance in the first half. The portfolio benefited as oil prices moved up sharply and our comparative overweight to that sector contributed to relative performance. Additionally, an underweight in the consumer discretionary sector helped performance, as the sector is actually down so far this year. Conversely, while we believe in the long-term potential in many industrial companies, they detracted slightly from relative performance as that sector overall increased only slightly for the year.
MAIRS & POWER SMALL CAP FUND
Top Performers
Second Quarter (3/31/14 – 6/30/14) | | Year To Date (12/31/13 – 6/30/14) | |
VASCO DATA SECURITY INT'L, INC. | | | 53.85 | % | | GENTHERM, INC. | | | 65.80 | % | |
OASIS PETROLEUM, INC. | | | 33.93 | % | | VASCO DATA SECURITY INT'L, INC. | | | 50.06 | % | |
GENTHERM, INC. | | | 28.02 | % | | THE MANITOWOC COMPANY, INC. | | | 40.91 | % | |
HUB GROUP, INC. | | | 26.03 | % | | KODIAK OIL & GAS CORP. | | | 29.79 | % | |
DELUXE CORP. | | | 11.64 | % | | HUB GROUP, INC. | | | 26.38 | % | |
Weak Performers
Second Quarter (3/31/14 – 6/30/14) | | Year To Date (12/31/13 – 6/30/14) | |
CRAY INC. | | | -28.72 | % | | LANDAUER, INC. | | | -20.17 | % | |
GENERAC HLDGS | | | -17.35 | % | | BANK MUTUAL CORPORATION | | | -17.26 | % | |
VASCULAR SOLUTIONS, INC. | | | -15.27 | % | | G&K SERVICES, INC. | | | -16.33 | % | |
G&K SERVICES, INC. | | | -14.88 | % | | CHART INDUSTRIES, INC. | | | -13.49 | % | |
BADGER METER, INC. | | | -4.45 | % | | NVE CORPORATION | | | -4.62 | % | |
Past performance is no guarantee of future results.
Small cap stocks lagged behind larger cap stocks in the first half of 2014. This underperformance brought small cap valuations down a bit relative to large cap stocks. However, there continues to be more of a premium for small companies than historically has been the case. We believe this is justified based on the underlying revenue and earnings growth prospects for smaller companies.
Gentherm, a manufacturer of automobile seat heating and cooling equipment, contributed the most to outperformance for the six-month and second-quarter periods, through June 30, returning 65.80% and 28.02%, respectively. Gentherm continues to benefit from increased inclusion of its products on Original Equipment Manufacturer (OEM) auto platforms as well as from other applications of its proprietary technology (consider how welcome heated seats would have been during Minnesota's brush with the Polar Vortex last winter). The password authentication hardware and software firm Vasco Data Security also contributed heavily to performance for both the six-month and second-quarter periods, returning 50.06% and 53.85%, respectively. Having an already strong European consumer banking presence, Vasco has now started to make inroads into the U.S. market. Every day, new headlines trumpeting widespread data vulnerabilities help to drive up greater demand for this firm's products.
25
MAIRS & POWER SMALL CAP FUND (unaudited) (continued)
In contrast, the radiation detection firm Landauer proved to be the biggest laggard in the first half of the year. However, a number of recent regulatory changes that address shortfalls in U.S. hospital radiation monitoring appear likely to provide the company with an opportunity to turn their stock performance around.
Portfolio additions during the second quarter included United Fire Group, a company based in Cedar Rapids, Iowa that writes property and casualty insurance, life insurance, and offers annuities. With a strong history of conservative underwriting, this steady performer grew its Return on Equity (ROE) 10% last year, while its stock traded at a discount to book value – considered a rare event at current valuations. Another aspect we like about this company is that its management goes out of its way to tell potential investors that, while they must report their results quarterly, they manage their company for the much longer term; music to our ears.
Andrew R. Adams
Lead Manager
The Fund's investment objective, risks, charges and expenses must be considered carefully before investing. The summary prospectus or full prospectus contains this and other important information about the Fund, and they may be obtained by calling Shareholder Services at (800) 304-7404 or visiting www.mairsandpower.com. Read the summary prospectus or full prospectus carefully before investing.
All investments have risks. The Small Cap Fund is designed for long-term investors. Equity investments are subject to market fluctuations, and the Fund's share price can fall because of weakness in the broad market, a particular industry, or specific holdings. Investments in small and midcap companies generally are more volatile. International investing risks include among others political, social or economic instability, difficulty in predicting international trade patterns, taxation and foreign trading practices, and greater fluctuations in price than United States corporations. The Fund may invest in initial public offerings by small cap companies, which can involve greater risk than investments in companies that are already publicly traded.
Return on Equity (ROE) is the amount of net income returned as a percentage of shareholders equity. Return on equity measures a corporation's profitability by revealing how much profit a company generates with the money shareholders have invested.
Lipper Small Cap Core Funds Index is an unmanaged index considered representative of small-cap core funds tracked by Lipper. It is not possible to invest directly in an index.
The S&P SmallCap 600 Index is an index of small company stocks managed by Standard & Poor's that covers a broad range of small cap stocks in the United States. The index is weighted according to the market capitalization and covers about 3-4% of the total market for equities in the United States. It is not possible to invest directly in an index.
26
Mairs & Power Small Cap Fund
PERFORMANCE INFORMATION (unaudited) June 30, 2014
Investment performance since commencement of operations (through June 30, 2014)
This chart illustrates the performance of a hypothetical $10,000 investment made in the Fund since commencement of operations.
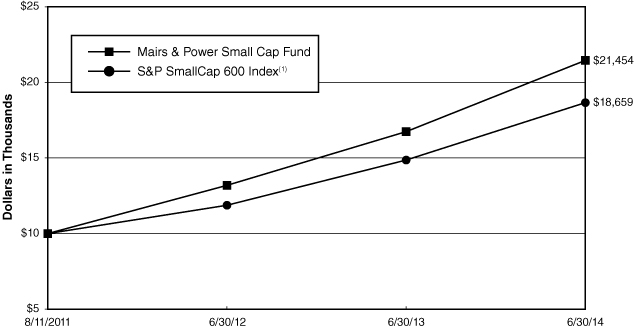
Average annual total returns for periods ended June 30, 2014
| | | 3 Month(2) | | 6 Month(2) | | 1 Year | | Since Inception(3) | |
Mairs & Power Small Cap Fund | | | 2.30 | % | | | 5.61 | % | | | 28.15 | % | | | 30.26 | % | |
S&P SmallCap 600 Index(1) | | | 2.07 | % | | | 3.22 | % | | | 25.54 | % | | | 24.11 | % | |
Performance data quoted represents past performance and does not guarantee future results. All performance information shown includes the reinvestment of dividend and capital gain distributions, but does not reflect the deduction of taxes that a shareholder would pay on Fund distributions or the redemption of Fund shares. The investment return and principal value of an investment will fluctuate so that an investor's shares, when redeemed, may be worth more or less than their original cost. Current performance of the Fund may be lower or higher than the performance quoted. For the most recent month-end performance figures, visit the Fund's website at www.mairsandpower.com or call Shareholder Services at (800) 304-7404.
(1) The S&P SmallCap 600 Index is an index of small company stocks managed by Standard & Poor's that covers a broad range of small cap stocks in the United States. The index is weighted according to market capitalization and covers about 3-4% of the total market for equities in the United States. It is not possible to invest directly in an index.
(2) Periods less than one year are not annualized.
(3) Since inception performance is as of August 11, 2011, which is the offering date of the Small Cap Fund.
27
Mairs & Power Small Cap Fund
FUND INFORMATION (unaudited) June 30, 2014
Portfolio Managers
Andrew R. Adams, lead manager since 2011
University of Wisconsin-Madison, BBA Finance
and Mathematics 1994, MS Finance 1997
General Information
Fund Symbol | | MSCFX | |
Net Asset Value (NAV) Per Share | | $ | 20.89 | | |
Expense Ratio | | | 1.08 | %1 | |
Portfolio Turnover Rate | | | 6.47 | % | |
Sales Charge | | | None2 | | |
Fund Inception Year | | | 2011 | | |
Portfolio Composition

Top Ten Portfolio Holdings
(Percent of Total Net Assets) 3
Badger Meter Inc | | | 3.5 | % | |
Deluxe Corp | | | 3.4 | | |
Cray Inc | | | 3.3 | | |
Apogee Enterprises Inc | | | 3.3 | | |
MDU Resources Group Inc | | | 3.2 | | |
Techne Corp | | | 3.1 | | |
PrivateBancorp Inc | | | 3.1 | | |
Wintrust Financial Corp | | | 3.0 | | |
Gentherm Inc | | | 2.9 | | |
Bemis Co Inc | | | 2.9 | | |
Portfolio Diversification
(Percent of Total Net Assets)
Common Stocks 98.3% | |
Industrials | | | 29.1 | % | |
Information Technology | | | 17.5 | | |
Financials | | | 16.4 | | |
Health Care | | | 8.4 | | |
Materials | | | 7.5 | | |
Consumer Discretionary | | | 6.8 | | |
Utilities | | | 5.8 | | |
Energy | | | 4.9 | | |
Consumer Staples | | | 1.9 | | |
Short-term Investments 1.7%4 | | | 1.7 | | |
| | | | 100.0 | % | |
1 Ratio has been annualized for the six month period ended June 30, 2014.
2 Although the Fund is no-load, investment management fees and other expenses still apply.
3 All holdings in the portfolio are subject to change without notice and may or may not represent current or future portfolio composition. The mention of specific securities is not intended as a recommendation or offer for a particular security, nor is it intended to be a solicitation for the purchase or sale of any security.
4 Represents short-term investments and other assets and liabilities (net).
The Global Industry Classification Standard (GICS®) was developed by and/or is the exclusive property of MSCI, Inc. and Standard & Poor's Financial Services LLC ("S&P"). GICS is a service mark of MSCI and S&P and has been licensed for use by Mairs and Power, Inc.
28
Mairs & Power Small Cap Fund
SCHEDULE OF INVESTMENTS (unaudited) June 30, 2014
Shares | | Security Description | | Fair Value | |
| | | COMMON STOCKS 98.3% | |
| | | CONSUMER DISCRETIONARY 6.8% | |
| | 20,900 | | | Buffalo Wild Wings Inc (b) | | $ | 3,463,339 | | |
| | 32,100 | | | Cabela's Inc (b) | | | 2,003,040 | | |
| | 92,885 | | | Gentherm Inc (b) | | | 4,128,738 | | |
| | | | 9,595,117 | | |
| | | CONSUMER STAPLES 1.9% | |
| | 38,900 | | | Casey's General Stores Inc | | | 2,734,281 | | |
| | | ENERGY 4.9% | |
| | 147,400 | | | Kodiak Oil & Gas Corp (a) (b) | | | 2,144,670 | | |
| | 164,400 | | | Northern Oil and Gas Inc (b) | | | 2,678,076 | | |
| | 37,500 | | | Oasis Petroleum Inc (b) | | | 2,095,875 | | |
| | | | 6,918,621 | | |
| | | FINANCIALS 16.4% | |
| | 132,200 | | | Agree Realty Corp | | | 3,996,406 | | |
| | 222,600 | | | Associated Banc-Corp | | | 4,024,608 | | |
| | 296,313 | | | Bank Mutual Corp | | | 1,718,615 | | |
| | 148,300 | | | PrivateBancorp Inc | | | 4,309,598 | | |
| | 124,400 | | | TCF Financial Corp | | | 2,036,428 | | |
| | 55,464 | | | United Fire Group Inc | | | 1,626,205 | | |
| | 17,900 | | | Waddell & Reed Financial Inc, Class A | | | 1,120,361 | | |
| | 91,100 | | | Wintrust Financial Corp | | | 4,190,600 | | |
| | | | 23,022,821 | | |
| | | HEALTH CARE 8.4% | |
| | 46,200 | | | Landauer Inc | | | 1,940,400 | | |
| | 45,300 | | | Patterson Cos Inc | | | 1,789,803 | | |
| | 47,200 | | | Techne Corp | | | 4,369,304 | | |
| | 164,121 | | | Vascular Solutions Inc (b) | | | 3,641,845 | | |
| | | | 11,741,352 | | |
| | | INDUSTRIALS 29.1% | |
| | 131,100 | | | Apogee Enterprises Inc | | | 4,570,146 | | |
| | 37,800 | | | Chart Industries Inc (b) | | | 3,127,572 | | |
| | 81,200 | | | Deluxe Corp | | | 4,756,696 | | |
| | 66,839 | | | G&K Services Inc, Class A | | | 3,480,307 | | |
| | 72,900 | | | Generac Holdings Inc (b) | | | 3,553,146 | | |
| | 34,700 | | | Graco Inc | | | 2,709,376 | | |
| | 65,500 | | | Hub Group Inc, Class A (b) | | | 3,301,200 | | |
| | 106,500 | | | Manitowoc Co Inc/The | | | 3,499,590 | | |
| | 64,500 | | | Oshkosh Corp | | | 3,581,685 | | |
| | 37,300 | | | Proto Labs Inc (b) | | | 3,055,616 | | |
| | 24,000 | | | Snap-on Inc | | | 2,844,480 | | |
| | 37,600 | | | Toro Co/The | | | 2,391,360 | | |
| | | | 40,871,174 | | |
29
Mairs & Power Small Cap Fund
SCHEDULE OF INVESTMENTS (unaudited) (continued) June 30, 2014
Shares | | Security Description | | Fair Value | |
| | | COMMON STOCKS (continued) | |
| | | INFORMATION TECHNOLOGY 17.5% | |
| | 65,100 | | | Advent Software Inc | | $ | 2,120,307 | | |
| | 93,300 | | | Badger Meter Inc | | | 4,912,245 | | |
| | 174,300 | | | Cray Inc (b) | | | 4,636,380 | | |
| | 150,374 | | | MOCON Inc (d) | | | 2,377,413 | | |
| | 47,200 | | | MTS Systems Corp | | | 3,198,272 | | |
| | 58,434 | | | NVE Corp (b) | | | 3,248,346 | | |
| | 33,900 | | | SPS Commerce Inc (b) | | | 2,142,141 | | |
| | 169,116 | | | VASCO Data Security International Inc (b) | | | 1,961,745 | | |
| | | | 24,596,849 | | |
| | | MATERIALS 7.5% | |
| | 100,400 | | | Bemis Co Inc | | | 4,082,264 | | |
| | 89,100 | | | Hawkins Inc | | | 3,309,174 | | |
| | 41,600 | | | Valspar Corp/The | | | 3,169,504 | | |
| | | | 10,560,942 | | |
| | | UTILITIES 5.8% | |
| | 72,500 | | | ALLETE Inc | | | 3,722,875 | | |
| | 126,600 | | | MDU Resources Group Inc | | | 4,443,660 | | |
| | | | 8,166,535 | | |
| | | | | TOTAL COMMON STOCKS
(cost $108,059,867) | | $ | 138,207,692
| | |
| | | SHORT-TERM INVESTMENTS 1.9% | |
| 2,647,337
| | | First American Prime Obligations Fund, Class Z, 0.02% (c)
(cost $2,647,337) | | $ | 2,647,337
| | |
| | | | | TOTAL INVESTMENTS 100.2%
(cost $110,707,204) | | $ | 140,855,029
| | |
| | | | | OTHER ASSETS AND LIABILITIES (NET) (0.2)% | | | (332,125 | ) | |
| | | | | TOTAL NET ASSETS 100.0% | | $ | 140,522,904 | | |
(a) Foreign security denominated in U.S. dollars. As of June 30, 2014, these securities represented $2,144,670 or 1.5% of total net assets.
(b) Non-income producing.
(c) The rate quoted is the annualized seven-day effective yield as of June 30, 2014.
(d) Illiquid security.
The Global Industry Classification Standard (GICS®) was developed by and/or is the exclusive property of MSCI, Inc. and Standard & Poor's Financial Services LLC ("S&P"). GICS is a service mark of MSCI and S&P and has been licensed for use by Mairs and Power, Inc.
See accompanying Notes to Financial Statements.
30
STATEMENTS OF ASSETS AND LIABILITIES (unaudited) June 30, 2014
| | | Mairs & Power
Growth Fund | | Mairs & Power
Balanced Fund | | Mairs & Power
Small Cap Fund | |
ASSETS | |
| Investments, at fair value (Note 1): | |
Unaffiliated securities * | | $ | 4,110,878,129 | | | $ | 658,503,197 | | | $ | 140,855,029 | | |
| Affiliated securities (Note 5) * | | | 149,632,366 | | | | - | | | | - | | |
| | | | 4,260,510,495 | | | | 658,503,197 | | | | 140,855,029 | | |
Cash | | | - | | | | 6,363 | | | | - | | |
Receivable for Fund shares sold | | | 3,226,769 | | | | 914,627 | | | | 55,952 | | |
Receivable for securities sold | | | 1,483,753 | | | | - | | | | - | | |
Dividends and interest receivable | | | 4,855,281 | | | | 2,961,098 | | | | 120,749 | | |
Prepaid expenses and other assets | | | 102,039 | | | | 39,390 | | | | 30,807 | | |
| | | 4,270,178,337 | | | | 662,424,675 | | | | 141,062,537 | | |
LIABILITIES | |
Payable for Fund shares redeemed | | | 2,012,766 | | | | 364,043 | | | | 67,842 | | |
Payable for securities purchased | | | 6,348,701 | | | | 2,282,627 | | | | 321,161 | | |
| Accrued investment management fees (Note 2) | | | 1,939,935 | | | | 319,183 | | | | 100,624 | | |
| Accrued Fund administration fees (Note 2) | | | 158,740 | | | | 24,298 | | | | 3,832 | | |
Accrued audit expense | | | 15,343 | | | | 22,394 | | | | 11,058 | | |
Accrued transfer agent fees | | | 267,965 | | | | 47,965 | | | | 13,556 | | |
Accrued expenses and other liabilities | | | 223,313 | | | | 60,721 | | | | 21,560 | | |
| | | 10,966,763 | | | | 3,121,231 | | | | 539,633 | | |
NET ASSETS | | $ | 4,259,211,574 | | | $ | 659,303,444 | | | $ | 140,522,904 | | |
NET ASSETS CONSIST OF | |
Portfolio capital | | $ | 2,241,891,178 | | | $ | 500,350,317 | | | $ | 107,570,132 | | |
Undistributed net investment income (loss) | | | (170,108 | ) | | | 190,354 | | | | 445,308 | | |
Undistributed net realized gain (loss) on
investments | | | 27,465,890 | | | | 30,254 | | | | 2,359,639 | | |
Net unrealized appreciation on investments | | | 1,990,024,614 | | | | 158,732,519 | | | | 30,147,825 | | |
TOTAL NET ASSETS | | $ | 4,259,211,574 | | | $ | 659,303,444 | | | $ | 140,522,904 | | |
Fund shares, par value | | $ | 0.01 | | | $ | 0.01 | | | $ | 0.01 | | |
Authorized | | | unlimited | | | | unlimited | | | | unlimited | | |
Fund shares issued and outstanding | | | 37,056,505 | | | | 7,648,880 | | | | 6,726,961 | | |
Net asset value per share | | $ | 114.94 | | | $ | 86.20 | | | $ | 20.89 | | |
* Cost of investments | |
Cost of unaffiliated securities | | $ | 2,189,383,210 | | | $ | 499,770,678 | | | $ | 110,707,204 | | |
| Cost of affiliated securities (Note 5) | | | 81,102,671 | | | | - | | | | - | | |
| | | $ | 2,270,485,881 | | | $ | 499,770,678 | | | $ | 110,707,204 | | |
See accompanying Notes to Financial Statements.
31
STATEMENTS OF OPERATIONS (unaudited) Six Months Ended June 30, 2014
| | | Mairs & Power
Growth Fund | | Mairs & Power
Balanced Fund | | Mairs & Power
Small Cap Fund | |
INVESTMENT INCOME | |
Income: | |
Dividends from unaffiliated securities * | | $ | 40,288,663 | | | $ | 4,417,545 | | | $ | 1,122,690 | | |
| Dividends from affiliated securities (Note 5) | | | 977,252 | | | | - | | | | - | | |
Interest income | | | 7,163 | | | | 4,898,035 | | | | 232 | | |
TOTAL INCOME | | | 41,273,078 | | | | 9,315,580 | | | | 1,122,922 | | |
Expenses: | |
| Investment management fees (Note 2) | | | 11,305,110 | | | | 1,782,137 | | | | 562,890 | | |
| Fund administration fees (Note 2) | | | 362,385 | | | | 34,956 | | | | 8,977 | | |
Fund accounting | | | 215,220 | | | | 67,295 | | | | 20,715 | | |
| Trustees' compensation (Note 2) | | | 74,665 | | | | 11,419 | | | | 1,757 | | |
Transfer agent fees | | | 730,412 | | | | 132,005 | | | | 37,043 | | |
Custodian fees | | | 121,913 | | | | 21,822 | | | | 3,971 | | |
Legal and audit fees | | | 35,660 | | | | 45,283 | | | | 12,185 | | |
Printing and mailing fees | | | 119,455 | | | | 38,847 | | | | 7,166 | | |
Other expenses | | | 113,541 | | | | 42,164 | | | | 22,910 | | |
TOTAL EXPENSES | | | 13,078,361 | | | | 2,175,928 | | | | 677,614 | | |
NET INVESTMENT INCOME | | | 28,194,717 | | | | 7,139,652 | | | | 445,308 | | |
| REALIZED AND UNREALIZED GAIN (LOSS) (Note 4) | |
Net realized gain (loss) on investments | |
Unaffiliated issuers | | | 28,257,760 | | | | 29,973 | | | | 2,659,752 | | |
| Affiliated issuers (Note 5) | | | - | | | | - | | | | - | | |
| | | | 28,257,760 | | | | 29,973 | | | | 2,659,752 | | |
Change in net unrealized appreciation
on investments | | | 114,569,996 | | | | 28,315,299 | | | | 4,217,939 | | |
NET GAIN ON INVESTMENTS | | | 142,827,756 | | | | 28,345,272 | | | | 6,877,691 | | |
NET INCREASE IN NET ASSETS FROM
OPERATIONS | | $ | 171,022,473 | | | $ | 35,484,924 | | | $ | 7,322,999 | | |
* Net of foreign taxes withheld of: | | $ | 292,771 | | | $ | - | | | $ | - | | |
See accompanying Notes to Financial Statements.
32
Mairs & Power Growth Fund
STATEMENTS OF CHANGES IN NET ASSETS (unaudited)
| | | Six Months Ended
June 30, 2014
(unaudited) | | Year Ended
December 31,
2013 | |
OPERATIONS | |
Net investment income | | $ | 28,194,717 | | | $ | 41,502,430 | | |
Net realized gain (loss) on investments sold | | | 28,257,760 | | | | 51,243,031 | | |
Net change in unrealized appreciation of investments | | | 114,569,996 | | | | 884,122,040 | | |
NET INCREASE IN NET ASSETS FROM OPERATIONS | | | 171,022,473 | | | | 976,867,501 | | |
DISTRIBUTIONS TO SHAREHOLDERS FROM | |
Net investment income | | | (28,364,825 | ) | | | (41,528,667 | ) | |
Net realized gain (loss) on investments sold | | | (947,458 | ) | | | (50,373,680 | ) | |
TOTAL DISTRIBUTIONS TO SHAREHOLDERS | | | (29,312,283 | ) | | | (91,902,347 | ) | |
CAPITAL TRANSACTIONS | |
Proceeds from shares sold | | | 360,030,937 | | | | 948,848,009 | | |
Reinvestment of distributions from net investment income and net realized gains | | | 27,167,712 | | | | 86,459,055 | | |
Cost of shares redeemed | | | (234,226,973 | ) | | | (453,949,065 | ) | |
INCREASE IN NET ASSETS FROM CAPITAL TRANSACTIONS | | | 152,971,676 | | | | 581,357,999 | | |
TOTAL INCREASE IN NET ASSETS | | | 294,681,866 | | | | 1,466,323,153 | | |
NET ASSETS | |
Beginning of period | | | 3,964,529,708 | | | | 2,498,206,555 | | |
End of period (including undistributed net investment income (loss) of
($170,108) and $0, respectively) | | $ | 4,259,211,574 | | | $ | 3,964,529,708 | | |
FUND SHARE TRANSACTIONS | |
Shares sold | | | 3,244,403 | | | | 9,744,654 | | |
Shares issued for reinvested distributions | | | 236,302 | | | | 805,337 | | |
Shares redeemed | | | (2,111,649 | ) | | | (4,621,611 | ) | |
NET INCREASE IN FUND SHARES | | | 1,369,056 | | | | 5,928,380 | | |
See accompanying Notes to Financial Statements.
33
Mairs & Power Balanced Fund
STATEMENTS OF CHANGES IN NET ASSETS (unaudited)
| | | Six Months Ended
June 30, 2014
(unaudited) | | Year Ended
December 31,
2013 | |
OPERATIONS | |
Net investment income | | $ | 7,139,652 | | | $ | 11,248,578 | | |
Net realized gain (loss) on investments sold | | | 29,973 | | | | 705,596 | | |
Net change in unrealized appreciation of investments | | | 28,315,299 | | | | 63,949,813 | | |
NET INCREASE IN NET ASSETS FROM OPERATIONS | | | 35,484,924 | | | | 75,903,987 | | |
DISTRIBUTIONS TO SHAREHOLDERS FROM | |
Net investment income | | | (7,041,475 | ) | | | (11,171,121 | ) | |
Net realized gain (loss) on investments sold | | | - | | | | (719,086 | ) | |
TOTAL DISTRIBUTIONS TO SHAREHOLDERS | | | (7,041,475 | ) | | | (11,890,207 | ) | |
CAPITAL TRANSACTIONS | |
Proceeds from shares sold | | | 110,325,524 | | | | 298,382,916 | | |
Reinvestment of distributions from net investment income and net realized gains | | | 6,731,403 | | | | 11,327,201 | | |
Cost of shares redeemed | | | (50,512,359 | ) | | | (96,318,153 | ) | |
INCREASE IN NET ASSETS FROM CAPITAL TRANSACTIONS | | | 66,544,568 | | | | 213,391,964 | | |
TOTAL INCREASE IN NET ASSETS | | | 94,988,017 | | | | 277,405,744 | | |
NET ASSETS | |
Beginning of period | | | 564,315,427 | | | | 286,909,683 | | |
End of period (including undistributed net investment income of $190,354
and $92,177, respectively) | | $ | 659,303,444 | | | $ | 564,315,427 | | |
FUND SHARE TRANSACTIONS | |
Shares sold | | | 1,323,658 | | | | 3,897,106 | | |
Shares issued for reinvested distributions | | | 79,443 | | | | 144,196 | | |
Shares redeemed | | | (609,920 | ) | | | (1,236,314 | ) | |
NET INCREASE IN FUND SHARES | | | 793,181 | | | | 2,804,988 | | |
See accompanying Notes to Financial Statements.
34
Mairs & Power Small Cap Fund
STATEMENTS OF CHANGES IN NET ASSETS (unaudited)
| | | Six Months Ended
June 30, 2014
(unaudited) | | Year Ended
December 31,
2013 | |
OPERATIONS | |
Net investment income | | $ | 445,308 | | | $ | 288,710 | | |
Net realized gain (loss) on investments sold | | | 2,659,752 | | | | 1,197,210 | | |
Net change in unrealized appreciation of investments | | | 4,217,939 | | | | 21,747,471 | | |
NET INCREASE IN NET ASSETS FROM OPERATIONS | | | 7,322,999 | | | | 23,233,391 | | |
DISTRIBUTIONS TO SHAREHOLDERS FROM | |
Net investment income | | | - | | | | (302,949 | ) | |
Net realized gain (loss) on investments sold | | | - | | | | (1,482,078 | ) | |
TOTAL DISTRIBUTIONS TO SHAREHOLDERS | | | - | | | | (1,785,027 | ) | |
CAPITAL TRANSACTIONS | |
Proceeds from shares sold | | | 31,045,596 | | | | 83,330,634 | | |
Reinvestment of distributions from net investment income and net realized gains | | | - | | | | 1,737,734 | | |
Cost of shares redeemed* | | | (9,331,986 | ) | | | (36,674,304 | ) | |
INCREASE IN NET ASSETS FROM CAPITAL TRANSACTIONS | | | 21,713,610 | | | | 48,394,064 | | |
TOTAL INCREASE IN NET ASSETS | | | 29,036,609 | | | | 69,842,428 | | |
NET ASSETS | |
Beginning of period | | | 111,486,295 | | | | 41,643,867 | | |
End of period (including undistributed net investment income of $445,308
and $0, respectively) | | $ | 140,522,904 | | | $ | 111,486,295 | | |
FUND SHARE TRANSACTIONS | |
Shares sold | | | 1,560,594 | | | | 4,907,583 | | |
Shares issued for reinvested distributions | | | - | | | | 88,208 | | |
Shares redeemed | | | (469,659 | ) | | | (2,233,782 | ) | |
NET INCREASE IN FUND SHARES | | | 1,090,935 | | | | 2,762,009 | | |
* Net of redemption fees of : | | $ | 12,127 | | | $ | 2,150 | | |
See accompanying Notes to Financial Statements.
35
NOTES TO FINANCIAL STATEMENTS (unaudited) June 30, 2014
Note 1 – Organization and Significant Accounting Policies
The Mairs & Power Funds Trust (the Trust) is a no-load, diversified, open-end management investment company registered under the Investment Company Act of 1940, as amended (the 1940 Act). Mairs & Power Growth Fund (the Growth Fund), Mairs & Power Balanced Fund (the Balanced Fund), and Mairs & Power Small Cap Fund (the Small Cap Fund) (individually a Fund and collectively the Funds) are series within the Trust. The objective of the Growth Fund is to provide shareholders with a diversified portfolio of common stocks, which have the potential for above-average, long-term appreciation. The objectives of the Balanced Fund are to provide shareholders with regular current income, the potential for capital appreciation and a moderate level of risk by investing in a diversified portfolio including bonds, preferred stocks, common stocks, and other securities convertible into common stock. The objective of the Small Cap Fund is to seek above-average, long-term appreciation.
Significant accounting policies of the Funds are as follows:
Security Valuations
Security valuations for the Funds' investments are furnished by independent pricing services that have been approved by the Trust's Board of Trustees (the Board). Investments in listed equity securities are valued at the last quoted sale price on the securities exchange on which such securities are principally traded or at the NASDAQ Official Closing Price if readily available for such securities on each business day. Other equity securities traded in the over-the-counter market and listed equity securities for which no sale was reported on that date are valued at the last quoted bid price. Debt obligations exceeding 60 days to maturity are valued by an independent pricing service. The pricing services may employ methodologies that utilize actual market transactions, broker-dealer supplied valuations, or other formula-driven valuation techniques. These techniques generally consider overall market conditions and such factors as yields or prices of bonds of comparable quality, type of issue, coupon, maturity and ratings. Debt obligations with 60 days or less remaining until maturity may be valued at their amortized cost, which approximates market.
Securities for which prices are not available from an independent pricing service, but where an active market exists, are valued using market quotations obtained from one or more dealers that make markets in the securities. When market quotations are not readily available, or when the last quoted sale price is not considered representative of the value of the security if it were to be sold on that day, the security will be valued at fair value as determined in good faith by the Fair Value Committee appointed by the Board, pursuant to procedures approved by the Board.
Factors that may be considered in determining the fair value of a security are fundamental analytical data relating to the security, the nature and duration of any restrictions on the disposition of the security, and the forces influencing the market in which the security is purchased or sold. As of June 30, 2014, no securities in the Funds were valued using this method.
Fair Valuation Measurements
The Trust has adopted authoritative fair valuation accounting standards, which establish a definition of fair value and set out a hierarchy for measuring fair value. These standards require additional disclosures about the various inputs and valuation techniques used to develop the measurements of fair value and changes in valuation techniques and related inputs during the period. These inputs are summarized in the three broad levels listed below:
• Level 1 – Quoted prices in active markets for identical securities.
• Level 2 – Other significant observable inputs (including quoted prices for similar securities, interest rates, prepayment speeds, credit risk, etc.).
• Level 3 – Significant unobservable inputs (including the Funds' own assumptions in determining the fair value of investments).
36
NOTES TO FINANCIAL STATEMENTS (unaudited) (continued) June 30, 2014
Note 1 – Organization and Significant Accounting Policies (continued)
The inputs or methodologies used for valuing securities are not necessarily an indication of the risk associated with investing in those securities. The following is a summary of the inputs used to value the net assets of each Fund as of June 30, 2014:
| | | Growth Fund | | Balanced Fund | | Small Cap Fund | |
Level 1* | | $ | 4,260,510,495 | | | $ | 428,673,489 | | | $ | 140,855,029 | | |
Level 2** | | | - | | | | 229,829,708 | | | | - | | |
Level 3 | | | - | | | | - | | | | - | | |
Total | | $ | 4,260,510,495 | | | $ | 658,503,197 | | | $ | 140,855,029 | | |
* All Level 1 investments are equity securities (common stocks and preferred stocks and securities) and short-term investments.
** All Level 2 investments are fixed income securities, excluding preferred securities.
For detail of securities by major sector classification for the Funds, please refer to the Schedules of Investments.
The Funds had no transfers amongst levels during the period and did not hold any Level 3 investments at either June 30, 2014 or December 31, 2013.
Security Transactions and Investment Income
Security transactions are recorded on the date on which securities are purchased or sold. Dividend income and corporate action transactions are recorded on the ex-dividend date, and interest income is recorded on an accrual basis. Realized gains and losses are reported on an identified cost basis.
Income Taxes
Each Fund is a "regulated investment company" as defined in Subtitle A, Chapter 1, Subchapter M of the Internal Revenue Code, as amended (the Code). No provisions have been made for federal income taxes as it is the intention of each Fund to comply with the provisions of the Code applicable to regulated investment companies and to make distributions of income and realized gains sufficient to relieve it from all or substantially all excise and income taxes.
As of June 30, 2014, the Trust did not have any tax positions that did not meet the "more-likely-than-not" threshold of being sustained by the applicable tax authority. Generally, tax authorities can examine all tax returns filed for the last three years or, for the Small Cap Fund, all tax returns filed since commencement of operations.
Basis of Presentation
The preparation of financial statements in conformity with U.S. generally accepted accounting principles (GAAP) requires management to make estimates and assumptions that affect the reported amount of net assets and liabilities and disclosure of contingent assets and liabilities at the date of the financial statements and the reported results of operations during the reporting period. Actual results could differ from those estimates.
In preparing these financial statements, the Funds have evaluated events and transactions for potential recognition or disclosure through the date the financial statements were available to be issued. This evaluation did not result in any subsequent events that necessitated recognition or disclosures.
37
NOTES TO FINANCIAL STATEMENTS (unaudited) (continued) June 30, 2014
Note 2 – Related-Party Transactions
Common expenses incurred by the Trust are allocated among the Funds based on their relative assets. Fund specific expenses are charged directly to the Fund that incurred the expense.
Investment Management and Fund Administration Fees
Mairs and Power, Inc. (the Adviser) provides investment management services to the Funds under a written agreement (the Management Agreement) approved by the Board.
Pursuant to the Management Agreement, the Adviser is paid a monthly fee on average daily net assets at the following annual rates:
| | | Growth Fund | | Balanced Fund | | Small Cap Fund* | |
Up to $2.5 Billion | | | 0.60 | % | | | 0.60 | % | | | 0.90 | % | |
Over $2.5 Billion | | | 0.50 | % | | | 0.60 | % | | | 0.90 | % | |
The Adviser provides fund administration services to the Funds under a written fund administration servicing agreement approved by the Board. The fund administration fee paid to the Adviser is computed at an annual rate of 0.00281% of average daily net assets. Fund administration fees incurred for the six months ended June 30, 2014 and fund administration fees payable to the Adviser as of June 30, 2014 were as follows:
| | | Growth Fund | | Balanced Fund | | Small Cap Fund | |
Fund administration fees incurred | | $ | 56,567 | | | $ | 8,346 | | | $ | 1,757 | | |
Fund administration fees payable | | | 9,748 | | | | 1,495 | | | | 314 | | |
Pursuant to a sub-administration agreement between the Funds and U.S. Bancorp Fund Services, LLC (USBFS), the Funds are charged a sub-administration fee paid to USBFS. Sub-administration fees from USBFS incurred for the six months ended June 30, 2014 and sub-administration fees payable to USBFS as of June 30, 2014 were as follows:
| | | Growth Fund | | Balanced Fund | | Small Cap Fund | |
Sub-administration fees paid | | $ | 305,818 | | | $ | 26,610 | | | $ | 7,220 | | |
Sub-administration fees payable | | | 148,992 | | | | 22,803 | | | | 3,518 | | |
* The Adviser has agreed to waive the Small Cap Fund's investment management and fund administration fees and reimburse expenses to the extent necessary to prevent total annual fund operating expenses (excluding interest, taxes, brokerage commissions, Acquired Fund Fees and Expenses, other investment-related costs and other extraordinary expenses, such as litigation and other expenses not incurred in the ordinary course of the Small Cap Fund's business) from exceeding 1.25% of daily net assets through April 30, 2015. The Adviser cannot terminate this arrangement before that date without the agreement of the Board.
Trustees' Compensation
The Funds pay compensation to the disinterested Trustees of the Trust. The Funds do not pay remuneration to officers or to Trustees who are officers, directors or employees of the Adviser.
Note 3 – Indemnifications
In the normal course of business, the Trust enters into contracts that contain general indemnifications to other parties. The Trust's maximum exposure under these contracts is unknown as this would involve future claims that may be made against the Trust that have not yet occurred. The Trust expects the risk of loss to be remote.
38
NOTES TO FINANCIAL STATEMENTS (unaudited) (continued) June 30, 2014
Note 4 – Distributions Paid, Distributable Earnings and Investment Transactions
Net investment income and net realized capital gains (losses) may differ for financial reporting and tax purposes because of temporary or permanent book/tax differences. To the extent these differences are permanent, reclassifications are made to the appropriate equity accounts in the period that the difference arises.
Distributions to shareholders are determined in accordance with income tax regulations that may differ from GAAP, and due to the timing of the distributions, the fiscal year in which the amounts are distributed may differ from the year that the income or realized gains (losses) were recorded by each Fund.
The tax character of distributions paid during the six months ended June 30, 2014 and the fiscal year ended December 31, 2013, were as follows:
Six months ended June 30, 2014 | |
Distributions paid from: | | Growth Fund | | Balanced Fund | | Small Cap Fund | |
Ordinary income | | $ | 28,364,825 | | | $ | 7,041,475 | | | $ | - | | |
Long-term capital gains | | | 947,458 | | | | - | | | | - | | |
Total distributions paid | | $ | 29,312,283 | | | $ | 7,041,475 | | | $ | - | | |
Year ended December 31, 2013 | |
Distributions paid from: | | Growth Fund | | Balanced Fund | | Small Cap Fund | |
Ordinary income | | $ | 41,523,920 | | | $ | 11,171,731 | | | $ | 287,673 | | |
Long-term capital gains | | | 50,378,427 | | | | 718,476 | | | | 1,497,354 | | |
Total distributions paid | | $ | 91,902,347 | | | $ | 11,890,207 | | | $ | 1,785,027 | | |
Ordinary income distributions include net short-term capital gains. The Funds designate the long-term capital gains presented above as capital gains dividends under the Internal Revenue Code.
At December 31, 2013, the components of accumulated earnings (losses) on a tax basis were as follows:
| | | Growth Fund | | Balanced Fund | | Small Cap Fund | |
Cost of investments | | $ | 2,084,675,163 | | | $ | 428,826,291 | | | $ | 86,222,918 | | |
Gross unrealized appreciation | | $ | 1,913,311,633 | | | $ | 143,023,727 | | | $ | 26,428,872 | | |
Gross unrealized depreciation | | | (38,648,912 | ) | | | (12,587,187 | ) | | | (507,308 | ) | |
Net unrealized appreciation | | $ | 1,874,662,721 | | | $ | 130,436,540 | | | $ | 25,921,564 | | |
Undistributed ordinary income | | $ | - | | | $ | 72,872 | | | $ | - | | |
Undistributed long-term capital gains | | | 947,485 | | | | 266 | | | | - | | |
Total distributable earnings | | $ | 947,485 | | | $ | 73,138 | | | $ | - | | |
Other accumulated earnings | | | - | | | | - | | | | (291,791 | ) | |
Total accumulated earnings | | $ | 1,875,610,206 | | | $ | 130,509,678 | | | $ | 25,629,773 | | |
The difference between book basis and tax basis unrealized appreciation is attributable primarily to the tax deferral of losses on wash sales and the tax cost basis adjustment due to receipt of return of capital distributions from certain investments.
39
NOTES TO FINANCIAL STATEMENTS (unaudited) (continued) June 30, 2014
Note 4 – Distributions Paid, Distributable Earnings and Investment Transactions (continued)
Purchases and sales of investment securities, excluding government securities, short-term securities and temporary cash investments, during the six months ended June 30, 2014 were as follows:
| | | Purchases | | Sales | |
Growth Fund | | $ | 220,796,022 | | | $ | 47,061,758 | | |
Balanced Fund | | | 68,319,920 | | | | 3,703,783 | | |
Small Cap Fund | | | 30,549,480 | | | | 8,016,161 | | |
Purchases and sales of government securities during the six months ended June 30, 2014 were as follows:
| | | Purchases | | Sales | |
Growth Fund | | $ | - | | | $ | - | | |
Balanced Fund | | | 7,349,395 | | | | 4,680,000 | | |
Small Cap Fund | | | - | | | | - | | |
Note 5 – Transactions With Affiliated Companies
The Growth Fund owned 5% or more of the voting securities of the following companies during the six months ended June 30, 2014. As a result, these companies are deemed to be affiliates of the Growth Fund as defined by the Investment Company Act of 1940. Transactions during the period in these securities of affiliated companies were as follows:
Growth Fund
| | | Share Activity | | | | | |
Security Name | | Balance
12/31/13 | | Purchases | | Sales | | Balance
06/30/14 | | Dividend
Income | | Fair Value at
06/30/14 | |
Badger Meter Inc | | | 429,500 | | | | 354,799 | | | | - | | | | 784,299 | | | $ | 257,252 | | | $ | 41,293,342 | | |
MTS Systems Corp. | | | 1,200,000 | | | | - | | | | - | | | | 1,200,000 | | | | 720,000 | | | | 81,312,000 | | |
NVE Corporation | | | 486,185 | | | | - | | | | - | | | | 486,185 | | | | - | | | | 27,027,024 | | |
| | | | | | | | | | | $ | 977,252 | | | $ | 149,632,366 | | |
40
Mairs and Power Growth Fund
FINANCIAL HIGHLIGHTS
SELECTED DATA AND RATIOS
(for a share outstanding throughout each year)
| | | Six Months
Ended | | Year Ended December 31, | |
| | | June 30, 2014 (1) | | 2013 | | 2012 | | 2011 | | 2010 | | 2009 | |
| | | (unaudited) | | | | | | | | | | | |
Per Share | |
Net asset value, beginning of period | | $ | 111.09 | | | $ | 83.95 | | | $ | 70.78 | | | $ | 72.16 | | | $ | 63.12 | | | $ | 52.51 | | |
Income from investment operations: | |
Net investment income | | | 0.77 | | | | 1.23 | | | | 1.33 | | | | 1.01 | | | | 0.86 | | | | 0.89 | | |
Net realized and unrealized gain (loss) | | | 3.88 | | | | 28.58 | | | | 14.08 | | | | (0.45 | ) | | | 10.01 | | | | 10.85 | | |
Total from investment operations | | | 4.65 | | | | 29.81 | | | | 15.41 | | | | 0.56 | | | | 10.87 | | | | 11.74 | | |
Distributions to shareholders from: | |
Net investment income | | | (0.77 | ) | | | (1.23 | ) | | | (1.34 | ) | | | (1.00 | ) | | | (0.86 | ) | | | (0.89 | ) | |
Net realized gains on unaffiliated investments sold | | | (0.03 | ) | | | (1.44 | ) | | | (0.90 | ) | | | (0.94 | ) | | | (0.97 | ) | | | (0.24 | ) | |
Contribution from Adviser | | | - | | | | - | | | | - | | | | - | | | | (0.04 | )(2) | | | - | | |
Total distributions | | | (0.80 | ) | | | (2.67 | ) | | | (2.24 | ) | | | (1.94 | ) | | | (1.87 | ) | | | (1.13 | ) | |
Contribution from Adviser | | | - | | | | - | | | | - | | | | - | | | | 0.04 | (2) | | | - | | |
Net asset value, end of period | | $ | 114.94 | | | $ | 111.09 | | | $ | 83.95 | | | $ | 70.78 | | | $ | 72.16 | | | $ | 63.12 | | |
Total investment return | | | 4.18 | % | | | 35.64 | % | | | 21.91 | % | | | 0.74 | % | | | 17.40 | %(3) | | | 22.52 | % | |
Net assets, end of period, in thousands | | $ | 4,259,212 | | | $ | 3,964,530 | | | $ | 2,498,207 | | | $ | 1,975,127 | | | $ | 2,040,709 | | | $ | 1,935,317 | | |
Ratios/supplemental data: | |
Ratio of expenses to average net assets | | | 0.65 | % | | | 0.67 | % | | | 0.70 | % | | | 0.72 | % | | | 0.71 | % | | | 0.71 | % | |
Ratio of net investment income to average net assets | | | 1.40 | | | | 1.27 | | | | 1.69 | | | | 1.40 | | | | 1.26 | | | | 1.61 | | |
Portfolio turnover rate | | | 1.18 | | | | 3.79 | | | | 1.58 | | | | 2.78 | | | | 1.81 | | | | 3.21 | | |
(1) For the six months ended June 30, 2014, all ratios have been annualized except total investment return and portfolio turnover.
(2) The Fund received two contributions from the Adviser related to prospect services and other expenses paid by the Fund from 1980-2009. The contribution amounts, including imputed interest, were $1,192,736, or $0.04 per share based upon shares outstanding on May 21, 2010 and $8,271 or $0.0003 per share based on shares outstanding as of September 24, 2010.
(3) For the year ended December 31, 2010, 0.08% of the Fund's total return was a result of contributions as described in footnote 2 above. Excluding the contributions, total investment return would have been 17.32%.
See accompanying Notes to Financial Statements.
41
Mairs and Power Balanced Fund
FINANCIAL HIGHLIGHTS
SELECTED DATA AND RATIOS
(for a share outstanding throughout each year)
| | | Six Months
Ended | | Year Ended December 31, | |
| | | June 30, 2014 (1) | | 2013 | | 2012 | | 2011 | | 2010 | | 2009 | |
| | | (unaudited) | | | | | | | | | | | |
Per Share | |
Net asset value, beginning of period | | $ | 82.31 | | | $ | 70.83 | | | $ | 62.15 | | | $ | 62.01 | | | $ | 55.76 | | | $ | 47.80 | | |
Income from investment operations: | |
Net investment income | | | 0.97 | | | | 1.79 | | | | 1.89 | | | | 1.85 | | | | 1.81 | | | | 1.88 | | |
Net realized and unrealized gain (loss) | | | 3.88 | | | | 11.58 | | | | 8.79 | | | | 0.13 | | | | 6.29 | | | | 8.08 | | |
Total from investment operations | | | 4.85 | | | | 13.37 | | | | 10.68 | | | | 1.98 | | | | 8.10 | | | | 9.96 | | |
Distributions to shareholders from: | |
Net investment income | | | (0.96 | ) | | | (1.78 | ) | | | (1.91 | ) | | | (1.83 | ) | | | (1.81 | ) | | | (1.86 | ) | |
Net realized gains on investments sold | | | - | | | | (0.11 | ) | | | (0.09 | ) | | | (0.01 | ) | | | (0.04 | ) | | | (0.11 | ) | |
Contribution from Adviser | | | - | | | | - | | | | - | | | | - | | | | (0.06 | )(2) | | | - | | |
Return of capital | | | - | | | | - | | | | - | | | | - | | | | (0.00 | )(3) | | | (0.03 | ) | |
Total distributions | | | (0.96 | ) | | | (1.89 | ) | | | (2.00 | ) | | | (1.84 | ) | | | (1.91 | ) | | | (2.00 | ) | |
Contribution from Adviser | | | - | | | | - | | | | - | | | | - | | | | 0.06 | (2) | | | - | | |
Net asset value, end of period | | $ | 86.20 | | | $ | 82.31 | | | $ | 70.83 | | | $ | 62.15 | | | $ | 62.01 | | | $ | 55.76 | | |
Total investment return | | | 5.92 | % | | | 19.02 | % | | | 17.34 | % | | | 3.23 | % | | | 14.87 | %(4) | | | 21.35 | % | |
Net assets, end of period, in thousands | | $ | 659,303 | | | $ | 564,315 | | | $ | 286,910 | | | $ | 186,660 | | | $ | 169,400 | | | $ | 136,404 | | |
Ratios/supplemental data: | |
Ratio of expenses to average net assets | | | 0.73 | % | | | 0.72 | % | | | 0.74 | % | | | 0.79 | % | | | 0.81 | % | | | 0.83 | % | |
Ratio of net investment income to average net assets | | | 2.40 | | | | 2.43 | | | | 2.94 | | | | 2.99 | | | | 3.13 | | | | 3.73 | | |
Portfolio turnover rate | | | 1.45 | | | | 3.02 | | | | 5.46 | | | | 9.12 | | | | 5.93 | | | | 18.92 | | |
(1) For the six months ended June 30, 2014, all ratios have been annualized except total investment return and portfolio turnover.
(2) The Fund received two contributions from the Adviser related to prospect services and other expenses paid by the Fund from 1980-2009. The contribution amounts, including imputed interest, were $161,030 or $0.06 per share based upon shares outstanding on May 21, 2010 and $5,841 or $0.002 per share based on shares outstanding as of September 24, 2010.
(3) Amount per share is less than $0.005.
(4) For the year ended December 31, 2010, 0.11% of the Fund's total return was a result of contributions as described in footnote 2 above. Excluding the contributions, total investment return would have been 14.76%.
See accompanying Notes to Financial Statements.
42
Mairs and Power Small Cap Fund
FINANCIAL HIGHLIGHTS
SELECTED DATA AND RATIOS
(for a share outstanding throughout each period)
| | | Six Months
Ended | | Year Ended December 31, | | August 11, 2011 *
Through | |
| | | June 30, 2014 (1) | | 2013 | | 2012 | | December 31, 2011 (1) | |
| | | (unaudited) | | | | | | | |
Per Share | |
Net asset value, beginning of period | | $ | 19.78 | | | $ | 14.49 | | | $ | 11.21 | | | $ | 10.00 | | |
Income from investment operations: | |
Net investment income | | | 0.07 | | | | 0.06 | | | | 0.01 | | | | 0.01 | | |
Net realized and unrealized gain (loss) | | | 1.04 | | | | 5.56 | | | | 3.42 | | | | 1.20 | | |
Total from investment operations | | | 1.11 | | | | 5.62 | | | | 3.43 | | | | 1.21 | | |
Distributions to shareholders from: | |
Net investment income | | | - | | | | (0.06 | ) | | | (0.02 | ) | | | - | | |
Net realized gains on investments sold | | | - | | | | (0.27 | ) | | | (0.13 | ) | | | - | | |
Redemption fees | | | (0.00 | )(2) | | | (0.00 | )(2) | | | - | | | | - | | |
Total distributions | | | - | | | | (0.33 | ) | | | (0.15 | ) | | | - | | |
Net asset value, end of period | | $ | 20.89 | | | $ | 19.78 | | | $ | 14.49 | | | $ | 11.21 | | |
Total investment return | | | 5.61 | % | | | 38.75 | % | | | 30.60 | % | | | 12.10 | % | |
Net assets, end of period, in thousands | | $ | 140,523 | | | $ | 111,486 | | | $ | 41,644 | | | $ | 5,194 | | |
Ratios/supplemental data: | |
Ratio of expenses to average net assets | |
Before expense reimbursement | | | 1.08 | % | | | 1.17 | % | | | 1.73 | % | | | 7.98 | % | |
After expense reimbursement | | | 1.08 | | | | 1.17 | | | | 1.25 | | | | 1.25 | | |
Ratio of net investment income to average net assets | |
Before expense reimbursement | | | 0.71 | % | | | 0.37 | % | | | (0.14 | )% | | | (6.41 | )% | |
After expense reimbursement | | | 0.71 | | | | 0.37 | | | | 0.34 | | | | 0.32 | | |
Portfolio turnover rate | | | 6.47 | | | | 34.91 | | | | 6.93 | | | | 4.52 | | |
* Commencement of operations.
(1) For the periods ended June 30, 2014 and December 31, 2011, all ratios have been annualized except total investment return and portfolio turnover.
(2) Amount per share is less than $0.005.
See accompanying Notes to Financial Statements.
43
FUND EXPENSES (unaudited)
As a shareholder of the Funds, you incur two types of costs: (1) transaction costs including redemption fees and (2) ongoing expenses for the operation of the Funds (e.g., asset-based charges, such as investment management fees). The Funds are "no-load" mutual funds. As a result, shareholders pay no commissions, fees, or expenses associated with sales representatives or sales charges.
This example is intended to help you understand your ongoing costs (in dollars) of investing in the Funds and to compare these costs with the ongoing costs of investing in other mutual funds. The table below reports the Funds' expenses during the period January 1, 2014 through June 30, 2014 and includes the costs associated with a $1,000 investment.
Actual Expenses
The first line in the tables below may be used to estimate the actual expenses you paid over the reporting period. You can do this by dividing your account value by $1,000 and multiplying the result by the expense shown in the table below. For example, if your account value is $8,600, divided by $1,000 = $8.60. Multiply the result by the number in the first line under the heading entitled "Expenses Paid During Period." By doing this you can estimate the expenses you paid on your account during this period.
Hypothetical Example
The second line of the tables below provides information about hypothetical account values and hypothetical expenses based on the Funds' actual expenses and assumed returns of 5% per year before expenses, which are not the Funds' actual returns. The results may be used to provide you with a basis for comparing the ongoing costs of investing in the Funds with the ongoing costs of investing in other funds. To do so, compare these 5% hypothetical examples with the 5% hypothetical examples that appear in the shareholder reports of other funds. Please note that these hypothetical examples may not be used to estimate the actual ending account balances or expenses you paid during the period and will not help you determine the relative total costs of owning different funds.
Mairs & Power Growth Fund
| | | Beginning Account
Value 01/01/2014 | | Ending Account
Value 06/30/2014 | | Expenses Paid
During Period * | |
Actual return | | $ | 1,000.00 | | | $ | 1,041.80 | | | $ | 3.29 | | |
Hypothetical assumed 5% return | | $ | 1,000.00 | | | $ | 1,021.57 | | | $ | 3.26 | | |
* The Fund's expenses are equal to the Fund's annualized expense ratio for the most recent six-month period of 0.65%, multiplied by the average account value over the Fund's first fiscal half-year, multiplied by the number of days in the Fund's second fiscal half-year (181 days), divided by 365 days.
Mairs & Power Balanced Fund
| | | Beginning Account
Value 01/01/2014 | | Ending Account
Value 06/30/2014 | | Expenses Paid
During Period * | |
Actual return | | $ | 1,000.00 | | | $ | 1,059.20 | | | $ | 3.73 | | |
Hypothetical assumed 5% return | | $ | 1,000.00 | | | $ | 1,021.17 | | | $ | 3.66 | | |
* The Fund's expenses are equal to the Fund's annualized expense ratio for the most recent six-month period of 0.73%, multiplied by the average account value over the Fund's first fiscal half-year, multiplied by the number of days in the Fund's second fiscal half-year (181 days), divided by 365 days.
44
FUND EXPENSES (unaudited) (continued)
Mairs & Power Small Cap Fund
| | | Beginning Account
Value 01/01/2014 | | Ending Account
Value 06/30/2014 | | Expenses Paid
During Period * | |
Actual return | | $ | 1,000.00 | | | $ | 1,056.10 | | | $ | 5.51 | | |
Hypothetical assumed 5% return | | $ | 1,000.00 | | | $ | 1,019.44 | | | $ | 5.41 | | |
* The Fund's expenses are equal to the Fund's annualized expense ratio for the most recent six-month period of 1.08%, multiplied by the average account value over the Fund's first fiscal half-year, multiplied by the number of days in the Fund's second fiscal half-year (181 days), divided by 365 days.
45
Proxy Voting Policies and Procedures that the Trust uses to determine how to vote proxies relating to portfolio securities are available (i) without charge, upon request, by calling Shareholder Services at (800) 304-7404 and requesting a copy of the Statement of Additional Information (SAI) and (ii) on the Securities and Exchange Commission's (SEC's) website at www.sec.gov (access Form N-1A).
Information on how the Trust voted proxies relating to portfolio securities during the most recent 12-month period ended June 30 is available at www.mairsandpower.com and on the SEC's website at www.sec.gov.
DISCLOSURE OF PORTFOLIO HOLDINGS (unaudited)
The Trust files a complete schedule of portfolio holdings on Form N-Q for the first and third quarter-ends and on Form N-CSR for the second and fourth quarter-ends with the SEC. The Trust's Forms N-Q and N-CSR are available on the SEC's website at www.sec.gov. Forms N-Q and N-CSR may also be reviewed and copied at the SEC's Public Reference Room in Washington, D.C. Information on the operation of the Public Reference Room may be obtained by calling (800) SEC-0330.
The schedule of portfolio holdings is also printed in the Trust's semi-annual and annual reports to shareholders, which are available without charge by calling Shareholder Services at (800) 304-7404 or by visiting www.mairsandpower.com.
A complete copy of the Trust's portfolio holdings will also be available on or about 15 days following each quarter-end on the Fund's website at www.mairsandpower.com.
BOARD OF TRUSTEES' APPROVAL OF INVESTMENT ADVISORY CONTRACT (unaudited)
The Board of Trustees (the Trustees) unanimously approved the Agreement for Investment Counsel Service (the Advisory Contract) between Mairs & Power Funds Trust (the Trust) on behalf of the Mairs & Power Growth Fund (the Growth Fund), the Mairs & Power Balanced Fund (the Balanced Fund) and the Mairs & Power Small Cap Fund (the Small Cap Fund) (each, a Fund and together, the Funds) and Mairs and Power, Inc. (the Adviser) at a meeting of the Board of Trustees held on May 12, 2014. In evaluating the Advisory Contract, the Trustees took into account their cumulative experience with the Adviser and their ongoing review and discussion with the Funds' portfolio managers at meetings throughout the year.
In preparation for the May 12, 2014 meeting, the Adviser provided the Trustees with extensive materials that are relevant to the Trustees' consideration of the Advisory Contract. As part of their discussion at the May 12 meeting, the independent Trustees discussed the materials and the proposed renewal of the Advisory Contract in executive session with legal counsel present, but with no representatives of the Adviser being present. In reaching their decision to renew the Funds' Advisory Contract with the Adviser, the Trustees considered all factors they believed to be relevant. Each of these factors and the conclusions reached by the Trustees with respect to these factors helped form the basis for the decision to renew the Advisory Contract with the Adviser and are discussed below. In their deliberations, the Trustees did not identify any single factor as determinative.
Nature, Extent and Quality of Services
With respect to the quality and extent of the Adviser's services provided to the Funds, the Trustees noted the Funds' solid performance records over the applicable periods, as discussed in more detail below under "Investment Performance." The Trustees considered the Adviser's extensive experience as an investment adviser and the services it would continue to provide the Funds and their shareholders under the Advisory Contract. They noted the Adviser's succession planning for the portfolio managers of the Growth and Balanced Funds, with Mark L. Henneman and Ronald L. Kaliebe being named lead portfolio managers of the Growth Fund and Balanced Fund, respectively, effective
46
BOARD OF TRUSTEES' APPROVAL OF INVESTMENT ADVISORY CONTRACT (unaudited) (continued)
July 1, 2013 in preparation for the retirement of William B. Frels at the end of 2014. The Trustees considered the Adviser's disciplined investment decision-making process, including its emphasis on Midwest stocks and generally low portfolio turnover. The Trustees also took into account other components of the services provided by the Adviser to the Funds, such as monitoring compliance with applicable requirements under the securities laws, service provider oversight, the Adviser's distribution strategy, the Adviser's risk management system and results of the most recent compliance review. The Trustees concluded that overall they were satisfied with the nature, extent and quality of services provided by the Adviser under the Advisory Contract.
Investment Performance
In reviewing the Funds' performance, the Trustees considered the information provided in connection with the May 12, 2014 Board meeting, noting that they also receive detailed performance information at each regular Board meeting during the year. At the May 12, 2014 meeting, the Trustees considered the investment results for the Funds compared to those mutual funds with similar investment objectives as determined by Morningstar, a representative peer group of funds with similar investment objectives and strategies as determined by the Adviser and to each Fund's respective performance benchmarks. With respect to the Growth Fund and the Balanced Fund, the Trustees reviewed comparative performance information for the one-, five-, ten-year and since-inception periods ending December 31, 2013. The Trustees noted that the investment performance of the Growth Fund and the Balanced Fund was in line with or exceeded the average return of the relevant peer groups and benchmark indices over most of those time periods. With respect to the Small Cap Fund, the Trustees reviewed comparative performance information for the one-year and since-inception periods ended December 31, 2013. The Trustees noted that the Small Cap Fund's performance has exceeded its peer group average during those periods and also exceeded the Morningstar category average for the past one-year period. The Small Cap Fund trailed the benchmark index for the past one-year period but outperformed the benchmark index for the since-inception period. Based upon their review, the Trustees concluded that each Fund's investment performance has been satisfactory.
Management Fees
In evaluating the level of the management fees paid to the Adviser, the Trustees considered both the amount of the fees and the overall expenses of the Funds, compared to those of other similar mutual funds, as well as the quality and quantity of advisory and other services provided by the Adviser. The Trustees noted that the management fees paid to the Adviser by the Growth Fund and the Balanced Fund are either below or in line with the average fees for Morningstar's respective peer group for each Fund and for the peer group of competitive funds identified by the Adviser. Additionally, the Trustees noted that the Balanced Fund's and Growth Fund's total expense ratios are below the average total expense ratios of funds in their Morningstar peer groups and the competitive funds identified by the Adviser. With respect to the Small Cap Fund, the Trustees noted that while the management fee was above the Morningstar and peer group averages, the Fund's total expense ratio was below the Morningstar and peer group averages. The Trustees also considered the Adviser's agreement to waive fees and reimburse the Small Cap Fund's expenses through April 30, 2015 to the extent necessary to limit the annual operating expenses of the Fund for each fiscal year, as a percentage of the Fund's average daily net assets, to 1.25%.
The Trustees then reviewed the fees the Adviser charges its non-mutual fund advisory clients, including retirement funds, other institutional clients and individuals (Advisory Clients) with investment objectives similar to those of the Growth Fund and Balanced Fund, noting that none of the Advisory Clients currently is invested in a small cap investment mandate. The Adviser provided the Trustees with information about the new fee schedule for Advisory Clients opening accounts after April 1, 2014 and the differences in the scope of services provided to its Advisory Clients compared with the scope of those it provides to the Funds. Management noted that the level of investment decision-making is considerably higher with respect to the Funds, because cash flows result in purchase and sale decisions being made by the Adviser virtually every trading day. Other services provided by the Adviser to the Funds include certain administrative services, oversight of the Funds' other service providers, trustee support and
47
BOARD OF TRUSTEES' APPROVAL OF INVESTMENT ADVISORY CONTRACT (unaudited) (continued)
providing office facilities and Fund officers. Having considered all of these factors, the Trustees concluded that the Funds' management fees are fair and reasonable for the services provided.
Costs of Services Provided and Profitability to the Adviser
At the request of the Trustees, the Adviser provided information regarding the Adviser's overall profitability as well as the allocation of profitability between Advisory Clients and the Funds. The profitability of the mutual fund business was further broken down among the Growth, Balanced and Small Cap Funds, as applicable. The Trustees reviewed the Adviser's financial assumptions and methods of expense allocation used. The Trustees noted that the profitability calculation includes fees received by the Adviser under both the Administrative Servicing Agreement and the Advisory Contract. The Trustees believe that the Adviser should be entitled to earn a reasonable level of profit for the services it provides to the Funds. The Trustees also reviewed the Adviser's financial condition and determined it to be sound. Based on their review, the Trustees concluded that the Adviser's level of profitability from its relationship with the Funds is reasonable.
Other Benefits
The Trustees considered the benefits to the Adviser from soft dollar arrangements whereby the Adviser receives proprietary investment research services from broker-dealers that execute the Funds' purchases and sales of securities. As a general matter, the research services received from broker-dealers are used to service all accounts that invest in equity securities. The Trustees received and reviewed information concerning the Funds' brokerage commissions and allocation of Fund brokerage. The Trustees recognized that the Adviser's profitability would be lower if it did not receive proprietary research for soft dollars in connection with the Funds' brokerage activity. In addition, the Trustees considered that the Adviser's Advisory Clients benefit from access to and research obtained from brokers executing trades on behalf of the Funds. While difficult to measure, the Trustees concluded that the benefits the Adviser receives in this way is fairly modest, given the Funds' relatively low portfolio turnover rates and the research capability that the Adviser itself maintains. The Trustees noted that the Adviser derives reputational benefits from its association with the Funds as well. The Trustees considered the nature and amount of fees paid by the Funds for administrative services provided by the Adviser under the Fund Administration Servicing Agreement. The Trustees concluded that the other benefits realized by the Adviser from its relationship with the Funds were reasonable.
Economies of Scale
The Trustees reviewed the extent to which economies of scale may be realized as the Funds increase in size. The Trustees noted the recent asset growth in each of the Funds. The Trustees noted that the Adviser's approach has been to keep costs to the Funds as low as reasonably possible, including management fee levels. At the same time, the Adviser believes, and the Trustees concur, that it is entitled to earn reasonable returns on its mutual fund business. The Adviser acknowledged that while it is difficult to pinpoint the economies of scale to be realized by the Funds at any particular asset level, there is no question that such economies exist. Accordingly, the Adviser, under the terms of the Advisory Contract for the Growth Fund, established a breakpoint at the $2.5 billion asset level. The breakpoint reduces the management fee applicable to assets managed in excess of $2.5 billion from 60 basis points (0.6 of 1%) to 50 basis points (0.5 of 1%). The Trustees reaffirmed their conclusion that establishing this breakpoint at $2.5 billion forms a reasonable basis for having management fee levels reflect economies of scale for the benefit of Growth Fund shareholders. The Adviser believes, and the Trustees concur, that the consideration of establishing a breakpoint at certain asset levels would be an appropriate way for the Adviser to share its economies of scale in the event that the Balanced and Small Cap Funds were to grow their assets substantially. With respect to the Balanced Fund, considering its current level of assets and low management fee, the Trustees concluded that the absence of breakpoints in the Fund's management fee is reasonable at this time. With respect to the Small Cap Fund, considering its current level of assets and the Adviser's agreement to waive fees and reimburse the Fund's expenses pursuant to the expense waiver agreement mentioned above, the Trustees concluded that the absence of breakpoints in the Fund's management fee is reasonable at this time.
48
In an effort to decrease costs, the Trust intends to reduce the number of duplicate Summary Prospectuses and Annual and Semi-Annual Reports you receive by sending only one copy of each to those addresses shared by two or more accounts and to shareholders reasonably believed to be from the same family or household. Once implemented, if you would like to discontinue householding for your accounts, please call Shareholder Services at (800) 304-7404 to request individual copies of these documents. Once notification to stop householding is received, the Trust will begin sending individual copies thirty days after receiving your request. This policy does not apply to account statements.
49
Our Promise to You
As a shareholder of the Mairs & Power Mutual Funds (Funds), you share both personal and financial information with us. Your privacy is important to us, and we are dedicated to safeguarding your personal and financial information.
Information Provided by Shareholders
In the normal course of doing business, we typically obtain the following non-public personal information about our shareholders:
• Personal information regarding our shareholders' identity such as name, address and social security number;
• Information regarding fund transactions effected by us; and
• Shareholder financial information such as net-worth, assets, income, bank account information and account balances.
How We Manage and Protect Your Personal Information
We do not sell information about current or former shareholders to third parties, nor is it our practice to disclose such information to third parties unless requested or permitted to do so by a shareholder or shareholder representative or, if necessary, in order to process a transaction, service an account or as permitted by law. Additionally, we may share information with outside companies that perform administrative services for us. However, our arrangements with these service providers require them to treat your information as confidential.
In order to protect your personal information, we maintain physical, electronic and procedural safeguards to protect your personal information. Our Privacy Policy restricts the use of shareholder information and requires that it be held in strict confidence.
Shareholder Notifications
We are required by law to annually provide a notice describing our privacy policy. In addition, we will inform you promptly if there are changes to our policy. Please contact us at (800) 304-7404 with questions about this notice.
OTHER INFORMATION
This report is submitted for the general information of the shareholders of the Funds. It is not authorized for distribution to prospective investors unless accompanied or preceded by an effective prospectus. An investor should consider the Funds' investment objectives, risks and expenses carefully before investing or sending money. This and other important information can be found in the Funds' summary prospectuses and full prospectus. To obtain a prospectus, please call Shareholder Services at (800) 304-7404 or vist the Funds' website at www.mairsandpower.com. Please read the prospectus carefully before investing.
This report includes forward-looking statements such as economic predictions and portfolio manager opinions. The statements are subject to change at any time based on market and other conditions. No predictions, forecasts, outlooks, expectations or beliefs are guaranteed.
50
This page is intentionally left blank.
This page is intentionally left blank.
MAIRS & POWER FUNDS TRUST
Mairs & Power Growth Fund, established 1958
Mairs & Power Balanced Fund, established 1961
Mairs & Power Small Cap Fund, established 2011
A No-Load Funds Trust
For Shareholder Services
Call (800) 304-7404
Or write to:
(via Regular Mail)
c/o U.S. Bancorp Fund Services, LLC
615 East Michigan Street
P. O. Box 701
Milwaukee, WI 53201-0701 | | (via Overnight or Express Mail)
c/o U.S. Bancorp Fund Services, LLC
3rd Floor
615 East Michigan Street
Milwaukee, WI 53202-0701 | |
For Fund literature and information, visit the Trust's website at:
www.mairsandpower.com
Investment Manager
Mairs and Power, Inc.
W1520 First National Bank Building
332 Minnesota Street
Saint Paul, MN 55101
Custodian
U.S. Bank, N.A.
Custody Operations
1555 North River Center Drive, Suite 302
Milwaukee, WI 53212
Distributor
ALPS Distributors, Inc.
1290 Broadway, Suite 1100
Denver, CO 80203
Mairs and Power, Inc.
c/o U.S. Bancorp Fund Services, LLC
3rd Floor
615 East Michigan Street
Milwaukee, WI 53202-0701
Item 2. Code of Ethics.
Not applicable for semi-annual reports.
Item 3. Audit Committee Financial Expert.
Not applicable for semi-annual reports.
Item 4. Principal Accountant Fees and Services.
Not applicable for semi-annual reports.
Item 5. Audit Committee of Listed Registrants.
Not applicable to registrant.
Item 6. Investments.
(a) Schedule of Investments is included as part of the report to shareholders filed under Item 1 of this Form
(b) Not Applicable.
Item 7. Disclosure of Proxy Voting Policies and Procedures for Closed-End Management Investment Companies.
Not applicable to open-end investment companies.
Item 8. Portfolio Managers of Closed-End Management Investment Companies.
Not applicable to open-end investment companies.
Item 9. Purchases of Equity Securities by Closed-End Management Investment Company and Affiliated Purchasers.
Not applicable to open-end investment companies.
Item 10. Submission of Matters to a Vote of Security Holders.
There has been no material change to the procedures by which shareholders may recommend nominees to the registrant’s board of directors.
1
Item 11. Controls and Procedures.
(a) The registrant’s principal executive officer and principal financial officer have evaluated the registrant’s disclosure controls and procedures as of a date within 90 days of the filing of this report and have concluded that the registrant’s disclosure controls and procedures were effective, as of that date, in ensuring that information required to be disclosed by the registrant in this Form N-CSR was recorded, processed, summarized and reported within the time period specified by the SEC’s rules and forms.
(b) There were no changes in the Registrant’s internal control over financial reporting (as defined in Rule 30a-3(d) under the Act) that occurred during the second fiscal quarter of the period covered by this report that has materially affected, or is reasonably likely to materially affect, the Registrant’s internal control over financial reporting.
Item 12. Exhibits.
(a) (1) Code of Ethics
Mairs & Power Funds Trust Code of Ethics for Principal Executive Officer and Principal Financial Officer.
Attached as exhibit 12(a)(1) to this form.
(2) Certifications required by Rule 30a-2(a) under the Investment Company Act of 1940.
Attached as exhibits 12(a)(2).1 and 12(a)(2).2 to this form.
(3) Any written solicitation to purchase securities under Rule 23c-1 under the Act sent or given during the period covered by the report by or on behalf of the registrant to 10 or more persons. Not applicable to open-end investment companies.
(b) Certifications pursuant to Section 906 of the Sarbanes-Oxley Act of 2002.
Attached as exhibit 12(b) to this form.
2
SIGNATURES
Pursuant to the requirements of the Securities Exchange Act of 1934 and the Investment Company Act of 1940, the registrant has duly caused this report to be signed on its behalf by the undersigned, thereunto duly authorized.
| (Registrant) | Mairs & Power Funds Trust | |
| | | |
| By (Signature and Title)* | /s/ William B. Frels | |
| | William B. Frels, President | |
| | Principal Executive Officer | |
| | |
| Date | 9/18/14 | |
| | | | | | |
Pursuant to the requirements of the Securities Exchange Act of 1934 and the Investment Company Act of 1940, this report has been signed below by the following persons on behalf of the registrant and in the capacities and on the dates indicated.
| | | |
| By (Signature and Title)* | /s/ William B. Frels | |
| | William B. Frels, President | |
| | Principal Executive Officer | |
| | |
| Date | 9/18/14 | |
| | |
| | | |
| By (Signature and Title)* | /s/ Andrea C. Stimmel | |
| | Andrea C. Stimmel, Treasurer | |
| | Principal Financial Officer | |
| | |
| Date | 9/18/14 | |
| | | | | |
* Print the name and title of each signing officer under his or her signature.
3