UNITED STATES
SECURITIES AND EXCHANGE COMMISSION
Washington, D.C. 20549
FORM N-CSR
CERTIFIED SHAREHOLDER REPORT OF REGISTERED
MANAGEMENT INVESTMENT COMPANIES
Investment Company Act file number | 811-22563 |
|
Mairs & Power Funds Trust |
(Exact name of registrant as specified in charter) |
|
332 Minnesota Street, Suite W1520, St. Paul, MN | | 55101 |
(Address of principal executive offices) | | (Zip code) |
|
Andrea C. Stimmel, Chief Compliance Officer & Treasurer, 332 Minnesota Street, Suite
W1520, St. Paul, MN 55101 |
(Name and address of agent for service) |
|
Registrant’s telephone number, including area code: | 651-222-8478 | |
|
Date of fiscal year end: | December 31, 2013 | |
|
Date of reporting period: | June 30, 2013 | |
| | | | | | | | |
Item 1. Reports to Stockholders.

Investing for the long-term
SEMI-ANNUAL REPORT
JUNE 30, 2013
- GROWTH FUND (MPGFX)
est. 1958
- BALANCED FUND (MAPOX)
est. 1961
- SMALL CAP FUND (MSCFX)
est. 2011
Mairs & Power W1520 First National Bank Building, 332 Minnesota Street, St. Paul, Minnesota 55101 www.mairsandpower.com
MAIRS & POWER FUNDS MARKET COMMENTARY (unaudited)
July 31, 2013
So far this year the stock market has been strong by almost any measure, with the benchmark Standard & Poor's 500 Stock Index producing a first half return of 13.82%, the strongest first half performance since 1998. Most of the year-to-date gain was posted in the first quarter, followed by a 2.91% gain in the second quarter.
Both the stock and bond markets absorbed a sharp sell-off in the last few days of the quarter following comments from the Federal Reserve (Fed) indicating the possible end to its unprecedented and unconventional program of pumping liquidity into the market through purchase of Mortgage Backed Securities and Treasury Bills, known as Quantitative Easing (QE II).
While this over-reaction to the possibility of future Fed moves demonstrates investor nervousness, we viewed this as a non-event for two reasons. First, many of the stocks we hold are generally not dependent on a low interest rate environment for their performance. In addition, the Fed indicated it will only reduce its liquidity program if the economy continues to strengthen – which would be a positive development for the market. Fed Chairman Bernanke described the approach as "easing up on the gas" as the economy accelerates rather than "putting on the brakes."
In the second quarter, several economic indicators gave mixed signals with a slight tilt to the positive. S&P earnings and revenue growth decelerated in the second quarter, and the market became more cautious, anticipating further slowdowns. Reported unemployment remains above 7%, improved from the depths of the recession, but still high. The recently reported Gross Domestic Product figures showed modest growth of 1.7% up from a revised figure of 1.1% growth in the first quarter. On a more positive note, reported inflation and the current near term inflation outlook both remain low, under 2%. Mortgage rates moved up slightly in the quarter, but remain low, helping the housing market continue its slow recovery, while consumer confidence measures continued to rise in the quarter, as evidenced by strong auto sales.
There is one additional market dynamic worth noting. Companies characterized by lower ROE (return on equity) ratios outperformed higher quality companies in the quarter across all capitalization levels. As a firm, our investment bias is toward those higher quality (higher ROE) companies, which underperformed in the quarter, but which we believe over time will outperform lower quality stocks.
Future Outlook
Given the strong first half performance, we would not be surprised if the market paused to absorb its gains. With the S&P 500 selling near its long-term historic average price/earnings ratio, the market is neither overly expensive, nor is it cheap. Even if a modest price adjustment occurs, we believe the longer term outlook remains positive for equities. Market anticipation of future Fed actions may continue to pressure fixed income securities, however.
We share the belief of many economists and the Fed that the current slow rate of GDP growth is likely to pick up in the second half. The level of the U.S. dollar remains favorable for export oriented companies, but economic growth outside the U.S. remains an open question and will impact revenue and earnings of many U.S. companies. Washington faces another debt limit decision later this year, and the outcome of that debate could cause a significant reaction in the market, depending on what is decided.
While we recognize the many uncertainties in the coming months and share many of the concerns of investors generally, we remain focused on the underlying fundamentals of each individual company we own as we continue to monitor revenue and earnings prospects closely. And we remain fundamentally positive on the long term outlook for the market. Mairs & Power will continue to focus on its long term investment strategy and will resist the temptation to make shorter term market moves.
1
MAIRS & POWER FUNDS MARKET COMMENTARY (unaudited) (continued)
In analyzing our Funds' performance numbers relative to benchmarks, we look at both individual stock selection and our allocation of assets in different industry sectors as an integral part of our disciplined investment process. The fund reports that follow highlight the effects of both factors.
Fund Manager Update
This first half report represents a milestone for the Mairs & Power Funds Trust, with the announcement that Bill Frels will retire from his role as Fund Manager, Officer and Trustee on December 31, 2014. On July 1, 2013, Bill stepped aside as lead manager on both the Growth Fund and the Balanced Fund, but he will continue to serve as co-manager for both Funds over the next six quarters to ensure a smooth transition. While stepping down from these Fund roles because of the mandatory retirement age adopted by the Mairs & Power Funds Trust, Bill expects to continue beyond 2014 as an Officer, Director and Shareholder of Mairs and Power, Inc., Adviser to the Mairs & Power Funds.
The legacy left by both Bill Frels and George Mairs before him will be felt long into the future. Both men, legendary leaders in the investment industry, have made a deep and lasting impact on the firm and the individuals privileged to work here. All the portfolio managers at Mairs & Power have benefited over the years from their experience in identifying outstanding companies and from their wisdom in managing investment funds for long term performance. We hope to continue that decades-long tradition of successful investing for the long term.
Gross Domestic Product (GDP) is the monetary value of all the finished goods and services produced within a country's borders in a specified time period.
Return on Equity (ROE). Return on equity measures a corporation's profitability by revealing how much profit a company generates with the money shareholders have invested.
2
MAIRS & POWER GROWTH FUND (unaudited)
To Our Shareholders: July 31, 2013
The Growth Fund benefited from a strong overall stock market in the first half of the year. Building on a very strong first quarter performance, the Growth Fund posted a solid first half overall, up 13.93% compared to 13.82% for the benchmark Standard & Poor's 500 Stock Index and 13.22% for the Lipper Multi-Cap Core Funds Index . In the second quarter, the Fund lagged its benchmarks, up 1.77% compared to a gain of 2.91% for the S&P 500 and 2.24% for the Lipper Index.
Looking at the first half performance overall, the Growth Fund benefited from being underweight in information technology and from not owning utilities or telecom stocks. Conversely, the Fund's performance was hurt by being overweight in financials and consumer discretionary sectors. While the Fund was also overweight in the relatively weak materials sector, gains by H.B. Fuller and Valspar, two of our sector holdings, more than compensated, benefiting overall Fund performance for the first half.
With economic uncertainty continuing to drive volatility both for the overall market and individual stocks, we continue to stay close to our portfolio companies so we can understand what is driving their individual performance. If our underlying investment thesis has not changed, we remain invested in these companies. A recent comment from money manager Pat Dorsey at Sanibel Captiva Investment Advisors aptly captured our approach when he said: having the "courage to do nothing when emotions run high and market volatility spikes is the wiser choice than trying to game the stock market's unpredictable gyrations."*
MAIRS & POWER GROWTH FUND
Top Performers | |
| Second Quarter (4/1/13 – 6/30/13) | | First Half (1/2/13 – 6/30/13) | |
WESTERN UNION | | | 13.76 | % | | G & K SERVICES INC | | | 39.39 | % | |
ST JUDE MEDICAL | | | 12.83 | % | | PRINCIPAL FINANCIAL GR. | | | 31.31 | % | |
WELLS FARGO | | | 11.57 | % | | WALT DISNEY CO | | | 26.83 | % | |
WALT DISNEY CO | | | 11.18 | % | | ST JUDE MEDICAL | | | 26.26 | % | |
INTEL CORP | | | 10.97 | % | | WESTERN UNION | | | 25.72 | % | |
Weak Performers | |
| Second Quarter (4/1/13 – 6/30/13) | | First Half (1/2/13 – 6/30/13) | |
FASTENAL CO | | | -10.79 | % | | BADGER METER INC | | | -6.03 | % | |
CRAY INC | | | -15.38 | % | | DAKTRONICS INC | | | -7.40 | % | |
BADGER METER INC | | | -16.76 | % | | SURMODICS INC | | | -10.51 | % | |
NVE CORP | | | -17.02 | % | | C H ROBINSON | | | -10.93 | % | |
SURMODICS INC | | | -26.57 | % | | NVE CORP | | | -15.62 | % | |
Past performance is no guarantee of future results.
Looking at the five best performers and poorest performers both in the quarter and year-to-date (SEE TABLE) illustrates the value in holding a diversified portfolio. For the first half, G&K Services and Principal Financial were the top performers in the Fund driven by outstanding first quarter returns. Strong performers in both the second quarter and first half included Western Union, St. Jude Medical and Disney. Wells Fargo and Intel were also among the top five performers in the second quarter on a stand-alone basis. Three of the poorest performing stocks in the first half, Surmodics, NVE Corp. and Badger Meter, resulted from large declines they experienced in the second quarter. CH Robinson and Daktronics were the other poor performers for the first half, while Cray and Fastenal were the other poor performers on a stand-alone basis in the second quarter.
3
MAIRS & POWER GROWTH FUND (unaudited) (continued)
Looking more closely at some of the names: medical device supplier Surmodics experienced a sharp decline in the second quarter, erasing all of its strong first quarter gain, following the company's Q2 earnings report which came in slightly below analysts' consensus expectations, even though both revenue and earnings grew in the quarter. Supercomputer maker Cray reported a deferral in booking some large system sales into future quarters which also caused a large sell-off in the quarter. Cray remains among the ten top performers year-to-date following a strong price run up in 2012 and the first quarter of 2013.
Mark L. Henneman
Vice President and Lead Manager | | William B. Frels
President and Co-Manager | |
All investments have risks. The Growth Fund is designed for long-term investors. Equity investments are subject to market fluctuations, and the Fund's share price can fall because of weakness in the broad market, a particular industry, or specific holdings. Investments in small and midcap companies generally are more volatile. International investing risks include among others political, social or economic instability, difficulty in predicting international trade patterns, taxation and foreign trading practices, and greater fluctuations in price than United States corporations.
Diversification does not guarantee profit or protect against loss.
*Captiva e-mail, "Courage to do Nothing," Sanibel Captiva Investment Advisers, July 2013
Lipper Multi-Cap Core Funds Index is an unmanaged index considered representative of multi-cap core funds tracked by Lipper. It is not possible to invest directly in an index.
4
Mairs & Power Growth Fund
PERFORMANCE INFORMATION (unaudited) June 30, 2013
Ten years of investment performance (through June 30, 2013)
This chart illustrates the performance of a hypothetical $10,000 investment made in the Fund 10 years ago.
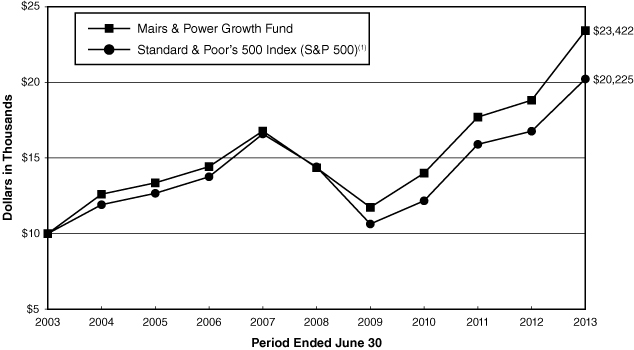
Average annual total returns for periods ended June 30, 2013
| | | 1 year | | 5 years | | 10 years | | 20 years | |
Mairs & Power Growth Fund | | | 24.45 | % | | | 10.29 | % | | | 8.88 | % | | | 12.42 | % | |
S&P 500(1) | | | 20.60 | % | | | 7.01 | % | | | 7.30 | % | | | 8.66 | % | |
Performance data quoted represents past performance and does not guarantee future results. All performance information shown includes the reinvestment of dividend and capital gain distributions, but does not reflect the deduction of taxes that a shareholder would pay on Fund distributions or the redemption of Fund shares. The investment return and principal value of an investment will fluctuate so that an investor's shares, when redeemed, may be worth more or less than their original cost. Current performance of the Fund may be lower or higher than the performance quoted. For the most recent month-end performance figures, visit the Fund's website at www.mairsandpower.com or call Shareholder Services at (800) 304-7404.
(1) The S&P 500 is an unmanaged index of 500 common stocks that is generally considered representative of the U.S. stock market. It is not possible to invest directly in an index.
5
Mairs & Power Growth Fund
FUND INFORMATION (unaudited) June 30, 2013
Portfolio Managers
Mark L. Henneman, lead manager since July 1, 2013,
co-manager since 2006
University of Minnesota, MBA Finance 1990
William B. Frels, co-manager from 1999-2004, and from July 1, 2013, lead manager from 2004-2013
University of Wisconsin, BBA Finance 1962
General Information
Fund Symbol | | | MPGFX | | |
Net Asset Value (NAV) Per Share | | $ | 95.07 | | |
Expense Ratio | | | 0.68 | %1 | |
Portfolio Turnover Rate | | | 0.09 | % | |
Sales Charge | | | None2 | | |
Fund Inception Year | | | 1958 | | |
Portfolio Composition

Top Ten Portfolio Holdings
(Percent of Total Net Assets) 3
Valspar Corp. | | | 4.6 | % | |
3M Co. | | | 4.5 | | |
Medtronic, Inc. | | | 4.3 | | |
Target Corp. | | | 4.1 | | |
Pentair Ltd. | | | 4.1 | | |
Honeywell International Inc. | | | 4.0 | | |
Ecolab, Inc. | | | 3.9 | | |
Graco, Inc. | | | 3.8 | | |
Emerson Electric Co. | | | 3.8 | | |
U.S. Bancorp | | | 3.5 | | |
Portfolio Diversification
(Percent of Total Net Assets)
Common Stocks 97.5% | |
Health Care | | | 16.9 | % | |
Capital Goods | | | 14.7 | | |
Basic Industries | | | 14.7 | | |
Technology | | | 13.2 | | |
Financial | | | 11.9 | | |
Consumer Cyclical | | | 9.2 | | |
Diversified | | | 6.7 | | |
Consumer Staple | | | 5.1 | | |
Transportation | | | 3.5 | | |
Energy | | | 1.6 | | |
Short-term Investments 2.5%4 | | | 2.5 | | |
| | | | 100.0 | % | |
1 Ratio has been annualized for the six month period ended June 30, 2013.
2 Although the Fund is no-load, investment management fees and other expenses still apply.
3 All holdings in the portfolio are subject to change without notice and may or may not represent current or future portfolio composition. The mention of specific securities is not intended as a recommendation or offer for a particular security, nor is it intended to be a solicitation for the purchase or sale of any security.
4 Represents short-term investments and other assets and liabilities (net).
6
Mairs & Power Growth Fund
SCHEDULE OF INVESTMENTS (unaudited) June 30, 2013
Shares | | Security Description | | Fair Value | |
| | | COMMON STOCKS 97.5% | |
| | | BASIC INDUSTRIES 14.7% | |
| | 2,185,000 | | | Bemis Co., Inc. | | $ | 85,520,900 | | |
| | 1,415,153 | | | Ecolab, Inc. | | | 120,556,884 | | |
| | 2,850,000 | | | H.B. Fuller Co. (d) | | | 107,758,500 | | |
| | 2,190,000 | | | Valspar Corp. | | | 141,627,300 | | |
| | | | 455,463,584 | | |
| | | CAPITAL GOODS 14.7% | |
| | 412,000 | | | Badger Meter, Inc. | | | 18,354,600 | | |
| | 2,630,000 | | | Donaldson Co., Inc. | | | 93,785,800 | | |
| | 690,000 | | | Fastenal Co. | | | 31,636,500 | | |
| | 1,870,000 | | | Graco, Inc. | | | 118,202,700 | | |
| | 1,200,000 | | | MTS Systems Corp. (d) | | | 67,920,000 | | |
| | 2,190,000 | | | Pentair Ltd. (a) | | | 126,341,100 | | |
| | | | 456,240,700 | | |
| | | CONSUMER CYCLICAL 9.2% | |
| | 500,000 | | | G&K Services, Inc., Class A | | | 23,800,000 | | |
| | 1,860,000 | | | Target Corp. | | | 128,079,600 | | |
| | 2,400,000 | | | Toro Co. | | | 108,984,000 | | |
| | 360,000 | | | The Walt Disney Company | | | 22,734,000 | | |
| | | | 283,597,600 | | |
| | | CONSUMER STAPLE 5.1% | |
| | 1,450,000 | | | General Mills, Inc. | | | 70,368,500 | | |
| | 2,230,000 | | | Hormel Foods Corp. | | | 86,033,400 | | |
| | | | 156,401,900 | | |
| | | DIVERSIFIED 6.7% | |
| | 1,260,000 | | | 3M Co. | | | 137,781,000 | | |
| | 3,040,000 | | | General Electric Co. | | | 70,497,600 | | |
| | | | 208,278,600 | | |
| | | ENERGY 1.6% | |
| | 680,000 | | | Schlumberger, Ltd. (a) | | | 48,728,800 | | |
| | | FINANCIAL 11.9% | |
| | 1,510,000 | | | Associated Banc-Corp. | | | 23,480,500 | | |
| | 1,600,000 | | | Principal Financial Group | | | 59,920,000 | | |
| | 3,060,000 | | | TCF Financial Corp. | | | 43,390,800 | | |
| | 300,000 | | | The Travelers Cos., Inc. | | | 23,976,000 | | |
| | 3,020,000 | | | U.S. Bancorp | | | 109,173,000 | | |
| | 1,920,000 | | | Wells Fargo & Co. | | | 79,238,400 | | |
| | 1,640,000 | | | Western Union Co. | | | 28,060,400 | | |
| | | | 367,239,100 | | |
7
Mairs & Power Growth Fund
SCHEDULE OF INVESTMENTS (unaudited) (continued) June 30, 2013
Shares | | Security Description | | Fair Value | |
| | | COMMON STOCKS (continued) | |
| | | HEALTH CARE 16.9% | |
| | 1,030,000 | | | Baxter International Inc. | | $ | 71,348,100 | | |
| | 1,130,000 | | | Johnson & Johnson | | | 97,021,800 | | |
| | 2,560,000 | | | Medtronic, Inc. | | | 131,763,200 | | |
| | 1,170,000 | | | Patterson Cos., Inc. | | | 43,992,000 | | |
| | 1,550,000 | | | Pfizer Inc. | | | 43,415,500 | | |
| | 1,340,000 | | | St. Jude Medical, Inc. | | | 61,144,200 | | |
| | 628,800 | | | SurModics, Inc. (b) | | | 12,582,288 | | |
| | 440,500 | | | Techne Corp. | | | 30,429,740 | | |
| | 430,000 | | | Zimmer Holdings, Inc. | | | 32,224,200 | | |
| | | | 523,921,028 | | |
| | | TECHNOLOGY 13.2% | |
| | 2,390,000 | | | Corning Inc. | | | 34,009,700 | | |
| | 1,012,500 | | | Cray Inc. (b) | | | 19,885,500 | | |
| | 1,960,000 | | | Daktronics, Inc. | | | 20,109,600 | | |
| | 2,140,000 | | | Emerson Electric Co. | | | 116,715,600 | | |
| | 170,000 | | | Fiserv, Inc. (b) | | | 14,859,700 | | |
| | 1,550,000 | | | Honeywell International Inc. | | | 122,977,000 | | |
| | 780,000 | | | Intel Corp. | | | 18,891,600 | | |
| | 486,185 | | | NVE Corporation (b) (d) | | | 22,763,182 | | |
| | 620,000 | | | Qualcomm, Inc. | | | 37,869,600 | | |
| | | | 408,081,482 | | |
| | | TRANSPORTATION 3.5% | |
| | 1,100,000 | | | C.H. Robinson Worldwide, Inc. | | | 61,941,000 | | |
| | 550,000 | | | United Parcel Service, Inc., Class B | | | 47,564,000 | | |
| | | | 109,505,000 | | |
| | | | | TOTAL COMMON STOCKS
(cost $1,682,283,100) | | $ | 3,017,457,794
| | |
| | | SHORT-TERM INVESTMENTS 2.3% | |
| | 70,202,772 | | | First American Prime Obligations Fund, Class Z, 0.00% (c)
(cost $70,202,772) | | $ | 70,202,772
| | |
| | | | | TOTAL INVESTMENTS 99.8%
(cost $1,752,485,872) | | $ | 3,087,660,566
| | |
| | | | | OTHER ASSETS AND LIABILITIES (NET) 0.2% | | | 5,019,718 | | |
| | | | | TOTAL NET ASSETS 100.0% | | $ | 3,092,680,284 | | |
8
Mairs & Power Growth Fund
SCHEDULE OF INVESTMENTS (unaudited) (continued) June 30, 2013
(a) Foreign security denominated in U.S. dollars. As of June 30, 2013, these securities represented $175,069,900 or 5.7% of total net assets.
(b) Non-income producing.
(c) The rate quoted is the annualized seven-day effective yield as of June 30, 2013.
(d) Affiliated company (Note 5).
See accompanying Notes to Financial Statements.
9
MAIRS & POWER BALANCED FUND (unaudited)
To Our Shareholders: July 31, 2013
The Balanced Fund produced a relatively strong showing during the first half of 2013 mainly due to the strength shown by the stock portion of the portfolio. The Fund delivered an overall investment return of 7.81% compared to a 7.00% return for the benchmark composite index (60% S&P 500 Stock Index and 40% Barclays Capital Gov't/Credit Bond Index). The Fund also outperformed the Lipper Balanced Funds Index, a peer group measurement, which came in with a 5.51% return for the same period. For the second quarter, the Fund was up 0.15% compared to a 0.73% return and 0.11% return for the benchmark composite and Lipper indices, respectively.
Bonds underperformed in the quarter, driven by rising rates following the Fed announcement that it is contemplating ending its program of pumping liquidity into the markets. While fixed income securities did not contribute positively in the quarter, our current laddering of the bonds in the portfolio will let us reinvest the maturities over time. We will continue to monitor the Fed, our credits and the market very closely. Rising rates and dividend increases in the quarter enabled us to restore the Balanced Fund dividend to its previous level of $0.45, after having cut it back in the first quarter.
On the equity side of the portfolio, stock selection was key to performance in the first half, where it contributed positively in the information technology, materials, industrials, financial and consumer staple sectors in particular. Stock selection was a negative factor in the energy and health care sectors. The Fund benefited from being underweight in the information technology sector but was hurt by being underweight in consumer discretionary. The potential negative impact of an overweight position in materials was outweighed by positive stock selection in the sector.
MAIRS & POWER BALANCED FUND
Top Performers (Equities only) | |
| Second Quarter (4/1/13 – 6/30/13) | | First Half (1/2/13 – 6/30/13) | |
WESTERN UNION | | | 13.76 | % | | LINCOLN NATIONAL | | | 40.81 | % | |
LINCOLN NATIONAL | | | 11.84 | % | | BRISTOL MYERS SQUIBB CO | | | 37.13 | % | |
WELLS FARGO | | | 11.57 | % | | PRINCIPAL FINANCIAL | | | 31.31 | % | |
JPMORGAN CHASE | | | 11.23 | % | | AMERICAN EXPRESS CO | | | 30.06 | % | |
AMERICAN EXPRESS | | | 10.82 | % | | WESTERN UNION | | | 25.72 | % | |
Weak Performers (Equities only) | |
| Second Quarter (4/1/13 – 6/30/13) | | First Half (1/2/13 – 6/30/13) | |
HORMEL FOODS CORP | | | -6.52 | % | | EMERSON ELECTRIC CO | | | 2.98 | % | |
H B FULLER CO | | | -9.04 | % | | MURPHY OIL CORP | | | 2.25 | % | |
IBM | | | -10.40 | % | | BP PLC | | | 0.24 | % | |
ELI LILLY & CO | | | -13.51 | % | | IBM | | | -0.23 | % | |
DELUXE CORP | | | -16.30 | % | | ELI LILLY & CO | | | -0.41 | % | |
Past performance is no guarantee of future results.
Top performers for both the second quarter and first half were concentrated in the financial services sector (SEE TABLE) with Lincoln National, American Express and Western Union all strong contributors in both periods. Principal Financial and pharmaceutical giant Bristol Myers also were top contributors in the first half, built primarily on solid second quarter results adding to outstanding first quarter performance. Wells Fargo and JP Morgan were top contributors for the second quarter, also following strong first quarter performance.
10
MAIRS & POWER BALANCED FUND (unaudited) (continued)
IBM and Eli Lilly were among the poorest performers, both in the quarter and year-to-date, due to large declines in the second quarter. Energy companies Murphy Oil and British Petroleum and industrial supplier Emerson Electric were also among the poorer performers for the first half. Deluxe Corp., HB Fuller and Hormel saw declines in the second quarter but are still positive for the year.
Looking more closely at a few names, Hormel cut its earnings outlook in the face of rising costs, causing the second quarter price drop, but the stock remains among the top ten performing stocks year-to-date based on very strong first quarter performance. Both Deluxe Corp. and HB Fuller have corrected a bit following strong price run ups in 2012 and the first quarter of 2013.
Ronald L. Kaliebe
Vice President and Lead Manager | | William B. Frels
President and Co-Manager | |
All investments have risks. The Balanced Fund is designed for long-term investors. Equity investments are subject to market fluctuations, and the Fund's share price can fall because of weakness in the broad market, a particular industry, or specific holdings. Investments in small and midcap companies generally are more volatile. International investing risks include among others political, social or economic instability, difficulty in predicting international trade patterns, taxation and foreign trading practices, and greater fluctuations in price than United States corporations. The Fund is subject to yield and share price variances with changes in interest rates and market conditions. Investors should note that if interest rates rise significantly from current levels, bond fund total returns will decline and may even turn negative in the short-term. There is also a chance that some of the Fund's holdings may have their credit rating downgraded or may default.
Barclays U.S. Government/Credit Index is composed of high-quality, investment-grade U.S. government and corporate fixed income securities with maturities greater than one year. It is not possible to invest directly in an index.
Lipper Balanced Funds Index is an unmanaged index considered representative of balanced funds tracked by Lipper. It is not possible to invest directly in an index.
11
Mairs & Power Balanced Fund
PERFORMANCE INFORMATION (unaudited) June 30, 2013
Ten years of investment performance (through June 30, 2013)
This chart illustrates the performance of a hypothetical $10,000 investment made in the Fund 10 years ago.
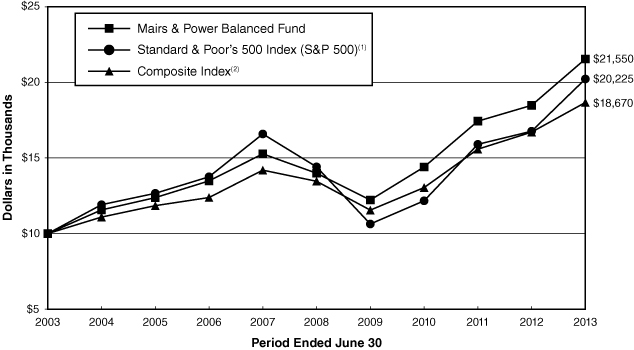
Average annual total returns for periods ended June 30, 2013
| | | 1 year | | 5 years | | 10 years | | 20 years | |
Mairs & Power Balanced Fund | | | 16.60 | % | | | 9.02 | % | | | 7.98 | % | | | 9.43 | % | |
S&P 500(1) | | | 20.60 | % | | | 7.01 | % | | | 7.30 | % | | | 8.66 | % | |
Composite Index(2) | | | 11.73 | % | | | 6.76 | % | | | 6.44 | % | | | 7.86 | % | |
Performance data quoted represents past performance and does not guarantee future results. All performance information shown includes the reinvestment of dividend and capital gain distributions, but does not reflect the deduction of taxes that a shareholder would pay on Fund distributions or the redemption of Fund shares. The investment return and principal value of an investment will fluctuate so that an investor's shares, when redeemed, may be worth more or less than their original cost. Current performance of the Fund may be lower or higher than the performance quoted. For the most recent month-end performance figures, visit the Fund's website at www.mairsandpower.com or call Shareholder Services at (800) 304-7404.
(1) The S&P 500 is an unmanaged index of 500 common stocks that is generally considered representative of the U.S. stock market. It is not possible to invest directly in an index.
(2) The Composite Index reflects an unmanaged portfolio of 60% of the S&P 500 and 40% of the Barclays Capital Government/Credit Bond Index, which is composed of high-quality, investment-grade U.S. government and corporate fixed income securities with maturities greater than one year.
12
Mairs & Power Balanced Fund
FUND INFORMATION (unaudited) June 30, 2013
Portfolio Managers
Ronald L. Kaliebe, lead manager since July 1, 2013,
co-manager since 2006
University of Wisconsin-Madison MBA Finance 1980
William B. Frels, co-manager since July 1, 2013
lead manager from 1992 – July 1, 2013
University of Wisconsin, BBA Finance 1962
General Information
Fund Symbol | | MAPOX | |
Net Asset Value (NAV) Per Share | | $ | 75.56 | | |
Expense Ratio | | | 0.72 | %1 | |
Portfolio Turnover Rate | | | 2.24 | % | |
Sales Charge | | | None2 | | |
Fund Inception Year | | | 1961 | | |
Portfolio Composition
Top Ten Common Stock Holdings
(Percent of Total Net Assets) 3
Medtronic, Inc. | | | 2.8 | % | |
U.S. Bancorp | | | 2.6 | | |
Emerson Electric Co. | | | 2.6 | | |
United Parcel Service, Inc., Class B | | | 2.5 | | |
Exxon Mobil Corp. | | | 2.5 | | |
Schlumberger, Ltd. | | | 2.4 | | |
Western Union Co. | | | 2.2 | | |
3M Co. | | | 2.0 | | |
Deluxe Corp. | | | 1.8 | | |
ConocoPhillips | | | 1.8 | | |
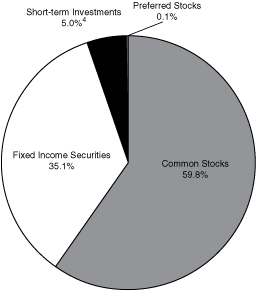
Portfolio Diversification
(Percent of Total Net Assets)
Fixed Income Securities 35.1% | |
Corporate Bonds | | | 28.3 | % | |
Federal Agency Obligations | | | 4.3 | | |
Asset Backed Securities | | | 1.8 | | |
Preferred Securities | | | 0.7 | | |
Common Stocks 59.8% | |
Financial | | | 11.9 | | |
Health Care | | | 9.1 | | |
Energy | | | 7.9 | | |
Technology | | | 6.2 | | |
Consumer Cyclical | | | 5.7 | | |
Basic Industries | | | 3.9 | | |
Capital Goods | | | 3.8 | | |
Diversified | | | 3.8 | | |
Consumer Staple | | | 2.6 | | |
Transportation | | | 2.5 | | |
Utilities | | | 2.4 | | |
Preferred Stocks 0.1% | | | 0.1 | | |
Short-term Investments 5.0%4 | | | 5.0 | | |
| | | | 100.0 | % | |
1 Ratio has been annualized for the six month period ended June 30, 2013.
2 Although the Fund is no-load, investment management fees and other expenses still apply.
3 All holdings in the portfolio are subject to change without notice and may or may not represent current or future portfolio composition. The mention of specific securities is not intended as a recommendation or offer for a particular security, nor is it intended to be a solicitation for the purchase or sale of any security.
4 Represents short-term investments and other assets and liabilities (net).
13
Mairs & Power Balanced Fund
SCHEDULE OF INVESTMENTS (unaudited) June 30, 2013
Par Value | | Security Description | | Fair Value | |
| | | FIXED INCOME SECURITIES 35.1% | |
| | | FEDERAL AGENCY OBLIGATIONS 4.3% | |
$ | 1,000,000 | | | Federal National Mortgage Association | | | 3.250 | % | | 03/27/28 | | $ | 949,278 | | |
| | 875,000 | | | Federal Farm Credit Bank | | | 3.450 | % | | 06/05/28 | | | 836,526 | | |
| | 1,000,000 | | | Federal Farm Credit Bank | | | 3.700 | % | | 06/20/28 | | | 963,889 | | |
| | 500,000 | | | Federal Farm Credit Bank | | | 4.200 | % | | 07/03/28 | | | 497,907 | | |
| | 1,084,000 | | | Federal Farm Credit Bank | | | 3.200 | % | | 04/24/30 | | | 1,006,924 | | |
| | 1,000,000 | | | Federal Home Loan Banks | | | 3.300 | % | | 05/07/32 | | | 924,457 | | |
| | 500,000 | | | Federal National Mortgage Association | | | 3.400 | % | | 09/27/32 | | | 469,850 | | |
| | 1,000,000 | | | Federal Home Loan Banks | | | 3.180 | % | | 12/06/32 | | | 908,351 | | |
| | 1,000,000 | | | Federal Home Loan Banks | | | 3.250 | % | | 01/18/33 | | | 939,664 | | |
| | 1,000,000 | | | Federal Farm Credit Bank | | | 3.480 | % | | 02/07/33 | | | 957,187 | | |
| | 1,000,000 | | | Federal Home Loan Banks | | | 3.230 | % | | 02/07/33 | | | 910,652 | | |
| | 2,000,000 | | | Federal Home Loan Banks | | | 3.500 | % | | 02/22/33 | | | 1,841,792 | | |
| | 1,000,000 | | | Federal Farm Credit Bank | | | 3.500 | % | | 02/28/33 | | | 943,379 | | |
| | 1,500,000 | | | Federal National Mortgage Association | | | 3.500 | % | | 03/07/33 | | | 1,432,102 | | |
| | 3,000,000 | | | Federal National Mortgage Association | | | 3.250 | % | | 03/25/33 | | | 2,773,581 | | |
| | 500,000 | | | Federal National Mortgage Association | | | 3.250 | % | | 04/29/33 | | | 459,197 | | |
| | 1,000,000 | | | Federal Home Loan Banks | | | 3.300 | % | | 05/09/33 | | | 900,899 | | |
| | 500,000 | | | Federal National Mortgage Association | | | 3.430 | % | | 05/27/33 | | | 481,570 | | |
| | 500,000 | | | Federal Home Loan Banks (h) | | | 3.730 | % | | 07/01/33 | | | 484,547 | | |
| | 840,000 | | | Federal Farm Credit Bank | | | 3.125 | % | | 12/05/33 | | | 750,531 | | |
| | 1,000,000 | | | Federal Home Loan Banks | | | 3.480 | % | | 10/09/37 | | | 917,675 | | |
| | | | 20,349,958 | | |
| | | CORPORATE BONDS 28.3% | |
| | | CONSUMER CYCLICAL 2.3% | |
| | 500,000 | | | Best Buy Co., Inc. (d) | | | 7.250 | % | | 07/15/13 | | | 500,625 | | |
| | 500,000 | | | Gannett Co., Inc. | | | 6.375 | % | | 09/01/15 | | | 540,000 | | |
| | 500,000 | | | Deluxe Corp. | | | 7.000 | % | | 03/15/19 | | | 527,500 | | |
| | 500,000 | | | Dell Inc. | | | 5.875 | % | | 06/15/19 | | | 506,540 | | |
| | 1,000,000 | | | Best Buy Co., Inc. | | | 5.500 | % | | 03/15/21 | | | 955,000 | | |
| | 500,000 | | | Dell Inc. | | | 4.625 | % | | 04/01/21 | | | 472,724 | | |
| | 2,200,000 | | | Darden Restaurants, Inc. | | | 3.350 | % | | 11/01/22 | | | 2,026,605 | | |
| | 500,000 | | | Staples, Inc. | | | 4.375 | % | | 01/12/23 | | | 484,710 | | |
| | 2,000,000 | | | Kohl's Corporation | | | 3.250 | % | | 02/01/23 | | | 1,850,160 | | |
| | 1,000,000 | | | Wyndam Worldwide | | | 3.900 | % | | 03/01/23 | | | 952,732 | | |
| | 500,000 | | | Hyatt Hotels Corporation | | | 3.375 | % | | 07/15/23 | | | 466,127 | | |
| | 1,000,000 | | | Metropolitan Opera | | | 4.349 | % | | 10/01/32 | | | 978,775 | | |
| | 500,000 | | | Altria Group, Inc. | | | 4.250 | % | | 08/09/42 | | | 426,677 | | |
| | | | 10,688,175 | | |
14
Mairs & Power Balanced Fund
SCHEDULE OF INVESTMENTS (unaudited) (continued) June 30, 2013
Par Value | | Security Description | | Fair Value | |
| | | FIXED INCOME SECURITIES (continued) | |
| | | CORPORATE BONDS (continued) | |
| | | FINANCIAL 13.7% | |
$ | 500,000 | | | SLM Corporation | | | 5.000 | % | | 10/01/13 | | $ | 502,500 | | |
| | 485,000 | | | Jefferson-Pilot Corp. | | | 4.750 | % | | 01/30/14 | | | 494,962 | | |
| | 415,000 | | | Liberty Mutual Group Inc. (e) | | | 5.750 | % | | 03/15/14 | | | 426,554 | | |
| | 500,000 | | | GATX Corp. | | | 8.750 | % | | 05/15/14 | | | 533,290 | | |
| | 500,000 | | | Genworth Life Financial Inc. | | | 5.750 | % | | 06/15/14 | | | 520,178 | | |
| | 500,000 | | | Citigroup Inc. | | | 5.000 | % | | 09/15/14 | | | 519,614 | | |
| | 500,000 | | | Regions Financial Corp. | | | 7.750 | % | | 11/10/14 | | | 540,290 | | |
| | 500,000 | | | SLM Corporation | | | 5.050 | % | | 11/14/14 | | | 511,250 | | |
| | 500,000 | | | General Motors Acceptance Corp. | | | 6.750 | % | | 12/01/14 | | | 526,250 | | |
| | 500,000 | | | Principal Life Global (e) | | | 5.050 | % | | 03/15/15 | | | 533,935 | | |
| | 500,000 | | | Marshall & Ilsley Corp. | | | 4.850 | % | | 06/16/15 | | | 528,712 | | |
| | 500,000 | | | TCF National Bank | | | 5.500 | % | | 02/01/16 | | | 513,316 | | |
| | 500,000 | | | Key Bank National Association | | | 5.450 | % | | 03/03/16 | | | 551,231 | | |
| | 500,000 | | | Symetra Financial Corp. (e) | | | 6.125 | % | | 04/01/16 | | | 545,061 | | |
| | 250,000 | | | Security Benefit Life Insurance (e) | | | 8.750 | % | | 05/15/16 | | | 285,796 | | |
| | 500,000 | | | Merrill Lynch & Co., Inc. | | | 6.050 | % | | 05/16/16 | | | 541,403 | | |
| | 500,000 | | | Torchmark Corp. | | | 6.375 | % | | 06/15/16 | | | 552,708 | | |
| | 500,000 | | | Western Union Co. | | | 5.930 | % | | 10/01/16 | | | 555,676 | | |
| | 500,000 | | | National City Bank | | | 5.250 | % | | 12/15/16 | | | 558,794 | | |
| | 500,000 | | | Marshall & Ilsley Corp. | | | 5.000 | % | | 01/17/17 | | | 534,326 | | |
| | 500,000 | | | Citigroup Inc. | | | 5.500 | % | | 02/15/17 | | | 546,785 | | |
| | 500,000 | | | White Mountain Group, Ltd. (a) (e) | | | 6.375 | % | | 03/20/17 | | | 546,658 | | |
| | 250,000 | | | Merrill Lynch & Co., Inc. | | | 5.700 | % | | 05/02/17 | | | 269,240 | | |
| | 500,000 | | | Royal Bank of Scotland Group, PLC (a) | | | 4.250 | % | | 07/15/17 | | | 513,845 | | |
| | 500,000 | | | Ford Motor Credit Co. | | | 3.000 | % | | 08/20/17 | | | 488,330 | | |
| | 500,000 | | | Comerica Incorporated | | | 5.200 | % | | 08/22/17 | | | 557,247 | | |
| | 500,000 | | | Bank of America Corp. | | | 6.000 | % | | 09/01/17 | | | 560,477 | | |
| | 500,000 | | | American Express Company | | | 6.000 | % | | 09/13/17 | | | 576,088 | | |
| | 250,000 | | | General Motors Acceptance Corp. | | | 7.250 | % | | 09/15/17 | | | 248,633 | | |
| | 500,000 | | | Bear Stearns Co., Inc. | | | 6.400 | % | | 10/02/17 | | | 576,723 | | |
| | 500,000 | | | The Hartford Financial Services Group Inc. | | | 4.000 | % | | 10/15/17 | | | 530,215 | | |
| | 500,000 | | | Prudential Financial Inc. | | | 6.000 | % | | 12/01/17 | | | 574,165 | | |
| | 500,000 | | | Barclays Bank, PLC (a) (e) | | | 6.050 | % | | 12/04/17 | | | 540,860 | | |
| | 1,000,000 | | | Morgan Stanley | | | 5.950 | % | | 12/28/17 | | | 1,109,541 | | |
| | 500,000 | | | Goldman Sachs Group, Inc. | | | 5.950 | % | | 01/18/18 | | | 559,420 | | |
| | 500,000 | | | Wachovia Corp. | | | 5.750 | % | | 02/01/18 | | | 575,882 | | |
| | 500,000 | | | United Health Group, Inc. | | | 6.000 | % | | 02/15/18 | | | 587,220 | | |
| | 250,000 | | | Lincoln National Corp. | | | 7.000 | % | | 03/15/18 | | | 290,037 | | |
15
Mairs & Power Balanced Fund
SCHEDULE OF INVESTMENTS (unaudited) (continued) June 30, 2013
Par Value | | Security Description | | Fair Value | |
| | | FIXED INCOME SECURITIES (continued) | |
| | | CORPORATE BONDS (continued) | |
| | | FINANCIAL (continued) | |
$ | 500,000 | | | SunTrust Banks, Inc. | | | 7.250 | % | | 03/15/18 | | $ | 599,694 | | |
| | 500,000 | | | Morgan Stanley | | | 6.625 | % | | 04/01/18 | | | 566,727 | | |
| | 1,000,000 | | | Jefferies Group, Inc. | | | 5.125 | % | | 04/13/18 | | | 1,045,002 | | |
| | 500,000 | | | Merrill Lynch & Co., Inc. | | | 6.875 | % | | 04/25/18 | | | 575,461 | | |
| | 500,000 | | | Provident Cos. | | | 7.000 | % | | 07/15/18 | | | 578,548 | | |
| | 500,000 | | | MetLife Inc. | | | 6.817 | % | | 08/15/18 | | | 605,654 | | |
| | 500,000 | | | Associated Banc-Corp | | | 9.250 | % | | 10/15/18 | | | 504,552 | | |
| | 1,000,000 | | | Ford Motor Credit Co. | | | 3.000 | % | | 12/20/18 | | | 962,170 | | |
| | 500,000 | | | The Hartford Financial Services Group Inc. | | | 6.000 | % | | 01/15/19 | | | 563,648 | | |
| | 500,000 | | | Royal Bank of Scotland Group, PLC (a) | | | 5.250 | % | | 02/15/19 | | | 534,973 | | |
| | 500,000 | | | BB&T Corp. | | | 6.850 | % | | 04/30/19 | | | 607,438 | | |
| | 250,000 | | | Berkley (WR) Corp. | | | 6.150 | % | | 08/15/19 | | | 279,433 | | |
| | 500,000 | | | Prospect Capital Corp. | | | 5.950 | % | | 09/15/19 | | | 490,131 | | |
| | 500,000 | | | Protective Life Corp. | | | 7.375 | % | | 10/15/19 | | | 605,802 | | |
| | 500,000 | | | Prospect Capital Corp. | | | 5.125 | % | | 11/15/19 | | | 482,448 | | |
| | 1,629,000 | | | Zions Bancorp | | | 4.150 | % | | 11/15/19 | | | 1,612,528 | | |
| | 500,000 | | | Credit Suisse (a) | | | 5.400 | % | | 01/14/20 | | | 541,721 | | |
| | 500,000 | | | Prospect Capital Corp. | | | 4.000 | % | | 01/15/20 | | | 468,124 | | |
| | 500,000 | | | Morgan Stanley | | | 5.500 | % | | 01/26/20 | | | 536,694 | | |
| | 500,000 | | | The Hartford Financial Services Group Inc. | | | 5.500 | % | | 03/30/20 | | | 552,977 | | |
| | 450,000 | | | Compass Bancshares, Inc. | | | 5.500 | % | | 04/01/20 | | | 454,545 | | |
| | 500,000 | | | Ford Motor Credit Co. | | | 3.450 | % | | 08/20/20 | | | 479,819 | | |
| | 537,000 | | | Manufacturers & Traders Trust Co. (d) | | | 5.585 | % | | 12/28/20 | | | 545,815 | | |
| | 500,000 | | | Wells Fargo & Co. (d) | | | 2.000 | % | | 01/31/21 | | | 491,866 | | |
| | 1,000,000 | | | Nationwide Financial Services (e) | | | 5.375 | % | | 03/25/21 | | | 1,088,609 | | |
| | 500,000 | | | Markel Corporation | | | 5.350 | % | | 06/01/21 | | | 539,454 | | |
| | 500,000 | | | Goldman Sachs Group, Inc. | | | 5.250 | % | | 07/27/21 | | | 534,949 | | |
| | 500,000 | | | Genworth Life Financial Inc. | | | 7.625 | % | | 09/24/21 | | | 581,040 | | |
| | 500,000 | | | AFLAC, Inc. | | | 4.000 | % | | 02/15/22 | | | 509,920 | | |
| | 500,000 | | | GATX Corp. | | | 4.750 | % | | 06/15/22 | | | 514,752 | | |
| | 1,000,000 | | | Block Financial LLC | | | 5.500 | % | | 11/01/22 | | | 1,004,898 | | |
| | 2,000,000 | | | RPM International, Inc. | | | 3.450 | % | | 11/15/22 | | | 1,865,844 | | |
| | 500,000 | | | Wells Fargo & Co. | | | 3.450 | % | | 02/13/23 | | | 477,517 | | |
| | 1,500,000 | | | Assurant, Inc. | | | 4.000 | % | | 03/15/23 | | | 1,452,032 | | |
| | 1,000,000 | | | GATX Corp. | | | 3.900 | % | | 03/30/23 | | | 976,293 | | |
| | 1,000,000 | | | Markel Corporation | | | 3.625 | % | | 03/30/23 | | | 952,171 | | |
| | 2,000,000 | | | Fidelity National Information Services, Inc. | | | 3.500 | % | | 04/15/23 | | | 1,806,338 | | |
| | 500,000 | | | Citigroup Inc. | | | 3.500 | % | | 05/15/23 | | | 449,066 | | |
16
Mairs & Power Balanced Fund
SCHEDULE OF INVESTMENTS (unaudited) (continued) June 30, 2013
Par Value | | Security Description | | Fair Value | |
| | | FIXED INCOME SECURITIES (continued) | |
| | | CORPORATE BONDS (continued) | |
| | | FINANCIAL (continued) | |
$ | 500,000 | | | CNA Financial Corp. | | | 7.250 | % | | 11/15/23 | | $ | 596,457 | | |
| | 500,000 | | | Pacific Life Insurance Co. (e) | | | 7.900 | % | | 12/30/23 | | | 649,321 | | |
| | 250,000 | | | Liberty Mutual Insurance Co. (e) | | | 8.500 | % | | 05/15/25 | | | 314,001 | | |
| | 500,000 | | | Citigroup Inc. | | | 5.200 | % | | 01/25/27 | | | 503,569 | | |
| | 250,000 | | | Provident Cos. | | | 7.250 | % | | 03/15/28 | | | 286,084 | | |
| | 1,000,000 | | | JP Morgan Chase & Co. (d) | | | 3.000 | % | | 03/21/28 | | | 872,294 | | |
| | 1,000,000 | | | JP Morgan Chase & Co. (d) | | | 3.000 | % | | 03/22/28 | | | 959,450 | | |
| | 1,000,000 | | | Royal Bank of Canada (a) | | | 3.000 | % | | 05/10/28 | | | 939,313 | | |
| | 500,000 | | | Farmers Exchange Capital (e) | | | 7.050 | % | | 07/15/28 | | | 582,016 | | |
| | 500,000 | | | Bank of America Corp. (d) | | | 5.500 | % | | 03/29/30 | | | 510,353 | | |
| | 500,000 | | | Goldman Sachs Group, Inc. | | | 4.250 | % | | 11/15/30 | | | 463,879 | | |
| | 500,000 | | | Goldman Sachs Group, Inc. | | | 4.000 | % | | 02/15/31 | | | 472,257 | | |
| | 500,000 | | | General Electric Cap Corp. | | | 3.500 | % | | 05/15/32 | | | 463,505 | | |
| | 500,000 | | | General Electric Cap Corp. | | | 4.000 | % | | 09/17/32 | | | 459,643 | | |
| | 500,000 | | | Goldman Sachs Group, Inc. | | | 4.300 | % | | 12/15/32 | | | 477,809 | | |
| | 1,000,000 | | | JPMorgan Chase & Co. (d) | | | 3.250 | % | | 01/31/33 | | | 930,732 | | |
| | 649,000 | | | Lloyds TSB Bank PLC (a) (d) | | | 3.400 | % | | 01/31/33 | | | 601,720 | | |
| | 2,000,000 | | | General Electric Cap Corp. | | | 4.000 | % | | 02/14/33 | | | 1,902,300 | | |
| | 1,500,000 | | | Western Union Co. | | | 6.200 | % | | 11/17/36 | | | 1,451,916 | | |
| | 500,000 | | | Barclays Bank, PLC (a) (d) | | | 4.000 | % | | 10/09/37 | | | 472,498 | | |
| | 1,000,000 | | | Berkshire Hathaway Finance Corporation | | | 4.400 | % | | 05/15/42 | | | 922,809 | | |
| | 500,000 | | | MetLife Inc. | | | 4.125 | % | | 08/13/42 | | | 444,684 | | |
| | 500,000 | | | Swiss Re Treasury (e) | | | 4.250 | % | | 12/06/42 | | | 439,933 | | |
| | 500,000 | | | Pacific Life Corp. (e) | | | 5.125 | % | | 01/30/43 | | | 453,358 | | |
| | 500,000 | | | Berkshire Hathaway Finance Corporation | | | 4.300 | % | | 05/15/43 | | | 454,116 | | |
| | 500,000 | | | Principal Financial Group | | | 4.350 | % | | 05/15/43 | | | 458,021 | | |
| | | | 64,447,903 | | |
| | | INDUSTRIAL 10.7% | |
| | 250,000 | | | Willamette Industries | | | 7.125 | % | | 07/22/13 | | | 250,426 | | |
| | 500,000 | | | Ingersoll-Rand Co., Ltd. (a) | | | 6.000 | % | | 08/15/13 | | | 503,160 | | |
| | 250,000 | | | Maytag Corp. | | | 5.000 | % | | 05/15/15 | | | 265,175 | | |
| | 340,000 | | | Johnson Controls, Inc. | | | 5.500 | % | | 01/15/16 | | | 373,554 | | |
| | 500,000 | | | International Paper Co. | | | 5.250 | % | | 04/01/16 | | | 542,830 | | |
| | 500,000 | | | SUPERVALU Inc. | | | 8.000 | % | | 05/01/16 | | | 538,125 | | |
| | 500,000 | | | Anadarko Petroleum Corp. | | | 5.950 | % | | 09/15/16 | | | 560,837 | | |
| | 500,000 | | | Valspar Corp. | | | 6.050 | % | | 05/01/17 | | | 558,715 | | |
| | 500,000 | | | Broadridge Financial Solutions, Inc. | | | 6.125 | % | | 06/01/17 | | | 552,328 | | |
| | 525,000 | | | Cargill, Inc. (e) | | | 6.000 | % | | 11/27/17 | | | 611,029 | | |
17
Mairs & Power Balanced Fund
SCHEDULE OF INVESTMENTS (unaudited) (continued) June 30, 2013
Par Value | | Security Description | | Fair Value | |
| | | FIXED INCOME SECURITIES (continued) | |
| | | CORPORATE BONDS (continued) | |
| | | INDUSTRIAL (continued) | |
$ | 500,000 | | | Cliffs Natural Resources, Inc. | | | 3.950 | % | | 01/15/18 | | $ | 477,704 | | |
| | 250,000 | | | ServiceMaster Co. | | | 7.100 | % | | 03/01/18 | | | 241,250 | | |
| | 1,000,000 | | | Avon Products, Inc. | | | 4.200 | % | | 07/15/18 | | | 1,016,659 | | |
| | 250,000 | | | ConocoPhillips | | | 6.650 | % | | 07/15/18 | | | 299,661 | | |
| | 350,000 | | | PPG Industries | | | 7.400 | % | | 08/15/19 | | | 423,642 | | |
| | 500,000 | | | MASCO Corp. | | | 7.125 | % | | 03/15/20 | | | 557,500 | | |
| | 1,000,000 | | | Safeway, Inc. | | | 3.950 | % | | 08/15/20 | | | 980,608 | | |
| | 500,000 | | | Cliffs Natural Resources, Inc. | | | 4.800 | % | | 10/01/20 | | | 450,698 | | |
| | 500,000 | | | Hewlett-Packard Company | | | 3.750 | % | | 12/01/20 | | | 483,979 | | |
| | 1,000,000 | | | Cliffs Natural Resources, Inc. | | | 4.875 | % | | 04/01/21 | | | 906,304 | | |
| | 500,000 | | | Pentair Ltd. (a) | | | 5.000 | % | | 05/15/21 | | | 531,597 | | |
| | 500,000 | | | Hewlett-Packard Company | | | 4.300 | % | | 06/01/21 | | | 488,889 | | |
| | 500,000 | | | Carpenter Technology | | | 5.200 | % | | 07/15/21 | | | 515,557 | | |
| | 500,000 | | | Safeway, Inc. | | | 4.750 | % | | 12/01/21 | | | 509,417 | | |
| | 500,000 | | | Idex Corporation | | | 4.200 | % | | 12/15/21 | | | 504,564 | | |
| | 1,000,000 | | | FREEPORT-McMoRan Copper & Gold Inc. | | | 3.550 | % | | 03/01/22 | | | 908,357 | | |
| | 500,000 | | | MASCO Corp. | | | 5.950 | % | | 03/15/22 | | | 525,000 | | |
| | 1,000,000 | | | Newmont Mining Corp | | | 3.500 | % | | 03/15/22 | | | 855,735 | | |
| | 1,000,000 | | | Domtar Corp. | | | 4.400 | % | | 04/01/22 | | | 969,681 | | |
| | 500,000 | | | URS Corp. (d) (e) | | | 5.000 | % | | 04/01/22 | | | 515,947 | | |
| | 1,500,000 | | | Murphy Oil Corp. | | | 4.000 | % | | 06/01/22 | | | 1,432,830 | | |
| | 500,000 | | | Whirlpool Corporation | | | 4.700 | % | | 06/01/22 | | | 522,256 | | |
| | 500,000 | | | Penske Truck Leasing Co., L.P. / PTL Finance Corp. (e) | | | 4.875 | % | | 07/11/22 | | | 517,590 | | |
| | 1,000,000 | | | Hewlett-Packard Company | | | 4.050 | % | | 09/15/22 | | | 950,535 | | |
| | 2,025,000 | | | Fiserv, Inc. | | | 3.500 | % | | 10/01/22 | | | 1,921,974 | | |
| | 2,000,000 | | | Transocean Ltd. (a) | | | 3.800 | % | | 10/15/22 | | | 1,905,104 | | |
| | 500,000 | | | Murphy Oil Corp. | | | 3.700 | % | | 12/01/22 | | | 463,814 | | |
| | 1,000,000 | | | Autodesk, Inc. | | | 3.600 | % | | 12/15/22 | | | 954,465 | | |
| | 1,500,000 | | | Sunoco Logistics Partners | | | 3.450 | % | | 01/15/23 | | | 1,393,518 | | |
| | 2,500,000 | | | Williams Companies | | | 3.700 | % | | 01/15/23 | | | 2,322,708 | | |
| | 1,445,000 | | | Boardwalk Pipelines, LP | | | 3.375 | % | | 02/01/23 | | | 1,330,368 | | |
| | 1,500,000 | | | Motorola Solutions, Inc. | | | 3.500 | % | | 03/01/23 | | | 1,414,034 | | |
| | 500,000 | | | Avon Products, Inc. | | | 5.000 | % | | 03/15/23 | | | 496,994 | | |
| | 1,000,000 | | | Reliance Steel & Aluminum Co. | | | 4.500 | % | | 04/15/23 | | | 948,376 | | |
| | 1,000,000 | | | Barrick Gold Corporation (a) (e) | | | 4.100 | % | | 05/01/23 | | | 835,456 | | |
| | 500,000 | | | Ingersoll-Rand Co., Ltd. (a) (e) | | | 4.250 | % | | 06/15/23 | | | 496,860 | | |
| | 500,000 | | | Wyeth | | | 6.450 | % | | 02/01/24 | | | 619,032 | | |
| | 865,000 | | | Union Carbide Corp. | | | 7.500 | % | | 06/01/25 | | | 1,012,321 | | |
18
Mairs & Power Balanced Fund
SCHEDULE OF INVESTMENTS (unaudited) (continued) June 30, 2013
Par Value | | Security Description | | Fair Value | |
| | | FIXED INCOME SECURITIES (continued) | |
| | | CORPORATE BONDS (continued) | |
| | | INDUSTRIAL (continued) | |
$ | 500,000 | | | Toro Co. | | | 7.800 | % | | 06/15/27 | | $ | 606,685 | | |
| | 1,949,000 | | | Land O'Lakes Capital Trust I (e) | | | 7.450 | % | | 03/15/28 | | | 1,910,020 | | |
| | 500,000 | | | Global Marine | | | 7.000 | % | | 06/01/28 | | | 532,573 | | |
| | 1,000,000 | | | Eaton Corporation (e) | | | 4.000 | % | | 11/02/32 | | | 934,983 | | |
| | 2,500,000 | | | Intel Corp. | | | 4.000 | % | | 12/15/32 | | | 2,321,572 | | |
| | 2,000,000 | | | Comcast Corporation | | | 4.250 | % | | 01/15/33 | | | 1,913,616 | | |
| | 1,000,000 | | | Pitney Bowes | | | 5.250 | % | | 01/15/37 | | | 1,044,390 | | |
| | 1,000,000 | | | Alcoa Inc. | | | 5.950 | % | | 02/01/37 | | | 891,443 | | |
| | 1,000,000 | | | Newmont Mining Corp. | | | 4.875 | % | | 03/15/42 | | | 770,995 | | |
| | 1,000,000 | | | Cargill, Inc. (e) | | | 4.100 | % | | 11/01/42 | | | 890,823 | | |
| | 590,000 | | | Eaton Corporation (e) | | | 4.150 | % | | 11/02/42 | | | 529,346 | | |
| | 500,000 | | | Murphy Oil Corp. | | | 5.125 | % | | 12/01/42 | | | 436,954 | | |
| | 500,000 | | | Lockheed Martin Corporation | | | 4.070 | % | | 12/15/42 | | | 436,559 | | |
| | 500,000 | | | Apache Corporation | | | 4.250 | % | | 01/15/44 | | | 446,104 | | |
| | | | 50,123,226 | | |
| | | UTILITIES 1.6% | |
| | 500,000 | | | Commonwealth Edison Co. | | | 6.150 | % | | 09/15/17 | | | 582,896 | | |
| | 250,000 | | | Vectren Utility Holdings, Inc. | | | 5.750 | % | | 08/01/18 | | | 288,351 | | |
| | 250,000 | | | South Jersey Gas Co. | | | 7.125 | % | | 10/22/18 | | | 302,070 | | |
| | 250,000 | | | United Utilities PLC (a) | | | 5.375 | % | | 02/01/19 | | | 271,544 | | |
| | 250,000 | | | Verizon Communications, Inc. | | | 6.350 | % | | 04/01/19 | | | 296,594 | | |
| | 500,000 | | | CenturyLink, Inc. | | | 6.150 | % | | 09/15/19 | | | 520,000 | | |
| | 1,000,000 | | | The ADT Corporation | | | 3.500 | % | | 07/15/22 | | | 919,548 | | |
| | 2,000,000 | | | Arrow Electronics, Inc. | | | 4.500 | % | | 03/01/23 | | | 1,967,834 | | |
| | 1,000,000 | | | National Rural Utilites Cooperative Finance Corporation | | | 3.000 | % | | 11/15/26 | | | 954,132 | | |
| | 500,000 | | | U S West Capital Funding Inc. | | | 6.875 | % | | 07/15/28 | | | 480,000 | | |
| | 550,000 | | | U S West Capital Funding Inc. | | | 6.875 | % | | 09/15/33 | | | 532,125 | | |
| | 500,000 | | | Entergy Gulf States, Inc. | | | 6.180 | % | | 03/01/35 | | | 500,058 | | |
| | | | 7,615,152 | | |
| | | TOTAL CORPORATE BONDS | | | 132,874,456 | | |
| | | ASSET BACKED SECURITIES 1.8% | |
| | 66,656 | | | GATX Corp. | | | 7.500 | % | | 02/28/15 | | | 69,572 | | |
| | 500,000 | | | American Airlines, Inc. (e) (f) | | | 7.500 | % | | 03/15/16 | | | 581,250 | | |
| | 500,000 | | | Delta Air Lines 2010-2 Class B Pass Thru Trust (e) | | | 6.750 | % | | 05/23/17 | | | 523,150 | | |
| | 415,062 | | | Continental Airlines 2009-1 Class A Pass Through Trust | | | 9.000 | % | | 01/08/18 | | | 476,284 | | |
19
Mairs & Power Balanced Fund
SCHEDULE OF INVESTMENTS (unaudited) (continued) June 30, 2013
Par Value/Shares | | Security Description | | Fair Value | |
| | | FIXED INCOME SECURITIES (continued) | |
| | | ASSET BACKED SECURITIES (continued) | |
$ | 428,085 | | | American Airlines Pass Through Trust 2011-1 Pass
Through Cert (e) | | | 7.000 | % | | 07/31/19 | | $ | 447,349 | | |
| | 274,938 | | | Continental Airlines 1999-1 Class B Pass Through Trust | | | 6.795 | % | | 02/02/20 | | | 283,873 | | |
| | 815,877 | | | Continental Airlines 2010-1 Class B Pass Through Trust | | | 6.000 | % | | 07/12/20 | | | 828,116 | | |
| | 401,879 | | | Delta Airlines 2011-1 Pass Thru Cert | | | 5.300 | % | | 10/15/20 | | | 443,071 | | |
| | 845,778 | | | America West Airlines, Inc. | | | 8.057 | % | | 01/02/22 | | | 900,753 | | |
| | 901,716 | | | American Airlines 2011-1 Pass Through Trust | | | 5.250 | % | | 07/31/22 | | | 962,582 | | |
| | 206,153 | | | Continental Airlines 2007-1 Class A Pass Through Trust | | | 5.983 | % | | 10/19/23 | | | 222,748 | | |
| | 394,236 | | | Southwest Airlines Co. | | | 6.150 | % | | 02/01/24 | | | 456,329 | | |
| | 888,301 | | | US Airways 2010-1 Class A Pass Through Cert | | | 6.250 | % | | 10/22/24 | | | 943,820 | | |
| | 455,259 | | | US Airways 2011-1A PTT Equipment Trust Certificate | | | 7.125 | % | | 04/22/25 | | | 512,167 | | |
| | 1,000,000 | | | US Airways 2013-1A Pass Through Trust | | | 3.950 | % | | 05/15/27 | | | 960,000 | | |
| | | | 8,611,064 | | |
| | | PREFERRED SECURITIES 0.7% | |
| | 20,000 | | | Pitney Bowes | | | 5.250 | % | | 11/27/22 | | | 507,000 | | |
| | 20,000 | | | Stifel Financial | | | 5.375 | % | | 12/31/22 | | | 512,600 | | |
| | 10,000 | | | Raymond James Financial Inc. | | | 6.900 | % | | 03/15/42 | | | 264,700 | | |
| | 20,000 | | | Protective Life Corp. | | | 6.000 | % | | 09/01/42 | | | 498,800 | | |
| | 20,000 | | | Selective Insurance Group (b) | | | 5.875 | % | | 02/09/43 | | | 461,200 | | |
| | 40,000 | | | Berkley (WR) Corp. (b) | | | 5.625 | % | | 04/30/53 | | | 934,400 | | |
| | 10,000 | | | Nextera Energy Capital | | | 5.700 | % | | 03/01/72 | | | 242,300 | | |
| | | | 3,421,000 | | |
| | TOTAL FIXED INCOME SECURITIES
(cost $164,986,837) | | $ | 165,256,478 | | |
| | | COMMON STOCKS 59.8% | |
| | | BASIC INDUSTRIES 3.9% | |
| | 85,000 | | | Bemis Co., Inc. | | | | | | | 3,326,900 | | |
| | 14,000 | | | Ecolab, Inc. | | | | | | | 1,192,660 | | |
| | 154,000 | | | H.B. Fuller Co. | | | | | | | 5,822,740 | | |
| | 120,000 | | | Valspar Corp. | | | | | | | 7,760,400 | | |
| | | | 18,102,700 | | |
| | | CAPITAL GOODS 3.8% | |
| | 80,000 | | | Graco, Inc. | | | | | | | 5,056,800 | | |
| | 23,000 | | | Ingersoll-Rand Co., Ltd. (a) | | | | | | | 1,276,960 | | |
| | 91,000 | | | MTS Systems Corp. | | | | | | | 5,150,600 | | |
| | 108,000 | | | Pentair Ltd. (a) | | | | | | | 6,230,520 | | |
| | | | 17,714,880 | | |
20
Mairs & Power Balanced Fund
SCHEDULE OF INVESTMENTS (unaudited) (continued) June 30, 2013
Shares | | Security Description | | Fair Value | |
| | | COMMON STOCKS (continued) | |
| | | CONSUMER CYCLICAL 5.7% | |
| | 250,000 | | | Deluxe Corp. | | | | | | $ | 8,662,500 | | |
| | 15,000 | | | Genuine Parts Co. | | | | | | | 1,171,050 | | |
| | 74,000 | | | Home Depot, Inc. | | | | | | | 5,732,780 | | |
| | 30,000 | | | Sturm, Ruger & Co., Inc. | | | | | | | 1,441,200 | | |
| | 115,000 | | | Target Corp. | | | | | | | 7,918,900 | | |
| | 40,000 | | | Toro Co. | | | | | | | 1,816,400 | | |
| | | | 26,742,830 | | |
| | | CONSUMER STAPLE 2.6% | |
| | 77,000 | | | General Mills, Inc. | | | | | | | 3,736,810 | | |
| | 15,000 | | | The Hershey Co. | | | | | | | 1,339,200 | | |
| | 120,000 | | | Hormel Foods Corp. | | | | | | | 4,629,600 | | |
| | 26,000 | | | Kimberly-Clark Corp. | | | | | | | 2,525,640 | | |
| | | | 12,231,250 | | |
| | | DIVERSIFIED 3.8% | |
| | 86,000 | | | 3M Co. | | | | | | | 9,404,100 | | |
| | 360,000 | | | General Electric Co. | | | | | | | 8,348,400 | | |
| | | | 17,752,500 | | |
| | | ENERGY 7.9% | |
| | 58,000 | | | BP p.l.c. ADR (g) | | | | | | | 2,420,920 | | |
| | 140,000 | | | ConocoPhillips | | | | | | | 8,470,000 | | |
| | 131,000 | | | Exxon Mobil Corp. | | | | | | | 11,835,850 | | |
| | 50,000 | | | Murphy Oil Corp. | | | | | | | 3,044,500 | | |
| | 155,000 | | | Schlumberger, Ltd. (a) | | | | | | | 11,107,300 | | |
| | | | 36,878,570 | | |
| | | FINANCIAL 11.9% | |
| | 26,000 | | | American Express Co. | | | | | | | 1,943,760 | | |
| | 391,000 | | | Associated Banc-Corp. | | | | | | | 6,080,050 | | |
| | 59,000 | | | Bank of America Corp. | | | | | | | 758,740 | | |
| | 103,000 | | | JPMorgan Chase & Co. | | | | | | | 5,437,370 | | |
| | 20,000 | | | Lincoln National Corp. | | | | | | | 729,400 | | |
| | 205,000 | | | Principal Financial Group | | | | | | | 7,677,250 | | |
| | 118,000 | | | TCF Financial Corp. | | | | | | | 1,673,240 | | |
| | 35,000 | | | The Travelers Cos., Inc. | | | | | | | 2,797,200 | | |
| | 335,000 | | | U.S. Bancorp | | | | | | | 12,110,250 | | |
| | 156,000 | | | Wells Fargo & Co. | | | | | | | 6,438,120 | | |
| | 600,000 | | | Western Union Co. | | | | | | | 10,266,000 | | |
| | | | 55,911,380 | | |
21
Mairs & Power Balanced Fund
SCHEDULE OF INVESTMENTS (unaudited) (continued) June 30, 2013
Shares | | Security Description | | Fair Value | |
| | | COMMON STOCKS (continued) | |
| | | HEALTH CARE 9.1% | |
| | 110,000 | | | Abbott Laboratories | | | | | | $ | 3,836,800 | | |
| | 80,000 | | | Abbvie, Inc. | | | | | | | 3,307,200 | | |
| | 85,000 | | | Baxter International Inc. | | | | | | | 5,887,950 | | |
| | 72,500 | | | Bristol-Myers Squibb Co. | | | | | | | 3,240,025 | | |
| | 60,000 | | | Eli Lilly & Co. | | | | | | | 2,947,200 | | |
| | 73,000 | | | Johnson & Johnson | | | | | | | 6,267,780 | | |
| | 252,500 | | | Medtronic, Inc. | | | | | | | 12,996,175 | | |
| | 150,000 | | | Pfizer Inc. | | | | | | | 4,201,500 | | |
| | | | 42,684,630 | | |
| | | TECHNOLOGY 6.2% | |
| | 420,000 | | | Corning Inc. | | | | | | | 5,976,600 | | |
| | 220,000 | | | Emerson Electric Co. | | | | | | | 11,998,800 | | |
| | 90,000 | | | Honeywell International Inc. | | | | | | | 7,140,600 | | |
| | 20,000 | | | International Business Machines Corp. | | | | | | | 3,822,200 | | |
| | | | 28,938,200 | | |
| | | TRANSPORTATION 2.5% | |
| | 137,000 | | | United Parcel Service, Inc., Class B | | | | | | | 11,847,760 | | |
| | | UTILITIES 2.4% | |
| | 50,000 | | | ALLETE, Inc. | | | | | | | 2,492,500 | | |
| | 160,000 | | | MDU Resources Group, Inc. | | | | | | | 4,145,600 | | |
| | 170,000 | | | Xcel Energy Inc. | | | | | | | 4,817,800 | | |
| | | | 11,455,900 | | |
| | | TOTAL COMMON STOCKS
(cost $192,987,586) | | $ | 280,260,600
| | |
| | | PREFERRED STOCKS 0.1% | |
| | | UTILITIES 0.1% | |
| | 10,000 | | | SCE Trust I | | | | | | | | | 236,000 | | |
| | TOTAL PREFERRED STOCKS
(cost $250,000) | | $ | 236,000 | | |
| | | SHORT-TERM INVESTMENTS 4.6% | |
| | 21,779,764 | | | First American Prime Obligations Fund, Class Z, 0.00% (c)
(cost $21,779,764) | |
| | | | | | $ | 21,779,764
| | |
| | | TOTAL INVESTMENTS 99.6%
(cost $380,004,187) | |
| |
| | $ | 467,532,842
| | |
| | | OTHER ASSETS AND LIABILITIES (NET) 0.4% | | | | | | | | | | | 1,984,407 | | |
| | | TOTAL NET ASSETS 100.0% | | | | | | | | | | $ | 469,517,249 | | |
22
Mairs & Power Balanced Fund
SCHEDULE OF INVESTMENTS (unaudited) (continued) June 30, 2013
(a) Foreign security denominated in U.S. dollars. As of June 30, 2013, these securities represented $27,850,089 or 5.9% of total net assets.
(b) Non-income producing.
(c) The rate quoted is the annualized seven-day effective yield as of June 30, 2013.
(d) Step Bonds – Securities for which the coupon rate of interest will adjust on specified future date(s). The rate disclosed represents the coupon rate in effect as of June 30, 2013.
(e) Securities exempt from registration under Rule 144A of the Securities Act of 1933. These securities may be resold in transactions exempt from registration, normally to qualified institutional buyers. These securities have been determined to be liquid under guidelines established by the Funds' Board of Trustees. As of June 30, 2013, these securities represented $15,199,905 or 3.2% of total net assets.
(f) Non-income producing – Issue is in default.
(g) American Depositary Receipt.
(h) When-issued security. As of June 30, 2013, these securities represented $484,547 or 0.1% of total net assets.
See accompanying Notes to Financial Statements.
23
MAIRS & POWER SMALL CAP FUND (unaudited)
To Our Shareholders: July 31, 2013
The Small Cap Fund posted a solid first half, benefiting from a very strong first quarter and an overall positive market environment. Small caps continued to outperform large caps in the second quarter and extended their lead year-to-date. The Fund was up 14.35% for the first half of the year, compared to 16.19% for the benchmark Standard & Poor's Small Cap 600 Index and 14.45% for the Lipper Small Cap Core Funds Index of peers. After six quarters of very strong relative performance since its inception, the Fund lagged its benchmark and peers in the second quarter, posting a negative 1.02% return, compared to a positive 3.92% and 2.32% return for the S&P 600 and Lipper indices, respectively.
For the first half, small cap stocks stood slightly above their historical valuation levels compared with large caps on a forward looking price-to-earnings basis. This slight premium appears justified, however, due to better underlying revenue growth in the small caps. We remain comfortable in the sector and believe that the small cap universe remains a good place to invest in good companies.
Stock selection was key to performance in the first half, overcoming potential negative impacts from an underweight position in the relatively strong consumer discretionary sector and overweighting the weaker industrial sector. Stock selection also drove positive relative performance in financials and materials while it was a negative in health care and information technology sectors.
MAIRS & POWER SMALL CAP FUND
Top Performers | |
| Second Quarter (4/1/13 – 6/30/13) | | First Half (1/2/13 – 6/30/13) | |
PROTO LABS INC | | | 32.32 | % | | PROTO LABS INC | | | 64.81 | % | |
SPS COMM INC | | | 28.90 | % | | ADVENT SOFTWARE INC | | | 63.99 | % | |
ADVENT SOFTWARE INC | | | 25.35 | % | | CABELAS INC | | | 55.11 | % | |
CHART INDUSTRIES INC | | | 17.60 | % | | SPS COMM INC | | | 47.57 | % | |
PRIVATEBANCORP INC | | | 12.36 | % | | CHART INDUSTRIES INC | | | 41.09 | % | |
Weak Performers | |
| Second Quarter (4/1/13 – 6/30/13) | | First Half (1/2/13 – 6/30/13) | |
LANDAUER INC | | | -14.31 | % | | VASCULAR SOLUTIONS INC | | | -6.90 | % | |
CRAY INC | | | -15.38 | % | | DAKTRONICS INC | | | -7.40 | % | |
DELUXE CORP | | | -16.30 | % | | NVE CORP | | | -15.62 | % | |
BADGER METER INC | | | -16.76 | % | | TITAN MACHINERY INC | | | -20.53 | % | |
NVE CORP | | | -17.02 | % | | LANDAUER INC | | | -21.08 | % | |
Past performance is no guarantee of future results.
Four companies were top performers for both the second quarter and first half (SEE TABLE): Protolabs (rapid prototyping), Advent Software (asset management software), SPS Commerce (supply chain management) and Chart Industries (specialty manufacturer). Sporting goods retailer Cabelas also was a top performer in the first half, built on a very strong first quarter. PrivateBancorp (small business banking) had a strong second quarter. Two companies were weak in both periods, Landauer (radiation detection products) and NVE (nano-tech sensor manufacturing) while Titan (ag and construction equipment distributor), Daktronics (LED displays) and Vascular Solutions (bio-medical) were weak in the first half. Badger Meter (water meter manufacturer), Deluxe Corp. (business services) and Cray (supercomputers) were poor performers in the second quarter.
24
MAIRS & POWER SMALL CAP FUND (unaudited) (continued)
Looking at the specifics behind a few of the names – at NVE, we see big opportunities in new applications for its technology which the company has been slow to develop thus far. Badger Meter disappointed in the quarter as municipalities continued to delay upgrading traditional water meters to newer radio transmitter meters. While Deluxe Corp. and Cray have corrected a bit following strong price run ups in 2012 and the first quarter of 2013, both companies are still up for the first half.
Andrew R. Adams
Vice President and Lead Manager
The Funds' investment objectives, risks, charges and expenses must be considered carefully before investing. The summary prospectuses or full prospectus contains this and other important information about the Funds, and they may be obtained by calling Shareholder Services at (800) 304-7404, or visiting www.mairsandpower.com. Read the summary prospectuses or full prospectus carefully before investing.
All investments have risks. The Small Cap Fund is designed for long-term investors. Equity investments are subject to market fluctuations, and the Fund's share price can fall because of weakness in the broad market, a particular industry, or specific holdings. Investments in small and midcap companies generally are more volatile. International investing risks include among others political, social or economic instability, difficulty in predicting international trade patterns, taxation and foreign trading practices, and greater fluctuations in price than United States corporations. The Fund may invest in initial public offerings by small cap companies, which can involve greater risks than investments in companies that are already publicly traded.
The price/earnings ratio is a valuation of a company's current share price compared to its per-share earnings.
Lipper Small Cap Core Funds Index is an unmanaged index considered representative of small-cap core funds tracked by Lipper. It is not possible to invest directly in an index.
25
Mairs & Power Small Cap Fund
PERFORMANCE INFORMATION (unaudited) June 30, 2013
Investment performance since commencement of operations (through June 30, 2013)
This chart illustrates the performance of a hypothetical $10,000 investment made in the Fund since commencement of operations.
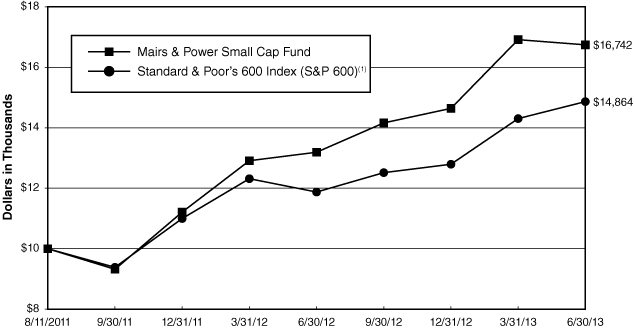
Average annual total returns for periods ended June 30, 2013
| | | 3 Month(2) | | 6 Month(2) | | 1 Year | | Since Inception(3) | |
Mairs & Power Small Cap Fund | | | -1.02 | % | | | 14.35 | % | | | 26.93 | % | | | 31.39 | % | |
S&P Small Cap 600(1) | | | 3.92 | % | | | 16.19 | % | | | 25.18 | % | | | 23.36 | % | |
Performance data quoted represents past performance and does not guarantee future results. All performance information shown includes the reinvestment of dividend and capital gain distributions, but does not reflect the deduction of taxes that a shareholder would pay on Fund distributions or the redemption of Fund shares. The investment return and principal value of an investment will fluctuate so that an investor's shares, when redeemed, may be worth more or less than their original cost. Current performance of the Fund may be lower or higher than the performance quoted. For the most recent month-end performance figures, visit the Fund's website at www.mairsandpower.com or call Shareholder Services at (800) 304-7404.
(1) The S&P Small Cap 600 is an index of small company stocks managed by Standard & Poor's that covers a broad range of small cap stocks in the United States. The index is weighted according to market capitalization and covers about 3-4% of the total market for equities in the United States. It is not possible to invest directly in an index.
(2) Periods less than one year are not annualized.
(3) Since inception performance is as of August 11, 2011, which is the offering date of the Small Cap Fund.
26
Mairs & Power Small Cap Fund
FUND INFORMATION (unaudited) June 30, 2013
Portfolio Manager
Andrew R. Adams, lead manager since 2011
University of Wisconsin-Madison, BBA Finance
and Mathematics 1994, MS Finance 1997
General Information
Fund Symbol | | MSCFX | |
Net Asset Value (NAV) Per Share | | $ | 16.57 | | |
Expense Ratio | | | 1.23 | %1,2 | |
Portfolio Turnover Rate | | | 33.32 | % | |
Sales Charge | | | None3 | | |
Fund Inception Year | | | 2011 | | |
Portfolio Composition

Top Ten Portfolio Holdings
(Percent of Total Net Assets) 4
Associated Banc-Corp. | | | 3.8 | % | |
ALLETE, Inc. | | | 3.5 | | |
MDU Resources Group, Inc. | | | 3.4 | | |
Badger Meter, Inc. | | | 3.0 | | |
Deluxe Corp. | | | 3.0 | | |
Wintrust Financial Corporation | | | 3.0 | | |
PrivateBancorp, Inc. | | | 2.9 | | |
Snap-on Incorporated | | | 2.8 | | |
NVE Corporation | | | 2.8 | | |
Cray Inc. | | | 2.7 | | |
Portfolio Diversification
(Percent of Total Net Assets)
Common Stocks 97.0% | |
Capital Goods | | | 17.4 | % | |
Financial | | | 16.2 | | |
Consumer Cyclical | | | 12.4 | | |
Basic Industries | | | 12.0 | | |
Technology | | | 12.0 | | |
Health Care | | | 8.5 | | |
Utilities | | | 6.9 | | |
Energy | | | 6.0 | | |
Transportation | | | 3.1 | | |
Consumer Staple | | | 2.5 | | |
Short-term Investments 3.0%5 | | | 3.0 | | |
| | | | 100.0 | % | |
1 Ratio has been annualized for the six month period ended June 30, 2013.
2 The Fund's investment adviser has agreed to waive its investment management and fund administration fees and reimburse expenses to the extent necessary to prevent total annual fund operating expenses (excluding interest, taxes, brokerage commissions, Acquired Fund Fees and Expenses, other investment-related costs and extraordinary expenses, such as litigation and other expenses not incurred in the ordinary course of the Fund's business) from exceeding 1.25% through December 31, 2014. The Adviser cannot terminate this arrangement before that date without the agreement of the Fund's Board of Trustees. In the Fund's prospectus dated April 30, 2013, the Fund's gross expense ratio was 1.74%.
3 Although the Fund is no-load, investment management fees and other expenses still apply.
4 All holdings in the portfolio are subject to change without notice and may or may not represent current or future portfolio composition. The mention of specific securities is not intended as a recommendation or offer for a particular security, nor is it intended to be a solicitation for the purchase or sale of any security.
5 Represents short-term investments and other assets and liabilities (net).
27
Mairs & Power Small Cap Fund
SCHEDULE OF INVESTMENTS (unaudited) June 30, 2013
Shares | | Security Description | | Fair Value | |
| | | COMMON STOCKS 97.0% | |
| | | BASIC INDUSTRIES 12.0% | |
| | 59,400 | | | Apogee Enterprises, Inc. | | $ | 1,425,600 | | |
| | 42,900 | | | Bemis Co., Inc. | | | 1,679,106 | | |
| | 41,400 | | | Hawkins, Inc. | | | 1,630,746 | | |
| | 87,100 | | | Titan Machinery, Inc. (b) | | | 1,709,773 | | |
| | 27,700 | | | Valspar Corp. | | | 1,791,359 | | |
| | | | 8,236,584 | | |
| | | CAPITAL GOODS 17.4% | |
| | 46,400 | | | Badger Meter, Inc. | | | 2,067,120 | | |
| | 16,600 | | | Chart Industries, Inc. (b) | | | 1,561,894 | | |
| | 24,600 | | | Graco, Inc. | | | 1,554,966 | | |
| | 103,872 | | | MOCON, Inc. | | | 1,407,466 | | |
| | 28,400 | | | MTS Systems Corp. | | | 1,607,440 | | |
| | 46,500 | | | Oshkosh Corporation (b) | | | 1,765,605 | | |
| | 21,800 | | | Snap-on Incorporated | | | 1,948,484 | | |
| | | | 11,912,975 | | |
| | | CONSUMER CYCLICAL 12.4% | |
| | 18,000 | | | Buffalo Wild Wings, Inc. (b) | | | 1,766,880 | | |
| | 19,600 | | | Cabela's Inc. (b) | | | 1,269,296 | | |
| | 59,200 | | | Deluxe Corp. | | | 2,051,280 | | |
| | 36,139 | | | G&K Services, Inc., Class A | | | 1,720,216 | | |
| | 36,900 | | | Toro Co. | | | 1,675,629 | | |
| | | | 8,483,301 | | |
| | | CONSUMER STAPLE 2.5% | |
| | 28,700 | | | Casey's General Stores, Inc. | | | 1,726,592 | | |
| | | ENERGY 6.0% | |
| | 163,700 | | | Kodiak Oil & Gas Corp. (a) (b) | | | 1,455,293 | | |
| | 39,100 | | | Oasis Petroleum Inc. (b) | | | 1,519,817 | | |
| | 42,900 | | | Superior Energy Services, Inc. (b) | | | 1,112,826 | | |
| | | | 4,087,936 | | |
| | | FINANCIAL 16.2% | |
| | 32,900 | | | Agree Realty Corporation | | | 971,208 | | |
| | 168,100 | | | Associated Banc-Corp. | | | 2,613,955 | | |
| | 278,613 | | | Bank Mutual Corporation | | | 1,571,377 | | |
| | 93,300 | | | PrivateBancorp, Inc. | | | 1,978,893 | | |
| | 64,000 | | | TCF Financial Corp. | | | 907,520 | | |
| | 23,900 | | | Waddell & Reed Financial, Inc. | | | 1,039,650 | | |
| | 53,500 | | | Wintrust Financial Corporation | | | 2,047,980 | | |
| | | | 11,130,583 | | |
28
Mairs & Power Small Cap Fund
SCHEDULE OF INVESTMENTS (unaudited) (continued) June 30, 2013
Shares | | Security Description | | Fair Value | |
| | | COMMON STOCKS (continued) | |
| | | HEALTH CARE 8.5% | |
| | 28,300 | | | Landauer, Inc. | | $ | 1,367,173 | | |
| | 45,300 | | | Patterson Cos., Inc. | | | 1,703,280 | | |
| | 24,400 | | | Techne Corp. | | | 1,685,552 | | |
| | 71,176 | | | Vascular Solutions, Inc. (b) | | | 1,046,999 | | |
| | | | 5,803,004 | | |
| | | TECHNOLOGY 12.0% | |
| | 23,300 | | | Advent Software, Inc. (b) | | | 816,898 | | |
| | 93,900 | | | Cray Inc. (b) | | | 1,844,196 | | |
| | 33,036 | | | Daktronics, Inc. | | | 338,949 | | |
| | 40,534 | | | NVE Corporation (b) | | | 1,897,802 | | |
| | 19,800 | | | Proto Labs, Inc. (b) | | | 1,286,406 | | |
| | 14,400 | | | SPS Commerce, Inc. (b) | | | 792,000 | | |
| | 150,400 | | | VASCO Data Security International, Inc. (b) | | | 1,249,824 | | |
| | | | 8,226,075 | | |
| | | TRANSPORTATION 3.1% | |
| | 30,600 | | | Echo Global Logistics, Inc. (b) | | | 596,394 | | |
| | 41,700 | | | Hub Group, Inc. (b) | | | 1,518,714 | | |
| | | | 2,115,108 | | |
| | | UTILITIES 6.9% | |
| | 48,300 | | | ALLETE, Inc. | | | 2,407,755 | | |
| | 90,000 | | | MDU Resources Group, Inc. | | | 2,331,900 | | |
| | | | 4,739,655 | | |
| | | | | TOTAL COMMON STOCKS
(cost $56,357,634) | | $ | 66,461,813
| | |
29
Mairs & Power Small Cap Fund
SCHEDULE OF INVESTMENTS (unaudited) (continued) June 30, 2013
Shares | | Security Description | | Fair Value | |
| | | SHORT-TERM INVESTMENTS 2.9% | |
| 1,966,107 | | | First American Prime Obligations Fund, Class Z, 0.00% (c)
(cost $1,966,107) | | $ | 1,966,107 | | |
| | TOTAL INVESTMENTS 99.9%
(cost $58,323,741) | | $ | 68,427,920 | | |
| | | OTHER ASSETS AND LIABILITIES (NET) 0.1% | | | 91,098 | | |
| | | TOTAL NET ASSETS 100.0% | | $ | 68,519,018 | | |
(a) Foreign security denominated in U.S. dollars. As of June 30, 2013, these securities represented $1,455,293 or 2.1% of total net assets.
(b) Non-income producing.
(c) The rate quoted is the annualized seven-day effective yield as of June 30, 2013.
See accompanying Notes to Financial Statements.
30
STATEMENTS OF ASSETS AND LIABILITIES (unaudited) June 30, 2013
| | | Mairs & Power
Growth Fund | | Mairs & Power
Balanced Fund | | Mairs & Power
Small Cap Fund | |
ASSETS | |
| Investments, at fair value (Note 1): | |
Unaffiliated securities * | | $ | 2,889,218,884 | | | $ | 467,532,842 | | | $ | 68,427,920 | | |
| Affiliated securities (Note 5) * | | | 198,441,682 | | | | - | | | | - | | |
| | | | 3,087,660,566 | | | | 467,532,842 | | | | 68,427,920 | | |
Cash | | | - | | | | 4,830 | | | | - | | |
Receivable for Fund shares sold | | | 4,893,779 | | | | 2,074,624 | | | | 105,249 | | |
Receivable for securities sold | | | 187,588 | | | | - | | | | - | | |
Dividends and interest receivable | | | 3,412,383 | | | | 2,341,394 | | | | 54,522 | | |
Prepaid expenses and other assets | | | 99,094 | | | | 38,358 | | | | 33,420 | | |
| | | | 3,096,253,410 | | | | 471,992,048 | | | | 68,621,111 | | |
LIABILITIES | |
Payable for Fund shares redeemed | | | 1,026,109 | | | | 398,304 | | | | 17,643 | | |
Payable for securities purchased | | | 612,275 | | | | 1,758,543 | | | | - | | |
| Accrued investment management fees (Note 2) | | | 1,487,047 | | | | 231,604 | | | | 49,467 | | |
| Accrued Fund administration fees (Note 2) | | | 75,912 | | | | 4,177 | | | | 2,445 | | |
Accrued Trustee fees | | | 38,728 | | | | 3,012 | | | | 1,291 | | |
Accrued audit expense | | | 21,514 | | | | 14,741 | | | | 10,624 | | |
Accrued transfer agent fees | | | 147,477 | | | | 17,273 | | | | 6,159 | | |
Accrued expenses and other liablities | | | 164,064 | | | | 47,145 | | | | 14,464 | | |
| | | | 3,573,126 | | | | 2,474,799 | | | | 102,093 | | |
NET ASSETS | | $ | 3,092,680,284 | | | $ | 469,517,249 | | | $ | 68,519,018 | | |
NET ASSETS CONSIST OF | |
Portfolio capital | | $ | 1,759,285,303 | | | $ | 382,412,952 | | | $ | 57,821,555 | | |
Undistributed net investment income (loss) | | | (336,578 | ) | | | 71,184 | | | | 14,369 | | |
Undistributed net realized gain (loss)
on investments | | | (1,443,135 | ) | | | (495,542 | ) | | | 578,915 | | |
Net unrealized appreciation on investments | | | 1,335,174,694 | | | | 87,528,655 | | | | 10,104,179 | | |
TOTAL NET ASSETS | | $ | 3,092,680,284 | | | $ | 469,517,249 | | | $ | 68,519,018 | | |
Fund shares, par value | | $ | 0.01 | | | $ | 0.01 | | | $ | 0.01 | | |
Authorized | | | unlimited | | | | unlimited | | | | unlimited | | |
Fund shares issued and oustanding | | | 32,529,602 | | | | 6,213,439 | | | | 4,136,001 | | |
Net asset value per share | | $ | 95.07 | | | $ | 75.56 | | | $ | 16.57 | | |
* Cost of investments | | | | | | | |
Cost of unaffiliated securities | | $ | 1,671,800,200 | | | $ | 380,004,187 | | | $ | 58,323,741 | | |
| Cost of affiliated securities (Note 5) | | | 80,685,672 | | | | - | | | | - | | |
| | | $ | 1,752,485,872 | | | $ | 380,004,187 | | | $ | 58,323,741 | | |
See accompanying Notes to Financial Statements.
31
STATEMENTS OF OPERATIONS (unaudited) Six Months Ended June 30, 2013
| | | Mairs & Power
Growth Fund | | Mairs & Power
Balanced Fund | | Mairs & Power
Small Cap Fund | |
INVESTMENT INCOME | |
Income: | |
Dividends from unaffiliated securities | | $ | 27,071,802 | | | $ | 2,933,323 | | | $ | 409,442 | | |
| Dividends from affiliated securities (Note 5) | | | 1,247,250 | | | | - | | | | - | | |
Interest income | | | 11,751 | | | | 3,268,515 | | | | 179 | | |
TOTAL INCOME | | | 28,330,803 | | | | 6,201,838 | | | | 409,621 | | |
Expenses: | |
| Investment management fees (Note 2) | | | 8,547,911 | | | | 1,209,143 | | | | 290,180 | | |
| Fund administration fees (Note 2) | | | 247,345 | | | | 21,706 | | | | 7,782 | | |
Fund accounting | | | 157,357 | | | | 51,300 | | | | 18,522 | | |
| Trustees' compensation (Note 2) | | | 78,103 | | | | 6,075 | | | | 2,604 | | |
Transfer agent fees | | | 563,579 | | | | 69,179 | | | | 22,839 | | |
Custodian fees | | | 97,494 | | | | 10,881 | | | | 13,001 | | |
Legal and audit fees | | | 76,333 | | | | 21,406 | | | | 15,614 | | |
Printing and mailing fees | | | 67,426 | | | | 10,471 | | | | 4,724 | | |
Other expenses | | | 103,741 | | | | 43,389 | | | | 20,139 | | |
TOTAL EXPENSES | | | 9,939,289 | | | | 1,443,550 | | | | 395,405 | | |
NET INVESTMENT INCOME | | | 18,391,514 | | | | 4,758,288 | | | | 14,216 | | |
| REALIZED AND UNREALIZED GAIN (LOSS) (Note 4) | |
Net realized gain (loss) on investments | |
| Unaffiliated issuers | | | (582,713 | ) | | | (495,751 | ) | | | 580,074 | | |
| Affiliated issuers (Note 5) | | | (151,406 | ) | | | - | | | | - | | |
| | | | (734,119 | ) | | | (495,751 | ) | | | 580,074 | | |
Change in net unrealized appreciation
on investments | | | 343,842,116 | | | | 21,061,248 | | | | 5,921,764 | | |
NET GAIN ON INVESTMENTS | | | 343,107,997 | | | | 20,565,497 | | | | 6,501,838 | | |
NET INCREASE IN NET ASSETS FROM
OPERATIONS | | $ | 361,499,511 | | | $ | 25,323,785 | | | $ | 6,516,054 | | |
See accompanying Notes to Financial Statements.
32
Mairs & Power Growth Fund
STATEMENTS OF CHANGES IN NET ASSETS (unaudited)
| | | Six Months Ended
June 30, 2013
(unaudited) | | Year Ended
December 31,
2012 | |
OPERATIONS | |
Net investment income | | $ | 18,391,514 | | | $ | 38,246,067 | | |
Net realized gain (loss) on investments sold | | | (734,119 | ) | | | 25,934,098 | | |
Net change in unrealized appreciation of investments | | | 343,842,116 | | | | 372,252,224 | | |
NET INCREASE IN NET ASSETS FROM OPERATIONS | | | 361,499,511 | | | | 436,432,389 | | |
DISTRIBUTIONS TO SHAREHOLDERS FROM | |
Net investment income | | | (18,749,582 | ) | | | (38,600,956 | ) | |
Net realized gain on investments sold | | | - | | | | (26,121,613 | ) | |
TOTAL DISTRIBUTIONS TO SHAREHOLDERS | | | (18,749,582 | ) | | | (64,722,569 | ) | |
CAPITAL TRANSACTIONS | |
Proceeds from shares sold | | | 491,215,677 | | | | 338,838,247 | | |
Reinvestment of distributions from net investment income and net realized gains | | | 17,381,606 | | | | 60,107,781 | | |
Cost of shares redeemed | | | (256,873,483 | ) | | | (247,576,772 | ) | |
INCREASE IN NET ASSETS FROM CAPITAL TRANSACTIONS | | | 251,723,800 | | | | 151,369,256 | | |
TOTAL INCREASE IN NET ASSETS | | | 594,473,729 | | | | 523,079,076 | | |
NET ASSETS | |
Beginning of period | | | 2,498,206,555 | | | | 1,975,127,479 | | |
End of period (including undistributed net investment income (loss) of
$(336,578) and $21,490, respectively) | | $ | 3,092,680,284 | | | $ | 2,498,206,555 | | |
FUND SHARE TRANSACTIONS | |
Shares sold | | | 5,324,965 | | | | 4,197,159 | | |
Shares issued for reinvested distributions | | | 181,839 | | | | 743,887 | | |
Shares redeemed | | | (2,736,271 | ) | | | (3,089,010 | ) | |
NET INCREASE IN FUND SHARES | | | 2,770,533 | | | | 1,852,036 | | |
See accompanying Notes to Financial Statements.
33
Mairs & Power Balanced Fund
STATEMENTS OF CHANGES IN NET ASSETS (unaudited)
| | | Six Months Ended
June 30, 2013
(unaudited) | | Year Ended
December 31,
2012 | |
OPERATIONS | |
Net investment income | | $ | 4,758,288 | | | $ | 6,647,087 | | |
Net realized gain (loss) on investments sold | | | (495,751 | ) | | | 387,619 | | |
Net change in unrealized appreciation of investments | | | 21,061,248 | | | | 28,004,807 | | |
NET INCREASE IN NET ASSETS FROM OPERATIONS | | | 25,323,785 | | | | 35,039,513 | | |
DISTRIBUTIONS TO SHAREHOLDERS FROM | |
Net investment income | | | (4,701,824 | ) | | | (6,712,826 | ) | |
Net realized gain on investments sold | | | (13,562 | ) | | | (368,142 | ) | |
TOTAL DISTRIBUTIONS TO SHAREHOLDERS | | | (4,715,386 | ) | | | (7,080,968 | ) | |
CAPITAL TRANSACTIONS | |
Proceeds from shares sold | | | 191,647,346 | | | | 91,053,226 | | |
Reinvestment of distributions from net investment income and net realized gains | | | 4,482,552 | | | | 6,580,843 | | |
Cost of shares redeemed | | | (34,130,731 | ) | | | (25,343,196 | ) | |
INCREASE IN NET ASSETS FROM CAPITAL TRANSACTIONS | | | 161,999,167 | | | | 72,290,873 | | |
TOTAL INCREASE IN NET ASSETS | | | 182,607,566 | | | | 100,249,418 | | |
NET ASSETS | |
Beginning of period | | | 286,909,683 | | | | 186,660,265 | | |
End of period (including undistributed net investment income (loss) of $71,184
and $14,720, respectively) | | $ | 469,517,249 | | | $ | 286,909,683 | | |
FUND SHARE TRANSACTIONS | |
Shares sold | | | 2,552,879 | | | | 1,322,413 | | |
Shares issued for reinvested distributions | | | 59,195 | | | | 95,833 | | |
Shares redeemed | | | (449,346 | ) | | | (370,691 | ) | |
NET INCREASE IN FUND SHARES | | | 2,162,728 | | | | 1,047,555 | | |
See accompanying Notes to Financial Statements.
34
Mairs & Power Small Cap Fund
STATEMENTS OF CHANGES IN NET ASSETS (unaudited)
| | | Six Months Ended
June 30, 2013
(unaudited) | | Year Ended
December 31,
2012 | |
OPERATIONS | |
Net investment income | | $ | 14,216 | | | $ | 61,513 | | |
Net realized gain (loss) on investments sold | | | 580,074 | | | | 344,220 | | |
Net change in unrealized appreciation of investments | | | 5,921,764 | | | | 3,706,050 | | |
NET INCREASE IN NET ASSETS FROM OPERATIONS | | | 6,516,054 | | | | 4,111,783 | | |
DISTRIBUTIONS TO SHAREHOLDERS FROM | |
Net investment income | | | - | | | | (61,142 | ) | |
Net realized gain on investments sold | | | - | | | | (348,235 | ) | |
TOTAL DISTRIBUTIONS TO SHAREHOLDERS | | | - | | | | (409,377 | ) | |
CAPITAL TRANSACTIONS | |
Proceeds from shares sold | | | 48,844,717 | | | | 34,480,633 | | |
Reinvestment of distributions from net investment income and net realized gains | | | - | | | | 378,100 | | |
Cost of shares redeemed | | | (28,485,620 | ) | | | (2,111,174 | ) | |
INCREASE IN NET ASSETS FROM CAPITAL TRANSACTIONS | | | 20,359,097 | | | | 32,747,559 | | |
TOTAL INCREASE IN NET ASSETS | | | 26,875,151 | | | | 36,449,965 | | |
NET ASSETS | |
Beginning of period | | | 41,643,867 | | | | 5,193,902 | | |
End of period (including undistributed net investment income (loss) of $14,369
and $153, respectively) | | $ | 68,519,018 | | | $ | 41,643,867 | | |
FUND SHARE TRANSACTIONS | |
Shares sold | | | 3,051,964 | | | | 2,537,189 | | |
Shares issued for reinvested distributions | | | - | | | | 26,589 | | |
Shares redeemed | | | (1,789,980 | ) | | | (153,167 | ) | |
NET INCREASE IN FUND SHARES | | | 1,261,984 | | | | 2,410,611 | | |
See accompanying Notes to Financial Statements.
35
NOTES TO FINANCIAL STATEMENTS (unaudited) June 30, 2013
Note 1 – Organization and Significant Accounting Policies
The Mairs & Power Funds Trust (the Trust) is a no-load, diversified, open-end management investment company registered under the Investment Company Act of 1940, as amended (the 1940 Act). Mairs & Power Growth Fund (the Growth Fund), Mairs & Power Balanced Fund (the Balanced Fund), and Mairs & Power Small Cap Fund (the Small Cap Fund) (individually a Fund and collectively the Funds) are series within the Trust. Effective August 11, 2011, the Small Cap Fund was added as a new series to the Trust. Effective December 31, 2011, the Growth Fund and Balanced Fund were added as new series to the Trust following the reorganization of Mairs and Power Growth Fund, Inc. and Mairs and Power Balanced Fund, Inc. into the Trust. The objective of the Growth Fund is to provide shareholders with a diversified portfolio of common stocks, which have the potential for above-average, long-term appreciation. The objectives of the Balanced Fund are to provide shareholders with regular current income, the potential for capital appreciation and a moderate level of risk by investing in a diversified portfolio including bonds, preferred stocks, common stocks, and other securities convertible into common stock. The objective of the Small Cap Fund is to seek above-average, long-term appreciation.
Significant accounting policies of the Funds are as follows:
Security Valuations
Security valuations for the Funds' investments are furnished by independent pricing services that have been approved by the Trust's Board of Trustees (the Board). Investments in listed equity securities are valued at the last quoted sale price on the securities exchange on which such securities are principally traded or at the NASDAQ Official Closing Price if readily available for such securities on each business day. Other equity securities traded in the over-the-counter market and listed equity securities for which no sale was reported on that date are valued at the last quoted bid price. Debt obligations exceeding 60 days to maturity are valued by an independent pricing service. The pricing services may employ methodologies that utilize actual market transactions, broker-dealer supplied valuations, or other formula-driven valuation techniques. These techniques generally consider overall market conditions and such factors as yields or prices of bonds of comparable quality, type of issue, coupon, maturity and ratings. Debt obligations with 60 days or less remaining until maturity may be valued at their amortized cost, which approximates market.
Securities for which prices are not available from an independent pricing service, but where an active market exists, are valued using market quotations obtained from one or more dealers that make markets in the securities. When market quotations are not readily available, or when the last quoted sale price is not considered representative of the value of the security if it were to be sold on that day, the security will be valued at fair value as determined in good faith by the Fair Value Committee appointed by the Board, pursuant to procedures approved by the Board.
Factors that may be considered in determining the fair value of a security are fundamental analytical data relating to the security, the nature and duration of any restrictions on the disposition of the security, and the forces influencing the market in which the security is purchased or sold. As of June 30, 2013, no securities in the Funds were valued using this method.
Fair Valuation Measurements
The Trust has adopted authoritative fair valuation accounting standards, which establish a definition of fair value and set out a hierarchy for measuring fair value. These standards require additional disclosures about the various inputs and valuation techniques used to develop the measurements of fair value and changes in valuation techniques and related inputs during the period. These inputs are summarized in the three broad levels listed below:
• Level 1 – Quoted prices in active markets for identical securities.
• Level 2 – Other significant observable inputs (including quoted prices for similar securities, interest rates, prepayment speeds, credit risk, etc.).
• Level 3 – Significant unobservable inputs (including the Funds' own assumptions in determining the fair value of investments).
36
NOTES TO FINANCIAL STATEMENTS (unaudited) (continued) June 30, 2013
Note 1 – Organization and Significant Accounting Policies (continued)
The inputs or methodologies used for valuing securities are not necessarily an indication of the risk associated with investing in those securities. The following is a summary of the inputs used to value the net assets of each Fund as of June 30, 2013:
| | | Growth Fund | | Balanced Fund | | Small Cap Fund | |
Level 1* | | $ | 3,087,660,566 | | | $ | 305,697,364 | | | $ | 68,427,920 | | |
Level 2** | | | - | | | | 161,835,478 | | | | - | | |
Level 3 | | | - | | | | - | | | | - | | |
Total | | $ | 3,087,660,566 | | | $ | 467,532,842 | | | $ | 68,427,920 | | |
* All Level 1 investments are equity securities (common stocks and preferred stocks and securities) and short-term investments.
** All Level 2 investments are fixed income securities, excluding preferred securities.
For detail of securities by major industry classification for the Funds, please refer to the Schedules of Investments.
The Funds had no transfers amongst levels during the period and did not hold any Level 3 investments at either June 30, 2013 or December 31, 2012; therefore, a roll forward of Level 3 investments is not required.
Security Transactions and Investment Income
Security transactions are recorded on the date on which securities are purchased or sold. Dividend income and corporate action transactions are recorded on the ex-dividend date, and interest income is recorded on an accrual basis. Realized gains and losses are reported on an identified cost basis.
Income Taxes
Each Fund is a "regulated investment company" as defined in Subtitle A, Chapter 1, Subchapter M of the Internal Revenue Code, as amended (the Code). No provisions have been made for federal income taxes as it is the intention of each Fund to comply with the provisions of the Code applicable to regulated investment companies and to make distributions of income and realized gains sufficient to relieve it from all or substantially all excise and income taxes.
As of June 30, 2013, the Trust did not have any tax positions that did not meet the "more-likely-than-not" threshold of being sustained by the applicable tax authority. Generally, tax authorities can examine all tax returns filed for the last three years or, for the Small Cap Fund, all tax returns filed since commencement of operations.
The Regulated Investment Company Modernization Act of 2010 (the Act) changed various technical rules governing the tax treatment of regulated investment companies. Under the Act, the Funds will be permitted to carry forward capital losses incurred. In addition, capital loss carryforwards will retain their character as either short-term or long-term capital losses rather than being considered all short-term as permitted under previous regulation. Management evaluated the implications of this guidance and concluded the Act has no impact on the Funds. As of June 30, 2013, the Growth Fund, Balanced Fund and Small Cap Fund did not have any post-enactment capital loss carryforwards.
Basis of Presentation
The preparation of financial statements in conformity with U.S. generally accepted accounting principles (GAAP) requires management to make estimates and assumptions that affect the reported amount of net assets and liabilities and disclosure of contingent assets and liabilities at the date of the financial statements and the reported results of operations during the reporting period. Actual results could differ from those estimates.
In preparing these financial statements, the Funds have evaluated events and transactions for potential recognition or disclosure through the date the financial statements were available to be issued. Effective September 3, 2013,
37
NOTES TO FINANCIAL STATEMENTS (unaudited) (continued) June 30, 2013
Note 1 – Organization and Significant Accounting Policies (continued)
the Small Cap Fund will implement a 1.00% redemption fee on shares held for 180 days or less. The fee is designed to protect long-term shareholders from the negative effects of short-term trading activity. The redemption fee will not apply to Fund shares currently held by shareholders and purchased before September 3, 2013.
Note 2 – Related-Party Transactions
Common expenses incurred by the Trust are allocated among the Funds based on a ratio predetermined by the Adviser. Fund specific expenses are charged directly to the Fund that incurred the expense.
Investment Management and Fund Administration Fees
Mairs and Power, Inc. (the Adviser) provides investment management services to the Funds under a written agreement (the Management Agreement) approved by the Board. Pursuant to the Management Agreement, the Adviser is paid a monthly fee on average daily net assets at the following annual rates:
| | | Growth Fund | | Balanced Fund | | Small Cap Fund* | |
Up to $2.5 Billion | | | 0.60 | % | | | 0.60 | % | | | 0.90 | % | |
Over $2.5 Billion | | | 0.50 | % | | | 0.60 | % | | | 0.90 | % | |
The Adviser provides fund administration services to the Funds under a written fund administration servicing agreement approved by the Board. The fund administration fee paid to the Adviser is computed at an annual rate of 0.00281% of average daily net assets. Fund administration fees incurred for the six months ended June 30, 2013 and fund administration fees payable to the Adviser as of June 30, 2013 were as follows:
| | | Growth Fund | | Balanced Fund | | Small Cap Fund | |
Fund administration fees incurred | | $ | 41,072 | | | $ | 5,663 | | | $ | 906 | | |
Fund administration fees payable | | | 7,202 | | | | 1,085 | | | | 155 | | |
Pursuant to a sub-administration agreement between the Funds and U.S. Bancorp Fund Services, LLC (USBFS), the Funds are charged a sub-administration fee paid to USBFS. Sub-administration fees from USBFS incurred for the six months ended June 30, 2013 and sub-administration fees payable to USBFS as of June 30, 2013 were as follows:
| | | Growth Fund | | Balanced Fund | | Small Cap Fund | |
Sub-administration fees paid | | $ | 206,273 | | | $ | 16,043 | | | $ | 6,876 | | |
Sub-administration fees payable | | | 68,710 | | | | 3,092 | | | | 2,290 | | |
* The Adviser has agreed to waive the Small Cap Fund's investment management and fund administration fees and reimburse expenses to the extent necessary to prevent total annual fund operating expenses (excluding interest, taxes, brokerage commissions, Acquired Fund Fees and Expenses, other investment-related costs and other extraordinary expenses, such as litigation and other expenses not incurred in the ordinary course of the Small Cap Fund's business) from exceeding 1.25% of daily net assets through December 31, 2014. The Adviser cannot terminate this arrangement before that date without the agreement of the Board.
Trustees' Compensation
The Funds pay compensation to the disinterested trustees of the Trust. The Funds do not pay remuneration to officers or to trustees who are officers, directors or employees of the Adviser.
38
NOTES TO FINANCIAL STATEMENTS (unaudited) (continued) June 30, 2013
Note 3 – Indemnifications
In the normal course of business, the Trust enters into contracts that contain general indemnifications to other parties. The Trust's maximum exposure under these contracts is unknown as this would involve future claims that may be made against the Trust that have not yet occurred. The Trust expects the risk of loss to be remote.
Note 4 – Distributions Paid, Distributable Earnings and Investment Transactions
Net investment income and net realized capital gains (losses) may differ for financial reporting and tax purposes because of temporary or permanent book/tax differences. The tax basis net realized gains (losses) for each Fund are determined only at the end of each fiscal year. As a result, no reclassifications were made as of June 30, 2013.
Distributions to shareholders are determined in accordance with income tax regulations that may differ from GAAP, and due to the timing of the distributions, the fiscal year in which the amounts are distributed may differ from the year that the income or realized gains (losses) were recorded by each Fund.
The tax character of distributions paid during the six months ended June 30, 2013 and the fiscal year ended December 31, 2012, were as follows:
Six months ended June 30, 2013 | |
Distributions paid from: | | Growth Fund | | Balanced Fund | | Small Cap Fund | |
Ordinary income | | $ | 18,749,582 | | | $ | 4,701,824 | | | $ | - | | |
Long-term capital gains | | | - | | | | 13,562 | | | | - | | |
Total distributions paid | | $ | 18,749,582 | | | $ | 4,715,386 | | | $ | - | | |
Year ended December 31, 2012 | |
Distributions paid from: | | Growth Fund | | Balanced Fund | | Small Cap Fund | |
Ordinary income | | $ | 38,600,956 | | | $ | 6,722,264 | | | $ | 291,357 | | |
Long-term capital gains | | | 26,121,613 | | | | 358,704 | | | | 118,020 | | |
Total distributions paid | | $ | 64,722,569 | | | $ | 7,080,968 | | | $ | 409,377 | | |
At December 31, 2012, the components of accumulated earnings (losses) on a tax basis were as follows:
| | | Growth Fund | | Balanced Fund | | Small Cap Fund | |
Cost of investments | | $ | 1,500,832,789 | | | $ | 219,876,934 | | | $ | 37,577,732 | | |
Gross unrealized appreciation | | $ | 1,095,798,501 | | | $ | 71,856,315 | | | $ | 4,728,780 | | |
Gross unrealized depreciation | | | (105,176,187 | ) | | | (5,374,188 | ) | | | (547,524 | ) | |
Net unrealized appreciation | | $ | 990,622,314 | | | $ | 66,482,127 | | | $ | 4,181,256 | | |
Undistributed ordinary income | | $ | 21,490 | | | $ | - | | | $ | 153 | | |
Undistributed long-term capital gains | | | 1,248 | | | | 13,771 | | | | - | | |
Total distributable earnings | | $ | 22,738 | | | $ | 13,771 | | | $ | 153 | | |
Other accumulated earnings | | | - | | | | - | | | | - | | |
Total accumulated earnings | | $ | 990,645,052 | | | $ | 66,495,898 | | | $ | 4,181,409 | | |
The difference between book basis and tax basis unrealized appreciation is attributable primarily to the tax deferral of losses on wash sales and the tax cost basis adjustment due to receipt of return of capital distributions from certain investments.
39
NOTES TO FINANCIAL STATEMENTS (unaudited) (continued) June 30, 2013
Note 4 – Distributions Paid, Distributable Earnings and Investment Transactions (continued)
Purchases and sales of investment securities, excluding government securities, short-term securities and temporary cash investments, during the six months ended June 30, 2013 were as follows:
| | | Purchases | | Sales | |
Growth Fund | | $ | 275,809,218 | | | $ | 2,570,151 | | |
Balanced Fund | | | 163,153,662 | | | | 6,562,381 | | |
Small Cap Fund | | | 40,466,569 | | | | 20,624,155 | | |
Purchases and sales of government securities during the six months ended June 30, 2013 were as follows:
| | | Purchases | | Sales | |
Growth Fund | | $ | - | | | $ | - | | |
Balanced Fund | | | 19,693,663 | | | | 1,500,000 | | |
Small Cap Fund | | | - | | | | - | | |
Note 5 – Transactions With Affiliated Companies
The Growth Fund owned 5% or more of the voting securities of the following companies during the six months ended June 30, 2013. As a result, these companies are deemed to be affiliates of the Growth Fund as defined by the 1940 Act. Transactions during the period in these securities of affiliated companies were as follows:
Growth Fund
| | | Share Activity | | | | | |
Security Name | | Balance
12/31/12 | | Purchases | | Sales | | Balance
06/30/13 | | Dividend
Income | | Fair Value at
06/30/13 | |
H.B. Fuller Co. | | | 2,850,000 | | | | - | | | | - | | | | 2,850,000 | | | $ | 527,250 | | | $ | 107,758,500 | | |
MTS Systems Corp. | | | 1,200,000 | | | | - | | | | - | | | | 1,200,000 | | | | 720,000 | | | | 67,920,000 | | |
NVE Corporation | | | 270,500 | | | | 242,200 | | | | 26,515 | | | | 486,185 | | | | - | | | | 22,763,182 | | |
| | | | | | | | | | | $ | 1,247,250 | | | $ | 198,441,682 | | |
40
Mairs & Power Growth Fund
FINANCIAL HIGHLIGHTS
SELECTED DATA AND RATIOS
(for a share outstanding throughout each period)
| | | Six Months
Ended | | Year Ended December 31, | |
| | | June 30, 2013 (1) | | 2012 | | 2011 | | 2010 | | 2009 | | 2008 | |
| | | (unaudited) | | | | | | | | | | | |
Per Share | |
Net asset value, beginning of period | | $ | 83.95 | | | $ | 70.78 | | | $ | 72.16 | | | $ | 63.12 | | | $ | 52.51 | | | $ | 76.30 | | |
Income (loss) from investment operations: | |
Net investment income | | | 0.57 | | | | 1.33 | | | | 1.01 | | | | 0.86 | | | | 0.89 | | | | 1.22 | | |
Net realized and unrealized gain (loss) | | | 11.13 | | | | 14.08 | | | | (0.45 | ) | | | 10.01 | | | | 10.85 | | | | (22.93 | ) | |
Total from investment operations | | | 11.70 | | | | 15.41 | | | | 0.56 | | | | 10.87 | | | | 11.74 | | | | (21.71 | ) | |
Distributions to shareholders from: | |
Net investment income | | | (0.58 | ) | | | (1.34 | ) | | | (1.00 | ) | | | (0.86 | ) | | | (0.89 | ) | | | (1.22 | ) | |
Net realized gains on affiliated investments sold | | | - | | | | (0.90 | ) | | | (0.94 | ) | | | (0.97 | ) | | | (0.24 | ) | | | (0.86 | ) | |
Contribution from Adviser | | | - | | | | - | | | | - | | | | (0.04 | )(2) | | | - | | | | - | | |
Total distributions | | | (0.58 | ) | | | (2.24 | ) | | | (1.94 | ) | | | (1.87 | ) | | | (1.13 | ) | | | (2.08 | ) | |
Contribution from Adviser | | | - | | | | - | | | | - | | | | 0.04 | (2) | | | - | | | | - | | |
Net asset value, end of period | | $ | 95.07 | | | $ | 83.95 | | | $ | 70.78 | | | $ | 72.16 | | | $ | 63.12 | | | $ | 52.51 | | |
Total investment return | | | 13.93 | % | | | 21.91 | % | | | 0.74 | % | | | 17.40 | %(3) | | | 22.52 | % | | | -28.51 | % | |
Net assets, end of period, in thousands | | $ | 3,092,680 | | | $ | 2,498,207 | | | $ | 1,975,127 | | | $ | 2,040,709 | | | $ | 1,935,317 | | | $ | 1,681,717 | | |
Ratios/supplemental data: | |
Ratio of expenses to average net assets | | | 0.68 | % | | | 0.70 | % | | | 0.72 | % | | | 0.71 | % | | | 0.71 | % | | | 0.70 | % | |
Ratio of net investment income to average
net assets | | | 1.26 | | | | 1.69 | | | | 1.40 | | | | 1.26 | | | | 1.61 | | | | 1.75 | | |
Portfolio turnover rate | | | 0.09 | | | | 1.58 | | | | 2.78 | | | | 1.81 | | | | 3.21 | | | | 2.42 | | |
(1) For the six months ended June 30, 2013, all ratios have been annualized except total investment return and portfolio turnover.
(2) The Fund received two contributions from the Adviser related to prospect services and other expenses paid by the Fund from 1980-2009, which were in violation of the Investment Company Act of 1940. The contribution amounts, including imputed interest, were $1,192,736, or $0.04 per share based upon shares outstanding on May 21, 2010 and $8,271 or $0.0003 per share based on shares outstanding as of September 24, 2010.
(3) For the year ended December 31, 2010, 0.08% of the Fund's total return was a result of contributions as described in footnote 2 above. Excluding the contributions, total investment return would have been 17.32%
See accompanying Notes to Financial Statements.
41
Mairs & Power Balanced Fund
FINANCIAL HIGHLIGHTS
SELECTED DATA AND RATIOS
(for a share outstanding throughout each period)
| | | Six Months
Ended | | Year Ended December 31, | |
| | | June 30, 2013 (1) | | 2012 | | 2011 | | 2010 | | 2009 | | 2008 | |
| | | (unaudited) | | | | | | | | | | | |
Per Share | |
Net asset value, beginning of period | | $ | 70.83 | | | $ | 62.15 | | | $ | 62.01 | | | $ | 55.76 | | | $ | 47.80 | | | $ | 63.19 | | |
Income (loss) from investment operations: | |
Net investment income | | | 0.81 | | | | 1.89 | | | | 1.85 | | | | 1.81 | | | | 1.88 | | | | 1.98 | | |
Net realized and unrealized gain (loss) | | | 4.72 | | | | 8.79 | | | | 0.13 | | | | 6.29 | | | | 8.08 | | | | (15.12 | ) | |
Total from investment operations | | | 5.53 | | | | 10.68 | | | | 1.98 | | | | 8.10 | | | | 9.96 | | | | (13.14 | ) | |
Distributions to shareholders from: | |
Net investment income | | | (0.80 | ) | | | (1.91 | ) | | | (1.83 | ) | | | (1.81 | ) | | | (1.86 | ) | | | (1.98 | ) | |
Net realized gains on affiliated investments sold | | | (0.00 | )(3) | | | (0.09 | ) | | | (0.01 | ) | | | (0.04 | ) | | | (0.11 | ) | | | (0.27 | ) | |
Contribution from Adviser | | | - | | | | - | | | | - | | | | (0.06 | )(2) | | | - | | | | - | | |
Return of capital | | | - | | | | - | | | | - | | | | (0.00 | )(3) | | | (0.03 | ) | | | - | | |
Total distributions | | | (0.80 | ) | | | (2.00 | ) | | | (1.84 | ) | | | (1.91 | ) | | | (2.00 | ) | | | (2.25 | ) | |
Contribution from Adviser | | | - | | | | - | | | | - | | | | 0.06 | (2) | | | - | | | | - | | |
Net asset value, end of period | | $ | 75.56 | | | $ | 70.83 | | | $ | 62.15 | | | $ | 62.01 | | | $ | 55.76 | | | $ | 47.80 | | |
Total investment return | | | 7.81 | % | | | 17.34 | % | | | 3.23 | % | | | 14.87 | %(4) | | | 21.35 | % | | | -21.12 | % | |
Net assets, end of period, in thousands | | $ | 469,517 | | | $ | 286,910 | | | $ | 186,660 | | | $ | 169,400 | | | $ | 136,404 | | | $ | 107,989 | | |
Ratios/supplemental data: | |
Ratio of expenses to average net assets | | | 0.72 | % | | | 0.74 | % | | | 0.79 | % | | | 0.81 | % | | | 0.83 | % | | | 0.80 | % | |
Ratio of net investment income to average
net assets | | | 2.36 | | | | 2.94 | | | | 2.99 | | | | 3.13 | | | | 3.73 | | | | 3.45 | | |
Portfolio turnover rate | | | 2.24 | | | | 5.46 | | | | 9.12 | | | | 5.93 | | | | 18.92 | | | | 17.31 | | |
(1) For the six months ended June 30, 2013, all ratios have been annualized except total investment return and portfolio turnover.
(2) The Fund received two contributions from the Adviser related to prospect services and other expenses paid by the Fund from 1980-2009, which were in violation of the Investment Company Act of 1940. The contribution amounts, including imputed interest, were $161,030 or $0.06 per share based upon shares outstanding on May 21, 2010 and $5,841 and $0.002 per share based on shares outstanding as of September 24, 2010.
(3) Amount per share is less than $0.005.
(4) For the year ended December 31, 2010, 0.11% of the Fund's total return was a result of contributions as described in footnote 2 above. Excluding the contributions, total investment return would have been 14.76%.
See accompanying Notes to Financial Statements.
42
Mairs & Power Small Cap Fund
FINANCIAL HIGHLIGHTS
SELECTED DATA AND RATIOS
(for a share outstanding throughout each period)
| | | Six Months Ended
June 30, 2013 (1) | | Year Ended
December 31, 2012 | | August 11, 2011 *
Through
December 31, 2011 (1) | |
| | | (unaudited) | | | | | |
Per Share | |
Net asset value, beginning of period | | $ | 14.49 | | | $ | 11.21 | | | $ | 10.00 | | |
Income (loss) from investment operations: | |
Net investment income | | | - | (2) | | | 0.01 | | | | 0.01 | | |
Net realized and unrealized gain (loss) | | | 2.08 | | | | 3.42 | | | | 1.20 | | |
Total from investment operations | | | 2.08 | | | | 3.43 | | | | 1.21 | | |
Distributions to shareholders from: | |
Net investment income | | | - | | | | (0.02 | ) | | | - | | |
Net realized gains on affiliated investments sold | | | - | | | | (0.13 | ) | | | - | | |
Total distributions | | | - | | | | (0.15 | ) | | | - | | |
Net asset value, end of period | | $ | 16.57 | | | $ | 14.49 | | | $ | 11.21 | | |
Total investment return | | | 14.35 | % | | | 30.60 | % | | | 12.10 | % | |
Net assets, end of period, in thousands | | $ | 68,519 | | | $ | 41,644 | | | $ | 5,194 | | |
Ratios/supplemental data: | |
Ratio of expenses to average net assets | |
Before expense reimbursement | | | 1.23 | % | | | 1.73 | % | | | 7.98 | % | |
After expense reimbursement | | | 1.23 | % | | | 1.25 | % | | | 1.25 | % | |
Ratio of net investment income to average net assets | |
Before expense reimbursement | | | 0.04 | % | | | (0.14 | )% | | | (6.41 | )% | |
After expense reimbursement | | | 0.04 | % | | | 0.34 | % | | | 0.32 | % | |
Portfolio turnover rate | | | 33.32 | % | | | 6.93 | % | | | 4.52 | % | |
* Commencement of operations.
(1) For the six months ended June 30, 2013 and the period ended December 31, 2011, all ratios have been annualized except total investment return and portfolio turnover.
(2) Amount per share is less than $0.005.
See accompanying Notes to Financial Statements.
43
FUND EXPENSES (unaudited)
As a shareholder of the Funds, you incur ongoing expenses for the operation of the Funds (e.g., asset-based charges, such as investment management fees). The Funds are "no-load" mutual funds. As a result, shareholders pay no commissions, fees, or expenses associated with sales representatives or sales charges.
This example is intended to help you understand your ongoing costs (in dollars) of investing in the Funds and to compare these costs with the ongoing costs of investing in other mutual funds. The table below reports the Funds' expenses during the period January 1, 2013 through June 30, 2013 and includes the costs associated with a $1,000 investment.
Actual Expenses
The first line in the tables below may be used to estimate the actual expenses you paid over the reporting period. You can do this by dividing your account value by $1,000 and multiplying the result by the expense shown in the table below. For example, if your account value is $8,600, divided by $1,000 = $8.60. Multiply the result by the number in the first line under the heading entitled "Expenses Paid During Period." By doing this you can estimate the expenses you paid on your account during this period.
Hypothetical Example
The second line of the tables below provides information about hypothetical account values and hypothetical expenses based on the Funds' actual expenses and assumed returns of 5% per year before expenses, which are not the Funds' actual returns. The results may be used to provide you with a basis for comparing the ongoing costs of investing in the Funds with the ongoing costs of investing in other funds. To do so, compare these 5% hypothetical examples with the 5% hypothetical examples that appear in the shareholder reports of other funds. Please note that these hypothetical examples may not be used to estimate the actual ending account balances or expenses you paid during the period and will not help you determine the relative total costs of owning different funds.
Mairs & Power Growth Fund
| | | Beginning Account
Value 01/01/2013 | | Ending Account
Value 06/30/2013 | | Expenses Paid
During Period * | |
Actual return | | $ | 1,000.00 | | | $ | 1,139.30 | | | $ | 3.61 | | |
Hypothetical assumed 5% return | | $ | 1,000.00 | | | $ | 1,021.42 | | | $ | 3.41 | | |
* The Fund's expenses are equal to the Fund's annualized expense ratio for the most recent six-month period of 0.68%, multiplied by the average account value over the Fund's first fiscal half-year, multiplied by the number of days in the Fund's first fiscal half-year (181 days), divided by 365 days.
Mairs & Power Balanced Fund
| | | Beginning Account
Value 01/01/2013 | | Ending Account
Value 06/30/2013 | | Expenses Paid
During Period * | |
Actual return | | $ | 1,000.00 | | | $ | 1,078.10 | | | $ | 3.71 | | |
Hypothetical assumed 5% return | | $ | 1,000.00 | | | $ | 1,021.22 | | | $ | 3.61 | | |
* The Fund's expenses are equal to the Fund's annualized expense ratio for the most recent six-month period of 0.72%, multiplied by the average account value over the Fund's first fiscal half-year, multiplied by the number of days in the Fund's first fiscal half-year (181 days), divided by 365 days.
44
FUND EXPENSES (unaudited) (continued)
Mairs & Power Small Cap Fund
| | | Beginning Account
Value 01/01/2013 | | Ending Account
Value 06/30/2013 | | Expenses Paid
During Period * | |
Actual return | | $ | 1,000.00 | | | $ | 1,143.50 | | | $ | 6.54 | | |
Hypothetical assumed 5% return | | $ | 1,000.00 | | | $ | 1,018.70 | | | $ | 6.16 | | |
* The Fund's expenses are equal to the Fund's annualized expense ratio for the most recent six-month period of 1.23%, multiplied by the average account value over the Fund's first fiscal half-year, multiplied by the number of days in the Fund's first fiscal half-year (181 days), divided by 365 days.
45
The Proxy Voting Policies and Procedures that the Trust uses to determine how to vote proxies relating to portfolio securities are available (i) without charge, upon request, by calling Shareholder Services at (800) 304-7404 and requesting a copy of the Statement of Additional Information (SAI) and (ii) on the Securities and Exchange Commission's (SEC's) website at www.sec.gov (access Form N-1A).
Information on how the Trust voted proxies relating to portfolio securities during the most recent 12-month period ended June 30 is available at www.mairsandpower.com and on the SEC's website at www.sec.gov.
DISCLOSURE OF PORTFOLIO HOLDINGS (unaudited)
The Trust files a complete schedule of portfolio holdings on Form N-Q for the first and third quarter-ends and on Form N-CSR for the second and fourth quarter-ends with the SEC. The Trust's Forms N-Q and N-CSR are available on the SEC's website at www.sec.gov. Forms N-Q and N-CSR may also be reviewed and copied at the SEC's Public Reference Room in Washington, D.C. Information on the operation of the Public Reference Room may be obtained by calling (800) SEC-0330.
The schedule of portfolio holdings is also printed in the Trust's semi-annual and annual reports to shareholders, which are available without charge by calling Shareholder Services at (800) 304-7404 or by visiting www.mairsandpower.com.
A complete copy of the Trust's portfolio holdings will also be available on or about 15 days following each quarter-end on the Fund's website at www.mairsandpower.com.
BOARD OF TRUSTEES' APPROVAL OF INVESTMENT ADVISORY CONTRACT
The Board of Trustees (the Trustees) unanimously approved the Agreement for Investment Counsel Service (the Advisory Contract) between Mairs & Power Funds Trust (the Trust) on behalf of the Mairs & Power Growth Fund (the Growth Fund), the Mairs & Power Balanced Fund (the Balanced Fund) and the Mairs & Power Small Cap Fund (the Small Cap Fund) (each, a Fund and together, the Funds) and Mairs and Power, Inc. (the Adviser) at a meeting of the Board of Trustees held on May 16, 2013. In evaluating the Advisory Contract, the Trustees took into account their cumulative experience with the Adviser and their ongoing review and discussion with the Funds' portfolio managers at meetings throughout the year.
In preparation for the May 16, 2013 meeting, the Adviser provided the Trustees with extensive materials that are relevant to the Trustees' consideration of the Advisory Contract. In addition to their discussion at the May 16 meeting, the independent Trustees discussed the materials and the proposed renewal of the Advisory Contract in a telephone conference on May 10, 2013 with legal counsel present, but with no representatives of the Adviser being present. In reaching their decision to renew the Funds' Advisory Contract with the Adviser, the Trustees considered all factors they believed to be relevant. Each of these factors and the conclusions reached by the Trustees with respect to these factors helped form the basis for the decision to renew the Advisory Contract with the Adviser and are discussed below. In their deliberations, the Trustees did not identify any single factor as determinative.
Nature, Extent and Quality of Services
With respect to the quality and extent of the Adviser's services provided to the Funds, the Trustees noted the Funds' solid performance records over the applicable periods, as discussed in more detail below under "Investment Performance." The Trustees considered the Adviser's extensive experience as an investment adviser and the services it would continue to provide the Funds and their shareholders under the Advisory Contract. The Trustees considered the Adviser's disciplined investment decision-making process, including its emphasis on Midwest stocks and generally low portfolio turnover. The Trustees also took into account other components of the services
46
BOARD OF TRUSTEES' APPROVAL OF INVESTMENT ADVISORY CONTRACT (continued)
provided by the Adviser to the Funds, such as monitoring compliance with applicable requirements under the securities laws, service provider oversight, the Adviser's distribution strategy, the Adviser's risk management system and results of the most recent compliance review. The Trustees concluded that overall they were satisfied with the nature, extent and quality of services provided by the Adviser under the Advisory Contract.
Investment Performance
In reviewing the Funds' performance, the Trustees considered the information provided in connection with the May 16, 2013 Board meeting, noting that they also receive detailed performance information at each regular Board meeting during the year. At the May 16, 2013 meeting, the Trustees considered the investment results for the Funds compared to those mutual funds with similar investment objectives as determined by Morningstar, a representative peer group of funds with similar investment objectives and strategies as determined by the Adviser and to each Fund's respective performance benchmarks. With respect to the Growth Fund and the Balanced Fund, the Trustees reviewed comparative performance information for the one-, five- and ten-year and since inception periods ending December 31, 2012. The Trustees noted that the investment performance of the Growth Fund and the Balanced Fund exceeded the average return of the relevant peer groups and benchmark indices over most of those time periods. With respect to the Small Cap Fund, the Trustees reviewed comparative performance information for the one year and since inception periods ended December 31, 2012. The Trustees noted that the Small Cap Fund's performance has exceeded its benchmark index and peer group averages during those periods and also exceeded the Morningstar category average for the past one-year period. Based upon their review, the Trustees concluded that each Fund's investment performance has been satisfactory.
Management Fees
In evaluating the level of the management fees paid to the Adviser, the Trustees considered both the amount of the fees and the overall expenses of the Funds, compared to those of other similar mutual funds, as well as the quality and quantity of advisory and other services provided by the Adviser. The Trustees noted that the management fees paid to the Adviser by the Growth Fund and the Balanced Fund are either below or in line with the average fees for Morningstar's respective peer group for each Fund and for groups of competitive funds identified by the Adviser. Additionally, the Trustees noted that the Balanced Fund's and Growth Fund's total expense ratios are below the average total expense ratios of funds in their Morningstar peer groups and the competitive funds identified by the Adviser. With respect to the Small Cap Fund, the Trustees noted that while the management fee was above the Morningstar and peer group averages, after giving effect to the Adviser's fee waiver and expense reimbursement, the Fund's total expense ratio was competitive with the Morningstar and peer group averages. The Trustees also considered the Adviser's agreement to waive fees and reimburse the Small Cap Fund's expenses through December 31, 2014 to the extent necessary to limit the annual operating expenses of the Fund for each fiscal year, as a percentage of the Fund's average daily net assets, to 1.25%.
The Trustees then reviewed the fees the Adviser charges its non-mutual fund advisory clients, including retirement funds, other institutional clients and individuals (Advisory Clients) with investment objectives similar to those of the Growth Fund and Balanced Fund, noting that none of the Advisory Clients currently is invested in a small cap investment mandate. The fee rates payable by the Adviser's Advisory Clients range from being exactly the same as the fees paid by the Funds to being lower than the fees paid by the Funds (the Adviser's larger Advisory Clients, many of which are institutional clients, fall into this latter category). The Adviser provided the Trustees with information about the differences in the scope of services provided to its Advisory Clients compared with the scope of those it provides to the Funds. Management noted that the level of investment decision-making is considerably higher with respect to the Funds, because cash flows result in purchase and sale decisions being made by the Adviser virtually every trading day. Other services provided by the Adviser to the Funds include certain administrative services, oversight of the Funds' other service providers, trustee support and providing office facilities and Fund officers. Having considered all of these factors, the Trustees concluded that the nature and extent of services provided to the Funds merit the generally higher management fees paid by the Funds as compared to
47
BOARD OF TRUSTEES' APPROVAL OF INVESTMENT ADVISORY CONTRACT (continued)
Advisory Clients. The Trustees further concluded that the Funds' management fees are fair and reasonable for the services provided.
Costs of Services Provided and Profitability to the Adviser
At the request of the Trustees, the Adviser provided information regarding the Adviser's overall profitability as well as the allocation of profitability between Advisory Clients and the Funds. The profitability of the mutual fund business was further broken down among the Growth, Balanced and Small Cap Funds, as applicable. The Trustees reviewed the Adviser's financial assumptions and methods of expense allocation used. The Trustees noted that the profitability calculation includes fees received by the Adviser under both the Administrative Servicing Agreement and the Advisory Contract. The Trustees believe that the Adviser should be entitled to earn a reasonable level of profit for the services it provides to the Funds. Based on their review, the Trustees concluded that the Adviser's level of profitability from its relationship with the Funds is reasonable.
Other Benefits
The Trustees considered the benefits to the Adviser from soft dollar arrangements whereby the Adviser receives proprietary investment research services from broker-dealers that execute the Funds' purchases and sales of securities. As a general matter, the research services received from broker-dealers are used to service all accounts that invest in equity securities. The Trustees received and reviewed information concerning the Funds' brokerage commissions and allocation of Fund brokerage. The Trustees recognized that the Adviser's profitability would be lower if it did not receive proprietary research for soft dollars in connection with the Funds' brokerage activity. In addition, the Trustees considered that the Adviser's Advisory Clients benefit from access to and research obtained from brokers executing trades on behalf of the Funds. While difficult to measure, the Trustees concluded that the benefits the Adviser receives in this way is fairly modest, given the Funds' relatively low portfolio turnover rates and the research capability that the Adviser itself maintains. The Trustees noted that the Adviser derives reputational benefits from its association with the Funds as well. The Trustees considered the nature and amount of fees paid by the Funds for administrative services provided by the Adviser under the Fund Administration Servicing Agreement. The Trustees concluded that the other benefits realized by the Adviser from its relationship with the Funds were reasonable.
Economies of Scale
The Trustees reviewed the extent to which economies of scale may be realized as the Funds increase in size. The Trustees noted the recent asset growth in each of the Funds. The Trustees noted that the Adviser's approach has been to keep costs to the Funds as low as reasonably possible, including management fee levels. At the same time, the Adviser believes, and the Trustees concur, that it is entitled to earn reasonable returns on its mutual fund business. The Adviser acknowledged that while it is difficult to pinpoint the economies of scale to be realized by the Funds at any particular asset level, there is no question that such economies exist. Accordingly, the Adviser, under the terms of the Advisory Contract for the Growth Fund, established a breakpoint at the $2.5 billion asset level. The breakpoint reduces the management fee applicable to assets managed in excess of $2.5 billion from 60 basis points (0.6 of 1%) to 50 basis points (0.5 of 1%). The Trustees reaffirmed their conclusion that establishing this breakpoint at $2.5 billion forms a reasonable basis for having management fee levels reflect economies of scale for the benefit of Growth Fund shareholders. The Adviser believes, and the Trustees concur, that the consideration of establishing a breakpoint at certain asset levels would be an appropriate way for the Adviser to share its economies of scale in the event that the Balanced and Small Cap Funds were to grow their assets substantially. With respect to the Balanced Fund, considering its current level of assets and low management fee, the Trustees concluded that the absence of breakpoints in the Fund's management fee is reasonable at this time. With respect to the Small Cap Fund, considering its current level of assets and the Adviser's agreement to waive fees and reimburse the Fund's expenses pursuant to the expense waiver agreement mentioned above, the Trustees concluded that the absence of breakpoints in the Fund's management fee is reasonable at this time.
48
In an effort to decrease costs, the Trust intends to reduce the number of duplicate Summary Prospectuses and Annual and Semi-Annual Reports you receive by sending only one copy of each to those addresses shared by two or more accounts and to shareholders reasonably believed to be from the same family or household. Once implemented, if you would like to discontinue householding for your accounts, please call Shareholder Services at (800) 304-7404 to request individual copies of these documents. Once notification to stop householding is received, the Trust will begin sending individual copies thirty days after receiving your request. This policy does not apply to account statements.
49
Our Promise to You
As a shareholder of the Mairs & Power Mutual Funds (Funds), you share both personal and financial information with us. Your privacy is important to us, and we are dedicated to safeguarding your personal and financial information.
Information Provided by Shareholders
In the normal course of doing business, we typically obtain the following non-public personal information about our shareholders:
• Personal information regarding our shareholders' identity such as name, address and social security number;
• Information regarding fund transactions effected by us; and
• Shareholder financial information such as net-worth, assets, income, bank account information and account balances.
How We Manage and Protect Your Personal Information
We do not sell information about current or former shareholders to third parties, nor is it our practice to disclose such information to third parties unless requested or permitted to do so by a shareholder or shareholder representative or, if necessary, in order to process a transaction, service an account or as permitted by law. Additionally, we may share information with outside companies that perform administrative services for us. However, our arrangements with these service providers require them to treat your information as confidential.
In order to protect your personal information, we maintain physical, electronic and procedural safeguards to protect your personal information. Our Privacy Policy restricts the use of shareholder information and requires that it be held in strict confidence.
Shareholder Notifications
We are required by law to annually provide a notice describing our privacy policy. In addition, we will inform you promptly if there are changes to our policy. Please contact us at (800) 304-7404 with questions about this notice.
OTHER INFORMATION
This report is submitted for the general information of the shareholders of the Funds. It is not authorized for distribution to prospective investors unless accompanied or preceded by an effective prospectus. An investor should consider the Funds' investment objectives, risks and expenses carefully before investing or sending money. This and other important information can be found in the Funds' summary prospectuses and full prospectus. To obtain a prospectus, please call Shareholder Services at (800) 304-7404 or visit the Funds' website at www.mairsandpower.com. Please read the prospectus carefully before investing.
This report includes forward-looking statements such as economic predictions and portfolio manager opinions. The statements are subject to change at any time based on market and other conditions. No predictions, forecasts, outlooks, expectations or beliefs are guaranteed.
50
This page is intentionally left blank.
This page is intentionally left blank.
MAIRS & POWER FUNDS TRUST
Mairs & Power Growth Fund, established 1958
Mairs & Power Balanced Fund, established 1961
Mairs & Power Small Cap Fund, established 2011
A No-Load Funds Trust
For Shareholder Services
Call (800) 304-7404
Or write to:
(via Regular Mail)
c/o U.S. Bancorp Fund Services, LLC
P. O. Box 701
Milwaukee, WI 53201-0701
| | (via Overnight or Express Mail)
c/o U.S. Bancorp Fund Services, LLC
3rd Floor
615 East Michigan Street
Milwaukee, WI 53202-0701 | |
For Fund literature and information, visit the Trust's website at:
www.mairsandpower.com
Investment Manager
Mairs and Power, Inc.
W1520 First National Bank Building
332 Minnesota Street
Saint Paul, MN 55101
Custodian
U.S. Bank, N.A.
Custody Operations
1555 North River Center Drive, Suite 302
Milwaukee, WI 53212
Distributor
ALPS Distributors, Inc.
1290 Broadway, Suite 1100
Denver, CO 80203
Mairs and Power, Inc.
c/o U.S. Bancorp Fund Services, LLC
3rd Floor
615 East Michigan Street
Milwaukee, WI 53202-0701
Item 2. Code of Ethics.
Not applicable for semi-annual reports.
Item 3. Audit Committee Financial Expert.
Not applicable for semi-annual reports.
Item 4. Principal Accountant Fees and Services.
Not applicable for semi-annual reports.
Item 5. Audit Committee of Listed Registrants.
Not applicable to registrant.
Item 6. Investments.
(a) Schedule of Investments is included as part of the report to shareholders filed under Item 1 of this Form
(b) Not Applicable.
Item 7. Disclosure of Proxy Voting Policies and Procedures for Closed-End Management Investment Companies.
Not applicable to open-end investment companies.
Item 8. Portfolio Managers of Closed-End Management Investment Companies.
Not applicable to open-end investment companies.
Item 9. Purchases of Equity Securities by Closed-End Management Investment Company and Affiliated Purchasers.
Not applicable to open-end investment companies.
Item 10. Submission of Matters to a Vote of Security Holders.
There has been no material change to the procedures by which shareholders may recommend nominees to the registrant’s board of directors.
1
Item 11. Controls and Procedures.
(a) The registrant’s principal executive officer and principal financial officer have evaluated the registrant’s disclosure controls and procedures as of a date within 90 days of the filing of this report and have concluded that the registrant’s disclosure controls and procedures were effective, as of that date, in ensuring that information required to be disclosed by the registrant in this Form N-CSR was recorded, processed, summarized and reported within the time period specified by the SEC’s rules and forms.
(b) There were no changes in the Registrant’s internal control over financial reporting (as defined in Rule 30a-3(d) under the Act) that occurred during the second fiscal quarter of the period covered by this report that has materially affected, or is reasonably likely to materially affect, the Registrant’s internal control over financial reporting.
Item 12. Exhibits.
(a) (1) Code of Ethics
Mairs & Power Funds Trust Code of Ethics for Principal Executive Officer and Principal Financial Officer.
Attached as exhibit 12(a)(1) to this form.
(2) Certifications required by Rule 30a-2(a) under the Investment Company Act of 1940.
Attached as exhibits 12(a)(2).1 and 12(a)(2).2 to this form.
(3) Any written solicitation to purchase securities under Rule 23c-1 under the Act sent or given during the period covered by the report by or on behalf of the registrant to 10 or more persons. Not applicable to open-end investment companies.
(b) Certifications pursuant to Section 906 of the Sarbanes-Oxley Act of 2002.
Attached as exhibit 12(b) to this form.
2
SIGNATURES
Pursuant to the requirements of the Securities Exchange Act of 1934 and the Investment Company Act of 1940, the registrant has duly caused this report to be signed on its behalf by the undersigned, thereunto duly authorized.
(Registrant) | Mairs & Power Funds Trust | | | | |
| | | | |
By (Signature and Title)* | /s/ William B. Frels | | | | |
| William B. Frels, President | | | | |
| Principal Executive Officer | | | | |
| | | | |
Date | 8/30/2013 | | | | |
| | | | | | | |
Pursuant to the requirements of the Securities Exchange Act of 1934 and the Investment Company Act of 1940, this report has been signed below by the following persons on behalf of the registrant and in the capacities and on the dates indicated.
By (Signature and Title)* | /s/ William B. Frels | | | | |
| William B. Frels, President | | | | |
| Principal Executive Officer | | | | |
| | | | |
Date | 8/30/2013 | | | | |
| | | | |
| | | | |
By (Signature and Title)* | /s/ Andrea C. Stimmel | | | | |
| Andrea C. Stimmel, Treasurer | | | | |
| Principal Financial Officer | | | | |
| | | | |
Date | 8/30/2013 | | | | |
| | | | | | |
* Print the name and title of each signing officer under his or her signature.
3