UNITED STATES
SECURITIES AND EXCHANGE COMMISSION
Washington, D.C. 20549
FORM N-CSR
CERTIFIED SHAREHOLDER REPORT OF REGISTERED
MANAGEMENT INVESTMENT COMPANIES
Investment Company Act file number | 811-22563 |
|
Mairs & Power Funds Trust |
(Exact name of registrant as specified in charter) |
|
332 Minnesota Street, Suite W1520, St. Paul, MN | | 55101 |
(Address of principal executive offices) | | (Zip code) |
|
Andrea C. Stimmel, Chief Compliance Officer & Treasurer, 332 Minnesota Street, Suite
W1520, St. Paul, MN 55101 |
(Name and address of agent for service) |
|
Registrant’s telephone number, including area code: | 651-222-8478 | |
|
Date of fiscal year end: | December 31, 2015 | |
|
Date of reporting period: | June 30, 2015 | |
| | | | | | | | |
Item 1. Reports to Stockholders.

Investing for the long-term
SEMI-ANNUAL REPORT
JUNE 30, 2015
- GROWTH FUND (MPGFX)
est. 1958
- BALANCED FUND (MAPOX)
est. 1961
- SMALL CAP FUND (MSCFX)
est. 2011
Mairs & Power W1520 First National Bank Building, 332 Minnesota Street, St. Paul, Minnesota 55101 www.mairsandpower.com
MAIRS & POWER FUNDS MARKET COMMENTARY (unaudited)
June 30, 2015
In a scenario we have seen for several quarters now, second quarter and the first half of the year delivered "more of the same" as the continuing strength of the dollar and low oil prices remained dominant factors for the economy and the markets, benefiting some companies while presenting a steady headwind against others.
Although low oil prices continued to pressure exploration and production companies as well as their equipment and service suppliers, the continued pressure on energy prices broadly benefited companies across multiple industries where fuel and energy or petroleum-based raw materials represent a significant portion of their costs. At the same time, the strong dollar continued to hurt export-oriented U.S. companies that do most or all of their manufacturing domestically. These companies find themselves squeezed between higher dollar-based production costs and less competitive prices when selling against foreign manufacturers. The industrial sector in particular continued to see this impact on revenue and profits in both the second quarter and first half.
One emerging concern we have is the market's current focus on chasing short-term returns wherever they can be found while ignoring earnings growth and stock valuations. Nine of the top ten factors driving market performance during the second quarter were technical and momentum factors instead of valuation fundamentals, according to a report from Bank of America Merrill Lynch. The top performing sectors in the quarter, technology and health care, were driven by merger and acquisition (M&A) or divestiture activity. Typically the market goes through periods where it loves either one or the other deal environment, but it currently seems enamored with both.
The market's focus on momentum and away from fundamentals hurt our performance in the second quarter and the first half for the simple reason that, as long-term investors, our investment discipline is all about the fundamentals. Nevertheless, we remain focused on finding and keeping stocks of good companies which have durable competitive advantages. For example, where stocks in the energy and industrial sectors have been punished, we look for well-managed companies able to get in front of current pressures by reducing their costs. We believe they present a buying opportunity and good value for patient investors. We will leave the momentum and headline chasing to others.
Worries about Greece, the strong dollar and expectations of higher interest rates all weighed on the market in both the second quarter and first half. The S&P 500 Total Return (TR) was up 0.28% and 1.23%, the Dow Jones Industrial Average TR was down 0.29% and up a slight 0.03%, the Barclay's Government/Credit Bond Index return was down 2.10% and down 0.30%, and the S&P Small Cap 600 TR was plus 0.19% and 4.16%, in each period respectively.
Outlook
There is no meaningful change to our outlook, which remains cautious near term and quite positive longer term. While our outlook is generally positive, we believe it will be difficult to generate returns above the level of earnings growth in the near term. Market expectations continue to call for the Federal Reserve (Fed) to raise short term interest rates later this year after an historic period of holding them near zero. We share that view and expect a series of gradual interest rate hikes beginning in the third quarter. Employment and GDP growth continue to indicate slow, steady economic expansion in the U.S. Moves by both Europe and Japan intended to add liquidity and stimulate growth show some positive early signs, which should help our holdings in export-oriented industrial companies down the road.
Given subdued earnings growth expectations and low interest rates, the market remains at the high end of what we view as an appropriate valuation range across key metrics. The dividend yield for the S&P 500 stands very close to its 10 year average of 2.13%, which is reasonable. However, the price/earnings ratio and enterprise value to sale ratios for the S&P 500 both have remained above their long term averages (10-year average P/E, 13.89; 10-year average EV/sales, 1.94) for more than a year and stand near the high end of their historic ranges. This is likely to limit upside movement in the overall market in the near term.
2
MAIRS & POWER FUNDS MARKET COMMENTARY (unaudited) (continued)
While we are not chasing after the M&A and spin-off stories that are driving much of the current market, we remain confident in our approach and still see good opportunities to buy high quality companies with demonstrated durable competitive advantages.
The S&P 500 Total Return (TR) Index is an unmanaged index of 500 common stocks that is generally considered representative of the United States stock market. It tracks both the capital gains of a group of stocks over time, and assumes that any cash distributions, such as dividends, are reinvested back into the index. It is not possible to invest directly in an index.
Dow Jones Industrial Average TR Index is a price-weighted average of 30 significant stocks traded on the New York Stock Exchange and the Nasdaq. It is not possible to invest directly in an index.
Barclays Government/Credit Bond Index. Barclays is composed of high-quality, investment-grade United States government and corporate fixed income securities with maturities greater than one year. It is not possible to invest directly in an index.
The S&P Small Cap Total Return (TR) is an index of small-company stocks managed by Standard and Poor's that covers a broad range of small cap stocks in the United States. The index is weighted according to market capitalization and covers about 3-4% of total market equities in the United States. It tracks both the capital gains of the group of stocks over time, and assumes that any cash distributions, such as dividends, are reinvested back into the index. It is not possible to invest directly in an index.
Dividend Yield is a ratio that shows how much a company pays out in dividends each year relative to its share price.
P/E (price per earnings) Ratio is the ratio of a company's share price to its per-share earnings.
EV/Sales (enterprise-value-to-sales) Ratio is a valuation measure that compares the enterprise value of a company to the company's sales.
Gross Domestic Product (GDP) is the monetary value of all the finished goods and services produced within a country's borders in a specific time period, though GDP is usually calculated on an annual basis.
3
MAIRS & POWER GROWTH FUND (unaudited)
To Our Shareholders: June 30, 2015
For the second quarter and first half ending June 30, 2015, the Mairs & Power Growth Fund was down 1.35% and 0.54% respectively, underperforming both its benchmark, the S&P 500 Total Return (TR) Index, which gained 0.28% and 1.23%, and its peer group, the Lipper Multi Cap Core Funds Index, which was up 0.15% and 2.31%, for the periods.
The Fund's performance in both the quarter and first half was negatively impacted by our overweight position in the industrial sector, which remains under pressure due to the strong dollar, as described in the market overview above. In addition, stock selection in healthcare hurt our performance. Although we are overweight in healthcare which was strong in both the quarter and the first half, we have focused on pharmaceutical and med tech industries where we believe demographics will drive long term demand. Recently we have seen increased merger and acquisition (M&A) activity in the insurance segment, where we have no exposure, and which drove outperformance in the overall healthcare sector.
The largest individual stock contributor to underperformance in both the second quarter and the first half was Stratasys (SSYS), a leader in 3D printing technology. We had gotten into the stock early on and had exited our position entirely in 2012 with a healthy gain after the market discovered the company and drove valuations to premium levels at 15 times revenue. We got back into the stock as valuations became more reasonable, but were early in our re-entry. The industry is still in its infancy and its growth rate is choppy, which has impacted the stock this year. But we remain convinced that, longer term, additive manufacturing will be transformative across multiple sectors in the economy and Stratasys is very well positioned to remain a leader in that transformation.
Perhaps it's the warmer weather, but the second quarter puts us in a nautical mood. Experienced sailors know that races are often won on the upwind leg. Those who can sail tight into the wind, change course at the right time without adding unnecessary tacks and take advantage of every bit of forward momentum come out ahead. It's an image that fits the current investing environment. Two of our portfolio companies neatly illustrate the point. They each highlight the type of managements we like to invest in, those who skillfully navigate at both the strategic and tactical levels.
Mairs & Power Growth Fund (MPGFX) Second Quarter Results (3/31/15 – 6/30/15)
Top Performers
| Second Quarter (3/31/15 – 6/30/15) | | Year To Date (12/31/14 – 6/30/15) | |
NVE Corporation | | | 13.48 | % | | The Walt Disney Company | | | 19.95 | % | |
St. Jude Medical, Inc. | | | 11.45 | % | | Fiserv, Inc. | | | 15.48 | % | |
Pentair Ltd. | | | 9.04 | % | | St. Jude Medical, Inc. | | | 11.13 | % | |
The Walt Disney Company | | | 8.54 | % | | Ecolab, Inc. | | | 6.95 | % | |
General Electric Co. | | | 6.81 | % | | Target Corp. | | | 6.31 | % | |
Weak Performers
| Second Quarter (3/31/15 – 6/30/15) | | Year To Date (12/31/14 – 6/30/15) | |
Stratasys, Inc. | | | -34.10 | % | | CH Robinson World Wide, Inc. | | | -17.92 | % | |
CH Robinson World Wide, Inc. | | | -15.07 | % | | Qualcomm, Inc. | | | -16.97 | % | |
MTS Systems Corp. | | | -9.14 | % | | Graco, Inc. | | | -12.64 | % | |
3M Co. | | | -6.74 | % | | Emerson Electric Co. | | | -11.44 | % | |
Medtronic, Inc. | | | -5.27 | % | | 3M Co. | | | -7.33 | % | |
Past performance is no guarantee of future results.
4
MAIRS & POWER GROWTH FUND (unaudited) (continued)
Ecolab (ECL) was a top contributor to performance in the first half despite facing headwinds from both lower oil prices and the stronger dollar. Almost half the company's revenues come from outside the U.S. across its institutional cleaning, sanitizing, water and energy management businesses. While it sources some products in its overseas markets, Ecolab still faces cost and price pressure from the strong dollar. In addition, a few years ago the company had made two acquisitions, Nalco and Champion Technologies, adding to its global presence in the oil and energy services arena. Last year, this segment contributed nearly one-third of the company's revenues. While lower oil prices benefit its legacy institutional and hospitality businesses in both raw material and fuel costs, the rapid decline in oil prices has pressured results in Ecolab's energy services segment. Ecolab management has transparently addressed both the currency impact and oil price issues with investors and has mitigated the effects somewhat through cost controls. Ecolab continues to impress us with exceptional tactical management of its business.
Hormel Foods (HRL) also was among the top contributors to performance in the first half. The recent acquisitions of strong niche brands such as Skippy (peanut butter), Muscle Milk (protein enhanced nutrition beverage) and Applegate (organically raised meats) are all moves management has taken to evolve from its heritage as a commodity meat processor to a multi-brand supplier of ready-to-use protein products where consumer demand is strong and growing. As it moves up the value-chain, Hormel's solid branding and merchandising capabilities strengthen these newly acquired businesses beyond the results they could achieve as stand-alone entities. On the tactical side, the recent avian influenza outbreak across the upper Midwest is challenging Hormel's Jennie-O Turkey brand business. Management acted quickly and decisively to limit the impact, cutting costs and curtailing its meat processing operations as supplies tightened.
Both companies exemplify what we would describe as skillful sailing into the wind.
Mark L. Henneman
Lead Manager | | Andrew R. Adams
Co-Manager | |
The Fund's investment objective, risks, charges and expenses must be considered carefully before investing. The summary prospectus or full prospectus contains this and other important information about the Fund, and they may be obtained by calling Shareholder Services at (800) 304-7404 or visiting www.mairsandpower.com. Read the summary prospectus or full prospectus carefully before investing.
All holdings in the portfolio are subject to change without notice and may or may not represent current or future portfolio composition. The mention of specific securities is not intended as a recommendation or an offer of a particular security, nor is it intended to be a solicitation for the purchase or sale of any security.
All investments have risks. The Growth Fund is designed for long-term investors. Equity investments are subject to market fluctuations, and the Fund's share price can fall because of weakness in the broad market, a particular industry, or specific holdings. Investments in small and midcap companies generally are more volatile. International investing risks include among others political, social or economic instability, difficulty in predicting international trade patterns, taxation and foreign trading practices, and greater fluctuations in price than United States corporations.
Diversification does not guarantee profit or protect against loss.
The S&P 500 Total Return (TR) Index is an unmanaged index of 500 common stocks that is generally considered representative of the United States stock market. It tracks both the capital gains of a group of stocks over time, and assumes that any cash distributions, such as dividends, are reinvested back into the index. It is not possible to invest directly in an index.
Lipper Multi-Cap Core Funds Index is an unmanaged index considered representative of multi-cap core funds tracked by Lipper. It is not possible to invest directly in an index.
5
Mairs & Power Growth Fund
PERFORMANCE INFORMATION (unaudited) June 30, 2015
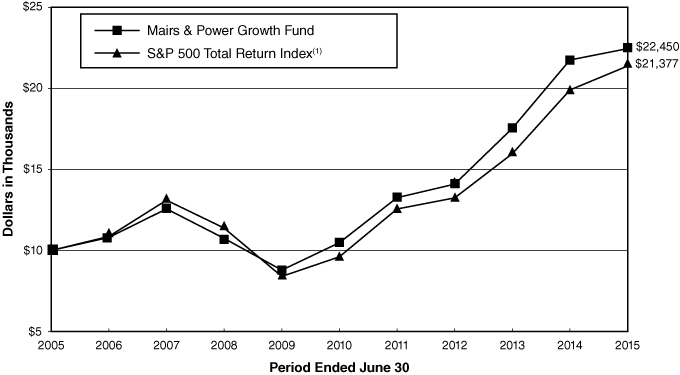
Ten years of investment performance (through June 30, 2015)
This chart illustrates the performance of a hypothetical $10,000 investment made in the Fund 10 years ago.
Average annual total returns for periods ended June 30, 2015
| | | 1 year | | 5 years | | 10 years | | 20 years | |
Mairs & Power Growth Fund | | | 3.22 | % | | | 16.46 | % | | | 8.42 | % | | | 11.89 | % | |
S&P 500 Total Return Index(1) | | | 7.42 | % | | | 17.34 | % | | | 7.89 | % | | | 8.91 | % | |
Performance data quoted represents past performance and does not guarantee future results. All performance information shown includes the reinvestment of dividend and capital gain distributions, but does not reflect the deduction of taxes that a shareholder would pay on Fund distributions or the redemption of Fund shares. The investment return and principal value of an investment will fluctuate so that an investor's shares, when redeemed, may be worth more or less than their original cost. Current performance of the Fund may be lower or higher than the performance quoted. For the most recent month-end performance figures, visit the Fund's website at www.mairsandpower.com or call Shareholder Services at (800) 304-7404.
(1) The S&P 500 Total Return Index is an unmanaged index of 500 common stocks which assumes reinvestment of dividends that is generally considered representative of the U.S. stock market. It is not possible to invest directly in an index.
6
Mairs & Power Growth Fund
FUND INFORMATION (unaudited) June 30, 2015
Portfolio Managers
Mark L. Henneman, lead manager since July 1, 2013, co-manager from January 1, 2006 through June 30, 2013
University of Minnesota, MBA Finance 1990
Andrew R. Adams, co-manager since January 1, 2015, University of Wisconsin-Madison, MS Finance 1997
General Information
Fund Symbol | | | MPGFX | | |
Net Asset Value (NAV) Per Share | | $ | 114.72 | | |
Expense Ratio | | | 0.65 | %1 | |
Portfolio Turnover Rate | | | 6.74 | % | |
Sales Charge | | | None2 | | |
Fund Inception Year | | | 1958 | | |
Portfolio Composition
Top Ten Portfolio Holdings
(Percent of Total Net Assets) 3
Ecolab Inc | | | 4.5 | % | |
US Bancorp/MN | | | 4.2 | | |
Honeywell International Inc | | | 3.8 | | |
| 3M Co | | | 3.7 | | |
Valspar Corp/The | | | 3.6 | | |
Bemis Co Inc | | | 3.4 | | |
Medtronic PLC | | | 3.4 | | |
Graco Inc | | | 3.1 | | |
Johnson & Johnson | | | 3.0 | | |
Schlumberger Ltd | | | 3.0 | | |
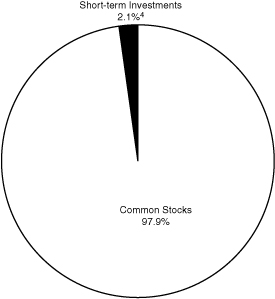
Portfolio Diversification
(Percent of Total Net Assets)
Common Stocks 97.9% | |
Industrials | | | 30.1 | % | |
Health Care | | | 17.9 | | |
Materials | | | 13.9 | | |
Information Technology | | | 11.3 | | |
Financials | | | 10.5 | | |
Consumer Staples | | | 5.8 | | |
Consumer Discretionary | | | 4.7 | | |
Energy | | | 3.0 | | |
Utilities | | | 0.7 | | |
Short-term Investments 2.1%4 | | | 2.1 | | |
| | | | 100.0 | % | |
1 Ratio has been annualized for the six month period ended June 30, 2015.
2 Although the Fund is no-load, investment management fees and other expenses still apply.
3 All holdings in the portfolio are subject to change without notice and may or may not represent current or future portfolio composition. The mention of specific securities is not intended as a recommendation or offer for a particular security, nor is it intended to be a solicitation for the purchase or sale of any security.
4 Represents short-term investments and other assets and liabilities (net).
The Global Industry Classification Standard (GICS®) was developed by and/or is the exclusive property of MSCI, Inc. and Standard & Poor's Financial Services LLC ("S&P"). GICS is a service mark of MSCI, Inc. and S&P and has been licensed for use by Mairs and Power, Inc.
7
Mairs & Power Growth Fund
SCHEDULE OF INVESTMENTS (unaudited) June 30, 2015
Shares | | Security Description | | Fair Value | |
| | | COMMON STOCKS 97.9% | |
| | | CONSUMER DISCRETIONARY 4.7% | |
| | 1,505,000 | | | Target Corp | | $ | 122,853,150 | | |
| | 640,000 | | | Walt Disney Co/The | | | 73,049,600 | | |
| | | | 195,902,750 | | |
| | | CONSUMER STAPLES 5.8% | |
| | 2,060,000 | | | General Mills Inc | | | 114,783,200 | | |
| | 2,200,000 | | | Hormel Foods Corp | | | 124,014,000 | | |
| | | | 238,797,200 | | |
| | | ENERGY 3.0% | |
| | 1,450,000 | | | Schlumberger Ltd (a) | | | 124,975,500 | | |
| | | FINANCIALS 10.5% | |
| | 230,000 | | | American Express Co | | | 17,875,600 | | |
| | 1,910,000 | | | Associated Banc-Corp | | | 38,715,700 | | |
| | 1,730,000 | | | Principal Financial Group Inc | | | 88,731,700 | | |
| | 300,000 | | | Travelers Cos Inc/The | | | 28,998,000 | | |
| | 4,020,000 | | | US Bancorp/MN | | | 174,468,000 | | |
| | 1,550,000 | | | Wells Fargo & Co | | | 87,172,000 | | |
| | | | 435,961,000 | | |
| | | HEALTH CARE 17.9% | |
| | 1,450,000 | | | Baxter International Inc | | | 101,398,500 | | |
| | 924,300 | | | Bio-Techne Corp | | | 91,015,821 | | |
| | 1,290,000 | | | Johnson & Johnson | | | 125,723,400 | | |
| | 1,920,000 | | | Medtronic PLC (f) | | | 142,272,000 | | |
| | 840,000 | | | Patterson Cos Inc | | | 40,866,000 | | |
| | 1,230,000 | | | Pfizer Inc | | | 41,241,900 | | |
| | 1,760,000 | | | Roche Holding AG ADR (e) | | | 61,723,200 | | |
| | 1,400,000 | | | St Jude Medical Inc | | | 102,298,000 | | |
| | 350,300 | | | Zimmer Holdings Inc | | | 38,263,269 | | |
| | | | 744,802,090 | | |
| | | INDUSTRIALS 30.1% | |
| | 1,005,000 | | | 3M Co | | | 155,071,500 | | |
| | 1,400,000 | | | CH Robinson Worldwide Inc | | | 87,346,000 | | |
| | 283,853 | | | Deluxe Corp | | | 17,598,886 | | |
| | 3,420,000 | | | Donaldson Co Inc | | | 122,436,000 | | |
| | 2,160,000 | | | Emerson Electric Co | | | 119,728,800 | | |
| | 1,450,000 | | | Fastenal Co | | | 61,161,000 | | |
| | 290,000 | | | G&K Services Inc, Class A | | | 20,050,600 | | |
| | 540,000 | | | Generac Holdings Inc (b) | | | 21,465,000 | | |
| | 2,310,000 | | | General Electric Co | | | 61,376,700 | | |
8
Mairs & Power Growth Fund
SCHEDULE OF INVESTMENTS (unaudited) (continued) June 30, 2015
Shares | | Security Description | | Fair Value | |
| | | COMMON STOCKS (continued) | |
| | | INDUSTRIALS (continued) | |
| | 1,800,000 | | | Graco Inc | | $ | 127,854,000 | | |
| | 1,550,000 | | | Honeywell International Inc | | | 158,053,500 | | |
| | 1,660,000 | | | Pentair PLC (a) | | | 114,125,000 | | |
| | 1,820,000 | | | Toro Co/The | | | 123,359,600 | | |
| | 640,000 | | | United Parcel Service Inc, Class B | | | 62,022,400 | | |
| | | | 1,251,648,986 | | |
| | | INFORMATION TECHNOLOGY 11.3% | |
| | 784,299 | | | Badger Meter Inc (d) | | | 49,795,143 | | |
| | 1,700,000 | | | Corning Inc | | | 33,541,000 | | |
| | 1,715,152 | | | Cray Inc (b) | | | 50,614,136 | | |
| | 1,000,000 | | | Fiserv Inc (b) | | | 82,830,000 | | |
| | 982,849 | | | MTS Systems Corp (d) | | | 67,767,439 | | |
| | 350,000 | | | NVE Corp (d) | | | 27,440,000 | | |
| | 940,000 | | | QUALCOMM Inc | | | 58,872,200 | | |
| | 1,100,000 | | | Stratasys Ltd (a) (b) | | | 38,423,000 | | |
| | 2,970,000 | | | Western Union Co/The | | | 60,380,100 | | |
| | | | 469,663,018 | | |
| | | MATERIALS 13.9% | |
| | 3,170,000 | | | Bemis Co Inc | | | 142,681,700 | | |
| | 1,639,999 | | | Ecolab Inc | | | 185,434,687 | | |
| | 2,481,600 | | | HB Fuller Co | | | 100,802,592 | | |
| | 1,830,000 | | | Valspar Corp/The | | | 149,730,600 | | |
| | | | 578,649,579 | | |
| | | UTILITIES 0.7% | |
| | 1,360,000 | | | MDU Resources Group Inc | | | 26,560,800 | | |
| | | | TOTAL COMMON STOCKS
(cost $2,207,067,386) | | $ | 4,066,960,923 | | |
| | | SHORT-TERM INVESTMENTS 1.9% | |
| 78,753,754 | | | First American Prime Obligations Fund, Class Z, 0.03% (c)
(cost $78,753,754) | | $ | 78,753,754 | | |
| | | | TOTAL INVESTMENTS 99.8%
(cost $2,285,821,140) | | $ | 4,145,714,677 | | |
| | | | | OTHER ASSETS AND LIABILITIES (NET) 0.2% | | | 7,286,825 | | |
| | | | | TOTAL NET ASSETS 100.0% | | $ | 4,153,001,502 | | |
(a) Foreign security denominated in U.S. dollars. As of June 30, 2015, these securities represented $277,523,500 or 6.7% of total net assets.
9
Mairs & Power Growth Fund
SCHEDULE OF INVESTMENTS (unaudited) (continued) June 30, 2015
(b) Non-income producing.
(c) The rate quoted is the annualized seven-day effective yield as of June 30, 2015.
(d) Affiliated company.
(e) American Depositary Receipt.
(f) Issuer headquartered overseas but considered domestic. In determining whether a security is foreign or domestic, the Adviser will generally look at the location of the headquarters of the issuer. However, if the issuer is believed by the Adviser to be headquartered in a jurisdiction primarily for tax purposes, the Adviser will consider the following additional factors; 1) the location of the primary exchange trading its securities; 2) where it derives the majority of its revenues, or 3) where it earns the majority of its profits.
The Global Industry Classification Standard (GICS®) was developed by and/or is the exclusive property of MSCI, Inc. and Standard & Poor's Financial Services LLC ("S&P"). GICS is a service mark of MSCI, Inc. and S&P and has been licensed for use by Mairs and Power, Inc.
See accompanying Notes to Financial Statements.
10
MAIRS & POWER BALANCED FUND (unaudited)
To Our Shareholders: June 30, 2015
For the second quarter and six months ending June 30, 2015, the Mairs & Power Balanced Fund was down 1.56% and 0.79% respectively. The Fund underperformed its benchmark composite index (60% S&P 500 Total Return (TR) Index and 40% Barclays Government/Credit Bond Index), which was down 0.67% in the quarter and up 0.73% for the first half.
Much of the Fund's equity performance in both the second quarter and the first half can be explained by the dollar and interest rates. The Fund's performance in both periods was negatively impacted by our overweight position in the industrial sector, which remains under pressure due to the strong dollar as described in the market overview above. While the industrial sector has underperformed for the first half, we still like the names we hold and believe they represent real value for patient investors at their current levels.
The Federal Reserve is expected to begin raising rates later this year after an historic period of holding short term rates near zero. While much speculation has centered around when that will occur, we believe the more important question for investors is the pace at which rates will rise, which we believe will be modest. The market's anticipation of rising rates has had several effects which impacted the Fund's performance, some positively and some negatively. The financial sector generally, and banks in particular, did well in anticipation of rising rates since a steeper yield curve typically benefits their earnings. Conversely, investor focus on dividend paying stocks lost favor in anticipation of rising interest rates, which has made for choppy performance among many high yield dividend stocks. In particular, utility stocks pulled back as they again demonstrated their historical inverse relationship to interest rates. While this is a short term reaction to anticipated rising rates, the high quality stocks we hold should continue to provide a stream of income through dividends longer term.
Mairs & Power Balanced Fund (MAPOX) Second Quarter Results (3/31/15 – 6/30/15)
Top Performers
Second Quarter (3/31/15 – 6/30/15) | | Year To Date (12/31/14 – 6/30/15) | |
Eli Lilly & Co. | | | 14.64 | % | | Eli Lilly & Co. | | | 19.79 | % | |
Abbvie, Inc. | | | 14.50 | % | | Western Union Co. | | | 12.28 | % | |
JPMorgan Chase & Co. | | | 11.57 | % | | JPMorgan Chase & Co. | | | 7.05 | % | |
Pentair Ltd. | | | 9.04 | % | | Ecolab, Inc. | | | 6.95 | % | |
General Electric Co. | | | 6.81 | % | | Target Corp. | | | 6.31 | % | |
Weak Performers
Second Quarter (3/31/15 – 6/30/15) | | Year To Date (12/31/14 – 6/30/15) | |
CH Robinson World Wide, Inc. | | | -15.07 | % | | CH Robinson World Wide, Inc. | | | -17.92 | % | |
Corning Inc. | | | -13.29 | % | | Corning Inc. | | | -15.19 | % | |
Deluxe Corp. | | | -10.79 | % | | United Parcel Services, Inc., | | | | | |
3M Co. | | | -6.74 | % | | Class B | | | -14.06 | % | |
Medtronic, Inc. | | | -5.27 | % | | Emerson Electric Co. | | | -11.44 | % | |
| | | | | Exxon Mobil Corp. | | | -11.24 | % | |
Past performance is no guarantee of future results.
In addition to the financial sector, health care and consumer discretionary were also positive contributors to Fund performance in both the second quarter and first half. For individual stocks, the top contributors in both periods tended towards larger cap names such as JP Morgan Chase (JPM), Eli Lilly (LLY), General Electric (GE) and Abbot Labs (ABT). In addition, AbbVie (ABBV), the bio-pharmaceutical development company spun off from Abbott Labs in 2013, was a top contributor in the second quarter.
11
MAIRS & POWER BALANCED FUND (unaudited) (continued)
While economic indicators in the U.S. continue to show some modest improvements in GDP growth and declining unemployment, progress is neither straight line, nor without challenges. Although we are beginning to see some positive signs, concerns remain about the slow growth in Europe, Japan and China and the impact those economies have on the U.S. economy and interest rates. While macroeconomic worries and market ups and downs drive headlines, the Fund continues to focus on core holdings where we can expect to establish meaningful positions based on the fundamentals of individual stocks. We continue to hone the quality of the overall portfolio, both through the names we choose to own and those we choose to sell. Current out-of-favor sectors present us with buying opportunities for names we know and like. At the same time, we exited eight smaller positions in the quarter that we have determined will never become core positions. We also made a strategic shift out of British Petroleum (BP) into Chevron (CVX). We believe this is a higher quality holding, as BP has paid a heavy price in fines from its Gulf oil spill and the following litigation costs, as well as its large exposure in the Russian Republic. We prefer Chevron, which has neither.
On the fixed income side of the portfolio, the bond market sold off in June over concerns about a spillover from the Greek crisis as well as anticipation of Fed action on rates. This sell-off pushed the broad investment grade index into negative returns for the first six months (though it quickly recovered after the end of the quarter). In an unprecedented scenario which has existed through the first half of the year, four European central banks currently are offering their depositors negative interest rates, adding to the overall weak fixed income market. We continue to migrate the fixed income portfolio at the margins to shorter duration (the average length to maturity) and closer to the benchmark duration.
Ronald L. Kaliebe
Lead Manager | | Kevin V. Earley
Co-Manager | |
The Fund's investment objective, risks, charges and expenses must be considered carefully before investing. The summary prospectus or full prospectus contains this and other important information about the Fund, and they may be obtained by calling Shareholder Services at (800) 304-7404 or visiting www.mairsandpower.com. Read the summary prospectus or full prospectus carefully before investing.
All holdings in the portfolio are subject to change without notice and may or may not represent current or future portfolio composition. The mention of specific securities is not intended as a recommendation or an offer of a particular security, nor is it intended to be a solicitation for the purchase or sale of any security.
All investments have risks. The Balanced Fund is designed for long-term investors. Equity investments are subject to market fluctuations, and the Fund's share price can fall because of weakness in the broad market, a particular industry, or specific holdings. Investments in small and midcap companies generally are more volatile. International investing risks include among others political, social or economic instability, difficulty in predicting international trade patterns, taxation and foreign trading practices, and greater fluctuations in price than United States corporations. The Fund is subject to yield and share price variances with changes in interest rates and market conditions. Investors should note that if interest rates rise significantly from current levels, bond total returns will decline and may even turn negative in the short-term. There is also a chance that some of the Fund's holdings may have their credit rating downgraded or may default.
Diversification does not guarantee profit or protect against loss.
The Composite Index reflects an unmanaged portfolio comprised of 60% of the S&P 500 Index and 40% of the Barclays Government/Credit Bond Index. It is not possible to invest directly in an index.
Barclays government/Credit Bond Index is composed of high-quality, investment-grade United States government and corporate fixed income securities with maturities greater than one year. It is not possible to invest directly in an index.
The S&P 500 Total Return (TR) Index is an unmanaged index of 500 common stocks that is generally considered representative of the United States stock market. It tracks both the capital gains of a group of stocks over time, and assumes that any cash distributions, such as dividends, are reinvested back into the index. It is not possible to invest directly in an index.
12
Mairs & Power Balanced Fund
PERFORMANCE INFORMATION (unaudited) June 30, 2015
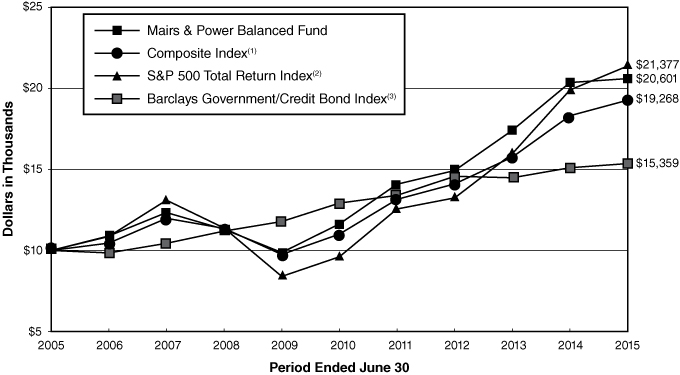
Ten years of investment performance (through June 30, 2015)
This chart illustrates the performance of a hypothetical $10,000 investment made in the Fund 10 years ago.
Average annual total returns for periods ended June 30, 2015
| | | 1 year | | 5 years | | 10 years | | 20 years | |
Mairs & Power Balanced Fund | | | 1.19 | % | | | 12.10 | % | | | 7.50 | % | | | 9.43 | % | |
Composite Index(1) | | | 5.22 | % | | | 11.85 | % | | | 6.78 | % | | | 7.92 | % | |
S&P 500 Total Return Index(2) | | | 7.42 | % | | | 17.34 | % | | | 7.89 | % | | | 8.91 | % | |
Barclays Government/Credit
Bond Index(3) | | | 1.69 | % | | | 3.52 | % | | | 4.38 | % | | | 5.63 | % | |
Performance data quoted represents past performance and does not guarantee future results. All performance information shown includes the reinvestment of dividend and capital gain distributions, but does not reflect the deduction of taxes that a shareholder would pay on Fund distributions or the redemption of Fund shares. The investment return and principal value of an investment will fluctuate so that an investor's shares, when redeemed, may be worth more or less than their original cost. Current performance of the Fund may be lower or higher than the performance quoted. For the most recent month-end performance figures, visit the Fund's website at www.mairsandpower.com or call Shareholder Services at (800) 304-7404.
(1) The Composite Index reflects an unmanaged portfolio comprised of 60% of the S&P 500 Index and 40% of the Barclays Government/Credit Bond Index. It is not possible to invest directly in an index.
(2) The S&P 500 Total Return Index is an unmanaged index of 500 common stocks which assumes reinvestment of dividends that is generally considered representative of the U.S. stock market. It is not possible to invest directly in an index.
(3) The Barclays Government/Credit Bond Index is composed of high-quality, investment-grade United States government and corporate fixed income securities with maturities greater than one year. It is not possible to invest directly in an index.
13
Mairs & Power Balanced Fund
FUND INFORMATION (unaudited) June 30, 2015
Portfolio Managers
Ronald L. Kaliebe, lead manager since July 1, 2013, co-manager from January 1, 2006 through June 30, 2013
University of Wisconsin-Madison, MBA Finance 1980
Kevin V. Earley, co-manager since January 1, 2015, University of Minnesota, MBA Finance 1990
General Information
Fund Symbol | | MAPOX | |
Net Asset Value (NAV) Per Share | | $ | 85.07 | | |
Expense Ratio | | | 0.72 | %1 | |
Portfolio Turnover Rate | | | 8.55 | % | |
Sales Charge | | | None2 | | |
Fund Inception Year | | | 1961 | | |
Portfolio Composition
Top Ten Common Stock Holdings
(Percent of Total Net Assets) 3
United Parcel Service Inc, Class B | | | 2.8 | % | |
Medtronic PLC | | | 2.6 | | |
US Bancorp/MN | | | 2.6 | | |
Target Corp | | | 2.4 | | |
Exxon Mobil Corp | | | 2.3 | | |
Deluxe Corp | | | 2.1 | | |
Johnson & Johnson | | | 2.0 | | |
Emerson Electric Co | | | 2.0 | | |
Ecolab Inc | | | 1.9 | | |
Schlumberger Ltd | | | 1.9 | | |
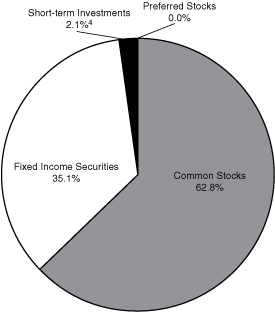
Portfolio Diversification
(Percent of Total Net Assets)
Fixed Income Securities 35.1% | |
Corporate Bonds | | | 28.2 | % | |
Federal Agency Obligations | | | 4.3 | | |
Asset Backed Securities | | | 1.5 | | |
Preferred Securities | | | 1.1 | | |
Common Stocks 62.8% | |
Industrials | | | 15.4 | | |
Health Care | | | 12.1 | | |
Financials | | | 9.2 | | |
Energy | | | 6.6 | | |
Information Technology | | | 6.0 | | |
Materials | | | 5.1 | | |
Consumer Discretionary | | | 3.5 | | |
Consumer Staples | | | 2.9 | | |
Utilities | | | 2.0 | | |
Preferred Stocks 0.0% | | | 0.0 | | |
Short-term Investments 2.1%4 | | | 2.1 | | |
| | | | 100.0 | % | |
1 Ratio has been annualized for the six month period ended June 30, 2015.
2 Although the Fund is no-load, investment management fees and other expenses still apply.
3 All holdings in the portfolio are subject to change without notice and may or may not represent current or future portfolio composition. The mention of specific securities is not intended as a recommendation or offer for a particular security, nor is it intended to be a solicitation for the purchase or sale of any security.
4 Represents short-term investments and other assets and liabilities (net).
The Global Industry Classification Standard (GICS®) was developed by and/or is the exclusive property of MSCI, Inc. and Standard & Poor's Financial Services LLC ("S&P"). GICS is a service mark of MSCI, Inc. and S&P and has been licensed for use by Mairs and Power, Inc.
14
Mairs & Power Balanced Fund
SCHEDULE OF INVESTMENTS (unaudited) June 30, 2015
Par Value | | Security Description | | Fair Value | |
| | | FIXED INCOME SECURITIES 35.1% | |
| | | FEDERAL AGENCY OBLIGATIONS 4.3% | |
$ | 1,000,000 | | | Federal National Mortgage Association | | | 3.250 | % | | 03/27/28 | | $ | 989,466 | | |
| | 500,000 | | | Federal Home Loan Banks | | | 3.480 | % | | 10/29/29 | | | 500,176 | | |
| | 2,030,000 | | | Federal Home Loan Banks | | | 3.620 | % | | 11/21/29 | | | 1,974,250 | | |
| | 500,000 | | | Federal Home Loan Banks | | | 3.625 | % | | 11/26/29 | | | 500,178 | | |
| | 1,400,000 | | | Federal Home Loan Banks | | | 3.650 | % | | 12/19/29 | | | 1,377,936 | | |
| | 1,000,000 | | | Federal Farm Credit Banks | | | 3.590 | % | | 12/24/29 | | | 994,719 | | |
| | 1,000,000 | | | Federal National Mortgage Association | | | 3.400 | % | | 02/27/30 | | | 975,821 | | |
| | 1,000,000 | | | Federal Farm Credit Banks | | | 3.440 | % | | 03/28/31 | | | 953,606 | | |
| | 1,400,000 | | | Federal National Mortgage Association | | | 3.520 | % | | 10/17/31 | | | 1,341,886 | | |
| | 2,000,000 | | | Federal National Mortgage Association | | | 3.500 | % | | 09/10/32 | | | 1,837,016 | | |
| | 500,000 | | | Federal National Mortgage Association | | | 3.400 | % | | 09/27/32 | | | 482,038 | | |
| | 1,590,000 | | | Federal Home Loan Banks | | | 3.300 | % | | 01/18/33 | | | 1,519,053 | | |
| | 3,000,000 | | | Federal Farm Credit Banks | | | 3.480 | % | | 02/07/33 | | | 2,904,162 | | |
| | 3,482,000 | | | Federal National Mortgage Association | | | 3.500 | % | | 03/07/33 | | | 3,383,982 | | |
| | 500,000 | | | Federal National Mortgage Association | | | 3.250 | % | | 04/29/33 | | | 479,007 | | |
| | 500,000 | | | Federal National Mortgage Association | | | 3.430 | % | | 05/27/33 | | | 474,831 | | |
| | 428,571 | | | Federal Home Loan Banks | | | 3.730 | % | | 07/01/33 | | | 420,888 | | |
| | 500,000 | | | Federal Home Loan Banks | | | 4.700 | % | | 07/25/33 | | | 514,172 | | |
| | 1,000,000 | | | Federal Farm Credit Banks | | | 4.375 | % | | 02/21/34 | | | 1,028,378 | | |
| | 1,250,000 | | | Federal Home Loan Banks | | | 4.050 | % | | 07/14/34 | | | 1,251,620 | | |
| | 1,000,000 | | | Federal Farm Credit Banks | | | 3.980 | % | | 08/14/34 | | | 999,339 | | |
| | 1,000,000 | | | Federal Home Loan Banks | | | 3.840 | % | | 12/26/34 | | | 973,323 | | |
| | 3,000,000 | | | Federal Home Loan Banks | | | 3.620 | % | | 02/12/35 | | | 2,779,551 | | |
| | 2,000,000 | | | Federal Home Loan Banks | | | 3.600 | % | | 03/16/35 | | | 1,911,624 | | |
| | | | 30,567,022 | | |
| | | CORPORATE BONDS 28.2% | |
| | | CONSUMER DISCRETIONARY 2.8% | |
| | 500,000 | | | Gannett Co Inc | | | 6.375 | % | | 09/01/15 | | | 502,812 | | |
| | 340,000 | | | Johnson Controls Inc | | | 5.500 | % | | 01/15/16 | | | 348,540 | | |
| | 250,000 | | | ServiceMaster Co LLC/The | | | 7.100 | % | | 03/01/18 | | | 262,500 | | |
| | 500,000 | | | Best Buy Co Inc | | | 5.000 | % | | 08/01/18 | | | 527,500 | | |
| | 1,000,000 | | | Ford Motor Credit Co LLC | | | 3.000 | % | | 12/20/18 | | | 1,010,297 | | |
| | 500,000 | | | Ford Motor Credit Co LLC | | | 3.450 | % | | 08/20/20 | | | 496,696 | | |
| | 1,000,000 | | | Time Warner Cable Inc | | | 4.125 | % | | 02/15/21 | | | 1,032,445 | | |
| | 1,000,000 | | | Best Buy Co Inc | | | 5.500 | % | | 03/15/21 | | | 1,037,100 | | |
| | 1,500,000 | | | Time Warner Cable Inc | | | 4.000 | % | | 09/01/21 | | | 1,539,954 | | |
| | 555,000 | | | Kohl's Corp | | | 4.000 | % | | 11/01/21 | | | 584,117 | | |
| | 500,000 | | | Whirlpool Corp | | | 4.700 | % | | 06/01/22 | | | 540,889 | | |
15
Mairs & Power Balanced Fund
SCHEDULE OF INVESTMENTS (unaudited) (continued) June 30, 2015
Par Value | | Security Description | | Fair Value | |
| | | FIXED INCOME SECURITIES (continued) | |
| | | CORPORATE BONDS (continued) | |
| | | CONSUMER DISCRETIONARY (continued) | |
$ | 1,750,000 | | | Newell Rubbermaid Inc | | | 4.000 | % | | 06/15/22 | | $ | 1,777,633 | | |
| | 1,000,000 | | | Block Financial LLC | | | 5.500 | % | | 11/01/22 | | | 1,078,085 | | |
| | 318,000 | | | Darden Restaurants Inc | | | 3.350 | % | | 11/01/22 | | | 298,492 | | |
| | 1,000,000 | | | Staples Inc | | | 4.375 | % | | 01/12/23 | | | 1,003,966 | | |
| | 2,000,000 | | | Kohl's Corp | | | 3.250 | % | | 02/01/23 | | | 1,948,572 | | |
| | 1,000,000 | | | Wyndham Worldwide Corp | | | 3.900 | % | | 03/01/23 | | | 979,760 | | |
| | 500,000 | | | Hyatt Hotels Corp | | | 3.375 | % | | 07/15/23 | | | 486,887 | | |
| | 1,000,000 | | | Ford Motor Credit Co LLC | | | 4.000 | % | | 04/20/24 | | | 991,070 | | |
| | 1,000,000 | | | Coach Inc | | | 4.250 | % | | 04/01/25 | | | 960,419 | | |
| | 1,000,000 | | | Metropolitan Opera Association Inc | | | 4.349 | % | | 10/01/32 | | | 1,019,784 | | |
| | 2,000,000 | | | Comcast Corp | | | 4.250 | % | | 01/15/33 | | | 1,953,224 | | |
| | | | 20,380,742 | | |
| | | CONSUMER STAPLES 1.2% | |
| | 222,000 | | | SUPERVALU Inc | | | 8.000 | % | | 05/01/16 | | | 231,812 | | |
| | 525,000 | | | Cargill Inc (d) | | | 6.000 | % | | 11/27/17 | | | 580,031 | | |
| | 1,000,000 | | | Avon Products Inc | | | 4.200 | % | | 07/15/18 | | | 922,500 | | |
| | 1,000,000 | | | Safeway Inc | | | 3.950 | % | | 08/15/20 | | | 902,500 | | |
| | 500,000 | | | Safeway Inc | | | 4.750 | % | | 12/01/21 | | | 459,375 | | |
| | 1,274,000 | | | Avon Products Inc (c) | | | 5.750 | % | | 03/15/23 | | | 1,095,640 | | |
| | 2,949,000 | | | Land O'Lakes Capital Trust I (d) | | | 7.450 | % | | 03/15/28 | | | 3,133,313 | | |
| | 500,000 | | | Altria Group Inc | | | 4.250 | % | | 08/09/42 | | | 443,750 | | |
| | 1,000,000 | | | Cargill Inc (d) | | | 4.100 | % | | 11/01/42 | | | 941,401 | | |
| | | | 8,710,322 | | |
| | | ENERGY 2.2% | |
| | 500,000 | | | Anadarko Petroleum Corp | | | 5.950 | % | | 09/15/16 | | | 527,457 | | |
| | 250,000 | | | ConocoPhillips | | | 6.650 | % | | 07/15/18 | | | 286,130 | | |
| | 1,500,000 | | | Murphy Oil Corp | | | 4.000 | % | | 06/01/22 | | | 1,417,675 | | |
| | 500,000 | | | Western Gas Partners LP | | | 4.000 | % | | 07/01/22 | | | 501,733 | | |
| | 655,000 | | | FMC Technologies Inc | | | 3.450 | % | | 10/01/22 | | | 631,273 | | |
| | 3,000,000 | | | Transocean Inc (a) (c) | | | 4.300 | % | | 10/15/22 | | | 2,257,500 | | |
| | 1,000,000 | | | Murphy Oil Corp | | | 3.700 | % | | 12/01/22 | | | 915,030 | | |
| | 1,500,000 | | | Sunoco Logistics Partners Operations LP | | | 3.450 | % | | 01/15/23 | | | 1,419,546 | | |
| | 3,000,000 | | | Williams Cos Inc/The | | | 3.700 | % | | 01/15/23 | | | 2,793,330 | | |
| | 1,945,000 | | | Boardwalk Pipelines LP | | | 3.375 | % | | 02/01/23 | | | 1,763,672 | | |
| | 575,000 | | | DCP Midstream Operating LP | | | 3.875 | % | | 03/15/23 | | | 531,253 | | |
| | 1,000,000 | | | Diamond Offshore Drilling Inc | | | 3.450 | % | | 11/01/23 | | | 945,634 | | |
| | 500,000 | | | Kinder Morgan Energy Partners LP | | | 4.250 | % | | 09/01/24 | | | 486,967 | | |
16
Mairs & Power Balanced Fund
SCHEDULE OF INVESTMENTS (unaudited) (continued) June 30, 2015
Par Value | | Security Description | | Fair Value | |
| | | FIXED INCOME SECURITIES (continued) | |
| | | CORPORATE BONDS (continued) | |
| | | ENERGY (continued) | |
$ | 500,000 | | | Global Marine Inc | | | 7.000 | % | | 06/01/28 | | $ | 370,000 | | |
| | 500,000 | | | Murphy Oil Corp | | | 5.125 | % | | 12/01/42 | | | 414,547 | | |
| | 500,000 | | | Apache Corp | | | 4.250 | % | | 01/15/44 | | | 434,217 | | |
| | | | 15,695,964 | | |
| | | FINANCIALS 10.0% | |
| | 500,000 | | | TCF National Bank | | | 5.500 | % | | 02/01/16 | | | 505,624 | | |
| | 500,000 | | | KeyBank NA/Cleveland OH | | | 5.450 | % | | 03/03/16 | | | 515,327 | | |
| | 500,000 | | | Symetra Financial Corp (d) | | | 6.125 | % | | 04/01/16 | | | 514,884 | | |
| | 250,000 | | | Security Benefit Life Insurance Co (d) | | | 8.750 | % | | 05/15/16 | | | 264,219 | | |
| | 500,000 | | | Bank of America Corp | | | 6.050 | % | | 05/16/16 | | | 519,198 | | |
| | 500,000 | | | Torchmark Corp | | | 6.375 | % | | 06/15/16 | | | 523,891 | | |
| | 500,000 | | | National City Bank/Cleveland OH | | | 5.250 | % | | 12/15/16 | | | 527,414 | | |
| | 500,000 | | | M&I Marshall & Ilsley Bank | | | 5.000 | % | | 01/17/17 | | | 524,672 | | |
| | 500,000 | | | Citigroup Inc | | | 5.500 | % | | 02/15/17 | | | 531,215 | | |
| | 500,000 | | | Sirius International Group Ltd (a) (d) | | | 6.375 | % | | 03/20/17 | | | 525,648 | | |
| | 250,000 | | | Bank of America Corp | | | 5.700 | % | | 05/02/17 | | | 266,722 | | |
| | 500,000 | | | Royal Bank of Scotland Group PLC (a) | | | 4.250 | % | | 07/15/17 | | | 521,832 | | |
| | 500,000 | | | Comerica Bank | | | 5.200 | % | | 08/22/17 | | | 533,309 | | |
| | 500,000 | | | Bank of America Corp | | | 6.000 | % | | 09/01/17 | | | 544,082 | | |
| | 500,000 | | | American Express Bank FSB | | | 6.000 | % | | 09/13/17 | | | 546,614 | | |
| | 500,000 | | | Bear Stearns Cos LLC/The | | | 6.400 | % | | 10/02/17 | | | 550,293 | | |
| | 500,000 | | | Prudential Financial Inc | | | 6.000 | % | | 12/01/17 | | | 551,708 | | |
| | 500,000 | | | Barclays Bank PLC (a) (d) | | | 6.050 | % | | 12/04/17 | | | 544,019 | | |
| | 1,000,000 | | | Morgan Stanley | | | 5.950 | % | | 12/28/17 | | | 1,099,215 | | |
| | 500,000 | | | Goldman Sachs Group Inc/The | | | 5.950 | % | | 01/18/18 | | | 549,642 | | |
| | 500,000 | | | Wachovia Corp | | | 5.750 | % | | 02/01/18 | | | 552,212 | | |
| | 250,000 | | | Lincoln National Corp | | | 7.000 | % | | 03/15/18 | | | 281,703 | | |
| | 500,000 | | | SunTrust Bank/Atlanta GA | | | 7.250 | % | | 03/15/18 | | | 568,658 | | |
| | 500,000 | | | Morgan Stanley | | | 6.625 | % | | 04/01/18 | | | 561,028 | | |
| | 1,000,000 | | | Jefferies Group LLC | | | 5.125 | % | | 04/13/18 | | | 1,061,886 | | |
| | 500,000 | | | Bank of America Corp | | | 6.875 | % | | 04/25/18 | | | 564,840 | | |
| | 500,000 | | | Provident Cos Inc | | | 7.000 | % | | 07/15/18 | | | 566,077 | | |
| | 500,000 | | | MetLife Inc | | | 6.817 | % | | 08/15/18 | | | 575,473 | | |
| | 500,000 | | | Hartford Financial Services Group Inc/The | | | 6.000 | % | | 01/15/19 | | | 558,705 | | |
| | 500,000 | | | Royal Bank of Scotland Group PLC (a) | | | 5.250 | % | | 02/15/19 | | | 526,531 | | |
| | 500,000 | | | BB&T Corp | | | 6.850 | % | | 04/30/19 | | | 585,172 | | |
| | 250,000 | | | WR Berkley Corp | | | 6.150 | % | | 08/15/19 | | | 281,895 | | |
17
Mairs & Power Balanced Fund
SCHEDULE OF INVESTMENTS (unaudited) (continued) June 30, 2015
Par Value | | Security Description | | Fair Value | |
| | | FIXED INCOME SECURITIES (continued) | |
| | | CORPORATE BONDS (continued) | |
| | | FINANCIALS (continued) | |
$ | 500,000 | | | Protective Life Corp | | | 7.375 | % | | 10/15/19 | | $ | 592,078 | | |
| | 500,000 | | | Prospect Capital Corp | | | 5.125 | % | | 11/15/19 | | | 498,488 | | |
| | 500,000 | | | Credit Suisse/New York NY (a) | | | 5.400 | % | | 01/14/20 | | | 552,832 | | |
| | 500,000 | | | Prospect Capital Corp | | | 4.000 | % | | 01/15/20 | | | 470,221 | | |
| | 500,000 | | | Morgan Stanley | | | 5.500 | % | | 01/26/20 | | | 557,997 | | |
| | 500,000 | | | Hartford Financial Services Group Inc/The | | | 5.500 | % | | 03/30/20 | | | 560,692 | | |
| | 450,000 | | | Compass Bank | | | 5.500 | % | | 04/01/20 | | | 489,624 | | |
| | 537,000 | | | Manufacturers & Traders Trust Co (c) | | | 5.585 | % | | 12/28/20 | | | 546,021 | | |
| | 500,000 | | | Wells Fargo & Co (c) | | | 2.000 | % | | 01/31/21 | | | 493,389 | | |
| | 1,000,000 | | | Nationwide Financial Services Inc (d) | | | 5.375 | % | | 03/25/21 | | | 1,097,408 | | |
| | 500,000 | | | Markel Corp | | | 5.350 | % | | 06/01/21 | | | 556,489 | | |
| | 500,000 | | | Goldman Sachs Group Inc/The | | | 5.250 | % | | 07/27/21 | | | 555,259 | | |
| | 500,000 | | | Genworth Holdings Inc | | | 7.625 | % | | 09/24/21 | | | 526,250 | | |
| | 500,000 | | | Aflac Inc | | | 4.000 | % | | 02/15/22 | | | 528,645 | | |
| | 2,000,000 | | | OneBeacon US Holdings Inc | | | 4.600 | % | | 11/09/22 | | | 2,039,084 | | |
| | 1,000,000 | | | Standard Chartered PLC (a) (d) | | | 3.950 | % | | 01/11/23 | | | 975,886 | | |
| | 500,000 | | | Wells Fargo & Co | | | 3.450 | % | | 02/13/23 | | | 497,293 | | |
| | 2,500,000 | | | Assurant Inc | | | 4.000 | % | | 03/15/23 | | | 2,501,285 | | |
| | 1,000,000 | | | Markel Corp | | | 3.625 | % | | 03/30/23 | | | 985,593 | | |
| | 1,500,000 | | | Citigroup Inc | | | 3.500 | % | | 05/15/23 | | | 1,464,493 | | |
| | 500,000 | | | Morgan Stanley | | | 4.100 | % | | 05/22/23 | | | 500,935 | | |
| | 2,000,000 | | | Liberty Mutual Group Inc (d) | | | 4.250 | % | | 06/15/23 | | | 2,056,810 | | |
| | 500,000 | | | Ameriprise Financial Inc | | | 4.000 | % | | 10/15/23 | | | 522,140 | | |
| | 500,000 | | | CNA Financial Corp | | | 7.250 | % | | 11/15/23 | | | 603,333 | | |
| | 500,000 | | | Pacific Life Insurance Co (d) | | | 7.900 | % | | 12/30/23 | | | 618,166 | | |
| | 1,000,000 | | | Moody's Corp | | | 4.875 | % | | 02/15/24 | | | 1,074,038 | | |
| | 1,000,000 | | | NASDAQ OMX Group Inc/The | | | 4.250 | % | | 06/01/24 | | | 1,016,567 | | |
| | 500,000 | | | Wintrust Financial Corp | | | 5.000 | % | | 06/13/24 | | | 510,042 | | |
| | 250,000 | | | Assured Guaranty US Holdings Inc | | | 5.000 | % | | 07/01/24 | | | 245,190 | | |
| | 500,000 | | | Symetra Financial Corp | | | 4.250 | % | | 07/15/24 | | | 498,827 | | |
| | 1,000,000 | | | Stifel Financial Corp | | | 4.250 | % | | 07/18/24 | | | 988,062 | | |
| | 1,000,000 | | | Citigroup Inc | | | 4.000 | % | | 08/05/24 | | | 986,749 | | |
| | 1,500,000 | | | Synchrony Financial | | | 4.250 | % | | 08/15/24 | | | 1,506,443 | | |
| | 1,800,000 | | | Brown & Brown Inc | | | 4.200 | % | | 09/15/24 | | | 1,776,746 | | |
| | 2,000,000 | | | Old Republic International Corp | | | 4.875 | % | | 10/01/24 | | | 2,069,112 | | |
| | 2,000,000 | | | TIAA Asset Management Finance Co LLC (d) | | | 4.125 | % | | 11/01/24 | | | 2,014,320 | | |
| | 1,000,000 | | | Associated Banc-Corp | | | 4.250 | % | | 01/15/25 | | | 985,242 | | |
| | 2,000,000 | | | Kemper Corp | | | 4.350 | % | | 02/15/25 | | | 1,987,292 | | |
18
Mairs & Power Balanced Fund
SCHEDULE OF INVESTMENTS (unaudited) (continued) June 30, 2015
Par Value | | Security Description | | Fair Value | |
| | | FIXED INCOME SECURITIES (continued) | |
| | | CORPORATE BONDS (continued) | |
| | | FINANCIALS (continued) | |
$ | 250,000 | | | Liberty Mutual Insurance Co (d) | | | 8.500 | % | | 05/15/25 | | $ | 312,441 | | |
| | 1,000,000 | | | Wells Fargo & Co | | | 4.100 | % | | 06/03/26 | | | 1,004,215 | | |
| | 500,000 | | | Morgan Stanley | | | 4.350 | % | | 09/08/26 | | | 489,940 | | |
| | 1,000,000 | | | National Rural Utilities Cooperative Finance Corp | | | 3.000 | % | | 11/15/26 | | | 961,299 | | |
| | 1,000,000 | | | Citigroup Inc | | | 4.300 | % | | 11/20/26 | | | 977,822 | | |
| | 1,000,000 | | | JPMorgan Chase & Co | | | 4.125 | % | | 12/15/26 | | | 983,276 | | |
| | 250,000 | | | Provident Cos Inc | | | 7.250 | % | | 03/15/28 | | | 308,069 | | |
| | 1,000,000 | | | JPMorgan Chase & Co (c) | | | 3.000 | % | | 03/21/28 | | | 922,556 | | |
| | 1,000,000 | | | JPMorgan Chase & Co (c) | | | 3.000 | % | | 03/22/28 | | | 969,541 | | |
| | 1,000,000 | | | Royal Bank of Canada (a) | | | 3.000 | % | | 05/10/28 | | | 916,620 | | |
| | 500,000 | | | Farmers Exchange Capital (d) | | | 7.050 | % | | 07/15/28 | | | 603,342 | | |
| | 500,000 | | | Goldman Sachs Group Inc/The | | | 4.250 | % | | 11/15/30 | | | 492,811 | | |
| | 500,000 | | | Goldman Sachs Group Inc/The | | | 4.000 | % | | 02/15/31 | | | 466,453 | | |
| | 500,000 | | | Goldman Sachs Group Inc/The | | | 4.300 | % | | 12/15/32 | | | 498,567 | | |
| | 1,000,000 | | | JPMorgan Chase & Co (c) | | | 3.250 | % | | 01/31/33 | | | 959,226 | | |
| | 649,000 | | | Lloyds Bank PLC (a) (c) | | | 3.400 | % | | 01/31/33 | | | 615,229 | | |
| | 250,000 | | | Citigroup Inc (c) | | | 4.000 | % | | 06/27/34 | | | 242,937 | | |
| | 538,000 | | | Bank of America Corp | | | 4.000 | % | | 08/15/34 | | | 523,016 | | |
| | 1,000,000 | | | Prudential Financial Inc | | | 4.050 | % | | 11/15/34 | | | 970,737 | | |
| | 1,000,000 | | | Goldman Sachs Group Inc/The | | | 4.000 | % | | 01/30/35 | | | 885,817 | | |
| | 500,000 | | | Barclays Bank PLC (a) (c) | | | 4.000 | % | | 10/09/37 | | | 479,528 | | |
| | 1,000,000 | | | Berkshire Hathaway Finance Corp | | | 4.400 | % | | 05/15/42 | | | 984,698 | | |
| | 500,000 | | | MetLife Inc | | | 4.125 | % | | 08/13/42 | | | 465,351 | | |
| | 500,000 | | | Swiss Re Treasury US Corp (d) | | | 4.250 | % | | 12/06/42 | | | 482,438 | | |
| | 500,000 | | | Pacific LifeCorp (d) | | | 5.125 | % | | 01/30/43 | | | 503,789 | | |
| | 500,000 | | | Berkshire Hathaway Finance Corp | | | 4.300 | % | | 05/15/43 | | | 483,923 | | |
| | 500,000 | | | Principal Financial Group Inc | | | 4.350 | % | | 05/15/43 | | | 468,272 | | |
| | | | 71,764,662 | | |
| | | HEALTH CARE 0.7% | |
| | 500,000 | | | UnitedHealth Group Inc | | | 6.000 | % | | 02/15/18 | | | 555,893 | | |
| | 1,000,000 | | | Quest Diagnostics Inc | | | 4.700 | % | | 04/01/21 | | | 1,081,477 | | |
| | 1,000,000 | | | Laboratory Corp of America Holdings | | | 3.750 | % | | 08/23/22 | | | 1,011,416 | | |
| | 1,000,000 | | | Laboratory Corp of America Holdings | | | 4.000 | % | | 11/01/23 | | | 1,021,029 | | |
| | 1,000,000 | | | Mylan Inc/PA | | | 4.200 | % | | 11/29/23 | | | 1,020,669 | | |
| | 500,000 | | | Wyeth LLC | | | 6.450 | % | | 02/01/24 | | | 617,076 | | |
| | | | 5,307,560 | | |
19
Mairs & Power Balanced Fund
SCHEDULE OF INVESTMENTS (unaudited) (continued) June 30, 2015
Par Value | | Security Description | | Fair Value | |
| | | FIXED INCOME SECURITIES (continued) | |
| | | CORPORATE BONDS (continued) | |
| | | INDUSTRIALS 3.0% | |
$ | 500,000 | | | Masco Corp | | | 7.125 | % | | 03/15/20 | | $ | 580,000 | | |
| | 500,000 | | | Pentair Finance SA (a) | | | 5.000 | % | | 05/15/21 | | | 546,922 | | |
| | 500,000 | | | IDEX Corp | | | 4.200 | % | | 12/15/21 | | | 521,895 | | |
| | 500,000 | | | Masco Corp | | | 5.950 | % | | 03/15/22 | | | 561,250 | | |
| | 500,000 | | | GATX Corp | | | 4.750 | % | | 06/15/22 | | | 531,410 | | |
| | 500,000 | | | Penske Truck Leasing Co Lp / PTL Finance Corp (d) | | | 4.875 | % | | 07/11/22 | | | 528,358 | | |
| | 1,000,000 | | | ADT Corp/The | | | 3.500 | % | | 07/15/22 | | | 905,000 | | |
| | 225,000 | | | Pentair Finance SA (a) | | | 3.150 | % | | 09/15/22 | | | 216,807 | | |
| | 2,000,000 | | | Dun & Bradstreet Corp/The | | | 4.375 | % | | 12/01/22 | | | 1,992,864 | | |
| | 1,000,000 | | | GATX Corp | | | 3.900 | % | | 03/30/23 | | | 1,011,187 | | |
| | 500,000 | | | ADT Corp/The | | | 4.125 | % | | 06/15/23 | | | 467,500 | | |
| | 500,000 | | | Ingersoll-Rand Global Holding Co Ltd (a) | | | 4.250 | % | | 06/15/23 | | | 518,365 | | |
| | 1,000,000 | | | Flowserve Corp | | | 4.000 | % | | 11/15/23 | | | 1,011,648 | | |
| | 2,126,000 | | | Air Lease Corp | | | 4.850 | % | | 02/01/24 | | | 2,115,370 | | |
| | 500,000 | | | Pitney Bowes Inc | | | 4.625 | % | | 03/15/24 | | | 504,290 | | |
| | 500,000 | | | Toro Co/The | | | 7.800 | % | | 06/15/27 | | | 634,155 | | |
| | 500,000 | | | General Electric Capital Corp | | | 3.500 | % | | 05/15/32 | | | 480,627 | | |
| | 200,000 | | | General Electric Capital Corp | | | 4.000 | % | | 08/17/32 | | | 194,028 | | |
| | 1,375,000 | | | General Electric Capital Corp | | | 4.000 | % | | 09/17/32 | | | 1,340,252 | | |
| | 3,000,000 | | | Eaton Corp | | | 4.000 | % | | 11/02/32 | | | 2,903,760 | | |
| | 2,000,000 | | | General Electric Capital Corp | | | 4.000 | % | | 02/14/33 | | | 1,966,720 | | |
| | 1,000,000 | | | Pitney Bowes Inc | | | 5.250 | % | | 01/15/37 | | | 1,030,837 | | |
| | 590,000 | | | Eaton Corp | | | 4.150 | % | | 11/02/42 | | | 544,303 | | |
| | 500,000 | | | Lockheed Martin Corp | | | 4.070 | % | | 12/15/42 | | | 472,446 | | |
| | | | 21,579,994 | | |
| | | INFORMATION TECHNOLOGY 3.8% | |
| | 500,000 | | | Western Union Co/The | | | 5.930 | % | | 10/01/16 | | | 524,960 | | |
| | 500,000 | | | Broadridge Financial Solutions Inc | | | 6.125 | % | | 06/01/17 | | | 536,362 | | |
| | 500,000 | | | Dell Inc | | | 5.875 | % | | 06/15/19 | | | 530,000 | | |
| | 500,000 | | | Broadridge Financial Solutions Inc | | | 3.950 | % | | 09/01/20 | | | 520,049 | | |
| | 500,000 | | | Hewlett-Packard Co | | | 3.750 | % | | 12/01/20 | | | 515,253 | | |
| | 500,000 | | | Dell Inc | | | 4.625 | % | | 04/01/21 | | | 502,165 | | |
| | 750,000 | | | Hewlett-Packard Co | | | 4.300 | % | | 06/01/21 | | | 779,023 | | |
| | 500,000 | | | Motorola Solutions Inc | | | 3.750 | % | | 05/15/22 | | | 492,090 | | |
| | 2,000,000 | | | Symantec Corp | | | 3.950 | % | | 06/15/22 | | | 2,006,000 | | |
| | 1,000,000 | | | Computer Sciences Corp | | | 4.450 | % | | 09/15/22 | | | 1,026,481 | | |
| | 1,000,000 | | | Hewlett-Packard Co | | | 4.050 | % | | 09/15/22 | | | 1,014,836 | | |
20
Mairs & Power Balanced Fund
SCHEDULE OF INVESTMENTS (unaudited) (continued) June 30, 2015
Par Value | | Security Description | | Fair Value | |
| | | FIXED INCOME SECURITIES (continued) | |
| | | CORPORATE BONDS (continued) | |
| | | INFORMATION TECHNOLOGY (continued) | |
$ | 2,025,000 | | | Fiserv Inc | | | 3.500 | % | | 10/01/22 | | $ | 2,015,766 | | |
| | 1,000,000 | | | Autodesk Inc | | | 3.600 | % | | 12/15/22 | | | 994,722 | | |
| | 2,500,000 | | | Arrow Electronics Inc | | | 4.500 | % | | 03/01/23 | | | 2,555,030 | | |
| | 1,500,000 | | | Motorola Solutions Inc | | | 3.500 | % | | 03/01/23 | | | 1,414,753 | | |
| | 2,000,000 | | | Fidelity National Information Services Inc | | | 3.500 | % | | 04/15/23 | | | 1,941,282 | | |
| | 2,352,000 | | | Total System Services Inc | | | 3.750 | % | | 06/01/23 | | | 2,310,633 | | |
| | 1,000,000 | | | Altera Corp | | | 4.100 | % | | 11/15/23 | | | 1,051,903 | | |
| | 500,000 | | | Motorola Solutions Inc | | | 4.000 | % | | 09/01/24 | | | 484,988 | | |
| | 500,000 | | | Arrow Electronics Inc | | | 4.000 | % | | 04/01/25 | | | 488,848 | | |
| | 4,000,000 | | | Intel Corp | | | 4.000 | % | | 12/15/32 | | | 3,833,128 | | |
| | 1,500,000 | | | Western Union Co/The | | | 6.200 | % | | 11/17/36 | | | 1,501,907 | | |
| | | | 27,040,179 | | |
| | | MATERIALS 2.9% | |
| | 500,000 | | | International Paper Co | | | 5.250 | % | | 04/01/16 | | | 514,699 | | |
| | 500,000 | | | Valspar Corp/The | | | 6.050 | % | | 05/01/17 | | | 532,864 | | |
| | 500,000 | | | Cliffs Natural Resources Inc (c) | | | 4.950 | % | | 01/15/18 | | | 363,750 | | |
| | 500,000 | | | Cliffs Natural Resources Inc | | | 4.800 | % | | 10/01/20 | | | 237,500 | | |
| | 500,000 | | | Carpenter Technology Corp | | | 5.200 | % | | 07/15/21 | | | 534,376 | | |
| | 500,000 | | | Freeport-McMoRan Inc | | | 4.000 | % | | 11/14/21 | | | 490,988 | | |
| | 175,000 | | | Mosaic Co/The | | | 3.750 | % | | 11/15/21 | | | 180,484 | | |
| | 1,000,000 | | | Freeport-McMoRan Inc | | | 3.550 | % | | 03/01/22 | | | 925,628 | | |
| | 1,500,000 | | | Newmont Mining Corp | | | 3.500 | % | | 03/15/22 | | | 1,431,512 | | |
| | 500,000 | | | Barrick Gold Corp (a) | | | 3.850 | % | | 04/01/22 | | | 484,618 | | |
| | 1,000,000 | | | Domtar Corp | | | 4.400 | % | | 04/01/22 | | | 1,016,269 | | |
| | 2,000,000 | | | RPM International Inc | | | 3.450 | % | | 11/15/22 | | | 1,928,990 | | |
| | 500,000 | | | Carpenter Technology Corp | | | 4.450 | % | | 03/01/23 | | | 497,364 | | |
| | 500,000 | | | Freeport-McMoRan Inc | | | 3.875 | % | | 03/15/23 | | | 454,214 | | |
| | 2,059,000 | | | Reliance Steel & Aluminum Co | | | 4.500 | % | | 04/15/23 | | | 2,025,535 | | |
| | 1,750,000 | | | Barrick Gold Corp (a) | | | 4.100 | % | | 05/01/23 | | | 1,705,154 | | |
| | 2,000,000 | | | Nucor Corp | | | 4.000 | % | | 08/01/23 | | | 2,029,374 | | |
| | 1,000,000 | | | Mosaic Co/The | | | 4.250 | % | | 11/15/23 | | | 1,028,229 | | |
| | 865,000 | | | Union Carbide Corp | | | 7.500 | % | | 06/01/25 | | | 1,077,885 | | |
| | 1,250,000 | | | Dow Chemical Co/The | | | 4.250 | % | | 10/01/34 | | | 1,174,171 | | |
| | 1,000,000 | | | Alcoa Inc | | | 5.950 | % | | 02/01/37 | | | 997,500 | | |
| | 1,000,000 | | | Newmont Mining Corp | | | 4.875 | % | | 03/15/42 | | | 839,091 | | |
| | | | 20,470,195 | | |
21
Mairs & Power Balanced Fund
SCHEDULE OF INVESTMENTS (unaudited) (continued) June 30, 2015
Par Value | | Security Description | | Fair Value | |
| | | FIXED INCOME SECURITIES (continued) | |
| | | CORPORATE BONDS (continued) | |
| | | TELECOMMUNICATION SERVICES 0.4% | |
$ | 250,000 | | | Verizon Communications Inc | | | 6.350 | % | | 04/01/19 | | $ | 285,686 | | |
| | 500,000 | | | CenturyLink Inc | | | 6.150 | % | | 09/15/19 | | | 526,250 | | |
| | 500,000 | | | Qwest Capital Funding Inc | | | 6.875 | % | | 07/15/28 | | | 491,250 | | |
| | 550,000 | | | Qwest Corp | | | 6.875 | % | | 09/15/33 | | | 543,834 | | |
| | 1,000,000 | | | Verizon Communications Inc | | | 4.400 | % | | 11/01/34 | | | 925,759 | | |
| | | | 2,772,779 | | |
| | | UTILITIES 1.2% | |
| | 500,000 | | | Commonwealth Edison Co | | | 6.150 | % | | 09/15/17 | | | 550,910 | | |
| | 250,000 | | | Vectren Utility Holdings Inc | | | 5.750 | % | | 08/01/18 | | | 274,035 | | |
| | 250,000 | | | South Jersey Gas Co | | | 7.125 | % | | 10/22/18 | | | 283,773 | | |
| | 250,000 | | | United Utilities PLC (a) | | | 5.375 | % | | 02/01/19 | | | 269,247 | | |
| | 2,000,000 | | | PPL Energy Supply LLC | | | 4.600 | % | | 12/15/21 | | | 1,835,000 | | |
| | 2,170,000 | | | ONEOK Inc | | | 4.250 | % | | 02/01/22 | | | 2,095,068 | | |
| | 785,000 | | | SCANA Corp | | | 4.125 | % | | 02/01/22 | | | 790,804 | | |
| | 1,000,000 | | | Exelon Generation Co LLC | | | 4.250 | % | | 06/15/22 | | | 1,023,596 | | |
| | 900,000 | | | National Fuel Gas Co | | | 3.750 | % | | 03/01/23 | | | 834,485 | | |
| | 500,000 | | | Entergy Gulf States Inc | | | 6.180 | % | | 03/01/35 | | | 501,529 | | |
| | | | 8,458,447 | | |
| | | TOTAL CORPORATE BONDS | | | 202,180,844 | | |
| | | ASSET BACKED SECURITIES 1.5% | |
| | 500,000 | | | Delta Air Lines 2010-2 Class B Pass Through Trust (d) | | | 6.750 | % | | 05/23/17 | | | 508,350 | | |
| | 357,370 | | | Continental Airlines 2009-1 Pass Through Trust | | | 9.000 | % | | 01/08/18 | | | 380,599 | | |
| | 353,258 | | | American Airlines 2011-1 Class B Pass Through Trust (d) | | | 7.000 | % | | 07/31/19 | | | 380,635 | | |
| | 106,772 | | | Continental Airlines 1999-1 Class B Pass Through Trust | | | 6.795 | % | | 02/02/20 | | | 111,777 | | |
| | 530,229 | | | Continental Airlines 2010-1 Class B Pass Through Trust | | | 6.000 | % | | 07/12/20 | | | 547,462 | | |
| | 319,898 | | | Delta Air Lines 2011-1 Class A Pass Through Trust | | | 5.300 | % | | 10/15/20 | | | 342,290 | | |
| | 624,056 | | | America West Airlines 2000-1 Pass Through Trust | | | 8.057 | % | | 01/02/22 | | | 695,435 | | |
| | 722,789 | | | American Airlines 2011-1 Class A Pass Through Trust | | | 5.250 | % | | 07/31/22 | | | 766,156 | | |
| | 190,000 | | | Continental Airlines 2007-1 Class A Pass Through Trust | | | 5.983 | % | | 10/19/23 | | | 209,000 | | |
| | 358,211 | | | Southwest Airlines Co 2007-1 Pass Through Trust | | | 6.150 | % | | 02/01/24 | | | 405,674 | | |
| | 756,600 | | | US Airways 2010-1 Class A Pass Through Trust | | | 6.250 | % | | 10/22/24 | | | 845,500 | | |
| | 1,000,000 | | | American Airlines 2015-1 Class B Pass Through Trust | | | 3.700 | % | | 11/01/24 | | | 980,000 | | |
22
Mairs & Power Balanced Fund
SCHEDULE OF INVESTMENTS (unaudited) (continued) June 30, 2015
Par Value/Shares | | Security Description | | Fair Value | |
| | | FIXED INCOME SECURITIES (continued) | |
| | | ASSET BACKED SECURITIES (continued) | |
$ | 392,230 | | | US Airways 2011-1 Class A Pass Through Trust | | | 7.125 | % | | 04/22/25 | | $ | 448,860 | | |
| | 1,287,052 | | | Hawaiian Airlines 2013-1 Class A Pass Through Certificates | | | 3.900 | % | | 01/15/26 | | | 1,264,529 | | |
| | 566,943 | | | Continental Airlines 2012-2 Class A Pass Through Trust | | | 4.000 | % | | 04/29/26 | | | 576,071 | | |
| | 976,901 | | | United Airlines 2013-1 Class A Pass Through Trust | | | 4.300 | % | | 02/15/27 | | | 1,003,766 | | |
| | 937,053 | | | US Airways 2013-1 Class A Pass Through Trust | | | 3.950 | % | | 05/15/27 | | | 940,567 | | |
| | | | 10,406,671 | | |
| | | PREFERRED SECURITIES 1.1% | |
| | 105,000 | | | Affiliated Managers Group Inc | | | 5.250 | % | | 10/15/22 | | | 2,649,150 | | |
| | 20,000 | | | Pitney Bowes Inc | | | 5.250 | % | | 11/27/22 | | | 509,600 | | |
| | 23,000 | | | Stifel Financial Corp | | | 5.375 | % | | 12/31/22 | | | 586,500 | | |
| | 10,000 | | | Raymond James Financial Inc | | | 6.900 | % | | 03/15/42 | | | 261,600 | | |
| | 20,000 | | | Protective Life Corp | | | 6.000 | % | | 09/01/42 | | | 503,000 | | |
| | 20,000 | | | Selective Insurance Group Inc | | | 5.875 | % | | 02/09/43 | | | 496,600 | | |
| | 40,000 | | | WR Berkley Corp | | | 5.625 | % | | 04/30/53 | | | 967,600 | | |
| | 20,000 | | | Verizon Communications Inc | | | 5.900 | % | | 02/15/54 | | | 524,400 | | |
| | 20,000 | | | American Financial Group Inc/OH | | | 6.250 | % | | 09/30/54 | | | 508,400 | | |
| | 20,000 | | | Qwest Corp | | | 6.875 | % | | 10/01/54 | | | 517,400 | | |
| | 10,000 | | | NextEra Energy Capital Holdings Inc | | | 5.700 | % | | 03/01/72 | | | 241,000 | | |
| | | | 7,765,250 | | |
| | TOTAL FIXED INCOME SECURITIES
(cost $249,905,047) | | $ | 250,919,787 | | |
| | | COMMON STOCKS 62.8% | |
| | | CONSUMER DISCRETIONARY 3.5% | |
| | 74,000 | | | Home Depot Inc/The | | | | | | | | | | | 8,223,620 | | |
| | 210,000 | | | Target Corp | | | | | | | | | | | 17,142,300 | | |
| | | | 25,365,920 | | |
| | | CONSUMER STAPLES 2.9% | |
| | 63,000 | | | Hershey Co/The | | | | | | | | | | | 5,596,290 | | |
| | 120,000 | | | Hormel Foods Corp | | | | | | | | | | | 6,764,400 | | |
| | 31,000 | | | Kimberly-Clark Corp | | | | | | | | | | | 3,285,070 | | |
| | | | 20,660,560 | | |
| | | ENERGY 6.6% | |
| | 72,000 | | | Chevron Corp | | | | | | | | | | | 6,945,840 | | |
| | 172,000 | | | ConocoPhillips | | | | | | | | | | | 10,562,520 | | |
| | 196,000 | | | Exxon Mobil Corp | | | | | | | | | | | 16,307,200 | | |
| | 160,000 | | | Schlumberger Ltd (a) | | | | | | | | | | | 13,790,400 | | |
| | | | 47,605,960 | | |
23
Mairs & Power Balanced Fund
SCHEDULE OF INVESTMENTS (unaudited) (continued) June 30, 2015
Shares | | Security Description | | Fair Value | |
| | | COMMON STOCKS (continued) | |
| | | FINANCIALS 9.2% | |
| | 46,000 | | | American Express Co | | $ | 3,575,120 | | |
| | 404,000 | | | Associated Banc-Corp | | | 8,189,080 | | |
| | 139,000 | | | JPMorgan Chase & Co | | | 9,418,640 | | |
| | 267,000 | | | Principal Financial Group Inc | | | 13,694,430 | | |
| | 35,000 | | | Travelers Cos Inc/The | | | 3,383,100 | | |
| | 427,000 | | | US Bancorp/MN | | | 18,531,800 | | |
| | 156,000 | | | Wells Fargo & Co | | | 8,773,440 | | |
| | | | 65,565,610 | | |
| | | HEALTH CARE 12.1% | |
| | 148,500 | | | Abbott Laboratories | | | 7,288,380 | | |
| | 84,000 | | | AbbVie Inc | | | 5,643,960 | | |
| | 131,000 | | | Baxter International Inc | | | 9,160,830 | | |
| | 74,500 | | | Bristol-Myers Squibb Co | | | 4,957,230 | | |
| | 74,000 | | | Eli Lilly & Co | | | 6,178,260 | | |
| | 150,000 | | | Johnson & Johnson | | | 14,619,000 | | |
| | 252,500 | | | Medtronic PLC (f) | | | 18,710,250 | | |
| | 295,000 | | | Pfizer Inc | | | 9,891,350 | | |
| | 296,000 | | | Roche Holding AG ADR (e) | | | 10,380,720 | | |
| | | | 86,829,980 | | |
| | | INDUSTRIALS 15.4% | |
| | 86,000 | | | 3M Co | | | 13,269,800 | | |
| | 115,000 | | | CH Robinson Worldwide Inc | | | 7,174,850 | | |
| | 239,500 | | | Deluxe Corp | | | 14,849,000 | | |
| | 256,000 | | | Emerson Electric Co | | | 14,190,080 | | |
| | 420,000 | | | General Electric Co | | | 11,159,400 | | |
| | 91,000 | | | Graco Inc | | | 6,463,730 | | |
| | 114,000 | | | Honeywell International Inc | | | 11,624,580 | | |
| | 136,000 | | | Pentair PLC (a) | | | 9,350,000 | | |
| | 40,000 | | | Toro Co/The | | | 2,711,200 | | |
| | 204,100 | | | United Parcel Service Inc, Class B | | | 19,779,331 | | |
| | | | 110,571,971 | | |
| | | INFORMATION TECHNOLOGY 6.0% | |
| | 420,000 | | | Corning Inc | | | 8,286,600 | | |
| | 70,000 | | | International Business Machines Corp | | | 11,386,200 | | |
| | 88,500 | | | MTS Systems Corp | | | 6,102,075 | | |
| | 86,000 | | | QUALCOMM Inc | | | 5,386,180 | | |
| | 569,000 | | | Western Union Co/The | | | 11,567,770 | | |
| | | | 42,728,825 | | |
24
Mairs & Power Balanced Fund
SCHEDULE OF INVESTMENTS (unaudited) (continued) June 30, 2015
Shares | | Security Description | | Fair Value | |
| | | COMMON STOCKS (continued) | |
| | | MATERIALS 5.1% | |
| | 136,000 | | | Bemis Co Inc | | $ | 6,121,360 | | |
| | 123,000 | | | Ecolab Inc | | | 13,907,610 | | |
| | 156,000 | | | HB Fuller Co | | | 6,336,720 | | |
| | 124,000 | | | Valspar Corp/The | | | 10,145,680 | | |
| | | | 36,511,370 | | |
| | | UTILITIES 2.0% | |
| | 88,000 | | | ALLETE Inc | | | 4,082,320 | | |
| | 252,000 | | | MDU Resources Group Inc | | | 4,921,560 | | |
| | 173,000 | | | Xcel Energy Inc | | | 5,567,140 | | |
| | | | 14,571,020 | | |
| | | | TOTAL COMMON STOCKS
(cost $314,428,900) | | $ | 450,411,216 | | |
| | | PREFERRED STOCKS 0.0% | |
| | | UTILITIES 0.0% | |
| | 10,000 | | | SCE Trust I | | | 240,800 | | |
| | | | TOTAL PREFERRED STOCKS
(cost $250,000) | | $ | 240,800 | | |
| | | SHORT-TERM INVESTMENTS 1.6% | |
| 11,654,291 | | | First American Prime Obligations Fund, Class Z, 0.03% (b)
(cost $11,654,291) | | $ | 11,654,291 | | |
| | | | TOTAL INVESTMENTS 99.5%
(cost $576,238,238) | | $ | 713,226,094 | | |
| | | | | OTHER ASSETS AND LIABILITIES (NET) 0.5% | | | 3,315,842 | | |
| | | | | TOTAL NET ASSETS 100.0% | | $ | 716,541,936 | | |
(a) Foreign security denominated in U.S. dollars. As of June 30, 2015, these securities represented $34,797,138 or 4.9% of total net assets.
(b) The rate quoted is the annualized seven-day effective yield as of June 30, 2015.
(c) Step Bonds – Securities for which the coupon rate of interest will adjust on specified future date(s). The rate disclosed represents the coupon rate in effect as of June 30, 2015.
(d) Securities exempt from registration under Rule 144A of the Securities Act of 1933. These securities may be resold in transactions exempt from registration, normally to qualified institutional buyers. These securities have been determined to be liquid under guidelines established by the Fund's Board of Trustees. As of June 30, 2015, these securities represented $16,585,458 or 2.3% of total net assets.
(e) American Depositary Receipt.
(f) Issuer headquartered overseas but considered domestic. In determining whether a security is foreign or domestic, the Adviser will generally look at the location of the headquarters of the issuer. However, if the issuer is believed by the Adviser to be headquartered
25
Mairs & Power Balanced Fund
SCHEDULE OF INVESTMENTS (unaudited) (continued) June 30, 2015
in a jurisdiction primarily for tax purposes, the Adviser will consider the following additional factors; 1) the location of the primary exchange trading its securities; 2) where it derives the majority of its revenues, or 3) where it earns the majority of its profits.
The Global Industry Classification Standard (GICS®) was developed by and/or is the exclusive property of MSCI, Inc. and Standard & Poor's Financial Services LLC ("S&P"). GICS is a service mark of MSCI, Inc. and S&P and has been licensed for use by Mairs and Power, Inc.
See accompanying Notes to Financial Statements.
26
MAIRS & POWER SMALL CAP FUND (unaudited)
To Our Shareholders: June 30, 2015
The Small Cap Fund was down 1.27% for the second quarter and up slightly for the first half at 1.31%, but has thus far underperformed both the index and peers in both periods ending June 30, 2015. The S&P 600 Small Cap Total Return (TR) Index was up 0.19% and 4.16% in the second quarter and first half and the peer group, as measured by the Lipper Small Cap Core index, was down 0.12% for the quarter and up 3.63% for the first half.
A combination of sector allocation and stock selection drove the Fund's relative underperformance for the first half. An underweight position in the healthcare sector and overweight position in the industrial sector were the primary negative factors in sector allocation. While the Fund is only slightly underweight in healthcare, that sector has been the best performing by far so far this year, up nearly 20%. Within healthcare, biotechnology has been the hot industry and the Fund has little exposure there due to the all-or-nothing risk those stocks pose. The other sector weight that impacted Fund performance negatively relative to the index was the Fund's overweight position in the industrial sector. While the sector has performed well through most of the economic recovery, it has been one of the worst performing sectors so far this year, due to the dollar's strength.
Stock selection has also been a drag on relative performance for the year. The Fund was clearly early building a new position in Stratasys (SSYS) beginning this year as the stock continued to have a significant negative impact on performance in the second quarter. The competitive position of the company looks very strong within 3-D printing, but during the quarter growth within this immature industry slowed significantly, punishing the stock as the market grew concerned about the long-term growth rate. We continue to believe the additive manufacturing space is very early in its growth cycle and continue to like both the industry and Stratasys's stock longer term.
Mairs & Power Small Cap Fund (MSCFX) Second Quarter Results (3/31/15 – 6/30/15)
Top Performers
Second Quarter (3/31/15 – 6/30/15) | | Year To Date (12/31/14 – 6/30/15) | |
VASCO Data Security Int'l, Inc. | | | 39.97 | % | | Gentherm, Inc. | | | 45.79 | % | |
Apogee Enterprises, Inc. | | | 21.66 | % | | Vascular Solutions, Inc. | | | 23.68 | % | |
NVE Corporation | | | 13.57 | % | | Apogee Enterprises, Inc. | | | 20.08 | % | |
PrivateBancorp, Inc. | | | 13.03 | % | | PrivateBancorp, Inc. | | | 15.06 | % | |
Wintrust Financial Corporation | | | 11.76 | % | | Wintrust Financial Corporation | | | 10.00 | % | |
Weak Performers
Second Quarter (3/31/15 – 6/30/15) | | Year To Date (12/31/14 – 6/30/15) | |
Stratasys, Inc. | | | -34.01 | % | | MDU Resources Group, Inc. | | | -21.05 | % | |
Cardiovascular Systems Inc. | | | -32.44 | % | | ALLETE, Inc. | | | -20.03 | % | |
Generac Holdings | | | -18.55 | % | | Generac Holdings | | | -19.15 | % | |
Agree Realty Corporation | | | -11.72 | % | | Cray Inc. | | | -18.57 | % | |
Deluxe Corp. | | | -10.70 | % | | Oshkosh Corporation | | | -17.05 | % | |
Past performance is no guarantee of future results.
Two other large detractors for the first half were utilities Allete (ALE) and MDU Resources (MDU). The utility sector has been one of the worst performing so far this year as these bond-like investments sold off with the expectation of increased interest rates. Allete and MDU were additionally impacted due to each company's customer base. Allete serves iron ore mines in Northern Minnesota and MDU Resources serves the Bakken oil range in North Dakota. The decline in iron ore and oil prices have hurt both of these utility stocks. As the price
27
MAIRS & POWER SMALL CAP FUND (unaudited) (continued)
came down, we have selectively added to our position in MDU as we believe drilling will continue in the Bakken, albeit at a slower pace, while the region's utility rate base will continue to grow nicely.
Vasco Data (VDSI) and Gentherm (THRM) continued as strong performers for the Fund in the second quarter and year-to-date. Vasco's two factor network security authentication continues to gain adoption in the banking industry as the steady drumbeat of exposed data breaches is heard across many industries. In addition, the company continues to introduce new and improved variations of its DIGIPASS authentication application. Gentherm's strong competitive position as a leading supplier of heated and cooled automotive seats, coupled with strong demand for those options on new vehicles has greatly benefited the company and its stock.
Raven Industries (RAVN), based in Sioux Falls, South Dakota, was added to the portfolio in the second quarter. The company's stock has been depressed due to its precision agriculture business which has come under pressure with lower crop prices. But, we anticipate that business as well as Raven's applied films business should start to stabilize soon. Also, the company is in the early stages of a project with Google to supply high altitude balloons providing internet service to the portion of the world's population which currently lacks access. Small cap stocks have continued to rebound relative to larger cap stocks over the last several quarters. Valuations are just slightly below their average long term premium to large cap stocks, a premium we believe to be justified as smaller stocks have continued to slightly outpace larger stocks in both revenue and earnings growth. Over the near term we would expect small cap stocks to perform in line with their expected mid-single digit revenue and earnings growth rates.
Andrew R. Adams
Lead Manager | | Allen D. Steinkopf
Co-Manager | |
The Fund's investment objective, risks, charges and expenses must be considered carefully before investing. The summary prospectus or full prospectus contains this and other important information about the Fund, and they may be obtained by calling Shareholder Services at (800) 304-7404 or visiting www.mairsandpower.com. Read the summary prospectus or full prospectus carefully before investing.
All holdings in the portfolio are subject to change without notice and may or may not represent current or future portfolio composition. The mention of specific securities is not intended as a recommendation or an offer of a particular security, nor is it intended to be a solicitation for the purchase or sale of any security.
All investments have risks. The Small Cap Fund is designed for long-term investors. Equity investments are subject to market fluctuations, and the Fund's share price can fall because of weakness in the broad market, a particular industry, or specific holdings. Investments in small and midcap companies generally are more volatile. International investing risks include among others political, social or economic instability, difficulty in predicting international trade patterns, taxation and foreign trading practices, and greater fluctuations in price than United States corporations. The Fund may invest in initial public offerings by small cap companies, which can involve greater risk than investments in companies that are already publicly traded.
Diversification does not guarantee profit or protect against loss.
Lipper Small Cap Core Funds Index is an unmanaged index considered representative of small-cap core funds tracked by Lipper. It is not possible to invest directly in an index.
The S&P SmallCap 600 Index is an index of small company stocks managed by Standard & Poor's that covers a broad range of small cap stocks in the United States. The index is weighted according to market capitalization and covers about 3-4% of the total market for equities in the United States. It is not possible to invest directly in an index.
28
Mairs & Power Small Cap Fund
PERFORMANCE INFORMATION (unaudited) June 30, 2015
Investment performance since commencement of operations (through June 30, 2015)
This chart illustrates the performance of a hypothetical $10,000 investment made in the Fund since commencement of operations.
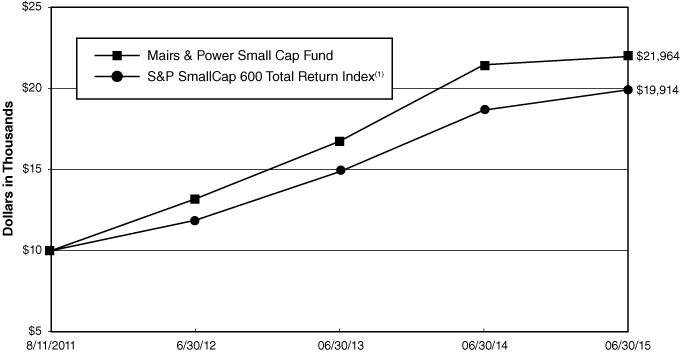
Average annual total returns for periods ended June 30, 2015
| | 1 Year | | 3 Year | | Since Inception(3) | |
Mairs & Power Small Cap Fund | | | 2.38 | % | | | 18.53 | % | | | 22.43 | % | |
S&P SmallCap 600 Total Return Index(1) | | | 6.72 | % | | | 18.81 | % | | | 19.38 | % | |
Performance data quoted represents past performance and does not guarantee future results. All performance information shown includes the reinvestment of dividend and capital gain distributions, but does not reflect the deduction of taxes that a shareholder would pay on Fund distributions or the redemption of Fund shares. The investment return and principal value of an investment will fluctuate so that an investor's shares, when redeemed, may be worth more or less than their original cost. Current performance of the Fund may be lower or higher than the performance quoted. For the most recent month-end performance figures, visit the Fund's website at www.mairsandpower.com or call Shareholder Services at (800) 304-7404.
(1) The S&P Small Cap 600 Total Return Index is an index of small company stocks managed by Standard & Poor's that covers a broad range of small cap stocks in the United States. The index is weighted according to market capitalization and covers about 3-4% of the total market for equities in the United States. It is not possible to invest directly in an index.
(2) Periods less than one year are not annualized.
(3) Since inception performance is as of August 11, 2011, which is the offering date of the Small Cap Fund.
29
Mairs & Power Small Cap Fund
FUND INFORMATION (unaudited) June 30, 2015
Portfolio Managers
Andrew R. Adams, lead manager since 2011
University of Wisconsin-Madison, MS Finance 1997
Allen D. Steinkopf, co-manager since January 1, 2015, University of Minnesota, MBA Finance 1986
General Information
Fund Symbol | | MSCFX | |
Net Asset Value (NAV) Per Share | | $ | 20.94 | | |
Expense Ratio | | | 1.06 | %1 | |
Portfolio Turnover Rate | | | 9.73 | % | |
Sales Charge | | | None2 | | |
Fund Inception Year | | | 2011 | | |
Portfolio Composition
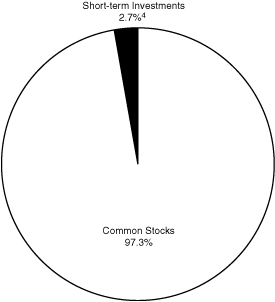
Top Ten Portfolio Holdings
(Percent of Total Net Assets) 3
Badger Meter Inc | | | 3.6 | % | |
Wintrust Financial Corp | | | 3.5 | | |
PrivateBancorp Inc | | | 3.2 | | |
United Fire Group Inc | | | 3.2 | | |
Cray Inc | | | 3.2 | | |
Bemis Co Inc | | | 3.0 | | |
Deluxe Corp | | | 3.0 | | |
Bio-Techne Corp | | | 3.0 | | |
Hawkins Inc | | | 3.0 | | |
Apogee Enterprises Inc | | | 3.0 | | |
Portfolio Diversification
(Percent of Total Net Assets)
Common Stocks 97.3% | |
Industrials | | | 28.4 | % | |
Financials | | | 22.3 | | |
Information Technology | | | 18.4 | | |
Materials | | | 7.4 | | |
Health Care | | | 7.0 | | |
Consumer Discretionary | | | 5.2 | | |
Utilities | | | 5.2 | | |
Consumer Staples | | | 2.5 | | |
Energy | | | 0.9 | | |
Short-term Investments 2.7%4 | | | 2.7 | | |
| | | | 100.0 | % | |
1 Ratio has been annualized for the six month period ended June 30, 2015.
2 Although the Fund is no-load, investment management fees and other expenses still apply.
3 All holdings in the portfolio are subject to change without notice and may or may not represent current or future portfolio composition. The mention of specific securities is not intended as a recommendation or offer for a particular security, nor is it intended to be a solicitation for the purchase or sale of any security.
4 Represents short-term investments and other assets and liabilities (net).
The Global Industry Classification Standard (GICS®) was developed by and/or is the exclusive property of MSCI, Inc. and Standard & Poor's Financial Services LLC ("S&P"). GICS is a service mark of MSCI, Inc. and S&P and has been licensed for use by Mairs and Power, Inc.
30
Mairs & Power Small Cap Fund
SCHEDULE OF INVESTMENTS (unaudited) June 30, 2015
Shares | | Security Description | | Fair Value | |
| | | COMMON STOCKS 97.3% | |
| | | CONSUMER DISCRETIONARY 5.2% | |
| | 23,300 | | | Buffalo Wild Wings Inc (b) | | $ | 3,650,877 | | |
| | 36,100 | | | Cabela's Inc (b) | | | 1,804,278 | | |
| | 94,185 | | | Gentherm Inc (b) | | | 5,171,698 | | |
| | | | 10,626,853 | | |
| | | CONSUMER STAPLES 2.5% | |
| | 53,100 | | | Casey's General Stores Inc | | | 5,083,794 | | |
| | | ENERGY 0.9% | |
| | 255,900 | | | Northern Oil and Gas Inc (b) | | | 1,732,443 | | |
| | | FINANCIALS 22.3% | |
| | 202,100 | | | Agree Realty Corp | | | 5,895,257 | | |
| | 262,200 | | | Associated Banc-Corp | | | 5,314,794 | | |
| | 288,613 | | | Bank Mutual Corp | | | 2,213,662 | | |
| | 236,116 | | | Cardinal Financial Corp | | | 5,144,967 | | |
| | 259,400 | | | Physicians Realty Trust | | | 3,984,384 | | |
| | 164,950 | | | PrivateBancorp Inc | | | 6,568,309 | | |
| | 199,363 | | | United Fire Group Inc | | | 6,531,132 | | |
| | 51,500 | | | Waddell & Reed Financial Inc, Class A | | | 2,436,465 | | |
| | 134,600 | | | Wintrust Financial Corp | | | 7,184,948 | | |
| | | | 45,273,918 | | |
| | | HEALTH CARE 7.0% | |
| | 61,000 | | | Bio-Techne Corp | | | 6,006,670 | | |
| | 127,442 | | | Cardiovascular Systems Inc (b) | | | 3,370,841 | | |
| | 35,300 | | | Patterson Cos Inc | | | 1,717,345 | | |
| | 90,473 | | | Vascular Solutions Inc (b) | | | 3,141,223 | | |
| | | | 14,236,079 | | |
| | | INDUSTRIALS 28.4% | |
| | 189,500 | | | Actuant Corp | | | 4,375,555 | | |
| | 113,600 | | | Apogee Enterprises Inc | | | 5,979,904 | | |
| | 98,500 | | | Deluxe Corp | | | 6,107,000 | | |
| | 138,300 | | | Donaldson Co Inc | | | 4,951,140 | | |
| | 52,939 | | | G&K Services Inc, Class A | | | 3,660,203 | | |
| | 130,600 | | | Generac Holdings Inc (b) | | | 5,191,350 | | |
| | 69,700 | | | Graco Inc | | | 4,950,791 | | |
| | 106,100 | | | Hub Group Inc, Class A (b) | | | 4,280,074 | | |
| | 139,600 | | | Manitowoc Co Inc/The | | | 2,736,160 | | |
| | 121,700 | | | Oshkosh Corp | | | 5,157,646 | | |
31
Mairs & Power Small Cap Fund
SCHEDULE OF INVESTMENTS (unaudited) (continued) June 30, 2015
Shares | | Security Description | | Fair Value | |
| | | COMMON STOCKS (continued) | |
| | | INDUSTRIALS (continued) | |
| | 48,700 | | | Proto Labs Inc (b) | | $ | 3,286,276 | | |
| | 128,534 | | | Raven Industries Inc | | | 2,613,096 | | |
| | 13,400 | | | Snap-on Inc | | | 2,133,950 | | |
| | 31,300 | | | Toro Co/The | | | 2,121,514 | | |
| | | | 57,544,659 | | |
| | | INFORMATION TECHNOLOGY 18.4% | |
| | 114,196 | | | Badger Meter Inc | | | 7,250,304 | | |
| | 220,478 | | | Cray Inc (b) | | | 6,506,306 | | |
| | 167,675 | | | MOCON Inc | | | 2,674,416 | | |
| | 47,200 | | | MTS Systems Corp | | | 3,254,440 | | |
| | 58,434 | | | NVE Corp | | | 4,581,226 | | |
| | 52,200 | | | SPS Commerce Inc (b) | | | 3,434,760 | | |
| | 141,300 | | | Stratasys Ltd (a) (b) | | | 4,935,609 | | |
| | 153,316 | | | VASCO Data Security International Inc (b) | | | 4,628,610 | | |
| | | | 37,265,671 | | |
| | | MATERIALS 7.4% | |
| | 136,000 | | | Bemis Co Inc | | | 6,121,360 | | |
| | 148,283 | | | Hawkins Inc | | | 5,989,150 | | |
| | 35,000 | | | Valspar Corp/The | | | 2,863,700 | | |
| | | | 14,974,210 | | |
| | | UTILITIES 5.2% | |
| | 101,900 | | | ALLETE Inc | | | 4,727,141 | | |
| | 301,300 | | | MDU Resources Group Inc | | | 5,884,389 | | |
| | | | 10,611,530 | | |
| | | | TOTAL COMMON STOCKS
(cost $166,992,024) | | $ | 197,349,157 | | |
| | | SHORT-TERM INVESTMENTS 2.2% | |
| 4,374,886 | | | First American Prime Obligations Fund, Class Z, 0.03% (c)
(cost $4,374,886) | | $ | 4,374,886 | | |
| | | | TOTAL INVESTMENTS 99.5%
(cost $171,366,910) | | $ | 201,724,043 | | |
| | | | | OTHER ASSETS AND LIABILITIES (NET) 0.5% | | | 944,823 | | |
| | | | | TOTAL NET ASSETS 100.0% | | $ | 202,668,866 | | |
(a) Foreign security denominated in U.S. dollars. As of June 30, 2015, these securities represented $4,935,609 or 2.4% of total net assets.
32
Mairs & Power Small Cap Fund
SCHEDULE OF INVESTMENTS (unaudited) (continued) June 30, 2015
(b) Non-income producing.
(c) The rate quoted is the annualized seven-day effective yield as of June 30, 2015.
The Global Industry Classification Standard (GICS®) was developed by and/or is the exclusive property of MSCI, Inc. and Standard & Poor's Financial Services LLC ("S&P"). GICS is a service mark of MSCI, Inc. and S&P and has been licensed for use by Mairs and Power, Inc.
See accompanying Notes to Financial Statements.
33
STATEMENTS OF ASSETS AND LIABILITIES (unaudited) June 30, 2015
| | | Mairs & Power
Growth Fund | | Mairs & Power
Balanced Fund | | Mairs & Power
Small Cap Fund | |
ASSETS | |
| Investments, at fair value (Note 1): | |
Unaffiliated securities * | | $ | 4,000,712,095 | | | $ | 713,226,094 | | | $ | 201,724,043 | | |
| Affiliated securities (Note 5) * | | | 145,002,582 | | | | - | | | | - | | |
| | | | 4,145,714,677 | | | | 713,226,094 | | | | 201,724,043 | | |
Receivable for Fund shares sold | | | 2,148,224 | | | | 706,874 | | | | 1,238,786 | | |
Receivable for securities sold | | | 4,479,852 | | | | 824,101 | | | | - | | |
Dividends and interest receivable | | | 6,582,681 | | | | 3,493,189 | | | | 178,573 | | |
Prepaid expenses and other assets | | | 147,495 | | | | 59,189 | | | | 34,526 | | |
| | | 4,159,072,929 | | | | 718,309,447 | | | | 203,175,928 | | |
LIABILITIES | |
Payable for Fund shares redeemed | | | 1,313,960 | | | | 1,202,916 | | | | 34,765 | | |
Payable for securities purchased | | | 2,314,855 | | | | 78,700 | | | | 272,589 | | |
| Accrued investment management fees (Note 2) | | | 1,948,778 | | | | 360,679 | | | | 151,098 | | |
| Accrued Fund administration fees (Note 2) | | | 114,851 | | | | 20,070 | | | | 4,361 | | |
Accrued trustee fees | | | 10,534 | | | | 1,777 | | | | 381 | | |
Accrued audit and tax expense | | | 18,975 | | | | 26,238 | | | | 14,562 | | |
Accrued transfer agent fees | | | 217,554 | | | | 44,239 | | | | 18,339 | | |
Accrued expenses and other liabilities | | | 131,920 | | | | 32,892 | | | | 10,967 | | |
| | | 6,071,427 | | | | 1,767,511 | | | | 507,062 | | |
NET ASSETS | | $ | 4,153,001,502 | | | $ | 716,541,936 | | | $ | 202,668,866 | | |
NET ASSETS CONSIST OF | |
Portfolio capital | | $ | 2,144,558,431 | | | $ | 566,793,291 | | | $ | 169,044,910 | | |
Undistributed net investment income | | | 220,691 | | | | 323,587 | | | | 472,990 | | |
Undistributed net realized gain on investments | | | 148,328,843 | | | | 12,437,202 | | | | 2,793,833 | | |
Net unrealized appreciation on investments | | | 1,859,893,537 | | | | 136,987,856 | | | | 30,357,133 | | |
TOTAL NET ASSETS | | $ | 4,153,001,502 | | | $ | 716,541,936 | | | $ | 202,668,866 | | |
Fund shares, par value | | $ | 0.01 | | | $ | 0.01 | | | $ | 0.01 | | |
Authorized | | | unlimited | | | | unlimited | | | | unlimited | | |
Fund shares issued and outstanding | | | 36,200,336 | | | | 8,422,707 | | | | 9,679,491 | | |
Net asset value per share | | $ | 114.72 | | | $ | 85.07 | | | $ | 20.94 | | |
* Cost of investments | |
Cost of unaffiliated securities | | $ | 2,218,203,466 | | | $ | 576,238,238 | | | $ | 171,366,910 | | |
| Cost of affiliated securities (Note 5) | | | 67,617,674 | | | | - | | | | - | | |
| | | $ | 2,285,821,140 | | | $ | 576,238,238 | | | $ | 171,366,910 | | |
See accompanying Notes to Financial Statements.
34
STATEMENTS OF OPERATIONS (unaudited) Six Months Ended June 30, 2015
| | | Mairs & Power
Growth Fund | | Mairs & Power
Balanced Fund | | Mairs & Power
Small Cap Fund | |
INVESTMENT INCOME | |
Income: | |
Dividends from unaffiliated securities * | | $ | 41,914,687 | | | $ | 6,158,851 | | | $ | 1,468,088 | | |
| Dividends from affiliated securities (Note 5) | | | 2,416,138 | | | | - | | | | - | | |
Interest income | | | 6,535 | | | | 5,646,587 | | | | 401 | | |
TOTAL INCOME | | | 44,337,360 | | | | 11,805,438 | | | | 1,468,489 | | |
Expenses: | |
| Investment management fees (Note 2) | | | 11,823,543 | | | | 2,206,765 | | | | 843,136 | | |
| Fund administration fees (Note 2) | | | 377,441 | | | | 67,607 | | | | 15,713 | | |
Fund accounting | | | 224,331 | | | | 76,389 | | | | 26,163 | | |
| Trustees' compensation (Note 2) | | | 105,984 | | | | 17,877 | | | | 3,831 | | |
Transfer agent fees | | | 733,760 | | | | 144,028 | | | | 52,714 | | |
Custodian fees | | | 125,112 | | | | 24,734 | | | | 7,926 | | |
Legal and audit fees | | | 79,750 | | | | 36,273 | | | | 15,972 | | |
Printing and mailing fees | | | 156,449 | | | | 44,369 | | | | 12,976 | | |
Other expenses | | | 117,172 | | | | 36,101 | | | | 17,501 | | |
TOTAL EXPENSES | | | 13,743,542 | | | | 2,654,143 | | | | 995,932 | | |
NET INVESTMENT INCOME | | | 30,593,818 | | | | 9,151,295 | | | | 472,557 | | |
| REALIZED AND UNREALIZED GAIN (LOSS) (Note 4) | |
Net realized gain on investments | |
Unaffiliated issuers | | | 141,941,780 | | | | 12,436,836 | | | | 3,893,573 | | |
| Affiliated issuers (Note 5) | | | 6,573,057 | | | | - | | | | - | | |
| | | | 148,514,837 | | | | 12,436,836 | | | | 3,893,573 | | |
Change in net unrealized depreciation
on investments | | | (201,766,117 | ) | | | (26,976,556 | ) | | | (2,296,873 | ) | |
NET GAIN (LOSS) ON INVESTMENTS | | | (53,251,280 | ) | | | (14,539,720 | ) | | | 1,596,700 | | |
NET INCREASE (DECREASE) IN NET ASSETS
FROM OPERATIONS | | $ | (22,657,462 | ) | | $ | (5,388,425 | ) | | $ | 2,069,257 | | |
* Net of foreign taxes withheld of: | | $ | 265,023 | | | $ | 43,518 | | | $ | - | | |
See accompanying Notes to Financial Statements.
35
Mairs & Power Growth Fund
STATEMENTS OF CHANGES IN NET ASSETS
| | | Six Months Ended
June 30, 2015
(Unaudited) | | Year Ended
December 31,
2014 | |
OPERATIONS | |
Net investment income | | $ | 30,593,818 | | | $ | 56,029,296 | | |
Net realized gain on investments sold | | | 148,514,837 | | | | 85,784,027 | | |
Net change in unrealized appreciation (depreciation) of investments | | | (201,766,117 | ) | | | 186,205,036 | | |
NET INCREASE IN NET ASSETS FROM OPERATIONS | | | (22,657,462 | ) | | | 328,018,359 | | |
DISTRIBUTIONS TO SHAREHOLDERS FROM | |
Net investment income | | | (30,578,156 | ) | | | (55,824,267 | ) | |
Net realized gain on investments sold | | | - | | | | (86,125,609 | ) | |
TOTAL DISTRIBUTIONS TO SHAREHOLDERS | | | (30,578,156 | ) | | | (141,949,876 | ) | |
CAPITAL TRANSACTIONS | |
Proceeds from shares sold | | | 189,614,147 | | | | 544,753,954 | | |
Reinvestment of distributions from net investment income and net
realized gains | | | 28,261,147 | | | | 133,193,951 | | |
Cost of shares redeemed | | | (309,113,465 | ) | | | (531,070,805 | ) | |
INCREASE (DECREASE) IN NET ASSETS FROM CAPITAL
TRANSACTIONS | | | (91,238,171 | ) | | | 146,877,100 | | |
TOTAL INCREASE (DECREASE) IN NET ASSETS | | | (144,473,789 | ) | | | 332,945,583 | | |
NET ASSETS | |
Beginning of period | | | 4,297,475,291 | | | | 3,964,529,708 | | |
End of period (including undistributed net investment income of $220,691
and $205,029, respectively) | | $ | 4,153,001,502 | | | $ | 4,297,475,291 | | |
FUND SHARE TRANSACTIONS | |
Shares sold | | | 1,627,087 | | | | 4,860,694 | | |
Shares issued for reinvested distributions | | | 246,844 | | | | 1,139,114 | | |
Shares redeemed | | | (2,656,099 | ) | | | (4,704,753 | ) | |
NET INCREASE (DECREASE) IN FUND SHARES | | | (782,168 | ) | | | 1,295,055 | | |
See accompanying Notes to Financial Statements.
36
Mairs & Power Balanced Fund
STATEMENTS OF CHANGES IN NET ASSETS
| | | Six Months Ended
June 30, 2015
(Unaudited) | | Year Ended
December 31,
2014 | |
OPERATIONS | |
Net investment income | | $ | 9,151,295 | | | $ | 15,303,692 | | |
Net realized gain on investments sold | | | 12,436,836 | | | | 725,618 | | |
Net change in unrealized appreciation (depreciation) of investments | | | (26,976,556 | ) | | | 33,547,192 | | |
NET INCREASE (DECREASE) IN NET ASSETS FROM OPERATIONS | | | (5,388,425 | ) | | | 49,576,502 | | |
DISTRIBUTIONS TO SHAREHOLDERS FROM | |
Net investment income | | | (8,850,857 | ) | | | (15,372,720 | ) | |
Net realized gain on investments sold | | | - | | | | (725,533 | ) | |
TOTAL DISTRIBUTIONS TO SHAREHOLDERS | | | (8,850,857 | ) | | | (16,098,253 | ) | |
CAPITAL TRANSACTIONS | |
Proceeds from shares sold | | | 81,537,197 | | | | 209,088,383 | | |
Reinvestment of distributions from net investment income and net
realized gains | | | 8,477,585 | | | | 15,406,907 | | |
Cost of shares redeemed | | | (82,097,016 | ) | | | (99,425,514 | ) | |
INCREASE IN NET ASSETS FROM CAPITAL TRANSACTIONS | | | 7,917,766 | | | | 125,069,776 | | |
TOTAL INCREASE (DECREASE) IN NET ASSETS | | | (6,321,516 | ) | | | 158,548,025 | | |
NET ASSETS | |
Beginning of period | | | 722,863,452 | | | | 564,315,427 | | |
End of period (including undistributed net investment income of $323,587
and $23,149, respectively) | | $ | 716,541,936 | | | $ | 722,863,452 | | |
FUND SHARE TRANSACTIONS | |
Shares sold | | | 938,628 | | | | 2,474,800 | | |
Shares issued for reinvested distributions | | | 98,527 | | | | 180,250 | | |
Shares redeemed | | | (943,675 | ) | | | (1,181,522 | ) | |
NET INCREASE IN FUND SHARES | | | 93,480 | | | | 1,473,528 | | |
See accompanying Notes to Financial Statements.
37
Mairs & Power Small Cap Fund
STATEMENTS OF CHANGES IN NET ASSETS
| | | Six Months Ended
June 30, 2015
(Unaudited) | | Year Ended
December 31,
2014 | |
OPERATIONS | |
Net investment income | | $ | 472,557 | | | $ | 575,864 | | |
Net realized gain on investments sold | | | 3,893,573 | | | | 2,028,819 | | |
Net change in unrealized appreciation (depreciation) of investments | | | (2,296,873 | ) | | | 6,724,120 | | |
NET INCREASE IN NET ASSETS FROM OPERATIONS | | | 2,069,257 | | | | 9,328,803 | | |
DISTRIBUTIONS TO SHAREHOLDERS FROM | |
Net investment income | | | - | | | | (569,257 | ) | |
Net realized gain on investments sold | | | - | | | | (2,834,620 | ) | |
TOTAL DISTRIBUTIONS TO SHAREHOLDERS | | | - | | | | (3,403,877 | ) | |
CAPITAL TRANSACTIONS | |
Proceeds from shares sold | | | 49,844,189 | | | | 60,699,525 | | |
Reinvestment of distributions from net investment income and net
realized gains | | | - | | | | 3,281,967 | | |
Cost of shares redeemed* | | | (11,474,853 | ) | | | (19,162,440 | ) | |
INCREASE IN NET ASSETS FROM CAPITAL TRANSACTIONS | | | 38,369,336 | | | | 44,819,052 | | |
TOTAL INCREASE IN NET ASSETS | | | 40,438,593 | | | | 50,743,978 | | |
NET ASSETS | |
Beginning of period | | | 162,230,273 | | | | 111,486,295 | | |
End of period (including undistributed net investment income of $472,990
and $433, respectively) | | $ | 202,668,866 | | | $ | 162,230,273 | | |
FUND SHARE TRANSACTIONS | |
Shares sold | | | 2,375,598 | | | | 3,008,547 | | |
Shares issued for reinvested distributions | | | - | | | | 157,787 | | |
Shares redeemed | | | (545,422 | ) | | | (953,045 | ) | |
NET INCREASE IN FUND SHARES | | | 1,830,176 | | | | 2,213,289 | | |
| * Net of redemption fees of: | | $ | 20,097 | | | $ | 24,735 | | |
See accompanying Notes to Financial Statements.
38
NOTES TO FINANCIAL STATEMENTS (unaudited) June 30, 2015
Note 1 – Organization and Significant Accounting Policies
The Mairs & Power Funds Trust (the Trust) is a no-load, diversified, open-end management investment company registered under the Investment Company Act of 1940, as amended (the 1940 Act). Mairs & Power Growth Fund (the Growth Fund), Mairs & Power Balanced Fund (the Balanced Fund), and Mairs & Power Small Cap Fund (the Small Cap Fund) (individually a Fund and collectively the Funds) are series within the Trust. The objective of the Growth Fund is to provide shareholders with a diversified portfolio of common stocks, which have the potential for above-average, long-term appreciation. The objective of the Balanced Fund is to provide capital growth, current income and preservation of capital. The objective of the Small Cap Fund is to seek above-average, long-term appreciation. Each fund is an investment company and accordingly follows the investment company accounting and reporting guidance of the Financial Accounting Standards Board (FASB) Accounting Standard Codification Topic 946 "Financial Services – Investment Companies."
Significant accounting policies of the Funds are as follows:
Security Valuations
Security valuations for each Fund's investments are furnished by independent pricing services that have been approved by the Trust's Board of Trustees (the Board). Investments in listed equity securities are valued at the last quoted sale price on the securities exchange on which such securities are principally traded or at the NASDAQ Official Closing Price if readily available for such securities on each business day. Other equity securities traded in the over-the-counter market and listed equity securities for which no sale was reported on that date are valued at the last quoted bid price. Debt obligations exceeding 60 days to maturity are valued at the bid price furnished by an independent pricing service. Debt obligations with 60 days or less remaining until maturity may be valued at the bid price furnished by an independent pricing service and in certain circumstances may be valued at their amortized cost, which approximates fair value. Pricing service prices for debt obligations are based on various evaluative and matrix-based methodologies and models that use market inputs such as market transactions, dealer quotations, benchmark yields and issuer, industry and economic events. These techniques generally consider overall market conditions and such factors as yields or prices of bonds of comparable quality, type of issue, coupon, maturity and ratings.
Securities for which prices are not available from an independent pricing service, but where an active market exists, are valued using market quotations obtained from two or more dealers that make markets in the securities. When market quotations are not readily available, or when the last quoted sale price is not considered representative of the value of the security if it were to be sold on that day, the security will be valued at fair value as determined in good faith by the Fair Value Committee appointed by the Board, pursuant to procedures approved by the Board.
When determining the value of a security, the Fair Value Committee takes into consideration all indications of value that appear relevant under the particular circumstances as well as fundamental analytical data relating to the security, the nature and duration of any restrictions on the disposition of the security, and the forces influencing the market in which the security is purchased or sold in addition to other more specific factors that may be applied on a case-by-case basis. Consequently, the value of the security used by a Fund may differ from a quoted or published price for the same security. Fair value pricing involves subjective judgments and it is possible that the fair value determined for the security is materially different than the value that could be realized upon the sale of that security. As of June 30, 2015, no securities in the Funds were valued using this method.
Fair Valuation Measurements
The Trust has adopted authoritative fair valuation accounting standards, which establish a definition of fair value and set out a hierarchy for measuring fair value. These standards require additional disclosures about the various inputs
39
NOTES TO FINANCIAL STATEMENTS (unaudited) (continued) June 30, 2015
Note 1 – Organization and Significant Accounting Policies (continued)
and valuation techniques used to develop the measurements of fair value and changes in valuation techniques and related inputs during the period. These inputs are summarized in the three broad levels listed below:
• Level 1 – Quoted prices in active markets for identical securities.
• Level 2 – Other significant observable inputs (including quoted prices for similar securities, interest rates, prepayment speeds, credit risk, etc.).
• Level 3 – Significant unobservable inputs (including the Funds' own assumptions in determining the fair value of investments).
The inputs or methodologies used for valuing securities are not necessarily an indication of the risk associated with investing in those securities. The following is a summary of the inputs used to value the net assets of each Fund as of June 30, 2015:
| | | Growth Fund | | Balanced Fund | | Small Cap Fund | |
Level 1* | | $ | 4,145,714,677 | | | $ | 470,071,557 | | | $ | 201,724,043 | | |
Level 2** | | | - | | | | 243,154,537 | | | | - | | |
Level 3 | | | - | | | | - | | | | - | | |
Total | | $ | 4,145,714,647 | | | $ | 713,226,094 | | | $ | 201,724,043 | | |
* All Level 1 investments are equity securities (common stocks and preferred securities) and short-term investments.
** All Level 2 investments are fixed income securities, excluding preferred securities.
For detail of securities by major sector classification for the Funds, please refer to the Schedules of Investments.
The Funds had no transfers amongst levels during the period and did not hold any Level 3 investments at either June 30, 2015 or December 31, 2014.
Security Transactions and Investment Income
Security transactions are recorded on the date on which securities are purchased or sold. Dividend income and corporate action transactions are recorded on the ex-dividend date. Interest income, including the accretion of discounts and amortization of premiums, is recorded on an accrual basis. Premiums and discounts are amortized using the effective interest method. Realized gains and losses are reported on an identified cost basis.
Income Taxes
Each Fund is a "regulated investment company" as defined in Subtitle A, Chapter 1, Subchapter M of the Internal Revenue Code, as amended (the Code). No provisions have been made for federal income taxes as it is the intention of each Fund to comply with the provisions of the Code applicable to regulated investment companies and to make distributions of income and realized gains sufficient to relieve it from all or substantially all excise and income taxes.
As of June 30, 2015, the Trust did not have any tax positions that did not meet the "more-likely-than-not" threshold of being sustained by the applicable tax authority. Generally, tax authorities can examine all tax returns filed for the last three years.
As of December 31, 2014, the Funds did not have any post-enactment capital loss carryforwards. The Small Cap Fund has a year end of October 31 for capital gains. At December 31, 2014, the Small Cap Fund deferred, on a tax basis, post-October losses of $1,036,472.
40
NOTES TO FINANCIAL STATEMENTS (unaudited) (continued) June 30, 2015
Note 1 – Organization and Significant Accounting Policies (continued)
Basis of Presentation
The preparation of financial statements in conformity with U.S. generally accepted accounting principles (GAAP) requires management to make estimates and assumptions that affect the reported amount of net assets and liabilities and disclosure of contingent assets and liabilities at the date of the financial statements and the reported results of operations during the reporting period. Actual results could differ from those estimates.
In preparing these financial statements, the Funds have evaluated events and transactions for potential recognition or disclosure through the date the financial statements were available to be issued. This evaluation did not result in any subsequent events that necessitated recognition or disclosures.
Expense Allocation
Common expenses incurred by the Trust are allocated among the Funds based on their relative assets. Fund specific expenses are charged directly to the Fund that incurred the expense.
Note 2 – Related-Party Transactions
Investment Management and Fund Administration Fees
The Adviser provides investment management services to the Funds under a written agreement (the Management Agreement) approved by the Board. Pursuant to the Management Agreement, the Adviser is paid a monthly fee on average daily net assets at the following annual rates:
| | | Growth Fund | | Balanced Fund | | Small Cap Fund | |
Up to $2.5 Billion | | | 0.60 | % | | | 0.60 | % | | | 0.90 | % | |
Over $2.5 Billion | | | 0.50 | % | | | 0.60 | % | | | 0.90 | % | |
The Adviser provides fund administration services to the Funds under a written fund administration servicing agreement approved by the Board. The fund administration fee paid to the Adviser is computed at an annual rate of 0.00281% of average daily net assets. Fund administration fees incurred for the six months ended June 30, 2015 and fund administration fees payable to the Adviser as of June 30, 2015 were as follows:
| | | Growth Fund | | Balanced Fund | | Small Cap Fund | |
Fund administration fees incurred | | $ | 59,481 | | | $ | 10,335 | | | $ | 2,633 | | |
Fund administration fees payable | | | 9,797 | | | | 1,689 | | | | 472 | | |
Pursuant to a sub-administration agreement between the Funds and U.S. Bancorp Fund Services, LLC (USBFS), the Funds are charged a sub-administration fee paid to USBFS. Sub-administration fees from USBFS incurred for the six months ended June 30, 2015 and sub-administration fees payable to USBFS as of June 30, 2015 were as follows:
| | | Growth Fund | | Balanced Fund | | Small Cap Fund | |
Sub-administration fees paid | | $ | 317,960 | | | $ | 57,272 | | | $ | 13,080 | | |
Sub-administration fees payable | | | 105,054 | | | | 18,381 | | | | 3,889 | | |
Trustees' Compensation
The Funds pay compensation to the disinterested Trustees of the Trust. The Funds do not pay remuneration to officers or to Trustees who are officers, directors or employees of the Adviser.
41
NOTES TO FINANCIAL STATEMENTS (unaudited) (continued) June 30, 2015
Note 3 – Indemnifications
In the normal course of business, the Trust enters into contracts that contain general indemnifications to other parties. The Trust's maximum exposure under these contracts is unknown as this would involve future claims that may be made against the Trust that have not yet occurred. The Trust expects the risk of loss to be remote.
Note 4 – Distributions Paid, Distributable Earnings and Investment Transactions
Net investment income and net realized capital gains (losses) may differ for financial reporting and tax purposes because of temporary or permanent book/tax differences. To the extent these differences are permanent, reclassifications are made to the appropriate equity accounts in the period that the difference arises.
Distributions to shareholders are determined in accordance with income tax regulations that may differ from GAAP, and due to the timing of the distributions, the fiscal year in which the amounts are distributed may differ from the year that the income or realized gains (losses) were recorded by each Fund.
The tax character of distributions paid during the six months ended June 30, 2015 and the fiscal year ended December 31, 2014, were as follows:
Six months ended June 30, 2015 | |
Distributions paid from: | | Growth Fund | | Balanced Fund | | Small Cap Fund | |
Ordinary income | | $ | 30,578,156 | | | $ | 8,850,857 | | | $ | - | | |
Long-term capital gains | | | - | | | | - | | | | - | | |
Total distributions paid | | $ | 30,578,156 | | | $ | 8,850,857 | | | $ | - | | |
Year ended December 31, 2014 | |
Distributions paid from: | | Growth Fund | | Balanced Fund | | Small Cap Fund | |
Ordinary income | | $ | 55,824,267 | | | $ | 15,401,379 | | | $ | 569,257 | | |
Long-term capital gains | | | 86,125,609 | | | | 696,874 | | | | 2,834,620 | | |
Total distributions paid | | $ | 141,949,876 | | | $ | 16,098,253 | | | $ | 3,403,877 | | |
Ordinary income distributions include net short-term capital gains. The Funds designate the long-term capital gains presented above as capital gains dividends under the Internal Revenue Code.
At December 31, 2014, the components of accumulated earnings (losses) on a tax basis were as follows:
| | | Growth Fund | | Balanced Fund | | Small Cap Fund | |
Cost of investments | | $ | 2,232,065,087 | | | $ | 553,234,505 | | | $ | 129,533,153 | | |
Gross unrealized appreciation | | $ | 2,100,312,918 | | | $ | 173,607,417 | | | $ | 37,249,153 | | |
Gross unrealized depreciation | | | (39,445,161 | ) | | | (9,643,005 | ) | | | (4,658,415 | ) | |
Net unrealized appreciation | | $ | 2,060,867,757 | | | $ | 163,964,412 | | | $ | 32,590,738 | | |
Undistributed ordinary income | | $ | 205,029 | | | $ | 23,222 | | | $ | 433 | | |
Undistributed long-term capital gains | | | 605,903 | | | | 293 | | | | - | | |
Total distributable earnings | | $ | 810,932 | | | $ | 23,515 | | | $ | 433 | | |
Other accumulated earnings | | | - | | | | - | | | | (1,036,472 | ) | |
Total accumulated earnings | | $ | 2,061,678,689 | | | $ | 163,987,927 | | | $ | 31,554,699 | | |
The difference between book basis and tax basis unrealized appreciation is attributable primarily to the tax deferrals of losses on wash sales and the tax cost basis adjustment due to receipt of return of capital distributions from certain investments.
42
NOTES TO FINANCIAL STATEMENTS (unaudited) (continued) June 30, 2015
Note 4 – Distributions Paid, Distributable Earnings and Investment Transactions (continued)
Purchases and sales of investment securities, excluding government securities, short-term securities and temporary cash investments, during the six months ended June 30, 2015 were as follows:
| | | Purchases | | Sales | |
Growth Fund | | $ | 280,342,471 | | | $ | 389,546,861 | | |
Balanced Fund | | | 63,674,460 | | | | 40,016,568 | | |
Small Cap Fund | | | 54,763,149 | | | | 17,734,593 | | |
Purchases and sales of government securities during the six months ended June 30, 2015 were as follows:
| | | Purchases | | Sales | |
Growth Fund | | $ | - | | | $ | - | | |
Balanced Fund | | | 12,986,012 | | | | 21,174,120 | | |
Small Cap Fund | | | - | | | | - | | |
Note 5 – Transactions With Affiliated Companies
The Growth Fund owned 5% or more of the voting securities of the following companies during the six months ended June 30, 2015. As a result, these companies are deemed to be affiliates of the Growth Fund as defined by the Investment Company Act of 1940. Transactions during the period in these securities of affiliated companies were as follows:
Growth Fund
| | | Share Activity | | | | | |
Security Name | | Balance
12/31/14 | | Purchases | | Sales | | Balance
06/30/15 | | Dividend
Income | | Fair Value at
06/30/15 | |
Badger Meter Inc | | | 784,299 | | | | - | | | | - | | | | 784,299 | | | $ | 298,034 | | | $ | 49,795,143 | | |
MTS Systems Corp | | | 1,071,025 | | | | - | | | | 88,176 | | | | 982,849 | | | | 642,615 | | | | 67,767,439 | | |
NVE Corp | | | 486,185 | | | | - | | | | 136,185 | | | | 350,000 | | | | 1,475,489 | | | | 27,440,000 | | |
| | | | | | | | | | | $ | 2,416,138 | | | $ | 145,002,582 | | |
Note 6 – Report of the Funds' Special Meetings of Shareholders
A special meeting of shareholders of the Trust took place on April 10, 2015 for the purpose of acting on the following proposal:
To elect six trustees to the Trust's Board of Trustees, including four current trustees and two trustee nominees.
All shareholders of record at the close of February 10, 2015 (the "Record Date") were entitled to vote. As of the Record Date, the Growth Fund had 36,674,321 shares outstanding, the Balanced Fund had 8,526,479 shares outstanding, and the Small Cap Fund had 8,473,479 shares outstanding for a cumulative total of 53,674,279 shares outstanding and entitled to vote at the special meeting of the Trust. A cumulative of 40,280,908 shares had been voted which represented 75.0% of the record date shares. The following is a summary of the shares voted for the proposal:
Trustee Nominee | | For | | % | | Withhold | | % | |
Norbert J. Conzemius | | | 39,677,615 | | | | 98.5 | | | | 603,293 | | | | 1.5 | | |
Jon A. Theobald | | | 39,538,347 | | | | 98.2 | | | | 742,561 | | | | 1.8 | | |
Bert J. McKasy | | | 39,650,464 | | | | 98.4 | | | | 630,443 | | | | 1.6 | | |
Mary Schmid Daugherty | | | 39,771,461 | | | | 98.7 | | | | 509,447 | | | | 1.3 | | |
James D. Alt | | | 39,735,713 | | | | 98.6 | | | | 545,194 | | | | 1.4 | | |
Patrick A. Thiele | | | 39,532,676 | | | | 98.1 | | | | 748,231 | | | | 1.9 | | |
43
NOTES TO FINANCIAL STATEMENTS (unaudited) (continued) June 30, 2015
Note 6 – Report of the Funds' Special Meetings of Shareholders (continued)
A special meeting of shareholders of the Balanced Fund took place on April 24, 2015 for the purpose of acting on the following proposal:
To approve an amendment to the Balanced Fund's investment objective.
All shareholders of record as of the Record Date were entitled to vote. The following is a summary of the shares voted for the proposal:
| For | | % | | Against | | % | | Abstain | | % | |
| | 4,424,587 | | | | 96.5 | | | | 105,375 | | | | 2.3 | | | | 54,279 | | | | 1.2 | | |
44
Mairs and Power Growth Fund
FINANCIAL HIGHLIGHTS
SELECTED DATA AND RATIOS
(for a share outstanding throughout each period)
| | | Six Months
Ended | | Year Ended December 31, | |
| | | June 30, 2015 (1) | | 2014 | | 2013 | | 2012 | | 2011 | | 2010 | |
| | | (unaudited) | | | | | | | | | | | |
Per Share | |
Net asset value, beginning of period | | $ | 116.20 | | | $ | 111.09 | | | $ | 83.95 | | | $ | 70.78 | | | $ | 72.16 | | | $ | 63.12 | | |
Income from investment operations: | |
Net investment income | | | 0.84 | | | | 1.54 | | | | 1.23 | | | | 1.33 | | | | 1.01 | | | | 0.86 | | |
Net realized and unrealized gain (loss) | | | (1.47 | ) | | | 7.48 | | | | 28.58 | | | | 14.08 | | | | (0.45 | ) | | | 10.01 | | |
Total from investment operations | | | (0.63 | ) | | | 9.02 | | | | 29.81 | | | | 15.41 | | | | 0.56 | | | | 10.87 | | |
Distributions to shareholders from: | |
Net investment income | | | (0.85 | ) | | | (1.53 | ) | | | (1.23 | ) | | | (1.34 | ) | | | (1.00 | ) | | | (0.86 | ) | |
Net realized gains on unaffiliated investments sold | | | - | | | | (2.38 | ) | | | (1.44 | ) | | | (0.90 | ) | | | (0.94 | ) | | | (0.97 | ) | |
Contribution from Adviser | | | - | | | | - | | | | - | | | | - | | | | - | | | | (0.04 | )(2) | |
Total distributions | | | (0.85 | ) | | | (3.91 | ) | | | (2.67 | ) | | | (2.24 | ) | | | (1.94 | ) | | | (1.87 | ) | |
Contribution from Adviser | | | - | | | | - | | | | - | | | | - | | | | - | | | | 0.04 | (2) | |
Net asset value, end of period | | $ | 114.72 | | | $ | 116.20 | | | $ | 111.09 | | | $ | 83.95 | | | $ | 70.78 | | | $ | 72.16 | | |
Total investment return | | | (0.54 | )% | | | 8.12 | % | | | 35.64 | % | | | 21.91 | % | | | 0.74 | % | | | 17.40 | %(3) | |
Net assets, end of period, in thousands | | $ | 4,153,002 | | | $ | 4,297,475 | | | $ | 3,964,530 | | | $ | 2,498,207 | | | $ | 1,975,127 | | | $ | 2,040,709 | | |
Ratios/supplemental data: | |
Ratio of expenses to average net assets | | | 0.65 | % | | | 0.65 | % | | | 0.67 | % | | | 0.70 | % | | | 0.72 | % | | | 0.71 | % | |
Ratio of net investment income to average
net assets | | | 1.45 | | | | 1.36 | | | | 1.27 | | | | 1.69 | | | | 1.40 | | | | 1.26 | | |
Portfolio turnover rate | | | 6.74 | | | | 6.42 | | | | 3.79 | | | | 1.58 | | | | 2.78 | | | | 1.81 | | |
(1) For the six months ended June 30, 2015, all ratios have been annualized except total investment return and portfolio turnover.
(2) The Fund received two contributions from the Adviser related to prospect services and other expenses paid by the Fund from 1980-2009, which were in violation of the Investment Company Act of 1940. The contribution amounts, including imputed interest, were $1,192,736, or $0.04 per share based upon shares outstanding on May 21, 2010 and $8,271 or $0.0003 per share based on shares outstanding as of September 24, 2010.
(3) For the year ended December 31, 2010, 0.08% of the Fund's total return was a result of contributions as described in footnote 2 above. Excluding the contributions, total investment return would have been 17.32%.
See accompanying Notes to Financial Statements.
45
Mairs and Power Balanced Fund
FINANCIAL HIGHLIGHTS
SELECTED DATA AND RATIOS
(for a share outstanding throughout each period)
| | | Six Months
Ended | | Year Ended December 31, | |
| | | June 30, 2015 (1) | | 2014 | | 2013 | | 2012 | | 2011 | | 2010 | |
| | | (unaudited) | | | | | | | | | | | |
Per Share | |
Net asset value, beginning of period | | $ | 86.79 | | | $ | 82.31 | | | $ | 70.83 | | | $ | 62.15 | | | $ | 62.01 | | | $ | 55.76 | | |
Income from investment operations: | |
Net investment income | | | 1.07 | | | | 1.98 | | | | 1.79 | | | | 1.89 | | | | 1.85 | | | | 1.81 | | |
Net realized and unrealized gain (loss) | | | (1.75 | ) | | | 4.59 | | | | 11.58 | | | | 8.79 | | | | 0.13 | | | | 6.29 | | |
Total from investment operations | | | (0.68 | ) | | | 6.57 | | | | 13.37 | | | | 10.68 | | | | 1.98 | | | | 8.10 | | |
Distributions to shareholders from: | |
Net investment income | | | (1.04 | ) | | | (2.00 | ) | | | (1.78 | ) | | | (1.91 | ) | | | (1.83 | ) | | | (1.81 | ) | |
Net realized gains on investments sold | | | - | | | | (0.09 | ) | | | (0.11 | ) | | | (0.09 | ) | | | (0.01 | ) | | | (0.04 | ) | |
Contribution from Adviser | | | - | | | | - | | | | - | | | | - | | | | - | | | | (0.06 | )(2) | |
Return of capital | | | - | | | | - | | | | - | | | | - | | | | - | | | | (0.00 | )(3) | |
Total distributions | | | (1.04 | ) | | | (2.09 | ) | | | (1.89 | ) | | | (2.00 | ) | | | (1.84 | ) | | | (1.91 | ) | |
Contribution from Adviser | | | - | | | | - | | | | - | | | | - | | | | - | | | | 0.06 | (2) | |
Net asset value, end of period | | $ | 85.07 | | | $ | 86.79 | | | $ | 82.31 | | | $ | 70.83 | | | $ | 62.15 | | | $ | 62.01 | | |
Total investment return | | | (0.79 | )% | | | 8.04 | % | | | 19.02 | % | | | 17.34 | % | | | 3.23 | % | | | 14.87 | %(4) | |
Net assets, end of period, in thousands | | $ | 716,542 | | | $ | 722,863 | | | $ | 564,315 | | | $ | 286,910 | | | $ | 186,660 | | | $ | 169,400 | | |
Ratios/supplemental data: | |
Ratio of expenses to average net assets | | | 0.72 | % | | | 0.72 | % | | | 0.72 | % | | | 0.74 | % | | | 0.79 | % | | | 0.81 | % | |
Ratio of net investment income to average net assets | | | 2.49 | | | | 2.39 | | | | 2.43 | | | | 2.94 | | | | 2.99 | | | | 3.13 | | |
Portfolio turnover rate | | | 8.55 | | | | 4.53 | | | | 3.02 | | | | 5.46 | | | | 9.12 | | | | 5.93 | | |
(1) For the six months ended June 30, 2015, all ratios have been annualized except total investment return and portfolio turnover.
(2) The Fund received two contributions from the Adviser related to prospect services and other expenses paid by the Fund from 1980-2009, which were in violation of the Investment Company Act of 1940. The contribution amounts, including imputed interest, were $161,030 or $0.06 per share based upon shares outstanding on May 21, 2010 and $5,841 or $0.002 per share based on shares outstanding as of September 24, 2010.
(3) Amount per share is less than $0.005.
(4) For the year ended December 31, 2010, 0.11% of the Fund's total return was a result of contributions as described in footnote 2 above. Excluding the contributions, total investment return would have been 14.76%.
See accompanying Notes to Financial Statements.
46
Mairs and Power Small Cap Fund
FINANCIAL HIGHLIGHTS
SELECTED DATA AND RATIOS
(for a share outstanding throughout each period)
| | | Six Months
Ended | | Year Ended December 31, | | August 11, 2011 *
Through | |
| | | June 30, 2015 (1) | | 2014 | | 2013 | | 2012 | | December 31, 2011 (1) | |
| | | (unaudited) | | | | | | | | | |
Per Share | |
Net asset value, beginning of period | | $ | 20.67 | | | $ | 19.78 | | | $ | 14.49 | | | $ | 11.21 | | | $ | 10.00 | | |
Income from investment operations: | |
Net investment income | | | 0.05 | | | | 0.08 | | | | 0.06 | | | | 0.01 | | | | 0.01 | | |
Net realized and unrealized gain (loss) | | | 0.22 | | | | 1.25 | | | | 5.56 | | | | 3.42 | | | | 1.20 | | |
Total from investment operations | | | 0.27 | | | | 1.33 | | | | 5.62 | | | | 3.43 | | | | 1.21 | | |
Distributions to shareholders from: | |
Net investment income | | | - | | | | (0.07 | ) | | | (0.06 | ) | | | (0.02 | ) | | | - | | |
Net realized gains on investments sold | | | - | | | | (0.37 | ) | | | (0.27 | ) | | | (0.13 | ) | | | - | | |
Redemption fees | | | - | | | | (0.00 | )(2) | | | (0.00 | )(2) | | | - | | | | - | | |
Total distributions | | | - | | | | (0.44 | ) | | | (0.33 | ) | | | (0.15 | ) | | | - | | |
Net asset value, end of period | | $ | 20.94 | | | $ | 20.67 | | | $ | 19.78 | | | $ | 14.49 | | | $ | 11.21 | | |
Total investment return | | | 1.31 | % | | | 6.73 | % | | | 38.75 | % | | | 30.60 | % | | | 12.10 | % | |
Net assets, end of period, in thousands | | $ | 202,669 | | | $ | 162,230 | | | $ | 111,486 | | | $ | 41,644 | | | $ | 5,194 | | |
Ratios/supplemental data: | |
Ratio of expenses to average net assets | |
Before expense reimbursement | | | 1.06 | % | | | 1.07 | % | | | 1.17 | % | | | 1.73 | % | | | 7.98 | % | |
After expense reimbursement | | | 1.06 | | | | 1.07 | | | | 1.17 | | | | 1.25 | | | | 1.25 | | |
Ratio of net investment income to average net assets | |
Before expense reimbursement | | | 0.50 | % | | | 0.43 | % | | | 0.37 | % | | | (0.14 | )% | | | (6.41 | )% | |
After expense reimbursement | | | 0.50 | | | | 0.43 | | | | 0.37 | | | | 0.34 | | | | 0.32 | | |
Portfolio turnover rate | | | 9.73 | | | | 15.85 | | | | 34.91 | | | | 6.93 | | | | 4.52 | | |
* Commencement of operations.
(1) For the period ended June 30, 2015 and December 31, 2011, all ratios have been annualized except total investment return and portfolio turnover.
(2) Amount per share is less than $0.005.
See accompanying Notes to Financial Statements.
47
FUND EXPENSES (unaudited)
As a shareholder of the Funds, you incur two types of costs: (1) transaction costs including redemption fees and (2) ongoing expenses for the operation of the Funds (e.g., asset-based charges, such as investment management fees). The Funds are "no-load" mutual funds. As a result, shareholders pay no commissions, fees, or expenses associated with sales representatives or sales charges.
This example is intended to help you understand your ongoing costs (in dollars) of investing in the Funds and to compare these costs with the ongoing costs of investing in other mutual funds. The table below reports the Funds' expenses during the period January 1, 2015 through June 30, 2015 and includes the costs associated with a $1,000 investment.
Actual Expenses
The first line in the tables below may be used to estimate the actual expenses you paid over the reporting period. You can do this by dividing your account value by $1,000 and multiplying the result by the expense shown in the table below. For example, if your account value is $8,600, divided by $1,000 = $8.60. Multiply the result by the number in the first line under the heading entitled "Expenses Paid During Period." By doing this you can estimate the expenses you paid on your account during this period.
Hypothetical Example
The second line of the tables below provides information about hypothetical account values and hypothetical expenses based on the Funds' actual expenses and assumed returns of 5% per year before expenses, which are not the Funds' actual returns. The results may be used to provide you with a basis for comparing the ongoing costs of investing in the Funds with the ongoing costs of investing in other funds. To do so, compare these 5% hypothetical examples with the 5% hypothetical examples that appear in the shareholder reports of other funds. Please note that these hypothetical examples highlight ongoing costs only. They may not be used to estimate the actual ending account balances or expenses you paid during the period and will not help you determine the relative total costs of owning different funds.
Mairs & Power Growth Fund
| | | Beginning Account
Value 01/01/2015 | | Ending Account
Value 06/30/2015 | | Expenses Paid
During Period * | |
Actual return | | $ | 1,000.00 | | | $ | 994.60 | | | $ | 3.21 | | |
Hypothetical assumed 5% return | | $ | 1,000.00 | | | $ | 1,021.57 | | | $ | 3.26 | | |
* The Fund's expenses are equal to the Fund's annualized expense ratio for the most recent six-month period of 0.65%, multiplied by the average account value over the Fund's first fiscal half-year, multiplied by the number of days in the Fund's first fiscal half-year (181 days), divided by 365 days.
Mairs & Power Balanced Fund
| | | Beginning Account
Value 01/01/2015 | | Ending Account
Value 06/30/2015 | | Expenses Paid
During Period * | |
Actual return | | $ | 1,000.00 | | | $ | 992.10 | | | $ | 3.56 | | |
Hypothetical assumed 5% return | | $ | 1,000.00 | | | $ | 1,021.22 | | | $ | 3.61 | | |
* The Fund's expenses are equal to the Fund's annualized expense ratio for the most recent six-month period of 0.72%, multiplied by the average account value over the Fund's first fiscal half-year, multiplied by the number of days in the Fund's first fiscal half-year (181 days), divided by 365 days.
48
FUND EXPENSES (unaudited) (continued)
Mairs & Power Small Cap Fund
| | | Beginning Account
Value 01/01/2015 | | Ending Account
Value 06/30/2015 | | Expenses Paid
During Period * | |
Actual return | | $ | 1,000.00 | | | $ | 1,013.10 | | | $ | 5.29 | | |
Hypothetical assumed 5% return | | $ | 1,000.00 | | | $ | 1,019.54 | | | $ | 5.31 | | |
* The Fund's expenses are equal to the Fund's annualized expense ratio for the most recent six-month period of 1.06%, multiplied by the average account value over the Fund's first fiscal half-year, multiplied by the number of days in the Fund's first fiscal half-year (181 days), divided by 365 days.
49
Proxy Voting Policies and Procedures that the Trust uses to determine how to vote proxies relating to portfolio securities are available (i) without charge, upon request, by calling Shareholder Services at (800) 304-7404 and requesting a copy of the Statement of Additional Information (SAI) and (ii) on the Securities and Exchange Commission's (SEC's) website at www.sec.gov (access Form N-1A).
Information on how the Trust voted proxies relating to portfolio securities during the most recent 12-month period ended June 30 is available at www.mairsandpower.com and on the SEC's website at www.sec.gov.
DISCLOSURE OF PORTFOLIO HOLDINGS (unaudited)
The Trust files a complete schedule of portfolio holdings on Form N-Q for the first and third quarter-ends and on Form N-CSR for the second and fourth quarter-ends with the SEC. The Trust's Forms N-Q and N-CSR are available on the SEC's website at www.sec.gov. Forms N-Q and N-CSR may also be reviewed and copied at the SEC's Public Reference Room in Washington, D.C. Information on the operation of the Public Reference Room may be obtained by calling (800) SEC-0330.
The schedule of portfolio holdings is also printed in the Trust's semi-annual and annual reports to shareholders, which are available without charge by calling Shareholder Services at (800) 304-7404 or by visiting www.mairsandpower.com.
A complete copy of the Trust's portfolio holdings will also be available on or about 15 days following each quarter-end on the Fund's website at www.mairsandpower.com.
BOARD OF TRUSTEES' APPROVAL OF INVESTMENT ADVISORY CONTRACT (unaudited)
The Board of Trustees (the Trustees) unanimously approved the renewal of the Agreement for Investment Counsel Service (the Advisory Contract) between the Mairs & Power Funds Trust (the Trust) on behalf of the Mairs & Power Growth Fund (the Growth Fund), the Mairs & Power Balanced Fund (the Balanced Fund) and the Mairs & Power Small Cap Fund (the Small Cap Fund) (each, a Fund and together, the Funds) and Mairs and Power, Inc. (the Adviser) at a meeting of the Board of Trustees held on May 12, 2015. In evaluating the Advisory Contract, the Trustees took into account their cumulative experience with the Adviser and their ongoing review and discussion with the Funds' portfolio managers at meetings throughout the year.
In preparation for the May 12, 2015 meeting, the Adviser provided the Trustees with extensive materials that are relevant to the Trustees' consideration of the Advisory Contract. As part of their discussion at the May 12 meeting, the independent Trustees discussed the materials and the proposed renewal of the Advisory Contract in executive session with legal counsel present, but with no representatives of the Adviser being present. In reaching their decision to renew the Funds' Advisory Contract with the Adviser, the Trustees considered all factors they believed to be relevant. Each of these factors and the conclusions reached by the Trustees with respect to these factors helped form the basis for the decision to renew the Advisory Contract with the Adviser and are discussed below. In their deliberations, the Trustees did not identify any single factor as determinative.
Nature, Extent and Quality of Services
With respect to the quality and extent of the Adviser's services provided to the Funds, the Trustees noted the Funds' strong performance record over most time periods, as discussed in more detail below under "Investment Performance." The Trustees considered the Adviser's experience as an investment adviser, the investments it has made in the advisory business, including the hiring of new personnel, and the services it would continue to provide the Funds and their shareholders under the Advisory Contract. They noted the appointment of co-managers for each of the Funds as part of the succession planning following the retirement of William B. Frels as portfolio
50
BOARD OF TRUSTEES' APPROVAL OF INVESTMENT ADVISORY CONTRACT (unaudited) (continued)
manager and President of the Trust. The Trustees considered the Adviser's disciplined investment decision-making process, including its emphasis on Midwest stocks and generally low portfolio turnover. The Trustees also took into account other components of the services provided by the Adviser to the Funds, such as the Adviser's distribution strategy, the Adviser's risk management system and results of the most recent compliance review. The Trustees concluded that they were satisfied with the nature, extent and quality of services provided by the Adviser under the Advisory Contract.
Investment Performance
In reviewing the Funds' performance, the Trustees considered the information provided in connection with the May 12, 2015 Board meeting, noting that they also receive detailed performance information at each regular Board meeting during the year. At the May 12, 2015 meeting, the Trustees considered the investment results for the Funds compared to those mutual funds with similar investment objectives as determined by Morningstar, a representative peer group of funds with similar investment objectives and strategies as determined by the Adviser and to each Fund's respective performance benchmarks. With respect to the Growth Fund and the Balanced Fund, the Trustees reviewed comparative performance information for the one-, five-, ten-year and since-inception periods ending December 31, 2014. The Trustees noted that the performance of the Growth Fund had trailed the benchmark and peer group averages over the one-year period but had exceeded the average return of the benchmark and peer groups for the five- and ten-year periods. The Balanced Fund's performance exceeded the average return of the peer group and Morningstar category and trailed the composite index for the one-year period. The Balanced Fund's performance exceeded the returns of the peer groups and composite index over the five- and ten-year periods. With respect to the Small Cap Fund, the Trustees reviewed comparative performance information for the one-year, three-year and since-inception periods ended December 31, 2014. The Trustees noted that the Small Cap Fund's performance has exceeded its peer group average, Morningstar category average and benchmark index during those periods. Based upon their review, the Trustees concluded that each Fund's investment performance has been satisfactory.
Management Fees
In evaluating the level of the management fees paid to the Adviser, the Trustees considered both the amount of the fees and the overall expenses of the Funds, compared to those of other similar mutual funds, as well as the quality and quantity of advisory and other services provided by the Adviser. The Trustees noted that the management fees paid to the Adviser by the Growth Fund are below the average fees for the Morningstar peer group and for the peer group of competitive funds identified by the Adviser. The management fee for the Balanced Fund is slightly above the Morningstar category average and below the peer group average. Additionally, the Trustees noted that the Growth Fund's and Balanced Fund's total expense ratios are below the average total expense ratios of funds in their Morningstar peer groups and the competitive funds identified by the Adviser. With respect to the Small Cap Fund, the Trustees noted that while the management fee was slightly above the Morningstar and peer group averages, the Fund's total expense ratio was below the Morningstar and peer group averages.
The Trustees then reviewed the fees the Adviser charges its non-mutual fund advisory clients, including retirement accounts, other institutional clients and individuals (Advisory Clients) with investment objectives similar to those of the Growth Fund and Balanced Fund, noting that none of the Advisory Clients currently is invested in a small cap investment mandate. The Adviser provided the Trustees with information about the fee schedule for Advisory Clients and the differences in the scope of services provided to its Advisory Clients compared with the scope of those it provides to the Funds. Management noted that the level of investment decision-making is considerably higher with respect to the Funds, because cash flows result in purchase and sale decisions being made by the Adviser virtually every trading day. Other services provided by the Adviser to the Funds include providing office facilities and Fund officers. Having considered all of these factors, the Trustees concluded that the Funds' management fees are fair and reasonable for the services provided.
51
BOARD OF TRUSTEES' APPROVAL OF INVESTMENT ADVISORY CONTRACT (unaudited) (continued)
Costs of Services Provided and Profitability to the Adviser
The Trustees reviewed information regarding the Adviser's overall profitability as well as the allocation of profitability between Advisory Clients and the Funds. The profitability of the mutual fund business was further broken down among the Growth, Balanced and Small Cap Funds, as applicable. The Trustees reviewed the Adviser's financial assumptions and methods of expense allocation used. The Trustees noted that the profitability calculation includes fees received by the Adviser under both the Fund Administration Servicing Agreement and the Advisory Contract. The Trustees believe that the Adviser should be entitled to earn a reasonable level of profit for the services it provides to the Funds. The Trustees also reviewed the Adviser's financial condition and determined it to be sound. Based on their review, the Trustees concluded that the Adviser's level of profitability from its relationship with the Funds is reasonable.
Other Benefits
The Trustees considered the benefits to the Adviser from soft dollar arrangements whereby the Adviser receives proprietary investment research services from broker-dealers that execute the Funds' purchases and sales of securities. As a general matter, the research services received from broker-dealers are used to service all accounts that invest in equity securities. The Trustees received and reviewed information concerning the Funds' brokerage commissions and allocation of Fund brokerage. The Trustees recognized that the Adviser's profitability would be lower if it did not receive proprietary research for soft dollars in connection with the Funds' brokerage activity. In addition, the Trustees considered that the Adviser's Advisory Clients benefit from access to and research obtained from brokers executing trades on behalf of the Funds. While difficult to measure, the Trustees concluded that the benefits the Adviser receives in this way is fairly modest, given the Funds' relatively low portfolio turnover rates and the research capability that the Adviser itself maintains. The Trustees noted that the Adviser derives reputational benefits from its association with the Funds as well. The Trustees considered the nature and amount of fees paid by the Funds for administrative services provided by the Adviser under the Fund Administration Servicing Agreement. The Trustees concluded that the other benefits realized by the Adviser from its relationship with the Funds were reasonable.
Economies of Scale
The Trustees reviewed the extent to which economies of scale may be realized as the Funds increase in size. The Trustees considered the asset levels in each of the Funds. The Trustees noted that the Adviser's approach has been to keep costs to the Funds as low as reasonably possible, including management fee levels. At the same time, the Adviser believes, and the Trustees concur, that it is entitled to earn reasonable returns on its mutual fund business. The Adviser acknowledged that while it is difficult to pinpoint the economies of scale to be realized by the Funds at any particular asset level, there is no question that such economies exist. Accordingly, the Adviser, under the terms of the Advisory Contract for the Growth Fund, established a breakpoint at the $2.5 billion asset level. The breakpoint reduces the management fee applicable to assets managed in excess of $2.5 billion from 60 basis points (0.6 of 1%) to 50 basis points (0.5 of 1%). The Trustees reaffirmed their conclusion that establishing this breakpoint at $2.5 billion forms a reasonable basis for having management fee levels reflect economies of scale for the benefit of Growth Fund shareholders. The Adviser believes, and the Trustees concur, that the consideration of establishing a breakpoint at certain asset levels would be an appropriate way for the Adviser to share its economies of scale in the event that the Balanced and Small Cap Funds were to grow their assets substantially. With respect to the Balanced Fund and Small Cap Funds, considering each Fund's current level of assets and low management fee, the Trustees concluded that the absence of breakpoints in each Fund's management fee is reasonable at this time.
52
In an effort to decrease costs, the Trust intends to reduce the number of duplicate Summary Prospectuses and Annual and Semi-Annual Reports you receive by sending only one copy of each to those addresses shared by two or more accounts and to shareholders reasonably believed to be from the same family or household. Once implemented, if you would like to discontinue householding for your accounts, please call Shareholder Services at (800) 304-7404 to request individual copies of these documents. Once notification to stop householding is received, the Trust will begin sending individual copies thirty days after receiving your request. This policy does not apply to account statements.
PRIVACY POLICY NOTICE
Our Promise to You
As a shareholder of the Mairs & Power Mutual Funds (Funds), you share both personal and financial information with us. Your privacy is important to us, and we are dedicated to safeguarding your personal and financial information.
Information Provided by Shareholders
In the normal course of doing business, we typically obtain the following non-public personal information about our shareholders:
• Personal information regarding our shareholders' identity such as name, address and social security number;
• Information regarding fund transactions effected by us; and
• Shareholder financial information such as net-worth, assets, income, bank account information and account balances.
How We Manage and Protect Your Personal Information
We do not sell information about current or former shareholders to third parties, nor is it our practice to disclose such information to third parties unless requested or permitted to do so by a shareholder or shareholder representative or, if necessary, in order to process a transaction, service an account or as permitted by law. Additionally, we may share information with outside companies that perform administrative services for us. However, our arrangements with these service providers require them to treat your information as confidential.
In order to protect your personal information, we maintain physical, electronic and procedural safeguards to protect your personal information. Our Privacy Policy restricts the use of shareholder information and requires that it be held in strict confidence.
Shareholder Notifications
We are required by law to annually provide a notice describing our privacy policy. In addition, we will inform you promptly if there are changes to our policy. Please contact us at (800) 304-7404 with questions about this notice.
53
This report is submitted for the general information of the shareholders of the Funds. It is not authorized for distribution to prospective investors unless accompanied or preceded by an effective prospectus. An investor should consider the Funds' investment objectives, risks and expenses carefully before investing or sending money. This and other important information can be found in the Funds' summary prospectuses and full prospectus. To obtain a prospectus, please call Shareholder Services at (800) 304-7404 or visit the Funds' website at www.mairsandpower.com. Please read the prospectus carefully before investing.
This report includes forward-looking statements such as economic predictions and portfolio manager opinions. The statements are subject to change at any time based on market and other conditions. No predictions, forecasts, outlooks, expectations or beliefs are guaranteed.
54
MAIRS & POWER FUNDS TRUST
Mairs & Power Growth Fund, established 1958
Mairs & Power Balanced Fund, established 1961
Mairs & Power Small Cap Fund, established 2011
A No-Load Funds Trust
For Shareholder Services
Call (800) 304-7404
Or write to:
(via Regular Mail)
c/o U.S. Bancorp Fund Services, LLC
615 East Michigan Street
P. O. Box 701
Milwaukee, WI 53201-0701 | | (via Overnight or Express Mail)
c/o U.S. Bancorp Fund Services, LLC
3rd Floor
615 East Michigan Street
Milwaukee, WI 53202-0701 | |
For Fund literature and information, visit the Trust's website at:
www.mairsandpower.com
Investment Manager
Mairs and Power, Inc.
W1520 First National Bank Building
332 Minnesota Street
Saint Paul, MN 55101
Custodian
U.S. Bank, N.A.
Custody Operations
1555 North River Center Drive, Suite 302
Milwaukee, WI 53212
Distributor
ALPS Distributors, Inc.
1290 Broadway, Suite 1100
Denver, CO 80203
Mairs and Power, Inc.
c/o U.S. Bancorp Fund Services, LLC
3rd Floor
615 East Michigan Street
Milwaukee, WI 53202-0701
Item 2. Code of Ethics.
Not applicable for semi-annual reports.
Item 3. Audit Committee Financial Expert.
Not applicable for semi-annual reports.
Item 4. Principal Accountant Fees and Services.
Not applicable for semi-annual reports.
Item 5. Audit Committee of Listed Registrants.
Not applicable to registrant.
Item 6. Investments.
(a) Schedule of Investments is included as part of the report to shareholders filed under Item 1 of this Form
(b) Not Applicable.
Item 7. Disclosure of Proxy Voting Policies and Procedures for Closed-End Management Investment Companies.
Not applicable to open-end investment companies.
Item 8. Portfolio Managers of Closed-End Management Investment Companies.
Not applicable to open-end investment companies.
Item 9. Purchases of Equity Securities by Closed-End Management Investment Company and Affiliated Purchasers.
Not applicable to open-end investment companies.
Item 10. Submission of Matters to a Vote of Security Holders.
There has been no material change to the procedures by which shareholders may recommend nominees to the registrant’s board of directors.
1
Item 11. Controls and Procedures.
(a) The registrant’s principal executive officer and principal financial officer have evaluated the registrant’s disclosure controls and procedures as of a date within 90 days of the filing of this report and have concluded that the registrant’s disclosure controls and procedures were effective, as of that date, in ensuring that information required to be disclosed by the registrant in this Form N-CSR was recorded, processed, summarized and reported within the time period specified by the SEC’s rules and forms.
(b) There were no changes in the Registrant’s internal control over financial reporting (as defined in Rule 30a-3(d) under the Act) that occurred during the second fiscal quarter of the period covered by this report that has materially affected, or is reasonably likely to materially affect, the Registrant’s internal control over financial reporting.
Item 12. Exhibits.
(a) (1) Code of Ethics
Mairs & Power Funds Trust Code of Ethics for Principal Executive Officer and Principal Financial Officer.
Attached as exhibit 12(a)(1) to this form.
(2) Certifications required by Rule 30a-2(a) under the Investment Company Act of 1940.
Attached as exhibits 12(a)(2).1 and 12(a)(2).2 to this form.
(3) Any written solicitation to purchase securities under Rule 23c-1 under the Act sent or given during the period covered by the report by or on behalf of the registrant to 10 or more persons. Not applicable to open-end investment companies.
(b) Certifications pursuant to Section 906 of the Sarbanes-Oxley Act of 2002.
Attached as exhibit 12(b) to this form.
2
SIGNATURES
Pursuant to the requirements of the Securities Exchange Act of 1934 and the Investment Company Act of 1940, the registrant has duly caused this report to be signed on its behalf by the undersigned, thereunto duly authorized.
| (Registrant) | Mairs & Power Funds Trust | |
| | | |
| By (Signature and Title)* | | /s/ Mark L. Henneman | |
| | Mark L. Henneman, President | |
| | Principal Executive Officer | |
| | |
| Date | 9/3/15 | | |
| | | | | | | |
Pursuant to the requirements of the Securities Exchange Act of 1934 and the Investment Company Act of 1940, this report has been signed below by the following persons on behalf of the registrant and in the capacities and on the dates indicated.
| By (Signature and Title)* | | /s/ Mark L. Henneman | |
| | Mark L. Henneman, President | |
| | Principal Executive Officer | |
| | |
| Date | 9/3/15 | | |
| | |
| | |
| By (Signature and Title)* | | /s/ Andrea C. Stimmel | |
| | Andrea C. Stimmel, Treasurer | |
| | Principal Financial Officer | |
| | |
| Date | 9/3/15 | | |
| | | | | | |
* Print the name and title of each signing officer under his or her signature.
3