UNITED STATES
SECURITIES AND EXCHANGE COMMISSION
Washington, D.C. 20549
FORM N-CSR
CERTIFIED SHAREHOLDER REPORT OF REGISTERED
MANAGEMENT INVESTMENT COMPANIES
Investment Company Act file number: 811-22562
Babson Capital Global Short Duration High Yield Fund
(Exact name of registrant as specified in charter)
550 South Tryon Street
Charlotte, NC 28202
(Address of principal executive offices) (Zip code)
Janice M. Bishop
Secretary and Chief Legal Officer
c/o Babson Capital Management LLC
Independence Wharf
470 Atlantic Avenue
Boston, MA 02210
(Name and address of agent for service)
(704) 805-7200
Registrant’s telephone number, including area code
Date of fiscal year end: December 31, 2016
Date of reporting period: June 30, 2016
Item 1. Reports to Stockholders.

BABSON CAPITAL GLOBAL SHORT DURATION HIGH YIELD FUND
Semi-Annual Report
June 30, 2016
Babson Capital Global Short Duration High Yield Fund
c / o Babson Capital Management LLC
550 South Tryon St.
Charlotte, NC 28202
704.805.7200
http://www.BabsonCapital.com/bgh
ADVISER
Babson Capital Management LLC
550 South Tryon St.
Suite 3300
Charlotte, NC 28202
SUB-ADVISOR
Babson Capital Global Advisors Limited
61 Aldwych
London, UK
WC2B 4AE
COUNSEL TO THE FUND
Ropes & Gray LLP
Prudential Tower
800 Boylston Street
Boston, Massachusetts 02110
INDEPENDENT REGISTERED PUBLIC ACCOUNTING FIRM
KPMG LLP
Two Financial Center
60 South Street
Boston, Massachusetts 02111
CUSTODIAN
US Bank
MK-WI-S302
1555 N. River Center Drive
Milwaukee, WI 53212
TRANSFER AGENT & REGISTRAR
U.S. Bancorp Fund Services, LLC
615 E. Michigan St.
Milwaukee, WI 53202
FUND ADMINISTRATION/ACCOUNTING
U.S. Bancorp Fund Services, LLC
615 E. Michigan St.
Milwaukee, WI 53202

PROXY VOTING POLICIES & PROCEDURES
The Trustees of Babson Capital Global Short Duration High Yield Fund (the “Fund”) have delegated proxy voting responsibilities relating to the voting of securities held by the Fund to Babson Capital Management LLC (“Babson Capital”). A description of Babson Capital’s proxy voting policies and procedures is available (1) without charge, upon request, by calling, toll-free 1-866-399-1516; (2) on the Fund’s website at http://www.BabsonCapital.com/bgh; and (3) on the U.S. Securities and Exchange Commission’s (“SEC”) website at http://www.sec.gov.
FORM N-Q
The Fund will file its complete schedule of portfolio holdings with the SEC for the first and third quarters of each fiscal year on Form N-Q. This information is available (1) on the SEC’s website at http://www.sec.gov; and (2) at the SEC’s Public Reference Room in Washington, DC (which information on their operation may be obtained by calling 1-800-SEC-0330). A complete schedule of portfolio holdings as of each quarter-end is available on the Fund’s website at http://www.BabsonCapital.com/bgh or upon request by calling, toll-free, 1-866-399-1516.
Babson Capital Global Short Duration High Yield Fund 2016 Semi-Annual Report
OFFICERS OF THE FUND
Russell Morrison
President
Carlene Pollock
Chief Financial Officer
Andrew Lennon
Treasurer
Michael Freno
Vice President
Sean Feeley
Vice President
Scott Roth
Vice President
Melissa LaGrant
Chief Compliance Officer
Janice Bishop
Secretary/Chief Legal Officer
Michele Manha
Assistant Secretary
Babson Capital Global Short Duration High Yield Fund is a closed-end investment company, first offered to the public in 2012, whose shares are traded on the New York Stock Exchange.
INVESTMENT OBJECTIVE & POLICY
Babson Capital Global Short Duration High Yield Fund (the “Fund”) was organized as a business trust under the laws of the Commonwealth of Massachusetts. The Fund is registered under the Investment Company Act of 1940, as amended, as a non-diversified, closed-end management investment company with its own investment objective. The Fund’s common shares are listed on the New York Stock Exchange under the symbol “BGH”.
The Fund’s primary investment objective is to seek as high a level of current income as the Adviser (as defined herein) determines is consistent with capital preservation. The Fund seeks capital appreciation as a secondary investment objective when consistent with its primary investment objective. There can be no assurance that the Fund will achieve its investment objectives.
The Fund will seek to take advantage of inefficiencies between geographies, primarily the North American and Western European high yield bond and loan markets and within capital structures between bonds and loans. For example, the Fund will seek to take advantage of differences in pricing between bonds and loans of an issuer denominated in U.S. dollars and substantially similar bonds and loans of the same issuer denominated in Euros, potentially allowing the Fund to achieve a higher relative return for the same credit risk exposure.
1
Babson Capital Global Short Duration High Yield Fund 2016 Semi-Annual Report
Dear Fellow Shareholders,
It is our pleasure to provide you with the 2016 Semi-Annual Report for the Babson Capital Global Short Duration High Yield Fund (the “Fund”) to recap portfolio performance and positioning during an interesting market environment over the past six months. We would like to remind shareholders that we continue to believe our Global High Yield Investments Group is one of the largest teams primarily focused on North American and Western European credits and that the Fund offers investors a compelling portfolio of global high yield assets. Utilizing the Group’s expertise, deep resources, and time-tested process, we continue to believe we can provide investors an attractive level of current income even during periods of uncertainty and market volatility.
The global nature of the portfolio, primarily focusing on North American and Western European credits, may provide investors with additional benefits compared to a U.S.-only portfolio, such as additional diversification, higher credit quality, increased yield, and lower duration. More importantly, the global strategy provides flexibility to dynamically shift the geographical weighting in order to capture our best risk-adjusted investment opportunities. This strategy also pays close attention to limiting the duration of the Fund while maintaining what we consider a reasonable amount of leverage.
Market Review
The first quarter of 2016 was marked with high levels of volatility that troughed in the middle of February and ended with a sharp recovery in lower rated credits and commodity prices, fueling price appreciation across all ratings categories and industry sectors. For the quarter, the Bank of America Merrill Lynch Non-Financial Developed Markets High Yield Constrained Index returned 3.32%. Of the first quarter’s tailwinds, the rally in commodity prices was by far the most significant. After an elongated decline throughout 2015, stability in the space brought a much needed catalyst for commodity exposed issuers to retrace some of the heavy losses suffered during the downturn with energy, chemicals, and metals & mining outperforming the broader Index towards the end of the quarter.
Following the strength of the first quarter, the global high yield market finished in positive territory during the second quarter, concluding the strongest quarterly performance for the global high yield market since 2012. The Index returned 5.93% for the second quarter, bringing year-to-date performance to 8.89%. On the economic front, the most significant headline of the second quarter was the United Kingdom’s historic decision to leave the European Union, bringing renewed uncertainty and heightened volatility to global markets at the conclusion of an otherwise strong quarter. While the surprise vote on June 23rd caused volatility in risk assets in the trading days immediately following the decision to leave, markets remained orderly and recovered well after dipping slightly through the first half of the week following the vote.
Although fears of an immediate market panic quickly subsided, almost all details remain unknown regarding the terms and process of the United Kingdom’s departure from the European Union, which is expected to take years to complete. Assumptions are that global central banks will remain accommodative in the near term with the likelihood of a rate hike in the United States being pushed even further into the future. In the U.S., economic backlash from the Brexit vote is less likely than in the rest of Europe and attention has now turned to the upcoming jobs report, which follows a disappointing report in May. Barring the events in Britain, U.S. economic data released over the quarter points to a fairly healthy, albeit tepid, domestic economy with home sales and consumer spending robust.
Year-to-date, U.S. dollar denominated high yield new issue supply totaled $155.3 billion, down 19% from the same period last year on the back of lower acquisition activity. Year-to-date volume in non-U.S. dollar denominated bonds totals the dollar equivalent of $31.6 billion, compared with $50.3 billion over the same period last year. Default activity decreased towards the end of the first half of the year, but remains elevated relative to historical averages primarily due to continued strain in the Energy and Metals & Mining sectors. The par-weighted U.S. high yield default rate is 3.56% at the end of June, which is up from 1.88% one year ago. Notably, excluding the Energy and Metals & Mining sectors, the default rate is a mere 0.53%.
Babson Capital Global Short Duration High Yield Fund Overview and Performance
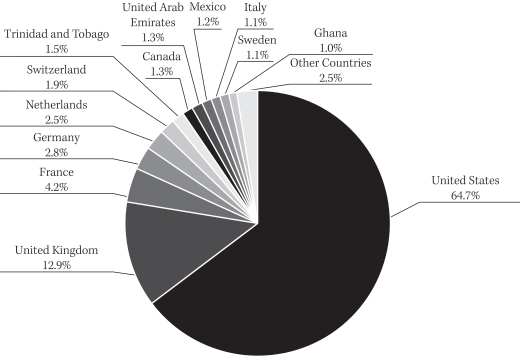
The Fund ended June with a portfolio of 137 issuers, which is a minor increase from the beginning of the year of 126 issuers. A majority of the issuers continue to be domiciled in the U.S. (64.7%) with the U.K. (12.9%) and France (4.2%) representing the next largest country exposures – see Country Composition chart on page 5. From a geographic standpoint, exposure to U.S. domiciled companies increased since the beginning of the year. High yield bond spreads in
2
Babson Capital Global Short Duration High Yield Fund 2016 Semi-Annual Report
the Western European market remain compressed compared to the U.S. market as the commodity related sectors in the U.S. experienced headwinds causing significant spread widening to occur. The Western European market, with less exposure to commodity sensitive assets, however, did not experience spread widening to the same degree. Therefore, we selectively allocated across the U.S. market to take advantage of attractive opportunities that offered an appropriate amount of yield to the portfolio without significantly altering the risk profile. The Western European market continues to offer global diversification, reduced duration, and potentially attractive yield opportunities while also providing a buffer against market volatility with limited exposure to commodity related sectors.
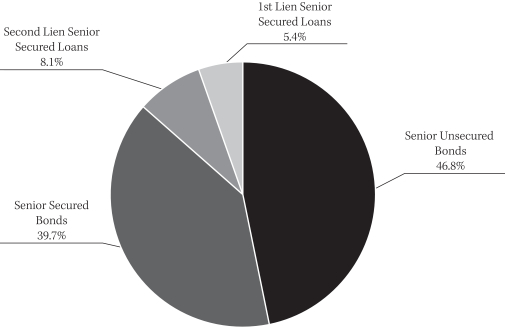
As of June 30, 2016, the Fund remained well positioned across the credit quality spectrum: 8.4% BB-rated and above, 72.6% B-rated, and 13.6% CCC-rated and below, with over 50% of the portfolio consisting of senior secured obligations. A small portion of the assets are not rated at 1.3% and cash and accrued income standing at 4.1% of the portfolio.1 Within the CCC-rated and below category, the majority of these assets are senior secured loans or short duration, yield-to-call high yield bond paper. Based on our experience in the current market environment, we believe these senior secured loan assets offer the potential for compelling risk-adjusted returns and may provide the portfolio with added protection against principal loss in the event of an issuer’s bankruptcy.
The Fund paid monthly dividend payments totaling $0.9285 per share over the first of half of 2016 comprised of net investment income. The Fund’s share price and net asset value (“NAV”) ended the reporting period at $17.86 and $19.39, respectively, or at a 7.89% discount to NAV. Based on the Fund’s share price and NAV on June 30, 2016, the Fund’s market price and NAV distribution rates, on an annualized basis were 10.31% and 9.49%, respectively. Assets acquired through leverage, which represented 24.82% of the Fund’s total assets as of June 30, 2016, were accretive to net investment income and benefited shareholders.
On a year-to-date basis, the NAV total return was +10.95%, outperforming the global high yield bond market as measured by the Bank of America / Merrill Lynch Non-Financial Developed Markets High Yield Constrained Index (HNDC), which returned +8.89%. From a market value perspective, the total return through the year-to-date period was +14.47%.2 As a reminder, following the January 28th, 2016 Board of Trustee’s meeting, the Fund changed the Index from the Bank of America / Merrill Lynch Global Non-Financial High Yield Constrained Index to the Bank of America / Merrill Lynch Non-Financial Developed Markets High Yield Constrained Index. The previous index returned +9.35% over the same year-to-date time period.
In Conclusion
The global high yield markets held up relatively well following the Brexit referendum. While we expect to see some headline-driven weakness in high yield markets in the near term – particularly in sterling denominated credits – it will take time for the economic implications of the vote to become clear. That said, outside of commodity related sectors, credit fundamentals for high yield borrowers across geographies remain largely intact. Further, we believe the European high yield markets will benefit from the expansion of the European Central Bank’s purchasing program to include corporate credit. Negative pressure in the near-term will most likely stem from broader market sentiment rather than the fundamentals of individual credits. Additionally, the macro-driven volatility tied to Brexit may result in some spread widening, which could present opportunities in quality credits that have been trading at tighter levels following the recent strong performance.
At Babson, we take a long-term view of investing through market and economic cycles and adhere to a disciplined, repeatable investment process that is deeply rooted in fundamental bottom-up analysis. In times of market volatility, we
| 1 | Ratings are based on Moody’s and S&P. If securities are rated differently by the rating agencies, the higher rating is applied and all ratings are converted to the equivalent Moody’s major rating category for purposes of the category shown. Credit ratings are based largely on the rating agency’s investment analysis at the time of rating and the rating assigned to any particular security is not necessarily a reflection of the issuer’s current financial condition. The rating assigned to a security by a rating agency does not necessarily reflect its assessment of the volatility of a security’s market value or of the liquidity of an investment in the security. Ratings of Baa3 or higher by Moody’s and BBB- or higher by S&P are considered to be investment grade quality. |
| 2 | Past performance is not necessarily indicative of future results. Current performance may be lower or higher. All performance is net of fees, which is inclusive of advisory fees, administrator fees and interest expenses. |
3
Babson Capital Global Short Duration High Yield Fund 2016 Semi-Annual Report
focus on our disciplined approached and emphasize our fundamental bottom-up research with the goal of preserving investor capital while seeking to capture such attractive capital appreciation opportunities as may exist. We continue to believe in and manage to this philosophy and believe the Fund will continue to offer an attractive dividend yield through the remainder of 2016.
We value your continued partnership and support, and look forward to helping you achieve your investment objectives.
Sincerely,

Russ Morrison
President
Babson Capital Global Short Duration High Yield Fund
4
Babson Capital Global Short Duration High Yield Fund 2016 Semi-Annual Report
PORTFOLIO COMPOSITION (% OF ASSETS*)
COUNTRY COMPOSITION (% OF ASSETS*)
| * | Percentage of assets are expressed by market value excluding cash and accrued income, and may vary over time. The percentages shown above represent a percentage of the assets as of June 30, 2016. |
5
Babson Capital Global Short Duration High Yield Fund 2016 Semi-Annual Report
FINANCIAL REPORT
6
Babson Capital Global Short Duration High Yield Fund 2016 Semi-Annual Report
STATEMENT OF ASSETS AND LIABILITIES
(Unaudited)
| | | | |
| | | JUNE 30, 2016 | |
| |
| Assets | | | | |
| Investments, at fair value (cost $560,642,688) | | $ | 501,912,997 | |
| Cash | | | 8,051,704 | |
| Foreign currency, at fair value (cost $603,093) | | | 601,500 | |
| Interest receivable | | | 10,142,202 | |
| Unrealized appreciation on forward foreign exchange contracts | | | 8,197,555 | |
| Prepaid expenses and other assets | | | 11,244 | |
| | | | |
Total assets | | | 528,917,202 | |
| | | | |
| |
| Liabilities | | | | |
| Note payable | | | 130,800,000 | |
| Dividend payable | | | 3,076,874 | |
| Payable for investments purchased | | | 5,206,436 | |
| Payable to adviser | | | 340,324 | |
| Unrealized depreciation on forward foreign exchange contracts | | | 180,500 | |
| Accrued expenses and other liabilities | | | 429,948 | |
| | | | |
Total liabilities | | | 140,034,082 | |
| | | | |
Total net assets | | $ | 388,883,120 | |
| | | | |
| |
| Net Assets: | | | | |
| Common stock, $0.00001 par value | | $ | 201 | |
| Additional paid-in capital | | | 477,884,220 | |
| Dividends in excess of net investment income | | | (1,878,903 | ) |
| Accumulated net realized loss | | | (36,295,348 | ) |
| Net unrealized depreciation | | | (50,827,050 | ) |
| | | | |
Total net assets | | $ | 388,883,120 | |
| | | | |
| |
| Common shares issued and outstanding (unlimited shares authorized) | | | 20,057,849 | |
| | | | |
| |
Net asset value per share | | $ | 19.39 | |
| | | | |
See accompanying Notes to Financial Statements.
7
Babson Capital Global Short Duration High Yield Fund 2016 Semi-Annual Report
STATEMENT OF OPERATIONS
(Unaudited)
| | | | |
| | | PERIOD FROM
JANUARY 1, 2016
THROUGH
JUNE 30, 2016 | |
| |
| Investment Income | | | | |
Interest income | | $ | 23,301,929 | |
Other income | | | 77,560 | |
| | | | |
Total investment income | | | 23,379,489 | |
| | | | |
| |
| Operating Expenses | | | | |
Advisory fees | | | 2,466,531 | |
Interest expense | | | 897,887 | |
Administrator fees | | | 242,244 | |
Professional fees | | | 82,931 | |
Directors’ fees | | | 70,790 | |
Printing and mailing expense | | | 45,692 | |
Other operating expenses | | | 39,859 | |
| | | | |
Total operating expenses | | | 3,845,934 | |
| | | | |
Less fees waived by Adviser | | | (489,118 | ) |
| | | | |
Net Expenses | | | 3,356,816 | |
| | | | |
Net investment income | | | 20,022,673 | |
| | | | |
| |
| Realized and Unrealized Gains (Losses) on Investments | | | | |
Net realized loss on investments | | | (26,736,258 | ) |
Net realized gain on forward foreign exchange contracts | | | 633,846 | |
Net realized loss on foreign currency and translation | | | (144,242 | ) |
| | | | |
Net realized loss on investments | | | (26,246,654 | ) |
| | | | |
Net unrealized appreciation of investments | | | 36,895,694 | |
Net unrealized appreciation of forward foreign exchange contracts | | | 6,452,157 | |
Net unrealized depreciation of foreign currency and translation | | | (35,338 | ) |
| | | | |
Net unrealized appreciation on investments | | | 43,312,513 | |
| | | | |
Net realized and unrealized gains on investments | | | 17,065,859 | |
| | | | |
Net increase in net assets resulting from operations | | $ | 37,088,532 | |
| | | | |
See accompanying Notes to Financial Statements.
8
Babson Capital Global Short Duration High Yield Fund 2016 Semi-Annual Report
STATEMENT OF CASH FLOWS
(Unaudited)
| | | | |
| | | PERIOD FROM
JANUARY 1, 2016
THROUGH
JUNE 30, 2016 | |
| |
Reconciliation of net increase in net assets resulting from
operations to net cash provided by operating activities | | | | |
| Net increase in net assets applicable to common shareholders resulting from operations | | $ | 37,088,532 | |
Adjustments to reconcile net decrease in net assets applicable to common shareholders
resulting from operations to net cash provided by operating activities: | | | | |
Purchases of long-term investments | | | (113,448,411 | ) |
Proceeds from sales of long-term investments | | | 97,331,861 | |
Purchases of foreign currency, net | | | 1,287,738 | |
Forward currency exchange contracts, net | | | (6,452,157 | ) |
Net unrealized appreciation | | | (36,909,298 | ) |
Net realized loss | | | 26,736,258 | |
Amortization and accretion | | | (499,772 | ) |
Changes in operating assets and liabilities: | | | | |
Increase in interest receivable | | | (17,779 | ) |
Increase in prepaid expenses and other assets | | | (2,260 | ) |
Decrease in payable for investments purchased | | | (2,002,136 | ) |
Decrease in payable to Adviser | | | (58,096 | ) |
Increase in accrued expenses and other liabilities | | | 90,813 | |
| | | | |
Net cash provided by operating activities | | | 3,145,293 | |
| | | | |
| Cash Flows From Financing Activities | | | | |
Advances from credit facility | | | 12,300,000 | |
Repayments on credit facility | | | (15,000,000 | ) |
Distributions paid to common shareholders | | | (23,190,885 | ) |
| | | | |
Net cash used in financing activities | | | (25,890,885 | ) |
| | | | |
Net change in cash | | | (22,745,592 | ) |
Cash beginning of period | | | 30,797,296 | |
| | | | |
Cash end of period | | $ | 8,051,704 | |
| | | | |
Supplemental disclosure of cashflow information | | | | |
Income taxes paid | | $ | – | |
Interest paid | | | 815,825 | |
See accompanying Notes to Financial Statements.
9
Babson Capital Global Short Duration High Yield Fund 2016 Semi-Annual Report
STATEMENT OF CHANGES IN NET ASSETS
(Unaudited)
| | | | | | | | |
| | | PERIOD FROM
JANUARY 1, 2016
THROUGH
JUNE 30, 2016 | | | YEAR ENDED
DECEMBER 31, 2015 | |
| | |
| Operations | | | | | | | | |
Net investment income | | $ | 20,022,673 | | | $ | 39,220,735 | |
Net realized loss on investments | | | (26,246,654 | ) | | | (5,072,108 | ) |
Net unrealized appreciation (depreciation) on investments | | | 43,312,513 | | | | (60,941,488 | ) |
| | | | | | | | |
Net increase (decrease) in net assets resulting from operations | | | 37,088,532 | | | | (26,792,861 | ) |
| | | | | | | | |
| | |
| Dividends to Common Stockholders | | | | | | | | |
Net investment income | | | (18,623,713 | ) | | | (44,022,967 | ) |
| | | | | | | | |
Total dividends to common stockholders | | | (18,623,713 | ) | | | (44,022,967 | ) |
| | | | | | | | |
Total increase (decrease) in net assets | | | 18,464,819 | | | | (70,815,828 | ) |
| | | | | | | | |
| | |
| Net Assets | | | | | | | | |
Beginning of period | | | 370,418,301 | | | | 441,234,129 | |
| | | | | | | | |
End of period (including dividends in excess of net investment income of $1,878,903 and $2,125,852, respectively) | | $ | 388,883,120 | | | $ | 370,418,301 | |
| | | | | | | | |
See accompanying Notes to Financial Statements.
10
Babson Capital Global Short Duration High Yield Fund 2016 Semi-Annual Report
FINANCIAL HIGHLIGHTS
(Unaudited)
| | | | | | | | | | | | | | | | | | | | |
| | | PERIOD FROM
JANUARY 1, 2015
THROUGH
JUNE 30, 2016 | | | YEAR ENDED
DECEMBER 31,
2015 | | | YEAR ENDED
DECEMBER 31,
2014 | | | YEAR ENDED
DECEMBER 31,
2013 | | | PERIOD FROM
OCTOBER 26, 2012 (1)
THROUGH
DECEMBER 31, 2012 | |
| | | | | |
| Per Common Share Data (2) | | | | | | | | | | | | | | | | | | | | |
Net asset value, beginning of period | | $ | 18.47 | | | $ | 22.00 | | | $ | 25.24 | | | $ | 24.30 | | | | 23.82 | (3) |
Income from investment operations: | | | | | | | | | | | | | | | | | | | | |
Net investment income | | | 0.94 | | | | 1.90 | | | | 2.12 | | | | 2.05 | | | | 0.18 | |
Net realized and unrealized gains (losses) on investments | | | 0.91 | | | | (3.23 | ) | | | (2.76 | ) | | | 1.21 | | | | 0.47 | |
| | | | | | | | | | | | | | | | | | | | |
Total increase (decrease) from investment operations | | | 1.85 | | | | (1.33 | ) | | | (0.64 | ) | | | 3.26 | | | | 0.65 | |
| | | | | | | | | | | | | | | | | | | | |
Less dividends to common stockholders: | | | | | | | | | | | | | | | | | | | | |
Net investment income | | | (0.93 | ) | | | (2.20 | ) | | | (2.56 | ) | | | (2.01 | ) | | | (0.17 | ) |
Net realized gain | | | – | | | | – | | | | (0.04 | ) | | | (0.31 | ) | | | – | |
| | | | | | | | | | | | | | | | | | | | |
Total dividends to common stockholders | | | (0.93 | ) | | | (2.20 | ) | | | (2.60 | ) | | | (2.32 | ) | | | (0.17 | ) |
| | | | | | | | | | | | | | | | | | | | |
Net asset value, end of period | | $ | 19.39 | | | $ | 18.47 | | | $ | 22.00 | | | $ | 25.24 | | | $ | 24.30 | |
| | | | | | | | | | | | | | | | | | | | |
Per common share market value, end of period | | $ | 17.86 | | | $ | 16.49 | | | $ | 20.19 | | | $ | 23.12 | | | $ | 23.77 | |
| | | | | | | | | | | | | | | | | | | | |
Total investment return based on net asset value (2)(4) | | | 10.95 | % | | | (5.57 | )% | | | (2.25 | )% | | | 14.48 | % | | | 2.69 | % |
| | | | | | | | | | | | | | | | | | | | |
Total investment return based on market value (2)(4) | | | 14.47 | % | | | (8.13 | )% | | | (2.06 | )% | | | 7.20 | % | | | (4.27 | )% |
| | | | | | | | | | | | | | | | | | | | |
| | | | | |
Supplemental Data and Ratios | | | | | | | | | | | | | | | | | | | | |
Net assets, end of period (000’s) | | $ | 388,883 | | | $ | 370,418 | | | $ | 441,234 | | | $ | 506,197 | | | $ | 487,005 | |
Ratio of expenses (before reductions and reimbursements) to average net assets (5) | | | 2.10 | %(6) | | | 2.27 | % | | | 2.20 | % | | | 2.06 | % | | | 1.85 | %(6) |
Ratio of expenses to average net assets | | | 2.37 | %(6) | | | – | % | | | – | % | | | – | % | | | – | %(6) |
Ratio of net investment income (before reductions and reimbursements) to average net assets (5) | | | 11.19 | %(6) | | | 9.18 | % | | | 8.47 | % | | | 8.20 | % | | | 4.70 | %(6) |
Ratio of net investment income to average net assets | | | 10.93 | %(6) | | | – | % | | | – | % | | | – | % | | | – | %(6) |
Portfolio turnover rate (2) | | | 20.34 | % | | | 38.13 | % | | | 63.66 | % | | | 60.87 | % | | | 4.74 | % |
| (1) | | Commencement of operations. |
| (3) | | Net asset value at the beginning of the period reflects the deduction of the sales load and offering costs of $1.18 per share paid by the shareholder from the $25.00 offering price. |
| (4) | | Total investment return calculation assumes reinvestment of dividends at actual prices pursuant to the Fund’s dividend reinvestment plan. Total investment return does not reflect brokerage commissions. |
| (5) | | The Adviser has contractually waived a portion of its management and other fees equal to an annual rate of 0.275% of the Fund’s managed assets for a period of one year commencing on January 1, 2016. |
| (6) | | Annualized for periods less than one full year. |
See accompanying Notes to Financial Statements.
11
Babson Capital Global Short Duration High Yield Fund 2016 Semi-Annual Report
SCHEDULE OF INVESTMENTS
June 30, 2016 (Unaudited)
| | | | | | | | | | | | | | | | | | | | |
| | | EFFECTIVE
INTEREST RATE ‡ | | | DUE DATE | | | PRINCIPAL | | | COST | | | FAIR
VALUE | |
Fixed Income — 129.07%*: | | | | | | | | | | | | | | | | | | | | |
| | | | | |
Bank Loans§ — 17.28%*: | | | | | | | | | | | | | | | | | | | | |
| | | | | |
Aerospace and Defense — 0.39%*: | | | | | | | | | | | | | | | | | | | | |
Swissport Investments+ | | | 6.25 | % | | | 2/9/2022 | | | | 1,400,000 | | | | $1,489,222 | | | | $1,530,072 | |
| | | | | | | | | | | | | | | | | | | | |
Total Aerospace and Defense | | | | | | | | | | | 1,400,000 | | | | 1,489,222 | | | | 1,530,072 | |
| | | | | | | | | | | | | | | | | | | | |
| | | |
Chemicals, Plastics and Rubber — 0.82%*: | | | | | | | | | | | | | |
Flint Group Holdings+ | | | 8.25 | | | | 9/30/2022 | | | | 3,451,145 | | | | 3,435,940 | | | | 3,175,054 | |
| | | | | | | | | | | | | | | | | | | | |
Total Chemicals, Plastics and Rubber | | | | | | | | | | | 3,451,145 | | | | 3,435,940 | | | | 3,175,054 | |
| | | | | | | | | | | | | | | | | | | | |
| | | |
Diversified/Conglomerate Manufacturing — 0.31%*: | | | | | | | | | | | | | |
TenCate+ | | | 5.25 | | | | 1/27/2023 | | | | 1,100,000 | | | | 1,176,692 | | | | 1,200,893 | |
| | | | | | | | | | | | | | | | | | | | |
Total Diversified/Conglomerate Manufacturing | | | | | | | | | | | 1,100,000 | | | | 1,176,692 | | | | 1,200,893 | |
| | | | | | | | | | | | | | | | | | | | |
| | | |
Diversified Natural Resources, Precious Metals and Minerals — 1.33%*: | | | | | | | | | | | | | |
Caraustar Industries Inc. | | | 8.00 | | | | 5/1/2019 | | | | 5,215,261 | | | | 5,226,102 | | | | 5,191,375 | |
| | | | | | | | | | | | | | | | | | | | |
Total Diversified Natural Resources, Precious Metals and Minerals | | | | | | | | | | | 5,215,261 | | | | 5,226,102 | | | | 5,191,375 | |
| | | | | | | | | | | | | | | | | | | | |
| | | | | |
Electronics — 1.93%*: | | | | | | | | | | | | | | | | | | | | |
Kronos, Inc. | | | 9.75 | | | | 4/30/2020 | | | | 7,483,740 | | | | 7,408,915 | | | | 7,514,947 | |
| | | | | | | | | | | | | | | | | | | | |
Total Electronics | | | | | | | | | | | 7,483,740 | | | | 7,408,915 | | | | 7,514,947 | |
| | | | | | | | | | | | | | | | | | | | |
| | | | | |
Farming and Agriculture — 1.58%*: | | | | | | | | | | | | | | | | | | | | |
Allflex Holdings, Inc. | | | 8.00 | | | | 7/19/2021 | | | | 6,232,322 | | | | 6,226,859 | | | | 6,149,245 | |
| | | | | | | | | | | | | | | | | | | | |
Total Farming and Agriculture | | | | | | | | | | | 6,232,322 | | | | 6,226,859 | | | | 6,149,245 | |
| | | | | | | | | | | | | | | | | | | | |
| | | |
Finance — 0.52%*: | | | | | | | | | | | | | |
Cunningham Lindsey Group, Inc. | | | 9.25 | | | | 6/10/2020 | | | | 5,504,015 | | | | 5,510,065 | | | | 2,036,486 | |
| | | | | | | | | | | | | | | | | | | | |
Total Finance | | | | | | | | | | | 5,504,015 | | | | 5,510,065 | | | | 2,036,486 | |
| | | | | | | | | | | | | | | | | | | | |
| | | |
Healthcare, Education and Childcare — 0.38%*: | | | | | | | | | | | | | |
Tecomet | | | 5.75 | | | | 12/5/2021 | | | | 1,574,287 | | | | 1,441,411 | | | | 1,479,830 | |
| | | | | | | | | | | | | | | | | | | | |
Total Healthcare, Education and Childcare | | | | | | | | | | | 1,574,287 | | | | 1,441,411 | | | | 1,479,830 | |
| | | | | | | | | | | | | | | | | | | | |
| | | |
Leisure, Amusement, Motion Pictures and Entertainment — 0.96%*: | | | | | | | | | | | | | |
Endemol+ | | | 6.75 | | | | 8/11/2021 | | | | 3,607,592 | | | | 3,458,665 | | | | 2,947,692 | |
Exterion Media+ | | | 7.00 | | | | 3/30/2018 | | | | 700,000 | | | | 771,348 | | | | 772,944 | |
| | | | | | | | | | | | | | | | | | | | |
Total Leisure, Amusement, Motion Pictures and Entertainment | | | | | | | | | | | 4,307,592 | | | | 4,230,013 | | | | 3,720,636 | |
| | | | | | | | | | | | | | | | | | | | |
| | | |
Mining, Steel, Iron and Non-Precious Metals — 1.23%*: | | | | | | | | | | | | | |
Boomerang Tube, LLC | | | 15.00 | | | | 8/1/2017 | | | | 670,565 | | | | 672,116 | | | | 670,565 | |
Boomerang Tube, LLC | | | 20.00 | | | | 2/1/2019 | | | | 609,111 | | | | 553,805 | | | | 548,200 | |
Boomerang Tube, LLC | | | 17.50 | | | | 2/1/2021 | | | | 1,458,654 | | | | 1,458,654 | | | | 1,458,654 | |
See accompanying Notes to Financial Statements.
12
Babson Capital Global Short Duration High Yield Fund 2016 Semi-Annual Report
SCHEDULE OF INVESTMENTS (CONTINUED)
June 30, 2016 (Unaudited)
| | | | | | | | | | | | | | | | | | | | |
| | | EFFECTIVE
INTEREST RATE ‡ | | | DUE DATE | | | PRINCIPAL | | | COST | | | FAIR
VALUE | |
Bank Loans (Continued) | | | | | | | | | | | | | | | | | | | | |
| | | |
Mining, Steel, Iron and Non-Precious Metals (Continued) | | | | | | | | | | | | | |
Boomerang Tube, LLC | | | 15.65 | % | | | 2/1/2019 | | | | 1,774,652 | | | | $1,774,652 | | | | $1,774,652 | |
Murray Energy Corp. | | | 7.50 | | | | 4/16/2020 | | | | 445,609 | | | | 434,553 | | | | 323,066 | |
| | | | | | | | | | | | | | | | | | | | |
Total Mining, Steel, Iron and Non-Precious Metals | | | | | | | | | | | 4,958,591 | | | | 4,893,780 | | | | 4,775,137 | |
| | | | | | | | | | | | | | | | | | | | |
| | | |
Oil and Gas — 6.31%*: | | | | | | | | | | | | | |
Caelus Energy Alaska | | | 8.75 | | | | 4/15/2020 | | | | 17,863,828 | | | | 17,372,841 | | | | 10,539,659 | |
Fieldwood Energy LLC | | | 8.38 | | | | 9/30/2020 | | | | 8,925,706 | | | | 6,931,820 | | | | 2,454,569 | |
Fieldwood Energy LLC | | | 8.13 | | | | 9/30/2020 | | | | 7,481,592 | | | | 5,811,501 | | | | 3,946,540 | |
Fieldwood Energy LLC | | | 7.65 | | | | 9/30/2020 | | | | 5,651,171 | | | | 4,994,845 | | | | 4,652,778 | |
Jonah Energy LLC | | | 7.50 | | | | 5/12/2021 | | | | 1,301,497 | | | | 1,310,050 | | | | 1,135,557 | |
MD America Energy, LLC | | | 9.50 | | | | 7/2/2019 | | | | 152,319 | | | | 146,872 | | | | 141,657 | |
NFR Energy LLC> | | | 10.00 | | | | 12/31/2018 | | | | 7,684,465 | | | | 7,774,974 | | | | 259,351 | |
Templar Energy> | | | 8.50 | | | | 11/25/2020 | | | | 5,580,408 | | | | 5,447,238 | | | | 1,395,102 | |
| | | | | | | | | | | | | | | | | | | | |
Total Oil and Gas | | | | | | | | | | | 54,640,986 | | | | 49,790,141 | | | | 24,525,213 | |
| | | | | | | | | | | | | | | | | | | | |
| | | |
Printing and Publishing — 0.83%*: | | | | | | | | | | | | | |
Springer+ | | | 9.00 | | | | 8/14/2021 | | | | 2,850,000 | | | | 3,262,480 | | | | 3,226,057 | |
| | | | | | | | | | | | | | | | | | | | |
Total Printing and Publishing | | | | | | | | | | | 2,850,000 | | | | 3,262,480 | | | | 3,226,057 | |
| | | | | | | | | | | | | | | | | | | | |
| | | | | |
Retail Store — 0.69%*: | | | | | | | | | | | | | | | | | | | | |
FleetPride | | | 5.25 | | | | 11/19/2019 | | | | 827,088 | | | | 717,036 | | | | 696,136 | |
FleetPride | | | 9.25 | | | | 5/19/2020 | | | | 3,000,000 | | | | 2,957,421 | | | | 1,980,000 | |
| | | | | | | | | | | | | | | | | | | | |
Total Retail Store | | | | | | | | | | | 3,827,088 | | | | 3,674,457 | | | | 2,676,136 | |
| | | | | | | | | | | | | | | | | | | | |
| | | | | | | | | | | | | | | | | | | | |
Total Bank Loans | | | | | | | | | | | 102,545,027 | | | | 97,766,077 | | | | 67,201,081 | |
| | | | | | | | | | | | | | | | | | | | |
| | | | | |
Corporate Bonds — 111.79%*: | | | | | | | | | | | | | | | | | | | | |
| | | | | |
Aerospace and Defense — 1.69%*: | | | | | | | | | | | | | | | | | | | | |
CPI International Inc.# | | | 8.75 | | | | 2/15/2018 | | | | 5,550,000 | | | | 5,634,416 | | | | 5,508,375 | |
Swissport Investments+^ | | | 6.75 | | | | 12/15/2021 | | | | 950,000 | | | | 1,040,150 | | | | 1,080,624 | |
| | | | | | | | | | | | | | | | | | | | |
Total Aerospace and Defense | | | | | | | | | | | 6,500,000 | | | | 6,674,566 | | | | 6,588,999 | |
| | | | | | | | | | | | | | | | | | | | |
| | | | | |
Automobile — 9.79%*: | | | | | | | | | | | | | | | | | | | | |
Accuride Corp# | | | 9.50 | | | | 8/1/2018 | | | | 11,210,000 | | | | 11,261,989 | | | | 10,382,702 | |
Allied Specialty Vehicles#^ | | | 8.50 | | | | 11/1/2019 | | | | 6,000,000 | | | | 5,965,020 | | | | 6,075,000 | |
Gates Global LLC^ | | | 6.00 | | | | 7/15/2022 | | | | 4,740,000 | | | | 4,182,787 | | | | 4,147,500 | |
International Automotive Components Group, S.A.#^ | | | 9.13 | | | | 6/1/2018 | | | | 8,125,000 | | | | 8,194,681 | | | | 8,125,000 | |
J.B. Poindexter & Co. Inc.#^ | | | 9.00 | | | | 4/1/2022 | | | | 8,989,000 | | | | 9,341,548 | | | | 9,348,560 | |
| | | | | | | | | | | | | | | | | | | | |
Total Automobile | | | | | | | | | | | 39,064,000 | | | | 38,946,025 | | | | 38,078,762 | |
| | | | | | | | | | | | | | | | | | | | |
| | | | | |
Banking — 0.89%*: | | | | | | | | | | | | | | | | | | | | |
Lock AS+^ | | | 7.00 | | | | 8/15/2021 | | | | 3,050,000 | | | | 3,783,602 | | | | 3,443,985 | |
| | | | | | | | | | | | | | | | | | | | |
Total Banking | | | | | | | | | | | 3,050,000 | | | | 3,783,602 | | | | 3,443,985 | |
| | | | | | | | | | | | | | | | | | | | |
See accompanying Notes to Financial Statements.
13
Babson Capital Global Short Duration High Yield Fund 2016 Semi-Annual Report
SCHEDULE OF INVESTMENTS (CONTINUED)
June 30, 2016 (Unaudited)
| | | | | | | | | | | | | | | | | | | | |
| | | EFFECTIVE
INTEREST RATE ‡ | | | DUE DATE | | | PRINCIPAL | | | COST | | | FAIR
VALUE | |
Corporate Bonds (Continued) | | | | | | | | | | | | | |
| | | |
Beverage, Food and Tobacco — 0.91%*: | | | | | | | | | | | | | |
Boparan Finance PLC+^ | | | 5.50 | % | | | 7/15/2021 | | | | 1,350,000 | | | | $1,946,326 | | | | $1,568,054 | |
Carrols Corp.# | | | 8.00 | | | | 5/1/2022 | | | | 709,000 | | | | 731,627 | | | | 763,947 | |
Manitowoc Foodservice#^ | | | 9.50 | | | | 2/15/2024 | | | | 1,074,000 | | | | 1,074,000 | | | | 1,200,195 | |
| | | | | | | | | | | | | | | | | | | | |
Total Beverage, Food and Tobacco | | | | | | | | | | | 3,133,000 | | | | 3,751,953 | | | | 3,532,196 | |
| | | | | | | | | | | | | | | | | | | | |
| | | |
Broadcasting and Entertainment — 3.92%*: | | | | | | | | | | | | | |
Arqiva Finance#+^ | | | 9.50 | | | | 3/31/2020 | | | | 5,000,000 | | | | 7,851,739 | | | | 7,095,331 | |
Dish DBS Corp.#^ | | | 7.75 | | | | 7/1/2026 | | | | 3,094,000 | | | | 3,131,459 | | | | 3,186,820 | |
Entertainment One Ltd.+^ | | | 6.88 | | | | 12/15/2022 | | | | 850,000 | | | | 1,282,422 | | | | 1,136,547 | |
RCN Cable#^ | | | 8.50 | | | | 8/15/2020 | | | | 3,733,000 | | | | 3,831,578 | | | | 3,826,325 | |
| | | | | | | | | | | | | | | | | | | | |
Total Broadcasting and Entertainment | | | | | | | | | | | 12,677,000 | | | | 16,097,198 | | | | 15,245,023 | |
| | | | | | | | | | | | | | | | | | | | |
| | | |
Buildings and Real Estate — 4.54%*: | | | | | | | | | | | | | |
Cemex S.A.B. de C.V.#+^ | | | 9.38 | | | | 10/12/2022 | | | | 5,000,000 | | | | 5,176,331 | | | | 5,500,000 | |
Cemex S.A.B. de C.V.#+^ | | | 7.75 | | | | 4/16/2026 | | | | 602,000 | | | | 601,916 | | | | 631,558 | |
Keystone Financing+^ | | | 9.50 | | | | 10/15/2019 | | | | 3,900,000 | | | | 6,201,571 | | | | 5,232,917 | |
Lyon Williams Homes, Inc.# | | | 8.50 | | | | 11/15/2020 | | | | 5,000,000 | | | | 5,037,507 | | | | 5,137,500 | |
Paroc Group+^ | | | 6.25 | | | | 5/15/2020 | | | | 1,050,000 | | | | 1,444,431 | | | | 1,155,921 | |
| | | | | | | | | | | | | | | | | | | | |
Total Buildings and Real Estate | | | | | | | | | | | 15,552,000 | | | | 18,461,756 | | | | 17,657,896 | |
| | | | | | | | | | | | | | | | | | | | |
| | | |
Cargo Transport — 5.76%*: | | | | | | | | | | | | | |
Direct ChassisLink Inc.^ | | | 10.00 | | | | 6/15/2023 | | | | 3,010,000 | | | | 3,010,000 | | | | 3,115,350 | |
Kenan Advantage Group, Inc.#^ | | | 7.88 | | | | 7/31/2023 | | | | 10,000,000 | | | | 10,078,140 | | | | 9,850,000 | |
Moto Hospitality Limited+^ | | | 6.38 | | | | 9/1/2020 | | | | 2,400,000 | | | | 3,584,497 | | | | 3,258,916 | |
World Flight Services, Inc.+^ | | | 9.50 | | | | 7/15/2022 | | | | 1,350,000 | | | | 1,530,563 | | | | 1,400,788 | |
XPO Logistics, Inc.#^ | | | 6.50 | | | | 6/15/2022 | | | | 5,000,000 | | | | 4,850,037 | | | | 4,768,750 | |
| | | | | | | | | | | | | | | | | | | | |
Total Cargo Transport | | | | | | | | | | | 21,760,000 | | | | 23,053,237 | | | | 22,393,804 | |
| | | | | | | | | | | | | | | | | | | | |
| | | |
Chemicals, Plastics and Rubber — 13.72%*: | | | | | | | | | | | | | |
Associated Asphalt Partners LLC#^ | | | 8.50 | | | | 2/15/2018 | | | | 2,327,000 | | | | 2,332,139 | | | | 2,327,000 | |
Chemours Co.# | | | 7.00 | | | | 5/15/2025 | | | | 5,962,000 | | | | 5,512,862 | | | | 5,000,627 | |
Consolidated Energy Finance S.A.#+^ | | | 6.75 | | | | 10/15/2019 | | | | 8,120,000 | | | | 7,923,406 | | | | 7,632,800 | |
Cornerstone Chemical Co.#^ | | | 9.38 | | | | 3/15/2018 | | | | 4,725,000 | | | | 4,794,536 | | | | 4,630,500 | |
CVR Partners LP#^ | | | 9.25 | | | | 6/15/2023 | | | | 5,913,000 | | | | 5,818,085 | | | | 6,016,477 | |
Ineos+^ | | | 6.50 | | | | 8/15/2018 | | | | 2,200,000 | | | | 2,514,622 | | | | 2,471,979 | |
LSB Industries, Inc.# | | | 7.75 | | | | 8/1/2019 | | | | 5,669,000 | | | | 5,440,904 | | | | 5,647,741 | |
Monitchem Holdco+^ | | | 5.25 | | | | 6/15/2021 | | | | 100,000 | | | | 111,414 | | | | 109,311 | |
Omnova Solutions, Inc.# | | | 7.88 | | | | 11/1/2018 | | | | 4,244,000 | | | | 4,296,311 | | | | 4,244,000 | |
Pinnacle Operating Corp.#^ | | | 9.00 | | | | 11/15/2020 | | | | 2,635,000 | | | | 2,640,702 | | | | 2,213,400 | |
Platform Specialty Products Corporation#^ | | | 10.38 | | | | 5/1/2021 | | | | 5,539,000 | | | | 5,632,088 | | | | 5,580,542 | |
TPC Group, Inc.#^ | | | 8.75 | | | | 12/15/2020 | | | | 8,398,000 | | | | 8,411,762 | | | | 6,571,435 | |
Trinseo^ | | | 6.38 | | | | 5/1/2022 | | | | 800,000 | | | | 936,354 | | | | 892,909 | |
| | | | | | | | | | | | | | | | | | | | |
Total Chemicals, Plastics and Rubber | | | | | | | | | | | 56,632,000 | | | | 56,365,185 | | | | 53,338,721 | |
| | | | | | | | | | | | | | | | | | | | |
See accompanying Notes to Financial Statements.
14
Babson Capital Global Short Duration High Yield Fund 2016 Semi-Annual Report
SCHEDULE OF INVESTMENTS (CONTINUED)
June 30, 2016 (Unaudited)
| | | | | | | | | | | | | | | | | | | | |
| | | EFFECTIVE
INTEREST RATE ‡ | | | DUE DATE | | | PRINCIPAL | | | COST | | | FAIR
VALUE | |
Corporate Bonds (Continued) | | | | | | | | | | | | | | | | | | | | |
| | | | | |
Containers, Packaging and Glass — 6.20%*: | | | | | | | | | | | | | | | | | | | | |
Bormioli+^ | | | 10.00 | % | | | 8/1/2018 | | | | 350,000 | | | | $393,737 | | | | $394,435 | |
Coveris Holdings S.A.#^ | | | 7.88 | | | | 11/1/2019 | | | | 7,600,000 | | | | 7,645,145 | | | | 7,381,500 | |
Horizon Holdings+^ | | | 7.25 | | | | 8/1/2023 | | | | 3,750,000 | | | | 4,116,582 | | | | 4,308,276 | |
Multi Packaging Solutions, Inc.#^ | | | 8.50 | | | | 8/15/2021 | | | | 6,105,000 | | | | 6,126,079 | | | | 6,379,725 | |
Onex Wizard Acquisition Co+^ | | | 7.75 | | | | 2/15/2023 | | | | 3,600,000 | | | | 4,134,082 | | | | 4,206,459 | |
Signode Industrial#^ | | | 6.38 | | | | 5/1/2022 | | | | 1,500,000 | | | | 1,444,528 | | | | 1,434,375 | |
| | | | | | | | | | | | | | | | | | | | |
Total Containers, Packaging and Glass | | | | | | | | | | | 22,905,000 | | | | 23,860,153 | | | | 24,104,770 | |
| | | | | | | | | | | | | | | | | | | | |
| | | | |
Diversified/Conglomerate Manufacturing — 3.58%*: | | | | | | | | | | | | | | | | | |
Appvion Inc.#^ | | | 9.00 | | | | 6/1/2020 | | | | 13,200,000 | | | | 13,383,213 | | | | 7,458,000 | |
Carlisle Transportation Products#^ | | | 8.25 | | | | 12/15/2019 | | | | 3,950,000 | | | | 4,027,583 | | | | 3,476,000 | |
StoneMor Partners L.P.# | | | 7.88 | | | | 6/1/2021 | | | | 3,000,000 | | | | 2,944,275 | | | | 2,970,000 | |
| | | | | | | | | | | | | | | | | | | | |
Total Diversified/Conglomerate Manufacturing | | | | | | | | | | | 20,150,000 | | | | 20,355,071 | | | | 13,904,000 | |
| | | | | | | | | | | | | | | | | | | | |
| | | | | |
Diversified/Conglomerate Service — 1.39%*: | | | | | | | | | | | | | | | | | | | | |
Carlson Travel Holdings Inc.#^ | | | 7.50 | | | | 8/15/2019 | | | | 2,690,000 | | | | 2,719,579 | | | | 2,568,950 | |
Zachry Holdings Inc.#^ | | | 7.50 | | | | 2/1/2020 | | | | 2,875,000 | | | | 2,817,957 | | | | 2,846,250 | |
| | | | | | | | | | | | | | | | | | | | |
Total Diversified/Conglomerate Service | | | | | | | | | | | 5,565,000 | | | | 5,537,536 | | | | 5,415,200 | |
| | | | | | | | | | | | | | | | | | | | |
| | | |
Diversified Natural Resources, Precious Metals and Minerals — 0.19%*: | | | | | | | | | | | | | |
Lecta S.A.#+^ | | | 8.88 | | | | 5/15/2019 | | | | 630,000 | | | | 821,226 | | | | 720,190 | |
| | | | | | | | | | | | | | | | | | | | |
Total Diversified Natural Resources, Precious Metals and Minerals | | | | | | | | | | | 630,000 | | | | 821,226 | | | | 720,190 | |
| | | | | | | | | | | | | | | | | | | | |
| | | | | |
Electronics — 4.41%*: | | | | | | | | | | | | | | | | | | | | |
ADT Corp/Protection One#^ | | | 9.25 | | | | 5/15/2023 | | | | 2,455,000 | | | | 2,455,000 | | | | 2,602,300 | |
Dell Inc.^ | | | 7.13 | | | | 6/15/2024 | | | | 533,000 | | | | 533,000 | | | | 556,676 | |
International Wire Group, Inc.#^ | | | 8.50 | | | | 10/15/2017 | | | | 8,086,000 | | | | 8,142,749 | | | | 8,005,140 | |
Microsemi Corporation#^ | | | 9.13 | | | | 4/15/2023 | | | | 1,326,000 | | | | 1,326,000 | | | | 1,458,600 | |
Western Digital Corporation#^ | | | 10.50 | | | | 4/1/2024 | | | | 4,224,000 | | | | 4,354,901 | | | | 4,519,680 | |
| | | | | | | | | | | | | | | | | | | | |
Total Electronics | | | | | | | | | | | 16,624,000 | | | | 16,811,650 | | | | 17,142,396 | |
| | | | | | | | | | | | | | | | | | | | |
| | | | | |
Finance — 7.20%*: | | | | | | | | | | | | | | | | | | | | |
Arrow Global Finance PLC+^ | | | 4.75 | | | | 5/1/2023 | | | | 350,000 | | | | 389,086 | | | | 382,588 | |
Cabot Financial#+^ | | | 10.38 | | | | 10/1/2019 | | | | 4,364,000 | | | | 7,227,102 | | | | 6,129,132 | |
Galaxy Finco Ltd.+^ | | | 7.88 | | | | 11/15/2021 | | | | 3,900,000 | | | | 6,351,736 | | | | 5,088,063 | |
GFKL Financial Services+^ | | | 8.50 | | | | 11/1/2022 | | | | 4,900,000 | | | | 7,407,352 | | | | 6,170,254 | |
Marlin Financial+^ | | | 10.50 | | | | 8/1/2020 | | | | 1,850,000 | | | | 2,929,086 | | | | 2,659,851 | |
National Financial Partners Corp.#^ | | | 9.00 | | | | 7/15/2021 | | | | 1,720,000 | | | | 1,711,400 | | | | 1,657,650 | |
TMF Group Holding+^ | | | 9.88 | | | | 12/1/2019 | | | | 5,000,000 | | | | 6,210,887 | | | | 5,920,542 | |
| | | | | | | | | | | | | | | | | | | | |
Total Finance | | | | | | | | | | | 22,084,000 | | | | 32,226,649 | | | | 28,008,080 | |
| | | | | | | | | | | | | | | | | | | | |
See accompanying Notes to Financial Statements.
15
Babson Capital Global Short Duration High Yield Fund 2016 Semi-Annual Report
SCHEDULE OF INVESTMENTS (CONTINUED)
June 30, 2016 (Unaudited)
| | | | | | | | | | | | | | | | | | | | |
| | | EFFECTIVE
INTEREST RATE ‡ | | | DUE DATE | | | PRINCIPAL | | | COST | | | FAIR
VALUE | |
Corporate Bonds (Continued) | | | | | | | | | | | | | | | | | | | | |
| | | | | |
Grocery — 0.66%*: | | | | | | | | | | | | | | | | | | | | |
Post Holdings#^ | | | 8.00 | % | | | 7/15/2025 | | | | 1,232,000 | | | | $1,232,000 | | | | $1,365,980 | |
Premier Foods Finance+^ | | | 6.50 | | | | 3/15/2021 | | | | 950,000 | | | | 1,528,720 | | | | 1,201,459 | |
| | | | | | | | | | | | | | | | | | | | |
Total Grocery | | | | | | | | | | | 2,182,000 | | | | 2,760,720 | | | | 2,567,439 | |
| | | | | | | | | | | | | | | | | | | | |
| | | |
Healthcare, Education and Childcare — 8.45%*: | | | | | | | | | | | | | |
Capsugel Holdings#^ | | | 7.00 | | | | 5/15/2019 | | | | 1,159,000 | | | | 1,166,458 | | | | 1,161,897 | |
Cerba+^ | | | 8.25 | | | | 2/1/2020 | | | | 3,450,000 | | | | 3,869,998 | | | | 3,901,398 | |
Cognita Financing+^ | | | 7.75 | | | | 8/15/2021 | | | | 2,200,000 | | | | 3,435,055 | | | | 2,969,826 | |
ConvaTec Healthcare#^ | | | 10.50 | | | | 12/15/2018 | | | | 850,000 | | | | 860,701 | | | | 869,125 | |
Kindred Healthcare, Inc.# | | | 8.75 | | | | 1/15/2023 | | | | 5,699,000 | | | | 5,757,772 | | | | 5,624,229 | |
Labco+^ | | | 6.25 | | | | 7/1/2022 | | | | 250,000 | | | | 290,134 | | | | 292,698 | |
Regionalcare Hospital Partners, Inc.#^ | | | 8.25 | | | | 5/1/2023 | | | | 1,496,000 | | | | 1,535,941 | | | | 1,533,400 | |
Tenet Healthcare Corporation# | | | 8.13 | | | | 4/1/2022 | | | | 4,700,000 | | | | 4,671,494 | | | | 4,816,560 | |
Unilabs+^ | | | 7.25 | | | | 7/15/2018 | | | | 2,600,000 | | | | 3,575,471 | | | | 2,836,311 | |
Unilabs+^ | | | 8.50 | | | | 7/15/2018 | | | | 2,450,000 | | | | 3,203,818 | | | | 2,774,365 | |
Valeant#^ | | | 6.13 | | | | 4/15/2025 | | | | 4,006,000 | | | | 3,677,601 | | | | 3,214,815 | |
Valeant#+^ | | | 7.50 | | | | 7/15/2021 | | | | 3,260,000 | | | | 3,260,000 | | | | 2,874,912 | |
| | | | | | | | | | | | | | | | | | | | |
Total Healthcare, Education and Childcare | | | | | | | | | | | 32,120,000 | | | | 35,304,443 | | | | 32,869,536 | |
| | | | | | | | | | | | | | | | | | | | |
| | | |
Hotels, Motels, Inns and Gaming — 0.61%*: | | | | | | | | | | | | | |
Gala Group Finance#+^ | | | 8.88 | | | | 9/1/2018 | | | | 565,714 | | | | 907,881 | | | | 771,186 | |
Travelodge+^ | | | 8.50 | | | | 5/15/2023 | | | | 1,250,000 | | | | 1,830,318 | | | | 1,604,580 | |
| | | | | | | | | | | | | | | | | | | | |
Total Hotels, Motels, Inns and Gaming | | | | | | | | | | | 1,815,714 | | | | 2,738,199 | | | | 2,375,766 | |
| | | | | | | | | | | | | | | | | | | | |
| | | |
Insurance — 0.67%*: | | | | | | | | | | | | | |
Onex York Acquisition Corp.#^ | | | 8.50 | | | | 10/1/2022 | | | | 3,524,000 | | | | 3,524,000 | | | | 2,598,950 | |
| | | | | | | | | | | | | | | | | | | | |
Total Insurance | | | | | | | | | | | 3,524,000 | | | | 3,524,000 | | | | 2,598,950 | |
| | | | | | | | | | | | | | | | | | | | |
| | | |
Leisure, Amusement, Motion Pictures and Entertainment — 4.51%*: | | | | | | | | | | | | | |
CPUK Finance Ltd+^ | | | 7.00 | | | | 2/28/2042 | | | | 4,100,000 | | | | 6,142,756 | | | | 5,594,606 | |
Odeon & UCI Finco+^ | | | 9.00 | | | | 8/1/2018 | | | | 2,150,000 | | | | 3,173,124 | | | | 2,885,099 | |
Perform Group+^ | | | 8.50 | | | | 11/15/2020 | | | | 900,000 | | | | 1,344,830 | | | | 1,084,308 | |
Vue Cinimas+^ | | | 7.88 | | | | 7/15/2020 | | | | 3,650,000 | | | | 5,854,374 | | | | 4,968,416 | |
Warner Music#^ | | | 6.75 | | | | 4/15/2022 | | | | 3,000,000 | | | | 2,739,076 | | | | 3,022,500 | |
| | | | | | | | | | | | | | | | | | | | |
Total Leisure, Amusement, Motion Pictures and Entertainment | | | | | | | | | | | 13,800,000 | | | | 19,254,160 | | | | 17,554,929 | |
| | | | | | | | | | | | | | | | | | | | |
| | | |
Machinery (Non-Agriculture, Non-Construct, Non-Electronic) — 2.02%*: | | | | | | | | | | | | | |
Apex Tool Group LLC^ | | | 7.00 | | | | 2/1/2021 | | | | 1,896,000 | | | | 1,666,610 | | | | 1,635,300 | |
Xerium Technologies# | | | 8.88 | | | | 6/15/2018 | | | | 6,324,000 | | | | 6,346,213 | | | | 6,229,140 | |
| | | | | | | | | | | | | | | | | | | | |
Total Machinery (Non-Agriculture, Non-Construct, Non-Electronic) | | | | | | | | | | | 8,220,000 | | | | 8,012,823 | | | | 7,864,440 | |
| | | | | | | | | | | | | | | | | | | | |
See accompanying Notes to Financial Statements.
16
Babson Capital Global Short Duration High Yield Fund 2016 Semi-Annual Report
SCHEDULE OF INVESTMENTS (CONTINUED)
June 30, 2016 (Unaudited)
| | | | | | | | | | | | | | | | | | | | |
| | | EFFECTIVE
INTEREST RATE ‡ | | | DUE DATE | | | PRINCIPAL | | | COST | | | FAIR
VALUE | |
Corporate Bonds (Continued) | | | | | | | | | | | | | | | | | | | | |
| | | |
Mining, Steel, Iron and Non-Precious Metals — 4.53%*: | | | | | | | | | | | | | |
Constellium Holdco B.V.#+^ | | | 7.88 | % | | | 4/1/2021 | | | | 2,474,000 | | | | $2,471,500 | | | | $2,551,312 | |
Constellium Holdco B.V.#+^ | | | 7.00 | | | | 1/15/2023 | | | | 3,350,000 | | | | 3,924,528 | | | | 2,994,590 | |
Freeport-McMoRan Inc. | | | 3.55 | | | | 3/1/2022 | | | | 3,000,000 | | | | 2,338,045 | | | | 2,640,000 | |
Hecla Mining Company# | | | 6.88 | | | | 5/1/2021 | | | | 5,888,000 | | | | 5,659,885 | | | | 5,637,760 | |
Kissner Milling Company Limited#^ | | | 7.25 | | | | 6/1/2019 | | | | 3,300,000 | | | | 2,969,320 | | | | 3,300,000 | |
Zekelman Industries Inc.^ | | | 9.88 | | | | 6/15/2023 | | | | 489,000 | | | | 489,000 | | | | 493,890 | |
| | | | | | | | | | | | | | | | | | | | |
Total Mining, Steel, Iron and Non-Precious Metals | | | | | | | | | | | 18,501,000 | | | | 17,852,278 | | | | 17,617,552 | |
| | | | | | | | | | | | | | | | | | | | |
| | | |
Oil and Gas — 14.09%*: | | | | | | | | | | | | | |
Calumet Specialty Products# | | | 7.63 | | | | 1/15/2022 | | | | 1,135,000 | | | | 1,117,907 | | | | 803,012 | |
Calumet Specialty Products# | | | 6.50 | | | | 4/15/2021 | | | | 6,000,000 | | | | 5,937,852 | | | | 4,290,000 | |
CITGO Holding Inc.#^ | | | 10.75 | | | | 2/15/2020 | | | | 7,584,000 | | | | 7,428,767 | | | | 7,621,920 | |
EP Energy | | | 9.38 | | | | 5/1/2020 | | | | 9,000,000 | | | | 4,999,395 | | | | 6,367,500 | |
Ferrellgas Partners LP# | | | 8.63 | | | | 6/15/2020 | | | | 7,635,000 | | | | 7,546,460 | | | | 7,635,000 | |
Jupiter Resources Inc.#+^ | | | 8.50 | | | | 10/1/2022 | | | | 5,025,000 | | | | 4,791,883 | | | | 3,605,437 | |
Kosmos Energy Ltd.#+^ | | | 7.88 | | | | 8/1/2021 | | | | 5,070,000 | | | | 4,663,416 | | | | 4,892,550 | |
Kosmos Energy Ltd.#^ | | | 7.88 | | | | 8/1/2021 | | | | 1,085,000 | | | | 1,011,698 | | | | 1,047,025 | |
Pbf Holding Company LLC# | | | 8.25 | | | | 2/15/2020 | | | | 6,000,000 | | | | 6,170,440 | | | | 6,225,000 | |
Pbf Logistics LP# | | | 6.88 | | | | 5/15/2023 | | | | 1,117,000 | | | | 1,117,000 | | | | 1,094,660 | |
SM Energy Company | | | 5.63 | | | | 6/1/2025 | | | | 4,000,000 | | | | 2,713,098 | | | | 3,440,000 | |
Topaz Marine SA#+^ | | | 8.63 | | | | 11/1/2018 | | | | 6,877,000 | | | | 6,902,976 | | | | 6,478,547 | |
Welltec#+^ | | | 8.00 | | | | 2/1/2019 | | | | 1,387,000 | | | | 1,348,593 | | | | 1,288,176 | |
| | | | | | | | | | | | | | | | | | | | |
Total Oil and Gas | | | | | | | | | | | 61,915,000 | | | | 55,749,485 | | | | 54,788,827 | |
| | | | | | | | | | | | | | | | | | | | |
| | | | | |
Printing and Publishing — 2.16%*: | | | | | | | | | | | | | | | | | | | | |
Cimpress N.V.#^ | | | 7.00 | | | | 4/1/2022 | | | | 1,560,000 | | | | 1,560,000 | | | | 1,544,400 | |
McGraw-Hill Education#^ | | | 8.50 | | | | 8/1/2019 | | | | 6,794,000 | | | | 6,807,180 | | | | 6,861,940 | |
| | | | | | | | | | | | | | | | | | | | |
Total Printing and Publishing | | | | | | | | | | | 8,354,000 | | | | 8,367,180 | | | | 8,406,340 | |
| | | | | | | | | | | | | | | | | | | | |
| | | | | |
Retail Store — 3.02%*: | | | | | | | | | | | | | | | | | | | | |
Boing Group Finance+^ | | | 6.63 | | | | 7/15/2019 | | | | 3,050,000 | | | | 4,163,755 | | | | 3,103,818 | |
Brighthouse Group PLC#+^ | | | 7.88 | | | | 5/15/2018 | | | | 2,000,000 | | | | 3,111,098 | | | | 2,393,999 | |
HSS Financing PLC+^ | | | 6.75 | | | | 8/1/2019 | | | | 816,000 | | | | 1,240,099 | | | | 1,058,061 | |
Takko Fashion+^ | | | 9.88 | | | | 4/15/2019 | | | | 2,300,000 | | | | 3,045,451 | | | | 1,448,507 | |
Travelex+^ | | | 8.00 | | | | 8/1/2018 | | | | 2,800,000 | | | | 4,343,244 | | | | 3,753,611 | |
| | | | | | | | | | | | | | | | | | | | |
Total Retail Store | | | | | | | | | | | 10,966,000 | | | | 15,903,647 | | | | 11,757,996 | |
| | | | | | | | | | | | | | | | | | | | |
| | | | | |
Telecommunications — 6.28%*: | | | | | | | | | | | | | | | | | | | | |
Altice S.A.#+^ | | | 7.75 | | | | 5/15/2022 | | | | 3,240,000 | | | | 3,240,000 | | | | 3,272,400 | |
Altice S.A.#+^ | | | 7.50 | | | | 5/15/2026 | | | | 1,622,000 | | | | 1,622,000 | | | | 1,589,560 | |
BiSoho S.A.S.+^ | | | 5.88 | | | | 5/1/2023 | | | | 350,000 | | | | 399,804 | | | | 398,114 | |
Digicel Limited+^ | | | 6.00 | | | | 4/15/2021 | | | | 4,000,000 | | | | 3,457,500 | | | | 3,428,800 | |
Eircom+^ | | | 4.50 | | | | 5/31/2022 | | | | 600,000 | | | | 681,447 | | | | 657,398 | |
Entercom Communications Corporation# | | | 10.50 | | | | 12/1/2019 | | | | 3,500,000 | | | | 3,618,377 | | | | 3,692,500 | |
See accompanying Notes to Financial Statements.
17
Babson Capital Global Short Duration High Yield Fund 2016 Semi-Annual Report
SCHEDULE OF INVESTMENTS (CONTINUED)
June 30, 2016 (Unaudited)
| | | | | | | | | | | | | | | | | | | | |
| | | EFFECTIVE
INTEREST RATE ‡ | | | DUE DATE | | | PRINCIPAL | | | COST | | | FAIR
VALUE | |
Corporate Bonds (Continued) | | | | | | | | | | | | | | | | | | | | |
| | | | | |
Telecommunications (Continued) | | | | | | | | | | | | | | | | | | | | |
Frontier Communications# | | | 10.50 | % | | | 9/15/2022 | | | | 1,406,000 | | | | $1,406,000 | | | | $1,487,724 | |
Numericable-SFR#+^ | | | 7.38 | | | | 5/1/2026 | | | | 1,933,000 | | | | 1,933,000 | | | | 1,911,254 | |
UPC Broadband+^ | | | 6.75 | | | | 3/15/2023 | | | | 150,000 | | | | 159,028 | | | | 164,516 | |
Wind Acquisition+^ | | | 7.00 | | | | 4/23/2021 | | | | 550,000 | | | | 758,861 | | | | 595,106 | |
Wind Acquisition#+^ | | | 7.38 | | | | 4/23/2021 | | | | 4,995,000 | | | | 4,612,445 | | | | 4,757,738 | |
Ziggo+^ | | | 7.13 | | | | 5/15/2024 | | | | 2,000,000 | | | | 2,392,870 | | | | 2,447,009 | |
| | | | | | | | | | | | | | | | | | | | |
Total Telecommunications | | | | | | | | | | | 24,346,000 | | | | 24,281,332 | | | | 24,402,119 | |
| | | | | | | | | | | | | | | | | | | | |
| | | | | |
Textiles & Leather — 0.60%*: | | | | | | | | | | | | | | | | | | | | |
Perry Ellis International Inc# | | | 7.88 | | | | 4/1/2019 | | | | 2,334,000 | | | | 2,382,537 | | | | 2,334,000 | |
| | | | | | | | | | | | | | | | | | | | |
Total Textiles & Leather | | | | | | | | | | | 2,334,000 | | | | 2,382,537 | | | | 2,334,000 | |
| | | | | | | | | | | | | | | | | | | | |
Total Corporate Bonds | | | | | | | | | | | 434,403,714 | | | | 462,876,611 | | | | 434,711,916 | |
| | | | | | | | | | | | | | | | | | | | |
Total Fixed Income | | | | | | | | | | | 536,948,741 | | | | 560,642,688 | | | | 501,912,997 | |
| | | | | | | | | | | | | | | | | | | | |
| | | | | |
Other assets and liabilities — (29.07)% | | | | | | | | | | | | | | | | | | | (113,029,877 | ) |
| | | | | | | | | | | | | | | | | | | | |
| | | | | |
Net Assets — 100% | | | | | | | | | | | | | | | | | | | $388,883,120 | |
| | | | | | | | | | | | | | | | | | | | |
| ‡ | The effective interest rates are based on settled commitment amount. |
| * | Calculated as a percentage of net assets applicable to common shareholders. |
| § | Bank loans are exempt from registration under the Securities Act of 1933, as amended, but contain certain restrictions on resale and cannot be sold publicly. These loans pay interest at rates which adjust periodically. The interest rates shown for bank loans are the current interest rates at June 30, 2016. Bank loans are also subject to mandatory and/or optional prepayment which cannot be predicted. As a result, the remaining maturity may be substantially less than the stated maturity shown. |
| # | All or a portion of the security is segregated as collateral for the credit facility. See Note 8 to the financial statements for further disclosure. |
| ^ | Security exempt from registration under Rule 144a of the Securities Act of 1933. These securities may only be resold in transactions exempt from registration, normally to qualified institutional buyers. |
See accompanying Notes to Financial Statements.
18
Babson Capital Global Short Duration High Yield Fund 2016 Semi-Annual Report
SCHEDULE OF INVESTMENTS (CONTINUED)
June 30, 2016 (Unaudited)
Distributions of investments by country of risk. Percentage of assets are expressed by market value excluding cash and accrued income as of June 30, 2016.
| | | | | | |
| | United States | | | 64.7% | |
| | United Kingdom | | | 12.9% | |
| | France | | | 4.2% | |
| | Germany | | | 2.8% | |
| | Netherlands | | | 2.5% | |
| | Switzerland | | | 1.9% | |
| | Trinidad and Tobago | | | 1.5% | |
| | Canada | | | 1.3% | |
| | United Arab Emirates | | | 1.3% | |
| | Mexico | | | 1.2% | |
| | Italy | | | 1.1% | |
| | Sweden | | | 1.1% | |
| | Ghana | | | 1.0% | |
| | (Individually less than 1%) | | | 2.5% | |
| | | | | | |
| | | | | 100.0% | |
| | | | | | |
Forward Foreign Exchange Contracts at June 30, 2016 (Unaudited)
| | | | | | | | | | | | | | | | | | | | | | |
| COUNTERPARTY | | CURRENCY | | CONTRACT TYPE | | | DELIVERY DATE | | | VALUE | | | AGGREGATE FACE
VALUE | | | UNREALIZED
APPRECIATION/
(DEPRECIATION) | |
J.P. Morgan | | | | | | | | | | | | | | | | | | | | | | |
| | British pounds | | | Buy | | | | 7/15/2016 | | | $ | 1,843,810 | | | $ | 1,833,122 | | | $ | (10,688 | ) |
| | British pounds | | | Sell | | | | 7/15/2016 | | | | (78,794,121 | ) | | | (72,256,730 | ) | | | 6,537,391 | |
| | Euros | | | Buy | | | | 7/15/2016 | | | | 1,449,988 | | | | 1,413,056 | | | | (36,932 | ) |
| | Euros | | | Sell | | | | 7/15/2016 | | | | (58,304,989 | ) | | | (56,712,135 | ) | | | 1,592,854 | |
| | U.S. Dollars | | | Buy | | | | 7/15/2016 | | | | 137,099,110 | | | | 137,099,110 | | | | – | |
| | U.S. Dollars | | | Sell | | | | 7/15/2016 | | | | (3,293,798 | ) | | | (3,293,798 | ) | | | – | |
| | | | | | | | | | | | | | | | | | | | | | |
| | | | | | | | | | | | | – | | | | 8,082,625 | | | | 8,082,625 | |
| | | | | | |
Morgan Stanley | | | | | | | | | | | | | | | | | | | | | | |
| | British pounds | | | Buy | | | | 7/1/2016 | | | $ | 1,421,649 | | | $ | 1,402,816 | | | $ | (18,833 | ) |
| | British pounds | | | Buy | | | | 7/15/2016 | | | | 3,432,113 | | | | 3,318,328 | | | | (113,785 | ) |
| | British pounds | | | Sell | | | | 7/15/2016 | | | | (1,421,737 | ) | | | (1,402,966 | ) | | | 18,771 | |
| | Euros | | | Buy | | | | 7/15/2016 | | | | 55,362 | | | | 55,100 | | | | (262 | ) |
| | Euros | | | Sell | | | | 7/15/2016 | | | | (2,588,554 | ) | | | (2,543,345 | ) | | | 45,209 | |
| | Swiss francs | | | Sell | | | | 7/15/2016 | | | | (179,093 | ) | | | (175,763 | ) | | | 3,330 | |
| | U.S. Dollars | | | Buy | | | | 7/15/2016 | | | | 4,189,384 | | | | 4,189,384 | | | | – | |
| | U.S. Dollars | | | Sell | | | | 7/1/2016 | | | | (1,421,649 | ) | | | (1,421,649 | ) | | | – | |
| | U.S. Dollars | | | Sell | | | | 7/15/2016 | | | | (3,487,475 | ) | | | (3,487,475 | ) | | | – | |
| | | | | | | | | | | | | | | | | | | | | | |
| | | | | | | | | | | | | – | | | | (65,570 | ) | | | (65,570 | ) |
| | | | | | | | | | | | | | | | | | | | | | |
| | | | | | | | | | | | | – | | | | 8,017,055 | | | | 8,017,055 | |
| | | | | | | | | | | | | | | | | | | | | | |
See accompanying Notes to Financial Statements.
19
Babson Capital Global Short Duration High Yield Fund 2016 Semi-Annual Report
NOTES TO THE FINANCIAL STATEMENTS
June 30, 2016 (Unaudited)
Babson Capital Global Short Duration High Yield Fund (the “Fund”) was organized as a business trust under the laws of the Commonwealth of Massachusetts on May 20, 2011, and commenced operations on October 26, 2012. The Fund is registered under the Investment Company Act of 1940, as amended (the “1940 Act”), as a non-diversified, closed-end management investment company.
Babson Capital Management LLC (the “Adviser”), a wholly-owned indirect subsidiary of Massachusetts Mutual Life Insurance Company, is a registered investment adviser under the Investment Advisers Act of 1940, as amended, and serves as investment adviser to the Fund.
Babson Capital Global Advisors Limited (“Sub-Adviser”), an indirect wholly-owned subsidiary of the Adviser will serve as a sub-adviser with respect to the Fund’s European investments.
The Fund’s primary investment objective is to seek as high a level of current income as the Adviser determines is consistent with capital preservation. The Fund seeks capital appreciation as a secondary investment objective when consistent with its primary investment objective. There can be no assurance that the Fund will achieve its investment objectives. The Fund seeks to take advantage of inefficiencies between geographies, primarily the North American and Western European high yield bond and loan markets and within capital structures between bonds and loans. Under normal market conditions, the Fund will invest at least 80% of its Managed Assets in bonds, loans and other income-producing instruments that are, at the time of purchase, rated below investment grade (below Baa3 by Moody’s Investors Service, Inc. (“Moody’s”) or below BBB- by either Standard & Poor’s Rating Services, a division of the McGraw-Hill Company, Inc. (“S&P”) or Fitch, Inc. (“Fitch”) or unrated but judged by the Adviser or Sub-Adviser to be of comparable quality.
| 2. | Significant Accounting Policies |
The following is a summary of significant accounting policies followed consistently by the Fund in the preparation of its financial statements in conformity with accounting principles generally accepted in the United States of America (“U.S. GAAP”).
| | A. | Valuation of Investments |
The Fund’s investments in fixed income securities are generally valued using the prices provided directly by
independent third party services or provided directly from one or more broker dealers or market makers, each in accordance with the valuation policies and procedures approved by the Fund’s Board of Trustees (the “Board”).
The pricing services may use valuation models or matrix pricing, which consider yield or prices with respect to comparable bond quotations from bond dealers or by reference to other securities that are considered comparable in such characteristics as credit rating, interest rates and maturity date, to determine the current value. The closing prices of domestic or foreign securities may not reflect their market values at the time the Fund calculates its NAV if an event that materially affects the value of those securities has occurred since the closing prices were established on the domestic or foreign exchange market, but before the Fund’s NAV calculation. Under certain conditions, the Board has approved an independent pricing service to fair value foreign securities. This is generally accomplished by adjusting the closing price for movements in correlated indices, securities or derivatives. Fair value pricing may cause the value of the security on the books of the Fund to be different from the closing value on the non-U.S. exchange and may affect the calculation of the Fund’s NAV. The Fund may fair value securities in other situations, for example, when a particular foreign market is closed but the Fund is pricing their shares.
The Fund’s investments in bank loans are normally valued at the bid quotation obtained from dealers in loans by an independent pricing service in accordance with the Fund’s valuation policies and procedures approved by the Board.
A Valuation Committee, made up of officers of the Fund and employees of the Adviser, is responsible for determining, in accordance with the Funds’ valuation policies and procedures approved by the Board: (1) whether market quotations are readily available for investments held by the Fund; and (2) the fair value of investments held by the Fund for which market quotations are not readily available or are deemed not reliable by the Adviser. In certain cases, authorized pricing service vendors may not provide prices for a security held by the Fund, or the price provided by such pricing service vendor is deemed unreliable by the Adviser. In such cases, the Fund may use market maker quotations provided by an established market maker for that security (i.e. broker quotes) to value the security if the Adviser has experience obtaining quotations from the
20
Babson Capital Global Short Duration High Yield Fund 2016 Semi-Annual Report
NOTES TO THE FINANCIAL STATEMENTS (CONTINUED)
June 30, 2016 (Unaudited)
market maker and the Adviser determines that quotations obtained from the market maker in the past have generally been reliable (or, if the Adviser has no such experience with respect to a market maker, it determines based on other information available to it that quotations obtained by it from the market maker are reasonably likely to be reliable). In any such case, the Adviser will review any market quotations so obtained in light of other information in its possession for their general reliability.
Bank loans in which the Fund may invest have similar risks to lower-rated fixed income securities. Changes in the financial condition of the borrower or economic conditions or other circumstances may reduce the capacity of the borrower to make principal and interest payments on such instruments and may lead to defaults. Senior secured bank loans are supported by collateral; however the value of the collateral may be insufficient to cover the amount owed to the Fund. By relying on a third party to administer a loan, the Fund is subject to the risk that the third party will fail to perform it obligations. The loans in which the Fund will invest are largely floating rate instruments; therefore, the interest rate risk generally is lower than for fixed-rate debt obligations. However, from the perspective of the borrower, an increase in interest rates may adversely affect the borrower’s financial condition. Due to the unique and customized nature of loan agreements evidencing loans and the private syndication thereof, loans are not as easily purchased or sold as publicly traded securities. Although the range of investors in loans has broadened in recent years, there can be no assurance that future levels of supply and demand in loan trading will provide the degree of liquidity which currently exists in the market. In addition, the terms of the loans may restrict their transferability without borrower consent. These factors may have an adverse effect on the market price and the Fund’s ability to dispose of particular portfolio investments. A less liquid secondary market also may make it more difficult for the Fund to obtain precise valuations of the high yield loans in its portfolio.
Fair value is defined as the price that would be received to sell an asset or paid to transfer a liability in an orderly transaction between market participants at the measurement date. A three-tier hierarchy is utilized to maximize the use of observable market data and minimize the use of unobservable inputs and to establish classification of fair value measurements for disclosure purposes. Inputs refer broadly to the assumptions that
market participants would use in pricing the asset or liability, including assumptions about risk. For example, market participants would consider the risk inherent in a particular valuation technique used to measure fair value, such as a pricing model, and/or the risk inherent in the inputs to the valuation technique. Inputs may be observable or unobservable. Observable inputs are inputs that reflect the assumptions market participants would use in pricing the asset or liability and are developed based on market data obtained from sources independent of the reporting entity. Unobservable inputs are inputs that reflect the reporting entity’s own assumptions about the assumptions market participants would use in pricing the asset or liability and are developed based on the best information available in the circumstances. The three-tier hierarchy of inputs is summarized in the three broad levels listed below.
Level 1 – quoted prices in active markets for identical securities
Level 2 – other significant observable inputs (including quoted prices for similar securities, interest rates, prepayment speeds, credit risk, etc.)
Level 3 – significant unobservable inputs (including the Fund’s own assumptions in determining the fair value of investments)
The availability of observable inputs can vary from security to security and is affected by a wide variety of factors, including, for example, the type of security, whether the security is new and not yet established in the marketplace, the liquidity of markets, and other characteristics particular to the security. To the extent that valuation is based on models or inputs that are less observable or unobservable in the market, the determination of fair value requires more judgment. Accordingly, the degree of judgment exercised is determining fair value is greatest for instruments categorized in level 3.
The inputs used to measure fair value may fall into different levels of the fair value hierarchy. In such cases, for disclosure purposes, the level in the fair value hierarchy within which the fair value measurement falls in its entirety is determined based on the lowest level input that is significant to the fair value measurement in its entirety.
21
Babson Capital Global Short Duration High Yield Fund 2016 Semi-Annual Report
NOTES TO THE FINANCIAL STATEMENTS (CONTINUED)
June 30, 2016 (Unaudited)
The following is a summary of the inputs used as of June 30, 2016 in valuing the Fund’s investments:
| | | | | | | | | | | | | | | | |
| DESCRIPTION | | LEVEL 1 | | | LEVEL 2 | | | LEVEL 3 | | | TOTAL INVESTMENTS | |
| | | | |
Assets: | | | | | | | | | | | | | | | | |
| Fixed Income: | | | | | | | | | | | | | | | | |
Bank Loans | | $ | – | | | $ | 55,864,980 | | | $ | 11,336,101 | | | $ | 67,201,081 | |
Bonds | | | – | | | | 434,711,916 | | | | – | | | | 434,711,916 | |
| | | | | | | | �� | | | | | | | | |
| Total Fixed Income | | $ | – | | | $ | 490,576,896 | | | $ | 11,336,101 | | | $ | 501,912,997 | |
| | | | | | | | | | | | | | | | |
| Derivative Securities: | | | | | | | | | | | | | | | | |
Foreign Exchange Contracts: | | $ | – | | | $ | 8,197,555 | | | $ | – | | | $ | 8,197,555 | |
| | | | | | | | | | | | | | | | |
| Total Derivative Securities | | | – | | | | 8,197,555 | | | | – | | | | 8,197,555 | |
| | | | | | | | | | | | | | | | |
| | | | |
Total Assets | | $ | – | | | $ | 498,774,451 | | | $ | 11,336,101 | | | $ | 510,110,552 | |
| | | | | | | | | | | | | | | | |
| | | | |
Liabilities: | | | | | | | | | | | | | | | | |
Foreign Exchange Contracts | | $ | – | | | $ | 180,500 | | | $ | – | | | $ | 180,500 | |
| | | | | | | | | | | | | | | | |
| | | | |
Total Liabilities: | | $ | – | | | $ | 180,500 | | | $ | – | | | $ | 180,500 | |
| | | | | | | | | | | | | | | | |
As of the period ended June 30, 2016, certain securities were transferred from one Level (as of December 31, 2015) to another. Based on beginning of period market values as of December 31, 2015, approximately $7,735,917 was transferred to Level 3 from Level 2 as a result of infrequent trading and limited reliable market prices. Valuation has been based on management and market assumptions or expectations.
The following table is a summary of quantitative information about significant unobservable valuation inputs for Level 3 fair value measurement for investments held as of June 30, 2016.
| | | | | | | | |
| TYPE OF ASSETS | | FAIR VALUE AS OF
JUNE 30, 2016 | | | VALUATION
TECHNIQUE(S) | | UNOBSERVABLE INPUT |
| | | |
Second Lien Term Loans | | | | | | | | |
| | | |
Boomerang Tube, LLC | | $ | 670,565 | | | Model Price | | Average Enterprise Valuation Multiple: 5.5x; EBITDA: $36 million. |
| | | |
Boomerang Tube, LLC | | $ | 548,200 | | | Model Price | | Average Enterprise Valuation Multiple: 5.5x; EBITDA: $36 million. |
| | | |
Boomerang Tube, LLC | | $ | 1,458,654 | | | Model Price | | Average Enterprise Valuation Multiple: 5.5x; EBITDA: $36 million. |
| | | |
Boomerang Tube, LLC | | $ | 1,774,652 | | | Model Price | | Average Enterprise Valuation Multiple: 5.5x; EBITDA: $36 million. |
| | | |
Cunningham Lindsey Group, Inc. | | $ | 2,036,486 | | | Broker Quote | | $37.00; pricing source depth of 1. |
| | | |
MD America Energy, LLC | | $ | 141,657 | | | Broker Quote | | $93.00; pricing source depth of 1. |
| | | |
Springer | | $ | 3,226,057 | | | Broker Quote | | $113.20; pricing source depth of 1. |
| | | |
Tecomet | | $ | 1,479,830 | | | Broker Quote | | $94.00; pricing source depth of 1. |
22
Babson Capital Global Short Duration High Yield Fund 2016 Semi-Annual Report
NOTES TO THE FINANCIAL STATEMENTS (CONTINUED)
June 30, 2016 (Unaudited)
Boomerang Tube, LLC restructured its debt securities on February 2, 2016. The Fund subsequently received new debt securities, all of which are considered Level 3.
The Fund discloses transfers between levels based on valuations at the end of the reporting period. The following is a reconciliation of Level 3 investments based upon the inputs used to determine fair value:
| | | | | | | | | | | | | | | | | | | | | | | | | | | | | | | | | | | | | | | | |
| | | BALANCE
AT
12.31.15 | | | TRANSFERS
INTO
LEVEL 3 | | | TRANSFERS
OUT OF
LEVEL 3 | | | PURCHASES | | | SALES | | | ACCRETION
OF
DISCOUNT | | | REALIZED
GAIN
LOSS | | | CHANGE
IN
UNREALIZED | | | BALANCE
AT
06.30.16 | | | CHANGE IN
UNREALIZED
APPRECIATION/
DEPRECIATION
FROM
INVESTMENTS
HELD AS OF
JUNE 30,
2016 | |
| | | | | | | | |
Fixed Income | | | | | | | | | | | | | | | | | | | | | | | | | | | | | | | | | |
Bank Loan | | $ | 9,628,816 | | | $ | 7,735,917 | | | $ | (772,944 | ) | | $ | 1,443,829 | | | $ | (9,621,627 | ) | | $ | 109,494 | | | $ | (142,542 | ) | | $ | 2,955,158 | | | $ | 11,336,101 | | | $ | 2,955,158 | |
| | B. | Cash and Cash Equivalents |
Cash and cash equivalents consist principally of short term investments that are readily convertible into cash and have original maturities of three months or less. At June 30, 2016, all cash and cash equivalents are held by U.S. Bank, N.A.
| | C. | Investment Transactions, Related Investment Income and Expenses |
Investment transactions are accounted for on a trade-date basis. Interest income is recorded on the accrual basis, including the amortization of premiums and accretion of discounts on bonds held using the yield-to-maturity method.
Realized gains and losses on investment transactions and unrealized appreciation and depreciation of investments are reported for financial statement and Federal income tax purposes on the identified cost method.
Expenses are recorded on the accrual basis as incurred.
The preparation of financial statements in conformity with U.S. GAAP requires management to make estimates and assumptions that affect the reported amounts of assets and liabilities and disclosure of contingent assets and liabilities at the date of the financial statements and the reported amounts of revenues and expenses during the reporting period. Actual results could differ from those estimates.
| | E. | Federal Income Taxation |
The Fund has elected to be taxed as a Regulated Investment Company (“RIC”) under sub-chapter M of the U.S. Internal Revenue Code of 1986, as amended, and intends to maintain this qualification and to distribute substantially all of its net taxable income to its shareholders.
| | F. | Dividends and Distributions |
The Fund declares and pays dividends monthly from net investment income. To the extent that these distributions exceed net investment income, they may be classified as return of capital. The Fund also pays a distribution at least annually from its net realized capital gains, if any. Dividends and distributions are recorded on the ex-dividend date. All common shares have equal dividend and other distribution rights. A notice disclosing the source(s) of a distribution will be provided if payment is made from any source other than net investment income. Any such notice would be provided only for informational purposes in order to comply with the requirements of Section 19(a) of the 1940 Act and not for tax reporting purposes. The tax composition of the Fund’s distributions for each calendar year is reported on Internal Revenue Service Form 1099-DIV.
Dividends from net investment income and distributions from realized gains from investment transactions have been determined in accordance with Federal income tax regulations and may differ from net investment income and realized gains recorded by the Fund for financial reporting purposes. These differences, which could be temporary or permanent in nature may result in
23
Babson Capital Global Short Duration High Yield Fund 2016 Semi-Annual Report
NOTES TO THE FINANCIAL STATEMENTS (CONTINUED)
June 30, 2016 (Unaudited)
reclassification of distributions; however, net investment income, net realized gains and losses, and net assets are not affected.
The following is a description of the derivative instruments that the Fund utilizes as part of its investment strategy, including the primary underlying risk exposures related to the instrument.
Forward Foreign Exchange Contracts – The Fund is subject to foreign currency exchange rate risk in the normal course of pursuing its investment objectives. The Fund transacted in and currently holds forward foreign exchange contracts to hedge against changes in the value of foreign currencies. The Fund entered into forward foreign exchange contracts obligating the Fund to deliver or receive a currency at a specified future date. Forward foreign exchange contracts are valued daily and unrealized appreciation or depreciation is recorded daily as the difference between the contract exchange rate and the closing forward rate applied to the face amount of the contract. A realized gain or loss is recorded at the time the forward contract expires. Credit risk may arise as a result of the failure of the counterparty to comply with the terms of the contract. The Fund considers the creditworthiness of each counterparty to a contract in evaluating potential credit risk quarterly. The Fund is also subject to credit risk with respect to the counterparties to the derivative contracts which are not cleared through a central counterparty but instead are traded over-the-counter between two counterparties. If a counterparty to an over-the-counter derivative becomes bankrupt or otherwise fails to perform its obligations under a derivative contract due to financial difficulties, the Fund may experience significant delays in obtaining any recovery under the derivative contract in a bankruptcy or other reorganization proceeding. The Fund may obtain only a limited recovery or may obtain no recovery in such circumstances. The counterparty risk for cleared derivatives is generally lower than for uncleared over-the-counter derivative transactions since generally a clearing organization becomes substituted for each counterparty to a cleared derivative contract and, in effect, guarantees the parties’ performance under the contract as each party to a trade looks only to the clearing house for performance of financial obligations. However, there can be no assurance that the clearing house, or its members, will satisfy its obligations to the Fund. In addition, in the event of a bankruptcy of a
clearing house, the Fund could experience a loss of the funds deposited with such clearing house as margin and of any profits on its open positions. The counter party risk to the Fund is limited to the net unrealized gain, in any, on the contract.
The use of forward foreign exchange contracts does not eliminate fluctuations in the underlying prices of the Fund’s investment securities; however, it does establish a rate of exchange that can be achieved in the future. The use of forward foreign exchange contracts involves the risk that anticipated currency movements will not be accurately predicted. A forward foreign exchange contract would limit the risk of loss due to a decline in the value of a particular currency; however it would also limit any potential gain that might result should the value of the currency increase instead of decrease. These contracts may involve market risk in excess of the amount of receivable or payable reflected on the Statement of Assets and Liabilities.
The Fund recognized an asset on the Statement of Assets and Liabilities as a result of forward foreign exchange contracts with Morgan Stanley and J.P. Morgan. The Fund’s policy is to recognize an asset equal to the net value of all forward foreign exchange contracts with an unrealized gain and a liability equal to the net value of all forward foreign exchange contracts with an unrealized loss. The Fund has recognized an asset of $8,197,555 in net unrealized appreciation and a liability of $180,500 in net unrealized depreciation on forward foreign exchange contracts. Outstanding forward foreign exchange contracts as of June 30, 2016 are indicative of the volume of activity during the period.
For the period from January 1, 2016 through June 30, 2016, the Fund’s direct investment in derivatives consisted of forward foreign exchange contracts.
The following is a summary of the fair value of derivative instruments held directly by the Fund as of June 30, 2016. These derivatives are presented in the Schedule of Investments.
24
Babson Capital Global Short Duration High Yield Fund 2016 Semi-Annual Report
NOTES TO THE FINANCIAL STATEMENTS (CONTINUED)
June 30, 2016 (Unaudited)
Fair values of derivative instruments on the Statement of Assets and Liabilities as of June 30, 2016:
| | | | | | | | |
| | | STATEMENT OF ASSETS
AND LIABILITIES
LOCATION | | | FAIR
VALUE | |
Derivatives | | | | | | | | |
Forward Foreign Exchange Contracts | |
| Unrealized
Appreciation |
| | $ | 8,197,555 | |
| | | | | | | | |
Total Asset Derivatives | | | $ | 8,197,555 | |
| | | | | | | | |
Liability Derivatives | | | | | | | | |
Forward Foreign Exchange Contracts | |
| Unrealized
Depreciation |
| | $ | 180,500 | |
| | | | | | | | |
Total Liability Derivatives | | | $ | 180,500 | |
| | | | | | | | |
The effect of derivative instruments on the Statement of Operations for the period from January 1, 2016 through June 30, 2016:
Amount of Realized Gain/(Loss) on Derivatives
| | | | |
| | | FORWARD FOREIGN
EXCHANGE CONTRACTS | |
Derivatives | | | | |
Forward Foreign Exchange Contracts | | $ | 633,846 | |
| | | | |
Total | | $ | 633,846 | |
| | | | |
Change in Unrealized Appreciation/(Depreciation) on Derivatives
| | | | |
| | | FORWARD FOREIGN
EXCHANGE CONTRACTS | |
Derivatives | | | | |
Forward Foreign Exchange Contracts | | $ | 6,452,158 | |
| | | | |
Total | | $ | 6,452,158 | |
| | | | |
| | H. | Offsetting of Financial and Derivative Assets and Liabilities |
The following is a summary by counterparty of the fair value of derivative investments subject to Master Netting Agreements and collateral pledged (received), if any, as of June 30, 2016.
| | | | | | | | |
| | | J.P. MORGAN | | | MORGAN
STANLEY | |
Assets: | | | | | | | | |
Forward foreign exchange contracts | | $ | 8,130,245 | | | $ | 67,310 | |
| | | | | | | | |
Total Assets | | $ | 8,130,245 | | | $ | 67,310 | |
| | | | | | | | |
Liabilities: | | | | | | | | |
Forward foreign exchange contracts | | $ | 47,620 | | | $ | 132,880 | |
| | | | | | | | |
Total Liabilities | | $ | 47,620 | | | $ | 132,880 | |
| | | | | | | | |
Net Exposure | | $ | 8,082,625 | | | $ | (65,570 | ) |
| | | | | | | | |
Investing in securities of foreign companies and foreign governments involves special risks and considerations not typically associated with investing in U.S. companies and the U.S. government. These risks include valuation of currencies and adverse political and economic developments. Moreover, securities of many foreign companies, foreign governments, and their markets may be less liquid and their prices more volatile than those of securities of comparable U.S. companies and the U.S. government.
| | J. | Foreign Currency Translation |
The books and records of the Fund are maintained in U.S. dollars. Foreign currency transactions are translated into U.S. dollars on the following basis: (i) market value of investment securities, assets and liabilities at the daily rates of exchange, and (ii) purchases and sales of investment securities, dividend and interest income and certain expenses at the rates of exchange prevailing on the respective dates of such transactions. For financial reporting purposes, the Fund does not isolate changes in the exchange rate of investment securities from the fluctuations arising from changes in the market prices of securities. However, for Federal income tax purposes, the Fund does isolate and treat as ordinary income the effect of changes in foreign exchange rates on realized gain or loss from the sale of investment securities and payables and receivables arising from trade-date and settlement-date differences.
The Fund helps manage counterparty credit risk by entering into agreements only with counterparties the Adviser believes have the financial resources to honor
25
Babson Capital Global Short Duration High Yield Fund 2016 Semi-Annual Report
NOTES TO THE FINANCIAL STATEMENTS (CONTINUED)
June 30, 2016 (Unaudited)
their obligations. The Adviser monitors the financial stability of the Fund’s counterparties.
The Fund has entered into an Investment Management Agreement (the “Agreement”) with the Adviser, a related party. Pursuant to the Agreement, the Fund has agreed to pay the Adviser a fee payable at the end of each calendar month, at an annual rate of 1.00% of the Fund’s average daily managed assets during such month. Managed assets are the total assets of the Fund, which include any assets attributable to leverage such as assets attributable to reverse repurchase agreements, or bank loans, minus the sum of the Fund’s accrued liabilities (other than liabilities incurred for the purpose of leverage).
Babson Capital has contractually waived a portion of its management and other fees equal to an annual rate of 0.275% of the Fund’s managed assets for a period of one year commencing on January 1, 2016. Such waived fees are not subject to recoupment from the Fund. Babson Capital may not discontinue this waiver prior to December 31, 2016 without the approval of the Fund’s Board of Trustees.
Subject to the supervision of the Adviser and the Board, the Sub-Adviser manages the investment and reinvestment of a portion of the assets of the Fund, as allocated from time to time to the Sub-Adviser by a global allocation investment committee composed of representatives of the Adviser and Sub-Adviser. The Adviser (not the Fund) will pay a portion of the fees it receives to the Sub-Adviser in return for its services.
The Fund has engaged U.S. Bancorp Fund Services, LLC (“US Bank”) to serve as the Fund’s administrator, fund accountant, and transfer agent. The Fund has engaged U.S. Bank, N.A. to serve as the Fund’s custodian. From January 1, 2015 through October 24, 2015, the Fund agreed to pay US Bank a fee payable at the end of each calendar month, at an annual rate of 0.30% of the Fund’s average daily managed assets. Beginning October 25, 2015, the Fund has agreed to pay US Bank a fee payable at the end of each calendar month, at an annual rate of 0.075% of the Fund’s average daily managed assets.
It is the Fund’s intention to qualify as a RIC under sub-chapter M of the Internal Revenue Code and distribute all
of its taxable income. Accordingly, no provision for federal income taxes is required in the financial statements.
The tax character of dividends paid to shareholders during the tax year ended in 2015, as noted below, was as follows:
| | | | | | | | |
| ORDINARY INCOME | | NET LONG TERM
CAPITAL GAINS | | | TOTAL
DISTRIBUTIONS
PAID | |
$44,022,967 | | $ | – | | | $ | 44,022,967 | |
The amount and character of income and capital gain distributions to be paid, if any, are determined in accordance with federal income tax regulations, which may differ from U.S. GAAP. On December 31, 2015, undistributed net investment income was increased $1,152,011 and accumulated net realized gain was decreased $1,152,011. This reclassification has no effect on the net assets of the Fund.
The following information is provided on a tax basis as of December 31, 2015:
| | | | |
Cost of investments | | $ | 570,323,681 | |
| | | | |
Unrealized appreciation | | | 2,703,752 | |
Unrealized depreciation | | | (98,329,137 | ) |
| | | | |
Net unrealized appreciation (depreciation) | | | (95,625,385 | ) |
Undistributed ordinary income | | | – | |
Undistributed long term gains | | | – | |
| | | | |
Distributable earnings | | | – | |
Other accumulated gain/(loss) | | | (11,821,352 | ) |
| | | | |
Total accumulated gain/(loss) | | | (107,446,737 | ) |
| | | | |
The capital loss carryforward is available to offset future taxable income. The Fund has the following capital loss amounts:
| | | | | | | | |
FISCAL YEAR ENDED CAPITAL
LOSS | | AMOUNT | | | EXPIRATION | |
December 31, 2014 | | $ | 2,702,651 | | | | Unlimited | |
December 31, 2015 | | | 9,635,805 | | | | Unlimited | |
| | | | | | | | |
Total | | $ | 12,338,456 | | | | | |
The Fund recognizes the tax benefits of uncertain tax positions only where the position is “more likely than not” to be sustained assuming examination by tax authorities. Management has analyzed the Fund’s tax positions, and
26
Babson Capital Global Short Duration High Yield Fund 2016 Semi-Annual Report
NOTES TO THE FINANCIAL STATEMENTS (CONTINUED)
June 30, 2016 (Unaudited)
has concluded that no liability for unrecognized tax benefits should be recorded related to uncertain tax positions taken on U.S. tax returns and state tax returns filed since inception of the Fund. No income tax returns are currently under examination. All tax years since commencement of operations remain subject to examination by the tax authorities in the United States. Due to the nature of the Fund’s investments, the Fund may be required to file income tax returns in several states. The Fund is not aware of any tax positions for which it is reasonably possible that the total amounts of unrecognized tax benefits will change materially in the next 12 months.
At December 31, 2015, the Fund deferred, on a tax basis, late-year December losses of $2,125,852.
| 6. | Investment Transactions |
For the period from January 1, 2016 through June 30, 2016, the Fund purchased (at cost) and sold securities in the amount of $113,448,816 and $97,331,861 (excluding short term debt securities), respectively.
On November 8, 2012, the Fund entered into a $200,000,000 credit facility with BNP Paribas Prime Brokerage International, Ltd. The credit facility previously had a variable annual interest rate equal to three-month LIBOR plus 0.90 percent. On January 6, 2014 the Fund entered an amended agreement with a variable annual interest rate of three-month LIBOR plus .80 percent. Unused portions of the credit facility will accrue a commitment fee equal to an annual rate of 0.65 percent.
Changes to the credit facility’s capacity for the period from January 1, 2016 through June 30, 2016 were as follows:
| | | | | | | | |
| DATE OF CHANGE | | PREVIOUS CAPACITY | | | NEW CAPACITY | |
Capacity at January 1, 2016: | | | | | | $ | 133,500,000 | |
January 6, 2016 | | $ | 133,500,000 | | | $ | 123,500,000 | |
January 20, 2016 | | $ | 123,500,000 | | | $ | 118,500,000 | |
March 21, 2016 | | $ | 118,500,000 | | | $ | 120,500,000 | |
April 29, 2016 | | $ | 120,500,000 | | | $ | 127,200,000 | |
May 19, 2016 | | $ | 127,200,000 | | | $ | 129,400,000 | |
June 14, 2016 | | $ | 129,400,000 | | | $ | 130,800,000 | |
Capacity at June 30, 2016: | | | | | | $ | 130,800,000 | |
The average principal balance and interest rate for the period during which the credit facility was utilized for the period from January 1, 2016 through June 30, 2016 was approximately $123,400,000 and 1.43 percent, respectively. At June 30, 2016, the principal balance outstanding was $130,800,000 at an interest rate of 1.45 percent.
Through an agreement with the Fund, BNP may lend out securities the Fund has pledged as collateral on the note payable. In return, the Fund receives additional income that is netted against the interest charged on the outstanding credit facility balance. For the period from January 1, 2016 through June 30, 2016, the total amount of income netted against the interest expense is $77,560.
The Fund has unlimited shares authorized and 20,057,849 shares outstanding at December 31, 2015 and June 30, 2016.
| 10. | Aggregate Remuneration Paid to Officers, Trustees and Their Affiliated Persons |
For the period from January 1, 2016 through June 30, 2016, the Fund paid its Trustees aggregate remuneration of $60,803. During the year, the Fund did not pay any compensation to any of its Trustees who are “interested persons” (as defined by the 1940 Act) of the Fund. The Fund classifies Mr. Finke as an interested person of the Fund.
All of the Fund’s officers are employees of the Adviser. Pursuant to the Agreement the Fund does not compensate its officers who are employees of the Adviser (except for the Chief Compliance Officer of the Fund unless assumed by the Adviser). For the period from January 1, 2016 through June 30, 2016, the Adviser paid the compensation of the Chief Compliance Officer of the Fund.
The Fund did not make any payments to the Adviser for the year ended December 31, 2015, other than the amounts payable to the Adviser pursuant to the Agreement.
The Fund has evaluated the possibility of subsequent events existing in this report through the date that the financial statements were issued. On July 1, 2016, the
27
Babson Capital Global Short Duration High Yield Fund 2016 Semi-Annual Report
NOTES TO THE FINANCIAL STATEMENTS (CONTINUED)
June 30, 2016 (Unaudited)
dividend payable of $3,076,874 was paid to common shareholders. The dividend amount consisted of net investment income.
In addition, as of June 30, 2016, the borrowing capacity on the current note payable was $130,800,000. On July 15, 2016, the note was withdrawn upon and borrowing capacity was increased to $132,800,000.
In addition, on July 18, 2016, Deloitte & Touche was selected as the Fund’s independent registered public accounting firm. The Fund’s selection of Deloitte & Touche as its independent registered public accounting firm was recommended by the Fund’s audit committee and was approved by the Board.
KPMG was the independent registered public accounting firm for the Fund. The reports of the financial statements audited by KPMG for the Fund each year in the four-year period ended December 31, 2015 did not contain an adverse opinion or disclaimer of opinion, and were not qualified or modified as to uncertainty, audit scope or accounting principles. There were no disagreements between the Fund and KPMG on any matters of accounting principles or practices, financial statement disclosure, or auditing score or procedures, which disagreements, if not resolved to the satisfaction of KPMG would have caused it to make reference to the subject matter of the disagreements in connection with its reports on the financial statements in such years.
28
Babson Capital Global Short Duration High Yield Fund 2016 Semi-Annual Report
FUND DIVIDEND REINVESTMENT PLAN
INDEPENDENT TRUSTEES
Rodney J. Dillman
Chairman, Trustee
Dr. Bernard A. Harris, Jr.
Trustee
Thomas W. Okel
Trustee
Martin A. Sumichrast
Trustee
Thomas W. Bunn
Trustee
OFFICERS
Russell Morrison
President
Carlene Pollock
Chief Financial Officer
Andrew Lennon
Treasurer
Michael Freno
Vice President
Sean Feeley
Vice President
Scott Roth
Vice President
Melissa LaGrant
Chief Compliance Officer
Janice Bishop
Secretary/Chief Legal Officer
Michele Manha
Assistant Secretary
The Fund offers a Dividend Reinvestment Plan (the “Plan”). The Plan provides a simple way for shareholders to add to their holdings in the Fund through the reinvestment of dividends in additional common shares of the Fund. Shareholders will have all dividends, including any capital gain dividends, reinvested automatically in additional shares of the Fund by U.S. Bancorp Fund Services, LLC, as Plan Agent, unless a shareholder elects to receive cash instead. An election to receive cash may be revoked or reinstated at the option of the shareholder. All distributions to investors who elect not to participate in the Plan (or whose broker or nominee elects not to participate on the investor’s behalf) will receive dividends and distributions in cash.
Whenever the Fund declares a dividend payable in cash or shares, the Plan Agent, acting on behalf of each participating shareholder, will take the dividend in shares only if the net asset value per Fund share is equal to or less than the market price per Fund share plus estimated brokerage commissions as of the payment date for the dividend.
When the dividend is to be taken in shares, the number of shares to be received is determined by dividing the dollar amount of the cash dividend by the net asset value per Fund share as of the dividend payment date or, if greater than the net asset value per Fund share, 95% of the closing share price on the payment date. Generally, if the net asset value per Fund share is greater than the market price per Fund share plus estimated brokerage commissions as of the dividend payment date, the Plan Agent will endeavor to buy shares on the open market at current prices promptly after the dividend payment date.
The reinvestment of dividends does not, in any way, relieve participating shareholders of any Federal, state or local tax. For Federal income tax purposes, the amount reportable in respect of a dividend received in shares of the Fund will be the fair market value of the shares received, which will be reportable as ordinary income and/or capital gains. Investors should consult with their own tax advisors for further information about the tax consequences of dividend reinvestment.
There is no brokerage charge for the reinvestment of dividends in additional Fund shares; however, all participants pay a pro rata share of brokerage commissions incurred by the Plan Agent when it makes open market purchases. There is no direct service charge to participants in the Plan, though the Fund reserves the right to amend the Plan to include a service charge payable by participants.
Additional information about the Plan may be obtained from, and any questions regarding the Plan should be addressed to, U.S. Bancorp Fund Services, Plan Agent for Babson Capital Global Short Duration High Yield Fund’s Dividend Reinvestment Plan, P.O. Box 701, Milwaukee, WI 52301.
29
Babson Capital Global Short Duration High Yield Fund 2016 Semi-Annual Report

THIS PRIVACY NOTICE IS BEING PROVIDED ON BEHALF OF BABSON CAPITAL MANAGEMENT LLC AND ITS AFFILIATES;
BABSON CAPITAL SECURITIES LLC;
BABSON CAPITAL MANAGEMENT (AUSTRALIA) PTY LTD.
BABSON CAPITAL MANAGEMENT (JAPAN) KK;
BABSON CAPITAL CORNERSTONE ASIA LIMITED;
BABSON CAPITAL FUNDS TRUST;
BABSON CAPITAL GLOBAL SHORT DURATION HIGH YIELD FUND;
BABSON CAPITAL CORPORATE INVESTORS AND BABSON CAPITAL PARTICIPATION INVESTORS (TOGETHER, FOR PURPOSES OF THIS PRIVACY NOTICE, “BABSON CAPITAL”).
When you use Babson Capital you entrust us not only with your hard-earned assets but also with your personal and financial data. We consider your data to be private and confidential, and protecting its confidentiality is important to us. Our policies and procedures regarding your personal information are summarized below.
We may collect non-public personal information about you from:
| | n | | Applications or other forms, interviews, or by other means; |
| | n | | Consumer or other reporting agencies, government agencies, employers or others; |
| | n | | Your transactions with us, our affiliates, or others; and |
We may share the financial information we collect with our financial service affiliates, such as insurance companies, investment companies and securities broker-dealers. Additionally, so that we may continue to offer you products and services that best meet your investment needs and to effect transactions that you request or authorize, we may disclose the information we collect, as described above, to companies that perform administrative or marketing services on our behalf, such as transfer agents, custodian banks, service providers or printers and mailers that assist us in the distribution of investor materials or that provide operational support to Babson Capital. These companies are required to protect this information and will use this information only for the services for which we hire them, and are not permitted to use or share this information for any other purpose. Some of these companies may perform such services in jurisdictions other than the United States. We may share some or all of the information we collect with other financial institutions with whom we jointly market products. This may be done only if it is permitted by the state in which you live. Some disclosures may be limited to your name, contact and transaction information with us or our affiliates.
Any disclosures will be only to the extent permitted by federal and state law. Certain disclosures may require us to get an “opt-in” or “opt-out” from you. If this is required, we will do so before information is shared. Otherwise, we do not share any personal information about our customers or former customers unless authorized by the customer or as permitted by law.
We restrict access to personal information about you to those employees who need to know that information to provide products and services to you. We maintain physical, electronic and procedural safeguards that comply with legal standards to guard your personal information. As an added measure, we do not include personal or account information in non-secure e-mails that we send you via the Internet without your prior consent. We advise you not to send such information to us in non-secure e-mails.
This joint notice describes the privacy policies of Babson Capital, the Funds and Babson Capital Securities LLC. It applies to all Babson Capital and the Funds accounts you presently have, or may open in the future, using your social security number or federal taxpayer identification number – whether or not you remain a shareholder of our Funds or as an advisory client of Babson Capital. As mandated by rules issued by the Securities and Exchange Commission, we will be sending you this notice annually, as long as you own shares in the Funds or have an account with Babson Capital.
Babson Capital Securities LLC is a member of the Financial Industry Regulatory Authority (FINRA) and the Securities Investor Protection Corporation (SIPC). Investors may obtain information about SIPC including the SIPC brochure by contacting SIPC online at www.sipc.org or calling (202)-371-8300. Investors may obtain information about FINRA including the FINRA Investor Brochure by contacting FINRA online at www.finra.org or by calling (800) 289-9999.
May 2016
30
 Babson Capital Global Short Duration High Yield Fund
Item 2. Code of Ethics.
Not applicable for semi-annual filing.
Item 3. Audit Committee Financial Expert.
Not applicable for semi-annual filing.
Item 4. Principal Accountant Fees and Services.
Not applicable for semi-annual filing.
Item 5. Audit Committee of Listed Registrants.
Not applicable for semi-annual filing.
Item 6. Investments.
| (a) | Schedule of Investments is included as part of the report to shareholders filed under Item 1 of this Form. |
Item 7. Disclosure of Proxy Voting Policies and Procedures for Closed-End Management Investment Companies.
Not applicable for semi-annual filing.
Item 8. Portfolio Managers of Closed-End Management Investment Companies.
Not applicable for semi-annual filing.
Item 9. Purchases of Equity Securities by Closed-End Management Investment Company and Affiliated Purchasers.
Not applicable.
Item 10. Submission of Matters to a Vote of Security Holders.
Not applicable.
Item 11. Controls and Procedures.
| (a) | The Registrant’s President and Chief Financial Officer have reviewed the Registrant’s disclosure controls and procedures (as defined in Rule 30a-3(c) under the Investment Company Act of 1940 (the “Act”)) as of a date within 90 days of the filing of this report, as required by Rule 30a-3(b) under the Act and Rules 13a-15(b) or 15d-15(b) under the Securities Exchange Act of 1934. |
| | Based on their review, such officers have concluded that the disclosure controls and procedures are effective in ensuring that information required to be disclosed in this report is appropriately recorded, processed, summarized and reported and made known to them by others within the Registrant and by the Registrant’s service provider. |
| (b) | There were no changes in the Registrant’s internal control over financial reporting (as defined in Rule 30a-3(d) under the Act) that occurred during the second fiscal quarter of the period covered by this report that has materially affected, or is reasonably likely to materially affect, the Registrant’s internal control over financial reporting. |
Item 12. Exhibits.
| | (a) | (1) ANY CODE OF ETHICS, OR AMENDMENTS THERETO, THAT IS THE SUBJECT OF DISCLOSURE REQUIRED BY ITEM 2, TO THE EXTENT THAT THE REGISTRANT INTENDS TO SATISFY THE ITEM 2 REQUIREMENTS THROUGH THE FILING OF AN EXHIBIT. |
The Registrant has posted its Code of Ethics on its website at www.babsoncapital.com/bgh.
Not applicable for this filing.
| | (a) | (2) A SEPARATE CERTIFICATION FOR EACH PRINCIPAL EXECUTIVE OFFICER AND PRINCIPAL FINANCIAL OFFICER OF THE REGISTRANT AS REQUIRED BY RULE 30a-2 UNDER THE ACT. |
Filed herewith for President.
Filed herewith for Chief Financial Officer.
| | (a) | (3) ANY WRITTEN SOLICITATION TO PURCHASE SECURITIES UNDER RULE 23c-1 UNDER THE ACT (17 CFR 270.23c-1) SENT OR GIVEN DURING THE PERIOD COVERED BY THE REPORT BY OR ON BEHALF OF THE REGISTRANT TO 10 OR MORE PERSONS. |
Not applicable for this filing.
| | (b) | CERTIFICATIONS PURSUANT TO RULE 30a-2(b) UNDER THE ACT. |
Filed herewith.
Pursuant to the requirements of the Securities Exchange Act of 1934 and the Investment Company Act of 1940, the registrant has duly caused this report to be signed on its behalf by the undersigned, thereunto duly authorized.
| | | | |
(Registrant) Babson Capital Global Short Duration High Yield Fund |
| | |
By (Signature and Title) | | /s/ Russell D. Morrison, President | | |
| | Russell D. Morrison, President | | |
Pursuant to the requirements of the Securities Exchange Act of 1934 and the Investment Company Act of 1940, this report has been signed below by the following persons on behalf of the registrant and in the capacities and on the dates indicated.
| | | | |
| By (Signature and Title) | | /s/ Russell D. Morrison, President | | |
| | Russell D. Morrison, President | | |
| | | | |
| | |
| By (Signature and Title) | | /s/ Carlene Pollock, Chief Financial Officer | | |
| | Carlene Pollock, Chief Financial Officer | | |