| | Barings Global Short Duration High Yield Fund 2019 Semi-Annual Report |
Sean Feeley
President Carlene Pollock
Chief Financial Officer Lesley Mastandrea
Treasurer Michael Freno
Vice President Scott Roth
Vice President Melissa LaGrant
Chief Compliance Officer Janice Bishop
Secretary/Chief Legal Officer Michele Manha
Assistant Secretary Jill Dinerman
Assistant Secretary | | Barings Global Short Duration High Yield Fund is a closed-end investment company, first offered to the public in 2012, whose shares are traded on the New York Stock Exchange. INVESTMENT OBJECTIVE & POLICY Barings Global Short Duration High Yield Fund (the “Fund”) was organized as a business trust under the laws of the Commonwealth of Massachusetts. The Fund is registered under the Investment Company Act of 1940, as amended, as a diversified, closed-end management investment company with its own investment objective. The Fund’s common shares are listed on the New York Stock Exchange under the symbol “BGH”. The Fund’s primary investment objective is to seek as high a level of current income as the Adviser (as defined herein) determines is consistent with capital preservation. The Fund seeks capital appreciation as a secondary investment objective when consistent with its primary investment objective. There can be no assurance that the Fund will achieve its investment objectives. The Fund seeks to take advantage of inefficiencies between geographies, primarily the North American and Western European high yield bond and loan markets and within capital structures between bonds and loans. For example, the Fund seeks to take advantage of differences in pricing between bonds and loans of an issuer denominated in U.S. dollars and substantially similar bonds and loans of the same issuer denominated in Euros, potentially allowing the Fund to achieve a higher relative return for the same credit risk exposure. |
1
| Barings Global Short Duration High Yield Fund 2019 Semi-Annual Report (Unaudited) | |
Dear Fellow Shareholders,
We are pleased to provide you with the 2019 Semi-Annual Report for the Barings Global Short Duration High Yield Fund (the “Fund”) to recap portfolio performance and positioning. We continue to believe our Global High Yield Investments Group is one of the largest teams in the market primarily focused on North American and Western European credits. Utilizing the Group’s expertise, deep resources, and time-tested process, we continue to believe we can provide investors an attractive level of current income by uncovering compelling opportunities across the global high yield market.
The Fund’s strategy focuses primarily on North American and Western European high yield companies, with the flexibility to dynamically shift the geographical weighting in order to capture, in our opinion, the best risk-adjusted investment opportunities. In addition, the strategy also focuses closely on limiting the duration of the Fund while maintaining what we consider a reasonable amount of leverage.
Market Review
The first half of 2019 saw a period of strong positive returns in the global yield bond market. While geopolitical headlines have caused brief periods of instability, the continued dovish sentiment from central banks, low inflationary environment, and stable corporate fundamentals has helped drive an unprecedented rebound from the softness in the fourth quarter of 2018. High yield bond default rates have remained range bound as recent earnings performance has displayed stable balance sheet trends and moderate leverage profiles.
Demand for U.S. high yield bonds remained robust amid the ongoing hunt for yield in a low interest rate environment during the first half of 2019. Investors became more cautious, however, as evidenced by the continued outperformance of double-Bs, which substantially outperformed lower-rated securities year-to-date. Returns were positive across industries led by the Retail sector which saw mid-double-digit gains, followed by the Services and Consumer Goods sectors. While still generating a strong positive return, the Transportation and Energy sectors saw more modest performance. U.S. high yield bond retail mutual funds recorded net inflows in the first half of the year totaling $12.0 billion compared to -$24.5 billion during the corresponding period in 2018. Gross U.S. high yield new issuance remained active as borrowers took advantage of an attractive lower rate backdrop. Specifically, $132.3 billion priced in the first six months of the year while issuance net of refinancing totaled $43.0 billion. The par-weighted U.S. high yield default rate has decreased since year-end 2018, ending June at 1.46% and remaining below historical averages.
The European high yield bond market also saw strong positive returns in the first half of 2019. During the period, all industry sectors were up, led by the Media and Real Estate sectors. While still generating a strong positive return, the Healthcare and Transportation sectors saw more modest performance. Triple-Cs outperformed the broader market, followed by double-Bs and single-Bs. European high yield bond funds reported net inflows of €4.1 billion year-to-date though still down €5.1 billion since the start of 2018. Gross European high yield new issuances rebounded in the second quarter, while remaining predominantly refinancing related. Year-to-date gross new issuance totaled €29.7 billion across 61 new bonds. Activity net of refinancing totaled €11.0 billion. The par-weighted European high yield bond default rate ended the period at 1.8%.
Barings Global Short Duration High Yield Fund Overview and Performance
The Fund ended June 2019 with a portfolio of 130 issuers, which is down from 157 issuers at the beginning of the year. A majority of the issuers are domiciled in the U.S. (71.7%), with the U.K. (11.9%) and Canada (4.1%) representing the next largest country exposures – see Country Composition chart. From a geographic standpoint, exposure to North American issuers was relatively in-line with year-end 2018. European issuers saw the largest increase in Fund exposure while issuers categorized as Rest of World were down. The Fund primary exposure continues to be in the U.S. market, where the fundamental and technical picture created a better backdrop for high yield issuers during the first half of the year.
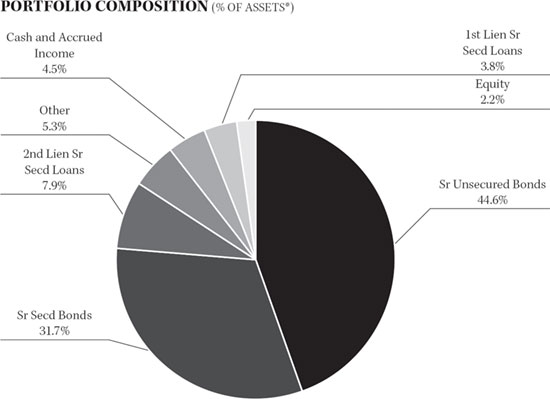
As of June 30, 2019, the Fund remained well-positioned across the credit quality spectrum: 15.4% BB-rated and above, 60.2% B-rated, and 17.2% CCC-rated and below, with approximately 49% of the portfolio consisting of secured obligations. The credit quality of the Fund’s underlying holdings changed modestly since the beginning of the year with an increase in BB-rated and above credits as well as B-rated credits, with a modest reduction in CCC-rated and below credits. Non-publicly rated securities and cash and accrued interest represented 2.7% and 4.5%, respectively.
2
| | Barings Global Short Duration High Yield Fund 2019 Semi-Annual Report (Unaudited) |
The Fund paid six consecutive monthly dividend payments of $0.1482 per share in the first half of 2019, which we believe is still an attractive level of yield for a global short duration high yield bond fund. The Fund’s share price and net asset value (“NAV”) ended the reporting period at $17.68 and $18.57, respectively, or at a 4.79% discount to NAV. Based on the Fund’s share price and NAV on June 30, 2019, the Fund’s market price and NAV distribution rates using the most recent monthly dividend, on an annualized basis were 10.06% and 9.58%, respectively. Assets acquired through leverage, which represented 29.1% of the Fund’s total assets at the end of June, were accretive to net investment income and benefited shareholders.
On a year-to-date basis through June 30, 2019, the NAV total return was +6.50%, underperforming the global high yield bond market as measured by the Bank of America / Merrill Lynch Non-Financial Developed Markets High Yield Constrained Index (HNDC), which returned +9.87%. From a market value perspective, the total return year-to-date through June 30, 2019 was +16.40%.
In August, 2019, in order to provide greater flexibility, the Fund’s Board of Directors approved the removal of the Fund’s non-fundamental investment restriction limiting investment in securities rated triple-C and below. The Fund’s Board of Directors also approved the removal of the Fund’s non-fundamental investment restriction on maintaining a portfolio with a weighted average maturity of five years or less; however, the Fund will continue to maintain a weighted average portfolio duration, including the effects of leverage, of three years or less.
Market Outlook
In our view, corporate fundamentals for high yield borrowers overall remain relatively healthy. We are seeing stable growth in the high yield market and believe that most companies have capital structures in place that are well positioned to absorb a potential slowdown. As will always be the case, there continue to be individual companies or segments of the market that face headwinds. Having said that, the overall market does not appear to expect that there will be a material increase in corporate defaults in the near-term and we believe that the recent volatility and spread levels are compensating investors for a higher level of defaults than what corporate fundamentals suggest to us is likely. Additionally, while commentary and action by central banks can influence investor sentiment, we believe that the central banks may continue to be willing to take steps to support growth, which can be supportive for high yield borrowers and investors.
At Barings, we remain committed to focusing on corporate fundamentals as market sentiment can change quickly and unexpectedly. Our focused and disciplined approach emphasizes our fundamental bottom-up research with the goal of preserving investor capital while seeking to capture attractive capital appreciation opportunities that may exist through market and economic cycles. On behalf of the Barings team, we continue to take a long-term view of investing and look forward to helping you achieve your investment goals.
| Sincerely, | |
 | |
| Sean Feeley | |
| 1. | Ratings are based on Moody’s, S&P and Fitch. If securities are rated differently by the rating agencies, the higher rating is applied and all ratings are converted to the equivalent Moody’s major rating category for purposes of the category shown. Credit ratings are based largely on the rating agency’s investment analysis at the time of rating and the rating assigned to any particular security is not necessarily a reflection of the issuer’s current financial condition. The rating assigned to a security by a rating agency does not necessarily reflect its assessment of the volatility of the security’s market value or of the liquidity of an investment in the security. Ratings of Baa3 or higher by Moody’s and BBB- or higher by S&P and Fitch are considered to be investment grade quality. |
| 2. | Past performance is not necessarily indicative of future results. Current performance may be lower or higher. All performance is net of fees, which is inclusive of advisory fees, administrator fees and interest expenses. |
3
| Barings Global Short Duration High Yield Fund 2019 Semi-Annual Report (Unaudited) | |
PORTFOLIO COMPOSITION (% OF ASSETS*)
COUNTRY COMPOSITION (% OF ASSETS*)
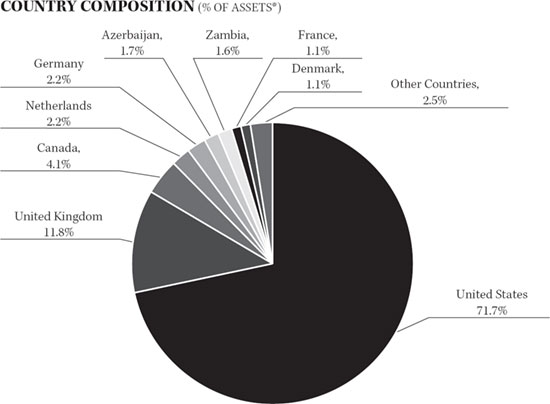
* The percentages shown above represent a percentage of the assets as of June 30, 2019.
4
Barings Global Short Duration High Yield Fund 2019 Semi-Annual Report
| Statement of Assets and Liabilities | 6 |
| | |
| Statement of Operations | 7 |
| | |
| Statement of Cash Flows | 8 |
| | |
| Statements of Changes in Net Assets | 9 |
| | |
| Financial Highlights | 10 |
| | |
| Schedule of Investments | 11-19 |
| | |
| Notes to the Financial Statements | 20-30 |
| | |
| Fund Dividend Reinvestment Plan | 31 |
| | |
| Joint Privacy Notice | 32 |
5
Barings Global Short Duration High Yield Fund 2019 Semi-Annual Report
STATEMENT OF ASSETS AND LIABILITIES |
| (Unaudited) |
| | | JUNE 30, 2019 | |
| | | | |
| Assets | | | |
| Investments, at fair value (cost $538,385,638) | | $ | 510,488,595 | |
| Cash | | | 15,768,296 | |
| Foreign currency, at fair value (cost $1,754,789) | | | 1,754,789 | |
| Receivable for investments sold | | | 21,874,600 | |
| Interest receivable | | | 10,114,143 | |
| Prepaid expenses and other assets | | | 13,626 | |
| Total assets | | | 560,014,049 | |
| | | | | |
| Liabilities | | | | |
| Note payable | | | 155,200,000 | |
| Dividend payable | | | 2,972,573 | |
| Payable for investments purchased | | | 27,530,195 | |
| Payable to adviser | | | 434,673 | |
| Unrealized depreciation on forward foreign exchange contracts | | | 171,657 | |
| Accrued expenses and other liabilities | | | 1,215,465 | |
| Total liabilities | | | 187,524,563 | |
| Total net assets | | $ | 372,489,486 | |
| | | | | |
| Net Assets: | | | | |
| Common shares, $0.00001 par value | | $ | 201 | |
| Additional paid-in capital | | | 468,758,610 | |
| Accumulated losses | | | (96,269,325 | ) |
| Total net assets | | $ | 372,489,486 | |
| | | | | |
| Common shares issued and outstanding (unlimited shares authorized) | | | 20,057,849 | |
| | | | | |
| Net asset value per share | | $ | 18.57 | |
See accompanying Notes to the Financial Statements.
6
Barings Global Short Duration High Yield Fund 2019 Semi-Annual Report
| | | PERIOD FROM
JANUARY 1, 2019
THROUGH
JUNE 30, 2019 | |
| | | | |
| Investment Income | | | |
| Interest income | | $ | 24,525,712 | |
| Other income | | | 107,772 | |
| Total investment income | | | 24,633,484 | |
| | | | | |
| Operating Expenses | | | | |
| Advisory fees | | | 2,699,321 | |
| Interest expense | | | 2,676,865 | |
| Administrator fees | | | 256,547 | |
| Professional fees | | | 86,800 | |
| Directors’ fees | | | 59,466 | |
| Taxes Paid on Undistributed Income | | | 46,123 | |
| Printing and mailing expense | | | 37,135 | |
| Pricing expense | | | 7,839 | |
| Other operating expenses | | | 24,810 | |
| Total operating expenses | | | 5,894,906 | |
| Net investment income | | | 18,738,578 | |
| | | | | |
| Realized and Unrealized Gains (Losses) on Investments | | | | |
| Net realized loss on investments | | | (9,732,704 | ) |
| Net realized gain on forward foreign exchange contracts | | | 768,324 | |
| Net realized loss on foreign currency and translation | | | (9,993 | ) |
| Net realized loss on investments | | | (8,974,373 | ) |
| Net change in unrealized appreciation of investments | | | 13,307,938 | |
| Net change in unrealized appreciation of forward foreign exchange contracts | | | 558,539 | |
| Net change in unrealized appreciation of foreign currency and translation | | | 2,866 | |
| Net change in unrealized appreciation on investments | | | 13,869,343 | |
| Net realized and unrealized gain on investments | | | 4,894,970 | |
| Net increase in net assets resulting from operations | | $ | 23,633,548 | |
See accompanying Notes to the Financial Statements.
7
Barings Global Short Duration High Yield Fund 2019 Semi-Annual Report
| | | PERIOD FROM
JANUARY 1, 2019
THROUGH
JUNE 30, 2019 | |
| | | | |
| Reconciliation of net increase in net assets resulting from operations to net cash provided by operating activities | | | |
| Net increase in net assets applicable to common shareholders resulting from operations | | $ | 23,633,548 | |
| Adjustments to reconcile net increase in net assets applicable to common shareholders resulting from operations to net cash provided by operating activities: | | | | |
| Purchases of long-term investments | | | (166,011,222 | ) |
| Proceeds from sales of long-term investments | | | 171,985,704 | |
| Proceeds from sales of foreign currency, net | | | (1,726,277 | ) |
| Forward currency exchange contracts, net | | | (558,539 | ) |
| Net unrealized depreciation | | | (13,307,470 | ) |
| Net realized loss | | | 9,732,704 | |
| Amortization and accretion | | | (1,027,399 | ) |
| Changes in operating assets and liabilities: | | | | |
| Increase in interest receivable | | | (730,318 | ) |
| Decrease in prepaid expenses and other assets | | | 36,844 | |
| Increase in receivable for investments sold | | | (21,874,600 | ) |
| Increase in payable for investments purchased | | | 27,530,195 | |
| Decrease in payable to Adviser | | | (26,527 | ) |
| Increase in accrued expenses and other liabilities | | | 882,189 | |
| Net cash provided by operating activities | | | 28,538,832 | |
| | | | | |
| Cash flows from financing activities | | | | |
| Advances from credit facility | | | 3,000,000 | |
| Repayments on credit facility | | | (5,000,000 | ) |
| Distributions paid to common shareholders | | | (17,835,439 | ) |
| Net cash used in financing activities | | | (19,835,439 | ) |
| Net change in cash | | | 8,703,393 | |
| Cash beginning of period | | | 7,064,903 | |
| Cash end of period | | $ | 15,768,296 | |
| | | | | |
| Supplemental disclosure of cash flow information | | | | |
| Income taxes paid | | $ | 46,123 | |
| Interest paid | | | 2,720,708 | |
See accompanying Notes to the Financial Statements.
8
Barings Global Short Duration High Yield Fund 2019 Semi-Annual Report
STATEMENTS OF CHANGES IN NET ASSETS |
| | | PERIOD FROM
JANUARY 1, 2019
THROUGH
JUNE 30, 2019 | | | YEAR ENDED
DECEMBER 31, 2018 | |
| | | (Unaudited) | | | | |
| Operations | | | | | | |
| Net investment income | | $ | 18,738,578 | | | $ | 38,194,759 | |
| Net realized loss on investments | | | (8,974,373 | ) | | | (28,627,365 | ) |
| Net unrealized appreciation (depreciation) on investments | | | 13,869,343 | | | | (25,128,726 | ) |
| Net increase (decrease) in net assets resulting from operations | | | 23,633,548 | | | | (15,561,332 | ) |
| | | | | | | | | |
| Dividends to Common Shareholders | | | | | | | | |
| From distributable earnings | | | (17,835,439 | ) | | | (35,670,878 | ) |
| Return of capital | | | — | | | | — | |
| Total dividends to common shareholders | | | (17,835,439 | ) | | | (35,670,878 | ) |
| Total increase (decrease) in net assets | | | 5,798,109 | | | | (51,232,210 | ) |
| | | | | | | | | |
| Net Assets | | | | | | | | |
| Beginning of period | | | 366,691,377 | | | | 417,923,587 | |
| End of period | | $ | 372,489,486 | | | $ | 366,691,377 | |
See accompanying Notes to the Financial Statements.
9
Barings Global Short Duration High Yield Fund 2019 Semi-Annual Report
| | | PERIOD FROM
JANUARY 1,
2019
THROUGH
JUNE 30,
2019
(Unaudited) | | | YEAR ENDED
DECEMBER 31,
2018 | | | YEAR ENDED
DECEMBER 31,
2017 | | | YEAR ENDED
DECEMBER 31,
2016 | | | YEAR ENDED
DECEMBER 31,
2015 | | | YEAR ENDED
DECEMBER 31,
2014 | |
Per Common Share Data (1) | | | | | | | | | | | | | | | | | | |
| Net asset value, beginning of period | | $ | 18.28 | | | $ | 20.84 | | | $ | 20.87 | | | $ | 18.47 | | | $ | 22.00 | | | $ | 25.24 | |
| Income from investment operations: | | | | | | | | | | | | | | | | | | | | | | | | |
| Net investment income | | | 0.93 | | | | 1.89 | | | | 1.77 | | | | 1.57 | | | | 1.90 | | | | 2.12 | |
| Net realized and unrealized gains (losses) on investments | | | 0.25 | | | | (2.67 | ) | | | 0.04 | | | | 2.68 | | | | (3.23 | ) | | | (2.76 | ) |
| Total increase (decrease) from investment operations | | | 1.18 | | | | (0.78 | ) | | | 1.81 | | | | 4.25 | | | | (1.33 | ) | | | (0.64 | ) |
| Less dividends to common stockholders: | | | | | | | | | | | | | | | | | | | | | | | | |
| Net investment income | | | (0.89 | ) | | | (1.78 | ) | | | (1.63 | ) | | | (1.60 | ) | | | (2.20 | ) | | | (2.56 | ) |
| Net realized gain | | | — | | | | — | | | | — | | | | — | | | | — | | | | (0.04 | ) |
| Return of capital | | | — | | | | — | | | | (0.21 | ) | | | (0.25 | ) | | | — | | | | — | |
| Total dividends to common stockholders | | | (0.89 | ) | | | (1.78 | ) | | | (1.84 | ) | | | (1.85 | ) | | | (2.20 | ) | | | (2.60 | ) |
| Net asset value, end of period | | $ | 18.57 | | | $ | 18.28 | | | $ | 20.84 | | | $ | 20.87 | | | $ | 18.47 | | | $ | 22.00 | |
| Per common share market value, end of period | | $ | 17.68 | | | $ | 15.95 | | | $ | 19.38 | | | $ | 19.23 | | | $ | 16.49 | | | $ | 20.19 | |
Total investment return based on net asset value (1)(2) | | | 6.50 | % | | | (3.42 | )% | | | 9.40 | % | | | 25.42 | % | | | (5.57 | )% | | | (2.25 | )% |
Total investment return based on market value (1)(2) | | | 16.40 | % | | | (9.38 | )% | | | 10.41 | % | | | 29.44 | % | | | (8.13 | )% | | | (2.06 | )% |
| | | | | | | | | | | | | | | | | | | | | | | | | |
| Supplemental Data and Ratios | | | | | | | | | | | | | | | | | | | | | | | | |
| Net assets, end of period (000’s) | | $ | 372,489 | | | $ | 366,691 | | | $ | 417,924 | | | $ | 418,613 | | | $ | 370,418 | | | $ | 441,234 | |
| Ratio of expenses (before reductions and reimbursements) to average net assets | | | 1.54 | %(4) | | | 2.93 | % | | | 2.33 | % | | | 2.05 | %(3) | | | 2.27 | % | | | 2.20 | % |
| Ratio of expenses (after reductions and reimbursements) to average net assets | | | 1.54 | %(4) | | | 2.93 | % | | | 2.33 | % | | | 1.78 | % | | | 2.27 | % | | | 2.20 | % |
| Ratio of net investment income (before reductions and reimbursements) to average net assets | | | 4.91 | %(4) | | | 9.34 | % | | | 9.20 | % | | | 10.68 | %(3) | | | 9.18 | % | | | 8.47 | % |
| Ratio of net investment income (after reductions and reimbursements) to average net assets | | | 4.91 | %(4) | | | 9.34 | % | | | 9.20 | % | | | 10.41 | % | | | 9.18 | % | | | 8.47 | % |
| Portfolio turnover rate | | | 31.69 | % | | | 48.92 | % | | | 36.59 | % | | | 44.81 | % | | | 38.13 | % | | | 63.66 | % |
| (2) | Total investment return calculation assumes reinvestment of dividends at actual prices pursuant to the Fund’s dividend reinvestment plan. Total investment return does not reflect brokerage commissions. |
| (3) | The Adviser contractually waived a portion of its management and other fees equal to an annual rate of 0.275% of the Fund’s managed assets for a period of one year ended December 31, 2016. |
| (4) | Annualized for periods less than one full year. |
See accompanying Notes to the Financial Statements.
10
Barings Global Short Duration High Yield Fund 2019 Semi-Annual Report
SCHEDULE OF INVESTMENTS
June 30, 2019 (Unaudited)
| | | SHARES | | COST | | FAIR
VALUE |
| Equities — 3.14%*: | | | | | | |
| Common Stocks — 3.10%*: | | | | | | |
| Boomerang Tube Holdings, Inc.¤ | | 36,150 | | $3,510,832 | | $3,023,547 |
| Fieldwood Energy LLC | | 167,574 | | 4,057,567 | | 5,027,220 |
| Jupiter Resources Inc.+ | | 1,171,624 | | 5,662,542 | | 3,075,513 |
| Sabine Oil & Gas LLC | | 4,342 | | 248,858 | | 121,576 |
| Templar Energy LLC¤ | | 135,392 | | 734,072 | | 50,772 |
| Templar Energy LLC¤ | | 101,589 | | 1,015,894 | | 228,576 |
| Total Common Stocks | | 1,616,671 | | 15,229,765 | | 11,527,204 |
| | | | | | | |
| Preferred Stocks — 0.03%*: | | | | | | |
| Pinnacle Operating Corp.¤ | | 1,368,352 | | 643,125 | | 123,152 |
| Total Preferred Stocks | | 1,368,352 | | 643,125 | | 123,152 |
| | | | | | | |
| Warrants — 0.01%*: | | | | | | |
| Appvion Holdings Corp. | | 12,892 | | 137,280 | | 6,446 |
| Appvion Inc. | | 12,892 | | — | | 1,611 |
| Sabine Oil & Gas LLC | | 13,521 | | 60,669 | | 40,563 |
| Sabine Oil & Gas LLC | | 2,481 | | 6,547 | | 7,443 |
| Total Warrants | | 41,786 | | 204,496 | | 56,063 |
| | | | | | | |
| Total Equities | | 3,026,809 | | 16,077,386 | | 11,706,419 |
| | | EFFECTIVE
INTEREST RATE ‡ | | DUE DATE | | PRINCIPAL | | COST | | FAIR
VALUE |
| Fixed Income — 133.91%*: | | | | | | | | | | | |
| Asset-Backed Securities — 7.65%*: | | | | | | | | | | | |
| CDO/CLO — 7.65%*: | | | | | | | | | | | |
| Anchorage Capital CLO LTD 2015-6A, 3M | | | | | | | | | | | |
| LIBOR + 6.350%^~ | | 8.95 | % | | 7/15/2030 | | 600,000 | | $612,289 | | $579,073 |
| Anchorage Capital CLO LTD 2016-9A ER, 3M | | | | | | | | | | | |
| LIBOR + 6.410%^~ | | 8.73 | | | 7/15/2032 | | 1,500,000 | | 1,455,000 | | 1,454,777 |
| Anchorage Capital CLO LTD 2016-9A, 3M | | | | | | | | | | | |
| LIBOR + 7.250%^~ | | 9.85 | | | 1/15/2029 | | 1,500,000 | | 1,538,895 | | 1,499,895 |
| BlueMountain CLO LTD 2018-23A, 3M | | | | | | | | | | | |
| LIBOR + 5.650%^~ | | 8.24 | | | 10/20/2031 | | 1,000,000 | | 1,000,000 | | 933,976 |
| Carbone CLO, LTD 2017-1A, 3M | | | | | | | | | | | |
| LIBOR + 5.900%^~ | | 8.49 | | | 1/20/2031 | | 750,000 | | 750,000 | | 705,589 |
| Carlyle Global Market Strategies 2013-3A, 3M | | | | | | | | | | | |
| LIBOR + 7.750%^~ | | 10.35 | | | 10/15/2030 | | 1,000,000 | | 1,000,000 | | 880,221 |
| Carlyle Global Market Strategies 2017-5A, 3M | | | | | | | | | | | |
| LIBOR + 5.300%^~ | | 7.89 | | | 1/20/2030 | | 700,000 | | 700,000 | | 644,435 |
| Cedar Funding LTD 2016-6A, 3M | | | | | | | | | | | |
| LIBOR + 5.900%^~ | | 8.49 | | | 10/20/2028 | | 2,500,000 | | 2,500,000 | | 2,483,750 |
See accompanying Notes to the Financial Statements.
11
Barings Global Short Duration High Yield Fund 2019 Semi-Annual Report
SCHEDULE OF INVESTMENTS (CONTINUED)
June 30, 2019 (Unaudited)
| | | EFFECTIVE
INTEREST RATE ‡ | | DUE DATE | | PRINCIPAL | | COST | | FAIR
VALUE |
| Fixed Income (Continued) | | | | | | | | | | | |
| Asset-Backed Securities (Continued) | | | | | | | | | | | |
| CDO/CLO (Continued) | | | | | | | | | | | |
| Galaxy CLO Ltd 2017-24A, 3M | | | | | | | | | | | |
| LIBOR + 5.500%^~ | | 8.10 | % | | 1/15/2031 | | 1,000,000 | | $1,000,000 | | $924,704 |
| GoldenTree Loan Management 2018-3A, 3M | | | | | | | | | | | |
| LIBOR + 6.500%^~ | | 9.09 | | | 4/22/2030 | | 1,500,000 | | 1,420,383 | | 1,270,841 |
| GoldenTree Loan Opportunities XI Ltd | | | | | | | | | | | |
| 2015-11A, 3M LIBOR + 5.400%^~ | | 8.00 | | | 1/18/2031 | | 500,000 | | 500,000 | | 463,716 |
| KKR Financial CLO Ltd 2017-20, 3M | | | | | | | | | | | |
| LIBOR + 5.500%^~ | | 8.10 | | | 10/16/2030 | | 1,500,000 | | 1,500,000 | | 1,387,138 |
| LCM LTD 2019-30, 3M LIBOR + 6.950%^~ | | 9.52 | | | 4/21/2031 | | 1,100,000 | | 1,100,000 | | 1,100,718 |
| Madison Park Funding Ltd 2015-19A, 3M | | | | | | | | | | | |
| LIBOR + 4.350%^~ | | 6.94 | | | 1/22/2028 | | 1,000,000 | | 1,000,000 | | 945,027 |
| Madison Park Funding Ltd 2016-22, 3M | | | | | | | | | | | |
| LIBOR + 6.650%^~ | | 9.23 | | | 10/25/2029 | | 1,000,000 | | 1,024,014 | | 989,866 |
| Madison Park Funding Ltd 2016-24, 3M | | | | | | | | | | | |
| LIBOR + 7.150%^~ | | 9.74 | | | 1/20/2028 | | 1,000,000 | | 1,032,355 | | 1,000,388 |
| Madison Park Funding Ltd 2018-29A, 3M | | | | | | | | | | | |
| LIBOR + 7.570%#^~ | | 10.17 | | | 10/18/2030 | | 2,000,000 | | 1,960,000 | | 1,830,224 |
| Magnetite CLO LTD 2016-18A, 3M | | | | | | | | | | | |
| LIBOR + 7.600%^~ | | 10.12 | | | 11/15/2028 | | 1,400,000 | | 1,386,000 | | 1,299,451 |
| OHA Credit Partners LTD 2015-11A, 3M | | | | | | | | | | | |
| LIBOR + 7.900%^~ | | 10.49 | | | 1/20/2032 | | 2,000,000 | | 1,970,323 | | 1,826,888 |
| OHA Loan Funding LTD 2013-1A, 3M | | | | | | | | | | | |
| LIBOR + 7.900%^~ | | 10.49 | | | 7/23/2031 | | 1,500,000 | | 1,477,500 | | 1,382,061 |
| Sound Point CLO LTD 2017-4A, 3M | | | | | | | | | | | |
| LIBOR + 5.500%^~ | | 8.09 | | | 1/21/2031 | | 2,000,000 | | 2,000,000 | | 1,830,462 |
| Steele Creek CLO Ltd 2017-1A, 3M | | | | | | | | | | | |
| LIBOR + 6.200%^~ | | 8.80 | | | 1/15/2030 | | 800,000 | | 800,000 | | 765,801 |
| Wellfleet CLO Ltd 2017-3A, 3M | | | | | | | | | | | |
| LIBOR + 5.550%^~ | | 8.14 | | | 1/17/2031 | | 1,500,000 | | 1,500,000 | | 1,348,378 |
| Wind River CLO Ltd 2017-4A, 3M | | | | | | | | | | | |
| LIBOR + 5.800%^~ | | 8.32 | | | 11/20/2030 | | 1,000,000 | | 1,000,000 | | 947,647 |
| Total CDO/CLO | | | | | | | 30,350,000 | | 30,226,759 | | 28,495,026 |
| | | | | | | | | | | | |
| Total Asset-Backed Securities | | | | | | | 30,350,000 | | 30,226,759 | | 28,495,026 |
| Bank Loans§ — 16.58%*: | | | | | | | | | | | |
| Broadcasting and Entertainment — 1.19%*: | | | | | | | | |
| Endemol, 3M LIBOR + 5.750%+~ | | 8.35 | | | 8/11/2021 | | 4,479,335 | | 4,354,327 | | 4,440,141 |
| Total Broadcasting and Entertainment | | | | | | | 4,479,335 | | 4,354,327 | | 4,440,141 |
| | | | | | | | | | | | |
| Cargo Transport — 0.79%*: | | | | | | | | | | | |
| PS Logistics, 1M LIBOR + 4.750%~ | | 7.15 | | | 3/6/2025 | | 2,977,500 | | 3,001,531 | | 2,942,157 |
| Total Cargo Transport | | | | | | | 2,977,500 | | 3,001,531 | | 2,942,157 |
See accompanying Notes to the Financial Statements.
12
Barings Global Short Duration High Yield Fund 2019 Semi-Annual Report
SCHEDULE OF INVESTMENTS (CONTINUED)
June 30, 2019 (Unaudited)
| | | EFFECTIVE
INTEREST RATE ‡ | | DUE DATE | | PRINCIPAL | | COST | | FAIR
VALUE |
| Fixed Income (Continued) | | | | | | | | | | | |
| Bank Loans (Continued) | | | | | | | | | | | |
| Chemicals, Plastics and Rubber — 0.43%*: | | | | | | | | | | | |
| Colouroz Investment 2 LLC, 3M | | | | | | | | | | | |
| LIBOR + 7.250%+~ | | 9.83 | % | | 9/7/2022 | | 2,033,201 | | $2,025,452 | | $1,585,897 |
| Total Chemicals, Plastics and Rubber | | | | | | | 2,033,201 | | 2,025,452 | | 1,585,897 |
| | | | | | | | | | | | |
| Diversified/Conglomerate Manufacturing — 0.94%*: | | | | | | | | |
| Averys, 3M LIBOR + 8.250%+~ | | 8.25 | | | 8/7/2026 | | 500,000 | | 571,943 | | 568,550 |
| Commercial Vehicle Group Inc., 1M | | | | | | | | | | | |
| LIBOR + 6.000%~ | | 8.40 | | | 4/12/2023 | | 584,886 | | 575,957 | | 581,962 |
| SunSource, Inc., 1M LIBOR + 8.000%~ | | 10.40 | | | 4/30/2026 | | 2,500,000 | | 2,520,718 | | 2,341,675 |
| Total Diversified/Conglomerate Manufacturing | | | | | | | 3,584,886 | | 3,668,618 | | 3,492,187 |
| | | | | | | | | | | | |
| Diversified/Conglomerate Service — 3.62%*: | | | | | | | | | | | |
| Misys (Finastra), 3M LIBOR + 7.250%+~ | | 9.65 | | | 6/16/2025 | | 13,630,136 | | 13,627,412 | | 13,496,697 |
| Total Diversified/Conglomerate Service | | | | | | | 13,630,136 | | 13,627,412 | | 13,496,697 |
| | | | | | | | | | | | |
| Electronics — 1.41%*: | | | | | | | | | | | |
| PowerSchool, 3M LIBOR + 6.750%~ | | 9.32 | | | 7/31/2026 | | 3,500,000 | | 3,465,000 | | 3,451,875 |
| Veritas US Inc., 3M LIBOR + 4.500%~ | | 6.89 | | | 1/27/2023 | | 1,989,822 | | 1,853,759 | | 1,807,017 |
| Total Electronics | | | | | | | 5,489,822 | | 5,318,759 | | 5,258,892 |
| | | | | | | | | | | | |
| Healthcare, Education and Childcare — 3.17%*: | | | | | | | | | | | |
| Argon Medical Devices, 1M LIBOR + 8.000%~ | | 10.40 | | | 1/23/2026 | | 8,179,057 | | 8,256,043 | | 8,035,924 |
| ADVANZ PHARMA Corp., 1M LIBOR + 5.500%+~ | | 7.91 | | | 9/6/2024 | | 3,940,000 | | 3,868,971 | | 3,777,475 |
| Total Healthcare, Education and Childcare | | | | | | | 12,119,057 | | 12,125,014 | | 11,813,399 |
| | | | | | | | | | | | |
| Home and Office Furnishings, Housewares, and Durable Consumer Products — 0.93%*: | | | | |
| Serta Simmons Beddings LLC, 1M | | | | | | | | | | | |
| LIBOR + 8.000%~ | | 10.39 | | | 11/8/2024 | | 7,933,333 | | 7,152,886 | | 3,474,800 |
| Total Home and Office Furnishings, Housewares, and Durable Consumer Products | | | | | | | 7,933,333 | | 7,152,886 | | 3,474,800 |
| | | | | | | | | | | | |
| Insurance — 0.82%*: | | | | | | | | | | | |
| Asurion, 1M LIBOR + 6.500%~ | | 8.90 | | | 8/4/2025 | | 3,000,000 | | 3,069,867 | | 3,039,390 |
| Total Insurance | | | | | | | 3,000,000 | | 3,069,867 | | 3,039,390 |
| | | | | | | | | | | | |
| Mining, Steel, Iron and Non-Precious Metals — 0.68%*: | | | | | | | | | | | |
| Boomerang Tube, LLC, 3M LIBOR + 6.500%¤~ | | 7.40 | | | 10/31/2021 | | 2,540,684 | | 2,540,684 | | 2,540,684 |
| Total Mining, Steel, Iron and Non-Precious Metals | | | | | | | 2,540,684 | | 2,540,684 | | 2,540,684 |
See accompanying Notes to the Financial Statements.
13
Barings Global Short Duration High Yield Fund 2019 Semi-Annual Report
SCHEDULE OF INVESTMENTS (CONTINUED)
June 30, 2019 (Unaudited)
| | | EFFECTIVE
INTEREST RATE ‡ | | DUE DATE | | PRINCIPAL | | COST | | FAIR
VALUE |
| Fixed Income (Continued) | | | | | | | | | | | |
| Bank Loans (Continued) | | | | | | | | | | | |
| Oil and Gas — 2.60%*: | | | | | | | | | | | |
| Fieldwood Energy LLC, 1M LIBOR + 5.250%~ | | 7.65 | % | | 4/11/2022 | | 3,751,171 | | $3,532,551 | | $3,466,307 |
| Fieldwood Energy LLC, 1M LIBOR + 7.250%~ | | 9.65 | | | 4/11/2023 | | 7,481,592 | | 2,417,253 | | 6,209,721 |
| Total Oil and Gas | | | | | | | 11,232,763 | | 5,949,804 | | 9,676,028 |
| | | | | | | | | | | | |
| Total Bank Loans | | | | | | | 69,020,717 | | 62,834,354 | | 61,760,272 |
| | | | | | | | | | | | |
| Corporate Bonds — 109.68%*: | | | | | | | | | | | |
| Aerospace and Defense — 1.17%*: | | | | | | | | | | | |
| TransDigm Group, Inc.#^ | | 7.50 | | | 3/15/2027 | | 3,000,000 | | 2,977,500 | | 3,131,250 |
| Triumph Group, Inc.# | | 7.75 | | | 8/15/2025 | | 1,289,000 | | 1,289,000 | | 1,247,108 |
| Total Automotive | | | | | | | 4,289,000 | | 4,266,500 | | 4,378,358 |
| | | | | | | | | | | | |
| Automotive — 2.85%*: | | | | | | | | | | | |
| Garrett Motion+^ | | 5.13 | | | 10/15/2026 | | 1,250,000 | | 1,275,989 | | 1,366,652 |
| Power Solutions#^ | | 8.50 | | | 5/15/2027 | | 8,965,000 | | 9,074,331 | | 9,233,950 |
| Total Aerospace and Defense | | | | | | | 10,215,000 | | 10,350,320 | | 10,600,602 |
| | | | | | | | | | | | |
| Beverage, Food and Tobacco — 2.39%*: | | | | | | | | | | | |
| Boparan Finance plc+^ | | 5.50 | | | 7/15/2021 | | 800,000 | | 1,025,548 | | 558,625 |
| JBS S.A.#^ | | 6.75 | | | 2/15/2028 | | 2,886,000 | | 2,886,000 | | 3,134,917 |
| Manitowoc Foodservice# | | 9.50 | | | 2/15/2024 | | 3,074,000 | | 3,244,000 | | 3,327,605 |
| Refresco Group N.V.+^ | | 6.50 | | | 5/15/2026 | | 1,600,000 | | 1,931,967 | | 1,886,149 |
| Total Beverage, Food and Tobacco | | | | | | | 8,360,000 | | 9,087,515 | | 8,907,296 |
| | | | | | | | | | | | |
| Broadcasting and Entertainment — 5.59%*: | | | | | | | | | | | |
| Arqiva Broadcast+^ | | 6.75 | | | 9/30/2023 | | 4,950,000 | | 6,338,979 | | 6,753,896 |
| Clear Channel Worldwide Holdings Inc.^ | | 9.25 | | | 2/15/2024 | | 642,000 | | 642,000 | | 696,570 |
| Dish DBS Corp.# | | 7.75 | | | 7/1/2026 | | 7,094,000 | | 6,867,492 | | 6,881,180 |
| Intelsat Jackson Holdings Ltd.#^ | | 9.75 | | | 7/15/2025 | | 4,609,000 | | 4,830,019 | | 4,701,180 |
| Intelsat Jackson Holdings Ltd.#^ | | 8.50 | | | 10/15/2024 | | 1,801,000 | | 1,801,000 | | 1,782,990 |
| Total Broadcasting and Entertainment | | | | | | | 19,096,000 | | 20,479,490 | | 20,815,816 |
| | | | | | | | | | | | |
| Buildings and Real Estate — 1.36%*: | | | | | | | | | | | |
| Realogy Group#^ | | 9.38 | | | 4/1/2027 | | 5,763,000 | | 5,938,309 | | 5,049,829 |
| Total Buildings and Real Estate | | | | | | | 5,763,000 | | 5,938,309 | | 5,049,829 |
| | | | | | | | | | | | |
| Cargo Transport — 2.42%*: | | | | | | | | | | | |
| Kenan Advantage#^ | | 7.88 | | | 7/31/2023 | | 10,000,000 | | 10,049,856 | | 9,000,000 |
| Total Cargo Transport | | | | | | | 10,000,000 | | 10,049,856 | | 9,000,000 |
| | | | | | | | | | | | |
| Chemicals, Plastics and Rubber — 6.99%*: | | | | | | | | | | | |
| Carlyle Group#^ | | 8.75 | | | 6/1/2023 | | 3,000,000 | | 2,970,300 | | 2,947,500 |
| Consolidated Energy Finance S.A.#^ | | 6.88 | | | 6/15/2025 | | 1,779,000 | | 1,770,105 | | 1,821,981 |
| CVR Partners LP#^ | | 9.25 | | | 6/15/2023 | | 6,213,000 | | 6,148,948 | | 6,496,934 |
See accompanying Notes to the Financial Statements.
14
Barings Global Short Duration High Yield Fund 2019 Semi-Annual Report
SCHEDULE OF INVESTMENTS (CONTINUED)
June 30, 2019 (Unaudited)
| | | EFFECTIVE
INTEREST RATE ‡ | | DUE DATE | | PRINCIPAL | | COST | | FAIR
VALUE |
| Fixed Income (Continued) | | | | | | | | | | | |
| Corporate Bonds (Continued) | | | | | | | | | | | |
| Chemicals, Plastics and Rubber (Continued) | | | | | | | | | | | |
| Diversey^ | | 5.63 | % | | 8/15/2025 | | 1,500,000 | | $1,607,896 | | $1,415,690 |
| Nouryon#+^ | | 8.00 | | | 10/1/2026 | | 4,214,000 | | 4,227,908 | | 4,329,885 |
| Pinnacle Operating Corp.#^ | | 9.00 | | | 5/15/2023 | | 1,993,613 | | 1,993,613 | | 657,892 |
| TPC Group, Inc.#^ | | 8.75 | | | 12/15/2020 | | 8,398,000 | | 8,402,771 | | 8,366,507 |
| Total Chemicals, Plastics and Rubber | | | | | | | 27,097,613 | | 27,121,541 | | 26,036,389 |
| | | | | | | | | | | | |
| Diversified/Conglomerate Manufacturing — 3.95%*: | | | | | | | | |
| Manitowoc Cranes#^ | | 9.00 | | | 4/1/2026 | | 8,538,000 | | 8,566,867 | | 8,538,000 |
| Truck Hero Inc.#^ | | 8.50 | | | 4/21/2024 | | 6,118,000 | | 6,148,000 | | 6,163,885 |
| Total Diversified/Conglomerate Manufacturing | | | | | | | 14,656,000 | | 14,714,867 | | 14,701,885 |
| | | | | | | | | | | | |
| Diversified/Conglomerate Service — 3.57%*: | | | | | | | | |
| Algeco Scotsman+^ | | 6.50 | | | 2/15/2023 | | 1,750,000 | | 2,130,120 | | 2,076,388 |
| ADT Corp/Protection One#^ | | 9.25 | | | 5/15/2023 | | 4,959,000 | | 5,226,065 | | 5,207,942 |
| Carlson Travel Holdings Inc.#^ | | 9.50 | | | 12/15/2024 | | 6,040,000 | | 6,051,838 | | 6,024,900 |
| Total Diversified/Conglomerate Service | | | | | | | 12,749,000 | | 13,408,023 | | 13,309,230 |
| | | | | | | | | | | | |
| Electronics — 6.91%*: | | | | | | | | | | | |
| International Wire Group Inc.#^ | | 10.75 | | | 8/1/2021 | | 7,389,000 | | 7,095,724 | | 7,497,988 |
| TIBCO Software, Inc.#^ | | 11.38 | | | 12/1/2021 | | 2,915,000 | | 3,067,570 | | 3,097,187 |
| Veritas Bermuda Ltd.#^ | | 10.50 | | | 2/1/2024 | | 17,684,000 | | 14,891,899 | | 15,164,030 |
| Total Electronics | | | | | | | 27,988,000 | | 25,055,193 | | 25,759,205 |
| | | | | | | | | | | | |
| Finance — 3.18%*: | | | | | | | | | | | |
| Galaxy Finco Ltd.#+^ | | 7.88 | | | 11/15/2021 | | 4,450,000 | | 7,060,906 | | 5,549,573 |
| GFKL Financial Services#+^ | | 8.50 | | | 11/1/2022 | | 4,925,000 | | 6,893,301 | | 5,610,308 |
| GFKL Financial Services#+^ | | 11.00 | | | 11/1/2023 | | 650,000 | | 894,237 | | 679,600 |
| Total Finance | | | | | | | 10,025,000 | | 14,848,444 | | 11,839,481 |
| | | | | | | | | | | | |
| Healthcare, Education and Childcare — 15.18%*: | | | | | | | | |
| Advanz Pharma Corp.+ | | 8.00 | | | 9/6/2024 | | 500,000 | | 480,033 | | 483,750 |
| Avantor Performance Materials Holdings, Inc.#^ | | 9.00 | | | 10/1/2025 | | 5,180,000 | | 5,274,476 | | 5,775,700 |
| Bausch Health Companies Inc.#^ | | 9.00 | | | 12/15/2025 | | 12,922,000 | | 13,176,855 | | 14,437,751 |
| Bausch Health Companies Inc.#^ | | 9.25 | | | 4/1/2026 | | 3,397,000 | | 3,397,000 | | 3,800,564 |
| Bausch Health Companies Inc.#^ | | 8.50 | | | 1/31/2027 | | 317,000 | | 317,000 | | 348,548 |
| Endo International^ | | 6.00 | | | 2/1/2025 | | 4,500,000 | | 3,651,917 | | 3,015,000 |
| Endo International#^ | | 7.50 | | | 4/1/2027 | | 1,890,000 | | 1,890,000 | | 1,856,925 |
| Envision Healthcare Corp.#^ | | 8.75 | | | 10/15/2026 | | 14,064,000 | | 13,086,887 | | 9,809,640 |
| Horizon Pharma plc#^ | | 8.75 | | | 11/1/2024 | | 1,595,000 | | 1,596,933 | | 1,711,116 |
| Regionalcare Hospital Partners, Inc.#^ | | 8.25 | | | 5/1/2023 | | 9,996,000 | | 10,070,397 | | 10,639,492 |
| Synlab+^ | | 8.25 | | | 7/1/2023 | | 2,000,000 | | 2,527,264 | | 2,372,719 |
See accompanying Notes to the Financial Statements.
15
Barings Global Short Duration High Yield Fund 2019 Semi-Annual Report
SCHEDULE OF INVESTMENTS (CONTINUED)
June 30, 2019 (Unaudited)
| | | EFFECTIVE
INTEREST RATE ‡ | | DUE DATE | | PRINCIPAL | | COST | | FAIR
VALUE |
| Fixed Income (Continued) | | | | | | | | | | | |
| Corporate Bonds (Continued) | | | | | | | | | | | |
| Healthcare, Education and Childcare (Continued) | | | | | | | | | | | |
| Tenet Healthcare Corporation# | | 8.13 | % | | 4/1/2022 | | 1,700,000 | | $1,684,618 | | $1,782,875 |
| Teva Pharmaceutical#+ | | 6.75 | | | 3/1/2028 | | 578,000 | | 578,000 | | 531,399 |
| Total Healthcare, Education and Childcare | | | | | | | 58,639,000 | | 57,731,380 | | 56,565,479 |
| | | | | | | | | | | | |
| Home and Office Furnishings, Housewares, and Durable Consumer Products — 1.26%*: | | | | | | | | | | | |
| Balta#+^ | | 7.75 | | | 9/15/2022 | | 4,171,500 | | 4,849,206 | | 4,713,103 |
| Total Home and Office Furnishings, Housewares, and Durable Consumer Products | | | | | | | 4,171,500 | | 4,849,206 | | 4,713,103 |
| | | | | | | | | | | | |
| Hotels, Motels, Inns and Gaming — 2.60%*: | | | | | | | | | | | |
| Boyne USA, Inc.#^ | | 7.25 | | | 5/1/2025 | | 950,000 | | 950,000 | | 1,028,375 |
| Golden Nugget Inc.^ | | 8.75 | | | 10/1/2025 | | 5,000,000 | | 5,262,500 | | 5,262,500 |
| TVL Finance Plc+^ | | 8.50 | | | 5/15/2023 | | 2,560,000 | | 3,616,968 | | 3,394,976 |
| Total Hotels, Motels, Inns and Gaming | | | | | | | 8,510,000 | | 9,829,468 | | 9,685,851 |
| | | | | | | | | | | | |
| Insurance — 2.10%*: | | | | | | | | | | | |
| Acrisure LLC#^ | | 8.13 | | | 2/15/2024 | | 4,564,000 | | 4,707,627 | | 4,712,330 |
| Onex York Acquisition Corp.#^ | | 8.50 | | | 10/1/2022 | | 3,794,000 | | 3,192,395 | | 3,120,565 |
| Total Insurance | | | | | | | 8,358,000 | | 7,900,022 | | 7,832,895 |
| | | | | | | | | | | | |
| Leisure, Amusement, Motion Pictures and Entertainment — 2.14%*: | | | | | | | | | | | |
| Perform Group+^ | | 8.50 | | | 11/15/2020 | | 2,600,000 | | 3,442,947 | | 3,341,503 |
| Thomas Cook+^ | | 3.88 | | | 7/15/2023 | | 150,000 | | 120,683 | | 61,403 |
| Thomas Cook+^ | | 6.25 | | | 6/15/2022 | | 1,200,000 | | 1,122,238 | | 512,323 |
| Vue Cinemas+^ | | 7.88 | | | 7/15/2020 | | 3,100,000 | | 4,075,431 | | 3,937,015 |
| Vue Cinemas+^~ | | 4.94 | | | 7/15/2020 | | 100,000 | | 112,901 | | 113,653 |
| Total Leisure, Amusement, Motion Pictures and Entertainment | | | | | | | 7,150,000 | | 8,874,200 | | 7,965,897 |
| | | | | | | | | | | | |
| Machinery (Non-Agriculture, Non-Construct, Non-Electronic) — 2.55%*: | | | | | | | | | | | |
| Apex Tool Group LLC#^ | | 9.00 | | | 2/15/2023 | | 10,627,000 | | 10,379,028 | | 9,484,598 |
| Total Machinery (Non-Agriculture, Non-Construct, Non-Electronic) | | | | | | | 10,627,000 | | 10,379,028 | | 9,484,598 |
| | | | | | | | | | | | |
| Mining, Steel, Iron and Non-Precious Metals — 13.97%*: | | | | | | | | | | | |
| Alliance Resources Partners, L.P.#^ | | 7.50 | | | 5/1/2025 | | 764,000 | | 764,000 | | 802,200 |
| Big River Steel LLC#^ | | 7.25 | | | 9/1/2025 | | 1,547,000 | | 1,547,000 | | 1,625,201 |
| Consol Energy Inc.#^ | | 11.00 | | | 11/15/2025 | | 10,316,000 | | 10,768,165 | | 11,167,070 |
| First Quantum Minerals#+^ | | 7.25 | | | 4/1/2023 | | 2,000,000 | | 1,914,098 | | 1,947,500 |
| First Quantum Minerals#+^ | | 7.50 | | | 4/1/2025 | | 6,775,000 | | 6,612,544 | | 6,453,187 |
| Hecla Mining Company# | | 6.88 | | | 5/1/2021 | | 5,888,000 | | 5,788,300 | | 5,620,084 |
| Kissner Milling Company Limited#+^ | | 8.38 | | | 12/1/2022 | | 6,475,000 | | 6,467,387 | | 6,734,000 |
| Northwest Acquisitions ULC#+^ | | 7.13 | | | 11/1/2022 | | 16,122,000 | | 12,072,283 | | 11,124,180 |
See accompanying Notes to the Financial Statements.
16
Barings Global Short Duration High Yield Fund 2019 Semi-Annual Report
SCHEDULE OF INVESTMENTS (CONTINUED)
June 30, 2019 (Unaudited)
| | | EFFECTIVE
INTEREST RATE ‡ | | DUE DATE | | PRINCIPAL | | COST | | FAIR
VALUE |
| Fixed Income (Continued) | | | | | | | | | | | |
| Corporate Bonds (Continued) | | | | | | | | | | | |
| Mining, Steel, Iron and Non-Precious Metals (Continued) | | | | | | | | | | | |
| SunCoke Energy Inc.#^ | | 7.50 | % | | 6/15/2025 | | 5,743,000 | | $5,726,398 | | $5,606,604 |
| Warrior Met Coal Inc.#^ | | 8.00 | | | 11/1/2024 | | 914,000 | | 914,000 | | 952,845 |
| Total Mining, Steel, Iron and Non-Precious Metals | | | | | | | 56,544,000 | | 52,574,175 | | 52,032,871 |
| | | | | | | | | | | | |
| Oil and Gas — 16.80%*: | | | | | | | | | | | |
| Calumet Specialty Products# | | 7.63 | | | 1/15/2022 | | 4,176,000 | | 3,900,882 | | 4,040,280 |
| CGG Holdings+^ | | 7.88 | | | 5/1/2023 | | 2,400,000 | | 2,879,281 | | 2,915,980 |
| CITGO Holding Inc.#^ | | 10.75 | | | 2/15/2020 | | 11,363,000 | | 11,397,625 | | 11,760,705 |
| Enven Energy Ventures#^ | | 11.00 | | | 2/15/2023 | | 3,572,000 | | 3,572,000 | | 3,911,340 |
| Ferrellgas Partners LP# | | 8.63 | | | 6/15/2020 | | 6,068,000 | | 6,053,092 | | 4,459,980 |
| Ferrellgas Partners LP# | | 8.63 | | | 6/15/2020 | | 1,254,000 | | 1,238,473 | | 921,690 |
| Globe Luxembourg SA#+^ | | 9.88 | | | 4/1/2022 | | 3,103,000 | | 3,172,541 | | 2,288,462 |
| Globe Luxembourg SA#+^ | | 9.63 | | | 4/1/2023 | | 4,238,000 | | 4,291,328 | | 3,083,145 |
| Jonah Energy LLC#^ | | 7.25 | | | 10/15/2025 | | 5,714,000 | | 4,987,653 | | 2,728,435 |
| Pbf Holding Company LLC# | | 7.00 | | | 11/15/2023 | | 1,000,000 | | 997,500 | | 1,037,510 |
| Topaz Marine SA#+^ | | 9.13 | | | 7/26/2022 | | 8,500,000 | | 8,500,000 | | 8,523,562 |
| Vine Oil & Gas#^ | | 9.75 | | | 4/15/2023 | | 17,662,000 | | 15,254,830 | | 11,436,145 |
| Welltec#+^ | | 9.50 | | | 12/1/2022 | | 5,713,000 | | 5,690,378 | | 5,455,915 |
| Total Oil and Gas | | | | | | | 74,763,000 | | 71,935,583 | | 62,563,149 |
| | | | | | | | | | | | |
| Personal and Non Durable Consumer Products — 0.08%*: | | | | | | | | | | | |
| High Ridge Brands Co.^ | | 8.88 | | | 3/15/2025 | | 2,982,000 | | 2,982,000 | | 283,290 |
| Total Personal and Non Durable Consumer Products | | | | | | | 2,982,000 | | 2,982,000 | | 283,290 |
| | | | | | | | | | | | |
| Personal Transportation — 1.15%*: | | | | | | | | | | | |
| Hertz Corporation#^ | | 7.63 | | | 6/1/2022 | | 3,678,000 | | 3,673,842 | | 3,820,522 |
| Naviera Armas, 3M EURIBOR + 6.500%+^~ | | 6.50 | | | 7/31/2023 | | 525,000 | | 609,590 | | 456,688 |
| Total Personal Transportation | | | | | | | 4,203,000 | | 4,283,432 | | 4,277,210 |
| | | | | | | | | | | | |
| Printing and Publishing — 0.57%*: | | | | | | | | | | | |
| Cimpress N.V.#^ | | 7.00 | | | 6/15/2026 | | 2,069,000 | | 2,069,000 | | 2,110,359 |
| Total Printing and Publishing | | | | | | | 2,069,000 | | 2,069,000 | | 2,110,359 |
| | | | | | | | | | | | |
| Retail Store — 2.60%*: | | | | | | | | | | | |
| Douglas GMBH+^ | | 6.25 | | | 7/15/2022 | | 775,000 | | 767,772 | | 827,884 |
| EG Global Finance PLC#+^ | | 6.75 | | | 2/7/2025 | | 2,439,000 | | 2,439,000 | | 2,419,976 |
| Ken Garff Automotive#^ | | 7.50 | | | 8/15/2023 | | 1,034,000 | | 1,034,000 | | 1,072,775 |
| Maxeda DIY+^ | | 6.13 | | | 7/15/2022 | | 750,000 | | 855,530 | | 844,723 |
| Travelex#+^ | | 8.00 | | | 5/15/2022 | | 4,000,000 | | 4,421,260 | | 4,532,663 |
| Total Retail Store | | | | | | | 8,998,000 | | 9,517,562 | | 9,698,021 |
See accompanying Notes to the Financial Statements.
17
Barings Global Short Duration High Yield Fund 2019 Semi-Annual Report
SCHEDULE OF INVESTMENTS (CONTINUED)
June 30, 2019 (Unaudited)
| | | EFFECTIVE
INTEREST RATE ‡ | | DUE DATE | | PRINCIPAL | | COST | | FAIR
VALUE |
| Fixed Income (Continued) | | | | | | | | | | | |
| Corporate Bonds (Continued) | | | | | | | | | | | |
| Telecommunications — 6.16%*: | | | | | | | | | | | |
| Altice S.A.#+^ | | 9.00 | % | | 6/15/2023 | | 3,150,000 | | $4,080,983 | | $3,724,567 |
| Commscope Inc.^ | | 8.25 | | | 3/1/2027 | | 9,673,000 | | 9,798,899 | | 9,865,009 |
| Digicel Limited#+^ | | 8.25 | | | 9/30/2020 | | 2,500,000 | | 2,479,186 | | 1,815,650 |
| Sprint Capital Corp.# | | 8.75 | | | 3/15/2032 | | 6,500,000 | | 6,845,240 | | 7,523,750 |
| Total Telecommunications | | | | | | | 21,823,000 | | 23,204,308 | | 22,928,976 |
| | | | | | | | | | | | |
| Utilities — 2.14%*: | | | | | | | | | | | |
| Nordex+^ | | 6.50 | | | 2/1/2023 | | 1,950,000 | | 2,421,789 | | 2,239,395 |
| NRG Energy# | | 7.25 | | | 5/15/2026 | | 1,385,000 | | 1,390,107 | | 1,525,231 |
| Techem+^ | | 6.00 | | | 7/30/2026 | | 3,500,000 | | 3,985,821 | | 4,222,462 |
| Total Utilities | | | | | | | 6,835,000 | | 7,797,717 | | 7,987,088 |
| Total Corporate Bonds | | | | | | | 425,911,113 | | 429,247,139 | | 408,526,878 |
| Total Fixed Income | | | | | | | 525,281,830 | | 522,308,252 | | 498,782,176 |
| Total Investments | | | | | | | 528,308,639 | | 538,385,638 | | 510,488,595 |
| | | | | | | | | | | | |
| Other assets and liabilities — (37.05)% | | | | | | | | | | | (137,999,109) |
| | | | | | | | | | | | |
| | | | | | | | | | | $372,489,486 |
| ‡ | The effective interest rates are based on settled commitment amount. |
| * | Calculated as a percentage of net assets applicable to common shareholders. |
| ¤ | Value determined using significant unobservable inputs, security is categorized as Level 3. |
| ^ | Security exempt from registration under Rule 144a of the Securities Act of 1933. These securities may only be resold in transactions exempt from registration, normally to qualified institutional buyers. |
| ~ | Variable rate security. The interest rate shown is the rate in effect at June 30, 2019. |
| # | All or a portion of the security is segregated as collateral for the credit facility. |
| § | Bank loans are exempt from registration under the Securities Act of 1933, as amended, but contain certain restrictions on resale and cannot be sold publicly. These loans pay interest at rates which adjust periodically. The interest rates shown for bank loans are the current interest rates at June 30, 2019. Bank loans are also subject to mandatory and/or optional prepayment which cannot be predicted. As a result, the remaining maturity may be substantially less than the stated maturity shown. |
See accompanying Notes to the Financial Statements.
18
Barings Global Short Duration High Yield Fund 2019 Semi-Annual Report
SCHEDULE OF INVESTMENTS (CONTINUED)
June 30, 2019 (Unaudited)
Distributions of investments by country of risk. Percentage of assets are expressed by market value excluding cash and accrued income as of June 30, 2019.
| United States | | 71.6% |
| United Kingdom | | 11.9% |
| Canada | | 4.1% |
| Netherlands | | 2.3% |
| Germany | | 2.2% |
| Azerbaijan | | 1.7% |
| Zambia | | 1.6% |
| France | | 1.1% |
| Denmark | | 1.1% |
| (Individually less than 1%) | | 2.4% |
| | | 100.0% |
A summary of outstanding derivatives at June 30, 2019 is as follows:
Schedule of Open Forward Currency Contracts
June 30, 2019 (Unaudited)
| | | | | | | | | FORWARD | UNREALIZED |
| CURRENCY TO BE | | | CURRENCY TO BE | | | | COUNTERPARTY OF | | SETTLEMENT | APPRECIATION/ |
| RECEIVED | | | DELIVERED(1) | | | | CONTRACT | | DATE | (DEPRECIATION) |
| 38,345,362 | | USD | (38,499,576) | | EUR | | JP MORGAN CHASE SECURITIES INC. | | 7/15/2019 | | $ | (154,214 | ) |
| 30,155,140 | | USD | (30,172,584) | | GBP | | JP MORGAN CHASE SECURITIES INC. | | 7/15/2019 | | | (17,443 | ) |
| | | | | | | | | | | | $ | (171,657 | ) |
(1) | Values are listed in U.S. dollars. |
See accompanying Notes to the Financial Statements.
19
Barings Global Short Duration High Yield Fund 2019 Semi-Annual Report
NOTES TO THE FINANCIAL STATEMENTS |
| June 30, 2019 (Unaudited) |
Barings Global Short Duration High Yield Fund (the “Fund”) was organized as a business trust under the laws of the Commonwealth of Massachusetts on May 20, 2011, and commenced operations on October 26, 2012. The Fund is registered under the Investment Company Act of 1940, as amended (the “1940 Act”), as a diversified, closed-end management investment company.
Barings LLC (the “Adviser”), a wholly-owned indirect subsidiary of Massachusetts Mutual Life Insurance Company, is a registered investment adviser under the Investment Advisers Act of 1940, as amended, and serves as investment adviser to the Fund.
Baring International Investment Limited (the “Sub-Adviser”), an indirect wholly-owned subsidiary of the Adviser, serves as sub-adviser with respect to the Fund’s European investments.
The Fund’s primary investment objective is to seek as high a level of current income as the Adviser determines is consistent with capital preservation. The Fund seeks capital appreciation as a secondary investment objective when consistent with its primary investment objective. There can be no assurance that the Fund will achieve its investment objectives. The Fund seeks to take advantage of inefficiencies between geographies, primarily the North American and Western European high yield bond and loan markets and within capital structures between bonds and loans. Under normal market conditions, the Fund will invest at least 80% of its Managed Assets in bonds, loans and other income-producing instruments that are, at the time of purchase, rated below investment grade (below Baa3 by Moody’s Investors Service, Inc. (“Moody’s”) or below BBB- by either Standard & Poor’s Rating Services, a division of the McGraw-Hill Company, Inc. (“S&P”) or Fitch, Inc. (“Fitch”), or unrated but judged by the Adviser or Sub-Adviser to be of comparable quality).
| 2. | Significant Accounting Policies |
The Fund is an investment company and follows accounting and reporting guidance in Financial Accounting Standards Board (“FASB”) Accounting Standards Codification Topic 946. The following is a summary of significant accounting policies followed consistently by the Fund in the preparation of its financial statements in conformity with accounting principles generally accepted in the United States of America (“U.S. GAAP”).
A. Valuation of Investments
The Fund’s investments in fixed income securities are generally valued using the prices provided directly by independent third party services or provided directly from one or more broker dealers or market makers, each in accordance with the valuation policies and procedures approved by the Fund’s Board of Trustees (the “Board”).
The pricing services may use valuation models or matrix pricing, which consider yield or prices with respect to comparable bond quotations from bond dealers or by reference to other securities that are considered comparable in such characteristics as credit rating, interest rates and maturity date, to determine the current value. The closing prices of domestic or foreign securities may not reflect their market values at the time the Fund calculates its NAV if an event that materially affects the value of those securities has occurred since the closing prices were established on the domestic or foreign exchange market, but before the Fund’s NAV calculation. Under certain conditions, the Board has approved an independent pricing service to fair value foreign securities. This is generally accomplished by adjusting the closing price for movements in correlated indices, securities or derivatives. Fair value pricing may cause the value of the security on the books of the Fund to be different from the closing value on the non-U.S. exchange and may affect the calculation of the Fund’s NAV. The Fund may fair value securities in other situations, for example, when a particular foreign market is closed but the Fund is pricing their shares.
The Fund’s investments in bank loans are normally valued at the bid quotation obtained from dealers in loans by an independent pricing service in accordance with the Fund’s valuation policies and procedures approved by the Board.
Forward foreign exchange contracts are normally valued on the basis of independent pricing service providers. A Valuation Committee, made up of officers of the Fund and employees of the Adviser, is responsible for determining, in accordance with the Fund’s valuation policies and procedures approved by the Board: (1) whether market quotations are readily available for investments held by the Fund; and (2) the fair value of investments held by the Fund for which market quotations are not readily available or are deemed not reliable by the Adviser. In certain cases, authorized pricing service vendors may not provide prices for a security held by the Fund, or the price provided by such
20
Barings Global Short Duration High Yield Fund 2019 Semi-Annual Report
NOTES TO THE FINANCIAL STATEMENTS (CONTINUED) |
| June 30, 2019 (Unaudited) |
pricing service vendor is deemed unreliable by the Adviser. In such cases, the Fund may use market maker quotations provided by an established market maker for that security (i.e. broker quotes) to value the security if the Adviser has experience obtaining quotations from the market maker and the Adviser determines that quotations obtained from the market maker in the past have generally been reliable (or, if the Adviser has no such experience with respect to a market maker, it determines based on other information available to it that quotations obtained by it from the market maker are reasonably likely to be reliable). In any such case, the Adviser will review any market quotations so obtained in light of other information in its possession for their general reliability.
Bank loans in which the Fund may invest have similar risks to lower-rated fixed income securities. Changes in the financial condition of the borrower or economic conditions or other circumstances may reduce the capacity of the borrower to make principal and interest payments on such instruments and may lead to defaults. Senior secured bank loans are supported by collateral; however, the value of the collateral may be insufficient to cover the amount owed to the Fund. By relying on a third party to administer a loan, the Fund is subject to the risk that the third party will fail to perform it obligations. The loans in which the Fund will invest are largely floating rate instruments; therefore, the interest rate risk generally is lower than for fixed-rate debt obligations. However, from the perspective of the borrower, an increase in interest rates may adversely affect the borrower’s financial condition. Due to the unique and customized nature of loan agreements evidencing loans and the private syndication thereof, loans are not as easily purchased or sold as publicly traded securities. Although the range of investors in loans has broadened in recent years, there can be no assurance that future levels of supply and demand in loan trading will provide the degree of liquidity which currently exists in the market. In addition, the terms of the loans may restrict their transferability without borrower consent. These factors may have an adverse effect on the market price and the Fund’s ability to dispose of particular portfolio investments. A less liquid secondary market also may make it more difficult for the Fund to obtain precise valuations of the high yield loans in its portfolio.
The Fund may invest in collateralized debt obligations (“CDOs”), which include collateralized bond obligations (“CBOs”) and collateralized loan obligations (“CLOs”).
CBOs and CLOs are types of asset-backed securities. A CDO is an entity that is backed by a diversified pool of debt securities (CBOs) or syndicated bank loans (CLOs). The cash flows of the CDO can be split into multiple segments, called “tranches,” which will vary in risk profile and yield. The riskiest segment is the subordinated or “equity” tranche. This tranche bears the greatest risk of defaults from the underlying assets in the CDO and serves to protect the other, more senior, tranches from default in all but the most severe circumstances. Since it is shielded from defaults by the more junior tranches, a “senior” tranche will typically have higher credit ratings and lower yields than their underlying securities, and often receive investment grade ratings from one or more of the nationally recognized rating agencies. Despite the protection from the more junior tranches, senior tranches can experience substantial losses due to actual defaults, increased sensitivity to future defaults and the disappearance of one or more protecting tranches as a result of changes in the credit profile of the underlying pool of assets.
Fair value is defined as the price that would be received to sell an asset or paid to transfer a liability in an orderly transaction between market participants at the measurement date. A three-tier hierarchy is utilized to maximize the use of observable market data and minimize the use of unobservable inputs and to establish classification of fair value measurements for disclosure purposes. Inputs refer broadly to the assumptions that market participants would use in pricing the asset or liability, including assumptions about risk. For example, market participants would consider the risk inherent in a particular valuation technique used to measure fair value, such as a pricing model, and/or the risk inherent in the inputs to the valuation technique. Inputs may be observable or unobservable. Observable inputs are inputs that reflect the assumptions market participants would use in pricing the asset or liability and are developed based on market data obtained from sources independent of the reporting entity. Unobservable inputs are inputs that reflect the reporting entity’s own assumptions about the assumptions market participants would use in pricing the asset or liability and are developed based on the best information available in the circumstances. The three-tier hierarchy of inputs is summarized in the three broad levels listed below.
Level 1 – quoted prices in active markets for identical securities
21
Barings Global Short Duration High Yield Fund 2019 Semi-Annual Report
NOTES TO THE FINANCIAL STATEMENTS (CONTINUED) |
| June 30, 2019 (Unaudited) |
Level 2 – other significant observable inputs (including quoted prices for similar securities, interest rates, prepayment speeds, credit risk, etc.)
Level 3 – significant unobservable inputs (including the Fund’s own assumptions in determining the fair value of investments)
The availability of observable inputs can vary from security to security and is affected by a wide variety of factors, including, for example, the type of security, whether the security is new and not yet established in the marketplace, the liquidity of markets, and other characteristics particular to the security. To the extent that valuation is based on models or inputs that are less observable or unobservable in the market, the determination of fair value requires more judgment. Accordingly, the degree of judgment exercised in determining fair value is greatest for instruments categorized in Level 3.
The inputs used to measure fair value may fall into different levels of the fair value hierarchy. In such cases, for disclosure purposes, the level in the fair value hierarchy within which the fair value measurement falls in its entirety is determined based on the lowest level input that is significant to the fair value measurement in its entirety.
The following is a summary of the inputs used as of June 30, 2019 in valuing the Fund’s investments:
| DESCRIPTION | | LEVEL 1 | | | LEVEL 2 | | | LEVEL 3 | | TOTAL INVESTMENTS |
| | | | | | | | | | | | | |
| Assets: | | | | | | | | | | | | |
| Equities: | | | | | | | | | | | | |
| Common Stocks | | $ | — | | | $ | 8,224,309 | | | $ | 3,302,895 | | | $ | 11,527,204 | |
| Preferred Stocks | | | — | | | | — | | | | 123,152 | | | | 123,152 | |
| Warrants | | | — | | | | 56,063 | | | | — | | | | 56,063 | |
| Total Equities: | | $ | — | | | $ | 8,280,372 | | | $ | 3,426,047 | | | $ | 11,706,419 | |
| | | | | | | | | | | | | | | | | |
| Fixed Income: | | | | | | | | | | | | | | | | |
| Asset-Backed Securities | | $ | — | | | $ | 28,495,026 | | | $ | — | | | $ | 28,495,026 | |
| Bank Loans | | | — | | | | 59,219,588 | | | | 2,540,684 | | | | 61,760,272 | |
| Corporate Bonds | | | — | | | | 408,526,878 | | | | — | | | | 408,526,878 | |
| Total Fixed Income | | $ | — | | | $ | 496,241,492 | | | $ | 2,540,684 | | | $ | 498,782,176 | |
| Total Assets | | $ | — | | | $ | 504,521,864 | | | $ | 5,966,731 | | | $ | 510,488,595 | |
| | | | | | | | | | | | | | | | | |
| Liabilities: | | | | | | | | | | | | | | | | |
| Foreign Exchange Contracts | | $ | — | | | $ | 171,657 | | | $ | — | | | $ | 171,657 | |
| Total Liabilities: | | $ | — | | | $ | 171,657 | | | $ | — | | | $ | 171,657 | |
22
Barings Global Short Duration High Yield Fund 2019 Semi-Annual Report
NOTES TO THE FINANCIAL STATEMENTS (CONTINUED) |
| June 30, 2019 (Unaudited) |
The following table is a summary of quantitative information about significant unobservable valuation inputs for Level 3 fair value measurement for investments held as of June 30, 2019:
| TYPE OF ASSETS | | FAIR VALUE AS OF
JUNE 30, 2019 | | VALUATION
TECHNIQUE(S) | UNOBSERVABLE INPUT |
| | | | | | | | |
| Equities | | | | | | | |
| Boomerang Tube Holdings, Inc. | | | $ | 3,023,547 | | | Model Price | Average Enterprise Valuation Multiple: 5 year projection, 5.5x; EBITDA: $42.0 million, 15% discount rate. |
| Pinnacle Operating Corp. | | | $ | 123,152 | | | Broker Quote | $0.10; Broker Quote depth of 1. |
| Templar Energy LLC | | | $ | 50,772 | | | Broker Quote | $0.48; Broker Quote depth of 1. |
| Templar Energy LLC | | | $ | 228,576 | | | Broker Quote | $2.38; Broker Quote depth of 1. |
| Second Lien Term Loans | | | | | | | | |
| Boomerang Tube, LLC | | | $ | 2,540,684 | | | Model Price | Average Enterprise Valuation Multiple: 5 year projection, 5.5x; EBITDA: $42.0 million, 15% discount rate. |
Boomerang Tube, LLC restructured its debt securities on November 1, 2018. The Fund subsequently received new debt and equity securities, all of which are considered Level 3.
Although the Fund believes the valuation methods described above are appropriate, the use of different methodologies or assumptions to determine fair value could result in different estimates of fair value at the reporting date.
The Fund discloses transfers between levels based on valuations at the end of the reporting period. The following is a reconciliation of Level 3 investments based upon the inputs used to determine fair value:
| | BALANCE
AT
DECEMBER 31,
2018 | TRANSFERS
INTO
LEVEL 3 | TRANSFERS
OUT OF
LEVEL 3 | PURCHASES | SALES | ACCRETION
OF
DISCOUNT | REALIZED
GAIN /
(LOSS) | CHANGE
IN
UNREALIZED | BALANCE
AT
JUNE 30,
2019 | CHANGE IN
UNREALIZED
APPRECIATION /
(DEPRECIATION)
FROM
INVESTMENTS
HELD AS OF
JUNE 30,
2019 |
| | | | | | | | | | | |
| Equities | | | | | | | | | | | | | | | | | | | | | | | | | | | | | | |
| Common Stocks | | $ | 4,000,008 | | | $ | 0 | | | $ | (187,528 | ) | | $ | 150,190 | | | $ | 0 | | | $ | 0 | | | $ | 0 | | | $ | (659,775 | ) | | $ | 3,302,895 | | | $ | (659,775 | ) |
| Preferred Stocks | | $ | 136,835 | | | $ | 0 | | | $ | 0 | | | $ | 0 | | | $ | 0 | | | $ | 0 | | | $ | 0 | | | $ | (13,683 | ) | | $ | 123,152 | | | $ | (13,683 | ) |
| Warrants | | $ | 20,268 | | | $ | 0 | | | $ | (20,268 | ) | | $ | 0 | | | $ | 0 | | | $ | 0 | | | $ | 0 | | | $ | 0 | | | $ | 0 | | | $ | 0 | |
| Total Equities | | $ | 4,157,111 | | | $ | 0 | | | $ | (207,796 | ) | | $ | 150,190 | | | $ | 0 | | | $ | 0 | | | $ | 0 | | | $ | (673,458 | ) | | $ | 3,426,047 | | | $ | (673,458 | ) |
| Fixed Income Bank Loans | | $ | 2,540,684 | | | $ | 0 | | | $ | 0 | | | $ | 0 | | | $ | 0 | | | $ | 0 | | | $ | 0 | | | $ | 0 | | | $ | 2,540,684 | | | $ | 0 | |
| Total Fixed Income | | $ | 2,540,684 | | | $ | 0 | | | $ | 0 | | | $ | 0 | | | $ | 0 | | | $ | 0 | | | $ | 0 | | | $ | 0 | | | $ | 2,540,684 | | | $ | 0 | |
| Total | | $ | 6,697,795 | | | $ | 0 | | | $ | (207,796 | ) | | $ | 150,190 | | | $ | 0 | | | $ | 0 | | | $ | 0 | | | $ | (673,458 | ) | | $ | 5,966,731 | | | $ | (673,458 | ) |
23
Barings Global Short Duration High Yield Fund 2019 Semi-Annual Report
NOTES TO THE FINANCIAL STATEMENTS (CONTINUED) |
| June 30, 2019 (Unaudited) |
| B.
| Cash and Cash Equivalents |
Cash and cash equivalents consist principally of short term investments that are readily convertible into cash and have original maturities of three months or less. At June 30, 2019, all cash and cash equivalents are held by U.S. Bank, N.A.
| C.
| Investment Transactions, Related Investment Income and Expenses |
Investment transactions are accounted for on a trade-date basis. Interest income is recorded on the accrual basis, including the amortization of premiums and accretion of discounts on bonds held using the yield-to-maturity method.
Interest income from securitized investments in which the Fund has a beneficial interest, such as the “equity” security class of a CLO vehicle (typically in the form of income or subordinated notes), is recorded upon receipt. The accrual of interest income related to these types of securities is periodically reviewed and adjustments are made as necessary.
Realized gains and losses on investment transactions and unrealized appreciation and depreciation of investments are reported for financial statement and Federal income tax purposes on the identified cost method.
Expenses are recorded on the accrual basis as incurred.
The preparation of financial statements in conformity with U.S. GAAP requires management to make estimates and assumptions that affect the reported amounts of assets and liabilities and disclosure of contingent assets and liabilities at the date of the financial statements and the reported amounts of revenues and expenses during the reporting period. Actual results could differ from those estimates.
| E.
| Federal Income Taxation |
The Fund has elected to be taxed as a Regulated Investment Company (“RIC”) under sub-chapter M of the U.S. Internal Revenue Code of 1986, as amended, and intends to maintain this qualification and to distribute substantially all of its net taxable income to its shareholders.
| F. | Dividends and Distributions |
The Fund declares and pays dividends monthly from net investment income. To the extent that these distributions exceed net investment income, they may be classified as return of capital. The Fund also pays a distribution at least annually from its net realized capital gains, if any. Dividends and distributions are recorded on the ex-dividend date. All common shares have equal dividend and other distribution rights. A notice disclosing the source(s) of a distribution will be provided if payment is made from any source other than net investment income. Any such notice would be provided only for informational purposes in order to comply with the requirements of Section 19(a) of the 1940 Act and not for tax reporting purposes. The tax composition of the Fund’s distributions for each calendar year is reported on Internal Revenue Service Form 1099-DIV.
Dividends from net investment income and distributions from realized gains from investment transactions have been determined in accordance with Federal income tax regulations and may differ from net investment income and realized gains recorded by the Fund for financial reporting purposes. These differences, which could be temporary or permanent in nature may result in reclassification of distributions; however, net investment income, net realized gains and losses, and net assets are not affected.
| G.
| Derivative Instruments |
The following is a description of the derivative instruments that the Fund utilizes as part of its investment strategy, including the primary underlying risk exposures related to the instrument.
Forward Foreign Exchange Contracts – The Fund is subject to foreign currency exchange rate risk in the normal course of pursuing its investment objectives. The Fund transacted in and currently holds forward foreign exchange contracts to hedge against changes in the value of foreign currencies. The Fund entered into forward foreign exchange contracts obligating the Fund to deliver or receive a currency at a specified future date. Forward foreign exchange contracts are valued daily and unrealized appreciation or depreciation is recorded daily as the difference between the contract exchange rate and the closing forward rate applied to the face amount of the contract. A realized gain or loss is recorded at the time the forward contract expires. Credit risk may arise as a result of the failure of the counterparty to comply with the terms of the contract. The Fund considers the creditworthiness of each counterparty to a contract in evaluating potential credit risk quarterly. The Fund is also subject to credit risk with respect to the counterparties to
24
Barings Global Short Duration High Yield Fund 2019 Semi-Annual Report
NOTES TO THE FINANCIAL STATEMENTS (CONTINUED) |
| June 30, 2019 (Unaudited) |
the derivative contracts which are not cleared through a central counterparty but instead are traded over-the-counter between two counterparties. If a counterparty to an over-the-counter derivative becomes bankrupt or otherwise fails to perform its obligations under a derivative contract due to financial difficulties, the Fund may experience significant delays in obtaining any recovery under the derivative contract in a bankruptcy or other reorganization proceeding. The Fund may obtain only a limited recovery or may obtain no recovery in such circumstances. The counterparty risk for cleared derivatives is generally lower than for uncleared over-the-counter derivative transactions since generally a clearing organization becomes substituted for each counterparty to a cleared derivative contract and, in effect, guarantees the parties’ performance under the contract as each party to a trade looks only to the clearing house for performance of financial obligations. However, there can be no assurance that the clearing house, or its members, will satisfy its obligations to the Fund. In addition, in the event of a bankruptcy of a clearing house, the Fund could experience a loss of the funds deposited with such clearing house as margin and any profits on its open positions. The counterparty risk to the Fund is limited to the net unrealized gain, if any, on the contract.
The use of forward foreign exchange contracts does not eliminate fluctuations in the underlying prices of the Fund’s investment securities; however, it does establish a rate of exchange that can be achieved in the future. The use of forward foreign exchange contracts involves the risk that anticipated currency movements will not be accurately predicted. A forward foreign exchange contract would limit the risk of loss due to a decline in the value of a particular currency; however, it would also limit any potential gain that might result should the value of the currency increase instead of decrease. These contracts may involve market risk in excess of the amount of receivable or payable reflected on the Statement of Assets and Liabilities.
The Fund recognized a liability on the Statement of Assets and Liabilities as a result of forward foreign exchange contracts with J.P. Morgan, The Bank of New York Mellon, and Morgan Stanley. The Fund’s policy is to recognize an asset equal to the net value of all forward foreign exchange contracts with an unrealized gain and a liability equal to the net value of all forward foreign exchange contracts with an unrealized loss. The Fund has recognized a liability of $730,196 in net unrealized depreciation on forward foreign exchange contracts. Outstanding forward foreign exchange contracts as of June 30, 2019 are indicative of the volume of activity during the period.
For the six months ended June 30, 2019, the Fund’s direct investment in derivatives consisted of forward foreign exchange contracts.
The following is a summary of the fair value of derivative instruments held directly by the Fund as of June 30, 2019. These derivatives are presented in the Schedule of Investments.
Fair values of derivative instruments on the Statement of Assets and Liabilities as of June 30, 2019:
| DERIVATIVES | STATEMENT OF ASSETS
AND LIABILITIES
LOCATION | | FAIR
VALUE | |
| Liability Derivatives | | | | |
| Forward Foreign | | | | |
| Exchange | | | | |
| Contracts | Unrealized Depreciation | | $ | 171,657 | |
| Total Liability | | | | | |
| Derivatives | | | $ | 171,657 | |
The effect of derivative instruments on the Statement of Operations for the year ended June 30, 2019:
Amount of Realized Gain/(Loss) on Derivatives
| | FORWARD FOREIGN
EXCHANGE CONTRACTS |
| Derivatives | | | |
| Forward Foreign Exchange | | | |
| Contracts | | $ | 768,324 | |
| Total | | $ | 768,324 | |
Change in Unrealized Appreciation/(Depreciation) on Derivatives
| | FORWARD FOREIGN
EXCHANGE CONTRACTS |
| Derivatives | | | |
| Forward Foreign Exchange | | | |
| Contracts | | $ | 558,539 | |
| Total | | $ | 558,539 | |
25
Barings Global Short Duration High Yield Fund 2019 Semi-Annual Report
NOTES TO THE FINANCIAL STATEMENTS (CONTINUED) |
| June 30, 2019 (Unaudited) |
| H.
| Disclosures about Offsetting Assets and Liabilities |
The following is a summary by counterparty of the fair value of derivative investments subject to Master Netting Agreements and collateral pledged (received), if any, as of June 30, 2019.
| | J.P. MORGAN |
| Liabilities: | | | |
| Forward foreign exchange contracts | | $ | 171,657 | |
| Total Liabilities | | $ | 171,657 | |
| Net Exposure | | $ | (171,657 | ) |
The Financial Accounting Standards Board (“FASB”) issued Accounting Standards Update (“ASU”) No. 2011-11 “Disclosures about Offsetting Assets and Liabilities” (“ASU 2011-11”). These disclosure requirements are intended to help better assess the effect or potential effect of offsetting arrangements on a Fund’s financial position. In addition, FASB issued Accounting Standards Update No. 2013-01 “Clarifying the Scope of Offsetting Assets and Liabilities” (“ASU 2013-01”), specifying which transactions are subject to disclosures about offsetting. In order to better define its contractual rights and to secure rights that will help the Fund mitigate its counterparty risk, the Fund may enter into an International Swaps and Derivatives Association, Inc. Master Agreement (“ISDA Master Agreement”) or similar agreement with its counterparties. An ISDA Master Agreement is a bilateral agreement between the Fund and a counterparty that governs certain OTC derivatives and typically contains, among other things, collateral posting terms and netting provisions in the event of a default and/or termination event. Under an ISDA Master Agreement, the Fund may, under certain circumstances, offset with the counterparty certain derivative financial instruments’ payables and/or receivables with collateral held and/or posted and create one single net payment. The provisions of the ISDA Master Agreement typically permit a single net payment in the event of default including the bankruptcy or insolvency of the counterparty. Bankruptcy or insolvency laws of a particular jurisdiction may restrict or prohibit the right of offset in bankruptcy, insolvency or other events. In addition, certain ISDA Master Agreements allow counterparties to terminate derivative contracts prior to maturity in the event the Fund’s net assets decline by a stated percentage or the Fund fails to meet the terms of its ISDA Master Agreements. The result would cause the Fund to accelerate payment of any net liability owed to the counterparty.
For derivatives traded under an ISDA Master Agreement, the collateral requirements are typically calculated by netting the mark to market amount for each transaction under such agreement and comparing that amount to the value of any collateral currently pledged by the Fund and the counterparty.
Cash collateral that has been pledged to cover obligations of the Fund and cash collateral received from the counterparty, if any, is reported separately on the Statement of Assets and Liabilities as cash collateral held at broker or cash collateral due to broker, respectively. Non-cash collateral pledged by or received by the Fund, if any, is noted in the Schedule of Investments. Generally, the amount of collateral due from or to a party has to exceed a minimum transfer amount threshold before a transfer is required, which is determined each day at the close of business of the Fund, typically based on changes in market values for each transaction under an ISDA Master Agreement and netted into one amount for such agreement and any additional required collateral is delivered to/pledged by the Fund on the next business day. Typically, the Fund and counterparties are not permitted to sell, re-pledge or use the collateral they receive. To the extent amounts due to the Fund from its counterparties are not fully collateralized, contractually or otherwise, the Fund bears the risk of loss from counterparty non-performance. The Fund attempts to mitigate counterparty risk by entering into agreements only with counterparties that they believe have the financial resources to honor their obligations and by monitoring the financial stability of those counterparties.
Investing in securities of foreign companies and foreign governments involves special risks and considerations not typically associated with investing in U.S. companies and the U.S. government. These risks include valuation of currencies and adverse political and economic developments. Moreover, securities of many foreign companies, foreign governments, and their markets may be less liquid and their prices more volatile than those of securities of comparable U.S. companies and the U.S. government.
| J. | Foreign Currency Translation |
The books and records of the Fund are maintained in U.S. dollars. Foreign currency transactions are translated into U.S. dollars on the following basis: (i) market value of investment securities, assets and liabilities at the daily
26
Barings Global Short Duration High Yield Fund 2019 Semi-Annual Report
NOTES TO THE FINANCIAL STATEMENTS (CONTINUED) |
| June 30, 2019 (Unaudited) |
rates of exchange, and (ii) purchases and sales of investment securities, dividend and interest income and certain expenses at the rates of exchange prevailing on the respective dates of such transactions. For financial reporting purposes, the Fund does not isolate changes in the exchange rate of investment securities from the fluctuations arising from changes in the market prices of securities. However, for Federal income tax purposes, the Fund does isolate and treat as ordinary income the effect of changes in foreign exchange rates on realized gain or loss from the sale of investment securities and payables and receivables arising from trade-date and settlement-date differences.
The Fund seeks to manage counterparty credit risk by entering into agreements only with counterparties the Adviser believes have the financial resources to honor their obligations. The Adviser monitors the financial stability of the Fund’s counterparties.
| L.
| Disclosures about Offsetting Assets and Liabilities |
The FASB issued Accounting Standards Update (“ASU”) No. 2011-11 “Disclosures about Offsetting Assets and Liabilities” (“ASU 2011-11”). These disclosure requirements are intended to help better assess the effect or potential effect of offsetting arrangements on a Fund’s financial position. In addition, FASB issued Accounting Standards Update No. 2013-01 “Clarifying the Scope of Offsetting Assets and Liabilities” (“ASU 2013-01”), specifying which transactions are subject to disclosures about offsetting. In order to better define its contractual rights and to secure rights that will help the Fund mitigate its counterparty risk, the Fund may enter into an International Swaps and Derivatives Association, Inc. Master Agreement (“ISDA Master Agreement”) or similar agreement with its counterparties. An ISDA Master Agreement is a bilateral agreement between the Fund and a counterparty that governs certain OTC derivatives and typically contains, among other things, collateral posting terms and netting provisions in the event of a default and/or termination event. Under an ISDA Master Agreement, the Fund may, under certain circumstances, offset with the counterparty certain derivative financial instruments’ payables and/or receivables with collateral held and/or posted and create one single net payment. The provisions of the ISDA Master Agreement typically permit a single net payment in the event of default including the bankruptcy or insolvency of the counterparty. Bankruptcy or insolvency laws of a particular jurisdiction may restrict or prohibit the right of offset in bankruptcy, insolvency or other events. In addition, certain ISDA Master Agreements allow counterparties to terminate derivative contracts prior to maturity in the event the Fund’s net assets decline by a stated percentage or the Fund fails to meet the terms of its ISDA Master Agreements. The result would cause the Fund to accelerate payment of any net liability owed to the counterparty.
For derivatives traded under an ISDA Master Agreement, the collateral requirements are typically calculated by netting the mark to market amount for each transaction under such agreement and comparing that amount to the value of any collateral currently pledged by the Fund and the counterparty.
Cash collateral that has been pledged to cover obligations of the Fund and cash collateral received from the counterparty, if any, is reported separately on the Statement of Assets and Liabilities as cash collateral held at broker or cash collateral due to broker, respectively. Non-cash collateral pledged by or received by the Fund, if any, is noted in the Schedule of Investments. Generally, the amount of collateral due from or to a party has to exceed a minimum transfer amount threshold before a transfer is required, which is determined each day at the close of business of the Fund, typically based on changes in market values for each transaction under an ISDA Master Agreement and netted into one amount for such agreement and any additional required collateral is delivered to/pledged by the Fund on the next business day. Typically, the Fund and counterparties are not permitted to sell, re-pledge or use the collateral they receive. To the extent amounts due to the Fund from its counterparties are not fully collateralized, contractually or otherwise, the Fund bears the risk of loss from counterparty non-performance. The Fund attempts to mitigate counterparty risk by entering into agreements only with counterparties that they believe have the financial resources to honor their obligations and by monitoring the financial stability of those counterparties.
| M.
| New Accounting Pronouncements |
As of November 5, 2018, pursuant to the Securities and Exchange Commission (“SEC”) Release #33-10532 “Disclosure Update and Simplification”, the Fund has adopted the amendments pertinent to Regulation S-X in this report. The amendments impacted certain disclosure presentation on the Statement of Assets and Liabilities, Statements of Changes in Nett Assets and Notes to the Financial Statements.
27
Barings Global Short Duration High Yield Fund 2019 Semi-Annual Report
NOTES TO THE FINANCIAL STATEMENTS (CONTINUED) |
| June 30, 2019 (Unaudited) |
In August 2018, the FASB issued ASU No. 2018-13, “Fair Value Measurement (Topic 820: Disclosure Framework –Changes to the Disclosure Requirements for Fair Value Measurement”. ASU 2018-13 eliminates the requirement to disclose the amount of and reasons for transfers between Level 1 and Level 2 of the fair value hierarchy, the timing of transfers between levels of the fair value hierarchy and the valuation processes for Level 3 fair value measurements. ASU 2018-13 will require the need to disclose the range and weighted average used to develop significant unobservable inputs for Level 3 fair value measurements and the changes in unrealized gains and losses for recurring Level 3 fair value measurements. ASU 2018-13 will also require that information is provided about the measurement uncertainty of Level 3 fair value measurements as of the reporting date. The guidance is effective for fiscal years, and interim periods within those fiscal years, beginning after December 15, 2019 and allows for early adoption of either the entire standard or only the provisions that eliminate or modify the requirements. The Fund has elected to early adopt the provisions that eliminate disclosure requirements. Management is still currently evaluating the impact of applying the rest of the guidance to the Fund.
In March 2017, the FASB issued ASU 2017-08, Receivables – Nonrefundable Fees and Other Costs (Subtopic 310-20): Premium Amortization on Purchased Callable Debt Securities, which amends the amortization period for certain purchased callable debt securities. Under ASU 2017-08, the premium amortization of purchased callable debt securities that have explicit, non-contingent call features and are callable at fixed prices will be amortized to the earliest call date. ASU 2017-08 will be applied on a modified retrospective basis and is effective for fiscal years, and their interim periods, beginning after December 15, 2018. Management is currently evaluating the impact of this guidance to the Fund.
The Fund has entered into an Investment Management Agreement (the “Agreement”) with the Adviser, a related party. Pursuant to the Agreement, the Fund has agreed to pay the Adviser a fee payable at the end of each calendar month, at an annual rate of 1.00% of the Fund’s average daily managed assets during such month. Managed assets are the total assets of the Fund, which include any assets attributable to leverage such as assets attributable to reverse repurchase agreements, or bank loans, minus the sum of the Fund’s accrued liabilities (other than liabilities incurred for the purpose of leverage).
Subject to the supervision of the Adviser and the Board, the Sub-Adviser manages the investment and reinvestment of a portion of the assets of the Fund, as allocated from time to time. As compensation for its services, the Adviser (not the Fund) pays the Sub-Adviser a portion of the investment management fee it receives from the Fund, in an amount in U.S. dollars equal to 35% of such investment management fee (“Sub-Advisory Fee”).
The Fund has engaged U.S. Bancorp Fund Services, LLC, d/b/a U.S. Bank Global Fund Services (“Fund Services”) to serve as the Fund’s administrator, fund accountant, and transfer agent. The Fund has engaged U.S. Bank, N.A. to serve as the Fund’s custodian. The Fund has agreed to pay Fund Services a fee payable at the end of each calendar month, at an annual rate of 0.075% of the Fund’s average daily managed assets.
It is the Fund’s intention to qualify as a RIC under sub-chapter M of the Internal Revenue Code and distribute all of its taxable income. Accordingly, no provision for federal income taxes is required in the financial statements.
The tax character of dividends paid to shareholders during the tax years ended in 2018 and 2017, as noted below, was as follows:
| | | 2018 | | | 2017 | |
| Ordinary Income | | $ | 35,670,878 | | | $ | 32,762,778 | |
| Net Long Term Capital Gains | | | — | | | | — | |
| Return of Capital | | | — | | | | 4,159,710 | |
| Total Distributions Paid | | $ | 35,670,878 | | | $ | 36,922,488 | |
The amount and character of income and capital gain distributions to be paid, if any, are determined in accordance with federal income tax regulations, which may differ from U.S. GAAP.
28
Barings Global Short Duration High Yield Fund 2019 Semi-Annual Report
NOTES TO THE FINANCIAL STATEMENTS (CONTINUED) |
| June 30, 2019 (Unaudited) |
The following information is provided on a tax basis as of December 31, 2018:
| Cost of investments | | $ | 552,363,741 | |
| Unrealized appreciation | | | 9,151,103 | |
| Unrealized depreciation | | | (50,355,616 | ) |
| Net unrealized appreciation/ (depreciation) | | | (41,204,513 | ) |
| Undistributed ordinary income | | | 2,101,443 | |
| Undistributed long term gains | | | — | |
| Distributable earnings | | | 2,101,443 | |
| Other accumulated gain/(loss) | | | (62,964,364 | ) |
| Total accumulated gain/(loss) | | | (102,067,434 | ) |
The capital loss carryforward is available to offset future taxable income. The Fund has the following capital loss amounts:
| 2018 | | 2019 | | | 2020 | | | UNLIMITED –
SHORT TERM | | | UNLIMITED –
LONG TERM | |
| $ | —
| | $ | — | | | $ | — | | | $ | 12,613,356 | | | $ | 50,350,829 | |
The Fund recognizes the tax benefits of uncertain tax positions only where the position is “more likely than not” to be sustained assuming examination by tax authorities. Management has analyzed the Fund’s tax positions, and has concluded that no liability for unrecognized tax benefits should be recorded related to uncertain tax positions taken on U.S. tax returns and state tax returns filed since inception of the Fund. No income tax returns are currently under examination. All tax years since commencement of operations remain subject to examination by the tax authorities in the U.S. Due to the nature of the Fund’s investments, the Fund may be required to file income tax returns in several states. The Fund is not aware of any tax positions for which it is reasonably possible that the total amounts of unrecognized tax benefits will change materially in the next 12 months.
| 6. | Investment Transactions |
For the six months ended June 30, 2019, the Fund purchased (at cost) and sold securities in the amount of $166,653,265 and $171,985,704 (excluding short-term debt securities), respectively.
On November 8, 2012, the Fund entered into a $200,000,000 credit facility with BNP Paribas Prime Brokerage International, Ltd (“BNP”). On January 6, 2014, the Fund entered into an amended agreement with a variable annual interest rate of three-month LIBOR plus 0.80 percent. Unused portions of the credit facility will accrue a commitment fee equal to an annual rate of 0.65 percent.
The average principal balance and interest rate for the period during which the credit facility was utilized for the six months ended June 30, 2019 was approximately $158,000,000 and 3.40 percent, respectively. At June 30, 2019, the principal balance outstanding was $155,200,000 at an interest rate of 3.12 percent.
If measured at fair value, borrowings under the credit facility would have been considered as Level 2 in the fair value hierarchy (see Note 2A) at June 30, 2019.
Through an agreement with the Fund, BNP may lend out securities the Fund has pledged as collateral on the note payable. In return, the Fund receives additional income that is netted against the interest charged on the outstanding credit facility balance. As of June 30, 2019, the total amount of income netted against the interest expense is $41,805.
The Fund has unlimited shares authorized and 20,057,849 shares outstanding at December 31, 2018 and June 30, 2019.
10.
| Aggregate Remuneration Paid to Officers, Trustees and Their Affiliated Persons |
For the six months ended June 30, 2019, the Fund paid its Trustees aggregate remuneration of $40,307. During the period, the Fund did not pay any compensation to any of its Trustees who are “interested persons” (as defined by the 1940 Act) of the Fund. The Fund classifies Mr. Finke as an interested person of the Fund.
All of the Fund’s officers are employees of the Adviser. Pursuant to the Agreement, the Fund does not compensate its officers who are employees of the Adviser (except for the Chief Compliance Officer of the Fund unless assumed by the Adviser). For the six months ended June 30, 2019, the Adviser paid the compensation of the Chief Compliance Officer of the Fund.
29
Barings Global Short Duration High Yield Fund 2019 Semi-Annual Report
NOTES TO THE FINANCIAL STATEMENTS (CONTINUED) |
| June 30, 2019 (Unaudited) |
The Fund did not make any payments to the Adviser for the six months ended June 30, 2019, other than the amounts payable to the Adviser pursuant to the Agreement.
Prior to August 8, 2019, the Fund was subject to a non-fundamental investment restriction limiting the Fund’s investment in high yield investments rated in lower rated categories (Caa1 or lower by Moody’s, and CCC+ or lower by S&P and Fitch) to 10% of its Managed Assets, but on that date, the Fund’s Board of Trustees voted to remove that non-fundamental restriction. While the Adviser believes that the elimination of this restriction is in the best interests of Fund shareholders, to the extent this flexibility is utilized it will result in the Fund being subject to greater credit risk. The Board of Trustees also approved removing the Fund’s non-fundamental investment restriction of maintaining a portfolio with a weighted average maturity of five years or less; however, the Fund will continue to maintain a weighted average portfolio duration, including the effects of leverage, of three years or less.
30
| Barings Global Short Duration High Yield Fund 2019 Semi-Annual Report |
FUND DIVIDEND REINVESTMENT PLAN |
INDEPENDENT TRUSTEES
Rodney J. Dillman
Chairman, Trustee Dr. Bernard A. Harris, Jr.
Trustee Thomas W. Okel
Trustee Cynthia R. Plouché
Trustee Martin A. Sumichrast
Trustee OFFICERS
Sean Feeley
President Carlene Pollock
Chief Financial Officer Lesley Mastandrea
Treasurer Michael Freno
Vice President Scott Roth
Vice President Melissa LaGrant
Chief Compliance Officer Janice Bishop
Secretary/Chief Legal Officer Michele Manha
Assistant Secretary Jill Dinerman
Assistant Secretary | | The Fund offers a Dividend Reinvestment Plan (the “Plan”). The Plan provides a simple way for shareholders to add to their holdings in the Fund through the reinvestment of dividends in additional common shares of the Fund. Shareholders will have all dividends, including any capital gain dividends, reinvested automatically in additional shares of the Fund by U.S. Bancorp Fund Services, LLC, as Plan Agent, unless a shareholder elects to receive cash instead. An election to receive cash may be revoked or reinstated at the option of the shareholder. All distributions to investors who elect not to participate in the Plan (or whose broker or nominee elects not to participate on the investor’s behalf) will receive dividends and distributions in cash.
Whenever the Fund declares a dividend payable in cash or shares, the Plan Agent, acting on behalf of each participating shareholder, will take the dividend in shares only if the net asset value per Fund share is equal to or less than the market price per Fund share plus estimated brokerage commissions as of the payment date for the dividend. When the dividend is to be taken in shares, the number of shares to be received is determined by dividing the dollar amount of the cash dividend by the net asset value per Fund share as of the dividend payment date or, if greater than the net asset value per Fund share, 95% of the closing share price on the payment date. Generally, if the net asset value per Fund share is greater than the market price per Fund share plus estimated brokerage commissions as of the dividend payment date, the Plan Agent will endeavor to buy shares on the open market at current prices promptly after the dividend payment date. The reinvestment of dividends does not, in any way, relieve participating shareholders of any Federal, state or local tax. For Federal income tax purposes, the amount reportable in respect of a dividend received in shares of the Fund will be the fair market value of the shares received, which will be reportable as ordinary income and/or capital gains. Investors should consult with their own tax advisors for further information about the tax consequences of dividend reinvestment. There is no brokerage charge for the reinvestment of dividends in additional Fund shares; however, all participants pay a pro rata share of brokerage commissions incurred by the Plan Agent when it makes open market purchases. There is no direct service charge to participants in the Plan, though the Fund reserves the right to amend the Plan to include a service charge payable by participants. Additional information about the Plan may be obtained from, and any questions regarding the Plan should be addressed to, U.S. Bancorp Fund Services, Plan Agent for Barings Global Short Duration High Yield Fund’s Dividend Reinvestment Plan, P.O. Box 701, Milwaukee, WI 52301. |
31
| Barings Global Short Duration High Yield Fund 2019 Semi-Annual Report |  |
| JOINT PRIVACY NOTICE OF BARINGS MANAGEMENT LLC AND |
| BARINGS GLOBAL SHORT DURATION HIGH YIELD FUND |
This privacy notice is being provided on behalf of Barings LLC and its affiliates: Barings Securities LLC; Barings Australia Pty Ltd; Barings Advisers (Japan) KK; Barings Investment Advisers (Hong Kong) Limited; Barings Funds Trust; Barings Global Short Duration High Yield Fund; Barings Corporate Investors and Barings Participation Investors (together, for purposes of this privacy notice, “Barings”).
When you use Barings you entrust us not only with your hard-earned assets but also with your personal and financial data. We consider your data to be private and confidential, and protecting its confidentiality is important to us. Our policies and procedures regarding your personal information are summarized below.
We may collect non-public personal information about you from:
| | ■ | Applications or other forms, interviews, or by other means; |
| | | |
| | ■ | Consumer or other reporting agencies, government agencies, employers or others; |
| | | |
| | ■ | Your transactions with us, our affiliates, or others; and |
| | | |
| | ■ | Our Internet website. |
We may share the financial information we collect with our financial service affiliates, such as insurance companies, investment companies and securities broker-dealers. Additionally, so that we may continue to offer you products and services that best meet your investment needs and to effect transactions that you request or authorize, we may disclose the information we collect, as described above, to companies that perform administrative or marketing services on our behalf, such as transfer agents, custodian banks, service providers or printers and mailers that assist us in the distribution of investor materials or that provide operational support to Barings. These companies are required to protect this information and will use this information only for the services for which we hire them, and are not permitted to use or share this information for any other purpose. Some of these companies may perform such services in jurisdictions other than the United States. We may share some or all of the information we collect with other financial institutions with whom we jointly market products. This may be done only if it is permitted by the state in which you live. Some disclosures may be limited to your name, contact and transaction information with us or our affiliates.
Any disclosures will be only to the extent permitted by federal and state law. Certain disclosures may require us to get an “opt-in” or “opt-out” from you. If this is required, we will do so before information is shared. Otherwise, we do not share any personal information about our customers or former customers unless authorized by the customer or as permitted by law.
We restrict access to personal information about you to those employees who need to know that information to provide products and services to you. We maintain physical, electronic and procedural safeguards that comply with legal standards to guard your personal information. As an added measure, we do not include personal or account information in non-secure e-mails that we send you via the Internet without your prior consent. We advise you not to send such information to us in non-secure e-mails.
This joint notice describes the privacy policies of Barings, the Funds and Barings Securities LLC. It applies to all Barings and the Funds accounts you presently have, or may open in the future, using your social security number or federal taxpayer identification number – whether or not you remain a shareholder of our Funds or as an advisory client of Barings. As mandated by rules issued by the Securities and Exchange Commission, we will be sending you this notice annually, as long as you own shares in the Funds or have an account with Barings.
Barings Securities LLC is a member of the Financial Industry Regulatory Authority (FINRA) and the Securities Investor Protection Corporation (SIPC). Investors may obtain information about SIPC including the SIPC brochure by contacting SIPC online at www.sipc.org or calling (202)-371-8300. Investors may obtain information about FINRA including the FINRA Investor Brochure by contacting FINRA online at www.finra.org or by calling (800) 289-9999.
32
This page intentionally left blank.
Not applicable for semi-annual reports.
Not applicable for semi-annual reports.
Not applicable for semi-annual reports.
Not applicable for semi-annual reports.
Not applicable for semi-annual reports.
Not applicable.
Not Applicable.
The registrant did not engage in securities lending activities during the fiscal period reported on this Form N-CSR.
Filed herewith for President.
Filed herewith for Chief Financial Officer.
Not applicable for this filing.
(b) CERTIFICATIONS PURSUANT TO RULE 30a-2(b) UNDER THE ACT.
Filed herewith.
Pursuant to the requirements of the Securities Exchange Act of 1934 and the Investment Company Act of 1940, the registrant has duly caused this report to be signed on its behalf by the undersigned, thereunto duly authorized.
Pursuant to the requirements of the Securities Exchange Act of 1934 and the Investment Company Act of 1940, this report has been signed below by the following persons on behalf of the registrant and in the capacities and on the dates indicated.
Carlene Pollock, Chief Financial Officer