united states
securities and exchange commission
washington, d.c. 20549
form n-csr
certified shareholder report of registered management
investment companies
Investment Company Act file number 811-22572
Multi-Strategy Growth & Income Fund
(Exact name of registrant as specified in charter)
80 Arkay Drive, Suite 110, Hauppauge, NY 11788
(Address of principal executive offices) (Zip code)
James Ash, Gemini Fund Services, LLC.
80 Arkay Drive, Suite 110, Hauppauge, NY 11788
(Name and address of agent for service)
Registrant's telephone number, including area code: 631-470-2619
Date of fiscal year end: 2/28
Date of reporting period: 2/28/15
Item 1. Reports to Stockholders.

| To Our Shareholders | |
Dear Valued Shareholder:
We thank you for your investment and continued confidence in the Multi-Strategy Growth & Income Fund (“MSFDX” or the “Fund”).
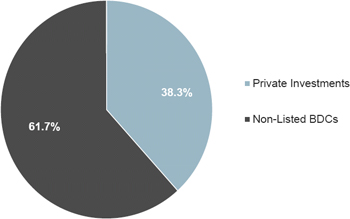
The Fund completed its third fiscal year on February 28, 2015, and ended the period with approximately $200 million in assets under management. This represents growth of more than 50%. We believe this growth demonstrates continued investor interest in the Fund’s strategy, which is focused on seeking competitive, risk-adjusted returns from capital appreciation and income with low correlation to stocks and bonds.
The Fund made great strides during the year, and we are proud to share some of the highlights with you:
Expanded Investment Team
The fund’s adviser added three new members to the investment team with approximately 50 years of combined experience. Mark C. Scalzo came on board as a co-portfolio manager of the Fund. Prior to joining, he oversaw more than $7 billion as the co-portfolio manager and director of research for an independent asset management firm.
Managed Distribution Policy
On February 6, 2015, the board of trustees approved a managed distribution policy for the Fund. Starting with our first distribution in the fiscal year beginning on March 1, 2015, investors will receive a monthly distribution calculated at an annualized rate of approximately 6.00% based on the Fund’s NAV.
New Share Classes
The Fund added three new share classes, providing investors with more choices. The new share classes accounted for more than $20 million of assets under management as of fiscal year-end.
Liquid Equity Income Allocation
Just before the end of the fiscal year, we internalized management of the Fund’s publicly traded equity income portfolio, which was previously sub-advised. Approximately $40 million was redeployed with the goal of increasing yield and improving diversification.
Reduced Transaction Fees
As a result of bringing the management of the publicly traded equity income portfolio in-house, we were able to negotiate a 50% reduction in transaction fees through our affiliated broker-dealer.
Line of Credit
The Fund established a line of credit that may provide greater flexibility in timing its investments and reduce its cash position.
| 1. | This calculation normalizes a quarterly dividend that overlapped the beginning of the fiscal year ended February 28, 2014. There is no guarantee that any investment strategy, including diversification, will result in a profit or protection from loss. The use of leverage through a line of credit will cause the Fund to incur additional expenses and magnify the Fund’s gains and losses. |
Multi-Strategy Growth & Income Fund
| 1 |
Performance
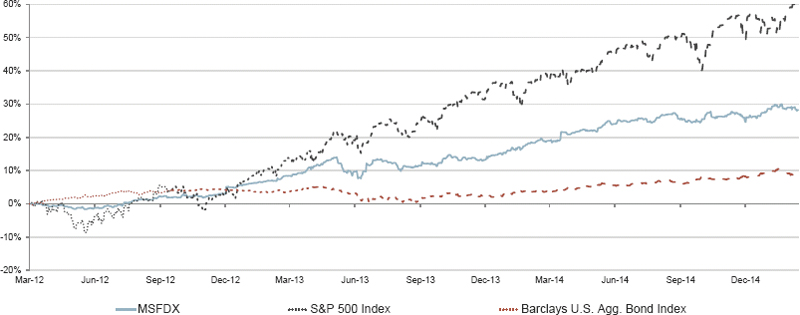
The Fund remains focused on seeking both competitive, risk-adjusted returns from capital appreciation and income with low correlation to stocks and bonds and returns between those of stocks and bonds (see charts below). Please note that charts and graphs are unaudited.
HISTORICAL INVESTMENT GROWTH
HISTORICAL INVESTMENT PERFORMANCE
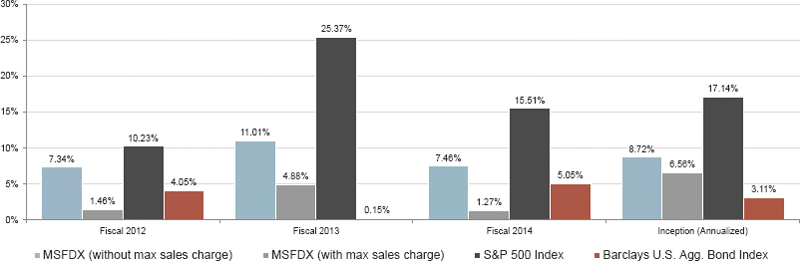
The performance data quoted here represents past performance. Current performance may be lower or higher than the performance data quoted above. Investment return and principal value will fluctuate, so shares may be worth more or less than their original cost when redeemed. Past performance is no guarantee of future results. The Fund’s investment adviser has contractually agreed to reduce its fees and/or absorb expenses of the Fund, at least until June 30, 2015, to ensure that the net annual fund operating expenses will not exceed 1.75% with respect to Class A shares, subject to possible recoupment from the Fund in future years. The Fund’s total annual operating expenses as of 2/28/2015 are 1.55%. Please review the Fund’s prospectus for more detail on the expense waiver. Results shown reflect the waiver, without which the results could have been lower. A fund’s performance, especially for very short periods of time, should not be the sole factor in making your investment decisions. The Fund’s Class A shares are subject to a maximum sales load imposed on purchases of 5.75%. For performance information current to the most recent month end, please call (855) 601-3841 or visit our website, www. growthandincomefund.com.
Total return is calculated assuming reinvestment of all dividends and distributions. The chart does not reflect the deduction of taxes that a shareholder may have to pay on Fund distributions or the redemption of Fund shares.
Multi-Strategy Growth & Income Fund
| 2 |
Distributions
Generating consistent income and increasing distributions are two primary focuses of the Fund.
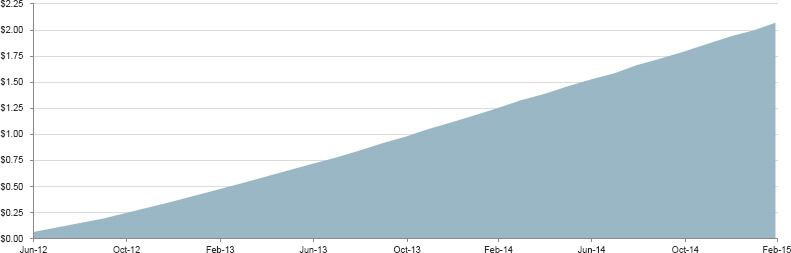
| † | From its inception on March 16, 2012, the Fund has paid cumulative distributions of $2.07 per share, representing 13.8% of its original NAV of $15.00 per share. |
| † | The Fund’s distribution policy is to make monthly distributions to its shareholders at an annualized rate of approximately 6.00% based on the Fund’s NAV. |
CUMULATIVE DISTRIBUTIONS PER SHARE (SINCE INCEPTION)
2014-2015 FISCAL YEAR MONTHLY DISTRIBUTIONS
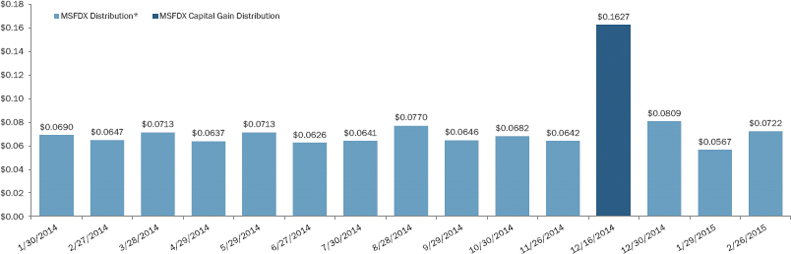
Note: Cumulative distributions represent the Fund’s total regular distributions (excluding capital gain distributions and tax reporting adjustments) per share from inception through the time periods shown in the chart above. Monthly distributions include a return of shareholder capital.
| * | The Fund’s distribution rate amounts were calculated based on the ordinary income received from the underlying investments net of Fund expenses. Net capital gains realized from the disposition of Fund investments, if any, will be paid out annually. The distribution rate does not reflect other non-income items and has not been adjusted for tax reporting purposes. |
Multi-Strategy Growth & Income Fund
| 3 |
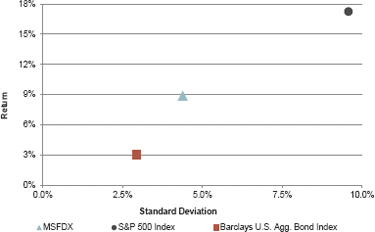
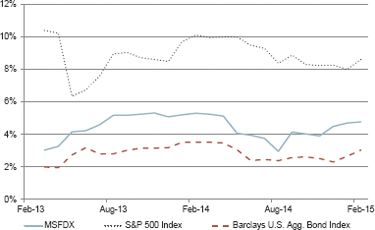
Risk-Adjusted Returns
From its inception on March 16, 2012, the Fund has achieved higher risk-adjusted returns with less volatility on average as compared to stocks and bonds (see table and charts below).
| Risk/Return Statistics | ||||||
| Investment | Standard Deviation | Sharpe Ratio | ||||
| MSFDX | 4.38% | 1.96 | ||||
| S&P 500 Index | 9.57% | 1.71 | ||||
| Barclays U.S Agg. Bond Index | 2.94% | 1.01 |
A higher Sharpe Ratio indicates a higher return per unit of risk as measured by standard deviation.
A lower standard deviation means less volatility as measured by price changes.
| RETURN VS. STANDARD DEVIATION | ROLLING 12-MONTH STANDARD DEVIATION | |
 |  |
As shown in the charts below, from its inception the Fund has captured 161.6% of the upside experienced by bonds and only 21.1% of the downside. Compared to stocks, the Fund has captured 37.3% of the upside and only 4.9% of the downside.
| UP/DOWN CAPTURE VS. BONDS | UP/DOWN CAPTURE VS. STOCKS | |
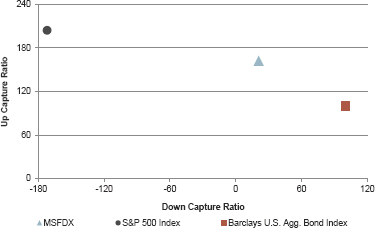 | 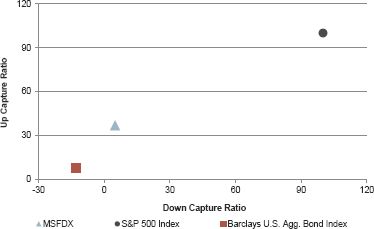 |
Multi-Strategy Growth & Income Fund
| 4 |
Strategy
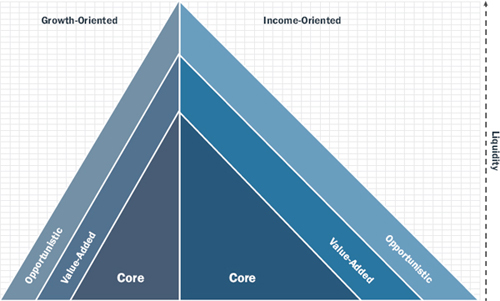
The Fund seeks to maximize risk-adjusted returns and current income with low correlation to the broad stock and bond markets by investing in a diversified portfolio of real estate investment trusts (REITs), alternative investment funds, and debt and equity income securities.
| † | Primary focus on income-producing strategies |
| † | Secondary focus on growth strategies |
| † | Investment universe consisting of liquid and illiquid investments |
| † | Categorization of investments into core, value-added, and opportunistic |
Risk Management
Asset allocation among investment categories and specific securities is determined according to a risk budgeting process that categorizes each security as core, value-added, or opportunistic.
| † | Core allocations are essential to delivering non-correlated returns; holding periods are expected to be three to five years. |
| † | Value-added allocations are expected to have shorter holding periods and may be over-weights of core allocations. |
| † | Opportunistic allocations take advantage of short- term inefficiencies; holding periods are expected to be approximately twelve months. |
MULTI-STRATEGY GROWTH & INCOME FUND ALLOCATION METHODOLOGY
Multi-Strategy Growth & Income Fund
| 5 |
Portfolio Holdings
The Fund improved its diversification during the past fiscal year and broadened its exposure to sponsors of non-traded investment vehicles. At the end of its fiscal year, the Fund held 83 investments and its single largest position accounted for 6.3% of its NAV (compared to 8.9% the prior year). The best performing asset classes in which the
Fund invested during the past fiscal year were non-listed REITs and alternative investment funds, while the worst performing were publicly traded REITs and master limited partnerships. The risk weighting for this portfolio was 63.9% Core, 22.6% Valued-Added, and 13.6% Opportunistic.
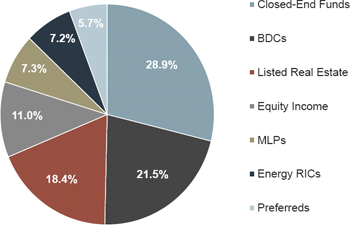
| STRATEGY DIVERSIFICATION | TOTAL REIT SECTOR DIVERSIFICATION | |
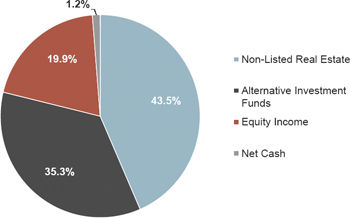 | 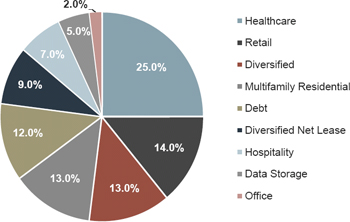 |
| ALTERNATIVE INVESTMENTS STRATEGY ALLOCATION | EQUITY INCOME STRATEGY ALLOCATION | |
 |  |
The security holdings are presented to illustrate examples of the securities that the Fund has bought, and the diversity of areas in which the Fund may invest, and may not be representative of the Fund’s current or future investments. Portfolio holdings are subject to change and should not be considered to be investment advice.
Multi-Strategy Growth & Income Fund
| 6 |
Market Outlook
Stock Market
| † | We believe that global growth remains challenged, and countries outside the U.S. (such as much of Europe, Japan, and China) are weakening their currencies to make their goods and services more attractive in order to spur growth and ward off deflation. |
| † | We expect the U.S. dollar to remain strong relative to other currencies, resulting in continued headwinds for U.S.-domiciled companies with global businesses and commodities linked to the dollar. |
| † | The Federal Reserve continues to signal an interest rate increase, although it is waiting for wage growth to improve and inflation to increase. |
Real Estate
| † | Capitalization rate compression in many real estate asset classes has been offset by low relative borrowing costs, and we expect this spread to contract as interest rates rise. |
| † | We believe the easy money has already been made in this sector, and therefore asset class and property selection have become more important. |
| † | Portfolio aggregation strategies have become increasingly difficult to execute in the current environment, and we favor existing portfolios with income growth opportunities. |
Credit
| † | We believe the opportunity created by regulatory changes is still very much intact, although competition has increased dramatically. |
| † | Focusing on credit quality, underwriting standards, and execution is critical to success. |
| † | We believe middle-market loans accessed through non-traded BDCs offer attractive terms and lower credit risk than broadly syndicated high-yield loans, and these products are expected to benefit from rising interest rates due to their variable rate structures. |
Multi-Strategy Growth & Income Fund
| 7 |
| Looking Forward | |
We enter the Fund’s fourth fiscal year with confidence in our strategy and conviction in our ability to execute. Our team is taking a “rifle approach” to investing in specific sectors and asset classes that we have identified as offering the most attractive opportunities in an effort to maximize risk-adjusted returns and minimize correlation to stocks and bonds. Diversification remains a keystone of our investment approach, and we remain committed to our consistent distribution policy.
Thank you again for your trust and confidence in our strategy. We look forward to continued success together.
Sincerely,

Ray Lucia Jr.
Chief Executive Officer, Lucia Capital Management
President, Multi-Strategy Growth & Income Fund
There is no guarantee that any investment strategy will achieve its objectives, generate profits, or avoid losses. Past performance does not guarantee future results. The opinions and forecasts herein are subject to change without notice, may or may not come to pass, and should not be considered specific investment advice.
Limited liquidity is provided to shareholders only through the Fund’s quarterly repurchase offers for up to 5% of the shares outstanding at NAV.
Multi-Strategy Growth & Income Fund
| 8 |
Investors should carefully consider the investment objectives, risks, charges, and expenses of the Multi-Strategy Growth & Income Fund. This and other important information about the Fund is contained in the prospectus, which can be obtained by calling (800) 644-1150. The prospectus should be read carefully before investing. The Multi-Strategy Growth & Income Fund is distributed by Northern Lights Distributors, LLC, member FINRA/SIPC.
The Fund’s distribution rate amounts were calculated based on the ordinary income received from the underlying investments net of Fund expenses. Net capital gains realized from the disposition of Fund investments, if any, will be paid out annually. The distribution rate does not reflect other non-income items and has not been adjusted for tax reporting purposes. Distribution amount is not indicative of Fund performance. Current distributions and monthly target yields are not guaranteed and may not be met in the future.
There is no guarantee that shareholders will be able to sell all of the shares they desire in a quarterly repurchase offer.
Mutual funds involve risk including the possible loss of principal. Alternative investment funds, ETFs, mutual funds, and closed-end funds are subject to management and other expenses, which will be indirectly paid by the Fund. Issuers of debt securities may not make scheduled interest and principal payments, resulting in losses to the Fund. Typically, a rise in interest rates causes a decline in the value of fixed-income securities. Lower-quality debt securities, known as “high-yield” or “junk” bonds, present greater risk than bonds of higher quality, including increased default risk and non-diversification risk, as the funds are more vulnerable to events affecting a single issuer. The use of leverage, such as borrowing money to purchase securities, will cause the Fund to incur additional expenses and will magnify the Fund’s gains or losses. There currently is no secondary market for the Fund’s shares, and the Fund expects that no secondary market will develop. Very limited liquidity is provided to shareholders only through the Fund’s quarterly repurchase offers. Investments in lesser-known, small- and medium-capitalization companies may be more vulnerable than those in larger, more established organizations. The Fund will not invest in real estate directly, but, because the Fund will concentrate its investments in securities of REITs, its portfolio will be significantly impacted by the performance of the real estate market. The sale of securities to fund repurchases could reduce the market price of those securities, which in turn would reduce the Fund’s NAV. The value of a structured note will be influenced by time to maturity; type of note; market volatility; changes in the issuer’s credit quality rating; and economic, legal, political, or geographic events that affect the reference index.
Shareholders receiving periodic payments from the Fund may be under the impression that they are receiving net profits. However, all or a portion of a distribution may consist of a return of capital.
Up Capture Ratio: A statistical measure of an investment manager’s overall performance in up markets. The up-market capture ratio is used to evaluate how well an investment manager performed relative to an index during periods when that index has risen. The ratio is calculated by dividing the manager’s returns by
the returns of the index during the up market and multiplying that factor by 100.
Down Capture Ratio: A statistical measure of an investment manager’s overall performance in down markets. The down-market capture ratio is used to evaluate how well or poorly an investment manager performed relative to an index during periods when that index has dropped. The ratio is calculated by dividing the manager’s returns by the returns of the index during the down market and multiplying that factor by 100.
Standard Deviation: A statistical measurement of the variation of returns from an average historical return as a percentage. A high standard deviation generally indicates higher volatility of returns.
Sharpe Ratio: A risk-adjusted measure used to determine reward per unit of risk. The Sharpe Ratio is calculated by dividing annualized excess returns over the risk-free rate by its annualized standard deviation. Generally, the higher the Sharpe Ratio, the better the risk-adjusted return.
Alternative Investment: An investment that is not one of the three traditional asset types (stocks, bonds, or cash). Most alternative investment assets are held by institutional investors or accredited, high-net-worth individuals because of their complex nature, limited regulations, and relative lack of liquidity. Alternative investments include hedge funds, managed futures, real estate, commodities, and derivatives contracts.
Barclays Aggregate Bond Index: An index commonly used as a benchmark by both passive and active investors to measure portfolio performance relative to the U.S. dollar-denominated, investment-grade, fixed-rate, taxable bond market. It is also an informational measure of broad market returns commonly applied to fixed-income instruments.
S&P 500: An index of 500 stocks chosen for market size, liquidity, and industry grouping (among other factors). It is designed to be an indicator of U.S. equities and is meant to reflect the risk/return characteristics of the large-cap universe.
Investors cannot directly invest in an index, and unmanaged index returns do not reflect any fees, expenses, or sales charges.
Income Distribution: Net earnings of a mutual fund distributed to its shareholders. These earnings are usually paid monthly as cash or reinvested at the choice of the shareholder. Income distributions are taxable income.
Return of Capital : A return from an investment that is not considered income. A return of capital is when some or all of the money an investor has in an investment is paid back to him or her, thus decreasing the value of the investment.
2191-NLD-4/13/2015
Multi-Strategy Growth & Income Fund
| 9 |
| Multi-Strategy Growth & Income Fund |
| PORTFOLIO REVIEW (Unaudited) |
| February 28, 2015 |
Composition of the Change in Value of a $10,000 Investment (since inception through February 28, 2015):
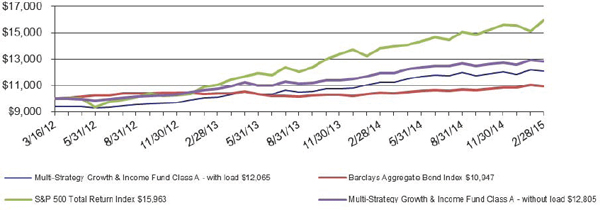
The Fund’s performance figures for the periods ending February 28, 2015, compared to its benchmarks:
| Since | Since Inception | |||||
| One | Inception | Class C, Class I | ||||
| Total Returns as of February 28, 2015 | Year | Class A* | and Class L ** | |||
| Multi-Strategy Growth & Income Fund | ||||||
| Class A: | ||||||
| Without Load | 7.46% | 8.72% | — | |||
| With Load | 1.27% | 6.56% | — | |||
| Class C | — | — | 2.04% | |||
| Class I | — | — | 2.37% | |||
| Class L: | ||||||
| Without Load | — | — | 2.25% | |||
| With Load | — | — | (1.57)% | |||
| Barclays Aggregate Bond Index | 5.05% | 3.11% | 3.65% | |||
| S&P 500 Total Return Index | 15.51% | 17.14% | 8.03% | |||
| * | Class A commenced operations March 16, 2012. |
| ** | Class C, Class I and Class L commenced operations on July 2, 2014. |
The Barclays Aggregate Bond Index is an unmanaged index which represents the U.S. investment-grade fixed-rate bond market (including government and corporate securities, mortgage pass-through securities and asset-backed securities). Investors cannot invest directly in an index or benchmark.
The S&P 500 Total Return Index is an unmanaged market capitalization-weighted index which is comprised of 500 of the largest U.S. domiciled companies and includes the reinvestment of all dividends. Investors cannot invest directly in an index or benchmark.
Past performance is not predictive of future results. The investment return and principal value of an investment will fluctuate. An investor’s shares, when redeemed, may be worth more or less than the original cost. Total return is calculated assuming reinvestment of all dividends and distributions. The Fund’s total gross annual operating expenses, per its prospectus dated July 1, 2014, including underlying funds, are 2.85%, 3.53%, 2.53%, and 3.28% for Class A, Class C, Class I and Class L shares, respectively. Class A and Class L shares of the Fund are subject to a maximum sales load imposed on purchases of 5.75% and 3.75%, respectively. Class C and Class I are not subject to a sales load. The chart does not reflect the deduction of taxes that a shareholder may have to pay on Fund distributions or the redemption of the Fund shares.
| 10 |
| Multi-Strategy Growth & Income Fund |
| PORTFOLIO OF INVESTMENTS |
| February 28, 2015 |
| Shares | Security | Value | ||||||
| COMMON STOCKS - 7.67% | ||||||||
| BIOTECHNOLOGY - 0.17% | ||||||||
| 48,049 | PDL BioPharma, Inc. | $ | 335,382 | |||||
| CHEMICALS - 0.17% | ||||||||
| 2,277 | Terra Nitrogen Company LP | 332,852 | ||||||
| COMMERCIAL SERVICES - 0.19% | ||||||||
| 4,774 | Macquarie Infrastructure Co. | 375,284 | ||||||
| LISTED BUSINESS DEVELOPMENT COMPANIES - 4.29% | ||||||||
| 198,069 | Apollo Investment Corp. | 1,542,957 | ||||||
| 65,584 | Ares Capital Corp. | 1,134,603 | ||||||
| 35,420 | Blackrock Kelso Capital Corp. | 310,988 | ||||||
| 120,084 | Fifth Street Finance Corp. | 850,195 | ||||||
| 101,574 | Medley Capital Corp. | 960,890 | ||||||
| 88,647 | PennantPark Investment Corp. | 843,033 | ||||||
| 248,799 | Prospect Capital Corp. | 2,147,134 | ||||||
| 26,763 | THL Credit, Inc. | 323,565 | ||||||
| 58,084 | TICC Capital Corp. | 423,432 | ||||||
| 8,536,797 | ||||||||
| MINING - 0.43% | ||||||||
| 30,973 | Freeport-McMoRan, Inc. | 669,956 | ||||||
| 4,955 | HI-Crush Partners LP | 180,312 | ||||||
| 850,268 | ||||||||
| OIL & GAS - 0.11% | ||||||||
| 4,812 | Suburban Propane Partners LP | 212,402 | ||||||
| PIPELINES - 1.39% | ||||||||
| 2,743 | DCP Midstream Partners LP | 109,171 | ||||||
| 13,307 | Enbridge Energy Partners LP | 521,501 | ||||||
| 13,220 | Energy Transfer Partners LP | 786,326 | ||||||
| 6,847 | Kinder Morgan, Inc. | 280,789 | ||||||
| 5,459 | MarkWest Energy Partners LP | 354,562 | ||||||
| 2,888 | NuStar Energy LP | 182,060 | ||||||
| 2,595 | ONEOK Partners LP | 108,432 | ||||||
| 8,677 | Plains All American Pipeline LP | 432,896 | ||||||
| 2,775,737 | ||||||||
| PRIVATE EQUITY - 0.33% | ||||||||
| 17,677 | Blackstone Group LP | 662,180 | ||||||
| TELECOMMUNICATIONS - 0.58% | ||||||||
| 16,582 | AT&T, Inc. | 573,062 | ||||||
| 73,959 | Windstream Holdings, Inc. | 583,537 | ||||||
| 1,156,599 | ||||||||
| TRANSPORTATION - 0.01% | ||||||||
| 500 | Teekay LNG Partners LP | 18,525 | ||||||
| TOTAL COMMON STOCKS | 15,256,026 | |||||||
| (Cost - $15,347,427) | ||||||||
| EXCHANGE TRADED FUND - 1.14% | ||||||||
| DEBT FUND - 1.14% | ||||||||
| 154,997 | Global X SuperIncome Preferred ETF | 2,278,456 | ||||||
| TOTAL EXCHANGED TRADED FUND | ||||||||
| (Cost - $2,285,896) | ||||||||
The accompanying notes are an integral part of these financial statements.
| 11 |
| Multi-Strategy Growth & Income Fund |
| PORTFOLIO OF INVESTMENTS (Continued) |
| February 28, 2015 |
| Shares | Security | Value | ||||||
| REAL ESTATE INVESTMENT TRUSTS - 47.45% | ||||||||
| LISTED REAL ESTATE INVESTMENT TRUSTS - 3.95% | ||||||||
| 53,748 | Annaly Capital Management, Inc. | $ | 570,804 | |||||
| 42,889 | BioMed Realty Trust, Inc. | 953,851 | ||||||
| 3,843 | Colony Financial, Inc. | 96,882 | ||||||
| 11,989 | Corrections Corporation Of America | 478,241 | ||||||
| 8,740 | Digital Realty Trust, Inc. | 580,161 | ||||||
| 11,366 | HCP, Inc. | 481,479 | ||||||
| 15,603 | Iron Mountain, Inc. | 573,410 | ||||||
| 9,482 | Omega Healthcare Investors, Inc. | 379,849 | ||||||
| 11,642 | Select Income REIT | 287,441 | ||||||
| 12,689 | Senior Housing Property Trust | 283,599 | ||||||
| 11,709 | Starwood Property Trust, Inc. | 285,700 | ||||||
| 91,719 | United Development Funding IV | 1,545,464 | ||||||
| 18,084 | Ventas, Inc. | 1,346,715 | ||||||
| TOTAL LISTED REAL ESTATE INVESTMENT TRUSTS | 7,863,596 | |||||||
| NON-LISTED REAL ESTATE INVESTMENT TRUSTS - 43.50% | ||||||||
| 432,432 | American Realty Capital Trust Global, Inc. # | 4,764,192 | ||||||
| 397,838 | American Realty Capital Healthcare Trust II, Inc. # | 9,924,366 | ||||||
| 216,216 | American Realty Capital Hospitality Trust, Inc. # | 5,000,000 | ||||||
| 707,027 | American Realty Capital Retail Centers of America, Inc. # | 7,503,139 | ||||||
| 188,108 | American Realty Capital Trust V, Inc. # | 4,610,874 | ||||||
| 661,928 | Cottonwood Residential, Inc. # | 8,664,638 | ||||||
| 738,378 | CV Mission Critical REIT, Inc. # | 7,479,121 | ||||||
| 228,122 | Carey Watermark Investors, Inc. # | 2,205,734 | ||||||
| 198,378 | Hines Global REIT, Inc. # | 2,693,306 | ||||||
| 432,432 | NorthStar Real Estate Income II, Inc. # | 4,000,000 | ||||||
| 764,346 | NorthStar Real Estate Income Trust, Inc. # | 7,800,584 | ||||||
| 1,081,081 | NorthStar Health Care Income, Inc. # | 10,205,406 | ||||||
| 593,514 | Phillips Edison Grocery Center REIT I, Inc. # | 6,825,941 | ||||||
| 388,931 | Steadfast Income REIT, Inc. # | 4,865,034 | ||||||
| TOTAL NON-LISTED REAL ESTATE INVESTMENT TRUSTS | 86,542,335 | |||||||
| TOTAL REAL ESTATE INVESTMENT TRUSTS | 94,405,931 | |||||||
| (Cost - $80,972,135) | ||||||||
| NON-LISTED BUSINESS DEVELOPMENT COMPANIES - 21.83% | ||||||||
| 1,215,151 | Business Development Corporation of America # | 12,588,968 | ||||||
| 1,005,598 | Cion Investment Corp. # | 9,704,022 | ||||||
| 1,188,054 | Corporate Capital Trust # | 12,088,453 | ||||||
| 978,323 | Sierra Income Corp. # | 9,049,489 | ||||||
| TOTAL NON-LISTED BUSINESS DEVELOPMENT COMPANIES | 43,430,932 | |||||||
| (Cost - $43,330,119) | ||||||||
| PRIVATE INVESTMENT COMPANIES - 13.42% | ||||||||
| 3 | Aim Infrastructure MLP Fund II LP # | 1,628,336 | ||||||
| 8,653 | Clarion Lion Properties Fund # | 10,077,549 | ||||||
| 3 | Ovation Alternative Income Fund # | 7,500,000 | ||||||
| 818,599 | TriLinc Global Impact Fund Class I # | 7,500,000 | ||||||
| TOTAL PRIVATE INVESTMENT COMPANIES | 26,705,885 | |||||||
| (Cost - $26,412,500) | ||||||||
| CLOSED-END FUNDS - 7.20% | ||||||||
| 57,839 | Apollo Tactical Income Fund, Inc. | 960,127 | ||||||
| 200,000 | BlackRock Debt Strategies Fund, Inc. | 762,000 | ||||||
| 91,709 | BlackRock Multi-Sector Income Trust | 1,610,410 | ||||||
| 20,357 | Brookfield Global Listed Infrastructure Income Fund, Inc. | 427,701 | ||||||
The accompanying notes are an integral part of these financial statements.
| 12 |
| Multi-Strategy Growth & Income Fund |
| PORTFOLIO OF INVESTMENTS (Continued) |
| February 28, 2015 |
| Shares | Security | Value | ||||||
| CLOSED-END FUNDS (Continued) - 7.20% | ||||||||
| 26,887 | ClearBridge Energy MLP Fund, Inc. | $ | 721,916 | |||||
| 64,256 | Cohen & Steers REIT and Preferred Income Fund, Inc. | 1,243,996 | ||||||
| 22,743 | Cohen & Steers MLP Income and Energy Opportunity Fund, Inc. | 455,770 | ||||||
| 49,608 | Delaware Enhanced Global Dividend & Income Fund | 578,925 | ||||||
| 79,872 | DoubleLine Income Solutions Fund | 1,625,395 | ||||||
| 36,076 | Eaton Vance Tax Managed Global Buy Write Opportunities Fund | 432,912 | ||||||
| 32,618 | First Trust MLP and Energy Income Fund | 687,587 | ||||||
| 16,356 | Kayne Anderson Midstream/Energy Fund, Inc. | 562,974 | ||||||
| 44,838 | Legg Mason BW Global Income Opportunities Fund, Inc. | 766,281 | ||||||
| 90,530 | Madison Covered Call & Equity Strategy Fund | 762,263 | ||||||
| 22,512 | Nuveen Energy MLP Total Return Fund | 420,974 | ||||||
| 15,295 | Tekla Life Sciences Investors | 429,790 | ||||||
| 36,352 | Voya Asia Pacific High Dividend Equity Income Fund | 432,225 | ||||||
| 36,965 | Wells Fargo Advantage Global Dividend Opportunity Fund | 286,109 | ||||||
| 101,786 | Western Asset Emerging Markets Income Fund, Inc. | 1,149,164 | ||||||
| TOTAL CLOSED-END FUNDS | 14,316,519 | |||||||
| (Cost - $14,349,306) | ||||||||
| SHORT-TERM INVESTMENT - 7.24% | ||||||||
| MONEY MARKET FUND - 7.24% | ||||||||
| 14,411,931 | AIM STIT-Government & Agency Portfolio, 0.01% + | 14,411,931 | ||||||
| TOTAL SHORT-TERM INVESTMENT | ||||||||
| (Cost - $14,411,931) | ||||||||
| TOTAL INVESTMENTS - 105.95% | ||||||||
| (Cost - $197,109,314) (a) | $ | 210,805,680 | ||||||
| LIABILITIES IN EXCESS OF OTHER ASSETS - (5.95)% | (11,836,684 | ) | ||||||
| NET ASSETS - 100.00% | $ | 198,968,996 | ||||||
| # | Fair Value estimated using Fair Valuation Procedures adopted by the Board of Trustees. Total value of such securities is $156,679,152 or 78.75% of net assets. |
| + | Money market fund; interest rate reflects the seven-day effective yield on February 28, 2015. |
| (a) | Represents cost for financial reporting purposes. Aggregate cost for federal tax purposes is $196,273,577 and differs from fair value by net unrealized appreciation (depreciation) of securities as follows: |
| Unrealized appreciation: | $ | 15,332,874 | |||
| Unrealized depreciation: | (800,771 | ) | |||
| Net unrealized appreciation: | $ | 14,532,103 |
| Portfolio Composition as of February 28, 2015 (Unaudited) |
| Percent of Net Assets | ||
| REITS | 47.45% | |
| Non-Listed Business Development Companies | 21.83% | |
| Private Investment Companies | 13.42% | |
| Financial | 11.82% | |
| Energy | 1.50% | |
| Debt Fund | 1.14% | |
| Basic Materials | 0.59% | |
| Communications | 0.58% | |
| Consumer, Non-Cyclical | 0.36% | |
| Industrial | 0.02% | |
| Short-term Investments | 7.24% | |
| Liabilities in excess of Assets | (5.95)% | |
| Net Assets | 100.00% | |
The accompanying notes are an integral part of these financial statements.
| 13 |
| Multi-Strategy Growth & Income Fund |
| STATEMENT OF ASSETS AND LIABILITIES |
| February 28, 2015 |
| Assets: | ||||
| Investments in Securities, at Value (identified cost $197,109,314) | $ | 210,805,680 | ||
| Dividends and Interest Receivable | 720,540 | |||
| Receivable for Securities Sold | 23,782,433 | |||
| Receivable for Fund Shares Sold | 655,369 | |||
| Prepaid Expenses and Other Assets | 70,219 | |||
| Total Assets | 236,034,241 | |||
| Liabilities: | ||||
| Payable for Securities Purchased | 36,823,203 | |||
| Shareholder Servicing Fees Payable | 38,787 | |||
| Distribution Fee Payable | 9,152 | |||
| Accrued Advisory Fees | 116,549 | |||
| Other Accrued Expenses | 77,554 | |||
| Total Liabilities | 37,065,245 | |||
| Net Assets | $ | 198,968,996 | ||
| Composition of Net Assets: | ||||
| At February 28, 2015, Net Assets consisted of: | ||||
| Paid-in-Capital | $ | 187,448,999 | ||
| Undistributed Net Investment Income | 171,646 | |||
| Accumulated Net Realized Loss on: | ||||
| Investments and Options Written | (2,347,955 | ) | ||
| Net Unrealized Appreciation on: | ||||
| Investments | 13,696,306 | |||
| Net Assets | $ | 198,968,996 | ||
The accompanying notes are an integral part of these financial statements.
| 14 |
| Multi-Strategy Growth & Income Fund |
| STATEMENT OF ASSETS AND LIABILITIES (Continued) |
| February 28, 2015 |
| Class A Shares (a): | ||||
| Net Assets | $ | 178,502,013 | ||
| Shares Outstanding (no par value; unlimited number of shares authorized) | 10,662,467 | |||
| Net Asset Value and Redemption Price Per Share * | $ | 16.74 | ||
| Offering Price Per Share (16.74/0.9425) | $ | 17.76 | ||
| Class C Shares: | ||||
| Net Assets | $ | 10,926,282 | ||
| Shares Outstanding (no par value; unlimited number of shares authorized) | 653,689 | |||
| Net Asset Value, Offering Price and Redemption Price Per Share * | $ | 16.71 | ||
| Class I Shares: | ||||
| Net Assets | $ | 1,185,186 | ||
| Shares Outstanding (no par value; unlimited number of shares authorized) | 70,748 | |||
| Net Asset Value, Offering Price and Redemption Price Per Share * | $ | 16.75 | ||
| Class L Shares: | ||||
| Net Assets | $ | 8,355,515 | ||
| Shares Outstanding (no par value; unlimited number of shares authorized) | 499,607 | |||
| Net Asset Value and Redemption Price Per Share * | $ | 16.72 | ||
| Offering Price Per Share (16.72/0.9625) | $ | 17.37 |
| * | The Net Asset Value for each class will differ due primarily to the allocation of class specific expenses, such as distribution fees and shareholder servicing fees. |
| (a) | Class A purchases valued at $1 million or more are not subject to a front end sales commission but there is a 1.00% fee on shares repurchased less than 365 days after purchase. |
The accompanying notes are an integral part of these financial statements.
| 15 |
| Multi-Strategy Growth & Income Fund |
| STATEMENT OF OPERATIONS |
| For the Year Ended February 28, 2015 |
| Investment Income: | ||||
| Dividend Income (less $7,879 foreign taxes withheld) | $ | 6,811,253 | ||
| Interest Income | 429 | |||
| Total Investment Income | 6,811,682 | |||
| Expenses: | ||||
| Investment Advisory Fees | 1,266,798 | |||
| Shareholder Servicing Fees: | ||||
| Class A | 405,609 | |||
| Class C | 9,154 | |||
| Class L | 5,943 | |||
| Distribution Fees: | ||||
| Class C | 27,808 | |||
| Class L | 11,888 | |||
| Administration Fees | 169,968 | |||
| Transfer Agent Fees | 154,375 | |||
| Legal Fees | 98,525 | |||
| Printing Expense | 98,061 | |||
| Pricing Expense | 78,871 | |||
| Registration & Filing Fees | 78,050 | |||
| Fund Accounting Fees | 59,915 | |||
| Non 12B-1 Shareholder Servicing | 48,707 | |||
| Trustees’ Fees and Expenses | 44,147 | |||
| Insurance Expense | 36,030 | |||
| Compliance Fees | 34,812 | |||
| Custody Fees | 22,361 | |||
| Audit Fees | 19,998 | |||
| Miscellaneous Expenses | 4,561 | |||
| Total Expenses | 2,675,581 | |||
| Plus: Expense Reimbursement Recaptured | 96,982 | |||
| Net Expenses | 2,772,563 | |||
| Net Investment Income | 4,039,119 | |||
| Net Realized and Unrealized Gain (Loss) on Investments: | ||||
| Net Realized Gain (Loss) on: | ||||
| Investments | (700,607 | ) | ||
| Options Written | 712,317 | |||
| Distributions of realized gain from underlying investment companies | 161,763 | |||
| Total Net Realized Gain | 173,473 | |||
| Net Change in Unrealized Appreciation on: | ||||
| Investments | 7,143,966 | |||
| Options Written | 34,711 | |||
| Total Net Change in Unrealized Appreciation | 7,178,677 | |||
| Net Realized and Unrealized Gain on Investments | 7,352,150 | |||
| Net Increase in Net Assets Resulting From Operations | $ | 11,391,269 |
The accompanying notes are an integral part of these financial statements.
| 16 |
| Multi-Strategy Growth & Income Fund |
| STATEMENTS OF CHANGES IN NET ASSETS |
| For the Year | For the Year | |||||||
| Ended | Ended | |||||||
| February 28, 2015 | February 28, 2014 | |||||||
| Operations: | ||||||||
| Net Investment Income | $ | 4,039,119 | $ | 2,102,591 | ||||
| Net Realized Gain on Investments and Options Written | 11,710 | 2,464,547 | ||||||
| Distributions of Realized Gain from Underlying Investment Companies | 161,763 | 58,504 | ||||||
| Net Change in Unrealized Appreciation on Investments and Options Written | 7,178,677 | 4,908,369 | ||||||
| Net Increase in Net Assets Resulting From Operations | 11,391,269 | 9,534,011 | ||||||
| Distributions to Shareholders From: | ||||||||
| Net Investment Income | ||||||||
| Class A | (3,585,981 | ) | (1,556,059 | ) | ||||
| Class C | (12,304 | ) | — | |||||
| Class I | (3,949 | ) | — | |||||
| Class L | (7,220 | ) | — | |||||
| Total from Income | (3,609,454 | ) | (1,556,059 | ) | ||||
| Realized Gains | ||||||||
| Class A | (3,858,184 | ) | (2,843,571 | ) | ||||
| Class C | (154,671 | ) | — | |||||
| Class I | (26,510 | ) | — | |||||
| Class L | (103,768 | ) | — | |||||
| Total from Realized Gains | (4,143,133 | ) | (2,843,571 | ) | ||||
| Return of Capital | ||||||||
| Class A | (2,221,694 | ) | (445,418 | ) | ||||
| Class C | (93,444 | ) | — | |||||
| Class I | (15,899 | ) | — | |||||
| Class L | (68,956 | ) | — | |||||
| Total from Return of Capital | (2,399,993 | ) | (445,418 | ) | ||||
| Total Distributions to Shareholders | (10,152,580 | ) | (4,845,048 | ) | ||||
The accompanying notes are an integral part of these financial statements.
| 17 |
| Multi-Strategy Growth & Income Fund |
| STATEMENTS OF CHANGES IN NET ASSETS (Continued) |
| For the Year | For the Year | |||||||
| Ended | Ended | |||||||
| February 28, 2015 | February 28, 2014 | |||||||
| From Shares of Beneficial Interest: | ||||||||
| Class A Shares: | ||||||||
| Proceeds from Shares Issued (3,476,511 and 4,773,153 shares, respectively) | 58,688,104 | 76,533,102 | ||||||
| Distributions Reinvested (452,705 and 270,931 shares, respectively) | 7,602,667 | 4,329,195 | ||||||
| Cost of Shares Redeemed (1,061,654 and 169,673 shares, respectively) | (17,974,784 | ) | (2,742,002 | ) | ||||
| Cost of Shares Transferred (59,931 and 0 shares, respectively) | (1,014,634 | ) | — | |||||
| Total From Capital Transactions: Class A | 47,301,353 | 78,120,295 | ||||||
| Class C Shares: | ||||||||
| Proceeds from Shares Issued (659,046 and 0 shares, respectively) | 11,170,191 | — | ||||||
| Distributions Reinvested (11,082 and 0 shares, respectively) | 185,294 | — | ||||||
| Cost of Shares Redeemed (16,439 and 0 shares, respectively) | (278,144 | ) | — | |||||
| Total From Capital Transactions: Class C | 11,077,341 | — | ||||||
| Class I Shares: | ||||||||
| Proceeds from Shares Issued (14,164 and 0 shares, respectively) | 239,281 | — | ||||||
| Distributions Reinvested (2,761 and 0 shares, respectively) | 46,358 | — | ||||||
| Cost of Shares Redeemed (6,108 and 0 shares, respectively) | (103,482 | ) | — | |||||
| Proceeds from Shares Transferred (59,931 and 0 shares, respectively) | 1,014,634 | — | ||||||
| Total From Capital Transactions: Class I | 1,196,791 | — | ||||||
| Class L Shares: | ||||||||
| Proceeds from Shares Issued (496,457 and 0 shares, respectively) | 8,405,902 | — | ||||||
| Distributions Reinvested (7,359 and 0 shares, respectively) | 123,038 | — | ||||||
| Cost of Shares Redeemed (4,209 and 0 shares, respectively) | (71,255 | ) | — | |||||
| Total From Capital Transactions: Class L | 8,457,685 | — | ||||||
| Total Increase in Net assets from Beneficial Interest: | 68,033,170 | 78,120,295 | ||||||
| Total Increase in Net Assets | 69,271,859 | 82,809,258 | ||||||
| Net Assets: | ||||||||
| Beginning of Year | 129,697,137 | 46,887,879 | ||||||
| End of Year | $ | 198,968,996 | $ | 129,697,137 | ||||
| Undistributed Net Investment Income at End of Year | $ | 171,646 | $ | 548,754 | ||||
The accompanying notes are an integral part of these financial statements.
| 18 |
| Multi-Strategy Growth & Income Fund |
| STATEMENT OF CASH FLOWS |
| For the Year Ended February 28, 2015 |
| Cash flows from operating activities: | ||||
| Net increase in net assets resulting from operations | $ | 11,391,269 | ||
| Adjustments to reconcile net increase in net assets resulting from operations to net cash used in operating activities: | ||||
| Purchases of investments and options written | (151,059,802 | ) | ||
| Proceeds from sales | 82,285,139 | |||
| Purchases of short term investments, net | (10,369,165 | ) | ||
| Return of capital and capital gain distributions from investments | 4,034,254 | |||
| Net realized gain from investments and options written | (11,710 | ) | ||
| Net change in unrealized appreciation from investments and options written | (7,178,677 | ) | ||
| Changes in assets and liabilities (Increase)/Decrease in assets: | ||||
| Dividends and Interest Receivable | (196,976 | ) | ||
| Receivable for Securities Sold | (23,782,433 | ) | ||
| Prepaid Expenses and Other Assets | (22,976 | ) | ||
| Increase/(Decrease) in liabilities: | ||||
| Payable to Other Affiliates | (14,259 | ) | ||
| Payable for Securities Purchased | 36,823,203 | |||
| Accrued Advisory Fees | 40,182 | |||
| Shareholder Servicing Fee | 15,922 | |||
| Distribution Fee Payable | 9,152 | |||
| Other Accrued Expenses Payable | 47,080 | |||
| Net cash used in operating activities | (57,989,797 | ) | ||
| Cash flows from financing activities: | ||||
| Proceeds from shares sold | 78,253,527 | |||
| Payment on shares redeemed | (18,427,665 | ) | ||
| Cash distributions paid | (2,195,223 | ) | ||
| Net cash provided by financing activities | 57,630,639 | |||
| Net decrease in cash | (359,158 | ) | ||
| Cash at beginning of Year | 359,158 | |||
| Cash at end of Year | — | |||
| Supplemental disclosure of non-cash activity: | ||||
| Noncash financing activities not including herein consists of reinvestment of dividends | $ | 7,957,357 |
The accompanying notes are an integral part of these financial statements.
| 19 |
| Multi-Strategy Growth & Income Fund - Class A |
| FINANCIAL HIGHLIGHTS |
The table below sets forth financial data for one share of beneficial interest outstanding throughout the periods presented.
| For the Year | For the Year | For the Period | ||||||||||
| Ended | Ended | Ended | ||||||||||
| February 28, 2015 | February 28, 2014 | February 28, 2013 * | ||||||||||
| Net Asset Value, Beginning of Period | $ | 16.51 | $ | 15.73 | $ | 15.00 | ||||||
| Increase From Operations: | ||||||||||||
| Net investment income (a) | 0.41 | 0.39 | 0.32 | |||||||||
| Net gain on investments (both realized and unrealized) | 0.80 | 1.29 | 0.77 | |||||||||
| Total from operations | 1.21 | 1.68 | 1.09 | |||||||||
| Less Distributions: | ||||||||||||
| From net investment income | (0.40 | ) | (0.29 | ) | (0.36 | ) | ||||||
| From net realized gains on investments | (0.37 | ) | (0.55 | ) | — | |||||||
| From paid in capital | (0.21 | ) | (0.06 | ) | — | |||||||
| Total Distributions | (0.98 | ) | (0.90 | ) | (0.36 | ) | ||||||
| Net Asset Value, End of Period | $ | 16.74 | $ | 16.51 | $ | 15.73 | ||||||
| Total Return (b) | 7.46 | % | 11.01 | % | 7.34 | % | ||||||
| Ratios/Supplemental Data | ||||||||||||
| Net assets, end of period (in 000’s) | $ | 178,502 | $ | 129,697 | $ | 46,888 | ||||||
| Ratio to average net assets: | ||||||||||||
| Expenses, Gross | 1.55 | % (f) | 1.60 | % | 2.61 | % (c) | ||||||
| Expenses, Net of Reimbursement/Recapture | 1.61 | % (e,f) | 1.75 | % (e) | 1.75 | % (c) | ||||||
| Net investment income, Net of Reimbursement/Recapture | 2.43 | % (g) | 2.46 | % | 2.19 | % (c) | ||||||
| Portfolio turnover rate | 49 | % | 14 | % | 108 | % (d) | ||||||
| * | Class A commenced operations on March 16, 2012. |
| (a) | Per share amounts are calculated using the average shares method, which more appropriately presents the per share data for the period. |
| (b) | Total returns are historical in nature and assume changes in share price, reinvestment of dividends and capital gains distributions, if any and exclude the effects of sales loads. Total returns for periods less than one year are not annualized. |
| (c) | Annualized for periods less than one year. |
| (d) | Not annualized. |
| (e) | Such ratio includes the Advisor’s recapture of waived/reimbursed fees from prior periods. |
| (f) | Does not include the expenses of the investment companies in which the Fund invests |
| (g) | The recognition of investment income is affected by the timing and declaration of dividends by the underlying investment companies in which the Fund invests. |
The accompanying notes are an integral part of these financial statements.
| 20 |
| Multi-Strategy Growth & Income Fund - Class C |
| FINANCIAL HIGHLIGHTS |
The table below sets forth financial data for one share of beneficial interest outstanding throughout the period presented.
| For the Period | ||||
| Ended | ||||
| February 28, 2015 * | ||||
| Net Asset Value, Beginning of Period | $ | 17.02 | ||
| Increase From Operations: | ||||
| Net investment income (a) | 0.18 | |||
| Net gain on investments (both realized and unrealized) | 0.16 | |||
| Total from operations | 0.34 | |||
| Less Distributions: | ||||
| From net investment income | (0.12 | ) | ||
| From net realized gains on investments | (0.35 | ) | ||
| From return of capital | (0.18 | ) | ||
| Total Distributions | (0.65 | ) | ||
| Net Asset Value, End of Period | $ | 16.71 | ||
| Total Return (b) | 2.04 | % | ||
| Ratios/Supplemental Data | ||||
| Net assets, end of period (in 000’s) | $ | 10,926 | ||
| Ratio to average net assets: | ||||
| Expenses | 2.30 | % (c,e) | ||
| Net investment income | 1.76 | % (c,f) | ||
| Portfolio turnover rate | 49 | % (d) | ||
| * | Class C commenced operations on July 2, 2014. |
| (a) | Per share amounts are calculated using the average shares method, which more appropriately presents the per share data for the period. |
| (b) | Total returns are historical in nature and assume changes in share price, reinvestment of dividends and capital gains distributions, if any. Total returns for periods less than one year are not annualized. |
| (c) | Annualized for periods less than one year. |
| (d) | Not annualized. Represents Fund level turnover ratio for entire year. |
| (e) | Does not include the expenses of the investment companies in which the Fund invests |
| (f) | The recognition of investment income is affected by the timing and declaration of dividends by the underlying investment companies in which the Fund invests. |
The accompanying notes are an integral part of these financial statements.
| 21 |
| Multi-Strategy Growth & Income Fund - Class I |
| FINANCIAL HIGHLIGHTS |
The table below sets forth financial data for one share of beneficial interest outstanding throughout the period presented.
| For the Period | ||||
| Ended | ||||
| February 28, 2015 * | ||||
| Net Asset Value, Beginning of Period | $ | 17.02 | ||
| Increase From Operations: | ||||
| Net investment income (a) | 0.30 | |||
| Net gain on investments (both realized and unrealized) | 0.09 | |||
| Total from operations | 0.39 | |||
| Less Distributions: | ||||
| From net investment income | (0.06 | ) | ||
| From net realized gains on investments | (0.37 | ) | ||
| From return of capital | (0.23 | ) | ||
| Total Distributions | (0.66 | ) | ||
| Net Asset Value, End of Period | $ | 16.75 | ||
| Total Return (b) | 2.37 | % | ||
| Ratios/Supplemental Data | ||||
| Net assets, end of period (in 000’s) | $ | 1,185 | ||
| Ratio to average net assets: | ||||
| Expenses | 1.30 | % (c,e) | ||
| Net investment income | 2.80 | % (c,f) | ||
| Portfolio turnover rate | 49 | % (d) | ||
| * | Class I commenced operations on July 2, 2014. |
| (a) | Per share amounts are calculated using the average shares method, which more appropriately presents the per share data for the period. |
| (b) | Total returns are historical in nature and assume changes in share price, reinvestment of dividends and capital gains distributions, if any. Total returns for periods less than one year are not annualized. |
| (c) | Annualized for periods less than one year. |
| (d) | Not annualized. Represents Fund level turnover ratio for entire year. |
| (e) | Does not include the expenses of the investment companies in which the Fund invests |
| (f) | The recognition of investment income is affected by the timing and declaration of dividends by the underlying investment companies in which the Fund invests. |
The accompanying notes are an integral part of these financial statements.
| 22 |
| Multi-Strategy Growth & Income Fund - Class L |
| FINANCIAL HIGHLIGHTS |
The table below sets forth financial data for one share of beneficial interest outstanding throughout the period presented.
| For the Period | ||||
| Ended | ||||
| February 28, 2015 * | ||||
| Net Asset Value, Beginning of Period | $ | 17.02 | ||
| Increase From Operations: | ||||
| Net investment income (a) | 0.20 | |||
| Net gain on investments (both realized and unrealized) | 0.17 | |||
| Total from operations | 0.37 | |||
| Less Distributions: | ||||
| From net investment income | (0.13 | ) | ||
| From net realized gains on investments | (0.35 | ) | ||
| From return of capital | (0.19 | ) | ||
| Total Distributions | (0.67 | ) | ||
| Net Asset Value, End of Period | $ | 16.72 | ||
| Total Return (b) | 2.25 | % | ||
| Ratios/Supplemental Data | ||||
| Net assets, end of period (in 000’s) | $ | 8,356 | ||
| Ratio to average net assets: | ||||
| Expenses | 2.05 | % (c,e) | ||
| Net investment income | 2.00 | % (c,f) | ||
| Portfolio turnover rate | 49 | % (d) | ||
| * | Class L commenced operations on July 2, 2014. |
| (a) | Per share amounts are calculated using the average shares method, which more appropriately presents the per share data for the period. |
| (b) | Total returns are historical in nature and assume changes in share price, reinvestment of dividends and capital gains distributions, if any and exclude the effects of sales loads. Total returns for periods less than one year are not annualized. |
| (c) | Annualized for periods less than one year. |
| (d) | Not annualized. Represents Fund level turnover ratio for entire year. |
| (e) | Does not include the expenses of the investment companies in which the Fund invests |
| (f) | The recognition of investment income is affected by the timing and declaration of dividends by the underlying investment companies in which the Fund invests. |
The accompanying notes are an integral part of these financial statements.
| 23 |
| Multi-Strategy Growth & Income Fund |
| NOTES TO FINANCIAL STATEMENTS |
| February 28, 2015 |
| 1. | ORGANIZATION |
Multi-Strategy Growth & Income Fund (the “Fund”) was organized as a Delaware statutory trust on June 3, 2011 and is registered under the Investment Company Act of 1940, as amended, (the “1940 Act”), as a non-diversified, closed-end management investment company that operates as an interval fund with a continuous offering of Fund shares. The investment objective of the Fund is to seek returns from capital appreciation and income with an emphasis on income generation. The Fund pursues its investment objective by investing primarily in the income-producing securities of real estate investment trusts and alternative investment funds, as well as common stocks and structured notes, notes, bonds and asset-backed securities.
The Fund currently offers Class A, Class C, Class I and Class L shares. Class A shares commenced operations on March 16, 2012; Class C, Class I and Class L shares commenced operations on July 2, 2014. Class A and Class L shares are offered at net asset value plus a maximum sales charge of 5.75% and 3.75%, respectively. Class C and Class I shares are offered at net asset value. Each class represents an interest in the same assets of the Fund and classes are identical except for differences in their sales charge structures and ongoing service and distribution charges. All classes of shares have equal voting privileges except that each class has exclusive voting rights with respect to its service and/or distribution plans. The Fund’s income, expenses (other than class specific distribution fees) and realized and unrealized gains and losses are allocated proportionately each day based upon the relative net assets of each class.
| 2. | SUMMARY OF SIGNIFICANT ACCOUNTING POLICIES |
The following is a summary of significant accounting policies followed by the Fund in preparation of its financial statements. These policies are in conformity with accounting principles generally accepted in the United States of America (“GAAP”). The preparation of financial statements requires management to make estimates and assumptions that affect the reported amounts of assets and liabilities and disclosure of contingent assets and liabilities at the date of the financial statements and the reported amounts of income and expenses for the period. Actual results could differ from those estimates.
Security Valuation – Securities listed on an exchange are valued at the last reported sale price at the close of the regular trading session of the exchange on the business day the value is being determined, or in the case of securities listed on NASDAQ, at the NASDAQ Official Closing Price (“NOCP”). In the absence of a sale, such securities shall be valued at the mean of the closing bid and asked prices on the day of valuation. Short-term investments that mature in 60 days or less may be valued at amortized cost, provided such valuations represent fair value.
Valuation of Fund of Funds – The Fund may invest in funds of open-end or closed-end investment companies (the “Underlying Funds”). The Underlying Funds value securities in their portfolios for which market quotations are readily available at their market values (generally the last reported sale price) and all other securities and assets at their fair value using the methods established by the board of directors of the Underlying Funds. Open-end funds are valued at their net asset value per share and closed-end fund that trade on an exchange are valued as described under security valuation.
When price quotations for certain securities are not readily available, or if the available quotations are not believed to be reflective of market value by the Advisor, those securities will be valued at “fair value” as determined in good faith by the Fair Valuation Committee using procedures adopted by and under the supervision of the Fund’s Board of Trustees (the “Board”). There can be no assurance that the Fund could purchase or sell a portfolio security at the price used to calculate the Fund’s net asset value (“NAV”).
Fair valuation procedures may be used to value a substantial portion of the assets of the Fund. The Fund may use the fair value of a security to calculate its NAV when, for example, (1) a portfolio security is not traded in a public
| 24 |
| Multi-Strategy Growth & Income Fund |
| NOTES TO FINANCIAL STATEMENTS (Continued) |
| February 28, 2015 |
market or the principal market in which the security trades is closed, (2) trading in a portfolio security is suspended and not resumed prior to the normal market close, (3) a portfolio security is not traded in significant volume for a substantial period, or (4) the Advisor determines that the quotation or price for a portfolio security provided by a broker-dealer or independent pricing service is inaccurate.
The “fair value” of securities may be difficult to determine and thus judgment plays a greater role in the valuation process. The fair valuation methodology may include or consider the following guidelines, as appropriate: (1) evaluation of all relevant factors, including but not limited to, pricing history, current market level, supply and demand of the respective security; (2) comparison to the values and current pricing of securities that have comparable characteristics; (3) knowledge of historical market information with respect to the security; (4) other factors relevant to the security which would include, but not be limited to, duration, yield, fundamental analytical data, the Treasury yield curve, and credit quality.
The values assigned to fair valued investments are based on available information and do not necessarily represent amounts that might ultimately be realized, since such amounts depend on future developments inherent in long-term investments. Changes in the fair valuation of portfolio securities may be less frequent and of greater magnitude than changes in the price of portfolio securities valued at their last sale price, by an independent pricing service, or based on market quotations. Imprecision in estimating fair value can also impact the amount of unrealized appreciation or depreciation recorded for a particular portfolio security and differences in the assumptions used could result in a different determination of fair value, and those differences could be material.
The Fund invests in some securities which are not traded and the Board’s Valuation Committee has established a methodology for fair value of each type of security. Non-traded Real Estate Investment Trusts (“REITs”) that are in the public offering period (or start-up phase) are valued at cost according to management’s fair valuation methodology unless the REIT issues an updated valuation. The Fund generally purchases REITs at NAV or without a commission. However, start-up REITs amortize a significant portion of their start-up costs and therefore potentially carry additional risks that may impact valuation should the REIT be unable to raise sufficient capital and execute their business plan. As such, start-up REITs pose a greater risk than seasoned REITs because if they encounter going concern issues, they may see significant deviation in value from the fair value, cost basis approach as represented. Management is not aware of any information which would cause a change in cost basis valuation methodology currently being utilized for non-traded REITs in their offering period. Non-traded REITs that are in their offering period are generally categorized as Level 3 in the fair value hierarchy. Once a REIT closes to new investors, the Fund values the security based on the movement of an appropriate market index or a similar security that is publicly traded until the REIT issues an updated market valuation. Non-traded REITs that have closed to new investors are generally categorized in Level 2 of the fair value hierarchy, due to the significance of the effect of the application of the movement of the market index on the overall fair valuation of the REIT. Other non-traded private investments are monitored for any independent audits of the investment or impairments reported on the potential value of the investment. For non-traded private investments that are themselves treated as investment companies under GAAP, the Fund follows the guidance in GAAP that allows, as practical expedient, the Fund to value such investments at their reported NAV per share (of if not unitized, at an equivalent percentage of the capital of the investee entity). Such investments typically provide an updated NAV or its equivalent on a quarterly basis. The Valuation Committee meets frequently to discuss the valuation methodology and will adjust the value of a security if there is a public update to such valuation.
The non-traded Business Development Companies provide quarterly fair value pricing which is used as an indicator of the valuation for the fund. If the value fluctuates, the Advisor will provide an updated price. If a significant event occurs that causes a large change in price, the Fair Valuation Committee will call a meeting to evaluate the fair value. Non-traded Business Development Companies are categorized as Level 2 in the fair value hierarchy.
The Fund utilizes various methods to measure the fair value of its investments on a recurring basis. GAAP establishes a hierarchy that prioritizes inputs to valuation methods. The three levels of input are:
| 25 |
| Multi-Strategy Growth & Income Fund |
| NOTES TO FINANCIAL STATEMENTS (Continued) |
| February 28, 2015 |
Level 1 – Unadjusted quoted prices in active markets for identical assets and liabilities that the Fund has the ability to access.
Level 2 – Observable inputs other than quoted prices included in Level 1 that are observable for the asset or liability, either directly or indirectly. These inputs may include quoted prices for the identical instrument on an inactive market, prices for similar instruments, interest rates, prepayment speeds, credit risk, yield curves, default rates and similar data.
Level 3 – Unobservable inputs for the asset or liability, to the extent relevant observable inputs are not available; representing the Fund’s own assumptions about the assumptions a market participant would use in valuing the asset or liability, and would be based on the best information available.
The availability of observable inputs can vary from security to security and is affected by a wide variety of factors, including, for example, the type of security, whether the security is new and not yet established in the marketplace, the liquidity of markets, and other characteristics particular to the security. To the extent that valuation is based on models or inputs that are less observable or unobservable in the market, the determination of fair value requires more judgment. Accordingly, the degree of judgment exercised in determining fair value is greatest for instruments categorized in Level 3.
The inputs used to measure fair value may fall into different levels of the fair value hierarchy. In such cases, for disclosure purposes, the level in the fair value hierarchy within which the fair value measurement falls in its entirety, is determined based on the lowest level input that is significant to the fair value measurement in its entirety.
The inputs or methodology used for valuing securities are not necessarily an indication of the risk associated with investing in those securities. The following tables summarize the inputs used as of February 28, 2015 for the Fund’s assets and liabilities measured at fair value:
| Assets* | Level 1 | Level 2 | Level 3 | Total | ||||||||||||
| Investments: | ||||||||||||||||
| Common Stocks | $ | 15,256,026 | $ | — | $ | — | $ | 15,256,026 | ||||||||
| Exchange Traded Fund | 2,278,456 | — | — | 2,278,456 | ||||||||||||
| Real Estate Investment Trusts | 7,863,596 | 67,336,929 | 19,205,406 | 94,405,931 | ||||||||||||
| Non-Listed Business Development Companies | — | 43,430,932 | — | 43,430,932 | ||||||||||||
| Private Investment Companies | — | — | 26,705,885 | 26,705,885 | ||||||||||||
| Closed-End Funds | 14,316,519 | — | — | 14,316,519 | ||||||||||||
| Short-Term Investment | 14,411,931 | — | — | 14,411,931 | ||||||||||||
| Total Investments: | $ | 54,126,528 | $ | 110,767,861 | $ | 45,911,291 | $ | 210,805,680 | ||||||||
| * | Refer to the Portfolio of Investments for industry classifications. |
There were no transfers between Level 1 and Level 2 during the year ended February 28, 2015. Transfers reflected in the table below represent transfers from Level 3 to Level 2 due to non-traded REITs that closed their offering period during the year ended February 28, 2015 and are thereafter being valued based upon changes in the value of an appropriate market index.
It is the Fund’s policy to record transfers into or out of any level at the beginning of the reporting period.
| 26 |
| Multi-Strategy Growth & Income Fund |
| NOTES TO FINANCIAL STATEMENTS (Continued) |
| February 28, 2015 |
The following is a reconciliation of assets in which Level 3 inputs were used in determining value:
| Real Estate | Private Investment | |||||||||||
| Investment Trusts | Companies | Totals | ||||||||||
| Beginning Balance | $ | 21,455,874 | $ | 487,660 | $ | 21,943,534 | ||||||
| Total realized gain (loss) | — | — | — | |||||||||
| Appreciation (Depreciation) | 396,479 | 368,225 | 764,704 | |||||||||
| Cost of Purchases | 19,000,000 | 25,850,000 | 44,850,000 | |||||||||
| Proceeds from Sales and returns of capital | (191,073 | ) | — | (191,073 | ) | |||||||
| Accrued Interest | — | — | — | |||||||||
| Net transfers in/out of level 3 | (21,455,874 | ) | — | (21,455,874 | ) | |||||||
| Ending Balance | $ | 19,205,406 | $ | 26,705,885 | $ | 45,911,291 | ||||||
Exchange Traded Funds – The Fund may invest in exchange traded funds (“ETFs”). ETFs are a type of index fund bought and sold on a securities exchange. An ETF trades like common stock and represents a fixed portfolio of securities designed to track the performance and dividend yield of a particular domestic or foreign market index. The Fund may purchase an ETF to gain exposure to a portion of the U.S. or a foreign market. The risks of owning an ETF generally reflect the risks of owning the underlying securities they are designed to track, although the lack of liquidity on an ETF could result in it being more volatile. Additionally, ETFs have fees and expenses that reduce their value.
Security Transactions and Investment Income – Investment security transactions are accounted for on a trade date basis. Cost is determined and gains and losses are based upon the specific identification method for both financial statement and federal income tax purposes. Dividend income is recorded on the ex-dividend date and interest income is recorded on the accrual basis. Purchase discounts and premiums on securities are accreted and amortized over the life of the respective securities.
Option Transactions – The Fund is subject to equity price risk in the normal course of pursuing its investment objective and may purchase or sell options to help hedge against risk. When the Fund writes a call option, an amount equal to the premium received is included in the statement of assets and liabilities as a liability. The amount of the liability is subsequently marked-to-market to reflect the current market value of the option. If an option expires on its stipulated expiration date or if the Fund enters into a closing purchase transaction, a gain or loss is realized. If a written call option is exercised, a gain or loss is realized for the sale of the underlying security and the proceeds from the sale are increased by the premium originally received. As writer of an option, the Fund has no control over whether the option will be exercised and, as a result, retains the market risk of an unfavorable change in the price of the security underlying the written option.
The Fund may purchase put and call options. Put options are purchased to hedge against a decline in the value of securities held in the Fund’s portfolio. If such a decline occurs, the put options will permit the Fund to sell the securities underlying such options at the exercise price, or to close out the options at a profit. The premium paid for a put or call option plus any transaction costs will reduce the benefit, if any, realized by the Fund upon exercise of the option, and, unless the price of the underlying security rises or declines sufficiently, the option may expire worthless to the Fund. In addition, in the event that the price of the security in connection with which an option was purchased moves in a direction favorable to the Fund, the benefits realized by the Fund as a result of such favorable movement will be reduced by the amount of the premium paid for the option and related transaction costs. Written and purchased options are non-income producing securities. With purchased options, there is minimal counterparty risk to the Fund since these options are exchange traded and the exchange’s clearinghouse, as counterparty to all exchange traded options, guarantees against a possible default.
GAAP requires disclosures about the Fund’s derivative and hedging activities, including how such activities are accounted for and their effect on the Fund’s financial position, performance and cash flows.
| 27 |
| Multi -Strategy Growth & Income Fund |
| NOTES TO FINANCIAL STATEMENTS (Continued) |
| February 28, 2015 |
As of February 28, 2015, the change in unrealized appreciation and realized gain on option contracts subject to equity price risk amounted to $34,711 and $712,317, respectively. Such figures can be found on the Statement of Operations. The table presented under Note 4 provides an indication of the volume of derivative activity during the year ended February 28, 2015.
Federal Income Taxes – The Fund intends to comply with the requirements of Subchapter M of the Internal Revenue Code applicable to regulated investment companies and will distribute all of its taxable income, if any to shareholders. Accordingly, no provision for Federal income taxes is required in the financial statements.
The Fund recognizes the tax benefits of uncertain tax positions only when the position is “more likely than not” to be sustained assuming examination by tax authorities. Management has reviewed the tax positions on returns filed for open tax years (2013-2014), or expected to be taken in the Fund’s 2015 return, and concluded that no liability for unrecognized tax benefits should be recorded related to uncertain tax positions. The Fund identifies its major tax jurisdictions as U.S. Federal. The Fund recognizes interest and penalties, if any, related to unrecognized tax benefits as income tax expense in the Statements of Operations. During the year ended February 28, 2015, the Fund did not incur any interest or penalties.
Distributions to Shareholders – Distributions from investment income are declared and paid monthly. Distributions from net realized capital gains, if any, are declared and paid annually and are recorded on the ex-dividend date. The character of income and gains to be distributed is determined in accordance with income tax regulations, which may differ from GAAP.
Indemnification – The Trust indemnifies its officers and Trustees for certain liabilities that may arise from the performance of their duties to the Trust. Additionally, in the normal course of business, the Fund enters into contracts that contain a variety of representations and warranties and which provide general indemnities. The Fund’s maximum exposure under these arrangements is unknown, as this would involve future claims that may be made against the Fund that have not yet occurred. However, based on experience, the Trust expects the risk of loss due to these warranties and indemnities to be remote.
| 3. | ADVISORY FEE AND OTHER RELATED PARTY TRANSACTIONS |
Advisory Fees – Pursuant to an investment advisory agreement with the Trust, with respect to the Fund, (the “Advisory Agreement”), investment advisory services are provided to the Fund by RJL Capital Management, LLC., (the “Advisor”). Under the terms of the Advisory Agreement, the Advisor receives monthly fees calculated at an annual rate of 0.75% of the average daily net assets of the Fund. For the year ended February 28, 2015, the Advisor earned advisory fees of $1,266,798.
The Advisor has contractually agreed to waive all or part of its advisory fees and/or make reimbursement payments to limit Fund expenses (exclusive of any front-end or contingent deferred loads, taxes, leverage interest, borrowing interest, brokerage commissions, expenses incurred in connection with any merger or reorganization, dividend expense on securities sold short, acquired (underlying) fund fees and expenses, or extraordinary expenses such as litigation) at least until June 30, 2015, so that the total annual operating expenses of the Fund do not exceed 1.75%, 2.50%, 1.60% and 2.25% for Class A, Class C, Class I and Class L, respectively, of the Fund’s average daily net assets. During the year ended February 28, 2015, the Advisor did not waive any fees or reimburse any expenses.
Waivers and expense reimbursement payments may be recouped by the Advisor from the Fund, to the extent that overall expenses fall below the expense limitation, within three fiscal years of when the amounts were waived or reimbursed. For the year ended February 28, 2015, the Advisor recouped $96,982 from the Fund for prior period fee waivers/expense reimbursements. As of February 28, 2015, there were no additional expenses subject to recapture by the Advisor.
| 28 |
| Multi-Strategy Growth & Income Fund |
| NOTES TO FINANCIAL STATEMENTS (Continued) |
| February 28, 2015 |
Sub-advisory services are provided to the Fund pursuant to agreements between the Advisor and First Allied Asset Management, Inc. (the “Sub-Advisor”). Under the terms of the sub-advisory agreements, the Advisor compensates the Sub-Advisor based on a portion of the Fund’s average daily net assets which the Sub-Advisor has been allocated to manage. Please see note 8 for more information.
Distributor – The distributor of the Fund is Northern Lights Distributors, LLC (the “Distributor”). The Board has adopted, on behalf of the Fund, a Shareholder Services Plan under which the Fund may compensate financial industry professionals for providing ongoing services in respect of clients with whom they have distributed shares of the Fund. Under the Shareholder Services Plan, the Fund may pay 0.25% per year of its average daily net assets of each of Class A, Class C and Class L shares for such services. For the year ended February 28, 2015, the Fund incurred shareholder servicing fees of $405,609, $9,154, and $5,943 for Class A, Class C and Class L shares, respectively. Under the Distribution Plans, the Fund pays 0.75% and 0.50% per year of its average daily net assets for such services for Class C and Class L shares, respectively. For the year ended February 28, 2015, the Fund incurred distributions fees of $27,808 and $11,888 for Class C and Class L shares, respectively.
The Distributor acts as the Fund’s principal underwriter in a continuous public offering of the Fund’s shares. For the year ended February 28, 2015, the Distributor received $2,469,803 and $332,678 in underwriting commissions for sales of Class A and Class L shares, respectively, of which $315,303 and $66,689 was retained by the principal underwriter or other affiliated broker-dealers.
In addition, certain affiliates of the Distributor provide services to the Fund as follows:
Gemini Fund Services, LLC (“GFS”) – GFS, an affiliate of the Distributor, provides administration, fund accounting, and transfer agent services to the Trust. Pursuant to separate servicing agreements with GFS, the Fund pays GFS customary fees for providing administration, fund accounting and transfer agency services to the Fund. Certain officers of the Fund are also officers of GFS, and are not paid any fees directly by the Fund for servicing in such capacities.
Northern Lights Compliance Services, LLC (“NLCS”) – NLCS, an affiliate of GFS and the Distributor, provides a Chief Compliance Officer to the Fund, as well as related compliance services, pursuant to a consulting agreement between NLCS and the Fund. Under the terms of such agreement, NLCS receives customary fees from the Fund.
Gemcom, LLC (“Gemcom”) – Gemcom, an affiliate of GFS and the Distributor, provides EDGAR conversion and filing services as well as print management services for the Fund on an ad-hoc basis. For the provision of these services, Gemcom receives customary fees from the Fund.
Trustees – The Fund pays each Trustee who is not affiliated with the Fund or Advisor a quarterly fee of $2,750, as well as reimbursement for any reasonable expenses incurred attending meetings. The “interested persons” who serve as Trustees of the Fund receive no compensation for their services as Trustees. None of the executive officers receive compensation from the Fund. The Fund also pays each Trustee who is a member of the audit committee a quarterly fee of $1,500.
Other Affiliates – During the year ended February 28, 2015, Lucia Securities, a registered broker/dealer and an affiliate of the Advisor, executed trades on behalf of the Fund for which it received placement fees, which could be deemed to be a form of brokerage commissions, of $552,000. Additionally, during the year ended February 28, 2015, First Allied Securities, Inc., a registered broker/dealer and an affiliate of the Sub-Advisor, executed trades on behalf of the Fund for which it received $50,604 in trade commissions.
| 29 |
| Multi-Strategy Growth & Income Fund |
| NOTES TO FINANCIAL STATEMENTS (Continued) |
| February 28, 2015 |
| 4. | INVESTMENT TRANSACTIONS |
The cost of purchases and proceeds from the sale of securities, other than short-term securities, for the year ended February 28, 2015, amounted to $150,205,275 and 81,050,147, respectively.
Transactions in option contracts written during the year ended February 28, 2015, were as follows:
| Contracts | Premiums | |||||||
| Outstanding at Beginning of Year | 2,319 | $ | 335,349 | |||||
| Options Written | 11,355 | 1,223,496 | ||||||
| Options Exercised | (3,909 | ) | (501,162 | ) | ||||
| Options Closed | (4,685 | ) | (547,583 | ) | ||||
| Options Expired | (5,080 | ) | (510,100 | ) | ||||
| Outstanding at End of Year | — | $ | — | |||||
| 5. | REPURCHASE OFFERS / SHARES OF BENEFICIAL INTEREST |
Pursuant to Rule 23c-3 under the 1940 Act, the Fund offers shareholders on a quarterly basis the option of redeeming shares, at net asset value, of no less than 5% and no more than 25% of the shares outstanding on the Repurchase Request Deadline. The Board shall determine the quarterly repurchase offer amount. There is no guarantee that shareholders will be able to sell all of the shares they desire in a quarterly repurchase offer, although each shareholder will have the right to require the Fund to purchase up to and including 5% of such shareholder’s shares in each quarterly repurchase. Limited liquidity will be provided to shareholders only through the Fund’s quarterly repurchases.
| Repurchase Offer | Repurchase Offer | Repurchase Offer | Repurchase Offer | |||||
| Commencement Date | March 17, 2014 | June 17, 2014 | September 17, 2014 | December 17, 2014 | ||||
| Repurchase Request | April 16, 2014 | July 17, 2014 | October 17, 2014 | January 16, 2015 | ||||
| Repurchase Pricing Date | April 16, 2014 | July 17, 2014 | October 17, 2014 | January 16, 2015 | ||||
| Net Asset Value as of Repurchase Offer Date: | ||||||||
| Class A | $16.73 | $17.05 | $16.90 | $16.94 | ||||
| Class C | N/A | N/A | $16.88 | $16.92 | ||||
| Class I | N/A | N/A | $16.90 | $16.95 | ||||
| Class L | N/A | N/A | $16.88 | $16.93 | ||||
| Amount Repurchased | ||||||||
| Class A | $1,353,471 | $1,662,630 | $1,415,660 | $13,543,023 | ||||
| Class C | N/A | N/A | $15 | $278,129 | ||||
| Class I | N/A | N/A | $13,792 | $89,690 | ||||
| Class L | N/A | N/A | $105 | $71,150 | ||||
| Percentage of Outstanding Shares Repurchased | ||||||||
| Class A | 0.95 | % | 1.04 | % | 0.83 | % | 7.26% | |
| Class C | N/A | N/A | 0.00 | %* | 2.96% | |||
| Class I | N/A | N/A | 1.21 | % | 7.01% | |||
| Class L | N/A | N/A | 0.00 | %* | 1.07% | |||
| * | Amount represents less then 0.01%. |
| 30 |
| Multi-Strategy Growth & Income Fund |
| NOTES TO FINANCIAL STATEMENTS (Continued) |
| February 28, 2015 |
| 6. | DISTRIBUTIONS TO SHAREHOLDERS AND TAX COMPONENTS OF CAPITAL |
The tax character of Fund distributions for the following years was as follows:
| Year Ended | Year Ended | |||||||
| February 28, 2015 | February 28, 2014 | |||||||
| Ordinary Income | $ | 4,395,879 | $ | 3,054,165 | ||||
| Long-Term Capital Gain | 3,356,708 | 1,345,465 | ||||||
| Return of Capital | 2,399,993 | 445,418 | ||||||
| $ | 10,152,580 | $ | 4,845,048 | |||||
The difference between the book basis and tax basis character of distributions as of February 28, 2014 and February 28, 2015 is primarily attributable to the income tax treatment of short term capital gain distributions.
As of February 28, 2015, the components of accumulated earnings/(deficit) on a tax basis were as follows:
| Post October Loss | Unrealized | Total | ||||||||
| and Late Year | Appreciation/ | Accumulated | ||||||||
| Losses | (Depreciation) | Earnings/(Deficits) | ||||||||
| $ | (3,012,046 | ) | $ | 14,532,043 | $ | 11,519,997 | ||||
The difference between book basis and tax basis unrealized appreciation of investments, accumulated net realized losses and undistributed net investment income/ loss is primarily attributable to the adjustment for partnerships and the tax deferral of losses on wash sales.
Late year losses incurred after December 31 within the fiscal year are deemed to arise on the first business day of the following fiscal year for tax purposes. The Fund incurred and elected to defer such late year losses of $683,953.
Capital losses incurred after October 31 within the fiscal year are deemed to arise on the first business day of the following fiscal year for tax purposes. The Fund incurred and elected to defer such capital losses of $2,328,093.
Permanent book and tax differences, primarily attributable to the book/ tax basis treatment of foreign currency gains/losses, the reclass of ordinary distributions, and adjustments related to partnerships, resulted in reclassification for the year ended February 28, 2015 as follows:
| Paid | Undistributed | Accumulated | ||||||||
| In | Net Investment | Net Realized | ||||||||
| Capital | Income | Loss | ||||||||
| $ | (818,587 | ) | $ | (806,773 | ) | $ | 1,625,360 | |||
| 7. | LINE OF CREDIT |
The Fund has a line of credit with a variable limit based on how many securities are pledged as collateral. This line of credit is intended to provide financing, if necessary, subject to certain restrictions, in connection with shareholder redemptions. Borrowings are secured by the Fund’s investments. Interest will be accrued at the 1 Month LIBOR rate plus 110 bps to be paid monthly. The credit facility is with BNP Paribas. During the year ended February 28, 2015, the Fund did not borrow from the line of credit.
| 31 |
| Multi-Strategy Growth & Income Fund |
| NOTES TO FINANCIAL STATEMENTS (Continued) |
| February 28, 2015 |
| 8. | SUBSEQUENT EVENTS |
Subsequent events after the date of the Statement of Assets and Liabilities have been evaluated through the date the financial statements were issued. Management has concluded that there is no impact requiring adjustment or disclosure in the financial statements. As of March 1, 2015, the Adviser has determined to take on full and sole responsibility for management of the portfolio and has terminated its sub-advisory agreement with First Allied Asset Management. On March 30, 2015, the Fund paid a dividend of $0.0836, $0.0834, $0.0837 and $0.0835 per share to shareholders of record on March 27, 2015 for Class A, Class C, Class I and Class L shares, respectively. The Fund completed a quarterly repurchase offer on April 15, 2015 which resulted in 1.93%, 3.44%, 1.18%, and 3.08% of Fund shares being repurchased for $3,526,297, $472,011, $14,054 and $295,646 for Class A, Class C, Class I and Class L, respectively.
| 32 |

REPORT OF INDEPENDENT REGISTERED PUBLIC ACCOUNTING FIRM
To the Board of Trustees and the Shareholders of
Multi-Strategy Growth & Income Fund
We have audited the accompanying statement of assets and liabilities of Multi-Strategy Growth & Income Fund, including the portfolio of investments, as of February 28, 2015, and the related statements of operations and cash flows for the year then ended, the statements of changes in net assets for each of the years in the two year period then ended and the financial highlights each of the years and period presented in the two year period then ended and for the period March 16, 2012 (commencement of operations) through February 28, 2013. These financial statements and financial highlights are the responsibility of the Fund’s management. Our responsibility is to express an opinion on these financial statements and financial highlights based on our audits.
We conducted our audits in accordance with the standards of the Public Company Accounting Oversight Board (United States). Those standards require that we plan and perform the audits to obtain reasonable assurance about whether the financial statements and financial highlights are free of material misstatement. An audit includes examining, on a test basis, evidence supporting the amounts and disclosures in the financial statements. Our procedures included confirmation of securities owned as of February 28, 2015 by correspondence with the custodian and brokers and investee companies. An audit also includes assessing the accounting principles used and significant estimates made by management, as well as evaluating the overall financial statement presentation. We believe that our audits provide a reasonable basis for our opinion.
As explained in Note 2, the financial statements include securities valued at $156,679,152 (79% of net assets), whose fair values have been estimated by the Board of Trustees in the absence of readily ascertainable fair values.
In our opinion, the financial statements and financial highlights referred to above present fairly, in all material respects, the financial position of Multi-Strategy Growth & Income Fund as of February 28, 2015, and the results of its operations and its cash flows for the year then ended and the changes in its net assets for each of the years in the two year period then ended and its financial highlights for each of the years and period presented in the two year period then ended and for the period March 16, 2012 through February 28, 2013, in conformity with accounting principles generally accepted in the United States of America.
 | |
| BBD, LLP |
Philadelphia, Pennsylvania
April 28, 2015
| 33 |
| Multi-Strategy Growth & Income Fund |
| DISCLOSURE OF FUND EXPENSES (Unaudited) |
| February 28, 2015 |
As a shareholder of the Fund you incur two types of costs: transaction costs (sales loads) and ongoing costs, which include management fees, shareholder service fees and other Fund operating expenses. This example is intended to help you understand your ongoing costs (in dollars) of investing in the Fund and to compare these costs with the ongoing costs of investing in other mutual funds. Please note, the expenses shown in the tables are meant to highlight ongoing costs only and do not reflect any transactional costs.
This example is based on an investment of $1,000 invested for the six month period beginning September 1, 2014 and ending February 28, 2015.
Actual Expenses: The first line of the table provides information about actual account values and actual expenses. You may use the information in this line, together with the amount you invested, to estimate the expenses that you paid over the period. Simply divide your account value by $1,000 (for example, an $8,600 account value divided by $1,000 = 8.6), then multiply the result by the number in the first line under the heading entitled “Expenses Paid During the Period” to estimate the expenses you paid on your account during the period.
Hypothetical Examples for Comparison Purposes: The second line of the table below provides information about hypothetical account values and hypothetical expenses based on the Fund’s actual expense ratio and an assumed rate of return of 5% per year before expenses, which is not the Fund’s actual return. The hypothetical account values and expenses may not be used to estimate the actual ending account balance or expenses you paid for the period. You may use this information to compare the ongoing costs of investing in the Fund and other funds. To do so, compare this 5% hypothetical example with the 5% hypothetical examples that appear in the shareholder reports of the other funds.
Please note that the expenses shown in the table are meant to highlight your ongoing costs only and do not reflect any transactional costs which may be applicable to your account. Therefore, the second line of the table is useful in comparing ongoing costs only, and will not help you determine the relative total costs of owning different funds. In addition, if these transactional costs were included, your costs would have been higher.
| Beginning | Ending Account | Expenses Paid | ||||||
| Account Value | Value | Expense | During the Period* | |||||
| (9/1/14) | (2/28/15) | Ratios | (9/1/14 to 2/28/15) | |||||
| Actual | ||||||||
| Class A | $1,000.00 | $1,009.80 | 1.64% | $ 8.17 | ||||
| Class C | $1,000.00 | $1,006.20 | 2.39% | $11.90 | ||||
| Class I | $1,000.00 | $1,011.40 | 1.39% | $ 6.91 | ||||
| Class L | $1,000.00 | $1,007.30 | 2.14% | $10.66 | ||||
| Hypothetical | ||||||||
| (5% return before expenses) | ||||||||
| Class A | $1,000.00 | $1,016.66 | 1.64% | $ 8.20 | ||||
| Class C | $1,000.00 | $1,012.93 | 2.39% | $11.94 | ||||
| Class I | $1,000.00 | $1,017.92 | 1.39% | $ 6.93 | ||||
| Class L | $1,000.00 | $1,014.17 | 2.14% | $10.70 |
| * | Expenses Paid During Period are equal to the Fund’s annualized expense ratio, multiplied by the number of days in the period from September 1, 2014 through February 28, 2015 (181) divided by the number of days in the fiscal year (365). |
| 34 |
Approval of the Continuance of Investment Advisory Agreement
At a meeting held on February 6, 2015, the Board of Trustees (the “Board” or the “Trustees”) of Multi-Strategy Growth & Income Fund (the “Fund” or the “Trust”), including a majority of the Trustees who are not “interested persons” (the “Independent Trustees”), as that term is defined in the Investment Company Act of 1940, as amended, approved the renewal of the Advisory Agreement (the “Advisory Agreement”) between RJL Capital Management, LLC (the “Adviser”) and the Trust with respect to the Fund. The Trustees reviewed in detail the information provided by the Adviser related to the proposed renewal of the Advisory Agreement. In its consideration of the Advisory Agreement, the Board, including the Independent Trustees, did not identify any single factor as all-important or controlling, and the following summary does not detail all the matters considered.
Nature, Extent and Quality of Services. The Board examined the nature, extent and quality of the services provided by the Adviser to the Fund. The Trustees noted that the Adviser has extensive experience, spends a significant amount of time and care in its research process, and has demonstrated an investment in its human resources and operations. The Trustees noted the Adviser dedicates time to learning as much as possible regarding the underlying investments in order to build the portfolio. In addition to research and due diligence, the Trustees agreed that the Adviser has a very good team in place servicing the Fund. The Board discussed that the firm has extensive experience in non-traded REITs, and the Adviser has a good reputation in terms of experience. The Board discussed the nature of the Adviser’s operations and the quality of the Adviser’s compliance infrastructure. The Board noted that the Adviser had established a culture of open communication with the Board. The Board further noted the Adviser had reported no litigation or administrative actions during the last 12 months. Overall, it was the consensus of the Trustees that they were satisfied with the nature, extent and quality of the services provided to the Fund under the Agreement.
Fees and Expenses. The Trustees reviewed information regarding fees charged by advisers to a peer group of funds composed of 5 other closed-end interval funds. The Trustees noted that the Adviser charges an advisory fee of 0.75%, which compared favorably to the peer group average of 1.19%. With respect to the average net expense ratio, they noted that the Fund’s net expense ratio of 2.85% is higher than the peer group average of 2.29%. The Trustees noted the Adviser did not receive any other payments from the Fund other than advisory fees, although its affiliate receives fees in connection with portfolio trades. The Trustees concluded that the advisory fee is reasonable.
Performance. The Trustees considered the Adviser’s past performance, as well as other factors relating to the Adviser’s track record, noting the Fund outperformed the Barclay’s Aggregate Bond Index with returns of 9.62% versus 5.97% for the last year, and 8.56% versus 2.48% since the inception of the Fund. The Trustees noted that the Fund achieved its objective, as well as the Adviser’s goals of delivering non-correlated returns and consistent monthly dividend distributions, and they considered that the Fund had achieved a strong Sharpe ratio, which indicated that the Fund was taking on relatively less risk to achieve the returns obtained. The Trustees concluded that the Fund’s performance was in line with the strategy and expectations, and they commended management for a job well done.
Economies of Scale. The Trustees considered whether the Adviser has realized or will realize economies of scale with respect to the management of the Fund. It was the consensus of the Trustees that the Fund had not achieved economies of scale, and they agreed to revisit this in future years. The Trustees agreed with the Adviser’s assessment that, as the Fund grows, so will the complexity of the management of the Fund, requiring additional Adviser resources. The Trustees noted their satisfaction with the Fund’s growth over the past year, and indicated their belief that continued growth would bring some economies to the operations of the Fund and will reduce other Fund expenses to the benefit of shareholders, and agreed to monitor Fund growth and the appropriateness of breakpoints.
Profitability. The Board considered the profits realized by the Adviser in connection with the operation of the Fund and whether the amount of profit is a fair entrepreneurial profit for the management of the Fund. The Board noted that the Adviser reported receiving a profit that was modest in both percentage and dollar amount,
| 35 |
and expressed their satisfaction with the fact that the Adviser was able to manage the Fund on a cost effective basis even though its advisory fee was less than the peer group average. The Board concluded that the Adviser’s estimated level of profitability from its relationship with the Fund was not excessive.
Conclusion. During the Board’s deliberations, it was noted that the Board did not identify any single piece of information that was all-important or controlling with respect to the Advisory Agreement. Having requested and received such information from the Adviser as the Trustees believed to be reasonably necessary to evaluate the terms of the Advisory Agreement, and as assisted by the advice of Counsel, the Trustees concluded that the fee structure is reasonable, that renewal of the Advisory Agreement is in the best interests of the shareholders of the Fund and that the Board was satisfied with the overall performance of the Fund and satisfied with management.
| 36 |
| Multi-Strategy Growth & Income Fund |
| TRUSTEE TABLE (Unaudited) |
| February 28, 2015 |
Independent Trustees
| Name, Address and Age (Year of Birth) | Position/Term of Office* | Principal Occupation During the Past Five Years | Number of Portfolios in Fund Complex** Overseen by Trustee | Other Directorships held by Trustee During Last Five Years | |||||||||
| Mark J. Riedy, PhD. (1942) | Trustee since September 2011 | Executive Director of the Emeritus Burnham-Moores Center for Real Estate and the former Ernest W. Hahn Professor of Real Estate Finance at the University of San Diego (1992 to Present) | 1 | None | |||||||||
| Ira J. Miller (1946) | Trustee since September 2011 | Retired as of August 2007 | 1 | None | |||||||||
| John D. Frager (1958) | Trustee since September 2011 | Executive Managing Director of CBRE, Inc. (2010 to present); CEO and President of Cassidy Turley San Diego (2002 to 2010); Senior Managing Director of CB Richard Ellis (Prior to 2002) | 1 | None |
Interested Trustees, Officers
| Name, Address and Age | Position/Term of Office* | Principal Occupation During the Past Five Years | Number of Portfolios in Fund Complex** Overseen by Trustee | Other Directorships held by Trustee During Last 5 Years | |||||||||
| Raymond J. Lucia, Jr. *** (1975) | Trustee and President since September 2011 | Chief Executive Officer for RJL Capital Management LLC (2012- Present); Chief Executive Officer for RJL Wealth Management, LLC (2010-Present); Chief Executive Officer for Lucia Securities, LLC (2010-Present), Executive Vice President for Raymond J. Lucia Companies, Inc.(2002-2010) | 1 | None |
| 37 |
| Multi-Strategy Growth & Income Fund |
| TRUSTEE TABLE (Unaudited) (Continued) |
| February 28, 2015 |
Interested Trustees, Officers (Continued)
| Name, Address and Age (Year of Birth) | Position/Term of Office* | Principal Occupation During the Past Five Years | Number of Portfolios in Fund Complex** Overseen by Trustee | Other Directorships held by Trustee During Last Five Years | |||||||||
| Stephanie Pimentel Holly (1983) | Treasurer, since September 2012 | Chief Financial Officer for RJL Capital Management LLC (2012 to present); Director of Finance for RJL Capital Management, LLC (2010 to 2012); Chief Financial Officer for RJL Wealth Management, LLC (2014 - Present); Vice President of RJL Wealth Management, LLC (2012 - 2014), Director of Finance for RJL Wealth Management, LLC (2011 - 2012), Senior Financial Analyst for RJL Wealth Management, LLC (2010 - 2011); Director of Finance for LPL Financial (2008 to 2010); Senior Financial Analyst for LPL Financial (2006 to 2008) | N/A | N/A | |||||||||
| James Colantino (1969) | Assistant Treasurer, since September 2011 | Senior Vice President (2011 to present); Vice President (2004 to 2011); Senior Fund Administrator (1999 to 2004); Gemini Fund Services, LLC. | N/A | N/A | |||||||||
| Michael Castellino (1974) | Assistant Treasurer, since February 2015 | Assistant Vice President (2013 to present); Gemini Fund Services, LLC; Assistant Vice President (2012 to 2013); International Fund Services; Vice President (2008 to 2012) HSBC Securities Services | N/A | N/A | |||||||||
| Theresa Ochs (1967) | Secretary since April 2015 | CCO for Lucia Capital Management (2012 to present); CCO for Lucia Wealth Services (2010-present); CCO of Lucia Securities, LLC (2015-Present), Sr. Compliance Officer, Lucia Securities, LLC (2013-2015), CCO for Lucia Securities, LLC (2011-2013), CCO for Lucia Securities, LLC (2009-2011) CCO for Raymond J Lucia Companies, Inc. (2009-2011), Designated Registered Principal, First Allied Securities, Inc. (2007- 2011) | N/A | N/A |
| 38 |
| Multi-Strategy Growth & Income Fund |
| TRUSTEE TABLE (Unaudited) (Continued) |
| February 28, 2015 |
Interested Trustees, Officers (Continued)
| Name, Address and Age | Position/Term of Office* | Principal Occupation During the Past Five Years | Number of Portfolios in Fund Complex** Overseen by Trustee | Other Directorships held by Trustee During Last 5 Years | |||||||||
| Dawn M. Dennis (1966) | Assistant Secretary, since October 2013 | Senior Paralegal, Gemini Fund Services (since May 2013); Paralegal (from July 2011 through April 2013) | N/A | N/A | |||||||||
| Emile R. Molineaux (1962) | Chief Compliance Officer and Anti- Money Laundering Officer, since December 2010 | CCO of various clients of Northern Lights Compliance Services, LLC, (Secretary since 2003 and Senior Compliance Officer since 2011); General Counsel, CCO and Senior Vice President, Gemini Fund Services, LLC (2003-2011) | N/A | N/A |
| * | The term of office for each Trustee and officer listed above will continue indefinitely. |
| ** | The term “Fund Complex” refers to Multi-Strategy Growth & Income Fund. |
| *** | Raymond J. Lucia, Jr. is an interested person of the Fund by virtue of his position as President of the Fund and his indirect controlling interest in the Trust’s Advisor. |
The Fund’s Statement of Additional Information includes additional information about the Trustees and is available free of charge, upon request, by calling toll-free 1-855-601-3841.
| 39 |
PRIVACY NOTICE
Rev: April 2013
| FACTS | WHAT DOES MULTI-STRATEGY GROWTH & INCOME FUND DO WITH YOUR PERSONAL INFORMATION? | |||
| Why? | Financial companies choose how they share your personal information. Federal law gives consumers the right to limit some but not all sharing. Federal law also requires us to tell you how we collect, share, and protect your personal information. Please read this notice carefully to understand what we do. | |||
| What? | The types of personal information we collect and share depend on the product or service you have with us. This information can include: | |||
| ■ | Social Security number | ■ | Purchase History | |
| ■ | Assets | ■ | Account Balances | |
| ■ | Retirement Assets | ■ | Account Transactions | |
| ■ | Transaction History | ■ | Wire Transfer Instructions | |
| ■ | Checking Account Information | |||
| When you are no longer our customer, we continue to share your information as described in this notice. | ||||
| How? | All financial companies need to share customers’ personal information to run their everyday business. In the section below, we list the reasons financial companies can share their customers’ personal information; the reasons The Multi-Strategy Growth & Income Fund chooses to share; and whether you can limit this sharing. | |||
| Reasons we can share your personal information | Does Multi- Strategy Growth & Income Fund share? | Can you limit this sharing? |
For our everyday business purposes – such as to process your transactions, maintain your account(s), respond to court orders and legal investigations, or report to credit bureaus | Yes | No |
For our marketing purposes – to offer our products and services to you | No | We don’t share |
| For joint marketing with other financial companies | No | We don’t share |
For our affiliates’ everyday business purposes – information about your transactions and experiences | No | We don’t share |
For our affiliates’ everyday business purposes – information about your creditworthiness | No | We don’t share |
| For nonaffiliates to market to you | No | We don’t share |
| Questions? | Call 1-855-601-3841 |
| Who we are | |||||
Who is providing this notice?
| Multi-Strategy Growth & Income Fund | ||||
| What we do | |||||
| How does Multi-Strategy Growth & Income Fund protect my personal information? | To protect your personal information from unauthorized access and use, we use security measures that comply with federal law. These measures include computer safeguards and secured files and buildings.
Our service providers are held accountable for adhering to strict policies and procedures to prevent any misuse of your nonpublic personal information. | ||||
| How does Multi-Strategy Growth & Income Fund collect my personal information? | We collect your personal information, for example, when you
■ Open an account
■ Provide account information
■ Give us your contact information
■ Make deposits or withdrawals from your account
■ Make a wire transfer
■ Tell us where to send the money
■ Tells us who receives the money
■ Show your government-issued ID
■ Show your driver’s license
We also collect your personal information from other companies. | ||||
| Why can’t I limit all sharing? | Federal law gives you the right to limit only
■ Sharing for affiliates’ everyday business purposes – information about your creditworthiness
■ Affiliates from using your information to market to you
■ Sharing for nonaffiliates to market to you
State laws and individual companies may give you additional rights to limit sharing. | ||||
| Definitions | |||||
| Affiliates | Companies related by common ownership or control. They can be financial and nonfinancial companies.
■ Multi-Strategy Growth & Income Fund does not share with our affiliates. | ||||
| Nonaffiliates | Companies not related by common ownership or control. They can be financial and nonfinancial companies
■ Multi-Strategy Growth & Income Fund does not share with nonaffiliates so they can market to you. | ||||
| Joint marketing | A formal agreement between nonaffiliated financial companies that together market financial products or services to you.
■ Multi-Strategy Growth & Income Fund doesn’t jointly market. | ||||
| Investment Advisor |
| RJL Capital Management, LLC |
| 13520 Evening Creek Drive N. Suite 300 |
| San Diego, CA 92128 |
| Distributor |
| Northern Lights Distributors, LLC |
| 17605 Wright Street |
| Omaha, NE 68130 |
| Legal Counsel |
| Thompson Hine LLP |
| 41 South High Street, Suite 1700 |
| Columbus, OH 43215 |
| Independent Registered Public Accounting Firm |
| BBD, LLP |
| 1835 Market Street, 26th Floor |
| Philadelphia, PA 19103 |
How to Obtain Proxy Voting Information
Information regarding how the Fund votes proxies relating to portfolio securities for the 12 month period ended June 30th as well as a description of the policies and procedures that the Fund used to determine how to vote proxies is available without charge, upon request, by calling 1-855-601-3841 or by referring to the Securities and Exchange Commission’s (“SEC”) website at http://www.sec.gov.
How to Obtain 1st and 3rd Fiscal Quarter Portfolio Holdings
The Fund files its complete schedule of portfolio holdings with the SEC for the first and third quarters of each fiscal year on Form N-Q. Form N-Q is available on the SEC’s website at http://www.sec.gov and may be reviewed and copied at the SEC’s Public Reference Room in Washington, DC (1-800-SEC-0330). The information on Form N-Q is available without charge, upon request, by calling 1-855-601-3841.
Item 2. Code of Ethics. Attached
(a) As of the end of the period covered by this report, the registrant has adopted a code of ethics that applies to the registrant's principal executive officer, principal financial officer, principal accounting officer or controller, or persons performing similar functions, regardless of whether these individuals are employed by the registrant or a third party.
(b) For purposes of this item, “code of ethics” means written standards that are reasonably designed to deter wrongdoing and to promote:
| (1) | Honest and ethical conduct, including the ethical handling of actual or apparent conflicts of interest between personal and professional relationships; |
| (2) | Full, fair, accurate, timely, and understandable disclosure in reports and documents that a registrant files with, or submits to, the Commission and in other public communications made by the registrant; |
(3) Compliance with applicable governmental laws, rules, and regulations;
| (4) | The prompt internal reporting of violations of the code to an appropriate person or persons identified in the code; and |
(5) Accountability for adherence to the code.
(c) Amendments: During the period covered by the report, there have not been any amendments to the provisions of the code of ethics.
(d) Waivers: During the period covered by the report, the registrant has not granted any express or implicit waivers from the provisions of the code of ethics.
(e) The Code of Ethics is not posted on Registrant’ website.
(f) A copy of the Code of Ethics is attached as an exhibit.
Item 3. Audit Committee Financial Expert.
(a) The Registrant’s board of trustees has determined that Mark Riedy is a financial expert, as defined in Item 3 of Form N-CSR. Mark Riedy is independent for purposes of this Item.
Item 4. Principal Accountant Fees and Services.
| (a) | Audit Fees |
| 2015 - $17,000 |
2014 - $16,500
| (b) | Audit-Related Fees |
| 2015 - $0 |
2014 - $0
| (c) | Tax Fees |
2015 - $3,500
2014 - $3,500
Preparation of Federal & State income tax returns, assistance with calculation of required income, capital gain and excise distributions and preparation of Federal excise tax returns.
| (d) | All Other Fees |
2015 - $0
2014 - $0
(e) (1) Audit Committee’s Pre-Approval Policies
| The registrant’s Audit Committee is required to pre-approve all audit services and, when appropriate, any non-audit services (including audit-related, tax and all other services) to the registrant. The registrant’s Audit Committee also is required to pre-approve, when appropriate, any non-audit services (including audit-related, tax and all other services) to its adviser, or any entity controlling, controlled by or under common control with the adviser that provides ongoing services to the registrant, to the extent that the services may be determined to have an impact on the operations or financial reporting of the registrant. Services are reviewed on an engagement by engagement basis by the Audit Committee. |
| (2) | Percentages of Services Approved by the Audit Committee |
2015 2014
Audit-Related Fees: 100.00% 100.00%
Tax Fees: 0.00% 0.00%
All Other Fees: 0.00% 0.00%
| (f) | During the audit of registrant's financial statements for the most recent fiscal year, less than 50 percent of the hours expended on the principal accountant's engagement were attributed to work performed by persons other than the principal accountant's full-time, permanent employees. |
| (g) | The aggregate non-audit fees billed by the registrant's accountant for services rendered to the registrant, and rendered to the registrant's investment adviser (not including any sub-adviser whose role is primarily portfolio management and is subcontracted with or overseen by another investment adviser), and any entity controlling, controlled by, or under common control with the adviser that provides ongoing services to the registrant: |
2015 - $3,500
2014 - $3,500
(h) The registrant's audit committee has considered whether the provision of non-audit services to the registrant's investment adviser (not including any sub-adviser whose role is primarily portfolio management and is subcontracted with or overseen by another investment adviser), and any entity controlling, controlled by, or under common control with the investment adviser that provides ongoing services to the registrant, that were not pre-approved pursuant to paragraph (c)(7)(ii) of Rule 2-01 of Regulation S-X, is compatible with maintaining the principal accountant's independence.
Item 5. Audit Committee of Listed Companies. Not applicable
Item 6. Schedule of Investments. Schedule of investments in securities of unaffiliated issuers is included under Item 1.
Item 7. Disclosure of Proxy Voting Policies and Procedures for Closed-End Funds.
See attached exhibits P1A and P1B, which contain the Adviser and Sub-Adviser proxy voting policies and procedures. Each votes proxies on behalf of the Fund for its portion of the Fund’s portfolio.
Item 8. Portfolio Managers of Closed-End Management Investment Companies.
Raymond J. Lucia, Jr.
Mr. Lucia, Chief Executive Officer of the Adviser, is the Fund's portfolio manager. Mr. Lucia has primary responsibility for management of the Fund's investment portfolio and has served the Fund in this capacity since it commenced operations in 2012. Mr. Lucia is also CEO of RJL Wealth Management, LLC, a Registered Investment Advisor, and Lucia Securities, LLC, a Registered Broker Dealer and member FINRA/SIPC. Mr. Lucia was previously with Raymond J. Lucia Companies, Inc. for 10 years where he held the position of Executive Vice President and was responsible for creating and managing the firm's strategic plans, including: developing and implementing the firm's investment strategies, growing the fee-based asset management platform, and expanding the firm's client base in over 15 office locations nationwide. Prior to joining RJL, Inc. in 2000, Mr. Lucia worked for Deloitte and Touche as a tax accountant in the Personal Financial Services group providing financial advice to high-net-worth individuals. Mr. Lucia graduated from Loyola Marymount University in 1997 with a Bachelor of Science in Accounting. Mr. Lucia is a Certified Public Accountant and holds the Personal Financial Specialist designation offered by the AICPA. Mr. Lucia holds the Series 7, 24, 63, and 65 licenses.
Jeffrey J. Mindlin, CFA
Mr. Mindlin, Managing Director and Chief Operating Officer of the sub-adviser, is the portfolio manager for that portion allocated by the Adviser to the sub-adviser and has served the Fund in this capacity since it commenced operations in 2012. Mr. Mindlin has served as the sub-adviser's Managing Director and Chief Operating Officer since 2006. Mr. Mindlin is responsible for the sub-adviser's portfolio management team and its efforts, including portfolio selection, trading, execution, proprietary money management and product development. Prior to joining the sub-adviser, Mr. Mindlin was the Director of Research and Co-Portfolio Manager of Greenbook Investment Management, Inc., where he was instrumental in the design of sophisticated, proprietary investment strategies. Before that, he worked as the Assistant Portfolio Manager and Senior Financial Engineer for Pinnacle Investment Advisors, LLC, which operated a hedge fund and a series of managed accounts for institutional and high-net-worth clients, and sub-advised a mutual fund. Previously, Mr. Mindlin was the Manager of Financial Engineering at Camelback Research, leading the development of several successful institutional grade quantitative products, including the popular MSN Money Stockscouter system. Mr. Mindlin earned his Chartered Financial Analyst (CFA) designation, as well as a BS in Economics and a BS in Finance from the College of Business Honor's Program at Arizona State University, where he received the prestigious Moore Award.
As of February 28, 2014, Raymond J. Lucia Jr. was responsible for the management of the following types of accounts in addition to the Fund:
| Other Accounts By Type | Total Number of Accounts by Account Type | Total Assets By Account Type | Number of Accounts by Type Subject to a Performance Fee | Total Assets By Account Type Subject to a Performance Fee |
| Registered Investment Companies | 0 | $0 | 0 | $0 |
| Other Pooled Investment Vehicles | 0 | $0 | 0 | $0 |
| Other Accounts | 0 | $0 | 0 | $0 |
As of March 31, 2014, Jeffrey J. Mindlin, CFA was responsible for the management of the following types of accounts in addition to the Fund:
| Other Accounts By Type | Total Number of Accounts by Account Type | Total Assets By Account Type | Number of Accounts by Type Subject to a Performance Fee | Total Assets By Account Type Subject to a Performance Fee |
| Registered Investment Companies | 0 | $0 | 0 | $0 |
| Other Pooled Investment Vehicles | 0 | $0 | 0 | $0 |
| Other Accounts | 4,963 | $990,507,609 | 0 | $0 |
Because the portfolio manager (Mr. Mindlin) manages assets for other pooled investment vehicles and/or other accounts (including institutional clients, pension plans and certain high net worth individuals) (collectively "Client Accounts"), or may be affiliated with such Client Accounts, there may be an incentive to favor one Client Account over another, resulting in conflicts of interest. For example, the Sub-Adviser may, directly or indirectly, receive fees from Client Accounts that are higher than the fee it receives from the Advisor to the Fund, or it may, directly or indirectly, receive a performance-based fee on a Client Account. In those instances, the portfolio manager may have an incentive to not favor the Fund over the Client Accounts. The Sub-Adviser has adopted trade allocation and other policies and procedures that it believes are reasonably designed to address these and other conflicts of interest.
Raymond J. Lucia Jr. and Jeffrey J. Mindlin are compensated through a salary.
As of February 28, 2015, the Portfolio Managers’ ownership of the Fund was as follows:
| Portfolio Managers | Dollar Range of Shares Owned |
| Raymond J. Lucia Jr. | Over $100,000 |
| Jeffrey J. Mindlin | $0 |
Item 9. Purchases of Equity Securities by Closed-End Funds. Not applicable
Item 10. Submission of Matters to a Vote of Security Holders. None
Item 11. Controls and Procedures.
(a) Based on an evaluation of the Registrant’s disclosure controls and procedures as of a date within 90 days of filing date of this Form N-CSR, the principal executive officer and principal financial officer of the Registrant have concluded that the disclosure controls and procedures of the Registrant are reasonably designed to ensure that the information required in filings on Form N-CSR is recorded, processed, summarized, and reported by the filing date, including that information required to be disclosed is accumulated and communicated to the Registrant’s management, including the Registrant’s principal executive officer and principal financial officer, as appropriate to allow timely decisions regarding required disclosure.
(b) There were no significant changes in the Registrant’s internal control over financial reporting that occurred during the Registrant’s last fiscal half-year that have materially affected, or are reasonably likely to materially affect, the Registrant’s internal control over financial reporting.
Item 12. Exhibits.
(a)(1) Code of Ethics filed herewith.
(a)(2) Certifications required by Section 302 of the Sarbanes-Oxley Act of 2002 (and Item 11(a)(2) of Form N-CSR) are filed herewith.
(a)(3) Not applicable.
(b) Certifications required by Section 906 of the Sarbanes-Oxley Act of 2002 (and Item 11(b) of Form N-CSR) are filed herewith.
SIGNATURES
Pursuant to the requirements of the Securities Exchange Act of 1934 and the Investment Company Act of 1940, the registrant has duly caused this report to be signed on its behalf by the undersigned, thereunto duly authorized.
(Registrant) Multi-Strategy Growth & Income Fund
By (Signature and Title)
/s/ Raymond J. Lucia Jr
Raymond J. Lucia Jr., President
Date 5/11/15
Pursuant to the requirements of the Securities Exchange Act of 1934 and the Investment Company Act of 1940, this report has been signed below by the following persons on behalf of the registrant and in the capacities and on the dates indicated.
By (Signature and Title)
/s/ Raymond J. Lucia J
Raymond J. Lucia Jr., President
Date 5/11/15
By (Signature and Title)
/s/ Stephanie Pimentel Holly
Stephanie Pimentel Holly, Treasurer
Date 5/11/15