united states
securities and exchange commission
washington, d.c. 20549
form n-csr
certified shareholder report of registered management
investment companies
Investment Company Act file number 811-22572
Multi-Strategy Growth & Income Fund
(Exact name of registrant as specified in charter)
80 Arkay Drive, Suite 110, Hauppauge, NY 11788
(Address of principal executive offices) (Zip code)
The Corporation Trust Company.
Corporation Trust Center
1209 Orange Street, Wilmington, Delaware 19801
(Name and address of agent for service)
Registrant's telephone number, including area code: 631-470-2600
Date of fiscal year end: 2/28
Date of reporting period: 2/28/17
Item 1. Reports to Stockholders.
Unaudited
To Our Shareholders:
During the latest quarter, we celebrated the five-year anniversary of the Multi-Strategy Growth & Income Fund (the “Fund”). Over five years ago, meeting the specific needs of individual clients gave rise to an innovative solution – a diversified pool of illiquid alternative investments in an interval fund wrapper. This easy-to-purchase investment provided individual investors access to recognized retail-oriented alternative investments with diversification and periodic liquidity. Out of this basic need, the Fund has grown to over $200 million in assets under management (“AUM”).
The multi-asset approach was not an accident. It was based upon the “endowment model” concept pioneered and popularized by David Swensen of the Yale Endowment, which has one of the best long-term track records of any university over the last twenty-plus years. The endowment model argues that an allocation to alternative investments alongside traditional bond and equity investments results in reduced volatility and a higher likelihood of achieving investment goals over long periods of time. The Fund’s alternative allocation is implemented utilizing a range of alternative investment strategies with complementary characteristics and actively-managed in response to the current economic environment.
Much has changed since we launched the Fund – the interval fund space has now grown to approximately 30 different interval funds with $9 billion in AUM as of February 20171 with both diversified and asset-class specific offerings. And while the Fund’s investment capabilities have evolved, its mandate has remained consistent – seeking to deliver, over reasonable time periods, high-quality current income and modest net asset value growth with low correlations to traditional asset classes.
However, the economic environment and investment landscape of that time is very different from today:
| Five Years Ago | Today | |||
| Economy | Economy accelerating, still in middle innings of recovery | Not clear that the economy will ever achieve “escape velocity” (3+% growth) without Fed support | ||
| Monetary Policy | Fed fueling a low interest rate environment creates increasing appetite to trade risk, higher costs, and liquidity for yield | In a rising rate environment with no Fed tailwind, strategies premised on “reach for yield” and/or extremely low borrowing rates may suffer | ||
| Real Estate Sector | Supply constrained real estate market makes cap rates attractive, especially relative to borrowing costs | High valuations, rising borrowing costs, and much slower organic growth make real estate acumen and management skill essential | ||
| Credit Strategies | Changing regulatory environment brought on by financial crisis creates opportunity for newly created middle market lenders | Significantly greater competition for middle market loans leading to lower quality portfolios and lower expected returns |
It’s not hard to imagine that the Fund’s strategic focus has changed as well:
| Fund Focus Five Years Ago | Fund Focus Today |
| 1 | “Are Interval Funds the Next Big Thing?” Morningstar March 20, 2017 |
1
Unaudited
| Real Estate Allocation | Real estate cycle and need for yield make non-listed portfolio aggregation strategies attractive (specific strategy a secondary concern) | Most real estate asset classes fully valued – be very specific about asset class and quality of strategy | ||
| Semi-Liquid Investments | Take advantage of accelerated exit cycle while it lasts – significantly improving returns | Focus more on custom- originated strategies rather than generic packaged products | ||
| Significant generic opportunity in Business Development Company (“BDC”)-type strategies as a result of vacuum created by bank exits | BDC strategies with higher% of secured and first lien loans – underwriting capability and portfolio credit quality matters | |||
| Liquid Sleeve | Rely on third-party asset managers to deliver income and returns based upon existing strategy | Build bespoke asset class exposure in- house using specific strategies that are consistent with the entire portfolio and seek to deliver higher-quality income while reducing volatility | ||
| Investment Team | 1 Portfolio Manager | 1 Portfolio Manager | ||
| 1 Assistant Portfolio Manager | ||||
| 3 Senior Investment Professionals | ||||
| 2 Research Analysts |
In short, while the environment has changed, the Fund, too, has evolved to better maximize opportunities for investors and attempt to manage risk more aggressively.
That brings us to the twelve months ending February 2017. Toward the latter months of calendar 2016 and early 2017, interest rates moved up on post-U.S. election growth expectations, causing sell-offs in many fixed-rate, income-oriented securities and sectors. The Fund benefitted from substantial allocations to certain variable-rate, yield-oriented asset classes that could increase their returns alongside rate increases, some of which saw strong capital inflows during this period along with positive net performance. Examples include BDCs and certain closed- end fund investments.
Despite the general reduction in volatility since the beginning of 2016, we have seen a series of significant short- term drawdowns in both equities (perhaps expected) and bonds (generally, not expected). With respect to equities, we saw five weekly drawdowns in the S&P 500 of 2% or more, with the largest drawdown of 8.5% occurring in February 2016. While it is entirely normal to have these types of moves in an equity bull market, very few anticipated the downturn in bonds that began in July of 2016 and continued into December.
This is the kind of environment that we believe allows the Fund to shine. As the last year indicates, having an allocation to a low-correlating alternative investment may benefit risk-adjusted returns when included alongside traditional asset classes. Aside from having low correlation with conventional assets, the illiquid securities in the portfolio are actively managed. As part of our long-term plans to manage strategic allocations, we trimmed and/or liquidated certain illiquid positions and redirected allocations to what we believe may be higher performing investments.
2
Unaudited
Opportunistic investments in the liquid sleeve also drove excess return, particularly individually selected public REITs and growth-oriented equities. This highlights the potential benefits of diversification and of being positioned to anticipate market changes rather than just reacting to them.
For the fiscal year ending February 28, 2017, the Fund generated a 10.04% total return with a 64% correlation to the equity markets (S&P 500) and volatility that was just 29% of the S&P 500’s. This type of performance is nothing new.
We are proud that the Fund has achieved the following results since inception:
The maximum sales charge is 5.75%. Investors may be eligible for a reduction in sales charges Inception date of the Fund’s Class A Shares was March 16, 2012 and total annual expense 3.13%. The performance data quoted here represents past performance. Current performance may be lower or higher than the performance data quoted above. Returns shown reflect the deduction of all fees and expenses. Investment return and principal value will fluctuate, so that shares, when redeemed, may be worth more or less than their original cost. Past performance is no guarantee of future results. A Fund’s performance, especially for very short periods of time, should not be the sole factor in making your investment decisions. For performance information current to the most recent month end, please call toll-free 1-855-601-3841. S&P 500 Total Return Index is an index of 500 stocks chosen for market size, liquidity, and industry grouping (among other factors). It is designed to be an indicator of U.S. equities and is meant to reflect the risk/return characteristics of the large-cap universe. The Bloomberg Barclays U.S. Aggregate Bond Index is an index commonly used to measure the performance of the total U.S. investment-grade bond market. The securities underlying the index include investment-grade U.S. Treasury bonds, government-related bonds, corporate bonds, mortgage and asset backed securities that are publicly offered for sale in the U.S. Investors cannot directly invest in an index, and unmanaged index returns do not reflect any fees, expenses, or sales charges. Past performance is no guarantee of future results.
Looking Forward
We anticipate that several forces acting on markets may create significant volatility in traditional asset classes over the next year.
First, we should mention the Federal Reserve (the “Fed”). It appears that, directionally, we have now embarked on a rising-rate path, although the timing and magnitude remains open to debate – as the Fed would say, it is “data dependent”. However, getting clear signals from the data continues to be elusive. We note the substantially disparate signals we have seen from the most recent actual economic data (i.e. GDP, employment, etc.) and softening forward-looking indicators (i.e. consumer confidence, industrial surveys, etc.). After an unprecedented period of monetary easing, the degree of difficulty in removing that accommodation without causing market dislocations remains very high and is likely to continue to create volatility in bond and equity markets.
3
Unaudited
Second, there is the current political environment in the US. On the one hand, some of the ideas that have been put forward by the new administration have the potential to enhance GDP growth. We would point to concepts like repatriation of cash held overseas, reduction in burdensome regulations, and corporate tax reform. Some of this optimism has already been priced into equity valuations. On the other hand, we are very short on actual details on any of these policies and, as the fight over repealing and replacing Obamacare shows, it is very difficult to get consensus in Washington regardless of party affiliation, especially for game-changing “big” ideas. This skepticism is reflected in the lower yields in the bond market (rising bond prices) so far in 2017 after rising substantially post-election. We can extend this issue beyond our shores as markets weigh the impact of rising nationalism and anti-European Union sentiment across Europe.
Third, we find ourselves in a very uncertain oil market. Until recently, markets tended to move in conjunction with the changes in perception about the trajectory of oil prices. But are current prices sustainable? Well, it depends. On the supply side, will the current OPEC-led production limits continue? Will participants cheat? Will US shale producers continue to find ways to improve efficiency and raise production? On the demand side, will global economic growth drive consumption higher?
Finally, we have the potential for global crises to spiral out of control. While this is always a possibility, the stakes have been raised to levels rarely seen across multiple global “hot spots” including North Korea, Iran, ISIS, Russia – need we say more?
And there are many less significant issues we could mention.
To us, all this points to potentially increased volatility across traditional markets, especially considering that volatility is close to historical lows, which we don’t believe will continue forever.
So, what does this mean for the Fund? We will focus on the following over the coming year:
| § | YIELD – focus on quality, as well as magnitude, and be wary of headwinds in certain yield-oriented asset classes (real estate, MLPs, etc.); |
| § | GROWTH – rely on specific, bottom-up theses, don’t rely on a rising tide lifting all boats; |
| § | LIQUIDITY – with equity markets at all-time highs and a likely pick-up in volatility, incremental allocations favor illiquid securities; and |
| § | RISK – be cognizant of rising correlations amongst certain asset classes. |
In our opinion, a core alternative allocation (ala the endowment model), such as the Fund provides, is a strategy that continues to have merit for meeting investor objectives with reasonable risk. As always, we will continue to be relentless in our pursuit of the Fund’s objectives on your behalf.
Sincerely,
 |  | |
| Raymond J Lucia, Jr | Mark C Scalzo | |
| CEO | Portfolio Manager |
5335-NLD-05/03/2017
4
| Multi-Strategy Growth & Income Fund |
| PORTFOLIO REVIEW (Unaudited) |
| February 28, 2017 |
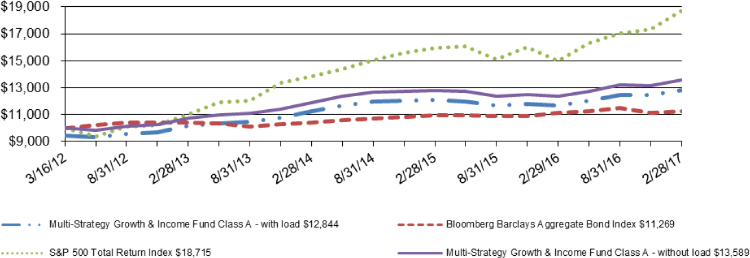
Composition of the Change in Value of a $10,000 Investment (since inception through February 28, 2017):
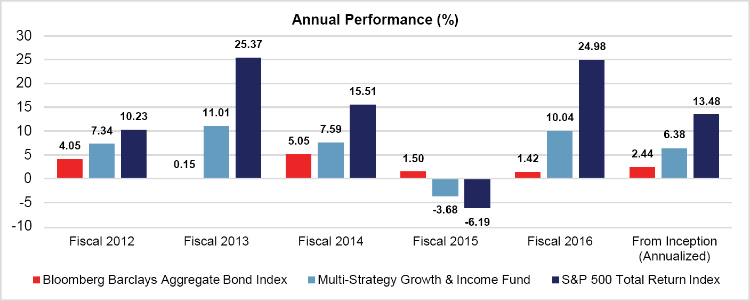
The Fund’s performance figures for the periods ended February 28, 2017, compared to its benchmarks:
| Total Returns as of February 28, 2017 | One | Annualized Three Year | Annualized Since Inception Class A* | Annualized Since Inception Class C, Class I and Class L ** | ||||
| Multi-Strategy Growth & Income Fund | ||||||||
| Class A: | ||||||||
| Without Load | 10.04% | 4.48% | 6.38% | - | ||||
| With Load | 3.70% | 2.53% | 5.18% | - | ||||
| Class C | 9.30% | - | - | 2.49% | ||||
| Class I | 11.01% | - | - | 3.58% | ||||
| Class L: | ||||||||
| Without Load | 9.50% | - | - | 2.74% | ||||
| With Load | 5.38% | - | - | 1.28% | ||||
| Bloomberg Barclays Aggregate Bond Index | 1.42% | 2.64% | 2.44% | 2.47% | ||||
| S&P 500 Total Return Index | 24.98% | 10.63% | 13.48% | 9.29% |
| * | Class A commenced operations on March 16, 2012. |
| ** | Class C, Class I and Class L commenced operations on July 2, 2014. |
The Bloomberg Barclays Aggregate Bond Index is an unmanaged index which represents the U.S. investment-grade fixed-rate bond market (including government and corporate securities, mortgage pass-through securities and asset-backed securities). Investors cannot invest directly in an index or benchmark.
The S&P 500 Total Return Index is an unmanaged market capitalization-weighted index which is comprised of 500 of the largest U.S. domiciled companies and includes the reinvestment of all dividends. Investors cannot invest directly in an index or benchmark.
Past performance is not predictive of future results. The investment return and principal value of an investment will fluctuate. An investor’s shares, when redeemed, may be worth more or less than the original cost. Total returns are calculated using the traded NAV on February 28, 2017. Total return is calculated assuming reinvestment of all dividends and distributions. The Fund’s total gross annual operating expenses, per its prospectus dated July 1, 2016, as supplemented August 8, 2016, including underlying funds, are 3.13%, 3.88%, 2.88%, and 3.63% for Class A, Class C, Class I and Class L shares, respectively. The Fund’s total net operating expenses, excluding underlying Funds, are 1.58%, 2.33%, 1.33%, and 2.08% for Class A, Class C, Class I and Class L shares, respectively. Class A and Class L shares of the Fund are subject to a maximum sales load imposed on purchases of 5.75% and 2.00%, respectively. When purchasing load waived shares, Class A shares are subject to a maximum early withdrawal charge of 1.00% on shares repurchased less than 365 days after purchase. Class C and Class I are not subject to a sales load. The chart does not reflect the deduction of taxes that a shareholder may have to pay on Fund distributions or the redemption of the Fund shares. For performance data current to the most recent month-end, please call 1-855-601-3841.
5
| Multi-Strategy Growth & Income Fund |
| PORTFOLIO OF INVESTMENTS |
| February 28, 2017 |
| Shares | Security | Value | ||||||
| COMMON STOCKS - 7.66% | ||||||||
| CHEMICALS - 0.39% | ||||||||
| 7,078 | Monsanto Co. | $ | 805,689 | |||||
| COMMERCIAL SERVICES - 0.28% | ||||||||
| 7,403 | Macquarie Infrastructure Co. | 569,587 | ||||||
| ENTERTAINMENT - 0.37% | ||||||||
| 10,988 | Cedar Fair LP | 752,458 | ||||||
| FOOD - 0.39% | ||||||||
| 14,519 | WhiteWave Foods Co. * | 799,707 | ||||||
| INSURANCE - 0.27% | ||||||||
| 137,931 | Genworth Financial, Inc. * | 564,138 | ||||||
| LISTED BUSINESS DEVELOPMENT COMPANIES - 2.10% | ||||||||
| 25,194 | Ares Capital Corp. | 447,193 | ||||||
| 51,792 | BlackRock Capital Investment Corp. | 401,388 | ||||||
| 30,782 | FS Investment Corp. | 330,907 | ||||||
| 33,990 | Garrison Capital, Inc. | 342,619 | ||||||
| 24,505 | Golub Capital BDC, Inc. | 469,026 | ||||||
| 17,971 | New Mountain Finance Corp. | 264,174 | ||||||
| 27,634 | PennantPark Floating Rate Capital Ltd. | 372,783 | ||||||
| 15,492 | THL Credit, Inc. | 161,427 | ||||||
| 27,852 | TPG Specialty Lending, Inc. | 543,671 | ||||||
| 11,292 | Triangle Capital Corp. | 218,500 | ||||||
| 27,527 | TriplePoint Venture Growth BDC Corp. | 360,053 | ||||||
| 32,516 | WhiteHorse Finance, Inc. | 420,757 | ||||||
| 4,332,498 | ||||||||
| PHARMACEUTICALS - 0.39% | ||||||||
| 11,900 | Actelion Ltd. | 801,643 | ||||||
| PIPELINES - 1.52% | ||||||||
| 4,585 | Buckeye Partners LP | 315,998 | ||||||
| 8,237 | DCP Midstream LP | 322,890 | ||||||
| 19,618 | Enable Midstream Partners LP | 320,166 | ||||||
| 17,849 | EnLink Midstream Partners LP | 334,133 | ||||||
| 4,432 | Enterprise Products Partners LP | 124,229 | ||||||
| 8,846 | Genesis Energy LP | 299,349 | ||||||
| 3,282 | MPLX LP | 122,123 | ||||||
| 13,183 | NGL Energy Partners LP | 292,663 | ||||||
| 3,930 | Plains All American Pipeline LP | 126,074 | ||||||
| 2,754 | Spectra Energy Partners LP | 123,186 | ||||||
| 12,418 | Sunoco Logistics Partners LP | 314,548 | ||||||
| 2,025 | Western Gas Partners LP | 125,894 | ||||||
| 7,846 | Williams Partners LP | 316,194 | ||||||
| 3,137,447 | ||||||||
| PRIVATE EQUITY - 0.52% | ||||||||
| 30,249 | Hercules Capital, Inc. | 447,988 | ||||||
| 11,088 | Icahn Enterprises LP | 623,589 | ||||||
| 1,071,577 | ||||||||
| RETAIL - 0.43% | ||||||||
| 6,867 | Cabela’s, Inc. * | 321,650 | ||||||
| 93,802 | Rite Aid Corp. * | 562,812 | ||||||
| 884,462 | ||||||||
| SEMICONDUCTORS - 1.00% | ||||||||
| 20,000 | NXP Semiconductors NV * | 2,056,200 | ||||||
| TOTAL COMMON STOCKS (Cost - $15,587,065) | 15,775,406 | |||||||
See accompanying notes to financial statements.
6
| Multi-Strategy Growth & Income Fund |
| PORTFOLIO OF INVESTMENTS (Continued) |
| February 28, 2017 |
| Shares | Security | Value | ||||||
| REAL ESTATE INVESTMENT TRUSTS - 46.67% | ||||||||
| LISTED REAL ESTATE INVESTMENT TRUSTS - 3.10% | ||||||||
| 5,785 | Care Capital Properties, Inc. | $ | 152,088 | |||||
| 6,453 | Colony NorthStar, Inc. | 94,730 | ||||||
| 27,173 | CoreCivic, Inc. | 915,730 | ||||||
| 10,456 | Digital Realty Trust, Inc. | 1,129,248 | ||||||
| 20,300 | The GEO Group, Inc. | 966,483 | ||||||
| 15,730 | HCP, Inc. | 515,787 | ||||||
| 19,001 | Iron Mountain, Inc. | 690,686 | ||||||
| 12,600 | Omega Healthcare Investors, Inc. | 411,264 | ||||||
| 23,144 | Ventas, Inc. | 1,505,517 | ||||||
| TOTAL LISTED REAL ESTATE INVESTMENT TRUSTS | 6,381,533 | |||||||
| NON-LISTED REAL ESTATE INVESTMENT TRUSTS - 32.69% | ||||||||
| 456,540 | American Realty Capital Hospitality Trust, Inc. # | 9,720,757 | ||||||
| 460,313 | American Finance Trust # | 10,822,409 | ||||||
| 228,122 | Carey Watermark Investors, Inc. # | 2,463,719 | ||||||
| 738,378 | Carter Validus Mission Critical REIT, Inc. # | 7,375,767 | ||||||
| 397,838 | Healthcare Trust, Inc. # | 8,731,693 | ||||||
| 198,378 | Hines Global REIT, Inc. # | 1,989,735 | ||||||
| 432,433 | NorthStar Real Estate Income II, Inc. # | 4,106,420 | ||||||
| 764,346 | NorthStar Real Estate Income Trust, Inc. # | 7,832,963 | ||||||
| 1,081,081 | NorthStar Health Care Income, Inc. # | 9,690,480 | ||||||
| 388,931 | Steadfast Income REIT, Inc. # | 4,553,940 | ||||||
| TOTAL NON-LISTED REAL ESTATE INVESTMENT TRUSTS | 67,287,883 | |||||||
| PRIVATE REAL ESTATE INVESTMENT TRUSTS - 10.88% | ||||||||
| 7,354 | Clarion Lion Industrial Trust # | 11,224,531 | ||||||
| 661,928 | Cottonwood Residential, Inc. # | 11,166,726 | ||||||
| TOTAL PRIVATE REAL ESTATE INVESTMENT TRUSTS | 22,391,257 | |||||||
| TOTAL REAL ESTATE INVESTMENT TRUSTS | 96,060,673 | |||||||
| (Cost - $76,494,477) | ||||||||
| NON-LISTED BUSINESS DEVELOPMENT COMPANIES - 10.52% | ||||||||
| 449,055 | Business Development Corporation of America # | 3,870,854 | ||||||
| 1,005,598 | Cion Investment Corp. # | 9,364,382 | ||||||
| 507,012 | Corporate Capital Trust, Inc. # | 4,527,620 | ||||||
| 464,655 | Sierra Income Corp. # | 3,889,739 | ||||||
| TOTAL NON-LISTED BUSINESS DEVELOPMENT COMPANIES | 21,652,595 | |||||||
| (Cost - $23,441,486) | ||||||||
| PRIVATE INVESTMENT FUNDS - 11.91% | ||||||||
| 10 | AIM Infrastructure MLP Fund II LP # | 3,486,675 | ||||||
| 9,910 | Clarion Lion Properties Fund # | 13,472,612 | ||||||
| 3 | Ovation Alternative Income Fund # | 7,563,000 | ||||||
| TOTAL PRIVATE INVESTMENT FUNDS | 24,522,287 | |||||||
| (Cost - $22,891,250) | ||||||||
| NON-TRADED PARTNERSHIP FUND - 1.10% | ||||||||
| 250,189 | TriLinc Global Impact Fund Class I # | 2,257,952 | ||||||
| TOTAL NON-TRADED PARTNERSHIP FUND | ||||||||
| (Cost - $2,292,228) | ||||||||
| CLOSED-END FUNDS - 6.91% | ||||||||
| 68,399 | Apollo Tactical Income Fund, Inc. ^ | 1,097,120 | ||||||
| 82,281 | BlackRock Debt Strategies Fund, Inc. ^ | 961,043 | ||||||
| 113,427 | BlackRock Multi-Sector Income Trust ^ | 1,986,107 | ||||||
| 80,314 | Cohen & Steers REIT and Preferred Income Fund, Inc. | 1,609,493 | ||||||
| 98,042 | DoubleLine Income Solutions Fund | 1,994,174 | ||||||
See accompanying notes to financial statements.
7
| Multi-Strategy Growth & Income Fund |
| PORTFOLIO OF INVESTMENTS (Continued) |
| February 28, 2017 |
| Shares | Security | Value | ||||||
| CLOSED-END FUNDS (continued) - 6.91% | ||||||||
| 218,315 | Flaherty & Crumrine Dynamic Preferred and Income Fund, Inc. ^ | $ | 5,433,860 | |||||
| 71,536 | John Hancock Premium Dividend Fund | 1,145,291 | ||||||
| TOTAL CLOSED-END FUNDS | 14,227,088 | |||||||
| (Cost - $13,891,832) | ||||||||
| HEDGE FUNDS - 13.58% | ||||||||
| 27,047 | Collins Master Access Fund Ltd. # * | 27,958,271 | ||||||
| TOTAL HEDGE FUNDS | ||||||||
| (Cost - $27,000,000) | ||||||||
| SHORT-TERM INVESTMENT - 2.62% | ||||||||
| MONEY MARKET FUND - 2.62% | ||||||||
| 5,381,864 | AIM STIT-Government & Agency Portfolio, Private Class, 0.14% + ^ | 5,381,864 | ||||||
| TOTAL SHORT-TERM INVESTMENT | ||||||||
| (Cost - $5,381,864) | ||||||||
| TOTAL INVESTMENTS - 100.97% | ||||||||
| (Cost - $186,980,202) (a) | $ | 207,836,136 | ||||||
| LIABILITIES IN EXCESS OF OTHER ASSETS - (0.97)% | (2,006,381 | ) | ||||||
| NET ASSETS - 100.00% | $ | 205,829,755 | ||||||
LP - Limited Partnership.
REIT - Real Estate Investment Trust.
| * | Non-income producing security. |
| ^ | All or a portion of this security is segregated as collateral. |
| # | Fair Value estimated using Fair Valuation Procedures adopted by the Board of Trustees. Total value of such securities is $166,070,245 or 80.68% of net assets. |
| + | Money market fund; interest rate reflects the seven-day effective yield on February 28, 2017. |
| (a) | Represents cost for financial reporting purposes. Aggregate cost for federal tax purposes is $185,553,711 and differs from fair value by net unrealized appreciation (depreciation) of securities as follows: |
| Unrealized appreciation: | $ | 29,982,295 | |||
| Unrealized depreciation: | (7,699,870 | ) | |||
| Net unrealized appreciation: | $ | 22,282,425 |
Portfolio Composition as of February 28, 2017 (Unaudited)
| Percent of Net Assets | ||
| Real Estate Investment Trusts | ||
| Non-Listed Real Estate Investment Trusts | 32.69% | |
| Private Real Estate Investment Trusts | 10.88% | |
| Listed Real Estate Investment Trusts | 3.10% | |
| Hedge Funds | 13.58% | |
| Private Investment Funds | 11.91% | |
| Non-Listed Business Development Companies | 10.52% | |
| Closed End Funds | 6.91% | |
| Short-term Investments | 2.62% | |
| Listed Business Development Companies | 2.10% | |
| Pipelines | 1.52% | |
| Non-Traded Partnership Fund | 1.10% | |
| Semiconductors | 1.00% | |
| Private Equity | 0.52% | |
| Retail | 0.43% | |
| Chemicals | 0.39% | |
| Pharmaceuticals | 0.39% | |
| Food | 0.39% | |
| Entertainment | 0.37% | |
| Commercial Services | 0.28% | |
| Insurance | 0.27% | |
| Liabilities in excess of other Assets | (0.97)% | |
| Net Assets | 100.00% | |
See accompanying notes to financial statements.
8
| Multi-Strategy Growth & Income Fund |
| STATEMENT OF ASSETS AND LIABILITIES |
| February 28, 2017 |
| Assets: | ||||
| Investments in Securities, at Value (identified cost $186,980,202) | $ | 207,836,136 | ||
| Cash | 486,505 | |||
| Dividends and Interest Receivable | 947,330 | |||
| Receivable for Securities Sold | 671,676 | |||
| Receivable for Fund Shares Sold | 191,832 | |||
| Prepaid Expenses and Other Assets | 25,620 | |||
| Total Assets | 210,159,099 | |||
| Liabilities: | ||||
| Payable for Securities Purchased | 3,994,664 | |||
| Accrued Advisory Fees (1) | 117,624 | |||
| Shareholder Servicing Fees Payable | 43,651 | |||
| Payable to Related Parties (1) | 25,396 | |||
| Distribution Fee Payable | 17,442 | |||
| Other Accrued Expenses | 130,567 | |||
| Total Liabilities | 4,329,344 | |||
| Net Assets | $ | 205,829,755 | ||
| Composition of Net Assets: | ||||
| At February 28, 2017, Net Assets consisted of: | ||||
| Paid-in-Capital | $ | 192,934,716 | ||
| Accumulated Net Investment Income | 1,426,491 | |||
| Accumulated Net Realized Loss on: | ||||
| Investments | (9,387,278 | ) | ||
| Net Unrealized Appreciation on: | ||||
| Investments | 20,855,826 | |||
| Net Assets | $ | 205,829,755 |
| (1) | See Note 3. |
See accompanying notes to financial statements.
9
| Multi-Strategy Growth & Income Fund |
| STATEMENT OF ASSETS AND LIABILITIES (Continued) |
| February 28, 2017 |
| Class A Shares (a): | ||||
| Net Assets | $ | 168,232,241 | ||
| Shares Outstanding (no par value; unlimited number of shares authorized) | 10,733,095 | |||
| Net Asset Value and Redemption Price Per Share * | $ | 15.67 | (b) | |
| Offering Price Per Share ($15.67/0.9425) | $ | 16.63 | (b) | |
| Class C Shares: | ||||
| Net Assets | $ | 24,584,921 | ||
| Shares Outstanding (no par value; unlimited number of shares authorized) | 1,594,605 | |||
| Net Asset Value, Offering Price and Redemption Price Per Share * | $ | 15.42 | (b) | |
| Class I Shares: | ||||
| Net Assets | $ | 3,820,303 | ||
| Shares Outstanding (no par value; unlimited number of shares authorized) | 240,935 | |||
| Net Asset Value, Offering Price and Redemption Price Per Share * | $ | 15.86 | (b) | |
| Class L Shares: | ||||
| Net Assets | $ | 9,192,290 | ||
| Shares Outstanding (no par value; unlimited number of shares authorized) | 592,841 | |||
| Net Asset Value and Redemption Price Per Share * | $ | 15.51 | (b) | |
| Offering Price Per Share ($15.51/0.98) | $ | 15.83 | (b) |
| * | The Net Asset Value for each class will differ due primarily to the allocation of class specific expenses, such as distribution fees and shareholder servicing fees. |
| (a) | Class A purchases valued at $1 million or more are not subject to a front end sales charge, but there is a 1.00% fee on shares repurchased less than 365 days after purchase. |
| (b) | The NAV and offering price shown above differs from the traded NAV on February 28, 2017 due to financial statement adjustments. Includes adjustments in accordance with accounting principles generally accepted in the United States and, consequently, the net asset value for financial reporting purposes based upon those net asset values may differ from the net asset values and returns for shareholder transactions. |
See accompanying notes to financial statements.
10
| Multi-Strategy Growth & Income Fund |
| STATEMENT OF OPERATIONS |
| For the Year Ended February 28, 2017 |
| Investment Income: | ||||
| Dividend Income | $ | 7,780,859 | ||
| Interest Income | 4,585 | |||
| Total Investment Income | 7,785,444 | |||
| Expenses: | ||||
| Investment Advisory Fees | 1,492,225 | |||
| Shareholder Servicing Fees: | ||||
| Class A | 405,834 | |||
| Class C | 53,516 | |||
| Class L | 23,798 | |||
| Distribution Fees: | ||||
| Class C | 160,546 | |||
| Class L | 47,596 | |||
| Transfer Agent Fees | 189,636 | |||
| Administration Fees | 188,655 | |||
| Interest Expense | 169,302 | |||
| Printing Expense | 138,068 | |||
| Trustees’ Fees and Expenses | 114,552 | |||
| Legal Fees | 101,426 | |||
| Custody Fees | 97,606 | |||
| Registration & Filing Fees | 75,739 | |||
| Fund Accounting Fees | 70,224 | |||
| Audit Fees | 61,331 | |||
| Non 12B-1 Shareholder Servicing | 47,233 | |||
| Compliance Fees | 34,052 | |||
| Insurance Expense | 17,002 | |||
| Miscellaneous Expenses | 3,263 | |||
| Net Expenses | 3,491,604 | |||
| Net Investment Income | 4,293,840 | |||
| Net Realized and Unrealized Gain (Loss) on Investments: | ||||
| Net Realized Gain (Loss) on: | ||||
| Investments | (3,867,117 | ) | ||
| Distributions of realized gain from underlying investments | 15,346 | |||
| Total Net Realized Loss | (3,851,771 | ) | ||
| Net Change in Unrealized Appreciation on: | ||||
| Investments | 17,530,784 | |||
| Net Realized and Unrealized Gain on Investments | 13,679,013 | |||
| Net Increase in Net Assets Resulting From Operations | $ | 17,972,853 |
See accompanying notes to financial statements.
11
| Multi-Strategy Growth & Income Fund |
| STATEMENTS OF CHANGES IN NET ASSETS |
| For the Year | For the Year | |||||||
| Ended | Ended | |||||||
| February 28, 2017 | February 29, 2016 | |||||||
| Operations: | ||||||||
| Net Investment Income | $ | 4,293,840 | $ | 5,682,693 | ||||
| Net Realized Loss on Investments | (3,867,117 | ) | (3,016,435 | ) | ||||
| Distributions of Realized Gain from Underlying Investments | 15,346 | 72,919 | ||||||
| Net Change in Unrealized Appreciation (Depreciation) on Investments | 17,530,784 | (10,371,264 | ) | |||||
| Net Increase (Decrease) in Net Assets Resulting From Operations | 17,972,853 | (7,632,087 | ) | |||||
| Distributions to Shareholders From: | ||||||||
| Net Investment Income | ||||||||
| Class A | (3,026,828 | ) | (4,356,657 | ) | ||||
| Class C | (360,316 | ) | (353,176 | ) | ||||
| Class I | (167,983 | ) | (29,771 | ) | ||||
| Class L | (175,289 | ) | (248,659 | ) | ||||
| Total from Net Investment Income | (3,730,416 | ) | (4,988,263 | ) | ||||
| Return of Capital | ||||||||
| Class A | (6,733,191 | ) | (6,060,568 | ) | ||||
| Class C | (937,890 | ) | (670,387 | ) | ||||
| Class I | (159,351 | ) | (143,390 | ) | ||||
| Class L | (395,041 | ) | (376,803 | ) | ||||
| Total from Return of Capital | (8,225,473 | ) | (7,251,148 | ) | ||||
| Total Distributions to Shareholders | $ | (11,955,889 | ) | $ | (12,239,411 | ) | ||
See accompanying notes to financial statements.
12
| Multi-Strategy Growth & Income Fund |
| STATEMENTS OF CHANGES IN NET ASSETS (Continued) |
| For the Year | For the Year | |||||||
| Ended | Ended | |||||||
| February 28, 2017 | February 29, 2016 | |||||||
| From Shares of Beneficial Interest: | ||||||||
| Class A Shares: | ||||||||
| Proceeds from Shares Issued (1,471,177 and 1,368,519 shares, respectively) | $ | 22,928,611 | $ | 22,114,165 | ||||
| Distributions Reinvested (403,837 and 476,871 shares, respectively) | 6,300,677 | 7,560,851 | ||||||
| Cost of Shares Redeemed (1,370,666 and 1,688,946 shares, respectively) | (21,411,341 | ) | (26,800,469 | ) | ||||
| Cost of Shares Transferred (166,180 and 423,984 shares, respectively) | (2,565,824 | ) | (6,585,309 | ) | ||||
| Total From Capital Transactions: Class A | 5,252,123 | (3,710,762 | ) | |||||
| Class C Shares: | ||||||||
| Proceeds from Shares Issued (438,201 and 701,332 shares, respectively) | 6,764,721 | 11,295,155 | ||||||
| Distributions Reinvested (50,752 and 41,682 shares, respectively) | 781,466 | 653,539 | ||||||
| Cost of Shares Redeemed (158,820 and 127,495 shares, respectively) | (2,447,370 | ) | (2,014,339 | ) | ||||
| Cost of Shares Transferred (0 and 4,736 shares, respectively) | — | (73,029 | ) | |||||
| Total From Capital Transactions: Class C | 5,098,817 | 9,861,326 | ||||||
| Class I Shares: | ||||||||
| Proceeds from Shares Issued (29,735 and 4,538 shares, respectively) | 469,450 | 72,612 | ||||||
| Distributions Reinvested (4,666 and 9,709 shares, respectively) | 73,024 | 151,260 | ||||||
| Cost of Shares Redeemed (471,176 and 47,305 shares, respectively) | (7,428,403 | ) | (726,725 | ) | ||||
| Proceeds from Shares Transferred (165,644 and 474,376 shares, respectively) | 2,565,824 | 7,386,831 | ||||||
| Total From Capital Transactions: Class I | (4,320,105 | ) | 6,883,978 | |||||
| Class L Shares: | ||||||||
| Proceeds from Shares Issued (52,985 and 275,291 shares, respectively) | 815,699 | 4,493,034 | ||||||
| Distributions Reinvested (24,228 and 26,213 shares, respectively) | 374,605 | 413,421 | ||||||
| Cost of Shares Redeemed (89,592 and 148,770 shares, respectively) | (1,389,253 | ) | (2,329,097 | ) | ||||
| Cost of Shares Transferred (0 and 47,121 shares, respectively) | — | (728,493 | ) | |||||
| Total From Capital Transactions: Class L | (198,949 | ) | 1,848,865 | |||||
| Total Increase in Net Assets from Shares of Beneficial Interest: | 5,831,886 | 14,883,407 | ||||||
| Total Increase (Decrease) in Net Assets | 11,848,850 | (4,988,091 | ) | |||||
| Net Assets: | ||||||||
| Beginning of Year | 193,980,905 | 198,968,996 | ||||||
| End of Year | $ | 205,829,755 | $ | 193,980,905 | ||||
| Accumulated Net Investment Income at End of Year | $ | 1,426,491 | $ | 1,623,311 | ||||
See accompanying notes to financial statements.
13
| Multi-Strategy Growth & Income Fund |
| STATEMENT OF CASH FLOWS |
| For the Year Ended February 28, 2017 |
| Cash flows from operating activities: | ||||
| Net increase in net assets resulting from operations | $ | 17,972,853 | ||
| Adjustments to reconcile net increase in net assets resulting from operations to net cash provided by operating activities: | ||||
| Purchases of investments | (22,371,228 | ) | ||
| Proceeds from sales | 42,387,579 | |||
| Purchases of short term investments, net | (4,240,252 | ) | ||
| Return of capital and capital gain distributions from investments | 4,435,576 | |||
| Net realized loss from investments | 3,867,117 | |||
| Net change in unrealized (appreciation) depreciation from investments | (17,530,784 | ) | ||
| Changes in assets and liabilities | ||||
| (Increase)/Decrease in assets: | ||||
| Dividends and Interest Receivable | 51,862 | |||
| Prepaid Expenses and Other Assets | 8,577 | |||
| Increase/(Decrease) in liabilities: | ||||
| Payable to Related Parties | (7,528 | ) | ||
| Accrued Advisory Fees | 3,669 | |||
| Shareholder Servicing Fee | 7,111 | |||
| Distribution Fee Payable | 2,706 | |||
| Other Accrued Expenses Payable | 69,170 | |||
| Net cash provided by operating activities | 24,656,428 | |||
| Cash flows from financing activities: | ||||
| Proceeds from shares sold | 30,802,697 | |||
| Payment on shares redeemed | (32,676,367 | ) | ||
| Cash distributions paid | (4,426,117 | ) | ||
| Due to Broker | (17,870,136 | ) | ||
| Net cash used in financing activities | (24,169,923 | ) | ||
| Net increase in cash | 486,505 | |||
| Cash at beginning of year | — | |||
| Cash at end of year | $ | 486,505 | ||
| Supplemental disclosure of non-cash activity: | ||||
| Noncash financing activities not including herein consists of: | ||||
| Reinvestment of dividends | $ | 7,529,772 | ||
| Interest Paid | $ | 169,302 |
See accompanying notes to financial statements.
14
| Multi-Strategy Growth & Income Fund - Class A |
| FINANCIAL HIGHLIGHTS |
| The table below sets forth financial data for one share of beneficial interest outstanding throughout each period presented. |
| For the Year | For the Year | For the Year | For the Year | For the Period | ||||||||||||||||
| Ended | Ended | Ended | Ended | Ended | ||||||||||||||||
| February 28, 2017 | February 29, 2016 | February 28, 2015 | February 28, 2014 | February 28, 2013 * | ||||||||||||||||
| Net Asset Value, Beginning of Period | $ | 15.20 | $ | 16.74 | $ | 16.51 | $ | 15.73 | $ | 15.00 | ||||||||||
| From Operations: | ||||||||||||||||||||
| Net investment income (a) | 0.35 | 0.46 | 0.41 | 0.39 | 0.32 | |||||||||||||||
| Net gain (loss) on investments (both realized and unrealized) | 1.06 | (1.04 | ) | 0.80 | 1.29 | 0.77 | ||||||||||||||
| Total from Operations | 1.41 | (0.58 | ) | 1.21 | 1.68 | 1.09 | ||||||||||||||
| Less Distributions: | ||||||||||||||||||||
| From net investment income | (0.29 | ) | (0.40 | ) | (0.40 | ) | (0.29 | ) | (0.36 | ) | ||||||||||
| From net realized gains on investments | — | — | (0.37 | ) | (0.55 | ) | — | |||||||||||||
| From paid in capital | (0.65 | ) | (0.56 | ) | (0.21 | ) | (0.06 | ) | — | |||||||||||
| Total Distributions | (0.94 | ) | (0.96 | ) | (0.98 | ) | (0.90 | ) | (0.36 | ) | ||||||||||
| Net Asset Value, End of Period | $ | 15.67 | $ | 15.20 | $ | 16.74 | $ | 16.51 | $ | 15.73 | ||||||||||
| Total Return (b) | 9.48 | % (h) | (3.57 | )% (h) | 7.46 | % | 11.01 | % | 7.34 | % (d) | ||||||||||
| Ratios/Supplemental Data | ||||||||||||||||||||
| Net assets, end of period (in 000’s) | $ | 168,232 | $ | 157,986 | $ | 178,502 | $ | 129,697 | $ | 46,888 | ||||||||||
| Ratio to average net assets: | ||||||||||||||||||||
| Expenses, Gross | 1.66 | % (f) | 1.58 | % (f) | 1.55 | % (f) | 1.60 | % | 2.61 | % (c) | ||||||||||
| Expenses, Net of Reimbursement/Recapture | 1.66 | % (f) | 1.58 | % (f) | 1.61 | % (e,f) | 1.75 | % (e) | 1.75 | % (c) | ||||||||||
| Net investment income, Net of Reimbursement/Recapture | 2.25 | % (g) | 2.87 | % (g) | 2.43 | % (g) | 2.46 | % | 2.19 | % (c) | ||||||||||
| Ratio to average net assets (excluding interest expense): | ||||||||||||||||||||
| Expenses, Gross | 1.57 | % (f) | 1.49 | % (f) | 1.55 | % (f) | 1.60 | % | 2.61 | % (c) | ||||||||||
| Expenses, Net of Reimbursement/Recapture | 1.57 | % (f) | 1.49 | % (f) | 1.61 | % (e,f) | 1.75 | % (e) | 1.75 | % (c) | ||||||||||
| Portfolio turnover rate | 13 | % | 21 | % | 49 | % | 14 | % | 108 | % (d) | ||||||||||
| * | Class A commenced operations on March 16, 2012. |
| (a) | Per share amounts are calculated using the average shares method, which more appropriately presents the per share data for the period. |
| (b) | Total returns are historical in nature and assume changes in share price, reinvestment of dividends and capital gains distributions, if any and exclude the effects of sales loads. Total returns for periods less than one year are not annualized. |
| (c) | Annualized for periods less than one year. |
| (d) | Not annualized. |
| (e) | Such ratio includes the Advisor’s recapture of waived/reimbursed fees from prior periods. |
| (f) | Does not include the expenses of the investment companies in which the Fund invests. |
| (g) | The recognition of investment income is affected by the timing and declaration of dividends by the underlying investment companies in which the Fund invests. |
| (h) | Includes adjustments in accordance with accounting principles generally accepted in the United States and, consequently, the net asset value for financial reporting purposes and the returns based upon those net asset values may differ from the net asset values and returns for shareholder transactions. |
See accompanying notes to financial statements.
15
| Multi-Strategy Growth & Income Fund - Class C |
| FINANCIAL HIGHLIGHTS |
| The table below sets forth financial data for one share of beneficial interest outstanding throughout each period presented. |
| For the Year | For the Year | For the Period | ||||||||||
| Ended | Ended | Ended | ||||||||||
| February 28, 2017 | February 29, 2016 | February 28, 2015 * | ||||||||||
| Net Asset Value, Beginning of Period | $ | 15.06 | $ | 16.71 | $ | 17.02 | ||||||
| From Operations: | ||||||||||||
| Net investment income (a) | 0.23 | 0.33 | 0.18 | |||||||||
| Net gain (loss) on investments (both realized and unrealized) | 1.06 | (1.03 | ) | 0.16 | ||||||||
| Total from Operations | 1.29 | (0.70 | ) | 0.34 | ||||||||
| Less Distributions: | ||||||||||||
| From net investment income | (0.28 | ) | (0.39 | ) | (0.12 | ) | ||||||
| From net realized gains on investments | — | — | (0.35 | ) | ||||||||
| From return of capital | (0.65 | ) | (0.56 | ) | (0.18 | ) | ||||||
| Total Distributions | (0.93 | ) | (0.95 | ) | (0.65 | ) | ||||||
| Net Asset Value, End of Period | $ | 15.42 | $ | 15.06 | $ | 16.71 | ||||||
| Total Return (b) | 8.73 | % (g) | (4.28 | )% (g) | 2.04 | % (d) | ||||||
| Ratios/Supplemental Data | ||||||||||||
| Net assets, end of period (in 000’s) | $ | 24,585 | $ | 19,046 | $ | 10,926 | ||||||
| Ratio to average net assets: | ||||||||||||
| Expenses (e) | 2.40 | % | 2.33 | % | 2.30 | % (c) | ||||||
| Net investment income (f) | 1.48 | % | 2.12 | % | 1.76 | % (c) | ||||||
| Ratio to average net assets (excluding interest expense) | ||||||||||||
| Expenses (e) | 2.33 | % | 2.24 | % | 2.30 | % (c) | ||||||
| Portfolio turnover rate | 13 | % | 21 | % | 49 | % (d) | ||||||
| * | Class C commenced operations on July 2, 2014. |
| (a) | Per share amounts are calculated using the average shares method, which more appropriately presents the per share data for the period. |
| (b) | Total returns are historical in nature and assume changes in share price, reinvestment of dividends and capital gains distributions, if any. Total returns for periods less than one year are not annualized. |
| (c) | Annualized for periods less than one year. |
| (d) | Not annualized. |
| (e) | Does not include the expenses of the investment companies in which the Fund invests. |
| (f) | The recognition of investment income is affected by the timing and declaration of dividends by the underlying investment companies in which the Fund invests. |
| (g) | Includes adjustments in accordance with accounting principles generally accepted in the United States and, consequently, the net asset value for financial reporting purposes and the returns based upon those net asset values may differ from the net asset values and returns for shareholder transactions. |
See accompanying notes to financial statements.
16
| Multi-Strategy Growth & Income Fund - Class I |
| FINANCIAL HIGHLIGHTS |
| The table below sets forth financial data for one share of beneficial interest outstanding throughout each period presented. |
| For the Year | For the Year | For the Period | ||||||||||
| Ended | Ended | Ended | ||||||||||
| February 28, 2017 | February 29, 2016 | February 28, 2015 * | ||||||||||
| Net Asset Value, Beginning of Period | $ | 15.24 | $ | 16.75 | $ | 17.02 | ||||||
| From Operations: | ||||||||||||
| Net investment income (a) | 0.42 | 0.48 | 0.30 | |||||||||
| Net gain (loss) on investments (both realized and unrealized) | 1.15 | (1.03 | ) | 0.09 | ||||||||
| Total from Operations | 1.57 | (0.55 | ) | 0.39 | ||||||||
| Less Distributions: | ||||||||||||
| From net investment income | (0.30 | ) | (0.40 | ) | (0.06 | ) | ||||||
| From net realized gains on investments | — | — | (0.37 | ) | ||||||||
| From return of capital | (0.65 | ) | (0.56 | ) | (0.23 | ) | ||||||
| Total Distributions | (0.95 | ) | (0.96 | ) | (0.66 | ) | ||||||
| Net Asset Value, End of Period | $ | 15.86 | $ | 15.24 | $ | 16.75 | ||||||
| Total Return (b) | 10.52 | % (g) | (3.37 | )% (g) | 2.37 | % (d) | ||||||
| Ratios/Supplemental Data | ||||||||||||
| Net assets, end of period (in 000’s) | $ | 3,820 | $ | 7,806 | $ | 1,185 | ||||||
| Ratio to average net assets: | ||||||||||||
| Expenses (e) | 1.39 | % | 1.33 | % | 1.30 | % (c) | ||||||
| Net investment income (f) | 2.67 | % | 3.09 | % | 2.80 | % (c) | ||||||
| Ratio to average net assets (excluding interest expense) | ||||||||||||
| Expenses (e) | 1.29 | % | 1.24 | % | 1.30 | % (c) | ||||||
| Portfolio turnover rate | 13 | % | 21 | % | 49 | % (d) | ||||||
| * | Class I commenced operations on July 2, 2014. |
| (a) | Per share amounts are calculated using the average shares method, which more appropriately presents the per share data for the period. |
| (b) | Total returns are historical in nature and assume changes in share price, reinvestment of dividends and capital gains distributions, if any. Total returns for periods less than one year are not annualized. |
| (c) | Annualized for periods less than one year. |
| (d) | Not annualized. |
| (e) | Does not include the expenses of the investment companies in which the Fund invests. |
| (f) | The recognition of investment income is affected by the timing and declaration of dividends by the underlying investment companies in which the Fund invests. |
| (g) | Includes adjustments in accordance with accounting principles generally accepted in the United States and, consequently, the net asset value for financial reporting purposes and the returns based upon those net asset values may differ from the net asset values and returns for shareholder transactions. |
See accompanying notes to financial statements.
17
| Multi-Strategy Growth & Income Fund - Class L |
| FINANCIAL HIGHLIGHTS |
| The table below sets forth financial data for one share of beneficial interest outstanding throughout each period presented. |
| For the Year | For the Year | For the Period | ||||||||||
| Ended | Ended | Ended | ||||||||||
| February 28, 2017 | February 29, 2016 | February 28, 2015 * | ||||||||||
| Net Asset Value, Beginning of Period | $ | 15.11 | $ | 16.72 | $ | 17.02 | ||||||
| From Operations: | ||||||||||||
| Net investment income (a) | 0.27 | 0.37 | 0.20 | |||||||||
| Net gain (loss) on investments (both realized and unrealized) | 1.06 | (1.03 | ) | 0.17 | ||||||||
| Total from Operations | 1.33 | (0.66 | ) | 0.37 | ||||||||
| Less Distributions: | ||||||||||||
| From net investment income | (0.28 | ) | (0.39 | ) | (0.13 | ) | ||||||
| From net realized gains on investments | — | — | (0.35 | ) | ||||||||
| From return of capital | (0.65 | ) | (0.56 | ) | (0.19 | ) | ||||||
| Total Distributions | (0.93 | ) | (0.95 | ) | (0.67 | ) | ||||||
| Net Asset Value, End of Period | $ | 15.51 | $ | 15.11 | $ | 16.72 | ||||||
| Total Return (b) | 9.01 | % (g) | (4.03 | )% (g) | 2.25 | % (d) | ||||||
| Ratios/Supplemental Data | ||||||||||||
| Net assets, end of period (in 000’s) | $ | 9,192 | $ | 9,143 | $ | 8,356 | ||||||
| Ratio to average net assets: | ||||||||||||
| Expenses (e) | 2.16 | % | 2.08 | % | 2.05 | % (c) | ||||||
| Net investment income (f) | 1.77 | % | 2.37 | % | 2.00 | % (c) | ||||||
| Ratio to average net assets (excluding interest expense) | ||||||||||||
| Expenses (e) | 2.07 | % | 1.99 | % | 2.05 | % (c) | ||||||
| Portfolio turnover rate | 13 | % | 21 | % | 49 | % (d) | ||||||
| * | Class L commenced operations on July 2, 2014. |
| (a) | Per share amounts are calculated using the average shares method, which more appropriately presents the per share data for the period. |
| (b) | Total returns are historical in nature and assume changes in share price, reinvestment of dividends and capital gains distributions, if any and exclude the effects of sales loads. Total returns for periods less than one year are not annualized. |
| (c) | Annualized for periods less than one year. |
| (d) | Not annualized. |
| (e) | Does not include the expenses of the investment companies in which the Fund invests. |
| (f) | The recognition of investment income is affected by the timing and declaration of dividends by the underlying investment companies in which the Fund invests. |
| (g) | Includes adjustments in accordance with accounting principles generally accepted in the United States and, consequently, the net asset value for financial reporting purposes and the returns based upon those net asset values may differ from the net asset values and returns for shareholder transactions. |
See accompanying notes to financial statements.
18
| Multi-Strategy Growth & Income Fund |
| NOTES TO FINANCIAL STATEMENTS |
| February 28, 2017 |
| 1. | ORGANIZATION |
Multi-Strategy Growth & Income Fund (the “Fund”) was organized as a Delaware statutory trust on June 3, 2011, is registered under the Investment Company Act of 1940, as amended, (the “1940 Act”), and is a diversified, closed-end management investment company that operates as an interval fund with a continuous offering of Fund shares. The investment objective of the Fund is to seek returns from capital appreciation and income with an emphasis on income generation. The Fund pursues its investment objective by investing primarily in the income-producing securities of real estate investment trusts and alternative investment funds, as well as common stocks and structured notes, notes, bonds and asset-backed securities.
The Fund currently offers Class A, Class C, Class I and Class L shares. Class A shares commenced operations on March 16, 2012; Class C, Class I and Class L shares commenced operations on July 2, 2014. Class A and Class L shares are offered at net asset value plus a maximum sales charge of 5.75% and 2.00%, respectively. When purchase loads are waived, Class A shares are subject to a maximum early withdrawal charge of 1.00% on shares repurchased less than 365 days after purchase. Class C and Class I shares are offered at net asset value. Each class represents an interest in the same assets of the Fund and classes are identical except for differences in their sales charge structures and ongoing service and distribution charges. All classes of shares have equal voting privileges except that each class has exclusive voting rights with respect to its service and/or distribution plans. The Fund’s income, expenses (other than class specific distribution fees) and realized and unrealized gains and losses are allocated proportionately each day based upon the relative net assets of each class.
| 2. | SUMMARY OF SIGNIFICANT ACCOUNTING POLICIES |
The following is a summary of significant accounting policies followed by the Fund in preparation of its financial statements. These policies are in conformity with accounting principles generally accepted in the United States of America (“GAAP”). The preparation of financial statements requires management to make estimates and assumptions that affect the reported amounts of assets and liabilities and disclosure of contingent assets and liabilities at the date of the financial statements and the reported amounts of income and expenses for the period. Actual results could differ from those estimates. The Fund is an investment company and accordingly follows the investment company accounting and reporting guidance of the Financial Accounting Standards Board (FASB) Accounting Standard Codification Topic 946 “Financial Services – Investment Companies” including FASB Accounting Standard Update ASU 2013-08.
Security Valuation – Securities listed on an exchange are valued at the last reported sale price at the close of the regular trading session of the exchange on the business day the value is being determined, or in the case of securities listed on NASDAQ, at the NASDAQ Official Closing Price (“NOCP”). In the absence of a sale, such securities shall be valued at the mean of the closing bid and asked prices on the day of valuation. Short-term investments that mature in 60 days or less may be valued at amortized cost, provided such valuations represent fair value.
When price quotations for certain securities are not readily available, or if the available quotations are not believed to be reflective of market value by the Advisor (defined below), those securities will be valued at “fair value” as determined in good faith by the Fair Valuation Committee using procedures adopted by and under the supervision of the Fund’s Board of Trustees (the “Board”). There can be no assurance that the Fund could purchase or sell a portfolio security at the price used to calculate the Fund’s net asset value (“NAV”).
Fair valuation procedures may be used to value a substantial portion of the assets of the Fund. The Fund may use the fair value of a security to calculate its NAV when, for example, (1) a portfolio security is not traded in a public market or the principal market in which the security trades is closed, (2) trading in a portfolio security is suspended and not resumed prior to the normal market close, (3) a portfolio security is not traded in significant volume for a
19
| Multi-Strategy Growth & Income Fund |
| NOTES TO FINANCIAL STATEMENTS (Continued) |
| February 28, 2017 |
substantial period, or (4) the Advisor determines that the quotation or price for a portfolio security provided by a broker-dealer or independent pricing service is inaccurate.
The “fair value” of securities may be difficult to determine and thus judgment plays a greater role in the valuation process. The fair valuation methodology may include or consider the following guidelines, as appropriate: (1) evaluation of all relevant factors, including but not limited to, pricing history, current market level, supply and demand of the respective security; (2) comparison to the values and current pricing of securities that have comparable characteristics; (3) knowledge of historical market information with respect to the security; (4) other factors relevant to the security which would include, but not be limited to, duration, yield, fundamental analytical data, the Treasury yield curve, and credit quality. Calls with the management teams of these securities are completed to gain further insight that might not be as evident through the reading of published reports or filings.
Often, significant back-testing or historical data analysis is employed to gain increased, tangible perspective into ways to enhance the accuracy of either existing, or potentially new fair valuation approaches. This also ensures that recent enhancements or additional methodologies are leading to more accurate valuations.
Ongoing “logic checks” and evaluations of underlying portfolios are used to identify potential disconnects between current methodologies and expected results.
The values assigned to fair valued investments are based on available information and do not necessarily represent amounts that might ultimately be realized, since such amounts depend on future developments inherent in long-term investments. Changes in the fair valuation of portfolio securities may be less frequent and of greater magnitude than changes in the price of portfolio securities valued at their last sale price, by an independent pricing service, or based on market quotations. Imprecision in estimating fair value can also impact the amount of unrealized appreciation or depreciation recorded for a particular portfolio security and differences in the assumptions used could result in a different determination of fair value, and those differences could be material.
The Fund invests in some securities which are not traded and the Board’s Valuation Committee has established a methodology for fair value of each type of security. Non-listed Real Estate Investment Trusts (“REITs”) that are in the public offering period (or start-up phase) are valued at cost according to management’s fair valuation methodology unless the REIT issues an updated valuation. The Fund generally purchases REITs at NAV or without a commission. However, start-up REITs amortize a significant portion of their start-up costs and therefore, potentially carry additional risks that may impact valuation should the REIT be unable to raise sufficient capital and execute their business plan. As such, start-up REITs pose a greater risk than seasoned REITs because if they encounter going concern issues, they may see significant deviation in value from the fair value, cost basis approach as represented. Management is not aware of any information which would cause a change in cost basis valuation methodology currently being utilized for non-traded REITs in their offering period. Non-traded REITs that are in their offering period are generally categorized as Level 3 in the fair value hierarchy. Once a REIT closes to new investors, the Fund values the security based on the movement of an appropriate market index or a similar security that is publicly traded until the REIT issues an updated market valuation. Non-traded REITs that have closed to new investors are generally categorized in Level 2 of the fair value hierarchy, due to the significance of the effect of the application of the movement of the market index on the overall fair valuation of the REIT. Other non-traded private investments are monitored for any independent audits of the investment or impairments reported on the potential value of the investment. For non-traded private investments, including private real estate investment trusts and non-traded partnership funds, that are themselves treated as investment companies under GAAP, the Fund follows the guidance in GAAP that allows, as practical expedient, the Fund to value such investments at their reported NAV per share (of if not unitized, at an equivalent percentage of the capital of the investee entity). Such investments typically provide an updated NAV or its equivalent on a quarterly basis. The Valuation Committee meets frequently to discuss the valuation methodology and will adjust the value of a security if there is a public update to such valuation.
20
| Multi-Strategy Growth & Income Fund |
| NOTES TO FINANCIAL STATEMENTS (Continued) |
| February 28, 2017 |
The non-listed Business Development Companies provide quarterly fair value pricing which is used as an indicator of the valuation for the Fund. If the value significantly fluctuates, the Advisor will provide an updated price. If a significant event occurs that causes a large change in price, the Fair Valuation Committee will call a meeting to evaluate the fair value. Non-traded Business Development Companies are categorized as Level 2 in the fair value hierarchy. The Hedge Funds provide monthly fair value pricing which is used as an indicator of the valuation for the Fund. The Fund values the security based on the movement of an appropriate market index or a similar security that is publicly traded until the Hedge Fund issues an updated market valuation.
Valuation of Fund of Funds - The Fund may invest in funds of open-end or closed-end investment companies (the “Underlying Funds”). The Underlying Funds value securities in their portfolios for which market quotations are readily available at their market values (generally the last reported sale price) and all other securities and assets at their fair value using the methods established by the board of directors of the Underlying Funds. Open-end investment companies are valued at their net asset value per share and closed-end investment companies that trade on an exchange are valued as described under security valuation.
The Fund utilizes various methods to measure the fair value of its investments on a recurring basis. GAAP establishes a hierarchy that prioritizes inputs to valuation methods. The three levels of input are:
Level 1 – Unadjusted quoted prices in active markets for identical assets and liabilities that the Fund has the ability to access.
Level 2 – Observable inputs other than quoted prices included in Level 1 that are observable for the asset or liability, either directly or indirectly. These inputs may include quoted prices for the identical instrument on an inactive market, prices for similar instruments, interest rates, prepayment speeds, credit risk, yield curves, default rates and similar data.
Level 3 – Unobservable inputs for the asset or liability, to the extent relevant observable inputs are not available; representing the Fund’s own assumptions about the assumptions a market participant would use in valuing the asset or liability, and would be based on the best information available.
The availability of observable inputs can vary from security to security and is affected by a wide variety of factors, including, for example, the type of security, whether the security is new and not yet established in the marketplace, the liquidity of markets, and other characteristics particular to the security. To the extent that valuation is based on models or inputs that are less observable or unobservable in the market, the determination of fair value requires more judgment. Accordingly, the degree of judgment exercised in determining fair value is greatest for instruments categorized in Level 3.
The inputs used to measure fair value may fall into different levels of the fair value hierarchy. In such cases, for disclosure purposes, the level in the fair value hierarchy within which the fair value measurement falls in its entirety, is determined based on the lowest level input that is significant to the fair value measurement in its entirety.
21
| Multi-Strategy Growth & Income Fund |
| NOTES TO FINANCIAL STATEMENTS (Continued) |
| February 28, 2017 |
The inputs or methodology used for valuing securities are not necessarily an indication of the risk associated with investing in those securities. The following tables summarize the inputs used as of February 28, 2017 for the Fund’s assets and liabilities measured at fair value:
| Investments: | Practical Expedient (1) | Level 1 | Level 2 | Level 3 | Total | |||||||||||||||
| Common Stocks | $ | — | $ | 15,775,406 | $ | — | $ | — | $ | 15,775,406 | ||||||||||
| Real Estate Investment Trusts | 11,224,531 | 6,381,533 | 67,287,883 | 11,166,726 | 96,060,673 | |||||||||||||||
| Non-Listed Business Development Companies | 8,398,474 | — | 13,254,121 | — | 21,652,595 | |||||||||||||||
| Private Investment Funds | 24,522,287 | — | — | — | 24,522,287 | |||||||||||||||
| Non-Traded Partnership Fund | — | — | 2,257,952 | — | 2,257,952 | |||||||||||||||
| Closed-End Funds | — | 14,227,088 | — | — | 14,227,088 | |||||||||||||||
| Hedge Fund | 27,958,271 | — | — | — | 27,958,271 | |||||||||||||||
| Short-Term Investment | — | 5,381,864 | — | — | 5,381,864 | |||||||||||||||
| Total Investments | $ | 72,103,563 | $ | 41,765,891 | $ | 82,799,956 | $ | 11,166,726 | $ | 207,836,136 | ||||||||||
| (1) | Certain investments that are measured at fair value using the net asset value per share (or its equivalent) practical expedient have not been categorized in the fair value hierarchy. The fair value amounts presented in this table are intended to permit reconciliation of the fair value hierarchy to the amounts presented in the portfolio of investments. |
| * | Refer to the Portfolio of Investments for industry classifications. |
There were no transfers between Level 1 and Level 2 during the year ended February 28, 2017. There were transfers between Level 3 to Level 2 due to non-traded REITs that closed their offering period during the year ended February 28, 2017 and are thereafter being valued based upon changes in the value of an appropriate market index as well as non-traded partnerships being valued at a recent transaction price.
It is the Fund’s policy to record transfers into or out of any level at the beginning of the reporting period.
The following is a reconciliation of assets in which Level 3 inputs were used in determining value:
| Real Estate Investment Trusts | Non-Traded Partnership Fund | Total | ||||||||||
| Beginning Value | $ | 14,591,536 | $ | 7,500,000 | $ | 22,091,536 | ||||||
| Realized Gain/Loss | — | — | — | |||||||||
| Change in Unrealized App/Dep | 1,226,482 | — | 1,226,432 | |||||||||
| Purchases | — | — | — | |||||||||
| Sales and Return of Capital | (584,412 | ) | — | (584,412 | ) | |||||||
| Transfer | (4,066,880 | ) | (7,500,000 | ) | (11,566,880 | ) | ||||||
| Ending Value | $ | 11,166,726 | $ | — | $ | 11,166,726 | ||||||
22
| Multi-Strategy Growth & Income Fund |
| NOTES TO FINANCIAL STATEMENTS (Continued) |
| February 28, 2017 |
The following is the fair value measurement of investments that are measured at Net Asset Value per Share (or its equivalent) as a practical expedient:
| Security Description | Industry | Value | Unfunded | Redemption Frequency | Redemption Notice Period | |||||||||
| AIM Infrastructure MLP Fund II | Private Investment Company | $ | 3,486,675 | $ | 3,371,250 | Quarterly | 30-60 Days | |||||||
| Business Development Corp. of America | Non-Listed BDC | 3,870,854 | Quarterly | Notice prior to annoucement of Repurchase Offer | ||||||||||
| Clarion Lion Industrial Trust | REIT | 11,224,531 | Quarterly | 90 Days | ||||||||||
| Clarion Lion Properties Fund | Private Investment Company | 13,472,612 | Quarterly | 90 Days | ||||||||||
| Collins Masters Access Fund, Ltd. | Hedge Fund | 27,958,271 | Subject to advisor approval | 30-60 Days | ||||||||||
| Corporate Capital Trust, Inc. | Non-Listed BDC | 4,527,620 | Quarterly | 30-60 Days | ||||||||||
| Ovation Alternative Income Fund, LP | Private Investment Company | 7,563,000 | Quarterly | 180 Days | ||||||||||
| $ | 72,103,563 | $ | 3,371,250 | |||||||||||
Exchange Traded Funds – The Fund may invest in exchange traded funds (“ETFs”). Most ETFs are a type of index fund bought and sold on a securities exchange. An ETF trades like common stock and represents a fixed (or managed) portfolio of securities designed to track the performance and dividend yield of a particular domestic or foreign market index. The Fund may purchase an ETF to gain exposure to a portion of the U.S. or a foreign market. The risks of owning an ETF generally reflect the risks of owning the underlying securities they are designed to track, although the lack of liquidity on an ETF could result in it being more volatile. Additionally, ETFs have fees and expenses that reduce their value.
Security Transactions and Investment Income – Investment security transactions are accounted for on a trade date basis. Cost is determined and gains and losses are based upon the specific identification method for both financial statement and federal income tax purposes. Dividend income is recorded on the ex-dividend date and interest income is recorded on the accrual basis. Purchase discounts and premiums on securities are accreted and amortized over the life of the respective securities.
Federal Income Taxes – The Fund intends to comply with the requirements of Subchapter M of the Internal Revenue Code applicable to regulated investment companies and will distribute all of its taxable income, if any to shareholders. Accordingly, no provision for Federal income taxes is required in the financial statements.
The Fund recognizes the tax benefits of uncertain tax positions only when the position is “more likely than not” to be sustained assuming examination by tax authorities. Management has reviewed the tax positions on returns filed for open tax years (2014-2016), or expected to be taken in the Fund’s 2017 return, and concluded that no liability for unrecognized tax benefits should be recorded related to uncertain tax positions. The Fund identifies its major tax jurisdiction as U.S. Federal. The Fund recognizes interest and penalties, if any, related to unrecognized tax benefits as income tax expense in the Statement of Operations. During the year ended February 28, 2017, the Fund did not incur any interest or penalties.
Distributions to Shareholders – Distributions from investment income are declared and paid monthly. Distributions from net realized capital gains, if any, are declared and paid annually and are recorded on the ex-dividend date. The character of income and gains to be distributed is determined in accordance with income tax regulations, which may differ from GAAP.
Indemnification – The Fund indemnifies its officers and Trustees for certain liabilities that may arise from the performance of their duties to the Fund. Additionally, in the normal course of business, the Fund enters into contracts that contain a variety of representations and warranties and which provide general indemnities. The Fund’s maximum exposure under these arrangements is unknown, as this would involve future claims that may be
23
| Multi-Strategy Growth & Income Fund |
| NOTES TO FINANCIAL STATEMENTS (Continued) |
| February 28, 2017 |
made against the Fund that have not yet occurred. However, based on experience, the Trust expects the risk of loss due to these warranties and indemnities to be remote.
| 3. | ADVISORY FEES AND OTHER RELATED PARTY TRANSACTIONS |
Advisory Fees – Pursuant to an investment advisory agreement with the Fund, (the “Advisory Agreement”), investment advisory services are provided to the Fund by Lucia Capital Management, LLC (the “Advisor”). Under the terms of the Advisory Agreement, the Advisor receives monthly fees calculated at an annual rate of 0.75% of the average daily net assets of the Fund. For the year ended February 28, 2017, the Advisor earned advisory fees of $1,492,225.
Distributor – The distributor of the Fund is Northern Lights Distributors, LLC (the “Distributor”). The Board has adopted, on behalf of the Fund, a Shareholder Services Plan under which the Fund may compensate financial industry professionals for providing ongoing services in respect of clients with whom they have distributed shares of the Fund. Under the Shareholder Services Plan, the Fund may pay 0.25% per year of its average daily net assets attributed to each of Class A, Class C and Class L shares for such services. For the year ended February 28, 2017, the Fund incurred shareholder servicing fees of $405,834, $53,516, and $23,798 for Class A, Class C and Class L shares, respectively. The Class C and Class L shares also pay to the Distributor a distribution fee, payable under distribution plans adopted by the Board (“Distribution Plans”), for certain activities relating to the distribution of shares to investors and maintenance of shareholder accounts. These activities including marketing and other activities to support the distribution of the Class C and Class L shares. Under the Distribution Plans, the Fund pays 0.75% and 0.50% per year of its average daily net assets for such services for Class C and Class L shares, respectively. For the year ended February 28, 2017, the Fund incurred distributions fees of $160,546 and $47,596 for Class C and Class L shares, respectively.
The Distributor acts as the Fund’s principal underwriter in a continuous public offering of the Fund’s shares. For the year ended February 28, 2017, the Distributor received $1,041,368 and $29,966 in underwriting commissions for sales of Class A and Class L shares, respectively, of which $154,871 and $6,738 was retained by the principal underwriter or other affiliated broker-dealers.
In addition, certain affiliates of the Distributor provide services to the Fund as follows:
Gemini Fund Services, LLC (“GFS”) – GFS, an affiliate of the Distributor, provides administration, fund accounting, and transfer agent services to the Fund. Pursuant to a separate servicing agreement with GFS, the Fund pays GFS customary fees for providing administration, fund accounting and transfer agency services to the Fund. Certain officers of the Trust are also officers of GFS, and are not paid any fees directly by the Fund for servicing in such capacities.
Northern Lights Compliance Services, LLC (“NLCS”) – NLCS, an affiliate of GFS and the Distributor, provides a Chief Compliance Officer to the Fund, as well as related compliance services, pursuant to a consulting agreement between NLCS and the Fund. Under the terms of such agreement, NLCS receives customary fees from the Fund. An officer of the Fund is also an officer of NLCS, and are not paid any fees directly by the Fund for servicing in such capacity.
Blu Giant, LLC (“Blu Giant”) – Blu Giant, an affiliate of GFS and the Distributor, provides EDGAR conversion and filing services as well as print management services for the Fund on an ad-hoc basis. For the provision of these services, Blu Giant receives customary fees from the Fund.
Trustees – The Fund pays each Trustee who is not affiliated with the Fund or Advisor a quarterly fee of $3,000, as well as reimbursement for any reasonable expenses incurred attending meetings. Effective October 2016, the fees increased from $3,000 to $5,000. In addition to these quarterly fees and reimbursements, Ira J. Miller and Darlene
24
| Multi-Strategy Growth & Income Fund |
| NOTES TO FINANCIAL STATEMENTS (Continued) |
| February 28, 2017 |
T. Deremer receive a quarterly fee of $1,500 for their role as members of the Audit Committee, and Mark J. Riedy receives a quarterly fee of $1,750 for his role as Chairman of the Audit Committee. Effective October 2016, the Audit Committee fees increased from $1,500 to $2,500 and fees for the Chairman of the Audit Committee increased from $1,750 to $2,750. In addition to the foregoing quarterly fees and reimbursements, each Trustee who is not affiliated with the Fund or Advisor is entitled to following per-meeting fees for attendance and participation at each meeting that is not a regularly scheduled Board meeting (“Regular Board Meeting”) or regularly scheduled Audit Committee meeting (“Regular Audit Committee Meeting”):
(i) $1,500 for each in-person Board Meeting that is not a Regular Board Meeting,
(ii) $750 for each telephonic Board Meeting that is not a Regular Board Meeting,
(iii) $1,000 for each in-person Audit Committee Meeting that is not a Regular Audit Committee Meeting,
(iv) $500 for each telephonic Audit Committee Meeting that is not a Regular Audit Committee Meeting or a meeting conducted in conjunction with a Board Meeting, and
(v) $500 for each in-person or telephonic Audit Committee meeting if such meeting is conducted in conjunction with a Board meeting and provided such meeting is not a Regular Audit Committee Meeting.
The “interested persons” who serve as Trustees of the Fund receive no compensation for their services as Trustees. None of the executive officers receive compensation from the Fund.
Other Affiliates – During the year ended February 28, 2017, Lucia Securities, a registered broker/dealer and an affiliate of the Advisor, executed trades on behalf of the Fund for which it received brokerage commissions of $14,726.
| 4. | INVESTMENT TRANSACTIONS |
The cost of purchases and proceeds from the sale of securities, other than short-term securities, for the year ended February 28, 2017, amounted to $26,372,488 and $43,065,851, respectively.
| 5. | REPURCHASE OFFERS / SHARES OF BENEFICIAL INTEREST |
Pursuant to Rule 23c-3 under the 1940 Act, on a quarterly basis, the Fund offers shareholders holding all classes of shares the option of redeeming shares at net asset value. The Board determines the quarterly repurchase offer amount (“Repurchase Offer Amount”), which can be no less than 5% and no more than 25% of all shares of all classes outstanding on the repurchase request deadline. If shareholders tender more than the Repurchase Offer Amount, the Fund may, but is not required to, repurchase an additional amount of shares not to exceed 2% of all outstanding shares of the Fund on the repurchase request deadline. If the Fund determines not to repurchase more than the Repurchase Offer Amount, or if shareholders tender shares in an amount exceeding the Repurchase Offer Amount plus 2% of all outstanding shares on the repurchase request deadline, the Fund shall repurchase the shares tendered on a pro rata basis. There is no guarantee that a shareholder will be able to sell all of the shares tendered in a quarterly repurchase offer. Limited liquidity will be provided to shareholders only through the Fund’s quarterly repurchases.
25
| Multi-Strategy Growth & Income Fund |
| NOTES TO FINANCIAL STATEMENTS (Continued) |
| February 28, 2017 |
| Repurchase Offer | Repurchase Offer | Repurchase Offer | Repurchase Offer | |||||||||||||
| Commencement Date | March 16, 2016 | June 16, 2016 | September 16, 2016 | December 16, 2016 | ||||||||||||
| Repurchase Request | April 15, 2016 | July 15, 2016 | October 17, 2016 | January 17, 2017 | ||||||||||||
| Repurchase Pricing Date | April 15, 2016 | July 15, 2016 | October 17, 2016 | January 17, 2017 | ||||||||||||
| Net Asset Value as of Repurchase Offer Date | ||||||||||||||||
| Class A | $ | 15.44 | $ | 15.75 | $ | 15.61 | $ | 15.72 | ||||||||
| Class C | $ | 15.29 | $ | 15.57 | $ | 15.39 | $ | 15.47 | ||||||||
| Class I | $ | 15.50 | $ | 15.82 | $ | 15.76 | $ | 15.88 | ||||||||
| Class L | $ | 15.34 | $ | 15.63 | $ | 15.46 | �� | $ | 15.55 | |||||||
| Amount Repurchase | ||||||||||||||||
| Class A | $ | 7,114,380 | $ | 7,537,019 | $ | 2,955,891 | $ | 3,804,051 | ||||||||
| Class C | $ | 924,870 | $ | 611,203 | $ | 502,752 | $ | 408,545 | ||||||||
| Class I | $ | 1,241,757 | $ | 6,060,060 | $ | 59,135 | $ | 67,451 | ||||||||
| Class L | $ | 256,263 | $ | 278,210 | $ | 311,459 | $ | 543,321 | ||||||||
| Percentage of Outstanding Shares Repurchased | ||||||||||||||||
| Class A | 4.36 | % | 4.54 | % | 1.81 | % | 2.26 | % | ||||||||
| Class C | 4.64 | % | 2.93 | % | 2.25 | % | 1.72 | % | ||||||||
| Class I | 11.80 | % | 62.75 | % | 1.64 | % | 1.87 | % | ||||||||
| Class L | 2.70 | % | 2.80 | % | 3.21 | % | 5.60 | % | ||||||||
| 6. | DISTRIBUTIONS TO SHAREHOLDERS AND TAX COMPONENTS OF CAPITAL |
The tax character of Fund distributions for the following years was as follows:
| Fiscal Year Ended | Fiscal Year Ended | |||||||
| February 28, 2017 | February 29, 2016 | |||||||
| Ordinary Income | $ | 3,730,416 | $ | 5,235,308 | ||||
| Return of Capital | 8,225,473 | 7,004,103 | ||||||
| $ | 11,955,889 | $ | 12,239,411 | |||||
As of February 28, 2017, the components of accumulated earnings/(deficit) on a tax basis were as follows:
| Undistributed | Undistributed | Post October Loss | Capital Loss | Other | Unrealized | Total | ||||||||||||||||||||
| Ordinary | Long-Term | and | Carry | Book/Tax | Appreciation/ | Accumulated | ||||||||||||||||||||
| Income | Gains | Late Year Loss | Forwards | Differences | (Depreciation) | Earnings/(Deficits) | ||||||||||||||||||||
| $ | — | $ | — | $ | (142,931 | ) | $ | (9,244,347 | ) | $ | — | $ | 22,282,317 | $ | 12,895,039 | |||||||||||
The difference between book basis and tax basis unrealized appreciation of investments and undistributed net investment income is primarily attributable to the adjustment for partnerships and mark-to-market on passive foreign investment companies.
Capital losses incurred after October 31 within the fiscal year are deemed to arise on the first business day of the following fiscal year for tax purposes. The Fund incurred and elected to defer such capital losses of $142,931.
At February 28, 2017, the Fund had capital loss carry forwards for federal income tax purposes available to offset future capital gains as follows:
| Non-Expiring | Non-Expiring | |||||||||
| Short-Term | Long-Term | Total | ||||||||
| $ | 6,458,568 | $ | 2,785,779 | $ | 9,244,347 | |||||
26
| Multi-Strategy Growth & Income Fund |
| NOTES TO FINANCIAL STATEMENTS (Continued) |
| February 28, 2017 |
Permanent book and tax differences, primarily attributable to adjustments related to partnerships and return of capital on 2016 tax return for real estate investment trusts, resulted in reclassification for the year ended February 28, 2017 as follows:
| Paid | Accumulated | Accumulated | ||||||||
| In | Net Investment | Net Realized | ||||||||
| Capital | Income | Loss | ||||||||
| $ | 247,045 | $ | (760,244 | } | $ | 513,199 | ||||
| 7. | BORROWING FROM BROKER |
The Fund has the opportunity to borrow money from a broker with a variable limit based on how many securities are pledged as collateral. It is intended to provide financing, if necessary, subject to certain restrictions, in connection with shareholder redemptions. Borrowings are secured by certain of the Fund’s investments. Interest will be accrued at the 1 Month LIBOR rate plus 110 bps to be paid monthly. The credit facility is with BNP Paribas Prime Brokerage, Inc. During the year ended February 28, 2017, the Fund paid $169,302 in interest on the borrowings. Average borrowings and the average interest rate during the year ended February 28, 2017, were $12,321,262 and 1.61%, respectively. The largest outstanding amount borrowed during the period was $20,917,329. The balance due to the broker as of February 28, 2017 was $0.
| 8. | NEW ACCOUNTING PRONOUNCEMENT |
On October 13, 2016 the Securities and Exchange Commission amended existing rules intended to modernize reporting and disclosure of information. These amendments relate to Regulation S-X which sets forth the form and content of financial statements. At this time, management is evaluating the implications of adopting these amendments and their impact on the financial statements and accompanying notes.
| 9. | SUBSEQUENT EVENTS |
Subsequent events after the date of the Statement of Assets and Liabilities have been evaluated through the date the financial statements were issued. Management has concluded that there is no impact requiring adjustment or disclosure in the financial statements. On March 30, 2017, the Fund paid distributions of $0.0782, $0.0769, $0.0791 and $0.0773 per share to shareholders of record on March 29, 2017 for Class A, Class C, Class I and Class L shares, respectively. The Fund completed a quarterly repurchase offer on April 17, 2017 which resulted in 2.27%, 1.87%, 2.96% and 2.97% of Fund shares being repurchased for $3,892,823, $479,985, $119,825 and $278,042 for Class A, Class C, Class I and Class L, respectively.
27

REPORT OF INDEPENDENT REGISTERED PUBLIC ACCOUNTING FIRM
To the Board of Trustees and the Shareholders of
Multi-Strategy Growth & Income Fund
We have audited the accompanying statement of assets and liabilities of Multi-Strategy Growth & Income Fund, (the “Fund”) including the portfolio of investments, as of February 28, 2017, and the related statements of operations and cash flows for the year then ended, the statements of changes in net assets for each of the years in the two-year period then ended and the financial highlights for each of the years and periods in the period from March 16, 2012 (commencement of operations) through February 28, 2017. These financial statements and financial highlights are the responsibility of the Fund’s management. Our responsibility is to express an opinion on these financial statements and financial highlights based on our audits.
We conducted our audits in accordance with the standards of the Public Company Accounting Oversight Board (United States). Those standards require that we plan and perform the audits to obtain reasonable assurance about whether the financial statements and financial highlights are free of material misstatement. An audit includes examining, on a test basis, evidence supporting the amounts and disclosures in the financial statements. Our procedures included confirmation of securities owned as of February 28, 2017 by correspondence with the custodian, brokers, and investee companies. An audit also includes assessing the accounting principles used and significant estimates made by management, as well as evaluating the overall financial statement presentation. We believe that our audits provide a reasonable basis for our opinion.
As explained in Note 2, the financial statements include securities valued at $166,070,245 (80.68% of net assets), whose fair values have been estimated by the Board of Trustees in the absence of readily ascertainable fair values.
In our opinion, the financial statements and financial highlights referred to above present fairly, in all material respects, the financial position of Multi-Strategy Growth & Income Fund as of February 28, 2017, and the results of its operations for the year then ended, the changes in its net assets for each of the years in the two-year period then ended and its financial highlights for each of the years and periods in the period from March 16, 2012 through February 28, 2017, in conformity with accounting principles generally accepted in the United States of America.

BBD, LLP
Philadelphia, Pennsylvania
April 28, 2017
28
Renewal of the Investment Advisory Agreement between the Trust and the Adviser (Unaudited)
At a meeting held on October 27, 2016, the Board of Trustees (the “Board” or the “Trustees”), including the Trustees who are not “interested persons,” as such term is defined in the Investment Company Act of 1940, as amended (the “Independent Trustees”), approved the renewal of the investment advisory agreement (the “Advisory Agreement”) between Multi-Strategy Growth & Income Fund (the “Fund”) and Lucia Capital Management, LLC (the “Adviser”). In its consideration of the Advisory Agreement, the Board, including the Independent Trustees, did not identify any single factor as all-important or controlling, and the following summary does not detail all the matters considered.
Nature, Extent and Quality of Services. The Board examined the nature, extent and quality of the services provided by the Adviser to the Fund. The Trustees noted that the Adviser has extensive experience and continues to invest in personnel.
The Trustees expressed satisfaction with the Fund’s portfolio, as well as with the continued evolution and growth of the Adviser’s management team and investment process. The Board discussed the nature of the Adviser’s operations, noting the high quality of the Adviser’s compliance infrastructure and the Adviser’s robust approach to the fair value process. The Board noted that the Adviser had established a culture of open communication with the Board. The Board further noted the Adviser had reported no material compliance incidents, litigation or administrative actions since the Board last renewed the Agreement. The Board noted their satisfaction with the fact that the Fund has continued to deliver positive returns while simultaneously providing downside protection. The Board indicated that the Adviser has done an admirable job managing the Fund’s assets, and they noted that they were pleased that the Adviser has added unique asset classes to the benefit of shareholders. The Board expressed its opinion that the Adviser is managing risks well. Overall, it was the consensus of the Trustees that they were satisfied with the nature, extent and quality of the services provided to the Fund under the Advisory Agreement.
Fees and Expenses. The Trustees reviewed information regarding fees charged by advisers to a peer group of funds composed of other closed-end interval funds. The Trustees noted that the Adviser charges an advisory fee of 0.75%, which was significantly below the peer group average. The Trustees also noted that the Fund’s net expense ratio was higher than the peer group average of 2.46%, but within the range of the peer group, and they considered that there was no longer an expense limitation agreement in place for the Fund. The Trustees noted the Adviser did not receive any other payments from the Fund other than advisory fees. After discussion, the Board concluded that the advisory fee was very competitive and below market.
Performance. The Trustees considered the Fund’s past performance. The Trustees considered the Fund’s investment objectives of seeking returns from capital appreciation and income, with an emphasis on the generation of income, as well as the Fund’s investment policy of maintaining a core allocation to alternative assets. They noted that since the Fund’s inception, the Fund has achieved its objective of delivering non-correlated returns and consistent monthly distributions. It was also discussed that there is no perfect benchmark for this type of fund. The Trustees noted that the Fund outperformed the Barclays US Aggregate Bond Index and underperformed the S&P 500 Total Return Index during the one-year period ended September 30, 2016. The Trustees concluded that the Fund was performing in line with its goals and objectives across a variety of market environments, and they agreed that the Fund’s performance was satisfactory.
Economies of Scale. The Trustees considered whether the Adviser has realized or will realize economies of scale with respect to the management of the Fund. The Trustees agreed with the Adviser’s assessment that, as the Fund grows, so will the complexity of the management of the Fund, requiring additional resources of the Adviser. It was noted that the Fund is currently being marketed to both affiliated and unaffiliated broker-dealers and also to registered investment advisers. The Trustees noted their satisfaction with the Fund’s growth over the past year. The Trustees agreed to continue to monitor Fund growth and evaluate the appropriateness of breakpoints in the advisory fee.
29
Profitability. The Trustees considered the profits realized by the Adviser in connection with the operation of the Fund and whether the amount of profit is a fair entrepreneurial profit for the management of the Fund. The Trustees noted that the Adviser reported receiving a profit that was modest in both percentage and dollar amount, and they expressed their satisfaction with the fact that the Adviser was able to manage the Fund on a cost effective basis even though its advisory fee rate was substantially below the peer group average. The Board concluded that the Adviser’s estimated level of profitability from its relationship with the Fund was not excessive.
Conclusion. During the Board’s deliberations, it was noted that the Board did not identify any single piece of information that was all-important or controlling with respect to the Advisory Agreement. Having requested and received such information from the Adviser as the Trustees believed to be reasonably necessary to evaluate the terms of the Advisory Agreement, and as assisted by the advice of Counsel, the Trustees concluded that the fee structure is reasonable and that renewal of the Advisory Agreement is in the best interests of the shareholders of the Fund.
30
| Multi-Strategy Growth & Income Fund |
| TRUSTEE TABLE (Unaudited) |
| February 28, 2017 |
Independent Trustees
| Name, Address and Age(Year of Birth) | Position/Term of Office(1) | Principal Occupation During the Past Five Years | Number of Portfolios in Fund Complex(2) Overseen by Trustee | Other Directorships held by Trustee During Last Five Years |
| Mark J. Riedy, PhD. 1942 | Trustee since Sept. 2011 | Executive Director of the Burnham-Moores Center for Real Estate and the Ernest W. Hahn Professor of Real Estate Finance at the University of San Diego, January 1993 to January 2015. Retired January 2015. | 1 | BioMed Realty Trust Board of Directors; Southwest Property Strategies Advisory Board |
| Ira J. Miller 1946 | Trustee since Sept. 2011 | Retired as of August 2007. | 1 | None |
| John D. Frager 1958 | Trustee since Sept. 2011 | Executive Managing Director of CBRE, Inc. (2010) to present), CEO and President of Cassidy Turley San Diego (2002 to 2010); Senior Managing Director of CB Richard Ellis (Prior to 2002) | 1 | None |
| Darlene T. Deremer 1955 | Trustee since Oct. 2015 | Managing Partner of Grail Partners, LLC (2005-present) | 1 | Syracuse University Board of Trustees; United Capital Wealth Management Board of Directors; Hillcrest Asset Management Board of Directors; Ark Investments Funds Trust Independent Chair; American Independence Funds Board of Directors. |
31
| Multi-Strategy Growth & Income Fund |
| TRUSTEE TABLE (Unaudited) (continued) |
| February 28, 2017 |
Interested Trustee & Officers
| Name, Address and Age (year of birth) | Position/Term of Office(1) | Principal Occupation During the Past Five Years | Number of Portfolios in Fund Complex(2) Overseen by Trustee | Other Directorships held by Trustee During Last 5 Years |
| Raymond J. Lucia, Jr. 1975(2) | Trustee, President since Sept. 2011 | Chief Executive Officer for Lucia Capital Management (2012-Present); Chairman for Lucia Wealth Services, LLC (2010-Present); Chief Executive Officer for Lucia Securities, LLC (2010-Present), Executive Vice President for Raymond J. Lucia Companies, Inc.(2002- 2010) | 1 | None |
| James Colantino 1969 | Assistant Treasurer since Sept. 2011 | Senior Vice President (2011-present) Vice President (2004 – 2011); Senior Fund Administrator (1999-2004), Gemini Fund Services, LLC. | n/a | n/a |
| Theresa J. Ochs 1967 | Secretary since April 2015 | CCO for Lucia Capital Management (2012 to present); CCO for Lucia Wealth Services (2010-present); CCO or Lucia Securities, LLC (2015-Present), Sr. Compliance Officer, Lucia Securities, LLC (2013-2015), CCO for Lucia Securities, LLC (2011-2013), CCO for Lucia Securities, LLC (2009-2011) CCO for Raymond J Lucia Companies, Inc. (2009-2011), Designated Registered Principal, First Allied Securities, Inc. (2007-2011) | n/a | n/a |
| Felicia Tarantino 1987 | Treasurer since June 2016 | Operations Manager for Lucia Capital Management, LLC (2012-Present); Financial Analyst for Lucia Management Company, LLC (2012-Present); Accounting Specialist for Lucia Management Company, LLC (2010-2012) | n/a | None |
| Dawn M. Dennis 1966 | Assistant Secretary since Oct. 2013 | Senior Paralegal, Gemini Fund Services (since May 2013), Paralegal (from July 2011 through April 2013) | n/a | n/a |
| Emile R. Molineaux 1962 | Chief Compliance Officer and Anti-Money Laundering Officer Since December 2010 | CCO of various clients of Northern Lights Compliance Services, LLC, (Secretary since 2003 and Senior Compliance Officer since 2011); General Counsel, CCO and Senior Vice President, Gemini Fund Services, LLC (2003-2011) | n/a | n/a |
| (1) | The term of office for each Trustee and officer listed above will continue indefinitely. |
| (2) | Raymond J. Lucia, Jr. is an interested person of the Trust by virtue of his position as President of the Trust and his indirect controlling interest in the Trust’s Adviser. |
The Fund’s Statement of Additional Information includes additional information about the Trustees and is available free of charge, upon request, by calling toll-free 1-855-601-3841.
32
PRIVACY NOTICE
Rev: April 2013
| FACTS | WHAT DOES MULTI-STRATEGY GROWTH & INCOME FUND DO WITH YOUR PERSONAL INFORMATION? | |||
| Why? | Financial companies choose how they share your personal information. Federal law gives consumers the right to limit some but not all sharing. Federal law also requires us to tell you how we collect, share, and protect your personal information. Please read this notice carefully to understand what we do. | |||
| What? | The types of personal information we collect and share depend on the product or service you have with us. This information can include: | |||
| ■ | Social Security number | ■ | Purchase History | |
| ■ | Assets | ■ | Account Balances | |
| ■ | Retirement Assets | ■ | Account Transactions | |
| ■ | Transaction History | ■ | Wire Transfer Instructions | |
| ■ | Checking Account Information | |||
| When you are no longer our customer, we continue to share your information as described in this notice. | ||||
| How? | All financial companies need to share customers’ personal information to run their everyday business. In the section below, we list the reasons financial companies can share their customers’ personal information; the reasons The Multi-Strategy Growth & Income Fund chooses to share; and whether you can limit this sharing. | |||
| Reasons we can share your personal information | Does Multi- Strategy Growth & Income Fund share? | Can you limit this sharing? |
For our everyday business purposes – such as to process your transactions, maintain your account(s), respond to court orders and legal investigations, or report to credit bureaus | Yes | No |
For our marketing purposes – to offer our products and services to you | No | We don’t share |
| For joint marketing with other financial companies | No | We don’t share |
For our affiliates’ everyday business purposes – information about your transactions and experiences | No | We don’t share |
For our affiliates’ everyday business purposes – information about your creditworthiness | No | We don’t share |
| For nonaffiliates to market to you | No | We don’t share |
| Questions? | Call 1-855-601-3841 |
33
| Who we are | |||||
Who is providing this notice?
| Multi-Strategy Growth & Income Fund | ||||
| What we do | |||||
| How does Multi-Strategy Growth & Income Fund protect my personal information? | To protect your personal information from unauthorized access and use, we use security measures that comply with federal law. These measures include computer safeguards and secured files and buildings.
Our service providers are held accountable for adhering to strict policies and procedures to prevent any misuse of your nonpublic personal information. | ||||
| How does Multi-Strategy Growth & Income Fund collect my personal information? | We collect your personal information, for example, when you
■ Open an account
■ Provide account information
■ Give us your contact information
■ Make deposits or withdrawals from your account
■ Make a wire transfer
■ Tell us where to send the money
■ Tells us who receives the money
■ Show your government-issued ID
■ Show your driver’s license
We also collect your personal information from other companies. | ||||
| Why can’t I limit all sharing? | Federal law gives you the right to limit only
■ Sharing for affiliates’ everyday business purposes – information about your creditworthiness
■ Affiliates from using your information to market to you
■ Sharing for nonaffiliates to market to you
State laws and individual companies may give you additional rights to limit sharing. | ||||
| Definitions | |||||
| Affiliates | Companies related by common ownership or control. They can be financial and nonfinancial companies.
■ Multi-Strategy Growth & Income Fund does not share with our affiliates. | ||||
| Nonaffiliates | Companies not related by common ownership or control. They can be financial and nonfinancial companies
■ Multi-Strategy Growth & Income Fund does not share with nonaffiliates so they can market to you. | ||||
| Joint marketing | A formal agreement between nonaffiliated financial companies that together market financial products or services to you.
■ Multi-Strategy Growth & Income Fund doesn’t jointly market. | ||||
34
| Investment Advisor |
| RJL Capital Management, LLC |
| 13520 Evening Creek Drive N. Suite 300 |
| San Diego, CA 92128 |
| Distributor |
| Northern Lights Distributors, LLC |
| 17605 Wright Street |
| Omaha, NE 68130 |
| Legal Counsel |
| Thompson Hine LLP |
| 41 South High Street, Suite 1700 |
| Columbus, OH 43215 |
| Independent Registered Public Accounting Firm |
| BBD, LLP |
| 1835 Market Street, 26th Floor |
| Philadelphia, PA 19103 |
How to Obtain Proxy Voting Information
Information regarding how the Fund voted proxies relating to portfolio securities for the 12 month period ended June 30th as well as a description of the policies and procedures that the Fund used to determine how to vote proxies is available without charge, upon request, by calling 1-855-601-3841 or by referring to the Securities and Exchange Commission’s (“SEC”) website at http://www.sec.gov.
How to Obtain 1st and 3rd Fiscal Quarter Portfolio Holdings
The Fund files its complete schedule of portfolio holdings with the SEC for the first and third quarters of each fiscal year on Form N-Q. Form N-Q is available on the SEC’s website at http://www.sec.gov and may be reviewed and copied at the SEC’s Public Reference Room in Washington, DC (1-800-SEC-0330). The information on Form N-Q is available without charge, upon request, by calling 1-855-601-3841.
Item 2. Code of Ethics. Attached
(a) As of the end of the period covered by this report, the registrant has adopted a code of ethics that applies to the registrant's principal executive officer, principal financial officer, principal accounting officer or controller, or persons performing similar functions, regardless of whether these individuals are employed by the registrant or a third party.
(b) For purposes of this item, “code of ethics” means written standards that are reasonably designed to deter wrongdoing and to promote:
| (1) | Honest and ethical conduct, including the ethical handling of actual or apparent conflicts of interest between personal and professional relationships; |
| (2) | Full, fair, accurate, timely, and understandable disclosure in reports and documents that a registrant files with, or submits to, the Commission and in other public communications made by the registrant; |
(3) Compliance with applicable governmental laws, rules, and regulations;
| (4) | The prompt internal reporting of violations of the code to an appropriate person or persons identified in the code; and |
(5) Accountability for adherence to the code.
(c) Amendments: During the period covered by the report, there have not been any amendments to the provisions of the code of ethics.
(d) Waivers: During the period covered by the report, the registrant has not granted any express or implicit waivers from the provisions of the code of ethics.
(e) The Code of Ethics is not posted on Registrant’ website.
(f) A copy of the Code of Ethics is attached as an exhibit.
Item 3. Audit Committee Financial Expert.
(a) The Registrant’s board of trustees has determined that Mark Riedy is a financial expert, as defined in Item 3 of Form N-CSR. Mark Riedy is independent for purposes of this Item.
Item 4. Principal Accountant Fees and Services.
| (a) | Audit Fees |
2017 - $51,500
2016 - $36,500
| (b) | Audit-Related Fees |
2017 - $0
2016 - $0
| (c) | Tax Fees |
2017 - $3,500
2016 - $3,500
Preparation of Federal & State income tax returns, assistance with calculation of required income, capital gain and excise distributions and preparation of Federal excise tax returns.
| (d) | All Other Fees |
2017 - $0
2016 - $0
| (e) | (1) Audit Committee’s Pre-Approval Policies |
The registrant’s Audit Committee is required to pre-approve all audit services and, when appropriate, any non-audit services (including audit-related, tax and all other services) to the registrant. The registrant’s Audit Committee also is required to pre-approve, when appropriate, any non-audit services (including audit-related, tax and all other services) to its adviser, or any entity controlling, controlled by or under common control with the adviser that provides ongoing services to the registrant, to the extent that the services may be determined to have an impact on the operations or financial reporting of the registrant. Services are reviewed on an engagement by engagement basis by the Audit Committee.
| (2) | Percentages of Services Approved by the Audit Committee |
2017 2016
Audit-Related Fees: 100.00% 100.00%
Tax Fees: 0.00% 0.00%
All Other Fees: 0.00% 0.00%
| (f) | During the audit of registrant's financial statements for the most recent fiscal year, less than 50 percent of the hours expended on the principal accountant's engagement were attributed to work performed by persons other than the principal accountant's full-time, permanent employees. |
| (g) | The aggregate non-audit fees billed by the registrant's accountant for services rendered to the registrant, and rendered to the registrant's investment adviser (not including any sub-adviser whose role is primarily portfolio management and is subcontracted with or overseen by another investment adviser), and any entity controlling, controlled by, or under common control with the adviser that provides ongoing services to the registrant: |
2017 - $3,500
2016 - $3,500
(h) The registrant's audit committee has considered whether the provision of non-audit services to the registrant's investment adviser (not including any sub-adviser whose role is primarily portfolio management and is subcontracted with or overseen by another investment adviser), and any entity controlling, controlled by, or under common control with the investment adviser that provides ongoing services to the registrant, that were not pre-approved pursuant to paragraph (c)(7)(ii) of Rule 2-01 of Regulation S-X, is compatible with maintaining the principal accountant's independence.
Item 5. Audit Committee of Listed Companies. Not applicable
Item 6. Schedule of Investments. Schedule of investments in securities of unaffiliated issuers is included under Item 1.
Item 7. Disclosure of Proxy Voting Policies and Procedures for Closed-End Funds.
See attached exhibit P1A, which contains the Adviser proxy voting policies and procedures.
Item 8. Portfolio Managers of Closed-End Management Investment Companies.
Raymond J. Lucia, Jr.
Mr. Lucia, Chief Executive Officer of the Adviser, is the Fund's co-portfolio manager. Mr. Lucia shares responsibility for management of the Fund's investment portfolio and has served the Fund in this capacity since it commenced operations in 2012. Mr. Lucia is Chairman of Lucia Wealth Services, LLC, a Registered Investment Advisor, and
CEO of Lucia Securities, LLC, a Registered Broker Dealer and member FINRA/SIPC. Mr. Lucia is also a Managing Member of VALIDUS Growth Investors, LLC, a Registered Investment Advisor. Mr. Lucia was previously with Raymond J. Lucia Companies, Inc. for 10 years where he held the position of Executive Vice President and was responsible for creating and managing the firm's strategic plans, including: developing and implementing the firm's investment strategies, growing the fee-based asset management platform, and expanding the firm's client base in over 15 office locations nationwide. Prior to joining Raymond J. Lucia Companies, Inc. in 2000, Mr. Lucia worked for Deloitte and Touche as a tax accountant in the Personal Financial Services group providing financial advice to high-net-worth individuals. Mr. Lucia graduated from Loyola Marymount University in 1997 with a Bachelor of Science in Accounting. Mr. Lucia is a Certified Public Accountant and holds the Personal Financial Specialist designation offered by the AICPA.
Mark C. Scalzo
Mr. Scalzo, Chief Investment Officer of the Adviser, is the Fund’s co-portfolio manager. Mr. Scalzo shares responsibility for management of the Fund’s investment portfolio and has served the Fund in this capacity since 2015. Mr. Scalzo is also the Founder, Chief Investment Officer and a Managing Member of VALIDUS Growth Investors, LLC, a Registered Investment Advisor. From 2008-2012, Mr. Scalzo was the Co-Portfolio Manager and Director of Research for Aletheia Research and Management, Inc. where Mr. Scalzo was responsible for managing all of Aletheia’s long-only model portfolios in conjunction with the Chief Investment Officer. As Director of Research, Mr. Scalzo worked to institutionalize and maintain the integrity of the investment process while managing a staff of seven research analysts. From 2006-2008, Mr. Scalzo was Group Vice President and Head of Mergers and Acquisitions for Fisher Investments where he created a consolidation strategy for Fisher’s investment platform, infrastructure and client service approach. Mr. Scalzo graduated cum laude from The Wharton School at the University of Pennsylvania in 1989 with a Bachelor of Science in Economics.
As of February 28, 2017, Raymond J. Lucia Jr. was responsible for the management of the following types of accounts in addition to the Fund:
| Other Accounts By Type | Total Number of Accounts by Account Type | Total Assets By Account Type | Number of Accounts by Type Subject to a Performance Fee | Total Assets By Account Type Subject to a Performance Fee |
| Registered Investment Companies | 0 | $0 | 0 | $0 |
| Other Pooled Investment Vehicles | 0 | $0 | 0 | $0 |
| Other Accounts | 0 | $0 | 0 | $0 |
As of February 28, 2017, Mark Scalzo was responsible for the management of the following types of accounts in addition to the Fund:
| Other Accounts By Type | Total Number of Accounts by Account Type | Total Assets By Account Type | Number of Accounts by Type Subject to a Performance Fee | Total Assets By Account Type Subject to a Performance Fee |
| Registered Investment Companies | 0 | $0 | 0 | $0 |
| Other Pooled Investment Vehicles | 0 | $0 | 0 | $0 |
| Other Accounts | 13 | $346,155,362 | 0 | $0 |
Because the Mr. Scalzo manages assets for other accounts (including institutional clients and certain high net worth individuals) (collectively "Client Accounts"), or may be affiliated with such Client Accounts, there may be an incentive to favor one Client Account over another, resulting in conflicts of interest. For example, the Advisor may, directly or indirectly, receive fees from Client Accounts that are higher than the fee it receives from the Advisor to the Fund, or it may, directly or indirectly, receive a performance-based fee on a Client Account. In those instances, the portfolio manager may have an incentive to not favor the Fund over the Client Accounts. The Advisor has adopted trade allocation and other policies and procedures that it believes are reasonably designed to address these and other conflicts of interest.
Raymond J. Lucia Jr. and Mark Scalzo are compensated through a salary.
As of February 28, 2017, the Portfolio Managers’ ownership of the Fund was as follows:
| Portfolio Managers | Dollar Range of Shares Owned |
| Raymond J. Lucia Jr. | Over $100,000 |
| Mark C. Scalzo | $0 |
Item 9. Purchases of Equity Securities by Closed-End Funds. Not applicable
Item 10. Submission of Matters to a Vote of Security Holders. None
Item 11. Controls and Procedures.
(a) Based on an evaluation of the Registrant’s disclosure controls and procedures as of a date within 90 days of filing date of this Form N-CSR, the principal executive officer and principal financial officer of the Registrant have concluded that the disclosure controls and procedures of the Registrant are reasonably designed to ensure that the information required in filings on Form N-CSR is recorded, processed, summarized, and reported by the filing date, including that information required to be disclosed is accumulated and communicated to the Registrant’s management, including the Registrant’s principal executive officer and principal financial officer, as appropriate to allow timely decisions regarding required disclosure.
(b) There were no significant changes in the Registrant’s internal control over financial reporting that occurred during the Registrant’s last fiscal half-year that have materially affected, or are reasonably likely to materially affect, the Registrant’s internal control over financial reporting.
Item 12. Exhibits.
(a)(1) Code of Ethics filed herewith.
(a)(2) Certifications required by Section 302 of the Sarbanes-Oxley Act of 2002 (and Item 11(a)(2) of Form N-CSR) are filed herewith.
(a)(3) Not applicable.
(b) Certifications required by Section 906 of the Sarbanes-Oxley Act of 2002 (and Item 11(b) of Form N-CSR) are filed herewith.
SIGNATURES
Pursuant to the requirements of the Securities Exchange Act of 1934 and the Investment Company Act of 1940, the registrant has duly caused this report to be signed on its behalf by the undersigned, thereunto duly authorized.
(Registrant) Multi-Strategy Growth & Income Fund
By (Signature and Title)
/s/ Raymond J. Lucia
Raymond J. Lucia Jr.,
Principal Executive Officer/President and Principal Financial Officer/Treasurer
Date 5/10/17
Pursuant to the requirements of the Securities Exchange Act of 1934 and the Investment Company Act of 1940, this report has been signed below by the following persons on behalf of the registrant and in the capacities and on the dates indicated.
By (Signature and Title)
/s/ Raymond J. Lucia
Raymond J. Lucia Jr.,
Principal Executive Officer/President and Principal Financial Officer/Treasurer
Date 5/10/17