united states
securities and exchange commission
washington, d.c. 20549
form n-csr
certified shareholder report of registered management
investment companies
Investment Company Act file number 811-22572
Destra Multi-Alternative Fund
(Exact name of registrant as specified in charter)
444 West Lake Street, Suite 1700, Chicago, IL 60606
(Address of principal executive offices) (Zip code)
The Corporation Trust Company – Corporation Trust Center
1209 Orange Street, Wilmington, Deleware 19801
(Name and address of agent for service)
Registrant's telephone number, including area code: 631-470-2600
Date of fiscal year end: 2/28
Date of reporting period:2/28/19
Item 1. Reports to Stockholders.
 |
| Destra Multi-Alternative Fund |
| Annual Report |
| February 28, 2019 |
INVESTOR INFORMATION: 1-855-601-3841
This report and the financial statements contained herein are submitted for the general information of shareholders and are not authorized for distribution to prospective investors unless preceded or accompanied by an effective prospectus. Nothing herein contained is to be considered an of fer of sale or solicitation of an offer to buy shares of the Destra Multi-Alternative Fund. Such offering is made only by prospectus, which includes details as to offering price and other material information.
Distributed by Destra Capital Investments, LLC Member
FINRA
Beginning on January 1, 2021, as permitted by regulations adopted by the Securities and Exchange Commission, paper copies of the Fund’s shareholder reports like this one will no longer be sent by mail, unless you specifically request paper copies of the reports. Instead, the reports will be made available on the Fund’s website www.destracapital.com, and you will be notified by mail each time a report is posted and provided with a website link to access the report.
If you already elected to receive shareholder reports electronically, you will not be affected by this change and you need not take any action. You may elect to receive shareholder reports and other communications from the Fund electronically by contacting your financial intermediary (such as a broker-dealer or bank) or, if you are a direct investor, by following the instructions included with paper Fund documents that have been mailed to you.
1
Dear Shareholders,
Thank you for your investment in the Destra Multi-Alternative Fund, formerly the Multi-Strategy Growth & Income Fund. On December 1st of 2018, Destra Capital Advisors LLC (“Destra”) became the advisor of the Fund. Pinhook Capital, LLC (“Pinhook”) (formerly known as LCM Investment Management LLC) has stayed on as the Fund’s manager and sub-advisor. Destra is proud to be partnered with Pinhook on the newly renamed Destra Multi-Alternative Fund.
When we first met the investment team at Pinhook in 2017, we were impressed with the sophistication and detailed process they had to managing investments across the alternative landscape. As we worked with them through 2018 on adopting the Fund to Destra’s business platform, we had the opportunity to observe first hand Pinhook’s capabilities in sourcing, analyzing, negotiating and navigating alternative investments. Based on these experiences, we are encouraged to be working with Pinhook and believe the future for the Destra Multi-Alternative Fund, now sub-advised by Pinhook, is a bright one.
The fiscal year for the Fund, which ended on February 28, 2019, was a turbulent one in the markets. The start of the fiscal year saw significant equity volatility return to the US market on a magnitude not seen for several years. In the summer and early fall of 2018 the markets turned eerily tranquil for both US equity and debt. By the fall of last year however, the markets had gone into near free-fall, with almost every equity, debt and even alternative asset class losing value through the 4th quarter of 2018 and most ending the year negative for the calendar year. As if to confound those looking for clear trends, the markets then returned to positive results in the last two months of the Fund’s fiscal year (January & February 2019) leaving the Fund essentially flat at -0.05% for the entire fiscal period and up 3.99% for the first two months of the new calendar year.
In the report that follows, you will find performance for your Fund through the end of the fiscal year, as well as a detailed commentary from the portfolio management team at Pinhook. This commentary describes in great detail the performance of the Fund, Pinhook’s continued efforts and progress in streamlining the legacy portfolio investments, and their outlook for the remainder of 2019 . We encourage you to read this document carefully, as it is the most detailed assessment of your investment each year and holds important information for you.
As noted at the beginning of this Shareholder Letter, those of us at Destra are excited to be a part of the Destra Multi-Alternative Fund and we look forward to communicating with you again soon.
Sincerely,
Robert A. Watson, CFP®
President of Destra Capital Advisors LLC
2
Pinhook Capital Manager Discussion & Analysis
Investment Environment
The Destra Multi-Alternative Fund (the “Fund”) seeks returns from capital appreciation and income with an emphasis on income generation. The interval fund structure allows the Fund to invest a substantial amount of its capital in institutional-quality, less liquid, longer-horizon individual investments, thereby capturing the illiquidity premiums embedded in these instruments as they mature, for the benefit of the Fund’s shareholders. This structure also fits well with Pinhook Capital LLC’s multi-step, multi-phase proprietary sourcing, research and due diligence process that can stretch over months or even years.
Fiscal 2019 (March 1, 2018 – February 28, 2019) was largely a tale of two periods – the first 10 months of the Fiscal Year characterized by a tightening Federal Reserve (“Fed”), rising interest rates and fundamental headwinds for many income-oriented alternative investments. And, the final two months (2019 YTD) characterized by a neutral Fed, stable-to-falling interest rates and fundamental tailwinds for income oriented alternative investments. Periods of intermittent heightened volatility in the fixed income and equity markets added stress to the environment. In our view, the markets were in part “adjusting” to both tighter monetary policy in the U.S. and the potential for other countries to follow suit. Additionally, as the year progressed, skirmishes over trade and tariffs put a damper on global growth expectations, at least some of which were evident in the economic data. This created further uncertainty which led to significant drawdowns in nearly all asset classes at various points during the period (most notably in February, October and December of 2018). Towards year-end 2018, as the markets melted down, the Fed reversed course and indicated that it was “done” raising rates for now (maybe for the foreseeable future). In fact, the US 10-Year yield started the 2018 fiscal year at 2.86% and finished at 2.72%; however, at its intra-year peak it reached as high as 3.24%.
The relatively wide variance in interest rates caused a significant disparity amongst alternative asset classes, particularly yield-oriented ones. Public REIT and BDC markets significantly outperformed broad equities, but bonds, MLPs, preferred securities, and most commodities did not. Interestingly, BDCs are generally considered to have low duration risk due to their mainly floating rate portfolios, while REITs often have high intrinsic durations (especially those with longer lease terms), yet both areas outperformed similarly over the fiscal year. Historically, higher volatility has generally been a positive for hedge funds, so their underperformance was also somewhat surprising.
Performance Discussion
For the fiscal year ended February 28, 2019, the Fund returned -0.05% on a total return basis. We are nearing completion of the multi-year plan that was put in place several years ago to position the portfolio for long-term success, which has included rationalizing and restructuring large portions of the portfolio. You will often hear us refer to the asset dichotomy within that restructuring as “institutional” versus “legacy” (mainly public non-traded REITs and BDCs) investments.
As part of this process, from time to time, we have made decisions that have led to a short-term impact on performance in the interest of meeting the Fund’s long-term objectives. Fiscal year ended February 28, 2019 featured a deliberate and sometimes opportunistic acceleration of certain dispositions and write-downs. Please keep in mind, the largest impairments were generally one-time events that resulted in the Fund’s permanent exit from those securities (meaning they are no longer ongoing concerns). As a
3
result, we feel strongly that the process has resulted in a higher quality, more sustainable portfolio going forward. Without these efforts, the Fund would likely have faced more significant negative impacts in the future. Although such events largely offset the continuing outperformance of the best institutional investments in the Fund during the fiscal year, we believe we have reached a significant inflection point in terms of expected relative contributions to performance going forward, driven by the absolute increase and the maturing stages of new and existing institutional investment allocations.
Due to the more unique multi-asset nature of the Fund, there are limited comparable indices from which to compare performance; however, we believe that the Morningstar Diversified Alternative Total Return Index (MDATR) and Morningstar US Closed-End Multialternative Category (MUCEM) are the most relevant at this time. During the fiscal year ended February 28, 2019, the MDATR Index returned 0.70%, and the MUCEM Category was up 1.12%. While the Fund slightly underperformed both the Index and category during the Fiscal year, during longer-term periods the Fund has considerably outperformed both the MDATR index and the MUCEM category.
It is worth noting that as with most alternative investment strategies, a major objective of the Fund is to reduce volatility relative to traditional asset classes; therefore, we believe valid performance comparisons must include risk-adjusted performance metrics and not just absolute and relative returns.
Portfolio Activity
As was noted previously, milestone progress was made during the fiscal year regarding our long-term concerted but disciplined efforts to streamline the original retail-oriented portfolio, while increasing the Fund’s allocations to superior institutional investments. Through that process of active management of the portfolio within this context alone, such decisions have had a meaningful impact on portfolio quality and a measurable positive impact on performance. We have had to manage this process carefully -- we are not interested in liquidity at any price and we painstakingly assess a wide variety of potential exit strategies to increase the probability of better outcomes. As this process has largely been executed, the portfolio of legacy positions has been substantially de-risked.
During Fiscal 2019, legacy assets exposure decreased from 34.3% to 16.7% of the Fund, while institutional investments increased from 45.8% to 64.3% of the Fund. As an example, within that data we trimmed off nearly all the Fund’s remaining non-traded BDC exposure, taking it from more than $15 million to less than $2.5 million, and did so at a discount to net asset value of less than 8%. Additionally, we have been able to place these proceeds in new accretive and attractive opportunities. The increasing effects of this can already be seen in the positive performance of the Fund during the first two months of calendar year 2019.
Four new illiquid institutional investments were approved and allocated to during the fiscal year, in addition to a variety of new liquid investments. These four illiquid investments include:
| ● | An allocation to a heavily oversubscribed and institutionally renowned private equity co-investment fund, as well as potential co-investment opportunities down the road. |
| ● | Seeding a newly launched asset-backed debt fund with meaningfully negotiated preferred terms, including no management or back-end fees of any kind and an equity interest in the Fund’s general partner. |
| ● | An allocation to a highly regarded institutional credit manager’s private CLO fund. |
4
| ● | Participating significantly in the private IPO of a new REIT seeded with a portfolio of properties at or below cost, fully occupied with long-term leases and annual escalators, with greater than 11% cap rates and in a unique niche arena where there are very few competitors. |
For both shared and idiosyncratic reasons, we are extremely excited about each of these new investments. We expect all four to increase in size during 2019 and beyond through capital calls, discretionary add-on investments, and certain predefined risk-mitigating hurdles being met by the managers.
Perspective & Outlook
By many measures, economic conditions and liquidity in the US remains favorable, although most expect the U.S. economy to slow from 2.9% growth in 2018 to 2.0-2.5% in 2019. We expect that some of the slowing we will see in the first half of 2019 relates to the transitory effects of the government shutdown and spending delays related to the uncertainties surrounding global trade. In short, with the Fed on the sidelines for now, we expect economic activity to accelerate in the second half of the year, but for that growth to remain slower than what was witnessed during the prior year. Sporadic heightened volatility, particularly surrounding headline news, should persist.
Going forward, the Fed’s new stance should serve to dampen volatility overall and keep interest rates low. In our opinion, this is a generally favorable environment for higher-yielding, asset-based investment classes in general. However, we believe that sector-specificity and being able to differentiate between upper- and lower-end performers will become increasingly important. In this light, identifying outsized return potentials will become increasingly difficult in the latter stages of the economic cycle. As such, we will continue to seek out niche opportunities via best-in-class managers focused on environments with lower correlations to the domestic economy, as well as situations where we can directly negotiate substantially preferred economic terms for the Fund and further develop our co-investment sourcing network.
5
| Destra Multi-Alternative Fund |
| PORTFOLIO REVIEW (Unaudited) |
| February 28, 2019 |
Composition of the Change in Value of a $10,000 Investment (since inception through February 28, 2019):
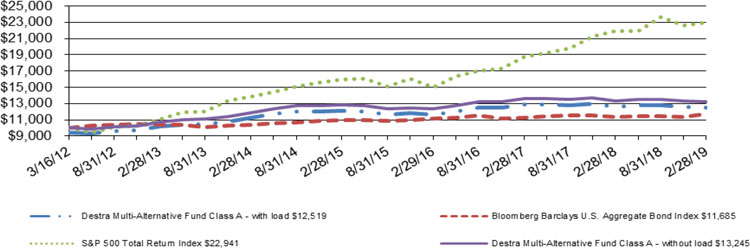
The Fund’s performance figures for the periods ended February 28, 2019, compared to its benchmarks:
| Annualized Since | |||||
| One | Annualized | Annualized | Annualized Since | Inception Class C, | |
| Total Returns as of February 28, 2019 | Year | Three Year | Five Year | Inception Class A* | Class I and Class L ** |
| Destra Mutli-Alternative Fund | |||||
| Class A: | |||||
| Without Load | (0.05)% | 2.34% | 2.12% | 4.11% | — |
| With Load | (5.79)% | 0.33% | 0.97% | 3.27% | — |
| Class C | (0.80)% | 1.58% | — | — | 0.51% |
| Class I | 0.17% | 2.77% | — | — | 1.54% |
| Class L: | |||||
| Without Load | (0.46)% | 1.83% | — | — | 0.77% |
| With Load | (2.45)% | 0.54% | — | — | (0.05)% |
| Bloomberg Barclays U.S. Aggregate Bond Index | 3.17% | 1.69% | 2.32% | 2.26% | 2.19% |
| S&P 500 Total Return Index | 4.68% | 15.28% | 10.67% | 12.68% | 9.90% |
| * | Class A commenced operations on March 16, 2012. |
| ** | Class C, Class I and Class L commenced operations on July 2, 2014. |
The Bloomberg Barclays U.S. Aggregate Bond Index is an unmanaged index which represents the U.S. investment-grade fixed-rate bond market (including government and corporate securities, mortgage pass-through securities and asset-backed securities). Investors cannot invest directly in an index or benchmark.
The S&P 500 Total Return Index is an unmanaged market capitalization-weighted index which is comprised of 500 of the largest U.S. domiciled companies and includes the reinvestment of all dividends. Investors cannot invest directly in an index or benchmark.
Past performance is not predictive of future results. The investment return and principal value of an investment will fluctuate. An investor’s shares, when redeemed, may be worth more or less than the original cost. Total return is calculated assuming reinvestment of all dividends and distributions. The Fund’s total gross annual operating expenses, per its prospectus (“Prospectus”) dated December 7, 2018 including underlying funds, are 3.20%, 3.96%, 3.00%, and 3.67% for Class A, Class C, Class I and Class L shares, respectively. The Fund’s total net annual operating expenses, after fee waivers and/or expense reimbursements, are 2.92%, 3.66%, 2.66%, and 3.41% for Class A, Class C, Class I and Class L shares, respectively, per the Prospectus. Class A and Class L shares of the Fund are subject to a maximum sales load imposed on purchases of 5.75% and 2.00%, respectively. Class C and Class I are not subject to a sales load. The chart does not reflect the deduction of taxes that a shareholder may have to pay on Fund distributions or the redemption of the Fund shares. For performance data current to the most recent month-end, please call 1-855-601-3841.
6
| Destra Multi-Alternative Fund |
| PORTFOLIO OF INVESTMENTS |
| February 28, 2019 |
| Shares | Security | Value | ||||||
| COMMON STOCKS - 5.50% | ||||||||
| ENTERTAINMENT - 0.38% | ||||||||
| 10,988 | Cedar Fair LP | $ | 582,364 | |||||
| LISTED BUSINESS DEVELOPMENT COMPANIES - 2.35% | ||||||||
| 25,194 | Ares Capital Corp. | 436,360 | ||||||
| 51,792 | BlackRock Capital Investment Corp. | 323,182 | ||||||
| 30,782 | FS Investment Corp. | 199,775 | ||||||
| 33,990 | Garrison Capital, Inc. | 254,245 | ||||||
| 24,505 | Golub Capital BDC, Inc. | 452,117 | ||||||
| 17,971 | New Mountain Finance Corp. | 248,898 | ||||||
| 27,634 | PennantPark Floating Rate Capital Ltd. | 362,006 | ||||||
| 27,852 | TPG Specialty Lending, Inc. | 560,939 | ||||||
| 27,527 | TriplePoint Venture Growth BDC Corp. | 350,143 | ||||||
| 32,516 | WhiteHorse Finance, Inc. | 438,966 | ||||||
| 3,626,631 | ||||||||
| PIPELINES - 0.28% | ||||||||
| 4,585 | Buckeye Partners LP | 144,336 | ||||||
| 19,618 | Enable Midstream Partners LP | 291,720 | ||||||
| 436,056 | ||||||||
| PRIVATE EQUITY - 1.34% | ||||||||
| 30,249 | Hercules Capital, Inc. | 423,486 | ||||||
| 14,289 | Icahn Enterprises LP | 1,061,530 | ||||||
| 32,700 | The Carlyle Group LP | 579,117 | ||||||
| 2,064,133 | ||||||||
| SEMICONDUCTORS - 1.15% | ||||||||
| 19,400 | NXP Semiconductors NV | 1,771,608 | ||||||
| TOTAL COMMON STOCKS | 8,480,792 | |||||||
| (Cost - $9,212,150) | ||||||||
| EXCHANGE TRADED FUND - 0.38% | ||||||||
| 12,500 | KraneShares CSI China Internet ETF | 585,500 | ||||||
| TOTAL EXCHANGE TRADED FUND | ||||||||
| (Cost - $510,730) | ||||||||
| EXCHANGE TRADED NOTE - 0.57% | ||||||||
| 100,000 | Credit Suisse X-Links Gold Shares Covered Call ETN | 874,000 | ||||||
| TOTAL EXCHANGE TRADED NOTE | ||||||||
| (Cost - $929,130) | ||||||||
| REAL ESTATE INVESTMENT TRUSTS - 45.33% | ||||||||
| LISTED REAL ESTATE INVESTMENT TRUSTS - 5.56% | �� | |||||||
| 40,800 | American Campus Communities, Inc. | 1,838,448 | ||||||
| 175,103 | American Finance Trust | 1,892,863 | ||||||
| 125,685 | Colony Credit Real Estate, Inc. | 2,190,690 | ||||||
| 20,000 | CoreCivic, Inc. | 423,600 | ||||||
| 19,440 | CyrusOne, Inc. | 968,890 | ||||||
| 45,000 | Granite Point Mortgage Trust, Inc. | 855,900 | ||||||
| 17,450 | The GEO Group, Inc. | 396,464 | ||||||
| TOTAL LISTED REAL ESTATE INVESTMENT TRUSTS | 8,566,855 | |||||||
| NON-LISTED REAL ESTATE INVESTMENT TRUSTS - 17.76% | ||||||||
| 228,122 | Carey Watermark Investors, Inc. # | 2,354,093 | ||||||
| 290,378 | Healthcare Trust, Inc. # | 6,132,652 | ||||||
| 456,540 | Hospitality Investor Trust, Inc. # * | 6,277,128 | ||||||
| 1,081,081 | NorthStar Health Care Income, Inc. # | 8,029,589 | ||||||
| 764,346 | N1 Liquidating Trust # | 557,973 | ||||||
| 388,931 | Steadfast Income REIT, Inc. # | 4,009,301 | ||||||
| TOTAL NON-LISTED REAL ESTATE INVESTMENT TRUSTS | 27,360,736 | |||||||
See accompanying notes to financial statements.
7
| Destra Multi-Alternative Fund |
| PORTFOLIO OF INVESTMENTS (Continued) |
| February 28, 2019 |
| Shares | Security | Value | ||||||
| PRIVATE REAL ESTATE INVESTMENT TRUSTS - 22.01% | ||||||||
| 7,354 | Clarion Lion Industrial Trust # | $ | 14,000,181 | |||||
| 661,928 | Cottonwood Residential, Inc. # | 12,411,150 | ||||||
| 375,000 | Treehouse Real Estate Investment Trust, Inc. # | 7,500,000 | ||||||
| TOTAL PRIVATE REAL ESTATE INVESTMENT TRUSTS | 33,911,331 | |||||||
| TOTAL REAL ESTATE INVESTMENT TRUSTS | 69,838,922 | |||||||
| (Cost - $58,327,086) | ||||||||
| NON-LISTED BUSINESS DEVELOPMENT COMPANIES - 1.58% | ||||||||
| 278,101 | Cion Investment Corp. #(Cost - $2,682,559) | 2,430,600 | ||||||
| PRIVATE BUSINESS DEVELOPMENT COMPANIES - 5.23% | ||||||||
| 534,081 | Owl Rock Capital Corp. #(Cost - $8,187,532) | 8,064,627 | ||||||
| PRIVATE INVESTMENT FUNDS - 29.10% | ||||||||
| 15 | AIM Infrastructure MLP Fund II LP # | 4,206,678 | ||||||
| 250 | Arboretum Core Asset Fund, L.P. # | 2,490,517 | ||||||
| 9,910 | Clarion Lion Properties Fund # | 14,890,765 | ||||||
| 2 | Levine Leichtman Capital Partners VI, LP # | 2,627,344 | ||||||
| 9,076 | Mosaic Real Estate Credit, LLC # | 10,147,147 | ||||||
| 3 | Ovation Alternative Income Fund # | 7,787,072 | ||||||
| 1 | Stepstone Capital Partners IV, L.P. # | 2,695,688 | ||||||
| TOTAL PRIVATE INVESTMENT FUNDS | 44,845,211 | |||||||
| (Cost - $43,736,124) | ||||||||
| CLOSED-END FUNDS - 9.54% | ||||||||
| 12,000 | Altaba, Inc. * | 895,080 | ||||||
| 92,641 | Apollo Tactical Income Fund, Inc. | 1,365,528 | ||||||
| 125,086 | BlackRock Debt Strategies Fund, Inc. | 1,348,427 | ||||||
| 114,153 | BlackRock Multi-Sector Income Trust | 1,912,063 | ||||||
| 58,623 | Blackstone/GSO Long-Short Credit Income Fund | 916,864 | ||||||
| 53,000 | Brookfield Real Assets Income Fund, Inc. | 1,131,550 | ||||||
| 98,042 | DoubleLine Income Solutions Fund | 1,937,310 | ||||||
| 40,000 | First Trust Energy Income and Growth Fund | 808,400 | ||||||
| 65,009 | Flaherty & Crumrine Dynamic Preferred and Income | 1,519,260 | ||||||
| 71,536 | John Hancock Premium Dividend Fund | 1,162,460 | ||||||
| 26,800 | Morgan Stanley China A Share Fund, Inc. | 610,504 | ||||||
| 78,964 | Western Asset Emerging Markets Debt Fund, Inc. | 1,097,600 | ||||||
| TOTAL CLOSED-END FUNDS | 14,705,046 | |||||||
| (Cost - $15,231,403) | ||||||||
| HEDGE FUND - 17.71% | ||||||||
| 24,744 | Collins Master Access Fund Ltd. # * | 27,294,495 | ||||||
| TOTAL HEDGE FUNDS | ||||||||
| (Cost - $25,002,167) | ||||||||
See accompanying notes to financial statements.
8
| Destra Multi-Alternative Fund |
| PORTFOLIO OF INVESTMENTS (Continued) |
| February 28, 2019 |
| Shares | Security | Value | ||||||
| SHORT-TERM INVESTMENT - 0.42% | ||||||||
| MONEY MARKET FUND - 0.42% | ||||||||
| 639,801 | Fidelity Investments Money Market Funds - Treasury Portfolio, Class I, 2.07% + | $ | 639,801 | |||||
| TOTAL SHORT-TERM INVESTMENT | ||||||||
| (Cost - $639,801) | ||||||||
| TOTAL INVESTMENTS - 115.36% | ||||||||
| (Cost - $164,458,682) | $ | 177,758,994 | ||||||
| LIABILITIES IN EXCESS OF OTHER ASSETS - (15.36)% | (23,662,675 | ) | ||||||
| NET ASSETS - 100.00 % | $ | 154,096,319 | ||||||
LLC - Limited Liability Company
LP - Limited Partnership
NV - Naamloze Vennootschap
REIT - Real Estate Investment Trust
| * | Non-income producing security. |
| # | Fair Value estimated using Fair Valuation Procedures adopted by the Board of Trustees. Total value of such securities is $143,907,000 or 93.40% of net assets. |
| + | Money market fund; interest rate reflects the seven-day effective yield on February 28, 2019. |
| Portfolio Composition as of February 28, 2019 | ||||
| Percent of Net Assets | ||||
| Private Investment Funds | 29.10 | % | ||
| Real Estate Investment Trusts | ||||
| Private Real Estate Investment Trusts | 22.01 | % | ||
| Non-Listed Real Estate Investment Trusts | 17.76 | % | ||
| Listed Real Estate Investment Trusts | 5.56 | % | ||
| Hedge Fund | 17.71 | % | ||
| Closed End Funds | 9.54 | % | ||
| Private Business Development Companies | 5.23 | % | ||
| Listed Business Development Companies | 2.35 | % | ||
| Non-Listed Business Development Companies | 1.58 | % | ||
| Private Equity | 1.34 | % | ||
| Semiconductors | 1.15 | % | ||
| Exchange Traded Note | 0.57 | % | ||
| Short-term Investment | 0.42 | % | ||
| Exchange Traded Fund | 0.38 | % | ||
| Entertainment | 0.38 | % | ||
| Pipelines | 0.28 | % | ||
| Liabilities In Excess Of Other Assets | (15.36 | )% | ||
| Net Assets | 100.00 | % | ||
See accompanying notes to financial statements.
9
| Destra Multi-Alternative Fund |
| STATEMENT OF ASSETS AND LIABILITIES |
| February 28, 2019 |
| Assets: | ||||
| Investments in Securities, at Value (identified cost $164,458,682) | $ | 177,758,994 | ||
| Dividends and Interest Receivable | 489,093 | |||
| Receivable for Fund Shares Sold | 20,509 | |||
| Prepaid Expenses and Other Assets | 42,230 | |||
| Total Assets | 178,310,826 | |||
| Liabilities: | ||||
| Line of Credit Payable | 23,800,000 | |||
| Interest Payable | 159,619 | |||
| Accrued Advisory Fees (1) | 138,266 | |||
| Distribution Fee Payable | 11,752 | |||
| Payable to Related Parties (1) | 28,340 | |||
| Shareholder Servicing Fees Payable | 26,150 | |||
| Other Accrued Expenses | 50,380 | |||
| Total Liabilities | 24,214,507 | |||
| Net Assets | $ | 154,096,319 | ||
| Composition of Net Assets: | ||||
| At February 28, 2019, Net Assets consisted of: | ||||
| Paid-in-Capital | $ | 148,992,974 | ||
| Accumulated earnings | 5,103,345 | |||
| Net Assets | $ | 154,096,319 |
| (1) | See Note 3. |
See accompanying notes to financial statements.
10
| Destra Multi-Alternative Fund |
| STATEMENT OF ASSETS AND LIABILITIES (Continued) |
| February 28, 2019 |
| Class A Shares: | ||||
| Net Assets | $ | 113,920,981 | ||
| Shares Outstanding (no par value; unlimited number of shares authorized) | 8,377,714 | |||
| Net Asset Value and Redemption Price Per Share * | $ | 13.60 | ||
| Offering Price Per Share ($13.60/0.9425) | $ | 14.43 | ||
| Class C Shares: | ||||
| Net Assets | $ | 16,451,492 | ||
| Shares Outstanding (no par value; unlimited number of shares authorized) | 1,248,431 | |||
| Net Asset Value, Offering Price and Redemption Price Per Share * | $ | 13.18 | ||
| Class I Shares: | ||||
| Net Assets | $ | 18,878,520 | ||
| Shares Outstanding (no par value; unlimited number of shares authorized) | 1,366,652 | |||
| Net Asset Value, Offering Price and Redemption Price Per Share * | $ | 13.81 | ||
| Class L Shares: | ||||
| Net Assets | $ | 4,845,326 | ||
| Shares Outstanding (no par value; unlimited number of shares authorized) | 363,832 | |||
| Net Asset Value and Redemption Price Per Share * | $ | 13.32 | ||
| Offering Price Per Share ($13.32/0.98) | $ | 13.59 | ||
| * | The Net Asset Value for each class will differ due primarily to the allocation of class specific expenses, such as distribution fees and shareholder servicing fees. |
See accompanying notes to financial statements.
11
| Destra Multi-Alternative Fund |
| STATEMENT OF OPERATIONS |
| For the Year Ended February 28, 2019 |
| Investment Income: | ||||
| Dividend Income | $ | 7,752,889 | ||
| Interest Income | 42,676 | |||
| Total Investment Income | 7,795,565 | |||
| Expenses: | ||||
| Investment Advisory Fees | 2,310,044 | |||
| Shareholder Servicing Fees: | ||||
| Class A | 335,384 | |||
| Class C | 53,337 | |||
| Class L | 14,323 | |||
| Distribution Fees: | ||||
| Class C | 160,011 | |||
| Class L | 28,646 | |||
| Interest Expense | 720,665 | |||
| Trustees’ Fees and Expenses | 163,947 | |||
| Administration Fees | 148,915 | |||
| Transfer Agent Fees | 136,076 | |||
| Legal Fees | 96,003 | |||
| Audit Fees | 80,131 | |||
| Printing Expense | 73,233 | |||
| Registration & Filing Fees | 67,126 | |||
| Fund Accounting Fees | 59,096 | |||
| Compliance Fees | 39,472 | |||
| Non 12b-1 Shareholder Servicing | 32,103 | |||
| Custody Fees | 13,669 | |||
| Insurance Expense | 11,603 | |||
| Miscellaneous Expenses | 1,784 | |||
| Total Expenses | 4,545,568 | |||
| Less: Fees Waived by Advisor | (327,457 | ) | ||
| Net Expenses | 4,218,111 | |||
| Net Investment Income | 3,577,454 | |||
| Net Realized and Unrealized Gain (Loss) on Investments: | ||||
| Net Realized Gain (Loss) on: | ||||
| Investments | (6,664,232 | ) | ||
| Distributions of realized gain from underlying investments | 88,473 | |||
| Total Net Realized Loss | (6,575,759 | ) | ||
| Net Change in Unrealized Appreciation on: | ||||
| Investments | 2,920,497 | |||
| Total Net Change in Unrealized Appreciation | 2,920,497 | |||
| Net Realized and Unrealized Loss on Investments | (3,655,262 | ) | ||
| Net Decrease in Net Assets Resulting From Operations | $ | (77,808 | ) |
See accompanying notes to financial statements.
12
| Destra Multi-Alternative Fund |
| STATEMENTS OF CHANGES IN NET ASSETS |
| For the Year | For the Year | |||||||
| Ended | Ended | |||||||
| February 28, 2019 | February 28, 2018 | |||||||
| Operations: | ||||||||
| Net Investment Income | $ | 3,577,454 | $ | 2,679,368 | ||||
| Net Realized Gain (Loss) on Investments | (6,664,232 | ) | 3,712,686 | |||||
| Distributions of Realized Gain from | ||||||||
| Underlying Investments | 88,473 | 55,588 | ||||||
| Net Change in Unrealized Appreciation | ||||||||
| (Depreciation) on Investments | 2,920,497 | (10,476,098 | ) | |||||
| Net Decrease in Net Assets | ||||||||
| Resulting From Operations | (77,808 | ) | (4,028,456 | ) | ||||
| Distributions to Shareholders From: | ||||||||
| Total distributions paid * | ||||||||
| Class A | (534,638 | ) | — | |||||
| Class C | (90,458 | ) | — | |||||
| Class I | (20,369 | ) | — | |||||
| Class L | (23,785 | ) | — | |||||
| (669,250 | ) | — | ||||||
| Net Investment Income | ||||||||
| Class A | — | (2,478,355 | ) | |||||
| Class C | — | (374,832 | ) | |||||
| Class I | — | (58,872 | ) | |||||
| Class L | — | (133,920 | ) | |||||
| Total from Net Investment Income | — | (3,045,979 | ) | |||||
| Return of Capital | ||||||||
| Class A | (7,383,979 | ) | (7,422,228 | ) | ||||
| Class C | (1,162,373 | ) | (1,192,608 | ) | ||||
| Class I | (608,511 | ) | (214,883 | ) | ||||
| Class L | (313,618 | ) | (352,090 | ) | ||||
| Total from Return of Capital | (9,468,481 | ) | (9,181,809 | ) | ||||
| Total Distributions to Shareholders | $ | (10,137,731 | ) | $ | (12,227,788 | ) | ||
| * | Distributions from net investment income and net realized capital gains are combined for the year ended February 28, 2019. See “New Accounting Pronouncements” in the Notes to Financial Statements for more information. The dividends and distributiions to shareholders for the year ended February 28, 2018 have not been reclassified to conform to the current year presentation. |
See accompanying notes to financial statements.
13
| Destra Multi-Alternative Fund |
| STATEMENTS OF CHANGES IN NET ASSETS (Continued) |
| For the Year | For the Year | |||||||
| Ended | Ended | |||||||
| February 28, 2019 | February 28, 2018 | |||||||
| From Shares of Beneficial Interest: | ||||||||
| Class A Shares: | ||||||||
| Proceeds from Shares Issued (278,673 and 741,421 shares, respectively) | $ | 3,962,542 | $ | 11,450,602 | ||||
| Distributions Reinvested (293,832 and 375,221 shares, respectively) | 4,140,233 | 5,720,058 | ||||||
| Cost of Shares Redeemed (1,989,225 and 1,375,715 shares, respectively) | (28,125,531 | ) | (21,100,354 | ) | ||||
| Proceeds from Shares Transferred (536 and 1,364 shares, respectively) | 7,578 | 21,262 | ||||||
| Cost of Shares Transferred (619,661 and 61,827 shares, respectively) | (8,704,497 | ) | (910,352 | ) | ||||
| Total From Capital Transactions: Class A | (28,719,675 | ) | (4,818,784 | ) | ||||
| Class C Shares: | ||||||||
| Proceeds from Shares Issued (93,295 and 314,032 shares, respectively) | 1,307,718 | 4,749,354 | ||||||
| Distributions Reinvested (51,938 and 59,771 shares, respectively) | 711,966 | 892,131 | ||||||
| Cost of Shares Redeemed (360,011 and 206,054 shares, respectively) | (4,972,544 | ) | (3,086,017 | ) | ||||
| Cost of Shares Transferred (278,310 and 20,835 shares, respectively) | (3,765,310 | ) | (310,920 | ) | ||||
| Total From Capital Transactions: Class C | (6,718,170 | ) | 2,244,548 | |||||
| Class I Shares: | ||||||||
| Proceeds from Shares Issued (282,440 and 181,501 shares, respectively) | 4,022,642 | 2,814,493 | ||||||
| Distributions Reinvested (17,804 and 6,832 shares, respectively) | 250,790 | 104,979 | ||||||
| Cost of Shares Redeemed (197,947 and 140,629 shares, respectively) | (2,854,486 | ) | (2,174,192 | ) | ||||
| Proceeds from Shares Transferred (895,872 and 79,844 shares, respectively) | 12,734,148 | 1,200,010 | ||||||
| Total From Capital Transactions: Class I | 14,153,094 | 1,945,290 | ||||||
| Class L Shares: | ||||||||
| Proceeds from Shares Issued (9,752 and 20,138 shares, respectively) | 134,721 | 308,409 | ||||||
| Distributions Reinvested (12,798 and 19,046 shares, respectively) | 177,046 | 286,942 | ||||||
| Cost of Shares Redeemed (100,927 and 169,591 shares, respectively) | (1,411,323 | ) | (2,571,832 | ) | ||||
| Cost of Shares Transferred (20,225 and 0 shares, respectively) | (271,919 | ) | — | |||||
| Total From Capital Transactions: Class L | (1,371,475 | ) | (1,976,481 | ) | ||||
| Total Decrease in Net Assets from Shares of Beneficial Interest: | (22,656,226 | ) | (2,605,427 | ) | ||||
| Total Decrease in Net Assets | (32,871,765 | ) | (18,861,671 | ) | ||||
| Net Assets: | ||||||||
| Beginning of Year | 186,968,084 | 205,829,755 | ||||||
| End of Year ** | $ | 154,096,319 | $ | 186,968,084 | ||||
| ** | Net Assets - End of Year includes accumulated net investment income of $1,307,764 as of February 28, 2018. |
See accompanying notes to financial statements.
14
| Destra Multi-Alternative Fund |
| STATEMENT OF CASH FLOWS |
| For the Year Ended February 28, 2019 |
| Cash flows from operating activities: | ||||
| Net decrease in net assets resulting from operations | $ | (77,808 | ) | |
| Adjustments to reconcile net increase in net assets resulting from operations to net cash provided by operating activities: | ||||
| Purchases of investments | (36,067,105 | ) | ||
| Proceeds from sales | 51,164,049 | |||
| Purchases of short term investments, net | 69,318 | |||
| Return of capital from investments | 2,833,058 | |||
| Net realized loss from investments | 6,664,232 | |||
| Net change in unrealized appreciation from investments | (2,920,497 | ) | ||
| Changes in assets and liabilities (Increase)/Decrease in assets: | ||||
| Dividends and Interest Receivable | 2,416,826 | |||
| Receivable for Securities Sold | 304,404 | |||
| Receivable for Fund Shares Sold | 61,408 | |||
| Prepaid Expenses and Other Assets | (3,498 | ) | ||
| Increase/(Decrease) in liabilities: | ||||
| Accrued Advisory Fees | 59,895 | |||
| Interest Payable | 110,464 | |||
| Shareholder Servicing Fee | (9,112 | ) | ||
| Payable to Related Parties | (4,318 | ) | ||
| Distribution Fee Payable | (16,015 | ) | ||
| Other Accrued Expenses Payable | (91,344 | ) | ||
| Net cash provided by operating activities | 24,493,957 | |||
| Cash flows from financing activities: | ||||
| Gross additions to line of credit | 36,000,000 | |||
| Gross payments of principal to line of credit | (27,700,000 | ) | ||
| Proceeds from shares sold | 9,427,623 | |||
| Payment on shares redeemed | (37,363,884 | ) | ||
| Cash distributions paid | (4,857,696 | ) | ||
| Net cash used in financing activities | (24,493,957 | ) | ||
| Net increase in cash | — | |||
| Cash at beginning of year | — | |||
| Cash at end of year | $ | — | ||
| Supplemental disclosure of non-cash activity: | ||||
| Noncash financing activities not including herein consists of: | ||||
| Reinvestment of dividends | $ | 5,280,035 | ||
| Interest Paid | $ | 610,201 |
See accompanying notes to financial statements.
15
| Destra Multi-Alternative Fund - Class A |
| FINANCIAL HIGHLIGHTS |
The table below sets forth financial data for one share of beneficial interest outstanding throughout each year presented.
| For the Year | For the Year | For the Year | For the Year | For the Year | ||||||||||||||||
| Ended | Ended | Ended | Ended | Ended | ||||||||||||||||
| February 28, 2019 | February 28, 2018 | February 28, 2017 | February 29, 2016 | February 28, 2015 | ||||||||||||||||
| Net Asset Value, Beginning of Year | $ | 14.45 | $ | 15.67 | $ | 15.20 | $ | 16.74 | $ | 16.51 | ||||||||||
| From Operations: | ||||||||||||||||||||
| Net investment income (a) | 0.32 | 0.22 | 0.35 | 0.46 | 0.41 | |||||||||||||||
| Net gain (loss) on investments (both realized and unrealized) | (0.32 | ) | (0.52 | ) | 1.06 | (1.04 | ) | 0.80 | ||||||||||||
| Total from Operations | — | (0.30 | ) | 1.41 | (0.58 | ) | 1.21 | |||||||||||||
| Less Distributions: | ||||||||||||||||||||
| From net investment income | (0.05 | ) | (0.23 | ) | (0.29 | ) | (0.40 | ) | (0.40 | ) | ||||||||||
| From net realized gains on investments | — | — | — | — | (0.37 | ) | ||||||||||||||
| From paid in capital | (0.80 | ) | (0.69 | ) | (0.65 | ) | (0.56 | ) | (0.21 | ) | ||||||||||
| Total Distributions | (0.85 | ) | (0.92 | ) | (0.94 | ) | (0.96 | ) | (0.98 | ) | ||||||||||
| Net Asset Value, End of Year | $ | 13.60 | $ | 14.45 | $ | 15.67 | $ | 15.20 | $ | 16.74 | ||||||||||
| Total Return (b) | (0.05 | )% | (2.56 | )% | 9.48 | % (h) | (3.57 | )% (h) | 7.46 | % | ||||||||||
| Ratios/Supplemental Data | ||||||||||||||||||||
| Net assets, end of year (in 000’s) | $ | 113,921 | $ | 150,428 | $ | 168,232 | $ | 157,986 | $ | 178,502 | ||||||||||
| Ratio to average net assets: | ||||||||||||||||||||
| Expenses, Gross (c)(f) | 2.56 | % | 1.99 | % | 1.66 | % | 1.58 | % | 1.55 | % | ||||||||||
| Expenses, Net of Reimbursement/Recapture (c)(f) | 2.37 | % | 1.80 | % | 1.66 | % | 1.58 | % | 1.61 | % (e) | ||||||||||
| Net investment income, Net of Reimbursement/Recapture (c)(g) | 2.25 | % | 1.42 | % | 2.25 | % | 2.87 | % | 2.43 | % | ||||||||||
| Ratio to average net assets (excluding interest expense): | ||||||||||||||||||||
| Expenses, Gross (c)(f) | 2.14 | % | 1.96 | % | 1.57 | % | 1.49 | % | 1.55 | % | ||||||||||
| Expenses, Net of Reimbursement/Recapture (c)(f) | 1.95 | % | 1.77 | % | 1.57 | % | 1.49 | % | 1.61 | % (e) | ||||||||||
| Portfolio turnover rate | 19 | % | 27 | % | 13 | % | 21 | % | 49 | % | ||||||||||
| (a) | Per share amounts are calculated using the average shares method, which more appropriately presents the per share data for the period. |
| (b) | Total returns are historical in nature and assume changes in share price, reinvestment of dividends and capital gains distributions, if any and exclude the effects of sales loads. Total returns for periods less than one year are not annualized. |
| (c) | Annualized for periods less than one year. |
| (d) | Not annualized. |
| (e) | Such ratio includes the Advisor’s recapture of waived/reimbursed fees from prior periods. |
| (f) | Does not include the expenses of the investment companies in which the Fund invests. |
| (g) | The recognition of investment income is affected by the timing and declaration of dividends by the underlying investment companies in which the Fund invests. |
| (h) | Includes adjustments in accordance with accounting principles generally accepted in the United States and, consequently, the net asset value for financial reporting purposes and the returns based upon those net asset values may differ from the net asset values and returns for shareholder transactions. |
See accompanying notes to financial statements.
16
| Destra Multi-Alternative Fund - Class C |
| FINANCIAL HIGHLIGHTS |
The table below sets forth financial data for one share of beneficial interest outstanding throughout each period presented.
| For the Year | For the Year | For the Year | For the Year | For the Period | ||||||||||||||||
| Ended | Ended | Ended | Ended | Ended | ||||||||||||||||
| February 28, 2019 | February 28, 2018 | February 28, 2017 | February 29, 2016 | February 28, 2015 * | ||||||||||||||||
| Net Asset Value, Beginning of Period | $ | 14.11 | $ | 15.42 | $ | 15.06 | $ | 16.71 | $ | 17.02 | ||||||||||
| From Operations: | ||||||||||||||||||||
| Net investment income (a) | 0.22 | 0.10 | 0.23 | 0.33 | 0.18 | |||||||||||||||
| Net gain (loss) on investments (both realized and unrealized) | (0.33 | ) | (0.51 | ) | 1.06 | (1.03 | ) | 0.16 | ||||||||||||
| Total from Operations | (0.11 | ) | (0.41 | ) | 1.29 | (0.70 | ) | 0.34 | ||||||||||||
| Less Distributions: | ||||||||||||||||||||
| From net investment income | (0.05 | ) | (0.22 | ) | (0.28 | ) | (0.39 | ) | (0.12 | ) | ||||||||||
| From net realized gains on investments | — | — | — | — | (0.35 | ) | ||||||||||||||
| From return of capital | (0.77 | ) | (0.68 | ) | (0.65 | ) | (0.56 | ) | (0.18 | ) | ||||||||||
| Total Distributions | (0.82 | ) | (0.90 | ) | (0.93 | ) | (0.95 | ) | (0.65 | ) | ||||||||||
| Net Asset Value, End of Period | $ | 13.18 | $ | 14.11 | $ | 15.42 | $ | 15.06 | $ | 16.71 | ||||||||||
| Total Return (b) | (0.80 | )% | (3.32 | )% | 8.73 | % (g) | (4.28 | )% (g) | 2.04 | % (d) | ||||||||||
| Ratios/Supplemental Data | ||||||||||||||||||||
| Net assets, end of period (in 000’s) | $ | 16,451 | $ | 24,575 | $ | 24,585 | $ | 19,046 | $ | 10,926 | ||||||||||
| Ratio to average net assets: | ||||||||||||||||||||
| Expenses, Gross (c)(e) | 3.31 | % | 2.75 | % | 2.40 | % | 2.33 | % | 2.30 | % | ||||||||||
| Expenses, Net of Reimbursement/Recapture (c)(e) | 3.12 | % | 2.55 | % | 2.40 | % | 2.33 | % | 2.30 | % | ||||||||||
| Net investment income (c)(f) | 1.58 | % | 0.68 | % | 1.48 | % | 2.12 | % | 1.76 | % | ||||||||||
| Ratio to average net assets (excluding interest expense) | ||||||||||||||||||||
| Expenses, Gross (c)(e) | 2.89 | % | 2.72 | % | 2.33 | % | 2.24 | % | 2.30 | % | ||||||||||
| Expenses, Net of Reimbursement/Recapture (c)(e) | 2.70 | % | 2.53 | % | 2.33 | % | 2.24 | % | 2.30 | % | ||||||||||
| Portfolio turnover rate | 19 | % | 27 | % | 13 | % | 21 | % | 49 | % (d) | ||||||||||
| * | Class C commenced operations on July 2, 2014. |
| (a) | Per share amounts are calculated using the average shares method, which more appropriately presents the per share data for the period. |
| (b) | Total returns are historical in nature and assume changes in share price, reinvestment of dividends and capital gains distributions, if any. Total returns for periods less than one year are not annualized. |
| (c) | Annualized for periods less than one year. |
| (d) | Not annualized. |
| (e) | Does not include the expenses of the investment companies in which the Fund invests. |
| (f) | The recognition of investment income is affected by the timing and declaration of dividends by the underlying investment companies in which the Fund invests. |
| (g) | Includes adjustments in accordance with accounting principles generally accepted in the United States and, consequently, the net asset value for financial reporting purposes and the returns based upon those net asset values may differ from the net asset values and returns for shareholder transactions. |
See accompanying notes to financial statements.
17
| Destra Multi-Alternative Fund - Class I |
| FINANCIAL HIGHLIGHTS |
The table below sets forth financial data for one share of beneficial interest outstanding throughout each period presented.
| For the Year | For the Year | For the Year | For the Year | For the Period | ||||||||||||||||
| Ended | Ended | Ended | Ended | Ended | ||||||||||||||||
| February 28, 2019 | February 28, 2018 | February 28, 2017 | February 29, 2016 | February 28, 2015 * | ||||||||||||||||
| Net Asset Value, Beginning of Period | $ | 14.64 | $ | 15.86 | $ | 15.24 | $ | 16.75 | $ | 17.02 | ||||||||||
| From Operations: | ||||||||||||||||||||
| Net investment income (a) | 0.18 | 0.25 | 0.42 | 0.48 | 0.30 | |||||||||||||||
| Net gain (loss) on investments (both realized and unrealized) | (0.15 | ) | (0.54 | ) | 1.15 | (1.03 | ) | 0.09 | ||||||||||||
| Total from Operations | 0.03 | (0.29 | ) | 1.57 | (0.55 | ) | 0.39 | |||||||||||||
| Less Distributions: | ||||||||||||||||||||
| From net investment income | (0.05 | ) | (0.23 | ) | (0.30 | ) | (0.40 | ) | (0.06 | ) | ||||||||||
| From net realized gains on investments | — | — | — | — | (0.37 | ) | ||||||||||||||
| From return of capital | (0.81 | ) | (0.70 | ) | (0.65 | ) | (0.56 | ) | (0.23 | ) | ||||||||||
| Total Distributions | (0.86 | ) | (0.93 | ) | (0.95 | ) | (0.96 | ) | (0.66 | ) | ||||||||||
| Net Asset Value, End of Period | $ | 13.81 | $ | 14.64 | $ | 15.86 | $ | 15.24 | $ | 16.75 | ||||||||||
| Total Return (b) | 0.17 | % | (2.39 | )% | 10.52 | % (g) | (3.37 | )% (g) | 2.37 | % (d) | ||||||||||
| Ratios/Supplemental Data | ||||||||||||||||||||
| Net assets, end of period (in 000’s) | $ | 18,879 | $ | 5,395 | $ | 3,820 | $ | 7,806 | $ | 1,185 | ||||||||||
| Ratio to average net assets: | ||||||||||||||||||||
| Expenses, Gross (c)(e) | 2.37 | % | 1.79 | % | 1.39 | % | 1.33 | % | 1.30 | % | ||||||||||
| Expenses, Net of Reimbursement/Recapture (c)(e) | 2.18 | % | 1.57 | % | 1.39 | % | 1.33 | % | 1.30 | % | ||||||||||
| Net investment income (c)(f) | 1.25 | % | 1.64 | % | 2.67 | % | 3.09 | % | 2.80 | % | ||||||||||
| Ratio to average net assets (excluding interest expense) | ||||||||||||||||||||
| Expenses, Gross (c)(e) | 1.89 | % | 1.76 | % | 1.29 | % | 1.24 | % | 1.30 | % | ||||||||||
| Expenses, Net of Reimbursement/Recapture (c)(e) | 1.70 | % | 1.55 | % | 1.29 | % | 1.24 | % | 1.30 | % | ||||||||||
| Portfolio turnover rate | 19 | % | 27 | % | 13 | % | 21 | % | 49 | % (d) | ||||||||||
| * | Class I commenced operations on July 2, 2014. |
| (a) | Per share amounts are calculated using the average shares method, which more appropriately presents the per share data for the period. |
| (b) | Total returns are historical in nature and assume changes in share price, reinvestment of dividends and capital gains distributions, if any. Total returns for periods less than one year are not annualized. |
| (c) | Annualized for periods less than one year. |
| (d) | Not annualized. |
| (e) | Does not include the expenses of the investment companies in which the Fund invests. |
| (f) | The recognition of investment income is affected by the timing and declaration of dividends by the underlying investment companies in which the Fund invests. |
| (g) | Includes adjustments in accordance with accounting principles generally accepted in the United States and, consequently, the net asset value for financial reporting purposes and the returns based upon those net asset values may differ from the net asset values and returns for shareholder transactions. |
See accompanying notes to financial statements.
18
| Destra Multi-Alternative Fund - Class L |
| FINANCIAL HIGHLIGHTS |
The table below sets forth financial data for one share of beneficial interest outstanding throughout each period presented.
| For the Year | For the Year | For the Year | For the Year | For the Period | ||||||||||||||||
| Ended | Ended | Ended | Ended | Ended | ||||||||||||||||
| February 28, 2019 | February 28, 2018 | February 28, 2017 | February 29, 2016 | February 28, 2015 * | ||||||||||||||||
| Net Asset Value, Beginning of Period | $ | 14.21 | $ | 15.51 | $ | 15.11 | $ | 16.72 | $ | 17.02 | ||||||||||
| From Operations: | ||||||||||||||||||||
| Net investment income (a) | 0.25 | 0.14 | 0.27 | 0.37 | 0.20 | |||||||||||||||
| Net gain (loss) on investments (both realized and unrealized) | (0.31 | ) | (0.53 | ) | 1.06 | (1.03 | ) | 0.17 | ||||||||||||
| Total from Operations | (0.06 | ) | (0.39 | ) | 1.33 | (0.66 | ) | 0.37 | ||||||||||||
| Less Distributions: | ||||||||||||||||||||
| From net investment income | (0.05 | ) | (0.23 | ) | (0.28 | ) | (0.39 | ) | (0.13 | ) | ||||||||||
| From net realized gains on investments | — | — | — | — | (0.35 | ) | ||||||||||||||
| From return of capital | (0.78 | ) | (0.68 | ) | (0.65 | ) | (0.56 | ) | (0.19 | ) | ||||||||||
| Total Distributions | (0.83 | ) | (0.91 | ) | (0.93 | ) | (0.95 | ) | (0.67 | ) | ||||||||||
| Net Asset Value, End of Period | $ | 13.32 | $ | 14.21 | $ | 15.51 | $ | 15.11 | $ | 16.72 | ||||||||||
| Total Return (b) | (0.46 | )% | (3.13 | )% | 9.01 | % (g) | (4.03 | )% (g) | 2.25 | % (d) | ||||||||||
| Ratios/Supplemental Data | ||||||||||||||||||||
| Net assets, end of period (in 000’s) | $ | 4,845 | $ | 6,570 | $ | 9,192 | $ | 9,143 | $ | 8,356 | ||||||||||
| Ratio to average net assets: | ||||||||||||||||||||
| Expenses, Gross (c)(e) | 3.06 | % | 2.46 | % | 2.16 | % | 2.08 | % | 2.05 | % | ||||||||||
| Expenses, Net of Reimbursement/Recapture (c)(e) | 2.87 | % | 2.28 | % | 2.16 | % | 2.08 | % | 2.05 | % | ||||||||||
| Net investment income (c)(f) | 1.78 | % | 0.90 | % | 1.77 | % | 2.37 | % | 2.00 | % | ||||||||||
| Ratio to average net assets (excluding interest expense) | ||||||||||||||||||||
| Expenses, Gross (c)(e) | 2.64 | % | 2.43 | % | 2.07 | % | 1.99 | % | 2.05 | % | ||||||||||
| Expenses, Net of Reimbursement/Recapture (c)(e) | 2.45 | % | 2.26 | % | 2.07 | % | 1.99 | % | 2.05 | % | ||||||||||
| Portfolio turnover rate | 19 | % | 27 | % | 13 | % | 21 | % | 49 | % (d) | ||||||||||
| * | Class L commenced operations on July 2, 2014. |
| (a) | Per share amounts are calculated using the average shares method, which more appropriately presents the per share data for the period. |
| (b) | Total returns are historical in nature and assume changes in share price, reinvestment of dividends and capital gains distributions, if any and exclude the effects of sales loads. Total returns for periods less than one year are not annualized. |
| (c) | Annualized for periods less than one year. |
| (d) | Not annualized. |
| (e) | Does not include the expenses of the investment companies in which the Fund invests. |
| (f) | The recognition of investment income is affected by the timing and declaration of dividends by the underlying investment companies in which the Fund invests. |
| (g) | Includes adjustments in accordance with accounting principles generally accepted in the United States and, consequently, the net asset value for financial reporting purposes and the returns based upon those net asset values may differ from the net asset values and returns for shareholder transactions. |
See accompanying notes to financial statements.
19
| Destra Multi-Alternative Fund |
| NOTES TO FINANCIAL STATEMENTS |
| February 28, 2019 |
| 1. | ORGANIZATION |
Destra Multi-Alternative Fund (“the Fund”), formerly known as Multi-Strategy Growth & Income Fund, was organized as a Delaware statutory trust on June 3, 2011, is registered under the Investment Company Act of 1940, as amended, (the “1940 Act”), and is a non-diversified, closed-end management investment company that operates as an interval fund with a continuous offering of Fund shares. The investment objective of the Fund is to seek returns from capital appreciation and income with an emphasis on income generation. The Fund pursues its investment objective by investing primarily in the income-producing securities of real estate investment trusts (“REITs”) and alternative investment funds, as well as common stocks and structured notes, notes, bonds and asset-backed securities.
The Fund currently offers Class A, Class C, Class I and Class L shares. Class A shares commenced operations on March 16, 2012; Class C, Class I and Class L shares commenced operations on July 2, 2014. Class A and Class L shares are offered at net asset value (“NAV”) plus a maximum sales charge of 5.75% and 2.00%, respectively. Class C and Class I shares are offered at net asset value. Each class represents an interest in the same assets of the Fund and classes are identical except for differences in their sales charge structures and ongoing service and distribution charges. All classes of shares have equal voting privileges except that each class has exclusive voting rights with respect to its service and/or distribution plans. The Fund’s income, expenses (other than class-specific distribution fees) and realized and unrealized gains and losses are allocated proportionately each day based upon the relative net assets of each class.
| 2. | SUMMARY OF SIGNIFICANT ACCOUNTING POLICIES |
The following is a summary of significant accounting policies followed by the Fund in preparation of its financial statements. These policies are in conformity with accounting principles generally accepted in the United States of America (“GAAP”). The preparation of financial statements requires management to make estimates and assumptions that affect the reported amounts of assets and liabilities and disclosure of contingent assets and liabilities at the date of the financial statements and the reported amounts of income and expenses for the period. Actual results could differ from those estimates. The Fund is an investment company and accordingly follows the investment company accounting and reporting guidance of the Financial Accounting Standards Board (“FASB”) Accounting Standard Codification Topic 946 “Financial Services – Investment Companies” including FASB Accounting Standard Update “ASU” 2013-08.
Security Valuation– Securities listed on an exchange are valued at the last reported sale price at the close of the regular trading session of the exchange on the business day the value is being determined, or in the case of securities listed on NASDAQ, at the NASDAQ Official Closing Price (“NOCP”). In the absence of a sale, such securities shall be valued at the mean of the closing bid and asked prices on the day of valuation. Short-term investments that mature in 60 days or less may be valued at amortized cost, provided such valuations represent fair value.
When price quotations for certain securities are not readily available, or if the available quotations are not believed to be reflective of market value by the Advisor (defined below), those securities will be valued at “fair value” as determined in good faith by the Fair Valuation Committee using procedures adopted by and under the supervision of the Fund’s Board of Trustees (the “Board”). There can be no assurance that the Fund could purchase or sell a portfolio security at the price used to calculate the Fund’s NAV.
Fair valuation procedures may be used to value a substantial portion of the assets of the Fund. The Fund may use the fair value of a security to calculate its NAV when, for example, (1) a portfolio security is not traded in a public market or the principal market in which the security trades is closed, (2) trading in a portfolio security is suspended and not resumed prior to the normal market close, (3) a portfolio security is not traded in significant volume for a
20
| Destra Multi-Alternative Fund |
| NOTES TO FINANCIAL STATEMENTS (Continued) |
| February 28, 2019 |
substantial period, or (4) the Advisor determines that the quotation or price for a portfolio security provided by a broker-dealer or independent pricing service is inaccurate.
The “fair value” of securities may be difficult to determine and thus judgment plays a greater role in the valuation process. The fair valuation methodology may include or consider the following guidelines, as appropriate: (1) evaluation of all relevant factors, including but not limited to, pricing history, current market level, supply and demand of the respective security; (2) comparison to the values and current pricing of securities that have comparable characteristics; (3) knowledge of historical market information with respect to the security; (4) other factors relevant to the security which would include, but would not be limited to, duration, yield, fundamental analytical data, the Treasury yield curve, and credit quality. Calls with the management teams of these securities are completed to gain further insight that might not be as evident through the reading of published reports or filings.
Often, significant back-testing or historical data analysis is employed to gain increased, tangible perspective into ways to enhance the accuracy of either existing, or potentially new fair valuation approaches. This also ensures that recent enhancements or additional methodologies are leading to more accurate valuations.
Ongoing “logic checks” and evaluations of underlying portfolios are used to identify potential disconnects between current methodologies and expected results.
The values assigned to fair valued investments are based on available information and do not necessarily represent amounts that might ultimately be realized, since such amounts depend on future developments inherent in long-term investments. Changes in the fair valuation of portfolio securities may be less frequent and of greater magnitude than changes in the price of portfolio securities valued at their last sale price, by an independent pricing service, or based on market quotations. Imprecision in estimating fair value can also impact the amount of unrealized appreciation or depreciation recorded for a particular portfolio security and differences in the assumptions used could result in a different determination of fair value, and those differences could be material.
The Fund invests in some securities which are not traded and the Board’s Valuation Committee has established a methodology for the fair valuation of each type of security. Non-listed REITs that are in the public offering period (or start-up phase) are valued at cost according to management’s fair valuation methodology unless the REIT issues an updated valuation. The Fund generally purchases REITs at NAV or without a commission. However, startup REITs amortize a significant portion of their start-up costs and therefore, potentially carry additional risks that may impact valuation should the REIT be unable to raise sufficient capital and execute their business plan. As such, start-up REITs pose a greater risk than seasoned REITs because if they encounter going concern issues, they may see significant deviation in value from the fair value, cost basis approach as represented. Management is not aware of any information which would cause a change in cost basis valuation methodology currently being utilized for non-traded REITs in their offering period. Non-traded REITs that are in their offering period are generally categorized as Level 3 in the fair value hierarchy. Once a REIT closes to new investors, the Fund values the security based on the movement of an appropriate market index or a similar security that is publicly traded until the REIT issues an updated market valuation. Non-traded REITs that have closed to new investors are generally categorized in Level 2 of the fair value hierarchy, due to the significance of the effect of the application of the movement of the market index on the overall fair valuation of the REIT. Other non-traded private investments are monitored for any independent audits of the investment or impairments reported on the potential value of the investment. For non-traded private investments, including private real estate investment trusts and non-traded partnership funds, that are themselves treated as investment companies under GAAP, the Fund follows the guidance in GAAP that allows, as practical expedient, the Fund to value such investments at their reported NAV per share (or if not unitized, at an equivalent percentage of the capital of the investee entity). Such investments typically provide an updated NAV or its equivalent on a quarterly basis. The Valuation Committee meets frequently to discuss the valuation methodology and will adjust the value of a security if there is a public update to such valuation.
21
| Destra Multi-Alternative Fund |
| NOTES TO FINANCIAL STATEMENTS (Continued) |
| February 28, 2019 |
Non-listed business development companies provide quarterly fair value pricing which is used as an indicator of the valuation for the Fund. If the value significantly fluctuates, the Advisor will provide an updated price. If a significant event occurs that causes a large change in price, the Fair Valuation Committee will call a meeting to evaluate the fair value. Non-traded business development companies are categorized as Level 2 in the fair value hierarchy. Hedge funds provide monthly fair value pricing which is used as an indicator of the valuation for the Fund. The Fund values the security based on the movement of an appropriate market index or a similar security that is publicly traded until the hedge fund issues an updated market valuation.
Valuation of Fund of Funds - The Fund may invest in funds of open-end or closed-end investment companies (the “Underlying Funds”). The Underlying Funds value securities in their portfolios for which market quotations are readily available at their market values (generally the last reported sale price) and all other securities and assets at their fair value using the methods established by the board of directors of the Underlying Funds. Open-end funds are valued at their NAV per share and closed-end fund that trade on an exchange are valued as described under security valuation.
The Fund utilizes various methods to measure the fair value of its investments on a recurring basis. GAAP establishes a hierarchy that prioritizes inputs to valuation methods. The three levels of input are:
Level 1 – Unadjusted quoted prices in active markets for identical assets and liabilities that the Fund has the ability to access.
Level 2 – Observable inputs other than quoted prices included in Level 1 that are observable for the asset or liability, either directly or indirectly. These inputs may include quoted prices for the identical instrument on an inactive market, prices for similar instruments, interest rates, prepayment speeds, credit risk, yield curves, default rates and similar data.
Level 3 –Unobservable inputs for the asset or liability, to the extent relevant observable inputs are not available; representing the Fund’s own assumptions about the assumptions a market participant would use in valuing the asset or liability, and would be based on the best information available.
The availability of observable inputs can vary from security to security and is affected by a wide variety of factors, including, for example, the type of security, whether the security is new and not yet established in the marketplace, the liquidity of markets, and other characteristics particular to the security. To the extent that valuation is based on models or inputs that are less observable or unobservable in the market, the determination of fair value requires more judgment. Accordingly, the degree of judgment exercised in determining fair value is greatest for instruments categorized in Level 3.
The inputs used to measure fair value of a security may fall into different levels (Level 1, Level 2 or Level 3) of the fair value hierarchy. In such cases, for disclosure purposes, the level within which the fair value measurement falls, in its entirety, is determined based on the lowest level input that is significant in its entirety to the fair value measurement.
22
| Destra Multi-Alternative Fund |
| NOTES TO FINANCIAL STATEMENTS (Continued) |
| February 28, 2019 |
The inputs or methodology used for valuing securities are not necessarily an indication of the risk associated with investing in those securities. The following tables summarize the inputs used as of February 28, 2019 for the Fund’s assets and liabilities measured at fair value:
| Assets* | ||||||||||||||||||||
| Investments: | Practical Expedient (1) | Level 1 | Level 2 | Level 3 | Total | |||||||||||||||
| Common Stocks | $ | — | $ | 8,480,792 | $ | — | $ | — | $ | 8,480,792 | ||||||||||
| Exchange Traded Fund | — | 585,500 | — | — | 585,500 | |||||||||||||||
| Exchange Traded Notes | — | 874,000 | — | — | 874,000 | |||||||||||||||
| Real Estate Investment Trusts | 21,500,181 | 8,566,855 | 39,771,886 | — | 69,838,922 | |||||||||||||||
| Non-Listed Business Development Companies | 2,430,600 | — | — | — | 2,430,600 | |||||||||||||||
| Private Business Development Companies | 8,064,627 | — | — | — | 8,064,627 | |||||||||||||||
| Private Investment Funds | 44,845,211 | — | — | — | 44,845,211 | |||||||||||||||
| Closed-End Funds | — | 14,705,046 | — | — | 14,705,046 | |||||||||||||||
| Hedge Fund | 27,294,495 | — | — | — | 27,294,495 | |||||||||||||||
| Short-Term Investment | — | 639,801 | — | — | 639,801 | |||||||||||||||
| Total Investments | $ | 104,135,114 | $ | 33,851,994 | $ | 39,771,886 | $ | — | $ | 177,758,994 | ||||||||||
| (1) | Certain investments that are measured at fair value using the NAV per share (or its equivalent) practical expedient have not been categorized in the fair value hierarchy. The fair value amounts presented in this table are intended to permit reconciliation of the fair value hierarchy to the amounts presented in the portfolio of investments. |
| * | Refer to the Portfolio of Investments for industry classifications. |
There was a change in fair valuation measurement inputs from Level 3 to practical expedient. Practical expedient became available based on the Fund receiving NAVs quarterly via investor letters and/or statements from the Sponsor of the investment.
The following is the fair value measurement of investments that are measured at NAV per Share (or its equivalent) as a practical expedient:
| Acquisition | % of Net | Unfunded | ||||||||||||||||||||
| Security Description | Industry | Date | Cost | Value | Assets | Commitments | Redemption Frequency | Redemption Notice Period | ||||||||||||||
| AIM Infrastructure MLP Fund II | Private Investment Company | 3/12/2014 | $ | 6,108,750 | $ | 4,206,678 | 2.7% | $ | 1,391,250 | Quarterly | 30-60 Days | |||||||||||
| Arboretum Core Asset Fund, L.P. | Private Investment Company | 8/2/2018 | 2,500,000 | 2,490,517 | 1.6% | 7,500,000 | Annually | 30 Days | ||||||||||||||
| Canyon CLO Fund II LP | Private Investment Company | 2/25/2019 | 10,000,000 | Subject to advisor approval | n/a | |||||||||||||||||
| Cion Investment Corp. | Non-Listed BDC | 4/21/2014 | 2,682,559 | 2,430,600 | 1.6% | — | Quarterly | 30 Days | ||||||||||||||
| Clarion Lion Industrial Trust | REIT | 6/29/2015 | 9,902,914 | 14,000,181 | 9.1% | — | Quarterly | 90 Days | ||||||||||||||
| Clarion Lion Properties Fund | Private Investment Company | 4/1/2014 | 11,000,000 | 14,890,765 | 9.7% | — | Quarterly | 90 Days | ||||||||||||||
| Collins Masters Access Fund, Ltd. | Hedge Fund | 6/2/2015 | 25,002,167 | 27,294,495 | 17.7% | — | Subject to advisor approval | 30-60 Days | ||||||||||||||
| Levine Leichtman Capital Partners VI, LP | Private Investment Company | 11/22/2017 | 3,830,759 | 2,627,344 | 1.7% | 7,303,288 | Subject to advisor approval | n/a | ||||||||||||||
| Mosaic Real Estate Credit, LLC | Private Investment Company | 7/6/2017 | 9,999,997 | 10,147,147 | 6.6% | — | Subject to advisor approval | 2 year lock up, then annual with 90 Days notice | ||||||||||||||
| Ovation Alternative Income Fund, LP | Private Investment Company | 7/25/2014 | 7,500,000 | 7,787,072 | 5.1% | — | Quarterly | 180 Days | ||||||||||||||
| Owl Rock Capital Corp. | Private BDC | 9/6/2017 | 8,187,532 | 8,064,627 | 5.2% | 4,126,442 | Quarterly | 90 Days | ||||||||||||||
| Stepstone Capital Partners IV, L.P. | Private Investment Company | 7/30/2018 | 2,796,618 | 2,695,688 | 1.7% | 7,203,382 | Subject to advisor approval | n/a | ||||||||||||||
| Treehouse Real Estate Investment Trust, Inc. | Private Investment Company | 12/31/2018 | 7,500,000 | 7,500,000 | 4.9% | — | Subject to advisor approval | n/a | ||||||||||||||
| $ | 97,011,297 | $ | 104,135,114 | $ | 37,524,362 | |||||||||||||||||
Exchange Traded Funds –The Fund may invest in exchange traded funds (“ETFs”). Most ETFs are a type of index fund bought and sold on a securities exchange. An ETF trades like common stock and represents a fixed (or managed) portfolio of securities designed to track the performance and dividend yield of a particular domestic or foreign market index. The Fund may purchase an ETF to gain exposure to a portion of the U.S. or a foreign market. The risks of owning an ETF generally reflect the risks of owning the underlying securities it is designed to track, although the lack of liquidity on an ETF could result in it being more volatile. Additionally, ETFs have fees and expenses that reduce their value.
Security Transactions and Investment Income – Investment security transactions are accounted for on a trade date basis. Cost is determined and gains and losses are based upon the specific identification method for both financial statement and federal income tax purposes. Dividend income is recorded on the ex-dividend date and interest
23
| Destra Multi-Alternative Fund |
| NOTES TO FINANCIAL STATEMENTS (Continued) |
| February 28, 2019 |
income is recorded on the accrual basis. Purchase discounts and premiums on securities are accreted and amortized over the life of the respective securities.
Federal Income Taxes – The Fund intends to comply with the requirements of Subchapter M of the Internal Revenue Code applicable to regulated investment companies and will distribute all of its taxable income, if any to shareholders. Accordingly, no provision for Federal income taxes is required in the financial statements.
The Fund recognizes the tax benefits of uncertain tax positions only when the position is “more likely than not” to be sustained assuming examination by tax authorities. Management has analyzed the Fund’s tax positions and has concluded that no liability for unrecognized tax benefits should be recorded related to uncertain tax positions taken on returns filed for open tax years ended February 29, 2016 to February 28, 2018, or expected to be taken in the Fund’s February 28, 2019 year-end tax return. The Fund identifies its major tax jurisdiction as U.S. Federal. The Fund recognizes interest and penalties, if any, related to unrecognized tax benefits as income tax expense in the Statement of Operations. During the year ended February 28, 2019, the Fund did not incur any interest or penalties.
Distributions to Shareholders – Distributions from investment income are declared and paid monthly. Distributions from net realized capital gains, if any, are declared and paid annually and are recorded on the ex-dividend date. The character of income and gains to be distributed is determined in accordance with income tax regulations, which may differ from GAAP.
Indemnification –The Fund indemnifies its officers and Trustees for certain liabilities that may arise from the performance of their duties to the Fund. Additionally, in the normal course of business, the Fund enters into contracts that contain a variety of representations and warranties and which provide general indemnities. The Fund’s maximum exposure under these arrangements is unknown, as this would involve future claims that may be made against the Fund that have not yet occurred. However, based on experience, the Trust expects the risk of loss due to these warranties and indemnities to be remote.
| 3. | RECENT ACCOUNTING PRONOUNCEMENTS AND REPORTING UPDATES |
In August 2018, the FASB issued Accounting Standards Update (“ASU”) No. 2018-13, which changes certain fair value measurement disclosure requirements. The new ASU, in addition to other modifications and additions, removes the requirement to disclose the amount and reasons for transfers between Level 1 and Level 2 of the fair value hierarchy, and the policy for the timing of transfers between levels. For investment companies, the amendments are effective for financial statements issued for fiscal years beginning after December 15, 2019, and interim periods within those fiscal years. The Fund has adopted early.
In August 2018, the Securities and Exchange Commission adopted amendments to certain disclosure requirements under Regulation S-X to conform to US GAAP, including: (i) an amendment to require presentation of the total, rather than the components, of distributable earnings on the Statement of Assets and Liabilities; and (ii) an amendment to require presentation of the total, rather than the components, of distributions to shareholders, except for tax return of capital distributions, on the Statement of Changes in Net Assets. The amendments also removed the requirement for parenthetical disclosure of undistributed net investment income on the Statement of Changes in Net Assets. These amendments have been adopted with these financial statements.
24
| Destra Multi-Alternative Fund |
| NOTES TO FINANCIAL STATEMENTS (Continued) |
| February 28, 2019 |
| 4. | INVESTMENT MANAGEMENT AND OTHER AGREEMENTS |
Advisory Agreement –Pursuant to an investment advisory agreement with the Fund, (the “Advisory Agreement”), investment advisory services are provided to the Fund by Destra Capital Advisors LLC (the “Advisor”), effective November 30, 2018. Under the terms of the Advisory Agreement, the Advisor receives monthly fees calculated at an annual rate of 1.35% of the average daily net assets of the Fund. Prior to November 30, 2018, Pinhook Capital, LLC (f/k/a LCM Invesment Management, LLC) (“Pinhook”) was the investment adviser to the Fund. For the period from February 28, 2018 to November 30, 2018, Pinhook earned advisory fees of $1,831,869. For the period from December 1, 2018 to February 28, 2019, the Advisor earned advisory fees of $478,175. For the year ended February 28, 2019, the Advisor was owed $138,266 in advisory fees.
Pursuant to a written contract (the “Expense Limitation Agreement”), the Advisor has agreed, at least until November 30, 2020, to waive a portion of its advisory fee and has agreed to reimburse the Fund for other expenses to the extent necessary so that the total expenses incurred by the Fund (excluding front-end or contingent deferred loads, brokerage fees and commissions, acquired fund fees and expenses, borrowing costs (such as interest and dividend expenses on securities sold short), fees and expenses associated with investments in other collective investment vehicles or derivative instruments (including, for example, option and swap fees and expenses), taxes or extraordinary expenses, such as litigation expenses), do not exceed the following amounts per annum of the average daily net assets of each class of shares:
| Class A | Class C | Class I | Class L | ||||||||
| 1.95% | 2.70% | 1.70% | 2.45% |
These amounts will herein be referred to as the “expense limitations.”
Any waiver or reimbursement by the Advisor under the Expense Limitation Agreement is subject to repayment by the Fund within three years from the date the Advisor waived any payment or reimbursed any expense, provided that the Fund is able to make the repayment without exceeding the expense limitation in place at the time of waiver or the current expense limitation and the repayment is approved by the Board. The Adviser may not terminate the Expense Limitation Agreement during the initial term. After the initial term, either the Board or the adviser may terminate the expense reimbursement arrangement upon 60 days’ written notice. For the fiscal year ended February 28, 2019, the Advisor waived fees/reimbursed expenses of $327,457.
The following amounts are subject to recapture by the Adviser by the following dates:
| 2/28/2021 | 2/28/2022 | ||||||
| $ | 386,639 | $ | 327,457 | ||||
Sub-Advisory Agreement –The Fund has engaged Pinhook Capital, LLC) as the primary sub-adviser (the “Sub-Adviser”). The Sub-Advisory Agreement provides that the Sub-Adviser is entitled to receive an annual fee from the Adviser equal to 50% of the net revenue received by the Adviser after any fee waivers and shared expenses between the Adviser and the Sub-Adviser, subject to a maximum of 0.675% of the Fund’s average daily net assets. The Sub-Adviser is compensated by the Adviser, not the Fund. The Sub-Adviser served as investment adviser to the Fund until November 30, 2018.
Distributor– The Board has adopted, on behalf of the Fund, a Shareholder Services Plan under which the Fund may compensate financial industry professionals for providing ongoing services in respect of clients with whom they have distributed shares of the Fund. Under the Shareholder Services Plan, the Fund may pay 0.25% per year of its average daily net assets attributed to each of Class A, Class C and Class L shares for such services. For the year ended February 28, 2019, the Fund incurred shareholder servicing fees of $335,384, $53,337, and $14,323 for Class
25
| Destra Multi-Alternative Fund |
| NOTES TO FINANCIAL STATEMENTS (Continued) |
| February 28, 2019 |
A, Class C and Class L shares, respectively. The Class C and Class L shares also pay to Destra Capital Investments, LLC (the “Distributor”) a distribution fee, payable under distribution plans adopted by the Board (“Distribution Plans”), for certain activities relating to the distribution of shares to investors and maintenance of shareholder accounts. These activities including marketing and other activities to support the distribution of the Class C and Class L shares. Under the Distribution Plans, the Fund pays 0.75% and 0.50% per year of its average daily net assets for such services for Class C and Class L shares, respectively. Effective February 1, 2019 Destra Capital Investments LLC became the Funds’ distributor. For the period February 28, 2018 to February 1, 2019, Northern Lights Distributors, LLC (the “Prior Distributor”), an affiliate of GFS, as defined below, served as the Fund’s Distributor. For the year ended February 28, 2019, the Fund incurred distributions fees of $160,011 and $28,646 for Class C and Class L shares, respectively.
The Distributor acts as the Fund’s principal underwriter in a continuous public offering of the Fund’s shares. For the fiscal year ended February 28, 2019, the Distributor received $160,867 and $2,747 in underwriting commissions for sales of Class A and Class L shares, respectively, of which $27,033 and $1,028 were retained by the principal underwriter or other affiliated broker-dealers.
In addition, certain affiliates of the Distributor provide services to the Fund as follows:
Gemini Fund Services, LLC (“GFS”) –GFS, provides administration, fund accounting, and transfer agent services to the Fund. Pursuant to a separate servicing agreement with GFS, the Fund pays GFS customary fees for providing administration, fund accounting and transfer agency services to the Fund. Certain officers of the Trust are also officers of GFS, and are not paid any fees directly by the Fund for serving in such capacities.
Blu Giant, LLC (“Blu Giant”) – Blu Giant, an affiliate of GFS, provides EDGAR conversion and filing services as well as print management services for the Fund on an ad-hoc basis. For the provision of these services, Blu Giant receives customary fees from the Fund.
Effective February 1, 2019, NorthStar Financial Services Group, LLC, the parent company of GFS and its affiliated companies including Northern Lights Distributors, LLC (“NLD”) and Northern Lights Compliance Services, LLC (“NLCS”)(collectively, the “Gemini Companies”), sold its interest in the Gemini Companies to a third party private equity firm that contemporaneously acquired Ultimus Fund Solutions, LLC (an independent mutual fund administration firm) and its affiliates (collectively, the “Ultimus Companies”). As a result of these separate transactions, the Gemini Companies and the Ultimus Companies are now indirectly owned through a common parent entity, The Ultimus Group, LLC.
Other Affiliates– During the fiscal year ended February 28, 2019, Lucia Securities, LLC (“Lucia Securities”), a registered broker/dealer and an affiliate of the Sub-Advisor, executed trades on behalf of the Fund for which it received brokerage commissions of $15,886. The prior Distributor previously entered into an agreement with Lucia Securities under which Lucia Securities provided wholesaling services with respect to the Fund. For the period from March 1, 2018 through November 30, 2018, Lucia Securities received $5,717 from NLD. NLD started to process fees to the Distributor in December 1, 2018 and Distributor reimbursed NLD $5,258.29 for the same period, for a the net of $459.
| 5. | INVESTMENT TRANSACTIONS |
The cost of purchases and proceeds from the sale of securities, other than short-term securities, for the fiscal year ended February 28, 2019, amounted to $36,067,105 and $51,164,049, respectively.
| 6. | REPURCHASE OFFERS / SHARES OF BENEFICIAL INTEREST |
Pursuant to Rule 23c-3 under the 1940 Act, on a quarterly basis, the Fund offers shareholders holding all classes of shares the option of redeeming shares at NAV. The Board determines the quarterly repurchase offer amount
26
| Destra Multi-Alternative Fund |
| NOTES TO FINANCIAL STATEMENTS (Continued) |
| February 28, 2019 |
(“Repurchase Offer Amount”), which can be no less than 5% and no more than 25% of all shares of all classes outstanding on the repurchase request deadline. If shareholders tender more than the Repurchase Offer Amount, the Fund may, but is not required to, repurchase an additional amount of shares not to exceed 2% of all outstanding shares of the Fund on the repurchase request deadline. If the Fund determines not to repurchase more than the Repurchase Offer Amount, or if shareholders tender shares in an amount exceeding the Repurchase Offer Amount plus 2% of all outstanding shares on the repurchase request deadline, the Fund shall repurchase the shares tendered on a pro rata basis. There is no guarantee that a shareholder will be able to sell all of the shares tendered in a quarterly repurchase offer. Limited liquidity will be provided to shareholders only through the Fund’s quarterly repurchases.
| Repurchase Offer | Repurchase Offer | Repurchase Offer | Repurchase Offer | |||||||||||||
| Commencement Date | March 16, 2018 | June 15, 2018 | September 18, 2018 | December 18, 2018 | ||||||||||||
| Repurchase Request | April 20, 2018 | July 17, 2018 | October 22, 2018 | January 18, 2019 | ||||||||||||
| Repurchase Pricing Date | April 20, 2018 | July 17, 2018 | October 22, 2018 | January 18, 2019 | ||||||||||||
| Net Asset Value as of Repurchase Offer Date | ||||||||||||||||
| Class A | $ | 14.45 | $ | 14.52 | $ | 13.95 | $ | 13.57 | ||||||||
| Class C | $ | 14.10 | $ | 14.13 | $ | 13.56 | $ | 13.16 | ||||||||
| Class I | $ | 14.65 | $ | 14.72 | $ | 14.16 | $ | 13.78 | ||||||||
| Class L | $ | 14.21 | $ | 14.26 | $ | 13.69 | $ | 13.30 | ||||||||
| Amount Repurchased | ||||||||||||||||
| Class A | $ | 8,432,217 | $ | 6,732,442 | $ | 6,525,764 | $ | 6,435,108 | ||||||||
| Class C | $ | 2,362,203 | $ | 674,189 | $ | 1,051,952 | $ | 884,200 | ||||||||
| Class I | $ | 542,577 | $ | 1,227,701 | $ | 601,967 | $ | 482,241 | ||||||||
| Class L | $ | 451,858 | $ | 483,561 | $ | 263,824 | $ | 212,080 | ||||||||
| Percentage of Outstanding Shares Repurchased | ||||||||||||||||
| Class A | 5.57 | % | 4.67 | % | 4.94 | % | 5.34 | % | ||||||||
| Class C | 9.43 | % | 2.90 | % | 5.05 | % | 4.92 | % | ||||||||
| Class I | 9.31 | % | 14.83 | % | 5.87 | % | 2.85 | % | ||||||||
| Class L | 6.84 | % | 7.75 | % | 4.68 | % | 4.22 | % | ||||||||
| 7. | DISTRIBUTIONS TO SHAREHOLDERS AND TAX COMPONENTS OF CAPITAL |
The tax character of distributions paid during the following years was as follows:
| Fiscal Year Ended | Fiscal Year Ended | |||||||
| February 28, 2019 | February 28, 2018 | |||||||
| Ordinary Income | $ | 669,250 | $ | 3,045,979 | ||||
| Return of Capital | 9,468,481 | 9,181,809 | ||||||
| $ | 10,137,731 | $ | 12,227,788 | |||||
As of February 28, 2019, the components of accumulated earnings/(deficit) on a tax basis were as follows:
| Undistributed | Undistributed | Post October Loss | Capital Loss | Other | Unrealized | Total | ||||||||||||||||||||
| Ordinary | Long-Term | and | Carry | Book/Tax | Appreciation/ | Accumulated | ||||||||||||||||||||
| Income | Gains | Late Year Loss | Forwards | Differences | (Depreciation) | Earnings/(Deficits) | ||||||||||||||||||||
| $ | — | $ | — | $ | (2,610,881 | ) | $ | (9,564,667 | ) | $ | — | $ | 17,278,893 | $ | 5,103,345 | |||||||||||
The difference between book basis and tax basis unrealized appreciation of investments, undistributed net investment income (loss), and accumulated net realized loss is primarily attributable to the tax deferral of losses on wash sales and adjustment for partnerships and mark-to-market on passive foreign investment companies.
27
| Destra Multi-Alternative Fund |
| NOTES TO FINANCIAL STATEMENTS (Continued) |
| February 28, 2019 |
Late year losses incurred after December 31 within the fiscal year are deemed to arise on the first business day of the following fiscal year for tax purposes. The Fund incurred and elected to defer such late year losses of $251,953.
Capital losses incurred after October 31 within the fiscal year are deemed to arise on the first business day of the following fiscal year for tax purposes. The Fund incurred and elected to defer such capital losses of $ 2,610,881.
At February 28, 2019, the Fund had capital loss carry forwards for federal income tax purposes available to offset future capital gains as follows:
| Non-Expiring | Non-Expiring | |||||||||||||||||
| Expiring | Short-Term | Long-Term | Total | CLCF Utilized | ||||||||||||||
| $ | — | $ | 7,560,057 | $ | 2,004,610 | $ | 9,564,667 | $ | — | |||||||||
Permanent book and tax differences, primarily attributable to adjustments related to the reclassification of Fund distributions, resulted in reclassification for the year ended February 28, 2019 as follows:
| Paid | ||||||
| In | Accumulated | |||||
| Capital | Earnings (Losses) | |||||
| $ | (29,799 | ) | $ | 29,799 | ||
| 8. | AGGREGATE UNREALIZED APPRECIATION AND DEPRECIATION – TAX BASIS |
| Net Unrealized | ||||||||||||||
| Gross Unrealized | Gross Unrealized | Appreciation/ | ||||||||||||
| Tax Cost | Appreciation | Depreciation | (Depreciation) | |||||||||||
| $ | 160,480,014 | $ | 34,833,561 | $ | (17,554,581 | ) | $ | 17,278,980 | ||||||
| 9. | DISTRIBUTABLE CASH FLOW |
The table below has been included to provide additional insight in regards to distribution coverage metrics for the Fund, particularly in regards to how to differentiate between the tax components of distributions and the actual non-GAAP cash flows received from the Fund’s underlying investments. One of the advantages that the Fund is able to provide to investors is the tax characterizations of distributions received. For example, a portion of distributions received from REITs and certain partnerships are often treated as a non-taxable return of capital as an inherent structural advantage of the underlying investments. This allows for the deferral of tax consequences on certain distributions. As such, from a tax characterization, these are considered a “return of capital” but are, in actuality, still a cash inflow source received from the underlying investments. The table is specifically designed to better inform investors of the distributable cash flows received, and the distribution coverage they represent. For example, as can be seen below, for the fiscal year ended February 28, 2019, only 76.9% of distributions were represented by gross income as defined by the Fund’s Statement of Operations (tax-basis), but when factoring in the tax adjustments attributable to underlying investments, these total distributions, dividends and interest represented 106% of gross distributions made by the Fund. The table also includes additional lines for coverage when factoring in total net fees and expenses, as well as net realized gains and losses. This information is supplemental, unaudited, and is not inclusive of required financial disclosures (such as total expense ratio), and should be read in conjunction with the Fund’s full financial statements.
28
| Destra Multi-Alternative Fund |
| NOTES TO FINANCIAL STATEMENTS (Continued) |
| February 28, 2019 |
| For the Year | For the Year | |||||||||
| Ended | Ended | |||||||||
| February 28, | February 28, | |||||||||
| 2019 | 2018 | |||||||||
| Gross Income Per Statement of Operations: | 7,795,565 | 6,580,963 | ||||||||
| Tax Adjustments attributable to underlying investments (1): | 2,921,531 | 5,808,377 | ||||||||
| Total Distributions, dividends and interest from underlying investments: | $ | 10,717,096 | $ | 12,389,340 | ||||||
| Distributions to Shareholders: | $ | (10,137,731 | ) | $ | (12,227,788 | ) | ||||
| Gross Distribution Coverage Ratio: | 106 | % | 101 | % | ||||||
| Total net fees and expenses (breakdown) | ||||||||||
| Total Fees & Expenses: | $ | 4,545,568 | $ | 4,288,234 | ||||||
| Fees Waived (added back): | $ | (327,457 | ) | $ | (386,639 | ) | ||||
| Total Net Fees & Expenses: | $ | 4,218,111 | $ | 3,901,595 | ||||||
| Net Distributable Income: | $ | 6,498,985 | $ | 8,487,745 | ||||||
| Distribution Coverage Ratio excluding Net Realized G/L: | 64 | % | 69 | % | ||||||
| Net Realized Gain/(Loss): | $ | (11,716,308 | ) | $ | (1,151,003 | ) | ||||
| Distribution Coverage Ratio including Net Realized G/L: | -51 | % | 60 | % | ||||||
| (1) | Tax adjustments attributable to REITs and other investments are adjustments to reflect the tax character of distributions received from underlying investments. Specifically, a portion of distributions received from REITs are often treated as non-taxable return of capital for book and tax purposes and distributions received from investments structured as partnerships are also treated as return of capital to the extent the distributions received exceed the income reported to the Fund on the Form K-1’s received from the underlying investments. |
| 10. | CREDIT FACILITY |
The Fund has the opportunity to borrow money from Barclays via a credit facility with a variable limit based on how many securities are pledged as collateral. It is intended to provide financing, if necessary, subject to certain restrictions, in connection with shareholder redemptions. Borrowings are secured by certain of the Fund’s investments. Interest is accrued at the 1 Month LIBOR rate plus 180 basis points to be paid monthly. During the fiscal year ended February 28, 2019, the Fund paid $220,797 in interest on the borrowings. Average borrowings and the average interest rate during the fiscal year ended February 28, 2019, were $17,747,814 and 3.69%, respectively. The largest outstanding amount borrowed during the fiscal year was $23,800,000. The balance due to the broker as of February 28, 2019 was $23,800,000.
| 11. | SUBSEQUENT EVENTS |
Subsequent events after the date of the Statement of Assets and Liabilities have been evaluated through the date the financial statements were issued. Management has concluded that there is no impact requiring adjustment or disclosure in the financial statements. On March 28, 2019, the Fund paid distributions of $0.0685, $0.0664, $0.0696 and $0.0671 per share to shareholders of record on March 27, 2019 for Class A, Class C, Class I and Class L shares, respectively. The Fund completed a quarterly repurchase offer on April 22, 2019 which resulted in 7.09%, 6.01%, 2.24% and 5.65% of Fund shares being repurchased for $6,398,295, $795,059, $371,645 and $221,908 for Class A, Class C, Class I and Class L, respectively.
29
REPORT OF INDEPENDENT REGISTERED PUBLIC ACCOUNTING FIRM
To the shareholders and the Board of Trustees of Destra Multi-Alternative Fund
Opinion on the Financial Statements and Financial Highlights
We have audited the accompanying statement of assets and liabilities of Destra Multi-Alternative Fund (formerly known as the Multi-Strategy Growth & Income Fund) (the “Fund”), including the portfolio of investments as of February 28, 2019, the related statements of operations and cash flows for the year then ended, the statement of changes in net assets for each of the two years in the period then ended, the financial highlights for each of the two years in the period then ended, and the related notes. In our opinion, the financial statements and financial highlights present fairly, in all material respects, the financial position of the Fund as of February 28, 2019, and the results of its operations and its cash flows for the year then ended, the changes in its net assets for each of the two years in the period then ended, and the financial highlights for the two years in the period then ended, in conformity with accounting principles generally accepted in the United States of America. The statement of changes in net assets for the period ended February 28, 2017 and the financial highlights for each of the respective stated periods in the three-year period ended February 28, 2017 were audited by other auditors whose report, dated April 28, 2017 expressed an unqualified opinion on those statements.
Basis for Opinion
These financial statements and financial highlights are the responsibility of the Fund’s management. Our responsibility is to express an opinion on the Fund’s financial statements and financial highlights based on our audits. We are a public accounting firm registered with the Public Company Accounting Oversight Board (United States) (PCAOB) and are required to be independent with respect to the Fund in accordance with the U.S. federal securities laws and the applicable rules and regulations of the Securities and Exchange Commission and the PCAOB.
We conducted our audits in accordance with the standards of the PCAOB. Those standards require that we plan and perform the audit to obtain reasonable assurance about whether the financial statements and financial highlights are free of material misstatement, whether due to error or fraud. The Fund is not required to have, nor were we engaged to perform, an audit of its internal control over financial reporting. As part of our audits we are required to obtain an understanding of internal control over financial reporting but not for the purpose of expressing an opinion on the effectiveness of the Fund’s internal control over financial reporting. Accordingly, we express no such opinion.
Our audits included performing procedures to assess the risks of material misstatement of the financial statements and financial highlights, whether due to error or fraud, and performing procedures that respond to those risks. Such procedures included examining, on a test basis, evidence regarding the amounts and disclosures in the financial statements and financial highlights. Our audits also included evaluating the accounting principles used and significant estimates made by management, as well as evaluating the overall presentation of the financial statements and financial highlights. Our procedures included confirmation of securities owned as of February 28, 2019, by correspondence with the custodian and underlying investment fund managers and advisers. We believe that our audits provide a reasonable basis for our opinion.

Costa Mesa, California
April 26, 2019
We have served as the auditor of Destra Multi-Alternative Fund since 2018.
30
| Destra Multi-Alternative Fund |
| SUPPLEMENTAL INFORMATION (Unaudited) |
| February 28, 2019 |
Consideration and Approval of Proposed Advisory Agreement
At a meeting held on October 2, 2018, the Board of Trustees (the “Board” or the “Trustees”), including the Independent Trustees, unanimously approved a proposed advisory agreement between Destra Capital Advisors LLC (“Destra”) and Multi-Strategy Growth & Income Fund (the “Fund”) (the “Proposed Advisory Agreement”). In considering the approval of the Advisory Agreement, the Trustees received materials specifically relating to the Advisory Agreement.
The Board reviewed and discussed the written materials that were provided in advance of the Meeting and deliberated on the approval of the Proposed Advisory Agreement. The Board relied upon the advice of independent legal counsel and their own business judgment in determining the material factors to be considered in evaluating the Proposed Advisory Agreement and the weight to be given to each such factor. The conclusions reached by the Board were based on a comprehensive evaluation of all of the information provided and were not the result of any one factor. Moreover, each Trustee may have afforded different weight to the various factors in reaching his conclusions with respect to the Advisory Agreement.
Nature, Extent and Quality of Service. In evaluating whether to approve the Proposed Advisory Agreement, the Board considered the nature, extent and quality of services to be provided under the agreement. They noted that Destra currently served as the investment adviser to three registered investment companies, including an interval fund like the Fund, and they observed that the Destra’s personnel have significant experience in investment company management. The Board evaluated the compliance program developed by Destra, including the background and experience of compliance personnel. The Board noted Destra’s intention to make no changes to the Fund’s investment objectives or strategy. In light of the Fund’s investment strategy, the Board also reviewed Destra’s fair valuation policies and procedures. In addition to the proposed advisory services, the Board also considered that Destra intended to engage LCM Investment Management, LLC (“LCM”), the Fund’s current adviser, as the Fund’s sub-adviser responsible for all trading, portfolio construction and investment operations, noting that it was anticipated that LCM personnel currently responsible for managing the Fund’s portfolio would continue to manage the Fund on behalf of LCM as the proposed sub-adviser. The Board considered Destra’s oversight process, noting that the firm intended to regularly engage with the Fund, the portfolio, and the sub-adviser, monitor compliance and portfolio construction on a daily basis, and conduct regular reviews of the sub-adviser. The Board concluded it was comfortable that Destra had the capabilities and resources to oversee the operations of the Fund. Based on their review, the Trustees concluded that, overall, the nature, extent and quality of services expected to be provided to the Fund were satisfactory.
Performance. The Board considered Destra’s investment philosophy and experience and its history in managing investment companies, and it reviewed the performance history of other funds managed by Destra, noting that they had shown generally positive returns and favorable Morningstar ratings. The Board also considered that Destra will delegate responsibility for the day-to-day management of the Fund to LCM, and LCM would continue to manage the Fund in the same manner once engaged as the Fund’s sub-adviser.
Fees and Expenses. The Trustees reviewed information regarding fees charged by advisers to a peer group of funds with investment objectives and strategies comparable to the Fund’s. The Trustees remarked that the proposed advisory fee of 1.35% was equal to the Fund’s current advisory fee and was slightly less than the peer group average. The Trustees remarked that the proposed advisory fee, while higher than the US Closed-end Multialternative Morningstar category average, was still well within the range of fees charged by funds in that category. The Trustees also considered that Destra had agreed to maintain the Fund’s current expense limitations of 1.95% of Class A shares’ net assets, 2.45% of Class L shares’ net assets, 2.70% of Class C shares’ net assets and 1.70% of Class I shares’ net assets. After further discussion, the Board concluded that the proposed advisory fee of 1.35% remained competitive and reasonable.
31
| Destra Multi-Alternative Fund |
| SUPPLEMENTAL INFORMATION (Unaudited)(Continued) |
| February 28, 2019 |
Economies of Scale. The Trustees considered whether Destra will realize economies of scale with respect to the management of the Fund. The Trustees agreed that while meaningful economies of scale had not yet been reached, they would continue to monitor Fund growth and evaluate the appropriateness of breakpoints in the advisory fee as Fund assets increase.
Profitability. The Trustees considered the projected profits by Destra in connection with the operation of the Fund for the first two years under the Proposed Advisory Agreement and whether the amount of profit would be a fair entrepreneurial profit for the management of the Fund. The Trustees noted that Destra expected to receive a reasonable profit both in terms of percentage of revenue and dollar amount over both years. The Board concluded that Destra’s estimated level of profitability from its relationship with the Fund was not excessive.
15(f) Considerations. The Trustees noted that section 15(f) of the Investment Company Act of 1940 (“the 1940 Act”) provides a safe harbor to investment advisers who may receive compensation or benefits in connection with the sale of securities or a sale of any other interest in the investment adviser, which results in an assignment of an investment advisory contract. They further noted that the safe harbor is conditioned on the following: (i) for a period of three years after the time of such sale, at least 75% of the board of trustees are not (a) interested persons of the investment adviser, as the term is defined in the 1940 Act, and (b) there is not imposed an unfair burden as a result of the sale. They considered that although LCM is not directly selling any interests in LCM to Destra, LCM and Destra have entered into a purchase agreement whereby LCM will receive compensation from Destra if Destra is retained as adviser to the Fund. They noted that it was anticipated that after the transaction, at least 75% of the Board of Trustees of the Fund would be independent. They also considered whether the retention of Destra will impose an unfair burden on the Fund’s shareholders. After discussion, they concluded that the retention of Destra was unlikely to impose an unfair burden on the Fund’s shareholders because after the transaction, none of Destra, LCM, or any of their affiliates would be entitled to receive any compensation directly or indirectly (i) from any person in connection with the purchase or sale of securities or other property to, from, or on behalf of the Fund, or (ii) from the Fund for other than bona fide investment advisory or other services.
Conclusion. Having requested and received such information from Destra as the Board believed to be reasonably necessary to evaluate the terms of the Proposed Advisory Agreement, and as assisted by the advice of counsel, the Board concluded that the advisory fee is reasonable and that approval of the Proposed Advisory Agreement is in the best interests of the shareholders of the Fund.
Consideration and Approval of the Proposed Sub-Advisory Agreement
Also, at the meeting held on October 2, 2018, the Trustees, including the Independent Trustees, unanimously approved a proposed sub-advisory agreement between Destra and LCM with respect to the Fund (“Proposed Sub-Advisory Agreement”).
The Board reviewed and discussed the written materials that were provided in advance of the Meeting and deliberated on the approval of the Proposed Sub-Advisory Agreement. The Board relied upon the advice of independent legal counsel and their own business judgment in determining the material factors to be considered in evaluating the Proposed Sub-Advisory Agreement and the weight to be given to each such factor. The conclusions reached by the Board were based on a comprehensive evaluation of all of the information provided and were not the result of any one factor. Moreover, each Trustee may have afforded different weight to the various factors in reaching his conclusions with respect to the Proposed Sub-Advisory Agreement. In considering the approval of the Proposed Sub-Advisory Agreement, the Board reviewed and analyzed various factors that they determined were relevant, including the factors enumerated below.
Nature, Extent and Quality of Service. The Trustees examined the nature, extent and quality of the services to be provided by LCM to the Fund. The Trustees noted their familiarity with LCM and its personnel because the firm currently served the Fund as its adviser. The Trustees expressed satisfaction with the overall historical management
32
| Destra Multi-Alternative Fund |
| SUPPLEMENTAL INFORMATION (Unaudited)(Continued) |
| February 28, 2019 |
of the Fund, as well as with the continued evolution and growth of LCM’s management team and investment process. The Trustees discussed the strategy of the Fund and its key risks, and they expressed the opinion that LCM is managing portfolio risks well. The Trustees discussed historical enhancements that LCM had made to its team and its portfolio management processes. The Trustees also discussed in detail LCM’s research processes, noting that the firm thoroughly analyzed sponsor and manager capabilities and evaluated the quality of the underlying portfolios. They also evaluated LCM’s proprietary multi-stage, multi-factor framework for selecting, evaluating and monitoring investment opportunities across different sectors and expressed their satisfaction with that process. The Trustees noted LCM had reported no material compliance incidents, litigation or administrative actions over the period in question. Overall, it was the consensus of the Trustees that they were satisfied with the nature, extent and quality of the services provided to the Fund by LCM and anticipated that Fund shareholders would continue to receive the same quality of services from LCM when the firm was engaged as the Fund’s sub-adviser.
Performance. The Trustees considered the Fund’s past performance and the Fund’s investment objective of seeking returns from capital appreciation and income, with an emphasis on the generation of income. The Trustees also reviewed the Fund’s investment policy of maintaining a core allocation to alternative assets. The Trustees also noted that LCM had previously served as the Fund’s investment adviser for the entirety of the Fund’s operations. The Trustees noted their satisfaction with the fact that the Fund had delivered positive annualized returns on a since-inception basis while simultaneously exhibiting lower overall risk metrics versus the S&P 500 Total Return Index over that period. They further noted that while the Fund underperformed the peer group over the past year, the Fund had substantially outperformed the Morningstar U.S. Closed-end Category average over the same time period. They also observed that the Fund’s performance had been consistent with that of the peer group over the since inception time period. The Trustees noted that, since inception, consistent with the Fund’s stated strategy, the Fund’s performance was regularly between the returns of the Barclays US Aggregate Bond Index and the S&P 500 Total Return Index. The Trustees concluded that overall, the Fund was performing in line with its goals and objectives across a variety of market environments, and they agreed that the Fund’s performance was satisfactory.
Fees and Expenses. The Trustees considered the proposed sub-advisory fee, noting that the contractual amount was equal to 50% of the net revenue received by Destra, after any fee waivers, subject to a maximum of 0.675% of the Fund’s average daily net assets. They observed that the sub-advisory fee would be paid by Destra, not the Fund, and concluded that the proposed sub-advisory fee was not unreasonable.
Economies of Scale. The Trustees considered whether LCM will experience economies of scale with respect to the management of the Fund. The Trustees agreed that this was primarily an adviser level issue and should be considered with respect to the overall advisory contract, taking into consideration the impact of the sub-advisory expense. After discussion, it was the consensus of the Trustees that a lack of breakpoints was acceptable and the shareholders will benefit from lower overall expenses as the Fund grows.
Profitability. The Trustees considered the anticipated profits to be realized by LCM in connection with its relationship with the Fund and whether the amount of profit is a fair entrepreneurial profit with respect to the sub-advisory services to be provided to the Fund. The Trustees noted that LCM estimates realizing a loss during its first year of engagement as sub-adviser and only a slight profit during the second year of such engagement. The Trustees considered the quality of services anticipated to be provided by LCM, and they concluded the anticipated level of profit was not excessive.
15(f) Considerations. The Trustees noted that section 15(f) of the 1940 Act provides a safe harbor to investment advisers who may receive compensation or benefits in connection with the sale of securities or a sale of any other interest in the investment adviser, which results in an assignment of an investment advisory contract. They further noted that the safe harbor is conditioned on the following: (i) for a period of three years after the time of such sale, at least 75% of the board of trustees are not (a) interested persons of the investment, as the term is defined in the 1940 Act, and (b) there is not imposed an unfair burden as a result of the sale. They considered that
33
| Destra Multi-Alternative Fund |
| SUPPLEMENTAL INFORMATION (Unaudited)(Continued) |
| February 28, 2019 |
although LCM is not directly selling any interests in LCM to Destra, LCM and Destra have entered into a purchase agreement whereby LCM will receive compensation from Destra if Destra is retained as adviser to the Fund. They noted that it was anticipated that after the transaction, at least 75% of the Board of Trustees of the Fund would be independent. They also considered whether the retention of LCM will impose an unfair burden on the Fund’s shareholders. After discussion, they concluded that the retention of LCM was unlikely to impose an unfair burden on the Fund’s shareholders because after the transaction, none of Destra, LCM, or any of their affiliates would be entitled to receive any compensation directly or indirectly (i) from any person in connection with the purchase or sale of securities or other property to, from, or on behalf of the Fund, or (ii) from the Fund for other than bona fide investment advisory or other services.
Conclusion. Having requested and received such information from LCM as the Board believed to be reasonably necessary to evaluate the terms of the Proposed Sub-Advisory Agreement, and as assisted by the advice of counsel, the Board concluded that the advisory fee is reasonable and that approval of the Proposed Sub-Advisory Agreement is in the best interests of the shareholders of the Fund.
34
| Destra Multi-Alternative Fund |
| SUPPLEMENTAL INFORMATION (Unaudited)(Continued) |
| February 28, 2019 |
At a special meeting of the Shareholders of the Fund, held at the offices of Gemini Fund Services, LLC, 80 Arkay Drive, Suite 110, Hauppauge, NY 11788, on Tuesday, November 20, 2018 at 10:00 a.m., Fund shareholders of record as of the close of business October 3, 2018, voted to approve the following proposals:
Proposal 1: To approve a new advisory agreement between Destra Capital Advisors LLC and the Fund.
| Shares Voted In | Shares Voted | Shares Voted | ||
| Favor | Against | Abstentions | ||
| 5,289,105 | 88,720 | 395,824 |
Proposal 2: To approve a new sub-advisory agreement between Destra Capital Advisors LLC and LCM Investment Management, LLC.
| Shares Voted In | Shares Voted | Shares Voted | ||
| Favor | Against | Abstentions | ||
| 5,278,994 | 91,243 | 403,412 |
Proposal 3: To elect four (4) Trustees
| Shares Voted In | Shares Voted | |||
| Favor | Against | |||
| Nicholas Dalmaso | 6,051,291 | 328,190 | ||
| John S. Emrich | 6,055,822 | 323,659 | ||
| Michael S. Erickson | 6,051,291 | 328,190 | ||
| Jeffrey S. Murphy | 6,055,822 | 323,659 |
Proposal 4: To approve a change in the Fund’s classification from a diversified investment company to a non-diversified investment company.
| Shares Voted In | Shares Voted | Shares Voted | ||
| Favor | Against | Abstentions | ||
| 5,192,793 | 117,897 | 462,958 |
35
| Destra Multi-Alternative Fund |
| TRUSTEE TABLE (Unaudited) |
| February 28, 2019 |
The management of the Fund, including general supervision of the duties performed for the Fund under the Investment Management Agreement, is the responsibility of the Board. The Board consists of four trustees, one of whom is an “Interested Person” (as the term “Interested Person” is defined in the 1940 Act) and three of whom are not Interested Persons (referred to herein as “Independent Trustees” and together with the Interested Person, the “Trustees”). None of the Independent Trustees has ever been a Trustee, director or employee of, or consultant to, Destra Capital Advisors LLC or its affiliates. The identity of the Trustees and the Fund’s executive officers and biographical information as of February 28, 2019 is set forth below. The Trustees of the Fund are also trustees of two Destra-sponsored open-end funds and one Destra-sponsored interval closed-end fund. The address for each Trustee is c/o Destra Multi-Alternative Fund, 444 West Lake Street, Suite 1700, Chicago, Illinois 60606. As set forth in the Fund’s Declaration of Trust, a Trustee’s term of office shall continue until his or her death, resignation or removal.
Independent Trustees
| Number of | ||||
| Registered | Other | |||
| Investment | Directorships | |||
| Principal | Companies in | held by the | ||
| Occupation(s) | Fund Complex | Trustee during | ||
| Name and | Trustee | During the past | Overseen by | the past five |
| Birth Year | Since | 5 years | Trustee1 | years |
| John S. Emrich, CFA Birth year: 1967 | November 2018 | Private Investor, January 2011 to present; Co-Founder and Portfolio Manager, Ironworks Capital Management (an investment adviser), April 2005 to December 2010; Member (June 2012 to present) and Manager (2013 to 2015), Iroquois Valley Farms LLC (a farmland finance company). | 4 | Meridian Fund, Inc. (4 portfolios) |
| Michael S. Erickson Birth year: 1952 | November 2018 | Private Investor, August 2007 to present; Treasurer and Vice President, Erickson Holding Corp. (a passive real estate holding company), 2003 to present; Treasurer, Vice President and Manager, McGee Island LLC (a real estate management company), 2015 to present. | 4 | Meridian Fund, Inc. (4 portfolios) |
| Jeffery S. Murphy Birth year: 1966 | November 2018 | Retired (2014 to present); Executive Manager, Affiliated Managers Group, Inc. (an asset manager), 1995 to 2014. | 4 | Aston Funds, 2010 -2014 |
36
| Destra Multi-Alternative Fund |
| TRUSTEE TABLE (Unaudited)(Continued) |
| February 28, 2019 |
Interested Trustee
| Number of | ||||
| Registered | ||||
| Investment | Other | |||
| Companies | Directorships | |||
| in | held by the | |||
| Principal | Fund | Trustee | ||
| Occupation(s) | Complex | during the | ||
| Name and | Trustee | During the past | Overseen by | past five |
| Birth Year | Since | 5 years | Trustee1 | years |
| Nicholas Dalmaso,2 Chairman Birth year: 1965 | November 2018 | General Counsel and Chief Compliance Officer of M1 Holdings LLC (an investment adviser), 2015 to present; General Counsel and Chief Compliance Officer of M1 Finance LLC (an investment adviser), 2015 to present; General Counsel and Chief Compliance Officer of M1 Advisory Services LLC (an investment adviser), 2015 to present; Co-Chairman, General Counsel and Chief Operating Officer of Destra Capital Management LLC, 2010 to 2014; President, Chief Operating Officer and General Counsel, Destra Capital Advisors LLC, 2010 to 2014; President, Chief Operating Officer and General Counsel, Destra Capital Investments LLC, 2010 to 2014; Chief Executive Officer, Destra Investment Trust and Destra Investment Trust II, 2010 to 2014. | 4 | None |
| 1 | The Fund Complex consists of the Fund, the Destra International & Event-Driven Credit Fund, the Destra Wolverine Dynamic Asset Fund and the Destra Flaherty & Crumrine Preferred and Income Fund, both a series of the Destra Investment Trust, and the Destra Exchange-Traded Fund Trust, of which there is currently no active series. |
| 2 | Mr. Dalmaso is an “Interested Person” of the Fund, as defined in the 1940 Act, by reason of his position with and prior ownership of Destra Capital Management LLC and its subsidiaries. |
The following persons serve as the Fund’s executive officers in the following capacities:
| Position(s) Held | Principal Occupation(s) | |
| Name and Birth Year | with the Fund | During the past 5 years |
| Robert Watson Birth year: 1965 | President since November 2018 | Investment Product Strategist, Destra Capital Investments LLC (since 2011); Global Product & Strategic Relationship Director, Aviva Investors (asset management (2010-2011). |
| Derek Mullins Birth year: 1973 | Chief Financial Officer and Treasurer since November 2018 | Managing Partner, PINE Advisor Solutions, LLC; Director of Operations, ArrowMark Asset Management, LLC (2009-2018); Chief Financial Officer (Principal Financial Officer) and Treasurer, Meridian Fund, Inc. (2013-2018). |
| Jane Hong Shissler Birth year: 1972 | Chief Compliance Officer and Secretary since November 2018 | General Counsel, Destra Capital Management LLC, Destra Capital Investments LLC and Destra Capital Advisors LLC; Partner (2012-2015) and Associate (2005-2012), Chapman and Cutler LLP. |
The address for each executive officer is c/o Destra Multi-Alternative Fund, 444 West Lake Street, Suite 1700, Chicago, Illinois 60606.
The Fund’s Statement of Additional Information includes additional information about the Trustees and is available free of charge, upon request, by calling toll-free 1-855-601-3841.
37
PRIVACY NOTICE
Rev. Sept. 2018
| FACTS | WHAT DOES DESTRA MULTI-ALTERNATIVE FUND DO WITH YOUR PERSONAL INFORMATION? |
| Why? | Financial companies choose how they share your personal information. Federal law gives consumers the right to limit some but not all sharing. Federal law also requires us to tell you how we collect, share, and protect your personal information. Please read this notice carefully to understand what we do. |
| What? | The types of personal information we collect and share depend on the product or service you have with us. This information can include: |
| ● Social Security number | |
| ● Purchase History | |
| ● Assets | |
| ● Account Balances | |
| ● Retirement Assets | |
| ● Account Transactions | |
| ● Transaction History | |
| ● Wire Transfer Instructions | |
| ● Checking Account Information | |
| When you are no longer our customer, we continue to share your information as described in this notice. | |
| How? | All financial companies need to share customers’ personal information to run their everyday business. In the section below, we list the reasons financial companies can share their customers’ personal information; the reasons the Destra Multi-Alternative Fund chooses to share; and whether you can limit this sharing. |
| Does Destra Multi- | Can you limit | |
| Reasons we can share your personal information | Alternative Fund share? | this sharing? |
| For our everyday business purposes –such as to process your transactions, maintain your account(s), respond to court orders and legal investigations, or report to credit bureaus | Yes | No |
| For our marketing purposes –to offer our products and services to you | No | We don’t share |
| For joint marketing with other financial companies | No | We don’t share |
| For our affiliates’ everyday business purposes –information about your transactions and experiences | No | We don’t share |
| For our affiliates’ everyday business purposes –information about your creditworthiness | No | We don’t share |
| For nonaffiliates to market to you | No | We don’t share |
| Questions? | Call 1-855-601-3841 |
38
| Who we are | |
| Who is providing this notice? | Destra Multi-Alternative Fund |
| What we do | |
| How does Destra Multi- Alternative Fund protect my personal information? | To protect your personal information from unauthorized access and use, we use security measures that comply with federal law. These measures include computer safeguards and secured files and buildings.
Our service providers are held accountable for adhering to strict policies and procedures to prevent any misuse of your nonpublic personal information.
|
| How does Destra Multi- Alternative Fund collect my personal information? | We collect your personal information, for example, when you
● Open an account
● Provide account information
● Give us your contact information
● Make deposits or withdrawals from your account
● Make a wire transfer
● Tell us where to send the money
● Tells us who receives the money
● Show your government-issued ID
● Show your driver’s license
We also collect your personal information from other companies.
|
| Why can’t I limit all sharing? | Federal law gives you the right to limit only
● Sharing for affiliates’ everyday business purposes – information about your creditworthiness
● Affiliates from using your information to market to you
● Sharing for nonaffiliates to market to you State laws and individual companies may give you additional rights to limit sharing. |
| Definitions | |
| Affiliates | Companies related by common ownership or control. They can be financial and nonfinancial companies.
● Destra Multi-Alternative Fund does not share with our affiliates. |
| Nonaffiliates | Companies not related by common ownership or control. They can be financial and nonfinancial companies
● Destra Multi-Alternative Fund does not share with nonaffiliates so they can market to you. |
| Joint marketing | A formal agreement between nonaffiliated financial companies that together market financial products or services to you.
● Destra Multi-Alternative Fund doesn’t jointly market. |
39
| Investment Advisor |
| Destra Capital Advisors LLC |
| 444 West Lake Street, Suite 1700 |
| Chicago, IL 60606 |
| Distributor |
| Destra Capital Investments LLC |
| 444 West Lake Street, Suite 1700 |
| Chicago, IL 60606 |
| Legal Counsel |
| Drinker Biddle & Reath LLP |
| One Logan Square Ste. 2000 |
| Philadelphia, PA 19103-6996 |
How to Obtain Proxy Voting Information
Information regarding how the Fund voted proxies relating to portfolio securities for the 12 month period ended June 30th as well as a description of the policies and procedures that the Fund used to determine how to vote proxies is available without charge, upon request, by calling 1-855-601-3841 or by referring to the Securities and Exchange Commission’s (“SEC”) website athttp://www.sec.gov.
How to Obtain 1st and 3rd Fiscal Quarter Portfolio Holdings
The Fund files its complete schedule of portfolio holdings with the SEC for the first and third quarters of each fiscal year on Form N-Q. Form N-Q is available on the SEC’s website athttp://www.sec.gov. The information on Form N-Q is available without charge, upon request, by calling 1-855-601-3841.
Item 2. Code of Ethics.Attached
(a) As of the end of the period covered by this report, the registrant has adopted a code of ethics that applies to the registrant's principal executive officer, principal financial officer, principal accounting officer or controller, or persons performing similar functions, regardless of whether these individuals are employed by the registrant or a third party.
(b) For purposes of this item, “code of ethics” means written standards that are reasonably designed to deter wrongdoing and to promote:
| (1) | Honest and ethical conduct, including the ethical handling of actual or apparent conflicts of interest between personal and professional relationships; |
| (2) | Full, fair, accurate, timely, and understandable disclosure in reports and documents that a registrant files with, or submits to, the Commission and in other public communications made by the registrant; |
(3) Compliance with applicable governmental laws, rules, and regulations;
| (4) | The prompt internal reporting of violations of the code to an appropriate person or persons identified in the code; and |
(5) Accountability for adherence to the code.
(c) Amendments: During the period covered by the report, there have not been any amendments to the provisions of the code of ethics.
(d) Waivers: During the period covered by the report, the registrant has not granted any express or implicit waivers from the provisions of the code of ethics.
(e) The Code of Ethics is not posted on Registrant’ website.
(f) A copy of the Code of Ethics is attached as an exhibit.
Item 3. Audit Committee Financial Expert.
(a) The Registrant’s board of trustees has determined that Jeffery S. Murphy is a financial expert, as defined in Item 3 of Form N-CSR. Jeffery S. Murphy is independent for purposes of this Item.
Item 4. Principal Accountant Fees and Services.
| (a) | Audit Fees |
2019 - $61,200
2018 - $60,000
| (b) | Audit-Related Fees |
2019 - $0
2018 - $0
| (c) | Tax Fees |
2019 - $9,180
2018 - $9,000
Preparation of Federal & State income tax returns, assistance with calculation of required income, capital gain and excise distributions and preparation of Federal excise tax returns.
| (d) | All Other Fees |
2019 - $0
2018 - $0
| (e) | (1)Audit Committee’s Pre-Approval Policies |
The registrant’s Audit Committee is required to pre-approve all audit services and, when appropriate, any non-audit services (including audit-related, tax and all other services) to the registrant. The registrant’s Audit Committee also is required to pre-approve, when appropriate, any non-audit services (including audit-related, tax and all other services) to its adviser, or any entity controlling, controlled by or under common control with the adviser that provides ongoing services to the registrant, to the extent that the services may be determined to have an impact on the operations or financial reporting of the registrant. Services are reviewed on an engagement by engagement basis by the Audit Committee.
| (2) | Percentages of Services Approved by the Audit Committee |
| 2019 | 2018 | |
| Audit-Related Fees: | 100.00% | 100.00% |
| Tax Fees: | 0.00% | 0.00% |
| All Other Fees: | 0.00% | 0.00% |
| (f) | During the audit of registrant's financial statements for the most recent fiscal year, less than 50 percent of the hours expended on the principal accountant's engagement were attributed to work performed by persons other than the principal accountant's full-time, permanent employees. |
| (g) | The aggregate non-audit fees billed by the registrant's accountant for services rendered to the registrant, and rendered to the registrant's investment adviser (not including any sub-adviser whose role is primarily portfolio management and is subcontracted with or overseen by another investment adviser), and any entity controlling, controlled by, or under common control with the adviser that provides ongoing services to the registrant: |
2019 - $9,180
2018 - $9,000
(h) The registrant's audit committee has considered whether the provision of non-audit services to the registrant's investment adviser (not including any sub-adviser whose role is primarily portfolio management and is subcontracted with or overseen by another investment adviser), and any entity controlling, controlled by, or under common control with the investment adviser that provides ongoing services to the registrant, that were not pre-approved pursuant to paragraph (c)(7)(ii) of Rule 2-01 of Regulation S-X, is compatible with maintaining the principal accountant's independence.
Item 5. Audit Committee of Listed Companies.Not applicable
Item 6. Schedule of Investments.Schedule of investments in securities of unaffiliated issuers is included under Item 1.
Item 7. Disclosure of Proxy Voting Policies and Procedures for Closed-End Funds.
See attached exhibit P1A, which contains the Adviser proxy voting policies and procedures.
Item 8. Portfolio Managers of Closed-End Management Investment Companies.
Aaron Rosen, CFA
Mr. Rosen is the Fund’s Co-Portfolio Manager and serves as the Sub-Adviser’s Senior Vice President. Mr. Rosen has been employed by the Sub-Adviser since November 2014, has served the Fund as Co-Portfolio Manager since October 2017, and is responsible for portfolio management and security selection, as well as due diligence, research, valuation, and sourcing of investments. Mr. Rosen also served as the Assistant Portfolio Manager for the Fund from January 2016 until October 2017, and Director of Due Diligence for Lucia Securities, LLC and held that role from November 2014 to September 2016. Prior to joining the Sub-Adviser, Mr. Rosen served as Senior Alternative Investment Analyst for AIG Advisor Group, focusing specifically on illiquid alternatives. Before that, Mr. Rosen served as the Senior Analyst for Irongate Capital Management, LLC, where he provided an extensive range of investment management services, including research and allocation decisions on investments for a family office. Mr. Rosen graduated magna cum laude from Honors Program of Boston University with a BSBA in Finance and a minor in Economics. He holds the Series 7, 63 and 66 licenses, and he holds the Chartered Financial Analyst (CFA) designation from the CFA Institute. Mr. Rosen was elected to the 2017 and 2018 Editorial Advisory Board of Real Assets Adviser magazine, and is a member of Mensa.
Mark C. Scalzo
Mr. Scalzo, Chief Investment Officer of the Sub-Adviser, is the Fund’s Co-Portfolio Manager. Mr. Scalzo has been employed by the Sub-Adviser since June 2014, has served the Fund since March 1, 2015 and is responsible for investment management, investment strategy creation, and research communications. Mr. Scalzo is also a Registered Principal of Lucia Securities, LLC, a registered broker-dealer and member of FINRA/SIPC (“Lucia Securities”), as well as serving since November 2012 as Chief Investment Officer for, and a Managing Partner of, Validus Growth Investors, LLC, a registered investment adviser. Prior to joining the Sub-Adviser, Mr. Scalzo was Executive Vice President, Co-Portfolio Manager and Director of Research, from November 2008 to October 2012, for Aletheia. Before that, he served as Group Vice President, Mergers & Acquisitions, for Fisher Asset Management, LLC, a registered investment adviser. Mr. Scalzo graduated cum laude from The Wharton School at the University of Pennsylvania with a B.S. in economics. He holds the Series 65 (Investment Advisor Representative) license with Pinhook Capital, LLC (f/k/a LCM Investment Management, LLC and FINRA Series 7, 24 and 79 licenses with Lucia Securities.
As of February 28, 2019, Aaron Rosen was responsible for the management of the following types of accounts in addition to the Fund:
| Other Accounts By Type | Total Number of Accounts by Account Type | Total Assets By Account Type | Number of Accounts by Type Subject to a Performance Fee | Total Assets By Account Type Subject to a Performance Fee |
| Registered Investment Companies | 0 | $0 | 0 | $0 |
| Other Pooled Investment Vehicles | 0 | $0 | 0 | $0 |
| Other Accounts | 0 | $324,427,085 | 0 | $0 |
As of February 28, 2019, Mark Scalzo was responsible for the management of the following types of accounts in addition to the Fund:
| Other Accounts By Type | Total Number of Accounts by Account Type | Total Assets By Account Type | Number of Accounts by Type Subject to a Performance Fee | Total Assets By Account Type Subject to a Performance Fee |
| Registered Investment Companies | 0 | $0 | 0 | $0 |
| Other Pooled Investment Vehicles | 0 | $0 | 0 | $0 |
| Other Accounts | 10 | $390,234,257 | 0 | $0 |
Because the Mr. Scalzo manages assets for other accounts (including institutional clients and certain high net worth individuals) (collectively "Client Accounts"), or may be affiliated with such Client Accounts, there may be an incentive to favor one Client Account over another, resulting in conflicts of interest. For example, the Advisor may, directly or indirectly, receive fees from Client Accounts that are higher than the fee it receives from the Advisor to the Fund, or it may, directly or indirectly, receive a performance-based fee on a Client Account. In those instances, the portfolio manager may have an incentive to not favor the Fund over the Client Accounts. The Advisor has adopted trade allocation and other policies and procedures that it believes are reasonably designed to address these and other conflicts of interest.
Aaron Rosen and Mark Scalzo are compensated through a salary.
As of February 28, 2019, the Portfolio Managers’ ownership of the Fund was as follows:
| Portfolio Managers | Dollar Range of Shares Owned |
| Aaron Rosen | $0 |
| Mark C. Scalzo | $0 |
Item 9. Purchases of Equity Securities by Closed-End Funds.Not applicable
Item 10. Submission of Matters to a Vote of Security Holders.None
Item 11. Controls and Procedures.
(a) Based on an evaluation of the Registrant’s disclosure controls and procedures as of a date within 90 days of filing date of this Form N-CSR, the principal executive officer and principal financial officer of the Registrant have concluded that the disclosure controls and procedures of the Registrant are reasonably designed to ensure that the information required in filings on Form N-CSR is recorded, processed, summarized, and reported by the filing date, including that information required to be disclosed is accumulated and communicated to the Registrant’s management, including the Registrant’s principal executive officer and principal financial officer, as appropriate to allow timely decisions regarding required disclosure.
(b) There were no significant changes in the Registrant’s internal control over financial reporting that occurred during the Registrant’s last fiscal half-year that have materially affected, or are reasonably likely to materially affect, the Registrant’s internal control over financial reporting.
Item 12. Disclosure of Securities Lending Activities for Closed-End Management Investment Companies.
(a) If the registrant is a closed-end management investment company, provide the following dollar amounts of income and fees/compensation related to the securities lending activities of the registrant during its most recent fiscal year:
(1) Gross income from securities lending activities;
(2) All fees and/or compensation for each of the following securities lending activities and related services: any share of revenue generated by the securities lending program paid to the securities lending agent(s) (“revenue split”); fees paid for cash collateral management services (including fees deducted from a pooled cash collateral reinvestment vehicle) that are not included in the revenue split; administrative fees that are not included in the revenue split; fees for indemnification that are not included in the revenue split; rebates paid to borrowers; and any other fees relating to the securities lending program that are not included in the revenue split, including a description of those other fees;
(3) The aggregate fees/compensation disclosed pursuant to paragraph (2); and (4) Net income from securities lending activities (i.e., the dollar amount in paragraph (1) minus the dollar amount in paragraph (3)).
Instruction to paragraph (a).
If a fee for a service is included in the revenue split, state that the fee is “included in the revenue split.”
(b) If the registrant is a closed-end management investment company, describe the services provided to the registrant by the securities lending agent in the registrant’s most recent fiscal year.
Item 13. Exhibits.
(a)(1) Code of Ethics filed herewith.
(a)(2) Certifications required by Section 302 of the Sarbanes-Oxley Act of 2002 (and Item 11(a)(2) of Form N-CSR) are filed herewith.
(a)(3) Not applicable.
(b) Certifications required by Section 906 of the Sarbanes-Oxley Act of 2002 (and Item 11(b) of Form N-CSR) are filed herewith.
SIGNATURES
Pursuant to the requirements of the Securities Exchange Act of 1934 and the Investment Company Act of 1940, the registrant has duly caused this report to be signed on its behalf by the undersigned, thereunto duly authorized.
(Registrant)Destra Multi-Alternative Fund
By (Signature and Title)
/s/ Robert Watson
Robert Watson
Principal Executive Officer/President
Date 5/8/19
Pursuant to the requirements of the Securities Exchange Act of 1934 and the Investment Company Act of 1940, this report has been signed below by the following persons on behalf of the registrant and in the capacities and on the dates indicated.
By (Signature and Title)
/s/ Robert Watson
Robert Watson
Principal Executive Officer/President
Date 5/8/19
By (Signature and Title)
/s/ Derek Mullins
Derek Mullins
Principal Financial Officer/Treasurer
Date 5/8/19