SECURITIES AND EXCHANGE COMMISSION
WASHINGTON, D.C. 20549
FORM 20-F
| ¨ | | REGISTRATION STATEMENT PURSUANT TO SECTION 12(b) OR (g) OF THE SECURITIES EXCHANGE ACT OF 1934 |
OR
| x | | ANNUAL REPORT PURSUANT TO SECTION 13 OR 15(d) OF THE SECURITIES EXCHANGE ACT OF 1934 |
For the fiscal year ended December 31, 2011
OR
| ¨ | | TRANSITION REPORT PURSUANT TO SECTION 13 OR 15(d) OF THE SECURITIES EXCHANGE ACT OF 1934 |
OR
| ¨ | | SHELL COMPANY REPORT PURSUANT TO SECTION 13 OR 15(d) OF THE SECURITIES EXCHANGE ACT OF 1934 |
COMMISSION FILE NUMBER: 333-175137
(Exact name of Registrant as specified in its charter)
(Jurisdiction of incorporation or organization)
|
| Fred. Roeskestraat 123, 1076 EE, Amsterdam, The Netherlands |
(Address of principal executive offices)
Contact details of Company Contact Person:
| | | | | | |
| | Name | | Johan Broekhuis | | |
| | Email | | Joost.broekhuis@atcgroup.com | | |
| | Telephone | | +31 20577 1177 | | |
| | Address | | Fred. Roeskestraat 123 1076 EE Amsterdam The Netherlands | | |
| | With a copy to: | | | | |
| | Name | | Thomas C. Reeve | | |
| | E-mail | | treeve@tomkins.co.uk | | |
| | Telephone | | +1 303 744 5059 | | |
| | Address | | Tomkins Limited 1551 Wewatta Street Denver, Colorado 80202 United States | | |
Securities registered or to be registered pursuant to Section 12(b) of the Act:
| | | | |
| Title of each class | | | | Name of each exchange on which registered |
| | |
| None. | | | | |
Securities registered or to be registered pursuant to Section 12(g) of the Act
None.
Securities for which there is a reporting obligation pursuant to Section 15(d) of the Act
9% Senior Secured Second Lien Notes
Indicate the number of outstanding shares of each of the issuer’s classes of capital or common stock as of the close of the period covered by the annual report:
| | |
Ordinary ‘B’ shares, nominal value €0.01 per share | | 1,090,037 |
| |
Preferred ‘A’ shares, nominal value €3,600 per share | | |
Indicate by check mark if the registrant is a well-known seasoned issuer, as defined in Rule 405 of the Securities Act. Yes¨ Nox
If this report is an annual or transition report, indicate by check mark if the registrant is not required to file reports pursuant to Section 13 or 15(d) of the Securities Exchange Act of 1934. Yes¨ Nox
Indicate by check mark whether the registrant (1) has filed all reports required to be filed by Section 13 or 15(d) of the Securities Exchange Act of 1934 during the preceding 12 months (or for such shorter period that the registrant was required to file such reports), and (2) has been subject to such filing requirements for the past 90 days: Yesx No¨
Indicate by check mark whether the registrant has submitted electronically and posted on its corporate Web site, if any, every Interactive Data File required to be submitted and posted pursuant to Rule 405 of Regulation S-T during the preceding 12 months (or for such shorter period that registrant was required to submit and post such files): Yes¨ No¨
Indicate by check mark whether the registrant is a large accelerated filer, an accelerated filer, or a non-accelerated filer. See definition of “accelerated filer and large accelerated filer” in Rule 12b-2 of the Exchange Act. (Check one):
Large accelerated filer ¨ Accelerated filer ¨ Non-accelerated filer x
Indicate by a check mark which basis of accounting the registrant has used to prepare the financial statements included in this filing:
| | | | |
US GAAP ¨ | | International Financial Reporting Standards as issued by the International Accounting Standards Board x | | Other ¨ |
If “Other” has been checked in response to the previous question, indicate by check mark which financial statement item the Registrant has elected to follow: Item 17 ¨ Item 18 ¨
If this is an annual report, indicate by check mark whether the registrant is a shell company (as defined in Rule 12b-2 of the Exchange Act). Yes¨ Nox
Pinafore Holdings B.V.
ANNUAL REPORT
TABLE OF CONTENTS
Pinafore Holdings B.V.
Financial and Other Information
On July 27, 2010, the independent directors of Tomkins plc and the board of directors of Tomkins Acquisitions Limited (formerly Pinafore Acquisitions Limited) announced that they had reached an agreement on the terms of a recommended cash acquisition (the ‘Acquisition’) for the entire share capital of Tomkins plc, including the Tomkins plc shares underlying the Tomkins American Depository Receipts (‘ADRs’) and certain employee equity awards, implemented by way of a scheme of arrangement under Part 26 of the UK’s Companies Act 2006 (the ‘Scheme’). On the Acquisition date, Tomkins plc was re-registered as a private company and its name was changed to Tomkins Limited.
The direct parent of Tomkins Acquisitions Limited is Pinafore Holdings B.V. (the‘Company’ or the ‘Registrant’), whose immediate and ultimate parent entity is Pinafore Coöperatief U.A. (the‘Co-operative’). The Co-operative is owned by a consortium representing the interests of Onex Corporation (‘Onex’), a Canadian private equity investor, Onex Partners III and various syndication participants, and the Canada Pension Plan Investment Board (‘CPPIB’), collectively the ‘Sponsors’.
Results of Tomkins plc and its subsidiaries (‘Tomkins’) for periods prior to the Acquisition on September 24, 2010 (‘Predecessor’) have been presented separately from those of the Company and its subsidiaries for the periods subsequent to the Acquisition (‘Successor’).
Prior to the Acquisition, Tomkins plc drew up its annual financial statements to the Saturday nearest December 31. Accordingly, Predecessor consolidated financial statements are presented for the 52-week period from January 4, 2009 to January 2, 2010 (‘Fiscal 2009’), and the 38-week period from January 3, 2010 to September 24, 2010 (‘9M 2010’). The Predecessor financial statements do not reflect the effects of the accounting for, or the financing of, the Acquisition. The Company draws up its annual financial statements to December 31. Although the Company was incorporated on September 1, 2010, it had no assets or liabilities (other than the proceeds of the shares issued on incorporation) and no operations prior to the Acquisition. Accordingly, this annual report (the ‘Annual Report’), which has been prepared in a format consistent with that of an annual report on Form 20-F, contains Successor consolidated financial statements that present the results of the Successor’s operations for the 52-week period from January 1, 2011 to December 31, 2011 (‘Fiscal 2011’) and the 14-week period from September 25, 2010 to December 31, 2010 (‘Q4 2010’).
The Company’s consolidated financial statements do not contain results for the year ended December 31, 2010 (‘Fiscal 2010’). As the Company had and has no interest in any operations other than those of Tomkins, comparison of the results of the Successor with those of the Predecessor is hindered only by the effects of the accounting for, and the financing of, the Acquisition. For the purposes of facilitating the discussion of Fiscal 2011 compared with Fiscal 2010 and Fiscal 2010 compared with Fiscal 2009, we therefore refer inItem 5‘Operating and financial review and prospects’ to our unaudited pro forma condensed consolidated income statement for Fiscal 2010 that is presented in ‘Unaudited pro forma financial information’. The unaudited pro forma financial information has been prepared in accordance with Securities and Exchange Commission (‘SEC’) Regulation S-X Article 11, as discussed further under ‘Unaudited pro forma financial information’. The unaudited pro forma financial information for Fiscal 2010 does not comply with International Financial Reporting Standards (‘IFRS’) or accounting principles generally accepted in the United States of America (‘US GAAP’) and does not purport either to represent actual results or to be indicative of results we might achieve in future periods.
In this Annual Report, all references to the ‘Group’, ‘we’, ‘us’, ‘our’ refer, except as otherwise indicated or as the context otherwise indicates, in the periods prior to the Acquisition means Tomkins and, in the period subsequent to the Acquisition, means the Company and its subsidiaries. References to ‘US dollars’, ‘$’ and ‘cents’ are to United States currency, references to ‘pounds sterling’, ‘£’, ‘pence’ and ‘p’ are to British currency, references to ‘Canadian dollars’ are to Canadian currency, and ‘Euros’ or ‘€’ are to the currency of certain member states of the European Union. These and certain other terms and acronyms used in this document are defined in the glossary to this document.
The consolidated financial statements of the Group appearing in this Annual Report are presented in US dollars and are prepared in accordance with IFRS as issued by the International Accounting Standards Board (‘IASB’), which differs in certain respects from US GAAP.
We assess the performance of our businesses using a variety of measures. Certain of these measures are not explicitly defined under IFRS and are therefore termed ‘non-GAAP measures’. Under the heading ‘Non-GAAP measures’ inItem 5‘Operating and financial review and prospects’ we identify and explain the relevance of each of the non-GAAP measures referenced herein, show how they are calculated and present a reconciliation to the most directly comparable measure defined under IFRS. We do not regard these non-GAAP measures as a substitute for, or superior to, the equivalent measures defined under IFRS. The non-GAAP measures that we use may not be directly comparable with similarly-titled measures used by other companies.
Special note regarding forward-looking statements
This Annual Report and oral statements made in connection with this document contain forward-looking statements within the meaning of Section 27A of the Securities Act of 1933 and Section 21E of the Securities Exchange Act of 1934 (the ‘Exchange Act’), including assumptions, anticipations, expectations and forecasts concerning the Company’s future business strategy, products, services, financial results, performance, future events and information relevant to our business, industries and operating environments. When used in this document, the words “may”, “will”, “intend”, “plan”, “foresee”, “anticipate”, “believe”, “expect”, “estimate”, “assume”, “could”, “should”, “continue” and similar expressions, as they relate to the Company, its end markets or its management, are intended to identify forward-looking statements.
Such statements reflect the current views of management with respect to future events and are subject to certain risks, uncertainties and assumptions. The forward-looking statements contained herein represent a good-faith assessment of our future performance for which we believe there is a reasonable basis. Important factors that could cause actual results, performance or achievements of the Company to be materially different from any future results, performance or achievements that may be expressed or implied by such forward-looking statements are disclosed underItem 3D‘Risk factors’. Some of the factors that could cause actual results to differ materially from those expressed or implied by the forward-looking statements include:
| • | | global and general economic conditions, including those specific to our end markets; |
| • | | significant global operations and global expansion; |
| • | | the impact of natural disasters and terrorist attacks; |
| • | | regulations applicable to our global operations; |
| • | | our ability to compete successfully with other companies in our industry; |
i
Pinafore Holdings B.V.
| • | | the cost and availability of raw materials; |
| • | | the cyclical nature of the non-residential construction industry; |
| • | | the downturn in the residential construction industry; |
| • | | the potential loss of key personnel; |
| • | | product liability claims against us; |
| • | | the sufficiency of our insurance policies to cover losses, including liabilities arising from litigation; |
| • | | failure to develop and maintain intellectual property rights; |
| • | | the demand for our products by automakers; |
| • | | our ability to integrate acquired companies into our business and the success of our acquisition strategy; |
| • | | environmental, health and safety laws and regulations; |
| • | | currency fluctuations from our international sales; |
| • | | labor shortages, labor costs and collective bargaining agreements; |
| • | | equipment failures, explosions and adverse weather; |
| • | | potential inability to obtain necessary capital; |
| • | | the few principal stockholders who control us; |
| • | | risks related to the Second Lien Notes, to the collateral and to high yield securities generally; |
| • | | our significant indebtedness; |
| • | | the dependence on the subsidiaries of the Company for cash to meet our debt obligations; and |
| • | | other risks and uncertainties, including those listed underItem 3D‘Risk factors’. |
Should one or more of these risks or uncertainties materialize, or should underlying assumptions prove incorrect, actual results may vary materially from those described herein. Other unpredictable factors could also cause actual results to differ materially from those in the forward-looking statements. Therefore investors should not place undue reliance on such statements as a prediction of actual results.
These forward-looking statements represent our view only as of the date they are made, and we disclaim any obligation to update forward-looking statements contained herein, except as may be otherwise required by law.
Market and industry data
In this Annual Report we have cited information compiled by certain industry sources and third parties including:
| • | | Automotive Aftermarket Industry Association (‘AAIA’) |
| • | | US Department of Transport |
| • | | IHS Global Insight Inc. (‘IHS’) |
| • | | European Automobile Manufacturers Association (‘ACEA’) |
| • | | National Association of Home Builders (‘NAHB’) |
| • | | McGraw-Hill Companies (‘McGraw-Hill’) |
| • | | McGraw-Hill Companies, ‘Dodge Construction Potential Bulletin’ (‘Dodge’) |
| • | | National Bureau of Statistics of China |
| • | | Architects Industry Association (‘AIA’) |
ii
Pinafore Holdings B.V.
Item 1
PART I
| Item 1. | Identity of Directors, Senior Management and Advisers |
Not applicable.
| Item 2. | Offer Statistics and Expected Timetable |
Not applicable.
1
Pinafore Holdings B.V.
Item 3A
A. Selected financial data
The selected financial data set out below as at December 31, 2011 and December 31, 2010 and for Fiscal 2011, Q4 2010, 9M 2010 and Fiscal 2009 has been derived from the Group’s consolidated financial statements prepared in accordance with IFRS and included in this Annual Report.
The historical financial information as at January 2, 2010 and January 3, 2009 and for the fiscal years ended January 3, 2009 (‘Fiscal 2008’) and December 29, 2007 (‘Fiscal 2007’) have also been prepared in accordance with IFRS and have been derived from audited consolidated financial statements not separately presented herein and after re-presentation for the classification of the Sensors & Valves operating segment as a discontinued operation (see note 15 to the Group’s consolidated financial statements).
The selected financial data set forth below should be read in conjunction with, and is qualified in its entirety by reference to, such consolidated financial statements and notes thereto andItem 5‘Operating and financial review and prospects’.
Consolidated income statement data
| | | | | | | | | | | | | | | | | | | | | | | | | | |
| $ million, unless otherwise stated | | SUCCESSOR | | | | | PREDECESSOR | |
| | | Fiscal 2011 | | | Q4 2010 | | | | | 9M 2010 | | | Fiscal 2009 | | | Fiscal 2008 | | | Fiscal 2007 | |
Sales | | | 4,590.7 | | | | 1,181.3 | | | | | | 3,270.4 | | | | 3,866.5 | | | | 5,094.9 | | | | 5,472.6 | |
| | | | | | | |
Operating profit/(loss) | | | 272.9 | | | | (204.3 | ) | | | | | 313.2 | | | | 88.2 | | | | 39.2 | | | | 554.2 | |
| | | | | | | |
Profit/(loss) for the period from continuing operations | | | 19.6 | | | | (269.4 | ) | | | | | 224.6 | | | | 18.8 | | | | (66.0 | ) | | | 375.0 | |
| | | | | | | |
Profit/(loss) for the period from discontinued operations | | | 37.6 | | | | (0.8 | ) | | | | | 19.0 | | | | (12.8 | ) | | | 19.5 | | | | (56.5 | ) |
| | | | | | | |
Profit/(loss) for the period | | | 57.2 | | | | (270.2 | ) | | | | | 243.6 | | | | 6.0 | | | | (46.5 | ) | | | 318.5 | |
| | | | | | | |
Profit/(loss) for the period attributable to equity shareholders | | | 27.9 | | | | (271.1 | ) | | | | | 217.4 | | | | (15.6 | ) | | | (64.6 | ) | | | 293.5 | |
| | | | | | | |
Dividend per share paid or proposed during the period: | | | | | | | | | | | | | | | | | | | | | | | | | | |
– Interim (cents per share) | | | — | | | | — | | | | | | — | | | | 3.50 c | | | | 11.02 | c | | | 11.02 | c |
– Final (cents per share) | | | — | | | | — | | | | | | — | | | | 6.50 c | | | | 2.00 | c | | | 16.66 | c |
| | | | | | | | | | | | | | | | | | | | | | | | | | |
| | | — | | | | — | | | | | | — | | | | 10.00 c | | | | 13.02 | c | | | 27.68 | c |
| | | | | | | | | | | | | | | | | | | | | | | | | | |
Consolidated balance sheet data
| | | | | | | | | | | | | | | | | | | | | | |
$ million | | SUCCESSOR | | | | | PREDECESSOR | |
| | | As at
December 31,
2011 | | | As at
December 31,
2010 | | | | | As at
January 2,
2010 | | | As at
January 3,
2009 | | | As at
December 29,
2007 | |
| | | | | | |
Total assets | | | 6,705.2 | | | | 7,552.3 | | | | | | 3,673.6 | | | | 3,770.7 | | | | 4,472.9 | |
Net assets | | | 2,343.6 | | | | 2,339.8 | | | | | | 1,678.0 | | | | 1,739.3 | | | | 2,254.8 | |
Share capital | | | — | | | | — | | | | | | 79.6 | | | | 79.6 | | | | 65.5 | |
Share premium account | | | 2,143.3 | | | | 2,124.7 | | | | | | 799.2 | | | | 799.1 | | | | 679.4 | |
Shareholders’ equity | | | 2,074.9 | | | | 2,028.3 | | | | | | 1,536.6 | | | | 1,610.8 | | | | 2,137.8 | |
Acquisitions and disposals
Acquisitions and disposals during the three most recent fiscal years are detailed in ‘Principal acquisitions and disposals’ underItem 4A‘History and development of the Company’.
B. Capitalization and indebtedness
Not applicable.
C. Reasons for the offer and use of proceeds
Not applicable.
2
Pinafore Holdings B.V.
Item 3D
D. Risk factors
Tomkins operates globally in a variety of markets and is affected by a number of risks inherent in its activities. Business risk can be considered either as downside risk (the risk that something can go wrong and result in a financial loss or exposure) or volatility risk (the risk associated with uncertainty, meaning there may be an opportunity for financial gain as well as the potential for loss).
We outline below the risks and uncertainties that the Company’s management board (the ‘Board’) believes have the potential to affect the Group’s results or financial position. We have not listed these risks in any order of priority. Details of the Group’s risk management procedures are set out under the heading ‘Internal control’ underItem 15‘Controls and procedures’.
Additional risks that we currently do not regard as significant, could also have a material adverse effect on our results or financial position. Our analysis of our principal risks and uncertainties should, therefore, be read in conjunction with the cautionary statement regarding forward-looking statements set out on page i.
When applying the Group’s accounting policies, management must make assumptions and estimates about the future that may differ from actual outcomes. We discuss the key sources of estimation uncertainty that have a significant risk of causing a material adjustment to the carrying amount of the Group’s assets and liabilities in note 4 to the Group’s consolidated financial statements.
Risks associated with our strategy and the competitiveness of our operations
Our strategy to expand our geographical reach may be impacted by economic, political and other risks associated with international operations, and this could adversely affect our business.
One of our key strategies is to expand our geographic reach, and as a result, a substantial portion of our operations are conducted and located outside the US. In Fiscal 2011, approximately 49% of sales from continuing operations originated from outside of the US. We have manufacturing, sales and service facilities spanning four continents and sell to customers in over 150 countries. Moreover, a significant amount of our manufacturing functions and sources of our raw materials and components are from Asia, principally China. Accordingly, our business and results of operations, as well as the business and results of operations of our vendors, suppliers and customers, are subject to risks associated with doing business internationally, including:
| • | | changes in foreign currency exchange rates; |
| • | | trade protection measures, such as tariff increases, and import and export licensing and control requirements; |
| • | | the complexities of operating within multiple tax jurisdictions, including potentially negative consequences from changes in tax laws or from tax examinations, which may, in addition, require an extended period of time to resolve; |
| • | | instability in a specific country’s or region’s political, economic or social conditions, particularly in emerging markets and the Middle East; |
| • | | difficulty in staffing and managing widespread operations; |
| • | | difficulty of enforcing agreements and collecting receivables through some foreign legal systems; |
| • | | differing and, in some cases, more stringent labor regulations; |
| • | | partial or total expropriation; |
| • | | differing protection of intellectual property; |
| • | | unexpected changes in regulatory requirements and required compliance with a variety of foreign laws, including environmental regulations and laws; |
| • | | the burden of complying with multiple and possibly conflicting laws and any unexpected changes in regulatory requirements; |
| • | | differing local product preferences and product requirements; |
| • | | strong competition from companies that are already established in the markets we seek to enter; |
| • | | inability to repatriate income or capital; and |
| • | | difficulty in administering and enforcing corporate policies, which may be different than the normal business practices of local cultures. |
Dependence on the continued operation of our manufacturing facilities.
While we are not heavily dependent on any single manufacturing facility, major disruptions at a number of our manufacturing facilities, due to labor unrest, natural disasters, terrorist attacks, significant mechanical failure of our facilities, or other catastrophic event, could result in significant interruption of our business and a potential loss of customers and sales or could significantly increase our operating costs.
We are subject to anti-corruption laws in various jurisdictions, as well as other laws governing our international operations; if we fail to comply with these laws we could be subject to civil or criminal penalties, other remedial measures, and legal expenses, which could adversely affect our business, financial condition and results of operations.
Our international operations are subject to one or more anti-corruption laws in various jurisdictions, such as the US Foreign Corrupt Practices Act of 1977, as amended (‘FCPA’), the UK Bribery Act of 2010 and other anticorruption laws. The FCPA and these other laws generally prohibit employees and intermediaries from bribing or making other prohibited payments to foreign officials or other persons to obtain or retain business or gain some other business advantage. We operate in a number of jurisdictions that pose a high risk of potential FCPA violations, and we participate in joint ventures and relationships with third parties whose actions could potentially subject us to liability under the FCPA. In addition, we cannot predict the nature, scope or effect of future regulatory requirements to which our international operations might be subject or the manner in which existing laws might be administered or interpreted.
3
Pinafore Holdings B.V.
Item 3D
We are also subject to other laws and regulations governing our international operations, including regulations administered by the US Department of Commerce’s Bureau of Industry and Security, the US Department of Treasury’s Office of Foreign Asset Control, and various non-US government entities, including applicable export control regulations, economic sanctions on countries and persons, customs requirements, currency exchange regulations, and transfer pricing regulations (collectively, ‘Trade Control laws’).
We have instituted policies, procedures and ongoing training of certain employees with regard to business ethics, designed to ensure that we and our employees comply with the FCPA, other anticorruption laws and Trade Control laws. However, there is no assurance that our efforts have been and will be completely effective in ensuring our compliance with all applicable anti-corruption laws, including the FCPA, or other legal requirements. If we are not in compliance with the FCPA, other anti-corruption laws or Trade Control laws, we may be subject to criminal and civil penalties, disgorgement and other sanctions and remedial measures, and legal expenses, which could have an adverse impact on our business, financial condition, results of operations and liquidity. Likewise, any investigation of any potential violations of the FCPA or other anti-corruption laws by US or foreign authorities could also have an adverse impact on our business, financial condition and results of operations.
We face competition in all areas of our business and may not be able to successfully compete with our competitors, which could lead to lower levels of profits and reduce the amount of cash we generate.
We are subject to competition from other producers of products that are similar to ours. Our customers often demand delivery of our products on a tight time schedule and in a number of geographic markets. If our quality of service declines or we cannot meet the demands of our customers, they may utilize the services of our competitors. Our competitors include manufacturers that may be better capitalized, may have a more extensive low-cost sourcing strategy and presence in low-cost regions or may receive significant governmental support and as a result, may be able to offer more aggressive pricing. If we are unable to continue to provide technologically superior or better quality products or to price our products competitively, our ability to compete could be harmed and we could lose customers or market share.
We are subject to risks from litigation that may materially impact our operations.
We face an inherent business risk of exposure to various types of claims and lawsuits. We are involved in various intellectual property, product liability, product warranty, environmental claims and lawsuits, and other legal proceedings arising in the ordinary course of our business. Although it is not possible to predict with certainty the outcome of every claim and lawsuit and the range of probable loss, we believe these lawsuits and claims will not individually or in the aggregate have a material impact on our results. However, we could in the future be subject to various lawsuits, including, amongst others, intellectual property, product liability, product warranty, environmental claims and antitrust claims, and we may incur judgments or enter into settlements of lawsuits and claims that could have a material adverse effect on our results of operations in any particular period.
Our insurance may not fully cover all future losses we may incur.
Manufacturers of products such as ours are subject to inherent risks. We maintain an amount of insurance protection that we consider adequate, but we cannot provide any assurance that our insurance will be sufficient or provide effective coverage under all circumstances and against all hazards or liabilities to which we may be subject. Specifically, our insurance may not be sufficient to replace facilities or equipment that are damaged in part or in full. Damages or third party claims for which we are not fully insured could hurt our financial results and materially harm our financial condition. Further, due to rising insurance costs and changes in the insurance markets, insurance coverage may not continue to be available at all or at rates or on terms similar to those presently available. Additionally, our insurance may subject us to significant deductibles, self-insured retentions, retrospectively rated premiums or similar costs. Any losses not covered by insurance could have a material adverse effect on us. We typically purchase business interruption insurance for our facilities. However, if we have a stoppage, our insurance policies may not cover every contingency and may not be sufficient to cover all of our lost revenues. In the future, we may be unable to purchase sufficient business interruption insurance at desirable costs.
We supply products to industries that are subject to inherent risks, including equipment defects, malfunctions and failures and natural disasters, which could result in unforeseen and damaging events. These risks may expose us, as an equipment operator and supplier, to liability for personal injury, wrongful death, property damage, and pollution and other environmental damage. The insurance we carry against many of these risks may not be adequate to cover our claims or losses. Further, insurance covering the risks we expect to face or in the amounts we desire may not be available in the future or, if available, the premiums may not be commercially justifiable. If we were to incur substantial liability and such damages were not covered by insurance or were in excess of policy limits, or if we were to incur liability at a time when we were not able to obtain liability insurance, our business, results of operations, cash flows and financial condition could be negatively impacted. If our clients suffer damages as a result of the occurrence of such events, they may reduce their business with us.
Failure to develop, obtain and protect intellectual property rights could adversely affect our competitive position.
Our success depends on our ability to develop technologies and inventions used in our products and to brand such products, to obtain intellectual property rights in such technologies, inventions, and brands, and to protect and enforce such intellectual property rights. In this regard, we rely on US and foreign trademark, patent, copyright, and trade secret laws, as well as license agreements, nondisclosure agreements, and confidentiality and other contractual provisions. Nevertheless, the technologies and inventions developed by our engineers in the future may not prove to be as valuable as those of competitors, or competitors may develop similar or identical technologies and inventions independently of us and before we do.
We may not be able to obtain patents or other intellectual property rights in our new technologies and inventions or, if we do, the scope of such rights may not be sufficiently broad to afford us any significant commercial advantage over our competitors. Owners of intellectual property rights that we need to conduct our business as it evolves may be unwilling to license such intellectual property rights to us on terms we consider reasonable. Competitors and others may successfully challenge the ownership, validity, and/or enforceability of our intellectual property rights. In the past, pirates have counterfeited certain of our products and sold them under our trademarks, which has led to loss of sales. It is difficult to police such counterfeiting, particularly on a worldwide basis, and the efforts we take to stop such counterfeiting may not be effective.
4
Pinafore Holdings B.V.
Item 3D
Our other efforts to enforce our intellectual property rights against infringers may not prove successful and will likely be time consuming and expensive and may divert management’s attention from the day-to-day operation of our business. Adequate remedies may not be available in the event of an unauthorized use or disclosure of our trade secrets and manufacturing expertise. If we fail to successfully enforce our intellectual property rights, our competitive position could suffer, which could harm our business, financial condition, results of operations and cash flows. We operate in industries with respect to which there are many patents, and it is not possible for us to ascertain that none of our products infringes any patents. If we were found to infringe any patent rights or other intellectual property rights of others, we could be required to pay substantial damages or we could be enjoined from offering certain products and services.
Our information technology systems suffer from certain deficiencies, which we are in the process of remedying.
Through acquisitions of other companies, we have inherited multiple stand-alone Enterprise Resource Planning (‘ERP’) systems, and in general our information technology systems are decentralized. This decentralization leads to security risks and makes access to common applications cumbersome. We are in the midst of several large-scale information technology projects, including with respect to ERP systems and consolidation of applications and servers. The costs of such projects may exceed the amounts we have budgeted for them, and any material failures in the execution of such projects may hinder our day-to-day operations.
Pricing pressures from our customers may adversely affect our business.
We face the greatest pricing pressure from our customers in the automotive Original Equipment (‘OE’) end market. Virtually all vehicle manufacturers seek price reductions in both the initial bidding process and during the term of the award. We are also, from time to time, subject to pricing pressures from customers in our other end markets. If we are not able to offset price reductions through improved operating efficiencies and reduced expenditures or new product introduction, those price reductions may have a material adverse effect on our results of operations.
We may in the future dispose of non-core businesses or acquire related businesses, which we may not be able to successfully integrate, and we may be unable to recoup our investment in these businesses.
From time to time we may make strategic acquisitions of complementary businesses to expand our product portfolio and geographic presence and may dispose of non-core businesses. Acquisitions and disposals, particularly investments in emerging markets, involve legal, economic and political risks. We also encounter risks in the selection of appropriate investment and disposal targets, execution of the transactions and integration of acquired businesses.
While we believe we have successfully integrated the operations we have acquired, we may not be able to effectively integrate future acquisitions or successfully implement appropriate operational, financial and management systems and controls to achieve the benefits expected to result from these acquisitions. As a result, we may not be able to recoup our investment in those acquisitions or achieve the economic benefits that we anticipate from these acquisitions. Our efforts to integrate these businesses could be affected by a number of factors beyond our control, such as general economic conditions and increased competition. In addition, the process of integrating these businesses could cause the interruption of, or loss of momentum in, the activities of our existing business and the diversion of management’s attention. These impacts and any delays or difficulties encountered in connection with the integration of these businesses could negatively impact our business and results of operations.
Environmental compliance costs and liabilities and responses to concerns regarding climate change could affect our financial condition, results of operations and cash flows adversely.
Our operations and properties are subject to stringent US and foreign, federal, state, local and provincial laws and regulations relating to environmental protection, including laws and regulations governing the investigation and clean up of contaminated properties as well as air emissions, water discharges, waste management and disposal and workplace health and safety. Such laws and regulations affect all of our operations, are continually changing, are generally different in every jurisdiction and can impose substantial fines and sanctions for violations. Further, they may require substantial clean-up costs for our properties (many of which are sites of long-standing manufacturing operations) and the installation of costly pollution control equipment or operational changes to limit pollution emissions and/or decrease the likelihood of accidental releases of regulated materials. We must conform our operations and properties to these laws and adapt to regulatory requirements in all jurisdictions as these requirements change.
Terrorist acts, conflicts and wars may materially adversely affect our business, financial condition and results of operations.
As a Group with a large international footprint, we are subject to increased risk of damage or disruption to us, our employees, facilities, partners, suppliers, distributors, resellers or customers due to terrorist acts, conflicts and wars, wherever located around the world. The potential for future attacks, the national and international responses to attacks or perceived threats to national security, and other actual or potential conflicts or wars have created many economic and political uncertainties. Although it is impossible to predict the occurrences or consequences of any such events, they could result in a decrease in demand for our products, make it difficult or impossible to deliver products to our customers or to receive components from our suppliers, create delays and inefficiencies in our supply chain and result in the need to impose employee travel restrictions, and thereby adversely affect our business, financial condition, results of operations and cash flows.
We have taken, and continue to take, cost-reduction actions, which may expose us to additional production risk and we may not be able to maintain the level of cost reductions that we have achieved.
We have been reducing costs in all of our businesses and have discontinued product lines, exited businesses, consolidated manufacturing operations and reduced our employee population. The impact of these cost-reduction actions on our sales and profitability may be influenced by many factors and we may not be able to maintain the level of cost savings that we have achieved depending on our ability to successfully complete these efforts. In connection with the implementation and maintenance of our cost reduction measures, we may face delays in implementation of anticipated workforce reductions, a decline in employee morale and a potential inability to meet operational targets due to an inability to retain or recruit key employees.
5
Pinafore Holdings B.V.
Item 3D
We are exposed to exchange rate fluctuations in the international markets in which we operate.
We conduct operations in many areas of the world involving transactions denominated in a variety of functional currencies. We are subject to currency exchange rate risk to the extent that our costs may be denominated in currencies other than those in which we earn and report revenues and vice versa. In addition, a decrease in the value of any of these currencies relative to the US dollar could reduce our profits from non-US operations and the translated value of the net assets of our non-US operations when reported in US dollars in our financial statements. This could have a negative impact on our business, financial condition or results of operations as reported in US dollars. Fluctuations in currencies may also make it more difficult to perform period-to-period comparisons of our reported results of operations.
We anticipate that there will be instances in which costs and revenues will not be exactly matched with respect to currency denomination. As a result, to the extent we expand geographically, we expect that increasing portions of our revenues, costs, assets and liabilities will be subject to fluctuations in foreign currency valuations. We may experience economic loss and a negative impact on earnings or net assets solely as a result of foreign currency exchange rate fluctuations. Further, the markets in which we operate could restrict the removal or conversion of the local or foreign currency, resulting in our inability to hedge against these risks.
We also face risks arising from the imposition of exchange controls and currency devaluations. Exchange controls may limit our ability to convert foreign currencies into US dollars or to remit dividends and other payments by our foreign subsidiaries or businesses located in or conducted within a country imposing controls. Currency devaluations result in a diminished value of funds denominated in the currency of the country instituting the devaluation. Actions of this nature, if they occur or continue for significant periods of time, could have an adverse effect on our results of operations and financial condition in any given period.
Risks associated with our markets
Conditions in the global economy and the major end markets we serve may materially and adversely affect the business and results of operations of our businesses should they deteriorate.
The business and operating results of our Industrial & Automotive (‘I&A’) and Building Products business groups have been, and will continue to be, affected by worldwide economic conditions, including conditions in the general industrial, automotive, non-residential and residential construction end markets we serve. As a result of continuing effects from the slowdown in global economic growth, the credit market crisis, declining consumer and business confidence, increased unemployment, reduced levels of capital expenditures, fluctuating commodity prices, bankruptcies and other challenges affecting the global economy, some of our customers may experience the deterioration of their businesses, cash flow shortages or difficulty obtaining financing. As a result, existing or potential customers may delay or cancel plans to purchase our products and services and may not be able to fulfill their obligations to us in a timely fashion.
Further, our vendors may be experiencing similar conditions, which may impact their ability to fulfill their obligations to us. If the global economic slowdown continues for a significant period or there is significant further deterioration in the global economy, our results of operations, financial position and cash flows could be materially adversely affected.
The non-residential construction end market is cyclical and affects market conditions for our products and services.
The non-residential construction end market is cyclical, and the downturn in this end market has caused a decline in the demand for our products. Certain of our products are primarily used in the non-residential construction end market and therefore our sales and earnings are strongly influenced by decreased non-residential construction activity. Non-residential construction activity can decline because of many other factors that we cannot control, such as a decline in general economic activity or the availability of credit, a decrease in infrastructure spending, an increase in raw material and overall construction costs and interest rate increases.
A portion of our business relies on home improvement and new home construction activity levels, both of which are inherently cyclical and recently experienced a significant downturn.
A portion of our business relies on the residential new construction and repair and refurbishment end markets. The residential new construction market, which is cyclical in nature, has undergone a significant downturn marked by declines in the demand for new homes, an oversupply of new and existing homes on the market and a reduction in the availability of financing for homebuyers. The oversupply of existing homes held for sale has been exacerbated by a growing number of home mortgage foreclosures, which has contributed to the downward pressure on home prices. Low levels of consumer confidence, high levels of unemployment and the downward pressure on home prices have made it more difficult for some homeowners to make additional investments in their homes, such as remodeling projects. Further, disruptions in the credit markets have limited the ability of consumers to finance home improvements. In addition, the economic turmoil has caused certain shifts in consumer preferences and purchasing practices and has resulted in changes in the business models and strategies of our customers. Such shifts, which may or may not be long-term, have altered the nature and prices of products demanded by the end consumer and our customers. If we do not timely and effectively respond to these changing consumer preferences, our relationships with our customers could be adversely affected, the demand for our products could be reduced and our market share could be negatively affected.
Longer product lives of automotive parts are adversely affecting aftermarket demand for some of our products.
The average useful life of automotive parts has steadily increased in recent years due to innovations in products, technologies and manufacturing processes. The longer product lives allow vehicle owners to replace parts of their vehicles less often. As a result, a portion of sales in the aftermarket has been displaced. This has adversely impacted, and could continue to adversely impact, our aftermarket sales. Also, any additional increases in the average useful lives of automotive parts would further adversely affect the demand for our aftermarket products.
6
Pinafore Holdings B.V.
Item 3D
We may not be able to accurately forecast demand or meet significant increases in demand for our products.
Certain of our businesses operate with short lead times and we order raw materials and supplies and plan production based on discussions with our customers and internal forecasts of demand. If we are unable to accurately forecast demand for our products, in terms of both volume and specific products, or react appropriately to abrupt changes in demand, we may experience delayed product shipments and customer dissatisfaction. Additionally, if demand increases significantly from the current, historically low levels, both we and our suppliers may have difficulty meeting such demand, particularly if such demand increases occur rapidly. Failure to accurately forecast demand or meet significant increases in demand could have an adverse impact on our business, financial condition and operating results.
Risks associated with our products
If we are unable to obtain raw materials at favorable prices in sufficient quantities, or at the time we require them, our operating margins and results of operations may be adversely affected.
We purchase our energy, steel, aluminum, rubber and rubber-based materials, and other key manufacturing inputs from outside sources. We do not traditionally have long-term pricing contracts with raw material suppliers. The costs of these raw materials have been volatile historically and are influenced by factors that are outside our control. In recent years, the prices for energy, metal alloys, polymers and certain other of our raw materials have been extremely volatile. While we strive to avoid this risk through the use of price escalation mechanisms with respect to our raw materials in our customer contracts and we seek to offset our increased costs with gains achieved through operational efficiencies, if we are unable to pass increases in the costs of our raw materials on to our customers, our operating margins and results of operations may be adversely affected if operational efficiencies are not achieved.
Additionally, our businesses compete globally for key production inputs. The availability of qualified suppliers and of certain raw materials, energy or other key inputs may be disrupted by any number of geopolitical factors, including political unrest and significant weather events. Such disruptions may require additional capital or operating expenditure by us or force reductions in our production volumes.
We may be subject to recalls, product liability claims or may incur costs related to product warranties that may materially and adversely affect our business.
Meeting or exceeding many government-mandated safety standards is costly and requires manufacturers to remedy defects related to product safety through recall campaigns if the products do not comply with safety standards. If we, customers or government regulators determine that a product is defective or does not comply with safety standards prior to the start of production, the launch of a product could be delayed until such defect is remedied. The costs associated with any protracted delay of a product launch or a recall campaign to remedy defects in products that have been sold could be substantial.
We face an inherent risk of product liability claims if product failure results in any claim for injury or loss. Litigation is inherently unpredictable and these claims, regardless of their outcome, may be costly, divert management attention and adversely affect our reputation. Supplier consolidation and the increase in low-cost country sourcing may increase the likelihood of receiving defective materials, thereby increasing the risk of product failure and resulting liability claims. In addition, even if we are successful in defending against a claim relating to our products, claims of this nature could cause our customers to lose confidence in our products and us.
From time to time, we receive product warranty claims from our customers, pursuant to which we may be required to bear costs of repair or replacement of certain of our products. Vehicle manufacturers are increasingly requiring their outside suppliers to participate in the warranty of their products and to be responsible for the operation of these component products in new vehicles sold to consumers. Warranty claims may range from individual customer claims to full recalls of all products in the field. It cannot be assured that costs associated with providing product warranties will not be material.
We are dependent on market acceptance of new product introductions and product innovations for continued revenue growth.
The markets in which we operate are subject to technological change. Our long-term operating results depend substantially upon our ability to continually develop, introduce, and market new and innovative products, to modify existing products, to respond to technological change, and to customize certain products to meet customer requirements and evolving industry standards. There are numerous risks inherent in this process, including the risks that we will be unable to anticipate the direction of technological change or that we will be unable to develop and market new products and applications in a timely fashion to satisfy customer demands.
Risks relating to our people
If we lose our senior management or key personnel, our business may be materially and adversely affected.
The success of our business is largely dependent on our senior management team, as well as on our ability to attract and retain other qualified key personnel. In addition, there is significant demand in our industry for skilled workers. It cannot be assured that we will be able to retain all of our current senior management personnel and to attract and retain other necessary personnel, including skilled workers, necessary for the development of our business. The loss of the services of senior management and other key personnel or the failure to attract additional personnel as required could have a material adverse effect on our business, financial condition and results of operations.
We may be adversely impacted by work stoppages and other labor matters.
As of December 31, 2011, we had approximately 24,700 employees worldwide. Certain of our employees are represented by various unions under collective bargaining agreements. While we have no reason to believe that we will be impacted by work stoppages and other labor matters, we cannot assure that future issues with our labor unions will be resolved favorably or that we will not encounter future strikes, work stoppages, or other types of conflicts with labor unions or our employees. Any of these factors may have an adverse effect on us or may limit our flexibility in dealing with our workforce. In addition, many of our customers have unionized work forces. If one or more of our customers experience a material work stoppage, it could similarly have a material adverse effect on our business, results of operations and financial condition.
7
Pinafore Holdings B.V.
Item 3D
Risks relating to our funding
We are dependent upon lenders for financing to execute our business strategy and meet our liquidity needs and the lack of adequate financing could negatively impact our business.
The Group may require capital to expand its business, implement its strategic initiatives and remain competitive. In the current volatile credit market, exacerbated by Eurozone sovereign debt concerns, there is risk that any lenders, even those with strong balance sheets and sound lending practices, could fail or refuse to honor their legal commitments and obligations under existing credit commitments, including but not limited to: extending credit up to the maximum permitted by a credit facility, allowing access to additional credit features and otherwise accessing capital and/or honoring loan commitments. If our lenders failed to honor their legal commitments under our senior secured revolving credit facility, it could be difficult in this environment to replace our senior secured revolving credit facility on similar terms.
Failure to obtain sufficient funding to meet our liquidity requirements may result in our losing business opportunities or in the curtailment of capital spending, research and development and other important strategic programs.
Restrictions on the availability of credit may cause some of our customers to be slower in settling the amounts that they owe to us, thereby reducing our own liquidity or, indeed, may cause them to be unable to pay the amounts that they owe to us. Restrictions on the availability of credit also increase the risk that some of our suppliers may fail, which could cause disruption in the supply of critical inputs to our manufacturing processes. If there were any interruption in the supply of our products to any of our customers, we may lose sales to those customers and there would be the risk that some of them would migrate to other suppliers.
If management’s plans or assumptions regarding the funding requirements change, the Group may need to seek other sources of financing, such as additional lines of credit with commercial banks or vendors or public financing, or to renegotiate existing bank facilities. It is possible that additional funding may not be available on commercially acceptable terms or at all.
We have substantial indebtedness, the size and terms of which could affect our ability to meet our debt obligations and may otherwise restrict our activities
As of December 31, 2011, we had total principal debt outstanding of $2,819.9 million. We are permitted by the terms of our debt instruments to incur substantial additional indebtedness, subject to the restrictions therein. Our inability to generate sufficient cash flow to satisfy our debt obligations, or to refinance our obligations on commercially reasonable terms, would have a material adverse effect on our business, financial condition and results of operations.
Our substantial indebtedness could have important consequences, for example, it could:
| • | | make it more difficult for us to satisfy our obligations under our indebtedness; |
| • | | limit our ability to borrow money for our working capital, capital expenditures, debt service requirements or other corporate purposes; |
| • | | require us to dedicate a substantial portion of our cash flow to payments on our indebtedness, which would reduce the amount of cash flow available to fund working capital, capital expenditures and other corporate requirements; |
| • | | increase our vulnerability to general adverse economic and industry conditions; |
| • | | limit our ability to respond to business opportunities; and |
| • | | subject us to financial and other restrictive covenants, which, if we fail to comply with these covenants and our failure is not waived or cured, could result in an event of default under our debt. |
In addition, our existing debt obligations contain, and any future indebtedness of ours would likely contain, a number of restrictive covenants that will impose significant operating and financial restrictions on us, including, amongst others, restrictions on our ability to incur or guarantee additional debt, make certain investments and engage in sales of assets and subsidiary stock.
A failure to comply with the covenants contained in our debt agreements could result in an event of default, which, if not cured or waived, could have a material adverse effect on our business, financial condition and results of operations. In the event of any default, the lenders:
| • | | will not be required to lend any additional amounts to us; |
| • | | could elect to declare all borrowings outstanding, together with accrued and unpaid interest and fees, to be due and payable; |
| • | | may have the ability to require us to apply all of our available cash to repay these borrowings; or |
| • | | may prevent us from making debt service payments under our other agreements. |
Such actions by lenders could cause cross defaults under our other indebtedness.
We have pledged and will pledge substantially all of our assets as collateral under our senior secured credit facilities and the indenture governing the senior secured second lien notes due in 2018 (‘Second Lien Notes’) subject to certain exceptions. If any of the holders of our indebtedness accelerate the repayment of such indebtedness, there can be no assurance that we will have sufficient assets to repay our indebtedness. If we were unable to repay those amounts, the holders of our secured indebtedness could proceed against the collateral granted to them to secure that indebtedness.
We may not be able to generate sufficient cash to service all of our indebtedness, and may be forced to take other actions to satisfy our obligations under our indebtedness that may not be successful.
Our ability to satisfy our debt obligations will depend upon, among other things:
| • | | our future financial and operating performance, which will be affected by prevailing economic conditions and financial, business, regulatory and other factors, many of which are beyond our control; and |
| • | | the future availability of borrowings under our senior secured credit facilities, which depends on, among other things, our complying with the covenants in those facilities. |
It cannot be assured that our business will generate sufficient cash flow from operations, or that future borrowings will be available to us under our senior secured credit facilities or otherwise, in an amount sufficient to fund our liquidity needs.
8
Pinafore Holdings B.V.
Item 3D
If our cash flows and capital resources are insufficient to service our indebtedness, we may be forced to reduce or delay capital expenditures, sell assets, seek additional capital or restructure or refinance our indebtedness, including the Second Lien Notes. These alternative measures may not be successful and may not permit us to meet our scheduled debt service obligations. Our ability to restructure or refinance our debt will depend on the condition of the capital markets and our financial condition at such time. Any refinancing of our debt could be at higher interest rates and may require us to comply with more onerous covenants, which could further restrict our business operations. In addition, the terms of existing or future debt agreements, may restrict us from adopting some of these alternatives. In the absence of such operating results and resources, we could face substantial liquidity problems and might be required to dispose of material assets or operations to meet our debt service and other obligations. We may not be able to consummate those dispositions for fair market value or at all, and any proceeds that we could realize from any such dispositions may not be adequate to meet our debt service obligations then due.
If we are required to make unexpected payments to any pension plans applicable to our employees, our financial condition may be adversely affected.
Some of our employees participate in defined benefit pension plans, the majority of which are in the UK and US. In aggregate, the defined benefit plans were in deficit by $1.7 million as at December 31, 2011. Tomkins has guaranteed the obligations of Gates UK Limited to its pension plan, and the obligations of Tomkins’ subsidiary that is the “principal employer” of the one section of the 2008 pension plan that is not directly sponsored by Tomkins. Various factors, such as changes in actuarial estimates and assumptions (including in relation to life expectancy and rate of return on assets) as well as actual return on assets, can increase the net expenses and net liabilities of the defined benefit pension plans. The assets and liabilities of the plans must be valued from time to time under applicable funding rules and as a result we may be required to increase the cash payments we make under these defined benefit pension plans. For a further description of the pension deficit see note 35 to the Group’s consolidated financial statements.
We could also be required at any time to make accelerated payments up to the full buy-out deficit in our defined benefit pension plans, which would likely be far higher than the normal ongoing funding cost of the plans, if we receive a “Contribution Notice” or a “Financial Support Direction” from the Pensions Regulator or if we are required to terminate one or more of the US defined benefit pension plans by the US Pension Benefit Guarantee Corporation (‘PBGC’). A Contribution Notice typically can be issued where there has been an act or omission which is materially detrimental to the pension plan or has as one of its main purposes the prevention of the recovery of a debt due to the plan or the compromise or settlement of such a debt. A Financial Support Direction can be issued at any time where the employer in the plan is either a services company or insufficiently resourced (meaning that its net assets are less than fifty percent of its share of the buy-out deficit in the relevant plan, and there are other group companies who have sufficient assets to make up the difference). The PBGC may institute proceedings to terminate a US defined benefit pension plan for a number of reasons, including if it determines that a plan will be unable to pay benefits when due or if the possible long-run loss of the PBGC with respect to a plan may reasonably be expected to increase unreasonably if the plan is not terminated.
Our reported results of operations and financial condition may be adversely affected to the extent that we are required to make any additional payments to any relevant defined benefit pension plans in excess of the amounts assumed in our current plans or that we must report higher pension plan expenses under IAS19 ‘Employee Benefits’.
Risks relating to the Second Lien Notes
In addition to the above risks, holders of the Second Lien Notes should be aware of the following risks related specifically to the Second Lien Notes:
The entities that issued the Second Lien Notes, Tomkins, Inc. and Tomkins, LLC (the ‘Issuers’), are wholly owned financing subsidiaries of the Company with no operations of their own and they are dependent upon payments under the intercompany loans from other subsidiaries of the Company to meet their obligations under the Second Lien Notes.
The Issuers have limited assets and no business operations other than operations related to issuing and servicing the Second Lien Notes and engaging in related transactions. Upon the consummation of the initial offering of the Second Lien Notes, the Issuers on-lent the proceeds from the issuance of those notes to other subsidiaries of the Company through intercompany loans. The Issuers’ ability to make payments on the Second Lien Notes is dependent directly on payments to the Issuers under these intercompany loans. The ability of the obligors to make payments to the Issuers under these intercompany loans will depend on a number of factors, some of which may be beyond our control.
The Second Lien Notes are structurally subordinated to all liabilities of the non-guarantor subsidiaries of the Company.
The Second Lien Notes are structurally subordinated to the indebtedness and other liabilities of the current and future subsidiaries of the Company that do not guarantee the Second Lien Notes. The non-guarantor subsidiaries and any future non-guarantor subsidiaries are separate and distinct legal entities and have no obligation, contingent or otherwise, to pay any amounts due pursuant to the Second Lien Notes, or to make any funds available therefore, whether by dividends, loans, distribution or other payments. The non-guarantor subsidiaries accounted for the following proportion of our ongoing operations: (i) 42% of sales in Fiscal 2011; (ii) 47% of adjusted EBITDA in Fiscal 2011; (iii) 41% of total assets at the end of Fiscal 2011; and (iv) 13% of total liabilities at the end of Fiscal 2011. Both (i) and (ii) are calculated excluding corporate center entities. In the event that Rule 3-10 of Regulation S-X under the Securities Act would require separate financial statements of any subsidiary that is a guarantor to be filed with the SEC solely because such subsidiary’s guarantee is not a full and unconditional guarantee as reasonably determined by the Company such guarantee will be automatically discharged and release. In the case of such discharge and release, the Second Lien Notes would no longer be guaranteed by such entity even though the guarantee by such entity of our senior secured credit facilities would continue. Substantially all, but not all, of our foreign entities that guarantee the senior secured credit facilities are expected to guarantee the Second Lien Notes. Any right that we or the guarantors have to receive any assets of the non-guarantor subsidiaries and any future non-guarantor subsidiaries upon the liquidation or reorganization of those subsidiaries, and the consequent rights of holders of Second Lien Notes to realize proceeds from the sale of any of those subsidiaries’ assets, will be structurally subordinated to the claims of those subsidiaries’ creditors.
9
Pinafore Holdings B.V.
Item 3D
The terms of our debt agreements may restrict our current and future operations, particularly our ability to respond to changes in our business or to take certain actions.
The credit agreement governing our senior secured credit facilities and the indenture governing the Second Lien Notes contain, and any future indebtedness of ours would likely contain, a number of restrictive covenants that will impose significant operating and financial restrictions on us, including restrictions on our ability to, among other things:
| • | | incur or guarantee additional debt; |
| • | | issue qualified stock and preferred stock; |
| • | | pay dividends and make other restricted payments; |
| • | | create or incur certain liens; |
| • | | make certain investments; |
| • | | engage in sales of assets and subsidiary stock; |
| • | | enter into transactions with affiliates; |
| • | | transfer all or substantially all of our assets or enter into merger or consolidation transactions; and |
| • | | make capital expenditures. |
In addition, our senior secured credit facilities require us to maintain certain financial ratios. As a result of these covenants, we will be limited in the manner in which we conduct our business, and we may be unable to engage in favorable business activities or finance future operations or capital needs. Our ability to meet those financial ratios can be affected by events beyond our control, and there can be no assurance that we will meet those ratios. An adverse development affecting our business could require us to seek waivers or amendments of covenants, alternative or additional sources of financing or reductions in expenditures. Such waivers, amendments or alternative or additional financings might not be on terms acceptable to us.
A failure to comply with the covenants contained in our senior secured credit facilities or the indenture governing the Second Lien Notes could result in an event of default under our debt agreements, which, if not cured or waived, could have a material adverse effect on our business, financial condition and results of operations.
We have pledged and will pledge substantially all of our assets as collateral under our senior secured credit facilities and the indenture governing the Second Lien Notes subject to certain exceptions. If any of the holders of our indebtedness accelerate the repayment of such indebtedness, there can be no assurance that we will have sufficient assets to repay our indebtedness. If we were unable to repay those amounts, the holders of our secured indebtedness could proceed against the collateral granted to them to secure that indebtedness.
The collateral securing our obligations under the Second Lien Notes and the guarantees is shared with other creditors. If there is a default, the value of the collateral may not be sufficient to repay the first priority lien creditors and the holders of the notes and guarantees. The collateral securing the Second Lien Notes may be divided under certain circumstances.
Our obligations under the Second Lien Notes and the guarantees related thereto will be secured by a second priority lien on all of the collateral securing our obligations under our senior secured credit facilities (subject to certain exceptions) and excluding certain assets on a second priority basis. The relative priority of the liens on the collateral will be governed by an intercreditor agreement. Accordingly, any proceeds received upon a realization of the collateral securing our senior secured credit facilities on a first priority basis will first be applied to the costs and expenses incurred with such realization and second to obligations (including expenses and other amounts) under our senior secured credit facilities, before any amounts will be available to pay the holders of Second Lien Notes (the ‘Noteholders’). The value of the collateral and the amount to be received upon a sale of such collateral will depend upon many factors including, among others, the ability to sell the collateral in an orderly sale, the condition of the economies in which our operations are located, the availability of buyers and other factors. The book value of the collateral should not be relied on as a measure of realizable value for such assets. Portions of the collateral may be illiquid and may have no readily ascertainable market value. The collateral is located in a number of countries, and the multi-jurisdictional nature of any foreclosure on the collateral may limit the realizable value of the collateral. To the extent that holders of other secured debt or third parties enjoy liens (including statutory liens), whether or not permitted by the indenture, such holders or third parties may have rights and remedies with respect to the collateral securing the Second Lien Notes and the guarantees that, if exercised, could reduce the proceeds available to satisfy the obligations under the Second Lien Notes and the guarantees. As a result, if there is a default, the value of the collateral may not be sufficient to repay our senior secured credit facilities and the Noteholders.
10
Pinafore Holdings B.V.
Item 3D
The value of the collateral securing the Second Lien Notes may not be sufficient to secure post-petition interest. Should our obligations under the Second Lien Notes equal or exceed the fair market value of the collateral securing those notes, the Noteholders may be deemed to have an unsecured claim.
In the event of a bankruptcy, liquidation, dissolution, reorganization or similar proceeding against the Issuers or the guarantors, Noteholders will be entitled to post-petition interest under the US Bankruptcy Code only if the value of their security interest in the collateral is greater than their pre-bankruptcy claim. Noteholders may be deemed to have an unsecured claim if the Issuers’ obligation under the Second Lien Notes equals or exceeds the fair market value of the collateral securing those notes. Noteholders that have a security interest in the collateral with a value equal to or less than their pre-bankruptcy claim will not be entitled to postpetition interest under the US Bankruptcy Code. The bankruptcy trustee, the debtor-in-possession or competing creditors could possibly assert that the fair market value of the collateral with respect to the Second Lien Notes on the date of the bankruptcy filing was less than the then-current principal amount of those notes. Upon a finding by a bankruptcy court that the Second Lien Notes are under-collateralized, the claims in the bankruptcy proceeding with respect to the Second Lien Notes would be bifurcated between a secured claim and an unsecured claim, and the unsecured claim would not be entitled to the benefits of security in the collateral. Other consequences of a finding of undercollateralization would be, among other things, a lack of entitlement on the part of holders of the Second Lien Notes to receive post-petition interest and a lack of entitlement on the part of the unsecured portion of the Second Lien Notes to receive other “adequate protection” under US federal bankruptcy laws. In addition, if any payments of post-petition interest were made at the time of such a finding of undercollateralization, such payments could be re-characterized by the bankruptcy court as a reduction of the principal amount of the secured claim with respect to Second Lien Notes. No appraisal of the fair market value of the collateral securing the Second Lien Notes has been prepared in connection with the offering of those notes and, therefore, the value of the collateral trustees’ interests in the collateral may not equal or exceed the principal amount of the Second Lien Notes. We cannot assure the Noteholders that there will be sufficient collateral to satisfy our and the guarantors’ obligations under the Second Lien Notes.
The right of holders of Second Lien Notes to exercise remedies with respect to the collateral is extremely limited, even during an event of default under the indenture governing the Second Lien Notes.
The rights of the holders of Second Lien Notes with respect to the collateral are extremely limited, even during an event of default under the indenture governing the Second Lien Notes. If first priority obligations are outstanding, any actions that may be taken in respect of any of the collateral securing the Second Lien Notes, including the ability to cause the commencement of enforcement proceedings against the collateral and to control the conduct of such proceedings, are controlled and directed by holders of our first lien debt. In those circumstances, the Second Lien Notes collateral agent, on behalf of the itself, the trustee and the Noteholders, will not have the ability to control or direct such actions, even if an event of default under the indenture governing the Second Lien Notes has occurred or if the rights of the trustee, the Second Lien Notes collateral agent and the Noteholders are or may be adversely affected. The administrative agent and the lenders under our senior secured credit facilities are under no obligation to take into account the interests of the trustee under the indenture governing the Second Lien Notes, the collateral agent and the Noteholders when determining whether and how to exercise their rights with respect to the collateral securing our senior secured credit facilities on a first priority basis, subject to the applicable intercreditor agreements, and their interests and rights may be significantly different from or adverse to those of the holders of the Second Lien Notes. To the extent that collateral is released from the first priority liens, subject to certain conditions the second priority liens securing the Second Lien Notes and the guarantees related thereto will also automatically be released without any Noteholder consent or notice to the collateral agent, except that such release of liens does not apply with respect to the release of collateral in connection with the full payment of our obligations under our senior secured credit facilities or a refinancing of our obligations thereunder.
In the event of our bankruptcy, the ability of the Noteholders to realize upon the collateral will be subject to certain bankruptcy law limitations.
The ability of the Noteholders to realize upon the collateral will be subject to certain bankruptcy law limitations in the event of our bankruptcy. Under federal bankruptcy law, secured creditors are prohibited from repossessing their security from a debtor in a bankruptcy case, or from disposing of security repossessed from such a debtor, without bankruptcy court approval, which may not be given. Moreover, applicable federal bankruptcy laws generally permit the debtor to continue to use and expend collateral, including cash collateral, and to provide liens senior to the collateral trustees for the Second Lien Notes’ liens to secure indebtedness incurred after the commencement of a bankruptcy case, provided that the secured creditor either consents or is given “adequate protection”. “Adequate protection” could include cash payments or the granting of additional security, if and at such times as the presiding court in its discretion determines, for any diminution in the value of the collateral as a result of the stay of repossession or disposition of the collateral during the pendency of the bankruptcy case, the use of collateral (including cash collateral) and the incurrence of such senior indebtedness. In view of the broad discretionary powers of a bankruptcy court, it is impossible to predict how long payments under the Second Lien Notes could be delayed following commencement of a bankruptcy case, whether or when the collateral trustees would repossess or dispose of the collateral, or whether or to what extent holders of the Second Lien Notes would be compensated for any delay in payment of loss of value of the collateral through the requirements of “adequate protection”. Furthermore, in the event the bankruptcy court determines that the value of the collateral is not sufficient to repay all amounts due on the Second Lien Notes, our senior secured credit facilities and any other first lien or pari passu debt secured by the common collateral, the indebtedness under the Second Lien Notes would be “undersecured” and the Noteholders would have unsecured claims as to the difference. Federal bankruptcy laws do not permit the payment or accrual of interest, costs, and attorneys’ fees on undersecured indebtedness during the debtor’s bankruptcy case.
11
Pinafore Holdings B.V.
Item 3D
Noteholders’ rights in the collateral may be adversely affected by the failure to perfect security interests in collateral.
Applicable law provides that a security interest in certain tangible and intangible assets can only be properly perfected and its priority retained through certain actions undertaken by the secured party. The liens in the collateral securing the Second Lien Notes may not be perfected with respect to the claims of the Second Lien Notes if the collateral agent relating to such notes is not able to take the actions necessary to perfect any of these liens on or about the date of the indenture governing such notes. In addition, applicable law provides that certain property and rights acquired after the grant of a general security interest, such as real property, equipment subject to a certificate of title and certain proceeds, can only be perfected at or after the time such property and rights are acquired and identified. We and our guarantors have limited obligations to perfect the Noteholders’ security interest in specified collateral. There can be no assurance that the collateral agent for the Second Lien Notes will monitor, or that we will inform the trustee of, the future acquisition of property and rights that constitute collateral, and that the necessary action will be taken to properly perfect the security interest in such after-acquired collateral. The collateral agent for the Second Lien Notes have no obligation to monitor the acquisition of additional property or rights that constitute collateral or the perfection of any security interest. Such failure may result in the loss of the security interest in the collateral or the priority of the security interest in favor of the Second Lien Notes against third parties.
The capital stock securing the Second Lien Notes will in certain circumstances be released automatically from the respective liens and no longer be deemed to be collateral to the extent the pledge of such capital stock would require the filing of separate financial statements for any of our subsidiaries with the SEC.
The indenture governing the Second Lien Notes and the security documents provide that, in the event that Rule 3-16 of Regulation S-X under the Securities Act (or any successor regulation) requires the filing with the SEC of separate financial statements of any of our subsidiaries the capital stock of which is pledged as collateral securing the Second Lien Notes, the portion (or, if necessary, all) of such capital stock necessary to eliminate such filing requirement will automatically be deemed released and not to have been part of the collateral securing the Second Lien Notes. In such event, we and the trustee will amend or modify the security documents without the consent of any holder of the Second Lien Notes to the extent necessary to evidence such release. As a result, Noteholders could lose all or a portion of their security interest in the capital stock. The capital stock pledged as collateral under the senior secured credit facilities is not subject to a similar provision and any capital stock pledged as collateral under any of our future indebtedness may not be subject to a similar provision.
The Rule 3-16 requirement to file with the SEC separate financial statements of a subsidiary is triggered if the aggregate principal amount, par value, or book value of the capital stock as carried by the registrant, or the market value of such capital stock, whichever is greatest, equals 20 percent or more of the principal amount of the Second Lien Notes. Any pledge of the capital stock of any of our subsidiaries is automatically released to the extent the value of the capital stock of any individual subsidiary subject to the pledge is in excess of 20 percent of the principal amount of the applicable Second Lien Notes. Any increase in value of the capital stock of our subsidiaries may lead to further releases of capital stock from the collateral securing the Second Lien Notes. Moreover, the realizable value of the capital stock in the event of a foreclosure may be significantly less than the management estimates of market value.
Corporate benefit, capital maintenance laws and other limitations on the guarantees and the security interests may adversely affect the validity and enforceability of the guarantees of the Second Lien Notes and the security interests.
The laws of certain of the jurisdictions in which the guarantors are organized limit the ability of these subsidiaries to guarantee debt of a related company or grant security on account of a related company’s debts. These limitations arise under various provisions or principles of corporate law which include rules governing capital maintenance, under which, among others, the risks associated with a guarantee or grant of security on account of a parent company’s debt need to be reasonable and economically and operationally justified from the guarantor’s or grantor’s perspective, as well as thin capitalization and fraudulent transfer principles. If these limitations were not observed, the guarantees and the grant of security interests by these guarantors could be subject to legal challenge. In these jurisdictions, the guarantees will contain language limiting the amount of debt guaranteed so that applicable local law restrictions will not be violated. Certain of the security documents will contain similar limitations. Accordingly if Noteholders were to enforce the guarantees by a guarantor in one of these jurisdictions or seek to enforce a security interest in collateral granted by a guarantor in one of these jurisdictions, their claims are likely to be limited. In some cases, where the amount that can be guaranteed or secured is limited by reference to the net assets and legal capital of the guarantor or by reference to the outstanding debt owed by the relevant guarantor to an Issuer under intercompany loans that amount might have reached zero or close to zero at the time of any insolvency or enforcement. Furthermore, although we believe that the guarantees by these guarantors and the security interests granted by these guarantors will be validly given in accordance with local law restrictions, there can be no assurance that a third party creditor would not challenge these guarantees and security interests and prevail in court.
The security interests over the collateral is granted to the collateral agent rather than directly to the Noteholders. The ability of the collateral agent to enforce the collateral may be restricted by local law.
In certain jurisdictions, including Germany and The Netherlands, the security over the collateral that (if and when granted) will constitute security for the obligations of the Issuers under the Second Lien Notes and the indenture governing the Second Lien Notes will not be granted directly to the Noteholders but only in favor of the collateral agent, as beneficiary of parallel debt or analogous obligations (the ‘Parallel Debt’). This Parallel Debt is created to satisfy a requirement under the applicable laws that the collateral agent, as grantee of certain types of collateral, be a creditor of the relevant security provider. The Parallel Debt is in the same amount and payable at the same time as the obligations of the Issuers under the indenture governing the Second Lien Notes and the Second Lien Notes (the ‘Principal Obligations’). Any payment in respect of the Principal Obligations shall discharge the corresponding Parallel Debt and any payment in respect of the Parallel Debt shall discharge the corresponding Principal Obligations. Although the collateral agent will have, pursuant to the Parallel Debt, a claim against the Issuers for the full principal amount of the Second Lien Notes, Noteholders bear some risks associated with a possible insolvency or bankruptcy of the collateral agent. The Parallel Debt obligations referred to above are contained in the indenture governing the Second Lien Notes, which are governed by New York law. There is no assurance that such a structure will be effective before applicable courts as there is no judicial or other guidance as to its efficacy, and therefore the ability of the collateral agent to enforce the collateral may be restricted.
12
Pinafore Holdings B.V.
Item 3D
The granting of the security interests in the collateral in connection with the issuance of the Second Lien Notes may create hardening periods for such security interests in accordance with the law applicable in certain jurisdictions.
The granting of new security interests in the collateral in connection with the Second Lien Notes may create hardening periods for such security interests in certain jurisdictions. The applicable hardening period for these new security interests will run as from the moment each new security interest has been granted or perfected. At each time, if the security interest granted or recreated were to be enforced before the end of the respective hardening period applicable in such jurisdiction, it may be declared void and/or it may not be possible to enforce it.
Federal and state statutes allow courts, under specific circumstances, to void Second Lien Notes and guarantees and require Noteholders to return payments received.
If we or any guarantor becomes a debtor in a case under the US Bankruptcy Code or encounter other financial difficulty, under federal or state fraudulent transfer law, a court may void, subordinate or otherwise decline to enforce the Second Lien Notes or the guarantees. A court might do so if it found that when we issued the Second Lien Notes or the guarantor entered into its guarantee, or in some states when payments became due under the Second Lien Notes or the guarantees, we or the guarantor received less than reasonably equivalent value or fair consideration and either:
| • | | was insolvent or rendered insolvent by reason of such incurrence; or |
| • | | was left with inadequate capital to conduct its business; or |
| • | | believed or reasonably should have believed that it would incur debts beyond its ability to pay. |
The court might also void an issuance of Second Lien Notes or a guarantee without regard to the above factors, if the court found that we issued the Second Lien Notes or the applicable guarantor entered into its guarantee with actual intent to hinder, delay or defraud its creditors.
A court would likely find that we or a guarantor did not receive reasonably equivalent value or fair consideration for the Second Lien Notes or its guarantee, if we or a guarantor did not substantially benefit directly or indirectly from the issuance of the Second Lien Notes. If a court were to void the issuance of the Second Lien Notes or guarantees, the Noteholders would no longer have any claim against us or the applicable guarantor. Sufficient funds to repay the Second Lien Notes may not be available from other sources, including the remaining obligors, if any. In addition, the court might direct the Noteholders to repay any amounts that they have already received from us or a guarantor.
The measures of insolvency for purposes of these fraudulent transfer laws will vary depending upon the law applied in any proceeding to determine whether a fraudulent transfer has occurred. Generally, however, a guarantor would be considered insolvent if:
| • | | the sum of its debts, including contingent liabilities, was greater than the fair saleable value of all of its assets; or |
| • | | if the present fair saleable value of its assets was less than the amount that would be required to pay its probable liability on its existing debts, including contingent liabilities, as they become absolute and mature; or |
| • | | it could not pay its debts as they become due. |
On the basis of historical financial information, recent operating history and other factors, we believe that each guarantor, after giving effect to its guarantee of the Second Lien Notes, will not be insolvent, will not have unreasonably small capital for the business in which it is engaged and will not have incurred debts beyond its ability to pay such debts as they mature. We cannot assure the Noteholders, however, as to what standard a court would apply in making these determinations or that a court would agree with our conclusions in this regard.
Local insolvency laws may not be as favorable to the Noteholders as US bankruptcy laws or those of another jurisdiction with which the Noteholders are familiar.
Certain of the guarantors are incorporated in one of the United Kingdom, Australia, Belgium, Brazil, the British Virgin Islands, Canada, Germany, Luxembourg, Mexico, The Netherlands, Northern Ireland, Mauritius, Russia, Turkey or the United Arab Emirates. The insolvency laws of these jurisdictions may not be as favorable to interests of the Noteholders as the laws of the United States or other jurisdictions with which the Noteholders are familiar. In the event that any one or more of the Company, the guarantors or any other of the Company’s subsidiaries experienced financial difficulty, it is not possible to predict with certainty in which jurisdiction or jurisdictions insolvency or similar proceedings would be commenced, or the outcome of such proceedings.
Insolvency laws and other limitations on the guarantees and the security interests, including fraudulent conveyance statutes, may adversely affect their validity and enforceability and enforcing the rights of the Noteholders or under the guarantees across multiple jurisdictions may prove difficult.
Our obligations under the Second Lien Notes will be guaranteed by the guarantors and secured by security interests over the collateral. The guarantors are organized under the laws of the United States, the United Kingdom, Australia, Belgium, Brazil, The British Virgin Islands, Canada, Germany, Luxembourg, Mexico, The Netherlands, Northern Ireland, Mauritius, Russia, Turkey or the United Arab Emirates. Although laws differ among these jurisdictions, in general, applicable fraudulent transfer and conveyance and equitable principles, insolvency laws and, in the case of the guarantees and the security interests, limitations on the enforceability of judgments obtained in courts in such jurisdictions could limit the enforceability of the guarantee against a guarantor and the enforceability of the security interests. The court may also in certain circumstances avoid the security interest or the guarantee where the company is close to or in the vicinity of insolvency.
The following discussion of fraudulent transfer, conveyance and insolvency law, although an overview, describes generally applicable terms and principles, which are defined under the relevant jurisdiction’s fraudulent transfer and insolvency statutes.
13
Pinafore Holdings B.V.
Item 3D
In an insolvency proceeding, it is possible that creditors of the guarantors or the appointed insolvency administrator may challenge the guarantees and the security interests, and intercompany obligations generally, as fraudulent transfers or conveyances, preferences or transactions at an undervalue or on other grounds. If so, such laws may permit a court, if it makes certain findings, to:
| • | | avoid or invalidate all or a portion of a guarantor’s obligations under its guarantee or the security interests; |
| • | | direct that holders of the notes return any amounts paid under a guarantee or any security to the relevant guarantor or to a fund for the benefit of the guarantor’s creditors; and |
| • | | take other action that is detrimental to the Noteholders. |
If we cannot satisfy our obligations under the notes and any guarantee or security interest is found to be a fraudulent transfer or conveyance or is otherwise set aside, it cannot be assured that we can ever repay in full any amounts outstanding under the Second Lien Note. In addition, the liability of each guarantor under its guarantee or the security interests will be limited to the amount that will result in such guarantee or security interests not constituting a fraudulent conveyance or improper corporate distribution or otherwise being set aside. The amount recoverable from the guarantors under the security documents will also be limited. However, there can be no assurance as to what standard a court would apply in making a determination of the maximum liability of each. Also, there is a possibility that the entire guarantee or security interests may be set aside, in which case, the entire liability may be extinguished.
In order to initiate any of these actions under fraudulent transfer or other applicable principles, courts would need to find that, at the time the guarantees were issued or the security interests created, the guarantor:
| • | | issued such guarantee or created such security interest with the intent of hindering, delaying or defrauding current or future creditors or with a desire to prefer some creditors over others, or created such security after its insolvency; |
| • | | issued such guarantee or created such security interest in a situation where a prudent businessman as a shareholder of such guarantor would have contributed equity to such guarantor; |
| • | | did not issue such guarantee or create such security interest in good faith or in the best interests of such guarantor; or |
| • | | received less than reasonably equivalent value for incurring the debt represented by the guarantee or security interest on the basis that the guarantee or security interest were incurred for our benefit, and only indirectly the guarantor’s benefit, or some other basis and (1) was insolvent or rendered insolvent by reason of the issuance of the guarantee or the creation of the security interest, or subsequently became insolvent for other reasons; (2) was engaged, or about to engage, in a business transaction for which the guarantor’s assets were unreasonably small; or (3) intended to incur, or believed it would incur, debts beyond its ability to make required payments as and when they would become due. |
Different jurisdictions evaluate insolvency on various criteria, but a guarantor generally may, in different jurisdictions, be considered insolvent at the time it issued a guarantee or created any security interest if:
| • | | its liabilities exceed the fair market value of its assets; |
| • | | it cannot pay its debts as and when they become due; and/or |
| • | | the present saleable value of its assets is less than the amount required to pay its total existing debts and liabilities, including contingent and prospective liabilities, as they mature or become absolute. |
Although we believe that we are solvent, there can be no assurance which standard a court would apply in determining whether a guarantor was “insolvent” as of the date the guarantees were issued or the security interests were created or that, regardless of the method of valuation, a court would not determine that a guarantor was insolvent on that date, or that a court would not determine, regardless of whether or not a guarantor was insolvent on the date its guarantee was issued or security interests were created, that payments to holders of the notes constituted fraudulent transfers on other grounds.
Certain collateral is subject to potential environmental liabilities and the collateral agent may determine not to foreclose on it.
The Second Lien Notes will be secured in part by liens on real property that may be subject to both known and unforeseen environmental risks, and these risks may reduce or eliminate the value of the real property pledged as collateral for the Second Lien Notes. Moreover, the trustee and the collateral agent may need to evaluate the impact of potential environmental liabilities before determining to foreclose on the collateral consisting of real property because secured lenders that hold or enforce a security interest in real property may, under certain circumstances, be held liable under environmental laws for the costs of remediating or preventing the release or threatened release of regulated materials at or from such real property. Consequently, the collateral agent may decline to foreclose on such collateral or exercise remedies available in respect thereof if it does not receive indemnification to its satisfaction from the Noteholders.
If we default on our obligations to pay our other indebtedness, we may not be able to make payments on the Second Lien Notes.
Any default under the agreements governing our indebtedness that is not waived by the required holders of such indebtedness, could leave us unable to pay principal, premium, if any, or interest on the Second Lien Notes and could substantially decrease the market value of those notes. If we are unable to generate sufficient cash flow and are otherwise unable to obtain funds necessary to meet required payments of principal, premium, if any, or interest on such indebtedness, or if we otherwise fail to comply with the various covenants, including financial and operating covenants, in the instruments governing our indebtedness we could be in default under the terms of the agreements governing such indebtedness. In the event of such default, the holders of such indebtedness could elect to declare all the funds borrowed thereunder to be due and payable, together with any accrued and unpaid interest, the lenders under our senior secured credit facilities could elect to terminate their commitments, cease making further loans and institute foreclosure proceedings against the assets securing such facilities and we could be forced into bankruptcy or liquidation. If our operating performance declines, we may in the future need to seek waivers from the required lenders under our senior secured credit facilities to avoid being in default. If we breach our covenants under our senior secured credit facilities and seek waivers, we may not be able to obtain waivers from the required lenders thereunder.
14
Pinafore Holdings B.V.
Item 3D
We may not be able to repurchase the Second Lien Notes upon a change of control.
Upon a change of control as defined in the indenture governing the Second Lien Notes, we will be required to make an offer to repurchase all outstanding Second Lien Notes at 101% of their principal amount plus accrued and unpaid interest, unless we have previously given notice of our intention to exercise our right to redeem the Second Lien Notes or unless such obligation is suspended. We may not have sufficient financial resources to purchase all of the Second Lien Notes that are tendered upon a change of control offer or, if then permitted under the indenture governing the Second Lien Notes, to redeem those notes. A failure to make the applicable change of control offer or to pay the applicable change of control purchase price when due would result in a default under the indenture. The occurrence of a change of control would also constitute an event of default under our senior secured credit facilities and may constitute an event of default under the terms of our other indebtedness. The terms of the credit agreement governing our senior secured credit facilities and the indenture governing the Second Lien Notes limit our right to purchase or redeem certain indebtedness. In the event any purchase or redemption is prohibited, we may seek to obtain waivers from the required lenders under our senior secured credit facilities or holders of the Second Lien Notes to permit the required repurchase or redemption, but the required holders of such indebtedness have no obligation to grant, and may refuse to grant such a waiver. A change of control is defined in the indenture governing the Second Lien Notes.
Certain private equity investment funds affiliated with the Sponsors own a significant majority of our equity and their interests may not be aligned with those of the Noteholders.
The Sponsors and certain of their affiliates and co-investors own 100% of the economic interests of the Co-operative, the direct parent of the Company, and, therefore, will have the power to control all of our affairs and policies. The Sponsors will also control the election of directors, the appointment of management, the entering into mergers, sales of substantially all of our assets and other extraordinary transactions. The directors so elected will have authority, subject to the terms of our debt, to issue additional stock, implement stock repurchase programs, declare dividends and make other decisions. The interests of the Sponsors could conflict with the interests of the Noteholders. For example, if we encounter financial difficulties or are unable to pay our debts as they mature, the interests of the Sponsors, as equity holders, might conflict with the interests of the Noteholders. The Sponsors may also have an interest in pursuing acquisitions, divestitures, financings or other transactions that, in their judgment, could enhance their equity investments, even though such transactions might involve risks to the Noteholders. Additionally, the Sponsors are in the business of making investments in companies, and may from time to time in the future acquire interests in businesses that directly or indirectly compete with certain portions of our business or are suppliers or customers of ours.
15
Pinafore Holdings B.V.
Item 4A
Item 4. Information on the Company
A. History and development of the Company
The Company
Pinafore Holdings B.V. is a private company with limited liability (besloten vennootschap met beperkte aansprakelijkheid) incorporated on September 1, 2010 in and under the laws of The Netherlands.
The Company’s immediate and ultimate parent entity is Pinafore Coöperatief U.A., which also operates in and under the laws of The Netherlands. The Co-operative is owned by a consortium representing the interests of Onex Corporation, a Canadian private equity investor, Onex Partners III and various syndication participants, and the Canada Pension Plan Investment Board. The Company’s registered address is: Fred. Roeskestraat 123, 1076 EE, Amsterdam, The Netherlands (Telephone: +31 20577 1177) and its website is www.tomkins.co.uk.
Prior to the Acquisition, the Company had no assets or liabilities (other than the proceeds of the shares issued on incorporation) and no operations.
The Acquisition
On July 27, 2010, the independent directors of Tomkins plc and the board of directors of Tomkins Acquisitions Limited (formerly Pinafore Acquisitions Limited) announced that they had reached an agreement on the terms of a recommended cash acquisition for the entire share capital of Tomkins, including the Tomkins shares underlying the Tomkins ADRs and certain employee equity awards, for approximately £2.9 billion, to be implemented by way of a scheme of arrangement under Part 26 of the UK’s Companies Act 2006. Tomkins Acquisitions Limited was a newly incorporated company formed for the purpose of implementing the Acquisition at the direction of the Sponsors. Tomkins, LLC and Tomkins, Inc. are indirect wholly owned subsidiaries of Tomkins Acquisitions Limited. On August 31, 2010, the requisite majorities of Tomkins’ shareholders voted to approve the Acquisition. On September 21, 2010, the High Court of Justice in England and Wales (the ‘Court’) sanctioned the Scheme and a Court hearing to confirm the corresponding reduction in share capital of Tomkins plc occurred on September 23, 2010. The Court issued orders pursuant to the Court hearings were registered and became effective on September 24, 2010.
On this date, each ordinary share in the capital of Tomkins plc (except those shares held by shareholders who validly elected to receive loan notes in respect of some or all of their shares) were automatically cancelled and shareholders received 325 pence for each ordinary share held prior to cancellation. Also on this date, Tomkins plc was re-registered as a private company and its name was changed to Tomkins Limited.
Group overview
We are now a diversified global engineering and manufacturing group with a portfolio of market-leading businesses. Our products are highly engineered and used in the industrial, automotive and construction end markets. We have a broad collection of premier brands that are among the most globally recognized in their respective end markets. The significant majority of our products, including those useful for the reduction of energy consumption and for safety improvement, are positioned in the premium end of their respective end markets, and as a result, allow for associated premium pricing.
We attribute our end market leadership positions to a combination of our brand strength, product quality and breadth and customer service and support. We are led by an experienced management team that has successfully streamlined our portfolio to focus on our core businesses, and implemented wide-ranging, significant cost-saving restructuring initiatives.
Our revenue and earnings base is highly diversified by product, geography, end market and customer. Our product portfolio consists of tens of thousands of stock keeping units (‘SKUs’), and we believe it comprises the broadest range of power transmission belts, fluid power hoses and air distribution products in the end markets in which we operate. We derive revenues from nearly every developed country across the globe and are well-positioned in most emerging markets with our industrial and automotive component products. We maintain long-standing customer relationships and have served our top 20 customers for an average of over 35 years, while some of our largest customer relationships span over 50 years. We also have developed strong relationships with industry-leading customers in emerging markets including Chery, Tata, Mahindra & Mahindra, Sany, Lui Gong and Zoomlion.
Our history
We were founded in 1925 as F.H. Tomkins Buckle Company, a small British manufacturer of buckles and fasteners. In the 1980’s and 1990’s we embarked on a succession of acquisitions, which rapidly grew our sales, product range and global reach. Major acquisitions included the US-based Gates Corporation in 1996, which signalled a move into the industrial and automotive markets and the Stant and Schrader businesses that further bolstered this division. We also expanded our businesses into the North American residential and non-residential construction markets and several other end markets through additional acquisitions. Recognizing the need to strengthen and build upon our market leadership positions in core engineering markets, we began a process of streamlining our activities by disposing of a number of businesses during the period from 1998 to 2001.
Jim Nicol joined us as Group CEO in 2002 and implemented a strategy of divesting under-performing and lower margin businesses, while also acquiring businesses with higher growth and margin potential such as A.E. Hydraulic and Fleximak, in order to create a globally diversified portfolio of market-leading industrial businesses. In our Air Distribution group there have been a number of strategic acquisitions that have provided strong product, manufacturing and customer synergies, and, in the case of Trion, have allowed for an important manufacturing capability in Asia. Today, our businesses are focused on lean manufacturing, sharing best practices, product innovation and geographic expansion.
16
Pinafore Holdings B.V.
Item 4A
Principal acquisitions and disposals
This section should be read in conjunction withItem 5‘Operating and financial review and prospects’ and with notes 41 and 42 to the Group’s consolidated financial statements.
Fiscal 2011
On October 31, 2011, the Group finalized the acquisition of the assets ofDu-Tex, Inc., a Texas-based distributor of products and services to the oil and gas industry. The assets were purchased for a cash consideration of $26.1 million.
On October 27, 2011, the Group finalized the sale ofIdeal, a leading manufacturer of gear clamps primarily for the automotive aftermarket, selling principally in the US, Mexico and China under a variety of brands. The business was sold for a cash consideration of $158.7 million.
Dexter Chassis, a manufacturer of chassis components for the recreational vehicle and industrial and utility end markets in the US, was sold on August 22, 2011 for a cash consideration of $14.3 million.
On August 2, 2011, the Group finalized the sale of itsStackpole business, which specializes in powder metal and engineered powertrain components and operates predominantly in North America and Europe. The business was sold to an affiliated investment fund of the Sterling Group, a Houston based private equity investment firm, for a cash consideration of $289.0 million.
Plews Inc., a wholly-owned manufacturer of automotive lubrication products and repair tools, was sold on April 20, 2011, to a consortium of investors in the US led by the private equity firm, Eigen Capital LLC for a cash consideration of $25.0 million.
9M 2010
On April 13, 2010, the Group acquired a 100% interest inTransHose Corporation, a hydraulic hose supplier to the mining industry in Australia, for A$3.0 million in cash plus up to A$2.0 million in cash over three years contingent on the sales and profitability of the acquired business.
On February 26, 2010, the Group acquired a 100% interest inKoch Filter Corporation, a leading manufacturer of air filters for the non-residential filtration market in the US for $35.5 million in cash.
No businesses were sold in Fiscal 2010.
Fiscal 2009
On July 7, 2009, the Group acquired a 100% interest inHydrolink, a fluid engineering services provider to the oil and gas and marine sectors in the Middle East.
Also on July 7, 2009, the Group acquired the remaining 40% non-controlling interest inRolastar Pvt Ltd, a duct manufacturer based in India.
No businesses were sold in Fiscal 2009.
Capital expenditure
Due to the diverse nature of the business, there is no individual item of capital expenditure that has had a material impact on the position of the Company and no individually significant capital expenditure project that is currently in progress.
B. Business overview
Segment analysis
The Group is organized for management reporting purposes into two business groups: Industrial & Automotive and Building Products. Within these two business groups, management distinguishes between those of the Group’s operating segments that are ‘ongoing’ and those that have been exited but do not meet the conditions to be classified as discontinued operations under IFRS (‘Exited’).
During Fiscal 2011, the Group refocused its operations around the Gates brand and commenced the disposal of those businesses that are no longer a strategic fit for the Group. The internal reports presented to the Board reflect this re-focus on the performance of the Group’s ongoing businesses and, as a consequence, certain changes have been made to the Group’s reporting segments. Comparative information for Q4 2010, 9M 2010 and Fiscal 2009 has been re-presented to reflect these changes. Details of the changes, as well as additional segmental information, are provided in note 5 to the Group’s consolidated financial statements.
Industrial & Automotive, which accounted for 78% of our Fiscal 2011 sales, manufactures a wide range of systems and components for the industrial equipment, car and truck manufacturing markets, and industrial and automotive aftermarkets throughout the world. Industrial & Automotive is comprised of five ongoing operating segments:
| • | | Gates North America (‘Gates NA’); |
| • | | Gates Europe, Middle East & Africa (‘Gates EMEA’); |
| • | | Gates Asia and the Pacific Regions (‘Gates APAC’); |
| • | | Gates South America (‘Gates SA’); and |
Two additional operating segments, Powertrain and Other I&A, are included in continuing operations, but are classified as exited segments following the disposal during Fiscal 2011 of the businesses comprising those segments. The final operating segment, Sensors & Valves, is in the process of being sold and is classified as a discontinued operation.
Building Products, which accounted for 22% of our Fiscal 2011 sales, is comprised of two ongoing operating segments:
17
Pinafore Holdings B.V.
Item 4B
Air Distribution supplies the industrial and residential heating, ventilation and air conditioning (‘HVAC’) market, mainly in North America. Bathware manufactures baths and whirlpools for the residential, and hotel and resort development markets, also predominantly in North America. A further operating segment, Doors & Windows, comprising a business that was closed during Fiscal 2009, is classified as exited.
Unless otherwise stated, all references to sales in this section are to total Group operations, including discontinued operations.
Analysis of sales and adjusted EBITDA by operating segment
| | | | | | | | | | | | | | | | | | | | | | | | | | | | | | | | | | | | |
| $ million | | Sales | | | Adjusted EBITDA | |
| | | SUCCESSOR | | | | | PREDECESSOR | | | SUCCESSOR | | | | | PREDECESSOR | |
| | | Fiscal
2011 | | | Q4
2010* | | | | | 9M
2010* | | | Fiscal
2009* | | | Fiscal
2011 | | | Q4
2010* | | | | | 9M
2010* | | | Fiscal
2009* | |
Ongoing segments | | | | | | | | | | | | | | | | | | | | | | | | | | | | | | | | | | | | |
Industrial & Automotive: | | | | | | | | | | | | | | | | | | | | | | | | | | | | | | | | | | | | |
– Gates North America | | | 1,287.3 | | | | 308.4 | | | | | | 844.4 | | | | 956.4 | | | | 305.3 | | | | 71.1 | | | | | | 209.3 | | | | 153.3 | |
– Gates EMEA | | | 803.3 | | | | 205.4 | | | | | | 541.8 | | | | 663.4 | | | | 103.4 | | | | 19.2 | | | | | | 54.4 | | | | 54.0 | |
– Gates APAC | | | 708.7 | | | | 183.1 | | | | | | 447.9 | | | | 478.6 | | | | 135.2 | | | | 37.4 | | | | | | 93.8 | | | | 79.5 | |
– Gates South America | | | 156.7 | | | | 37.7 | | | | | | 109.5 | | | | 99.5 | | | | 4.5 | | | | 3.1 | | | | | | 16.2 | | | | 14.4 | |
| | | | | | | | | | | | | | | | | | | | | | | | | | | | | | | | | | | | |
| | | 2,956.0 | | | | 734.6 | | | | | | 1,943.6 | | | | 2,197.9 | | | | 548.4 | | | | 130.8 | | | | | | 373.7 | | | | 301.2 | |
– Dexter | | | 281.4 | | | | 54.4 | | | | | | 190.8 | | | | 196.6 | | | | 40.5 | | | | 7.5 | | | | | | 31.2 | | | | 28.2 | |
| | | | | | | | | | | | | | | | | | | | | | | | | | | | | | | | | | | | |
| | | 3,237.4 | | | | 789.0 | | | | | | 2,134.4 | | | | 2,394.5 | | | | 588.9 | | | | 138.3 | | | | | | 404.9 | | | | 329.4 | |
| | | | | | | | | | | | | | | | | | | | | | | | | | | | | | | | | | | | |
Building Products: | | | | | | | | | | | | | | | | | | | | | | | | | | | | | | | | | | | | |
– Air Distribution | | | 882.9 | | | | 226.7 | | | | | | 636.2 | | | | 874.2 | | | | 104.2 | | | | 22.6 | | | | | | 80.5 | | | | 105.6 | |
– Bathware | | | 106.3 | | | | 27.1 | | | | | | 91.7 | | | | 140.3 | | | | (4.5 | ) | | | (1.2 | ) | | | | | (1.7 | ) | | | (0.1 | ) |
| | | | | | | | | | | | | | | | | | | | | | | | | | | | | | | | | | | | |
| | | 989.2 | | | | 253.8 | | | | | | 727.9 | | | | 1,014.5 | | | | 99.7 | | | | 21.4 | | | | | | 78.8 | | | | 105.5 | |
| | | | | | | | | | | | | | | | | | | | | | | | | | | | | | | | | | | | |
Corporate | | | — | | | | — | | | | | | — | | | | — | | | | (35.9 | ) | | | (6.1 | ) | | | | | (25.8 | ) | | | (26.7 | ) |
| | | | | | | | | | | | | | | | | | | | | | | | | | | | | | | | | | | | |
Total ongoing | | | 4,226.6 | | | | 1,042.8 | | | | | | 2,862.3 | | | | 3,409.0 | | | | 652.7 | | | | 153.6 | | | | | | 457.9 | | | | 408.2 | |
| | | | | | | | | | | | | | | | | | | | | | | | | | | | | | | | | | | | |
Exited segments | | | | | | | | | | | | | | | | | | | | | | | | | | | | | | | | | | | | |
Industrial & Automotive: | | | | | | | | | | | | | | | | | | | | | | | | | | | | | | | | | | | | |
– Powertrain | | | 200.2 | | | | 82.2 | | | | | | 226.4 | | | | 208.1 | | | | 28.1 | | | | 15.8 | | | | | | 25.1 | | | | 18.8 | |
– Other I&A | | | 163.9 | | | | 56.3 | | | | | | 181.7 | | | | 212.9 | | | | 19.3 | | | | 4.6 | | | | | | 16.6 | | | | 8.0 | |
| | | | | | | | | | | | | | | | | | | | | | | | | | | | | | | | | | | | |
| | | 364.1 | | | | 138.5 | | | | | | 408.1 | | | | 421.0 | | | | 47.4 | | | | 20.4 | | | | | | 41.7 | | | | 26.8 | |
Building Products: | | | | | | | | | | | | | | | | | | | | | | | | | | | | | | | | | | | | |
– Doors & Windows | | | — | | | | — | | | | | | — | | | | 36.5 | | | | (0.8 | ) | | | (0.2 | ) | | | | | (0.7 | ) | | | (12.9 | ) |
| | | | | | | | | | | | | | | | | | | | | | | | | | | | | | | | | | | | |
Total exited | | | 364.1 | | | | 138.5 | | | | | | 408.1 | | | | 457.5 | | | | 46.6 | | | | 20.2 | | | | | | 41.0 | | | | 13.9 | |
| | | | | | | | | | | | | | | | | | | | | | | | | | | | | | | | | | | | |
Total continuing operations | | | 4,590.7 | | | | 1,181.3 | | | | | | 3,270.4 | | | | 3,866.5 | | | | 699.3 | | | | 173.8 | | | | | | 498.9 | | | | 422.1 | |
| | | | | | | | | | | | | | | | | | | | | | | | | | | | | | | | | | | | |
Discontinued operation | | | 450.8 | | | | 107.9 | | | | | | 294.3 | | | | 313.6 | | | | 76.0 | | | | 17.4 | | | | | | 44.5 | | | | 25.6 | |
| | | | | | | | | | | | | | | | | | | | | | | | | | | | | | | | | | | | |
Total operations | | | 5,041.5 | | | | 1,289.2 | | | | | | 3,564.7 | | | | 4,180.1 | | | | 775.3 | | | | 191.2 | | | | | | 543.4 | | | | 447.7 | |
| | | | | | | | | | | | | | | | | | | | | | | | | | | | | | | | | | | | |
| * | Re-presented (see note 5A to the Group’s consolidated financial statements) |
Analysis of sales by origin
| | | | | | | | | | | | | | | | | | |
| $ million | | SUCCESSOR | | | | | PREDECESSOR | |
| | | Fiscal
2011 | | | Q4 2010 | | | | | 9M 2010 | | | Fiscal
2009 | |
US | | | 2,418.2 | | | | 592.9 | | | | | | 1,745.9 | | | | 2,172.9 | |
Rest of North America | | | 522.0 | | | | 163.8 | | | | | | 434.8 | | | | 446.9 | |
UK | | | 397.4 | | | | 96.3 | | | | | | 252.9 | | | | 297.0 | |
Rest of Europe | | | 739.5 | | | | 188.2 | | | | | | 492.9 | | | | 603.5 | |
Asia | | | 677.1 | | | | 174.3 | | | | | | 433.9 | | | | 466.1 | |
Rest of the world | | | 287.3 | | | | 73.7 | | | | | | 204.3 | | | | 193.7 | |
| | | | | | | | | | | | | | | | | | |
| | | 5,041.5 | | | | 1,289.2 | | | | | | 3,564.7 | | | | 4,180.1 | |
| | | | | | | | | | | | | | | | | | |
18
Pinafore Holdings B.V.
Item 4B
Industrial & Automotive
The I&A business group has corporate offices in the United States and Canada. It supplies a wide variety of industries, including the construction equipment, agricultural equipment, oil and gas, mining, transportation and automotive. Our products are sold through a range of distribution channels: direct to customers (principally for the OE end market) and through distributors (principally for the aftermarket business). The primary raw materials used by I&A are rubber materials, steel and a range of fibers and fabrics, all of which are principally sourced locally.
The I&A business group operates from 144 locations in 30 countries throughout the world, with approximately 40% of the facilities located in North America. European operations include 26 facilities and the Asian businesses operate from 37 facilities, half of which are in India and China.
As at December 31, 2011, the Industrial & Automotive business group, including the discontinued Sensors & Valves operating segment, employed 17,547 people around the world.
| | | | | | | | | | | | |
Sales by end markets | | | | | Sales by destination | | | | | Major products by category Gates Synchronous belts V-belts and V-ribbed belts Hydraulic hose and assemblies Industrial hose Engine hose Metal drive components Accessory belt drive kits Timing belt kits Dexter Utility trailers Powertrain (sold during Fiscal 2011) Powdered metal components Oil pumps Other I&A (sold during Fiscal 2011) Clamps Sensors & Valves (discontinued operation) Tire pressure monitoring systems |
Industrial aftermarket | | | 21.8 | % | | North America | | | 53.8 | % | |
Industrial OE | | | 21.0 | % | | Europe | | | 21.3 | % | |
Automotive aftermarket | | | 25.6 | % | | China | | | 5.8 | % | |
Automotive OE | | | 29.6 | % | | Rest of Asia | | | 11.2 | % | |
Other * | | | 2.0 | % | | Rest of World | | | 7.9 | % | |
| | | | | | | | | | | |
| | | 100.0 | % | | | | | 100.0 | % | |
| | | | | | | | | | | |
| | | | | | | | | | | |
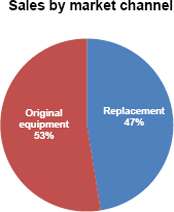 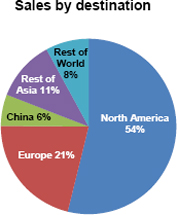 | | |
| * | Our ‘Other’ end markets include manufactured housing and recreational vehicles. |
We discuss below the businesses comprising each of I&A’s operating segments, including the discontinued Sensor & Valves segment, followed by a brief analysis of the end markets to which those businesses sell.
Gates
| | | | | | | | | | | | | | | | | | |
 | | Key products Synchronous drive belts, pulleys, tensioners
& idlers, accessory drive belts, hydraulic
hose and hose assemblies, industrial hose,
couplings, adapters and hose services (hose
monitoring and management) | | | 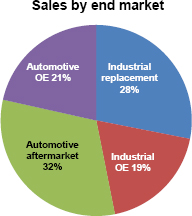 |
| | | Number of
locations | | | % of business
group sales | | | % of Group
Sales | | | Adjusted
EBITDA
margin | | |
– North America | | | 51 | | | | 31.8 | % | | | 25.5 | % | | | 23.7 | % | |
– EMEA | | | 32 | | | | 19.8 | % | | | 15.9 | % | | | 12.9 | % | |
– APAC | | | 34 | | | | 17.5 | % | | | 14.1 | % | | | 19.1 | % | |
– South America | | | 6 | | | | 3.9 | % | | | 3.1 | % | | | 2.9 | % | |
| | | | | | | | | | | | | | | | | |
| | | 123 | | | | 73.0 | % | | | 58.6 | % | | | 18.6 | % | |
| | | | | | | | | | | | | | | | | |
Gates is globally positioned, selling to 132 countries from its operations in 30 countries and maintains research, development and engineering capabilities worldwide. The largest component of our Gates sales is to leading distributors for use in the industrial replacement end market. This end market covers a broad range of industries, which have an ongoing need for replacement parts, often in critical environments.
19
Pinafore Holdings B.V.
Item 4B
The end market segments for our industrial products are broad and primarily cover applications such as construction equipment, agricultural equipment, oil and gas, mining, transportation and automotive. We also have a nascent presence in elevators, white goods and wind turbines. We have continued to broaden our product base by providing hydraulic service offerings to the oil and gas, marine, construction and agricultural end market segments. These services include IMR (Inspection, Maintenance and Repair), flushing, hose monitoring (Sentry IQ) and hose management (Sentry ID) services. The automotive aftermarket provides us with both a stable source of revenue and our highest margin sales. We supply aftermarket belts and related components for substantially all light vehicles in North America and Europe.
We also sell Gates products directly to industrial and automotive OE manufacturers (‘OEMs’). In Fiscal 2011, 56.7% of the Gates operating segments’ sales were to customers located outside of North America, primarily in continental Europe and Asia, including JCB, Samsung, Sany, Renault, PSA/Peugeot, Mercedes, Hyundai, Mazda and Chery.
The industrial replacement end market and automotive aftermarket collectively represented 59.7% of Gates’ Fiscal 2011 sales, while 18.8% of its Fiscal 2011 sales were to the industrial OE end market. The remaining 21.5% of Fiscal 2011 sales were generated from the automotive OE end market.
Dexter
| | | | | | | | | | | | |
 | |
| Key products High specification non-drive axles, doors
and venting products for trailers and
industrial equipment |
| | 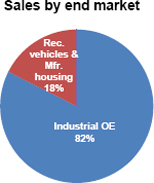 |
Number of locations: | | | 6 | | | Adjusted EBITDA margin | | | 14.4% | | |
% of business group sales | | | 6.9 | % | | % of Group Sales | | | 5.6% | | |
| | | | | | | | | | | |
| | | | | | | | | | | |
| | | | | | | | | | | |
Dexter is a leading manufacturer of axle components for the utility, industrial trailer and recreational vehicle end market segments primarily in the US. Dexter sells its products directly to OEMs and through national distributors.
In Fiscal 2011, approximately 40% of Dexter’s sales were to its top five customers, comprising large trailer part distributors, and utility, recreational vehicle and equipment trailer OEMs.
Powertrain (exited segment – sold in August 2011)
| | | | |
 | | Key products Planetary carrier systems, powder metal power transmission and pump components, engine and transmission oil pumps | | 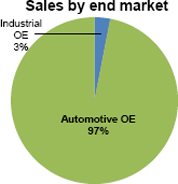 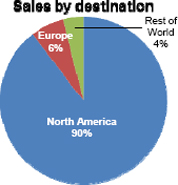 |
% of business group sales | | 4.9% | |
% of Group Sales | | 4.0% | |
Adjusted EBITDA margin | | 14.0% | |
| | | |
Stackpole is a Canadian-based manufacturer of powertrain components, systems and assemblies primarily for use in automotive engines and transmissions. The business operates primarily in North America, with facilities in Canada and the UK, and employs approximately 1,500 employees. The automotive OE end market accounted for 97% of Powertrain’s contribution to the Group’s sales in Fiscal 2011. The remaining 3% of Powertrain’s sales up until its disposal by the Group were to the industrial replacement end market (2.6%) and to the automotive aftermarket (0.4%).
On August 2, 2011, the Group finalized the sale of Stackpole to an affiliated investment fund of the Sterling Group, a Houston based private equity investment firm, for a cash consideration of $289.0 million. Prior to its disposal, the business contributed sales of $200.2 million in Fiscal 2011 and adjusted EBITDA of $28.1 million.
20
Pinafore Holdings B.V.
Item 4B
Other Industrial & Automotive (exited segment – businesses all sold during Fiscal 2011)
| | | | | | |
 | | | 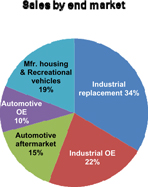 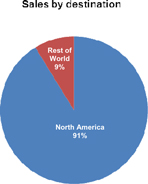 |
Key products Stainless steel and carbon hose clamps, standard gear clamps, automotive accessories, grease guns, power steering hose assemblies, air power pneumatic components and systems, air line products, trailer chassis and components, fabricated metal parts, and high-end coatings for military and general industries. | | |
% of business group sales | | | 4.1% | | |
% of Group Sales | | | 3.3% | | |
Adjusted EBITDA margin | | | 11.8% | | |
Other Industrial & Automotive includes the Ideal, Plews and Dexter Chassis businesses.
The Ideal and Plews businesses manufacture, market and distribute (under a variety of brands) products destined primarily for industrial OE and replacement end markets. Sales to these end markets comprised 51.0% of Other I&A’s contribution to Group sales, with a further 15.2% coming from the automotive aftermarket and 10.1% from the automotive OE end market. Ideal is a designer and clamp manufacturer based in the US, selling principally in the US, Mexico and China under a variety of brands. Also based in the US, Plews is a designer, manufacturer and distributor of a broad range of automotive lubrication products and repair tools.
Plews was sold by the Group on April 20, 2011, to a consortium of investors in the US led by the private equity firm, Eigen Capital LLC for a cash consideration of $25.0 million. Prior to its disposal, the business contributed sales of $20.6 million in Fiscal 2011 and adjusted EBITDA of $1.0 million.
On October 27, 2011, the Group finalized the sale of Ideal for a cash consideration of $158.7 million. Prior to its disposal, the business contributed sales of $104.5 million in Fiscal 2011 and adjusted EBITDA of $18.9 million.
Dexter Chassis, a manufacturer of chassis components for the recreational vehicle (18.7% of Other I&A’s Fiscal 2011 sales) and industrial and utility end markets in the US, was sold on August 22, 2011 for a cash consideration of $14 million. Prior to its disposal, the business contributed sales of $38.8 million in Fiscal 2011 and incurred an adjusted EBITDA loss of $0.6 million.
Sensors & Valves (discontinued segment)
| | | | | | |
 | | | 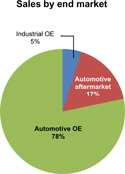 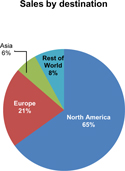 |
Key products Remote Tire Pressure Monitoring Systems, tire valves and gauges, air-conditioning and injection valves and connectors, industrial valves, inflating gauges, and tire repair pieces. | | |
Number of locations | | | 15 | | |
% of Group Sales | | | 11.1 | % | |
Adjusted EBITDA margin | | | 16.9 | % | |
Sensors & Valves includes the Schrader Electronics and Schrader International businesses. During the second quarter of 2011, management began actively seeking prospective buyers for these businesses and the Sensors & Valves segment is now classified as discontinued.
Schrader Electronics, which is based in Northern Ireland, is a designer and manufacturer of Tire Pressure Monitoring Systems (‘TPMS’), an information and safety device that is economically and ergonomically integrated into vehicle electronic information systems. TPMS is mandatory for all new vehicles sold in the US automotive market and will become mandatory in Europe over the next two years. Schrader International manufactures a range of industrial and automotive products including gauges and valves, which are sold mainly in the US and Europe.
21
Pinafore Holdings B.V.
Item 4B
Industrial & Automotive end markets
Industrial OE & Replacement
We generated 34.4% of our Fiscal 2011 sales from the global industrial OE and replacement end markets. Our Gates businesses accounted for 79.8% of our Fiscal 2011 sales to these end markets. Gates’ industrial belts are used in manufacturing equipment, commercial vehicles, light and heavy duty construction, agricultural and mining equipment as well as a broad range of consumer and industrial products and applications. Gates’ industrial fluid power products are used within hydraulic systems, for example, on construction equipment and to transfer and convey fluids, as well as food, water, steam, oil, chemicals, gas and air and primarily serve the general industrial, construction, agriculture, oil and gas, marine and mining industries. Our Dexter Axle business, which accounted for 13.4% of our Fiscal 2011 sales to the industrial OE and replacement markets, sells non-dynamic axles and trailers mainly to the Industrial Utility markets. The remaining 6.8% of our Fiscal 2011 sales to the industrial OE and replacement markets relates to businesses exited or classified as discontinued, including Ideal, Dexter Chassis, Plews, Stackpole and Schrader.
We believe the demand for our products in the industrial OE and replacement end markets will continue to be driven by:
| • | | the level of industrial production and capacity utilization, both of which still remain below long-term averages in North America and Europe; |
| • | | the level of durable goods orders and operating expenditures related to consumable items used in industrial production; |
| • | | the level of construction activity which drives demand for construction equipment that utilize our products; |
| • | | the level of global commodity prices that impact demand and utilization of equipment in a number of our end market segments including agriculture and oil and gas; and |
| • | | continued emerging market growth and infrastructure build. |
Automotive aftermarket
We generated 20.6% of our Fiscal 2011 sales from the automotive aftermarket, primarily through the broad range of our Gates products.
The automotive aftermarket is characterized by a stable underlying demand for products, which is influenced more by non-discretionary preventative maintenance than economic conditions. As such, spending in the automotive aftermarket is usually relatively resilient during economic downturns. The 10-year compound annual growth rate (‘CAGR’) of automotive aftermarket spending as measured by the AAIA is 3.0%, with market growth in all but 1 of the last 15 years. According to the AAIA, the US motor vehicle aftermarket is estimated to be worth approximately $224 billion in 2011 and is forecasted to grow by 4.1% in 2012.
We believe the demand for our products in the automotive aftermarket will continue to be driven by:
| • | | Vehicle usage, often measured by miles driven, which drives vehicle wear; |
| • | | continued increases in car population, which increases by the level of annual vehicle production less the scrappage rate; |
| • | | a continued increase in the average age of the car population, particularly in emerging markets; and |
Miles driven in the US, as measured by the US Department of Transport, has grown in all but three of the last 25 years, at a CAGR of 2.2%. For the year to December 2011, miles driven declined by 1.2%, due to continued high fuel prices, low consumer confidence and high unemployment.
The global vehicle population stood at 930 million units at the end of 2011 according to IHS and is expected to grow by 370 million units or a CAGR of 3.8% through to 2020. North America accounted for 31% of the total vehicle population in 2011, Europe 35% and Asia 27%. The highest expected growth rate through to 2020 is in Asia, which is forecast to grow at a CAGR of 8.1%, whereas, in North America and Europe, the CAGR to 2020 is expected to be only 1.0% and 1.4%, respectively.
The average age of light vehicles in the US stands at a record 10.8 years (according to Polk) and has grown or at least been flat in every year for the last 15 years. In Europe, the average age of light vehicles has followed a similar trend and stands at 8.2 years (as measured by ACEA). In China, the average age of cars is estimated to be around 4 years – a lower age than in the US and Europe because the volume of new car sales account for a higher proportion of the total car population.
US fuel prices in 2011 were approximately 30% higher than 2010 however have been declining throughout the second half of 2011. Fuel prices are a factor in determining the level of automotive usage and therefore the required spending on maintenance.
Automotive OE
We generated 23.8% of our Fiscal 2011 sales from the global automotive OE end market. Sales by our Gates business (principally belts and related accessories) accounted for 53.0% of our Fiscal 2011 sales for this end market. The remaining 47.0% of our Fiscal 2011 sales relate to businesses exited or discontinued, including Ideal, Stackpole and Schrader. The demand in this end market is directly related to global vehicle production. According to IHS, global automotive production in the ten years to 2011 averaged 65.7 million units and grew at a CAGR of 3.4%. North America accounted for 21% of global production, Europe 30%, Asia 41%, and China alone accounted for 14%. IHS forecasts that automotive production will grow at a CAGR of 5.5% over the next 5 years to 2016, with Asia accounting for 51% of the production over this period, with a CAGR of 6.8%. North America and Europe are expected to grow by 4.9% and 3.0%, respectively. Current automotive industry volumes in North America and Europe have improved somewhat from cyclical lows in 2008, though they are still significantly below long-run averages. In 2011, North American production recovered to 13.0 million units from 11.9 million units the year before, an increase of 9.1%. In Europe, production increased by 5.1%, rising from 19.1 million units in 2010 to 20.1 million units in 2011. The North American and European markets accounted for 9.9% and 5.6% of our Fiscal 2011 sales respectively. Approximately 3% of our automotive OE sales are derived from the Chinese market where production grew at an annualized growth rate of 20.3% between 2006 and 2011.
22
Pinafore Holdings B.V.
Item 4B
Evolving consumer preferences and recent regulations have made fuel economy a growth area for automotive OE suppliers, which we believe will benefit our business. Many of the products that we sell to the automotive OE end market have been shown to improve fuel economy, which positions us well to benefit from this trend.
We believe that the demand for our products in the automotive OE end market will continue to be driven by:
| • | | the level of global vehicle production; |
| • | | our ability to secure positions on new vehicle platforms relative to our competitors; and |
| • | | evolving regulatory requirements related to fuel economy. |
Building Products
The Building Products business group manufactures a wide range of air distribution products and systems, including grilles, registers and diffusers (‘GRDs’), dampers and fans, and bathware products (bathtubs, shower cubicles and luxury whirlpools) for the non-residential construction and residential construction end markets. Building Products sells its products through a range of distribution channels, principally to suppliers to the construction industry, building contractors, OEMs and retailers for both the new build and refurbishment sectors.
Over 90% of Fiscal 2011 sales were to the North American markets, but we have an increasing presence in India, Thailand, China, Europe and the Middle East. We operate from 68 locations across seven countries, with just under three quarters of our facilities located in the US. As at December 31, 2011, Building Products employed 7,037 people around the world.
The primary raw materials used by the business group are steel, aluminum, resin and fiberglass.
| | | | | | | | | | |
Sales by end markets | | | | | Sales by destination | | | |
Residential construction | | | 32.1 | % | | North America | | | 92.7 | % |
Commercial Construction | | | 67.6 | % | | Europe | | | 3.3 | % |
Other * | | | 0.3 | % | | China | | | 0.3 | % |
| | | | | | Rest of Asia | | | 2.5 | % |
| | | | | | Rest of World | | | 1.2 | % |
| | | | | | | | | | |
| | | 100.0 | % | | | | | 100.0 | % |
| | | | | | | | | | |
|
Major products by category |
Air Distribution |
Grilles, registers and diffusers |
Vents |
Dampers |
Fans |
|
Ducting |
|
Terminal units |
Air filters |
Louvers, screens & sun control systems |
|
Bathware |
Bathtubs, showers and whirlpools |
| * | Our ‘Other’ end markets include manufactured housing. |
We discuss below the businesses comprising Building Products’ continuing operating segments, followed by a brief analysis of the end markets to which those businesses sell.
23
Pinafore Holdings B.V.
Item 4B
Air Distribution

Key products
Grilles, registers, diffusers, dampers, commercial/industrial fans and accessories, energy recovery ventilators, louvers and filtration products
| | | | | | | | | | |
Number of locations | | | 59 | | | Adjusted EBITDA margin | | | 11.8 | % |
% of business group sales | | | 89.3 | % | | % of Group Sales | | | 17.5 | % |
We believe that Air Distribution, based in North America, is a leading manufacturer of products that are used to distribute, recycle and vent air, which are critical components of HVAC systems. We design and manufacture a broad range of products which are marketed under many established and well-known brand names including, Ruskin, Lau, Titus, Krueger, Koch Filter, Hart & Cooley and Selkirk. We believe that we are the only nationwide US provider of air distribution products across many of the primary categories in which we compete and we have an extensive multi-channel distribution network across the country. The majority of our products are sold through manufacturers’ representatives and building products wholesalers. The balance of our products are sold directly to HVAC OEMs, such as Carrier Group, York International and Lennox, as well as to home centers, specialty retailers and national accounts.
We maintain a competitive advantage in this business by offering the broadest range of products, providing industry-leading customer service and delivering customized products on short lead times with long-established, well-known brands. We believe our portfolio of brands is recognized as representing the highest quality products, and building architects and engineers often specify them by name in building designs. The non-residential construction market represented 75.7% of Air Distribution’s Fiscal 2011 sales, while 24.3% of Fiscal 2011 sales were to the residential construction market. 75.0% of Fiscal 2011 sales were into the new construction market, with the remaining 25.0% into the repair and remodeling (‘R&R’) market, which includes all sales to home centers such as Home Depot and Lowes.
Air Distribution’s products are also increasingly sold outside of North America with the UK, India, Australia and the Middle East contributing 5.5% of the segment’s Fiscal 2011 sales.
Bathware
| | | | | | |
 | | Key products Luxury whirlpool baths, acrylic tub/showers and showers |
| | | | | | | | | | |
Number of locations | | | 9 | | | Adjusted EBITDA margin | | | (4.2 | )% |
% of business group sales | | | 10.7 | % | | % of Group Sales | | | 2.1 | % |
Bathware is a leading manufacturer of bathtubs and shower enclosures in the US, including an extensive range of luxury whirlpools. The products are sold under the Aquatic brand name primarily through building products wholesalers, home center retailers and specialty distributors. The business operates manufacturing plants and distribution warehouses across the US, providing national distribution capabilities. The residential end market accounted for 97.0% of Bathware’s Fiscal 2011 sales, of which 76.3% were made to the new build sector and 23.7% to the R&R sector. The remaining 3.0% of Bathware’s Fiscal 2011 sales were made to the manufactured housing industry.
Doors & Windows (exited segment)
The Philips Doors and Windows business was based in the US and produced windows, doors and venting products for the residential, manufactured housing, recreational vehicle and specialty trailer markets. The business ceased its operations in August 2009.
24
Pinafore Holdings B.V.
Item 4B
Building Products end markets
Non-Residential Construction
We generated 13.3% of our Fiscal 2011 sales from the non-residential construction end market, primarily from our Air Distribution segment. US non-residential construction activity has been in decline since 2008, and, according to Dodge in 2011 US non-residential construction starts totaled 658 million square feet as compared with an average of 1.2 billion square feet over the period from 2007 to 2010. McGraw-Hill is forecasting that the market will continue to stabilize in 2012 followed by more rapid growth in 2013 and 2014. Approximately 16% of our Building Products business group’s Fiscal 2011 sales were derived from non-residential R&R activities within our Air Distribution segment. We believe this will be a growth area given the increasing global drive to reduce energy consumption in buildings, which many of our products achieve. Globally, buildings use approximately one-third of the world’s energy, 25% of which is attributable to buildings’ air distribution systems. Our energy efficient air distribution products can help reduce energy consumption in this area.
We believe that demand in the non-residential construction end market, which is inherently local in nature, will be driven by underlying dynamics including:
| • | | local office vacancy rates, which are tied to employment levels; |
| • | | the availability of financing for new construction projects; |
| • | | public and private spending on healthcare, education and other social services; and |
| • | | trends in the development of new urban areas and the re-development of existing urban areas. |
Residential Construction
We generated 6.3% of our Fiscal 2011 sales from the residential construction end market, including the R&R end market segment. Housing starts in 2011 were near cyclical lows at 607,000, having declined in most years since the peak in 2005 where starts were 2.1 million units. Average housing starts for the last 10 years were 1.3 million units (as measured by the US Census Bureau Housing Starts) and according to the NAHB, housing starts are expected to recover to approximately 900,000 units in 2013 as long-term demographic factors and an expected economic recovery lead to absorption of the current excess housing supply. However, despite signs of recent stabilization and the long-term positive outlook for new residential construction, recent housing starts data suggests that near-term demand will continue to be restrained. According to the US Census Bureau, R&R spending increased by 2.6% in 2011, and we expect it to continue to grow as consumer confidence and unemployment improve.
We believe that demand in the new residential construction end market segment will continue to be driven by:
| • | | consumer confidence and employment levels; |
| • | | availability of financing along with interest rate stability; |
| • | | on-going population growth and relocation trends; and |
| • | | the level of existing home sales which impacts housing inventory levels as well as the level of R&R activity. |
Raw materials and energy supplies
We maintain a diversified supply base for the raw material and component inputs that we use in our manufacturing operations. In Fiscal 2011, we spent $1.9 billion or approximately 56% of our cost of goods sold on material inputs, with the top 10 materials representing an approximate $1.7 billion or 86% of total input purchases. The primary raw materials used by our I&A business group are polymers, carbon black, steel, fibers and fabrics. In our Building Products business group, we primarily employ steel and aluminum in our products.
The ability of the Group’s suppliers to meet performance and quality specifications and delivery schedules is important to its operations, but the Company is not dependent on any single source of supply for critical materials. The energy and materials required for the Group’s manufacturing operations tend to be readily available, however, basic raw materials such as steel, aluminum, nickel, polymers and resins can be subject to significant fluctuations in price and occasionally availability. We have historically been able to pass on cost increases to our customers when we have experienced rising prices for our material inputs, however there is typically a lag between cost increases and our price increases. We maintain contracts with key customers and often in these agreements we are able to include raw material clauses, which allow us to minimize the lag between an increase in costs and a raise in the prices for our products. Furthermore, improved purchasing strategies, cost reduction initiatives and sourcing of alternative materials have helped to mitigate input pricing pressures. Materials and components are generally sourced locally and are typically available from multiple qualified sources in quantities sufficient for our needs.
Seasonality
Industrial & Automotive
Sales to automotive OEMs tend generally not to exhibit seasonal patterns, although there are slow-downs in summer and around the calendar year end due to shut-downs in Europe and, to a lesser extent, North America. Sales into the aftermarket are generally stronger during the winter months reflecting higher levels of demand for replacement parts for vehicles during those months. Sales to industrial OEMs are strongest from October to April for outdoor power equipment and from February to June for agricultural equipment.
Equipment sales to the agricultural industry experience moderate seasonality due to crop-related seasonal activities, while sales to the construction industry decline in the summer months followed by a resurgence of activity in the late fall, early winter and spring. The remaining markets served by I&A do not exhibit significant seasonal patterns.
Building Products
Sales to the construction industry generally slow down in November and December before the Thanksgiving, Christmas and New Year holiday season and are generally stronger in the spring and summer months. Sales can also be affected regionally by severe weather. Heating product sales are more concentrated in the fall and cooling product sales in the spring.
25
Pinafore Holdings B.V.
Item 4B
Patents and Trademarks
We market and sell our products and services under numerous trademarks, which we believe carry strong identities in the markets we serve. We also hold various patent and licenses with respect to our products. However, as we have many product lines, the loss or expiration of any single or series of related patents or licenses would not materially affect our sales and profits.
Regulations
We are subject to a variety of laws and regulations, including but not limited to those of the United States, that impose requirements that govern many aspects of our operations. These requirements include but are not limited to environmental, health and safety laws and legal requirements that are intended to curtail bribery and corruption.
We are subject to a variety of federal, state, local, foreign and provincial environmental, health and safety laws and regulations, including those governing the discharge of pollutants into the air or water, the management, storage and disposal of, or exposure to, hazardous substances and wastes, the responsibility to investigate and clean up contamination, and occupational health and safety. Fines and penalties may be imposed for non-compliance with applicable environmental, health and safety requirements and the failure to have or to comply with the terms and conditions of required permits. Historically, the costs to comply with environmental, health and safety requirements have not been material. However, the failure by us to comply with applicable environmental, health and safety requirements could result in fines, penalties, enforcement actions, third-party claims for property damage and personal injury, requirements to clean up property or to pay for the costs of cleanup, or regulatory or judicial orders requiring corrective measures, including the installation of pollution control equipment or remedial actions.
Under certain laws and regulations, such as the federal US Superfund law, the obligation to investigate and remediate contamination at a facility may be imposed on current and former owners or operators or on persons who may have sent waste to that facility for disposal. Liability under these laws and regulations may be without regard to fault or to the legality of the activities giving rise to the contamination. We are currently performing environmental investigations and remediation at a number of former and current facilities in the United States and Canada, as well as another facility in Belgium. We have incurred and will continue to incur costs to investigate and remediate conditions at those sites. We are also incurring costs associated with contamination at approximately twenty offsite waste disposal sites. We have established reserves of $6.4 million with respect to such remediation and other environmental matters. In the future, we may incur similar liabilities in connection with environmental conditions currently unknown to us relating to our existing, prior, or future sites or operations or those of predecessor companies whose liabilities we may have assumed or acquired. As discussed inItem 3D‘Risk factors’ we are and may from time to time be subject to personal injury and/or property damage lawsuits in which private parties allege damages arising from exposure to hazardous materials used, or alleged to be used, by us in the past.
In addition, environmental, health and safety laws and regulations applicable to our business and the business of our customers, and the interpretation or enforcement of these laws and regulations, are constantly evolving and it is impossible to predict accurately the effect that changes in these laws and regulations, or their interpretation or enforcement, may have upon our business, financial condition or results of operations. For example, legislation and regulations limiting emissions of greenhouse gases are at various stages of consideration and implementation, and if fully implemented, could negatively impact the market for the products we distribute and, consequently, our business. Should environmental laws and regulations, or their interpretation or enforcement, become more stringent, our costs could increase, which may have a material adverse effect on our business, financial condition and results of operations.
The FCPA, the UK Bribery Act of 2010, international treaties and the laws of various countries are designed to prevent public corruption and commercial bribery. We are subject to one or more of these laws in various jurisdictions. Failure to comply with these laws could subject us to, among other things, penalties and legal expenses, which could harm our reputation and have a material adverse effect on our business, financial condition and results of operations.
C. Organizational structure
The Company is the parent of a large number of subsidiaries that are organized into two principal business groups managed through a Corporate Center. As at December 31, 2011, the Group’s organizational structure as used for internal reporting is as follows:
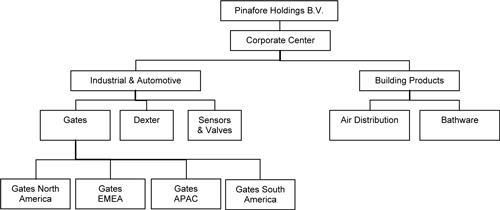
A list of the Company’s principal subsidiaries, including their name, country of incorporation and the Group’s ownership interest, is set forth in Exhibit 8.1.
26
Pinafore Holdings B.V.
Item 4B
D. Property, plant and equipment
The Group operates from 277 locations in 32 countries across the Americas, Europe, Asia, and Australia. As at December 31, the carrying amount of the Group’s property, plant and equipment was $902.9 million (December 31, 2010: $1,359.1 million), of which $3.0 million (December 31, 2010: $4.2 million) related to assets held under finance leases.
Included in property, plant and equipment are land and buildings of $318.3 million, representing the Group’s owned manufacturing facilities, service centers, distribution centers and offices, which are located in 14 countries throughout the world, predominantly in North America. These 110 owned facilities cover approximately 17.7 million square feet (December 31, 2010: 19.5 million square feet) and include 81 manufacturing or service centers. The Group leases a further 167 locations, which cover 9.2 million square feet (December 31, 2010: 10.0 million square feet) and include 68 manufacturing or service centers. The Group continues to improve and replace properties when considered appropriate to meet the needs of its individual operations. There are no individually significant properties that were under-utilized during Fiscal 2011.
The table below provides an analysis of the geographic spread of the Group’s property, plant and equipment (excluding assets held for sale).
| | | | | | | | |
| | | Carrying amount | |
| | | $ million | | | % | |
US | | | 418.6 | | | | 46.4 | % |
China | | | 137.7 | | | | 15.2 | % |
Mexico | | | 53.0 | | | | 5.9 | % |
Brazil | | | 46.3 | | | | 5.1 | % |
Poland | | | 35.7 | | | | 4.0 | % |
India | | | 31.3 | | | | 3.5 | % |
Japan | | | 27.1 | | | | 3.0 | % |
UK | | | 25.4 | | | | 2.8 | % |
Other countries | | | 127.8 | | | | 14.1 | % |
| | | | | | | | |
Total | | | 902.9 | | | | 100.0 | % |
| | | | | | | | |
Due to the diverse nature of our business, there is no individual fixed asset or facility at December 31, 2011, the loss of which would have a material adverse impact on our operations. There are no plans to construct, expand or improve facilities that would, on completion or cancellation, significantly affect our operations.
Assets held under finance leases are secured by a lessor’s charge over the leased assets. Following the Acquisition, the Group’s secured borrowings are jointly and severally, irrevocably and fully and unconditionally guaranteed by certain of the Company’s direct and indirect subsidiaries and secured by liens on substantially all of their assets. An analysis of the security given is presented in note 47 to the Group’s consolidated financial statements.
Item 4A. Unresolved Staff Comments
None.
27
Pinafore Holdings B.V.
Item 5A
| Item 5. | Operating and financial review and prospects |
A. Operating results
Basis of preparation
This section should be read in conjunction with the Group’s consolidated financial statements which have been prepared in accordance with IFRS and present separately the Predecessor periods prior to the Acquisition and the Successor periods after the Acquisition. The Predecessor financial statements do not reflect the effects of the accounting for or the financing of the Acquisition. To facilitate a discussion of certain results of operations across periods, we have presented the results for Fiscal 2010 on a pro forma basis taking in account the effects of the certain events as if those events had occurred on January 3, 2010. For a description of these events and for information regarding their pro forma effects, see ‘Unaudited pro forma financial information’ included at the end ofItem 5A.
We assess the performance of our businesses using a variety of measures. Certain of these measures are not explicitly defined under IFRS and are therefore termed ‘non-GAAP measures’. Under the heading ‘Non-GAAP measures’ at the end ofItem 5B‘Liquidity and capital resources’, we identify and explain the relevance of each of the non-GAAP measures presented used in this Annual Report, show how they are calculated and present a reconciliation to the most directly comparable measure defined under IFRS. We do not regard these non-GAAP measures as a substitute for, or superior to, the equivalent measures defined under IFRS. The non-GAAP measures that we use may not be directly comparable with similarly-titled measures used by other companies.
The statements in this Annual Report regarding industry outlook, our expectations regarding the performance of our business and the forward-looking statements are subject to numerous risks and uncertainties, including, but not limited to, the risks and uncertainties described in the ‘Special note regarding forward-looking statements’ on page i andItem 3D‘Risk factors’. Our actual results may differ materially from those contained in or implied by any forward-looking statements.
The following discussion should be read together withItem 3A‘Selected historical financial information’,Item 3D‘Risk factors’, the ‘Unaudited pro forma financial information’ section included below, and the Group’s consolidated financial statements, including the related notes, appearing elsewhere in this Annual Report.
Our Business
We are a diversified global engineering and manufacturing company with a portfolio of market-leading businesses. Our products are highly engineered and used in the industrial, automotive and construction end markets. We have a broad collection of premier brands that are among the most globally recognized in their respective end markets. Approximately 40% of our Fiscal 2011 sales were generated from the global industrial replacement end market and automotive aftermarket, where we achieve higher margins. Our industrial replacement business provides us with exposure to a broad range of industrial end market segments that have an ongoing need for replacement parts, and the automotive aftermarket also provides us with both a stable source of revenue and our highest margins. The significant majority of our products, including those useful for the reduction of energy consumption and for safety improvement, are positioned in the premium end of their respective end markets, and as a result, allow for associated premium pricing. The prices of our products are low relative to the potential cost of their failure within the critical systems in which they are used, such as industrial machinery, automotive engines and HVAC systems.
We attribute our end market leadership positions to a combination of our brand strength, product quality and breadth, and customer service and support. We are led by an experienced management team that has successfully streamlined our portfolio to focus on our core businesses, and implemented wide-ranging, significant cost-saving restructuring initiatives.
Our revenue and earnings base is highly diversified by product, geography, end market and customer. Our product portfolio consists of tens of thousands of SKUs, and we believe it comprises the broadest range of power transmission belts, fluid power hoses and air distribution products in the end markets in which we operate. We derive revenues from nearly every developed country across the globe and are well-positioned in most emerging markets with our industrial and automotive component products. Approximately 38% of our Fiscal 2011 sales were generated outside of North America. The diversification of our customer base is evidenced by the fact that our top ten customers represented only 22% of our Fiscal 2011 sales. We maintain long-standing customer relationships and have served our top 20 customers for an average of over 35 years, while some of our largest customer relationships span over 50 years. We have also developed strong relationships with industry-leading customers in emerging markets.
The charts below, representing our continuing operations, highlight the diversity of our end markets and our geographical diversification:
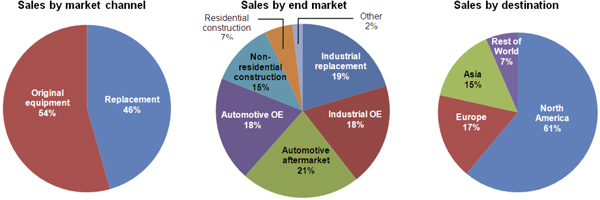
28
Pinafore Holdings B.V.
Item 5A
Effect of the Acquisition
As a result of the Acquisition and the application of purchase accounting, certain of our assets and liabilities were adjusted to their fair values on the date of the Acquisition. These adjusted valuations will result in additional depreciation and amortization in the Successor periods. Specifically, we anticipate an increase in our cost of sales due to the increased carrying value of our property, plant and equipment and an increase in our administrative expenses due to the amortization of our intangible assets. As a result of the Acquisition we have recognized certain intangible assets that we consider have indefinite useful lives and there has been a significant increase in the carrying amount of goodwill compared with the Predecessor periods. Both goodwill and intangible assets with indefinite useful lives are not amortized but are subject to annual impairment testing.
Additionally, as discussed below underItem 5B‘Liquidity and capital resources’ we incurred significant indebtedness in connection with the Acquisition and our total indebtedness and related interest expenses in the Successor periods will be significantly higher than in the Predecessor periods.
Group-wide restructuring Initiatives
In response to the adverse economic conditions prevailing during late 2007 and 2008, we launched two major restructuring initiatives during Fiscal 2008 and Fiscal 2009, which we refer to as projects Eagle and Cheetah. Project Eagle was launched in early 2008 to reduce our cost base, improve our competitiveness and increase our operating margins. Project Cheetah was launched in early 2009 to refocus our manufacturing footprint towards low-cost and high growth regions and within our most efficient facilities. These projects have had a material impact on our results of operations, capital resources and cash flows.
During Fiscal 2011, the Group initiated Project Sierra, an initiative that focuses on identifying and implementing cost reduction opportunities and efficiency improvements across many of our businesses.
Our segments
Our revenue and earnings base is highly diversified by product, geography, end market and customer. We derive revenues from nearly every developed country across the globe and our industrial and automotive component products are well-positioned in most emerging markets.
We are organized for management reporting purposes into two business groups: Industrial & Automotive and Building Products. We distinguish within our continuing operations between those of our operating segments that are ongoing, which we identify as ongoing segments, and those that we have exited but do not meet the conditions to be classified as discontinued operations, which we identify as exited segments.
| • | | I&A manufactures a wide range of systems and components for the industrial equipment, car, truck and trailer manufacturing markets, and industrial and automotive aftermarkets throughout the world. I&A is comprised of five ongoing operating segments: Gates North America, Gates EMEA, Gates APAC, Gates South America and Dexter. |
| • | | Building Products is comprised of two ongoing operating segments: Air Distribution and Bathware. Air Distribution supplies the industrial and residential HVAC market, mainly in North America. Bathware manufactures baths and whirlpools for the residential, and hotel and resort development markets, mainly in North America. |
During the periods under review, we reported three exited segments within continuing operations: within Industrial & Automotive, the Powertrain segment which was sold on August 2, 2011; the Other I&A segment, comprising the Plews, Dexter Chassis and Ideal businesses (which were sold in April 2011, August 2011 and October 2011, respectively); and, within Building Products, the Doors & Windows segment, which was closed during Fiscal 2009.
During the second quarter of 2011, management began actively seeking a buyer for the businesses that comprise our Sensors & Valves operating segment within I&A. This operating segment is now classified as a discontinued operation.
Unless otherwise stated, all references below to Fiscal 2011 sales relate to continuing operations only.
29
Pinafore Holdings B.V.
Item 5A
Highlighting the diversity of the end markets in which our segments operate, our Fiscal 2011 sales analyzed by end market were as follows:
| | | | | | | | | | | | | | | | | | | | | | | | | | | | | | | | |
$ million | | Industrial
replacement | | | Industrial
OE | | | Automotive
aftermarket | | | Automotive
OE | | | Non-residential
construction | | | Residential
construction | | | Other * | | | Total | |
Ongoing operations | | | | | | | | | | | | | | | | | | | | | | | | | | | | | | | | |
Industrial & Automotive: | | | | | | | | | | | | | | | | | | | | | | | | | | | | | | | | |
– Gates North America | | | 427.9 | | | | 287.6 | | | | 499.5 | | | | 72.3 | | | | — | | | | — | | | | — | | | | 1,287.3 | |
– Gates EMEA | | | 196.2 | | | | 111.4 | | | | 290.6 | | | | 205.1 | | | | — | | | | — | | | | — | | | | 803.3 | |
– Gates APAC | | | 155.8 | | | | 125.7 | | | | 100.6 | | | | 326.6 | | | | — | | | | — | | | | — | | | | 708.7 | |
– Gates South America | | | 50.6 | | | | 30.3 | | | | 44.2 | | | | 31.6 | | | | — | | | | — | | | | — | | | | 156.7 | |
| | | | | | | | | | | | | | | | | | | | | | | | | | | | | | | | |
| | | 830.5 | | | | 555.0 | | | | 934.9 | | | | 635.6 | | | | — | | | | — | | | | — | | | | 2,956.0 | |
– Dexter | | | — | | | | 232.0 | | | | — | | | | — | | | | — | | | | — | | | | 49.4 | | | | 281.4 | |
| | | | | | | | | | | | | | | | | | | | | | | | | | | | | | | | |
| | | 830.5 | | | | 787.0 | | | | 934.9 | | | | 635.6 | | | | — | | | | — | | | | 49.4 | | | | 3,237.4 | |
Building Products: | | | | | | | | | | | | | | | | | | | | | | | | | | | | | | | | |
– Air Distribution | | | — | | | | — | | | | — | | | | — | | | | 668.5 | | | | 214.4 | | | | — | | | | 882.9 | |
– Bathware | | | — | | | | — | | | | — | | | | — | | | | — | | | | 103.1 | | | | 3.2 | | | | 106.3 | |
| | | | | | | | | | | | | | | | | | | | | | | | | | | | | | | | |
| | | — | | | | — | | | | — | | | | — | | | | 668.5 | | | | 317.5 | | | | 3.2 | | | | 989.2 | |
| | | | | | | | | | | | | | | | | | | | | | | | | | | | | | | | |
Total ongoing operations | | | 830.5 | | | | 787.0 | | | | 934.9 | | | | 635.6 | | | | 668.5 | | | | 317.5 | | | | 52.6 | | | | 4,226.6 | |
| | | | | | | | | | | | | | | | | | | | | | | | | | | | | | | | |
| | | | | | | | |
Exited segments | | | | | | | | | | | | | | | | | | | | | | | | | | | | | | | | |
Industrial & Automotive: | | | | | | | | | | | | | | | | | | | | | | | | | | | | | | | | |
– Powertrain | | | — | | | | 5.3 | | | | 0.8 | | | | 194.1 | | | | — | | | | — | | | | — | | | | 200.2 | |
– Other I&A | | | 55.0 | | | | 36.2 | | | | 24.8 | | | | 16.6 | | | | — | | | | — | | | | 31.3 | | | | 163.9 | |
| | | | | | | | | | | | | | | | | | | | | | | | | | | | | | | | |
Total exited | | | 55.0 | | | | 41.5 | | | | 25.6 | | | | 210.7 | | | | — | | | | — | | | | 31.3 | | | | 364.1 | |
| | | | | | | | | | | | | | | | | | | | | | | | | | | | | | | | |
Total continuing operations | | | 885.5 | | | | 828.5 | | | | 960.5 | | | | 846.3 | | | | 668.5 | | | | 317.5 | | | | 83.9 | | | | 4,590.7 | |
| | | | | | | | | | | | | | | | | | | | | | | | | | | | | | | | |
| * | Our ‘Other’ end markets include manufactured housing and recreational vehicles. |
The percentage changes in the Group’s ongoing sales by end market from pro forma Fiscal 2010 to Fiscal 2011 were as follows:
| | | | | | | | | | | | | | | | | | | | | | | | | | | | | | | | |
% change | | Industrial
replacement | | | Industrial
OE | | | Automotive
aftermarket | | | Automotive
OE | | | Non-residential
construction | | | Residential
construction | | | Other * | | | Total | |
Ongoing operations | | | | | | | | | | | | | | | | | | | | | | | | | | | | | | | | |
Industrial & Automotive: | | | | | | | | | | | | | | | | | | | | | | | | | | | | | | | | |
– Gates North America | | | 12.5 | % | | | 31.8 | % | | | 2.3 | % | | | 9.9 | % | | | — | | | | — | | | | — | | | | 11.7 | % |
– Gates EMEA | | | 8.4 | % | | | 19.8 | % | | | (2.2 | )% | | | 16.5 | % | | | — | | | | — | | | | — | | | | 7.5 | % |
– Gates APAC | | | 18.8 | % | | | 20.2 | % | | | 14.7 | % | | | 6.2 | % | | | — | | | | — | | | | — | | | | 12.3 | % |
– Gates South America | | | 3.9 | % | | | (15.1 | )% | | | 44.0 | % | | | (1.6 | )% | | | — | | | | — | | | | — | | | | 6.5 | % |
| | | | | | | | | | | | | | | | | | | | | | | | | | | | | | | | |
| | | 12.0 | % | | | 22.9 | % | | | 3.4 | % | | | 9.3 | % | | | — | | | | — | | | | — | | | | 10.4 | % |
– Dexter | | | — | | | | 20.0 | % | | | — | | | | — | | | | — | | | | — | | | | (4.6 | )% | | | 14.8 | % |
| | | | | | | | | | | | | | | | | | | | | | | | | | | | | | | | |
| | | 12.0 | % | | | 22.0 | % | | | 3.4 | % | | | 9.3 | % | | | — | | | | — | | | | (4.6 | )% | | | 10.7 | % |
| | | | | | | | | | | | | | | | | | | | | | | | | | | | | | | | |
| | | | | | | | |
Building Products: | | | | | | | | | | | | | | | | | | | | | | | | | | | | | | | | |
– Air Distribution | | | — | | | | — | | | | — | | | | — | | | | 4.7 | % | | | (4.5 | )% | | | — | | | | 2.3 | % |
– Bathware | | | — | | | | — | | | | — | | | | — | | | | — | | | | (9.9 | )% | | | (27.3 | )% | | | (10.5 | )% |
| | | | | | | | | | | | | | | | | | | | | | | | | | | | | | | | |
| | | — | | | | — | | | | — | | | | — | | | | 4.7 | % | | | (6.3 | )% | | | (27.3 | )% | | | 0.8 | % |
| | | | | | | | | | | | | | | | | | | | | | | | | | | | | | | | |
Total ongoing operations | | | 12.0 | % | | | 22.0 | % | | | 3.4 | % | | | 9.3 | % | | | 4.7 | % | | | (6.3 | )% | | | (6.4 | )% | | | 8.2 | % |
| | | | | | | | | | | | | | | | | | | | | | | | | | | | | | | | |
| * | Our ‘Other’ end markets include manufactured housing and recreational vehicles. |
30
Pinafore Holdings B.V.
Item 5A
Industry trends
Industrial & Automotive (78.5% of Fiscal 2011 sales)
During Fiscal 2011, the industrial markets accounted for 47.6% of I&A sales, with 24.6% to the industrial replacement market and 23.0% to the industrial OE market.
US industrial production, as measured by the US Federal Reserve Industrial Production index, continued to grow throughout 2011 and in December was 2.9% higher than December 2010. The European industrial production index grew through the first part of the year but has been declining since its peak in August 2011. Industrial markets in Asia continued to soften, with industrial production in China growing by 14.0% in the year to November 2011 compared with 15.7% for 2010 as a whole (as measured by the National Bureau of Statistics of China). Sales to the industrial markets in North America, Europe and Asia accounted for 28.6%, 7.3% and 7.0% respectively of I&A’s sales in Fiscal 2011.
The automotive aftermarket, which comprised 26.7% of I&A’s sales in Fiscal 2011, grew but at a slower pace than in 2010. In the US, miles driven, a key driver of vehicle repair, was down by 1.2% in the year to December 2011 compared with the corresponding period in 2010, and the price of gasoline (another factor influencing the amount of spending on car maintenance) stood 27% higher at the end of December 2011 compared with December 2010. Sales to the automotive aftermarket in North America, Europe and Asia accounted for 14.5%, 7.8% and 2.1% respectively of I&A’s sales in Fiscal 2011.
The automotive OE market accounted for 23.5% of I&A’s sales in Fiscal 2011. Global production volumes as measured by IHS were up by 2.8% compared with 2010, with volumes in North America up by 9.1%, Europe up by 5.1%, China up by 2.9% and Japan/Korea down by 7.2% compared with 2010. Sales to the automotive OE market in North America, Europe and Asia accounted for 7.1%, 6.2% and 9.2% respectively of I&A’s sales in Fiscal 2011.
Building Products (21.5% of Fiscal 2011 sales)
Non-residential construction in North America accounted for 60.7% of Building Products’ sales in Fiscal 2011. In the US, non-residential construction declined on a square foot basis by 2.4% during 2011 compared with 2010, and by 4.5% on a dollar value basis (as measured by Dodge). However, US office vacancy rates (as measured by CB Richard Ellis) continued to fall, reaching 16.0% in the last quarter of 2011. A decrease in vacancy rates indicates lower supply going forward, and levels below 12% indicate an expansion in construction activity. The US Architectural Billings Index, which is regarded as a leading indicator of future commercial construction activity, grew throughout the second half of 2010 ending at 52 in December 2011. A value of more than 50 suggests an expansion in future construction activity.
Residential construction in North America accounted for 31.6% of Building Products’ sales in Fiscal 2011. The US residential construction market continues to be weak, with housing starts in 2011 at 607,000, 3.4% higher than in 2010. Housing inventories, at 6.1 months for new homes and 8.3 months for existing homes fell throughout the second half of the year and are close to the levels at which new construction is initiated. House prices (as measured by the S&P/Case-Shiller Home Price Index) rose during the middle of 2011, but declined towards the end of the year.
Fiscal 2011 results compared with pro forma Fiscal 2010 results
Unless otherwise indicated, all commentary in this section is for continuing operations.
Group summary
| | | | | | | | | | | | | | | | | | | | | | |
| $ million, unless otherwise stated | | SUCCESSOR | | | | | PREDECESSOR | | | | | | | |
| | | Fiscal 2011 | | | Q4 2010 | | | | | 9M 2010 | | | Pro forma
adjustments | | | Pro forma
Fiscal 2010 | |
Continuing operations | | | | | | | | | | | | | | | | | | | | | | |
Sales | | | 4,590.7 | | | | 1,181.3 | | | | | | 3,270.4 | | | | — | | | | 4,451.7 | |
Cost of sales | | | (3,128.0 | ) | | | (950.3 | ) | | | | | (2,223.8 | ) | | | 107.8 | | | | (3,066.3 | ) |
| | | | | | | | | | | | | | | | | | | | | | |
Gross profit | | | 1,462.7 | | | | 231.0 | | | | | | 1,046.6 | | | | 107.8 | | | | 1,385.4 | |
Distribution costs | | | (508.0 | ) | | | (137.1 | ) | | | | | (362.0 | ) | | | — | | | | (499.1 | ) |
Administrative expenses | | | (665.1 | ) | | | (217.3 | ) | | | | | (327.3 | ) | | | (90.6 | ) | | | (635.2 | ) |
Transaction costs | | | (0.6 | ) | | | (78.2 | ) | | | | | (41.2 | ) | | | 118.8 | | | | (0.6 | ) |
Impairments | | | (38.0 | ) | | | — | | | | | | — | | | | — | | | | — | |
Restructuring costs | | | (40.2 | ) | | | (3.7 | ) | | | | | (10.0 | ) | | | — | | | | (13.7 | ) |
Net gain on disposals and on the exit of businesses | | | 60.9 | | | | — | | | | | | 6.3 | | | | — | | | | 6.3 | |
Share of profit of associates | | | 1.2 | | | | 1.0 | | | | | | 0.8 | | | | — | | | | 1.8 | |
| | | | | | | | | | | | | | | | | | | | | | |
Operating profit/(loss) | | | 272.9 | | | | (204.3 | ) | | | | | 313.2 | | | | 136.0 | | | | 244.9 | |
| | | | | | |
Interest expense | | | (317.9 | ) | | | (90.8 | ) | | | | | (71.4 | ) | | | (198.7 | ) | | | (360.9 | ) |
Investment income | | | 71.8 | | | | 18.7 | | | | | | 48.0 | | | | — | | | | 66.7 | |
Other finance (expense)/income | | | (26.4 | ) | | | (27.1 | ) | | | | | (2.7 | ) | | | 55.1 | | | | 25.3 | |
Net finance costs | | | (272.5 | ) | | | (99.2 | ) | | | | | (26.1 | ) | | | (143.6 | ) | | | (268.9 | ) |
| | | | | | | | | | | | | | | | | | | | | | |
Profit/(loss) before tax | | | 0.4 | | | | (303.5 | ) | | | | | 287.1 | | | | (7.6 | ) | | | (24.0 | ) |
Income tax (benefit)/expense | | | 19.2 | | | | 34.1 | | | | | | (62.5 | ) | | | 66.7 | | | | 38.3 | |
| | | | | | | | | | | | | | | | | | | | | | |
Profit/(loss) for the period | | | 19.6 | | | | (269.4 | ) | | | | | 224.6 | | | | 59.1 | | | | 14.3 | |
| | | | | | | | | | | | | | | | | | | | | | |
| | | | | | |
Adjusted EBITDA | | | 699.3 | | | | 173.8 | | | | | | 498.9 | | | | (1.7 | ) | | | 671.0 | |
Adjusted EBITDA margin (%) | | | 15.2 | % | | | 14.7 | % | | | | | 15.3 | % | | | | | | | 15.1 | % |
31
Pinafore Holdings B.V.
Item 5A
Sales
Sales in Fiscal 2011 were $4,590.7 million, compared with sales of $1,181.3 million in Q4 2010 and $3,270.4 million in 9M 2010. Pro forma sales in Fiscal 2010 were $4,451.7 million. During Fiscal 2011, the Group disposed of four businesses: Stackpole (which comprised the Powertrain segment), Plews, Dexter Chassis and Ideal (which together formed the Other I&A segment). These disposals reduced Fiscal 2011 sales by $217.2 million compared with pro forma Fiscal 2010. In addition, the Group’s continuing sales for Fiscal 2011 benefitted from a positive movement of $95.3 million in average currency exchange rates (particularly the Euro, Canadian dollar and Japanese Yen) compared with pro forma Fiscal 2010. Acquisitions, which included Koch Filter in Fiscal 2010 and Du-Tex in Fiscal 2011, contributed a further $11.4 million to the improvement in sales in Fiscal 2011 compared with pro forma Fiscal 2010. Excluding these impacts from acquisitions, disposals and currency exchange rate movements, Fiscal 2011 sales from continuing operations were $249.5 million higher than in pro forma Fiscal 2010.
Excluding segments that have been exited, the Group’s ongoing sales in Fiscal 2011 were $4,226.6 million (pro forma Fiscal 2010: $3,905.1 million), an increase of 8.2%. Higher sales volumes during Fiscal 2011 accounted for approximately $146 million of the increase in ongoing sales, while higher selling prices across most segments, particularly Gates North America and Air Distribution, contributed approximately a further $81 million to the improvement over pro forma Fiscal 2010.
I&A’s ongoing sales in Fiscal 2011 were 10.7% higher compared with pro forma Fiscal 2010, due mainly to improvements in the industrial OE and replacement markets and the automotive OE markets. Sales to the industrial markets grew by 16.7%, driven by growth in the Gates North America businesses. Sales to the automotive OE markets grew by 9.3%, of which 7.1% was from Europe and China. Sales to the automotive aftermarket increased by 3.4% during Fiscal 2011 compared with pro forma Fiscal 2010, as strong growth in North America was partially offset by a slight weakening in European sales. Building Products’ sales for Fiscal 2011 were up by 0.8% compared with pro forma Fiscal 2010, as sales growth to the non-residential construction markets combined with the impact of the acquisition of Koch Filter (which was completed on February 26, 2010) were largely offset by the continued weakness in the US residential construction market.
Cost of sales
Cost of sales in Fiscal 2011 was $3,128.0 million, compared with $950.3 million in Q4 2010 and $2,223.8 million in 9M 2010. Pro forma cost of sales for Fiscal 2010 was $3,066.3 million. The increase of 2.0% in cost of sales during Fiscal 2011 compared with pro forma Fiscal 2010 was driven principally by higher production volumes of approximately $100 million, combined with raw material cost increases of approximately $80 million across the Group. The majority of these increases were offset by the reduction in cost of sales as a result of the disposal of businesses during Fiscal 2011.
Gross profit
The gross profit for Fiscal 2011 was $1,462.7 million, compared with $231.0 million in Q4 2010 and $1,046.6 million in 9M 2010. Pro forma gross profit for Fiscal 2010 was $1,385.4 million. Our gross profit margin for Fiscal 2011 was 31.9%, up slightly from 31.1% in pro forma Fiscal 2010, due principally to higher selling prices which contributed approximately $80 million to gross profit.
Distribution costs
Distribution costs in Fiscal 2011 were $508.0 million, compared with $137.1 million in Q4 2010 and $362.0 million in 9M 2010. Pro forma distribution costs in Fiscal 2010 were $499.1 million. Fiscal 2011 distribution costs as a percentage of sales remained broadly in line with the prior year at 11.1% (pro forma Fiscal 2010: 11.2%).
Administrative expenses
Administrative expenses in Fiscal 2011 were $665.1 million, compared with $217.3 million in Q4 2010 and $327.3 million in 9M 2010. Pro forma administrative expenses in Fiscal 2010 were $635.2 million. The increase in administrative expenses in Fiscal 2011 compared with pro forma Fiscal 2010 was due principally to an increase in the charge relating to share-based incentives ($8.7 million) and an increase in labor-related costs of approximately $18 million.
Transaction costs
Transaction costs of $0.6 million were recognized during Fiscal 2011, including costs of $0.2 million in relation to the acquisition of Du-Tex in October 2011.
The Group recognized transaction costs in relation to acquisitions of $78.2 million during Q4 2010 and of $41.2 million during 9M 2010, predominantly in respect of the Acquisition. Pro forma transaction costs for Fiscal 2010 amounted to $0.6 million, principally in relation to the acquisition of Koch Filter Corporation in February 2010.
Impairments
During Fiscal 2011, in light of the prolonged weakness of the US residential construction end market, the Group recognized an impairment of $36.9 million in relation to Bathware, representing the entire goodwill allocated to this segment.
Also during Fiscal 2011, an impairment of $0.7 million was recognized in relation to Schrader Duncan, an associate that is listed on the Mumbai Stock Exchange and which is included within the discontinued Sensors & Valves segment.
No impairments of long-lived assets were recognized in either Q4 2010 or 9M 2010.
Restructuring costs
Restructuring costs in Fiscal 2011 were $40.2 million principally in relation to Project Sierra, an initiative that focuses on identifying and implementing cost reduction opportunities and efficiency improvements across many of the Group’s businesses. These costs were partially offset by the release of a provision for restructuring costs of $10.6 million due to the reversal of the decision to close a division of Stackpole, which comprises the Powertrain operating segment, following the recovery in the demand for its products.
We recognized restructuring costs of $3.7 million during Q4 2010 and $10.0 million during 9M 2010 in connection with projects Eagle and Cheetah. In both periods, the costs related principally to the cessation of certain of Gates North America’s manufacturing facilities in North America, partially offset by gains on various asset disposals.
32
Pinafore Holdings B.V.
Item 5A
Net gain on disposals and on the exit of businesses
During Fiscal 2011 we recognized a net gain on the disposal and on the exit of businesses of $60.9 million, principally in relation to the sale in October 2011 of the Ideal business.
No gain or loss on the disposal or exit of businesses was recognized during Q4 2010, however, during 9M 2010, we recognized a net gain of $9.6 million on the disposal of property, plant and equipment, principally in Building Products as a consequence of the restructuring of Bathware and the closure of Doors & Windows. This net gain was offset by an additional loss of $3.3 million on the disposal of a subsidiary that took place in Fiscal 2008 and a loss on the disposal of Hydrolink’s operations in Kazakhstan.
Operating profit
Operating profit in Fiscal 2011 was $272.9 million, compared with a loss of $204.3 million in Q4 2010 and a profit of $313.2 million in 9M 2010. Pro forma operating profit for Fiscal 2010 was $244.9 million.
Adjusted EBITDA
Adjusted EBITDA for Fiscal 2011 was $699.3 million, compared with $173.8 million for Q4 2010 and $498.9 million for 9M 2010. Pro forma adjusted EBITDA for Fiscal 2010 was $671.0 million. The disposal of businesses during Fiscal 2011 reduced adjusted EBITDA during Fiscal 2011 by $23.7 million, offset in part by a $17.6 million benefit from movements in average currency exchange rates. Excluding these two factors, and a small contribution in Fiscal 2011 from acquisitions, adjusted EBITDA grew by $31.6 million, including an increase of approximately $40 million from the Group’s higher sales volumes, particularly in North American industrial OE markets. Increases in raw material and other input costs of approximately $90 million were largely offset by an $80 million benefit from higher selling prices.
The adjusted EBITDA margin was up slightly at 15.2%, compared with 15.1% in pro forma Fiscal 2010.
A reconciliation of operating profit or loss to adjusted EBITDA for each of the periods under review and for each of the Group’s operating segments is presented under the heading ‘Non-GAAP measures’.
Interest expense
The interest expense for Fiscal 2011 was $317.6 million, compared with $90.8 million for Q4 2010 and $71.4 million for 9M 2010. Pro forma interest expense for Fiscal 2010 was $360.9 million. Our interest expense may be analyzed as follows:
| | | | | | | | | | | | | | | | | | | | | | |
| $ million | | SUCCESSOR | | | | | PREDECESSOR | | | | | | | |
| | | Fiscal 2011 | | | Q4 2010 | | | | | 9M 2010 | | | Pro forma
adjustments | | | Pro forma
Fiscal 2010 | |
Bank overdrafts | | | 0.7 | | | | — | | | | | | 6.0 | | | | — | | | | 6.0 | |
Term loans | | | 126.7 | | | | 38.4 | | | | | | — | | | | 120.1 | | | | 158.5 | |
Other bank loans | | | 2.7 | | | | — | | | | | | 0.5 | | | | 1.5 | | | | 2.0 | |
Second Lien Notes | | | 109.4 | | | | 27.9 | | | | | | — | | | | 83.8 | | | | 111.7 | |
2011 Notes | | | 6.2 | | | | 1.9 | | | | | | 13.3 | | | | (8.5 | ) | | | 6.7 | |
2015 Notes | | | 1.5 | | | | 3.3 | | | | | | 17.2 | | | | (18.9 | ) | | | 1.6 | |
Net interest on interest rate swaps | | | — | | | | — | | | | | | (19.0 | ) | | | 19.0 | | | | — | |
| | | | | | | | | | | | | | | | | | | | | | |
| | | 247.2 | | | | 71.5 | | | | | | 18.0 | | | | 197.0 | | | | 286.5 | |
Finance leases | | | 0.2 | | | | — | | | | | | 0.2 | | | | — | | | | 0.2 | |
Other | | | 6.1 | | | | 4.0 | | | | | | 3.2 | | | | 1.7 | | | | 8.9 | |
| | | | | | | | | | | | | | | | | | | | | | |
| | | 253.5 | | | | 75.5 | | | | | | 21.4 | | | | 198.7 | | | | 295.6 | |
Post-employment benefits: | | | | | | | | | | | | | | | | | | | | | | |
– Interest on benefit obligation | | | 64.1 | | | | 15.3 | | | | | | 50.0 | | | | — | | | | 65.3 | |
| | | | | | | | | | | | | | | | | | | | | | |
| | | 317.6 | | | | 90.8 | | | | | | 71.4 | | | | 198.7 | | | | 360.9 | |
| | | | | | | | | | | | | | | | | | | | | | |
The decrease in interest expense during Fiscal 2011 compared with pro forma Fiscal 2010 was due largely to the repayment during Fiscal 2011 of $346.4 million of borrowings under the term loans and Second Lien Notes as a result of a number of redemptions, as discussed underItem 5B‘Liquidity and capital resources’. In addition, effective February 17, 2011, the Group agreed with the providers of the senior secured credit facilities a re-pricing of Term Loan A and Term Loan B. For Term Loan A, the applicable margin for LIBOR was reduced from 4.25% to 3.0% per annum and for Term Loan B, the applicable margin for LIBOR was reduced from 4.5% to 3.0% per annum. For both term loans, LIBOR was subject to a 1.75% floor, which was reduced to 1.25% floor following the re-pricing. The saving on interest expense for Fiscal 2011 as a result of the re-pricing was approximately $31 million.
When it was acquired, Tomkins had the following notes outstanding under a Euro Medium Term Note Programme: £150 million 8% notes repayable at par on December 20, 2011 (the ‘2011 Notes’); and £250 million 6.125% notes repayable at par on September 16, 2015 (the ‘2015 Notes’), and, together with the 2011 Notes, the ‘Medium Term Notes’). During Q4 2010, as a result of our tender offer and the triggering of a put option held by the lenders, the principal amount outstanding on the 2011 Notes was reduced from £150.0 million to £107.0 million and the principal amount outstanding on the 2015 Notes was reduced from £250.0 million to £17.2 million. The impact on interest expense of these payments is included in the pro forma adjustments above, as explained in ‘Unaudited pro forma financial information’ included at the end ofItem 5A. During Fiscal 2011, a further £4.9 million of the 2011 Notes and £4.0 million of the 2015 Notes were repaid, and, on December 20, 2011, the 2011 Notes were repaid in full on their maturity. As a result of these transactions, the interest expense in relation to the 2011 Notes and the 2015 Notes decreased to $8.0 million in Fiscal 2011 compared with a pro forma interest expense of $8.3 million in Fiscal 2010.
In Fiscal 2011, interest on the benefit obligations of our defined benefit and post-employment heath care plans was $64.1 million, $1.2 million lower than in Fiscal 2010 due primarily to a decrease in the discount rates used in the actuarial valuations.
33
Pinafore Holdings B.V.
Item 5A
Investment income
Investment income for Fiscal 2011 was $71.8 million, compared with $18.7 million for Q4 2010 and $48.0 million for 9M 2010. Pro forma investment income for Fiscal 2010 was $66.7 million. The increase in investment income during Fiscal 2011 compared with pro forma Fiscal 2010 was due primarily to the effect during the period of the lower expected return on the assets held by our defined benefit pension plans at the beginning of Fiscal 2011 compared with at the beginning of Fiscal 2010. Investment income may be analyzed as follows:
| | | | | | | | | | | | | | | | | | | | | | |
| $ million | | SUCCESSOR | | | | | PREDECESSOR | | | | | | | |
| | | Fiscal 2011 | | | Q4 2010 | | | | | 9M 2010 | | | Pro forma
adjustments | | | Pro forma
Fiscal 2010 | |
Bank deposits | | | 3.6 | | | | 1.3 | | | | | | 2.3 | | | | — | | | | 3.6 | |
Other | | | 1.2 | | | | 1.1 | | | | | | 1.1 | | | | — | | | | 2.2 | |
| | | | | | | | | | | | | | | | | | | | | | |
| | | 4.8 | | | | 2.4 | | | | | | 3.4 | | | | — | | | | 5.8 | |
Post-employment benefits: | | | | | | | | | | | | | | | | | — | | | | | |
– Expected return on plan assets | | | 67.0 | | | | 16.3 | | | | | | 44.6 | | | | — | | | | 60.9 | |
| | | | | | | | | | | | | | | | | | | | | | |
| | | 71.8 | | | | 18.7 | | | | | | 48.0 | | | | — | | | | 66.7 | |
| | | | | | | | | | | | | | | | | | | | | | |
Other finance (expense)/income
Other finance expense for Fiscal 2011 was $26.4 million, compared with $27.1 million for Q4 2010 and $2.7 million for 9M 2010. Pro forma interest income for Fiscal 2010 was $25.3 million. Our other finance (expense)/income may be analyzed as follows:
| | | | | | | | | | | | | | | | | | | | | | |
| $ million | | SUCCESSOR | | | | | PREDECESSOR | | | | | | | |
| | | Fiscal 2011 | | | Q4 2010 | | | | | 9M 2010 | | | Pro forma
adjustments | | | Pro forma
Fiscal 2010 | |
Loss on derivatives held for hedging purposes | | | — | | | | — | | | | | | (1.7 | ) | | | 1.7 | | | | — | |
(Loss)/gain on embedded derivatives | | | (7.5 | ) | | | 22.9 | | | | | | — | | | | — | | | | 22.9 | |
Translation gain/(loss) on hedging instruments | | | 4.6 | | | | (1.5 | ) | | | | | (1.0 | ) | | | 4.9 | | | | 2.4 | |
Loss on redemption of notes | | | (25.0 | ) | | | (0.9 | ) | | | | | — | | | | 0.9 | | | | — | |
Gain on early settlement of loan note receivable | | | 1.2 | | | | — | | | | | | — | | | | — | | | | — | |
Translation loss on the Acquisition | | | — | | | | (47.6 | ) | | | | | — | | | | 47.6 | | | | — | |
| | | | | | | | | | | | | | | | | | | | | | |
| | | (26.7 | ) | | | (27.1 | ) | | | | | (2.7 | ) | | | 55.1 | | | | 25.3 | |
| | | | | | | | | | | | | | | | | | | | | | |
The increase during Fiscal 2011 compared with pro forma Fiscal 2010 was principally attributable to a loss of $25.0 million recognized on the redemption of certain debt instruments, and a loss of $7.5 million on the movement in the fair value of embedded derivatives.
Borrowings against the senior secured credit facilities that were drawn down to finance the Acquisition bear interest at floating rates, subject to a floor (an embedded interest rate derivative that was required to be recognized separately from the term loans). During Fiscal 2011, we recognized a loss of $7.5 million due to the change in the fair values of the embedded interest rate derivatives as a debit to other finance (expense)/income. During Q4 2010, we recognized a gain of $22.9 million due to the change in the fair values of these embedded derivatives. As discussed further in the ‘Borrowings’ section ofItem 5B‘Liquidity and capital resources’, during Fiscal 2011, the Group redeemed $115.0 million under its Second Lien Notes and, as a result of the disposals of the Stackpole, Dexter Chassis and Ideal businesses, the Group repaid $187.1 million under the Group’s senior secured credit facilities. A loss of $10.8 million, including a premium paid of $3.5 million was recognized on the redemption of the Second Lien Notes and a loss of $13.8 million was recognized on the partial repayment of the term loans. A further loss of $0.4 million in total was incurred on the partial repayment in January 2011 of the 2011 Notes, and, in April 2011, of the 2015 Notes. These losses arose principally because the carrying amounts of the debt instruments redeemed, which have been reduced by their attributable borrowing costs, were lower than the principal amounts repaid.
Other finance expense also included a currency translation gain on hedging instruments of $4.6 million in Fiscal 2011, a loss of $1.5 million in Q4 2010 and a loss of $1.0 million in 9M 2010. In arriving at pro forma other finance (expense)/income for Fiscal 2010, we have eliminated a net currency translation loss of $4.9 million which was attributable to the translation of the 2011 Notes and the 2015 Notes and to the interest rate swaps that were designated as fair value hedges in relation to them. Accordingly, pro forma other finance (expense)/income for Fiscal 2010 includes a net currency translation gain of $2.4 million on hedging instruments.
During Q4 2010, we incurred a currency translation loss of $47.6 million on the Acquisition due to the change in the rate of exchange between Sterling (in which the purchase consideration was denominated) and the US dollar (the functional currency of the acquiring entity), in the period between the effective date of the Acquisition and the payment of the consideration to the former shareholders in Tomkins. Also during Q4 2010, we incurred a loss of $0.9 million on repayments of the 2011 Notes and the 2015 Notes. As these losses represented non-recurring effects of the Acquisition, they were eliminated in arriving at pro forma other finance (expense)/income for Fiscal 2010.
Income tax expense
During the Fiscal 2011, the income tax benefit attributable to continuing operations was $19.2 million (Q4 2010: benefit of $34.1 million; 9M 2010: expense of $62.5 million) on a profit before tax of $0.4 million (Q4 2010: loss before tax of $303.5 million; 9M 2010: profit before tax of $287.1 million). Pro forma income tax benefit was $38.3 million on a loss before tax of $24.0 million.
Our effective tax rate in Fiscal 2011 was significantly different from the statutory tax rates that are applicable in the jurisdictions in which we operate, principally due to the non-deductibility for tax purposes of the compensation expense recognized on share-based payments, the recognition of deferred tax liabilities on temporary differences associated with investments in subsidiaries and tax credits in relation to which we were unable to recognize deferred tax assets.
34
Pinafore Holdings B.V.
Item 5A
Effect of Inflation
Management does not believe that inflation has had a material effect on the Company’s financial condition or results of operations during Fiscal 2011, Q4 2010, 9M 2010 or Fiscal 2009.
Effect of Foreign Currency
For further discussion seeItem 11‘Quantitative and Qualitative Disclosures about Market Risk’ and Notes 33 and 34F to the Group’s consolidated financial statements.
Analysis by ongoing operating segment
In the discussion below, each segment’s pro forma sales for Fiscal 2010 are equal to the sum of the actual sales for the Predecessor and Successor periods in Fiscal 2010. Unless otherwise indicated, all commentary in this section is for ongoing operations.
Industrial & Automotive
Gates North America (39.8% of I&A’s Fiscal 2011 ongoing sales)
| | | | | | | | | | | | | | | | | | | | | | | | | | |
| $ million, unless otherwise stated | | SUCCESSOR | | | | | PREDECESSOR | | | | | | | | | Fiscal 2011
vs pro forma
Fiscal 2010
% change | |
| | | Fiscal 2011 | | | Q4 2010 | | | | | 9M 2010 | | | Pro forma
adjustments | | | Pro forma
Fiscal 2010 | | |
Sales | | | 1,287.3 | | | | 308.4 | | | | | | 844.4 | | | | — | | | | 1,152.8 | | | | 11.7 | % |
Operating expenses | | | (1,129.1 | ) | | | (329.8 | ) | | | | | (663.5 | ) | | | (1.3 | ) | | | (994.6 | ) | | | | |
| | | | | | | | | | | | | | | | | | | | | | | | | | |
Operating profit | | | 158.2 | | | | (21.4 | ) | | | | | 180.9 | | | | (1.3 | ) | | | 158.2 | | | | | |
| | | | | | | | | | | | | | | | | | | | | | | | | | |
| | | | | | | |
Adjusted EBITDA | | | 305.3 | | | | 71.1 | | | | | | 209.3 | | | | 0.1 | | | | 280.5 | | | | | |
Adjusted EBITDA margin | | | 23.7 | % | | | 23.1 | % | | | | | 24.8 | % | | | | | | | 24.3 | % | | | | |
Sales were $1,287.3 million (pro forma Fiscal 2010: $1,152.8 million), an increase of 11.7%, or $134.5 million. Sales were higher principally due to the strengthening of the industrial replacement and OE markets (33.2% and 22.3% of Gates NA’s Fiscal 2011 sales, respectively) which increased year-on-year by 12.5% and 31.8%, respectively. Sales to the Automotive aftermarket (38.8% of Gates NA’s Fiscal 2011 sales) grew by 2.3% principally due to strong sales in the early part of the year, offset by the impact of some destocking by customers towards the end of the year. Sales to the automotive OE markets (5.6% of Gates NA’s Fiscal 2011 sales) were up by 9.9% following the recovery in this end market. Overall, volume increases accounted for $90.1 million of increased sales, with a further $37.0 million attributed to pricing increases and $11.8m of sales transferred to Gates SA. Foreign exchange movements accounted for a further $11.0 million.
Operating expenses in our Gates NA segment totaled $1,129.1 million in Fiscal 2011, compared with $329.8 million in Q4 2010 and $663.5 million in 9M 2010. Pro forma operating expenses for Fiscal 2010 were $994.6 million. The principal component of operating expenses was cost of sales.
Fiscal 2011 cost of sales in our Gates NA segment was $782.9 million, compared with $231.7 million in Q4 2010 and $488.8 million in 9M 2010. Pro forma cost of sales for Fiscal 2010 was $675.7 million. Cost of sales for Fiscal 2011 increased by approximately $53 million compared with pro forma Fiscal 2010 due to higher volumes and by a further $34 million due to higher raw material and other input costs, particularly carbon black, steel and polymers. These increases were somewhat offset by a combination of efficiency improvements and other benefits arising from restructuring projects of approximately $5 million.
In addition to the movements in cost of sales, operating expenses for Fiscal 2011 increased by approximately $9 million as a result of higher labor-related costs compared with pro forma Fiscal 2010. In Fiscal 2011, the compensation expense in respect of share-based incentives was $9.7 million compared with $12.8 million in pro forma Fiscal 2010. Restructuring costs in Fiscal 2011 were $26.8 million compared with $2.4 million for pro forma Fiscal 2010, and related principally to costs incurred in relation to Project Sierra.
Our Gates NA segment recognized an operating profit of $158.2 million for Fiscal 2011, compared with an operating loss for Q4 2010 of $21.4 million and an operating profit of $180.9 million for 9M 2010. Pro forma operating profit for Fiscal 2010 was $158.2 million.
Adjusted EBITDA was $305.3 million (Q4 2010: $71.1 million; 9M 2010: $209.3 million), compared with a pro forma adjusted EBITDA for Fiscal 2010 of $280.5 million. Pricing and volume benefits of approximately $74 million were partially offset by increases in the cost of raw materials and other inputs of approximately $34 million, and higher labor-related costs of $9 million. These cost increases caused a softening in the adjusted EBITDA margin from 24.3% on a pro forma basis in Fiscal 2010 to 23.7% in Fiscal 2011.
35
Pinafore Holdings B.V.
Item 5A
Gates EMEA (24.8% of I&A’s Fiscal 2011 ongoing sales)
| | | | | | | | | | | | | | | | | | | | | | | | | | |
| $ million, unless otherwise stated | | SUCCESSOR | | | | | PREDECESSOR | | | | | | Fiscal 2011
vs pro forma
Fiscal 2010
% change | |
| | | Fiscal 2011 | | | Q4 2010 | | | | | 9M 2010 | | | Pro forma
adjustments | | | Pro forma
Fiscal 2010 | | |
Sales | | | 803.3 | | | | 205.4 | | | | | | 541.8 | | | | — | | | | 747.2 | | | | 7.5 | % |
Operating expenses | | | (762.7 | ) | | | (236.3 | ) | | | | | (513.9 | ) | | | 13.7 | | | | (736.5 | ) | | | | |
| | | | | | | | | | | | | | | | | | | | | | | | | | |
Operating profit | | | 40.6 | | | | (30.9 | ) | | | | | 27.9 | | | | 13.7 | | | | 10.7 | | | | | |
| | | | | | | | | | | | | | | | | | | | | | | | | | |
| | | | | | | |
Adjusted EBITDA | | | 103.4 | | | | 19.2 | | | | | | 54.4 | | | | 0.2 | | | | 73.8 | | | | | |
Adjusted EBITDA margin | | | 12.9 | % | | | 9.3 | % | | | | | 10.0 | % | | | | | | | 9.9 | % | | | | |
Sales were $803.3 million (pro forma Fiscal 2010: $747.2 million), an increase of 7.5%. Sales to the industrial replacement and OE markets (24.4% and 13.9% respectively of Gates EMEA’s Fiscal 2011 sales) were up year-on-year by 8.4% and 19.8% respectively, due to the continued recovery in the region’s industrial markets. Sales to the automotive aftermarket, which accounted for 36.2% of Gates EMEA’s sales, declined by 2.2% mainly as a result of an in-sourcing project reducing our sales value by $21.9 million, partially offset by favorable movements in currency exchange rates of $12.9 million and sales of new products and to new customers accounting for $6.8m. Sales to the automotive OE market, which accounted for 25.5% of Gates EMEA’s Fiscal 2011 sales, were up by 16.5% due to the commencement of sales to a new engine platform during the year ($14.3 million), combined with favorable movements in currency exchange rates ($6.3 million). Overall, Gates EMEA sales were higher mainly due to positive movements in currency exchange rates of $34.9m and higher volumes of $21.1 million.
Operating expenses in our Gates EMEA segment totaled $762.7 million in Fiscal 2011, compared with $236.3 million in Q4 2010 and $513.9 million in 9M 2010. Pro forma operating expenses for Fiscal 2010 were $736.5 million. The principal component of operating expenses was cost of sales.
Fiscal 2011 cost of sales in our Gates EMEA segment was $533.5 million, compared with $177.7 million in Q4 2010 and $371.9 million in 9M 2010. Pro forma cost of sales for Fiscal 2010 was $521.0 million. Cost of sales for Fiscal 2011 increased by approximately $10 million compared with pro forma Fiscal 2010 due to higher production volumes and by a further $6 million as a result of higher material costs. These increases were offset by a combination of efficiency improvements and other benefits arising from restructuring projects of approximately $10 million and favorable movements in currency exchange rates of approximately $12 million.
In addition to the movements in cost of sales described above, operating expenses for Fiscal 2011 included depreciation and amortization of $50.9 million compared with $54.6 million in pro forma Fiscal 2010. Also in Fiscal 2011, restructuring costs were $11.0 million compared with $3.0 million for pro forma Fiscal 2010 and, in Fiscal 2011, the segment also recognized a net gain of $0.4 million on the disposal and exit of businesses, compared with a pro forma loss of $1.7 million in Fiscal 2010.
Our Gates EMEA segment recognized an operating profit of $40.6 million for Fiscal 2011, compared with an operating loss for Q4 2010 of $30.9 million and an operating profit of $27.9 million for 9M 2010. Pro forma operating profit for Fiscal 2010 was $10.7 million.
Adjusted EBITDA was $103.4 million (Q4 2010: $19.2 million; 9M 2010: $54.4 million), compared with a pro forma adjusted EBITDA in Fiscal 2010 of $73.8 million. This increase of $29.6 million was principally due to higher volumes (approximately $11 million), benefits of cost-saving initiatives (approximately $9 million) and improvements in selling prices (approximately $4 million). The adjusted EBITDA margin for Fiscal 2011 reflected these benefits, increasing by 3.0% to 12.9% (pro forma Fiscal 2010: 9.9%).
Gates APAC (21.9% of I&A’s Fiscal 2011 ongoing sales)
| | | | | | | | | | | | | | | | | | | | | | | | | | |
| $ million, unless otherwise stated | | SUCCESSOR | | | | | PREDECESSOR | | | | | | Fiscal 2011
vs pro forma
Fiscal 2010
% change | |
| | | Fiscal 2011 | | | Q4 2010 | | | | | 9M 2010 | | | Pro forma
adjustments | | | Pro forma
Fiscal 2010 | | |
Sales | | | 708.7 | | | | 183.1 | | | | | | 447.9 | | | | — | | | | 631.0 | | | | 12.3 | % |
Operating expenses | | | (636.1 | ) | | | (191.9 | ) | | | | | (373.5 | ) | | | 8.5 | | | | (556.9 | ) | | | | |
| | | | | | | | | | | | | | | | | | | | | | | | | | |
Operating profit | | | 72.6 | | | | (8.8 | ) | | | | | 74.4 | | | | 8.5 | | | | 74.1 | | | | | |
| | | | | | | | | | | | | | | | | | | | | | | | | | |
| | | | | | | |
Adjusted EBITDA | | | 135.2 | | | | 37.4 | | | | | | 93.8 | | | | — | | | | 131.2 | | | | | |
Adjusted EBITDA margin | | | 19.1 | % | | | 20.4 | % | | | | | 20.9 | % | | | | | | | 20.8 | % | | | | |
Sales were $708.7 million (pro forma Fiscal 2010: $631.0 million) an increase of 12.3% or $77.7 million, driven by favorable movements in currency exchange rates of $43.4 million from the weakening of the US dollar against the region’s currencies, combined with a $35.6 million increase in sales volumes, principally in China and India. Sales to the industrial replacement and OE markets increased by 18.8% and 20.2% respectively compared with Fiscal 2010. These end markets together accounted for 39.7% respectively of Gates APAC’s Fiscal 2011 sales. The automotive aftermarket (14.2% of Gates APAC’s Fiscal 2011 sales) grew by 14.7% compared with Fiscal 2010 and sales to the automotive OE market (46.1% of Gates APAC’s Fiscal 2011 sales) grew year-on-year by 6.2%.
Operating expenses in our Gates APAC segment totaled $636.1 million in Fiscal 2011, compared with $191.9 million in Q4 2010 and $373.5 million in 9M 2010. Pro forma operating expenses for Fiscal 2010 were $556.9 million. The principal component of operating expenses was cost of sales.
Fiscal 2011 cost of sales in our Gates APAC segment was $471.2 million, compared with $142.8 million in Q4 2010 and $282.9 million in 9M 2010. Pro forma cost of sales for Fiscal 2010 was $400.9 million. Cost of sales for Fiscal 2011 increased by approximately $29 million compared with pro forma Fiscal 2010 due to higher production volumes and by a further $5 million as a result of higher raw material costs. These increases was partially offset by efficiency improvements and other benefits arising from restructuring projects of approximately $7 million.
36
Pinafore Holdings B.V.
Item 5A
In addition to the movements in cost of sales described above, operating expenses for Fiscal 2011 included depreciation and amortization of $58.1 million in Fiscal 2011 compared with $54.3 million in pro forma Fiscal 2010, the increase being due principally to additional capital expenditure during the period. While there were no pro forma restructuring costs recognized in Fiscal 2010, restructuring costs of $3.9 million were incurred during Fiscal 2011.
Our Gates APAC segment recognized an operating profit of $72.6 million for Fiscal 2011, compared with an operating loss for Q4 2010 of $8.8 million and an operating profit of $74.4 million for 9M 2010. Pro forma operating profit for Fiscal 2010 was $74.1 million.
Adjusted EBITDA was $135.2 million (Q4 2010: $37.4 million; 9M 2010: $93.8 million), compared with $131.2 million in pro forma Fiscal 2010, an increase of $4.0 million, which was principally due to higher volumes (approximately $6 million) and the strengthening of regional currency exchange rates compared with the US dollar (approximately $9 million), partially offset by the impact of higher raw material costs of approximately $6 million. The adjusted EBITDA margin declined from 20.8% in pro forma Fiscal 2010 to 19.1% in Fiscal 2011, driven primarily by the higher raw material costs.
Gates South America (4.8% of I&A’s Fiscal 2011 ongoing sales)
| | | | | | | | | | | | | | | | | | | | | | | | | | |
| $ million, unless otherwise stated | | SUCCESSOR | | | | | PREDECESSOR | | | | | | Fiscal 2011
vs pro forma
Fiscal 2010
% change | |
| | | Fiscal 2011 | | | Q4 2010 | | | | | 9M 2010 | | | Pro forma
adjustments | | | Pro forma
Fiscal 2010 | | |
Sales | | | 156.7 | | | | 37.7 | | | | | | 109.5 | | | | — | | | | 147.2 | | | | 6.5 | % |
Operating expenses | | | (165.9 | ) | | | (43.8 | ) | | | | | (96.6 | ) | | | 0.3 | | | | (140.1 | ) | | | | |
| | | | | | | | | | | | | | | | | | | | | | | | | | |
Operating (loss)/profit | | | (9.2 | ) | | | (6.1 | ) | | | | | 12.9 | | | | 0.3 | | | | 7.1 | | | | | |
| | | | | | | | | | | | | | | | | | | | | | | | | | |
| | | | | | | |
Adjusted EBITDA | | | 4.5 | | | | 3.1 | | | | | | 16.2 | | | | — | | | | 19.3 | | | | | |
Adjusted EBITDA margin | | | 2.9 | % | | | 8.2 | % | | | | | 14.8 | % | | | | | | | 13.1 | % | | | | |
Sales were $156.7 million (pro forma Fiscal 2010: $147.2 million) an increase of 6.5%. Sales to the industrial replacement end market, which accounted for just under a third of Gates SA’s Fiscal 2011 sales, grew by 3.9% driven by large industrial development projects in the region. Sales to the industrial OE market (19.3% of Gates SA’s Fiscal 2011 sales) declined by 15.1% due to weak end market demand affected by the decrease in government incentives for the purchase of agricultural machinery and destocking by customers with high levels of inventory. Sales to the automotive aftermarket, which accounted for 28.2% of Gates SA’s Fiscal 2011 sales, grew by 44.0% due to the transfer of some customers from Gates NA while sales to the automotive OE end market (20.2% of Gates SA’s Fiscal 2011 sales) declined by 1.6%, mainly due to price decreases in the market.
Operating expenses in our Gates SA segment totaled $165.9 million in Fiscal 2011, compared with $43.8 million in Q4 2010 and $96.6 million in 9M 2010. Pro forma operating expenses for Fiscal 2010 were $140.1 million. The principal component of operating expenses was cost of sales.
Fiscal 2011 cost of sales in our Gates SA segment was $122.4 million, compared with $34.5 million in Q4 2010 and $77.6 million in 9M 2010. Pro forma cost of sales for Fiscal 2010 was $109.1 million. Cost of sales for Fiscal 2011 increased primarily as a result of higher raw material and other input costs.
In addition to the movements in cost of sales, operating expenses in Fiscal 2011 increased by approximately $6 million as a result of an increase in legal provisions. While no restructuring costs were recognized in pro forma Fiscal 2010, restructuring costs of $2.5 million were incurred in Fiscal 2011, relating primarily to severance costs arising on reorganizations within the business, and costs incurred in relation to Project Sierra.
Our Gates SA segment incurred an operating loss of $9.2 million for Fiscal 2011, compared with an operating loss for Q4 2010 of $6.1 million and an operating profit of $12.9 million for 9M 2010. Pro forma operating profit for Fiscal 2010 was $7.1 million.
Adjusted EBITDA was $4.5 million (Q4 2010: $3.1 million; 9M 2010: 16.2 million), compared with a pro forma adjusted EBITDA in Fiscal 2010 of $19.3 million; a decrease of $14.8 million. The adjusted EBITDA margin in Fiscal 2011 was also lower at 2.9% compared with 13.1% on a pro forma basis in Fiscal 2010. This decline was due principally to negative pricing effects, higher raw material costs and operational inefficiencies at certain of our facilities. We have subsequently implemented a performance improvement plan to return the businesses to normal levels of profitability.
Dexter (8.7% of I&A’s Fiscal 2011 ongoing sales)
| | | | | | | | | | | | | | | | | | | | | | | | | | |
| $ million, unless otherwise stated | | SUCCESSOR | | | | | PREDECESSOR | | | | | | Fiscal 2011
vs pro forma
Fiscal 2010
% change | |
| | | Fiscal 2011 | | | Q4 2010 | | | | | 9M 2010 | | | Pro forma
adjustments | | | Pro forma
Fiscal 2010 | | |
Sales | | | 281.4 | | | | 54.4 | | | | | | 190.8 | | | | — | | | | 245.2 | | | | 14.8 | % |
Operating expenses | | | (256.3 | ) | | | (53.7 | ) | | | | | (165.2 | ) | | | (5.0 | ) | | | (223.9 | ) | | | | |
| | | | | | | | | | | | | | | | | | | | | | | | | | |
Operating profit | | | 25.1 | | | | 0.7 | | | | | | 25.6 | | | | (5.0 | ) | | | 21.3 | | | | | |
| | | | | | | | | | | | | | | | | | | | | | | | | | |
| | | | | | | |
Adjusted EBITDA | | | 40.5 | | | | 7.5 | | | | | | 31.2 | | | | — | | | | 38.7 | | | | | |
Adjusted EBITDA margin | | | 14.4 | % | | | 13.8 | % | | | | | 16.4 | % | | | | | | | 15.8 | % | | | | |
Sales were $281.4 million (pro forma Fiscal 2010: $245.2 million) an increase of 14.8%. Sales to the industrial utility market, which accounted for 82.4% of Dexter’s Fiscal 2011 sales, grew by 20.0% year-on-year driven primarily by strong demand in axles used in industrial applications. Sales to both the Recreational Vehicle and Manufactured Housing end markets, which accounted for 15.8% and 1.8% respectively of Dexter’s Fiscal 2011 sales, declined by 4.3% and 7.4% respectively due to the continued weakness in both markets.
Operating expenses in our Dexter segment totaled $256.3 million in Fiscal 2011, compared with $53.7 million in Q4 2010 and $165.2 million in 9M 2010. Pro forma operating expenses for Fiscal 2010 were $223.9 million. The principal component of operating expenses was cost of sales.
37
Pinafore Holdings B.V.
Item 5A
Fiscal 2011 cost of sales in our Dexter segment was $219.4 million, compared with $45.1 million in Q4 2010 and $144.6 million in 9M 2010. Pro forma cost of sales for Fiscal 2010 was $189.0 million. Cost of sales for Fiscal 2011 increased compared with pro forma Fiscal 2010 due to a combination of higher production volumes (approximately $21 million) and higher input costs (approximately $12 million), in particular the costs of raw materials and related freight.
Our Dexter segment recognized an operating profit of $25.1 million for Fiscal 2011, compared with an operating profit for Q4 2010 of $0.7 million and an operating profit of $25.6 million for 9M 2010. Pro forma operating profit for Fiscal 2010 was $21.3 million.
Adjusted EBITDA was $40.5 million (Q4 2010: $7.5 million; 9M 2010: $31.2 million), compared with a pro forma adjusted EBITDA in Fiscal 2010 of $38.7 million, an increase of $1.8 million as an impact of approximately $4 million from higher volumes drove the majority of the growth in adjusted EBITDA during Fiscal 2011. The impact of higher raw material costs exceeded the benefit from sales price increases by approximately $1 million and, together with a further $0.9 million increase in freight-related distribution costs, partially offset this volume-driven growth. The adjusted EBITDA margin was 14.4% in Fiscal 2011 (pro forma Fiscal 2010: 15.8%), reflecting the higher raw material and freight costs.
Building Products
Air Distribution (89.3% of Building Products’ Fiscal 2011 ongoing sales)
| | | | | | | | | | | | | | | | | | | | | | | | | | |
| $ million, unless otherwise stated | | SUCCESSOR | | | | | PREDECESSOR | | | | | | Fiscal 2011
vs pro forma
Fiscal 2010
% change | |
| | | Fiscal 2011 | | | Q4 2010 | | | | | 9M 2010 | | | Pro forma
adjustments | | | Pro forma
Fiscal 2010 | | |
Sales | | | 882.9 | | | | 226.7 | | | | | | 636.2 | | | | — | | | | 862.9 | | | | 2.3 | % |
Operating expenses | | | (832.7 | ) | | | (231.7 | ) | | | | | (584.4 | ) | | | 0.4 | | | | (815.7 | ) | | | | |
| | | | | | | | | | | | | | | | | | | | | | | | | | |
Operating profit/(loss) | | | 50.2 | | | | (5.0 | ) | | | | | 51.8 | | | | 0.4 | | | | 47.2 | | | | | |
| | | | | | | | | | | | | | | | | | | | | | | | | | |
| | | | | | | |
Adjusted EBITDA | | | 104.2 | | | | 22.6 | | | | | | 80.5 | | | | 0.4 | | | | 103.5 | | | | | |
Adjusted EBITDA margin | | | 11.8 | % | | | 10.0 | % | | | | | 12.7 | % | | | | | | | 12.0 | % | | | | |
Sales were $882.9 million (pro forma Fiscal 2010: $862.9 million), an increase of 2.3%. Sales were higher due to a 4.7% increase in sales to the non-residential construction market (which accounted for 75.7% of Air Distribution’s Fiscal 2011 sales), more than offsetting a decline in sales to the residential construction market, which accounted for the remaining 24.3% of the segment’s Fiscal 2011 sales and which declined by 4.5%. Overall, price increases accounted for $24.3 million of the increase in sales and combined with sales of new products and to new customers (totaling $33.5 million) offset the decline in the market of $43.1 million.
Operating expenses in our Air Distribution segment totaled $832.7 million in Fiscal 2011, compared with $231.7 million in Q4 2010 and $584.4 million in 9M 2010. Pro forma operating expenses for Fiscal 2010 were $815.7 million. The principal component of operating expenses was cost of sales.
Fiscal 2011 cost of sales in our Air Distribution segment was $618.7 million, compared with $172.0 million in Q4 2010 and $435.8 million in 9M 2010. Pro forma cost of sales for Fiscal 2010 was $604.3 million. Cost of sales for Fiscal 2011 increased by approximately $22 million compared with pro forma Fiscal 2010 due to higher raw material costs, in addition to increased labor-related costs of $1 million. These increases were partially offset by a combination of efficiency improvements and other benefits arising from restructuring projects of approximately $5 million and higher volumes of approximately $3 million.
In addition to the movements in cost of sales, operating expenses in Fiscal 2011 increased by approximately $5 million as a result of higher freight costs compared with pro forma Fiscal 2010. Depreciation and amortization amounted to $44.5 million in Fiscal 2011 compared with $45.9 million in pro forma Fiscal 2010. While no loss on the disposal or exit of businesses was incurred in Fiscal 2011, a loss of $0.8 million was incurred in Fiscal 2010.
Our Air Distribution segment recognized an operating profit of $50.2 million for Fiscal 2011, compared with an operating loss for Q4 2010 of $5.0 million and an operating profit of $51.8 million for 9M 2010. Pro forma operating profit for Fiscal 2010 was $47.2 million.
Adjusted EBITDA was $104.2 million (Q4 2010: $22.6 million; 9M 2010: $80.5 million), compared with a pro forma adjusted EBITDA in Fiscal 2010 of $103.5 million, as pricing and volume benefits were almost entirely offset by raw material increases. The adjusted EBITDA margin remained relatively stable at 11.8% (pro forma Fiscal 2010: 12.0%).
Bathware (10.7% of Building Products’ Fiscal 2011 ongoing sales)
| | | | | | | | | | | | | | | | | | | | | | | | | | |
| $ million, unless otherwise stated | | SUCCESSOR | | | | | PREDECESSOR | | | | | | Fiscal 2011
vs pro forma
Fiscal 2010
% change | |
| | | Fiscal 2011 | | | Q4 2010 | | | | | 9M 2010 | | | Pro forma
adjustments | | | Pro forma
Fiscal 2010 | | |
Sales | | | 106.3 | | | | 27.1 | | | | | | 91.7 | | | | — | | | | 118.8 | | | | (10.5 | )% |
Operating expenses | | | (157.8 | ) | | | (31.5 | ) | | | | | (95.8 | ) | | | (2.5 | ) | | | (129.8 | ) | | | | |
| | | | | | | | | | | | | | | | | | | | | | | | | | |
Operating (loss)/profit | | | (51.5 | ) | | | (4.4 | ) | | | | | (4.1 | ) | | | (2.5 | ) | | | (11.0 | ) | | | | |
| | | | | | | | | | | | | | | | | | | | | | | | | | |
| | | | | | | |
Adjusted EBITDA | | | (4.5 | ) | | | (1.2 | ) | | | | | (1.7 | ) | | | — | | | | (2.9 | ) | | | | |
Adjusted EBITDA margin | | | (4.2 | )% | | | (4.4 | )% | | | | | (1.9 | )% | | | | | | | (2.4 | )% | | | | |
Sales were $106.3 million (pro forma Fiscal 2010: $118.8 million), a decrease of 10.5%. Bathware sells primarily to the US residential construction and remodeling markets, which have continued to be weak year-on-year.
Operating expenses in our Bathware segment totaled $157.8 million in Fiscal 2011, compared with $31.5 million in Q4 2010 and $95.8 million in 9M 2010. Pro forma operating expenses for Fiscal 2010 were $129.8 million. The principal component of operating expenses was cost of sales.
38
Pinafore Holdings B.V.
Item 5A
Fiscal 2011 cost of sales in our Bathware segment was $71.9 million, compared with $18.0 million in Q4 2010 and $57.9 million in 9M 2010. Pro forma cost of sales for Fiscal 2010 was $76.9 million. Cost of sales for Fiscal 2011 increased by approximately $6 million compared with pro forma Fiscal 2010 due to higher raw material costs, but this was more than offset by the impact of decreased production volumes of approximately $8 million and efficiency improvements and other benefits arising from restructuring projects of approximately $4 million.
In addition to the movements in cost of sales, operating expenses in Fiscal 2011 were reduced by further efficiency and cost improvements of approximately $5 million. Depreciation and amortization amounted to $9.2 million in Fiscal 2011 compared with $10.7 million in pro forma Fiscal 2010. During Fiscal 2011, in light of the prolonged weakness of the US residential construction end market, Bathware recognized an impairment of $36.9 million, representing the entire goodwill allocated to this segment. While there was no gain on the disposal or exit of businesses in Fiscal 2011, a gain of $3.2 million was recognized in Fiscal 2010.
Our Bathware segment incurred an operating loss of $51.5 million for Fiscal 2011, compared with an operating loss for Q4 2010 of $4.4 million and an operating loss of $4.1 million for 9M 2010. Pro forma operating loss for Fiscal 2010 was $11.0 million.
The segment’s adjusted EBITDA loss for Fiscal 2011 was $4.5 million (Q4 2010: loss of $1.2 million; 9M 2010: loss of $1.7 million), compared with a pro forma loss of $2.9 million in Fiscal 2010, primarily driven by the declining volumes of approximately $8 million and higher raw material costs of $6 million, partially offset by efficiency improvements and other benefits arising from restructuring projects of approximately $9 million and pricing benefits of approximately $4 million. As a consequence, the adjusted EBITDA margin remained slipped to negative 4.2% in Fiscal 2011, compared with negative 2.4% in pro forma Fiscal 2010.
Corporate
Corporate reported an operating loss of $102.4 million for Fiscal 2011, compared with an operating loss of $131.0 million for Q4 2010 and $78.6 million for 9M 2010. Pro forma operating loss for Fiscal 2010 was $87.4 million. In Fiscal 2011, the compensation expense in respect of share-based incentives was $66.1 million compared with $48.4 million in pro forma Fiscal 2010. Corporate also recognized a gain of $4.9 million on disposals in Fiscal 2011, compared with a loss of $2.3 million in pro forma Fiscal 2010. Restructuring costs in Fiscal 2011 were $4.1 million compared with $2.0 million for pro forma Fiscal 2010 and related principally to costs incurred in relation to Project Sierra.
Corporate incurred an adjusted EBITDA loss of $35.9 million for Fiscal 2011, compared with a loss of $6.1 million for Q4 2010 and a loss of $25.8 million for 9M 2010. Pro forma adjusted EBITDA was a loss of $34.3 million for Fiscal 2010.
Discontinued operations
During the second quarter of 2011, management began actively seeking prospective buyers for its Schrader Electronics and Schrader International businesses, which together constitute the Sensors & Valves operating segment.
Sensors & Valves’ sales in Fiscal 2011 were $450.8 million (pro forma Fiscal 2010: $402.2 million), an increase of 12.1%. Automotive OE sales, which comprised 78.3% of Sensors & Valves’ Fiscal 2011 sales, increased by $42.7 million compared with pro forma Fiscal 2010, almost entirely driven by sales to North America. Sales to the automotive aftermarket (16.9% of Sensors & Valves’ Fiscal 2011 sales) and industrial OE sales (4.8% of Sensors & Valves’ Fiscal 2011 sales) were both up marginally compared with pro forma Fiscal 2010.
Adjusted EBITDA was $76.0 million (Q4 2010: $17.4 million; 9M 2010: $44.5 million), compared with a pro forma adjusted EBITDA in Fiscal 2010 of $61.9 million.
39
Pinafore Holdings B.V.
Item 5A
Pro forma Fiscal 2010 results compared with Fiscal 2009 results
Unless otherwise indicated, all commentary in Management’s Discussion and Analysis is for continuing operations.
Group summary
| | | | | | | | | | | | | | | | | | | | | | |
| $ million, unless otherwise stated | | SUCCESSOR | | | | | PREDECESSOR | | | | | | | | | | |
| | | Q4 2010 | | | | | 9M 2010 | | | Pro forma
adjustments | | | Pro forma
Fiscal 2010 | | | Fiscal 2009 | |
Continuing operations | | | | | | | | | | | | | | | | | | | | | | |
Sales | | | 1,181.3 | | | | | | 3,270.4 | | | | — | | | | 4,451.7 | | | | 3,866.5 | |
Cost of sales | | | (950.3 | ) | | | | | (2,223.8 | ) | | | 107.8 | | | | (3,066.3 | ) | | | (2,748.2 | ) |
| | | | | | | | | | | | | | | | | | | | | | |
Gross profit | | | 231.0 | | | | | | 1,046.6 | | | | 107.8 | | | | 1,385.4 | | | | 1,118.3 | |
Distribution costs | | | (137.1 | ) | | | | | (362.0 | ) | | | — | | | | (499.1 | ) | | | (441.7 | ) |
Administrative expenses | | | (217.3 | ) | | | | | (327.3 | ) | | | (90.6 | ) | | | (635.2 | ) | | | (437.0 | ) |
Transaction costs | | | (78.2 | ) | | | | | (41.2 | ) | | | 118.8 | | | | (0.6 | ) | | | — | |
Impairments | | | — | | | | | | — | | | | — | | | | — | | | | (73.0 | ) |
Restructuring costs | | | (3.7 | ) | | | | | (10.0 | ) | | | — | | | | (13.7 | ) | | | (140.9 | ) |
Net gain on disposals and on the exit of businesses | | | — | | | | | | 6.3 | | | | — | | | | 6.3 | | | | 0.2 | |
Gain on amendment of post-employment benefits | | | — | | | | | | — | | | | — | | | | — | | | | 63.0 | |
Share of profit/(loss) of associates | | | 1.0 | | | | | | 0.8 | | | | — | | | | 1.8 | | | | (0.7 | ) |
| | | | | | | | | | | | | | | | | | | | | | |
Operating (loss)/profit | | | (204.3 | ) | | | | | 313.2 | | | | 136.0 | | | | 244.9 | | | | 88.2 | |
| | | | | | |
Interest expense | | | (90.8 | ) | | | | | (71.4 | ) | | | (198.7 | ) | | | (360.9 | ) | | | (111.0 | ) |
Investment income | | | 18.7 | | | | | | 48.0 | | | | — | | | | 66.7 | | | | 67.0 | |
Other finance expense | | | (27.1 | ) | | | | | (2.7 | ) | | | 55.1 | | | | 25.3 | | | | (0.3 | ) |
Net finance costs | | | (99.2 | ) | | | | | (26.1 | ) | | | (143.6 | ) | | | (268.9 | ) | | | (44.3 | ) |
| | | | | | | | | | | | | | | | | | | | | | |
(Loss)/profit before tax | | | (303.5 | ) | | | | | 287.1 | | | | (7.6 | ) | | | (24.0 | ) | | | 43.9 | |
Income tax expense | | | 34.1 | | | | | | (62.5 | ) | | | 66.7 | | | | 38.3 | | | | (25.1 | ) |
| | | | | | | | | | | | | | | | | | | | | | |
(Loss)/profit for the period | | | (269.4 | ) | | | | | 224.6 | | | | 59.1 | | | | 14.3 | | | | 18.8 | |
| | | | | | | | | | | | | | | | | | | | | | |
| | | | | | |
Adjusted EBITDA | | | 173.8 | | | | | | 498.9 | | | | (1.7 | ) | | | 671.0 | | | | 422.1 | |
Adjusted EBITDA margin (%) | | | 14.7 | % | | | | | 15.3 | % | | | | | | | 15.1 | % | | | 10.9 | % |
Sales
Sales from continuing operations were $1,181.3 million in Q4 2010 and were $3,270.4 million in 9M 2010. Pro forma sales for Fiscal 2010 were $4,451.7 million, compared with $3,866.5 million for Fiscal 2009, an increase of 15.1%. Most of our end markets strengthened during the period, which caused a corresponding increase in sales volumes across our businesses. Acquisitions made during the period, in particular the acquisition of Koch Filter Corporation in February 2010, increased Fiscal 2010 pro forma sales by $52.8 million compared with Fiscal 2009. Fiscal 2010 pro forma sales also benefited by $30.3 million compared with Fiscal 2009 from changes in average currency exchange rates. However, Fiscal 2010 pro forma sales included no contribution from Doors & Windows, an exited segment that contributed sales of $36.5 million prior to its closure during Fiscal 2009. Excluding the impact of acquisitions, the closure of Doors & Windows and exchange rate movements, Fiscal 2010 pro forma sales rose by $538.6 million, or 14.1%, compared with Fiscal 2009.
Cost of sales
Cost of sales was $950.3 million in Q4 2010 and $2,223.8 million in 9M 2010. Pro forma cost of sales for Fiscal 2010 was $3,066.3 million compared with $2,748.2 million for Fiscal 2009, an increase of 11.6% that was driven principally by higher production volumes and the effect of accounting for the Acquisition.
Production volumes increased significantly in the I&A businesses in response to the sales growth experienced during Fiscal 2010 compared with Fiscal 2009, but these increases were slightly offset by reduced volumes in the Building Products businesses due to the continued weakness in North American construction end markets. Production cost savings resulted from our restructuring initiatives, particularly in the Gates segments. During Fiscal 2010, we also benefited from decreases in certain material costs, but incurred marginally higher labor costs.
Pro forma cost of sales for Fiscal 2010 includes an additional depreciation expense of $39.3 million due to the fair value uplift to the carrying amount of the property, plant and equipment held by Tomkins at the date of the Acquisition.
Gross profit
Gross profit was $231.0 million in Q4 2010 and $1,046.6 million in 9M 2010. Pro forma gross profit for Fiscal 2010 was $1,385.4 million compared with $1,118.3 million for Fiscal 2009.
Our gross profit margin was 19.6% in Q4 2010, significantly down compared with the 9M 2010 margin of 32.0% as a result of the purchase accounting adjustments included in cost of sales. Pro forma gross profit margin for Fiscal 2010 was 31.1%, broadly in line with the gross profit margin for 9M 2010, and slightly higher than the gross profit margin of 28.9% achieved in Fiscal 2009, principally due to the production cost savings.
40
Pinafore Holdings B.V.
Item 5A
Distribution costs
Distribution costs recognized during Q4 2010 were $137.1 million and were $362.0 million during 9M 2010. Pro forma distribution costs for Fiscal 2010 were $499.1 million compared with $441.7 million for Fiscal 2009, an increase of 13.0% that was broadly commensurate with the increase in sales volumes. Efficiency gains in I&A drove the slight improvement in distribution costs as a percentage of sales, from 11.4% of sales in Fiscal 2009 to 11.2% on a pro forma basis in Fiscal 2010.
Administrative expenses
Administrative expenses recognized during Q4 2010 were $217.3 million and were $327.3 million during 9M 2010. Pro forma administrative expenses for Fiscal 2010 were $635.2 million, compared with $437.0 million for Fiscal 2009, an increase of $198.2 million that was related principally share-based incentives and the effect of accounting for the Acquisition. Administrative expenses as a percentage of sales increased from 11.3% in Fiscal 2009 to 14.3% on a pro forma basis in Fiscal 2010.
Pro forma administrative expenses for Fiscal 2010 include a compensation expense of $78.0 million in relation to share-based incentives, a significant increase compared with the compensation expense of $10.4 million that was recognized during Fiscal 2009 which is principally due to the new share schemes that were put in place after the Acquisition.
Pro forma administrative expenses for Fiscal 2010 include an additional amortization expense of $132.3 million due to the fair value uplift to the carrying amount of the identifiable intangible assets held by Tomkins at the date of the Acquisition.
Transaction costs
Transaction costs recognized in relation to acquisitions were $78.2 million during Q4 2010 and were $41.2 million during 9M 2010. Pro forma transaction costs for Fiscal 2010 amounted to $0.6 million, principally in relation to the acquisition of Koch Filter Corporation in February 2010. Acquisition-related costs incurred by us in relation to businesses acquired before January 3, 2010 were not expensed but were included in the cost of acquisition.
Impairments
We recognized no impairment of long-lived assets during Fiscal 2010.
During Fiscal 2009, we recognized impairments amounting to $73.0 million, comprising $18.9 million on goodwill and intangible assets arising on acquisitions, $38.6 million on assets that became impaired as a consequence of our restructuring initiatives and $15.5 million on receivables held in relation to the disposal of businesses in previous years.
Restructuring costs
We recognized restructuring costs of $3.7 million during Q4 2010 and $10.0 million during 9M 2010 in connection with projects Eagle and Cheetah. In both periods, the costs related principally to the cessation of certain North American manufacturing facilities within the Gates North America and Powertrain operating segments.
During Fiscal 2009, we recognized restructuring costs of $140.9 million. I&A recognized restructuring costs of $113.8 million, which principally related to the cessation of Gates EMEA’s manufacturing operations in Aachen, Germany, the cessation of its hose manufacturing activities in Erembodegem, Belgium and the substantial closure of its assembly facility at St. Neots, UK; the rationalization of Powertrain’s powder metal facility at Mississauga, Ontario, and the closures of its pulley and tensioner facility at London, Ontario, and FormFlo in the UK; the rationalization of Dexter’s manufacturing facilities, and, in Other Industrial & Automotive, the closure of Ideal’s manufacturing facility at St. Augustine, Florida. Building Products recognized restructuring costs of $26.6 million, which principally related to the closure of the Philips Doors and Windows business.
Net gain on disposals and on the exit of businesses
During Q4 2010, we recognized no gain or loss on the disposal or exit of businesses. During 9M 2010, we recognized a net gain of $9.6 million on the disposal of property, plant and equipment, principally in Building Products as a consequence of the restructuring of Bathware and the closure of Doors & Windows. This net gain was offset by an additional loss of $3.3 million on the disposal of a subsidiary that took place in Fiscal 2008 and a loss on the disposal of Hydrolink’s operations in Kazakhstan.
During Fiscal 2009, we recognized a net gain of $0.2 million in relation to the disposal of businesses in prior years.
Gain on amendment of post-employment benefits
During Fiscal 2009, we recognized a one-off gain of $63.0 million on the amendment of post-employment benefit plans in North America.
Operating profit
During Q4 2010 we incurred an operating loss of $204.3 million but during 9M 2010 we recognized an operating profit of $313.2 million. Pro forma operating profit for Fiscal 2010 was $244.9 million, compared with an operating profit of $88.2 million for Fiscal 2009.
Adjusted EBITDA
Adjusted EBITDA was $173.8 million for Q4 2010 and $498.9 million for 9M 2010. Pro forma adjusted EBITDA for Fiscal 2010 was $671.0 million, an increase of $248.9 million over the adjusted EBITDA for Fiscal 2009 of $422.1 million that was due largely to the effect of increased sales volumes and the benefits of our restructuring initiatives. Our pro forma adjusted EBITDA margin was 15.1% for Fiscal 2010, compared with our adjusted EBITDA margin of 10.9% for Fiscal 2009.
A reconciliation of operating profit or loss for the period to adjusted EBITDA for each of the periods under review is presented under the heading ‘Non-GAAP measures’.
41
Pinafore Holdings B.V.
Item 5A
Interest Expense
Interest expense was $90.8 million in Q4 2010 and $71.4 million in 9M 2010. Pro forma interest expense was $360.9 million for Fiscal 2010 compared with $111.0 million for Fiscal 2009, the increase being due largely to the additional borrowings that were drawn down to finance the Acquisition. Our interest expense may be analyzed as follows:
| | | | | | | | | | | | | | | | | | | | | | |
| $ million | | SUCCESSOR | | | | | PREDECESSOR | | | | | | | | | | |
| | | Q4 2010 | | | | | 9M 2010 | | | Pro forma
adjustments | | | Pro forma
Fiscal 2010 | | | Fiscal 2009 | |
Bank overdrafts | | | — | | | | | | 6.0 | | | | — | | | | 6.0 | | | | 4.6 | |
Term loans | | | 38.4 | | | | | | — | | | | 120.1 | | | | 158.5 | | | | — | |
Other bank loans | | | — | | | | | | 0.5 | | | | 1.5 | | | | 2.0 | | | | 4.3 | |
Second Lien Notes | | | 27.9 | | | | | | — | | | | 83.8 | | | | 111.7 | | | | — | |
2011 Notes | | | 1.9 | | | | | | 13.3 | | | | (8.5 | ) | | | 6.7 | | | | 19.9 | |
2015 Notes | | | 3.3 | | | | | | 17.2 | | | | (18.9 | ) | | | 1.6 | | | | 24.8 | |
Net interest on interest rate swaps | | | — | | | | | | (19.0 | ) | | | 19.0 | | | | — | | | | (20.2 | ) |
| | | | | | | | | | | | | | | | | | | | | | |
| | | 71.5 | | | | | | 18.0 | | | | 197.0 | | | | 286.5 | | | | 33.4 | |
Finance leases | | | — | | | | | | 0.2 | | | | — | | | | 0.2 | | | | 0.4 | |
Other | | | 4.0 | | | | | | 3.2 | | | | 1.7 | | | | 8.9 | | | | 7.6 | |
| | | | | | | | | | | | | | | | | | | | | | |
| | | 75.5 | | | | | | 21.4 | | | | 198.7 | | | | 295.6 | | | | 41.4 | |
Post-employment benefits: | | | | | | | | | | | | | | | | | | | | | | |
– Interest on benefit obligation | | | 15.3 | | | | | | 50.0 | | | | — | | | | 65.3 | | | | 69.6 | |
| | | | | | | | | | | | | | | | | | | | | | |
| | | 90.8 | | | | | | 71.4 | | | | 198.7 | | | | 360.9 | | | | 111.0 | |
| | | | | | | | | | | | | | | | | | | | | | |
At the beginning of Q4 2010, we borrowed $2,000.0 million by way of floating rate term loans issued under the senior secured credit facilities and issued $1,150.0 million 9% senior secured second lien notes that mature on October 1, 2018 to finance the Acquisition. We recognized a pro forma interest expense of $270.2 million on these additional borrowings during Fiscal 2010.
When it was acquired, Tomkins had the following notes outstanding under a Euro Medium Term Note Programme: £150 million 8% notes repayable at par on December 20, 2011; and £250 million 6.125% notes repayable at par on September 16, 2015. During Q4 2010, as a result of our tender offer and the triggering of a put option held by the lenders, the principal amount outstanding on the 2011 Notes was reduced from £150.0 million to £107.0 million and the principal amount outstanding on the 2015 Notes was reduced from £250.0 million to £17.2 million. As a result, the pro forma interest expense in relation to the 2011 Notes and the 2015 Notes was $8.3 million in Fiscal 2010 compared with $44.7 million in Fiscal 2009.
Prior to the Acquisition, Tomkins held interest rate swaps to swap the 2011 Notes and the 2015 Notes from fixed interest rates to floating interest rates. During 9M 2010, these interest rate swaps had the effect of reducing our interest expense by $19.0 million (Fiscal 2009: $20.2 million). On September 16, 2010, these interest rate swaps were sold in anticipation of the Acquisition. Accordingly, their beneficial effect was eliminated in arriving at the pro forma interest expense for Fiscal 2010.
In Fiscal 2010, pro forma interest on the benefit obligations of our defined benefit and post-employment heath care plans was $65.3 million, $4.3 million lower than in Fiscal 2009 due to the decline in market interest rates during Fiscal 2010.
Investment Income
Investment income was $18.7 million in Q4 2010 and $48.0 million in 9M 2010. Pro forma investment income was $66.7 million in Fiscal 2010 compared with $67.0 million in Fiscal 2009. Interest earned on bank and other deposits was higher during Fiscal 2010 compared with Fiscal 2009 due principally to the higher average interest-bearing cash balances. However, the higher interest income was outweighed by the effect during the period of the lower expected return on the assets held by our defined benefit pension plans at the beginning of Fiscal 2010 compared with at the beginning of Fiscal 2009. Investment income may be analyzed as follows:
| | | | | | | | | | | | | | | | | | | | | | |
| $ million | | SUCCESSOR | | | | | PREDECESSOR | | | | | | | | | | |
| | | Q4 2010 | | | | | 9M 2010 | | | Pro forma
adjustments | | | Pro forma
Fiscal 2010 | | | Fiscal 2009 | |
Bank deposits | | | 1.3 | | | | | | 2.3 | | | | — | | | | 3.6 | | | | 2.6 | |
Other | | | 1.1 | | | | | | 1.1 | | | | — | | | | 2.2 | | | | 1.9 | |
| | | | | | | | | | | | | | | | | | | | | | |
| | | 2.4 | | | | | | 3.4 | | | | — | | | | 5.8 | | | | 4.5 | |
Post-employment benefits: | | | | | | | | | | | | | — | | | | | | | | | |
– Expected return on plan assets | | | 16.3 | | | | | | 44.6 | | | | — | | | | 60.9 | | | | 62.5 | |
| | | | | | | | | | | | | | | | | | | | | | |
| | | 18.7 | | | | | | 48.0 | | | | — | | | | 66.7 | | | | 67.0 | |
| | | | | | | | | | | | | | | | | | | | | | |
42
Pinafore Holdings B.V.
Item 5A
Other Finance (Expense)/Income
Other finance expense was $27.1 million in Q4 2010 and $2.7 million in 9M 2010. Pro forma other finance income was $25.3 million in Fiscal 2010 compared with an expense of $0.3 million in Fiscal 2009.
| | | | | | | | | | | | | | | | | | | | | | |
| $ million | | SUCCESSOR | | | | | PREDECESSOR | | | Pro forma
adjustments | | | Pro forma
Fiscal 2010 | | | Fiscal 2009 | |
| | | Q4 2010 | | | | | 9M 2010 | | | | |
Loss on derivatives held for hedging purposes | | | — | | | | | | (1.7 | ) | | | 1.7 | | | | — | | | | 1.3 | |
Gain on embedded derivatives | | | 22.9 | | | | | | — | | | | — | | | | 22.9 | | | | — | |
Translation loss on hedging instruments | | | (1.5 | ) | | | | | (1.0 | ) | | | 4.9 | | | | 2.4 | | | | (1.6 | ) |
Translation loss on the Acquisition | | | (47.6 | ) | | | | | — | | | | 47.6 | | | | — | | | | — | |
Loss on redemption of notes | | | (0.9 | ) | | | | | — | | | | 0.9 | | | | — | | | | — | |
| | | | | | | | | | | | | | | | | | | | | | |
| | | (27.1 | ) | | | | | (2.7 | ) | | | 55.1 | | | | 25.3 | | | | (0.3 | ) |
| | | | | | | | | | | | | | | | | | | | | | |
Prior to the Acquisition, Tomkins had designated as fair value hedges in relation to the 2011 Notes and the 2015 Notes the interest rate swaps that it held to swap the interest payable on the notes from fixed to floating rates. During 9M 2010, Tomkins recognized a loss of $1.7 million in other finance expense because there was deemed to be ineffectiveness in the hedging relationship for accounting purposes. As the interest rate swaps were sold in anticipation of the Acquisition, we have eliminated that loss in arriving at pro forma other finance income for Fiscal 2010. During Fiscal 2009, we recognized a gain of $1.3 million due to hedge ineffectiveness of the interest rate swaps.
Other finance expense included a currency translation loss on hedging instruments of $1.5 million in Q4 2010 and $1.0 million in 9M 2010. In arriving at pro forma other finance income for Fiscal 2010, we have eliminated a net currency translation loss of $4.9 million which was attributable to the translation of the 2011 Notes and the 2015 Notes and to the interest rate swaps that were designated as fair value hedges in relation to them. Accordingly, pro forma other finance income for Fiscal 2010 includes a net currency translation gain of $2.4 million on hedging instruments compared with a net currency translation loss of $1.6 million that was included in other finance expense for Fiscal 2009.
Borrowings against the senior secured credit facilities that were drawn down to finance the Acquisition bear interest at floating rates, subject to a floor (an embedded interest rate derivative that was required to be recognized separately from the term loans). During Q4 2010, we recognized a gain of $22.9 million due to the change in the fair values of the embedded interest rate derivatives as a credit to other finance expense.
During Q4 2010, we incurred a currency translation loss of $47.6 million on the Acquisition due to the change in the rate of exchange between Sterling (in which the purchase consideration was denominated) and the US dollar (the functional currency of the acquiring entity), in the period between the effective date of the Acquisition and the payment of the consideration to the former shareholders in Tomkins. Also during Q4 2010, we incurred a loss of $0.9 million on partial repayments of the 2011 Notes and the 2015 Notes. As these losses represented non-recurring effects of the Acquisition, they were eliminated in arriving at pro forma other finance income for Fiscal 2010.
Income tax benefit/(expense)
We recognized an income tax benefit of $34.1 million on a loss before tax of $303.5 million in Q4 2010 and an income tax expense of $62.5 million on a profit before tax of $287.1 million in 9M 2010. For Fiscal 2010, the pro forma income tax benefit was $38.3 million on the pro forma loss before tax of $24.0 million, compared with the income tax expense of $25.1 million that we recognized on the profit before tax of $43.9 million in Fiscal 2009.
43
Pinafore Holdings B.V.
Item 5A
Analysis by ongoing operating segment
In the discussion below, each segment’s pro forma sales for Fiscal 2010 are equal to the sum of the actual sales for the Predecessor and Successor periods in Fiscal 2010. Unless otherwise indicated, all commentary in this section of Management’s Discussion and Analysis is for ongoing operations.
Industrial & Automotive
Gates North America (39.4% of I&A’s Fiscal 2010 ongoing sales)
| | | | | | | | | | | | | | | | | | | | | | | | | | |
| $ million, unless otherwise stated | | SUCCESSOR | | | | | PREDECESSOR | | | | | | | | | | | | Pro forma
Fiscal 2010 vs
Fiscal 2009
% change | |
| | | Q4 2010 | | | | | 9M 2010 | | | Pro forma
adjustments | | | Pro forma
Fiscal 2010 | | | Fiscal 2009 | | |
Sales | | | 308.4 | | | | | | 844.4 | | | | — | | | | 1,152.8 | | | | 956.4 | | | | 20.5 | % |
Operating expenses | | | (329.8 | ) | | | | | (663.5 | ) | | | (1.3 | ) | | | (994.6 | ) | | | (830.6 | ) | | | | |
| | | | | | | | | | | | | | | | | | | | | | | | | | |
Operating profit | | | (21.4 | ) | | | | | 180.9 | | | | (1.3 | ) | | | 158.2 | | | | 125.8 | | | | | |
| | | | | | | | | | | | | | | | | | | | | | | | | | |
| | | | | | | |
Adjusted EBITDA | | | 71.1 | | | | | | 209.3 | | | | 0.1 | | | | 280.5 | | | | 153.3 | | | | | |
Adjusted EBITDA margin | | | 23.1 | % | | | | | 24.8 | % | | | | | | | 24.3 | % | | | 16.0 | % | | | | |
Sales were $1,152.8 million (Fiscal 2009: $956.4 million), an increase of 20.5%, or $196.4 million. Sales were higher principally due to the strengthening of the industrial replacement and OE markets (33.0% and 18.9% of Gates NA’s Fiscal 2010 sales, respectively) which increased year-on-year by 30.8% and 34.8%, respectively. Sales to the Automotive aftermarket (42.4% of Gates NA’s Fiscal 2011 sales) were up by 8.1% due to increased demand by end users, the increased size and age of the global vehicle population and the greater number of miles driven. Sales to the automotive OE markets (5.7% of Gates NA’s Fiscal 2010 sales) were up by 27.2% following the recovery in automotive production and the unprecedentedly low sales volumes in the prior year as a result of extended plant shutdowns and significantly depressed sales by automotive OEMs, including the Chapter 11 restructurings of General Motors and Chrysler. Overall, volume increases accounted for $202.1 million of increased sales, with a further $6.9 million attributed to pricing increases. Foreign exchange movements accounted for a further $11.0 million.
Operating expenses in our Gates NA segment totaled $329.8 million in Q4 2010 and $663.5 million in 9M 2010. Pro forma operating expenses were $994.6 million in Fiscal 2010 compared with $830.6 million in Fiscal 2009. The principal component of operating expenses was cost of sales.
Cost of sales in our Gates NA segment totaled $231.7 million in Q4 2010 and $488.8 million in 9M 2010. Pro forma cost of sales was $675.7 million in Fiscal 2010 compared with $602.3 million in Fiscal 2009. Pro forma cost of sales for Fiscal 2010 increased by approximately $130 million compared with Fiscal 2009 due to higher production volumes, and by a further approximately $5 million as a result of rising raw material costs. These increases were partially offset by a combination of efficiency improvements and other benefits arising from restructuring projects of approximately $33 million.
In addition to the movements in cost of sales, pro forma operating expenses for Fiscal 2010 benefited from a reduction of approximately $8 million in labor-related costs, compared with Fiscal 2009. Pro forma depreciation and pro forma amortization amounted to $113.0 million in Fiscal 2010 compared with $42.6 million in Fiscal 2009, the increase being due principally to the purchase accounting uplift to the carrying amounts of long-lived assets. In Fiscal 2010, the pro forma compensation expense in respect of share-based incentives was $12.8 million compared with $1.0 million in Fiscal 2009. While there was no pro forma impairment of long-lived assets recognized in Fiscal 2010, Gates NA recognized impairments of $17.8 million in Fiscal 2009. In Fiscal 2010, pro forma restructuring costs were $2.4 million compared with $24.8 million for Fiscal 2009. In Fiscal 2009, Gates NA recognized a one-off gain of $58.7 million on the amendment of our post-employment benefit plans in North America.
Our Gates NA segment incurred an operating loss of $21.4 million for Q4 2010, and recognized an operating profit of $180.9 million for 9M 2010. Pro forma operating profit was $158.2 million for Fiscal 2010, an increase of $32.4 million compared with Fiscal 2009.
Adjusted EBITDA in our Gates NA segment was $71.1 million for Q4 2010 and $209.3 million for 9M 2010. Pro forma adjusted EBITDA was $280.5 million for Fiscal 2010 compared with $153.3 million for Fiscal 2009, an increase of 83.0% that was due principally to higher volumes in Fiscal 2010 and the effects of our restructuring initiatives. Gates NA’s adjusted EBITDA margin consequently increased to 24.3% on a pro forma basis in Fiscal 2010 compared with 16.0% in Fiscal 2009.
Gates EMEA (25.6% of I&A’s Fiscal 2010 ongoing sales)
| | | | | | | | | | | | | | | | | | | | | | | | | | |
| $ million, unless otherwise stated | | SUCCESSOR | | | | | PREDECESSOR | | | | | | | | | | | | Pro forma
Fiscal 2010 vs
Fiscal 2009
% change | |
| | | Q4 2010 | | | | | 9M 2010 | | | Pro forma
adjustments | | | Pro forma
Fiscal 2010 | | | Fiscal 2009 | | |
Sales | | | 205.4 | | | | | | 541.8 | | | | — | | | | 747.2 | | | | 663.4 | | | | 12.6 | % |
Operating expenses | | | (236.3 | ) | | | | | (513.9 | ) | | | 13.7 | | | | (736.5 | ) | | | (703.3 | ) | | | | |
| | | | | | | | | | | | | | | | | | | | | | | | | | |
Operating profit/(loss) | | | (30.9 | ) | | | | | 27.9 | | | | 13.7 | | | | 10.7 | | | | (39.9 | ) | | | | |
| | | | | | | | | | | | | | | | | | | | | | | | | | |
| | | | | | | |
Adjusted EBITDA | | | 19.2 | | | | | | 54.4 | | | | 0.2 | | | | 73.8 | | | | 54.0 | | | | | |
Adjusted EBITDA margin | | | 9.3 | % | | | | | 10.0 | % | | | | | | | 9.9 | % | | | 8.1 | % | | | | |
Sales were $747.2 million (Fiscal 2009: $663.4 million), an increase of 12.6%. Sales to the industrial replacement and OE markets (24.2% and 12.4% respectively of Gates EMEA’s Fiscal 2010 sales) were up year-on-year by 22.3% and 31.6% respectively, due to the recovery in the region’s industrial markets, and also the acquisition of Hydrolink in June 2009. Sales to the automotive aftermarket, which accounted for 39.8% of Gates EMEA’s sales, grew by 3.9% and sales to the automotive OE market, which accounted for 23.6% of Gates EMEA’s Fiscal 2010 sales, were up by 10.9% due to increased automotive production volumes in the region. Overall, volume increases accounted for $105.2 million of the increase in Gates EMEA sales.
44
Pinafore Holdings B.V.
Item 5A
Operating expenses in our Gates EMEA segment totaled $236.3 million in Q4 2010 and $513.9 million in 9M 2010. Pro forma operating expenses were $736.5 million in Fiscal 2010 compared with $703.3 million in Fiscal 2009. The principal component of operating expenses was cost of sales.
Cost of sales in our Gates EMEA segment totaled $177.7 million in Q4 2010 and $371.9 million in 9M 2010. Pro forma cost of sales was $521.0 million in Fiscal 2010 compared with $472.0 million in Fiscal 2009. Pro forma cost of sales for Fiscal 2010 increased by approximately $70 million compared with Fiscal 2009 due to higher production volumes. This impact was partially offset by a combination of savings of approximately $7 million on pro forma raw material costs and a further saving of approximately $21 million as a result of efficiency improvements and other benefits arising from restructuring projects.
In addition to the movements in cost of sales, higher freight costs of approximately $5.0 million increased other pro forma operating expenses for Fiscal 2010, but this was offset by administrative and distribution efficiency savings of approximately $5 million. Pro forma depreciation and pro forma amortization amounted to $54.6 million in Fiscal 2010 compared with $27.5 million in Fiscal 2009, the increase being due principally to the purchase accounting uplift to the carrying amounts of the relevant long-lived assets. In Fiscal 2010, the pro forma compensation expense in respect of share-based incentives was $3.8 million compared with $1.3 million in Fiscal 2009. While there was no pro forma impairment of long-lived assets recognized in Fiscal 2010, Gates EMEA recognized impairments of $10.9 million in Fiscal 2009. In Fiscal 2010, pro forma restructuring costs were $3.0 million compared with $54.2 million for Fiscal 2009.
Our Gates EMEA segment incurred an operating loss of $30.9 million for Q4 2010 and recognized an operating profit of $27.9 million for 9M 2010. Pro forma operating profit was $10.7 million for Fiscal 2010 compared with an operating loss of $39.9 million for Fiscal 2009.
Adjusted EBITDA in our Gates EMEA segment was $19.2 million for Q4 2010 and $54.4 million for 9M 2010. Pro forma adjusted EBITDA was $73.8 million for Fiscal 2010 compared with $54.0 million for Fiscal 2009, the improvement being due principally to the increased sales volumes and the effects of our restructuring initiatives. Gates EMEA’s adjusted EBITDA margin improved significantly to 9.9% on a pro forma basis in Fiscal 2010 compared with 8.1% in Fiscal 2009.
Gates APAC (21.6% of I&A’s Fiscal 2010 ongoing sales)
| | | | | | | | | | | | | | | | | | | | | | | | | | |
| $ million, unless otherwise stated | | SUCCESSOR | | | | | PREDECESSOR | | | | | | | | | | | | Pro forma
Fiscal 2010 vs
Fiscal 2009
% change | |
| | | Q4 2010 | | | | | 9M 2010 | | | Pro forma
adjustments | | | Pro forma
Fiscal 2010 | | | Fiscal 2009 | | |
Sales | | | 183.1 | | | | | | 447.9 | | | | — | | | | 631.0 | | | | 478.6 | | | | 31.8 | % |
Operating expenses | | | (191.9 | ) | | | | | (373.5 | ) | | | 8.5 | | | | (556.9 | ) | | | (425.3 | ) | | | | |
| | | | | | | | | | | | | | | | | | | | | | | | | | |
Operating profit | | | (8.8 | ) | | | | | 74.4 | | | | 8.5 | | | | 74.1 | | | | 53.3 | | | | | |
| | | | | | | | | | | | | | | | | | | | | | | | | | |
| | | | | | | |
Adjusted EBITDA | | | 37.4 | | | | | | 93.8 | | | | — | | | | 131.2 | | | | 79.5 | | | | | |
Adjusted EBITDA margin | | | 20.4 | % | | | | | 20.9 | % | | | | | | | 20.8 | % | | | 16.6 | % | | | | |
Sales were $631.0 million (Fiscal 2009: $478.6 million) an increase of 31.8%, driven by higher sales to the Auto OE market, which accounted for 48.7% of Gates APAC’s sales and which grew 19.6% compared to 2009. The industrial replacement and OE markets, which accounted for 20.8% and 16.6% respectively, increased by 47.4% and 65.4% respectively compared with Fiscal 2009. The automotive aftermarket (13.9% of Gates APAC’s Fiscal 2010 sales) grew by 26.4% compared with Fiscal 2009. Overall, volume accounted for $146.2 million of the increase in sales. Favorable movements in currency exchange rates accounted for a further $30.2 million of the increase.
Operating expenses in our Gates APAC segment totaled $191.9 million in Q4 2010 and $373.5 million in 9M 2010. Pro forma operating expenses were $556.9 million in Fiscal 2010 compared with $425.3 million in Fiscal 2009. The principal component of operating expenses was cost of sales.
Cost of sales in our Gates APAC segment totaled $142.8 million in Q4 2010 and $282.9 million in 9M 2010. Pro forma cost of sales was $400.9 million in Fiscal 2010 compared with $312.5 million in Fiscal 2009. Pro forma cost of sales for Fiscal 2010 increased by approximately $100 million compared with Fiscal 2009 due to higher production volumes, partially offset by savings from efficiency improvements and other benefits arising from restructuring projects of approximately $9 million.
In addition to the movements in cost of sales, pro forma operating expenses for Fiscal 2010 were approximately $3 million higher compared with Fiscal 2009 as a result of increased labor-related costs. Pro forma depreciation and pro forma amortization amounted to $54.3 million in Fiscal 2010 compared with $22.5 million in Fiscal 2009, the increase being due principally to the purchase accounting uplift to the carrying amounts of the relevant long-lived assets. In Fiscal 2010, the pro forma compensation expense in respect of share-based incentives was $2.6 million compared with $0.1 million in Fiscal 2009. While there was no pro forma impairment of long-lived assets recognized in Fiscal 2010, Gates APAC recognized impairments of $2.7 million in Fiscal 2009.
Our Gates APAC segment incurred an operating loss of $8.8 million for Q4 2010 and recognized an operating profit of $74.4 million for 9M 2010. Pro forma operating profit was $74.1 million for Fiscal 2010 compared with an operating profit of $53.3 million for Fiscal 2009.
Adjusted EBITDA in our Gates APAC segment was $37.4 million for Q4 2010 and $93.8 million for 9M 2010. Pro forma adjusted EBITDA was $131.2 million for Fiscal 2010 compared with $79.5 million for Fiscal 2009, the improvement being due principally to the increased sales volumes and the effects of our restructuring initiatives. Gates APAC’s adjusted EBITDA margin improved to 20.8% on a pro forma basis in Fiscal 2010 compared with 16.6% in Fiscal 2009.
45
Pinafore Holdings B.V.
Item 5A
Gates South America (5.0% of I&A’s Fiscal 2010 ongoing sales)
| | | | | | | | | | | | | | | | | | | | | | | | | | |
| $ million, unless otherwise stated | | SUCCESSOR | | | | | PREDECESSOR | | | | | | | | | | | | Pro forma
Fiscal 2010 vs
Fiscal 2009
% change | |
| | | Q4 2010 | | | | | 9M 2010 | | | Pro forma
adjustments | | | Pro forma
Fiscal 2010 | | | Fiscal 2009 | | |
Sales | | | 37.7 | | | | | | 109.5 | | | | — | | | | 147.2 | | | | 99.5 | | | | 47.9 | % |
Operating expenses | | | (43.8 | ) | | | | | (96.6 | ) | | | 0.3 | | | | (140.1 | ) | | | (90.9 | ) | | | | |
| | | | | | | | | | | | | | | | | | | | | | | | | | |
Operating profit | | | (6.1 | ) | | | | | 12.9 | | | | 0.3 | | | | 7.1 | | | | 8.6 | | | | | |
| | | | | | | | | | | | | | | | | | | | | | | | | | |
| | | | | | | |
Adjusted EBITDA | | | 3.1 | | | | | | 16.2 | | | | — | | | | 19.3 | | | | 14.4 | | | | | |
Adjusted EBITDA margin | | | 8.2 | % | | | | | 14.8 | % | | | | | | | 13.1 | % | | | 14.5 | % | | | | |
Sales were $147.2 million (Fiscal 2009: $99.5 million) an increase of 47.9%. Sales to the industrial replacement end market, which accounted for 33.1% of Gates SA’s Fiscal 2010 sales, grew by 64.6% driven by end market recovery. Sales to the industrial OE market (24.2% of Gates SA’s Fiscal 20110 sales) grew 75.7% also driven by the recovery in end markets. Sales to the automotive aftermarket, which accounted for 20.9% of Gates SA’s Fiscal 2010 sales, grew 26.4% due to market recovery and underlying growth in the market.
Operating expenses in our Gates SA segment totaled $43.8 million in Q4 2010 and $96.6 million in 9M 2010. Pro forma operating expenses were $140.1 million in Fiscal 2010 compared with $90.9 million in Fiscal 2009. The principal component of operating expenses was cost of sales.
Cost of sales in our Gates SA segment totaled $34.5 million in Q4 2010 and $77.6 million in 9M 2010. Pro forma cost of sales was $109.1 million in Fiscal 2010 compared with $70.2 million in Fiscal 2009. The increase in pro forma cost of sales for Fiscal 2010 compared with Fiscal 2009 was due primarily to higher production volumes.
In addition to the movements in cost of sales, pro forma operating expenses for Fiscal 2010 were approximately $2 million higher compared with Fiscal 2009 as a result of increased labor-related costs. Pro forma depreciation and pro forma amortization amounted to $11.7 million in Fiscal 2010 compared with $4.9 million in Fiscal 2009, the increase being due principally to the purchase accounting uplift to the carrying amounts of the relevant long-lived assets. While there was no pro forma impairment of long-lived assets recognized in Fiscal 2010, Gates SA recognized impairments of $0.5 million in Fiscal 2009.
Our Gates SA segment incurred an operating loss of $6.1 million for Q4 2010 and recognized an operating profit of $12.9 million for 9M 2010. Pro forma operating profit was $7.1 million for Fiscal 2010 compared with an operating profit of $8.6 million for Fiscal 2009.
Adjusted EBITDA in our Gates SA segment was $3.1 million for Q4 2010 and $16.2 million for 9M 2010. Pro forma adjusted EBITDA was $19.3 million for Fiscal 2010 compared with $14.4 million for Fiscal 2009, the improvement being due principally to the increased sales volumes. Gates SA’s adjusted EBITDA margin softened from 14.5% in Fiscal 2009 to 13.1% on a pro forma basis in Fiscal 2010, due largely to the impact of higher production costs.
Dexter (8.4% of I&A’s Fiscal 2010 ongoing sales)
| | | | | | | | | | | | | | | | | | | | | | | | | | |
| $ million, unless otherwise stated | | SUCCESSOR | | | | | PREDECESSOR | | | | | | | | | | | | Pro forma
Fiscal 2010 vs
Fiscal 2009
% change | |
| | | Q4 2010 | | | | | 9M 2010 | | | Pro forma
adjustments | | | Pro forma
Fiscal 2010 | | | Fiscal
2009 | | |
Sales | | | 54.4 | | | | | | 190.8 | | | | — | | | | 245.2 | | | | 196.6 | | | | 24.7 | % |
Operating expenses | | | (53.7 | ) | | | | | (165.2 | ) | | | (5.0 | ) | | | (223.9 | ) | | | (178.3 | ) | | | | |
| | | | | | | | | | | | | | | | | | | | | | | | | | |
Operating profit | | | 0.7 | | | | | | 25.6 | | | | (5.0 | ) | | | 21.3 | | | | 18.3 | | | | | |
| | | | | | | | | | | | | | | | | | | | | | | | | | |
| | | | | | | |
Adjusted EBITDA | | | 7.5 | | | | | | 31.2 | | | | — | | | | 38.7 | | | | 28.2 | | | | | |
Adjusted EBITDA margin | | | 13.8 | % | | | | | 16.4 | % | | | | | | | 15.8 | % | | | 14.3 | % | | | | |
Sales were $245.2 million (Fiscal 2009: $196.6 million) an increase of 24.7%. Sales to the industrial utility market, which accounted for 78.9% of Dexter’s Fiscal 2010 sales, grew by 15.1% year-on-year driven by strong demand combined with price increases early in the year. Sales to both the recreational vehicle and manufactured housing end markets, which accounted for 18.9% and 2.2% respectively of Dexter’s Fiscal 2011 sales, grew by 81.9% and 72.5% respectively due to the recovery in both markets.
Operating expenses in our Dexter segment totaled $53.7 million in Q4 2010 and $165.2 million in 9M 2010. Pro forma operating expenses were $223.9 million in Fiscal 2010 compared with $178.3 million in Fiscal 2009. The principal component of operating expenses was cost of sales.
Cost of sales in our Dexter segment totaled $45.1 million in Q4 2010 and $144.6 million in 9M 2010. Pro forma cost of sales was $189.0 million in Fiscal 2010 compared with $154.1 million in Fiscal 2009. Pro forma cost of sales for Fiscal 2010 increased by approximately $31 million compared with Fiscal 2009 due to higher production volumes, partially offset by efficiency improvements and other benefits arising from restructuring projects of approximately $3 million. In addition to the movements in cost of sales during Fiscal 2010, the segment recognized a pro forma gain of approximately $4 million from the sale of scrap compared with Fiscal 2009. Pro forma depreciation and pro forma amortization amounted to $15.5 million in Fiscal 2010 compared with $7.3 million in Fiscal 2009, the increase being due principally to the purchase accounting uplift to the carrying amounts of the relevant long-lived assets. In Fiscal 2010, the pro forma compensation expense in respect of share-based incentives was $1.5 million compared with $0.2 million in Fiscal 2009. In Fiscal 2010, restructuring costs were $0.4 million compared with $2.2 million for Fiscal 2009.
Our Dexter segment recognized an operating profit of $0.7 million for Q4 2010 and $25.6 million for 9M 2010. Pro forma operating profit was $21.3 million for Fiscal 2010 compared with an operating profit of $18.3 million for Fiscal 2009.
46
Pinafore Holdings B.V.
Item 5A
Adjusted EBITDA in our Dexter segment was $7.5 million for Q4 2010 and $31.2 million for 9M 2010. Pro forma adjusted EBITDA was $38.7 million for Fiscal 2010 compared with $28.2 million for Fiscal 2009, the improvement being due principally to higher sales volumes. Dexter’s adjusted EBITDA margin improved to 15.8% on a pro forma basis in Fiscal 2010 compared with 14.3% in Fiscal 2009, largely due to the savings from restructuring initiatives.
Building Products
Air Distribution (87.9% of Building Products’ Fiscal 2010 ongoing sales)
| | | | | | | | | | | | | | | | | | | | | | | | | | |
| $ million, unless otherwise stated | | SUCCESSOR | | | | | PREDECESSOR | | | | | | | | | | | | Pro forma
Fiscal 2010 vs
Fiscal 2009
% change | |
| | | Q4 2010 | | | | | 9M 2010 | | | Pro forma
adjustments | | | Pro forma
Fiscal 2010 | | | Fiscal 2009 | | |
Sales | | | 226.7 | | | | | | 636.2 | | | | — | | | | 862.9 | | | | 874.2 | | | | (1.3 | )% |
Operating expenses | | | (231.7 | ) | | | | | (584.4 | ) | | | 0.4 | | | | (815.7 | ) | | | (826.1 | ) | | | | |
| | | | | | | | | | | | | | | | | | | | | | | | | | |
Operating (loss)/profit | | | (5.0 | ) | | | | | 51.8 | | | | 0.4 | | | | 47.2 | | | | 48.1 | | | | | |
| | | | | | | | | | | | | | | | | | | | | | | | | | |
| | | | | | | |
Adjusted EBITDA | | | 22.6 | | | | | | 80.5 | | | | 0.4 | | | | 103.5 | | | | 105.6 | | | | | |
Adjusted EBITDA margin | | | 10.0 | % | | | | | 12.7 | % | | | | | | | 12.0 | % | | | 12.1 | % | | | | |
Pro forma sales in our Air Distribution segment were $862.9 million for Fiscal 2010 compared with $874.2 million for Fiscal 2009, a decline of 1.3% that was due primarily to a combination of decreased volumes (approximately $45 million) and adverse selling price variances (approximately $6 million), partially offset by a $36.7 million increase due to the acquisition of Koch Filter Corporation in February 2010. Sales into the non-residential construction markets (74.0% of Air Distribution’s Fiscal 2010 pro forma sales) rose marginally compared with Fiscal 2009, as the continued decline in North American new build markets was offset by growth in the North American refurbishment market. Pro forma sales to the residential construction market (26.0% of Air Distribution’s Fiscal 2010 pro forma sales) declined by 7.2% in Fiscal 2010 compared with Fiscal 2009 due to the continued weakness in the North American residential construction market.
Operating expenses in our Air Distribution segment totaled $231.7 million in Q4 2010 and $584.4 million in 9M 2010. Pro forma operating expenses were $815.7 million in Fiscal 2010 compared with $826.1 million in Fiscal 2009. The principal component of operating expenses was cost of sales.
Cost of sales in our Air Distribution segment totaled $172.0 million in Q4 2010 and $435.8 million in 9M 2010. Pro forma cost of sales was $604.3 million in Fiscal 2010 compared with $616.4 million in Fiscal 2009. Pro forma cost of sales for Fiscal 2010 decreased by approximately $27 million compared with Fiscal 2009 due to lower production volumes.
In addition to the movements in cost of sales, pro forma operating expenses for Fiscal 2010 also decreased compared with Fiscal 2009 by approximately $18 million as a result of efficiency improvements and other benefits arising from restructuring projects and by approximately $5 million due to the acquisition in February 2010 of Koch Filter Corporation. Pro forma depreciation and pro forma amortization amounted to $45.9 million in Fiscal 2010 compared with $31.9 million in Fiscal 2009, the increase being due principally to the purchase accounting uplift to the carrying amounts of the relevant long-lived assets. In Fiscal 2010, the pro forma compensation expense in respect of share-based incentives was $7.6 million compared with $1.8 million in Fiscal 2009. While there was no impairment of long-lived assets recognized in Fiscal 2010, Air Distribution recognized impairments of $18.6 million in Fiscal 2009. In Fiscal 2010, restructuring costs were $1.7 million compared with $5.1 million for Fiscal 2009.
Our Air Distribution segment incurred an operating loss of $5.0 million for Q4 2010, but the segment recognized an operating profit for 9M 2010 of $51.8 million. Pro forma operating profit was $47.2 million for Fiscal 2010 compared with $48.1 million for Fiscal 2009.
Adjusted EBITDA in our Air Distribution segment was $22.6 million for Q4 2010 and $80.5 million for 9M 2010. Pro forma adjusted EBITDA was $103.5 million for Fiscal 2010 compared with $105.6 million for Fiscal 2009, with the slight reduction being due largely to the decline in sales which was offset partially by improved cost efficiencies. Air Distribution’s pro forma adjusted EBITDA margin was slightly lower at 12.0% on a pro forma basis for Fiscal 2010 compared with 12.1% for Fiscal 2009.
Bathware (12.1% of Building Products’ Fiscal 2010 ongoing sales)
| | | | | | | | | | | | | | | | | | | | | | | | | | |
| $ million, unless otherwise stated | | SUCCESSOR | | | | | PREDECESSOR | | | | | | | | | | | | Pro forma
Fiscal 2010 vs
Fiscal 2009
% change | |
| | | Q4 2010 | | | | | 9M 2010 | | | Pro forma
adjustments | | | Pro forma
Fiscal 2010 | | | Fiscal 2009 | | |
Sales | | | 27.1 | | | | | | 91.7 | | | | — | | | | 118.8 | | | | 140.3 | | | | (15.3 | )% |
Operating expenses | | | (31.5 | ) | | | | | (95.8 | ) | | | (2.5 | ) | | | (129.8 | ) | | | (153.1 | ) | | | | |
| | | | | | | | | | | | | | | | | | | | | | | | | | |
Operating loss | | | (4.4 | ) | | | | | (4.1 | ) | | | (2.5 | ) | | | (11.0 | ) | | | (12.8 | ) | | | | |
| | | | | | | | | | | | | | | | | | | | | | | | | | |
| | | | | | | |
Adjusted EBITDA | | | (1.2 | ) | | | | | (1.7 | ) | | | — | | | | (2.9 | ) | | | (0.1 | ) | | | | |
Adjusted EBITDA margin | | | (4.4 | )% | | | | | (1.9 | )% | | | | | | | (2.4 | )% | | | (0.1 | )% | | | | |
Pro forma sales in our Bathware segment were $118.8 million for Fiscal 2010 compared with $140.3 million for Fiscal 2009, a decline of 15.3%, due almost entirely to a drop in sales volumes. Bathware sells primarily to the US residential construction market, which continued to be weak throughout Fiscal 2010 and declined further towards the end of the period.
Operating expenses in our Bathware segment totaled $31.5 million in Q4 2010 and $95.8 million in 9M 2010. Pro forma operating expenses were $129.8 million in Fiscal 2010 compared with $153.1 million in Fiscal 2009. The principal component of operating expenses was cost of sales.
47
Pinafore Holdings B.V.
Item 5A
Cost of sales in our Bathware segment totaled $18.0 million in Q4 2010 and $57.9 million in 9M 2010. Pro forma cost of sales was $76.9 million in Fiscal 2010 compared with $89.0 million in Fiscal 2009. Pro forma cost of sales for Fiscal 2010 decreased by approximately $11 million compared with Fiscal 2009 due to lower production volumes, and by approximately $2 million as a result of efficiency improvements and other benefits arising from restructuring projects.
In addition to the movements in cost of sales, pro forma operating expenses for Fiscal 2010 also decreased compared with Fiscal 2009 by approximately $2 million as a result of savings on freight costs. Bathware recognized a gain of $3.2 million on the exit and disposal of businesses in Fiscal 2010. Pro forma depreciation and pro forma amortization amounted to $10.7 million in Fiscal 2010 compared with $8.4 million in Fiscal 2009, the increase being due principally to the purchase accounting uplift to the carrying amounts of the relevant long-lived assets. In Fiscal 2009, Bathware recognized restructuring costs of $1.6 million and impairments of $2.5 million.
Our Bathware segment reported an operating loss of $4.4 million for Q4 2010 and $4.1 million for 9M 2010. Pro forma operating loss was $11.0 million for Fiscal 2010 compared with a loss of $12.8 million for Fiscal 2009.
Adjusted EBITDA in our Bathware segment was a loss of $1.2 million for Q4 2010 and $1.7 million for 9M 2010. Pro forma adjusted EBITDA was a loss of $2.9 million for Fiscal 2010, which was higher than the loss of $0.1 million for Fiscal 2009 due to the continued decline in the residential construction end market during Fiscal 2010.
Corporate
Corporate reported an operating loss of $131.0 million for Q4 2010 and $78.6 million for 9M 2010. Pro forma operating loss was $87.4 million in Fiscal 2010 compared with an operating loss of $48.2 million in Fiscal 2009. In Fiscal 2010, the pro forma compensation expense in respect of share-based incentives was $48.4 million compared with $5.2 million in Fiscal 2009. While there was no impairment of long-lived assets recognized in Fiscal 2010, Corporate recognized impairments of $15.5 million in Fiscal 2009.
Corporate also recognized a pro forma management fee payable to the Sponsors of $3.0 million in Fiscal 2010. Corporate incurred an adjusted EBITDA loss of $6.1 million for Q4 2010 and a loss of $25.8 million for 9M 2010. Pro forma adjusted EBITDA was a loss of $34.3 million for Fiscal 2010 compared with a loss of $26.7 million for Fiscal 2009.
Discontinued operations
Discontinued operations includes the Sensors & Valves operating segment. In addition, during Fiscal 2009, we recognized additional losses of $3.9 million in relation to businesses sold in previous years that were classified as discontinued operations.
Sensors & Valves’ pro forma sales in Fiscal 2010 were $402.2 million compared with $313.6 million in Fiscal 2009. Sales to the automotive OE end market, which comprised 77.1% of Sensors & Valves’ Fiscal 2010 pro forma sales, increased by $76.7 million compared with Fiscal 2009, driven by higher sales to North America. Sales to the automotive aftermarket (18.4% of Sensors & Valves’ Fiscal 2010 pro forma sales) and industrial OE sales (4.5% of Sensors & Valves’ Fiscal 2010 pro forma sales) were up by 13.6% and 20.4%, respectively, compared with Fiscal 2009.
Adjusted EBITDA was $17.4 million in Q4 2010 and $44.5 million in 9M 2010. Pro forma adjusted EBITDA was $61.9 million compared with $25.6 million in Fiscal 2009.
48
Pinafore Holdings B.V.
Item 5A
Unaudited pro forma financial information
Introduction
The unaudited pro forma financial information has been prepared to reflect the following ‘Events’:
| • | | the incurrence of indebtedness under our senior secured credit facilities and the Second Lien Notes which was used to partially finance the Acquisition; |
| • | | the tender offer to purchase the outstanding 2011 Notes and 2015 Notes that we made in September 2011 as a requirement of the senior secured credit facility agreement (settlement of the tendered notes occurred in October 2010); |
| • | | the exercise by certain holders of our 2011 Notes and 2015 Notes of their right to put the notes to us that occurred in November 2010 (the put rights having arisen as a consequence of the ratings downgrade that resulted from the Acquisition); and |
| • | | the tender offer to purchase the outstanding 2011 Notes that we made in December 2010 as a requirement of the senior secured credit facility agreement (settlement of the tendered notes took place in January 2011). |
Basis of preparation
The unaudited pro forma financial information comprises the unaudited pro forma condensed consolidated income statements of the Company for Fiscal 2010, which is based on the consolidated income statement of the Predecessor for 9M 2010 and on the consolidated income statement of the Successor for Q4 2010 that are included elsewhere in this Annual Report. This pro forma financial information is presented for the purposes of facilitating the discussion inItem 5A‘Operating results’.
The unaudited pro forma adjustments described in the accompanying notes give effect to the Events as if they had occurred on January 3, 2010. The unaudited pro forma adjustments are based on currently available information and certain assumptions that we believe are reasonable and supportable.
The unaudited pro forma financial information does not give effect to items of income and expense (including costs directly attributable to the Acquisition) that were incurred in connection with the Events but would not have a continuing impact for us beyond the twelve months following completion of the Events.
The unaudited pro forma financial information is presented solely for informational purposes and is not intended to represent or be indicative of the consolidated income statement of the Company had the Events been completed as of January 3, 2010, nor is it necessarily indicative of future results. The unaudited pro forma financial information should be read in conjunction withItem 5A ‘Operating results’ and the Group’s consolidated financial statements included elsewhere in this Annual Report.
The unaudited pro forma adjustments do not reflect any other transactions since January 3, 2010.
49
Pinafore Holdings B.V.
Item 5A
UNAUDITED PRO FORMA CONDENSED CONSOLIDATED INCOME STATEMENT
Year Ended December 31, 2010
| | | | | | | | | | | | | | | | | | | | | | | | | | | | | | |
| | | Successor | | | | | Predecessor | | | Pro forma adjustments | | | Pro forma | |
| | | Q4 2010
$ million | | | | | 9M 2010
$ million | | | Acquisition
accounting
adjustments
$ million | | | Draw-down
of new debt
$ million | | | Repayment
of Tomkins
debt
$ million | | | Other
$ million | | | Fiscal
2010
$ million | |
Continuing operations | | | | | | | | | | | | | | | | | | | | | | | | | | | | | | |
Sales | | | 1,181.3 | | | | | | 3,270.4 | | | | — | | | | — | | | | — | | | | — | | | | 4,451.7 | |
Cost of sales | | | (950.3 | ) | | | | | (2,223.8 | ) | | | 107.8 | (A) | | | — | | | | — | | | | — | | | | (3,066.3 | ) |
| | | | | | | | | | | | | | | | | | | | | | | | | | | | | | |
Gross profit | | | 231.0 | | | | | | 1,046.6 | | | | 107.8 | | | | — | | | | — | | | | — | | | | 1,385.4 | |
Distribution costs | | | (137.1 | ) | | | | | (362.0 | ) | | | — | | | | — | | | | — | | | | — | | | | (499.1 | ) |
Administrative expenses | | | (217.3 | ) | | | | | (327.3 | ) | | | (88.2 | ) (A),(B) | | | — | | | | — | | | | (2.4 | ) (F) | | | (635.2 | ) |
Transaction costs | | | (78.2 | ) | | | | | (41.2 | ) | | | 118.8 | (B) | | | — | | | | — | | | | — | | | | (0.6 | ) |
Restructuring costs | | | (3.7 | ) | | | | | (10.0 | ) | | | — | | | | — | | | | — | | | | — | | | | (13.7 | ) |
Net gain on disposals and on the exit of businesses | | | — | | | | | | 6.3 | | | | — | | | | — | | | | — | | | | — | | | | 6.3 | |
Share of profit of associates | | | 1.0 | | | | | | 0.8 | | | | — | | | | — | | | | — | | | | — | | | | 1.8 | |
| | | | | | | | | | | | | | | | | | | | | | | | | | | | | | |
Operating (loss)/profit | | | (204.3 | ) | | | | | 313.2 | | | | 138.4 | | | | — | | | | — | | | | (2.4 | ) | | | 244.9 | |
| | | | | | | | | | | | | | | | | | | | | | | | | | | | | | |
| | | | | | | | |
Interest expense | | | (90.8 | ) | | | | | (71.4 | ) | | | — | | | | (208.7 | ) (C) | | | 10.0 | (D) | | | — | | | | (360.9 | ) |
Investment income | | | 18.7 | | | | | | 48.0 | | | | — | | | | — | | | | — | | | | — | | | | 66.7 | |
Other finance (expense)/income | | | (27.1 | ) | | | | | (2.7 | ) | | | 47.6 | (B) | | | — | | | | 7.5 | (E) | | | — | | | | 25.3 | |
Net finance (costs)/income | | | (99.2 | ) | | | | | (26.1 | ) | | | 47.6 | | | | (208.7 | ) | | | 17.5 | | | | — | | | | (268.9 | ) |
| | | | | | | | | | | | | | | | | | | | | | | | | | | | | | |
(Loss)/profit before tax | | | (303.5 | ) | | | | | 287.1 | | | | 186.0 | | | | (208.7 | ) | | | 17.5 | | | | (2.4 | ) | | | (24.0 | ) |
Income tax benefit/(expense) | | | 34.1 | | | | | | (62.5 | ) | | | (5.9 | ) (G) | | | 72.6 | (G) | | | — | | | | — | | | | 38.3 | |
| | | | | | | | | | | | | | | | | | | | | | | | | | | | | | |
(Loss)/profit for the period from continuing operations | | | (269.4 | ) | | | | | 224.6 | | | | 180.1 | | | | (136.1 | ) | | | 17.5 | | | | (2.4 | ) | | | 14.3 | |
| | | | | | | | | | | | | | | | | | | | | | | | | | | | | | |
| | | | | | | | |
Discontinued operation | | | | | | | | | | | | | | | | | | | | | | | | | | | | | | |
(Loss)/profit for the period from discontinued operations | | | (0.8 | ) | | | | | 19.0 | | | | (3.2 | ) (H) | | | — | | | | — | | | | — | | | | 15.0 | |
| | | | | | | | | | | | | | | | | | | | | | | | | | | | | | |
(Loss)/profit for the period | | | (270.2 | ) | | | | | 243.6 | | | | 176.9 | | | | (136.1 | ) | | | 17.5 | | | | (2.4 | ) | | | 29.3 | |
| | | | | | | | | | | | | | | | | | | | | | | | | | | | | | |
50
Pinafore Holdings B.V.
Item 5A
NOTES TO THE UNAUDITED PRO FORMA CONDENSED CONSOLIDATED INCOME STATEMENT
Adjustments relating to the Acquisition
(A) Acquisition accounting adjustments
We have adjusted for the effect on the unaudited pro forma financial information of certain of the acquisition accounting adjustments to the carrying amount of the identifiable assets and liabilities of Tomkins as at the effective date of the Acquisition as follows:
Cost of sales
Pro forma cost of sales for Fiscal 2010 has been increased by $31.2 million to reflect the additional depreciation expense that would have been recognized during 9M 2010 on the fair value uplift to the carrying amount of the property, plant and equipment held by Tomkins. The adjustment relating to the discontinued operation was $2.5 million in 9M 2010.
As a result of accounting for the Acquisition, the carrying amount of the inventory held by Tomkins was uplifted by $144.2 million, of which $7.7 million related to the discontinued operation. As this inventory was sold by our businesses during Q4 2010, the effect of the uplift was a non-recurring increase of $144.2 million to cost of sales during Q4 2010 which has therefore been reversed in arriving at pro forma cost of sales for Fiscal 2010.
| | | | |
| | | Pro forma
Fiscal 2010
$ million | |
Additional depreciation expense | | | (31.2 | ) |
Reversal of fair value uplift to inventory | | | 144.2 | |
| | | | |
Adjustment to cost of sales | | | 113.0 | |
| | | | |
| |
Continuing operations | | | 107.8 | |
Discontinued operation | | | 5.2 | |
| | | | |
| | | 113.0 | |
| | | | |
Administrative expenses
Pro forma administrative expenses for Fiscal 2010 have been increased by $108.2 million, of which $100.2 million relates to continuing operations and $7.4 million relates to the discontinued operation, principally to reflect the additional amortization expense that would have been recognized during 9M 2010 on the fair value uplift to the carrying amount of the identifiable intangible assets held by Tomkins on the date of the Acquisition.
(B) Costs relating to the Acquisition
Administrative expenses
During the third quarter of 2010, the Predecessor recognized an accelerated compensation expense of $12.6 million in its continuing operations and a further $0.9 million In its discontinued operation, in respect of the early vesting of certain of its employee share schemes as a consequence of the Acquisition. As there is no continuing impact on the Company, the additional compensation expense has been reversed as a pro forma adjustment in Fiscal 2010.
Transaction costs
Costs recognized by continuing operations in relation to the Acquisition during the second, third and fourth quarters of 2010 amounted to $118.8 million. In 9M 2010, a further $0.3 million of Acquisition-related transaction costs were recognized in the discontinued operation. As there is no continuing impact on the Company, all of these transaction costs have been reversed as pro forma adjustments in Fiscal 2010.
Other finance (expense)/income
During Q4 2010, the Successor recognized a currency translation loss of $47.6 million on the Acquisition due to the change in the rate of exchange between Sterling (in which the purchase consideration was denominated) and the US dollar (the functional currency of the acquiring entity) in the period between the effective date of the Acquisition and the payment of the consideration to the former shareholders in Tomkins. As there is no continuing impact on the Company, the currency translation loss has been reversed as a pro forma adjustment in Fiscal 2010.
Draw-down of new debt
(C) Additional interest expense
We have adjusted the pro forma financial information to reflect the interest expense that would have been recognized had the Second Lien Notes and the amounts drawn against the senior secured credit facilities as at December 31, 2010 been outstanding throughout Fiscal 2010.
We have calculated the additional interest expense on the Second Lien Notes using the effective interest rate method, based on the coupon rate of 9% and taking into account the deferred financing costs attributed to the Second Lien Notes.
Borrowings under the senior secured credit facilities bear interest at a floating rate, which can be either based on LIBOR plus an applicable margin or, at our option, based on a base rate as defined in the credit agreement plus an applicable margin. Both LIBOR and the base rate are subject to a floor.
We have calculated the additional interest expense on our senior secured credit facilities using the effective interest rate method, based on the amounts drawn against the facilities and the terms of the facilities as they existed as at December 31, 2010 and taking into account the deferred financing costs that were attributed to the amounts drawn under the facilities. We have not taken into account the effect on interest expense of the re-pricing of the senior secured credit facilities that became effective on February 17, 2011.
51
Pinafore Holdings B.V.
Item 5A
As at December 31, 2010, interest payable in relation to our borrowings under the senior secured credit facilities was based upon 3-month US$ LIBOR, which was 0.29% but was subject to a floor of 1.75%. Accordingly, the interest expense has been calculated as follows:
| • | | on the $296.0 million outstanding against the Term Loan A credit facility, based on interest payable at 6.00% per annum (LIBOR floor + the applicable margin of 4.25%) and the amortization of the commitment fee and other attributable financing costs over the 5-year term of the facility; |
| • | | on the $300 million revolving credit facility, fees totaling 4.50% per annum on the $40.3 million drawn by way of letters of credit, a commitment fee of 0.75% per annum on the unutilized portion of the facility which amounted to $259.7 million and the amortization of attributable deferred financing costs over the 5-year term of the facility; and |
| • | | on the $1,677.3 million outstanding against the Term Loan B credit facility, based on interest payable at 6.25% per annum (LIBOR floor + the applicable margin of 4.50%) and the amortization of the commitment fee and other attributable financing costs over the 6-year term of the facility. |
On inception of the senior secured credit facilities, the applicable prevailing market interest rates were lower than the floor which applied to LIBOR or the base rate as defined in the credit agreement. Consequently, the floor (an embedded interest rate derivative) was required to be separated from each of the host loan contracts. On inception of the facilities, the fair value of the embedded derivatives was a liability of $69.8 million. We recognized the embedded derivative as a separate liability in the Successor’s balance sheet and reduced by an equivalent amount the carrying amounts of the borrowings under the Term Loan A facility and the Term Loan B facility. We are amortizing to profit or loss the adjustments to the carrying amounts of the borrowings under the Term Loan A facility and the Term Loan B facility using the effective interest method over the respective terms of the facilities. We have adjusted the unaudited pro forma financial information to reflect the additional amortization of $14.8 million for Fiscal 2010 that would have been recognized had inception of the senior secured credit facilities occurred at the beginning of Fiscal 2010.
The pro forma adjustments to interest expense may be analysed as follows:
| | | | | | | | | | | | |
| | | Pro forma Fiscal 2010 | |
| | | Interest
Payable
$ million | | | Other
interest
expense
$ million | | | Total
$ million | |
Second Lien Notes | | | (78.8 | ) | | | (5.0 | ) | | | (83.8 | ) |
Term Loan A credit facility | | | (13.0 | ) | | | (3.5 | ) | | | (16.5 | ) |
Term Loan B credit facility | | | (78.4 | ) | | | (10.4 | ) | | | (88.8 | ) |
Revolving credit facility (including letters of credit) | | | — | | | | (4.8 | ) | | | (4.8 | ) |
Amortization of embedded derivatives | | | — | | | | (14.8 | ) | | | (14.8 | ) |
| | | | | | | | | | | | |
Adjustment to interest expense | | | (170.2 | ) | | | (38.5 | ) | | | (208.7 | ) |
| | | | | | | | | | | | |
Repayment of the Tomkins Debt
(D) Reduction of Interest Expense
Subsequent to the Acquisition, certain of the existing Tomkins debt was redeemed and/or replaced by the new debt. We have adjusted the pro forma financial information such that the interest expense has been reduced by the interest expense that was recognized during the relevant period on the Tomkins debt that was replaced by the Company debt subsequent to the Acquisition.
Repayment of Medium Term Notes
When it was acquired by the Company, Tomkins had £150 million of the 2011 Notes and £250 million of the 2015 Notes outstanding. Following the Acquisition, the principal amount outstanding on the 2011 Notes was reduced by £47.9 million to £102.1 million and the principal amount outstanding on the 2015 Notes was reduced by £232.8 million to £17.2 million.
Under the terms of the senior secured credit facilities, the Company was required to commence a tender offer to purchase the outstanding notes prior to the effective date of the Acquisition and, to the extent that any of the 2011 Notes remained outstanding 90 days after the effective date of the Acquisition, the Company was required to commence a further tender offer for all outstanding 2011 Notes.
On September 13, 2010, the Company made the first tender offer required under the senior secured credit facilities to purchase the outstanding 2011 Notes, at a price of 105.787%, and the outstanding 2015 Notes, at a price of 100.50%. Acceptances were received in respect of £40.9 million of the 2011 Notes and £109.3 million of the 2015 Notes. On October 6, 2010, the purchase was completed for total consideration of £153.1 million.
On November 19, 2010, the Company notified holders of the 2011 Notes and the 2015 Notes that the credit rating of the Medium Term Notes had been withdrawn by Moody’s and downgraded by Standard & Poor’s as a consequence of the Acquisition and that this constituted a put event under the terms of the Medium Term Notes entitling the holders to redeem the Medium Term Notes at par. Put notices were received in respect of £2.1 million of the 2011 Notes and £123.5 million of the 2015 Notes. Settlement took place on December 17, 2010 for total consideration of £125.6 million.
On December 30, 2010, the Company made the second tender offer required under the senior secured credit facilities to purchase the outstanding 2011 Notes, at a price of 105.00% (plus accrued and unpaid interest). Acceptances were received in respect of a further £4.9 million of the 2011 Notes. Settlement took place on January 19, 2011 for consideration of £5.1 million.
We have calculated the reduction in the interest expense due to the redemption of the 2011 Notes and the 2015 Notes using the effective interest rate method, taking into account the deferred financing costs that were attributed to the Medium Term Notes prior to the Acquisition and the fair value adjustments to the carrying amounts of the Medium Term Notes that were recognized on the effective date of the Acquisition.
52
Pinafore Holdings B.V.
Item 5A
Overall, therefore, we have reduced interest expense by $27.4 million in Fiscal 2010 on the assumption that the redemptions of the 2011 Notes and the 2015 Notes took place at the beginning of Fiscal 2010.
Sale of Interest Rate Swaps
Prior to the Acquisition, Tomkins held interest rate swaps to swap the interest payable on the 2011 Notes and the 2015 Notes from fixed to floating interest rates. On September 16, 2010, Tomkins sold these interest rate swaps in anticipation of the Events.
From the beginning of Fiscal 2010 to the date on which they were sold, the interest receivable under the fixed legs of the interest rate swaps exceeded the interest payable under the fixed legs of the interest rate swaps such that they had the effect of reducing the interest payable on the 2011 Notes and the 2015 Notes. We have therefore increased interest expense by $19.0 million in Fiscal 2010 on the assumption that the interest rate swaps were sold at the beginning of Fiscal 2010.
Letters of Credit
Prior to the Acquisition, Tomkins had a revolving credit facility that was replaced by the revolving credit facility provided under the senior secured credit facilities. During 9M 2010, Tomkins made no borrowings against the revolving credit facility but incurred fees in relation to letters of credit issued under the facility that amounted to $1.6 million. As the letters of credit were replaced by letters of credit issued under senior secured credit facilities, we have eliminated these fees from the interest expense recognized in the respective periods.
The pro forma adjustment to interest expense may be analysed as follows:
| | | | | | | | | | | | |
| | | Pro forma Fiscal 2010 | |
| | | Interest
$ million | | | Other
interest
expense
$ million | | | Total
$ million | |
2011 Notes | | | 4.8 | | | | 3.7 | | | | 8.5 | |
2015 Notes | | | 18.8 | | | | 0.1 | | | | 18.9 | |
Sale of interest rate swaps | | | (19.0 | ) | | | — | | | | (19.0 | ) |
Revolving credit facility (including letters of credit) | | | — | | | | 1.6 | | | | 1.6 | |
| | | | | | | | | | | | |
Adjustment to interest expense | | | 4.6 | | | | 5.4 | | | | 10.0 | |
| | | | | | | | | | | | |
(E) Adjustment to Other Finance (Expense)/Income
Hedge ineffectiveness
Prior to the Acquisition, Tomkins had as fair value hedges in relation to the 2011 Notes and the 2015 Notes the interest rate swaps that it held to swap the interest payable on the notes from fixed to floating interest rates. During 9M 2010, Tomkins recognized a net loss of $1.7 million in other finance (expense)/income because there was deemed to be ineffectiveness in the hedging relationship for accounting purposes. Included in this net loss was a net gain of $2.5 million in 6M 2010. We have eliminated these gains and losses from other finance (expense)/income because the interest rate swaps were sold by Tomkins in anticipation of the Events.
Currency translation losses
The 2011 Notes and the 2015 Notes and the interest rate swaps that were designated as fair value hedges in relation to them were denominated in Sterling. Translation of these items into the functional currency of the subsidiaries of the Company that hold them give rise to currency translation differences that are recognised in other finance (expense)/income. We have eliminated from other finance (expense)/income a net currency translation loss of $4.9 million in Fiscal 2010, which was attributable to the translation of the 2011 Notes and the 2015 Notes that were redeemed subsequent to the Acquisition and to the interest rate swaps that were sold by Tomkins in anticipation of the Events.
Loss on redemption of Medium Term Notes
We have eliminated from other finance (expense)/income the loss of $0.9 million that the Company recognized on the redemption of the 2011 Notes and the 2015 Notes subsequent to the Acquisition.
The pro forma adjustment to other finance (expense)/income may be analysed as follows:
| | | | |
| | | Fiscal 2010
$ million | |
Hedge ineffectiveness | | | 1.7 | |
Currency translation loss | | | 4.9 | |
Loss on redemption of notes | | | 0.9 | |
| | | | |
Adjustment to other finance (expense)/income | | | 7.5 | |
| | | | |
Other adjustments
(F) Management fees payable to the Sponsors
The Company is required to pay to the Sponsors annual management fees amounting to $3.0 million. Administrative expenses for Q4 2010 included an expense of $0.6 million in relation to these management fees. Additional expenses of $2.4 million in Fiscal 2010 have been recognized as pro forma adjustments such that the unaudited pro forma financial information reflects the annual management fees payable by the Company.
53
Pinafore Holdings B.V.
Item 5A
(G) Income tax adjustments
We have apportioned the pro forma adjustments to the tax jurisdictions in which they would have been recognized and we have tax effected them based on their effect on taxable income in the relevant jurisdiction using the applicable statutory tax rate. In particular, we have tax effected the pro forma adjustments that affect taxable income in the UK at the UK statutory tax rate of 28% and those that affect taxable income in the US at the US statutory tax rate that is applicable to the entity concerned of 37.5%.
(H) Discontinued operation
The impact of the pro forma adjustments on the discontinued operation may be summarized as follows:
| | | | |
$ in millions | | Fiscal 2010 | |
Cost of sales: | | | | |
– Additional depreciation expense | | | (2.5 | ) |
– Reversal of fair value uplift to inventory | | | 7.7 | |
| | | | |
| | | 5.2 | |
| |
Administration expenses: | | | | |
– Additional depreciation expense | | | (0.4 | ) |
– Additional amortization expense | | | (7.0 | ) |
– Accelerated compensation expense in respect of the early vesting of employee share schemes | | | 0.9 | |
| | | | |
| | | (6.5 | ) |
Transaction costs: | | | 0.3 | |
| | | | |
Adjustment to other finance (expense)/income | | | (1.0 | ) |
| | | | |
54
Pinafore Holdings B.V.
Item 5B
B. Liquidity and capital resources
Treasury responsibilities and philosophy
Our primary liquidity and capital resource needs are for working capital, debt service requirements, capital expenditure, facility expansions and acquisitions. We expect to finance our future cash requirements with cash on hand, cash flows from operations and, where necessary, borrowings under the revolving credit portion of our senior secured credit facilities. Prior to the Acquisition, our liquidity and capital resource needs were the same in nature but debt servicing requirements were substantially lower and capital expenditure was not subject to any limitation (from Fiscal 2011 onwards, capital expenditure is limited to $175 million per year under the senior secured credit facilities). We have historically relied on our cash flow from operations and various debt and equity financings for liquidity.
Our central treasury function is responsible for procuring our financial resources and maintaining an efficient capital structure, together with managing our liquidity, foreign exchange and interest rate exposures. All treasury operations are conducted within strict policies and guidelines that are approved by the Board. Compliance with those policies and guidelines is monitored by the regular reporting of treasury activities to the Board.
A key element of our treasury philosophy is that funding, interest rate and currency decisions and the location of cash and debt balances are determined independently from each other. Our borrowing requirements are met by raising funds in the most favorable markets. Management aims to retain a portion of net debt in the foreign currencies in which the net assets of our operations are denominated. The desired currency profile of net debt is achieved by entering into currency derivative contracts.
Management does not hedge the proportion of foreign operations effectively funded by shareholders’ equity. From time to time, we enter into currency derivative contracts to manage currency transaction exposures. Where necessary, the desired interest rate profile of net debt in each currency is achieved by entering into interest rate derivative contracts.
Our portfolio of cash and cash equivalents is managed such that there is no significant concentration of credit risk in any one bank or other financial institution. Management monitors closely the credit quality of the institutions with which it holds deposits. Similar considerations are given to our portfolio of derivative financial instruments.
Our borrowing facilities are monitored against forecast requirements and timely action is taken to put in place, renew or replace credit lines. Management’s policy is to reduce liquidity risk by diversifying our funding sources and by staggering the maturity of its borrowings. The Group has established long-term credit ratings of Ba3 Stable with Moody’s and BB- Stable with Standard & Poor’s. Credit ratings are subject to regular review by the credit rating agencies and may change in response to economic and commercial developments.
It is our policy to retain sufficient liquidity throughout the capital expenditure cycle to maintain our financial flexibility. We do not anticipate any material long-term deterioration in our overall liquidity position in the foreseeable future. Management believes that the current level of working capital is sufficient for the Group’s present requirements.
An analysis of our exposure to liquidity risk, credit risk and market risk is presented in note 34 to the Group’s consolidated financial statements presented elsewhere in this Annual Report.
Cash flow
Cash generated from operations was $611.0 million in Fiscal 2011 compared with $281.5 million in Fiscal 2010. Operating cash flow before movements in working capital was $635.4 million compared with $359.0 million in Fiscal 2010, an increase of $276.4 million that was due largely to a decrease in cash outflows on transaction costs relating business combinations, which were $0.6 million during Fiscal 2011 compared with $114.4 million in Fiscal 2010. The improvement in the Group’s profitability as measured by adjusted EBITDA contributed an additional $40.7 million to cash generated from operations compared with Fiscal 2010. Movements in working capital during Fiscal 2011 gave rise to a further improvement in cash generated from operations of $53.1 million compared with Fiscal 2010.
Cash outflow on restructurings was $43.7 million (Fiscal 2010: $29.1 million), net of proceeds on related asset sales of $14.7 million (Fiscal 2010: $24.1 million).
Gross capital expenditure was $116.2 million (Fiscal 2010: $155.9 million). Excluding the proceeds on asset sales arising from restructurings, net capital expenditure was $113.4 million (Fiscal 2010: $152.7 million).
As a result of the above, trading cash flow for Fiscal 2011 rose to $512.3 million compared with $152.9 million in Fiscal 2010.
During the year, the Group paid net cash interest of $213.2 million, up substantially from $58.8 million in Fiscal 2010 as a result of the additional borrowings that were used to finance the acquisition of Tomkins in September 2010, and made net cash tax payments of $89.1 million. Also during Fiscal 2011, cash dividends of $64.4 million were paid to minority shareholders (primarily Nitta Corporation), and $36.9 million of additional cash financing costs were incurred, primarily in relation to the re-pricing of Term Loan A and Term Loan B in February 2011.
These cash outflows were offset by an inflow of $475.7 million on disposal of businesses during Fiscal 2011, including Stackpole ($289.0 million) and Ideal ($158.7 million). The above net cash flows, in addition to the positive trading cash flow, resulted in a decrease in net debt during the year of $540.2 million.
55
Pinafore Holdings B.V.
Item 5B
The table below shows the movements in net debt:
| | | | | | | | | | | | | | |
| $ million | | SUCCESSOR | | | | | PREDECESSOR | |
| | | Fiscal 2011 | | | Q4 2010 | | | | | 9M 2010 | |
Opening net debt | | | (2,865.0 | ) | | | (138.1 | ) | | | | | (211.4 | ) |
| | | | | | | | | | | | | | |
| | | | |
Cash generated from operations | | | 611.0 | | | | 66.3 | | | | | | 215.2 | |
Capital expenditure | | | (116.2 | ) | | | (60.2 | ) | | | | | (95.7 | ) |
Disposal of property, plant and equipment | | | 17.5 | | | | 2.7 | | | | | | 24.6 | |
| | | | | | | | | | | | | | |
Trading cash flow | | | 512.3 | | | | 8.8 | | | | | | 144.1 | |
Income taxes paid (net) | | | (89.1 | ) | | | (20.9 | ) | | | | | (20.5 | ) |
Interest (net) | | | (213.2 | ) | | | (56.7 | ) | | | | | (2.1 | ) |
Financing costs paid | | | (36.9 | ) | | | (182.4 | ) | | | | | — | |
Ordinary dividends | | | — | | | | — | | | | | | (56.9 | ) |
Acquisitions and disposals (net) | | | 432.6 | | | | (4,531.5 | ) | | | | | (45.2 | ) |
Dividend paid to a minority shareholder in a subsidiary | | | (64.4 | ) | | | — | | | | | | (12.0 | ) |
Share movements | | | (0.3 | ) | | | 2,142.3 | | | | | | (0.7 | ) |
Settlement of interest rate swaps | | | — | | | | — | | | | | | 64.7 | |
Other movements | | | (4.3 | ) | | | 4.8 | | | | | | — | |
Foreign currency movements | | | 7.7 | | | | (46.4 | ) | | | | | 1.9 | |
| | | | | | | | | | | | | | |
Cash decrease/(increase) in net debt | | | 544.4 | | | | (2,682.0 | ) | | | | | 73.3 | |
| | | | | | | | | | | | | | |
| | | | |
Non-cash movements | | | (4.2 | ) | | | (44.9 | ) | | | | | — | |
| | | | | | | | | | | | | | |
| | | | |
Closing net debt | | | (2,324.8 | ) | | | (2,865.0 | ) | | | | | (138.1 | ) |
| | | | | | | | | | | | | | |
A reconciliation of the above table to the consolidated cash flow statement is presented under ‘Non-GAAP measures’.
Borrowings
As at December 31, 2011, the Group’s borrowings principally consisted of two term loans under the senior secured credit facilities and the Second Lien Notes that were used to finance the Acquisition.
The Group’s borrowings as at December 31, 2011 may be analyzed as follows:
| | | | | | | | | | | | | | | | |
| $ million | | Carrying amount | | | Principal amount | |
| | | As at
December 31,
2011 | | | As at
December 31,
2010 | | | As at
December 31,
2011 | | | As at
December 31,
2010 | |
Bank overdrafts | | | 5.5 | | | | 7.1 | | | | 5.5 | | | | 7.1 | |
| | | | | | | | | | | | | | | | |
Bank and other loans: | | | | | | | | | | | | | | | | |
– Secured | | | | | | | | | | | | | | | | |
Term Loan A | | | 223.4 | | | | 271.2 | | | | 238.1 | | | | 296.0 | |
Term Loan B | | | 1,398.3 | | | | 1,540.9 | | | | 1,503.7 | | | | 1,677.3 | |
Second Lien Notes | | | 994.4 | | | | 1,098.3 | | | | 1,035.0 | | | | 1,150.0 | |
| | | | | | | | | | | | | | | | |
| | | 2,616.1 | | | | 2,910.4 | | | | 2,776.8 | | | | 3,123.3 | |
| | | | | | | | | | | | | | | | |
– Unsecured | | | | | | | | | | | | | | | | |
2011 Notes | | | — | | | | 172.2 | | | | — | | | | 165.5 | |
2015 Notes | | | 20.8 | | | | 27.1 | | | | 20.4 | | | | 26.5 | |
Other borrowings | | | 17.2 | | | | 44.9 | | | | 17.2 | | | | 45.1 | |
| | | | | | | | | | | | | | | | |
| | | 38.0 | | | | 244.2 | | | | 37.6 | | | | 237.1 | |
| | | | | | | | | | | | | | | | |
| | | 2,659.6 | | | | 3,161.7 | | | | 2,819.9 | | | | 3,367.5 | |
| | | | | | | | | | | | | | | | |
Details of the Group’s borrowings together with a reconciliation of their carrying amount to their principal amount are presented in note 30 to the Group’s consolidated financial statements.
Re-pricing of Senior Secured Facilities
Borrowings under the senior secured credit facilities bear interest at a floating rate, which can be either LIBOR plus an applicable margin or, at the Group’s option, a base rate as defined in the credit agreement plus an applicable margin. LIBOR and the base rate are both subject to floors. On inception of the facilities, the applicable margin for the Term Loan B credit facility was 4.5% per annum for LIBOR and 3.5% per annum for base rate. The applicable margin for the Term Loan A credit facility and the revolving credit facility was between 3.75% and 4.25% per annum for LIBOR and 2.75% and 3.25% per annum for base rate depending on a total leverage to EBITDA ratio. LIBOR was subject to a 1.75% floor and base rate was subject to a 2.75% floor. Effective February 17, 2011, the Group agreed with the providers of the senior secured credit facilities a re-pricing of Term Loan A and Term Loan B and amendments to certain of the covenants attaching to the facilities. For both Term Loan A and Term Loan B the applicable margin for LIBOR was reduced to 3.0% per annum, with LIBOR being subject to a 1.25% floor, and the applicable margin for base rate was reduced to 2.0% per annum, with base rate being subject to a 2.25% floor. Management considered that the re-pricing did not cause a substantial change in the net present value of the expected future cash flows in relation to the facilities. Accordingly, the Group recognized neither a gain nor a loss on the re-pricing and recognized the associated costs of $23.4 million and the decrease of $18.1 million in the interest rate floor liability as adjustments to the carrying amounts of the borrowings outstanding under the facilities.
56
Pinafore Holdings B.V.
Item 5B
In addition, during the second quarter of 2011, the Group agreed with the providers of the senior secured credit facilities further amendments to the credit agreement, primarily an increase in the value of permitted prepayments of junior debt outstanding under other facilities. The costs of $3.2 million associated with these revisions were recognized as adjustments to the carrying amounts of the borrowings outstanding under the senior secured credit facilities.
Redemption of Second Lien Notes
In accordance with the terms of our Second Lien Notes, prior to October 1, 2013, but not more than once in any 12-month period, the Group may redeem up to 10% of the original aggregate principal amount of the Second Lien Notes at a redemption price of 103% of the principal amount plus accrued and unpaid interest up to but not including the redemption date. On August 3, 2011, we issued notice to the holders of the Second Lien Notes of our intention to exercise this call option for 2011 in full, which became effective on September 2, 2011. Accrued interest of $4.3 million was paid on the $115.0 million notes redeemed, and the redemption premium of $3.5 million has been recognized in other finance expense. As at December 31, 2011, the principal amount outstanding under the Second Lien Notes was $1,035.0 million (December 31, 2010: $1,150.0 million).
Prepayments using disposal proceeds
During Fiscal 2011, the Group disposed of its Stackpole, Dexter Chassis and Ideal businesses. Under the terms of the credit agreement, the net proceeds received on certain dispositions, as calculated under the credit agreement, must be offered to the providers of the senior secured credit facilities as a reduction to the debt outstanding under the term loans. In total, during Fiscal 2011, an amount of $29.6 million was repaid under Term Loan A and $157.5 million was repaid under Term Loan B to the providers that accepted the offers.
Borrowing headroom
As at December 31, 2011, the Group’s committed revolving credit facility of $300.0 million was undrawn for cash but there were letters of credit outstanding against the facility amounting to $66.1 million. Also, the Group had drawn $6.6 million against uncommitted borrowing facilities and had outstanding performance bonds, letters of credit and bank guarantees amounting to $39.6 million (in addition to those outstanding under the revolving credit facility).
Overall, therefore, the Group’s committed borrowing headroom was $187.7 million, in addition to cash balances of $497.7 million (including collateralized cash of $17.7 million).
Borrowing covenants
The Group is subject to covenants, representations and warranties in respect of the senior secured credit facilities including two principal financial covenants as defined in the credit agreement that were tested for the first time for the period ended December 31, 2010. Firstly, the ratio of ‘consolidated total debt’ to ‘consolidated EBITDA’ (the ‘total leverage ratio’) must not exceed 5.75 times (for the covenant test period ended December 31, 2011, the ratio was 3.72 times). Secondly, the ratio of ‘consolidated EBITDA’ to ‘consolidated net interest’ (the ‘interest coverage ratio’) must not be less than 1.95 times (for the covenant test period ended December 31, 2011, the ratio was 3.77 times).
Any future non-compliance with the borrowing covenants could, if not waived, constitute an event of default and may, in certain circumstances, lead to an acceleration of the maturity of borrowings drawn down and the inability to access committed facilities.
Seasonality of borrowings
We operate in a wide range of markets and geographic locations and, as a result, there is little seasonality in our borrowing requirements. Fluctuations in our borrowings are caused principally by the timing of capital expenditure and interest payments.
Cash balances
Our central treasury function is responsible for maximizing the return on surplus cash balances within the constraints of our liquidity and credit policy. We achieve this, where possible, by controlling directly all surplus cash balances and pooling arrangements on an ongoing basis and by reviewing the efficiency of all other cash balances across our businesses on a weekly basis. Our policy is to apply funds from one part of the Group to meet the obligations of another part wherever possible, in order to ensure maximum efficiency in the use of our funds. No material restrictions apply that limit the application of this policy.
We manage our cash balances such that there is no significant concentration of credit risk in any one bank or other financial institution. We monitor closely the quality of the institutions that hold our deposits. As at December 31, 2011 92% of our cash balances were held with institutions rated at least A-1 by Standard & Poor’s and P-1 by Moody’s.
As at December 31, 2011, our total cash and investments were $497.7 million (including collateralized cash and before interest accruals), compared with $506.3 million as at December 31, 2010, of which $420.8 million (December 31, 2010: $395.8 million) was interest-earning. All interest-earning deposits attract interest at floating rates. Of the total cash and investments balance, $256.0 million (December 31, 2010: $177.5 million) was invested in short-term deposits by our Treasury department, $17.7 million (December 31, 2010: $47.0 million) comprised collateralized cash, primarily $15.5 million (December 31, 2010: $44.9 million) held in escrow as security for the outstanding Loan Note Alternatives, $29.4 million of which were repaid during Fiscal 2011. A further $102.3 million (December 31, 2010: $158.7 million) of the total cash and investments balance was held in our non-wholly owned Asian subsidiaries, down compared with the prior year end primarily due to the payment in Fiscal 2011 of dividends of $64.4 million. The remaining $121.7 million (December 31, 2010: $123.1 million) of the total cash and investments balance was held in centrally-controlled pooling arrangements and with local operating companies. As at December 31, 2011, $283.8 million (December 31, 2010: $226.7 million) of our cash balance was under the direct control of the Group Treasury.
Interest earned on bank deposits during Fiscal 2011 was $3.6 million (Q4 2010: $1.3 million; 9M 2010: $2.4 million) and as at December 31, 2011, the weighted average interest rate on interest-earning cash balances was 0.5%.
57
Pinafore Holdings B.V.
Item 5B
Other Assets and Liabilities
Intangible Assets
Goodwill
As at December 31, 2011, the carrying amount of goodwill was $1,585.4 million (December 31, 2010: $1,745.4 million), in addition to $84.8 million (December 31, 2010: $nil) classified as assets held for sale in respect of the discontinued Sensors & Valves operating segment. The majority of the goodwill was recognized on the Acquisition in Fiscal 2010 and is principally attributable to expected future opportunities to increase sales and further enhance margins by further developing Tomkins’ product range and service capabilities (with an emphasis on the growing markets for energy-efficient and environmentally-friendly products), extending the Group’s global presence by further penetrating markets in the emerging economies, and by pursuing performance improvement initiatives. Of the goodwill recognized as at December 31, 2011, $1,494.4 million is allocated to I&A (of which $1,318.3 million is allocated to the Gates businesses) and $175.8 million is allocated to Building Products.
Further details on the accounting for Acquisition are provided in note 41 to the Group’s consolidated financial statements.
During Fiscal 2011, the Group transferred $120.3 million of goodwill to assets held for sale and recognized provisional goodwill of $21.8 million on the acquisition in October 2011 of Du-Tex, Inc. In light of the prolonged weakness of the US residential construction end market, the Group also recognized an impairment of $36.9 million in relation to Bathware, representing the entire goodwill allocated to this segment.
Other intangible assets
As at December 31, 2010, the carrying amount of other intangible assets was $2,268.5 million. During Fiscal 2011, we recognized additions of $7.8 million, primarily in respect of computer software, and incurred amortization of $156.2 million. As a result of the decision to dispose of a number of businesses during the second quarter of Fiscal 2011, intangible assets associated with those businesses of $176.1 million were transferred to assets held for sale. As at December 31, 2011, the carrying amount of other intangible assets was $1,931.2 million, in addition to $109.8 million of other intangible assets, relating to the discontinued Sensors & Valves operating segment, included in assets held for sale.
Property, plant and equipment
As at December 31, 2011, the carrying amount of property, plant and equipment was $902.9 million (December 31, 2010: $1,359.1 million), including $3.0 million (December 31, 2010: $4.2 million) held under finance leases. During Fiscal 2011, we recognized additions of $116.2 million and incurred a depreciation expense of $183.7 million.
Information on the number and geographic spread of our facilities is included inItem 4D‘Property, plant and equipment’.
Post-employment benefits
Pensions
We operate a number of defined benefit pension plans, principally in the UK and the US, of which most are funded. All of the plans are closed to new entrants. During Fiscal 2009, management closed the principal pension plans in North America to future service accrual and the deferred pension benefits accrued under them were frozen. As a result, most of our pension plans are now closed to future service accrual by current employees. Funded plans receive contributions from us and, where they remain eligible, current employees, at rates that are determined by independent actuaries taking into account any funding objectives prescribed by local legislation.
As at December 31, 2011, the present value of the benefit obligation was $1,136.4 million (December 31, 2010: $1,128.5 million). Excluding the effects of currency exchange rate changes, the obligation increased by $10.0 million during Fiscal 2011. As at December 31, 2011, the fair value of the plan assets was $1,134.7 million (December 31, 2010: $1,011.1 million). Excluding the effect of currency exchange rate changes, the plan assets increased by $126.3 million during Fiscal 2011, driven by actual returns on plan assets of $161.8 million, partially offset by $24.2 million of plan assets relating to businesses disposed of during the year. On an actuarial basis, the net deficit in the plan was $1.7 million (December 31, 2010: $117.4 million) but, for accounting purposes, we were unable to recognize surpluses on certain of the plans amounting to $64.6 million (December 31, 2010: $28.2 million). Accordingly, the net pension liability recognized in the Group’s consolidated financial statements was $66.3 million (December 31, 2010: $145.6 million), including $2.3 million (December 31, 2010: $nil) included in assets held for sale.
During Fiscal 2011, we contributed $65.5 million (Q4 2010: $11.9 million; 9M 2010: $32.1 million) to the defined benefit plans and expect to contribute approximately $35.5 million to them during 2012. Additionally, following negotiations during Q4 2010 with the trustees and regulatory authorities in connection with the Acquisition, we agreed to make one-off contributions amounting to $25.0 million to certain defined benefit pension plans in the US and the UK, of which $5.0 million was paid to the US plans during Q4 2010 and $20.0 million was paid to the UK plans in January 2011.
Management of the risks associated with our defined benefit pension plans is the responsibility of our treasury function. Our primary objective is to identify and manage the risks associated with both the assets and liabilities of the defined benefit pension plans and we continue to work with the trustees of our pension plans to improve the management of our defined benefit pension risks. The principal risks affecting the present value of the benefit obligation are: interest rate risk, inflation risk and mortality risk.
For some years, our US plans have hedged the interest rate risk implicit in their benefit obligations. As at December 31, 2011, the benefit obligation of the funded US plans amounted to $589.1 million, of which 94.3% was hedged using a combination of bonds and interest rate swaps with an average duration of 9.9 years.
For our business as a whole, we estimate that a 0.5% decrease in market interest rates would increase the benefit obligation by 3.5%, or $39.7 million. Only 7.4% of the benefit obligation of $1,136.4 million as at December 31, 2011 is exposed to future salary increases. We estimate that a 0.5% increase in the salary scale would increase the benefit obligation by $0.2 million.
Unless the benefit obligation is subject to a buy-out or buy-in, it is not practical to mitigate the effects of mortality risk. We estimate that if the average life expectancy of plan members increased by one year at age 65, the benefit obligation would increase by 2.4%, or $27.7 million.
58
Pinafore Holdings B.V.
Item 5B
Other benefits
We provide other post-employment benefits, principally health and life insurance cover, to certain of our employees in North America through a number of unfunded plans.
As at December 31, 2011, the liability recognized in respect of these plans was $126.4 million (December 31, 2010: $130.0 million). Excluding the effect of currency exchange rate changes, the liability decreased by $2.8 million during Fiscal 2011.
Benefits paid during Fiscal 2010 were $11.4 million (Q4 2010: $3.6 million; 9M 2010: $11.2 million).
Critical accounting estimates & judgments
Details of the Group’s significant accounting policies are set out in note 3 to the Group’s consolidated financial statements.
When applying the Group’s accounting policies, management must make assumptions, judgments and estimates concerning the future that affect the carrying amounts of assets and liabilities at the balance sheet date, the disclosure of contingencies that existed at the balance sheet date and the amounts of revenue and expenses recognized during the accounting period. Management makes these assumptions, estimates and judgments based on factors such as historical experience, the observance of trends in the industries in which the Group operates and information available from the Group’s customers and other outside sources. Due to the inherent uncertainty involved in making assumptions, estimates and judgments, the actual outcomes could be different. An analysis of the key sources of estimation uncertainty at the balance sheet date that have a significant risk of causing a material adjustment to the carrying amounts of the Group’s assets and liabilities within the next fiscal year is presented below.
Pension and other post-retirement benefits
The Group operates pension plans throughout the world, covering the majority of its employees. Pension benefits are provided by way of both defined contribution plans and defined benefit plans. The Group’s defined benefit pension plans are closed to new entrants. The Group also provides other post-employment benefits, principally health and life insurance cover, to certain of its employees in North America by way of unfunded defined benefit plans.
The Group accounts for post-employment benefits in accordance with IAS 19 ‘Employee Benefits’, whereby the cost of defined benefit plans is determined based on actuarial valuations of the plans that are carried out annually at the Group’s balance sheet date. The actuarial valuations are dependent on assumptions about the future that are made by management on the advice of independent qualified actuaries.
If actual experience differs from these assumptions, there could be a material change in the amounts recognized by the Group in respect of defined benefit plans in the next financial year.
As at December 31, 2011, the present value of the benefit obligation was $1,136.4 million. The benefit obligation is calculated using a number of assumptions including future salary increases, increases to pension benefits, mortality rates and, in the case of post-employment medical benefits, the expected rate of increase in medical costs. The present value of the benefit obligation is calculated by discounting the benefit obligation using market yields on high-quality corporate bonds at the balance sheet date. As at December 31, 2011, the fair value of the plan assets was $1,134.7 million.
The plan assets consist largely of listed securities and their fair values are subject to fluctuation in response to changes in market conditions.
Effects of changes in the actuarial assumptions underlying the benefit obligation, effects of changes in the discount rate applicable to the benefit obligation and effects of differences between the expected and actual return on the plan assets are classified as actuarial gains and losses and are recognized in other comprehensive income. During 2011, the Group recognized a net actuarial gain of $33.4 million. Further actuarial gains and losses will be recognized during the next financial year.
An analysis of the assumptions that will be used by management to determine the cost of defined benefit plans that will be recognized in profit or loss in the next financial year is presented in note 35 to the Group’s consolidated financial statements.
Impairment of non-current assets
Goodwill, other intangible assets and property, plant and equipment are tested for impairment whenever events or circumstances indicate that their carrying amounts might be impaired. Additionally, goodwill and other intangible assets that have indefinite useful lives are subject to an annual impairment test. Due to the nature of the Group’s operations, it is generally not possible to estimate the recoverable amount for individual long-lived assets and impairment tests are usually based on the value in use of the cash-generating unit (‘CGU’) or group of CGUs to which the asset belongs.
Value in use represents the net present value of the cash flows expected to arise from the relevant CGU or group of CGUs and its calculation requires management to estimate those cash flows and to apply a suitable discount rate to them.
Management bases the estimated cash flows of the CGU or group of CGUs on assumptions such as the future changes in sales volumes, future changes in selling prices, and future changes in material prices, salaries and other costs. Management determines a discount rate for each CGU or group of CGUs using a capital asset pricing model, which is based on variables including the applicable risk-free interest rates and, for determining the cost of equity, the long-term equity risk premium and the assumed share price volatility relative to the market and, for determining the cost of debt, the assumed credit risk spreads.
As at December 31, 2011, the carrying amount of long-lived assets was $4,419.5 million. Impairment losses may be recognized on these assets within the next financial year if there are adverse changes in the variables and assumptions underlying the estimated future cash flows of the CGUs or the discount rates that are applied to those cash flows. The sensitivity of the carrying amount of goodwill to the key assumptions underlying the value in use calculations is discussed in note 20 to the Group’s consolidated financial statements.
59
Pinafore Holdings B.V.
Item 5B
Inventory
Inventories are stated at the lower of cost and net realizable value, with due allowance for excess, obsolete or slow-moving items. Net realizable value is based on current assessments of future demand, market conditions and new product development initiatives. As at December 31, 2011, the carrying value of inventories was $571.7 million, net of allowances of $19.7 million. Should demand for the Group’s products decline during the next financial year, additional allowances may be necessary in respect of excess or slow-moving items.
Financial instruments
Derivative financial instruments are recognized as an asset or a liability measured at their fair value at the balance sheet date. The fair value of derivatives continually changes in response to changes in prevailing market conditions and applicable credit risk spreads.
Where permissible under IAS 39, the Group uses hedge accounting to mitigate the impact of changes in the fair value of derivatives on profit or loss but the Group’s results may be affected by changes in the fair values of derivatives where hedge accounting cannot be applied or due to hedge ineffectiveness.
Workers’ compensation
Provision is made for claims for compensation for injuries sustained by the Group’s employees while at work. The Group’s liability for claims made but not fully settled is calculated on an actuarial basis. Historical data trends are used to estimate the liability for unreported incidents. As at December 31, 2011, the workers’ compensation provision amounted to $18.9 million.
Further provision may be necessary within the next financial year if the actual cost of settling claims exceeds management’s estimates.
Environmental liabilities
Provision is made for the estimated cost of known environmental remediation obligations in relation to the Group’s current and former manufacturing facilities. Cost estimates include the expenditure expected to be incurred in the initial remediation effort and, where appropriate, in the long-term monitoring of the relevant sites. Management monitors for each remediation project the costs incurred to date against expected total costs to complete and operates procedures to identify possible remediation obligations that are presently unknown.
As at December 31, 2011, the provision for environmental remediation costs amounted to $10.4 million. Further provision may be necessary within the next financial year if actual remediation costs exceed expected costs, new remediation obligations are identified or there are changes in the circumstances affecting the Group’s legal or constructive remediation obligations.
Product warranties
Provision is made for the estimated cost of future warranty claims on the Group’s products. Management bases the provision on historical experience of the nature, frequency and average cost of warranty claims and takes into account recent trends that might suggest that the historical claims experience may differ from future claims. As at December 31, 2011, the Group’s provision for warranty claims amounted to $11.8 million. Further provision may be necessary within the next financial year if actual claims experience differs from management’s estimates.
Taxation
The Group is subject to income tax in most of the jurisdictions in which it operates. Management is required to exercise significant judgment in determining the Group’s provision for income taxes.
Estimation is required of taxable profit in order to determine the Group’s current tax liability. Management’s judgment is required in relation to uncertain tax positions whereby additional current tax may become payable in the future following the audit by the tax authorities of previously-filed tax returns. It is possible that the final outcome of these uncertain tax positions may differ from management’s estimates.
Estimation is also required of temporary differences between the carrying amount of assets and liabilities and their tax base. Deferred tax liabilities are recognized for all taxable temporary differences but, where there exist deductible temporary differences, management’s judgment is required as to whether a deferred tax asset should be recognized based on the availability of future taxable profits. As at December 31, 2011, the Group recognized net deferred tax liabilities amounting to $679.8 million. Deferred tax assets of $787.9 million were not recognized in respect of tax losses and tax credits carried forward. It is possible that the deferred tax assets actually recoverable may differ from the amounts recognized if actual taxable profits differ from management’s estimates.
As at December 31, 2011, the aggregate amount of temporary differences associated with investments in subsidiaries for which deferred tax liabilities have not been recognized was $1,421.5 million. Deferred tax liabilities have not been recognized on these temporary differences because the Group is able to control the timing of their reversal and it is not probable that they will reverse in the foreseeable future. Income tax may become payable on these temporary differences if circumstances change, for example upon the repatriation of assets from the subsidiaries concerned or on the sale or liquidation of one or more of them.
60
Pinafore Holdings B.V.
Item 5B
Accounting pronouncements not yet adopted
Recently-issued accounting pronouncements that may be relevant to the Group’s operations but have not yet been adopted are outlined below. None of these pronouncements has yet been endorsed for use in the European Union. Management has not yet completed its assessment of these pronouncements and is therefore not currently able to estimate reliably the impact of their adoption on the Group’s results or financial position.
IFRS 9‘Financial Instruments’
In November 2009, the IASB issued IFRS 9 which represents the first phase of its replacement of IAS 39 and introduces new requirements for the classification and measurement of financial assets and removes the need to separately account for certain embedded derivatives. IFRS 9 is effective for annual periods commencing on or after January 1, 2015. Early adoption is permitted, but the standard has not yet been endorsed for use in the European Union.
Suite of pronouncements on consolidation, joint arrangements and disclosures
In May 2011, the IASB issued the following four pronouncements on consolidation, joint arrangements and disclosures. These pronouncements, together with IAS 27 ‘Separate Financial Statements (revised 2011)’, which is not relevant to the Group’s consolidated financial statements, are effective for annual periods commencing on or after January 1, 2013. Early adoption is permitted, provided that all five pronouncements are adopted at the same time.
IAS 28 ‘Investments in Associates and Joint Ventures (2011)’
The revisions to the existing standard have been made largely to conform it with the changes arising from the issuance of IFRS 10 ‘Consolidated Financial Statements’and IFRS 11 ‘Joint Arrangements’, and to incorporate the accounting for joint ventures as prescribed by IFRS 11.
IFRS 10 ‘Consolidated Financial Statements’
This standard will require a parent to present consolidated financial statements as those of a single economic entity, replacing the requirements previously contained in IAS 27 ‘Consolidated and Separate Financial Statements’ and SIC-12 ‘Consolidation - Special Purpose Entities’. The standard identifies the principles of control and introduces a single consolidation model for all entities based on control, irrespective of the nature of the investee.
IFRS 11 ‘Joint Arrangements’
IFRS 11 replaces IAS 31 ‘Interests in Joint Ventures’ and requires a party to a joint arrangement to determine the type of joint arrangement in which it is involved by assessing its rights and obligations and then account for those rights and obligations accordingly. Joint arrangements are either joint operations (where the parties recognize their assets, liabilities, revenue and expenses in relation to their interest in the joint operation) or joint ventures (where the parties apply the equity method of accounting for its investment in accordance with IAS 28 ‘Investments in Associates and Joint Ventures (2011)’. The use of proportionate consolidation is no longer permitted.
IFRS 12 ‘Disclosure of Interests in Other Entities’
This standard requires extensive disclosure of information to enable users of financial statements to evaluate the nature of, and risks associated with, interests in other entities and the effects of those interests on its financial position, financial performance and cash flows. These disclosures would include significant judgments and assumptions (such as how control, joint control, significant influence has been determined), details of the structure of the group, risks associated with structured entities and the nature, extent and financial effects of interests in joint arrangements and associates.
IFRS 13 ‘Fair Value Measurement’
Also during May 2011, the IASB replaced the guidance on fair value measurement in existing IFRSs with a standard that establishes a single framework for fair value measurements required by other IFRSs. This IFRS defines fair value, provides guidance on how to determine fair value and requires disclosures about fair value measurements. With some exceptions, the standard requires entities to classify these measurements into the three-level ‘fair value hierarchy’ currently required for financial instruments based on the nature of the inputs. Entities are required to make various disclosures depending upon the use of the fair value measurement (e.g. whether it is recognized in the financial statements or merely disclosed) and the level in which it is classified.
IFRS 13 is effective for annual periods commencing on or after January 1, 2013 and is to be adopted prospectively from the adoption date, with early adoption permitted.
IAS 19 ‘Employee Benefits (2011)’
During June 2011, the IASB issued an amended version of IAS 19 ‘Employee Benefits’ with revised requirements for pensions and other post-retirement benefits and termination benefits. The key amendments include the elimination of the ‘corridor approach’ permitted by the existing IAS 19, requirements for the disaggregation of changes in the defined benefit plan obligations and plan assets into specific components, enhanced disclosures around defined benefit plans, and certain modifications to the accounting for termination benefits.
The amendments to IAS 19 are effective for annual periods commencing on or after January 1, 2013 and are to be adopted on retrospective basis from the adoption date (with certain exceptions), with early adoption permitted.
‘Presentation of Items of Other Comprehensive Income (Amendments to IAS 1)’
These amendments to IAS 1 ‘Presentation of Financial Statements’ revise the way in which OCI is presented. The amendments will require items presented in OCI (including the tax associated with such items) to be grouped based on whether or not they may subsequently be reclassified to profit or loss.
The amendments to IAS 1 are effective for annual periods commencing on or after July 1, 2012, with early adoption permitted.
61
Pinafore Holdings B.V.
Item 5B
Non-GAAP measures
EBITDA and adjusted EBITDA
EBITDA is a non-GAAP measure that represents profit or loss for the period before net finance costs, income taxes, depreciation and amortization. We present EBITDA because it is widely used by securities analysts, investors and other interested parties to evaluate the profitability of companies. EBITDA eliminates potential differences in performance caused by variations in capital structures (affecting net finance costs), tax positions (such as the availability of net operating losses against which to relieve taxable profits), the cost and age of tangible assets (affecting relative depreciation expense) and the extent to which intangible assets are identifiable (affecting relative amortization expense).
Adjusted EBITDA represents EBITDA before additional specific items that are considered to hinder comparison of the trading performance of our businesses either year-on-year or with other businesses. Adjusted EBITDA is the measure used by the Board to assess the trading performance of our businesses and is therefore the measure of segment profit that we present under IFRS. Adjusted EBITDA is also presented on a consolidated basis because management believes it is important to consider the Group’s profitability on a basis consistent with that of its operating segments. When presented on a consolidated basis, adjusted EBITDA is a non-GAAP measure. Management believes that adjusted EBITDA should, therefore, be made available to securities analysts, investors and other interested parties to assist in their assessment of the trading performance of our businesses.
During the periods under review, the items excluded from EBITDA in arriving at adjusted EBITDA were:
| • | | the effect on cost of sales of the uplift to the carrying amount of inventory held by Tomkins on its acquisition by the Group; |
| • | | the compensation expense in relation to share-based incentives; |
| • | | transaction costs incurred in relation to business combinations; |
| • | | impairments, comprising impairments of goodwill and material impairments of other assets; |
| • | | the net gain or loss on disposals and on the exit of businesses; and |
| • | | the gain recognized on amendments to certain post-employment benefit plans in North America. |
Differences exist among our businesses in the extent to which their employees receive share-based incentives. We therefore exclude from adjusted EBITDA the compensation expense in relation to share-based incentives in order to assess the relative trading performance of our businesses.
We exclude from adjusted EBITDA those acquisition-related costs that are required to be expensed in accordance with IFRS 3 (Revised 2008) ‘Business Combinations’ because we do not believe that they relate to the Group’s trading performance. Other items are excluded from adjusted EBITDA because they are individually or collectively material items that are not considered to be representative of the trading performance of our businesses. During the periods under review we excluded restructuring costs that reflect specific actions taken by management to improve the Group’s future profitability; the net gain or loss on disposals and on the exit of businesses; and impairments of goodwill and material impairments of other assets, representing the excess of their carrying amounts over the amounts that are expected to be recovered from them in the future.
EBITDA and adjusted EBITDA exclude items that can have a significant effect on the Group’s profit or loss and should, therefore, be used in conjunction with, not as substitutes for, profit or loss for the period. Management compensates for these limitations by separately monitoring profit or loss for the period.
For the avoidance of any confusion, the non-GAAP measures ‘EBITDA’ and ‘adjusted EBITDA’ differ in certain respects to ‘consolidated EBITDA’ as defined in the financial covenants attaching to the senior secured credit facilities.
The following table contains reconciliations of the profit for the period to adjusted EBITDA for Fiscal 2011, Q4 2010, 9M 2010 and Fiscal 2009:
| | | | | | | | | | | | | | | | | | |
| $ million | | SUCCESSOR | | | | | PREDECESSOR | |
| | | Fiscal 2011 | | | Q4 2010 | | | | | 9M 2010 | | | Fiscal 2009 | |
Profit/(loss) for the period | | | 57.2 | | | | (270.2 | ) | | | | | 243.6 | | | | 6.0 | |
(Profit)/loss for the period from discontinued operations | | | (37.6 | ) | | | 0.8 | | | | | | (19.0 | ) | | | 12.8 | |
| | | | | | | | | | | | | | | | | | |
Profit/(loss) for the period from continuing operations | | | 19.6 | | | | (269.4 | ) | | | | | 224.6 | | | | 18.8 | |
Income tax (benefit)/expense | | | (19.2 | ) | | | (34.1 | ) | | | | | 62.5 | | | | 25.1 | |
| | | | | | | | | | | | | | | | | | |
Profit/(loss) before tax | | | 0.4 | | | | (303.5 | ) | | | | | 287.1 | | | | 43.9 | |
Net finance costs | | | 272.5 | | | | 99.2 | | | | | | 26.1 | | | | 44.3 | |
| | | | | | | | | | | | | | | | | | |
Operating profit/(loss) | | | 272.9 | | | | (204.3 | ) | | | | | 313.2 | | | | 88.2 | |
Amortization | | | 150.4 | | | | 41.3 | | | | | | 16.2 | | | | 24.4 | |
Depreciation | | | 170.8 | | | | 47.5 | | | | | | 104.9 | | | | 148.4 | |
| | | | | | | | | | | | | | | | | | |
EBITDA | | | 594.1 | | | | (115.5 | ) | | | | | 434.3 | | | | 261.0 | |
Inventory uplift | | | — | | | | 136.5 | | | | | | | | | | — | |
Share-based incentives | | | 87.3 | | | | 70.9 | | | | | | 19.7 | | | | 10.4 | |
Transaction costs | | | 0.6 | | | | 78.2 | | | | | | 41.2 | | | | — | |
Impairments | | | 38.0 | | | | — | | | | | | — | | | | 73.0 | |
Restructuring costs | | | 40.2 | | | | 3.7 | | | | | | 10.0 | | | | 140.9 | |
Net gain on disposals and on the exit of businesses | | | (60.9 | ) | | | — | | | | | | (6.3 | ) | | | (0.2 | ) |
Gain on amendment of post-employment benefits | | | — | | | | — | | | | | | — | | | | (63.0 | ) |
| | | | | | | | | | | | | | | | | | |
Adjusted EBITDA | | | 699.3 | | | | 173.8 | | | | | | 498.9 | | | | 422.1 | |
| | | | | | | | | | | | | | | | | | |
62
Pinafore Holdings B.V.
Item 5B
The following tables contain reconciliations of the operating profit or loss to the adjusted EBITDA of each of the Group’s continuing operating segments and the discontinued operation for Fiscal 2011, Q4 2010, 9M 2010 and Fiscal 2009:
SUCCESSOR
Fiscal 2011
| | | | | | | | | | | | | | | | | | | | | | | | | | | | | | | | | | | | |
$ million | | Operating
profit/(loss) | | | Amortization | | | Depreciation | | | Share-based
incentives | | | Transaction
costs | | | Impairments | | | Restructuring
costs | | | (Gain)/loss
on disposals
and on the
exit of
businesses | | | Adjusted
EBITDA | |
Continuing segments | | | | | | | | | | | | | | | | | | | | | | | | | | | | | | | | | | | | |
Industrial & Automotive: | | | | | | | | | | | | | | | | | | | | | | | | | | | | | | | | | | | | |
– Gates North America | | | 158.2 | | | | 67.5 | | | | 43.9 | | | | 9.7 | | | | 0.2 | | | | 0.1 | | | | 26.8 | | | | (1.1 | ) | | | 305.3 | |
– Gates EMEA | | | 40.6 | | | | 24.2 | | | | 26.7 | | | | 1.3 | | | | — | | | | — | | | | 11.0 | | | | (0.4 | ) | | | 103.4 | |
– Gates APAC | | | 72.6 | | | | 28.0 | | | | 30.1 | | | | 0.5 | | | | — | | | | — | | | | 3.9 | | | | 0.1 | | | | 135.2 | |
– Gates South America | | | (9.2 | ) | | | 3.5 | | | | 7.7 | | | | — | | | | — | | | | — | | | | 2.5 | | | | — | | | | 4.5 | |
– Dexter | | | 25.1 | | | | 7.6 | | | | 7.0 | | | | 0.7 | | | | — | | | | — | | | | 0.2 | | | | (0.1 | ) | | | 40.5 | |
| | | | | | | | | | | | | | | | | | | | | | | | | | | | | | | | | | | | |
| | | 287.3 | | | | 130.8 | | | | 115.4 | | | | 12.2 | | | | 0.2 | | | | 0.1 | | | | 44.4 | | | | (1.5 | ) | | | 588.9 | |
| | | | | | | | | | | | | | | | | | | | | | | | | | | | | | | | | | | | |
Building Products: | | | | | | | | | | | | | | | | | | | | | | | | | | | | | | | | | | | | |
– Air Distribution | | | 50.2 | | | | 14.8 | | | | 29.7 | | | | 8.3 | | | | — | | | | — | | | | 1.2 | | | | — | | | | 104.2 | |
– Bathware | | | (51.5 | ) | | | 1.6 | | | | 7.6 | | | | 0.4 | | | | — | | | | 37.5 | | | | (0.1 | ) | | | — | | | | (4.5 | ) |
| | | | | | | | | | | | | | | | | | | | | | | | | | | | | | | | | | | | |
| | | (1.3 | ) | | | 16.4 | | | | 37.3 | | | | 8.7 | | | | — | | | | 37.5 | | | | 1.1 | | | | — | | | | 99.7 | |
| | | | | | | | | | | | | | | | | | | | | | | | | | | | | | | | | | | | |
Corporate | | | (102.5 | ) | | | 0.4 | | | | 0.4 | | | | 66.1 | | | | 0.4 | | | | — | | | | 4.1 | | | | (4.8 | ) | | | (35.9 | ) |
| | | | | | | | | | | | | | | | | | | | | | | | | | | | | | | | | | | | |
Total ongoing | | | 183.5 | | | | 147.6 | | | | 153.1 | | | | 87.0 | | | | 0.6 | | | | 37.6 | | | | 49.6 | | | | (6.3 | ) | | | 652.7 | |
| | | | | | | | | | | | | | | | | | | | | | | | | | | | | | | | | | | | |
| | | | | | | | | |
Exited segments | | | | | | | | | | | | | | | | | | | | | | | | | | | | | | | | | | | | |
Industrial & Automotive: | | | | | | | | | | | | | | | | | | | | | | | | | | | | | | | | | | | | |
– Powertrain | | | 21.5 | | | | 1.6 | | | | 14.7 | | | | — | | | | — | | | | — | | | | (9.7 | ) | | | — | | | | 28.1 | |
– Other I&A | | | 69.5 | | | | 1.2 | | | | 3.0 | | | | 0.3 | | | | — | | | | — | | | | (0.1 | ) | | | (54.6 | ) | | | 19.3 | |
| | | | | | | | | | | | | | | | | | | | | | | | | | | | | | | | | | | | |
| | | 91.0 | | | | 2.8 | | | | 17.7 | | | | 0.3 | | | | — | | | | — | | | | (9.8 | ) | | | (54.6 | ) | | | 47.4 | |
Building Products: | | | | | | | | | | | | | | | | | | | | | | | | | | | | | | | | | | | | |
– Doors & Windows | | | (1.6 | ) | | | — | | | | — | | | | — | | | | — | | | | 0.4 | | | | 0.4 | | | | — | | | | (0.8 | ) |
| | | | | | | | | | | | | | | | | | | | | | | | | | | | | | | | | | | | |
Total exited | | | 89.4 | | | | 2.8 | | | | 17.7 | | | | 0.3 | | | | — | | | | 0.4 | | | | (9.4 | ) | | | (54.6 | ) | | | 46.6 | |
| | | | | | | | | | | | | | | | | | | | | | | | | | | | | | | | | | | | |
Total continuing operations | | | 272.9 | | | | 150.4 | | | | 170.8 | | | | 87.3 | | | | 0.6 | | | | 38.0 | | | | 40.2 | | | | (60.9 | ) | | | 699.3 | |
| | | | | | | | | | | | | | | | | | | | | | | | | | | | | | | | | | | | |
| | | | | | | | | |
Discontinued operation | | | 54.3 | | | | 5.8 | | | | 12.9 | | | | 1.5 | | | | — | | | | 1.5 | | | | — | | | | — | | | | 76.0 | |
| | | | | | | | | | | | | | | | | | | | | | | | | | | | | | | | | | | | |
Total Group operations | | | 327.2 | | | | 156.2 | | | | 183.7 | | | | 88.8 | | | | 0.6 | | | | 39.5 | | | | 40.2 | | | | (60.9 | ) | | | 775.3 | |
| | | | | | | | | | | | | | | | | | | | | | | | | | | | | | | | | | | | |
63
Pinafore Holdings B.V.
Item 5B
Pro forma Fiscal 2010*
| | | | | | | | | | | | | | | | | | | | | | | | | | | | | | | | |
$ million | | Operating
profit/(loss) | | | Amortization | | | Depreciation | | | Share-based
incentives | | | Transaction
costs | | | Restructuring
costs | | | (Gain)/loss on
disposals and
on the exit of
businesses | | | Adjusted
EBITDA | |
Continuing segments | | | | | | | | | | | | | | | | | | | | | | | | | | | | | | | | |
Industrial & Automotive: | | | | | | | | | | | | | | | | | | | | | | | | | | | | | | | | |
– Gates North America | | | 158.2 | | | | 71.7 | | | | 41.3 | | | | 12.8 | | | | 0.1 | | | | 2.4 | | | | (6.0 | ) | | | 280.5 | |
– Gates EMEA | | | 10.7 | | | | 23.6 | | | | 31.0 | | | | 3.8 | | | | — | | | | 3.0 | | | | 1.7 | | | | 73.8 | |
– Gates APAC | | | 74.1 | | | | 26.4 | | | | 27.9 | | | | 2.6 | | | | 0.2 | | | | — | | | | — | | | | 131.2 | |
– Gates South America | | | 7.1 | | | | 3.4 | | | | 8.3 | | | | 0.5 | | | | — | | | | — | | | | — | | | | 19.3 | |
– Dexter | | | 21.3 | | | | 7.8 | | | | 7.7 | | | | 1.5 | | | | — | | | | 0.4 | | | | — | | | | 38.7 | |
| | | | | | | | | | | | | | | | | | | | | | | | | | | | | | | | |
| | | 271.4 | | | | 132.9 | | | | 116.2 | | | | 21.2 | | | | 0.3 | | | | 5.8 | | | | (4.3 | ) | | | 543.5 | |
| | | | | | | | | | | | | | | | | | | | | | | | | | | | | | | | |
Building Products: | | | | | | | | | | | | | | | | | | | | | | | | | | | | | | | | |
– Air Distribution | | | 47.2 | | | | 13.7 | | | | 32.2 | | | | 7.6 | | | | 0.3 | | | | 1.7 | | | | 0.8 | | | | 103.5 | |
– Bathware | | | (11.0 | ) | | | 1.9 | | | | 8.8 | | | | 0.5 | | | | — | | | | 0.1 | | | | (3.2 | ) | | | (2.9 | ) |
| | | | | | | | | | | | | | | | | | | | | | | | | | | | | | | | |
| | | 36.2 | | | | 15.6 | | | | 41.0 | | | | 8.1 | | | | 0.3 | | | | 1.8 | | | | (2.4 | ) | | | 100.6 | |
| | | | | | | | | | | | | | | | | | | | | | | | | | | | | | | | |
Corporate | | | (87.4 | ) | | | 0.2 | | | | 0.2 | | | | 48.4 | | | | — | | | | 2.0 | | | | 2.3 | | | | (34.3 | ) |
| | | | | | | | | | | | | | | | | | | | | | | | | | | | | | | | |
Total ongoing | | | 220.2 | | | | 148.7 | | | | 157.4 | | | | 77.7 | | | | 0.6 | | | | 9.6 | | | | (4.4 | ) | | | 609.8 | |
| | | | | | | | | | | | | | | | | | | | | | | | | | | | | | | | |
| | | | | | | | |
Exited segments | | | | | | | | | | | | | | | | | | | | | | | | | | | | | | | | |
Industrial & Automotive: | | | | | | | | | | | | | | | | | | | | | | | | | | | | | | | | |
– Powertrain | | | 12.4 | | | | 3.2 | | | | 20.5 | | | | — | | | | — | | | | 4.8 | | | | — | | | | 40.9 | |
– Other I&A | | | 9.7 | | | | 2.3 | | | | 8.0 | | | | 0.3 | | | | — | | | | 0.9 | | | | — | | | | 21.2 | |
| | | | | | | | | | | | | | | | | | | | | | | | | | | | | | | | |
| | | 22.1 | | | | 5.5 | | | | 28.5 | | | | 0.3 | | | | — | | | | 5.7 | | | | — | | | | 62.1 | |
Building Products: | | | | | | | | | | | | | | | | | | | | | | | | | | | | | | | | |
– Doors & Windows | | | 2.6 | | | | — | | | | — | | | | — | | | | — | | | | (1.6 | ) | | | (1.9 | ) | | | (0.9 | ) |
| | | | | | | | | | | | | | | | | | | | | | | | | | | | | | | | |
Total exited | | | 24.7 | | | | 5.5 | | | | 28.5 | | | | 0.3 | | | | — | | | | 4.1 | | | | (1.9 | ) | | | 61.2 | |
| | | | | | | | | | | | | | | | | | | | | | | | | | | | | | | | |
Total continuing operations | | | 244.9 | | | | 154.2 | | | | 185.9 | | | | 78.0 | | | | 0.6 | | | | 13.7 | | | | (6.3 | ) | | | 671.0 | |
| | | | | | | | | | | | | | | | | | | | | | | | | | | | | | | | |
| | | | | | | | |
Discontinued operation | | | 26.2 | | | | 10.7 | | | | 24.6 | | | | 2.1 | | | | — | | | | (1.7 | ) | | | — | | | | 61.9 | |
| | | | | | | | | | | | | | | | | | | | | | | | | | | | | | | | |
Total Group operations | | | 271.1 | | | | 164.9 | | | | 210.5 | | | | 80.1 | | | | 0.6 | | | | 12.0 | | | | (6.3 | ) | | | 732.9 | |
| | | | | | | | | | | | | | | | | | | | | | | | | | | | | | | | |
| * | Re-presented (see note 5A to the Group’s consolidated financial statements) |
64
Pinafore Holdings B.V.
Item 5B
Q4 2010*
| | | | | | | | | | | | | | | | | | | | | | | | | | | | | | | | |
$ million | | Operating
(loss)/profit | | | Amortization | | | Depreciation | | | Share-based
incentives | | | Transaction
costs | | | Inventory uplift | | | Restructuring
costs | | | Adjusted
EBITDA | |
Continuing segments | | | | | | | | | | | | | | | | | | | | | | | | | | | | | | | | |
Industrial & Automotive: | | | | | | | | | | | | | | | | | | | | | | | | | | | | | | | | |
– Gates North America | | | (21.4 | ) | | | 19.2 | | | | 10.4 | | | | 11.3 | | | | — | | | | 52.5 | | | | (0.9 | ) | | | 71.1 | |
– Gates EMEA | | | (30.9 | ) | | | 6.1 | | | | 7.9 | | | | 3.7 | | | | — | | | | 33.7 | | | | (1.3 | ) | | | 19.2 | |
– Gates APAC | | | (8.8 | ) | | | 7.2 | | | | 7.4 | | | | 2.5 | | | | — | | | | 29.1 | | | | — | | | | 37.4 | |
– Gates South America | | | (6.1 | ) | | | 0.9 | | | | 2.1 | | | | 0.6 | | | | — | | | | 5.6 | | | | — | | | | 3.1 | |
– Dexter | | | 0.7 | | | | 2.1 | | | | 1.9 | | | | 1.2 | | | | — | | | | 1.5 | | | | 0.1 | | | | 7.5 | |
| | | | | | | | | | | | | | | | | | | | | | | | | | | | | | | | |
| | | (66.5 | ) | | | 35.5 | | | | 29.7 | | | | 19.3 | | | | — | | | | 122.4 | | | | (2.1 | ) | | | 138.3 | |
| | | | | | | | | | | | | | | | | | | | | | | | | | | | | | | | |
Building Products: | | | | | | | | | | | | | | | | | | | | | | | | | | | | | | | | |
– Air Distribution | | | (5.0 | ) | | | 3.8 | | | | 8.2 | | | | 6.3 | | | | — | | | | 9.3 | | | | — | | | | 22.6 | |
– Bathware | | | (4.4 | ) | | | 0.5 | | | | 2.1 | | | | 0.4 | | | | — | | | | 0.2 | | | | — | | | | (1.2 | ) |
| | | | | | | | | | | | | | | | | | | | | | | | | | | | | | | | |
| | | (9.4 | ) | | | 4.3 | | | | 10.3 | | | | 6.7 | | | | — | | | | 9.5 | | | | — | | | | 21.4 | |
| | | | | | | | | | | | | | | | | | | | | | | | | | | | | | | | |
Corporate | | | (131.0 | ) | | | — | | | | — | | | | 44.7 | | | | 78.2 | | | | — | | | | 2.0 | | | | (6.1 | ) |
| | | | | | | | | | | | | | | | | | | | | | | | | | | | | | | | |
Total ongoing | | | (206.9 | ) | | | 39.8 | | | | 40.0 | | | | 70.7 | | | | 78.2 | | | | 131.9 | | | | (0.1 | ) | | | 153.6 | |
| | | | | | | | | | | | | | | | | | | | | | | | | | | | | | | | |
| | | | | | | | |
Exited segments | | | | | | | | | | | | | | | | | | | | | | | | | | | | | | | | |
Industrial & Automotive: | | | | | | | | | | | | | | | | | | | | | | | | | | | | | | | | |
– Powertrain | | | 5.0 | | | | 0.8 | | | | 5.5 | | | | — | | | | — | | | | 1.3 | | | | 3.2 | | | | 15.8 | |
– Other I&A | | | (1.7 | ) | | | 0.7 | | | | 2.0 | | | | 0.2 | | | | — | | | | 3.3 | | | | 0.1 | | | | 4.6 | |
| | | | | | | | | | | | | | | | | | | | | | | | | | | | | | | | |
| | | 3.3 | | | | 1.5 | | | | 7.5 | | | | 0.2 | | | | — | | | | 4.6 | | | | 3.3 | | | | 20.4 | |
Building Products: | | | | | | | | | | | | | | | | | | | | | | | | | | | | | | | | |
– Doors & Windows | | | (0.7 | ) | | | — | | | | — | | | | — | | | | — | | | | — | | | | 0.5 | | | | (0.2 | ) |
| | | | | | | | | | | | | | | | | | | | | | | | | | | | | | | | |
Total exited | | | 2.6 | | | | 1.5 | | | | 7.5 | | | | 0.2 | | | | — | | | | 4.6 | | | | 3.8 | | | | 20.2 | |
| | | | | | | | | | | | | | | | | | | | | | | | | | | | | | | | |
Total continuing operations | | | (204.3 | ) | | | 41.3 | | | | 47.5 | | | | 70.9 | | | | 78.2 | | | | 136.5 | | | | 3.7 | | | | 173.8 | |
| | | | | | | | | | | | | | | | | | | | | | | | | | | | | | | | |
| | | | | | | | |
Discontinued operation | | | 0.5 | | | | 2.9 | | | | 6.5 | | | | 1.5 | | | | — | | | | 7.7 | | | | (1.7 | ) | | | 17.4 | |
| | | | | | | | | | | | | | | | | | | | | | | | | | | | | | | | |
Total Group operations | | | (203.8 | ) | | | 44.2 | | | | 54.0 | | | | 72.4 | | | | 78.2 | | | | 144.2 | | | | 2.0 | | | | 191.2 | |
| | | | | | | | | | | | | | | | | | | | | | | | | | | | | | | | |
| * | Re-presented (see note 5A to the Group’s consolidated financial statements) |
65
Pinafore Holdings B.V.
Item 5B
PREDECESSOR
9M 2010
| | | | | | | | | | | | | | | | | | | | | | | | | | | | | | | | |
$ million | | Operating
profit/(loss) | | | Amortization | | | Depreciation | | | Share-based
incentives | | | Transaction
costs | | | Restructuring
costs | | | (Gain)/loss on
disposals and
on the exit of
businesses | | | Adjusted
EBITDA | |
Continuing segments | | | | | | | | | | | | | | | | | | | | | | | | | | | | | | | | |
Industrial & Automotive: | | | | | | | | | | | | | | | | | | | | | | | | | | | | | | | | |
– Gates North America | | | 180.9 | | | | 4.7 | | | | 23.2 | | | | 3.1 | | | | 0.1 | | | | 3.3 | | | | (6.0 | ) | | | 209.3 | |
– Gates EMEA | | | 27.9 | | | | 2.0 | | | | 16.7 | | | | 1.0 | | | | 0.8 | | | | 4.3 | | | | 1.7 | | | | 54.4 | |
– Gates APAC | | | 74.4 | | | | 3.7 | | | | 15.2 | | | | 0.3 | | | | 0.2 | | | | — | | | | — | | | | 93.8 | |
– Gates South America | | | 12.9 | | | | 0.1 | | | | 3.0 | | | | 0.2 | | | | — | | | | — | | | | — | | | | 16.2 | |
– Dexter | | | 25.6 | | | | 0.3 | | | | 4.6 | | | | 0.4 | | | | — | | | | 0.3 | | | | — | | | | 31.2 | |
| | | | | | | | | | | | | | | | | | | | | | | | | | | | | | | | |
| | | 321.7 | | | | 10.8 | | | | 62.7 | | | | 5.0 | | | | 1.1 | | | | 7.9 | | | | (4.3 | ) | | | 404.9 | |
| | | | | | | | | | | | | | | | | | | | | | | | | | | | | | | | |
Building Products: | | | | | | | | | | | | | | | | | | | | | | | | | | | | | | | | |
– Air Distribution | | | 51.8 | | | | 4.7 | | | | 17.2 | | | | 3.2 | | | | 1.1 | | | | 1.7 | | | | 0.8 | | | | 80.5 | |
– Bathware | | | (4.1 | ) | | | — | | | | 5.3 | | | | 0.2 | | | | — | | | | 0.1 | | | | (3.2 | ) | | | (1.7 | ) |
| | | | | | | | | | | | | | | | | | | | | | | | | | | | | | | | |
| | | 47.7 | | | | 4.7 | | | | 22.5 | | | | 3.4 | | | | 1.1 | | | | 1.8 | | | | (2.4 | ) | | | 78.8 | |
| | | | | | | | | | | | | | | | | | | | | | | | | | | | | | | | |
Corporate | | | (78.6 | ) | | | 0.2 | | | | 0.2 | | | | 11.1 | | | | 39.0 | | | | — | | | | 2.3 | | | | (25.8 | ) |
| | | | | | | | | | | | | | | | | | | | | | | | | | | | | | | | |
Total ongoing | | | 290.8 | | | | 15.7 | | | | 85.4 | | | | 19.5 | | | | 41.2 | | | | 9.7 | | | | (4.4 | ) | | | 457.9 | |
| | | | | | | | | | | | | | | | | | | | | | | | | | | | | | | | |
| | | | | | | | |
Exited segments | | | | | | | | | | | | | | | | | | | | | | | | | | | | | | | | |
Industrial & Automotive: | | | | | | | | | | | | | | | | | | | | | | | | | | | | | | | | |
– Powertrain | | | 8.8 | | | | — | | | | 14.7 | | | | — | | | | — | | | | 1.6 | | | | — | | | | 25.1 | |
– Other I&A | | | 10.3 | | | | 0.5 | | | | 4.8 | | | | 0.2 | | | | — | | | | 0.8 | | | | — | | | | 16.6 | |
| | | | | | | | | | | | | | | | | | | | | | | | | | | | | | | | |
| | | 19.1 | | | | 0.5 | | | | 19.5 | | | | 0.2 | | | | — | | | | 2.4 | | | | — | | | | 41.7 | |
Building Products: | | | | | | | | | | | | | | | | | | | | | | | | | | | | | | | | |
– Doors & Windows | | | 3.3 | | | | — | | | | — | | | | — | | | | — | | | | (2.1 | ) | | | (1.9 | ) | | | (0.7 | ) |
| | | | | | | | | | | | | | | | | | | | | | | | | | | | | | | | |
Total exited | | | 22.4 | | | | 0.5 | | | | 19.5 | | | | 0.2 | | | | — | | | | 0.3 | | | | (1.9 | ) | | | 41.0 | |
| | | | | | | | | | | | | | | | | | | | | | | | | | | | | | | | |
Total continuing operations | | | 313.2 | | | | 16.2 | | | | 104.9 | | | | 19.7 | | | | 41.2 | | | | 10.0 | | | | (6.3 | ) | | | 498.9 | |
| | | | | | | | | | | | | | | | | | | | | | | | | | | | | | | | |
| | | | | | | | |
Discontinued operation | | | 26.7 | | | | 0.8 | | | | 15.2 | | | | 1.5 | | | | 0.3 | | | | — | | | | — | | | | 44.5 | |
| | | | | | | | | | | | | | | | | | | | | | | | | | | | | | | | |
Total Group operations | | | 339.9 | | | | 17.0 | | | | 120.1 | | | | 21.2 | | | | 41.5 | | | | 10.0 | | | | (6.3 | ) | | | 543.4 | |
| | | | | | | | | | | | | | | | | | | | | | | | | | | | | | | | |
| * | Re-presented (see note 5A to the Group’s consolidated financial statements) |
66
Pinafore Holdings B.V.
Item 5B
Fiscal 2009*
| | | | | | | | | | | | | | | | | | | | | | | | | | | | | | | | | | | | |
$ million | | Operating
profit/(loss) | | | Amortization | | | Depreciation | | | Share-based
incentives | | | Gain on
amendment
of post-
employment
benefits | | | Impairments | | | Restructuring
costs | | | Loss/(gain)
on disposals
and on the
exit of
businesses | | | Adjusted
EBITDA | |
Continuing segments | | | | | | | | | | | | | | | | | | | | | | | | | | | | | | | | | | | | |
Industrial & Automotive: | | | | | | | | | | | | | | | | | | | | | | | | | | | | | | | | | | | | |
– Gates North America | | | 125.8 | | | | 8.0 | | | | 34.6 | | | | 1.0 | | | | (58.7 | ) | | | 17.8 | | | | 24.8 | | | | — | | | | 153.3 | |
– Gates EMEA | | | (39.9 | ) | | | 2.4 | | | | 25.1 | | | | 1.3 | | | | — | | | | 10.9 | | | | 54.2 | | | | — | | | | 54.0 | |
– Gates APAC | | | 53.3 | | | | 5.2 | | | | 17.3 | | | | 0.1 | | | | — | | | | 2.7 | | | | 0.9 | | | | — | | | | 79.5 | |
– Gates South America | | | 8.6 | | | | 0.1 | | | | 4.8 | | | | 0.3 | | | | — | | | | 0.5 | | | | 0.1 | | | | — | | | | 14.4 | |
– Dexter | | | 18.3 | | | | 0.4 | | | | 6.9 | | | | 0.2 | | | | — | | | | 0.2 | | | | 2.2 | | | | — | | | | 28.2 | |
| | | | | | | | | | | | | | | | | | | | | | | | | | | | | | | | | | | | |
| | | 166.1 | | | | 16.1 | | | | 88.7 | | | | 2.9 | | | | (58.7 | ) | | | 32.1 | | | | 82.2 | | | | — | | | | 329.4 | |
| | | | | | | | | | | | | | | | | | | | | | | | | | | | | | | | | | | | |
Building Products: | | | | | | | | | | | | | | | | | | | | | | | | | | | | | | | | | | | | |
– Air Distribution | | | 48.2 | | | | 7.2 | | | | 24.7 | | | | 1.8 | | | | — | | | | 18.6 | | | | 5.1 | | | | — | | | | 105.6 | |
– Bathware | | | (12.8 | ) | | | 0.1 | | | | 8.3 | | | | 0.2 | | | | — | | | | 2.5 | | | | 1.6 | | | | — | | | | (0.1 | ) |
| | | | | | | | | | | | | | | | | | | | | | | | | | | | | | | | | | | | |
| | | 35.4 | | | | 7.3 | | | | 33.0 | | | | 2.0 | | | | — | | | | 21.1 | | | | 6.7 | | | | — | | | | 105.5 | |
| | | | | | | | | | | | | | | | | | | | | | | | | | | | | | | | | | | | |
Corporate | | | (48.2 | ) | | | 0.2 | | | | 0.2 | | | | 5.2 | | | | (0.2 | ) | | | 15.5 | | | | 0.5 | | | | 0.1 | | | | (26.7 | ) |
| | | | | | | | | | | | | | | | | | | | | | | | | | | | | | | | | | | | |
Total ongoing | | | 153.3 | | | | 23.6 | | | | 121.9 | | | | 10.1 | | | | (58.9 | ) | | | 68.7 | | | | 89.4 | | | | 0.1 | | | | 408.2 | |
| | | | | | | | | | | | | | | | | | | | | | | | | | | | | | | | | | | | |
| | | | | | | | | |
Exited segments | | | | | | | | | | | | | | | | | | | | | | | | | | | | | | | | | | | | |
Industrial & Automotive: | | | | | | | | | | | | | | | | | | | | | | | | | | | | | | | | | | | | |
– Powertrain | | | (26.2 | ) | | | — | | | | 18.2 | | | | 0.1 | | | | (2.4 | ) | | | 3.7 | | | | 25.4 | | | | — | | | | 18.8 | |
– Other I&A | | | (5.9 | ) | | | 0.8 | | | | 8.1 | | | | 0.2 | | | | (1.7 | ) | | | 0.6 | | | | 6.2 | | | | (0.3 | ) | | | 8.0 | |
| | | | | | | | | | | | | | | | | | | | | | | | | | | | | | | | | | | | |
| | | (32.1 | ) | | | 0.8 | | | | 26.3 | | | | 0.3 | | | | (4.1 | ) | | | 4.3 | | | | 31.6 | | | | (0.3 | ) | | | 26.8 | |
Building Products: | | | | | | | | | | | | | | | | | | | | | | | | | | | | | | | | | | | | |
– Doors & Windows | | | (33.0 | ) | | | — | | | | 0.2 | | | | — | | | | — | | | | — | | | | 19.9 | | | | — | | | | (12.9 | ) |
| | | | | | | | | | | | | | | | | | | | | | | | | | | | | | | | | | | | |
Total exited | | | (65.1 | ) | | | 0.8 | | | | 26.5 | | | | 0.3 | | | | (4.1 | ) | | | 4.3 | | | | 51.5 | | | | (0.3 | ) | | | 13.9 | |
| | | | | | | | | | | | | | | | | | | | | | | | | | | | | | | | | | | | |
Total continuing operations | | | 88.2 | | | | 24.4 | | | | 148.4 | | | | 10.4 | | | | (63.0 | ) | | | 73.0 | | | | 140.9 | | | | (0.2 | ) | | | 422.1 | |
| | | | | | | | | | | | | | | | | | | | | | | | | | | | | | | | | | | | |
| | | | | | | | | |
Discontinued operation | | | (3.5 | ) | | | 1.2 | | | | 23.8 | | | | 0.9 | | | | — | | | | — | | | | 3.2 | | | | — | | | | 25.6 | |
| | | | | | | | | | | | | | | | | | | | | | | | | | | | | | | | | | | | |
Total Group operations | | | 84.7 | | | | 25.6 | | | | 172.2 | | | | 11.3 | | | | (63.0 | ) | | | 73.0 | | | | 144.1 | | | | (0.2 | ) | | | 447.7 | |
| | | | | | | | | | | | | | | | | | | | | | | | | | | | | | | | | | | | |
| * | Re-presented (see note 5A to the Group’s consolidated financial statements) |
Adjusted EBITDA margin
Adjusted EBITDA margin is a non-GAAP measure that represents adjusted EBITDA expressed as a percentage of sales.
We use adjusted EBITDA margin to measure the success of our businesses in managing their cost base and improving profitability.
| | | | | | | | | | | | | | | | | | |
| | | SUCCESSOR | | | | | PREDECESSOR | |
| | | Fiscal 2011 | | | Q4 2010 | | | | | 9M 2010 | | | Fiscal 2009 | |
Continuing operations | | | | | | | | | | | | | | | | | | |
Sales ($ million) | | | 4,590.7 | | | | 1,181.3 | | | | | | 3,270.4 | | | | 3,866.5 | |
| | | | | | | | | | | | | | | | | | |
Adjusted EBITDA ($ million) | | | 699.3 | | | | 173.8 | | | | | | 498.9 | | | | 422.1 | |
Adjusted EBITDA margin (%) | | | 15.2 | % | | | 14.7 | % | | | | | 15.3 | % | | | 10.9 | % |
| | | | | | | | | | | | | | | | | | |
67
Pinafore Holdings B.V.
Item 5B
Trading cash flow
Trading cash flow is a non-GAAP measure that we use as a measure of the cash generated by our businesses from their trading activities.
Trading cash flow represents cash generated from operations less net capital expenditure (cash outflows on the purchase of property, plant and equipment and non-integral computer software, less proceeds on the disposal of property, plant and equipment).
A reconciliation of cash generated from operations to trading cash flow is presented in the ‘Analysis of movements in net debt (unaudited)’ below.
| | | | | | | | | | | | | | | | | | |
| $ million | | SUCCESSOR | | | | | PREDECESSOR | |
| | | Fiscal 2011 | | | Q4 2010 | | | | | 9M 2010 | | | Fiscal 2009 | |
Total operations | | | | | | | | | | | | | | | | | | |
Trading cash flow | | | 512.3 | | | | 8.8 | | | | | | 144.1 | | | | 422.0 | |
Trading cash flow reflects net capital expenditure which may fluctuate considerably from one year to another in an individual business, depending on the timing of capital projects and asset disposals. Management, therefore, uses trading cash flow in conjunction with, not as a substitute for, cash generated from operations in assessing the cash generation of the Group’s businesses.
Net debt
Management uses net debt, rather than the narrower measure of net cash and cash equivalents which forms the basis for the consolidated cash flow statement, as a measure of the Group’s liquidity and in assessing the strength of the Group’s balance sheet.
Net debt represents the net total of:
| • | | the principal amount of the Group’s borrowings (bank overdrafts and bank and other loans); |
| • | | the carrying amount of finance lease obligations; |
| • | | the carrying amount of cash and cash equivalents and collateralized cash (included in trade and other receivables); and |
| • | | the fair value of the foreign currency derivatives that are held to hedge foreign currency translation exposures. |
Net debt may be analyzed as follows:
| | | | | | | | |
$ million | | As at
December 31,
2011 | | | As at
December 31,
2010 | |
Total operations | | | | | | | | |
Borrowings: | | | | | | | | |
– Bank overdrafts | | | (5.5 | ) | | | (7.1 | ) |
– Bank and other loans | | | (2,814.4 | ) | | | (3,360.4 | ) |
| | | | | | | | |
| | | (2,819.9 | ) | | | (3,367.5 | ) |
Obligations under finance leases | | | (2.8 | ) | | | (3.3 | ) |
| | | | | | | | |
Debt | | | (2,822.7 | ) | | | (3,370.8 | ) |
Cash and cash equivalents | | | 480.0 | | | | 459.3 | |
Collateralized cash | | | 17.7 | | | | 47.0 | |
Foreign currency derivatives | | | 0.2 | | | | (0.5 | ) |
| | | | | | | | |
Net debt | | | (2,324.8 | ) | | | (2,865.0 | ) |
| | | | | | | | |
A reconciliation of the carrying amount to the principal amount of the Group’s borrowings is presented in note 30 to the accompanying financial statements.
68
Pinafore Holdings B.V.
Item 5B
Analysis of movements in net debt (unaudited)
| | | | | | | | | | | | | | | | | | |
| $ million | | SUCCESSOR | | | | | PREDECESSOR | |
| | | Fiscal 2011 | | | Q4 2010 | | | | | 9M 2010 | | | Fiscal 2009 | |
Cash generated from operations | | | 611.0 | | | | 66.3 | | | | | | 215.2 | | | | 532.1 | |
Capital expenditure: | | | | | | | | | | | | | | | | | | |
– Purchase of property, plant and equipment | | | (108.8 | ) | | | (60.2 | ) | | | | | (90.0 | ) | | | (115.2 | ) |
– Purchase of computer software | | | (7.4 | ) | | | — | | | | | | (5.7 | ) | | | (7.8 | ) |
| | | (116.2 | ) | | | (60.2 | ) | | | | | (95.7 | ) | | | (123.0 | ) |
Disposal of property, plant and equipment | | | 17.5 | | | | 2.7 | | | | | | 24.6 | | | | 12.9 | |
| | | | | | | | | | | | | | | | | | |
Trading cash flow | | | 512.3 | | | | 8.8 | | | | | | 144.1 | | | | 422.0 | |
Tax: | | | | | | | | | | | | | | | | | | |
– Income taxes paid | | | (104.4 | ) | | | (22.3 | ) | | | | | (66.2 | ) | | | (50.3 | ) |
– Income taxes received | | | 15.3 | | | | 1.4 | | | | | | 45.7 | | | | 31.2 | |
| | | | | | | | | | | | | | | | | | |
| | | (89.1 | ) | | | (20.9 | ) | | | | | (20.5 | ) | | | (19.1 | ) |
Interest: | | | | | | | | | | | | | | | | | | |
– Interest element of finance lease rental payments | | | (0.2 | ) | | | — | | | | | | (0.2 | ) | | | (0.4 | ) |
– Interest received | | | 2.0 | | | | 1.4 | | | | | | 13.3 | | | | 3.6 | |
– Interest paid | | | (215.0 | ) | | | (58.1 | ) | | | | | (15.2 | ) | | | (37.5 | ) |
| | | | | | | | | | | | | | | | | | |
| | | (213.2 | ) | | | (56.7 | ) | | | | | (2.1 | ) | | | (34.3 | ) |
| | | | | |
Financing costs paid | | | (36.9 | ) | | | (182.4 | ) | | | | | — | | | | (6.3 | ) |
Ordinary dividends | | | — | | | | — | | | | | | (56.9 | ) | | | (48.3 | ) |
| | | | | |
Acquisitions and disposals: | | | | | | | | | | | | | | | | | | |
– Purchase of interests in subsidiaries, net of cash acquired | | | (29.6 | ) | | | (4,535.0 | ) | | | | | (41.2 | ) | | | (26.5 | ) |
– Sale of businesses and subsidiaries, net of cash disposed | | | 475.7 | | | | 4.0 | | | | | | (4.0 | ) | | | 0.7 | |
– Debt acquired on acquisition of subsidiary | | | — | | | | — | | | | | | — | | | | (7.8 | ) |
– Purchase of non-controlling interest | | | (13.1 | ) | | | — | | | | | | — | | | | — | |
– Investments in associates | | | (0.4 | ) | | | (0.5 | ) | | | | | — | | | | (2.7 | ) |
| | | | | | | | | | | | | | | | | | |
| | | 432.6 | | | | (4,531.5 | ) | | | | | (45.2 | ) | | | (36.3 | ) |
Share movements: | | | | | | | | | | | | | | | | | | |
– Issue of shares | | | — | | | | 2,142.3 | | | | | | 5.5 | | | | 0.1 | |
– Purchase of own shares | | | (0.3 | ) | | | — | | | | | | (6.2 | ) | | | (1.4 | ) |
| | | | | | | | | | | | | | | | | | |
| | | (0.3 | ) | | | 2,142.3 | | | | | | (0.7 | ) | | | (1.3 | ) |
Other movements: | | | | | | | | | | | | | | | | | | |
– Capitalization of development costs | | | (1.8 | ) | | | (2.3 | ) | | | | | (0.5 | ) | | | (0.6 | ) |
– Dividends received from associates | | | 0.5 | | | | — | | | | | | 0.5 | | | | 0.3 | |
– Premium on redemption of debt instruments | | | (3.8 | ) | | | (4.6 | ) | | | | | — | | | | — | |
– Settlement of interest rate swaps | | | — | | | | — | | | | | | 64.7 | | | | — | |
– Return of management investment | | | (0.7 | ) | | | — | | | | | | — | | | | — | |
– Investment by a minority shareholder in a subsidiary | | | 1.5 | | | | 11.7 | | | | | | — | | | | 4.7 | |
– Dividend paid to a minority shareholder in a subsidiary | | | (64.4 | ) | | | — | | | | | | (12.0 | ) | | | (8.7 | ) |
| | | | | | | | | | | | | | | | | | |
| | | (68.7 | ) | | | 4.8 | | | | | | 52.7 | | | | (4.3 | ) |
Foreign currency movements: | | | | | | | | | | | | | | | | | | |
– Net cash and cash equivalents | | | (1.6 | ) | | | (45.6 | ) | | | | | 1.3 | | | | 4.8 | |
– Other debt | | | 4.3 | | | | 1.4 | | | | | | 20.9 | | | | (48.0 | ) |
– Receipts/(payments) on foreign currency derivatives | | | 5.0 | | | | (2.2 | ) | | | | | (20.3 | ) | | | 39.6 | |
| | | | | | | | | | | | | | | | | | |
| | | 7.7 | | | | (46.4 | ) | | | | | 1.9 | | | | (3.6 | ) |
| | | | | | | | | | | | | | | | | | |
Cash movement in net debt | | | 544.4 | | | | (2,682.0 | ) | | | | | 73.3 | | | | 268.5 | |
Non-cash movements | | | (4.2 | ) | | | (44.9 | ) | | | | | — | | | | — | |
| | | | | | | | | | | | | | | | | | |
Decrease/(increase) in net debt | | | 540.2 | | | | (2,726.9 | ) | | | | | 73.3 | | | | 268.5 | |
| | | | | | | | | | | | | | | | | | |
69
Pinafore Holdings B.V.
Item 5F
C. Research and development
Applied research and development is important to our businesses and integral to our leading market positions. We have facilities in the United States, Europe and Japan that focus on the introduction of new and improved products with a particular emphasis on energy efficiency and safety, the application of technology to reduce unit and operating costs and improving services to our customers. Our research and development expenditures were $79.3 million for Fiscal 2011, $83.1 million for pro forma Fiscal 2010 and $78.0 million for Fiscal 2009.
D. Trend information
When considering the trends affecting the Group, it is important to bear in mind that our sales and earnings base is highly diversified by product, geography, end market and customer. We derive sales from nearly every developed country across the globe and are well-positioned in markets for our industrial and automotive components in most major emerging markets.
Discussion of the market trends affecting the Fiscal 2011 and Fiscal 2010 are discussed under ‘Industry trends’ inItem 5A‘Operating results’. Our outlook for the end markets in which we operate is discussed below.
Industrial & Automotive markets
Industrial and automotive markets, which accounted for the majority of the Group’s sales in Fiscal 2011, are forecast to continue to grow during 2012. However, growth rates are expected to be lower in 2012 than in 2011 due to the weakening macroeconomic environment. The following is a summary of our global outlook for I&A end markets in 2012:
| • | | Industrial and replacement OE markets are forecast to grow between 5 to 10%. In North America, growth is expected to be between 5-10%. The economic environment in Europe is uncertain, however we currently expect growth of between 0-5%. Growth in China is expected to slow to 5-10%. |
| • | | Global automotive OE markets are measured by vehicle production and are forecast to grow by 5% in 2012 to 80 million units. |
| • | | Automotive aftermarkets are forecast to grow at approximately 3%. |
Construction markets
Construction markets in the US, which accounted for the remainder of the Group’s sales, are expected to remain weak in 2012. The following is a summary of our outlook for US construction markets in 2012:
| • | | Non-residential construction markets are forecast by Dodge to be up by 2% in 2012. However, as our products are installed later in the building process, we expect to lag the market in 2012. |
| • | | Residential construction markets are measured by US housing starts and are forecast to be slightly higher in 2012 than in 2011, at around 640,000 units. |
E. Off-balance sheet arrangements
We have not entered into any transaction, agreement or other contractual arrangement that is considered to be an off-balance sheet arrangement that is required to be disclosed other than operating lease commitments that are analyzed in note 44 to the Group’s consolidated financial statements.
70
Pinafore Holdings B.V.
Item 5F
F. Tabular disclosure of contractual obligations
The Company’s consolidated contractual obligations and commercial commitments are summarized in the following table which includes aggregate information about the Company’s contractual obligations as at December 31, 2011 and the periods in which payments are due, based on the earliest date on which the Group could be required to settle the liabilities.
Floating interest payments and payments and receipts on interest rate derivatives are estimated based on market interest rates prevailing at the balance sheet date. Amounts in respect of operating leases and purchase obligations are items that the Company is obligated to pay in the future, but they are not required to be included on the consolidated balance sheet.
Contractual obligations
| | | | | | | | | | | | | | | | | | | | |
| Fiscal 2011 | | | | | Earliest period in which payment/(receipt) due | |
| | | Total
$ million | | | Less than 1 year
$ million | | | 1 - 3 years
$ million | | | 3 - 5 years
$ million | | | After 5 years
$ million | |
| | | | | |
Bank and other loans: | | | | | | | | | | | | | | | | | | | | |
– Principal | | | 2,814.4 | | | | 58.4 | | | | 83.2 | | | | 1,637.5 | | | | 1,035.3 | |
– Interest payments(1)(2) | | | 912.8 | | | | 168.6 | | | | 306.7 | | | | 251.2 | | | | 186.3 | |
Derivative financial instruments: | | | | | | | | | | | | | | | | | | | | |
– Payments(3) | | | 175.5 | | | | 175.5 | | | | — | | | | — | | | | — | |
– Receipts(3) | | | (177.3 | ) | | | (177.3 | ) | | | — | | | | — | | | | — | |
Finance leases | | | 4.1 | | | | 0.4 | | | | 0.8 | | | | 0.7 | | | | 2.2 | |
Operating leases | | | 196.2 | | | | 42.9 | | | | 62.8 | | | | 38.9 | | | | 51.6 | |
Post-employment benefits(4) | | | 45.0 | | | | 45.0 | | | | — | | | | — | | | | — | |
Purchase obligations(5) | | | 41.2 | | | | 29.2 | | | | 8.6 | | | | 3.4 | | | | — | |
| | | | | | | | | | | | | | | | | | | | |
Total | | | 4,011.9 | | | | 342.7 | | | | 462.1 | | | | 1,931.7 | | | | 1,275.4 | |
| | | | | | | | | | | | | | | | | | | | |
| (1) | Future interest payments include payments on fixed and floating rate debt. |
| (2) | Floating rate interest payments and payments and receipts on the floating rate legs of interest rate derivatives are estimated based on market interest rates prevailing as at December 31, 2011. |
| (3) | Receipts and payments on foreign currency derivatives are estimated based on market exchange rates prevailing as at December 31, 2011. |
| (4) | Post-employment benefit obligations represent the Group’s expected cash contributions to its defined benefit pension and other post-employment benefit plans in Fiscal 2012. It is not practicable to present expected cash contributions for subsequent years because they are determined annually on an actuarial basis to provide for current and future benefits in accordance with federal law and other regulations. |
| (5) | A purchase obligation is defined as an agreement to purchase goods or services that is enforceable and legally binding on the Group and that specifies all significant terms, including: fixed or minimum quantities to be purchased; fixed, minimum or variable price provisions; and the approximate timing of the transaction. |
G. Safe Harbor
See the ‘Special note regarding forward-looking statements’ on page i.
71
Pinafore Holdings B.V.
Item 6A
| Item 6. | Directors, Senior Management and Employees |
A. Directors and senior management
The directors of the Company (the ‘Directors’) and the executive officers of the Group as at March 5, 2012 are as follows:
| | | | |
| Name | | Age | | Position |
Directors | | | | |
James Nicol | | 57 | | Group Chief Executive Officer and Director C |
Kosty Gilis | | 38 | | Director A |
Donald West | | 74 | | Director A |
Anthony Morgan | | 39 | | Director B |
Ryan Selwood | | 38 | | Director B |
Johan Broekhuis | | 36 | | Director C |
Edwin Denekamp | | 41 | | Director C |
Pieter Hallebeek | | 35 | | Director C |
Roelof Langelaar | | 40 | | Director C |
Ronald Rosenboom | | 50 | | Director C |
| | |
Group executive officers | | | | |
John Zimmerman | | 48 | | Group Chief Financial Officer |
Alan Power | | 49 | | President, Industrial & Automotive |
Terry O’Halloran | | 64 | | Chief Operating Officer, Building Products |
Dave Carroll | | 54 | | Executive Vice President, Business Development |
Thomas Reeve | | 54 | | Executive Vice President and General Counsel |
There are no family relationships between any Director or executive officer and any other Director or executive officer or any arrangement or understanding between any Director or executive officer and any other person pursuant to which such Director or executive officer was so elected or appointed.
Directors
James Nicol
Mr. James Nicol has held the position of the Group’s Chief Executive Officer since joining us in February 2002 and currently serves as a Director on the Board. Previously, Mr. Nicol was the President and Chief Operating Officer of Magna International Inc, a global automotive parts company. He joined Magna International Inc. in 1987 as Vice-President, Special Projects, following a successful career as a commercial lawyer. Mr. Nicol also founded TRIAM Automotive Inc. in 1992, and he returned to Magna International Inc. as Vice Chairman when it acquired TRIAM Automotive Inc. in 1998. He has earned degrees from York University and the London School of Economics.
Kosty Gilis
Mr. Kosty Gilis currently serves as a Director on the Board. He is a Managing Director at Onex. Since joining Onex in 2004, he has worked on the acquisition of Allison Transmission and has been actively involved in sourcing, evaluating and conducting due diligence on a number of acquisition opportunities. Prior to joining Onex, Mr. Gilis spent four years at Willis Stein & Partners, a Chicago-based private equity firm, where he completed acquisitions and advised portfolio companies in the consumer products, industrial manufacturing and business services industries. Previously, Mr. Gilis was a management consultant at Bain & Company, where he worked on strategic and operational issues for clients in a variety of industries. Mr. Gilis currently serves on the board of directors of Allison Transmission Holdings Inc. Mr. Gilis earned a Master in Business Administration from the Harvard Graduate School of Business Administration and a Bachelor of Science in Economics from the Wharton School at the University of Pennsylvania.
Donald West
Mr. Donald West currently serves as a Director on the Board. Mr. West is the Director of Tax – US Operations for OMI Management US Limited Partnership, a subsidiary of Onex Corporation, where he has worked since 1983. Mr. West currently serves on the board of directors of Caliber Collision, Mister Carwash and Sport Supply Group. Mr. West holds a Bachelor of Science in Business Administration from the Ohio State University and is a Certified Public Accountant.
Anthony Morgan
Mr. Anthony Morgan currently serves as a Director on the Board. He is a Vice President at CPPIB based in Toronto. Since joining CPPIB in 2008, he has worked on the acquisition of Bank of America Merchant Services, Aricent Inc and Livingston International. Prior to joining CPPIB, Mr. Morgan worked for eight years in private equity in London, as a Partner at Alchemy Partners and an Investment Manager at Permira. Previously, Mr. Morgan was a management consultant at Mitchell Madison Group, where he worked on strategic and operational issues for clients in a variety of industries. Mr. Morgan currently serves on the boards of directors of Aricent Technologies and Livingston International. Mr. Morgan earned a Master of Business Administration from the Harvard Business School where he was a Fulbright Scholar, a Masters in Manufacturing Engineering from Cambridge University and a Bachelor of Engineering from Cambridge University.
72
Pinafore Holdings B.V.
Item 6A
Ryan Selwood
Mr. Ryan Selwood currently serves as a Director on the Board. He is a Senior Principal at CPPIB and is currently based in London, leading CPPIB’s Principal Investing activities in Europe. Since joining CPPIB in 2006, Ryan has had experience across a wide variety industries ranging from financial services to technology. Ryan led CPPIB’s investment in CHC Helicopter. Prior to joining CPPIB, Mr. Selwood was a Vice-President at Merrill Lynch & Co. in the Financial Institutions Group in the Investment Banking Division in New York and Toronto. Ryan holds his MBA and law degrees from York University and a BA from the University of Western Ontario.
Johan Broekhuis
Mr. Johan Broekhuis was appointed as a Director on the Board on October 1, 2011. He also serves as a director of a number of Dutch-based private companies. Mr. Broekhuis is currently employed as a business unit manager with ATC Management B.V. (‘ATC’), which he joined in 2011. Previously he worked as a senior corporate lawyer in a leading international law firm and as an associate in a leading Benelux law firm. Mr. Broekhuis graduated from the University of Leiden (the Netherlands) in 2000.
Edwin Denekamp
Mr. Edwin Denekamp was appointed as a Director on the Board on September 1, 2010. Mr. Denekamp is currently employed as senior manager with ATC, which he joined in 2002. He is also a non-executive director of a number of Dutch-based private companies. Previously he worked for another Dutch based corporate service provider. He earned a Bachelor of Business Administration in 1995.
Pieter Hallebeek
Mr. Pieter Hallebeek was appointed as a Director on the Board on October 26, 2010. Mr. Hallebeek is currently employed as senior manager with ATC, which he joined in 2005. He is also a non-executive director of a number of Dutch-based private companies. Previously he worked for another Dutch-based corporate service provider and as a corporate lawyer in a leading international law firm. Mr. Hallebeek graduated from the VU University Amsterdam in 2000.
Roelof Langelaar
Mr. Roelof Langelaar was appointed as a Director on the Board on September 1, 2010. He is also a member of the board of directors of ATC, and a non-executive director of a number of Dutch-based private companies. Mr. Langelaar Joined ATC in 2003. Previously he worked for Rabobank Nederland and ING Bank N.V. Mr. Langelaar earned a Bachelor of Business Administration in 1999.
Ronald Rosenboom
Mr. Ronald Rosenboom was appointed as a Managing Director on the Board on September 1, 2010. Mr. Rosenboom is currently employed as business unit director with ATC, which he joined in 2003. He is also a non-executive director of a number of Dutch-based private companies. Previously he worked nine years for another Dutch-based corporate service provider. His last position was assistant managing director. He earned a Bachelor of Business Administration in 1984.
Executive officers
John Zimmerman
Mr. John Zimmerman currently serves as the Group’s Chief Financial Officer. He joined us as Vice President of Corporate Development in 1999 and was appointed as Chief Financial Officer in October 2007. Mr. Zimmerman is a Chartered Accountant (S.A.) and practiced for many years at Deloitte in South Africa. He joined Braxton Associates in Toronto in 1990 and later became a partner at Orenda Corporate Finance in 1994. Mr. Zimmerman earned his Bachelor of Commerce (Hons) degree from the University of Cape Town, South Africa.
Alan Power
Mr. Alan Power currently serves as our President, Industrial and Automotive. He joined us in September 2008. Previously, Mr. Power was President and Chief Operating Officer of Van Rob Inc., an auto parts company, President, Chief Executive Officer and Chairman of National Rubber Technologies, a manufacturer of rubber products, and President and Chief Executive Officer of Decoma International, an auto parts supplier. He earned his Mechanical Engineering degree from Technical University of Nova Scotia.
Terry O’Halloran
Mr. Terry O’Halloran currently serves as Tomkins’ Chief Operating Officer, Building Products. He joined us in 1985 as Vice President of Operations and has held the positions of Group President – Air Systems Division, President of Ruskin Company and President of Air Systems Components. He earned his Masters in Business Administration from the University of Dallas and a Bachelor of Business Administration from Texas Wesleyan University.
David Carroll
Mr. David Carroll currently serves as our Tomkins’ Executive Vice President, Business Development. He has served with us since 2003 and has held positions of Executive Vice-President (Tomkins) and Executive Vice-President, Business Development. Previously, Mr. Carroll was Executive Vice President, Marketing and Corporate Planning of Magna International Inc., a global automotive parts company. He joined Magna International Inc. in 1984 as a Sales Coordinator. He earned a Bachelor of Business Administration with Honors and Masters in Business Administration both from the University of Western Ontario.
Thomas Reeve
Mr. Thomas Reeve currently serves as our Executive Vice President and General Counsel. He joined Tomkins in 1998 and has previously been Corporate Counsel for Gates Corporation; Director, Tomkins Corporate Development; and Vice President, Tomkins Corporate Development. Mr. Reeve previously worked as outside counsel at Gibson Dunn & Crutcher and was a founding partner of a commercial litigation firm in Denver, Colorado. He earned a Bachelor degree from the University of Notre Dame and a J.D. degree from the University of Virginia.
73
Pinafore Holdings B.V.
Item 6A
Changes in the Board and executive officers
Johan Haneveer, a former Director C, stepped down from the Board effective October 1, 2011. On the same date, Johan Broekhuis was appointed as a Director C. Mr. Pappayliou, the Group’s General Counsel, retired effective March 31, 2011 and Mr Reeve was appointed to this position.
B. Compensation
The table below shows compensation paid or payable to our directors and executive officers in respect of their services to us, including Mr. Nicol, Mr. Zimmerman, Mr. Power, Mr. O’Halloran, Mr. Pappayliou (up to March 31, 2011) Mr. Reeve, Mr. Carroll, Mr. Rosenboom, Mr. Haneveer (up to October 1, 2011), Mr. Huisbroek (from October 1, 2011), Mr. Denekamp, Mr. Langelaar and Mr. Hallebeek as of December 31, 2011. The individuals designated as Director A and Director B did not receive compensation from us during Fiscal 2011.
| | | | | | | | | | | | | | | | | | |
| | | SUCCESSOR | | | | | PREDECESSOR | |
| | | Fiscal 2011
$000s | | | Q4 2010
$000s | | | | | 9M 2010
$000s | | | Fiscal 2009
$000s | |
Short-term employee benefits: | | | | | | | | | | | | | | | | | | |
– Salaries and fees | | | 4,755 | | | | 1,121 | | | | | | 3,230 | | | | 4,928 | |
– Bonus cash | | | 6,993 | | | | 2,609 | | | | | | 4,314 | | | | 3,397 | |
– Benefits-in-kind | | | 304 | | | | 71 | | | | | | 149 | | | | 168 | |
– Social security contributions | | | 26 | | | | 12 | | | | | | 27 | | | | 425 | |
– Termination benefits | | | 376 | | | | — | | | | | | — | | | | 755 | |
| | | | | | | | | | | | | | | | | | |
| | | 12,454 | | | | 3,813 | | | | | | 7,720 | | | | 9,673 | |
| | | | | | | | | | | | | | | | | | |
Share-based incentives: | | | | | | | | | | | | | | | | | | |
– Retention awards | | | — | | | | 3,080 | | | | | | — | | | | — | |
– ABIP | | | | | | | | | | | | | | | | | | |
Bonus shares | | | 910 | | | | — | | | | | | 557 | | | | 829 | |
Deferred shares | | | 1,821 | | | | — | | | | | | 1,113 | | | | 1,659 | |
– Gain on the vesting of PSP awards | | | — | | | | 14,979 | | | | | | — | | | | — | |
– Gain on the exercise of share options | | | 13,088 | | | | 1,306 | | | | | | 173 | | | | — | |
| | | | | | | | | | | | | | | | | | |
| | | 15,819 | | | | 19,365 | | | | | | 1,843 | | | | 2,488 | |
| | | | | | | | | | | | | | | | | | |
Pension contributions | | | 1,520 | | | | 355 | | | | | | 1,039 | | | | 1,260 | |
| | | | | | | | | | | | | | | | | | |
| | | 29,793 | | | | 23,533 | | | | | | 10,602 | | | | 13,421 | |
| | | | | | | | | | | | | | | | | | |
Retirement Plans and Incentive Plans and Awards
Retirement Plans
Except for Mr. O’Halloran and Mr. Pappayliou, none of the members of our senior management who are employees participate or participated in any plan or program that provides pension or other retirement benefits (other than defined contribution plans such as the 401(k) plan in which members of our senior management in the US participate). Instead, each of the members of our senior management who are employees receive a monthly supplemental payment in addition to regular base salary that is intended to allow the executive to make contributions to a personal retirement program of his choice. Mr. O’Halloran and Mr. Pappayliou participate or participated in one of our defined benefit pension plans and are also entitled to supplemental pension benefits in accordance with the terms of their employment agreement.
Annual Bonus Incentive Plan
In addition to annual base salary, members of senior management who are employees participate in the Tomkins Annual Bonus Incentive Plan (‘ABIP’), pursuant to which participants may earn annual bonuses. Bonus payments are determined based upon the amount of bonusable profit for the calendar year. Bonuses are payable quarterly and each member of senior management is entitled to a specified percentage of the applicable bonusable profit. Bonus payments are made in cash or a combination of cash and ordinary ‘B’ shares (‘B Shares’) or depository receipts in respect of such B Shares (‘Depository Receipts’) (and/or rights to receive B Shares in the Company, subject to the satisfaction of future service requirements).
Pre-acquisition equity incentive programs
Prior to the Acquisition, we maintained several equity incentive award programs consisting of certain share option schemes and a Performance Share Plan (‘PSP’). In connection with the Acquisition all outstanding options under the share option schemes were converted (directly or indirectly) into the right to receive, upon cancellation or exercise of the options, an amount equal to the difference between the aggregate amount of cash consideration payable in respect of the underlying shares subject to the options and the aggregate exercise price of such options.
In addition, all outstanding awards in connection with the PSP fully vested as a result of the Acquisition and were paid in cash at that time, except that as an alternative to this accelerated vesting and payment under the PSP, certain members of our senior management who are employees and certain other employees who were not resident in the US elected to cancel their PSP awards in exchange for awards of options to purchase equity interests in the Company (the ‘Replacement Options’). The shares covered by each Replacement Option had a market value at the time of the award equal to the market value of the shares subject to the cancelled PSP awards. As at December 31, 2011, an aggregate of 16,020 B Shares are subject to Replacement Options granted to certain of our directors and executive officers. Each Replacement Option has a nominal exercise price and was fully vested at grant. The Replacement Options will expire on the tenth anniversary of the grant date.
74
Pinafore Holdings B.V.
Item 6B
Current equity incentive plan
The Company has established an equity incentive plan under which each of the members of our senior management who is an employee, and certain other employees, received awards of options to purchase B Shares in the Company (the ‘Variable Options’). The percentage of the Company’s shares available for such options is up to 15% of the ordinary share capital of the Company on a fully diluted basis. The Variable Options are divided into three tiers with distinct escalating exercise prices for each tier, allowing the option holders to participate in the aggregate in 9%, 12% and 15%, respectively, of the gains of the Company’s equity investors above certain minimum return thresholds.
The first tier of Variable Options has an exercise price equal to $1,966.00 (the ‘Initial Exercise Price’) compounded at 8% per annum. The second tier of Variable Options has an exercise price equal to the Initial Exercise Price compounded at 25% per annum (but subject, in certain circumstances, to a cap of 2.25 times the Initial Exercise Price). The third tier of Variable Options has an exercise price equal to the Initial Exercise Price compounded at 27.5% per annum (but subject, in certain circumstances, to a cap of 2.5 times the Initial Exercise Price).
The equity incentive plan is designed to provide management with an initial 9% of the equity (after coverage of the initial investment made by the Company’s equity investors plus 8% compounded), subject to certain step-ups at higher levels of returns. Under this plan, at December 31, 2011, an aggregate of 139,741 B Shares are subject to Variable Options granted to certain of our directors and executive officers. The Variable Options were vested as to 25% on grant, with a further 25% vesting on the first three anniversaries of the Acquisition becoming effective, subject to continued employment on the applicable vesting date. The vesting of the Variable Options will be accelerated in whole or in part in the event of a change of control or certain liquidity events while the holder is still employed, or, in part, if the holder is a good leaver. The Variable Options will expire on the tenth anniversary of the grant date.
During Fiscal 2011, an additional award of variable options were granted to members of senior management on the same terms as those granted in Fiscal 2010, with the exception that the Initial Exercise Price was $2,533.70.
Retention Awards
In addition to the Variable Options, the equity incentive plan provides for the grant of retention awards to certain of our employees, and such awards were awarded in December 2010 to certain members of senior management. The retention awards consist of the right to receive B Shares in the Company, which shares would be issued on the first to occur of December 10, 2015 or the holder’s termination of employment in certain circumstances. The retention awards will become vested as to one-third of the award on the first three anniversaries following the date of the awards, subject to continued employment on the applicable vesting date. The vesting of the retention awards will be accelerated in the event of a change of control or liquidity event while the holder is still employed, or if the holder dies, has his employment terminated due to disability or without cause or resigns for good reason. As at December 31, 2011, an aggregate of 1,574 B Shares are subject to Retention Awards granted to certain of our directors and executive officers.
Share options
As at March 5, 2012, our directors and executive officers held the following options over the Company’s B Shares:
| | | | | | | | | | | | | | | | | | | | | | | | |
| | | | | | | | | | | | Number of
options held | |
Scheme | | Grant date | | | Expiry date | | | Exercise
price | | | Directors | | | Other executive
officers | | | Total | |
Replacement options | | | September 28, 2010 | | | | September 28, 2020 | | | € | 0.01 | | | | 11,898 | | | | 4,122 | | | | 16,020 | |
Variable options | | | | | | | | | | | | | | | | | | | | | | | | |
Initial tranche: | | | | | | | | | | | | | | | | | | | | | | | | |
– First tier | | | November 11, 2010 | | | | November 11, 2020 | | | $ | 2,166 | | | | 43,389 | | | | 40,515 | | | | 83,904 | |
– Second tier | | | November 11, 2010 | | | | November 11, 2020 | | | $ | 2,604 | | | | 14,463 | | | | 13,505 | | | | 27,968 | |
– Third tier | | | November 11, 2010 | | | | November 11, 2020 | | | $ | 2,670 | | | | 14,463 | | | | 13,505 | | | | 27,968 | |
2011 tranche: | | | | | | | | | | | | | | | | | | | | | | | | |
– First tier | | | September 15, 2011 | | | | November 11, 2020 | | | $ | 2,534 | | | | — | | | | 117 | | | | 117 | |
– Second tier | | | September 15, 2011 | | | | November 11, 2020 | | | $ | 2,604 | | | | — | | | | 39 | | | | 39 | |
– Third tier | | | September 15, 2011 | | | | November 11, 2020 | | | $ | 2,670 | | | | — | | | | 39 | | | | 39 | |
2012 tranche: | | | | | | | | | | | | | | | | | | | | | | | | |
– First tier | | | January 1, 2012 | | | | November 11, 2020 | | | $ | 2,359 | | | | 1,320 | | | | 1,236 | | | | 2,556 | |
– Second tier | | | January 1, 2012 | | | | November 11, 2020 | | | $ | 2,359 | | | | 440 | | | | 412 | | | | 852 | |
– Third tier | | | January 1, 2012 | | | | November 11, 2020 | | | $ | 2,359 | | | | 440 | | | | 412 | | | | 852 | |
| | | | | | | | | | | | | | | | | | | | | | | | |
| | | | | | | | | | | | | | | 86,413 | | | | 73,902 | | | | 160,315 | |
| | | | | | | | | | | | | | | | | | | | | | | | |
The Replacement Options and the Variable Options are over our unissued B Shares. The Replacement Options vested on the grant date. As at March 5, 2012, 50% of each tier of the Variable Options had vested. Details of the options granted over our shares are presented in note 36 to the Group’s consolidated financial statements.
C. Board Practices
Board of Directors
The Board is responsible for approving overall Group strategy and financial policy, acquisition and divestment policy and major capital expenditure projects. It also appoints and removes members of the Board Committees, reviews recommendations of the Audit Committee and Remuneration Committee, and the appointment of the independent auditor. It also reviews the financial performance and operation of each of the Group’s businesses. In Fiscal 2011, the Company granted qualifying third party indemnities to the Directors which remain in force at the time of this report.
75
Pinafore Holdings B.V.
Item 6C
The constitution of the Company requires that a majority of the directors present at any meeting must vote in favor to approve a resolution, such approval generally to include the affirmative vote of at least one Director A and one Director B. The directors may also adopt resolutions without convening a Board meeting, provided that such resolutions are adopted unanimously and in writing. The Board requires the approval at the general meeting of shareholders with respect to such resolutions as shall have been specified in a resolution at the general meeting of shareholders of which the Board shall have been notified. The Board is authorized to represent the Company and may also be represented by one Director A, one Director B and one Director C acting jointly. Pursuant to the terms of the Investment Agreement, Onex has appointed Mr. Gilis and Mr. West each as a Managing Director A and CPPIB has appointed Mr. Selwood and Mr. Morgan each as Managing Director B. The other Managing Directors are each Managing Director C.
Service contracts
In connection with the Acquisition, the members of senior management, other than Mr. Pappayliou, entered into new employment agreements with either the Company or one of its subsidiaries, which we believe contain customary and market terms regarding employment and compensation matters. These agreements also provide for compensation upon termination of employment by us (without cause) or termination of employment by the executive for good reason. The directors have no fixed terms of office.
Board Committees
The Board has established a number of Committees and receives reports of their proceedings. Each Committee has its own delegated authority as defined in its terms of reference, which are reviewed periodically by the Board. The Board is satisfied that its Committees have written terms of reference which conform with best corporate governance practice.
The Board appoints the chairmen and members of all Board Committees. The principal Committees, their membership and a brief description of their duties are set out below.
Audit Committee
Kosty Gilis (Chairman), Anthony Morgan
The Board has determined that both members of the Audit Committee are independent for the purposes of rule 10A(m) under the Exchange Act. In accordance with section 407 of the Sarbanes-Oxley Act of 2002 (the ‘SOX Act’), the Board has determined that Anthony Morgan is an “audit committee financial expert” as that term is defined under the rules of the SEC, having significant, relevant and up-to-date US financial and accounting knowledge and experience.
Terms of reference
The purpose of the Audit Committee is to assist the Board in ensuring that:
| • | | the Company’s financial and accounting systems are appropriately controlling the Company’s assets and providing accurate and up-to-date information on its financial results and financial position; |
| • | | the Company’s quarterly and annual financial statements represent a true and fair reflection of its financial results and financial position; and |
| • | | the external audit is conducted in a thorough, efficient and effective manner. |
The Chief Financial Officer shall, if the Audit Committee deems it necessary, attend the Audit Committee meetings, together with other internal or external individuals as invited by the Chief Financial Officer. The Audit Committee may also involve internal or external individuals for the purpose of obtaining information or advice. The internal and external auditors of the Company will be invited to attend at least one meeting each year.
The Audit Committee must consist of at least one Director A and one Director B and its members are determined and appointed by the Audit Committee, with notice to the Board, which may veto any proposed nominee or remove any member of the Audit Committee. Non-members of the Board can be appointed to the Audit Committee.
The Audit Committee meets at least four times a year, with regular meetings in February, May, August and November, to coincide with the announcement of the quarterly results. Other meetings of the Audit Committee are held if its members, the Board or the external auditor deem it necessary. At least once a year, the Audit Committee:
| • | | reviews the accounting policies; |
| • | | reviews the auditor’s management letter as well as any management responses thereto; and |
| • | | considers the effectiveness of the internal controls. |
Resolutions of the Audit Committee are passed with the affirmative vote of a simple majority of the members of the Audit Committee, which must include the affirmative vote of one Director A appointed to the Audit Committee and one Director B appointed to the Audit Committee.
In determining its policy on the extent of non-audit services provided by the independent auditors, the Audit Committee has taken account of the rules of the SEC which regulate and, in certain circumstances, prohibit the provision of, certain types of non-audit services by the independent auditors. Non-audit services require the approval of the Chairman of the Audit Committee. All fees proposed by the independent auditors must be reported to and approved by the Audit Committee or, between meetings, the Chairman of the Audit Committee. Details of fees paid to the Company’s independent auditors, Deloitte LLP, are set forth inItem 16C‘Principal accountant fees and services’.
A ‘whistleblowing’ procedure has been established for the confidential and anonymous submission by employees of concerns regarding accounting, internal controls or auditing matters, in accordance with the requirements of section 301 of the SOX Act. Should a call be received on the dedicated telephone line, the General Counsel would report to the applicable management all relevant concerns raised. A course of action would be agreed and a report prepared for review at the next meeting of the Audit Committee, including details of actions taken to deal with the matters raised. The Company’s Code of Conduct and Ethics includes the ‘whistleblowing’ procedure. Calls to the designated telephone number, as well as direct contacts with management, are made from time to time, but no issues material to the Company were dealt with by the Audit Committee during Fiscal 2011.
76
Pinafore Holdings B.V.
Item 6C
Remuneration Committee
Seth Mersky (Chairman), Anthony Morgan, James Nicol
Membership
Members of the Remuneration Committee shall be appointed by the Board of Directors of Pinafore Holdings, BV. The Committee shall be made up of at least three members: one member A of the Board, one member B of the Board and one member C of the Board. The relevant member A or B of the Board may designate a non-Board member to serve in their place. The members present at any meeting of the Committee shall elect one of themselves to chair the meeting.
Meetings
The Remuneration Committee shall meet formally at least four times a year and at such other times as any member of the Remuneration Committee may request. A meeting of the Remuneration Committee may be called by any member of the Remuneration Committee. A meeting of the Remuneration Committee may consist of a conference between members who are not all in one place, but of whom each is able (directly or by telephonic or electronic communication) to communicate with each of the others simultaneously, and the word “meeting” shall be construed accordingly.
The Remuneration Committee shall appoint a Secretary, who shall keep appropriate records of all meetings, including the names of those present and in attendance. Minutes of Remuneration Committee meetings shall be circulated promptly to all members.
Duties and responsibilities
Formulation of Remuneration Policy
The Remuneration Committee shall be responsible for recommending to the Board the policy for the remuneration of senior managers of the Group. The objective of such policy shall be to ensure that members of the executive management of the Group are provided with appropriate incentives to encourage enhanced performance and are, in a fair and responsible manner, rewarded for their individual contributions to the success of the Group. In formulating this policy, the Remuneration Committee shall address all of the main elements of total remuneration, and take into account factors that it deems necessary to ensure that the correct balance of performance-related components and other elements of the whole remuneration package are in line both with shareholder interests and with best practice.
Determination of Total Remuneration
Within the terms of the agreed policy, the Remuneration Committee shall review and recommend to the Board the total individual remuneration packages of relevant Group management, including, where appropriate, basic salary, performance-related incentives, both short and longer-term (that is, annual bonus, share options and share grants), pension arrangements and other benefits-in-kind, for approval by the Board.
No Director or manager shall be involved in any decisions as to their own remuneration.
Service Agreements and Contracts and Termination Arrangements
The Remuneration Committee shall:
| • | | recommend to the Board the terms of individual Director’s service agreements or contracts of employment and any changes thereto for approval by the Board; and |
| • | | ensure their recommendations to the Board relating to contractual terms on termination, and any payments made are fair to the individual and the Company. |
Reporting Responsibilities
The Remuneration Committee shall make whatever recommendations to the Board it deems appropriate on any area within its remit where action or improvement is needed.
Authority
The Remuneration Committee shall not have authority to make decisions with respect to remuneration issues, but will only make recommendations to the Board.
77
Pinafore Holdings B.V.
Item 6D
D. Employees
During Fiscal 2011, the Group employed an average of 26,949 employees, excluding non-executive directors. Our I&A business employed on average 19,623 employees, our Building Products business employed on average 7,214 employees and an average of 112 employees were employed in our corporate functions during Fiscal 2011. A more detailed breakdown of employees by operating segment is as follows:
| | | | | | | | | | | | | | | | | | |
| | | SUCCESSOR | | | | | PREDECESSOR | |
| | | Fiscal 2011
Number | | | Q4 2010*
Number | | | | | 9M 2010*
Number | | | Fiscal 2009*
Number | |
Continuing operations | | | | | | | | | | | | | | | | | | |
Ongoing segments | | | | | | | | | | | | | | | | | | |
Industrial & Automotive: | | | | | | | | | | | | | | | | | | |
– Gates North America | | | 6,187 | | | | 6,145 | | | | | | 5,709 | | | | 5,627 | |
– Gates EMEA | | | 3,365 | | | | 3,407 | | | | | | 3,168 | | | | 2,969 | |
– Gates APAC | | | 3,785 | | | | 3,707 | | | | | | 3,397 | | | | 3,018 | |
– Gates South America | | | 909 | | | | 942 | | | | | | 832 | | | | 715 | |
| | | | | | | | | | | | | | | | | | |
| | | 14,246 | | | | 14,201 | | | | | | 13,106 | | | | 12,329 | |
– Dexter | | | 1,220 | | | | 1,111 | | | | | | 1,140 | | | | 971 | |
| | | | | | | | | | | | | | | | | | |
| | | 15,466 | | | | 15,312 | | | | | | 14,246 | | | | 13,300 | |
| | | | | | | | | | | | | | | | | | |
Building Products: | | | | | | | | | | | | | | | | | | |
– Air Distribution | | | 6,514 | | | | 6,736 | | | | | | 6,682 | | | | 7,074 | |
– Bathware | | | 700 | | | | 739 | | | | | | 895 | | | | 1,038 | |
| | | | | | | | | | | | | | | | | | |
| | | 7,214 | | | | 7,475 | | | | | | 7,577 | | | | 8,112 | |
| | | | | | | | | | | | | | | | | | |
Corporate | | | 112 | | | | 133 | | | | | | 146 | | | | 145 | |
| | | | | | | | | | | | | | | | | | |
Total ongoing | | | 22,792 | | | | 22,920 | | | | | | 21,969 | | | | 21,557 | |
| | | | | | | | | | | | | | | | | | |
| | | | | |
Exited segments | | | | | | | | | | | | | | | | | | |
Industrial & Automotive: | | | | | | | | | | | | | | | | | | |
– Powertrain | | | 911 | | | | 1,538 | | | | | | 1,486 | | | | 1,249 | |
– Other I&A | | | 1,042 | | | | 1,584 | | | | | | 1,548 | | | | 1,496 | |
| | | | | | | | | | | | | | | | | | |
| | | 1,953 | | | | 3,122 | | | | | | 3,034 | | | | 2,745 | |
| | | | | |
Building Products: | | | | | | | | | | | | | | | | | | |
– Doors & Windows | | | — | | | | — | | | | | | — | | | | 480 | |
| | | | | | | | | | | | | | | | | | |
Total exited | | | 1,953 | | | | 3,122 | | | | | | 3,034 | | | | 3,225 | |
| | | | | | | | | | | | | | | | | | |
Total continuing operations | | | 24,745 | | | | 26,042 | | | | | | 25,003 | | | | 24,782 | |
| | | | | | | | | | | | | | | | | | |
| | | | | |
Discontinued operation | | | | | | | | | | | | | | | | | | |
Industrial & Automotive: | | | | | | | | | | | | | | | | | | |
– Sensors & Valves | | | 2,204 | | | | 2,140 | | | | | | 2,078 | | | | 2,015 | |
| | | | | | | | | | | | | | | | | | |
Total Group | | | 26,949 | | | | 28,182 | | | | | | 27,081 | | | | 26,797 | |
| | | | | | | | | | | | | | | | | | |
| * | Re-presented (see note 5A to the Group’s consolidated financial statements) |
During Fiscal 2011, 44% of the Group’s average employees were located in the US, 11% in Mexico, 10% in continental Europe, 8% in China, 7% in the UK, 5% in Canada, 4% in Brazil and 11% in the rest of the world. The location of employees in Fiscal 2011 is broadly consistent with Fiscal 2010 and Fiscal 2009.
As at December 31, 2011, the Group employed 24,683 people compared with 27,672 at December 31, 2010, of whom approximately 5% were employed on a temporary basis. The reduction in the work force compared with December 31, 2010 is due to the disposal during Fiscal 2011 of the Plews, Stackpole, Dexter Chassis and Ideal businesses.
There have been no significant work stoppages or labor disputes involving the Group’s employees in any of the last five years.
Some of the Group’s employees are members of labor unions and over many years the Group has been able to maintain successful relationships with the unions and employment organizations. Management believes that it has a good relationship with the Group’s employees. Certain of our employees are subject to collective bargaining agreements, in particular, with the Sheet Metal Workers Union in the US and Canada. Historically, the cost associated with the use of union labor versus non-union labor has not been materially different. To date, employee relations have been flexible and constructive as we have pursued lean manufacturing in our plants. In the US, there have not been any strikes or material work stoppages or business interruptions in over 15 years, the most recent being in 1993 at one of Ruskin’s plants in Lexington, KY. There have been several minor work stoppages with respect to our European employees, but short work stoppages are common in many European jurisdictions and the longest recent stoppage lasted for four days in Nevers, France in 2006.
Employee involvement and communication programs continue to be developed and are designed to provide equal opportunity to all, irrespective of sex, race, religion or color. Each company in the Group endeavors to provide equality of opportunity in recruiting, training, promoting and developing the careers of disabled persons.
78
Pinafore Holdings B.V.
Item 6E
E. Share ownership
As at March 5, 2012, the number of B Shares in the Company owned by our directors and executive officers was as follows:
| | | | |
| | | Number of B Shares | |
Directors | | | — | |
Executive officers | | | 3,095 | |
| | | | |
| | | 3,095 | |
| | | | |
The above interests in aggregate comprise less than 1% of the Company’s issued B Shares.
| Item 7. | Major shareholders and related party transactions |
A. Major shareholders
The Company’s issued share capital as at December 31, 2011 and as at March 5, 2012 consisted of 2 ordinary ‘A’ shares of €3,600 each (‘A Shares’) and 1,090,037 B Shares of one eurocent (€0.01) each.
As at March 5, 2012, one (50%) of the A Shares was held in the US. As at this date, the 342,495 of the Company’s B Shares were held in the US. Since certain of the Company’s shares are held in investment funds, the number of record holders in the US may not be representative of the number of beneficial holders or of where the beneficial holders are resident.
Shareholders of the Company do not have different voting rights, however there are different voting rights attaching to each class of shares, as described in note 39 to the Group’s consolidated financial statements.
To the Company’s knowledge, it is not directly or indirectly owned or controlled by any corporation, by any government or by any other natural or legal person or persons, severally or jointly.
Major shareholders at March 5, 2012
| | | | | | | | |
| | | Number of
shares held | | | Percentage of outstanding
shares held | |
A Shares | | | | | | | | |
Onex American Holdings II LLC | | | 1 | | | | 50.0 | % |
7607555 Canada Inc | | | 1 | | | | 50.0 | % |
| | |
B Shares | | | | | | | | |
CPPIB | | | 460,400 | | | | 42.2 | % |
Onex Partners III International LP | | | 286,303 | | | | 26.3 | % |
Onex American Holdings II LLC | | | 156,082 | | | | 14.3 | % |
Onex Tomkins Co-Invest LP | | | 155,477 | | | | 14.3 | % |
There are no arrangements currently known to the Company that would result in a change in control of the Company.
B. Related party transactions
Transactions with related parties are presented in note 46 to the Group’s consolidated financial statements.
The Sponsors and any members of management that hold capital stock or options to purchase capital stock of the Company are or will become parties to an investment agreement with the Co-operative and the Company, which provides for, among other things, the right of the Sponsors to designate directors of the Co-operative and the Company, restrictions on transfer of the equity of those entities held by such parties, tag-along-rights, drag-along rights, registration rights and certain voting rights.
We may occasionally enter into contracts with portfolio companies owned by the Sponsors, which may be material in amount. Any such transactions will be on terms that are no less favorable to us than those that would have been obtained in a comparable transaction by us with an unrelated party.
C. Interests of experts and counsel
Not applicable.
79
Pinafore Holdings B.V.
Item 8
| Item 8. | Financial Information |
A. Consolidated statements and other financial information
The Group’s consolidated financial statements are set out on pages F-2 to F-89 of this document (refer toItem 18‘Financial Statements’).
Legal Proceedings
The Group is, from time to time, party to legal proceedings and claims, which arise in the ordinary course of the business, including, in Brazil, ongoing litigation with the State of Sao Paulo Tax Department in respect of tax paid, totaling approximately $29 million (including penalties and interest). Based on the success of work to date, and legal advice received, management is of the opinion that the Group is able to rigorously defend its position against virtually all of this particular claim, plus the associated penalty and interest. The Group has nevertheless been requested to pledge certain of its assets as collateral for the disputed amount while the case is heard. Management does not anticipate that the outcome of this, or of any other current proceedings or known claims, either individually or in aggregate, will have a material adverse effect upon the Group’s financial position, results of operations or cash flows.
Dividend policy
The Company has not declared a dividend since its incorporation and has no formal policy regarding the payment of dividends. Our debt agreements for the senior secured credit facilities and the indenture governing the Second Lien Notes contain covenants that limit the ability of the Company to pay dividends.
Dividends may be paid out of profits allocated to the shareholders and from their respective share premium accounts. Any profit earned in a financial year is allocated to the shareholders after the adoption of the annual accounts for the financial year at a general meeting of the shareholders. Each of the A Shares is entitled to a cumulative profit allocation of €1,000 in respect of the financial year. Any profit for the financial year remaining after the allocation of profit to the A Shares is allocated to the B Shares on a pro rata basis. Dividends may be declared only on a resolution of the shareholders in general meeting and may not exceed the amount of the Company’s distributable reserves as determined in accordance with Dutch law (which currently comprises the excess of the Company’s net assets over its issued share capital).
B. Significant changes
Significant changes occurring between December 31, 2011 and February 20, 2012, the date on which the Group’s consolidated financial statements were signed, are detailed in note 47 to the Group’s consolidated financial statements.
80
Pinafore Holdings B.V.
Item 9
| Item 9. | The Offer and Listing |
A. Offer and listing details
The Company’s A and B Shares are not traded on any exchange.
B. Plan of distribution
Not applicable.
C. Markets
Not applicable.
D. Selling shareholders
Not applicable.
E. Dilution
Not applicable.
F. Expenses of the issue
Not applicable.
| Item 10. | Additional Information |
A. Share Capital
Not applicable.
B. Memorandum and Articles of Association
General
The Company is incorporated in Amsterdam, the Netherlands. The rights of the shareholders are set forth in the Articles of Association of the Company (the ‘Articles’) and are provided by applicable Dutch law. The following summary of key provisions of the Articles is qualified in its entirety by reference to the Articles.
Objects and purposes
The objects of the Company, set forth in Chapter 2, Article 3 of the Incorporation Articles are as follows:
(a) to incorporate, to participate in any way whatsoever, to manage, to supervise, to operate and to promote enterprises, businesses and companies;
(b) to finance businesses and companies;
I to supply advice and to render services to enterprises and companies with which the company forms a group and to third parties;
(d) to borrow, to lend and to raise funds, including the issue of bonds, promissory notes or other securities or evidence of indebtedness as well as to enter into agreement in connection with the aforementioned;
(e) to render guarantees, to bind the company and to pledge its assets for obligations of the companies and enterprises with which it forms a group and on behalf of third parties;
(f) to obtain, alienate, manage and exploit registered property and items of property in general;
(g) to trade in currencies, securities and items of property in general;
(h) to develop and trade patent, trade marks, licenses, know-how and other industrial property rights;
(i) to perform any and all activity of industrial, financial or commercial nature;
as well as everything pertaining the foregoing, relating thereto or conducive thereto, all in the broadest sense of the word.
The Management Board
The Management Board of the Company shall be constituted by two members A, two members B and four members C or such other number as determined by the General Meeting. At least 50% of the members of the Management Board should be residents of the Netherlands.
The body of the Company formed by shareholders and other persons entitled to vote (the ‘General Meeting’) shall appoint the members of the Management Board, determine their title and determine the remuneration and further conditions of employment for each member. The Management Board may lay down rules regarding the board’s decision-making process and may determine the duties of each member of the Management Board.
81
Pinafore Holdings B.V.
Item 10C
Subject to the restrictions imposed by the Articles, the Management Board is entrusted with the management of the Company. The Management Board is to meet on a regular basis but at least once a year, and whenever one member of the Management Board deems it necessary to meet.
Each member of the Management Board is entitled to cast one vote. All resolutions of the Management Board are to be adopted by a majority of the votes cast by the members who are present or represented at such meeting. At least one member A or one member B of the Management Board must vote in favor of the proposal, unless the Articles or any board rules adopted by the Management Board determine otherwise. In the event of a tie of votes, the proposal is rejected.
A member of the Management Board may be represented by a co-member authorized in writing, but a member may not act as a representative for more than one co-member.
Resolutions of the Management Board may also be adopted in writing without recourse to a Management Board meeting, provided they are adopted by a unanimous vote of all members of the Management Board who are, at the time of adoption, present in the Netherlands. A report shall be drawn up regarding resolutions thus adopted and the replies received shall be attached to the report, which shall be signed by one member A and one member B of the Management Board.
The Management Board shall authorized to represent the Company. A member A, a member B and a member C of the Management Board acting together are authorized to represent the Company. The Management Board may appoint officers with general or limited power to represent the Company.
In the event of a conflict of interest between the Company and a member, such member shall remain authorized to represent the Company. The General Meeting shall authorized to designate another person or persons to represent the Company for this purpose. No person may be designated unless he performs all his duties of managing the company in accordance with these Articles.
The General Meeting is entitled to require resolutions of the Management Board to be subject to its approval. These resolutions shall be clearly specified and notified to the Management Board in writing.
If a member of the Management Board is absent or prevented from performing his duties, the remaining members of the Management Board shall be temporarily entrusted with the entire management of the Company with due observance of the requirement that at each time at least one member A and one member B should be involved with the management of the Company. If all members of the Management Board, all members A or all members B are absent or prevented from performing their duties, the management of the company shall be temporarily entrusted to the person designated for this purpose by the General Meeting. In case of the absence of the chairman of the managing board, the meeting shall appoint its chairman.
Shares
The Company’s authorized capital amounts to €90,000 and is divided into:
(a) ten A Shares, with a nominal value of €3,600 each; and
(b) 5,400,000 B Shares, with a nominal value of one eurocent (€0.01) each.
All shares are to be registered shares and no share certificates shall be issued. The Management Board shall keep a register in which the names and addresses of all holders of shares are recorded, as well as those with a right of usufruct (‘Life Interest’) or a pledge on the shares, showing the date on which they acquired the shares or rights, the date of the acknowledgement or notification and, if applicable, the amount paid on each share and the class of the shares.
Share issues
The issuance of shares may only be effected pursuant to a resolution of the Management Board. A shareholder has no pre-emptive right upon the issuance of shares.
The full nominal amount of each share must be paid in on issue. The Management Board shall be authorized to perform legal acts pertaining to a non-cash contribution on shares.
When issuing shares, the Company shall not be entitled to subscribe for its own shares. The Company may, pursuant to a resolution of the Management Board and subject to the relevant provisions of the law, acquire fully paid in shares in its own capital or registered depository receipts of shares in the capital of the Company (‘Depository Receipts’), up to the maximum permitted by law. No voting rights may be exercised in the General Meeting for any share or Depository Receipts held by the Company or any of its subsidiaries.
The Company may give loans with a view to the subscription for or acquisition of shares or Depository Receipts, but only up to the amount of the distributable reserves.
Share capital reductions, share disposals and share transfers
The disposal of shares or Depository Receipts held by the Company shall be effected pursuant to a resolution of the Management Board, stipulating the conditions of the disposal. The disposal of shares held by the Company shall be effected with due observance of the provisions of the blocking clause.
The General Meeting may, subject to the relevant provisions of the law, resolve to reduce the issued capital. The notice of the relevant General Meeting shall mention the purpose of the capital reduction and the manner in which it is to be achieved. The entire issued capital must be represented at the General Meeting and the resolution must be effected unanimously.
The transfer of a share or a right thereon requires a deed drawn up in the presence of a civil law notary registered in the Netherlands. Unless the Company itself is party to the legal act, the rights attached to the share can only be exercised after the Company has acknowledged the legal act or the deed has been served on it in accordance with the relevant provisions of the law.
On the creation of a life interest or a pledge on shares the right to vote can, subject to the provisions of the law, be given to the beneficiary of the life interest or to the pledgee.
A pledgee without the right to vote shall not have the rights accruing to Depositary Receipts Holders, unless provided otherwise by the establishing of the right of pledge.
82
Pinafore Holdings B.V.
Item 10C
In order to be valid, any transfer of shares requires the approval of the Management Board.
A shareholder wishing to transfer shares (the ‘Applicant’) must give notice of their intention to the Management Board specifying the number of shares they wish to transfer and the person or the persons to whom they wishes to transfer the shares.
The Management Board shall be obliged to decide on the transfer of shares within six weeks from the date of receipt of the notice.
If:
(a) no such decision has been made within the six week period;
(b) within that time no resolution has been adopted regarding the request for approval; or
(c) such approval has been refused without the Management Board having informed the Applicant, at the same time as the refusal, of one or more interested parties who are prepared to purchase, in cash, all of the shares in question;
the approval requested shall be deemed to have been granted.
Unless the Applicant and the interested party(ies) agree otherwise, the purchase price of the shares shall be determined by an expert. The Applicant is entitled to withdraw within one month of the price being communicated to him in writing. The costs of determining the price will be borne by the Applicant if they withdraw, or, if the shares are purchased, the Applicant will bear half the costs and the purchasers the other half, with each purchaser contributing in proportion to the number of shares purchased by him. In any other event, the costs will be borne by the Company.
In the case of the death of a shareholder, the suspension of payments, bankruptcy or receivership of a shareholder and in the case of the appointment of an administrator by the court over the property of a shareholder, the shares of the shareholder concerned shall be offered for sale to the other shareholders subject to the provisions below. From this time, the shareholder is no longer authorized to exercise the right to attend meetings, cast votes or exercise the right of payments.
The obligation to offer the shares for sale must be complied with within one month after it has arisen. The shares offered shall be sold to the holders of B Shares designated by the meeting in proportion to their existing holdings. The Company itself can be purchaser of the shares with the consent of the offeror.
The offeror may not withdraw his/her offer, however, if not all shares are to be purchased, the offeror shall have the right to keep his/her shares. The shareholder shall as of that moment again be authorized to exercise the right to attend meetings, cast a vote and exercise the right of payments.
If the obligation to offer is not complied with in time, the Company shall be irrevocably empowered to offer such shares for sale.
The above provisions do not apply if the shareholder is obligated by law to transfer his/her shares to a prior shareholder.
Annual accounts
Annually, not later than five months after the end of the financial year, unless by reason of special circumstances this term is extended by the General Meeting by not more than six months, the Management Board shall draw up Annual Accounts.
The Management Board shall deposit the Annual Accounts for inspection by the shareholders and Depository Receipt Holders at the office of the Company. The Annual Accounts shall be signed by all the members of the Management Board; if the signature of one or more of them is lacking, this shall be stated and reasons given.
The General Meeting shall adopt the Annual Accounts and the Company shall publish the Annual Accounts within eight days following their adoption, subject to statutory exemptions, if applicable.
The Company maintains two share premium accounts so as to record the premium on the issue of the A Shares separately from the premium on the issue of the B Shares. Provided the Company has sufficient distributable profits as determined in accordance with Dutch law, the holders of the A Shares and the B Shares may resolve in a General Meeting of their respective classes of shares to pay dividends from their respective share premium accounts.
The Company also maintains a dividend reserve A and a dividend reserve B. The holders of shares A are exclusively entitled to the dividend reserve A. The holders of shares B are exclusively entitled to the dividend reserve B.
The distribution of profits earned in a financial year shall be determined by the General Meeting provided that:
(a) each A Share is entitled to a maximum distribution of €1,000 per financial year;
(b) the remaining profits shall be allocated to the shares B on a pro rata basis.
If and to the extent that the General Meeting resolves not to distribute any profits, these profits shall be added to the dividend reserves of the Company in accordance with the principles set out under (a) and (b) above.
The general meeting of holders of shares A and the general meeting of holders of shares B can resolve to make payments to their respective share premium reserves and dividend reserves.
Meetings of shareholders
The Annual Meeting shall be held annually, and not later than six months after the end of the financial year, for the purpose of discussion and adoption of the Annual Accounts.
Other General Meetings of Shareholders shall be held as often as the Management Board deems them necessary.
General Meetings of Shareholders shall be convoked by the Management Board, by letter mailed to the addresses of the shareholders and Depository Receipt Holders. General Meetings of Shareholders may also be convoked by an electronic notice sent to the address of the shareholders and Depository Receipt Holders as notified for this purpose, provided that the relevant shareholders and Depository Receipt Holders have given their consent thereto.
The convocation shall take place no later than on the fifteenth day prior to the date of the meeting.
83
Pinafore Holdings B.V.
Item 10C
The General Meetings of shareholders shall be held in the municipality in which the Company has its official seat.
The General Meeting shall appoint its chairman. Until that moment a member of the Management Board shall act as chairman and in the absence of such a member, the eldest person at the meeting shall act as chairman.
As long as the entire issued capital and all Depository Receipt Holders are represented at a General Meeting, valid resolutions can be adopted on all subjects brought up for discussion, even if the formalities prescribed by law or by the Articles for the convocation and holding of meetings have not been complied with, provided such resolutions are adopted unanimously.
The Management Board keeps a record of the resolutions made. If the Management Board is not represented at a meeting, the chairman of the meeting shall provide the Management Board with a transcript of the resolutions made as soon as possible after the meeting. The records shall be deposited at the offices of the Company for inspection by the shareholders and Depository Receipt Holders. Upon request each of them shall be provided with a copy or an extract of such record at not more than the actual costs.
Meetings of holders of shares of one class shall be convened by the Management Board or by a holder of one or more shares of the relevant class, by letter to the addresses of the holders of shares and the holders of Depository Receipts of the relevant class.
Voting rights
Each share A confers the right to cast 360,000 votes. Each share B confers the right to cast one vote. The right to take part in the meeting may be exercised by a proxy authorized in writing. To the extent that the law or the Articles do not require a qualified majority, all resolutions shall be adopted by a majority of the votes cast.
If there is a tie the proposal is rejected.
Resolutions of shareholders may also be adopted in writing without recourse to a General Meeting of Shareholders, provided they are adopted by a unanimous vote of all shareholders entitled to vote. The Management Board shall keep a record of the resolutions thus made.
Amendment of the Articles and dissolution
When a proposal of the Management Board to amend the Articles or to dissolve the Company is to be made to the General Meeting, this must be mentioned in the notification of the General Meeting of Shareholders. A copy of a proposal to amend the Articles, including the text of the proposed amendment, must at the same time be deposited and held available for inspection at the Company’s office until the end of the meeting.
In the event of dissolution of the Company by virtue of a resolution of the General Meeting, the members of the Management Board shall be charged with the liquidation of the business of the Company. The balance of the Company remaining after payment of debts, shall be transferred to the shareholders.
C. Material Contracts
During the two years preceding the end of Fiscal 2011, there have been no material contracts, other than contracts entered into in the ordinary course of business, to which the Company or any member of the Group is a party.
Indenture
The Issuers have issued $1,150 million in aggregate principal amount of Second Lien Notes under the Indenture, dated as of September 29, 2010, among the Issuers, the Company as a guarantor, certain other guarantors and Wilmington Trust, National Association (successor by merger to Wilmington Trust FSB), as trustee and as collateral agent. The Group redeemed $115.0 million of its Second Lien Notes in September 2011.
The Second Lien Notes mature on October 1, 2018, and interest on the Second Lien Notes is due each April 1 and October 1. The Second Lien Notes and the guarantees are senior secured second lien obligations of the Issuers and the guarantors, respectively, and rank equal in right of payment with all of its future senior unsecured debt to the extent of the collateral securing the Second Lien Notes, senior to all of the Issuers and guarantors’ existing and future subordinated debt and effectively subordinated to all of the Issuers’ and guarantors’ first priority secured debt, including the borrowings under the senior secured credit facilities.
The Second Lien Notes are secured by substantially all of the property and assets, in each case, that are held by the Issuers or any of the US guarantors, as well as collateral in non-US jurisdictions, which will consist of those types of assets customarily provided as security for bank loans with certain agreed exceptions.
The Issuers and the guarantors are permitted to incur certain liens on the collateral pursuant to the Indenture’s terms and these permitted liens have priority over the liens in favor of the Second Lien Notes and the guarantees.
At any time prior to October 1, 2013, but not more than once in any twelve-month period, the Issuers may redeem up to 10% of the original aggregate principal amount of the Second Lien Notes at a redemption price of 103% of the principal amount plus accrued and unpaid interest, if any. Additionally, at any time prior to October 1, 2014, the Issuers may redeem the Second Lien Notes at their option, in whole at any time or in part from time to time, at a redemption price equal to 100% of the principal amount of the Second Lien Notes redeemed plus the applicable premium (as such term is defined in the Indenture) as of, and accrued and unpaid interest and additional interest to, the applicable redemption date. The Issuers may also redeem the Second Lien Notes in whole or in part, at any time at redemption prices based on the schedule below:
| | | | |
| | | Redemption price | |
During the year commencing: | | | | |
– October 1, 2014 | | | 104.50 | % |
– October 1, 2015 | | | 102.25 | % |
– October 1, 2016 and thereafter | | | 100.00 | % |
84
Pinafore Holdings B.V.
Item 10C
If we experience a change of control (as such term is defined in the Indenture), the holders of our Second Lien Notes will have the right to require the Issuers to purchase some or all of their Second Lien Notes at a purchase price equal to 101% of their principal amount plus accrued and unpaid interest, if any, and additional amounts, if any, to the date of repurchase.
The Indenture contains certain covenants which, among other things, restrict our ability to (i) incur or guarantee additional indebtedness; (ii) pay dividends or make other distributions to repurchase or redeem our stock; (iii) make investments or other restricted payments; (iv) create liens; (v) enter into certain transactions with affiliates; (vi) enter into agreements that restrict the ability of our material subsidiaries to pay dividends; and (vii) consolidate, merge or sell all or substantially all of our assets.
We agreed to file a registration statement with the SEC relating to an offer to exchange the initial notes for publicly tradable notes that have identical terms (except for terms concerning additional interest and transfer restrictions). On October 21, 2011 the Issuers launched an exchange offer to exchange up to $1,035 million of the 9% Second Lien Notes due in 2018 for like principal amounts of Second Lien Notes due in 2018 that had been registered under the Securities Act of 1933, as amended.
As of November 23, 2011 when the exchange offer closed, $1,034,977,000 or 99.998% of the outstanding aggregate principal amount of the Second Lien Notes had been validly tendered and accepted for exchange by the Issuers.
The Committee on Uniform Securities Identification Procedures and International Securities Identification Number for the new Second Lien Notes are 890028 AA3 and US890027AA35, respectively.
The exchange notes together with the unregistered Second Lien Notes that remain outstanding after the completion of the exchange offer are treated as a single class of debt securities under the Indenture.
US Second Lien Security Agreement
As security for our obligations under the Indenture, the Issuers and the US guarantors have agreed to grant a security interest in certain of our assets pursuant to a Security Agreement, dated as of September 29, 2010, between the grantors named therein and Wilmington Trust, National Association (successor by merger to Wilmington Trust FSB), as collateral agent. The US guarantors’ obligations under the Indenture are secured by a lien on substantially all of their property and assets (subject to certain exclusions).
Credit Agreement
The Issuers entered into senior secured credit facilities pursuant to a Credit Agreement, dated as of July 27, 2010, as amended and restated on August 6, 2010, as further amended and restated on September 21, 2010, as further amended on September 28, 2010, as further amended on February 17, 2011, and as further amended on June 30, 2011, among the Issuers, the Pinafore Holdings B.V. as a guarantor, certain other guarantors and Citibank, N.A., as administrative agent, and Citicorp USA, Inc., as collateral agent, and affiliates of the initial purchasers as agents and/or lenders. The senior secured credit facilities consist of (i) a senior secured revolving credit facility, (ii) a Term Loan A credit facility and (iii) a Term Loan B credit facility.
The revolving credit facility provides for multi-currency revolving loans and letters of credit up to an aggregate principal amount of $300.0 million, with a letter of credit sub-facility of $100.0 million. As at December 31, 2011, there were no drawings for cash under the revolving credit facility but there were letters of credit outstanding amounting to $66.1 million. Our ability to draw under our senior secured revolving credit facility or issue letters of credit thereunder after the closing date is conditioned upon, among other things, our delivery of prior written notice of borrowing or issuance, as applicable, our ability to reaffirm the representations and warranties contained in our credit agreement and the absence of any default or event of default under our senior secured credit facilities.
We initially borrowed $300.0 million under the Term Loan A credit facility and $1,700.0 million under the Term Loan B credit facility. Subject to certain conditions, the senior secured revolving credit facility may be increased by up to $100.0 million in additional commitments and the Term Loan B credit facility may be increased by, or new term loan facilities established up to, $400.0 million in additional commitments (less any increase in the revolving credit facility).
The Term Loan A credit facility and the revolving credit facility mature on September 29, 2015 and the Term Loan B credit facility matures on September 29, 2016. The Term Loan A credit facility is subject to quarterly amortization payments of 2.5% of the original principal amount of all Term A Loans and the Term Loan B credit facility is subject to quarterly amortization payments of 0.25% of the original principal amount of all Term B Loans, in each case, less certain prepayments, and commencing on March 31, 2011 with the balance payable on the applicable maturity date.
We may voluntarily prepay loans or reduce commitments under the senior secured credit facilities, in whole or in part, subject to minimum amounts without premium or penalty, other than in the case of certain re-pricing transactions with respect to the Term Loan B credit facility prior to August 17, 2011, which were subject to a 1% premium. If we prepay LIBOR rate loans other than at the end of an applicable interest period, it is required to reimburse the lenders for any consequential losses or expenses. We must prepay (i) the Term Loan A credit facility and Term Loan B credit facility with net cash proceeds of asset sales, casualty and condemnation events, and the incurrence of indebtedness (other than indebtedness permitted to be incurred) and (ii) the Loans in an amount equal to a percentage of excess cash flow based on a total leverage to EBITDA ratio, in each case subject to certain exceptions such as reinvestment rights.
We are required to make prepayments under our revolving credit facility at any time when, and to the extent that, the aggregate amount of the outstanding loans and letters of credit under the revolving credit facility exceeds the aggregate amount of commitments in respect of the revolving credit facility.
As at December 31, 2011, the principal amount outstanding under the Term Loan A credit facility was $238.1 million and that under the Term Loan B credit facility was $1,503.7 million.
Our obligations under the senior secured credit facilities are guaranteed by the Company and all of our direct and indirect wholly owned subsidiaries (subject to certain exceptions to be agreed, including exclusion of any non-US subsidiaries of a US entity) and secured by a first lien on substantially all of their assets, including capital stock of subsidiaries (subject to certain exceptions). The relative rights governing the liens on the senior secured credit facilities and those securing the Second Lien Notes are governed by an intercreditor agreement.
85
Pinafore Holdings B.V.
Item 10C
Our senior secured credit facilities contain customary negative covenants, including, but not limited to, restrictions on the Company and its subsidiaries’ ability to merge and consolidate with other companies, incur indebtedness, grant liens or security interests on assets, make acquisitions, loans, advances or investments, pay dividends, sell or otherwise transfer assets, optionally prepay or modify the terms of any junior indebtedness, enter into transactions with affiliates or change our line of business. Our senior secured credit facilities require the maintenance of a minimum interest coverage ratio and a maximum total leverage ratio on a quarterly basis, and impose an annual cap on capital expenditures (subject to certain exceptions and ability to rollover unused amounts).
Our senior secured credit facilities contain customary affirmative covenants, including, but not limited to, delivery of financial and other information to the administrative agent, notice to the administrative agent upon the occurrence of certain material events, preservation of existence, payment of material taxes and other claims, maintenance of properties and insurance, access to books and records by and meetings with the lenders, compliance with applicable laws and regulations, including environmental laws, and further assurances and provision of additional collateral and guarantees.
Our senior secured credit facilities provide that, upon the occurrence of certain events of default, our obligations thereunder may be accelerated and the lending commitments terminated. Such events of default include payment defaults to the lenders, material inaccuracies of representations and warranties, covenant defaults, cross-defaults to other material indebtedness, including the Second Lien Notes, voluntary and involuntary bankruptcy proceedings, material money judgments, material pension-plan events, certain change of control events and other customary events of default.
D. Exchange controls
There are no limits under the laws of The Netherlands or in our Articles on non-residents of The Netherlands holding or voting with our ordinary shares. Currently, there are no exchange controls under the laws of The Netherlands on the conduct of our operations or affecting the remittance of dividends, except that the transfer of funds to jurisdictions subject to general economic sanctions adopted in connection with policies of the United Nations, European Commission or similar measures imposed directly by the Government of the Netherlands may be restricted.
E. Taxation
Certain United States Federal Income Tax Considerations
The following is a summary of certain United States federal income tax consequences of the purchase, ownership, and disposition of the Second Lien Notes. It deals only with Second Lien Notes held as capital assets and acquired at their original issuance for their “issue price” within the meaning of the Internal Revenue Code of 1986, as amended (the ‘Code’) (i.e. the first price at which a substantial amount of Second Lien Notes is sold to the public for cash excluding sales to bond houses, brokers, or similar persons or organizations acting in the capacity of underwriters, placement agents or wholesalers). If a holder purchases Second Lien Notes at a price other than the issue price, the rules regarding the taxation of amortizable bond premium or market discount may also apply to such holder. Holders should consult their tax advisors regarding this possibility. The summary does not address special classes of holders, such as dealers in securities or currencies, life insurance companies, tax-exempt entities, persons that hold a Second Lien Note in connection with an arrangement that completely or partially hedges the Second Lien Note, securities traders that use a mark-to-market method of accounting, banks or financial institutions, persons liable for the alternative minimum tax, persons holding Second Lien Notes as part of a conversion transaction, a constructive sale or a straddle, certain former citizens or residents of the United States, entities that are treated as partnerships for United States federal income tax purposes, or United States Holders (as defined below) whose “functional currency” is not the United States dollar. The summary is based upon the Code, and Treasury regulations, rulings and judicial decisions thereunder as of the date of this annual report. Such authorities may be repealed, revoked or modified so as to produce United States federal income tax consequences different from those discussed below.
Holders should consult their tax advisors concerning United States federal taxes (such as estate or gift taxes and taxes on certain investment income pursuant to the newly enacted healthcare legislation) and any state, local or foreign tax consequences in their particular situations.
Characterization of the Second Lien Notes
For United States federal income tax purposes, while not free from doubt, we intend to treat the Second Lien Notes as debt of Tomkins, LLC and to treat interest income on the Second Lien Notes as from sources within the United States. The determination of whether an instrument is debt or equity, and the entity or entities that is or are treated as the issuer of such instrument, for United States federal income tax purposes is an inherently factual question and no one factor is determinative. The determination of the source for interest income on a debt instrument issued by an entity such as Tomkins, LLC is also subject to uncertainty. There can be no assurance that the Internal Revenue Service (‘IRS’) will not contend, and that a court will not ultimately hold, that the Second Lien Notes are equity, debt of a different entity, and/or that interest income on the Second Lien Notes (wholly or partially) is from sources without the United States. In such event, holders of the Second Lien Notes could be subject to different tax consequences than what is described below. This discussion assumes that the Second Lien Notes are properly treated as debt of Tomkins, LLC and interest income on the Second Lien Notes is treated as from sources within the United States for United States federal income tax purposes. Holders should consult their tax advisors regarding whether the Second Lien Notes would be properly treated as debt of Tomkins, LLC and whether interest on the Second Lien Notes should be treated as foreign source income.
86
Pinafore Holdings B.V.
Item 10C
United States Holders
For purposes of this discussion, a “United States Holder” means a beneficial owner of a Second Lien Note that is, for United States federal income tax purposes (i) an individual citizen or resident of the United States, (ii) a corporation or other entity treated as a corporation for United States federal income tax purposes, created or organized in or under the laws of the United States, any state of the United States or the District of Columbia, (iii) an estate the income of which is subject to United States federal income tax regardless of its source and (iv) a trust, if either (A) a court within the United States is able to exercise primary supervision over the administration of the trust, and one or more United States persons have the authority to control all substantial decisions of the trust or (B) a valid election is in effect under applicable Treasury regulations to treat such trust as a United States person.
If a partnership (including an entity treated as a partnership for United States federal income tax purposes) holds Second Lien Notes, the United States federal income tax treatment of a partner generally will depend on the status of the partner and the activities of the partnership. Partners and their partnerships holding Second Lien Notes should consult their tax advisors.
Payments of Stated Interest
Payments of stated interest on a Second Lien Note will be taxable to a United States Holder as ordinary interest income at the time they are received or accrued, depending on the United States Holder’s regular method of accounting for United States federal income tax purposes.
Sale, Exchange, Redemption, or Other Taxable Disposition
A United States Holder generally will recognize gain or loss upon the sale, exchange, redemption or other taxable disposition of a Second Lien Note, equal to the difference between the amount realized (less an amount equal to any accrued and unpaid interest, which will be taxable as ordinary interest income as discussed above to the extent not previously included in income by the United States Holder) and the United States Holder’s adjusted tax basis in the Second Lien Note. A United States Holder’s adjusted tax basis in a Second Lien Note will, in general, be its cost for such Second Lien Note. Such gain or loss will be capital gain or loss and will be long-term capital gain or loss if the United States Holder has held the Second Lien Note for more than one year. Net long-term capital gain of non-corporate United States Holders are eligible for reduced rates of taxation. The deductibility of capital losses is subject to limitations.
Backup Withholding and Information Reporting
A United States Holder may be subject to a backup withholding (currently at a rate of 28% and scheduled to increase to 31% in 2013) on interest payments, on the Second Lien Notes or on the proceeds received upon the sale or other taxable disposition of such Second Lien Notes (including a redemption or retirement). Certain holders (including, among others, corporations and certain tax-exempt organizations) generally are not subject to backup withholding. A United States Holder will be subject to a backup withholding tax if such holder is not otherwise exempt and:
| • | | fails to furnish its taxpayer identification number, which, for an individual, is ordinarily his or her social security number; |
| • | | furnishes an incorrect taxpayer identification number; |
| • | | is notified by the IRS that such holder is subject to backup withholding because it has failed to properly report payments of interest or dividends; or |
| • | | fails to certify, under penalties of perjury, that it has furnished its correct taxpayer identification number and that the IRS has not notified the United States Holder that it is subject to backup withholding. |
United States Holders should consult their tax advisors regarding their qualification for an exemption from backup withholding and the procedures for obtaining such an exemption, if applicable. Backup withholding is not an additional tax, and taxpayers may use amounts withheld as a credit against their United States federal income tax liability or may claim a refund, if they timely provide certain information to the IRS.
In general, information reporting requirements will apply to payments of interest on a Second Lien Note and the proceeds of the sale or other taxable disposition of a Second Lien Note within the United States to non-exempt United States Holders.
Non-United States Holders
As used herein, a “Non-United States Holder” is a beneficial owner of a Second Lien Note that, for United States federal income tax purposes, is neither a United States Holder nor a partnership (including an entity treated as a partnership for United States federal income tax purposes).
Effectively Connected Income or Gain
If the income or gain on the Second Lien Notes is “effectively connected with the conduct of a trade or business within the United States” by the Non-United States Holder (and if a treaty applies, is attributable to a permanent establishment or fixed base in the United States of a Non-United States Holder) holding the Second Lien Note, such income or gain will be subject to tax essentially in the same manner as if the Second Lien Notes were held by a United States Holder, as discussed above, and in the case of a Non-United States Holder that is a foreign corporation, may also be subject to the branch profits tax, currently at a 30% rate (or a reduced rate specified by an applicable income tax treaty). The interest income in respect of the Second Lien Notes would be exempt from United States withholding tax (described below) if the Non-United States Holder claims the exemption by providing a properly completed IRS Form W-8ECI (or other appropriate form).
Payments of Interest
If the interest income on the Second Lien Notes is not “effectively connected with the conduct of a trade or business within the United States” (and if a treaty applies, such interest is not attributable to a permanent establishment or fixed base in the United States), then, under the portfolio interest exemption of current United States federal will not be subject to withholding of United States federal income tax if the Non-United States Holder (1) does not actually or constructively own 10% or more of the capital or profits interest in us, (2) is not a bank receiving interest pursuant to a loan agreement entered into in the ordinary course of its trade or business, (3) is not a controlled foreign corporation related to us directly or constructively and (4) provides appropriate certification.
87
Pinafore Holdings B.V.
Item 10E
Under current law, the certification requirement will be met if either:
| • | | In accordance with specified procedures, the Non-United States Holder provides to us or our paying agent a Form W-8BEN (or a suitable substitute or successor form), that is signed under penalties of perjury, includes its name and address, and contains a certification that the holder is not a United States person; or |
| • | | the Non-United States Holder provides a Form W-8BEN (or a suitable substitute or successor form), signed under the penalties of perjury, to an institution such as a securities clearing organization, bank, or other financial institution who holds customers’ securities in the ordinary course of its trade or business and holds the Second Lien Notes on behalf of a beneficial owner, and (b) the institution certifies to us, or our paying agent, under the penalties of perjury, that such statement has been received by it from the beneficial owner, directly or through another intermediary financial institution, and furnishes us or our paying agent with a copy thereof. |
Treasury regulations provide alternative documentation procedures for satisfying the certification requirement described above. Such regulations add intermediary certification options for certain qualifying agents.
If a Non-United States Holder does not qualify for the portfolio interest exemption, interest payments to the Non-United States Holder will be subject to United States withholding at a 30% rate unless (A) such holder provides a properly completed IRS Form W-8BEN (or other appropriate form) claiming an exemption from or reduction in withholding under an applicable tax treaty, or (B) such interest is effectively connected with such holder’s conduct of a United States trade or business (and, if a treaty applies, is attributable to a permanent establishment or fixed base in the United States) and such holder provides a properly completed IRS Form W-8ECI (or other appropriate form).
Sale, Exchange, Redemption or Other Taxable Disposition
A Non-United States Holder generally will not be subject to United States federal income tax or withholding tax on any gain realized on the sale, exchange, redemption, retirement at maturity or other taxable disposition of a Second Lien Note unless (i) the gain is effectively connected with the conduct of a trade or business within the United States by the Non-United States Holder (and, if a treaty applies, is attributable to a permanent establishment or fixed base in the United States of a Non-United States Holder) or (ii) in the case of a Non-United States Holder who is an individual, such Non-United States Holder is present in the United States for a period or periods aggregating I83 days or more during the taxable year of the disposition and certain other conditions are met.
If the first exception applies, gain on a Second Lien Note that is effectively connected with the conduct by a Non-United States Holder of a trade or business within the United States (and if a treaty applies, such income or gain is attributable to a permanent establishment or fixed base in the United States of a Non-United States Holder) will be subject to United States federal income tax on a net income basis at the rates applicable to United States persons generally (and, with respect to corporate Non-United States Holders, may also be subject to a 30% branch profits tax or such lower rate as may be specified by an applicable income tax treaty). If the second exception applies, the Non-United States Holder generally will be subject to tax at a rate of 30% (or at a reduced rate under an applicable income tax treaty) on such Holder’s net United States source capital gain.
Any amounts in respect of accrued interest will generally be treated as described in “—Payments of Interest,” above.
Information Reporting and Backup Withholding
United States information reporting requirements and backup withholding (currently at a rate of 28% and scheduled to increase to 31% in 2013) will not apply to payments on a Second Lien Note to a holder that is a Non-United States Holder provided that a certification of non-United States status, as discussed above, has been received and neither the Company nor its paying agent has actual knowledge that the payee is not a Non-United States Holder. However, information reporting on IRS Form 1042-S may still apply with respect to interest payments.
Information reporting requirements and backup withholding will generally not apply to any payment of the proceeds of the sale or other taxable disposition of a Second Lien Note effected outside the United States by a foreign office of a “broker” (as defined in applicable Treasury regulations), provided that such broker (1) is a Non-United States Holder, (2) derives less than 50% of its gross income for certain periods from the conduct of a trade or business in the United States and (3) is not a controlled foreign corporation as to the United States or a foreign partnership doing business in the United States or in which United States persons own more than 50% of the income or capital interests (a person described in (1), (2) and (3) being hereinafter referred to as a “foreign controlled person”). Payment of the proceeds of the sale of a Second Lien Note effected outside the United States by a foreign office of any broker that is not a foreign controlled person will generally not be subject to backup withholding, but will generally be subject to information reporting requirements unless such broker has documentary evidence in its records that the beneficial owner is a Non-United States Holder and certain other conditions are met, or the beneficial owner otherwise establishes an exemption.
Non-United States Holders should consult their tax advisors regarding application of withholding and backup withholding in their particular circumstance and the availability of any procedure for obtaining an exemption from information reporting and backup withholding under current Treasury regulations. Backup withholding is not an additional tax and taxpayers may use amounts withheld as a credit against their United States federal income tax liability or may claim a refund as long as they timely provide certain information to the IRS.
Netherlands Taxation
General
The following is a general summary of certain Netherlands tax consequences of the acquisition, holding and disposal of the Second Lien Notes. This summary does not purport to describe all possible tax considerations or consequences that may be relevant to a holder or prospective holder of Second Lien Notes and does not purport to deal with the tax consequences applicable to all categories of investors, some of which (such as investors that are subject to taxation in Bonaire, Sint Eustatius and Saba and trusts or similar arrangements) may be subject to special rules. In view of its general nature, it should be treated with corresponding caution. Holders or prospective holders of Second Lien Notes should consult with their tax advisers with regard to the tax consequences of investing in the Second Lien Notes in their particular circumstances. The discussion below is included for general information purposes only.
88
Pinafore Holdings B.V.
Item 10E
Except as otherwise indicated, this summary only addresses Netherlands national tax legislation and published regulations, as in effect on the date hereof and as interpreted in published case law until this date, without prejudice to any amendment introduced at a later date and implemented with or without retroactive effect.
Withholding tax
All payments of principal and/or interest made by Tomkins, LLC under the Second Lien Notes may be made free of withholding or deduction of, for or on account of any taxes of whatever nature imposed, levied, withheld or assessed by the Netherlands or any political subdivision or taxing authority thereof or therein.
Taxes on income and capital gains
Please note that the summary in this section does not describe the Netherlands tax consequences for:
| • | | holders of Second Lien Notes if such holders, and in the case of individuals, his/her partner or certain of their relatives by blood or marriage in the direct line (including foster children), have a substantial interest or deemed substantial interest in the issuer of the Second Lien Notes under The Netherlands Income Tax Act 2001 (in Dutch: “Wet inkomstenbelasting 2001”). Generally speaking, a holder of securities in a company is considered to hold a substantial interest in such company, if such holder alone or, in the case of individuals, together with his/her partner (as defined in The Netherlands Income Tax Act 2001), directly or indirectly, holds (i) an interest of 5% or more of the total issued and outstanding capital of that company or of 5% or more of the issued and outstanding capital of a certain class of shares of that company; or (ii) rights to acquire, directly or indirectly, such interest; or (iii) certain profit sharing rights in that company that relate to 5% or more of the company’s annual profits and/or to 5% or more of the company’s liquidation proceeds. A deemed substantial interest arises if a substantial interest (or part thereof) in a company has been disposed of, or is deemed to have been disposed of, on a non-recognition basis; |
| • | | pension funds, investment institutions (in Dutch “fiscale beleggingsinstellingen”), exempt investment institutions (in Dutch: “vrijgestelde beleggingsinstellingen”) (as defined in The Netherlands Corporate Income Tax Act 1969; in Dutch: “Wet op de vennootschapsbelasting 1969”) and other entities that are exempt from Netherlands corporate income tax; and |
| • | | holders of Second Lien Notes who are individuals for whom the Second Lien Notes or any benefit derived from the Second Lien Notes are a remuneration or deemed to be a remuneration for activities performed by such holders or certain individuals related to such holder (as defined in The Netherlands Income Tax Act 2001). |
Residents of the Netherlands
Generally speaking, if the holder of the Second Lien Notes is an entity that is a resident or deemed to be resident of the Netherlands for Netherlands corporate income tax purposes, any payment under the Second Lien Notes or any gain or loss realized on the disposal or deemed disposal of the Second Lien Notes is subject to Netherlands corporate income tax at a rate of 25% (a corporate income tax rate of 20% applies with respect to taxable profits up to €200,000, the bracket for 2012).
If a holder of the Second Lien Notes is an individual, resident or deemed to be resident of the Netherlands for Netherlands income tax purposes (including the non-resident individual holder who has made an election for the application of the rules of The Netherlands Income Tax Act 2001 as they apply to residents of the Netherlands), any payment under the Second Lien Notes or any gain or loss realized on the disposal or deemed disposal of the Second Lien Notes is taxable at the progressive income tax rates (with a maximum of 52%), if:
| • | | the Second Lien Notes are attributable to an enterprise from which the holder of the Second Lien Notes derives a share of the profit, whether as an entrepreneur or as a person who has a co entitlement to the net worth of such enterprise without being a shareholder (as defined in The Netherlands Income Tax Act 2001); or |
| • | | the holder of the Second Lien Notes is considered to perform activities with respect to the Second Lien Notes that go beyond ordinary asset management (in Dutch “normaal, actief vermogensbeheer”) or derives benefits from the Second Lien Notes that are (otherwise) taxable as benefits from other activities (in Dutch: “resultaat uit overage werkzaamheden”). |
If the above-mentioned conditions (i) and (ii) do not apply to the individual holder of the Second Lien Notes, such holder will be taxed annually on a deemed income of 4% of his/her net investment assets for the year at an income tax rate of 30%. The net investment assets for the year are the fair market value of the investment assets less the allowable liabilities on 1 January of the relevant calendar year. The Second Lien Notes are included as investment assets. A tax free allowance may be available. An actual gain or loss in respect of the Second Lien Notes is as such not subject to Netherlands income tax.
Non residents of the Netherlands
A holder of the Second Lien Notes that is neither resident nor deemed to be resident of the Netherlands nor has made an election for the application of the rules of The Netherlands Income Tax Act 2001 as they apply to residents of the Netherlands will not be subject to Netherlands taxes on income or capital gains in respect of any payment under the Second Lien Notes or in respect of any gain or loss realized on the disposal or deemed disposal of the Second Lien Notes, provided that:
| • | | such holder does not have an interest in an enterprise or deemed enterprise (as defined in The Netherlands Income Tax Act 2001 and The Netherlands Corporate Income Tax Act 1969) which, in whole or in part, is either effectively managed in the Netherlands or carried on through a permanent establishment, a deemed permanent establishment or a permanent representative in the Netherlands and to which enterprise or part of an enterprise the Second Lien Notes are attributable; and |
| • | | in the event the holder is an individual, such holder does not carry out any activities in the Netherlands with respect to the Second Lien Notes that go beyond ordinary asset management and does not derive benefits from the Second Lien Notes that are (otherwise) taxable as benefits from other activities in the Netherlands. |
Gift and inheritance taxes
Residents of the Netherlands
Gift or inheritance taxes will arise in the Netherlands with respect to a transfer of the Second Lien Notes by way of a gift by, or on the death of, a holder of such Second Lien Notes who is resident or deemed resident of the Netherlands at the time of the gift or his/her death.
89
Pinafore Holdings B.V.
Item 10E
Non-residents of the Netherlands
No Netherlands gift or inheritance taxes will arise on the transfer of Second Lien Notes by way of gift by, or on the death of, a holder of Second Lien Notes who is neither resident nor deemed to be resident in the Netherlands, unless the transfer is otherwise construed as a gift or inheritance made by, or on behalf of, a person who, at the time of the gift or death, is or is deemed to be resident in the Netherlands.
Value added tax (VAT)
No Netherlands VAT will be payable by the holders of the Second Lien Notes on any payment in consideration for the issue of the Second Lien Notes or with respect to the payment of interest or principal by the issuer of the Second Lien Notes under the Second Lien Notes.
Other taxes and duties
No Netherlands registration tax, customs duty, stamp duty or any other similar documentary tax or duty will be payable by the holders of the Second Lien Notes in respect or in connection with the issue of the Second Lien Notes or with respect to the payment of interest or principal by the Issuer under the Second Lien Notes.
F. Dividends and paying agents
Not applicable.
G. Statement by experts
Not applicable.
H. Documents on display
The Company is subject to the information requirements of the Exchange Act and in accordance therewith files reports and other information with the SEC. These reports and other information can be inspected and copied at the public reference facilities maintained by the SEC at 100 F Street, N.E., Washington, D.C. 20549. Copies of all or a portion of these documents may be requested from the Public Reference Section of the SEC at 100 F Street, N.E., Washington, D.C. 20549, at prescribed rates. Reports filed by the Company with the Commission are also available on the SEC’s website at www.sec.gov. As a foreign private issuer, the Company is exempt under the Exchange Act from, among other things, the rules prescribing the furnishing and content of proxy statements and the ‘short-swing’ profit recovery provisions contained in Section 16 of the Exchange Act.
I. Subsidiary information
See Exhibit 8.1.
90
Pinafore Holdings B.V.
Item 11
| Item 11. | Quantitative and Qualitative Disclosures about Market Risk |
We are exposed to various types of market risks including the effects of adverse fluctuations in foreign currency exchange rates, adverse movements in commodity prices for products we use in our manufacturing and adverse changes in interest rates. To reduce our exposure to these risks, we maintain risk management controls and policies to monitor these risks and take appropriate actions to attempt to mitigate such forms of market risks.
Further information and quantitative analysis is included in note 34 of the Group’s consolidated financial statements.
Foreign currency exchange rate risks
We have global operations and thus make investments and enter into transactions denominated in various foreign currencies. Our operating results are impacted by buying, selling and financing in currencies other than the functional currency of our operating companies. From time to time, we may enter into currency derivative contracts to manage currency transaction exposures. Information on the Group’s exposure to currency risk is presented in notes 26, 28, 30, 33 and 34F to the Group’s consolidated financial statements.
Interest rate risk
We are subject to interest rate market risk in connection with our long-term debt. Our primary interest rate exposure relates to outstanding amounts under our senior secured credit facilities. As at December 31, 2011, the principal amount outstanding under our variable rate senior secured credit facilities was $1,741.8 million. We also had additional availability of $233.9 million under the revolving portion of our senior secured credit facility.
Commodity price risk
We purchase certain raw materials that are subject to price volatility caused by fluctuations in supply and demand as well as other factors. To help mitigate the impact of higher commodity prices and volatility, we have multiple-source and geographically diverse procurement policies and endeavor to negotiate commodity supply contracts that fix prices for quarterly or annual periods in order to reduce the impact of price volatility. In addition, we continue to negotiate with our customers to provide for the sharing of increased raw material costs. From time to time, we may enter into commodity contracts to manage our exposure to changes in commodity prices.
| Item 12. | Description of Securities Other than Equity Securities |
Not applicable.
91
Pinafore Holdings B.V.
Item 13
PART II
| Item 13. | Defaults, dividend arrearages and delinquencies |
None.
| Item 14. | Material modifications to the rights of security holders and use of proceeds |
None.
| Item 15. | Controls and Procedures |
Disclosure Controls and Procedures
SOX Act certifications
The certifications of the Principal Executive Officer and Principal Financial Officer required under section 302 of the SOX Act, and the related rules of the SEC are filed as Exhibits 12.1 and 12.2.
The Principal Executive Officer and the Principal Financial Officer have evaluated the effectiveness of the Company’s disclosure controls and procedures (as such term is defined in Rules 13a – 15(e) and 15d – 15(e) under the Exchange Act) as at December 31, 2011. Based on such evaluation, those officers have concluded that, as of December 31, 2011, the Company’s disclosure controls and procedures are effective in providing reasonable assurance that information we are required to disclose in reports that we file or submit under the Exchange Act is recorded, processed, summarized and reported within the time periods specified in the SEC rules and forms, and that such information is accumulated and communicated to our management, including our Principal Executive Officer and Principal Financial Officer, as appropriate, to allow timely decisions regarding required disclosure.
Internal control
The Directors have overall responsibility for the Group’s system of internal control and for reviewing its effectiveness. To fulfill this responsibility the Directors have established a Performance Management Framework within which each of the Group’s businesses operates. Within this framework, the management of each of the businesses considers strategic, operational, commercial and financial risks, and identifies risk mitigation actions. Whilst acknowledging the overall responsibility for the system of internal control, the Directors are aware that the system is designed to manage rather than eliminate the risk of failure to achieve business objectives and can provide reasonable and not absolute assurance against material misstatement or loss.
During Fiscal 2011, the Directors were not aware of any control breakdowns that resulted in a material loss to the Group.
Risk assessment
An ongoing process is in place for identifying, evaluating and managing the significant risks faced by the Group. Each business unit’s management identifies and assesses the key business risks affecting the achievement of its objectives. Business unit management also identifies the risk management processes used to mitigate the key risks to an acceptable level and, where appropriate, additional actions required to further manage and mitigate them. The risk summaries developed out of this process are updated at least annually. In addition, Corporate Center management considers those risks to the Group’s strategic objectives that may not be identified and managed at the business unit level.
In connection with quarterly business reviews, relevant executives discuss risk management activities with Corporate Center management. The key risks and mitigation strategies are also discussed at least annually with the Audit Committee as well as the full Board. The risk management processes described above are applied to major decision-making processes such as acquisitions as well as operational risks within the business including environmental, health and safety.
Management’s annual report on internal control over financial reporting
This Annual Report does not include a report of Management’s assessment regarding internal control over financial reporting or an attestation report of the Company’s registered public accounting firm due to a transition period established by rules of the SEC for newly public companies.
Changes in internal control over financial reporting
During Fiscal 2011, there have not been any changes in the Company’s internal controls over financial reporting that have materially affected, or are reasonably likely to materially affect, the Company’s internal controls over financial reporting.
| Item 16A. | Audit committee financial expert |
The Board has determined that Anthony Morgan is an ‘audit committee financial expert’ as that term is defined under the rules of the SEC. Refer toItem 6A‘Directors and senior management’ for a brief description of his relevant experience. However, Anthony Morgan is not independent as that term is defined in the New York Stock Exchange listing standards as he is a Vice-President at CPPIB.
92
Pinafore Holdings B.V.
Item 16B
Code of Conduct and Ethics
The Group has adopted a Code of Conduct and Ethics which sets out the policies and principles of conduct to be followed by all companies in the Group and applies to all executive directors, officers and employees, including the principal executive, financial and accounting officers, as required by section 406 of the SOX Act and the related rules of the SEC.
The Code of Conduct and Ethics covers a number of important areas including compliance with anti-trust and competition laws, employee health and safety laws and environmental laws. It also reaffirms the Company’s commitment to fair treatment of all employees, ethical and lawful behavior and sets out some general principles, which are important in dealing with suppliers and customers, and with governments and government agencies. The Code of Conduct and Ethics emphasizes the importance of employees protecting the Company’s intellectual property. The Code of Conduct and Ethics contains provisions under which employees can report violations of company policy or any applicable law, rule or regulation, including those of the SEC. Employees in the US have the added protection of section 806 of the SOX Act, which prohibits the discrimination by a company or others against an employee where such violations are reported. The current procedure, which is set out in the Code of Conduct and Ethics, provides for information to be given anonymously under conditions of confidentiality. Those employees who come forward and give their name are assured that they will receive the full protection of section 806 and no retaliation will take place. The Company ensures that the principles are applied, subject to compliance with local employment and other laws.
Waivers to the Code of Conduct and Ethics require the approval of the board of the relevant operating company. During Fiscal 2011 there have been no amendments to the code of ethics and no waivers have been either sought or granted. A complete copy of the Code of Conduct and Ethics can be viewed on the website www.tomkins.co.uk.
| Item 16C. | Principal Accountant Fees and Services |
Fees payable to the Company’s principal accountant, Deloitte LLP, and other member firms of Deloitte Touche Tohmatsu Limited were as follows:
| | | | | | | | | | | | | | | | | | |
| $ million | | SUCCESSOR | | | | | PREDECESSOR | |
| | | Fiscal 2011 | | | Q4 2010 | | | | | 9M 2010 | | | Fiscal 2009 | |
Audit fees: | | | | | | | | | | | | | | | | | | |
– Audit of the company’s accounts | | | 0.8 | | | | 1.1 | | | | | | — | | | | 0.7 | |
– Audit of the accounts of the company’s subsidiaries | | | 5.3 | | | | 4.6 | | | | | | 1.5 | | | | 4.3 | |
– Other statutory services | | | 0.8 | | | | 0.1 | | | | | | 0.1 | | | | 0.1 | |
– Other audit fees | | | 1.4 | | | | — | | | | | | — | | | | — | |
| | | | | | | | | | | | | | | | | | |
| | | 8.3 | | | | 5.8 | | | | | | 1.6 | | | | 5.1 | |
Tax fees: | | | | | | | | | | | | | | | | | | |
– Compliance services | | | 0.8 | | | | 0.1 | | | | | | — | | | | 0.6 | |
– Advisory services | | | 2.5 | | | | 0.1 | | | | | | 0.4 | | | | 1.0 | |
| | | | | | | | | | | | | | | | | | |
| | | 3.3 | | | | 0.2 | | | | | | 0.4 | | | | 1.6 | |
All other fees | | | — | | | | — | | | | | | 0.5 | | | | 0.2 | |
| | | | | | | | | | | | | | | | | | |
Total fees | | | 11.6 | | | | 6.0 | | | | | | 2.5 | | | | 6.9 | |
| | | | | | | | | | | | | | | | | | |
The Audit Committee or, between meetings, the Chairman of the Audit Committee, approves the engagement terms and fees of Deloitte LLP, and other member firms of Deloitte Touche Tohmatsu Limited for all services before the related work is undertaken.
| Item 16D. | Exemption from the listing standards for Audit Committees |
Not applicable.
| Item 16E. | Purchases of Equity Securities by the Issuer and Affiliated Purchasers |
Not applicable.
| Item 16F. | Change in a Registrant’s Certifying Accountant |
Not applicable.
| Item 16G. | Corporate governance |
Not applicable.
93
Pinafore Holdings B.V.
Item 17
PART III
| Item 17. | Financial Statements |
Refer to Item 18.
| Item 18. | Financial Statements |
Consolidated financial statements (as referred to by Item 8A)
94
REPORT OF INDEPENDENT REGISTERED PUBLIC ACCOUNTING FIRM
To the Board of Directors and Shareholders of Pinafore Holdings B.V.
We have audited the accompanying consolidated balance sheets of Pinafore Holdings B.V. and subsidiaries (the ‘Company’) as of December 31, 2011 and 2010, and the related consolidated statements of income, comprehensive income, changes in equity and cash flows for the periods from January 1, 2011 through December 31, 2011 and September 1, 2010 through December 31, 2010 (Successor Company operations) and for the periods from January 3, 2010 through September 24, 2010 and from January 4, 2009 to January 2, 2010 (Predecessor Company operations). These financial statements are the responsibility of the Company’s management. Our responsibility is to express an opinion on these financial statements based on our audits.
We conducted our audits in accordance with the standards of the Public Company Accounting Oversight Board (United States). Those standards require that we plan and perform the audit to obtain reasonable assurance about whether the financial statements are free of material misstatement. The Company is not required to have, nor were we engaged to perform, an audit of its internal control over financial reporting. Our audits included consideration of internal control over financial reporting as a basis for designing audit procedures that are appropriate in the circumstances, but not for the purpose of expressing an opinion on the Company’s internal control over financial reporting. Accordingly, we express no such opinion. An audit also includes examining, on a test basis, evidence supporting the amounts and disclosures in the financial statements, assessing the accounting principles used and significant estimates made by management, as well as evaluating the overall financial statement presentation. We believe that our audits provide a reasonable basis for our opinion.
In our opinion, the Successor Company consolidated financial statements present fairly, in all material respects, the financial position of Pinafore Holdings B.V. and subsidiaries as of December 31, 2011 and 2010 and the results of their operations and their cash flows for the period from January 1, 2011 through December 31, 2011 and the period from September 1, 2010 through December 31, 2010, in conformity with International Financial Reporting Standards as issued by the International Accounting Standards Board. Further, in our opinion, the Predecessor Company consolidated financial statements referred to above present fairly, in all material respects, the results of their operations and their cash flows for the period from January 3, 2010 through September 24, 2010 and for the period from January 4, 2009 to January 2, 2010 in conformity with International Financial Reporting Standards as issued by the International Accounting Standards Board.
Deloitte LLP
London, United Kingdom
February 20, 2012
F-1
Pinafore Holdings B.V.
Group Financial Statements
CONSOLIDATED INCOME STATEMENT
| | | | | | | | | | | | | | | | | | | | | | |
| | | | | | SUCCESSOR | | | | | PREDECESSOR | |
| | | Note | | | Fiscal 2011
$ million | | | Q4 2010
$ million | | | | | 9M 2010
$ million | | | Fiscal 2009
$ million | |
Continuing operations | | | | | | | | | | | | | | | | | | | | | | |
Sales | | | 5 | | | | 4,590.7 | | | | 1,181.3 | | | | | | 3,270.4 | | | | 3,866.5 | |
Cost of sales | | | | | | | (3,128.0 | ) | | | (950.3 | ) | | | | | (2,223.8 | ) | | | (2,748.2 | ) |
| | | | | | | | | | | | | | | | | | | | | | |
Gross profit | | | | | | | 1,462.7 | | | | 231.0 | | | | | | 1,046.6 | | | | 1,118.3 | |
Distribution costs | | | | | | | (508.0 | ) | | | (137.1 | ) | | | | | (362.0 | ) | | | (441.7 | ) |
Administrative expenses | | | | | | | (665.1 | ) | | | (217.3 | ) | | | | | (327.3 | ) | | | (437.0 | ) |
Transaction costs | | | 6 | | | | (0.6 | ) | | | (78.2 | ) | | | | | (41.2 | ) | | | — | |
Impairments | | | 7 | | | | (38.0 | ) | | | — | | | | | | — | | | | (73.0 | ) |
Restructuring costs | | | 8 | | | | (40.2 | ) | | | (3.7 | ) | | | | | (10.0 | ) | | | (140.9 | ) |
Net gain on disposals and on the exit of businesses | | | 8 | | | | 60.9 | | | | — | | | | | | 6.3 | | | | 0.2 | |
Gain on amendment of post-employment benefits | | | 9 | | | | — | | | | — | | | | | | — | | | | 63.0 | |
Share of profit/(loss) of associates | | | 23 | | | | 1.2 | | | | 1.0 | | | | | | 0.8 | | | | (0.7 | ) |
| | | | | | | | | | | | | | | | | | | | | | |
Operating profit/(loss) | | | | | | | 272.9 | | | | (204.3 | ) | | | | | 313.2 | | | | 88.2 | |
| | | | | | | | | | | | | | | | | | | | | | |
| | | | | | |
Interest expense | | | 11 | | | | (317.6 | ) | | | (90.8 | ) | | | | | (71.4 | ) | | | (111.0 | ) |
Investment income | | | 12 | | | | 71.8 | | | | 18.7 | | | | | | 48.0 | | | | 67.0 | |
Other finance expense | | | 13 | | | | (26.7 | ) | | | (27.1 | ) | | | | | (2.7 | ) | | | (0.3 | ) |
Net finance costs | | | | | | | (272.5 | ) | | | (99.2 | ) | | | | | (26.1 | ) | | | (44.3 | ) |
| | | | | | | | | | | | | | | | | | | | | | |
Profit/(loss) before tax | | | | | | | 0.4 | | | | (303.5 | ) | | | | | 287.1 | | | | 43.9 | |
Income tax benefit/(expense) | | | 14 | | | | 19.2 | | | | 34.1 | | | | | | (62.5 | ) | | | (25.1 | ) |
| | | | | | | | | | | | | | | | | | | | | | |
Profit/(loss) for the period from continuing operations | | | | | | | 19.6 | | | | (269.4 | ) | | | | | 224.6 | | | | 18.8 | |
| | | | | | |
Discontinued operations | | | | | | | | | | | | | | | | | | | | | | |
Profit/(loss) for the period from discontinued operations | | | 15 | | | | 37.6 | | | | (0.8 | ) | | | | | 19.0 | | | | (12.8 | ) |
| | | | | | | | | | | | | | | | | | | | | | |
Profit/(loss) for the period | | | 16 | | | | 57.2 | | | | (270.2 | ) | | | | | 243.6 | | | | 6.0 | |
Non-controlling interests | | | | | | | (29.3 | ) | | | (0.9 | ) | | | | | (26.2 | ) | | | (21.6 | ) |
| | | | | | | | | | | | | | | | | | | | | | |
Profit/(loss) for the period attributable to equity shareholders | | | | | | | 27.9 | | | | (271.1 | ) | | | | | 217.4 | | | | (15.6 | ) |
| | | | | | | | | | | | | | | | | | | | | | |
F-2
Pinafore Holdings B.V.
Group Financial Statements
CONSOLIDATED STATEMENT OF COMPREHENSIVE INCOME
| | | | | | | | | | | | | | | | | | | | | | |
| | | | | | SUCCESSOR | | | | | PREDECESSOR | |
| | | Note | | | Fiscal 2011
$ million | | | Q4 2010
$ million | | | | | 9M 2010
$ million | | | Fiscal 2009
$ million | |
Profit/(loss) for the period | | | | | | | 57.2 | | | | (270.2 | ) | | | | | 243.6 | | | | 6.0 | |
| | | | | | | | | | | | | | | | | | | | | | |
| | | | | | |
Other comprehensive (loss)/income | | | | | | | | | | | | | | | | | | | | | | |
Foreign currency translation: | | | | | | | | | | | | | | | | | | | | | | |
– Currency translation differences on foreign operations: | | | | | | | | | | | | | | | | | | | | | | |
Subsidiaries | | | | | | | (62.5 | ) | | | 23.9 | | | | | | 7.3 | | | | 81.5 | |
Associates | | | | | | | 0.6 | | | | 0.3 | | | | | | 0.6 | | | | 0.8 | |
– Gain/(loss) on net investment hedges | | | | | | | 3.6 | | | | (2.5 | ) | | | | | 0.5 | | | | (3.1 | ) |
| | | | | | | | | | | | | | | | | | | | | | |
| | | | | | | (58.3 | ) | | | 21.7 | | | | | | 8.4 | | | | 79.2 | |
Available-for-sale investments: | | | | | | | | | | | | | | | | | | | | | | |
– Unrealized (loss)/gain arising in the period | | | | | | | (0.4 | ) | | | 0.2 | | | | | | (0.1 | ) | | | 0.4 | |
| | | | | | | | | | | | | | | | | | | | | | |
| | | | | | | (0.4 | ) | | | 0.2 | | | | | | (0.1 | ) | | | 0.4 | |
Post-employment benefits: | | | | | | | | | | | | | | | | | | | | | | |
– Net actuarial gain/(loss) | | | | | | | 33.4 | | | | 70.1 | | | | | | (31.3 | ) | | | (143.8 | ) |
– Effect of the asset ceiling | | | | | | | (37.8 | ) | | | (20.2 | ) | | | | | 0.3 | | | | 18.6 | |
| | | | | | | | | | | | | | | | | | | | | | |
| | | | | | | (4.4 | ) | | | 49.9 | | | | | | (31.0 | ) | | | (125.2 | ) |
| | | | | | | | | | | | | | | | | | | | | | |
Other comprehensive (loss)/income before tax | | | | | | | (63.1 | ) | | | 71.8 | | | | | | (22.7 | ) | | | (45.6 | ) |
Income tax (expense)/benefit | | | 14 | | | | (4.2 | ) | | | (15.9 | ) | | | | | 0.9 | | | | 26.3 | |
| | | | | | | | | | | | | | | | | | | | | | |
Other comprehensive (loss)/income | | | | | | | (67.3 | ) | | | 55.9 | | | | | | (21.8 | ) | | | (19.3 | ) |
| | | | | | | | | | | | | | | | | | | | | | |
Comprehensive (loss)/income for the period | | | | | | | (10.1 | ) | | | (214.3 | ) | | | | | 221.8 | | | | (13.3 | ) |
| | | | | | | | | | | | | | | | | | | | | | |
| | | | | | |
Attributable to: | | | | | | | | | | | | | | | | | | | | | | |
– Equity shareholders in Pinafore Holdings B.V. | | | | | | | | | | | | | | | | | | | | | | |
Arising from continuing operations | | | | | | | (77.4 | ) | | | (217.4 | ) | | | | | 173.9 | | | | (33.2 | ) |
Arising from discontinued operations | | | | | | | 34.3 | | | | (3.7 | ) | | | | | 16.6 | | | | (3.6 | ) |
| | | | | | | (43.1 | ) | | | (221.1 | ) | | | | | 190.5 | | | | (36.8 | ) |
| | | | | | | | | | | | | | | | | | | | | | |
– Non-controlling interests | | | | | | | 33.0 | | | | 6.8 | | | | | | 31.3 | | | | 23.5 | |
| | | | | | | | | | | | | | | | | | | | | | |
| | | | | | | (10.1 | ) | | | (214.3 | ) | | | | | 221.8 | | | | (13.3 | ) |
| | | | | | | | | | | | | | | | | | | | | | |
An analysis of each item of other comprehensive (loss)/income by component of equity is presented in note 40.
F-3
Pinafore Holdings B.V.
Group Financial Statements
CONSOLIDATED CASH FLOW STATEMENT
| | | | | | | | | | | | | | | | | | | | | | |
| | | | | | SUCCESSOR | | | | | PREDECESSOR | |
| | | Note | | | Fiscal 2011
$ million | | | Q4 2010
$ million | | | | | 9M 2010
$ million | | | Fiscal 2009
$ million | |
Operating activities | | | | | | | | | | | | | | | | | | | | | | |
Cash generated from operations | | | 19 | | | | 611.0 | | | | 66.3 | | | | | | 215.2 | | | | 532.1 | |
Income taxes paid | | | | | | | (104.4 | ) | | | (22.3 | ) | | | | | (66.2 | ) | | | (50.3 | ) |
Income taxes received | | | | | | | 15.3 | | | | 1.4 | | | | | | 45.7 | | | | 31.2 | |
| | | | | | | | | | | | | | | | | | | | | | |
Net cash inflow from operating activities | | | | | | | 521.9 | | | | 45.4 | | | | | | 194.7 | | | | 513.0 | |
| | | | | | | | | | | | | | | | | | | | | | |
| | | | | | |
Investing activities | | | | | | | | | | | | | | | | | | | | | | |
Purchase of property, plant and equipment | | | | | | | (108.4 | ) | | | (60.2 | ) | | | | | (90.0 | ) | | | (115.2 | ) |
Purchase of computer software | | | | | | | (7.8 | ) | | | — | | | | | | (5.7 | ) | | | (7.8 | ) |
Capitalization of development costs | | | | | | | (1.8 | ) | | | (2.3 | ) | | | | | (0.5 | ) | | | (0.6 | ) |
Disposal of property, plant and equipment | | | | | | | 17.5 | | | | 2.7 | | | | | | 24.6 | | | | 12.9 | |
Investments in associates | | | | | | | (0.4 | ) | | | (0.5 | ) | | | | | — | | | | (2.7 | ) |
Purchase of interests in subsidiaries, net of cash acquired | | | 41 | | | | (29.6 | ) | | | (4,043.9 | ) | | | | | (41.2 | ) | | | (26.5 | ) |
Sale of businesses and subsidiaries, net of cash disposed | | | 42 | | | | 475.7 | | | | 4.0 | | | | | | (4.0 | ) | | | 0.7 | |
Interest received | | | | | | | 2.0 | | | | 1.4 | | | | | | 13.3 | | | | 3.6 | |
Dividends received from associates | | | | | | | 0.5 | | | | — | | | | | | 0.5 | | | | 0.3 | |
| | | | | | | | | | | | | | | | | | | | | | |
Net cash inflow/(outflow) from investing activities | | | | | | | 347.7 | | | | (4,098.8 | ) | | | | | (103.0 | ) | | | (135.3 | ) |
| | | | | | | | | | | | | | | | | | | | | | |
| | | | | | |
Financing activities | | | | | | | | | | | | | | | | | | | | | | |
Issue of shares | | | | | | | — | | | | 2,142.3 | | | | | | 5.5 | | | | 0.1 | |
Draw-down of bank and other loans | | | | | | | 1.9 | | | | 3,150.0 | | | | | | — | | | | 2.8 | |
Repayment of bank and other loans | | | | | | | (549.7 | ) | | | (460.4 | ) | | | | | (0.8 | ) | | | (164.4 | ) |
Premium on redemption of debt instruments | | | | | | | (3.8 | ) | | | (4.6 | ) | | | | | — | | | | — | |
Receipts/(payments) on foreign currency derivatives | | | | | | | 5.0 | | | | (2.2 | ) | | | | | (20.3 | ) | | | 39.6 | |
Settlement of interest rate swaps | | | | | | | — | | | | — | | | | | | 64.7 | | | | — | |
Capital element of finance lease rental payments | | | | | | | (0.5 | ) | | | (0.2 | ) | | | | | (0.7 | ) | | | (2.8 | ) |
Interest element of finance lease rental payments | | | | | | | (0.2 | ) | | | — | | | | | | (0.2 | ) | | | (0.4 | ) |
Decrease/(increase) in collateralized cash | | | | | | | 30.5 | | | | (44.9 | ) | | | | | — | | | | 2.1 | |
Purchase of non-controlling interest | | | 36 | | | | (13.1 | ) | | | — | | | | | | — | | | | — | |
Return of management investment | | | 39 | | | | (0.7 | ) | | | — | | | | | | — | | | | — | |
Purchase of own shares | | | | | | | (0.3 | ) | | | — | | | | | | (6.2 | ) | | | (1.4 | ) |
Interest paid | | | | | | | (215.0 | ) | | | (58.1 | ) | | | | | (15.2 | ) | | | (37.5 | ) |
Financing costs paid | | | | | | | (36.9 | ) | | | (182.4 | ) | | | | | — | | | | (6.3 | ) |
Equity dividend paid | | | | | | | — | | | | — | | | | | | (56.9 | ) | | | (48.3 | ) |
Investment by a minority shareholder in a subsidiary | | | | | | | 1.5 | | | | 11.7 | | | | | | — | | | | 4.7 | |
Dividend paid to a minority shareholder in a subsidiary | | | | | | | (64.4 | ) | | | — | | | | | | (12.0 | ) | | | (8.7 | ) |
| | | | | | | | | | | | | | | | | | | | | | |
Net cash (outflow)/inflow from financing activities | | | | | | | (845.7 | ) | | | 4,551.2 | | | | | | (42.1 | ) | | | (220.5 | ) |
| | | | | | | | | | | | | | | | | | | | | | |
| | | | | | |
Increase in net cash and cash equivalents | | | | | | | 23.9 | | | | 497.8 | | | | | | 49.6 | | | | 157.2 | |
Net cash and cash equivalents at the beginning of the period | | | | | | | 452.2 | | | | — | | | | | | 440.2 | | | | 278.2 | |
Foreign currency translation | | | | | | | (1.6 | ) | | | (45.6 | ) | | | | | 1.3 | | | | 4.8 | |
| | | | | | | | | | | | | | | | | | | | | | |
Net cash and cash equivalents at the end of the period | | | | | | | 474.5 | | | | 452.2 | | | | | | 491.1 | | | | 440.2 | |
| | | | | | | | | | | | | | | | | | | | | | |
Analysis of net cash and cash equivalents:
| | | | | | | | | | | | | | |
| | | SUCCESSOR | | | | | PREDECESSOR | |
| | | As at
December 31,
2011
$ million | | | As at
December 31,
2010
$ million | | | | | As at
January 2,
2010
$ million | |
Cash and cash equivalents | | | 480.0 | | | | 459.3 | | | | | | 445.0 | |
Bank overdrafts | | | (5.5 | ) | | | (7.1 | ) | | | | | (4.8 | ) |
| | | | | | | | | | | | | | |
| | | 474.5 | | | | 452.2 | | | | | | 440.2 | |
| | | | | | | | | | | | | | |
F-4
Pinafore Holdings B.V.
Group Financial Statements
CONSOLIDATED BALANCE SHEET
| | | | | | | | | | | | | | |
| | | Note | | | As at
December 31,
2011
$ million | | | | | As at
December 31,
2010
$ million | |
Non-current assets | | | | | | | | | | | | | | |
Goodwill | | | 20 | | | | 1,585.4 | | | | | | 1,745.4 | |
Other intangible assets | | | 21 | | | | 1,931.2 | | | | | | 2,268.5 | |
Property, plant and equipment | | | 22 | | | | 902.9 | | | | | | 1,359.1 | |
Investments in associates | | | 23 | | | | 6.6 | | | | | | 23.6 | |
Trade and other receivables | | | 25 | | | | 20.1 | | | | | | 26.2 | |
Deferred tax assets | | | 37 | | | | 7.9 | | | | | | 9.6 | |
Post-employment benefit surpluses | | | 35 | | | | 6.7 | | | | | | 3.6 | |
| | | | | | | | | | | | | | |
| | | | | | | 4,460.8 | | | | | | 5,436.0 | |
| | | | | | | | | | | | | | |
Current assets | | | | | | | | | | | | | | |
Inventories | | | 24 | | | | 571.7 | | | | | | 693.5 | |
Trade and other receivables | | | 25 | | | | 728.4 | | | | | | 914.5 | |
Income tax recoverable | | | | | | | 20.5 | | | | | | 11.0 | |
Available-for-sale investments | | | 27 | | | | 1.1 | | | | | | 1.4 | |
Cash and cash equivalents | | | 28 | | | | 480.0 | | | | | | 459.3 | |
| | | | | | | | | | | | | | |
| | | | | | | 1,801.7 | | | | | | 2,079.7 | |
| | | | | | | | | | | | | | |
Assets held for sale | | | 29 | | | | 442.7 | | | | | | 36.6 | |
| | | | | | | | | | | | | | |
Total assets | | | | | | | 6,705.2 | | | | | | 7,552.3 | |
| | | | | | | | | | | | | | |
| | | | |
Current liabilities | | | | | | | | | | | | | | |
Bank overdrafts | | | 30 | | | | (5.5 | ) | | | | | (7.1 | ) |
Bank and other loans | | | 30 | | | | (42.4 | ) | | | | | (255.7 | ) |
Obligations under finance leases | | | 31 | | | | (0.2 | ) | | | | | (0.5 | ) |
Trade and other payables | | | 32 | | | | (545.0 | ) | | | | | (704.4 | ) |
Income tax liabilities | | | | | | | (85.5 | ) | | | | | (106.8 | ) |
Provisions | | | 38 | | | | (33.9 | ) | | | | | (65.6 | ) |
| | | | | | | | | | | | | | |
| | | | | | | (712.5 | ) | | | | | (1,140.1 | ) |
| | | | | | | | | | | | | | |
Non-current liabilities | | | | | | | | | | | | | | |
Bank and other loans | | | 30 | | | | (2,611.7 | ) | | | | | (2,898.9 | ) |
Obligations under finance leases | | | 31 | | | | (2.6 | ) | | | | | (2.8 | ) |
Trade and other payables | | | 32 | | | | (47.2 | ) | | | | | (65.4 | ) |
Post-employment benefit obligations | | | 35 | | | | (197.1 | ) | | | | | (279.2 | ) |
Deferred tax liabilities | | | 37 | | | | (650.9 | ) | | | | | (793.3 | ) |
Provisions | | | 38 | | | | (25.3 | ) | | | | | (24.7 | ) |
| | | | | | | | | | | | | | |
| | | | | | | (3,534.8 | ) | | | | | (4,064.3 | ) |
| | | | | | | | | | | | | | |
Liabilities directly associated with assets held for sale | | | 29 | | | | (114.3 | ) | | | | | (8.1 | ) |
| | | | | | | | | | | | | | |
Total liabilities | | | | | | | (4,361.6 | ) | | | | | (5,212.5 | ) |
| | | | | | | | | | | | | | |
Net assets | | | | | | | 2,343.6 | | | | | | 2,339.8 | |
| | | | | | | | | | | | | | |
| | | | |
Capital and reserves | | | | | | | | | | | | | | |
Share capital | | | 39 | | | | — | | | | | | — | |
Shares to be issued | | | 39 | | | | — | | | | | | 17.6 | |
Share premium account | | | 39 | | | | 2,143.3 | | | | | | 2,124.7 | |
Currency translation reserve | | | | | | | (47.4 | ) | | | | | 16.2 | |
Available-for-sale reserve | | | | | | | (0.1 | ) | | | | | — | |
Accumulated deficit | | | | | | | (20.9 | ) | | | | | (130.2 | ) |
| | | | | | | | | | | | | | |
Shareholders’ equity | | | | | | | 2,074.9 | | | | | | 2,028.3 | |
Non-controlling interests | | | | | | | 268.7 | | | | | | 311.5 | |
| | | | | | | | | | | | | | |
Total equity | | | | | | | 2,343.6 | | | | | | 2,339.8 | |
| | | | | | | | | | | | | | |
The consolidated financial statements were approved by the Board of Directors and authorized for issue on February 20, 2012.
F-5
Pinafore Holdings B.V.
Group Financial Statements
CONSOLIDATED STATEMENT OF CHANGES IN EQUITY
SUCCESSOR
| | | | | | | | | | | | | | | | | | | | | | | | | | | | | | | | | | | | |
| | | Share
capital
(note 39)
$ million | | | Shares
to be
issued
(note 39)
$ million | | | Share
premium
account
(note 39)
$ million | | | Available-for-sale
reserve
$ million | | | Currency
translation
reserve
$ million | | | Accumulated
deficit
$ million | | | Total
shareholders’
equity
$ million | | | Non-controlling
interests
$ million | | | Total
equity
$ million | |
As at September 25, 2010 | | | — | | | | — | | | | — | | | | — | | | | — | | | | — | | | | — | | | | — | | | | — | |
| | | | | | | | | |
Q4 2010 | | | | | | | | | | | | | | | | | | | | | | | | | | | | | | | | | | | | |
(Loss)/profit for the period | | | — | | | | — | | | | — | | | | — | | | | — | | | | (271.1 | ) | | | (271.1 | ) | | | 0.9 | | | | (270.2 | ) |
Other comprehensive income | | | — | | | | — | | | | — | | | | — | | | | 16.2 | | | | 33.8 | | | | 50.0 | | | | 5.9 | | | | 55.9 | |
| | | | | | | | | | | | | | | | | | | | | | | | | | | | | | | | | | | | |
Comprehensive (loss)/income | | | — | | | | — | | | | — | | | | — | | | | 16.2 | | | | (237.3 | ) | | | (221.1 | ) | | | 6.8 | | | | (214.3 | ) |
| | | | | | | | | | | | | | | | | | | | | | | | | | | | | | | | | | | | |
| | | | | | | | | |
Other changes in equity: | | | | | | | | | | | | | | | | | | | | | | | | | | | | | | | | | | | | |
– Issue of shares | | | — | | | | — | | | | 2,124.7 | | | | — | | | | — | | | | — | | | | 2,124.7 | | | | — | | | | 2,124.7 | |
– Acquisition of subsidiaries | | | — | | | | — | | | | — | | | | — | | | | — | | | | — | | | | — | | | | 304.5 | | | | 304.5 | |
– Subscription by management | | | — | | | | 17.6 | | | | — | | | | — | | | | — | | | | — | | | | 17.6 | | | | — | | | | 17.6 | |
– Share-based incentives | | | — | | | | — | | | | — | | | | — | | | | — | | | | 107.1 | | | | 107.1 | | | | 0.2 | | | | 107.3 | |
| | | | | | | | | | | | | | | | | | | | | | | | | | | | | | | | | | | | |
As at December 31, 2010 | | | — | | | | 17.6 | | | | 2,124.7 | | | | — | | | | 16.2 | | | | (130.2 | ) | | | 2,028.3 | | | | 311.5 | | | | 2,339.8 | |
| | | | | | | | | | | | | | | | | | | | | | | | | | | | | | | | | | | | |
| | | | | | | | | |
Fiscal 2011 | | | | | | | | | | | | | | | | | | | | | | | | | | | | | | | | | | | | |
Profit for the period | | | — | | | | — | | | | — | | | | — | | | | — | | | | 27.9 | | | | 27.9 | | | | 29.3 | | | | 57.2 | |
Other comprehensive (loss)/income | | | — | | | | — | | | | — | | | | (0.1 | ) | | | (63.6 | ) | | | (7.3 | ) | | | (71.0 | ) | | | 3.7 | | | | (67.3 | ) |
| | | | | | | | | | | | | | | | | | | | | | | | | | | | | | | | | | | | |
Comprehensive (loss)/income | | | — | | | | — | | | | — | | | | (0.1 | ) | | | (63.6 | ) | | | 20.6 | | | | (43.1 | ) | | | 33.0 | | | | (10.1 | ) |
| | | | | | | | | | | | | | | | | | | | | | | | | | | | | | | | | | | | |
| | | | | | | | | |
Other changes in equity: | | | | | | | | | | | | | | | | | | | | | | | | | | | | | | | | | | | | |
– Return of management interest | | | — | | | | (0.7 | ) | | | — | | | | — | | | | — | | | | — | | | | (0.7 | ) | | | — | | | | (0.7 | ) |
– Issue of B Shares | | | — | | | | (16.9 | ) | | | 18.6 | | | | — | | | | — | | | | — | | | | 1.7 | | | | — | | | | 1.7 | |
– Share-based incentives (including a tax benefit of $0.4 million) | | | — | | | | — | | | | — | | | | — | | | | — | | | | 89.0 | | | | 89.0 | | | | 0.2 | | | | 89.2 | |
– Buy-back of shares from management (see note 39) | | | — | | | | — | | | | — | | | | — | | | | — | | | | (0.3 | ) | | | (0.3 | ) | | | — | | | | (0.3 | ) |
– Purchase of non-controlling interest | | | — | | | | — | | | | — | | | | — | | | | — | | | | — | | | | — | | | | (13.1 | ) | | | (13.1 | ) |
– Shares issued by a subsidiary to minority shareholders | | | — | | | | — | | | | — | | | | — | | | | — | | | | — | | | | — | | | | 1.5 | | | | 1.5 | |
– Dividends paid to minority shareholders | | | — | | | | — | | | | — | | | | — | | | | — | | | | — | | | | — | | | | (64.4 | ) | | | (64.4 | ) |
| | | | | | | | | | | | | | | | | | | | | | | | | | | | | | | | | | | | |
As at December 31, 2011 | | | — | | | | — | | | | 2,143.3 | | | | (0.1 | ) | | | (47.4 | ) | | | (20.9 | ) | | | 2,074.9 | | | | 268.7 | | | | 2,343.6 | |
| | | | | | | | | | | | | | | | | | | | | | | | | | | | | | | | | | | | |
An analysis of each item of other comprehensive (loss)/income by component of equity is presented in note 40.
F-6
Pinafore Holdings B.V.
Group Financial Statements
CONSOLIDATED STATEMENT OF CHANGES IN EQUITY
PREDECESSOR
| | | | | | | | | | | | | | | | | | | | | | | | | | | | | | | | | | | | | | | | | | | | |
| | | Share
capital
(note 39)
$ million | | | Share
premium
account
(note 39)
$ million | | | Deferred
shares
(note 39)
$ million | | | Own
shares
(note 39)
$ million | | | Capital
redemption
reserve
(note 39)
$ million | | | Currency
translation
reserve
$ million | | | Available-for-sale
reserve
$ million | | | Accumulated
deficit
$ million | | | Total
shareholders’
equity
$ million | | | Non-controlling
interests
$ million | | | Total
equity
$ million | |
As at January 3, 2009 | | | 79.6 | | | | 799.1 | | | | 0.1 | | | | (14.9 | ) | | | 921.7 | | | | (169.6 | ) | | | (1.0 | ) | | | (4.2 | ) | | | 1,610.8 | | | | 128.5 | | | | 1,739.3 | |
| | | | | | | | | | | |
Fiscal 2009 | | | | | | | | | | | | | | | | | | | | | | | | | | | | | | | | | | | | | | | | | | | | |
Profit/(loss) for the period | | | — | | | | — | | | | — | | | | — | | | | — | | | | — | | | | — | | | | (15.6 | ) | | | (15.6 | ) | | | 21.6 | | | | 6.0 | |
Other comprehensive (loss)/income | | | — | | | | — | | | | — | | | | — | | | | — | | | | 76.6 | | | | 0.1 | | | | (97.9 | ) | | | (21.2 | ) | | | 1.9 | | | | (19.3 | ) |
| | | | | | | | | | | | | | | | | | | | | | | | | | | | | | | | | | | | | | | | | | | | |
Comprehensive (loss)/income | | | — | | | | — | | | | — | | | | — | | | | — | | | | 76.6 | | | | 0.1 | | | | (113.5 | ) | | | (36.8 | ) | | | 23.5 | | | | (13.3 | ) |
| | | | | | | | | | | | | | | | | | | | | | | | | | | | | | | | | | | | | | | | | | | | |
| | | | | | | | | | | |
Other changes in equity: | | | | | | | | | | | | | | | | | | | | | | | | | | | | | | | | | | | | | | | | | | | | |
– Cancellation of deferred shares | | | — | | | | — | | | | (0.1 | ) | | | — | | | | 0.1 | | | | — | | | | — | | | | — | | | | — | | | | — | | | | — | |
– Issue of ordinary shares | | | — | | | | 0.1 | | | | — | | | | — | | | | — | | | | — | | | | — | | | | — | | | | 0.1 | | | | — | | | | 0.1 | |
– Dividends paid on ordinary shares | | | — | | | | — | | | | — | | | | — | | | | — | | | | — | | | | — | | | | (48.3 | ) | | | (48.3 | ) | | | — | | | | (48.3 | ) |
– Purchase of own shares | | | — | | | | — | | | | — | | | | (1.4 | ) | | | — | | | | — | | | | — | | | | — | | | | (1.4 | ) | | | — | | | | (1.4 | ) |
– Transfer of own shares | | | — | | | | — | | | | — | | | | 8.1 | | | | — | | | | — | | | | — | | | | (8.1 | ) | | | — | | | | — | | | | — | |
– Share-based incentives (including a tax benefit of $0.9 million) | | | — | | | | — | | | | — | | | | — | | | | — | | | | — | | | | — | | | | 12.2 | | | | 12.2 | | | | — | | | | 12.2 | |
– Dividends paid to minority shareholders | | | — | | | | — | | | | — | | | | — | | | | — | | | | — | | | | — | | | | — | | | | — | | | | (8.7 | ) | | | (8.7 | ) |
– Purchase of a non-controlling interest | | | — | | | | — | | | | — | | | | — | | | | — | | | | — | | | | — | | | | — | | | | — | | | | (6.6 | ) | | | (6.6 | ) |
– Shares issued by a subsidiary to minority shareholders | | | — | | | | — | | | | — | | | | — | | | | — | | | | — | | | | — | | | | — | | | | — | | | | 4.7 | | | | 4.7 | |
| | | | | | | | | | | | | | | | | | | | | | | | | | | | | | | | | | | | | | | | | | | | |
As at January 2, 2010 | | | 79.6 | | | | 799.2 | | | | — | | | | (8.2 | ) | | | 921.8 | | | | (93.0 | ) | | | (0.9 | ) | | | (161.9 | ) | | | 1,536.6 | | | | 141.4 | | | | 1,678.0 | |
| | | | | | | | | | | | | | | | | | | | | | | | | | | | | | | | | | | | | | | | | | | | |
| | | | | | | | | | | |
9M 2010 | | | | | | | | | | | | | | | | | | | | | | | | | | | | | | | | | | | | | | | | | | | | |
Profit for the period | | | — | | | | — | | | | — | | | | — | | | | — | | | | — | | | | — | | | | 217.4 | | | | 217.4 | | | | 26.2 | | | | 243.6 | |
Other comprehensive (loss)/income | | | — | | | | — | | | | — | | | | — | | | | — | | | | 3.1 | | | | (0.1 | ) | | | (29.9 | ) | | | (26.9 | ) | | | 5.1 | | | | (21.8 | ) |
| | | | | | | | | | | | | | | | | | | | | | | | | | | | | | | | | | | | | | | | | | | | |
Comprehensive income/(loss) | | | — | | | | — | | | | — | | | | — | | | | — | | | | 3.1 | | | | (0.1 | ) | | | 187.5 | | | | 190.5 | | | | 31.3 | | | �� | 221.8 | |
| | | | | | | | | | | | | | | | | | | | | | | | | | | | | | | | | | | | | | | | | | | | |
| | | | | | | | | | | |
Other changes in equity: | | | | | | | | | | | | | | | | | | | | | | | | | | | | | | | | | | | | | | | | | | | | |
– Issue of ordinary shares | | | 0.3 | | | | 15.1 | | | | — | | | | — | | | | — | | | | — | | | | — | | | | — | | | | 15.4 | | | | — | | | | 15.4 | |
– Dividends paid on ordinary shares | | | — | | | | — | | | | — | | | | — | | | | — | | | | — | | | | — | | | | (56.9 | ) | | | (56.9 | ) | | | — | | | | (56.9 | ) |
– Purchase of own shares | | | — | | | | — | | | | — | | | | (6.2 | ) | | | — | | | | — | | | | — | | | | — | | | | (6.2 | ) | | | — | | | | (6.2 | ) |
– Transfer of own shares | | | — | | | | — | | | | — | | | | 14.4 | | | | — | | | | — | | | | — | | | | (14.4 | ) | | | — | | | | — | | | | — | |
– Share-based incentives (including a tax benefit of $5.2 million) | | | — | | | | — | | | | — | | | | — | | | | — | | | | — | | | | — | | | | 26.4 | | | | 26.4 | | | | — | | | | 26.4 | |
– Dividends paid to minority shareholders | | | — | | | | — | | | | — | | | | — | | | | — | | | | — | | | | — | | | | — | | | | — | | | | (12.0 | ) | | | (12.0 | ) |
| | | | | | | | | | | | | | | | | | | | | | | | | | | | | | | | | | | | | | | | | | | | |
As at September 24, 2010 | | | 79.9 | | | | 814.3 | | | | — | | | | — | | | | 921.8 | | | | (89.9 | ) | | | (1.0 | ) | | | (19.3 | ) | | | 1,705.8 | | | | 160.7 | | | | 1,866.5 | |
| | | | | | | | | | | | | | | | | | | | | | | | | | | | | | | | | | | | | | | | | | | | |
An analysis of each item of other comprehensive income/(loss) by component of equity is presented in note 40.
F-7
Pinafore Holdings B.V.
Group Financial Statements
NOTES TO THE CONSOLIDATED FINANCIAL STATEMENTS
| 1. | Incorporation of the Company and acquisition of Tomkins |
Pinafore Holdings B.V. (‘theCompany’ or ‘theSuccessor’) was incorporated on September 1, 2010 in and under the laws of The Netherlands.
The Company’s immediate and ultimate parent entity is Pinafore Coöperatief U.A. (‘theCo-operative’), which also operates in and under the laws of The Netherlands. The Co-operative is owned by a consortium representing the interests of Onex Corporation (‘Onex’), a Canadian private equity investor, Onex Partners III and various syndication participants, and the Canada Pension Plan Investment Board (‘CPPIB’), collectively the ‘Sponsors’.
On September 24, 2010, Tomkins Acquisitions Limited (formerly Pinafore Acquisitions Limited), a wholly-owned subsidiary of the Company that is incorporated in and under the laws of the United Kingdom, acquired the entire issued ordinary share capital of Tomkins plc (‘thePredecessor’).
Tomkins plc is incorporated in and under the laws of the United Kingdom. On the acquisition date, Tomkins plc was re-registered as a private company and its name was changed to Tomkins Limited.
Further information on the acquisition of the group headed by Tomkins Limited (‘Tomkins’) is presented in note 41.
References in these consolidated financial statements to ‘the Group’ refer, in the periods prior to the acquisition of Tomkins, to Tomkins Limited and its subsidiaries and, in the period subsequent to the acquisition of Tomkins, to the Company and its subsidiaries.
The Group comprises a global engineering and manufacturing business and is organized for management reporting purposes into two business groups: Industrial & Automotive and Building Products. Within these two business groups, management distinguishes between those of the Group’s operating segments that are ‘ongoing’ and those that have been exited but do not meet the conditions to be classified as discontinued operations (‘Exited’).
Industrial & Automotive manufactures a wide range of systems and components for the industrial equipment, car and truck manufacturing markets, and industrial and automotive aftermarkets throughout the world. Industrial & Automotive is comprised of five ongoing operating segments: Gates North America, Gates Europe, Gates Middle East & Africa (‘Gates EMEA’), Gates Asia and the Pacific Regions (‘GatesAPAC’), Gates South America and Dexter. Two additional operating segments, Powertrain and Other I&A, are included in continuing operations, but are classified as exited segments. The final operating segment, Sensors & Valves, is in the process of being sold and is classified as a discontinued operation.
Building Products is comprised of two ongoing operating segments: Air Distribution and Bathware. Air Distribution supplies the industrial and residential heating, ventilation and air conditioning market, mainly in North America. Bathware manufactures baths and whirlpools for the residential, and hotel and resort development markets, mainly in North America. A further operating segment, Doors & Windows, comprising a business that was closed during Fiscal 2009, is classified as exited.
| 3. | Principal accounting policies |
A. Basis of preparation
The consolidated financial statements have been prepared on a going concern basis in accordance with International Financial Reporting Standards (‘IFRS’) adopted for use in the European Union and, except as described under the heading ‘Financial instruments’, under the historical cost convention.
From the Group’s perspective, there are no applicable differences between IFRS adopted for use in the European Union and IFRS as issued by the International Accounting Standards Board (‘IASB’) and, therefore, the financial statements also comply with IFRS as issued by the IASB.
Except for the adoption at the beginning of Fiscal 2011 of ‘Improvements to IFRSs 2010’, which did not have any significant impact on the Group’s results or financial position, the Group’s accounting policies are unchanged compared with the year ended December 31, 2010.
B. Accounting periods
Financial statements are presented for the periods preceding and succeeding the acquisition of Tomkins.
The financial statements for the periods preceding the acquisition of Tomkins, the Predecessor financial statements, comprise the consolidated financial statements of Tomkins Limited. Prior to the acquisition, Tomkins drew up its annual financial statements to the Saturday nearest December 31. Accordingly, the Predecessor financial statements are presented for the 52-week period from January 4, 2009 to January 2, 2010 (‘Fiscal 2009’) and the 38-week period from January 3, 2010 to September 24, 2010 (‘9M 2010’). The Predecessor financial statements do not reflect the effects of the accounting for the acquisition of Tomkins.
The financial statements for the period succeeding the acquisition, the Successor financial statements, comprise the Company’s consolidated financial statements. The Company draws up its annual financial statements to December 31. Although the Company was incorporated on September 1, 2010, it had no assets or liabilities (other than the proceeds of the shares issued on incorporation) and no operations prior to the acquisition of Tomkins. Accordingly, the Successor financial statements present the results of the Successor’s operations for the 14-week period from September 25, 2010 to December 31, 2010 (‘Q4 2010’) and for the year ended December 31, 2011 (‘Fiscal 2011’).
C. Basis of consolidation
The consolidated financial statements include the results, cash flows and assets and liabilities of the Company and its subsidiaries, and the Group’s share of the results and net assets of its associates.
A subsidiary is an entity controlled, either directly or indirectly, by the Company, where control is the power to govern the financial and operating policies of the entity so as to obtain benefit from its activities. The results of a subsidiary acquired during the period are included in the Group’s results from the effective date of acquisition. The results of a subsidiary sold during the period are included in the Group’s results up to the effective date of disposal.
Intra-Group transactions and balances, and any unrealized profits or losses arising from intra-Group transactions, are eliminated on consolidation.
Pinafore Holdings B.V.
Group Financial Statements
NOTES TO THE CONSOLIDATED FINANCIAL STATEMENTS (CONTINUED)
| 3. | Principal accounting policies continued |
D. Associates
An associate is an entity over which the Company, either directly or indirectly, is in a position to exercise significant influence by participating in, but not controlling or jointly controlling, the financial and operating policies of the entity.
Associates are accounted for using the equity method whereby the investments in associates are carried in the balance sheet at cost as adjusted for changes in the Group’s share of the net assets of the associate, less any recognized impairment. Profits or losses recognized by the Company or its subsidiaries on transactions with an associate are eliminated to the extent of the Group’s interest in the associate concerned.
Losses of an associate in excess of the Group’s interest in the entity are not recognized, except to the extent that the Group has incurred obligations on behalf of the entity.
E. Foreign currency translation
At entity level, transactions denominated in currencies other than the entity’s functional currency are translated into the entity’s functional currency at the exchange rate ruling on the date of the transaction. Monetary assets and liabilities denominated in foreign currencies are translated at the exchange rate ruling on the balance sheet date. Currency translation differences arising at an entity level are recognized in profit or loss.
On consolidation, the results of foreign operations are translated into the Group’s presentation currency at the average exchange rate for the period and their assets and liabilities are translated into the Group’s presentation currency at the exchange rate ruling on the balance sheet date. Currency translation differences arising on consolidation are recognized in other comprehensive income (‘OCI’) and taken to the currency translation reserve.
In the event that a foreign operation is sold, the gain or loss on disposal recognized in profit or loss is determined after taking into account the cumulative currency translation differences arising on consolidation of the operation.
In the cash flow statement, the cash flows of foreign operations are translated into the Group’s presentation currency at the average exchange rate for the period.
F. Revenue
Revenue from the sale of goods is measured at the invoiced amount net of returns, early settlement discounts, rebates and sales taxes and is recognized only where there is persuasive evidence of a sales agreement, the delivery of goods has occurred and, where there are contractual acceptance provisions, the customer has accepted the goods (or the right to reject them has lapsed), the sale price is fixed or determinable and the collectability of revenue is reasonably assured.
Where a customer has the right to return unwanted goods, future returns are estimated based on historical returns profiles. Settlement discounts that may apply to unpaid invoices are estimated based on the settlement histories of the relevant customers. Rebates that may apply to issued invoices are estimated based on expected total qualifying sales to the relevant customers.
Interest income is accrued on a time basis using the effective interest method.
Dividend income is recognized when payment is received.
G. Restructuring initiatives
Restructuring initiatives comprise expenses incurred in major projects undertaken to rationalize and improve the cost competitiveness of the Group and consequential gains and losses arising on the disposal or exit of businesses or on the disposal of assets.
H. Borrowing costs
Borrowing costs directly attributable to the construction of a production, distribution or administration facility are capitalized as part of the cost of the facility if, at the outset of construction, the facility was expected to take more than 12 months to get ready for its intended use.
All other borrowing costs are recognized in profit or loss in the period in which they are incurred.
I. Business combinations
(i) Background
Effective January 3, 2010, the Group adopted IFRS 3 (Revised 2008) ‘Business Combinations’ and IAS 27 (Revised 2008) ‘Consolidated and Separate Financial Statements’, which contained a number of changes that affected the accounting for business combinations and subsequent changes in the Group’s ownership interest in a subsidiary. The revised standards were applied prospectively to business combinations with an effective date of acquisition on or after January 3, 2010.
(ii) Businesses acquired before January 3, 2010
Business combinations were accounted for using the purchase method.
Goodwill arising in a business combination was measured as the excess of the cost of acquisition over the interest acquired by the Group in the fair value of the identifiable assets, liabilities and contingent liabilities of the acquired business that were recognized at the acquisition date. Where the interest acquired by the Group in the fair value of the identifiable assets, liabilities and contingent liabilities that were recognized exceeded the cost of acquisition, the excess was recognized as a gain in profit or loss.
The cost of acquisition comprised the aggregate of the fair values of the assets given, liabilities incurred or assumed and equity instruments issued by the Group in exchange for control over the acquired business and any costs directly attributable to the business combination.
The identifiable assets, liabilities and contingent liabilities of the acquired business that were recognized were measured at their fair value at the acquisition date, except for assets that were classified as held for sale, which were measured at fair value less costs to sell.
Any non-controlling interests were initially measured at their share of the identifiable assets, liabilities and contingent liabilities of the acquired business that were recognized at the acquisition date.
If the initial accounting for a business combination was incomplete by the end of the reporting period in which the combination occurred, the Group reported provisional amounts for the items for which the accounting was incomplete. If, within a maximum of one year after the acquisition date, new information was obtained about facts and circumstances that existed at the acquisition date that, if known, would have affected the amounts recognized at that date, adjustments were made to the amounts recognized, or new assets and liabilities recognized, as at the acquisition date. Otherwise, with the exception of adjustments to contingent consideration and the recognition of previously unrecognized deferred tax assets of the acquired business, adjustments to the provisional amounts were recognized in profit or loss.
Subsequent adjustments to the estimated amount of contingent consideration were recognized as adjustments to the cost of acquisition.
Where deferred tax assets of the acquired business at the acquisition date were not initially recognized but were subsequently recognized, the income tax benefit was recognized as income but, in addition, the Group reduced the carrying amount of goodwill recognized on the acquisition and recognized the reduction in the carrying amount of goodwill as an expense in profit or loss.
Pinafore Holdings B.V.
Group Financial Statements
NOTES TO THE CONSOLIDATED FINANCIAL STATEMENTS (CONTINUED)
| 3. | Principal accounting policies continued |
I. Business combinations (continued)
Where a business combination was achieved in stages, the Group treated each exchange transaction separately and applied the purchase method at the date of each exchange transaction.
Where the Group sold an interest in a subsidiary, the difference between the consideration received and the carrying amount of the interest in the subsidiary that was sold was recognized in profit or loss.
(iii) Businesses acquired on or after January 3, 2010
A business combination is a transaction or other event in which the Group obtains control of one or more businesses.
Business combinations are accounted for using the acquisition method.
Goodwill arising in a business combination is measured as the excess of the aggregate of the consideration transferred, the amount of any non-controlling interest in the acquired business and, in a business combination achieved in stages, the fair value at the acquisition date of the Group’s previously held equity interest in the acquired business, over the identifiable assets and liabilities of the acquired business at the acquisition date. If the identifiable assets and liabilities of the acquired business exceed the aggregate of the consideration transferred, the amount of any non-controlling interest in the acquired business and the fair value at the acquisition date of any previously held equity interest, that excess is recognized as a gain in profit or loss.
Consideration transferred in a business combination is measured at the aggregate of the fair values of the assets given, liabilities incurred or assumed and equity instruments issued by the Group in exchange for control over the acquired business. Acquisition-related costs are recognized in profit or loss as incurred.
Any non-controlling interests in the acquired business are measured either at fair value or at the non-controlling interest’s proportionate share of the identifiable assets and liabilities of the acquired business.
Identifiable assets and liabilities of the acquired business are measured at their fair value at the acquisition date, except for the following that are measured in accordance with the relevant Group accounting policy:
| • | | pensions and other post-employment benefit arrangements; |
| • | | equity instruments related to the replacement of share-based incentives awarded to employees of the acquired business; |
| • | | deferred tax assets and liabilities of the acquired business; and |
| • | | assets classified as held for sale. |
If the initial accounting for a business combination is incomplete by the end of the reporting period in which the combination occurs, the Group reports provisional amounts for the items for which the accounting is incomplete. If, within a maximum of one year after the acquisition date, new information is obtained about facts and circumstances that existed at the acquisition date that, if known, would have affected the amounts recognized at that date, adjustments are made to the amounts recognized, or new assets and liabilities recognized, as at the acquisition date. Otherwise, any adjustments to the provisional amounts are recognized in profit or loss.
When a business combination is achieved in stages, the Group’s previously held interests in the acquired business are remeasured to their fair value when the Group obtains control of the acquired business and the resulting gain or loss, if any, is recognized in profit or loss.
Changes in the Group’s ownership interest in a subsidiary that do not result in a loss of control are accounted for within equity. In such circumstances, the carrying amounts of equity attributable to the shareholders of the Company and to non-controlling interests are adjusted to reflect the changes in their relative interests in the subsidiary. Any difference between the amount by which the non-controlling interests are adjusted and the fair value of the consideration paid or received is recognized directly in equity and attributed to the shareholders of the Company.
If the Group loses control of a subsidiary, it derecognizes the assets and liabilities and related equity components of the former subsidiary and measures any investment retained in the former subsidiary at its fair value at the date when control is lost. Any gain or loss is recognized in profit or loss.
J. Goodwill
Goodwill arising in a business combination is recognized as an intangible asset and is allocated to the cash generated unit (‘CGU’) or group of CGUs that are expected to benefit from the synergies of the acquisition.
Where a number of CGUs or groups of CGUs are acquired in a business combination, the goodwill attributable to each of them is determined by allocating the purchase consideration in proportion to their respective business enterprise values and comparing the allocated purchase consideration with the fair value of the identifiable assets and liabilities of the CGU or group of CGUs.
Goodwill is not amortized but is tested at least annually for impairment and carried at cost less any recognized impairment.
K. Other intangible assets
Other intangible assets are stated at cost less accumulated amortization and any recognized impairment losses.
(i) Assets acquired in business combinations
An intangible resource acquired in a business combination is recognized as an intangible asset if it is separable from the acquired business or arises from contractual or legal rights. An acquired intangible asset with a definite useful life is amortized on a straight-line basis so as to charge its cost, which represents its fair value at the date of acquisition, to profit or loss over its expected useful life, as follows:
| | | | |
Customer relationships | | | 16 to 19 years | |
Technology and know how | | | 7 to 9 years | |
Acquired brands and trade names are considered to have an indefinite useful life and are not amortized but are tested at least annually for impairment and carried at cost less any recognized impairment.
(ii) Product development costs
All research expenditure is charged to profit or loss in the period in which it is incurred.
Development expenditure is charged to profit or loss in the period in which it is incurred unless it relates to the development of a new or significantly improved product, it is incurred after the technical feasibility of the product has been proven, and customer orders have been received that are expected to provide income sufficient to cover the further development expenditure that will be incurred prior to the product going into full production. Capitalized development expenditure is amortized on a straight-line basis such that it is charged to profit or loss over the expected life of the resulting product.
(iii) Computer software
Computer software that is not integral to an item of property, plant and equipment is recognized separately as an intangible asset. Amortization is provided on a straight-line basis so as to charge the cost of the software to profit or loss over its expected useful life, which is in the range 2 to 10 years.
F-10
Pinafore Holdings B.V.
Group Financial Statements
NOTES TO THE CONSOLIDATED FINANCIAL STATEMENTS (CONTINUED)
| 3. | Principal accounting policies continued |
L. Property, plant and equipment
Property, plant and equipment is stated at cost less accumulated depreciation and any recognized impairment losses.
Freehold land and assets under construction are not depreciated. Depreciation of property, plant and equipment, other than freehold land and assets under construction, is generally provided on a straight-line basis so as to charge the depreciable amount to profit or loss over the useful life of the asset as follows:
| | |
Freehold buildings and long-leasehold property | | 50 years |
Short-leasehold property | | Length of lease |
Plant, equipment and vehicles | | 2 to 25 years |
Property, plant and equipment acquired in a business combination is depreciated so as to charge the depreciable amount, which represents its fair value at the date of acquisition less expected residual value, to profit or loss over the remaining useful life of the asset.
M. Leases
Leases that confer rights and obligations similar to those that attach to owned assets are classified as finance leases. All other leases are classified as operating leases.
Assets held under finance leases are included within property, plant and equipment, initially measured at their fair value or, if lower, the present value of the minimum lease payments, and a corresponding liability is recognized within obligations under finance leases. Subsequently, the assets are depreciated on a basis consistent with similar owned assets or over the term of the lease, if shorter. At inception of the lease, the lease rentals are apportioned between an interest element and a capital element so as to produce a constant periodic rate of interest on the outstanding liability. Thereafter, the interest element is recognized as an expense in profit or loss while the capital element is applied to reduce the outstanding liability.
Operating lease payments, and any incentives receivable, are recognized in profit or loss on a straight-line basis over the term of the lease.
N. Impairment of long-lived assets
Goodwill, other intangible assets and property, plant and equipment are tested for impairment whenever events or circumstances indicate that their carrying amounts might be impaired. Additionally, goodwill, other intangible assets considered to have an indefinite useful life and any capitalized development expenditure relating to a product that is not yet in full production are subject to an annual impairment test.
An asset is impaired to the extent that its carrying amount exceeds its recoverable amount, which represents the higher of the asset’s value in use and its fair value less costs to sell. An asset’s value in use represents the present value of the future cash flows expected to be derived from the continued use of the asset. Fair value less costs to sell is the amount obtainable from the sale of the asset in an arm’s length transaction between knowledgeable, willing parties, less the costs of disposal.
Where it is not possible to estimate the recoverable amount of an individual asset, the recoverable amount is determined for the CGU to which the asset belongs. An asset’s CGU is the smallest group of assets that includes the asset and generates cash inflows that are largely independent of the cash inflows from other assets or groups of assets. Goodwill does not generate cash flows independently of other assets and is, therefore, tested for impairment at the level of the CGU or group of CGUs to which it is allocated.
Where appropriate, impairment of long-lived assets other than goodwill is recognized before goodwill is tested for impairment. When goodwill is tested for impairment and the carrying amount of
the CGU or group of CGUs to which the goodwill has been allocated exceeds its recoverable amount, the impairment is allocated first to reduce the carrying amount of the goodwill and then to the other long-lived assets belonging to the CGU or group of CGUs pro-rata on the basis of their carrying amounts.
Impairments are recognized in profit or loss. Impairments recognized in previous periods for long-lived assets other than goodwill are reversed if there has been a change in the estimates used to determine the asset’s recoverable amount, but only to the extent that the carrying amount of the asset does not exceed its carrying amount had no impairment been recognized in previous periods. Impairments recognized in respect of goodwill are not reversed.
O. Inventories
Inventories are valued at the lower of cost and net realizable value, with due allowance for any excess, obsolete or slow-moving items. Cost represents the expenditure incurred in bringing inventories to their existing location and condition, which may include the cost of raw materials, direct labor costs, other direct costs and related production overheads. Cost is generally determined on a first in, first out basis. Net realizable value is the estimated selling price less costs to complete and sell.
P. Grants
Grants received relating to property, plant and equipment are treated as deferred income and recognized in profit or loss in equal installments over the expected useful life of the asset concerned. Other grants received are recognized in profit or loss on a systematic basis so as to match them with the costs they are intended to compensate or, if those costs have already been recognized, the grants are recognized in profit or loss in the period in which they are received.
Q. Financial instruments
(i) Investments
Listed investments are classified as available-for-sale and are measured at fair value. Changes in their fair values are recognized in OCI and taken to the available-for-sale reserve, except to the extent that they represent an other than temporary impairment in which case the impairment is recognized in profit or loss. In the event that such an investment is sold, the realized gain or loss is transferred from OCI to profit or loss.
(ii) Trade receivables
Trade receivables represent the amount of sales of goods to customers for which payment has not been received, less an allowance for doubtful accounts that is estimated based on factors such as the credit rating of the customer, historical trends, the current economic environment and other information.
(iii) Cash and cash equivalents
Cash and cash equivalents comprise cash in hand, deposits available on demand and other short-term, highly-liquid investments with a maturity on acquisition of three months or less, and bank overdrafts. Bank overdrafts are presented as current liabilities to the extent that there is no right of offset with cash balances.
(iv) Trade payables
Trade payables represent the amount of invoices received from suppliers for purchases of goods and services for which payment has not been made.
(v) Bank and other loans
Bank and other loans are initially measured at fair value, net of directly attributable transaction costs, if any, and are subsequently measured at amortized cost using the effective interest rate method.
Pinafore Holdings B.V.
Group Financial Statements
NOTES TO THE CONSOLIDATED FINANCIAL STATEMENTS (CONTINUED)
| 3. | Principal accounting policies continued |
Q. Financial instruments (continued)
(vi) Derivative financial instruments
From time to time, the Group uses derivative financial instruments, principally foreign currency swaps, forward foreign currency contracts and interest rate swaps, to reduce its exposure to exchange rate and interest rate movements. The Group does not hold or issue derivatives for speculative purposes.
Derivative financial instruments are recognized as assets and liabilities measured at their fair values at the balance sheet date. Changes in their fair values are recognized in profit or loss and this is likely to cause volatility in situations where the carrying value of the hedged item is not normally adjusted to reflect fair value changes arising from the hedged risk or is so adjusted but that adjustment is not recognized in profit or loss. Provided the conditions specified by IAS 39 ‘Financial Instruments: Recognition and Measurement’ are met, hedge accounting may be used to mitigate this volatility.
The Group does not generally apply hedge accounting to transactional foreign currency hedging relationships, such as hedges of forecast or committed transactions. It does, however, apply hedge accounting to translational foreign currency hedging relationships and to hedges of its interest rate exposures where it is permissible to do so under IAS 39. When hedge accounting is used, the relevant hedging relationships are classified as a fair value hedge, a cash flow hedge or, in the case of a hedge of the Group’s net investment in a foreign operation, a net investment hedge.
Where the hedging relationship is classified as a fair value hedge, the carrying amount of the hedged asset or liability is adjusted by the change in its fair value attributable to the hedged risk and the resulting gain or loss is recognized in profit or loss where, to the extent that the hedge is effective, it offsets the change in the fair value of the hedging instrument.
Where the hedging relationship is classified as a cash flow hedge or as a net investment hedge, to the extent the hedge is effective, the change in the fair value of the hedging instrument attributable to the hedged risk is recognized in OCI rather than in profit or loss. When the hedged item in a cash flow hedge is recognized in the financial statements, the accumulated gain or loss recognized in OCI is either transferred to profit or loss or, if the hedged item results in a non-financial asset, is recognized as an adjustment to the asset’s initial carrying amount. In the event that a foreign operation that is designated as a hedged item in a net investment hedge is sold, the accumulated currency translation gain or loss on the hedging instrument that is recognized in OCI is transferred to profit or loss and included in the gain or loss on disposal of the foreign operation.
Derivative financial instruments are classed as current assets or liabilities unless they are in a designated hedging relationship and the hedged item is classified as a non-current asset or liability.
Derivative financial instruments that are not in a designated hedging relationship are classified as held for trading.
(vii) Contracts to buy or sell non-financial items
From time to time, the Group enters into forward contracts to fix the price of energy and raw materials purchased for use in its manufacturing operations. Such contracts fall outside the scope of IAS 39, provided that they were entered into and continue to be held for the purpose of receipt or delivery in accordance with the Group’s expected purchase, sale or usage requirements. Where these conditions are not met, the contracts are classified and accounted for in the same way as derivative financial instruments.
(viii) Embedded derivatives
A derivative embedded in a non-derivative hybrid contract is separated from the host contract when its risks and characteristics are not closely related to those of the host contract and the hybrid contract is not measured at fair value with changes in fair value recognized in profit or loss. An embedded derivative that is separated from its host contract is presented as a separate asset or liability measured at fair value with changes in fair value recognized in profit or loss and is classed as a current or non-current asset or liability based on the cash flows of the hybrid contract.
R. Post-employment benefits
Post-employment benefits comprise pension benefits provided to employees throughout the world and other benefits, mainly healthcare, provided to certain employees in North America.
For defined contribution plans, the cost of providing the benefits represents the Group’s contributions to the plans and is recognized in profit or loss in the period in which the contributions fall due.
For defined benefit plans, the cost of providing the benefits is determined based on actuarial valuations of each of the plans that are carried out annually at the Group’s balance sheet date by independent, qualified actuaries. Plan assets are measured at their fair value at the balance sheet date. Benefit obligations are measured on an actuarial basis using the projected unit credit method.
The cost of defined benefit plans recognized in profit or loss comprises the net total of the current service cost, the past service cost, the expected return on plan assets, the interest cost and the effect of any curtailments or settlements. The current service cost represents the increase in the present value of the plan liabilities expected to arise from employee service in the current period. The past service cost is the change in the benefit obligation that results from changes in the benefits payable in respect of employee service in prior periods. The past service cost may be either positive or negative and is recognized in profit or loss on a straight-line basis over the vesting period, or immediately if the benefits have vested.
The expected return on plan assets is based on market expectations at the beginning of the period of future returns over the life of the benefit obligation. The interest cost represents the increase in the benefit obligation due to the passage of time. The discount rate used is determined at the balance sheet date by reference to market yields on high-quality corporate bonds, where available, or on government bonds. Gains or losses on curtailments or settlements are recognized in profit or loss in the period in which the curtailment or settlement occurs.
Actuarial gains and losses, which represent differences between the expected and actual returns on the plan assets and the effect of changes in the actuarial assumptions, are recognized in OCI in the period in which they occur.
The defined benefit liability or asset recognized in the balance sheet comprises the net total for each plan of the present value of the benefit obligation, minus any past service costs not yet recognized, minus the fair value of the plan assets at the balance sheet date. Where a plan is in surplus, the asset recognized is limited to the amount of any unrecognized past service costs and the present value of any amounts that the Group expects to recover by way of refunds or a reduction in future contributions. The net total for all plans in surplus is classified as a non-current asset. The net total for all plans in deficit is classified as a non-current liability.
Pinafore Holdings B.V.
Group Financial Statements
NOTES TO THE CONSOLIDATED FINANCIAL STATEMENTS (CONTINUED)
| 3. | Principal accounting policies continued |
S. Share-based incentives
Share-based incentives are provided to employees under the Group’s share option, bonus and other share award schemes. All ongoing schemes are classified as equity-settled. The Group recognizes a compensation expense in respect of these schemes that is based on the market-based value of the awards, which, where appropriate, is measured using either the Black-Scholes option-pricing formula or a Monte Carlo valuation model. Expected volatility of the price of the shares that are subject to an award is measured using the Merton model based on the volatility of the price of equivalent listed securities. Market-based value is determined at the grant date and reflects market performance conditions and all non-vesting conditions. Market-based value is not subsequently remeasured unless the conditions on which the award was granted are modified. If an award is modified, an additional compensation expense is recognized if and to the extent that the market-based value of the modified award is higher than the fair value of the existing award both measured at the modification date.
Generally, the compensation expense is recognized on a straight-line basis over the vesting period. Adjustments are made to reduce the compensation expense to reflect expected and actual forfeitures during the vesting period due to failure to satisfy a service condition or a non-market performance condition.
In the event of a cancellation, whether by the Group or by a participating employee, or settlement of an award by the Group, the compensation expense that would have been recognized over the remainder of the vesting period is recognized immediately in profit or loss. Any payment made to the employee on cancellation or settlement is accounted for as the repurchase of an equity interest, except if the payment exceeds the market-based value of the award measured on the settlement date when the excess is recognized as an additional compensation expense. Where new equity-settled awards are granted that are identified by the Group as replacements for the cancelled awards, the replacement awards are accounted for as a modification of the cancelled awards.
T. Provisions
A provision is a liability of uncertain timing or amount and is generally recognized when the Group has a present obligation as a result of a past event, it is probable that payment will be made to settle the obligation and the payment can be estimated reliably. Additionally, in a business combination, a provision is required in respect of a present obligation of the acquired business at the acquisition date even where it is not probable that payments will be made to settle the obligation but the payment can be estimated reliably.
Provision is made for warranty claims when the relevant products are sold, based on historical experience of the nature, frequency and average cost of warranty claims.
Provision is made for the cost of product recalls if management considers it probable that it will be necessary to recall a specific product and the amount can be reasonably estimated.
Provision is made for restructuring costs when a detailed formal plan for the restructuring has been determined and the plan has been communicated to the parties that may be affected by it. Gains from the expected disposal of assets are not taken into account in measuring restructuring provisions and provision is not made for future operating losses.
Provision is made for claims for compensation for injuries sustained by the Group’s employees while at work. The provision represents management’s best estimate of the liability for claims made but not yet fully settled and for incidents which have occurred but have not yet been reported to the Group. The Group’s liability for claims made but not yet fully settled is
calculated on an actuarial basis by a third party administrator. Historical data trends are used to estimate the liability for unreported incidents.
U. Taxation
Current tax is the amount of tax payable or recoverable in respect of the taxable profit or loss for the period. Taxable profit differs from accounting profit because it excludes items of income or expense that are recognized in the period for accounting purposes but are either not taxable or deductible for tax purposes or are taxable or deductible in other periods. Current tax is calculated using tax rates that have been enacted or substantively enacted at the balance sheet date.
The Group recognizes provisions in respect of uncertain tax positions whereby additional current tax may become payable in future periods following the audit by the tax authorities of previously-filed tax returns. Provisions for uncertain tax positions are based upon management’s assessment of the likely outcome of issues associated with assumed permanent differences, interest that may be applied to temporary differences, and the possible disallowance of tax credits and penalties. Provisions for uncertain tax positions are reviewed regularly and are adjusted to reflect events such as the expiry of limitation periods for assessing tax, administrative guidance given by the tax authorities and court decisions.
Deferred tax is tax expected to be payable or recoverable on differences between the carrying amount of an asset or a liability and its tax base used in the computation of taxable profit. Deferred tax is accounted for using the liability method, whereby deferred tax liabilities are generally recognized for all taxable temporary differences and deferred tax assets are recognized to the extent that it is probable that taxable profits will be available in the foreseeable future against which the deductible temporary differences may be utilized.
Deferred tax assets and liabilities are not recognized if the temporary difference arises from the initial recognition of goodwill or from the initial recognition of other assets and liabilities in a transaction other than a business combination that affects neither accounting profit nor taxable profit.
Deferred tax is provided on temporary differences arising on investments in foreign subsidiaries and associates, except to the extent that the Group is able to control the timing of the reversal of the temporary difference and it is not probable that the temporary difference will reverse in the foreseeable future.
Deferred tax is calculated using the tax rates that are expected to apply in the period in which the liability is settled or the asset is realized.
Current tax assets and current tax liabilities are offset when there is a legally enforceable right to set off the amounts and management intends to settle on a net basis. Deferred tax assets and deferred tax liabilities are offset where there is a legally enforceable right to offset current tax assets and current tax liabilities and the deferred tax assets and deferred tax liabilities relate to income taxes levied by the same taxation authority on the same taxable entity.
Current and deferred tax is recognized in profit or loss unless it relates to an item that is recognized in the same or a different period outside profit or loss, in which case it too is recognized outside profit or loss, either in OCI or directly in equity.
Pinafore Holdings B.V.
Group Financial Statements
NOTES TO THE CONSOLIDATED FINANCIAL STATEMENTS (CONTINUED)
| 3. | Principal accounting policies continued |
V. Assets held for sale and discontinued operations
An asset is classified as held for sale if its carrying amount will be recovered by sale rather than by continuing use in the business, the asset is available for immediate sale in its present condition, management is committed to, and has initiated, a plan to sell the asset which, when initiated, was expected to result in a completed sale within 12 months. An extension of the period required to complete the sale does not preclude the asset from being classified as held for sale, provided the delay was for reasons beyond the Group’s control and management remains committed to its plan to sell the asset. Assets that are classified as held for sale are measured at the lower of their carrying amount and fair value less costs to sell.
A discontinued operation is a component of an entity that has either been disposed of, or satisfies the criteria to be classified as held for sale, and represents a separate major line of business or geographic area of operations, is part of a single coordinated plan to dispose of a separate major line of business or geographic area of operations, or is a subsidiary acquired exclusively with a view to disposal.
W. Accounting pronouncements not yet adopted
Recently-issued accounting pronouncements that may be relevant to the Group’s operations but have not yet been adopted are outlined below. None of these pronouncements has yet been endorsed for use in the European Union. Management has not yet completed its assessment of these pronouncements and is therefore not currently able to estimate reliably the impact of their adoption on the Group’s results or financial position.
IFRS 9 ‘Financial Instruments’
In November 2009, the IASB issued IFRS 9 which represents the first phase of its replacement of IAS 39 and introduces new requirements for the classification and measurement of financial assets and removes the need to separately account for certain embedded derivatives.
IFRS 9 is effective for annual periods commencing on or after January 1, 2015. Early adoption is permitted, but the standard has not yet been endorsed for use in the European Union.
Suite of pronouncements on consolidation, joint arrangements and disclosures
In May 2011, the IASB issued the following four pronouncements on consolidation, joint arrangements and disclosures. These pronouncements, together with IAS 27 ‘Separate Financial Statements (revised 2011)’, which is not relevant to the Group���s consolidated financial statements, are effective for annual periods commencing on or after January 1, 2013. Early adoption is permitted, provided that all five pronouncements are adopted at the same time.
IAS 28 ‘Investments in Associates and Joint Ventures (2011)’
The revisions to the existing standard have been made largely to conform it with the changes arising from the issuance of IFRS 10 ‘Consolidated Financial Statements’and IFRS 11 ‘Joint Arrangements’, and to incorporate the accounting for joint ventures as prescribed by IFRS 11.
IFRS 10 ‘Consolidated Financial Statements’
This standard will require a parent to present consolidated financial statements as those of a single economic entity, replacing the requirements previously contained in IAS 27 ‘Consolidated and Separate Financial Statements’ and SIC-12 ‘Consolidation - Special Purpose Entities’.
The standard identifies the principles of control and introduces a single consolidation model for all entities based on control, irrespective of the nature of the investee.
IFRS 11 ‘Joint Arrangements’
IFRS 11 replaces IAS 31 ‘Interests in Joint Ventures’ and requires a party to a joint arrangement to determine the type of joint arrangement in which it is involved by assessing its rights and obligations and then account for those rights and obligations accordingly. Joint arrangements are either joint operations (where the parties recognize their assets, liabilities, revenue and expenses in relation to their interest in the joint operation) or joint ventures (where the parties apply the equity method of accounting for its investment in accordance with IAS 28 ‘Investments in Associates and Joint Ventures (2011)’. The use of proportionate consolidation is no longer permitted.
IFRS 12 ‘Disclosure of Interests in Other Entities’
This standard requires extensive disclosure of information to enable users of financial statements to evaluate the nature of, and risks associated with, interests in other entities and the effects of those interests on its financial position, financial performance and cash flows.
These disclosures would include significant judgments and assumptions (such as how control, joint control, significant influence has been determined), details of the structure of the group, risks associated with structured entities and the nature, extent and financial effects of interests in joint arrangements and associates.
IFRS 13 ‘Fair Value Measurement’
Also during May 2011, the IASB replaced the guidance on fair value measurement in existing IFRSs with a standard that establishes a single framework for fair value measurements required by other IFRSs.
This IFRS defines fair value, provides guidance on how to determine fair value and requires disclosures about fair value measurements.
With some exceptions, the standard requires entities to classify these measurements into the three-level ‘fair value hierarchy’ currently required for financial instruments based on the nature of the inputs.
Entities are required to make various disclosures depending upon the use of the fair value measurement (e.g. whether it is recognized in the financial statements or merely disclosed) and the level in which it is classified.
IFRS 13 is effective for annual periods commencing on or after January 1, 2013 and is to be adopted prospectively from the adoption date, with early adoption permitted.
IAS 19 ‘Employee Benefits (2011)’
During June 2011, the IASB issued an amended version of IAS 19 ‘Employee Benefits’ with revised requirements for pensions and other post-retirement benefits and termination benefits. The key amendments include the elimination of the ‘corridor approach’ permitted by the existing IAS 19, requirements for the disaggregation of changes in the defined benefit plan obligations and plan assets into specific components, enhanced disclosures around defined benefit plans, and certain modifications to the accounting for termination benefits.
The amendments to IAS 19 are effective for annual periods commencing on or after January 1, 2013 and are to be adopted on retrospective basis from the adoption date (with certain exceptions), with early adoption permitted.
Pinafore Holdings B.V.
Group Financial Statements
NOTES TO THE CONSOLIDATED FINANCIAL STATEMENTS (CONTINUED)
| 3. | Principal accounting policies continued |
W. Accounting pronouncements not yet adopted (continued)
‘Presentation of Items of Other Comprehensive Income (Amendments to IAS 1)’
These amendments to IAS 1 ‘Presentation of Financial Statements’ revise the way in which OCI is presented. The amendments will require items presented in OCI (including the tax associated with such items) to be grouped based on whether or not they may subsequently be reclassified to profit or loss.
The amendments to IAS 1 are effective for annual periods commencing on or after July 1, 2012, with early adoption permitted.
Amendments to IAS 32 ‘Financial instruments: Presentation’ and IFRS 7 ‘Financial instruments: Disclosures’
In December 2011, the IASB issued amendments to IAS 32 to clarify the application of rules for offsetting financial instruments. The revisions focused on the meaning of “currently has a legally enforceable right of set-off”, the application of simultaneous realization and settlement, the offsetting of collateral amounts and the unit of account for applying the offsetting requirements.
Amendments were concurrently made to IFRS 7 to require disclosure of information about financial instruments that have been set off in accordance with IAS 32. The amendments also require disclosures around financial instruments that are subject to enforceable master netting arrangements and similar agreements even if they are not set off under IAS 32.
The amendments to IFRS 7 are effective on a retrospective basis for annual periods commencing on or after January 1, 2013, while the amendments to IAS 32 are effective for annual periods commencing on or after January 1, 2014, also on a retrospective basis.
| 4. | Critical accounting estimates & judgments |
A. Background
When applying the Group’s accounting policies, management must make assumptions, estimates and judgments concerning the future that affect the carrying amounts of assets and liabilities at the balance sheet date, the disclosure of contingencies that existed at the balance sheet date and the amounts of revenue and expenses recognized during the accounting period. Such assumptions, estimates and judgments are based on factors such as historical experience, the observance of trends in the industries in which the Group operates and information available from the Group’s customers and other outside sources.
Due to the inherent uncertainty involved in making assumptions, estimates and judgments, the actual outcomes could be different. An analysis of the key sources of estimation uncertainty at the balance sheet date that have a significant risk of causing a material adjustment to the carrying amounts of the Group’s assets and liabilities within the next financial year is presented below.
B. Post-employment benefits
The Group operates pension plans throughout the world, covering the majority of its employees. Pension benefits are provided by way of both defined contribution plans and defined benefit plans. The Group’s defined benefit pension plans are closed to new entrants. The Group also provides other post-employment benefits, principally health and life insurance cover, to certain of its employees in North America by way of unfunded defined benefit plans.
The Group accounts for post-employment benefits in accordance with IAS 19 ‘Employee Benefits’, whereby the cost of defined benefit plans is determined based on actuarial valuations of the plans that are carried out annually at the Group’s balance sheet date. The actuarial valuations are dependent on assumptions about the future that are made by management on the advice of independent qualified actuaries.
If actual experience differs from these assumptions, there could be a material change in the amounts recognized by the Group in respect of defined benefit plans in the next financial year.
As at December 31, 2011, the present value of the benefit obligation was $1,136.4 million. The benefit obligation is calculated using a number of assumptions including future salary increases, increases to pension benefits, mortality rates and, in the case of post-employment medical benefits, the expected rate of increase in medical costs. The present value of the benefit obligation is calculated by discounting the benefit obligation using market yields on high-quality corporate bonds at the balance sheet date. As at December 31, 2011, the fair value of the plan assets was $1,134.7 million.
The plan assets consist largely of listed securities and their fair values are subject to fluctuation in response to changes in market conditions.
Effects of changes in the actuarial assumptions underlying the benefit obligation, effects of changes in the discount rate applicable to the benefit obligation and effects of differences between the expected and actual return on the plan assets are classified as actuarial gains and losses and are recognized in other comprehensive income. During 2011, the Group recognized a net actuarial gain of $33.4 million. Further actuarial gains and losses will be recognized during the next financial year.
An analysis of the assumptions that will be used by management to determine the cost of defined benefit plans that will be recognized in profit or loss in the next financial year is presented in note 35.
C. Impairment of long-lived assets
Goodwill, other intangible assets and property, plant and equipment are tested for impairment whenever events or circumstances indicate that their carrying amounts might be impaired. Additionally, goodwill and other intangible assets that have indefinite useful lives are subject to an annual impairment test. Due to the nature of the Group’s operations, it is generally not possible to estimate the recoverable amount for individual long-lived assets and impairment tests are usually based on the value in use of the CGU or group of CGUs to which the asset belongs.
Value in use represents the net present value of the cash flows expected to arise from the relevant CGU or group of CGUs and its calculation requires management to estimate those cash flows and to apply a suitable discount rate to them.
Management bases the estimated cash flows of the CGU or group of CGUs on assumptions such as the future changes in sales volumes, future changes in selling prices, and future changes in material prices, salaries and other costs. Management determines a discount rate for each CGU or group of CGUs using a capital asset pricing model, which is based on variables including the applicable risk-free interest rates and, for determining the cost of equity, the long-term equity risk premium and the assumed share price volatility relative to the market and, for determining the cost of debt, the assumed credit risk spreads.
Pinafore Holdings B.V.
Group Financial Statements
NOTES TO THE CONSOLIDATED FINANCIAL STATEMENTS (CONTINUED)
| 4. | Critical accounting estimates & judgments continued |
C. Impairment of long-lived assets (continued)
As at December 31, 2011, the carrying amount of long-lived assets was $4,419.5 million. Impairment losses may be recognized on these assets within the next financial year if there are adverse changes in the variables and assumptions underlying the estimated future cash flows of the CGUs or the discount rates that are applied to those cash flows. The sensitivity of the carrying amount of goodwill to the key assumptions underlying the value in use calculations is discussed in note 20.
D. Inventory
Inventories are stated at the lower of cost and net realizable value, with due allowance for excess, obsolete or slow-moving items. Net realizable value is based on current assessments of future demand, market conditions and new product development initiatives. As at December 31, 2011, the carrying value of inventories was $571.7 million, net of allowances of $19.7 million. Should demand for the Group’s products decline during the next financial year, additional allowances may be necessary in respect of excess or slow-moving items.
E. Financial instruments
Derivative financial instruments are recognized as an asset or a liability measured at their fair value at the balance sheet date. The fair value of derivatives continually changes in response to changes in prevailing market conditions and applicable credit risk spreads.
Where permissible under IAS 39, the Group uses hedge accounting to mitigate the impact of changes in the fair value of derivatives on profit or loss but the Group’s results may be affected by changes in the fair values of derivatives where hedge accounting cannot be applied or due to hedge ineffectiveness.
F. Workers’ compensation
Provision is made for claims for compensation for injuries sustained by the Group’s employees while at work. The Group’s liability for claims made but not fully settled is calculated on an actuarial basis. Historical data trends are used to estimate the liability for unreported incidents. As at December 31, 2011, the workers’ compensation provision amounted to $18.9 million.
Further provision may be necessary within the next financial year if the actual cost of settling claims exceeds management’s estimates.
G. Environmental liabilities
Provision is made for the estimated cost of known environmental remediation obligations in relation to the Group’s current and former manufacturing facilities. Cost estimates include the expenditure expected to be incurred in the initial remediation effort and, where appropriate, in the long-term monitoring of the relevant sites. Management monitors for each remediation project the costs incurred to date against expected total costs to complete and operates procedures to identify possible remediation obligations that are presently unknown.
As at December 31, 2011, the provision for environmental remediation costs amounted to $10.4 million. Further provision may be necessary within the next financial year if actual remediation costs exceed expected costs, new remediation obligations are identified or there are changes in the circumstances affecting the Group’s legal or constructive remediation obligations. The majority of the environmental provisions are currently expected to be utilized during 2013 and 2014.
H. Product warranties
Provision is made for the estimated cost of future warranty claims on the Group’s products. Management bases the provision on historical experience of the nature, frequency and average cost of warranty claims and takes into account recent trends that might suggest that the historical claims experience may differ from future claims. As at December 31, 2011, the Group’s provision for warranty claims amounted to $11.8 million. Further provision may be necessary within the next financial year if actual claims experience differs from management’s estimates.
I. Taxation
The Group is subject to income tax in most of the jurisdictions in which it operates. Management is required to exercise significant judgment in determining the Group’s provision for income taxes.
Estimation is required of taxable profit in order to determine the Group’s current tax liability. Management’s judgment is required in relation to uncertain tax positions whereby additional current tax may become payable in the future following the audit by the tax authorities of previously-filed tax returns. It is possible that the final outcome of these uncertain tax positions may differ from management’s estimates.
Estimation is also required of temporary differences between the carrying amount of assets and liabilities and their tax base. Deferred tax liabilities are recognized for all taxable temporary differences but, where there exist deductible temporary differences, management’s judgment is required as to whether a deferred tax asset should be recognized based on the availability of future taxable profits. As at December 31, 2011, the Group recognized net deferred tax liabilities amounting to $679.8 million. Deferred tax assets of $787.9 million were not recognized in respect of tax losses and tax credits carried forward. It is possible that the deferred tax assets actually recoverable may differ from the amounts recognized if actual taxable profits differ from management’s estimates.
As at December 31, 2011, the aggregate amount of temporary differences associated with investments in subsidiaries for which deferred tax liabilities have not been recognized was $1,421.5 million. Deferred tax liabilities have not been recognized on these temporary differences because the Group is able to control the timing of their reversal and it is not probable that they will reverse in the foreseeable future. Income tax may become payable on these temporary differences if circumstances change, for example upon the repatriation of assets from the subsidiaries concerned or on the sale or liquidation of one or more of them.
Pinafore Holdings B.V.
Group Financial Statements
NOTES TO THE CONSOLIDATED FINANCIAL STATEMENTS (CONTINUED)
A. Background
The Group’s operating segments are identified by grouping together businesses that manufacture similar products, and, in the case of the Gates group of businesses, by grouping together businesses that operate in similar regions, as this is the basis on which information is provided to the Board for the purposes of allocating resources within the Group and assessing the performance of the Group’s businesses.
The Group’s internal management reports distinguish between those of the Group’s continuing operations that are ongoing and those that have been exited but do not meet the conditions to be classified as discontinued operations. The Group’s operating segments are described in note 2.
The Group has refocused its operations around the Gates brand and has commenced the disposal of those businesses that are no longer a strategic fit for the Group. The internal reports presented to the Board reflect this re-focus on the performance of the Group’s ongoing businesses. As a consequence, the following changes to the Group’s reporting segments have been made:
| • | | the Gates businesses, which previously comprised the Power Transmission segment, the Fluid Power segment and a portion of the Other I&A segment, are now presented as the following four geographic segments: North America, EMEA, APAC and South America; |
| • | | the Stackpole businesses, previously included in the Power Transmission segment and which were sold in August 2011, are now presented as a separate segment named Powertrain and classified as exited; |
| • | | the Dexter Axle business has been moved out of the Other I&A segment and presented as a separate segment, leaving the Plews, Dexter Chassis and Ideal businesses in the Other I&A segment, which is now classified as exited, following the disposal of these businesses in April, August and October respectively. |
Comparative information for Q4 2010 and Fiscal 2009 has been re-presented to reflect these changes. Comparative information for 9M 2010 has been previously re-presented in the Group’s Quarterly Report released on November 8, 2011.
B. Measure of segment profit or loss
The Board uses adjusted earnings before net finance costs, income taxes, depreciation and amortization (‘adjusted EBITDA’) to measure the profitability of each segment. Adjusted EBITDA is, therefore, the measure of segment profit or loss presented in the Group’s segment disclosures.
‘EBITDA’ represents profit or loss for the period before net finance costs, income taxes, depreciation and amortization. Adjusted EBITDA represents EBITDA before specific items that are considered to hinder comparison of the trading performance of the Group’s businesses either year-on-year or with other businesses.
During the periods under review, the specific items excluded from EBITDA in arriving at adjusted EBITDA were as follows:
| • | | the effect on cost of sales of the uplift to the carrying amount of inventory held by Tomkins on its acquisition by the Group; |
| • | | the compensation expense in relation to share-based incentives; |
| • | | transaction costs incurred in business combinations; |
| • | | impairments, comprising impairments of goodwill and material impairments of other assets; |
| • | | the net gain or loss on disposals and on the exit of businesses; and |
| • | | the gain recognized on amendments to certain post-employment benefit plans in North America. |
F-17
Pinafore Holdings B.V.
Group Financial Statements
NOTES TO THE CONSOLIDATED FINANCIAL STATEMENTS (CONTINUED)
| 5. | Segment information continued |
C. Sales and adjusted EBITDA – continuing operations
| | | 0,000.0 | | | | 0,000.0 | | | | 0,000.0 | | | | 0,000.0 | | | | 0,000.0 | | | | 0,000.0 | | | | 0,000.0 | | | | 0,000.0 | |
| | | Sales | | | Adjusted EBITDA | |
| | | SUCCESSOR | | | PREDECESSOR | | | SUCCESSOR | | | PREDECESSOR | |
| | | Fiscal
2011
$ million | | | Q4
2010*
$ million | | | 9M
2010*
$ million | | | Fiscal
2009*
$ million | | | Fiscal
2011
$ million | | | Q4
2010*
$ million | | | 9M
2010*
$ million | | | Fiscal
2009*
$ million | |
Ongoing segments | | | | | | | | | | | | | | | | | | | | | | | | | | | | | | | | |
Industrial & Automotive: | | | | | | | | | | | | | | | | | | | | | | | | | | | | | | | | |
– Gates North America | | | 1,287.3 | | | | 308.4 | | | | 844.4 | | | | 956.4 | | | | 305.3 | | | | 71.1 | | | | 209.3 | | | | 153.3 | |
– Gates EMEA | | | 803.3 | | | | 205.4 | | | | 541.8 | | | | 663.4 | | | | 103.4 | | | | 19.2 | | | | 54.4 | | | | 54.0 | |
– Gates APAC | | | 708.7 | | | | 183.1 | | | | 447.9 | | | | 478.6 | | | | 135.2 | | | | 37.4 | | | | 93.8 | | | | 79.5 | |
– Gates South America | | | 156.7 | | | | 37.7 | | | | 109.5 | | | | 99.5 | | | | 4.5 | | | | 3.1 | | | | 16.2 | | | | 14.4 | |
| | | | | | | | | | | | | | | | | | | | | | | | | | | | | | | | |
| | | 2,956.0 | | | | 734.6 | | | | 1,943.6 | | | | 2,197.9 | | | | 548.4 | | | | 130.8 | | | | 373.7 | | | | 301.2 | |
– Dexter Axle | | | 281.4 | | | | 54.4 | | | | 190.8 | | | | 196.6 | | | | 40.5 | | | | 7.5 | | | | 31.2 | | | | 28.2 | |
| | | | | | | | | | | | | | | | | | | | | | | | | | | | | | | | |
| | | 3,237.4 | | | | 789.0 | | | | 2,134.4 | | | | 2,394.5 | | | | 588.9 | | | | 138.3 | | | | 404.9 | | | | 329.4 | |
| | | | | | | | | | | | | | | | | | | | | | | | | | | | | | | | |
Building Products: | | | | | | | | | | | | | | | | | | | | | | | | | | | | | | | | |
– Air Distribution | | | 882.9 | | | | 226.7 | | | | 636.2 | | | | 874.2 | | | | 104.2 | | | | 22.6 | | | | 80.5 | | | | 105.6 | |
– Bathware | | | 106.3 | | | | 27.1 | | | | 91.7 | | | | 140.3 | | | | (4.5 | ) | | | (1.2 | ) | | | (1.7 | ) | | | (0.1 | ) |
| | | | | | | | | | | | | | | | | | | | | | | | | | | | | | | | |
| | | 989.2 | | | | 253.8 | | | | 727.9 | | | | 1,014.5 | | | | 99.7 | | | | 21.4 | | | | 78.8 | | | | 105.5 | |
| | | | | | | | | | | | | | | | | | | | | | | | | | | | | | | | |
Corporate | | | — | | | | — | | | | — | | | | — | | | | (35.9 | ) | | | (6.1 | ) | | | (25.8 | ) | | | (26.7 | ) |
| | | | | | | | | | | | | | | | | | | | | | | | | | | | | | | | |
Total ongoing | | | 4,226.6 | | | | 1,042.8 | | | | 2,862.3 | | | | 3,409.0 | | | | 652.7 | | | | 153.6 | | | | 457.9 | | | | 408.2 | |
| | | | | | | | | | | | | | | | | | | | | | | | | | | | | | | | |
| | | | | | | | |
Exited segments | | | | | | | | | | | | | | | | | | | | | | | | | | | | | | | | |
Industrial & Automotive: | | | | | | | | | | | | | | | | | | | | | | | | | | | | | | | | |
– Powertrain | | | 200.2 | | | | 82.2 | | | | 226.4 | | | | 208.1 | | | | 28.1 | | | | 15.8 | | | | 25.1 | | | | 18.8 | |
– Other I&A | | | 163.9 | | | | 56.3 | | | | 181.7 | | | | 212.9 | | | | 19.3 | | | | 4.6 | | | | 16.6 | | | | 8.0 | |
| | | | | | | | | | | | | | | | | | | | | | | | | | | | | | | | |
| | | 364.1 | | | | 138.5 | | | | 408.1 | | | | 421.0 | | | | 47.4 | | | | 20.4 | | | | 41.7 | | | | 26.8 | |
| | | | | | | | |
Building Products: | | | | | | | | | | | | | | | | | | | | | | | | | | | | | | | | |
– Doors & Windows | | | — | | | | — | | | | — | | | | 36.5 | | | | (0.8 | ) | | | (0.2 | ) | | | (0.7 | ) | | | (12.9 | ) |
| | | | | | | | | | | | | | | | | | | | | | | | | | | | | | | | |
Total exited | | | 364.1 | | | | 138.5 | | | | 408.1 | | | | 457.5 | | | | 46.6 | | | | 20.2 | | | | 41.0 | | | | 13.9 | |
| | | | | | | | | | | | | | | | | | | | | | | | | | | | | | | | |
Total continuing operations | | | 4,590.7 | | | | 1,181.3 | | | | 3,270.4 | | | | 3,866.5 | | | | 699.3 | | | | 173.8 | | | | 498.9 | | | | 422.1 | |
| | | | | | | | | | | | | | | | | | | | | | | | | | | | | | | | |
| * | Re-presented (see note 5A) |
| | | 0,000.0 | | | | 0,000.0 | | | | 0,000.0 | | | | 0,000.0 | | | | 0,000.0 | | | | 0,000.0 | | | | 0,000.0 | | | | 0,000.0 | |
| | | Sales | | | Adjusted EBITDA | |
| | | SUCCESSOR | | | PREDECESSOR | | | SUCCESSOR | | | PREDECESSOR | |
| | | Fiscal
2011
$ million | | | Q4 2010
$ million | | | 9M 2010
$ million | | | Fiscal
2009
$ million | | | Fiscal
2011
$ million | | | Q4 2010
$ million | | | 9M
2010
$ million | | | Fiscal
2009
$ million | |
By origin | | | | | | | | | | | | | | | | | | | | | | | | | | | | | | | | |
US | | | 2,336.2 | | | | 571.9 | | | | 1,686.7 | | | | 2,104.7 | | | | 323.6 | | | | 66.3 | | | | 242.5 | | | | 190.9 | |
Rest of North America | | | 522.0 | | | | 163.8 | | | | 434.8 | | | | 446.9 | | | | 118.7 | | | | 37.5 | | | | 89.4 | | | | 67.7 | |
UK | | | 132.4 | | | | 35.7 | | | | 92.8 | | | | 137.5 | | | | 10.5 | | | | 2.3 | | | | 10.2 | | | | 5.0 | |
Rest of Europe | | | 668.3 | | | | 170.4 | | | | 443.6 | | | | 542.6 | | | | 86.9 | | | | 17.4 | | | | 33.6 | | | | 50.3 | |
Asia | | | 676.7 | | | | 174.1 | | | | 433.2 | | | | 465.3 | | | | 141.8 | | | | 42.9 | | | | 97.6 | | | | 85.0 | |
Rest of the world | | | 255.1 | | | | 65.4 | | | | 179.3 | | | | 169.5 | | | | 17.8 | | | | 7.4 | | | | 25.6 | | | | 23.2 | |
| | | | | | | | | | | | | | | | | | | | | | | | | | | | | | | | |
| | | 4,590.7 | | | | 1,181.3 | | | | 3,270.4 | | | | 3,866.5 | | | | 699.3 | | | | 173.8 | | | | 498.9 | | | | 422.1 | |
| | | | | | | | | | | | | | | | | | | | | | | | | | | | | | | | |
By destination | | | | | | | | | | | | | | | | | | | | | | | | | | | | | | | | |
US | | | 2,408.4 | | | | 607.0 | | | | 1,782.4 | | | | 2,180.4 | | | | | | | | | | | | | | | | | |
Rest of North America | | | 396.6 | | | | 110.4 | | | | 287.8 | | | | 314.8 | | | | | | | | | | | | | | | | | |
UK | | | 98.6 | | | | 27.7 | | | | 68.1 | | | | 84.2 | | | | | | | | | | | | | | | | | |
Rest of Europe | | | 699.5 | | | | 178.4 | | | | 464.4 | | | | 587.3 | | | | | | | | | | | | | | | | | |
Asia | | | 689.1 | | | | 181.1 | | | | 462.5 | | | | 493.8 | | | | | | | | | | | | | | | | | |
Rest of the world | | | 298.5 | | | | 76.7 | | | | 205.2 | | | | 206.0 | | | | | | | | | | | | | | | | | |
| | | | | | | | | | | | | | | | | | | | | | | | | | | | | | | | |
| | | 4,590.7 | | | | 1,181.3 | | | | 3,270.4 | | | | 3,866.5 | | | | | | | | | | | | | | | | | |
| | | | | | | | | | | | | | | | | | | | | | | | | | | | | | | | |
During the period, no sales originated in the Netherlands.
Sales between reporting segments and the impact of such sales on segmental adjusted EBITDA are not included in internal reports presented to the Board and have therefore not been included above.
F-18
Pinafore Holdings B.V.
Group Financial Statements
NOTES TO THE CONSOLIDATED FINANCIAL STATEMENTS (CONTINUED)
| 5. | Segment information continued |
C. Sales and adjusted EBITDA – continuing operations (continued)
Reconciliation of the profit or loss for the period to adjusted EBITDA:
| | | | | | | | | | | | | | | | | | |
| | | SUCCESSOR | | | | | PREDECESSOR | |
| | | Fiscal
2011
$ million | | | Q4 2010
$ million | | | | | 9M
2010
$ million | | | Fiscal
2009
$ million | |
Profit/(loss) for the period | | | 57.2 | | | | (270.2 | ) | | | | | 243.6 | | | | 6.0 | |
(Profit)/loss for the period from discontinued operations | | | (37.6 | ) | | | 0.8 | | | | | | (19.0 | ) | | | 12.8 | |
| | | | | | | | | | | | | | | | | | |
Profit/(loss) for the period from continuing operations | | | 19.6 | | | | (269.4 | ) | | | | | 224.6 | | | | 18.8 | |
Income tax (benefit)/expense | | | (19.2 | ) | | | (34.1 | ) | | | | | 62.5 | | | | 25.1 | |
| | | | | | | | | | | | | | | | | | |
Profit/(loss) before tax | | | 0.4 | | | | (303.5 | ) | | | | | 287.1 | | | | 43.9 | |
Net finance costs | | | 272.5 | | | | 99.2 | | | | | | 26.1 | | | | 44.3 | |
| | | | | | | | | | | | | | | | | | |
Operating profit/(loss) | | | 272.9 | | | | (204.3 | ) | | | | | 313.2 | | | | 88.2 | |
Amortization | | | 150.4 | | | | 41.3 | | | | | | 16.2 | | | | 24.4 | |
Depreciation | | | 170.8 | | | | 47.5 | | | | | | 104.9 | | | | 148.4 | |
| | | | | | | | | | | | | | | | | | |
EBITDA | | | 594.1 | | | | (115.5 | ) | | | | | 434.3 | | | | 261.0 | |
Inventory uplift | | | — | | | | 136.5 | | | | | | — | | | | — | |
Share-based incentives | | | 87.3 | | | | 70.9 | | | | | | 19.7 | | | | 10.4 | |
Transaction costs | | | 0.6 | | | | 78.2 | | | | | | 41.2 | | | | — | |
Impairments (see note 7) | | | 38.0 | | | | — | | | | | | — | | | | 73.0 | |
Restructuring costs (see note 8) | | | 40.2 | | | | 3.7 | | | | | | 10.0 | | | | 140.9 | |
Net gain on disposals and on the exit of businesses (see note 8) | | | (60.9 | ) | | | — | | | | | | (6.3 | ) | | | (0.2 | ) |
Gain on amendment of post-employment benefits (see note 9) | | | — | | | | — | | | | | | — | | | | (63.0 | ) |
| | | | | | | | | | | | | | | | | | |
Adjusted EBITDA | | | 699.3 | | | | 173.8 | | | | | | 498.9 | | | | 422.1 | |
| | | | | | | | | | | | | | | | | | |
D. Non-current assets
The geographic analysis of long-lived assets (goodwill and other intangible assets, and property, plant and equipment) and investments in associates, other than those included in assets held for sale, was as follows:
| | | | | | | | |
| | | As at
December 31,
2011
$ million | | | As at
December 31,
2010
$ million | |
By location | | | | | | | | |
US | | | 2,386.3 | | | | 2,849.3 | |
Rest of North America | | | 541.1 | | | | 377.9 | |
UK | | | 100.0 | | | | 346.7 | |
Rest of Europe | | | 490.6 | | | | 774.2 | |
Asia | | | 758.6 | | | | 809.4 | |
Rest of the world | | | 149.5 | | | | 239.1 | |
| | | | | | | | |
| | | 4,426.1 | | | | 5,396.6 | |
| | | | | | | | |
F-19
Pinafore Holdings B.V.
Group Financial Statements
NOTES TO THE CONSOLIDATED FINANCIAL STATEMENTS (CONTINUED)
| 5. | Segment information continued |
D. Non-current assets (continued)
Capital expenditure, depreciation and amortization in respect of long-lived assets was as follows:
SUCCESSOR
| | | | | | | | | | | | | | | | | | | | | | | | |
| | | Fiscal 2011 | | | Q4 2010* | |
| | | Capital
expenditure
$ million | | | Depreciation
$ million | | | Amortization
$ million | | | Capital
expenditure
$ million | | | Depreciation
$ million | | | Amortization
$ million | |
Continuing operations | | | | | | | | | | | | | | | | | | | | | | | | |
Ongoing segments | | | | | | | | | | | | | | | | | | | | | | | | |
Industrial & Automotive: | | | | | | | | | | | | | | | | | | | | | | | | |
– Gates North America | | | 26.9 | | | | 43.9 | | | | 67.5 | | | | 12.2 | | | | 10.4 | | | | 19.2 | |
– Gates EMEA | | | 13.3 | | | | 26.7 | | | | 24.2 | | | | 6.1 | | | | 7.9 | | | | 6.1 | |
– Gates APAC | | | 29.9 | | | | 30.1 | | | | 28.0 | | | | 15.9 | | | | 7.4 | | | | 7.2 | |
– Gates South America | | | 4.9 | | | | 7.7 | | | | 3.5 | | | | 3.6 | | | | 2.1 | | | | 0.9 | |
| | | | | | | | | | | | | | | | | | | | | | | | |
| | | 75.0 | | | | 108.4 | | | | 123.2 | | | | 37.8 | | | | 27.8 | | | | 33.4 | |
– Dexter | | | 2.9 | | | | 7.0 | | | | 7.6 | | | | 1.0 | | | | 1.9 | | | | 2.1 | |
| | | | | | | | | | | | | | | | | | | | | | | | |
| | | 77.9 | | | | 115.4 | | | | 130.8 | | | | 38.8 | | | | 29.7 | | | | 35.5 | |
| | | | | | | | | | | | | | | | | | | | | | | | |
Building Products: | | | | | | | | | | | | | | | | | | | | | | | | |
– Air Distribution | | | 12.5 | | | | 29.7 | | | | 14.8 | | | | 5.9 | | | | 8.2 | | | | 3.8 | |
– Bathware | | | 0.5 | | | | 7.6 | | | | 1.6 | | | | 0.1 | | | | 2.1 | | | | 0.5 | |
| | | | | | | | | | | | | | | | | | | | | | | | |
| | | 13.0 | | | | 37.3 | | | | 16.4 | | | | 6.0 | | | | 10.3 | | | | 4.3 | |
| | | | | | | | | | | | | | | | | | | | | | | | |
Corporate | | | 2.3 | | | | 0.4 | | | | 0.4 | | | | 0.2 | | | | — | | | | — | |
| | | | | | | | | | | | | | | | | | | | | | | | |
Total ongoing | | | 93.2 | | | | 153.1 | | | | 147.6 | | | | 45.0 | | | | 40.0 | | | | 39.8 | |
| | | | | | | | | | | | | | | | | | | | | | | | |
| | | | | | |
Exited segments | | | | | | | | | | | | | | | | | | | | | | | | |
Industrial & Automotive: | | | | | | | | | | | | | | | | | | | | | | | | |
– Powertrain | | | 12.8 | | | | 14.7 | | | | 1.6 | | | | 9.3 | | | | 5.5 | | | | 0.8 | |
– Other I&A | | | 1.5 | | | | 3.0 | | | | 1.2 | | | | 1.0 | | | | 2.0 | | | | 0.7 | |
| | | | | | | | | | | | | | | | | | | | | | | | |
Total exited | | | 14.3 | | | | 17.7 | | | | 2.8 | | | | 10.3 | | | | 7.5 | | | | 1.5 | |
| | | | | | | | | | | | | | | | | | | | | | | | |
Total continuing operations | | | 107.5 | | | | 170.8 | | | | 150.4 | | | | 55.3 | | | | 47.5 | | | | 41.3 | |
| | | | | | | | | | | | | | | | | | | | | | | | |
| | | | | | |
Discontinued operation | | | | | | | | | | | | | | | | | | | | | | | | |
Industrial & Automotive: | | | | | | | | | | | | | | | | | | | | | | | | |
– Sensors & Valves | | | 8.7 | | | | 12.9 | | | | 5.8 | | | | 4.9 | | | | 6.5 | | | | 2.9 | |
| | | | | | | | | | | | | | | | | | | | | | | | |
Total Group | | | 116.2 | | | | 183.7 | | | | 156.2 | | | | 60.2 | | | | 54.0 | | | | 44.2 | |
| | | | | | | | | | | | | | | | | | | | | | | | |
| * | Re-presented (see note 5A) |
F-20
Pinafore Holdings B.V.
Group Financial Statements
NOTES TO THE CONSOLIDATED FINANCIAL STATEMENTS (CONTINUED)
| 5. | Segment information continued |
D. Non-current assets (continued)
PREDECESSOR
| | | | | | | | | | | | | | | | | | | | | | | | |
| | | 9M 2010* | | | Fiscal 2009* | |
| | | Capital
expenditure
$ million | | | Depreciation
$ million | | | Amortization
$ million | | | Capital
expenditure
$ million | | | Depreciation
$ million | | | Amortization
$ million | |
Continuing operations | | | | | | | | | | | | | | | | | | | | | | | | |
Ongoing segments | | | | | | | | | | | | | | | | | | | | | | | | |
Industrial & Automotive: | | | | | | | | | | | | | | | | | | | | | | | | |
– Gates North America | | | 14.2 | | | | 23.2 | | | | 4.7 | | | | 18.5 | | | | 34.6 | | | | 8.0 | |
– Gates EMEA | | | 7.4 | | | | 16.7 | | | | 2.0 | | | | 17.2 | | | | 25.1 | | | | 2.4 | |
– Gates APAC | | | 25.9 | | | | 15.2 | | | | 3.7 | | | | 39.9 | | | | 17.3 | | | | 5.2 | |
– Gates South America | | | 2.0 | | | | 3.0 | | | | 0.1 | | | | 2.5 | | | | 4.8 | | | | 0.1 | |
| | | | | | | | | | | | | | | | | | | | | | | | |
| | | 49.5 | | | | 58.1 | | | | 10.5 | | | | 78.1 | | | | 81.8 | | | | 15.7 | |
– Dexter | | | 1.9 | | | | 4.6 | | | | 0.3 | | | | 8.7 | | | | 6.9 | | | | 0.4 | |
| | | | | | | | | | | | | | | | | | | | | | | | |
| | | 51.4 | | | | 62.7 | | | | 10.8 | | | | 86.8 | | | | 88.7 | | | | 16.1 | |
| | | | | | | | | | | | | | | | | | | | | | | | |
Building Products: | | | | | | | | | | | | | | | | | | | | | | | | |
– Air Distribution | | | 11.0 | | | | 17.2 | | | | 4.7 | | | | 13.6 | | | | 24.7 | | | | 7.2 | |
– Bathware | | | 2.9 | | | | 5.3 | | | | — | | | | 3.5 | | | | 8.3 | | | | 0.1 | |
| | | | | | | | | | | | | | | | | | | | | | | | |
| | | 13.9 | | | | 22.5 | | | | 4.7 | | | | 17.1 | | | | 33.0 | | | | 7.3 | |
| | | | | | | | | | | | | | | | | | | | | | | | |
Corporate | | | 3.9 | | | | 0.2 | | | | 0.2 | | | | 0.1 | | | | 0.2 | | | | 0.2 | |
| | | | | | | | | | | | | | | | | | | | | | | | |
Total ongoing | | | 69.2 | | | | 85.4 | | | | 15.7 | | | | 104.0 | | | | 121.9 | | | | 23.6 | |
| | | | | | | | | | | | | | | | | | | | | | | | |
| | | | | | |
Exited segments | | | | | | | | | | | | | | | | | | | | | | | | |
Industrial & Automotive: | | | | | | | | | | | | | | | | | | | | | | | | |
– Powertrain | | | 16.7 | | | | 14.7 | | | | — | | | | 9.4 | | | | 18.2 | | | | — | |
– Other I&A | | | 1.7 | | | | 4.8 | | | | 0.5 | | | | 3.8 | | | | 8.1 | | | | 0.8 | |
| | | | | | | | | | | | | | | | | | | | | | | | |
| | | 18.4 | | | | 19.5 | | | | 0.5 | | | | 13.2 | | | | 26.3 | | | | 0.8 | |
Building Products: | | | | | | | | | | | | | | | | | | | | | | | | |
– Doors & Windows | | | — | | | | — | | | | — | | | | 0.1 | | | | 0.2 | | | | — | |
| | | | | | | | | | | | | | | | | | | | | | | | |
Total exited | | | 18.4 | | | | 19.5 | | | | 0.5 | | | | 13.3 | | | | 26.5 | | | | 0.8 | |
| | | | | | | | | | | | | | | | | | | | | | | | |
Total continuing operations | | | 87.6 | | | | 104.9 | | | | 16.2 | | | | 117.3 | | | | 148.4 | | | | 24.4 | |
| | | | | | | | | | | | | | | | | | | | | | | | |
| | | | | | |
Discontinued operation | | | | | | | | | | | | | | | | | | | | | | | | |
Industrial & Automotive: | | | | | | | | | | | | | | | | | | | | | | | | |
– Sensors & Valves | | | 8.1 | | | | 15.2 | | | | 0.8 | | | | 5.7 | | | | 23.8 | | | | 1.2 | |
| | | | | | | | | | | | | | | | | | | | | | | | |
Total Group | | | 95.7 | | | | 120.1 | | | | 17.0 | | | | 123.0 | | | | 172.2 | | | | 25.6 | |
| | | | | | | | | | | | | | | | | | | | | | | | |
| * | Re-presented (see note 5A) |
Transaction costs may be analyzed as follows:
| | | | | | | | | | | | | | | | | | |
| | | SUCCESSOR | | | | | PREDECESSOR | |
| | | Fiscal
2011
$ million | | | Q4 2010
$ million | | | | | 9M
2010
$ million | | | Fiscal
2009
$ million | |
Acquisition of Tomkins: | | | | | | | | | | | | | | | | | | |
– Acquisition-related costs | | | 0.4 | | | | 78.2 | | | | | | — | | | | — | |
– Costs incurred by Tomkins | | | — | | | | — | | | | | | 40.9 | | | | — | |
| | | | | | | | | | | | | | | | | | |
| | | 0.4 | | | | 78.2 | | | | | | 40.9 | | | | — | |
Other acquisitions | | | 0.2 | | | | — | | | | | | 0.6 | | | | — | |
| | | | | | | | | | | | | | | | | | |
| | | 0.6 | | | | 78.2 | | | | | | 41.5 | | | | — | |
| | | | | | | | | | | | | | | | | | |
| | | | | |
Continuing operations | | | 0.6 | | | | 78.2 | | | | | | 41.2 | | | | — | |
Discontinued operation | | | — | | | | — | | | | | | 0.3 | | | | — | |
| | | | | | | | | | | | | | | | | | |
| | | 0.6 | | | | 78.2 | | | | | | 41.5 | | | | — | |
| | | | | | | | | | | | | | | | | | |
Acquisition-related costs incurred in relation to businesses acquired before January 3, 2010 were included in the cost of acquisition.
F-21
Pinafore Holdings B.V.
Group Financial Statements
NOTES TO THE CONSOLIDATED FINANCIAL STATEMENTS (CONTINUED)
In Fiscal 2011, in light of the prolonged weakness of the US residential construction end market, the Group recognized an impairment of $36.9 million in relation to Bathware, representing the entire goodwill allocated to this segment (see note 20).
Also during Fiscal 2011, an impairment of $0.7 million was recognized in relation to Schrader Duncan Limited (‘Schrader Duncan’), an associate that is listed on the Mumbai Stock Exchange and which is included within the discontinued Sensors & Valves segment.
In Fiscal 2009, the Group recognized impairments amounting to $73.0 million, comprising $18.9 million on goodwill and intangible assets arising on acquisitions, $38.6 million on assets that became impaired as a consequence of the Group’s restructuring initiatives and $15.5 million on long-term receivables held in relation to the disposal of businesses in previous years.
| | | | | | | | | | | | | | | | | | | | | | | | | | | | | | | | | | | | | | | | | | | | |
| | | SUCCESSOR | | | PREDECESSOR | |
| | | Fiscal 2011 | | | Q4
2010 | | | 9M
2010 | | | Fiscal 2009* | |
| | | Goodwill
$ million | | | Investment
in
associates
$ million | | | Property,
plant and
equipment
$ million | | | Total
$ million | | | Total $
million | | | Total
$ million | | | Goodwill
$ million | | | Other
intangible
assets
$ million | | | Property,
plant and
equipment
$ million | | | Other
receivables
$ million | | | Total
$ million | |
Continuing operations | | | | | | | | | | | | | | | | | | | | | | | | | | | | | | | | | | | | | | | | | | | | |
Ongoing segments | | | | | | | | | | | | | | | | | | | | | | | | | | | | | | | | | | | | | | | | | | | | |
Industrial & Automotive: | | | | | | | | | | | | | | | | | | | | | | | | | | | | | | | | | | | | | | | | | | | | |
– Gates North America | | | — | | | | — | | | | 0.1 | | | | 0.1 | | | | — | | | | — | | | | — | | | | 4.7 | | | | 13.1 | | | | — | | | | 17.8 | |
– Gates EMEA | | | — | | | | — | | | | — | | | | — | | | | — | | | | — | | | | — | | | | 3.3 | | | | 7.6 | | | | — | | | | 10.9 | |
– Gates APAC | | | — | | | | — | | | | — | | | | — | | | | — | | | | — | | | | — | | | | 2.7 | | | | — | | | | — | | | | 2.7 | |
– Gates South America | | | — | | | | — | | | | — | | | | — | | | | — | | | | — | | | | — | | | | 0.5 | | | | — | | | | — | | | | 0.5 | |
| | | | | | | | | | | | | | | | | | | | | | | | | | | | | | | | | | | | | | | | | | | | |
| | | — | | | | — | | | | 0.1 | | | | 0.1 | | | | — | | | | — | | | | — | | | | 11.2 | | | | 20.7 | | | | — | | | | 31.9 | |
– Dexter | | | — | | | | — | | | | — | | | | — | | | | — | | | | — | | | | — | | | | — | | | | 0.2 | | | | — | | | | 0.2 | |
| | | | | | | | | | | | | | | | | | | | | | | | | | | | | | | | | | | | | | | | | | | | |
| | | — | | | | — | | | | 0.1 | | | | 0.1 | | | | — | | | | — | | | | — | | | | 11.2 | | | | 20.9 | | | | — | | | | 32.1 | |
| | | | | | | | | | | | | | | | | | | | | | | | | | | | | | | | | | | | | | | | | | | | |
Building Products: | | | | | | | | | | | | | | | | | | | | | | | | | | | | | | | | | | | | | | | | | | | | |
– Air Distribution | | | — | | | | — | | | | — | | | | — | | | | — | | | | — | | | | 8.7 | | | | 9.7 | | | | 0.2 | | | | — | | | | 18.6 | |
– Bathware | | | 36.9 | | | | — | | | | 0.6 | | | | 37.5 | | | | — | | | | — | | | | — | | | | — | | | | 2.5 | | | | — | | | | 2.5 | |
| | | | | | | | | | | | | | | | | | | | | | | | | | | | | | | | | | | | | | | | | | | | |
| | | 36.9 | | | | — | | | | 0.6 | | | | 37.5 | | | | — | | | | — | | | | 8.7 | | | | 9.7 | | | | 2.7 | | | | — | | | | 21.1 | |
| | | | | | | | | | | | | | | | | | | | | | | | | | | | | | | | | | | | | | | | | | | | |
Corporate | | | — | | | | — | | | | — | | | | — | | | | — | | | | — | | | | — | | | | — | | | | — | | | | 15.5 | | | | 15.5 | |
| | | | | | | | | | | | | | | | | | | | | | | | | | | | | | | | | | | | | | | | | | | | |
Total ongoing | | | 36.9 | | | | — | | | | 0.7 | | | | 37.6 | | | | — | | | | — | | | | 8.7 | | | | 20.9 | | | | 23.6 | | | | 15.5 | | | | 68.7 | |
| | | | | | | | | | | | | | | | | | | | | | | | | | | | | | | | | | | | | | | | | | | | |
| | | | | | | | | | | |
Exited segments | | | | | | | | | | | | | | | | | | | | | | | | | | | | | | | | | | | | | | | | | | | | |
Industrial & Automotive: | | | | | | | | | | | | | | | | | | | | | | | | | | | | | | | | | | | | | | | | | | | | |
– Powertrain | | | — | | | | — | | | | — | | | | — | | | | — | | | | — | | | | — | | | | 1.1 | | | | 2.6 | | | | — | | | | 3.7 | |
– Other I&A | | | — | | | | — | | | | — | | | | — | | | | — | | | | — | | | | — | | | | — | | | | 0.6 | | | | — | | | | 0.6 | |
| | | | | | | | | | | | | | | | | | | | | | | | | | | | | | | | | | | | | | | | | | | | |
| | | — | | | | — | | | | — | | | | — | | | | — | | | | — | | | | — | | | | 1.1 | | | | 3.2 | | | | — | | | | 4.3 | |
Building Products: | | | | | | | | | | | | | | | | | | | | | | | | | | | | | | | | | | | | | | | | | | | | |
– Doors & Windows | | | — | | | | — | | | | 0.4 | | | | 0.4 | | | | — | | | | — | | | | — | | | | — | | | | — | | | | — | | | | — | |
| | | | | | | | | | | | | | | | | | | | | | | | | | | | | | | | | | | | | | | | | | | | |
Total exited | | | — | | | | — | | | | 0.4 | | | | 0.4 | | | | — | | | | — | | | | — | | | | 1.1 | | | | 3.2 | | | | — | | | | 4.3 | |
| | | | | | | | | | | | | | | | | | | | | | | | | | | | | | | | | | | | | | | | | | | | |
Total continuing operations | | | 36.9 | | | | — | | | | 1.1 | | | | 38.0 | | | | — | | | | — | | | | 8.7 | | | | 22.0 | | | | 26.8 | | | | 15.5 | | | | 73.0 | |
| | | | | | | | | | | | | | | | | | | | | | | | | | | | | | | | | | | | | | | | | | | | |
| | | | | | | | | | | |
Discontinued operation | | | | | | | | | | | | | | | | | | | | | | | | | | | | | | | | | | | | | | | | | | | | |
Industrial & Automotive: | | | | | | | | | | | | | | | | | | | | | | | | | | | | | | | | | | | | | | | | | | | | |
– Sensors & Valves | | | — | | | | 0.7 | | | | 0.8 | | | | 1.5 | | | | — | | | | — | | | | — | | | | — | | | | — | | | | — | | | | — | |
| | | | | | | | | | | | | | | | | | | | | | | | | | | | | | | | | | | | | | | | | | | | |
Total Group | | | 36.9 | | | | 0.7 | | | | 1.9 | | | | 39.5 | | | | — | | | | — | | | | 8.7 | | | | 22.0 | | | | 26.8 | | | | 15.5 | | | | 73.0 | |
| | | | | | | | | | | | | | | | | | | | | | | | | | | | | | | | | | | | | | | | | | | | |
| * | Re-presented (see note 5A) |
| 8. | Restructuring initiatives |
A. Restructuring costs
During Fiscal 2011, restructuring costs amounting to $40.2 million were recognized, principally in relation to Project Sierra, an initiative that focuses on identifying and implementing cost reduction opportunities and efficiency improvements across many of the Group’s businesses. In addition, the Group recognized $5.8 million in relation to severance costs due to reorganizations across the Gates businesses and in the Corporate segment. These costs were partially offset by the release of a provision for restructuring costs of $10.6 million due to the reversal of the decision to close a division of Stackpole, which comprises the Powertrain operating segment, following the recovery in the demand for its products.
Restructuring costs recognized during both Q4 2010 and 9M 2010 principally related to the cessation of certain North American manufacturing facilities within the Gates North America and Powertrain operating segments.
F-22
Pinafore Holdings B.V.
Group Financial Statements
NOTES TO THE CONSOLIDATED FINANCIAL STATEMENTS (CONTINUED)
| 8. | Restructuring initiatives continued |
A. Restructuring costs (continued)
Restructuring costs recognized during Fiscal 2009 principally arose in relation to the restructuring of the Group’s manufacturing operations under projects Eagle and Cheetah. In particular:
| • | | in Industrial & Automotive, the cessation of Gates EMEA’s manufacturing operations in Aachen, Germany, the cessation of its hose manufacturing activities in Erembodegem, Belgium and the substantial closure of its assembly facility at St. Neots, UK; the rationalization of Powertrain’s powder metal facility at Mississauga, Ontario, and the closures of its pulley and tensioner facility at London, Ontario, and FormFlo in the UK; the rationalization of Dexter’s manufacturing facilities, and, in Other Industrial & Automotive, the closure of Ideal’s manufacturing facility at St. Augustine, Florida; and |
| • | | in Building Products, the closure of the Philips Doors and Windows business. |
B. Disposals and exit of businesses
During Fiscal 2011, a net gain on the disposal and exit of businesses of $60.9 million was recognized, principally in relation to the disposal of Ideal during October 2011.
During 9M 2010, the Group recognized a net gain of $9.6 million on the disposal of property, plant and equipment, principally as a consequence of the restructuring of Bathware and the closure of Doors & Windows. However, a loss of $3.3 million was recognized in relation to the disposal of a subsidiary that took place in 2008 and on the disposal of Hydrolink’s operations in Kazakhstan (included in the Gates EMEA operating segment).
In Fiscal 2009, the Group recognized a net gain of $0.2 million in relation to the disposal of businesses in prior years.
SUCCESSOR
| | | | | | | | | | | | | | | | | | | | | | | | |
| | | Fiscal 2011 | | | Q4 2010* | |
| | | Restructuring
costs
$ million | | | Disposals
and exit
of
businesses
$ million | | | Total
$ million | | | Restructuring
costs
$ million | | | Disposals
and exit
of
businesses
$ million | | | Total
$ million | |
Continuing operations | | | | | | | | | | | | | | | | | | | | | | | | |
Ongoing segments | | | | | | | | | | | | | | | | | | | | | | | | |
Industrial & Automotive: | | | | | | | | | | | | | | | | | | | | | | | | |
– Gates North America | | | (26.8 | ) | | | 1.1 | | | | (25.7 | ) | | | 0.9 | | | | — | | | | 0.9 | |
– Gates EMEA | | | (11.0 | ) | | | 0.4 | | | | (10.6 | ) | | | 1.3 | | | | — | | | | 1.3 | |
– Gates APAC | | | (3.9 | ) | | | (0.1 | ) | | | (4.0 | ) | | | — | | | | — | | | | — | |
– Gates South America | | | (2.5 | ) | | | — | | | | (2.5 | ) | | | — | | | | — | | | | — | |
| | | | | | | | | | | | | | | | | | | | | | | | |
| | | (44.2 | ) | | | 1.4 | | | | (42.8 | ) | | | 2.2 | | | | — | | | | 2.2 | |
– Dexter | | | (0.2 | ) | | | 0.1 | | | | (0.1 | ) | | | (0.1 | ) | | | — | | | | (0.1 | ) |
| | | | | | | | | | | | | | | | | | | | | | | | |
| | | (44.4 | ) | | | 1.5 | | | | (42.9 | ) | | | 2.1 | | | | — | | | | 2.1 | |
| | | | | | | | | | | | | | | | | | | | | | | | |
Building Products: | | | | | | | | | | | | | | | | | | | | | | | | |
– Air Distribution | | | (1.2 | ) | | | — | | | | (1.2 | ) | | | — | | | | — | | | | — | |
– Bathware | | | 0.1 | | | | — | | | | 0.1 | | | | — | | | | — | | | | — | |
| | | | | | | | | | | | | | | | | | | | | | | | |
| | | (1.1 | ) | | | — | | | | (1.1 | ) | | | — | | | | — | | | | — | |
| | | | | | | | | | | | | | | | | | | | | | | | |
Corporate | | | (4.1 | ) | | | 4.8 | | | | 0.7 | | | | (2.0 | ) | | | — | | | | (2.0 | ) |
| | | | | | | | | | | | | | | | | | | | | | | | |
Total ongoing | | | (49.6 | ) | | | 6.3 | | | | (43.3 | ) | | | 0.1 | | | | — | | | | 0.1 | |
| | | | | | | | | | | | | | | | | | | | | | | | |
| | | | | | |
Exited segments | | | | | | | | | | | | | | | | | | | | | | | | |
Industrial & Automotive: | | | | | | | | | | | | | | | | | | | | | | | | |
– Powertrain | | | 9.7 | | | | — | | | | 9.7 | | | | (3.2 | ) | | | — | | | | (3.2 | ) |
– Other I&A | | | 0.1 | | | | 54.6 | | | | 54.7 | | | | (0.1 | ) | | | — | | | | (0.1 | ) |
| | | | | | | | | | | | | | | | | | | | | | | | |
| | | 9.8 | | | | 54.6 | | | | 64.4 | | | | (3.3 | ) | | | — | | | | (3.3 | ) |
Building Products | | | | | | | | | | | | | | | | | | | | | | | | |
– Doors & Windows | | | (0.4 | ) | | | — | | | | (0.4 | ) | | | (0.5 | ) | | | — | | | | (0.5 | ) |
| | | | | | | | | | | | | | | | | | | | | | | | |
Total exited | | | 9.4 | | | | 54.6 | | | | 64.0 | | | | (3.8 | ) | | | — | | | | (3.8 | ) |
| | | | | | | | | | | | | | | | | | | | | | | | |
Total continuing operations | | | (40.2 | ) | | | 60.9 | | | | 20.7 | | | | (3.7 | ) | | | — | | | | (3.7 | ) |
| | | | | | | | | | | | | | | | | | | | | | | | |
| | | | | | |
Discontinued operation | | | | | | | | | | | | | | | | | | | | | | | | |
Industrial & Automotive: | | | | | | | | | | | | | | | | | | | | | | | | |
– Sensors & Valves | | | — | | | | — | | | | — | | | | 1.7 | | | | — | | | | 1.7 | |
| | | | | | | | | | | | | | | | | | | | | | | | |
Total Group | | | (40.2 | ) | | | 60.9 | | | | 20.7 | | | | (2.0 | ) | | | — | | | | (2.0 | ) |
| | | | | | | | | | | | | | | | | | | | | | | | |
| * | Re-presented (see note 5A) |
F-23
Pinafore Holdings B.V.
Group Financial Statements
NOTES TO THE CONSOLIDATED FINANCIAL STATEMENTS (CONTINUED)
| 8. | Restructuring initiatives continued |
B. Disposals and exit of businesses (continued)
PREDECESSOR
| | | | | | | | | | | | | | | | | | | | | | | | |
| | | 9M 2010* | | | Fiscal 2009* | |
| | | Restructuring
costs
$ million | | | Disposals
and exit
of
businesses
$ million | | | Total
$ million | | | Restructuring
costs
$ million | | | Disposals
and exit
of
businesses
$ million | | | Total
$ million | |
Continuing operations | | | | | | | | | | | | | | | | | | | | | | | | |
Ongoing segments | | | | | | | | | | | | | | | | | | | | | | | | |
Industrial & Automotive: | | | | | | | | | | | | | | | | | | | | | | | | |
– Gates North America | | | (3.3 | ) | | | 6.0 | | | | 2.7 | | | | (24.8 | ) | | | — | | | | (24.8 | ) |
– Gates EMEA | | | (4.3 | ) | | | (1.7 | ) | | | (6.0 | ) | | | (54.2 | ) | | | — | | | | (54.2 | ) |
– Gates APAC | | | — | | | | — | | | | — | | | | (0.9 | ) | | | — | | | | (0.9 | ) |
– Gates South America | | | — | | | | — | | | | — | | | | (0.1 | ) | | | — | | | | (0.1 | ) |
| | | | | | | | | | | | | | | | | | | | | | | | |
| | | (7.6 | ) | | | 4.3 | | | | (3.3 | ) | | | (80.0 | ) | | | — | | | | (80.0 | ) |
– Dexter | | | (0.3 | ) | | | — | | | | (0.3 | ) | | | (2.2 | ) | | | — | | | | (2.2 | ) |
| | | | | | | | | | | | | | | | | | | | | | | | |
| | | (7.9 | ) | | | 4.3 | | | | (3.6 | ) | | | (82.2 | ) | | | — | | | | (82.2 | ) |
| | | | | | | | | | | | | | | | | | | | | | | | |
Building Products: | | | | | | | | | | | | | | | | | | | | | | | | |
– Air Distribution | | | (1.7 | ) | | | (0.8 | ) | | | (2.5 | ) | | | (5.1 | ) | | | — | | | | (5.1 | ) |
– Bathware | | | (0.1 | ) | | | 3.2 | | | | 3.1 | | | | (1.6 | ) | | | — | | | | (1.6 | ) |
| | | | | | | | | | | | | | | | | | | | | | | | |
| | | (1.8 | ) | | | 2.4 | | | | 0.6 | | | | (6.7 | ) | | | — | | | | (6.7 | ) |
| | | | | | | | | | | | | | | | | | | | | | | | |
Corporate | | | — | | | | (2.3 | ) | | | (2.3 | ) | | | (0.5 | ) | | | (0.1 | ) | | | (0.6 | ) |
| | | | | | | | | | | | | | | | | | | | | | | | |
Total ongoing | | | (9.7 | ) | | | 4.4 | | | | (5.3 | ) | | | (89.4 | ) | | | (0.1 | ) | | | (89.5 | ) |
| | | | | | | | | | | | | | | | | | | | | | | | |
| | | | | | |
Exited segments | | | | | | | | | | | | | | | | | | | | | | | | |
Industrial & Automotive: | | | | | | | | | | | | | | | | | | | | | | | | |
– Powertrain | | | (1.6 | ) | | | — | | | | (1.6 | ) | | | (25.4 | ) | | | — | | | | (25.4 | ) |
– Other I&A | | | (0.8 | ) | | | — | | | | (0.8 | ) | | | (6.2 | ) | | | 0.3 | | | | (5.9 | ) |
| | | | | | | | | | | | | | | | | | | | | | | | |
| | | (2.4 | ) | | | — | | | | (2.4 | ) | | | (31.6 | ) | | | 0.3 | | | | (31.3 | ) |
Building Products: | | | | | | | | | | | | | | | | | | | | | | | | |
– Doors & Windows | | | 2.1 | | | | 1.9 | | | | 4.0 | | | | (19.9 | ) | | | — | | | | (19.9 | ) |
| | | | | | | | | | | | | | | | | | | | | | | | |
Total exited | | | (0.3 | ) | | | 1.9 | | | | 1.6 | | | | (51.5 | ) | | | 0.3 | | | | (51.2 | ) |
| | | | | | | | | | | | | | | | | | | | | | | | |
Total continuing operations | | | (10.0 | ) | | | 6.3 | | | | (3.7 | ) | | | (140.9 | ) | | | 0.2 | | | | (140.7 | ) |
| | | | | | | | | | | | | | | | | | | | | | | | |
| | | | | | |
Discontinued operation | | | | | | | | | | | | | | | | | | | | | | | | |
Industrial & Automotive: | | | | | | | | | | | | | | | | | | | | | | | | |
– Sensors & Valves | | | — | | | | — | | | | — | | | | (3.2 | ) | | | — | | | | (3.2 | ) |
| | | | | | | | | | | | | | | | | | | | | | | | |
Total Group | | | (10.0 | ) | | | 6.3 | | | | (3.7 | ) | | | (144.1 | ) | | | 0.2 | | | | (143.9 | ) |
| | | | | | | | | | | | | | | | | | | | | | | | |
| * | Re-presented (see note 5A) |
F-24
Pinafore Holdings B.V.
Group Financial Statements
NOTES TO THE CONSOLIDATED FINANCIAL STATEMENTS (CONTINUED)
| 9. | Gain on amendment of post-employment benefits |
With effect from September 30, 2009, the Group closed its principal defined benefit pension plans in the US and Canada to future service accrual and the deferred pension benefits accrued under those plans were frozen, based on the pensionable salaries of participating employees at that date. In addition, the Group closed the Gates post-retirement healthcare plan in the US to employees who had not retired by December 31, 2009 and reduced the benefits payable to existing beneficiaries.
As a result of these amendments, the Group recognized a gain of $63.0 million in Fiscal 2009, of which $35.3 million related to pensions and $27.7 million to healthcare benefits.
| | | | | | | | | | | | | | | | | | |
| | | SUCCESSOR | | | | | PREDECESSOR | |
| | | Fiscal
2011
$ million | | | Q4 2010
$ million | | | | | 9M
2010
$ million | | | Fiscal
2009*
$ million | |
Ongoing segments | | | | | | | | | | | | | | | | | | |
Industrial & Automotive: | | | | | | | | | | | | | | | | | | |
– Gates North America | | | — | | | | — | | | | | | — | | | | 58.7 | |
Corporate | | | — | | | | — | | | | | | — | | | | 0.2 | |
| | | | | | | | | | | | | | | | | | |
Total ongoing | | | — | | | | — | | | | | | — | | | | 58.9 | |
| | | | | | | | | | | | | | | | | | |
| | | | | |
Exited segments | | | | | | | | | | | | | | | | | | |
Industrial & Automotive: | | | | | | | | | | | | | | | | | | |
– Powertrain | | | — | | | | — | | | | | | — | | | | 2.4 | |
– Other I&A | | | — | | | | — | | | | | | — | | | | 1.7 | |
| | | | | | | | | | | | | | | | | | |
| | | | | | | | | | | | | | | | | 4.1 | |
| | | | | | | | | | | | | | | | | | |
Total continuing operations | | | — | | | | — | | | | | | — | | | | 63.0 | |
| | | | | | | | | | | | | | | | | | |
| * | Re-presented (see note 5A) |
The average number of persons employed by the Group was as follows:
| | | | | | | | | | | | | | | | | | |
| | | SUCCESSOR | | | | | PREDECESSOR | |
| | | Fiscal
2011
Number | | | Q4
2010*
Number | | | | | 9M
2010*
Number | | | Fiscal
2009*
Number | |
Continuing operations | | | | | | | | | | | | | | | | | | |
Ongoing segments | | | | | | | | | | | | | | | | | | |
Industrial & Automotive: | | | | | | | | | | | | | | | | | | |
– Gates North America | | | 6,187 | | | | 6,145 | | | | | | 5,709 | | | | 5,627 | |
– Gates EMEA | | | 3,365 | | | | 3,407 | | | | | | 3,168 | | | | 2,969 | |
– Gates APAC | | | 3,785 | | | | 3,707 | | | | | | 3,397 | | | | 3,018 | |
– Gates South America | | | 909 | | | | 942 | | | | | | 832 | | | | 715 | |
| | | | | | | | | | | | | | | | | | |
| | | 14,246 | | | | 14,201 | | | | | | 13,106 | | | | 12,329 | |
– Dexter | | | 1,220 | | | | 1,111 | | | | | | 1,140 | | | | 971 | |
| | | | | | | | | | | | | | | | | | |
| | | 15,466 | | | | 15,312 | | | | | | 14,246 | | | | 13,300 | |
| | | | | | | | | | | | | | | | | | |
Building Products: | | | | | | | | | | | | | | | | | | |
– Air Distribution | | | 6,514 | | | | 6,736 | | | | | | 6,682 | | | | 7,074 | |
– Bathware | | | 700 | | | | 739 | | | | | | 895 | | | | 1,038 | |
| | | | | | | | | | | | | | | | | | |
| | | 7,214 | | | | 7,475 | | | | | | 7,577 | | | | 8,112 | |
| | | | | | | | | | | | | | | | | | |
Corporate | | | 112 | | | | 133 | | | | | | 146 | | | | 145 | |
| | | | | | | | | | | | | | | | | | |
Total ongoing | | | 22,792 | | | | 22,920 | | | | | | 21,969 | | | | 21,557 | |
| | | | | | | | | | | | | | | | | | |
Exited segments | | | | | | | | | | | | | | | | | | |
Industrial & Automotive: | | | | | | | | | | | | | | | | | | |
– Powertrain | | | 911 | | | | 1,538 | | | | | | 1,486 | | | | 1,249 | |
– Other I&A | | | 1,042 | | | | 1,584 | | | | | | 1,548 | | | | 1,496 | |
| | | | | | | | | | | | | | | | | | |
| | | 1,953 | | | | 3,122 | | | | | | 3,034 | | | | 2,745 | |
Building Products: | | | | | | | | | | | | | | | | | | |
– Doors & Windows | | | — | | | | — | | | | | | — | | | | 480 | |
| | | | | | | | | | | | | | | | | | |
Total exited | | | 1,953 | | | | 3,122 | | | | | | 3,034 | | | | 3,225 | |
| | | | | | | | | | | | | | | | | | |
Total continuing operations | | | 24,745 | | | | 26,042 | | | | | | 25,003 | | | | 24,782 | |
| | | | | | | | | | | | | | | | | | |
| | | | | |
Discontinued operation | | | | | | | | | | | | | | | | | | |
Industrial & Automotive: | | | | | | | | | | | | | | | | | | |
– Sensors & Valves | | | 2,204 | | | | 2,140 | | | | | | 2,078 | | | | 2,015 | |
| | | | | | | | | | | | | | | | | | |
Total Group | | | 26,949 | | | | 28,182 | | | | | | 27,081 | | | | 26,797 | |
| | | | | | | | | | | | | | | | | | |
| * | Re-presented (see note 5A) |
F-25
Pinafore Holdings B.V.
Group Financial Statements
NOTES TO THE CONSOLIDATED FINANCIAL STATEMENTS (CONTINUED)
| | | | | | | | | | | | | | | | | | |
| | | SUCCESSOR | | | | | PREDECESSOR | |
| | | Fiscal
2011
Number | | | Q4
2010
Number | | | | | 9M
2010
Number | | | Fiscal
2009
Number | |
By location | | | | | | | | | | | | | | | | | | |
US | | | 11,789 | | | | 12,284 | | | | | | 11,770 | | | | 12,307 | |
Rest of North America | | | 4,455 | | | | 5,170 | | | | | | 5,275 | | | | 5,070 | |
UK | | | 1,815 | | | | 1,799 | | | | | | 1,721 | | | | 1,740 | |
Rest of Europe | | | 2,751 | | | | 2,806 | | | | | | 2,573 | | | | 2,614 | |
Asia | | | 4,372 | | | | 4,353 | | | | | | 4,091 | | | | 3,763 | |
Rest of the world | | | 1,767 | | | | 1,770 | | | | | | 1,651 | | | | 1,303 | |
| | | | | | | | | | | | | | | | | | |
| | | 26,949 | | | | 28,182 | | | | | | 27,081 | | | | 26,797 | |
| | | | | | | | | | | | | | | | | | |
| | | | | |
Continuing operations | | | 24,745 | | | | 26,042 | | | | | | 25,003 | | | | 24,782 | |
Discontinued operation | | | 2,204 | | | | 2,140 | | | | | | 2,078 | | | | 2,015 | |
| | | | | | | | | | | | | | | | | | |
| | | 26,949 | | | | 28,182 | | | | | | 27,081 | | | | 26,797 | |
| | | | | | | | | | | | | | | | | | |
Staff costs recognized in profit or loss during the period were as follows:
| | | | | | | | | | | | | | | | | | |
| | | SUCCESSOR | | | | | PREDECESSOR | |
| | | Fiscal
2011
$ million | | | Q4 2010
$ million | | | | | 9M
2010
$ million | | | Fiscal
2009
$ million | |
Wages and salaries | | | 980.8 | | | | 281.2 | | | | | | 714.4 | | | | 921.3 | |
Social security costs | | | 118.0 | | | | 25.9 | | | | | | 88.6 | | | | 116.5 | |
Pensions (see note 35) | | | 32.0 | | | | 10.4 | | | | | | 26.8 | | | | 41.4 | † |
Other post-employment benefits (see note 35) | | | 0.1 | | | | — | | | | | | (1.7 | ) | | | 0.4 | † |
Share-based incentives (see note 36) | | | 88.8 | | | | 81.3 | | | | | | 21.2 | | | | 11.3 | |
Termination benefits | | | 8.1 | | | | 0.9 | | | | | | 10.4 | | | | 105.3 | |
| | | | | | | | | | | | | | | | | | |
| | | 1,227.8 | | | | 399.7 | | | | | | 859.7 | | | | 1,196.2 | |
| | | | | | | | | | | | | | | | | | |
| | | | | |
Continuing operations | | | 1,121.2 | | | | 371.6 | | | | | | 790.8 | | | | 1,099.1 | |
Discontinued operation | | | 106.6 | | | | 28.1 | | | | | | 68.9 | | | | 97.1 | |
| | | | | | | | | | | | | | | | | | |
| | | 1,227.8 | | | | 399.7 | | | | | | 859.7 | | | | 1,196.2 | |
| | | | | | | | | | | | | | | | | | |
| † | Excludes the gain on the amendment of certain plans in North America (see note 9). |
F-26
Pinafore Holdings B.V.
Group Financial Statements
NOTES TO THE CONSOLIDATED FINANCIAL STATEMENTS (CONTINUED)
| | | | | | | | | | | | | | | | | | |
| | | SUCCESSOR | | | | | PREDECESSOR | |
| | | Fiscal
2011
$ million | | | Q4 2010
$ million | | | | | 9M
2010
$ million | | | Fiscal
2009
$ million | |
Borrowings: | | | | | | | | | | | | | | | | | | |
– Interest on bank overdrafts | | | 0.7 | | | | — | | | | | | 6.0 | | | | 4.6 | |
– Interest on bank and other loans: | | | | | | | | | | | | | | | | | | |
Term loans | | | 126.7 | | | | 38.4 | | | | | | — | | | | — | |
Other bank loans | | | 2.9 | | | | — | | | | | | 0.5 | | | | 6.1 | |
Second Lien Notes | | | 109.4 | | | | 27.9 | | | | | | — | | | | — | |
2011 Notes | | | 6.2 | | | | 1.9 | | | | | | 13.3 | | | | 19.9 | |
2015 Notes | | | 1.5 | | | | 3.3 | | | | | | 17.2 | | | | 24.8 | |
– Interest on interest rate swaps in designated hedging relationships: | | | | | | | | | | | | | | | | | | |
Payable | | | — | | | | — | | | | | | 11.5 | | | | 22.1 | |
Receivable | | | — | | | | — | | | | | | (30.5 | ) | | | (44.7 | ) |
– Interest on interest rate swaps classed as held for trading: | | | | | | | | | | | | | | | | | | |
Payable | | | — | | | | — | | | | | | — | | | | 3.0 | |
Receivable | | | — | | | | — | | | | | | — | | | | (0.6 | ) |
| | | | | | | | | | | | | | | | | | |
| | | 247.4 | | | | 71.5 | | | | | | 18.0 | | | | 35.2 | |
Interest element of finance lease rentals | | | 0.2 | | | | — | | | | | | 0.2 | | | | 0.4 | |
Other interest payable | | | 6.1 | | | | 4.0 | | | | | | 3.2 | | | | 7.6 | |
| | | | | | | | | | | | | | | | | | |
| | | 253.7 | | | | 75.5 | | | | | | 21.4 | | | | 43.2 | |
Post-employment benefits: | | | | | | | | | | | | | | | | | | |
– Interest cost on benefit obligation (see note 35) | | | 64.4 | | | | 15.4 | | | | | | 50.4 | | | | 70.0 | |
| | | | | | | | | | | | | | | | | | |
| | | 318.1 | | | | 90.9 | | | | | | 71.8 | | | | 113.2 | |
| | | | | | | | | | | | | | | | | | |
| | | | | |
Continuing operations | | | 317.6 | | | | 90.8 | | | | | | 71.4 | | | | 111.0 | |
Discontinued operation | | | 0.5 | | | | 0.1 | | | | | | 0.4 | | | | 2.2 | |
| | | | | | | | | | | | | | | | | | |
| | | 318.1 | | | | 90.9 | | | | | | 71.8 | | | | 113.2 | |
| | | | | | | | | | | | | | | | | | |
Details of the bank and other loans are presented in note 30.
Interest expense includes the amortization of issue costs incurred in relation to the borrowings.
From time to time, interest rate swaps are used to manage the interest rate profile of the Group’s borrowings. Net interest payable or receivable on such interest rate swaps is therefore included in interest expense.
| | | | | | | | | | | | | | | | | | |
| | | SUCCESSOR | | | | | PREDECESSOR | |
| | | Fiscal
2011
$ million | | | Q4 2010
$ million | | | | | 9M
2010
$ million | | | Fiscal
2009
$ million | |
Interest on bank deposits | | | 3.6 | | | | 1.3 | | | | | | 2.4 | | | | 2.7 | |
Other interest receivable | | | 1.2 | | | | 1.1 | | | | | | 1.1 | | | | 1.9 | |
| | | | | | | | | | | | | | | | | | |
| | | 4.8 | | | | 2.4 | | | | | | 3.5 | | | | 4.6 | |
Post-employment benefits: | | | | | | | | | | | | | | | | | | |
– Expected return on plan assets (see note 35) | | | 67.1 | | | | 16.3 | | | | | | 44.7 | | | | 62.6 | |
| | | | | | | | | | | | | | | | | | |
| | | 71.9 | | | | 18.7 | | | | | | 48.2 | | | | 67.2 | |
| | | | | | | | | | | | | | | | | | |
| | | | | |
Continuing operations | | | 71.8 | | | | 18.7 | | | | | | 48.0 | | | | 67.0 | |
Discontinued operation | | | 0.1 | | | | — | | | | | | 0.2 | | | | 0.2 | |
| | | | | | | | | | | | | | | | | | |
| | | 71.9 | | | | 18.7 | | | | | | 48.2 | | | | 67.2 | |
| | | | | | | | | | | | | | | | | | |
F-27
Pinafore Holdings B.V.
Group Financial Statements
NOTES TO THE CONSOLIDATED FINANCIAL STATEMENTS (CONTINUED)
| | | | | | | | | | | | | | | | | | |
| | | SUCCESSOR | | | | | PREDECESSOR | |
| | | Fiscal
2011
$ million | | | Q4 2010
$ million | | | | | 9M
2010
$ million | | | Fiscal
2009
$ million | |
Derivative financial instruments: | | | | | | | | | | | | | | | | | | |
– Loss on derivatives in designated hedging relationships | | | — | | | | — | | | | | | (1.7 | ) | | | (1.0 | ) |
– Gain on derivatives classified as held for trading | | | — | | | | — | | | | | | — | | | | 2.3 | |
– (Loss)/gain on embedded derivatives | | | (7.5 | ) | | | 22.9 | | | | | | — | | | | — | |
Currency translation gain/(loss) on hedging instruments | | | 4.6 | | | | (1.5 | ) | | | | | (1.0 | ) | | | (1.6 | ) |
Loss on redemption of notes | | | (25.0 | ) | | | (0.9 | ) | | | | | — | | | | — | |
Gain on early settlement of loan note receivable | | | 1.2 | | | | — | | | | | | — | | | | — | |
Currency translation loss on the acquisition of Tomkins | | | — | | | | (47.6 | ) | | | | | — | | | | — | |
| | | | | | | | | | | | | | | | | | |
| | | (26.7 | ) | | | (27.1 | ) | | | | | (2.7 | ) | | | (0.3 | ) |
| | | | | | | | | | | | | | | | | | |
Other finance expense includes fair value gains and losses arising on financial instruments held by the Group to hedge its translational exposures where either the economic hedging relationship does not qualify for hedge accounting or to the extent that there is deemed to be ineffectiveness in a designated hedging relationship.
Gains and losses on derivative financial instruments are analyzed in note 33.
As explained in note 30, during Fiscal 2011, the Group made repayments against the principal amounts outstanding under certain of its debt facilities. In total, $519.1 million (Q4 2010: $462.2 million) of the principal amount of these facilities was repaid at a cost of $522.9 million (Q4 2010: $466.8 million). The carrying amount of the debt repaid was $547.9 million (Q4 2010: $463.1 million). Accordingly, the Group recognized a loss of $25.0 million (Q4 2010: $0.9 million) on the repayments.
Additionally, during Q4 2010, the Group incurred a currency translation loss on the acquisition of Tomkins due to the change in the rate of exchange between the pound sterling (in which the purchase consideration was denominated) and the US dollar (the functional currency of the acquiring entity), in the period between the effective date of the acquisition and the payment of the consideration to the former shareholders in Tomkins.
Other finance expense is wholly attributable to continuing operations.
F-28
Pinafore Holdings B.V.
Group Financial Statements
NOTES TO THE CONSOLIDATED FINANCIAL STATEMENTS (CONTINUED)
| 14. | Income tax (benefit)/expense |
A. Income tax recognized in profit or loss
| | | | | | | | | | | | | | | | | | |
| | | | | | | | | | | PREDECESSOR | |
| | | | | | | | | | | 9M
2010
$ million | | | Fiscal
2009
$ million | |
Current tax | | | | | | | | | | | | | | | | | | |
Domestic corporation tax - Predecessor | | | | | | | | | | | | | | | | | | |
UK corporation tax on profits for the period | | | | | | | | | | | | | 0.3 | | | | 0.3 | |
Adjustments in respect of prior periods | | | | | | | | | | | | | (0.3 | ) | | | 0.4 | |
| | | | | | | | | | | | | | | | | | |
Total UK tax | | | | | | | | | | | | | — | | | | 0.7 | |
| | | | | | | | | | | | | | | | | | |
| | | | |
| | | SUCCESSOR | | | | | | | | | |
| | | Fiscal
2011
$ million | | | Q4 2010
$ million | | | | | | | | | |
Domestic corporation tax - Successor | | | | | | | | | | | | | | | | | | |
Dutch corporation tax on profits for the period | | | — | | | | — | | | | | | | | | | | |
| | | | | | | | | | | | | | | | | | |
Total Dutch tax | | | — | | | | — | | | | | | | | | | | |
| | | | | | | | | | | | | | | | | | |
| | | | | |
Overseas tax on profits for the period | | | 80.6 | | | | 23.2 | | | | | | 72.6 | | | | 17.2 | |
Decrease in provision for uncertain tax positions | | | (16.1 | ) | | | (6.2 | ) | | | | | (15.5 | ) | | | 15.8 | |
Adjustments in respect of prior periods | | | (7.1 | ) | | | 0.1 | | | | | | (1.4 | ) | | | 8.0 | |
| | | | | | | | | | | | | | | | | | |
Total overseas tax | | | 57.4 | | | | 17.1 | | | | | | 55.7 | | | | 41.0 | |
| | | | | | | | | | | | | | | | | | |
| | | | | |
Total current tax | | | 57.4 | | | | 17.1 | | | | | | 55.7 | | | | 41.7 | |
| | | | | | | | | | | | | | | | | | |
| | | | | |
Deferred tax | | | | | | | | | | | | | | | | | | |
Origination or reversal of temporary differences | | | (28.2 | ) | | | (136.5 | ) | | | | | 22.6 | | | | (24.8 | ) |
Utilization of previously unrecognized tax losses | | | (21.4 | ) | | | (117.2 | ) | | | | | (35.3 | ) | | | (36.9 | ) |
Tax losses in the period not recognized | | | 8.5 | | | | 198.8 | | | | | | 21.3 | | | | 49.6 | |
Adjustments in respect of prior periods | | | 3.2 | | | | (0.7 | ) | | | | | (0.5 | ) | | | (0.4 | ) |
Other changes in unrecognized deferred tax assets | | | (22.4 | ) | | | 5.6 | | | | | | (1.8 | ) | | | (1.2 | ) |
| | | | | | | | | | | | | | | | | | |
Total deferred tax | | | (60.3 | ) | | | (50.0 | ) | | | | | 6.3 | | | | (13.7 | ) |
| | | | | | | | | | | | | | | | | | |
| | | | | |
Income tax (benefit)/charge for the period | | | (2.9 | ) | | | (32.9 | ) | | | | | 62.0 | | | | 28.0 | |
| | | | | | | | | | | | | | | | | | |
| | | | | |
Continuing operations | | | (19.2 | ) | | | (34.1 | ) | | | | | 62.5 | | | | 25.1 | |
Discontinued operation | | | 16.3 | | | | 1.2 | | | | | | (0.5 | ) | | | 2.9 | |
| | | | | | | | | | | | | | | | | | |
| | | (2.9 | ) | | | (32.9 | ) | | | | | 62.0 | | | | 28.0 | |
| | | | | | | | | | | | | | | | | | |
The income tax (benefit)/expense for the period recognized in profit or loss differs from the product of the profit/(loss) before tax for the period and the applicable rate of corporation tax as follows:
| | | | | | | | | | | | | | | | | | |
| | | SUCCESSOR | | | | | PREDECESSOR | |
| | | Fiscal
2011
$ million | | | Q4 2010
$ million | | | | | 9M
2010
$ million | | | Fiscal
2009
$ million | |
Profit/(loss) before tax: | | | | | | | | | | | | | | | | | | |
– Continuing operations | | | 0.4 | | | | (303.5 | ) | | | | | 287.1 | | | | 43.9 | |
– Discontinued operations | | | 53.9 | | | | 0.4 | | | | | | 18.5 | | | | (9.9 | ) |
| | | | | | | | | | | | | | | | | | |
| | | 54.3 | | | | (303.1 | ) | | | | | 305.6 | | | | 34.0 | |
| | | | | | | | | | | | | | | | | | |
| | | | | |
Predecessor UK corporation tax at 26% (Fiscal 2009: 28%) on profit before tax | | | | | | | | | | | | | 85.6 | | | | 9.5 | |
Successor Dutch corporation tax at 25% (Q4 2010: 25.5%) on loss before tax | | | 13.6 | | | | (77.3 | ) | | | | | | | | | | |
Permanent differences | | | (18.9 | ) | | | (22.2 | ) | | | | | 0.9 | | | | (3.3 | ) |
Adjustment in respect of prior periods | | | (3.9 | ) | | | (0.6 | ) | | | | | (2.2 | ) | | | 8.0 | |
Decrease in provisions for uncertain tax positions | | | (14.5 | ) | | | (6.2 | ) | | | | | (15.5 | ) | | | 15.8 | |
Effect of different tax rates on overseas profits | | | 44.6 | | | | (19.3 | ) | | | | | 13.3 | | | | (11.5 | ) |
Foreign tax credits | | | 9.5 | | | | (1.1 | ) | | | | | (1.9 | ) | | | (4.1 | ) |
Temporary differences on investment in subsidiaries | | | 2.0 | | | | 6.6 | | | | | | (2.3 | ) | | | 2.1 | |
Tax losses in the period not recognized | | | 8.5 | | | | 198.8 | | | | | | 21.3 | | | | 49.6 | |
Utilization of previously unrecognized tax losses | | | (21.4 | ) | | | (117.2 | ) | | | | | (35.4 | ) | | | (36.9 | ) |
Other changes in unrecognized deferred tax assets | | | (22.4 | ) | | | 5.6 | | | | | | (1.8 | ) | | | (1.2 | ) |
| | | | | | | | | | | | | | | | | | |
Income tax (benefit)/expense for the period | | | (2.9 | ) | | | (32.9 | ) | | | | | 62.0 | | | | 28.0 | |
| | | | | | | | | | | | | | | | | | |
F-29
Pinafore Holdings B.V.
Group Financial Statements
NOTES TO THE CONSOLIDATED FINANCIAL STATEMENTS (CONTINUED)
| 14. | Income tax (benefit)/expense continued |
A. Income tax recognized in profit or loss (continued)
Deferred tax assets amounting to $8.5 million (Q4 2010: $198.8 million; 9M 2010: $21.3 million; Fiscal 2009: $49.6 million) were not recognized on tax losses arising during the period because it was not considered probable that the taxable entities concerned would generate sufficient taxable profits in the foreseeable future against which the losses may be utilized. In Q4 2010, as a consequence of the acquisition of Tomkins, it was possible to utilize in other taxable entities previously unrecognized tax losses amounting to $117.2 million.
B. Income tax expense/(benefit) recognized outside profit and loss
| | | | | | | | | | | | | | | | | | |
| | | SUCCESSOR | | | | | PREDECESSOR | |
| | | Fiscal
2011
$ million | | | Q4 2010
$ million | | | | | 9M
2010
$ million | | | Fiscal
2009
$ million | |
Income tax on items recognized in other comprehensive income | | | | | | | | | | | | | | | | | | |
Gain/(loss) on net investment hedges | | | 0.8 | | | | — | | | | | | — | | | | 0.6 | |
Net actuarial gain/(loss) | | | 3.5 | | | | 15.8 | | | | | | (0.9 | ) | | | (27.0 | ) |
Available-for-sale investments: | | | | | | | | | | | | | | | | | | |
– Unrealized (loss)/gain arising in the period | | | (0.1 | ) | | | 0.1 | | | | | | — | | | | 0.1 | |
| | | | | | | | | | | | | | | | | | |
| | | 4.2 | | | | 15.9 | | | | | | (0.9 | ) | | | (26.3 | ) |
| | | | | | | | | | | | | | | | | | |
| | | | | |
Income tax on items recognized directly in equity | | | | | | | | | | | | | | | | | | |
Share-based incentives | | | (0.4 | ) | | | — | | | | | | (5.2 | ) | | | (0.9 | ) |
| | | | | | | | | | | | | | | | | | |
Income tax expense/(benefit) recognized outside profit or loss | | | 3.8 | | | | 15.9 | | | | | | (6.1 | ) | | | (27.2 | ) |
| | | | | | | | | | | | | | | | | | |
| 15. | Discontinued operations |
A. Background
During the second quarter of 2011, management began actively seeking prospective buyers for its Schrader Electronics and Schrader International businesses, which together constitute the Sensors & Valves operating segment. Schrader Electronics, which is based in Northern Ireland, is a designer and manufacturer of Tire Pressure Monitoring Systems and sells primarily into automotive OE markets in the US. Schrader International manufactures a range of automotive products including gauges and valves, which are sold mainly in the US and Europe.
The comparative information presented in these financial statements for discontinued operations for Q4 2010, 9M 2010 and Fiscal 2009 has been previously re-presented in the Group’s Registration Statement filed with the SEC on Form F-4, effective October 21, 2011.
In 9M 2010 and Fiscal 2009, the Group recognized an additional net loss of $7.2 million and $3.9 million respectively in relation to discontinued operations that were sold in previous years.
F-30
Pinafore Holdings B.V.
Group Financial Statements
NOTES TO THE CONSOLIDATED FINANCIAL STATEMENTS (CONTINUED)
| 15. | Discontinued operations continued |
B. Results and cash flows
The profit for the period from discontinued operations may be analyzed as follows:
| | | | | | | | | | | | | | | | | | |
| | | SUCCESSOR | | | | | PREDECESSOR | |
| | | Fiscal
2011
$ million | | | Q4 2010
$ million | | | | | 9M
2010
$ million | | | Fiscal
2009
$ million | |
Profit for the period | | | | | | | | | | | | | | | | | | |
Sales | | | 450.8 | | | | 107.9 | | | | | | 294.3 | | | | 313.6 | |
Cost of sales | | | (321.6 | ) | | | (87.8 | ) | | | | | (213.9 | ) | | | (247.7 | ) |
| | | | | | | | | | | | | | | | | | |
Gross profit | | | 129.2 | | | | 20.1 | | | | | | 80.4 | | | | 65.9 | |
Distribution costs | | | (28.0 | ) | | | (7.5 | ) | | | | | (20.4 | ) | | | (23.1 | ) |
Administrative expenses | | | (44.7 | ) | | | (13.5 | ) | | | | | (30.9 | ) | | | (43.4 | ) |
Transactions costs | | | — | | | | — | | | | | | (0.3 | ) | | | — | |
Impairments | | | (1.5 | ) | | | — | | | | | | — | | | | — | |
Restructuring costs | | | — | | | | 1.7 | | | | | | — | | | | (3.2 | ) |
Share of loss/(profit) of associates | | | (0.7 | ) | | | (0.3 | ) | | | | | (2.1 | ) | | | 0.3 | |
| | | | | | | | | | | | | | | | | | |
Operating profit/(loss) | | | 54.3 | | | | 0.5 | | | | | | 26.7 | | | | (3.5 | ) |
Interest expense | | | (0.5 | ) | | | (0.1 | ) | | | | | (0.4 | ) | | | (2.2 | ) |
Investment income | | | 0.1 | | | | — | | | | | | 0.2 | | | | 0.2 | |
| | | | | | | | | | | | | | | | | | |
Profit/(loss) before tax | | | 53.9 | | | | 0.4 | | | | | | 26.5 | | | | (5.5 | ) |
Income tax expense | | | (16.3 | ) | | | (1.2 | ) | | | | | (0.3 | ) | | | (3.4 | ) |
| | | | | | | | | | | | | | | | | | |
Profit/(loss) after tax | | | 37.6 | | | | (0.8 | ) | | | | | 26.2 | | | | (8.9 | ) |
| | | | | | | | | | | | | | | | | | |
| | | | | |
Loss on disposal of discontinued operations | | | | | | | | | | | | | | | | | | |
Loss before tax | | | — | | | | — | | | | | | (8.0 | ) | | | (4.4 | ) |
Income tax benefit | | | — | | | | — | | | | | | 0.8 | | | | 0.5 | |
| | | | | | | | | | | | | | | | | | |
Loss after tax | | | — | | | | — | | | | | | (7.2 | ) | | | (3.9 | ) |
| | | | | | | | | | | | | | | | | | |
| | | | | |
Profit/(loss) for the period from discontinued operations | | | 37.6 | | | | (0.8 | ) | | | | | 19.0 | | | | (12.8 | ) |
| | | | | | | | | | | | | | | | | | |
Cash flows arising from discontinued operations during the period were as follows:
| | | | | | | | | | | | | | | | | | |
| | | SUCCESSOR | | | | | PREDECESSOR | |
| | | Fiscal
2011
$ million | | | Q4 2010
$ million | | | | | 9M
2010
$ million | | | Fiscal
2009
$ million | |
Cash inflow from operating activities | | | 64.9 | | | | 18.2 | | | | | | 30.4 | | | | 69.8 | |
Cash outflow from investing activities | | | (9.8 | ) | | | (7.1 | ) | | | | | (8.4 | ) | | | (6.0 | ) |
Cash inflow/(outflow) from financing activities | | | 1.0 | | | | — | | | | | | — | | | | (44.4 | ) |
| | | | | | | | | | | | | | | | | | |
Net increase in net cash and cash equivalents | | | 56.1 | | | | 11.1 | | | | | | 22.0 | | | | 19.4 | |
| | | | | | | | | | | | | | | | | | |
F-31
Pinafore Holdings B.V.
Group Financial Statements
NOTES TO THE CONSOLIDATED FINANCIAL STATEMENTS (CONTINUED)
| 15. | Discontinued operations continued |
C. Sales and adjusted EBITDA
The sales and adjusted EBITDA of discontinued operations may be analyzed as follows:
| | | | | | | | | | | | | | | | | | | | | | | | | | | | | | | | | | | | |
| | | Sales | | | Adjusted EBITDA | |
| | | SUCCESSOR | | | | | PREDECESSOR | | | SUCCESSOR | | | | | PREDECESSOR | |
| | | Fiscal
2011
$ million | | | Q4 2010
$ million | | | | 9M
2010
$ million | | | Fiscal
2009
$ million | | | Fiscal
2011
$ million | | | Q4 2010
$ million | | | | 9M
2010
$ million | | | Fiscal
2009
$ million | |
Operating segment | | | | | | | | | | | | | | | | | | | | | | | | | | | | | | | | | | | | |
Industrial & Automotive: | | | | | | | | | | | | | | | | | | | | | | | | | | | | | | | | | | | | |
– Sensors & Valves | | | 450.8 | | | | 107.9 | | | | | | 294.3 | | | | 313.6 | | | | 76.0 | | | | 17.4 | | | | | | 44.5 | | | | 25.6 | |
| | | | | | | | | | | | | | | | | | | | | | | | | | | | | | | | | | | | |
| | | | | | | | | | |
By origin | | | | | | | | | | | | | | | | | | | | | | | | | | | | | | | | | | | | |
US | | | 82.0 | | | | 21.0 | | | | | | 59.2 | | | | 68.2 | | | | 20.6 | | | | 5.6 | | | | | | 9.9 | | | | 8.4 | |
UK | | | 265.0 | | | | 60.6 | | | | | | 160.1 | | | | 159.5 | | | | 41.9 | | | | 8.3 | | | | | | 22.7 | | | | 17.5 | |
Rest of Europe | | | 71.2 | | | | 17.8 | | | | | | 49.3 | | | | 60.9 | | | | 12.6 | | | | 3.0 | | | | | | 9.3 | | | | 5.9 | |
Asia | | | 0.4 | | | | 0.2 | | | | | | 0.7 | | | | 0.8 | | | | (0.4 | ) | | | (0.1 | ) | | | | | — | | | | — | |
Rest of the world | | | 32.2 | | | | 8.3 | | | | | | 25.0 | | | | 24.2 | | | | 1.3 | | | | 0.6 | | | | | | 2.6 | | | | (6.2 | ) |
| | | | | | | | | | | | | | | | | | | | | | | | | | | | | | | | | | | | |
| | | 450.8 | | | | 107.9 | | | | | | 294.3 | | | | 313.6 | | | | 76.0 | | | | 17.4 | | | | | | 44.5 | | | | 25.6 | |
| | | | | | | | | | | | | | | | | | | | | | | | | | | | | | | | | | | | |
By destination | | | | | | | | | | | | | | | | | | | | | | | | | | | | | | | | | | | | |
US | | | 245.0 | | | | 60.9 | | | | | | 166.0 | | | | 178.5 | | | | | | | | | | | | | | | | | | | |
Rest of North America | | | 48.3 | | | | 7.7 | | | | | | 16.2 | | | | 8.5 | | | | | | | | | | | | | | | | | | | |
UK | | | 5.4 | | | | 1.2 | | | | | | 3.0 | | | | 3.1 | | | | | | | | | | | | | | | | | | | |
Rest of Europe | | | 90.6 | | | | 23.3 | | | | | | 63.7 | | | | 78.5 | | | | | | | | | | | | | | | | | | | |
Asia | | | 25.9 | | | | 5.8 | | | | | | 17.3 | | | | 17.4 | | | | | | | | | | | | | | | | | | | |
Rest of the world | | | 35.6 | | | | 9.0 | | | | | | 28.1 | | | | 27.6 | | | | | | | | | | | | | | | | | | | |
| | | | | | | | | | | | | | | | | | | | | | | | | | | | | | | | | | | | |
| | | 450.8 | | | | 107.9 | | | | | | 294.3 | | | | 313.6 | | | | | | | | | | | | | | | | | | | |
| | | | | | | | | | | | | | | | | | | | | | | | | | | | | | | | | | | | |
D. Reconciliation to adjusted EBITDA
Reconciliation of profit for the period from discontinued operations to adjusted EBITDA:
| | | | | | | | | | | | | | | | | | |
| | | SUCCESSOR | | | | | PREDECESSOR | |
| | | Fiscal
2011
$ million | | | Q4 2010
$ million | | | | | 9M
2010
$ million | | | Fiscal
2009
$ million | |
Profit/(loss) for the period from discontinued operations | | | 37.6 | | | | (0.8 | ) | | | | | 19.0 | | | | (12.8 | ) |
Loss on disposal | | | — | | | | — | | | | | | 7.2 | | | | 3.9 | |
| | | | | | | | | | | | | | | | | | |
Profit/(loss) for the period | | | 37.6 | | | | (0.8 | ) | | | | | 26.2 | | | | (8.9 | ) |
Income tax expense | | | 16.3 | | | | 1.2 | | | | | | 0.3 | | | | 3.4 | |
| | | | | | | | | | | | | | | | | | |
Profit/(loss) before tax | | | 53.9 | | | | 0.4 | | | | | | 26.5 | | | | (5.5 | ) |
Net finance costs | | | 0.4 | | | | 0.1 | | | | | | 0.2 | | | | 2.0 | |
| | | | | | | | | | | | | | | | | | |
Operating profit/(loss) | | | 54.3 | | | | 0.5 | | | | | | 26.7 | | | | (3.5 | ) |
Amortization | | | 5.8 | | | | 2.9 | | | | | | 0.8 | | | | 1.2 | |
Depreciation | | | 12.9 | | | | 6.5 | | | | | | 15.2 | | | | 23.8 | |
| | | | | | | | | | | | | | | | | | |
EBITDA | | | 73.0 | | | | 9.9 | | | | | | 42.7 | | | | 21.5 | |
Inventory uplift | | | — | | | | 7.7 | | | | | | — | | | | — | |
Share-based incentives | | | 1.5 | | | | 1.5 | | | | | | 1.5 | | | | 0.9 | |
Transaction costs | | | — | | | | — | | | | | | 0.3 | | | | — | |
Impairments | | | 1.5 | | | | — | | | | | | — | | | | — | |
Restructuring costs | | | — | | | | (1.7 | ) | | | | | — | | | | 3.2 | |
| | | | | | | | | | | | | | | | | | |
Adjusted EBITDA | | | 76.0 | | | | 17.4 | | | | | | 44.5 | | | | 25.6 | |
| | | | | | | | | | | | | | | | | | |
F-32
Pinafore Holdings B.V.
Group Financial Statements
NOTES TO THE CONSOLIDATED FINANCIAL STATEMENTS (CONTINUED)
| 16. | Operating profit/(loss) |
Operating profit/(loss) is stated after charging/(crediting):
| | | | | | | | | | | | |
| | | Continuing
operations
$ million | | | Discontinued
operations
$ million | | | Total
$ million | |
SUCCESSOR | | | | | | | | | | | | |
Fiscal 2011 | | | | | | | | | | | | |
Inventories: | | | | | | | | | | | | |
– Cost of inventories | | | 1,687.6 | | | | 180.8 | | | | 1,868.4 | |
– Write-down of inventories | | | 13.2 | | | | 0.4 | | | | 13.6 | |
Staff costs (see note 10) | | | 1,121.2 | | | | 106.6 | | | | 1,227.8 | |
Amortization of other intangible assets (see note 21) | | | 150.4 | | | | 5.8 | | | | 156.2 | |
Depreciation of property, plant and equipment (see note 22) | | | 170.8 | | | | 12.9 | | | | 183.7 | |
Research and development costs | | | 62.2 | | | | 17.1 | | | | 79.3 | |
Government grants: | | | | | | | | | | | | |
– Revenue | | | 0.9 | | | | 3.6 | | | | 4.5 | |
– Capital | | | — | | | | 0.2 | | | | 0.2 | |
Net foreign exchange (losses)/gains | | | (4.0 | ) | | | 0.7 | | | | (3.3 | ) |
| | | | | | | | | | | | |
Q4 2010 | | | | | | | | | | | | |
Inventories: | | | | | | | | | | | | |
– Cost of inventories | | | 556.7 | | | | 46.8 | | | | 603.5 | |
– Write-down of inventories | | | 2.2 | | | | — | | | | 2.2 | |
Staff costs (see note 10) | | | 371.6 | | | | 28.1 | | | | 399.7 | |
Amortization of other intangible assets (see note 21) | | | 41.3 | | | | 2.9 | | | | 44.2 | |
Depreciation of property, plant and equipment (see note 22) | | | 47.5 | | | | 6.5 | | | | 54.0 | |
Research and development costs | | | 17.3 | | | | 3.5 | | | | 20.8 | |
Government grants: | | | | | | | | | | | | |
– Revenue | | | (0.5 | ) | | | (0.8 | ) | | | (1.3 | ) |
Net foreign exchange gains | | | (1.9 | ) | | | (0.4 | ) | | | (2.3 | ) |
| | | | | | | | | | | | |
PREDECESSOR | | | | | | | | | | | | |
| | | |
9M 2010 | | | | | | | | | | | | |
| | | |
Inventories: | | | | | | | | | | | | |
– Cost of inventories | | | 1,054.7 | | | | 114.4 | | | | 1,169.1 | |
– Write-down of inventories | | | 17.5 | | | | 1.2 | | | | 18.7 | |
Staff costs (see note 10) | | | 790.8 | | | | 68.9 | | | | 859.7 | |
Amortization of other intangible assets (see note 21) | | | 16.2 | | | | 0.8 | | | | 17.0 | |
Depreciation of property, plant and equipment (see note 22) | | | 104.9 | | | | 15.2 | | | | 120.1 | |
Research and development costs | | | 51.8 | | | | 10.5 | | | | 62.3 | |
Government grants: | | | | | | | | | | | | |
– Revenue | | | (0.3 | ) | | | (0.9 | ) | | | (1.2 | ) |
– Capital | | | — | | | | (0.1 | ) | | | (0.1 | ) |
Net foreign exchange gains | | | (4.5 | ) | | | (1.1 | ) | | | (5.6 | ) |
| | | | | | | | | | | | |
| | | |
Fiscal 2009 | | | | | | | | | | | | |
| | | |
Inventories: | | | | | | | | | | | | |
– Cost of inventories | | | 3,248.9 | | | | 260.2 | | | | 3,509.1 | |
– Write-down of inventories | | | 25.9 | | | | 0.3 | | | | 26.2 | |
Staff costs (see note 10) | | | 1,099.1 | | | | 97.1 | | | | 1,196.2 | |
Amortization of other intangible assets (see note 21) | | | 24.4 | | | | 1.2 | | | | 25.6 | |
Depreciation of property, plant and equipment (see note 22) | | | 148.4 | | | | 23.8 | | | | 172.2 | |
Research and development costs | | | 62.5 | | | | 15.5 | | | | 78.0 | |
Government grants: | | | | | | | | | | | | |
– Revenue | | | (0.5 | ) | | | (1.3 | ) | | | (1.8 | ) |
– Capital | | | — | | | | (0.3 | ) | | | (0.3 | ) |
Net foreign exchange gains | | | (7.6 | ) | | | (1.4 | ) | | | (9.0 | ) |
| | | | | | | | | | | | |
F-33
Pinafore Holdings B.V.
Group Financial Statements
NOTES TO THE CONSOLIDATED FINANCIAL STATEMENTS (CONTINUED)
| 17. | Dividends on ordinary shares |
| | | | | | | | |
| | | PREDECESSOR | |
| | | 9M
2010
$ million | | | Fiscal
2009
$ million | |
Paid or proposed in respect of the period | | | | | | | | |
Interim dividend | | | — | | | | 3.50c | |
Final dividend | | | — | | | | 6.50c | |
| | | | | | | | |
| | | — | | | | 10.00c | |
| | | | | | | | |
| | |
Recognized in the period | | | | | | | | |
Interim dividend for the period of nil (Fiscal 2009: 3.50c) per share | | | — | | | | 30.9 | |
Final dividend for the prior period of 6.50c (Fiscal 2009: 2.00c) per share | | | 56.9 | | | | 17.4 | |
| | | | | | | | |
| | | 56.9 | | | | 48.3 | |
| | | | | | | | |
Dividends were paid by the Predecessor on ordinary shares in Tomkins plc. During Fiscal 2011, no dividends were paid by the Successor (Q4 2010: $nil).
| 18. | Auditor’s remuneration |
Fees payable to the Company’s auditors, Deloitte LLP, and other member firms of Deloitte Touche Tohmatsu Limited were as follows:
| | | | | | | | | | | | | | | | | | |
| | | SUCCESSOR | | | | | PREDECESSOR | |
| | | Fiscal
2011
$ million | | | Q4 2010
$ million | | | | | 9M
2010
$ million | | | Fiscal
2009
$ million | |
Audit fees: | | | | | | | | | | | | | | | | | | |
– Audit of the company’s accounts | | | 0.8 | | | | 1.1 | | | | | | — | | | | 0.7 | |
– Audit of the accounts of the company’s subsidiaries | | | 5.3 | | | | 4.6 | | | | | | 1.5 | | | | 4.3 | |
– Other statutory services | | | 0.8 | | | | 0.1 | | | | | | 0.1 | | | | 0.1 | |
– Other audit fees | | | 1.4 | | | | — | | | | | | — | | | | — | |
| | | | | | | | | | | | | | | | | | |
| | | 8.3 | | | | 5.8 | | | | | | 1.6 | | | | 5.1 | |
Tax fees: | | | | | | | | | | | | | | | | | | |
– Compliance services | | | 0.8 | | | | 0.1 | | | | | | — | | | | 0.6 | |
– Advisory services | | | 2.5 | | | | 0.1 | | | | | | 0.4 | | | | 1.0 | |
| | | | | | | | | | | | | | | | | | |
| | | 3.3 | | | | 0.2 | | | | | | 0.4 | | | | 1.6 | |
All other fees | | | — | | | | — | | | | | | 0.5 | | | | 0.2 | |
| | | | | | | | | | | | | | | | | | |
Total fees | | | 11.6 | | | | 6.0 | | | | | | 2.5 | | | | 6.9 | |
| | | | | | | | | | | | | | | | | | |
Fees for the audit of the company’s accounts represent fees payable to in respect of the audit of the company’s individual financial statements and the Group’s consolidated financial statements prepared in accordance with IFRS. Other statutory services include the review of the Group’s interim financial statements. In Fiscal 2011, other audit fees include the audit of certain financial statements prepared specifically in relation to business disposals.
Other fees are paid for services including advice on accounting matters and non-statutory reporting.
The Audit Committee or, between meetings, the Chairman of the Audit Committee, approves the engagement terms and fees of Deloitte LLP, and other member firms of Deloitte & Touche Tohmatsu Limited for all services before the related work is undertaken.
F-34
Pinafore Holdings B.V.
Group Financial Statements
NOTES TO THE CONSOLIDATED FINANCIAL STATEMENTS (CONTINUED)
Reconciliation of profit/(loss) for the period to cash generated from operations:
| | | | | | | | | | | | | | | | | | |
| | | SUCCESSOR | | | | | PREDECESSOR | |
| | | Fiscal
2011
$ million | | | Q4 2010
$ million | | | | | 9M
2010
$ million | | | Fiscal
2009
$ million | |
Profit/(loss) for the period | | | 57.2 | | | | (270.2 | ) | | | | | 243.6 | | | | 6.0 | |
Interest expense | | | 318.1 | | | | 90.9 | | | | | | 71.8 | | | | 113.2 | |
Investment income | | | (71.9 | ) | | | (18.7 | ) | | | | | (48.2 | ) | | | (67.2 | ) |
Other finance expense | | | 26.7 | | | | 27.1 | | | | | | 2.7 | | | | 0.3 | |
Income tax (benefit)/expense | | | (2.9 | ) | | | (32.9 | ) | | | | | 62.0 | | | | 28.0 | |
| | | | | | | | | | | | | | | | | | |
Operating profit/(loss) from continuing and discontinued operations | | | 327.2 | | | | (203.8 | ) | | | | | 331.9 | | | | 80.3 | |
Share of (profit)/loss of associates | | | (0.5 | ) | | | (0.7 | ) | | | | | 1.3 | | | | 0.4 | |
Amortization of intangible assets | | | 156.2 | | | | 44.2 | | | | | | 17.0 | | | | 25.6 | |
Depreciation of property, plant and equipment | | | 183.7 | | | | 54.0 | | | | | | 120.1 | | | | 172.2 | |
Impairments: | | | | | | | | | | | | | | | | | | |
– Goodwill | | | 36.9 | | | | — | | | | | | — | | | | 8.7 | |
– Investment in associate | | | 0.7 | | | | — | | | | | | — | | | | — | |
– Other intangible assets | | | — | | | | — | | | | | | — | | | | 22.0 | |
– Property, plant and equipment | | | 1.9 | | | | — | | | | | | — | | | | 26.8 | |
– Other receivables | | | — | | | | — | | | | | | — | | | | 15.5 | |
(Gain)/loss on disposal of businesses: | | | | | | | | | | | | | | | | | | |
– Continuing operations | | | (58.8 | ) | | | — | | | | | | (6.3 | ) | | | (0.2 | ) |
– Discontinued operations | | | — | | | | — | | | | | | 8.0 | | | | 4.4 | |
Loss/(gain) on sale of property, plant and equipment | | | 1.0 | | | | (1.3 | ) | | | | | (0.8 | ) | | | (1.6 | ) |
Share-based incentives | | | 88.8 | | | | 72.4 | | | | | | 21.2 | | | | 11.3 | |
Decrease in post-employment benefit obligations | | | (77.1 | ) | | | (13.4 | ) | | | | | (41.1 | ) | | | (122.4 | ) |
(Decrease)/increase in provisions | | | (24.6 | ) | | | (13.7 | ) | | | | | (30.0 | ) | | | 45.1 | |
| | | | | | | | | | | | | | | | | | |
| | | 635.4 | | | | (62.3 | ) | | | | | 421.3 | | | | 288.1 | |
Movements in working capital: | | | | | | | | | | | | | | | | | | |
– (Increase)/decrease in inventories | | | (2.1 | ) | | | 148.6 | | | | | | (112.4 | ) | | | 214.6 | |
– (Increase)/decrease in receivables | | | (9.0 | ) | | | 85.9 | | | | | | (204.9 | ) | | | 52.3 | |
– (Decrease)/increase in payables | | | (13.3 | ) | | | (105.9 | ) | | | | | 111.2 | | | | (22.9 | ) |
| | | | | | | | | | | | | | | | | | |
Cash generated from operations | | | 611.0 | | | | 66.3 | | | | | | 215.2 | | | | 532.1 | |
| | | | | | | | | | | | | | | | | | |
A. Analysis of movements
SUCCESSOR
| | | | |
| | | $ million | |
Cost | | | | |
As at September 25, 2010 | | | — | |
Acquisition of subsidiaries | | | 1,742.1 | |
Foreign currency translation | | | 3.3 | |
| | | | |
As at December 31, 2010 | | | 1,745.4 | |
Purchase accounting adjustments | | | (8.7 | ) |
Acquisition of subsidiaries | | | 21.8 | |
Transfer to assets held for sale | | | (120.3 | ) |
Foreign currency translation | | | (15.9 | ) |
| | | | |
As at December 31, 2011 | | | 1,622.3 | |
| | | | |
| |
Accumulated impairment | | | | |
As at September 25, 2010 and December 31, 2010 | | | — | |
Impairments | | | 36.9 | |
| | | | |
As at December 31, 2011 | | | 36.9 | |
| | | | |
| |
Carrying amount | | | | |
As at December 31, 2010 | | | 1,745.4 | |
| | | | |
As at December 31, 2011 | | | 1,585.4 | |
| | | | |
F-35
Pinafore Holdings B.V.
Group Financial Statements
NOTES TO THE CONSOLIDATED FINANCIAL STATEMENTS (CONTINUED)
A. Analysis of movements (continued)
During Fiscal 2011, management finalized its assessment of the fair values at the acquisition date of the acquired net assets of Tomkins. This resulted in a re-allocation of the goodwill between Guarantor and non-Guarantor subsidiaries and a net adjustment to goodwill of $8.7 million. This net adjustment is not considered to be material and comparative periods have therefore not been restated. The adjustment may be analyzed as follows:
| | | | | | | | | | | | |
| | | Provisional
fair value
$ million | | | Revised
fair
value
$ million | | | Purchase
accounting
adjustments
$ million | |
Identifiable intangible assets | | | 2,301.9 | | | | 2,292.4 | | | | 9.5 | |
Property, plant and equipment | | | 1,353.3 | | | | 1,356.5 | | | | (3.2 | ) |
Trade and other payables | | | (813.1 | ) | | | (816.1 | ) | | | 3.0 | |
Deferred tax liabilities | | | (820.5 | ) | | | (795.5 | ) | | | (25.0 | ) |
Provisions | | | (102.3 | ) | | | (109.3 | ) | | | 7.0 | |
| | | | | | | | | | | | |
Adjustment to goodwill recognized | | | | | | | | | | | (8.7 | ) |
| | | | | | | | | | | | |
PREDECESSOR
| | | | |
| | | $ million | |
Cost | | | | |
As at January 2, 2010 | | | 681.1 | |
Acquisition of subsidiaries | | | 23.1 | |
Disposals | | | (0.6 | ) |
Foreign currency translation | | | 2.5 | |
| | | | |
As at September 24, 2010 | | | 706.1 | |
| | | | |
| |
Accumulated impairment | | | | |
As at January 2, 2010 | | | 245.1 | |
Foreign currency translation | | | 3.3 | |
| | | | |
As at September 24, 2010 | | | 248.4 | |
| | | | |
| |
Carrying amount | | | | |
As at January 2, 2010 | | | 436.0 | |
| | | | |
As at September 24, 2010 | | | 457.7 | |
| | | | |
B. Allocation of goodwill
Goodwill is allocated to the following CGUs or groups of CGUs:
| | | | | | | | |
| | | As at
December 31,
2011
$ million | | | As at
December 31,
2010*
$ million | |
Industrial & Automotive | | | | | | | | |
Gates North America | | | 939.6 | | | | 951.1 | |
Gates EMEA | | | 143.4 | | | | 147.1 | |
Gates APAC | | | 228.1 | | | | 225.8 | |
Gates South America | | | 6.4 | | | | 7.2 | |
| | | | | | | | |
| | | 1,317.5 | | | | 1,331.2 | |
Dexter | | | 92.1 | | | | 92.1 | |
Other Industrial & Automotive: | | | | | | | | |
– Ideal | | | — | | | | 31.6 | |
Sensors & Valves: | | | | | | | | |
– Schrader Electronics | | | 76.2 | | | | 77.2 | |
– Schrader International | | | 8.6 | | | | 7.9 | |
| | | 84.8 | | | | 85.1 | |
| | | | | | | | |
Total Industrial & Automotive | | | 1,494.4 | | | | 1,540.0 | |
| | | | | | | | |
| * | Re-presented (see note 5A) |
F-36
Pinafore Holdings B.V.
Group Financial Statements
NOTES TO THE CONSOLIDATED FINANCIAL STATEMENTS (CONTINUED)
B. Allocation of goodwill (continued)
| | | | | | | | |
| | | As at
December 31,
2011
$ million | | | As at
December 31,
2010
$ million | |
Building Products | | | | | | | | |
Air Distribution: | | | | | | | | |
– Air Systems Components | | | 74.0 | | | | 74.0 | |
– Hart & Cooley Group | | | 30.7 | | | | 31.7 | |
– Ruskin | | | 45.0 | | | | 45.1 | |
– Koch Filter | | | 23.2 | | | | 23.2 | |
– Other | | | 2.9 | | | | 4.7 | |
| | | | | | | | |
| | | 175.8 | | | | 178.7 | |
Bathware | | | — | | | | 26.7 | |
| | | | | | | | |
Total Building Products | | | 175.8 | | | | 205.4 | |
| | | | | | | | |
Total Group | | | 1,670.2 | | | | 1,745.4 | |
| | | | | | | | |
| | |
Goodwill is presented in the Group’s balance sheet as follows: | | | | | | | | |
– Non-current assets | | | 1,585.4 | | | | 1,745.4 | |
– Assets held for sale (see note 29) | | | 84.8 | | | | — | |
| | | | | | | | |
| | | 1,670.2 | | | | 1,745.4 | |
| | | | | | | | |
C. Impairment tests
Goodwill is tested for impairment annually and whenever there are indications that it may have suffered an impairment. Goodwill is considered impaired to the extent that its carrying amount exceeds its recoverable amount, which is the higher of the value in use and the fair value less costs to sell of the CGU or group of CGUs to which it is allocated. Impairment tests were carried out during Fiscal 2009, following the acquisition of Tomkins, in Q4 2010, and during Fiscal 2011. In each case, the recoverable amount of all items of goodwill was determined based on value in use calculations.
Management based the value in use calculations on cash flow forecasts derived from the most recent three-year financial plans approved by the Board, in which the principal assumptions were those regarding sales growth rates, selling prices and changes in direct costs.
Cash flows for the years beyond the three-year financial plans for the CGUs to which individually significant amounts of goodwill were allocated were calculated as follows: cash flows in the fourth and fifth years were estimated by management based on relevant industry and economic forecasts; thereafter, the cash flows were projected to grow at either 2% or 2.5% per annum, which rates do not exceed expected long-term growth rates in their respective principal end markets.
Management applied discount rates to the resulting cash flow projections that reflect current market assessments of the time value of money and the risks specific to the CGU or group of CGUs. In each case, the discount rate was determined using a capital asset pricing model. Pre-tax discount rates used in the impairment tests of goodwill during Fiscal 2011 were in the following ranges: Industrial & Automotive businesses 15.3% to 18.3% (Q4 2010: 15.0% to 17.5%; Fiscal 2009: 8.1% to 12.2%); and Building Products businesses 15.4% to 16.8% (Q4 2010: 16.1% to 17.0%; Fiscal 2009: 10.4% to 17.2%).
D. Impairments recognized
During Fiscal 2011, in light of the prolonged weakness of the US residential construction end market, the Group recognized an impairment of $36.9 million in relation to Bathware, representing the entire goodwill allocated to this segment. Management used a pre-tax discount rate of 15.5%.
As there had been no significant change in management’s expectations in relation to the Group’s businesses subsequent to the acquisition of Tomkins, no impairments of goodwill were recognized in Q4 2010.
During Fiscal 2009, the Group recognized an impairment of $8.7 million in relation to Rolastar due to the significant deterioration that had occurred in Rolastar’s end markets since negotiations for its acquisition were concluded in early 2008.
Impairments are analyzed by operating segment in note 7.
E. Sensitivity to changes in key assumptions
Management does not consider that the recoverable amounts of the CGUs or groups of CGUs to which significant amounts of goodwill are allocated may fall below their carrying amounts, nor that the aggregate recoverable amount of other CGUs may fall below their aggregate carrying amount, due to reasonably possible changes during the next year in one or more of the key assumptions.
F-37
Pinafore Holdings B.V.
Group Financial Statements
NOTES TO THE CONSOLIDATED FINANCIAL STATEMENTS (CONTINUED)
| 21. | Other intangible assets |
| | | | | | | | | | | | | | | | | | | | |
SUCCESSOR | | Brands
and
trade
names
$ million | | | Customer
relationships
$ million | | | Technology
and
know-how
$ million | | | Computer
software
$ million | | | Total
$ million | |
Cost | | | | | | | | | | | | | | | | | | | | |
As at September 25, 2010 | | | — | | | | — | | | | — | | | | — | | | | — | |
Acquisition of subsidiaries | | | 325.9 | | | | 1,622.1 | | | | 336.3 | | | | 17.6 | | | | 2,301.9 | |
Additions | | | — | | | | — | | | | 2.3 | | | | — | | | | 2.3 | |
Disposals | | | — | | | | — | | | | — | | | | (0.3 | ) | | | (0.3 | ) |
Foreign currency translation | | | — | | | | 9.2 | | | | (0.2 | ) | | | 0.2 | | | | 9.2 | |
| | | | | | | | | | | | | | | | | | | | |
As at December 31, 2010 | | | 325.9 | | | | 1,631.3 | | | | 338.4 | | | | 17.5 | | | | 2,313.1 | |
Acquisition of subsidiaries | | | — | | | | 0.6 | | | | — | | | | — | | | | 0.6 | |
Additions | | | — | | | | — | | | | 0.3 | | | | 7.5 | | | | 7.8 | |
Purchase accounting adjustments (see note 20) | | | 5.0 | | | | (29.5 | ) | | | 8.8 | | | | 7.3 | | | | (8.4 | ) |
Transfers to assets held for sale | | | (7.0 | ) | | | (98.0 | ) | | | (81.5 | ) | | | (2.5 | ) | | | (189.0 | ) |
Disposals | | | — | | | | — | | | | (0.8 | ) | | | (0.3 | ) | | | (1.1 | ) |
Foreign currency translation | | | — | | | | (7.8 | ) | | | 2.8 | | | | 0.2 | | | | (4.8 | ) |
| | | | | | | | | | | | | | | | | | | | |
As at December 31, 2011 | | | 323.9 | | | | 1,496.6 | | | | 268.0 | | | | 29.7 | | | | 2,118.2 | |
| | | | | | | | | | | | | | | | | | | | |
| | | | | |
Accumulated amortization | | | | | | | | | | | | | | | | | | | | |
As at September 25, 2010 | | | — | | | | — | | | | — | | | | — | | | | — | |
Amortization charge for the period | | | — | | | | 28.4 | | | | 12.6 | | | | 3.2 | | | | 44.2 | |
Foreign currency translation | | | — | | | | 0.4 | | | | — | | | | — | | | | 0.4 | |
| | | | | | | | | | | | | | | | | | | | |
As at December 31, 2010 | | | — | | | | 28.8 | | | | 12.6 | | | | 3.2 | | | | 44.6 | |
Purchase accounting adjustments (see note 20) | | | — | | | | 1.1 | | | | 0.3 | | | | (0.3 | ) | | | 1.1 | |
Amortization charge for the period | | | — | | | | 103.7 | | | | 43.2 | | | | 9.3 | | | | 156.2 | |
Transfers to assets held for sale | | | — | | | | (4.9 | ) | | | (7.6 | ) | | | (0.4 | ) | | | (12.9 | ) |
Foreign currency translation | | | — | | | | (2.3 | ) | | | 0.1 | | | | 0.2 | | | | (2.0 | ) |
| | | | | | | | | | | | | | | | | | | | |
As at December 31, 2011 | | | — | | | | 126.4 | | | | 48.6 | | | | 12.0 | | | | 187.0 | |
| | | | | | | | | | | | | | | | | | | | |
| | | | | |
Carrying amount | | | | | | | | | | | | | | | | | | | | |
As at December 31, 2010 | | | 325.9 | | | | 1,602.5 | | | | 325.8 | | | | 14.3 | | | | 2,268.5 | |
| | | | | | | | | | | | | | | | | | | | |
As at December 31, 2011 | | | 323.9 | | | | 1,370.2 | | | | 219.4 | | | | 17.7 | | | | 1,931.2 | |
| | | | | | | | | | | | | | | | | | | | |
Amortization of intangible assets is primarily included under administrative expenses in the consolidated income statement.
Brands and trade names are considered to have an indefinite life, given the strength and durability of the brands and the level of marketing support. The brands are in relatively similar stable and profitable market sectors, with similar risk profiles, and their size, diversification and market shares mean that the risk of market-related factors causing a reduction in the lives of the brands is considered to be relatively low. Brands and trade names are therefore not amortized but are tested for impairment annually and whenever there are indications that they may have suffered an impairment.
Except for brands and trade names, all other intangible assets included above have finite useful lives.
Intangible assets with indefinite useful lives are allocated to the following CGUs or groups of CGUs:
| | | | | | | | |
| | | As at
December 31,
2011
$ million | | | As at
December 31,
2010*
$ million | |
Industrial & Automotive | | | | | | | | |
Gates North America | | | 196.0 | | | | 191.0 | |
Dexter | | | 21.0 | | | | 21.0 | |
Powertrain | | | — | | | | 1.0 | |
Other Industrial & Automotive: | | | | | | | | |
– Ideal | | | — | | | | 6.0 | |
| | | | | | | | |
Total Industrial & Automotive | | | 217.0 | | | | 219.0 | |
| | | | | | | | |
| | |
Building Products | | | | | | | | |
Air Distribution: | | | | | | | | |
– Air Systems Components | | | 47.0 | | | | 47.0 | |
– Hart & Cooley Group | | | 25.0 | | | | 25.0 | |
– Ruskin | | | 22.9 | | | | 22.9 | |
| | | | | | | | |
| | | 94.9 | | | | 94.9 | |
Bathware | | | 12.0 | | | | 12.0 | |
| | | | | | | | |
Total Building Products | | | 106.9 | | | | 106.9 | |
| | | | | | | | |
Total Group | | | 323.9 | | | | 325.9 | |
| | | | | | | | |
| * | Re-presented (see note 5A) |
F-38
Pinafore Holdings B.V.
Group Financial Statements
NOTES TO THE CONSOLIDATED FINANCIAL STATEMENTS (CONTINUED)
| 21. | Other intangible assets continued |
Management has assessed the recoverability of the carrying amount of the brands and trade names using the ‘relief from royalty’ method whereby the value in use of those assets represents the present value of the cost savings to the Group from not having to license them from a third party. The key assumptions used in the relief from royalty method are the hypothetical royalty rate and forecast annual sales.
Management has used a hypothetical royalty rate of 1% per annum. Forecast annual sales were based on the most recent three-year financial plans approved by the Board. Forecast annual sales for the years beyond the three-year financial plans for the CGUs to which the brands and trade names were allocated were calculated as follows: sales in the fourth and fifth years were estimated by management based on relevant industry and economic forecasts; thereafter, sales were generally projected to grow at either 2% or 2.5% per annum, which rates do not exceed expected long-term growth rates in their respective principal end markets.
Management applied discount rates to the resulting royalty savings that reflect current market assessments of the time value of money and the risks specific to the CGU or group of CGUs. In each case, the discount rate was determined using a capital asset pricing model. Pre-tax discount rates used in the annual impairment tests of brands and trade names during Fiscal 2011 were in the following ranges: Industrial & Automotive businesses 15.3% to 18.3% (Q4 2010: 15.0% to 17.5%); and Building Products businesses 15.4% to 16.8% (Q4 2010: 16.1% to 17.0%).
Management does not consider that the recoverable amounts of the CGUs or groups of CGUs to which significant amounts of intangible assets with indefinite useful lives are allocated may fall below their carrying amounts, nor that the aggregate recoverable amount of other CGUs may fall below their aggregate carrying amount, due to reasonably possible changes during the next year in one or more of the key assumptions.
PREDECESSOR
| | | | | | | | | | | | | | | | |
| | | Development
costs
$ million | | | Assets
arising on
acquisitions
$ million | | | Computer
software
$ million | | | Total
$ million | |
Cost | | | | | | | | | | | | | | | | |
As at January 2, 2010 | | | 2.5 | | | | 100.6 | | | | 134.9 | | | | 238.0 | |
Additions | | | 0.5 | | | | 6.4 | | | | 5.7 | | | | 12.6 | |
Disposals | | | — | | | | — | | | | (0.2 | ) | | | (0.2 | ) |
Foreign currency translation | | | (0.1 | ) | | | 0.2 | | | | 1.0 | | | | 1.1 | |
| | | | | | | | | | | | | | | | |
As at September 24, 2010 | | | 2.9 | | | | 107.2 | | | | 141.4 | | | | 251.5 | |
| | | | | | | | | | | | | | | | |
| | | | |
Accumulated amortization and impairment | | | | | | | | | | | | | | | | |
As at January 2, 2010 | | | 0.5 | | | | 45.0 | | | | 114.5 | | | | 160.0 | |
Amortization charge for the period | | | 0.2 | | | | 7.9 | | | | 8.9 | | | | 17.0 | |
Disposals | | | — | | | | — | | | | (0.2 | ) | | | (0.2 | ) |
Foreign currency translation | | | — | | | | 0.1 | | | | 0.5 | | | | 0.6 | |
| | | | | | | | | | | | | | | | |
As at September 24, 2010 | | | 0.7 | | | | 53.0 | | | | 123.7 | | | | 177.4 | |
| | | | | | | | | | | | | | | | |
| | | | |
Carrying amount | | | | | | | | | | | | | | | | |
As at January 2, 2010 | | | 2.0 | | | | 55.6 | | | | 20.4 | | | | 78.0 | |
| | | | | | | | | | | | | | | | |
As at September 24, 2010 | | | 2.2 | | | | 54.2 | | | | 17.7 | | | | 74.1 | |
| | | | | | | | | | | | | | | | |
Intangible assets arising on acquisitions principally represented acquired customer relationships.
All intangible assets included above had finite useful lives.
In Fiscal 2009, the Group recognized an impairment of $10.2 million in relation to acquired customer relationships, of which the majority related to Rolastar and arose due to the deterioration in its end markets in the period since its acquisition was negotiated in early 2008. Also in Fiscal 2009, an impairment of $11.8 million was recognized in relation to software licenses that had become surplus to requirements as a consequence of the Group’s restructuring initiatives.
Impairments are analyzed by operating segment in note 7.
F-39
Pinafore Holdings B.V.
Group Financial Statements
NOTES TO THE CONSOLIDATED FINANCIAL STATEMENTS (CONTINUED)
| 22. | Property, plant and equipment |
| | | | | | | | | | | | | | | | |
SUCCESSOR | | Land
and
buildings
$ million | | | Plant,
equipment
and
vehicles
$ million | | | Assets
under
construction
$ million | | | Total
$ million | |
Cost | | | | | | | | | | | | | | | | |
As at September 25, 2010 | | | — | | | | — | | | | — | | | | — | |
Acquisition of subsidiaries | | | 428.2 | | | | 845.9 | | | | 79.2 | | | | 1,353.3 | |
Additions | | | 2.3 | | | | 6.8 | | | | 51.3 | | | | 60.4 | |
Transfer from assets under construction | | | 2.6 | | | | 27.8 | | | | (30.4 | ) | | | — | |
Transfer to assets held for sale | | | (6.9 | ) | | | — | | | | — | | | | (6.9 | ) |
Disposals | | | (1.6 | ) | | | (1.8 | ) | | | (0.1 | ) | | | (3.5 | ) |
Foreign currency translation | | | 2.4 | | | | 5.1 | | | | 0.3 | | | | 7.8 | |
| | | | | | | | | | | | | | | | |
As at December 31, 2010 | | | 427.0 | | | | 883.8 | | | | 100.3 | | | | 1,411.1 | |
Acquisition of subsidiaries | | | 0.3 | | | | 0.5 | | | | — | | | | 0.8 | |
Additions | | | 7.0 | | | | 17.3 | | | | 76.9 | | | | 101.2 | |
Transfer from assets under construction | | | 2.5 | | | | 92.6 | | | | (95.1 | ) | | | — | |
Purchase accounting adjustments (see note 20) | | | 3.4 | | | | 13.4 | | | | (11.8 | ) | | | 5.0 | |
Transfer to assets held for sale | | | (67.9 | ) | | | (259.5 | ) | | | (23.0 | ) | | | (350.4 | ) |
Disposals | | | (17.8 | ) | | | (32.8 | ) | | | (0.8 | ) | | | (51.4 | ) |
Foreign currency translation | | | (6.1 | ) | | | (15.7 | ) | | | 2.1 | | | | (19.7 | ) |
| | | | | | | | | | | | | | | | |
As at December 31, 2011 | | | 348.4 | | | | 699.6 | | | | 48.6 | | | | 1,096.6 | |
| | | | | | | | | | | | | | | | |
| | | | |
Accumulated depreciation | | | | | | | | | | | | | | | | |
As at September 25, 2010 | | | — | | | | — | | | | — | | | | — | |
Depreciation charge for the period | | | 6.2 | | | | 47.8 | | | | — | | | | 54.0 | |
Foreign currency translation | | | — | | | | (2.0 | ) | | | — | | | | (2.0 | ) |
| | | | | | | | | | | | | | | | |
As at December 31, 2010 | | | 6.2 | | | | 45.8 | | | | — | | | | 52.0 | |
Purchase accounting adjustments (see note 20) | | | 0.9 | | | | 0.9 | | | | — | | | | 1.8 | |
Depreciation charge for the period | | | 22.7 | | | | 161.0 | | | | — | | | | 183.7 | |
Transfers to assets held for sale | | | 0.9 | | | | (32.0 | ) | | | — | | | | (31.1 | ) |
Impairments | | | 0.5 | | | | 0.6 | | | | — | | | | 1.1 | |
Disposals | | | (0.8 | ) | | | (8.0 | ) | | | — | | | | (8.8 | ) |
Foreign currency translation | | | (0.3 | ) | | | (4.7 | ) | | | — | | | | (5.0 | ) |
| | | | | | | | | | | | | | | | |
As at December 31, 2011 | | | 30.1 | | | | 163.6 | | | | — | | | | 193.7 | |
| | | | | | | | | | | | | | | | |
| | | | |
Carrying amount | | | | | | | | | | | | | | | | |
As at December 31, 2010 | | | 420.8 | | | | 838.0 | | | | 100.3 | | | | 1,359.1 | |
| | | | | | | | | | | | | | | | |
As at December 31, 2011 | | | 318.3 | | | | 536.0 | | | | 48.6 | | | | 902.9 | |
| | | | | | | | | | | | | | | | |
Land and buildings include freehold land with a carrying value of $75.8 million (December 31, 2010: $96.6 million) that is not depreciated.
Property, plant and equipment includes assets held under finance leases with a carrying amount of $3.0 million (December 31, 2010: $4.2 million). Obligations under finance leases are secured by a lessor’s charge over the leased assets.
F-40
Pinafore Holdings B.V.
Group Financial Statements
NOTES TO THE CONSOLIDATED FINANCIAL STATEMENTS (CONTINUED)
| 22. | Property, plant and equipment continued |
| | | | | | | | | | | | | | | | |
PREDECESSOR | | Land
and
buildings
$ million | | | Plant,
equipment
and
vehicles
$ million | | | Assets
under
construction
$ million | | | Total
$ million | |
Cost | | | | | | | | | | | | | | | | |
As at January 2, 2010 | | | 710.1 | | | | 2,548.0 | | | | 70.5 | | | | 3,328.6 | |
Additions | | | 14.4 | | | | 13.7 | | | | 71.7 | | | | 99.8 | |
Acquisitions of subsidiaries | | | 0.9 | | | | 3.3 | | | | — | | | | 4.2 | |
Transfer from assets under construction | | | 8.1 | | | | 46.8 | | | | (54.9 | ) | | | — | |
Transfer to assets held for sale | | | (10.5 | ) | | | (8.1 | ) | | | — | | | | (18.6 | ) |
Disposals | | | (8.9 | ) | | | (129.5 | ) | | | (0.6 | ) | | | (139.0 | ) |
Foreign currency translation | | | (0.2 | ) | | | (0.2 | ) | | | 0.7 | | | | 0.3 | |
| | | | | | | | | | | | | | | | |
As at September 24, 2010 | | | 713.9 | | | | 2,474.0 | | | | 87.4 | | | | 3,275.3 | |
| | | | | | | | | | | | | | | | |
| | | | |
Accumulated depreciation and impairment | | | | | | | | | | | | | | | | |
As at January 2, 2010 | | | 306.0 | | | | 1,897.0 | | | | 2.8 | | | | 2,205.8 | |
Depreciation charge for the period | | | 17.9 | | | | 101.9 | | | | 0.3 | | | | 120.1 | |
Transfer to assets held for sale | | | (5.7 | ) | | | (7.3 | ) | | | — | | | | (13.0 | ) |
Disposals | | | (1.9 | ) | | | (126.8 | ) | | | — | | | | (128.7 | ) |
Foreign currency translation | | | (2.3 | ) | | | 0.3 | | | | — | | | | (2.0 | ) |
| | | | | | | | | | | | | | | | |
As at September 24, 2010 | | | 314.0 | | | | 1,865.1 | | | | 3.1 | | | | 2,182.2 | |
| | | | | | | | | | | | | | | | |
| | | | |
Carrying amount | | | | | | | | | | | | | | | | |
As at January 2, 2010 | | | 404.1 | | | | 651.0 | | | | 67.7 | | | | 1,122.8 | |
| | | | | | | | | | | | | | | | |
As at September 24, 2010 | | | 399.9 | | | | 608.9 | | | | 84.3 | | | | 1,093.1 | |
| | | | | | | | | | | | | | | | |
| 23. | Investments in associates |
| | | | | | | | | | | | | | | | | | |
| | | SUCCESSOR | | | | | PREDECESSOR | |
| | | Fiscal 2011
$ million | | | Q4 2010
$ million | | | | | 9M 2010
$ million | | | Fiscal 2009
$ million | |
Carrying amount | | | | | | | | | | | | | | | | | | |
At the beginning of the period | | | 23.6 | | | | — | | | | | | 20.6 | | | | 20.3 | |
Acquisition of subsidiaries | | | — | | | | 22.5 | | | | | | — | | | | — | |
Share of profit/(loss) of associates | | | 0.5 | | | | 0.7 | | | | | | (1.3 | ) | | | (0.4 | ) |
Impairments | | | (0.7 | ) | | | — | | | | | | — | | | | — | |
Dividends received from associates | | | (0.5 | ) | | | — | | | | | | (0.5 | ) | | | (0.3 | ) |
| | | | | | | | | | | | | | | | | | |
| | | 22.9 | | | | 23.2 | | | | | | 18.8 | | | | 19.6 | |
Additions | | | 0.4 | | | | — | | | | | | — | | | | — | |
Disposal of subsidiaries | | | (13.6 | ) | | | — | | | | | | — | | | | — | |
Foreign currency translation | | | 0.6 | | | | 0.4 | | | | | | 0.5 | | | | 1.0 | |
| | | | | | | | | | | | | | | | | | |
At the end of the period | | | 10.3 | | | | 23.6 | | | | | | 19.3 | | | | 20.6 | |
| | | | | | | | | | | | | | | | | | |
Investments in associates are presented in the Group’s balance sheet as follows:
| | | | | | | | |
| | | As at
December 31,
2011
$ million | | | As at
December 31,
2010
$ million | |
Ongoing businesses | | | 6.6 | | | | 23.6 | |
Businesses to be sold (see note 29) | | | 3.7 | | | | — | |
| | | | | | | | |
| | | 10.3 | | | | 23.6 | |
| | | | | | | | |
F-41
Pinafore Holdings B.V.
Group Financial Statements
NOTES TO THE CONSOLIDATED FINANCIAL STATEMENTS (CONTINUED)
| 23. | Investments in associates continued |
As at December 31, 2011, the Group’s principal associates were as follows:
| | | | | | | | |
Name of company | | Country of
incorporation | | Group’s
holding | | | Nature of business |
Pyung Hwa CMB Company Limited | | Korea | | | 21 | % | | Belts |
Ruskin Titus Gulf | | U.A.E. | | | 50 | % | | Air system components |
Colinx LLC | | US | | | 20 | % | | e-business and logistics services |
Caryaire Air System Components Private Ltd | | India | | | 50 | % | | HVAC products |
Schrader Duncan Limited | | India | | | 50 | % | | Valves and fittings |
Schrader Duncan Limited is listed on the Mumbai Stock Exchange. As at December 31, 2010, the fair value of the Group’s investment based on the quoted market price of that company’s shares was $2.9 million (December 31, 2010: $5.3 million). During Fiscal 2011, as a result of a decrease in the market value of the shares, the Group recognized an impairment of $0.7 million in discontinued operations in relation to its investment in Schrader Duncan Limited, which is included in assets held for sale at December 31, 2011.
Segment analysis of the Group’s investments in associates and of its share of associates’ profit/(loss) for the period:
| | | | | | | | | | | | | | | | | | | | | | | | | | |
| | | Investments in associates | | | Share of profit/(loss) of associates | |
| | | SUCCESSOR | | | SUCCESSOR | | | | | PREDECESSOR | |
| | | As at
December 31,
2011
$ million | | | As at
December 31,
2010*
$ million | | | Fiscal 2011
$ million | | | Q4 2010*
$ million | | | | | 9M 2010*
$ million | | | Fiscal 2009*
$ million | |
By operating segment | | | | | | | | | | | | | | | | | | | | | | | | | | |
Continuing operations | | | | | | | | | | | | | | | | | | | | | | | | | | |
Industrial & Automotive: | | | | | | | | | | | | | | | | | | | | | | | | | | |
– Gates North America | | | 3.3 | | | | 3.3 | | | | — | | | | — | | | | | | — | | | | — | |
– Gates APAC | | | 2.3 | | | | 2.9 | | | | (0.4 | ) | | | 0.7 | | | | | | 0.2 | | | | 0.6 | |
| | | | | | | | | | | | | | | | | | | | | | | | | | |
| | | 5.6 | | | | 6.2 | | | | (0.4 | ) | | | 0.7 | | | | | | 0.2 | | | | 0.6 | |
| | | | | | | | | | | | | | | | | | | | | | | | | | |
Building Products: | | | | | | | | | | | | | | | | | | | | | | | | | | |
– Air Distribution | | | 1.0 | | | | 1.3 | | | | (0.3 | ) | | | (0.3 | ) | | | | | (0.5 | ) | | | (1.2 | ) |
| | | | | | | | | | | | | | | | | | | | | | | | | | |
| | | 6.6 | | | | 7.5 | | | | (0.7 | ) | | | 0.4 | | | | | | (0.3 | ) | | | (0.6 | ) |
| | | | | | | | | | | | | | | | | | | | | | | | | | |
| | | | | | | |
Exited segments | | | | | | | | | | | | | | | | | | | | | | | | | | |
Industrial & Automotive: | | | | | | | | | | | | | | | | | | | | | | | | | | |
– Powertrain | | | — | | | | 10.5 | | | | 1.7 | | | | 0.5 | | | | | | 0.9 | | | | (0.3 | ) |
– Other I&A | | | — | | | | 0.6 | | | | 0.2 | | | | 0.1 | | | | | | 0.2 | | | | 0.2 | |
| | | | | | | | | | | | | | | | | | | | | | | | | | |
| | | — | | | | 11.1 | | | | 1.9 | | | | 0.6 | | | | | | 1.1 | | | | (0.1 | ) |
| | | | | | | | | | | | | | | | | | | | | | | | | | |
| | | 6.6 | | | | 18.6 | | | | 1.2 | | | | 1.0 | | | | | | 0.8 | | | | (0.7 | ) |
| | | | | | | | | | | | | | | | | | | | | | | | | | |
| | | | | | | |
Discontinued operation | | | | | | | | | | | | | | | | | | | | | | | | | | |
Industrial & Automotive: | | | | | | | | | | | | | | | | | | | | | | | | | | |
– Sensors & Valves | | | 3.7 | | | | 5.0 | | | | (0.7 | ) | | | (0.3 | ) | | | | | (2.1 | ) | | | 0.3 | |
| | | | | | | | | | | | | | | | | | | | | | | | | | |
| | | 10.3 | | | | 23.6 | | | | 0.5 | | | | 0.7 | | | | | | (1.3 | ) | | | (0.4 | ) |
| | | | | | | | | | | | | | | | | | | | | | | | | | |
| | | | | | | |
By location | | | | | | | | | | | | | | | | | | | | | | | | | | |
US | | | 3.3 | | | | 3.3 | | | | | | | | | | | | | | | | | | | |
Rest of North America | | | — | | | | 0.6 | | | | | | | | | | | | | | | | | | | |
Asia | | | 8.2 | | | | 20.8 | | | | | | | | | | | | | | | | | | | |
Rest of the world | | | (1.2 | ) | | | (1.1 | ) | | | | | | | | | | | | | | | | | | |
| | | | | | | | | | | | | | | | | | | | | | | | | | |
| | | 10.3 | | | | 23.6 | | | | | | | | | | | | | | | | | | | |
| | | | | | | | | | | | | | | | | | | | | | | | | | |
| * | Re-presented (see note 5A) |
During Fiscal 2011, the aggregate sales of the Group’s associates were $257.1 million (Q4 2010: $62.7 million; 9M 2010: $188.2 million; Fiscal 2009: $177.5 million) and their aggregate profit for the period was $4.3 million (Q4 2010: $0.7 million; 9M 2010: $2.2 million; Fiscal 2009: loss of $2.3 million).
As at December 31, 2011, the aggregate total assets of the Group’s associates was $87.2 million (December 31, 2010: $165.7 million) and the aggregate total of their liabilities was $71.5 million (December 31, 2010: $107.8 million).
F-42
Pinafore Holdings B.V.
Group Financial Statements
NOTES TO THE CONSOLIDATED FINANCIAL STATEMENTS (CONTINUED)
| | | | | | | | |
| | | As at
December 31,
2011
$ million | | | As at
December 31,
2010
$ million | |
Raw materials and supplies | | | 183.9 | | | | 225.5 | |
Work in progress | | | 49.5 | | | | 90.8 | |
Finished goods and goods held for resale | | | 338.3 | | | | 377.2 | |
| | | | | | | | |
| | | 571.7 | | | | 693.5 | |
| | | | | | | | |
As at December 31, 2011, inventories were stated net of an allowance for excess, obsolete or slow-moving items of $19.7 million (December 31, 2010: $7.9 million).
Inventories arise wholly in the businesses of Tomkins and were initially recognized by the Successor at their fair value at the date of acquisition of Tomkins. Accordingly, the allowance for excess, obsolete or slow-moving items reflects only those items of inventory that have been identified as excess, obsolete or slow-moving since the acquisition of Tomkins.
| 25. | Trade and other receivables |
| | | | | | | | |
| | | As at
December 31,
2011
$ million | | | As at
December 31,
2010
$ million | |
Current assets | | | | | | | | |
Financial assets: | | | | | | | | |
– Trade receivables (see note 26) | | | 635.5 | | | | 761.1 | |
– Derivative financial instruments (see note 33) | | | 0.4 | | | | 0.6 | |
– Collateralized cash | | | 17.7 | | | | 47.0 | |
– Other receivables | | | 40.2 | | | | 58.4 | |
| | | | | | | | |
| | | 693.8 | | | | 867.1 | |
| | | | | | | | |
Non-financial assets: | | | | | | | | |
– Prepayments | | | 34.6 | | | | 47.4 | |
| | | | | | | | |
| | | 728.4 | | | | 914.5 | |
| | | | | | | | |
| | |
Non-current assets | | | | | | | | |
Financial assets: | | | | | | | | |
– Derivative financial instruments (see note 33) | | | 0.2 | | | | 0.9 | |
– Other receivables | | | 10.9 | | | | 13.0 | |
| | | | | | | | |
| | | 11.1 | | | | 13.9 | |
| | | | | | | | |
Non-financial assets: | | | | | | | | |
– Prepayments | | | 9.0 | | | | 12.3 | |
| | | | | | | | |
| | | 20.1 | | | | 26.2 | |
| | | | | | | | |
Collateralized cash comprises cash given as collateral under letters of credit for insurance and regulatory purposes and cash held in escrow for the purpose of repaying the loan notes issued by the Group under the Loan Note Alternative in relation to the acquisition of Tomkins (see note 30).
The Group is the beneficiary of a number of corporate-owned life assurance policies against which it borrows from the relevant life assurance company. As at December 31, 2011, the surrender value of the policies was $707.5 million (December 31, 2010: $644.3 million) and the amount outstanding on the related loans was $705.7 million (December 31, 2010: $642.3 million). For accounting purposes, these amounts are offset and the net receivable of $1.8 million (December 31, 2010: $2.0 million) is included in other receivables.
As at December 31, 2011, trade and other receivables amounting to $4.0 million (December 31, 2010: $4.3 million) were secured on the assets of the debtors.
F-43
Pinafore Holdings B.V.
Group Financial Statements
NOTES TO THE CONSOLIDATED FINANCIAL STATEMENTS (CONTINUED)
Trade receivables amounted to $635.5 million (December 31, 2010: $761.1 million), net of an allowance of $4.0 million (December 31, 2010: $0.3 million) for doubtful debts.
The Group has a significant concentration of customers in the US, who accounted for 52.6% (Q4 2010: 51.8%; 9M 2010: 54.7%; Fiscal 2009: 56.4%) of the Group’s sales during Fiscal 2011, and in the automotive industry, which accounted for 44.3% (Q4 2010: 47.1%; 9M 2010: 45.9%; Fiscal 2009: 45.1%) of the Group’s total sales during Fiscal 2011. However, no single customer accounted for more than 10% of the Group’s sales and there were no significant amounts due from any one customer.
Before accepting a new customer, the Group assesses the potential customer’s credit quality and establishes a credit limit. Credit quality is assessed by using data maintained by reputable credit rating agencies, by checking of references included in credit applications and, where they are available, by reviewing the customer’s recent financial statements. Credit limits are subject to multiple levels of authorization and are reviewed on a regular basis.
Trade receivables are regularly reviewed for bad and doubtful debts. Bad debts are written off and an allowance is established for specific doubtful debts.
Trade receivables may be analyzed as follows:
| | | | | | | | |
| | | As at
December 31,
2011
$ million | | | As at
December 31,
2010
$ million | |
Amounts neither past due nor impaired | | | 534.7 | | | | 636.7 | |
| | | | | | | | |
| | |
Amounts past due but not impaired: | | | | | | | | |
– Less than 30 days old | | | 16.9 | | | | 3.1 | |
– Between 30 and 60 days old | | | 36.1 | | | | 53.7 | |
– Between 61 and 90 days old | | | 21.0 | | | | 24.8 | |
– More than 90 days old | | | 23.3 | | | | 42.5 | |
| | | | | | | | |
| | | 97.3 | | | | 124.1 | |
| | |
Amounts impaired: | | | | | | | | |
– Total amounts that have been impaired | | | 7.5 | | | | 0.6 | |
– Allowance for doubtful debts | | | (4.0 | ) | | | (0.3 | ) |
| | | | | | | | |
| | | 3.5 | | | | 0.3 | |
| | | | | | | | |
| | | 635.5 | | | | 761.1 | |
| | | | | | | | |
Trade receivables arise wholly in the businesses of Tomkins and were initially recognized by the Successor at their fair value at the date of acquisition of Tomkins. Accordingly, receivables that were considered impaired by Tomkins are included within amounts past due but not impaired and the allowance for doubtful debts relates wholly to receivables that have become impaired since the acquisition of Tomkins.
Movements in the allowance for doubtful debts were as follows:
| | | | | | | | | | | | | | |
| | | SUCCESSOR | | | | | PREDECESSOR | |
| | | Fiscal 2011
$ million | | | Q4 2010
$ million | | | | | 9M 2010
$ million | |
At the beginning of the period | | | 0.3 | | | | — | | | | | | 13.7 | |
Charge for the period | | | 4.2 | | | | 0.3 | | | | | | 4.0 | |
Transfer to assets held for sale | | | (0.1 | ) | | | — | | | | | | (0.1 | ) |
Utilized during the period | | | (0.3 | ) | | | — | | | | | | (2.9 | ) |
Released during the period | | | — | | | | — | | | | | | (0.2 | ) |
Foreign currency translation | | | (0.1 | ) | | | — | | | | | | (0.3 | ) |
| | | | | | | | | | | | | | |
At the end of the period | | | 4.0 | | | | 0.3 | | | | | | 14.2 | |
| | | | | | | | | | | | | | |
Trade receivables are not generally interest-bearing although interest may be charged to customers on overdue accounts.
| 27. | Available-for-sale investments |
| | | | | | | | | | | | | | | | | | |
| | | SUCCESSOR | | | | | PREDECESSOR | |
| | | Fiscal 2011
$ million | | | Q4 2010
$ million | | | | | 9M 2010
$ million | | | Fiscal 2009
$ million | |
Carrying amount | | | | | | | | | | | | | | | | | | |
At the beginning of the period | | | 1.4 | | | | — | | | | | | 1.2 | | | | 0.8 | |
Acquisition of subsidiaries | | | — | | | | 1.2 | | | | | | — | | | | — | |
Fair value loss recognized in other comprehensive income | | | (0.4 | ) | | | 0.2 | | | | | | (0.1 | ) | | | 0.4 | |
Foreign currency translation | | | 0.1 | | | | — | | | | | | 0.1 | | | | — | |
| | | | | | | | | | | | | | | | | | |
At the end of the period | | | 1.1 | | | | 1.4 | | | | | | 1.2 | | | | 1.2 | |
| | | | | | | | | | | | | | | | | | |
Available-for-sale investments comprise listed equities.
F-44
Pinafore Holdings B.V.
Group Financial Statements
NOTES TO THE CONSOLIDATED FINANCIAL STATEMENTS (CONTINUED)
| 28. | Cash and cash equivalents |
| | | | | | | | |
| | | As at
December 31,
2011
$ million | | | As at
December 31,
2010
$ million | |
Cash on hand and demand deposits | | | 286.4 | | | | 325.2 | |
Term deposits | | | 193.6 | | | | 134.1 | |
| | | | | | | | |
| | | 480.0 | | | | 459.3 | |
| | | | | | | | |
The currency and interest rate profile of cash and cash equivalents was as follows:
| | | | | | | | | | | | | | | | |
| | | Floating interest rate | | | | | | | |
| | | $ million | | | Weighted
average
interest
rate % | | | Non-interest
bearing
$ million | | | Total
$ million | |
As at December 31, 2011 | | | | | | | | | | | | | | | | |
Currency: | | | | | | | | | | | | | | | | |
– US dollar | | | 293.2 | | | | 0.0 | % | | | 35.7 | | | | 328.9 | |
– Sterling | | | 34.9 | | | | 0.4 | % | | | 0.8 | | | | 35.7 | |
– Euro | | | 9.6 | | | | 0.7 | % | | | 9.9 | | | | 19.5 | |
– Canadian dollar | | | — | | | | 0.9 | % | | | 4.5 | | | | 4.5 | |
– Other | | | 65.6 | | | | 1.7 | % | | | 25.8 | | | | 91.4 | |
| | | | | | | | | | | | | | | | |
| | | 403.3 | | | | | | | | 76.7 | | | | 480.0 | |
| | | | | | | | | | | | | | | | |
As at December 31, 2010 | | | | | | | | | | | | | | | | |
Currency: | | | | | | | | | | | | | | | | |
– US dollar | | | 34.6 | | | | 0.0 | % | | | 21.8 | | | | 56.4 | |
– Sterling | | | 164.1 | | | | 0.4 | % | | | 0.4 | | | | 164.5 | |
– Euro | | | 30.9 | | | | 2.0 | % | | | 27.0 | | | | 57.9 | |
– Canadian dollar | | | 13.4 | | | | 2.2 | % | | | 9.5 | | | | 22.9 | |
– Other | | | 105.8 | | | | 2.0 | % | | | 51.8 | | | | 157.6 | |
| | | | | | | | | | | | | | | | |
| | | 348.8 | | | | | | | | 110.5 | | | | 459.3 | |
| | | | | | | | | | | | | | | | |
During the second quarter of 2011, management began actively seeking prospective buyers for its Schrader businesses.
The Schrader group consists of Schrader Electronics and Schrader International businesses, together comprising the Sensors & Valves operating segment, which has consequently been classified as a discontinued operation. Schrader Electronics, which is based in Northern Ireland, is a designer and manufacturer of Tire Pressure Monitoring Systems and sells primarily into automotive OE markets in the US. Schrader International manufactures a range of automotive products including gauges and valves, which are sold mainly in the US and Europe.
During the 9M 2010, management began actively seeking prospective buyers for Plews Inc., a manufacturer of automotive lubrication products and repair tools, which is included in the Other Industrial & Automotive operating segment, as a result of which its assets and liabilities were classified as held for sale as at December 31, 2010. Plews Inc. was sold on April 20, 2011.
Assets held for sale also include vacant properties no longer required by the Group for its manufacturing operations.
Assets classified as held for sale and directly associated liabilities were as follows:
| | | | | | | | |
| | | As at
December 31,
2011
$ million | | | As at
December 31,
2010
$ million | |
Assets held for sale | | | | | | | | |
Goodwill | | | 84.8 | | | | — | |
Other intangible assets | | | 109.8 | | | | — | |
Property, plant and equipment | | | 117.6 | | | | 7.3 | |
Investments in associates | | | 3.7 | | | | — | |
Deferred tax assets | | | — | | | | 3.8 | |
Inventories | | | 61.1 | | | | 7.5 | |
Trade and other receivables | | | 65.7 | | | | 18.0 | |
| | | | | | | | |
| | | 442.7 | | | | 36.6 | |
| | | | | | | | |
Liabilities directly associated with assets held for sale | | | | | | | | |
Trade and other payables | | | (68.4 | ) | | | (7.4 | ) |
Provisions | | | (6.8 | ) | | | (0.7 | ) |
Post-employment benefit obligations | | | (2.3 | ) | | | | |
Deferred tax liabilities | | | (36.8 | ) | | | — | |
| | | | | | | | |
| | | (114.3 | ) | | | (8.1 | ) |
| | | | | | | | |
| | | 328.4 | | | | 28.5 | |
| | | | | | | | |
F-45
Pinafore Holdings B.V.
Group Financial Statements
NOTES TO THE CONSOLIDATED FINANCIAL STATEMENTS (CONTINUED)
| | | | | | | | | | | | | | | | | | | | | | | | |
| | | As at December 31, 2011 | | | As at December 31, 2010 | |
| | | Current
liabilities
$ million | | | Non-current
liabilities
$ million | | | Total
$ million | | | Current
liabilities
$ million | | | Non-current
liabilities
$ million | | | Total
$ million | |
Carrying amount | | | | | | | | | | | | | | | | | | | | | | | | |
Bank overdrafts | | | 5.5 | | | | — | | | | 5.5 | | | | 7.1 | | | | — | | | | 7.1 | |
| | | | | | | | | | | | | | | | | | | | | | | | |
Bank and other loans: | | | | | | | | | | | | | | | | | | | | | | | | |
– Secured: | | | | | | | | | | | | | | | | | | | | | | | | |
Term loans | | | 8.7 | | | | 1,613.0 | | | | 1,621.7 | | | | 18.8 | | | | 1,793.3 | | | | 1,812.1 | |
Second Lien Notes | | | 16.6 | | | | 977.8 | | | | 994.4 | | | | 19.3 | | | | 1,079.0 | | | | 1,098.3 | |
| | | | | | | | | | | | | | | | | | | | | | | | |
| | | 25.3 | | | | 2,590.8 | | | | 2,616.1 | | | | 38.1 | | | | 2,872.3 | | | | 2,910.4 | |
| | | | | | | | | | | | | | | | | | | | | | | | |
– Unsecured: | | | | | | | | | | | | | | | | | | | | | | | | |
Bank loans | | | — | | | | — | | | | — | | | | — | | | | — | | | | — | |
2011 Notes | | | — | | | | — | | | | — | | | | 172.2 | | | | �� | | | | 172.2 | |
2015 Notes | | | 0.4 | | | | 20.4 | | | | 20.8 | | | | 0.5 | | | | 26.6 | | | | 27.1 | |
Loan notes | | | 15.5 | | | | — | | | | 15.5 | | | | 44.9 | | | | — | | | | 44.9 | |
Other loans | | | 1.2 | | | | 0.5 | | | | 1.7 | | | | — | | | | — | | | | — | |
| | | | | | | | | | | | | | | | | | | | | | | | |
| | | 17.1 | | | | 20.9 | | | | 38.0 | | | | 217.6 | | | | 26.6 | | | | 244.2 | |
| | | | | | | | | | | | | | | | | | | | | | | | |
| | | 42.4 | | | | 2,611.7 | | | | 2,654.1 | | | | 255.7 | | | | 2,898.9 | | | | 3,154.6 | |
| | | | | | | | | | | | | | | | | | | | | | | | |
| | | 47.9 | | | | 2,611.7 | | | | 2,659.6 | | | | 262.8 | | | | 2,898.9 | | | | 3,161.7 | |
| | | | | | | | | | | | | | | | | | | | | | | | |
The Group’s secured borrowings are jointly and severally, irrevocably and fully and unconditionally guaranteed by certain of the Company’s direct and indirect subsidiaries and secured by liens on substantially all of their assets. An analysis of the security given is presented in note 47.
As at December 31, 2011, the carrying amount of borrowings includes the following items, each of which are being amortized to profit or loss over the term of the related borrowings using the effective interest method:
| • | | costs incurred on the issue of the Senior Secured Credit Facilities and the Second Lien Notes; |
| • | | the fair value on inception of the interest rate floor (an embedded derivative) that applies to amounts drawn down under the Senior Secured Credit Facilities; |
| • | | a purchase accounting adjustment to reflect the excess of the fair value of the 2011 Notes and the 2015 Notes over their principal amount on the effective date of the acquisition of Tomkins. |
The carrying amount of borrowings may be reconciled to the principal amount outstanding as follows:
| | | | | | | | |
| | | As at
December 31,
2011
$ million | | | As at
December 31,
2010
$ million | |
Carrying amount | | | 2,659.6 | | | | 3,161.7 | |
Issue costs | | | 150.7 | | | | 173.8 | |
Interest rate floor | | | 33.9 | | | | 66.1 | |
Purchase accounting adjustment | | | — | | | | (6.4 | ) |
Accrued interest payable | | | (24.3 | ) | | | (27.7 | ) |
| | | | | | | | |
Principal amount | | | 2,819.9 | | | | 3,367.5 | |
| | | | | | | | |
F-46
Pinafore Holdings B.V.
Group Financial Statements
NOTES TO THE CONSOLIDATED FINANCIAL STATEMENTS (CONTINUED)
| | | | | | | | | | | | | | | | | | | | | | | | |
| | | As at December 31, 2011 | | | As at December 31, 2010 | |
| | | Current
liabilities
$ million | | | Non-current
liabilities
$ million | | | Total
$ million | | | Current
liabilities
$ million | | | Non-current
liabilities
$ million | | | Total
$ million | |
Principal amount | | | | | | | | | | | | | | | | | | | | | | | | |
Bank overdrafts | | | 5.5 | | | | — | | | | 5.5 | | | | 7.1 | | | | — | | | | 7.1 | |
| | | | | | | | | | | | | | | | | | | | | | | | |
Bank and other loans: | | | | | | | | | | | | | | | | | | | | | | | | |
– Secured | | | | | | | | | | | | | | | | | | | | | | | | |
Term Loan A | | | 26.5 | | | | 211.6 | | | | 238.1 | | | | 29.6 | | | | 266.4 | | | | 296.0 | |
Term Loan B | | | 15.2 | | | | 1,488.5 | | | | 1,503.7 | | | | 16.8 | | | | 1,660.5 | | | | 1,677.3 | |
Second Lien Notes | | | — | | | | 1,035.0 | | | | 1,035.0 | | | | — | | | | 1,150.0 | | | | 1,150.0 | |
| | | | | | | | | | | | | | | | | | | | | | | | |
| | | 41.7 | | | | 2,735.1 | | | | 2,776.8 | | | | 46.4 | | | | 3,076.9 | | | | 3,123.3 | |
– Unsecured | | | | | | | | | | | | | | | | | | | | | | | | |
2011 Notes | | | — | | | | — | | | | — | | | | 165.5 | | | | — | | | | 165.5 | |
2015 Notes | | | — | | | | 20.4 | | | | 20.4 | | | | — | | | | 26.5 | | | | 26.5 | |
Other loan notes | | | 15.5 | | | | — | | | | 15.5 | | | | 45.1 | | | | — | | | | 45.1 | |
Other bank loans | | | 1.2 | | | | 0.5 | | | | 1.7 | | | | — | | | | — | | | | — | |
| | | | | | | | | | | | | | | | | | | | | | | | |
| | | 16.7 | | | | 20.9 | | | | 37.6 | | | | 210.6 | | | | 26.5 | | | | 237.1 | |
| | | | | | | | | | | | | | | | | | | | | | | | |
| | | 63.9 | | | | 2,756.0 | | | | 2,819.9 | | | | 264.1 | | | | 3,103.4 | | | | 3,367.5 | |
| | | | | | | | | | | | | | | | | | | | | | | | |
The maturity analysis of the principal amount outstanding is presented in note 34.
Bank loans
The Group has Senior Secured Credit Facilities consisting of a Term Loan A credit facility, a Term Loan B credit facility and a senior secured revolving credit facility (‘Revolver’).
Term loans
The Group initially borrowed $300.0 million under the Term Loan A credit facility and $1,700.0 million under the Term Loan B credit facility. The Term Loan A credit facility and the revolving credit facility mature on September 29, 2015 and the Term Loan B credit facility matures on September 29, 2016.
The Term Loan A credit facility is subject to quarterly amortization payments of 2.5% and the Term Loan B credit facility is subject to quarterly amortization payments of 0.25%, in each case based on the original principal amount less certain prepayments with the balance payable on maturity. During Fiscal 2011, the Group made quarterly amortization payments totaling $28.3 million against the Term Loan A facility and $16.1 million against the Term Loan B facility.
If the Group prepays LIBOR rate loans other than at the end of an applicable interest period, it is required to reimburse the lenders for any consequential losses or expenses. The Group must prepay the Term Loan A credit facility and Term Loan B credit facility with net cash proceeds of asset sales, casualty and condemnation events, incurrence of indebtedness (other than indebtedness permitted to be incurred) and a percentage of excess cash flow based on a total leverage to EBITDA ratio, in each case subject to certain exceptions such as reinvestment rights. During Fiscal 2011, the Group disposed of its Stackpole, Dexter Chassis and Ideal businesses and therefore offered to make prepayments of the debt outstanding under the term loans to the extent of the net cash proceeds received from those asset sales, as determined under the credit agreement. In total, during Fiscal 2011, $29.6 million of the principal amount was prepaid under Term Loan A and $157.5 million of the principal amount was prepaid under Term Loan B to the providers that accepted the offers. The carrying amounts of the Term Loan A and Term Loan B repayments were $27.7 million and $145.6 million respectively, and accordingly the Group recognized an aggregate loss of $13.8 million on the repayments.
As at December 31, 2011, the principal amount outstanding under the Term Loan A credit facility was $238.1 million and that under the Term Loan B credit facility was $1,503.7 million.
The term loans bear interest at a floating rate, which can be either LIBOR plus an applicable margin or, at the Group’s option, a base rate as defined in the credit agreement plus an applicable margin. LIBOR and the base rate are both subject to floors. On inception of the facilities, the applicable margin for the Term Loan B credit facility was 4.5% per annum for LIBOR and 3.5% per annum for base rate. The applicable margin for the Term Loan A credit facility was between 3.75% and 4.25% per annum for LIBOR and 2.75% and 3.25% per annum for base rate depending on a total leverage to EBITDA ratio. LIBOR was subject to a 1.75% floor and base rate was subject to a 2.75% floor. Effective February 17, 2011, the Group agreed with the providers of the Senior Secured Credit Facilities a re-pricing of Term Loan A and Term Loan B and amendments to certain of the covenants attaching to the facilities. For both Term Loan A and Term Loan B the applicable margin for LIBOR was reduced to 3.0% per annum, with LIBOR being subject to a 1.25% floor, and the applicable margin for base rate was reduced to 2.0% per annum, with base rate being subject to a 2.25% floor. Management considered that the re-pricing did not cause a substantial change in the net present value of the expected future cash flows in relation to the facilities. Accordingly, the Group recognized neither a gain nor a loss on the re-pricing and recognized the associated costs of $23.4 million (including a 1% premium of on the Term Loan B credit facility amounting to $16.8 million) and the decrease of $18.1 million in the interest rate floor liability as adjustments to the carrying amounts of the borrowings outstanding under the facilities.
As at December 31, 2011, borrowings under both Term Loan A and Term Loan B attracted an interest rate of 4.25% per annum (in both cases, to be next re-set on March 30, 2012).
F-47
Pinafore Holdings B.V.
Group Financial Statements
NOTES TO THE CONSOLIDATED FINANCIAL STATEMENTS (CONTINUED)
Bank loans (continued)
The Group may voluntarily prepay loans or reduce commitments under the Senior Secured Credit Facilities, in whole or in part, subject to minimum amounts without premium or penalty, other than in the case of the re-pricing transaction discussed above, which was subject to a 1% premium on the Term Loan B facility.
During June 2011, the Group agreed with the providers of the Senior Secured Credit Facilities further amendments to the credit agreement, primarily an increase in the value of permitted prepayments of junior debt outstanding under other facilities. The costs of $3.2 million associated with these revisions were recognized as adjustments to the carrying amounts of the borrowings outstanding under the Senior Secured Credit Facilities.
Revolver
The revolving credit facility provides for multi-currency revolving loans and letters of credit up to an aggregate principal amount of $300.0 million, with a letter of credit sub-facility of $100.0 million. As at December 31, 2011, there were no drawings for cash under the revolving credit facility but there were letters of credit outstanding amounting to $66.1 million.
Subject to certain conditions, the revolving credit facility may be increased by up to $100.0 million and the Term Loan B credit facility increased by, or new term loan facilities established up to, $400.0 million (less any increase in the revolving credit facility).
As with the term loans, borrowings under the Revolver bear interest at a floating rate, which can be either LIBOR plus an applicable margin or, at the Group’s option, a base rate as defined in the credit agreement plus an applicable margin, and both LIBOR and the base rate are subject to floors. The applicable margin for the Revolver is between 3.75% and 4.25% per annum for LIBOR and 2.75% and 3.25% per annum for base rate depending on a total leverage to EBITDA ratio. LIBOR is subject to a 1.75% floor and base rate is subject to a 2.75% floor. Each letter of credit issued under the Revolver attracts a participation fee equal to the applicable LIBOR margin under the Revolver to the maximum amount available to be drawn and a fronting fee of the greater of 0.25% of the maximum amount available to be drawn and $1,500 per annum. An unused line fee of 0.75% per annum is based on the unused portion of the Revolver (which may decrease to 0.5% per annum based on a total leverage to EBITDA ratio).
Other borrowings
Senior Secured Second Lien Notes (‘the Second Lien Notes’)
On September 29, 2010, the Group issued $1,150.0 million 9% Second Lien Notes.
The Second Lien Notes mature on October 1, 2018.
At any time, or from time to time, prior to October 1, 2013, but not more than once in any twelve-month period, the Group may redeem up to 10% of the original aggregate principal amount of the Second Lien Notes at a redemption price of 103% of the principal amount thereof plus accrued and unpaid interest thereon up to but not including the redemption date.
On August 3, 2011, the Group issued notice to the holders of the Second Lien Notes of its intention to exercise this call option for 2011 in full, which became effective on September 2, 2011. Notes with a carrying value of $107.7 million (excluding accrued interest) were redeemed for $118.5 million, including a premium on redemption of $3.5 million. A loss of $10.8 million was therefore recognized in other finance expense. Accrued interest of $4.3 million was paid on the redeemed notes.
Notwithstanding the foregoing, at any time and from time to time prior to October 1, 2013, the Group may redeem in the aggregate up to 35% of the original aggregate principal amount of the Second Lien Notes (calculated after giving effect to any issuance of additional Second Lien Notes) with the net cash proceeds of equity offerings by the Co-operative or certain of its subsidiaries at a redemption price of 109% of the principal amount thereof plus accrued and unpaid interest thereon up to but not including the redemption date, provided that at least 65% of the original aggregate principal amount of the Second Lien Notes remain outstanding after each such redemption (calculated after giving effect to any issuance of additional Second Lien Notes) and the Group satisfies certain other conditions.
At any time prior to October 1, 2014, the Group may redeem the Second Lien Notes at its option, in whole at any time or in part from time to time, at 100% of the principal amount thereof plus the greater of (i) 1% of the principal amount and (ii) the excess of the present value at the redemption date of the redemption price as at October 1, 2014 and the required interest payments due from the redemption date to October 1, 2014 (discounted using an appropriate US Treasury Rate plus 50 basis points) over the principal amount, plus accrued and unpaid interest to the redemption date.
On and after October 1, 2014, the Group may redeem the Second Lien Notes, at its option, in whole at any time or in part from time to time, at the following redemption prices (expressed as percentage of the principal amount), plus accrued and unpaid interest to the redemption date:
| | | | |
| | | Redemption
price | |
During the year commencing: | | | | |
– October 1, 2014 | | | 104.50 | % |
– October 1, 2015 | | | 102.25 | % |
– October 1, 2016 and thereafter | | | 100.00 | % |
In the event of a change of control over the Company, each holder will have the right to require the Group to repurchase all or any part of such holder’s Second Lien Notes at a purchase price in cash equal to 101% of the principal amount thereof, plus accrued and unpaid interest to the date of repurchase, except to the extent that the Group has previously elected to redeem the Second Lien Notes.
F-48
Pinafore Holdings B.V.
Group Financial Statements
NOTES TO THE CONSOLIDATED FINANCIAL STATEMENTS (CONTINUED)
Other borrowings (continued)
2011 Notes and 2015 Notes
When it was acquired by the Group, Tomkins had the following notes outstanding under a Euro Medium Term Note Programme: £150 million 8% notes repayable at par on December 20, 2011 (the ‘2011 Notes’); and £250 million 6.125% notes repayable at par on September 16, 2015 (the ‘2015 Notes’).
Each of the 2011 Notes and the 2015 Notes contain a put option giving the holders the option to put their notes to the relevant issuer at par plus accrued interest in the event of a change of control or certain acquisitions and disposals and, in either case, a ratings downgrade occurring as a result of such transaction.
On September 13, 2010, the Group offered to purchase the outstanding 2011 Notes at a price of 105.787 per cent (plus accrued and unpaid interest) and the outstanding 2015 Notes at a price of 100.50 per cent (plus accrued and unpaid interest). Acceptances were received in respect of £40.9 million of the 2011 Notes and £109.3 million of the 2015 Notes. On October 6, 2010, the purchase was completed for total consideration of £153.1 million (plus accrued interest of £3.0 million).
On November 19, 2010, the Group notified holders of the 2011 Notes and the 2015 Notes that the credit rating of the notes had been withdrawn by Moody’s and downgraded by Standard & Poor’s as a consequence of the acquisition of Tomkins and that this constituted a put event entitling the holders to redeem the notes at par (plus accrued and unpaid interest). Put notices were received in respect of £2.1 million of the 2011 Notes and £123.5 million of the 2015 Notes. Settlement took place on December 17, 2010 for total consideration of £125.6 million (plus accrued interest of £2.0 million).
On December 30, 2010, the Group made a further offer to purchase the outstanding 2011 Notes at a price of 105.00 per cent (plus accrued and unpaid interest). Acceptances were received in respect of £4.9 million ($7.8 million) of the 2011 Notes. Settlement took place on January 19, 2011 and the principal amount of the outstanding 2011 Notes was thereby reduced to £102.1 million. Also during 2011, the Group elected to settle £4.0 million ($6.5 million) of the 2015 Notes following a request from one of the holders.
On December 20, 2011, the Group repaid in full the remaining 2011 Notes for $158.3 million, plus accrued interest of $12.7 million. As at December 31, 2011, the principal amount outstanding of the 2015 Notes was £13.2 million.
Loan Note Alternative
Under the terms of the acquisition of Tomkins, certain shareholders in Tomkins Limited elected to receive loan notes rather than cash in respect of all or part of the consideration payable on the purchase of their shares in Tomkins Limited, subject to a maximum aggregate amount of £50 million (the ‘Loan Note Alternative’). As at December 31, 2010, loan notes with a principal amount of £29.0 million were outstanding under the Loan Note Alternative.
The loan notes fall due for repayment, at par, on December 31, 2015. From June 30, 2011 until December 31, 2015, each holder has the right to require full or part repayment, at par, half-yearly on June 30 and December 31 and for this reason these loan notes are classified as current liabilities. At any time on or after six months after the date of issue of the loan notes, the Group may purchase any of the loan notes at any price by tender, private treaty or otherwise.
During Fiscal 2011, holders of loan notes with a principal amount of £19.0 million requested repayment. As at December 31, 2011, loan notes with a principal amount of £10.0 million were still outstanding under the Loan Note Alternative.
The loan notes accrue interest at the higher of 0.8% below LIBOR and 0% (to be next re-set on July 2, 2012).
Although the loan notes are unsecured, the Group is required to retain in an escrow account cash equivalent to the nominal amount of the outstanding loan notes.
Guest & Chrimes Notes
When it was acquired by the Group, Tomkins had in issue loan notes by way of consideration for the acquisition of a former subsidiary, Guest & Chrimes Limited. As at December 31, 2010, the remaining principal amount outstanding was £0.1 million that falls due for repayment, at par, on June 30, 2012.
F-49
Pinafore Holdings B.V.
Group Financial Statements
NOTES TO THE CONSOLIDATED FINANCIAL STATEMENTS (CONTINUED)
Currency and interest rate profile
The currency and interest rate profile of outstanding borrowings, after taking into account the effect of the Group’s currency and interest rate hedging activities, was as follows:
| | | | | | | | | | | | | | | | | | | | | | | | | | | | |
| | | Floating interest rate | | | Fixed interest rate | | | Interest-
free | | | | |
| | | $ million | | | Weighted
average
interest
rate % | | | $ million | | | Weighted
average
interest
rate % | | | Weighted
average
period for
which rate
is fixed
Years | | | $ million | | | Total
$ million | |
As at December 31, 2011 | | | | | | | | | | | | | | | | | | | | | | | | | | | | |
Currency: | | | | | | | | | | | | | | | | | | | | | | | | | | | | |
– US dollar | | | 1,574.0 | | | | 4.3 | % | | | 965.2 | | | | 9.0 | % | | | 6.7 years | | | | 3.7 | | | | 2,542.9 | |
– Sterling | | | 15.4 | | | | 0.3 | % | | | 20.8 | | | | 6.1 | % | | | 3.7 years | | | | 0.8 | | | | 37.0 | |
– Euro | | | 33.4 | | | | 4.3 | % | | | 20.4 | | | | 9.0 | % | | | 6.7 years | | | | 0.7 | | | | 54.5 | |
– Canadian dollar | | | 0.8 | | | | 1.8 | % | | | — | | | | — | | | | — | | | | — | | | | 0.8 | |
– Other | | | 15.6 | | | | 4.0 | % | | | 8.8 | | | | 9.0 | % | | | 6.7 years | | | | — | | | | 24.4 | |
| | | | | | | | | | | | | | | | | | | | | | | | | | | | |
| | | 1,639.2 | | | | | | | | 1,015.2 | | | | | | | | | | | | 5.2 | | | | 2,659.6 | |
| | | | | | | | | | | | | | | | | | | | | | | | | | | | |
| | | | | | | |
As at December 31, 2010 | | | | | | | | | | | | | | | | | | | | | | | | | | | | |
Currency: | | | | | | | | | | | | | | | | | | | | | | | | | | | | |
– US dollar | | | 1,857.0 | | | | 6.5 | % | | | 1,169.7 | | | | 8.9 | % | | | 7.4 years | | | | 1.2 | | | | 3,027.9 | |
– Sterling | | | — | | | | — | | | | 1.5 | | | | 7.7 | % | | | 1.5 years | | | | 0.9 | | | | 2.4 | |
– Euro | | | — | | | | — | | | | 67.0 | | | | 7.7 | % | | | 1.5 years | | | | — | | | | 67.0 | |
– Canadian dollar | | | 0.8 | | | | 0.4 | % | | | 31.9 | | | | 7.7 | % | | | 1.5 years | | | | — | | | | 32.7 | |
– Other | | | 3.7 | | | | 12.3 | % | | | 27.8 | | | | 7.7 | % | | | 1.5 years | | | | 0.2 | | | | 31.7 | |
| | | | | | | | | | | | | | | | | | | | | | | | | | | | |
| | | 1,861.5 | | | | | | | | 1,297.9 | | | | | | | | | | | | 2.3 | | | | 3,161.7 | |
| | | | | | | | | | | | | | | | | | | | | | | | | | | | |
Borrowing covenants
The Group is subject to covenants, representations and warranties in respect of the Senior Secured Credit Facilities including two financial covenants as defined in the credit agreement. The compliance with these financial covenants is tested for the twelve month period to the end of each calendar quarter (the ‘test period’). Firstly, the ratio of ‘consolidated total debt’ to ‘consolidated EBITDA’ (the ‘total leverage ratio’) must not exceed 5.75 times (for the test period ended December 31, 2011, the ratio was 3.72 times). Secondly, the ratio of consolidated EBITDA to ‘consolidated net interest’ (the ‘interest coverage ratio’) must not be less than 1.95 times (for the test period ended December 31, 2011, the ratio was 3.77 times).
The limits against which the financial covenants are tested become progressively stricter for each test period until December 31, 2012. Thereafter, the total leverage ratio must not exceed 5.25 times and the interest coverage ratio must not be less than 2.10 times.
The limits for the forthcoming year are set out below:
| | | | | | | | |
| | | Total
leverage
ratio
Must
not
exceed | | | Interest
coverage
ratio
Must
not be
less than | |
Covenant test period ended: | | | | | | | | |
– March 31, 2012 | | | 5.55 x | | | | 2.00 x | |
– June 30, 2012 | | | 5.40 x | | | | 2.05 x | |
– September 30, 2012 | | | 5.35 x | | | | 2.05 x | |
– December 31, 2012 | | | 5.25 x | | | | 2.10 x | |
Any future non-compliance with the borrowing covenants could, if not waived, constitute an event of default and may, in certain circumstances, lead to an acceleration of the maturity of borrowings drawn down and the inability to access committed facilities.
F-50
Pinafore Holdings B.V.
Group Financial Statements
NOTES TO THE CONSOLIDATED FINANCIAL STATEMENTS (CONTINUED)
| 31. | Obligations under finance leases |
| | | | | | | | | | | | | | | | |
| | | Minimum lease payments | | | Carrying amount | |
| | | As at
December 31,
2011
$ million | | | As at
December 31,
2010
$ million | | | As at
December 31,
2011
$ million | | | As at
December 31,
2010
$ million | |
Amounts payable under finance leases | | | | | | | | | | | | | | | | |
Within one year | | | 0.4 | | | | 0.7 | | | | 0.2 | | | | 0.5 | |
In the second to fifth years, inclusive | | | 1.5 | | | | 1.6 | | | | 0.6 | | | | 0.7 | |
After more than five years | | | 2.2 | | | | 2.6 | | | | 2.0 | | | | 2.1 | |
| | | | | | | | | | | | | | | | |
| | | 4.1 | | | | 4.9 | | | | 2.8 | | | | 3.3 | |
Less: Future finance charges | | | (1.3 | ) | | | (1.6 | ) | | | — | | | | — | |
| | | | | | | | | | | | | | | | |
| | | 2.8 | | | | 3.3 | | | | 2.8 | | | | 3.3 | |
| | | | | | | | | | | | | | | | |
The Group leases certain of its plant, equipment and vehicles under finance leases. All leases are on a fixed repayment basis and no arrangements have been entered into for contingent rental payments. As at December 31, 2011, the average effective interest rate was 7.4% (December 31, 2010: 7.3%).
The Group’s obligations under finance leases are secured by the lessors’ title to the leased assets.
| 32. | Trade and other payables |
| | | | | | | | |
| | | As at
December 31,
2011
$ million | | | As at
December 31,
2010
$ million | |
Current liabilities | | | | | | | | |
Financial liabilities: | | | | | | | | |
– Trade payables | | | 330.6 | | | | 419.3 | |
– Other taxes and social security | | | 25.3 | | | | 25.1 | |
– Derivative financial instruments (see note 33) | | | 2.2 | | | | 0.9 | |
– Other payables | | | 37.3 | | | | 64.2 | |
| | | | | | | | |
| | | 395.4 | | | | 509.5 | |
| | | | | | | | |
Non-financial liabilities: | | | | | | | | |
– Accruals and deferred income | | | 149.6 | | | | 194.9 | |
| | | | | | | | |
| | | 545.0 | | | | 704.4 | |
| | | | | | | | |
| | |
Non-current liabilities | | | | | | | | |
Financial liabilities: | | | | | | | | |
– Derivative financial instruments (see note 33) | | | 36.2 | | | | 48.3 | |
– Other payables | | | 10.6 | | | | 8.3 | |
| | | | | | | | |
| | | 46.8 | | | | 56.6 | |
| | | | | | | | |
Non-financial liabilities: | | | | | | | | |
– Accruals and deferred income | | | 0.4 | | | | 8.8 | |
| | | | | | | | |
| | | 47.2 | | | | 65.4 | |
| | | | | | | | |
Trade payables are generally not interest-bearing but interest may be charged by suppliers on overdue accounts.
F-51
Pinafore Holdings B.V.
Group Financial Statements
NOTES TO THE CONSOLIDATED FINANCIAL STATEMENTS (CONTINUED)
| 33. | Derivative financial instruments |
Derivative financial instruments are held in relation to the Group’s financial risk management policy which is described in note 34. The Group does not hold or issue derivatives for speculative purposes.
The carrying amount of derivative financial instruments held by the Group was as follows:
| | | | | | | | | | | | | | | | | | | | | | | | |
| | | As at December 31, 2011 | | | As at December 31, 2010 | |
| | | Assets
$ million | | | Liabilities
$ million | | | Net
$ million | | | Assets
$ million | | | Liabilities
$ million | | | Net
$ million | |
Hedging activities | | | | | | | | | | | | | | | | | | | | | | | | |
Translational hedges: | | | | | | | | | | | | | | | | | | | | | | | | |
– Currency swaps | | | 0.2 | | | | — | | | | 0.2 | | | | 0.9 | | | | (1.4 | ) | | | (0.5 | ) |
| | | | | | | | | | | | | | | | | | | | | | | | |
| | | | | | |
Transactional hedges: | | | | | | | | | | | | | | | | | | | | | | | | |
– Currency forwards | | | 0.4 | | | | (2.2 | ) | | | (1.8 | ) | | | 0.6 | | | | (0.1 | ) | | | 0.5 | |
– Commodity contracts | | | — | | | | — | | | | — | | | | — | | | | (0.8 | ) | | | (0.8 | ) |
| | | | | | | | | | | | | | | | | | | | | | | | |
| | | 0.4 | | | | (2.2 | ) | | | (1.8 | ) | | | 0.6 | | | | (0.9 | ) | | | (0.3 | ) |
| | | | | | | | | | | | | | | | | | | | | | | | |
| | | 0.6 | | | | (2.2 | ) | | | (1.6 | ) | | | 1.5 | | | | (2.3 | ) | | | (0.8 | ) |
| | | | | | | | | | | | | | | | | | | | | | | | |
Other items | | | | | | | | | | | | | | | | | | | | | | | | |
Embedded derivatives | | | — | | | | (36.2 | ) | | | (36.2 | ) | | | — | | | | (46.9 | ) | | | (46.9 | ) |
| | | | | | | | | | | | | | | | | | | | | | | | |
| | | 0.6 | | | | (38.4 | ) | | | (37.8 | ) | | | 1.5 | | | | (49.2 | ) | | | (47.7 | ) |
| | | | | | | | | | | | | | | | | | | | | | | | |
| | | | | | |
Classified as: | | | | | | | | | | | | | | | | | | | | | | | | |
– Current | | | 0.4 | | | | (2.2 | ) | | | (1.8 | ) | | | 0.6 | | | | (0.9 | ) | | | (0.3 | ) |
– Non-current | | | 0.2 | | | | (36.2 | ) | | | (36.0 | ) | | | 0.9 | | | | (48.3 | ) | | | (47.4 | ) |
| | | | | | | | | | | | | | | | | | | | | | | | |
| | | 0.6 | | | | (38.4 | ) | | | (37.8 | ) | | | 1.5 | | | | (49.2 | ) | | | (47.7 | ) |
| | | | | | | | | | | | | | | | | | | | | | | | |
A. Currency derivatives
As at December 31, 2011, the notional principal amount of outstanding foreign exchange contracts that are used to manage the currency profile of the Group’s net assets was $81.7 million (December 31, 2010: $438.0 million). Where necessary, the Group has designated these contracts as net investment hedges. During Fiscal 2011, a net fair value gain of $3.6 million (Q4 2010: loss of $2.5 million; 9M 2010: gain of $0.5 million; Fiscal 2009: net loss of $3.1 million) in relation to designated net investment hedges was recognized in other comprehensive income.
The currency profile of the Group’s net assets after taking into account translation hedges is presented in note 34.
Also during Fiscal 2011, a net fair value loss of $2.2 million (Q4 2010: loss of $0.6 million; 9M 2010: loss of $0.1 million; Fiscal 2009: gain of $12.2 million) was recognized within operating profit in respect of currency derivatives that were held to provide an economic hedge of transactional currency exposures but were not designated as hedges for accounting purposes.
B. Interest rate swaps
As at December 31, 2011 and December 31, 2010, the Group held no interest rate swaps.
Until September 2010, the Group held interest rate swaps to swap the 2011 Notes and the 2015 Notes from fixed interest rates to floating interest rates. The Group had designated these contracts as fair value hedges in relation to the notes.
During 9M 2010, the Group recognized a net fair value gain of $17.3 million (Fiscal 2009: net loss of $13.3 million) in relation to these contracts and the carrying amount of the notes was increased by $19.0 million (Fiscal 2009: decreased by $12.3 million) to reflect the change in the fair value of the notes attributable to the hedged risk and the amortization of the transitional adjustment that was recognized on adoption of IAS 39. During 9M 2010, a net loss of $1.7 million (Fiscal 2009: net loss of $1.0 million) was, therefore, recognized within other finance expense in relation to these hedges.
On September 16, 2010, the Group sold the interest rate swaps for $64.7 million (plus accrued interest of $10.1 million).
Until December 2009, when the remaining contracts matured, the Group held interest rate swaps to swap to fixed interest rates a portion of the synthetic floating rate debt created by the fixed to floating interest swaps. During Fiscal 2009, a net fair value gain of $2.3 million was recognized within other finance expense in relation to these contracts that did not qualify for hedge accounting under IAS 39.
C. Other items
Borrowings against the Senior Secured Credit Facilities bear interest at floating rates, subject to a floor (an embedded interest rate derivative). On inception of the facilities, the applicable market interest rate was lower than the floor. Consequently, the floor was required to be separated from the host loan contract. As at December 31, 2011, the fair value of the embedded derivatives was $36.2 million (December 31, 2010: $46.9 million) and during Fiscal 2011, a loss of $7.5 million (Q4 2010: gain of $22.9 million) due to the change in their fair value was recognized as a debit to other finance expense.
The Second Lien Notes include certain redemption options as detailed in note 30. Three of these options are considered to be closely related to the host contract and have therefore not been required to be separated from the host contract. The fourth option is not closely related, but contains a number of conditions in order to be exercised, the fulfillment of which management considers not to be reasonably possible prior to the option expiry date of 1 October 2013. This option therefore has a nil fair value.
F-52
Pinafore Holdings B.V.
Group Financial Statements
NOTES TO THE CONSOLIDATED FINANCIAL STATEMENTS (CONTINUED)
| 34. | Financial risk management |
A. Introduction
The Group’s central treasury function is responsible for procuring the Group’s financial resources and maintaining an efficient capital structure, together with managing the Group’s liquidity, foreign exchange and interest rate exposures.
All treasury operations are conducted within strict policies and guidelines that are approved by the Board. Compliance with those policies and guidelines is monitored by the regular reporting of treasury activities to the Board.
A key element of the Group’s treasury philosophy is that funding, interest rate and currency decisions and the location of cash and debt balances are determined independently from each other. The Group’s borrowing requirements are met by raising funds in the most favorable markets. Management aims to retain a portion of net debt in the foreign currencies in which the net assets of the Group’s operations are denominated. The desired currency profile of net debt is achieved by entering into currency derivative contracts. Management does not hedge the proportion of foreign operations effectively funded by shareholders’ equity. An analysis of the Group’s exposure to currency risk and an analysis of the profile of net assets by currency are set out in part F of this note.
Management considers that the Group’s capital equates to shareholders’ equity and manages the Group’s capital structure to maximize shareholder value whilst retaining flexibility to take advantage of opportunities that arise to grow the Group’s business.
B. Summary of financial assets and liabilities
The following table analyses financial assets and liabilities by the categories defined in IAS 39. Financial instruments held at fair value, have been categorized into one of three levels to reflect the degree to which observable inputs are used in determining the fair values:
| • | | ‘Level 1’ fair value measurements are those derived without adjustment from quoted prices in active markets for identical assets or liabilities. |
| • | | ‘Level 2’ fair value measurements are those derived from inputs other than quoted prices included within Level 1 that are observable for the asset or liability, either directly (i.e. as prices) or indirectly (i.e. derived from prices). |
| • | | ‘Level 3’ fair value measurements are those derived from valuation techniques that include inputs for the asset or liability that are not based on observable market data (unobservable inputs). |
During the periods presented below, there were no transfers of financial instruments between Level 1 and Level 2.
| | | | | | | | | | | | | | | | | | | | | | | | | | | | |
| | | | | | Fair value through
profit or loss | | | | | | | |
| | | Loans and
receivables
$ million | | | Available-
for-sale
$ million | | | Liabilities
at
amortized
cost
$ million | | | Designated
hedging
relationships
$ million | | | Held for
trading
$ million | | | Total
carrying
value
$ million | | | Fair
value
$ million | |
As at December 31, 2011 | | | | | | | | | | | | | | | | | | | | | | | | | | | | |
Financial assets not held at fair value | | | | | | | | | | | | | | | | | | | | | | | | | | | | |
Trade and other receivables: | | | | | | | | | | | | | | | | | | | | | | | | | | | | |
– Non-derivative assets | | | 704.3 | | | | — | | | | — | | | | — | | | | — | | | | 704.3 | | | | 704.3 | |
Cash and cash equivalents | | | 480.0 | | | | — | | | | — | | | | — | | | | — | | | | 480.0 | | | | 480.0 | |
| | | | | | | | | | | | | | | | | | | | | | | | | | | | |
| | | 1,184.3 | | | | — | | | | — | | | | — | | | | — | | | | 1,184.3 | | | | 1,184.3 | |
Financial assets held at fair value | | | | | | | | | | | | | | | | | | | | | | | | | | | | |
Level 1: | | | | | | | | | | | | | | | | | | | | | | | | | | | | |
– Available-for-sale investments | | | — | | | | 1.1 | | | | — | | | | — | | | | — | | | | 1.1 | | | | 1.1 | |
Level 2: | | | | | | | | | | | | | | | | | | | | | | | | | | | | |
– Trade and other receivables: | | | | | | | | | | | | | | | | | | | | | | | | | | | | |
Derivative assets | | | — | | | | — | | | | — | | | | 0.2 | | | | 0.4 | | | | 0.6 | | | | 0.6 | |
| | | | | | | | | | | | | | | | | | | | | | | | | | | | |
| | | — | | | | 1.1 | | | | — | | | | 0.2 | | | | 0.4 | | | | 1.7 | | | | 1.7 | |
| | | | | | | | | | | | | | | | | | | | | | | | | | | | |
Total financial assets | | | 1,184.3 | | | | 1.1 | | | | — | | | | 0.2 | | | | 0.4 | | | | 1,186.0 | | | | 1,186.0 | |
| | | | | | | | | | | | | | | | | | | | | | | | | | | | |
| | | | | | | |
Financial liabilities not held at fair value | | | | | | | | | | | | | | | | | | | | | | | | | | | | |
Trade and other payables: | | | | | | | | | | | | | | | | | | | | | | | | | | | | |
– Non-derivative liabilities | | | — | | | | — | | | | (403.8 | ) | | | — | | | | — | | | | (403.8 | ) | | | (403.8 | ) |
Bank overdrafts | | | — | | | | — | | | | (5.5 | ) | | | — | | | | — | | | | (5.5 | ) | | | (5.5 | ) |
Bank and other loans: | | | | | | | | | | | | | | | | | | | | | | | | | | | | |
– Current | | | — | | | | — | | | | (42.4 | ) | | | — | | | | — | | | | (42.4 | ) | | | (88.2 | ) |
– Non-current | | | — | | | | — | | | | (2,611.7 | ) | | | — | | | | — | | | | (2,611.7 | ) | | | (2,865.1 | ) |
Obligations under finance leases | | | — | | | | — | | | | (2.8 | ) | | | — | | | | — | | | | (2.8 | ) | | | (2.8 | ) |
| | | | | | | | | | | | | | | | | | | | | | | | | | | | |
| | | — | | | | — | | | | (3,066.2 | ) | | | — | | | | — | | | | (3,066.2 | ) | | | (3,365.4 | ) |
| | | | | | | | | | | | | | | | | | | | | | | | | | | | |
| | | | | | | |
Financial liabilities held at fair value | | | | | | | | | | | | | | | | | | | | | | | | | | | | |
Level 2: | | | | | | | | | | | | | | | | | | | | | | | | | | | | |
– Trade and other payables: | | | | | | | | | | | | | | | | | | | | | | | | | | | | |
Derivative liabilities | | | — | | | | — | | | | — | | | | — | | | | (38.4 | ) | | | (38.4 | ) | | | (38.4 | ) |
| | | | | | | | | | | | | | | | | | | | | | | | | | | | |
| | | — | | | | — | | | | — | | | | — | | | | (38.4 | ) | | | (38.4 | ) | | | (38.4 | ) |
| | | | | | | | | | | | | | | | | | | | | | | | | | | | |
Total financial liabilities | | | — | | | | — | | | | (3,066.2 | ) | | | — | | | | (38.4 | ) | | | (3,104.6 | ) | | | (3,403.8 | ) |
| | | | | | | | | | | | | | | | | | | | | | | | | | | | |
| | | 1,184.3 | | | | 1.1 | | | | (3,066.2 | ) | | | 0.2 | | | | (38.0 | ) | | | (1,918.6 | ) | | | (2,217.8 | ) |
| | | | | | | | | | | | | | | | | | | | | | | | | | | | |
F-53
Pinafore Holdings B.V.
Group Financial Statements
NOTES TO THE CONSOLIDATED FINANCIAL STATEMENTS (CONTINUED)
| 34. | Financial risk management continued |
B. Summary of financial assets and liabilities (continued)
| | | | | | | | | | | | | | | | | | | | | | | | | | | | |
| | | | | | Fair value through profit
or loss | | | | | | | |
| | | Loans and
receivables
$ million | | | Available-
for-sale
$ million | | | Liabilities
at
amortized
cost
$ million | | | Designated
hedging
relationships
$ million | | | Held for
trading
$ million | | | Total
carrying
value
$ million | | | Fair
value
$ million | |
As at December 31, 2010 | | | | | | | | | | | | | | | | | | | | | | | | | | | | |
Financial assets not held at fair value | | | | | | | | | | | | | | | | | | | | | | | | | | | | |
Trade and other receivables: | | | | | | | | | | | | | | | | | | | | | | | | | | | | |
– Non-derivative assets | | | 879.5 | | | | — | | | | — | | | | — | | | | — | | | | 879.5 | | | | 879.5 | |
Cash and cash equivalents | | | 459.3 | | | | — | | | | — | | | | — | | | | — | | | | 459.3 | | | | 459.3 | |
| | | | | | | | | | | | | | | | | | | | | | | | | | | | |
| | | 1,338.8 | | | | — | | | | — | | | | — | | | | — | | | | 1,338.8 | | | | 1,338.8 | |
Financial assets held at fair value | | | | | | | | | | | | | | | | | | | | | | | | | | | | |
Level 1: | | | | | | | | | | | | | | | | | | | | | | | | | | | | |
– Available-for-sale investments | | | — | | | | 1.4 | | | | — | | | | — | | | | — | | | | 1.4 | | | | 1.4 | |
Level 2: | | | | | | | | | | | | | | | | | | | | | | | | | | | | |
– Trade and other receivables: | | | | | | | | | | | | | | | | | | | | | | | | | | | | |
Derivative assets | | | — | | | | — | | | | — | | | | 0.9 | | | | 0.6 | | | | 1.5 | | | | 1.5 | |
| | | | | | | | | | | | | | | | | | | | | | | | | | | | |
| | | — | | | | 1.4 | | | | — | | | | 0.9 | | | | 0.6 | | | | 2.9 | | | | 2.9 | |
| | | | | | | | | | | | | | | | | | | | | | | | | | | | |
Total financial assets | | | 1,338.8 | | | | 1.4 | | | | — | | | | 0.9 | | | | 0.6 | | | | 1,341.7 | | | | 1,341.7 | |
| | | | | | | | | | | | | | | | | | | | | | | | | | | | |
| | | | | | | |
Financial liabilities not held at fair value | | | | | | | | | | | | | | | | | | | | | | | | | | | | |
Trade and other payables: | | | | | | | | | | | | | | | | | | | | | | | | | | | | |
– Non-derivative liabilities | | | — | | | | — | | | | (516.6 | ) | | | — | | | | — | | | | (516.6 | ) | | | (516.6 | ) |
Bank overdrafts | | | — | | | | — | | | | (7.1 | ) | | | — | | | | — | | | | (7.1 | ) | | | (7.1 | ) |
Bank and other loans: | | | | | | | | | | | | | | | | | | | | | | | | | | | | |
– Current | | | — | | | | — | | | | (255.7 | ) | | | — | | | | — | | | | (255.7 | ) | | | (290.2 | ) |
– Non-current | | | — | | | | — | | | | (2,898.9 | ) | | | — | | | | — | | | | (2,898.9 | ) | | | (3,201.0 | ) |
Obligations under finance leases | | | — | | | | — | | | | (3.3 | ) | | | — | | | | — | | | | (3.3 | ) | | | (3.3 | ) |
| | | | | | | | | | | | | | | | | | | | | | | | | | | | |
| | | — | | | | — | | | | (3,681.6 | ) | | | — | | | | — | | | | (3,681.6 | ) | | | (4,018.2 | ) |
| | | | | | | | | | | | | | | | | | | | | | | | | | | | |
| | | | | | | |
Financial liabilities held at fair value | | | | | | | | | | | | | | | | | | | | | | | | | | | | |
Level 2: | | | | | | | | | | | | | | | | | | | | | | | | | | | | |
– Trade and other payables: | | | | | | | | | | | | | | | | | | | | | | | | | | | | |
Derivative liabilities | | | — | | | | — | | | | — | | | | (1.4 | ) | | | (47.8 | ) | | | (49.2 | ) | | | (49.2 | ) |
| | | | | | | | | | | | | | | | | | | | | | | | | | | | |
| | | — | | | | — | | | | — | | | | (1.4 | ) | | | (47.8 | ) | | | (49.2 | ) | | | (49.2 | ) |
| | | | | | | | | | | | | | | | | | | | | | | | | | | | |
Total financial liabilities | | | — | | | | — | | | | (3,681.6 | ) | | | (1.4 | ) | | | (47.8 | ) | | | (3,730.8 | ) | | | (4,067.4 | ) |
| | | | | | | | | | | | | | | | | | | | | | | | | | | | |
| | | 1,338.8 | | | | 1.4 | | | | (3,681.6 | ) | | | (0.5 | ) | | | (47.2 | ) | | | (2,389.1 | ) | | | (2,725.7 | ) |
| | | | | | | | | | | | | | | | | | | | | | | | | | | | |
Available-for-sale investments are listed and are valued by reference to quoted market prices.
Cash and cash equivalents largely attract floating interest rates. Accordingly, their carrying amounts are considered to be approximately fair value. Non-derivative trade and other receivables and non-derivative trade and other payables are also considered to approximate their fair values.
Bank and other loans principally comprise borrowings under the Senior Secured Credit Facilities, the 2011 Notes and the 2015 Notes, the Second Lien Notes and other loan notes. Borrowings under the Senior Secured Credit Facilities attract interest at floating rates and their principal amounts are considered to approximate to fair value. The 2011 Notes and the 2015 Notes are traded on the Professional Securities Market in London and their fair value is based on their quoted market prices. The Second Lien Notes and the other loan notes attract interest at fixed interest rates and their fair value has been assessed by reference to prevailing market interest rates.
Finance lease obligations attract fixed interest rates that are implicit in the lease rentals and their fair value has been assessed by reference to prevailing market interest rates.
Derivative assets and liabilities represent the fair value of foreign currency and interest rate derivatives held by the Group at the balance sheet date together with embedded interest rate derivatives that were required to be separated from their host loan contracts. Foreign currency derivatives are valued by reference to prevailing forward exchange rates. Interest rate derivatives are valued by discounting the related cash flows using prevailing market interest rates. Embedded interest rate derivatives are valued using a valuation model incorporating assumptions on expected forward interest rates and estimated debt prepayments.
F-54
Pinafore Holdings B.V.
Group Financial Statements
NOTES TO THE CONSOLIDATED FINANCIAL STATEMENTS (CONTINUED)
| 34. | Financial risk management continued |
C. Credit risk
Credit risk is the risk that a counterparty will default on its contractual obligations resulting in financial loss to the Group. The Group’s portfolio of cash and cash equivalents is managed such that there is no significant concentration of credit risk in any one bank or other financial institution. Management monitors closely the credit quality of the institutions with which it holds deposits. Similar considerations are given to the Group’s portfolio of derivative financial instruments. As at December 31, 2011, 92% (December 31, 2010: 95%) of the Group’s cash and cash equivalents were held with institutions rated at least A-1 by Standard & Poor’s or P-1 by Moody’s. Credit risk disclosures with respect to trade receivables are set out in note 26.
Management considers the Group’s maximum exposure to credit risk to be as follows:
| | | | | | | | |
| | | As at
December 31,
2011
$ million | | | As at
December 31,
2010
$ million | |
Trade and other receivables: | | | | | | | | |
– Derivative assets | | | 0.6 | | | | 1.5 | |
– Non-derivative assets | | | 704.3 | | | | 879.5 | |
| | | | | | | | |
| | | 704.9 | | | | 881.0 | |
Cash and cash equivalents | | | 480.0 | | | | 459.3 | |
| | | | | | | | |
| | | 1,184.9 | | | | 1,340.3 | |
| | | | | | | | |
D. Liquidity risk
Liquidity risk is the risk that an entity will encounter difficulty in meeting obligations associated with financial liabilities.
The Group’s borrowing facilities are monitored against forecast requirements and timely action is taken to put in place, renew or replace credit lines. Management’s policy is to reduce liquidity risk by diversifying the Group’s funding sources and by staggering the maturity of its borrowings.
The Group has established long-term credit ratings of Ba3 Stable with Moody’s and BB- Stable with Standard & Poor’s. Credit ratings are subject to regular review by the credit rating agencies and may change in response to economic and commercial developments.
As at December 31, 2011, the Group had a committed revolving credit facility of $300.0 million that expires on September 29, 2015, which was undrawn for cash but against which there were outstanding letters of credit amounting to $66.1 million (December 31, 2010: $40.3 million). Also, the Group had drawn $6.6 million (December 31, 2010: $7.2 million) against uncommitted borrowing facilities and had outstanding performance bonds, letters of credit and bank guarantees amounting to $39.6 million (December 31, 2010: $66.0 million), in addition to those outstanding under the revolving credit facility. Overall, therefore, the Group’s committed borrowing headroom was $187.7 million (December 31, 2010: $186.5 million), in addition to cash balances of $497.7 million (December 31, 2010: $506.3 million), including collateralized cash of $17.7 million (December 31, 2010: $47.0 million).
The expected timing of contractual cash flows relating to the Group’s financial liabilities and related financial assets are as follows:
| | | | | | | | | | | | | | | | | | | | | | | | | | | | |
| | | Within
1 year
$ million | | | Between
1 and 2
years
$ million | | | Between
2 and 3
years
$ million | | | Between
3 and 4
years
$ million | | | Between
4 and 5
years
$ million | | | After
5 years
$ million | | | Total
$ million | |
As at December 31, 2011 | | | | | | | | | | | | | | | | | | | | | | | | | | | | |
Bank overdrafts | | | (5.5 | ) | | | — | | | | — | | | | — | | | | — | | | | — | | | | (5.5 | ) |
Bank and other loans: | | | | | | | | | | | | | | | | | | | | | | | | | | | | |
– Principal | | | (58.4 | ) | | | (41.6 | ) | | | (41.6 | ) | | | (194.4 | ) | | | (1,443.1 | ) | | | (1,035.3 | ) | | | (2,814.4 | ) |
– Interest payments | | | (168.6 | ) | | | (159.3 | ) | | | (147.4 | ) | | | (135.2 | ) | | | (116.0 | ) | | | (186.3 | ) | | | (912.8 | ) |
Finance lease obligations | | | (0.4 | ) | | | (0.4 | ) | | | (0.4 | ) | | | (0.3 | ) | | | (0.4 | ) | | | (2.2 | ) | | | (4.1 | ) |
Trade and other payables: | | | | | | | | | | | | | | | | | | | | | | | | | | | | |
– Non-derivative liabilities | | | (393.2 | ) | | | (10.6 | ) | | | — | | | | — | | | | — | | | | — | | | | (403.8 | ) |
| | | | | | | | | | | | | | | | | | | | | | | | | | | | |
Cash flows on non-derivative liabilities | | | (626.1 | ) | | | (211.9 | ) | | | (189.4 | ) | | | (329.9 | ) | | | (1,559.5 | ) | | | (1,223.8 | ) | | | (4,140.6 | ) |
| | | | | | | | | | | | | | | | | | | | | | | | | | | | |
| | | | | | | |
Cash flows on derivative liabilities: | | | | | | | | | | | | | | | | | | | | | | | | | | | | |
– Payments | | | (21.1 | ) | | | — | | | | — | | | | — | | | | — | | | | — | | | | (21.1 | ) |
– Receipts | | | 23.1 | | | | — | | | | — | | | | — | | | | — | | | | — | | | | 23.1 | |
| | | | | | | | | | | | | | | | | | | | | | | | | | | | |
| | | 2.0 | | | | — | | | | — | | | | — | | | | — | | | | — | | | | 2.0 | |
| | | | | | | | | | | | | | | | | | | | | | | | | | | | |
Cash flows on financial liabilities | | | (624.1 | ) | | | (211.9 | ) | | | (189.4 | ) | | | (329.9 | ) | | | (1,559.5 | ) | | | (1,223.8 | ) | | | (4,138.6 | ) |
| | | | | | | | | | | | | | | | | | | | | | | | | | | | |
| | | | | | | |
Cash flows on related derivative assets: | | | | | | | | | | | | | | | | | | | | | | | | | | | | |
– Payments | | | (154.4 | ) | | | — | | | | — | | | | — | | | | — | | | | — | | | | (154.4 | ) |
– Receipts | | | 154.2 | | | | — | | | | — | | | | — | | | | — | | | | — | | | | 154.2 | |
| | | | | | | | | | | | | | | | | | | | | | | | | | | | |
| | | (0.2 | ) | | | — | | | | — | | | | — | | | | — | | | | — | | | | (0.2 | ) |
| | | | | | | | | | | | | | | | | | | | | | | | | | | | |
| | | (624.3 | ) | | | (211.9 | ) | | | (189.4 | ) | | | (329.9 | ) | | | (1,559.5 | ) | | | (1,223.8 | ) | | | (4,138.8 | ) |
| | | | | | | | | | | | | | | | | | | | | | | | | | | | |
F-55
Pinafore Holdings B.V.
Group Financial Statements
NOTES TO THE CONSOLIDATED FINANCIAL STATEMENTS (CONTINUED)
| 34. | Financial risk management continued |
D. Liquidity risk (continued)
| | | | | | | | | | | | | | | | | | | | | | | | | | | | |
| | | Within
1 year
$ million | | | Between
1 and 2
years
$ million | | | Between
2 and 3
years
$ million | | | Between
3 and 4
years
$ million | | | Between
4 and 5
years
$ million | | | After
5 years
$ million | | | Total
$ million | |
As at December 31, 2010 | | | | | | | | | | | | | | | | | | | | | | | | | | | | |
Bank overdrafts | | | (7.1 | ) | | | — | | | | — | | | | — | | | | — | | | | — | | | | (7.1 | ) |
Bank and other loans: | | | | | | | | | | | | | | | | | | | | | | | | | | | | |
– Principal | | | (256.9 | ) | | | (46.6 | ) | | | (46.4 | ) | | | (46.4 | ) | | | (220.8 | ) | | | (2,743.3 | ) | | | (3,360.4 | ) |
– Interest payments | | | (243.5 | ) | | | (227.5 | ) | | | (224.0 | ) | | | (221.2 | ) | | | (215.9 | ) | | | (390.6 | ) | | | (1,522.7 | ) |
Finance lease obligations | | | (0.7 | ) | | | (0.4 | ) | | | (0.4 | ) | | | (0.4 | ) | | | (0.4 | ) | | | (2.6 | ) | | | (4.9 | ) |
Trade and other payables: | | | | | | | | | | | | | | | | | | | | | | | | | | | | |
– Non-derivative liabilities | | | (508.6 | ) | | | (16.0 | ) | | | — | | | | — | | | | — | | | | — | | | | (524.6 | ) |
| | | | | | | | | | | | | | | | | | | | | | | | | | | | |
Cash flows on non-derivative liabilities | | | (1,016.8 | ) | | | (290.5 | ) | | | (270.8 | ) | | | (268.0 | ) | | | (437.1 | ) | | | (3,136.5 | ) | | | (5,419.7 | ) |
| | | | | | | | | | | | | | | | | | | | | | | | | | | | |
| | | | | | | |
Cash flows on derivative liabilities: | | | | | | | | | | | | | | | | | | | | | | | | | | | | |
– Payments | | | (180.7 | ) | | | — | | | | — | | | | — | | | | — | | | | — | | | | (180.7 | ) |
– Receipts | | | 178.5 | | | | — | | | | — | | | | — | | | | — | | | | — | | | | 178.5 | |
| | | | | | | | | | | | | | | | | | | | | | | | | | | | |
| | | (2.2 | ) | | | — | | | | — | | | | — | | | | — | | | | — | | | | (2.2 | ) |
| | | | | | | | | | | | | | | | | | | | | | | | | | | | |
Cash flows on financial liabilities | | | (1,019.0 | ) | | | (290.5 | ) | | | (270.8 | ) | | | (268.0 | ) | | | (437.1 | ) | | | (3,136.5 | ) | | | (5,421.9 | ) |
| | | | | | | | | | | | | | | | | | | | | | | | | | | | |
| | | | | | | |
Cash flows on related derivative assets: | | | | | | | | | | | | | | | | | | | | | | | | | | | | |
– Payments | | | (292.4 | ) | | | — | | | | — | | | | — | | | | — | | | | — | | | | (292.4 | ) |
– Receipts | | | 292.3 | | | | — | | | | — | | | | — | | | | — | | | | — | | | | 292.3 | |
| | | | | | | | | | | | | | | | | | | | | | | | | | | | |
| | | (0.1 | ) | | | — | | | | — | | | | — | | | | — | | | | — | | | | (0.1 | ) |
| | | | | | | | | | | | | | | | | | | | | | | | | | | | |
| | | (1,019.1 | ) | | | (290.5 | ) | | | (270.8 | ) | | | (268.0 | ) | | | (437.1 | ) | | | (3,136.5 | ) | | | (5,422.0 | ) |
| | | | | | | | | | | | | | | | | | | | | | | | | | | | |
The Group’s exposure to liquidity risk by currency may be assessed by analyzing these expected future net cash flows on financial liabilities and related financial assets as follows:
| | | | | | | | | | | | | | | | | | | | | | | | | | | | |
| | | Within
1 year
$ million | | | Between
1 and 2
years
$ million | | | Between
2 and 3
years
$ million | | | Between
3 and 4
years
$ million | | | Between
4 and 5
years
$ million | | | After
5 years
$ million | | | Total
$ million | |
As at December 31, 2011 | | | | | | | | | | | | | | | | | | | | | | | | | | | | |
– US dollar | | | (345.3 | ) | | | (205.8 | ) | | | (187.7 | ) | | | (307.8 | ) | | | (1,559.0 | ) | | | (1,221.3 | ) | | | (3,826.9 | ) |
– Sterling | | | (21.7 | ) | | | (1.3 | ) | | | (1.3 | ) | | | (21.7 | ) | | | — | | | | — | | | | (46.0 | ) |
– Euro | | | (97.1 | ) | | | (1.6 | ) | | | (0.4 | ) | | | (0.4 | ) | | | (0.5 | ) | | | (2.5 | ) | | | (102.5 | ) |
– Canadian dollar | | | (6.4 | ) | | | — | | | | — | | | | — | | | | — | | | | — | | | | (6.4 | ) |
– Other | | | (153.8 | ) | | | (3.2 | ) | | | — | | | | — | | | | — | | | | — | | | | (157.0 | ) |
| | | | | | | | | | | | | | | | | | | | | | | | | | | | |
| | | (624.3 | ) | | | (211.9 | ) | | | (189.4 | ) | | | (329.9 | ) | | | (1,559.5 | ) | | | (1,223.8 | ) | | | (4,138.8 | ) |
| | | | | | | | | | | | | | | | | | | | | | | | | | | | |
| | | | | | | |
As at December 31, 2010 | | | | | | | | | | | | | | | | | | | | | | | | | | | | |
– US dollar | | | (569.4 | ) | | | (281.9 | ) | | | (268.8 | ) | | | (266.0 | ) | | | (408.5 | ) | | | (3,133.9 | ) | | | (4,928.5 | ) |
– Sterling | | | (39.9 | ) | | | (2.6 | ) | | | (1.6 | ) | | | (1.6 | ) | | | (28.2 | ) | | | — | | | | (73.9 | ) |
– Euro | | | (150.2 | ) | | | (0.8 | ) | | | (0.4 | ) | | | (0.4 | ) | | | (0.4 | ) | | | (2.6 | ) | | | (154.8 | ) |
– Canadian dollar | | | (70.5 | ) | | | — | | | | — | | | | — | | | | — | | | | — | | | | (70.5 | ) |
– Other | | | (189.1 | ) | | | (5.2 | ) | | | — | | | | — | | | | — | | | | — | | | | (194.3 | ) |
| | | | | | | | | | | | | | | | | | | | | | | | | | | | |
| | | (1,019.1 | ) | | | (290.5 | ) | | | (270.8 | ) | | | (268.0 | ) | | | (437.1 | ) | | | (3,136.5 | ) | | | (5,422.0 | ) |
| | | | | | | | | | | | | | | | | | | | | | | | | | | | |
Maturities of the financial liabilities in all of the liquidity tables above are based on the earliest date on which the counterparty has a contractual right to require payment.
It should be noted that certain borrowings under the Senior Secured Credit Facilities would be required to be prepaid with net cash proceeds of asset sales, casualty and condemnation events, incurrence of indebtedness (other than indebtedness permitted to be incurred) and to the extent that the Group generates ‘excess cash’ as defined in the credit agreement, in each case subject to certain exceptions such as reinvestment rights. Furthermore, in the event of a change of control, the bank and other loans may have to be repaid and the undrawn committed borrowing facilities may be withdrawn. The effect of these potential prepayments have not been reflected in the above tables.
Floating interest payments and payments and receipts on interest rate derivatives are estimated based on market interest rates prevailing at the balance sheet date.
F-56
Pinafore Holdings B.V.
Group Financial Statements
NOTES TO THE CONSOLIDATED FINANCIAL STATEMENTS (CONTINUED)
| 34. | Financial risk management continued |
E. Interest rate risk
Interest rate risk is the risk that the fair value of, or future cash flows associated with, a financial instrument will fluctuate because of changes in market interest rates. Where necessary, the desired interest rate profile of net debt in each currency is achieved by entering into interest rate derivative contracts. As at December 31, the Group held no interest rate derivative contracts.
The interest rate profile of the Group’s financial assets and liabilities was as follows:
| | | | | | | | | | | | | | | | | | | | | | | | | | | | | | | | |
| | | As at December 31, 2011 | | | As at December 31, 2010 | |
| | | Interest-bearing | | | | | | | | | Interest-bearing | | | | | | | |
| | | Floating
rate
$ million | | | Fixed
rate
$ million | | | Non-interest
bearing
$ million | | | Total
$ million | | | Floating
rate
$ million | | | Fixed
rate
$ million | | | Non-interest
bearing
$ million | | | Total
$ million | |
Financial assets | | | | | | | | | | | | | | | | | | | | | | | | | | | | | | | | |
Trade and other receivables | | | 17.9 | | | | 1.7 | | | | 685.3 | | | | 704.9 | | | | 47.9 | | | | 8.0 | | | | 825.1 | | | | 881.0 | |
Available-for-sale investments | | | — | | | | — | | | | 1.1 | | | | 1.1 | | | | — | | | | — | | | | 1.4 | | | | 1.4 | |
Cash and cash equivalents (see note 28) | | | 403.3 | | | | — | | | | 76.7 | | | | 480.0 | | | | 348.8 | | | | — | | | | 110.5 | | | | 459.3 | |
| | | | | | | | | | | | | | | | | | | | | | | | | | | | | | | | |
| | | 421.2 | | | | 1.7 | | | | 763.1 | | | | 1,186.0 | | | | 396.7 | | | | 8.0 | | | | 937.0 | | | | 1,341.7 | |
Financial liabilities | | | | | | | | | | | | | | | | | | | | | | | | | | | | | | | | |
Trade and other payables | | | — | | | | — | | | | (442.2 | ) | | | (442.2 | ) | | | — | | | | — | | | | (565.8 | ) | | | (565.8 | ) |
Borrowings (see note 30) | | | (1,639.2 | ) | | | (1,015.2 | ) | | | (5.2 | ) | | | (2,659.6 | ) | | | (1,861.5 | ) | | | (1,297.9 | ) | | | (2.3 | ) | | | (3,161.7 | ) |
Obligations under finance leases | | | — | | | | (2.8 | ) | | | — | | | | (2.8 | ) | | | — | | | | (3.3 | ) | | | — | | | | (3.3 | ) |
| | | | | | | | | | | | | | | | | | | | | | | | | | | | | | | | |
| | | (1,639.2 | ) | | | (1,018.0 | ) | | | (447.4 | ) | | | (3,104.6 | ) | | | (1,861.5 | ) | | | (1,301.2 | ) | | | (568.1 | ) | | | (3,730.8 | ) |
| | | | | | | | | | | | | | | | | | | | | | | | | | | | | | | | |
| | | (1,218.0 | ) | | | (1,016.3 | ) | | | 315.7 | | | | (1,918.6 | ) | | | (1,464.8 | ) | | | (1,293.2 | ) | | | 368.9 | | | | (2,389.1 | ) |
| | | | | | | | | | | | | | | | | | | | | | | | | | | | | | | | |
On the assumption that the change in interest rates is applied to the Group’s financial assets and liabilities at the balance sheet date, an increase of 50 basis points in prevailing interest rates would increase the Group’s profit before tax by $2.0 million and a decrease of 50 basis points would decrease the Group’s profit before tax by $0.7 million. Borrowings under the Senior Secured Credit Facilities bear interest at floating rates, but are subject to a floor, which, as at December 31, 2011, was a LIBOR floor of 1.25%. The Revolver is subject to a floor of 1.75%, but as at December 31, 2011, there were no cash drawings under this facility. If the LIBOR floor was not effective, an increase of 50 basis points in the prevailing interest rates applied to the Group’s financial assets and liabilities at the balance sheet date would decrease the Group’s profit before tax by $6.7 million and a decrease of 50 basis points would increase the Group’s profit before tax by $8.0 million.
F. Currency risk
Currency risk is the risk that the fair value or future cash flows of a financial instrument will fluctuate because of changes in foreign exchange rates. Currency risk arises on financial assets and liabilities that are denominated in a currency other than the functional currency of the entity in which they are held. From time to time, the Group enters into currency derivative contracts to manage currency transaction exposures.
The Group’s exposure to currency risk, after taking into account currency transaction hedges, was as follows:
| | | | | | | | | | | | | | | | | | | | | | | | |
| | | Net foreign currency financial assets/(liabilities) | |
| | | US
dollar
$ million | | | Sterling
$ million | | | Euro
$ million | | | Canadian
dollar
$ million | | | Other
$ million | | | Total
$ million | |
As at December 31, 2011 | | | | | | | | | | | | | | | | | | | | | | | | |
Functional currency of entity: | | | | | | | | | | | | | | | | | | | | | | | | |
– US dollar | | | — | | | | 12.0 | | | | 4.2 | | | | — | | | | (1.6 | ) | | | 14.6 | |
– Sterling | | | 3.7 | | | | — | | | | 6.3 | | | | — | | | | (6.4 | ) | | | 3.6 | |
– Euro | | | (8.3 | ) | | | 1.1 | | | | — | | | | (0.6 | ) | | | — | | | | (7.8 | ) |
– Canadian dollar | | | 1.3 | | | | — | | | | (0.2 | ) | | | — | | | | (0.1 | ) | | | 1.0 | |
– Other | | | (2.9 | ) | | | (3.0 | ) | | | 17.0 | | | | (0.6 | ) | | | — | | | | 10.5 | |
| | | | | | | | | | | | | | | | | | | | | | | | |
| | | (6.2 | ) | | | 10.1 | | | | 27.3 | | | | (1.2 | ) | | | (8.1 | ) | | | 21.9 | |
| | | | | | | | | | | | | | | | | | | | | | | | |
| | | | | | |
As at December 31, 2010 | | | | | | | | | | | | | | | | | | | | | | | | |
Functional currency of entity: | | | | | | | | | | | | | | | | | | | | | | | | |
– US dollar | | | — | | | | (1.1 | ) | | | (2.2 | ) | | | — | | | | (2.6 | ) | | | (5.9 | ) |
– Sterling | | | 3.4 | | | | — | | | | (2.7 | ) | | | — | | | | (0.5 | ) | | | 0.2 | |
– Euro | | | (5.8 | ) | | | (4.6 | ) | | | — | | | | (0.3 | ) | | | (0.1 | ) | | | (10.8 | ) |
– Canadian dollar | | | (4.2 | ) | | | (0.8 | ) | | | (0.5 | ) | | | — | | | | (7.4 | ) | | | (12.9 | ) |
– Other | | | (9.7 | ) | | | (5.6 | ) | | | 4.4 | | | | (1.3 | ) | | | — | | | | (12.2 | ) |
| | | | | | | | | | | | | | | | | | | | | | | | |
| | | (16.3 | ) | | | (12.1 | ) | | | (1.0 | ) | | | (1.6 | ) | | | (10.6 | ) | | | (41.6 | ) |
| | | | | | | | | | | | | | | | | | | | | | | | |
F-57
Pinafore Holdings B.V.
Group Financial Statements
NOTES TO THE CONSOLIDATED FINANCIAL STATEMENTS (CONTINUED)
| 34. | Financial risk management continued |
On the assumption that the change in exchange rates is applied to the risk exposures in existence at the balance sheet date and that designated net investment hedges are 100% effective, an increase or decrease of 10% in the value of the functional currencies of the entities concerned against the currencies in which the financial assets and liabilities are denominated would increase or decrease the Group’s profit before tax by $2.5 million (December 31, 2010: $4.2 million).
Currency translation exposures on the Group’s net assets, after taking into account currency translation, were as follows:
| | | | | | | | |
| | | As at
December 31,
2010
$ million | | | As at
December 31,
2010
$ million | |
Currency | | | | | | | | |
– US dollar | | | (92.3 | ) | | | 184.8 | |
– Sterling | | | 316.2 | | | | 444.1 | |
– Euro | | | 420.4 | | | | 336.8 | |
– Canadian dollar | | | 293.6 | | | | 237.3 | |
– Other | | | 1,405.7 | | | | 1,136.8 | |
| | | | | | | | |
| | | 2,343.6 | | | | 2,339.8 | |
| | | | | | | | |
| 35. | Post-employment benefit obligations |
A. Background
The Group operates pension plans throughout the world, covering the majority of its employees. The plans are structured to accord with local conditions and practices in each country and include defined contribution plans and defined benefit plans.
The Group provides defined contribution pension benefits in most of the countries in which it operates; in particular, the majority of the Group’s employees in the US are entitled to such benefits. Contributions payable by the Group to these plans during Fiscal 2011 amounted to $31.9 million (Q4 2010: $9.2 million; 9M 2010: $22.0 million; Fiscal 2009: $33.4 million). At the balance sheet date, the Group had not paid over to the plans contributions due amounting to $15.1 million (December 31, 2010: $16.1 million). All amounts due for the period were paid over subsequent to the balance sheet date.
The Group operates defined benefit pension plans in several countries; in particular, in the US and the UK. Generally, the pension benefits provided under these plans are based upon pensionable salary and the period of service of the individual employees. The assets of the plans are held separately from those of the Group in funds that are under the control of trustees. All of the defined benefit pension plans operated by the Group are closed to new entrants. In addition to the funded defined benefit pension plans, the Group has unfunded defined benefit obligations to certain current and former employees.
The Group also provides other post-employment benefits, principally health and life insurance cover, to certain of its employees in North America. These plans, which are unfunded, are defined benefit plans.
B. Summary of financial effect on comprehensive income
An analysis of the effect of providing post-employment benefits on the Group’s results is set out below.
| | | | | | | | | | | | | | | | | | | | | | | | | | | | |
| SUCCESSOR | | Pensions | | | Other post-employment benefits | |
Fiscal 2011 | | Operating
profit
$ million | | | Finance
charges
$ million | | | Profit from
discontinued
operation
$ million | | | Total
$ million | | | Operating
profit
$ million | | | Finance
charges
$ million | | | Total
$ million | |
Defined contribution plans | | | 29.7 | | | | — | | | | 2.2 | | | | 31.9 | | | | — | | | | — | | | | — | |
| | | | | | | | | | | | | | | | | | | | | | | | | | | | |
| | | | | | | |
Defined benefit plans | | | | | | | | | | | | | | | | | | | | | | | | | | | | |
Recognized in profit or loss: | | | | | | | | | | | | | | | | | | | | | | | | | | | | |
– Current service cost | | | 3.2 | | | | — | | | | — | | | | 3.2 | | | | 0.1 | | | | — | | | | 0.1 | |
– Settlement and curtailments | | | (3.1 | ) | | | — | | | | — | | | | (3.1 | ) | | | — | | | | — | | | | — | |
– Interest cost | | | — | | | | 57.6 | | | | 0.3 | | | | 57.9 | | | | — | | | | 6.5 | | | | 6.5 | |
– Expected return on plan assets | | | — | | | | (67.0 | ) | | | (0.1 | ) | | | (67.1 | ) | | | — | | | | — | | | | — | |
| | | | | | | | | | | | | | | | | | | | | | | | | | | | |
| | | 0.1 | | | | (9.4 | ) | | | 0.2 | | | | (9.1 | ) | | | 0.1 | | | | 6.5 | | | | 6.6 | |
| | | | | | | | | | | | | | | | | | | | | | | | | | | | |
Recognized in equity: | | | | | | | | | | | | | | | | | | | | | | | | | | | | |
– Net actuarial (gain)/loss | | | | | | | | | | | | | | | (35.4 | ) | | | | | | | | | | | 2.0 | |
– Effect of the asset ceiling | | | | | | | | | | | | | | | 37.8 | | | | | | | | | | | | — | |
| | | | | | | | | | | | | | | | | | | | | | | | | | | | |
| | | | | | | | | | | | | | | 2.4 | | | | | | | | | | | | 2.0 | |
| | | | | | | | | | | | | | | | | | | | | | | | | | | | |
| | | | | | | | | | | | | | | (6.7 | ) | | | | | | | | | | | 8.6 | |
| | | | | | | | | | | | | | | | | | | | | | | | | | | | |
F-58
Pinafore Holdings B.V.
Group Financial Statements
NOTES TO THE CONSOLIDATED FINANCIAL STATEMENTS (CONTINUED)
| 35. | Post-employment benefit obligations continued |
B. Summary of financial effect on comprehensive income (continued)
| | | | | | | | | | | | | | | | | | | | | | | | | | | | |
| SUCCESSOR | | Pensions | | | Other post-employment benefits | |
Q4 2010 | | Operating
profit
$ million | | | Finance
charges
$ million | | | Loss from
discontinued
operation
$ million | | | Total
$ million | | | Operating
profit
$ million | | | Finance
charges
$ million | | | Total
$ million | |
Defined contribution plans | | | 8.7 | | | | — | | | | 0.5 | | | | 9.2 | | | | — | | | | — | | | | — | |
| | | | | | | | | | | | | | | | | | | | | | | | | | | | |
| | | | | | | |
Defined benefit plans | | | | | | | | | | | | | | | | | | | | | | | | | | | | |
Recognized in profit or loss: | | | | | | | | | | | | | | | | | | | | | | | | | | | | |
– Current service cost | | | 1.2 | | | | — | | | | — | | | | 1.2 | | | | — | | | | — | | | | — | |
– Interest cost | | | — | | | | 13.5 | | | | 0.1 | | | | 13.6 | | | | — | | | | 1.8 | | | | 1.8 | |
– Expected return on plan assets | | | — | | | | (16.3 | ) | | | — | | | | (16.3 | ) | | | — | | | | — | | | | — | |
| | | | | | | | | | | | | | | | | | | | | | | | | | | | |
| | | 1.2 | | | | (2.8 | ) | | | 0.1 | | | | (1.5 | ) | | | — | | | | 1.8 | | | | 1.8 | |
| | | | | | | | | | | | | | | | | | | | | | | | | | | | |
Recognized in equity: | | | | | | | | | | | | | | | | | | | | | | | | | | | | |
– Net actuarial gain | | | | | | | | | | | | | | | (60.1 | ) | | | | | | | | | | | (10.0 | ) |
– Effect of the asset ceiling | | | | | | | | | | | | | | | 20.2 | | | | | | | | | | | | — | |
| | | | | | | | | | | | | | | | | | | | | | | | | | | | |
| | | | | | | | | | | | | | | (39.9 | ) | | | | | | | | | | | (10.0 | ) |
| | | | | | | | | | | | | | | | | | | | | | | | | | | | |
| | | | | | | | | | | | | | | (41.4 | ) | | | | | | | | | | | (8.2 | ) |
| | | | | | | | | | | | | | | | | | | | | | | | | | | | |
| | |
| PREDECESSOR | | Pensions | | | Other post-employment benefits | |
9M 2010 | | Operating
profit
$ million | | | Finance
charges
$ million | | | Profit from
discontinued
operation
$ million | | | Total
$ million | | | Operating
profit
$ million | | | Finance
charges
$ million | | | Total
$ million | |
Defined contribution plans | | | 20.5 | | | | — | | | | 1.5 | | | | 22.0 | | | | — | | | | — | | | | — | |
| | | | | | | | | | | | | | | | | | | | | | | | | | | | |
| | | | | | | |
Defined benefit plans | | | | | | | | | | | | | | | | | | | | | | | | | | | | |
Recognized in profit or loss: | | | | | | | | | | | | | | | | | | | | | | | | | | | | |
– Current service cost | | | 3.8 | | | | — | | | | — | | | | 3.8 | | | | 0.2 | | | | — | | | | 0.2 | |
– Settlement and curtailments | | | 1.0 | | | | — | | | | — | | | | 1.0 | | | | (1.9 | ) | | | — | | | | (1.9 | ) |
– Interest cost | | | — | | | | 44.4 | | | | 0.4 | | | | 44.8 | | | | — | | | | 5.6 | | | | 5.6 | |
– Expected return on plan assets | | | — | | | | (44.6 | ) | | | (0.1 | ) | | | (44.7 | ) | | | — | | | | — | | | | — | |
| | | | | | | | | | | | | | | | | | | | | | | | | | | | |
| | | 4.8 | | | | (0.2 | ) | | | 0.3 | | | | 4.9 | | | | (1.7 | ) | | | 5.6 | | | | 3.9 | |
| | | | | | | | | | | | | | | | | | | | | | | | | | | | |
| | | | | | | |
Recognized in equity: | | | | | | | | | | | | | | | | | | | | | | | | | | | | |
– Net actuarial loss | | | | | | | | | | | | | | | 25.9 | | | | | | | | | | | | 5.4 | |
– Effect of the asset ceiling | | | | | | | | | | | | | | | (0.3 | ) | | | | | | | | | | | — | |
| | | | | | | | | | | | | | | | | | | | | | | | | | | | |
| | | | | | | | | | | | | | | 25.6 | | | | | | | | | | | | 5.4 | |
| | | | | | | | | | | | | | | | | | | | | | | | | | | | |
| | | | | | | | | | | | | | | 30.5 | | | | | | | | | | | | 9.3 | |
| | | | | | | | | | | | | | | | | | | | | | | | | | | | |
| | |
| PREDECESSOR | | Pensions | | | Other post-employment benefits | |
Fiscal 2009 | | Operating
profit
$ million | | | Finance
charges
$ million | | | Profit from
discontinued
operation
$ million | | | Total
$ million | | | Operating
profit
$ million | | | Finance
charges
$ million | | | Total
$ million | |
Defined contribution plans | | | 31.2 | | | | — | | | | 2.2 | | | | 33.4 | | | | — | | | | — | | | | — | |
| | | | | | | | | | | | | | | | | | | | | | | | | | | | |
| | | | | | | |
Defined benefit plans | | | | | | | | | | | | | | | | | | | | | | | | | | | | |
Recognized in profit or loss: | | | | | | | | | | | | | | | | | | | | | | | | | | | | |
– Current service cost | | | 6.7 | | | | — | | | | — | | | | 6.7 | | | | 0.4 | | | | — | | | | 0.4 | |
– Past service cost | | | 2.7 | | | | — | | | | — | | | | 2.7 | | | | — | | | | — | | | | — | |
– Negative past service cost | | | (0.3 | ) | | | — | | | | — | | | | (0.3 | ) | | | (17.2 | ) | | | — | | | | (17.2 | ) |
– Settlement and curtailments | | | (36.4 | ) | | | — | | | | — | | | | (36.4 | ) | | | (10.5 | ) | | | — | | | | (10.5 | ) |
– Interest cost | | | — | | | | 60.6 | | | | 0.4 | | | | 61.0 | | | | — | | | | 9.0 | | | | 9.0 | |
– Expected return on plan assets | | | — | | | | (62.5 | ) | | | (0.1 | ) | | | (62.6 | ) | | | — | | | | — | | | | — | |
| | | | | | | | | | | | | | | | | | | | | | | | | | | | |
| | | (27.3 | ) | | | (1.6 | ) | | | 0.3 | | | | (28.9 | ) | | | (27.3 | ) | | | 9.0 | | | | (18.3 | ) |
| | | | | | | | | | | | | | | | | | | | | | | | | | | | |
| | | | | | | |
Recognized in equity: | | | | | | | | | | | | | | | | | | | | | | | | | | | | |
– Net actuarial loss | | | | | | | | | | | | | | | 119.8 | | | | | | | | | | | | 24.0 | |
– Effect of the asset ceiling | | | | | | | | | | | | | | | (18.6 | ) | | | | | | | | | | | — | |
| | | | | | | | | | | | | | | | | | | | | | | | | | | | |
| | | | | | | | | | | | | | | 101.2 | | | | | | | | | | | | 24.0 | |
| | | | | | | | | | | | | | | | | | | | | | | | | | | | |
| | | | | | | | | | | | | | | 72.3 | | | | | | | | | | | | 5.7 | |
| | | | | | | | | | | | | | | | | | | | | | | | | | | | |
During Fiscal 2009, the Group recognized a gain of $63.0 million on the amendment of pension and post-retirement healthcare plans in North America (see note 9).
F-59
Pinafore Holdings B.V.
Group Financial Statements
NOTES TO THE CONSOLIDATED FINANCIAL STATEMENTS (CONTINUED)
| 35. | Post-employment benefit obligations continued |
C. Summary of financial effect on the balance sheet
The net liability recognized in the Group’s balance sheet in respect of defined benefit plans and its presentation in the balance sheet are set out below:
| | | | | | | | | | | | | | | | | | | | | | | | | | | | | | | | |
| | | As at December 31, 2011 | | | As at December 31, 2010 | |
| | | US
$ million | | | UK
$ million | | | Other
countries
$ million | | | Total
$ million | | | US
$ million | | | UK
$ million | | | Other
countries
$ million | | | Total
$ million | |
Pensions | | | | | | | | | | | | | | | | | | | | | | | | | | | | | | | | |
Present value of benefit obligation: | | | | | | | | | | | | | | | | | | | | | | | | | | | | | | | | |
– Funded | | | 589.0 | | | | 382.5 | | | | 127.5 | | | | 1,099.0 | | | | 572.9 | | | | 367.3 | | | | 150.9 | | | | 1,091.1 | |
– Unfunded | | | 35.8 | | | | 0.2 | | | | 1.4 | | | | 37.4 | | | | 35.8 | | | | 0.2 | | | | 1.4 | | | | 37.4 | |
| | | | | | | | | | | | | | | | | | | | | | | | | | | | | | | | |
| | | 624.8 | | | | 382.7 | | | | 128.9 | | | | 1,136.4 | | | | 608.7 | | | | 367.5 | | | | 152.3 | | | | 1,128.5 | |
Fair value of plan assets | | | (596.0 | ) | | | (444.1 | ) | | | (94.6 | ) | | | (1,134.7 | ) | | | (513.5 | ) | | | (377.9 | ) | | | (119.7 | ) | | | (1,011.1 | ) |
| | | | | | | | | | | | | | | | | | | | | | | | | | | | | | | | |
| | | 28.8 | | | | (61.4 | ) | | | 34.3 | | | | 1.7 | | | | 95.2 | | | | (10.4 | ) | | | 32.6 | | | | 117.4 | |
Effect of the asset ceiling | | | 6.9 | | | | 57.7 | | | | — | | | | 64.6 | | | | 3.8 | | | | 24.4 | | | | — | | | | 28.2 | |
| | | | | | | | | | | | | | | | | | | | | | | | | | | | | | | | |
Net liability | | | 35.7 | | | | (3.7 | ) | | | 34.3 | | | | 66.3 | | | | 99.0 | | | | 14.0 | | | | 32.6 | | | | 145.6 | |
| | | | | | | | | | | | | | | | | | | | | | | | | | | | | | | | |
| | | | | | | | |
Other benefits (unfunded) | | | | | | | | | | | | | | | | | | | | | | | | | | | | | | | | |
Present value of benefit obligation | | | 93.7 | | | | — | | | | 32.7 | | | | 126.4 | | | | 97.4 | | | | — | | | | 32.6 | | | | 130.0 | |
| | | | | | | | | | | | | | | | | | | | | | | | | | | | | | | | |
| | | 129.4 | | | | (3.7 | ) | | | 67.0 | | | | 192.7 | | | | 196.4 | | | | 14.0 | | | | 65.2 | | | | 275.6 | |
| | | | | | | | | | | | | | | | | | | | | | | | | | | | | | | | |
The net liability is presented in the Group’s balance sheet as follows:
| | | | | | | | | | | | | | | | | | | | | | | | |
| | | As at December 31, 2011 | | | As at December 31, 2010 | |
| | | Pensions
$ million | | | Other
benefits
$ million | | | Total
$ million | | | Pensions
$ million | | | Other
benefits
$ million | | | Total
$ million | |
Surpluses | | | (6.7 | ) | | | — | | | | (6.7 | ) | | | (3.6 | ) | | | — | | | | (3.6 | ) |
Deficits | | | 70.7 | | | | 126.4 | | | | 197.1 | | | | 149.2 | | | | 130.0 | | | | 279.2 | |
| | | | | | | | | | | | | | | | | | | | | | | | |
| | | 64.0 | | | | 126.4 | | | | 190.4 | | | | 145.6 | | | | 130.0 | | | | 275.6 | |
Businesses to be sold (see note 29) | | | 2.3 | | | | — | | | | 2.3 | | | | — | | | | — | | | | — | |
| | | | | | | | | | | | | | | | | | | | | | | | |
Net liability | | | 66.3 | | | | 126.4 | | | | 192.7 | | | | 145.6 | | | | 130.0 | | | | 275.6 | |
| | | | | | | | | | | | | | | | | | | | | | | | |
D. Pensions
Assumptions
The principal assumptions used in the actuarial valuations of the defined benefit pension plans were as follows:
| | | | | | | | | | | | | | | | | | | | | | | | |
| | | As at December 31, 2011 | | | As at December 31, 2010 | |
| | | US
% per
annum | | | UK
% per
annum | | | Other
countries
% per
annum | | | US
% per
annum | | | UK
% per
annum | | | Other
countries
% per
annum | |
Salary increases | | | 3.28 | % | | | 4.00 | % | | | 3.47 | % | | | 3.31 | % | | | 4.25 | % | | | 4.41 | % |
Increase to pensions in payment | | | n/a | | | | 3.00 | % | | | 1.75 | % | | | n/a | | | | 3.50 | % | | | 1.75 | % |
Increase to deferred pensions | | | n/a | | | | 3.00 | % | | | 1.75 | % | | | n/a | | | | 3.50 | % | | | 1.75 | % |
Long-term rate of return on plan assets | | | 7.25 | % | | | 5.97 | % | | | 5.41 | % | | | 7.75 | % | | | 6.23 | % | | | 5.92 | % |
Discount rate | | | 5.00 | % | | | 5.00 | % | | | 3.69 | % | | | 5.38 | % | | | 5.50 | % | | | 4.52 | % |
Inflation rate | | | n/a | | | | 3.00 | % | | | 2.11 | % | | | n/a | | | | 3.50 | % | | | 2.20 | % |
The current life expectancies underlying the benefit obligations of the Group’s principal pension plans were as follows:
| | | | | | | | | | | | | | | | | | | | | | | | | | |
| | | | | As at December 31, 2011 | | | As at December 31, 2010 | |
| | | | | US
Years | | | UK
Years | | | Other
countries
Years | | | US
Years | | | UK
Years | | | Other
countries
Years | |
Current pensioners (at age 65) | | – male | | | 18.6 | | | | 23.5 | | | | 19.4 | | | | 17.7 | | | | 21.2 | | | | 19.4 | |
| | – female | | | 20.7 | | | | 25.5 | | | | 21.8 | | | | 20.3 | | | | 24.2 | | | | 21.8 | |
Future pensioners (at age 65) | | – male | | | 18.6 | | | | 25.7 | | | | 19.4 | | | | 17.7 | | | | 22.2 | | | | 19.4 | |
| | – female | | | 20.7 | | | | 27.7 | | | | 21.8 | | | | 20.3 | | | | 25.2 | | | | 21.8 | |
F-60
Pinafore Holdings B.V.
Group Financial Statements
NOTES TO THE CONSOLIDATED FINANCIAL STATEMENTS (CONTINUED)
| 35. | Post-employment benefit obligations continued |
D. Pensions (continued)
Benefit obligation
Changes in the present value of the benefit obligation were as follows:
| | | | | | | | | | | | | | | | | | | | | | | | | | | | | | | | |
| SUCCESSOR | | Fiscal 2011 | | | Q4 2010 | |
| | | US
$ million | | | UK
$ million | | | Other
countries
$ million | | | Total
$ million | | | US
$ million | | | UK
$ million | | | Other
countries
$ million | | | Total
$ million | |
At the beginning of the period | | | 608.7 | | | | 367.5 | | | | 152.3 | | | | 1,128.5 | | | | — | | | | — | | | | — | | | | — | |
Acquisition of subsidiaries | | | — | | | | — | | | | — | | | | — | | | | 638.7 | | | | 398.0 | | | | 152.1 | | | | 1,188.8 | |
Current service cost | | | 0.8 | | | | 0.4 | | | | 2.0 | | | | 3.2 | | | | 0.2 | | | | 0.1 | | | | 0.9 | | | | 1.2 | |
Settlements | | | (0.4 | ) | | | — | | | | (1.1 | ) | | | (1.5 | ) | | | (0.1 | ) | | | — | | | | — | | | | (0.1 | ) |
Curtailments | | | (3.1 | ) | | | — | | | | — | | | | (3.1 | ) | | | — | | | | — | | | | — | | | | — | |
Interest cost | | | 31.4 | | | | 20.5 | | | | 6.0 | | | | 57.9 | | | | 7.7 | | | | 4.9 | | | | 1.0 | | | | 13.6 | |
Net actuarial loss/(gain) | | | 38.2 | | | | 11.8 | | | | 9.3 | | | | 59.3 | | | | (22.2 | ) | | | (25.4 | ) | | | (4.3 | ) | | | (51.9 | ) |
| | | | | | | | | | | | | | | | | | | | | | | | | | | | | | | | |
| | | 675.6 | | | | 400.2 | | | | 168.5 | | | | 1,244.3 | | | | 624.3 | | | | 377.6 | | | | 149.7 | | | | 1,151.6 | |
Disposal of subsidiaries | | | — | | | | — | | | | (30.5 | ) | | | (30.5 | ) | | | — | | | | — | | | | — | | | | — | |
Employees’ contributions | | | — | | | | 0.1 | | | | — | | | | 0.1 | | | | — | | | | — | | | | — | | | | — | |
Benefits paid | | | (50.8 | ) | | | (16.4 | ) | | | (8.2 | ) | | | (75.4 | ) | | | (15.6 | ) | | | (4.8 | ) | | | (1.7 | ) | | | (22.1 | ) |
Foreign currency translation | | | — | | | | (1.2 | ) | | | (0.9 | ) | | | (2.1 | ) | | | — | | | | (5.3 | ) | | | 4.3 | | | | (1.0 | ) |
| | | | | | | | | | | | | | | | | | | | | | | | | | | | | | | | |
At the end of the period | | | 624.8 | | | | 382.7 | | | | 128.9 | | | | 1,136.4 | | | | 608.7 | | | | 367.5 | | | | 152.3 | | | | 1,128.5 | |
| | | | | | | | | | | | | | | | | | | | | | | | | | | | | | | | |
| | | | | | | | | | | | | | | | |
| PREDECESSOR | | 9M 2010 | |
| | | US
$ million | | | UK
$ million | | | Other
countries
$ million | | | Total
$ million | |
At the beginning of the period | | | 601.9 | | | | 366.8 | | | | 147.3 | | | | 1,116.0 | |
Current service cost | | | 0.5 | | | | 0.3 | | | | 3.0 | | | | 3.8 | |
Settlements | | | — | | | | — | | | | 1.0 | | | | 1.0 | |
Interest cost | | | 24.9 | | | | 14.6 | | | | 5.3 | | | | 44.8 | |
Net actuarial loss | | | 47.1 | | | | 37.1 | | | | 6.2 | | | | 90.4 | |
| | | | | | | | | | | | | | | | |
| | | 674.4 | | | | 418.8 | | | | 162.8 | | | | 1,256.0 | |
Employees’ contributions | | | — | | | | 0.1 | | | | 0.1 | | | | 0.2 | |
Benefits paid | | | (35.7 | ) | | | (11.0 | ) | | | (13.6 | ) | | | (60.3 | ) |
Foreign currency translation | | | — | | | | (9.9 | ) | | | 2.8 | | | | (7.1 | ) |
| | | | | | | | | | | | | | | | |
At the end of the period | | | 638.7 | | | | 398.0 | | | | 152.1 | | | | 1,188.8 | |
| | | | | | | | | | | | | | | | |
Plan assets
Changes in the fair value of plan assets were as follows:
| | | | | | | | | | | | | | | | | | | | | | | | | | | | | | | | |
| SUCCESSOR | | Fiscal 2011 | | | Q4 2010 | |
| | | US
$ million | | | UK
$ million | | | Other
countries
$ million | | | Total
$ million | | | US
$ million | | | UK
$ million | | | Other
countries
$ million | | | Total
$ million | |
At the beginning of the period | | | 513.5 | | | | 377.9 | | | | 119.7 | | | | 1,011.1 | | | | — | | | | — | | | | — | | | | — | |
Acquisition of subsidiaries | | | — | | | | — | | | | — | | | | — | | | | 515.9 | | | | 372.0 | | | | 111.4 | | | | 999.3 | |
Expected return on plan assets | | | 36.2 | | | | 24.8 | | | | 6.1 | | | | 67.1 | | | | 9.1 | | | | 5.7 | | | | 1.5 | | | | 16.3 | |
Settlements | | | (0.4 | ) | | | — | | | | (1.1 | ) | | | (1.5 | ) | | | (0.1 | ) | | | — | | | | — | | | | (0.1 | ) |
Net actuarial gain/(loss) | | | 69.8 | | | | 26.8 | | | | (1.9 | ) | | | 94.7 | | | | (1.9 | ) | | | 7.3 | | | | 2.8 | | | | 8.2 | |
| | | | | | | | | | | | | | | | | | | | | | | | | | | | | | | | |
| | | 619.1 | | | | 429.5 | | | | 122.8 | | | | 1,171.4 | | | | 523.0 | | | | 385.0 | | | | 115.7 | | | | 1,023.7 | |
Disposal of subsidiaries | | | — | | | | — | | | | (24.2 | ) | | | (24.2 | ) | | | — | | | | — | | | | — | | | | — | |
Employer’s contributions | | | 27.7 | | | | 32.3 | | | | 5.5 | | | | 65.5 | | | | 6.1 | | | | 2.8 | | | | 3.0 | | | | 11.9 | |
Employees’ contributions | | | — | | | | 0.1 | | | | — | | | | 0.1 | | | | — | | | | — | | | | — | | | | — | |
Benefits paid | | | (50.8 | ) | | | (16.4 | ) | | | (8.2 | ) | | | (75.4 | ) | | | (15.6 | ) | | | (4.8 | ) | | | (1.7 | ) | | | (22.1 | ) |
Foreign currency translation | | | — | | | | (1.4 | ) | | | (1.3 | ) | | | (2.7 | ) | | | — | | | | (5.1 | ) | | | 2.7 | | | | (2.4 | ) |
| | | | | | | | | | | | | | | | | | | | | | | | | | | | | | | | |
At the end of the period | | | 596.0 | | | | 444.1 | | | | 94.6 | | | | 1,134.7 | | | | 513.5 | | | | 377.9 | | | | 119.7 | | | | 1,011.1 | |
| | | | | | | | | | | | | | | | | | | | | | | | | | | | | | | | |
F-61
Pinafore Holdings B.V.
Group Financial Statements
NOTES TO THE CONSOLIDATED FINANCIAL STATEMENTS (CONTINUED)
| 35. | Post-employment benefit obligations continued |
D. Pensions (continued)
Plan assets (continued)
| | | | | | | | | | | | | | | | |
| PREDECESSOR | | 9M 2010 | |
| | | US
$ million | | | UK
$ million | | | Other
countries
$ million | | | Total
$ million | |
At the beginning of the period | | | 458.1 | | | | 353.7 | | | | 112.7 | | | | 924.5 | |
Expected return on plan assets | | | 24.4 | | | | 15.7 | | | | 4.6 | | | | 44.7 | |
Net actuarial gain/(loss) | | | 57.4 | | | | 7.9 | | | | (0.8 | ) | | | 64.5 | |
| | | | | | | | | | | | | | | | |
| | | 539.9 | | | | 377.3 | | | | 116.5 | | | | 1,033.7 | |
Employer’s contributions | | | 11.7 | | | | 14.9 | | | | 5.5 | | | | 32.1 | |
Employees’ contributions | | | — | | | | 0.1 | | | | 0.1 | | | | 0.2 | |
Benefits paid | | | (35.7 | ) | | | (11.0 | ) | | | (13.6 | ) | | | (60.3 | ) |
Foreign currency translation | | | — | | | | (9.3 | ) | | | 2.9 | | | | (6.4 | ) |
| | | | | | | | | | | | | | | | |
At the end of the period | | | 515.9 | | | | 372.0 | | | | 111.4 | | | | 999.3 | |
| | | | | | | | | | | | | | | | |
The fair value of plan assets by asset category was as follows:
| | | | | | | | | | | | | | | | | | | | | | | | | | | | | | | | |
| | | As at December 31, 2010 | | | As at December 31, 2010 | |
| | | US
$ million | | | UK
$ million | | | Other
countries
$ million | | | Total
$ million | | | US
$ million | | | UK
$ million | | | Other
countries
$ million | | | Total
$ million | |
Equity instruments | | | 351.6 | | | | 145.6 | | | | 40.3 | | | | 537.5 | | | | 319.2 | | | | 163.8 | | | | 51.9 | | | | 534.9 | |
Fixed income instruments | | | 235.5 | | | | 294.9 | | | | 48.2 | | | | 578.6 | | | | 165.4 | | | | 213.7 | | | | 45.3 | | | | 424.4 | |
Other assets | | | 8.9 | | | | 3.6 | | | | 6.1 | | | | 18.6 | | | | 28.9 | | | | 0.4 | | | | 22.5 | | | | 51.8 | |
| | | | | | | | | | | | | | | | | | | | | | | | | | | | | | | | |
| | | 596.0 | | | | 444.1 | | | | 94.6 | | | | 1,134.7 | | | | 513.5 | | | | 377.9 | | | | 119.7 | | | | 1,011.1 | |
| | | | | | | | | | | | | | | | | | | | | | | | | | | | | | | | |
Plan assets do not include any of the Group’s own financial instruments, nor any property occupied by, or other assets used by, the Group.
The return and risk expectations for each asset class incorporate assumptions about historical return relationships, current financial market conditions and the degree of global capital market integration. The assumptions used have been derived from rigorous historical performance analysis combined with forward-looking views of the financial markets as revealed through the yield on long-term bonds and the price earnings ratios of the major stock market indices. The actuaries review analyses of historical risk and the correlation of the return on asset classes and apply subjective judgment based on their knowledge of the Group’s plans. The result of this analysis is incorporated into a risk matrix from which expected long-term risk premiums for each asset class are developed.
The nominal return expectations are determined by combining the asset class risk premiums with expected inflation and real risk-free rate assumptions. As a final consideration, the nominal return assumptions are blended with current market conditions to develop long-term equilibrium expectations.
The Group’s investment strategy for pension plan assets includes diversification to minimize interest and market risks. Accordingly, the interest rate risk inherent in the benefit obligation of the Group’s US funded pension plans is hedged using a combination of bonds and interest rate swaps with a combined average duration of 9.9 years. In general, the investment strategy for the Group’s pension plans outside the US does not involve the use of derivative financial instruments.
Plan assets are rebalanced periodically to maintain target asset allocations. Maturities of investments are not necessarily related to the timing of expected future benefit payments, but adequate liquidity to make immediate and medium-term benefit payments is ensured.
The weighted averages of the expected returns on plan assets were as follows:
| | | | | | | | | | | | | | | | | | | | | | | | | | | | | | | | | | | | | | |
| | | SUCCESSOR | | | | | PREDECESSOR | |
| | | As at December 31, 2011 | | | As at December 31, 2010 | | | | As at January 2, 2010 | |
| | | US | | | UK | | | Other
countries | | | US | | | UK | | | Other
countries | | | | | US | | | UK | | | Other
countries | |
Equity instruments | | | 7.50 | % | | | 7.45 | % | | | 7.20 | % | | | 8.50 | % | | | 8.00 | % | | | 9.00 | % | | | | | 8.70 | % | | | 7.80 | % | | | 8.80 | % |
Debt instruments | | | 3.80 | % | | | 3.73 | % | | | 4.30 | % | | | 4.20 | % | | | 3.98 | % | | | 3.89 | % | | | | | 5.20 | % | | | 4.92 | % | | | 5.31 | % |
Other assets | | | 3.10 | % | | | 3.95 | % | | | 1.44 | % | | | 2.80 | % | | | 3.70 | % | | | 2.00 | % | | | | | 3.30 | % | | | 4.20 | % | | | 2.00 | % |
The actual return on plan assets was as follows:
| | | | | | | | | | | | | | | | | | |
| | | SUCCESSOR | | | | | PREDECESSOR | |
| | | Fiscal 2011 | | | Q4 2010 | | | | 9M 2010 | | | Fiscal 2009 | |
US | | | 20.6 | % | | | 1.4 | % | | | | | 23.8 | % | | | 0.8 | % |
UK | | | 14.0 | % | | | 3.5 | % | | | | | 8.9 | % | | | 9.4 | % |
Other countries | | | 3.1 | % | | | 4.1 | % | | | | | 4.6 | % | | | 7.1 | % |
F-62
Pinafore Holdings B.V.
Group Financial Statements
NOTES TO THE CONSOLIDATED FINANCIAL STATEMENTS (CONTINUED)
| 35. | Post-employment benefit obligations continued |
D. Pensions (continued)
Actuarial gains and losses
Actuarial gains and losses recognized in relation to defined benefit pension plans were as follows:
| | | | | | | | | | | | | | | | | | | | | | | | | | |
| | | SUCCESSOR | | | | | PREDECESSOR | |
| | | Fiscal
2011
$ million | | | Q4 2010
$ million | | | | | 9M 2010
$ million | | | Fiscal
2009
$ million | | | Fiscal
2008
$ million | | | Fiscal
2007
$ million | |
At the end of the period: | | | | | | | | | | | | | | | | | | | | | | | | | | |
– Present value of benefit obligation | | | 1,136.4 | | | | 1,128.5 | | | | | | 1,188.8 | | | | 1,116.0 | | | | 1,018.1 | | | | 1,196.5 | |
– Fair value of plan assets | | | (1,134.7 | ) | | | (1,011.1 | ) | | | | | (999.3 | ) | | | (924.5 | ) | | | (862.1 | ) | | | (1,125.0 | ) |
| | | | | | | | | | | | | | | | | | | | | | | | | | |
Deficit in the plans | | | 1.7 | | | | 117.4 | | | | | | 189.5 | | | | 191.5 | | | | 156.0 | | | | 71.5 | |
| | | | | | | | | | | | | | | | | | | | | | | | | | |
| | | | | | | |
Recognized in the period: | | | | | | | | | | | | | | | | | | | | | | | | | | |
– Net actuarial (loss)/gain on benefit obligation | | | (59.3 | ) | | | 51.9 | | | | | | (90.4 | ) | | | (101.4 | ) | | | 23.1 | | | | 92.9 | |
– Net actuarial gain/(loss) on plan assets | | | 94.7 | | | | 8.2 | | | | | | 64.5 | | | | (18.4 | ) | | | (145.5 | ) | | | (3.0 | ) |
| | | | | | | | | | | | | | | | | | | | | | | | | | |
| | | 35.4 | | | | 60.1 | | | | | | (25.9 | ) | | | (119.8 | ) | | | (122.4 | ) | | | 89.9 | |
| | | | | | | | | | | | | | | | | | | | | | | | | | |
As at December 31, 2011, the cumulative net actuarial gain recognized in other comprehensive income amounted to $95.5 million (December 31, 2010: gain of $60.1 million).
Expected future contributions
The Group expects to make contributions of $35.5 million to defined benefit pension plans during 2012.
E. Other post-employment benefits
Assumptions
The weighted averages of the principal assumptions used in the actuarial valuations of the other post-employment benefit plans were as follows:
| | | | | | | | | | | | | | |
| | | SUCCESSOR | | | | | PREDECESSOR | |
| | | As at
December 31,
2011
% per annum | | | As at
December 31,
2010
% per annum | | | | | As at
January 2,
2010
% per annum | |
Discount rate | | | 4.7 | % | | | 5.3 | % | | | | | 5.6 | % |
Medical cost inflation rate | | | 8.0 | % | | | 12.5 | % | | | | | 12.6 | % |
The Group’s other post-employment benefit plans are unfunded. Accordingly, the liability recognized in the Group’s balance sheet in respect of these plans represents the present value of the benefit obligation.
Sensitivity to change in the assumed medical cost inflation rate used in the actuarial valuations as at December 31, 2011 is as follows:
| | | | | | | | |
| | | Increase
of one
percentage
point
$ million | | | Decrease
of one
percentage
point
$ million | |
Effect on the aggregate of the current service cost and the interest cost | | | 0.4 | | | | (0.3 | ) |
Effect on the accumulated benefit obligation | | | 7.7 | | | | (6.6 | ) |
Benefit obligation
Changes in the present value of the benefit obligation were as follows:
| | | | | | | | | | | | | | |
| | | SUCCESSOR | | | | | PREDECESSOR | |
| | | Fiscal
2011
$ million | | | Q4 2010
$ million | | | | | 9M 2010
$ million | |
At the beginning of the period | | | 130.0 | | | | — | | | | | | 142.1 | |
Acquisition of subsidiaries | | | — | | | | 140.9 | | | | | | — | |
Current service cost | | | 0.1 | | | | — | | | | | | — | |
Settlements | | | — | | | | — | | | | | | (1.7 | ) |
Interest cost | | | 6.5 | | | | 1.8 | | | | | | 5.6 | |
Net actuarial loss/(gain) | | | 2.0 | | | | (10.0 | ) | | | | | 5.4 | |
| | | | | | | | | | | | | | |
| | | 138.6 | | | | 132.7 | | | | | | 151.4 | |
Benefits paid | | | (11.4 | ) | | | (3.6 | ) | | | | | (11.2 | ) |
Foreign currency translation | | | (0.8 | ) | | | 0.9 | | | | | | 0.7 | |
| | | | | | | | | | | | | | |
At the end of the period | | | 126.4 | | | | 130.0 | | | | | | 140.9 | |
| | | | | | | | | | | | | | |
F-63
Pinafore Holdings B.V.
Group Financial Statements
NOTES TO THE CONSOLIDATED FINANCIAL STATEMENTS (CONTINUED)
| 35. | Post-employment benefit obligations continued |
E. Other post-employment benefits (continued)
Actuarial gains and losses
Actuarial gains and losses recognized in relation to other post-employment benefit plans were as follows:
| | | | | | | | | | | | | | | | | | | | | | | | | | |
| | | SUCCESSOR | | | | | PREDECESSOR | |
| | | Fiscal
2011
$ million | | | Q4 2010
$ million | | | | | 9M
2010
$ million | | | Fiscal
2009
$ million | | | Fiscal
2008
$ million | | | Fiscal
2007
$ million | |
At the end of the period: | | | | | | | | | | | | | | | | | | | | | | | | | | |
– Present value of benefit obligation | | | 126.4 | | | | 130.0 | | | | | | 140.9 | | | | 142.1 | | | | 147.7 | | | | 180.8 | |
| | | | | | | | | | | | | | | | | | | | | | | | | | |
| | | | | | | |
Recognized in the period: | | | | | | | | | | | | | | | | | | | | | | | | | | |
– Actuarial (loss)/gain on benefit obligation | | | (2.0 | ) | | | 10.0 | | | | | | (5.4 | ) | | | (24.0 | ) | | | 23.6 | | | | 6.0 | |
| | | | | | | | | | | | | | | | | | | | | | | | | | |
As at December 31, 2011, the cumulative net actuarial gain recognized in other comprehensive income amounted to $8.0 million (December 31, 2010: net gain of $10.0 million).
| 36. | Share-based incentives |
The Group operates a number of employee share schemes to provide incentives to the Group’s senior executives and other eligible employees.
Prior to its acquisition by the Group, Tomkins plc operated a number of employee share schemes to provide incentives to the Group’s senior executives and other eligible employees. Options and awards made under these schemes were in respect of Tomkins plc’s ordinary shares. Although Tomkins plc’s ordinary shares were denominated in US dollars, they were quoted in sterling on the London Stock Exchange.
A. Share options - SUCCESSOR
Variable Options
The Company has established an equity incentive plan under which the Group’s senior executives were granted options to purchase ordinary ‘B’ shares (‘B Shares’), named theVariable Options. During Fiscal 2011, the compensation expense recognized in relation to the Variable Options was $80.4 million (Q4 2010: $72.2 million).
The Variable Options are divided into three tiers with escalating exercise prices which allow the participants to share in the gains of the equity investors in the Company above certain minimum return thresholds.
The first tier options have an exercise price equal to the price at which the Sponsors subscribed for shares in the Company at the time of the acquisition of Tomkins (the ‘Initial Exercise Price’) increasing at a compound rate of 8% per annum until the exercise date, subject to the additional condition that 3.184% of the options may not be exercised unless the fair market value of the underlying shares exceeds the exercise price of the second tier options and 3.409% of the options may not be exercised unless the fair market value of the underlying shares exceeds the exercise price of the third tier options. The second tier options have an exercise price equal to Initial Exercise Price increasing at a compound rate of 25% per annum until the exercise date (subject, in certain circumstances, to a cap of 2.25 times the Initial Exercise Price), subject to the additional condition that 3.409% of the options may not be exercised unless the fair market value of the underlying shares exceeds the exercise price of the third tier options. The third tier options have an exercise price equal to Initial Exercise Price increasing at a compound rate of 27.5% per annum until the exercise date (subject, in certain circumstances, to a cap of 2.5 times the Initial Exercise Price).
The Variable Options vested as to 25% immediately on grant, with a further 25% vesting on the first three anniversaries of the effective date of the acquisition of Tomkins, subject to the participant’s continuing employment by the Group on the vesting date. Vesting will be accelerated in the event of a change of control or a liquidity event while the participant is still employed by the Group and on a graduated basis for good leavers.
During Fiscal 2011, an additional 1,073 shares were issued to management on the same terms as those granted in Fiscal 2010 with the exception that the Initial Exercise Price was increased to $2,533.70.
The fair value of the Variable Options at their grant date was measured using a Monte Carlo valuation model as follows:
| | | | | | | | |
| | | Fiscal
2011 | | | Q4 2010 | |
Fair value: | | | | | | | | |
– First tier | | $ | 1,500 | | | $ | 1,164 | |
– Second tier | | $ | 1,281 | | | $ | 994 | |
– Third tier | | $ | 1,202 | | | $ | 933 | |
Inputs to the model: | | | | | | | | |
– Share price at the grant date | | $ | 2,534 | | | $ | 1,966 | |
– Exercise price at the grant date | | $ | 2,534 | | | $ | 1,966 | |
– Expected volatility | | | 83.5 | % | | | 83.5 | % |
– Expected option life | | | 5 years | | | | 5 years | |
– Risk-free interest rate | | | 1.37 | % | | | 1.37 | % |
– Expected dividends | | | nil | | | | nil | |
F-64
Pinafore Holdings B.V.
Group Financial Statements
NOTES TO THE CONSOLIDATED FINANCIAL STATEMENTS (CONTINUED)
| 36. | Share-based incentives continued |
A. Share options – SUCCESSOR (continued)
The Monte Carlo valuation model simulates the share price on the exercise date assuming the share price follows geometric Brownian motion. Based on the simulated share price, the model calculates the exercise price in accordance with the rules of the scheme and applies the discount factor to the resulting simulated payoff on exercise of the option. The model is run for a large number of simulations and the fair value of the option is determined as the average payoff on exercise of the option over those simulations.
The Company is an unlisted entity but it was considered that Tomkins plc was a similar listed entity. Expected volatility of the price of the B Shares was therefore determined using the Merton model based on the historical volatility of the market price of Tomkins plc’s ordinary shares over the expected life of the options having made adjustments to reflect the higher leverage ratio of the Company compared with that of Tomkins plc.
The expected life of the options reflects the effects of non-transferability, exercise restrictions and behavioral considerations.
Details of the Variable Options outstanding as at December 31, 2011 were as follows:
| | | | | | | | | | | | | | | | |
| | | Fiscal 2011 | | | Q4 2010 | |
| | | Options
Number | | | Exercise
Price $ | | | Options
Number | | | Exercise
Price $ | |
Outstanding at the beginning of the period | | | | | | | | | | | | | | | | |
– First tier | | | 113,034 | | | $ | 2,002 | | | | — | | | | — | |
– Second tier | | | 37,674 | | | $ | 2,072 | | | | — | | | | — | |
– Third tier | | | 37,685 | | | $ | 2,082 | | | | — | | | | — | |
| | | | | | | | | | | | | | | | |
| | | 188,393 | | | $ | 2,033 | | | | — | | | | — | |
Movements during the period | | | | | | | | | | | | | | | | |
Granted during the period: | | | | | | | | | | | | | | | | |
– First tier | | | 643 | | | $ | 2,534 | | | | 113,034 | | | $ | 2,002 | |
– Second tier | | | 215 | | | $ | 2,534 | | | | 37,674 | | | $ | 2,072 | |
– Third tier | | | 215 | | | $ | 2,534 | | | | 37,685 | | | $ | 2,082 | |
| | | | |
Forfeited during the period: | | | | | | | | | | | | | | | | |
– First tier | | | (1,846 | ) | | $ | 2,146 | | | | — | | | | — | |
– Second tier | | | (616 | ) | | $ | 2,534 | | | | — | | | | — | |
– Third tier | | | (616 | ) | | $ | 2,591 | | | | — | | | | — | |
| | | | |
Outstanding at the end of the period | | | | | | | | | | | | | | | | |
– First tier | | | 111,831 | | | $ | 2,148 | | | | 113,034 | | | $ | 2,002 | |
– Second tier | | | 37,273 | | | $ | 2,534 | | | | 37,674 | | | $ | 2,072 | |
– Third tier | | | 37,284 | | | $ | 2,591 | | | | 37,685 | | | $ | 2,082 | |
| | | | | | | | | | | | | | | | |
| | | 186,388 | | | $ | 2,314 | | | | 188,393 | | | $ | 2,032 | |
| | | | | | | | | | | | | | | | |
| | | | |
Exercisable | | | 89,361 | | | $ | 2,320 | | | | 44,913 | | | $ | 2,033 | |
| | | | | | | | | | | | | | | | |
If the Variable Options remain outstanding but unexercised, they will expire on the tenth anniversary of the grant date. As at December 31, 2011, the Variable Options had a remaining contractual life of 8.75 years.
Replacement Options
On the acquisition of Tomkins, certain executives who are not resident in the US were given the opportunity to cancel their vested awards under the Performance Share Plan (‘PSP’) that was operated by Tomkins Limited in exchange for awards of options, named theReplacement Options, to purchase equity interests in the Company. In the event, Replacement Options over 17,641 B Shares were granted to participating executives. Each Replacement Option has a nominal exercise price and vested immediately on grant. As such, the Replacement Options had a fair value at their grant date that was equal to the fair value of the vested awards under the PSP that they replaced, which was the equivalent of the offer price of 325 pence per ordinary share in Tomkins Limited. Accordingly, the fair value of the Replacement Options granted, which amounted to $34.9 million, was recognized by the Group as part of the consideration paid to acquire Tomkins.
Since the grant date, there has been no change in the number of Replacement Options that are outstanding. If the Replacement Options remain outstanding but unexercised, they will expire on the tenth anniversary of the grant date. As at December 31, 2011, the Replacement Options had a remaining contractual life of 8.75 years.
F-65
Pinafore Holdings B.V.
Group Financial Statements
NOTES TO THE CONSOLIDATED FINANCIAL STATEMENTS (CONTINUED)
| 36. | Share-based incentives continued |
B. Other share awards – SUCCESSOR
Retention Awards
Following the acquisition of Tomkins, awards over 3,648 B Shares, named the Retention Awards, were granted to certain executives. Retention Awards are deferred shares that normally become vested as to one-third of the award on the first three anniversaries of the effective date of the acquisition of Tomkins subject to the participant’s continuing employment by the Group at the vesting date. Vesting will be accelerated in the event of a change of control or a liquidity event while the participant is still employed by the Group, if the holder dies, has his or her employment terminated due to disability or without cause or resigns for good reason.
On the principal assumption that there will be no dividend payments during the vesting period, the fair value on the grant date of the Retention Awards was $1,966. During Fiscal 2011, there were no changes in the number of outstanding awards and the compensation expense recognized in relation to the Retention Awards was $4.5 million (Q4 2010: $0.2 million).
Annual Bonus Incentive Plan (‘ABIP’)
Certain executives participate in the ABIP, a legacy scheme operated by Tomkins, under which each participant receives a bonus which represents a percentage of the ‘bonusable profit’ of the business for which he or she had responsibility. Bonuses are determined based on bonusable profit for the calendar year. Interim payments are made quarterly in June, September and December based on 75% of bonusable profit for the year to date and the balance of the bonus for the year is paid in March of the following year. Senior participants normally receive their bonus as to four-sevenths in cash, one seventh in Bonus Shares and two-sevenths in Deferred Share Rights. Other participants normally receive their bonus as to three-quarters in cash, one twelfth in Bonus Shares and one sixth in Deferred Share Rights. Bonus shares vest immediately on grant. Dividends are paid on the Bonus Shares. Deferred awards do not vest until three years after the end of the quarter to which the bonus relates, subject to the participant’s continuing employment by the Group at the vesting date. If the participant ceases to be employed by the Group, the deferred awards vest on a pro-rata basis. Dividends are not paid on the Deferred Share Rights until they have vested.
During Fiscal 2011, awards were granted over 1,377 B Shares, which represented the share element of bonuses earned under the ABIP during Fiscal 2011. As at December 31, 2011, the Group had not yet issued 809 B Shares over which ABIP awards had been granted.
The fair value of awards made under the ABIP was measured based on the internal valuations of the Company’s B Shares on the respective dates of the awards. The weighted average fair value of awards made under these schemes during Fiscal 2011 was $2,395.10. The compensation expense recognized during Fiscal 2011 in relation to these awards was $3.9 million.
ABIP bonuses payable and accrued during the transitional period between the acquisition of Tomkins and December 31, 2010 were settled wholly in cash.
Other legacy schemes
While most of the awards and options that were outstanding under the employee share schemes that were operated by Tomkins Limited were exercised, settled or replaced at the time of the acquisition of Tomkins, there remained outstanding a number of options over ordinary shares in Tomkins Limited that had vested but had not been exercised by the option holders. Under the terms of the acquisition agreement, these options remain exercisable in accordance with the rules of the relevant schemes. Accordingly, they are recognized by the Group as non-controlling interests in Tomkins Limited measured at their fair value at the acquisition date.
During Fiscal 2011, the majority of the outstanding options over shares in Tomkins Limited were exercised and the Group accordingly purchased $13.1 million of the non-controlling interest. Movements in the number of options outstanding were as follows:
| | | | | | | | | | | | | | | | |
| | | Fiscal 2011 | | | Q4 2010 | |
| | | Options
Number | | | Weighted average
exercise price
Pence | | | Options
Number | | | Weighted average
exercise price
Pence | |
As at the beginning of the period | | | 9,532,628 | | | | 243p | | | | 9,597,537 | | | | 242p | |
Exercised | | | (8,416,400 | ) | | | 325p | | | | (10,590 | ) | | | 218p | |
Expired | | | (1,055,228 | ) | | | 345p | | | | (54,319 | ) | | | 217p | |
| | | | | | | | | | | | | | | | |
As at the end of the period | | | 61,000 | | | | 254p | | | | 9,532,628 | | | | 243p | |
| | | | | | | | | | | | | | | | |
| | | | |
Exercisable as at the end of the period | | | 61,000 | | | | 254p | | | | 9,532,628 | | | | 243p | |
| | | | | | | | | | | | | | | | |
At the time of the acquisition of Tomkins, options over 2,865,528 ordinary shares in Tomkins Limited were outstanding under the Tomkins Sharesave Scheme.
In view of the fact that certain participants would lose preferential tax treatment as a consequence of the acquisition of Tomkins and/or would not be able to exercise their options in full at the time of the acquisition, the Group agreed to make an ex gratia payment to those participants who chose to exercise their options conditionally on the acquisition becoming effective of an amount equal to the aggregate of (i) an amount which, after deduction of income tax and national insurance contributions, equaled the income tax, if any, payable on the exercise of such options and (ii) an amount which, after deduction of income tax and national insurance contributions, equaled the additional profit which the participant would have received if the participant had been able to exercise his or her options in full at the date of acquisition. In the event, the ex gratia payment amounted to $11.3 million, of which $2.4 million was recognized by the Group as part of the consideration paid to acquire Tomkins and $8.9 million was recognized as an expense within acquisition costs.
F-66
Pinafore Holdings B.V.
Group Financial Statements
NOTES TO THE CONSOLIDATED FINANCIAL STATEMENTS (CONTINUED)
C. Share options – PREDECESSOR
Subsequent to the acquisition, there remained 64,909 options outstanding under the Tomkins Sharesave Scheme, which either had been exercised or had expired as at December 31, 2010.
Options were granted from time to time under the Tomkins Sharesave Scheme, which was restricted to employees who are resident for tax purposes in the UK. It offered eligible employees the option to buy ordinary shares in Tomkins plc after a period of three, five or seven years, funded from the proceeds of a savings contract to which employees contributed up to £250 per month.
Vested options remained outstanding under Tomkins plc’s executive share option schemes which lapsed for the purpose of new awards in 2005. The final unvested options under these schemes vested during 2007.
In 9M 2010, the compensation expense in respect of share options was $0.7 million, of which $0.5 million was accelerated due to the early vesting of options on the acquisition of Tomkins. In Fiscal 2009, the compensation expense in respect of share options was $1.0 million.
Changes in the total number of share options outstanding during the period were as follows:
| | | | | | | | | | | | | | | | |
| | | 9M 2010 | | | Fiscal 2009 | |
| | | Options
Number | | | Weighted average
exercise price
Pence | | | Options
Number | | | Weighted average
exercise price
Pence | |
Outstanding at the beginning of the period | | | 17,248,301 | | | | 224.24 | | | | 18,131,583 | | | | 238.60 | |
Granted during the period | | | 308,264 | | | | 188.56 | | | | 2,228,492 | | | | 96.00 | |
Cancelled during the period | | | (8,674 | ) | | | 280.94 | | | | (634,716 | ) | | | 157.70 | |
Forfeited during the period | | | (49,951 | ) | | | 115.39 | | | | (34,770 | ) | | | 202.88 | |
Exercised during the period | | | (4,196,081 | ) | | | 220.95 | | | | (45,000 | ) | | | 170.50 | |
Lapsed during the period | | | (1,421,790 | ) | | | 252.81 | | | | (2,397,288 | ) | | | 232.61 | |
Settled | | | (1,860,532 | ) | | | 114.36 | | | | — | | | | — | |
| | | | | | | | | | | | | | | | |
Outstanding at the end of the period | | | 10,019,537 | | | | 241.36 | | | | 17,248,301 | | | | 224.24 | |
| | | | | | | | | | | | | | | | |
| | | | |
Exercisable at the end of the period | | | 10,019,537 | | | | 241.36 | | | | 14,544,405 | | | | 245.19 | |
| | | | | | | | | | | | | | | | |
On the dates on which options were exercised during 9M 2010, the weighted average market price of Tomkins plc’s ordinary shares was 317.52p per share (Fiscal 2009: 178.90p per share).
The fair value of options granted under the Sharesave Scheme was measured at their respective grant dates using the Black-Scholes option pricing formula based on the following assumptions:
| | | | | | | | |
| | | 9M 2010 | | | Fiscal 2009 | |
Weighted average fair value | | | 97.96p | | | | 68.34p | |
Weighted average assumptions: | | | | | | | | |
– Share price | | | 247.40p | | | | 161.75p | |
– Exercise price | | | 188.56p | | | | 96.00p | |
– Expected volatility | | | 40.34 | % | | | 33.44 | % |
– Expected option life | | | 4.31 years | | | | 4.47 years | |
– Risk-free interest rate | | | 2.60 | % | | | 3.76 | % |
– Expected dividends | | | 6.53p | | | | 6.25p | |
Expected volatility was determined based on the historical volatility of the market price of Tomkins plc’s ordinary shares over the expected life of the options. Adjustments have been made to the expected life used in the model to reflect the effects of non-transferability, exercise restrictions and behavioral considerations.
D. Other share awards – PREDECESSOR
The Group’s principal share-based compensation arrangements were the ABIP and the PSP. Both were restricted to the Group’s senior executives. In 9M 2010, the compensation expense in respect of awards under these schemes was $20.5 million, of which $13.0 million was accelerated due to the early vesting or lapsing of awards on the acquisition of Tomkins. In Fiscal 2009, the compensation expense in respect of these schemes was $10.3 million.
ABIP
Certain executives of Tomkins participated in the ABIP (see part B above). During Fiscal 2009, awards were granted over 999,108 ordinary shares under the ABIP.
In Fiscal 2009, the Interim Bonus Plan (‘IBP’) was introduced as a temporary, one-year substitute for the ABIP. The IBP differed from the ABIP only in that bonuses accruing under the plan were based on the trading cash flow of the business for which the participants had responsibility and on the attainment of strategic achievement milestones that were set for each of the participants and the quarterly phasing of awards was suspended. In March 2010, awards were granted over 1,748,274 ordinary shares, which represented the share element of bonuses earned under the IBP during Fiscal 2009.
The ABIP was reinstated for 2010. In June 2010, awards were granted over 482,749 ordinary shares, which represented the share element of bonuses earned under the ABIP in the first quarter of 2010. As a consequence of the acquisition of Tomkins, the share-based element of the ABIP was suspended and bonuses earned in the second and third quarters of 2010 were settled entirely in cash.
F-67
Pinafore Holdings B.V.
Group Financial Statements
NOTES TO THE CONSOLIDATED FINANCIAL STATEMENTS (CONTINUED)
| 36. | Share-based incentives continued |
D. Other share awards – PREDECESSOR (continued)
The fair value of awards made under the ABIP and the IBP was measured based on the market price of the Tomkins plc’s ordinary shares on the date of the award. Where the awards did not attract dividends during the vesting period, the market price was reduced by the present value of the dividends that were expected to be paid during the expected life of the awards. The weighted average fair value of awards made under these schemes during 9M 2010 was 219.8p (Fiscal 2009: 130.46p).
PSP
The PSP provided awards of shares which vested after a period of three years, conditional on the Group’s total shareholder return relative to its cost of equity over the vesting period and the participant’s continued employment with the Group. During 9M 2010, awards were granted over 5,558,211 ordinary shares under the PSP (Fiscal 2009: 6,894,193 ordinary shares).
The fair value of awards made under the PSP was measured at their respective grant dates using a Monte Carlo valuation model based on the following assumptions:
| | | | | | | | |
| | | 9M 2010 | | | Fiscal 2009 | |
Weighted average fair value | | | 63.70p | | | | 41.92p | |
Weighted average assumptions: | | | | | | | | |
– Expected volatility | | | 48.00 | % | | | 45.36 | % |
– Expected option life | | | 3.00 years | | | | 3.00 years | |
– Risk-free interest rate | | | 1.90 | % | | | 2.00 | % |
– Dividend yield | | | 3.23 | % | | | 4.87 | % |
Expected volatility was determined based on the historical volatility of the market price of Tomkins plc’s ordinary shares over the expected life of the awards.
Movements in the net deferred tax assets and (liabilities) recognized by the Group were as follows:
| | | | | | | | | | | | | | | | | | | | | | | | | | | | | | | | |
| | | Post-
employment
benefits
$ million | | | Tax
losses
$ million | | | Net
investment
in
subsidiaries
$ million | | | Accrued
expenses
$ million | | | Long-
lived
assets
$ million | | | Inventories
$ million | | | Other
items
$ million | | | Total
$ million | |
SUCCESSOR | | | | | | | | | | | | | | | | | | | | | | | | | | | | | | | | |
As at September 25, 2010 | | | — | | | | — | | | | — | | | | — | | | | — | | | | — | | | | — | | | | — | |
Acquisition of subsidiaries | | | 99.3 | | | | 37.8 | | | | (77.8 | ) | | | 41.2 | | | | (863.8 | ) | | | (72.3 | ) | | | 23.3 | | | | (812.3 | ) |
(Charge)/credit to profit or loss | | | (4.1 | ) | | | (4.9 | ) | | | (6.8 | ) | | | 2.5 | | | | 19.3 | | | | 44.3 | | | | (0.3 | ) | | | 50.0 | |
Charged outside profit or loss | | | (15.8 | ) | | | — | | | | — | | | | — | | | | — | | | | — | | | | (0.1 | ) | | | (15.9 | ) |
Currency translation differences | | | 0.1 | | | | (0.1 | ) | | | — | | | | 0.3 | | | | (2.3 | ) | | | 0.3 | | | | — | | | | (1.7 | ) |
| | | | | | | | | | | | | | | | | | | | | | | | | | | | | | | | |
As at December 31, 2010 | | | 79.5 | | | | 32.8 | | | | (84.6 | ) | | | 44.0 | | | | (846.8 | ) | | | (27.7 | ) | | | 22.9 | | | | (779.9 | ) |
Purchase accounting adjustments (see note 20) | | | — | | | | — | | | | — | | | | 5.0 | | | �� | (7.0 | ) | | | (0.5 | ) | | | 27.5 | | | | 25.0 | |
(Charge)/credit to profit or loss | | | (27.0 | ) | | | 32.2 | | | | (2.1 | ) | | | (2.9 | ) | | | 61.6 | | | | (7.6 | ) | | | 6.1 | | | | 60.3 | |
Disposal of subsidiaries | | | (0.2 | ) | | | — | | | | — | | | | (1.3 | ) | | | 19.9 | | | | (0.9 | ) | | | (1.7 | ) | | | 15.8 | |
Charged outside profit or loss | | | (3.6 | ) | | | 0.1 | | | | 0.3 | | | | — | | | | — | | | | (0.2 | ) | | | 0.5 | | | | (2.9 | ) |
Currency translation differences | | | 0.1 | | | | (0.2 | ) | | | — | | | | (1.0 | ) | | | 3.5 | | | | (0.2 | ) | | | (0.3 | ) | | | 1.9 | |
| | | | | | | | | | | | | | | | | | | | | | | | | | | | | | | | |
As at December 31, 2011 | | | 48.8 | | | | 64.9 | | | | (86.4 | ) | | | 43.8 | | | | (768.8 | ) | | | (37.1 | ) | | | 55.0 | | | | (679.8 | ) |
| | | | | | | | | | | | | | | | | | | | | | | | | | | | | | | | |
| | | | | | | | |
PREDECESSOR | | | | | | | | | | | | | | | | | | | | | | | | | | | | | | | | |
As at January 2, 2010 | | | 97.2 | | | | 16.5 | | | | (5.3 | ) | | | 42.9 | | | | (101.1 | ) | | | (29.0 | ) | | | 36.4 | | | | 57.6 | |
Acquisition of subsidiaries | | | — | | | | — | | | | — | | | | 0.1 | | | | (2.6 | ) | | | 0.1 | | | | — | | | | (2.4 | ) |
(Charge)/credit to profit or loss | | | (7.4 | ) | | | 1.0 | | | | 2.2 | | | | (2.5 | ) | | | 0.4 | | | | (3.1 | ) | | | 3.1 | | | | (6.3 | ) |
Credited outside profit or loss | | | — | | | | — | | | | — | | | | — | | | | — | | | | — | | | | 4.8 | | | | 4.8 | |
Currency translation differences | | | 0.3 | | | | (0.7 | ) | | | — | | | | 0.2 | | | | 0.2 | | | | (0.2 | ) | | | 0.1 | | | | (0.1 | ) |
| | | | | | | | | | | | | | | | | | | | | | | | | | | | | | | | |
As at September 24, 2010 | | | 90.1 | | | | 16.8 | | | | (3.1 | ) | | | 40.7 | | | | (103.1 | ) | | | (32.2 | ) | | | 44.4 | | | | 53.6 | |
| | | | | | | | | | | | | | | | | | | | | | | | | | | | | | | | |
F-68
Pinafore Holdings B.V.
Group Financial Statements
NOTES TO THE CONSOLIDATED FINANCIAL STATEMENTS (CONTINUED)
| 37. | Deferred tax continued |
Deferred tax assets and liabilities presented in the Group’s balance sheet are as follows:
| | | | | | | | |
| | | As at
December 31,
2011
$ million | | | As at
December 31,
2010
$ million | |
Deferred tax assets: | | | | | | | | |
– Ongoing businesses | | | 7.9 | | | | 9.6 | |
– Businesses to be sold (see note 29) | | | — | | | | 3.8 | |
| | | | | | | | |
| | | 7.9 | | | | 13.4 | |
Deferred tax liabilities: | | | | | | | | |
– Ongoing businesses | | | (650.9 | ) | | | (793.3 | ) |
– Businesses to be sold (see note 29) | | | (36.8 | ) | | | — | |
| | | | | | | | |
| | | (687.7 | ) | | | (793.3 | ) |
| | | | | | | | |
| | | (679.8 | ) | | | (779.9 | ) |
| | | | | | | | |
As at December 31, 2011:
| • | | the Group had operating tax losses amounting to $2,250.3 million, of which $1,708.6 million can be carried forward indefinitely and $541.7 million have expiry dates between 2012 and 2031 (the Group recognized a deferred tax asset of $64.6 million in respect of these losses); |
| • | | the Group had capital tax losses amounting to $794.6 million, of which $434.1 million can be carried forward indefinitely and $360.5 million expire between 2012 and 2013. The Group recognized a deferred tax asset of $0.3 million in respect of these losses); |
| • | | the Group had foreign tax credits amounting to $8.3 million, which expire between 2015 and 2021 (the Group recognized no deferred tax asset in respect of these tax credits); and |
| • | | the Group had other tax credits amounting to $47.0 million, of which $19.6 million can be carried forward indefinitely and $27.4 million expire between 2013 and 2027 (the Group recognized a deferred tax asset of $21.3 million in respect of these tax credits). |
As at December 31, 2011, the aggregate amount of temporary differences associated with investments in subsidiaries for which deferred tax liabilities have not been recognized was $1,421.5 million (December 31, 2010: $1,375.0 million).
| | | | | | | | | | | | | | | | | | | | | | | | | | | | |
| | | Restructuring
costs
$ million | | | Environmental
remediation
$ million | | | Workers’
compensation
$ million | | | Warranty
provisions
$ million | | | Product
liability
provisions
$ million | | | Other
provisions
$ million | | | Total
$ million | |
SUCCESSOR | | | | | | | | | | | | | | | | | | | | | | | | | | | | |
As at September 25, 2010 | | | — | | | | — | | | | — | | | | — | | | | — | | | | — | | | | — | |
Acquisition of subsidiaries | | | 39.5 | | | | 12.5 | | | | 20.4 | | | | 12.2 | | | | 9.5 | | | | 9.1 | | | | 103.2 | |
Charge for the period | | | 0.1 | | | | 0.8 | | | | 4.4 | | | | 2.7 | | | | 1.8 | | | | 0.1 | | | | 9.9 | |
Utilized during the period | | | (10.4 | ) | | | (1.1 | ) | | | (2.9 | ) | | | (2.3 | ) | | | (3.0 | ) | | | — | | | | (19.7 | ) |
Released during the period | | | (1.8 | ) | | | (0.3 | ) | | | (0.3 | ) | | | (0.5 | ) | | | — | | | | — | | | | (2.9 | ) |
Foreign currency translation | | | 0.4 | | | | 0.1 | | | | — | | | | — | | | | — | | | | — | | | | 0.5 | |
| | | | | | | | | | | | | | | | | | | | | | | | | | | | |
As at December 31, 2010 | | | 27.8 | | | | 12.0 | | | | 21.6 | | | | 12.1 | | | | 8.3 | | | | 9.2 | | | | 91.0 | |
Purchase accounting adjustments (see note 20) | | | — | | | | (1.5 | ) | | | (0.3 | ) | | | — | | | | 9.8 | | | | (1.0 | ) | | | 7.0 | |
Charge for the period | | | 5.3 | | | | 3.1 | | | | 10.6 | | | | 10.4 | | | | 8.1 | | | | 0.3 | | | | 37.8 | |
Utilized during the period | | | (13.9 | ) | | | (2.6 | ) | | | (10.9 | ) | | | (8.7 | ) | | | (12.5 | ) | | | — | | | | (48.6 | ) |
Released during the period | | | (11.9 | ) | | | (0.6 | ) | | | (1.2 | ) | | | (1.3 | ) | | | (0.1 | ) | | | (4.2 | ) | | | (19.3 | ) |
Disposal of subsidiaries | | | — | | | | — | | | | (0.8 | ) | | | (0.6 | ) | | | — | | | | — | | | | (1.4 | ) |
Foreign currency translation | | | 0.3 | | | | — | | | | (0.1 | ) | | | (0.1 | ) | | | — | | | | (0.6 | ) | | | (0.5 | ) |
| | | | | | | | | | | | | | | | | | | | | | | | | | | | |
As at December 31, 2011 | | | 7.6 | | | | 10.4 | | | | 18.9 | | | | 11.8 | | | | 13.6 | | | | 3.7 | | | | 66.0 | |
| | | | | | | | | | | | | | | | | | | | | | | | | | | | |
| | | | | | | |
PREDECESSOR | | | | | | | | | | | | | | | | | | | | | | | | | | | | |
As at January 2, 2010 | | | 68.9 | | | | 6.5 | | | | 22.0 | | | | 11.3 | | | | 10.0 | | | | 0.8 | | | | 119.5 | |
Charge for the period | | | 8.5 | | | | 2.0 | | | | 9.2 | | | | 7.2 | | | | 7.4 | | | | 0.1 | | | | 34.4 | |
Utilized during the period | | | (30.3 | ) | | | (2.1 | ) | | | (10.2 | ) | | | (4.5 | ) | | | (9.4 | ) | | | — | | | | (56.5 | ) |
Released during the period | | | (5.2 | ) | | | — | | | | (0.9 | ) | | | (1.8 | ) | | | (0.1 | ) | | | — | | | | (8.0 | ) |
Foreign currency translation | | | (2.4 | ) | | | — | | | | — | | | | — | | | | (0.2 | ) | | | — | | | | (2.6 | ) |
| | | | | | | | | | | | | | | | | | | | | | | | | | | | |
As at September 24, 2010 | | | 39.5 | | | | 6.4 | | | | 20.1 | | | | 12.2 | | | | 7.7 | | | | 0.9 | | | | 86.8 | |
| | | | | | | | | | | | | | | | | | | | | | | | | | | | |
F-69
Pinafore Holdings B.V.
Group Financial Statements
NOTES TO THE CONSOLIDATED FINANCIAL STATEMENTS (CONTINUED)
Provisions are presented in the Group’s balance sheet as follows:
| | | | | | | | |
| | | As at
December 31,
2011
$ million | | | As at
December 31,
2010
$ million | |
Ongoing businesses: | | | | | | | | |
– Current liabilities | | | 33.9 | | | | 65.6 | |
– Non-current liabilities | | | 25.3 | | | | 24.7 | |
| | | | | | | | |
| | | 59.2 | | | | 90.3 | |
Businesses to be sold (see note 29) | | | 6.8 | | | | 0.7 | |
| | | | | | | | |
| | | 66.0 | | | | 91.0 | |
| | | | | | | | |
Provisions for restructuring costs are expected largely to be utilized during 2012. The majority of the environmental provisions and product liability provisions are currently expected to be utilized during 2013 and 2014. Other provisions consist primarily of legal and insurance provisions.
Further information on certain of the Group’s provisions is presented in note 4.
| 39. | Share capital and reserves |
A. Authorized and issued, fully paid shares of Pinafore Holdings B.V.
| | | | | | | | | | | | | | | | |
| SUCCESSOR | | Preferred ‘A’ shares of
€3,600 each | | | Ordinary ‘B’ shares of
€0.01 each | |
| | | Authorized
Number of
shares | | | Issued
Number of
shares | | | Authorized
Number of
shares | | | Issued
Number of
shares | |
As at December 31, 2010 | | | 10 | | | | 2 | | | | 5,400,000 | | | | 1,080,000 | |
Issue of shares | | | — | | | | — | | | | — | | | | 10,037 | |
| | | | | | | | | | | | | | | | |
As at December 31, 2011 | | | 10 | | | | 2 | | | | 5,400,000 | | | | 1,090,037 | |
| | | | | | | | | | | | | | | | |
Share capital
The Company’s authorized share capital consists of two classes of shares: the preferred ‘A’ shares of €3,600 each (‘A Shares’); and the B Shares of one eurocent (€0.01) each.
Share capital represents the nominal value of the shares issued.
On September 1, 2010, the date on which the Company was incorporated, two A Shares and 1,080,000 B Shares were issued for cash at their nominal value. On September 27, 2010, the holder of the B Shares subscribed an additional amount of €1,578.3 million by way of a contribution to share premium. The Company used the amount of the contribution to subscribe for additional shares in its wholly-owned subsidiary, Tomkins Acquisitions Limited, which, in turn, used the contribution to partially fund the acquisition of Tomkins.
Shareholders have no entitlement to share in the profits of the Company, except for dividends that have been declared and in the event of its liquidation. Dividends may be paid out of profits allocated to the Shareholders and from their respective share premium accounts. Any profit earned in a financial year is allocated to the Shareholders after the adoption of the annual accounts for the financial year at a General Meeting of the Shareholders. Each of the A Shares is entitled to a cumulative profit allocation of €1,000 in respect of the financial year. Any profit for the financial year remaining after the allocation of profit to the A Shares is allocated to the B Shares on a pro rata basis. Dividends may be declared only on a resolution of the Shareholders in General Meeting and may not exceed the amount of the Company’s distributable reserves as determined in accordance with Dutch law (which currently comprises the excess of the Company’s net assets over its issued share capital).
Shareholders have the right to attend, and vote at, general meetings of the Company or to appoint a proxy to attend and vote at such meetings on their behalf. A General Meeting of the Shareholders shall take place at least once each year and no later than six months after the end of the previous financial year. Each A Share has the right to cast 360,000 votes and each ‘B’ share has the right to cast one vote. Resolutions of a General Meeting may generally only be adopted with a majority of the votes cast. In the event of a tie of votes, the resolution shall be rejected. Resolutions of a General Meeting may also be adopted in writing without recourse to a meeting, provided they are adopted by a unanimous vote of all Shareholders.
Shares issued
Following the acquisition of Tomkins, certain members of the Tomkins management team invested in the Group by way of subscribing for B Shares. In total, the participating members of the Tomkins management team subscribed for 9,097 B Shares for the Euro equivalent of $17.6 million in cash. As at December 31, 2010, the shares had not yet been registered in the names of the participants. During Fiscal 2011, as a result of changes within the management team, cash invested of $0.7 million was returned to certain members of management who had previously subscribed for B Shares. As a result, during Fiscal 2011, 8,642 B Shares were issued in the names of the participants for $16.9 million.
Also included in shares issued during the year were share issues made to meet the Group’s obligations under its ABIP scheme.
Own shares
As a result of the changes in the management team during Fiscal 2011, the Company had bought back 103 shares from management for a total consideration of $0.3 million. These shares may be transferred to another shareholder as part of the next tranche of awards under the ABIP scheme.
F-70
Pinafore Holdings B.V.
Group Financial Statements
NOTES TO THE CONSOLIDATED FINANCIAL STATEMENTS (CONTINUED)
| 39. | Share capital and reserves continued |
A. Authorized and issued, fully paid shares of Pinafore Holdings B.V. (continued)
Share premium account
The share premium accounts record the difference between the nominal value of shares issued and the fair value of the consideration received. The Company maintains two share premium accounts so as to record the premium on the issue of the A Shares separately from the premium on the issue of the B Shares. Provided the Company has sufficient distributable profits as determined in accordance with Dutch law, the holders of the A Shares and the B Shares may resolve in a General Meeting of their respective classes of shares to pay dividends from their respective share premium accounts.
B. Authorized and issued, fully paid shares of Tomkins plc
| | | | | | | | | | | | | | | | |
| PREDECESSOR | | Ordinary shares
of 9c each | | | Deferred shares
of £1 each | |
| | | Authorized
Number of
shares | | | Issued
Number of
shares | | | Authorized
Number of
shares | | | Issued
Number of
shares | |
As at January 3, 2009 | | | 1,585,164,220 | | | | 884,151,772 | | | | 50,000 | | | | 50,000 | |
| | | | |
Fiscal 2009 | | | | | | | | | | | | | | | | |
Shares issued during the period: | | | | | | | | | | | | | | | | |
– Exercise of employee share options | | | — | | | | 45,000 | | | | — | | | | — | |
Cancellation of deferred shares | | | — | | | | — | | | | (50,000 | ) | | | (50,000 | ) |
| | | | | | | | | | | | | | | | |
As at January 2, 2010 | | | 1,585,164,220 | | | | 884,196,772 | | | | — | | | | — | |
| | | | |
9M 2010 | | | | | | | | | | | | | | | | |
Shares issued during the period: | | | | | | | | | | | | | | | | |
– Exercise of employee share options | | | — | | | | 4,960,521 | | | | — | | | | — | |
| | | | | | | | | | | | | | | | |
As at September 24, 2010 | | | 1,585,164,220 | | | | 889,157,293 | | | | — | | | | — | |
| | | | | | | | | | | | | | | | |
Ordinary shares
On 22 May 2008, the Tomkins plc’s ordinary shares were redenominated from sterling to US dollars. The redenomination did not affect the rights of the holders of ordinary shares.
Ordinary shareholders have no entitlement to share in the profits of Tomkins plc, except for dividends that have been declared and in the event of its liquidation.
Ordinary shareholders have the right to attend, and vote at, general meetings of Tomkins plc or to appoint a proxy to attend and vote at such meetings on their behalf. Ordinary shareholders have one vote for every share held.
Ordinary share capital represents the nominal value of ordinary shares issued.
Deferred shares
When Tomkins plc redenominated its ordinary shares from sterling to US dollars, it was required by law to have a minimum share capital of £50,000 denominated in sterling. The deferred shares were issued to meet this requirement, which was removed on the implementation of section 542 of the Companies Act 2006 on October 1, 2009. Accordingly, Tomkins plc bought back and cancelled the deferred shares on December 16, 2009 and transferred the nominal amount of the shares to the capital redemption reserve in accordance with the applicable capital maintenance rules.
The deferred shares were not listed on any investment exchange and had extremely limited rights such that they effectively had no value.
Share premium account
The share premium account records the difference between the nominal value of shares issued and the fair value of the consideration received. The share premium account is not distributable but may be used for certain purposes specified by UK law, including to write off expenses on any issue of shares or debentures and to pay up fully paid bonus shares. The share premium account may be reduced by special resolution of Tomkins Limited’s shareholder and with court approval.
Capital redemption reserve
The capital redemption reserve records the cost of shares purchased by Tomkins Limited for cancellation or redeemed in excess of the proceeds of any fresh issue of shares made specifically to fund the purchase or redemption. The capital redemption reserve is not distributable but may be reduced by special resolution of Tomkins Limited’s shareholder and with court approval.
Own shares
Own shares represented the cost of ordinary shares in Tomkins plc that were acquired to meet the Group’s expected obligations under employee share schemes. Dividends relating to own shares held were waived with the exception of those that are payable to participants in the relevant schemes.
As at January 2, 2010, the Group held 2,543,194 own shares with a market value of $7.9 million (of which 904,632 shares were held in trust and 1,638,562 shares were held in treasury).
F-71
Pinafore Holdings B.V.
Group Financial Statements
NOTES TO THE CONSOLIDATED FINANCIAL STATEMENTS (CONTINUED)
| 40. | Analysis of other comprehensive income/(loss) |
| | | | | | | | | | | | | | | | | | | | | | | | |
SUCCESSOR | | Currency
translation
reserve
$ million | | | Available-for-sale
reserve
$ million | | | Accumulated
deficit
$ million | | | Total
shareholders’
equity
$ million | | | Non-
controlling
interests
$ million | | | Total
equity
$ million | |
Fiscal 2011 | | | | | | | | | | | | | | | | | | | | | | | | |
Foreign currency translation: | | | | | | | | | | | | | | | | | | | | | | | | |
– Currency translation differences on foreign operations: | | | | | | | | | | | | | | | | | | | | | | | | |
Subsidiaries | | | (67.0 | ) | | | — | | | | — | | | | (67.0 | ) | | | 4.5 | | | | (62.5 | ) |
Associates | | | 0.6 | | | | — | | | | — | | | | 0.6 | | | | — | | | | 0.6 | |
– Gain on net investment hedges | | | 3.6 | | | | — | | | | — | | | | 3.6 | | | | — | | | | 3.6 | |
| | | | | | | | | | | | | | | | | | | | | | | | |
| | | (62.8 | ) | | | — | | | | — | | | | (62.8 | ) | | | 4.5 | | | | (58.3 | ) |
Available-for-sale investments: | | | | | | | | | | | | | | | | | | | | | | | | |
– Unrealized loss arising in the period | | | — | | | | (0.2 | ) | | | — | | | | (0.2 | ) | | | (0.2 | ) | | | (0.4 | ) |
| | | | | | | | | | | | | | | | | | | | | | | | |
| | | — | | | | (0.2 | ) | | | — | | | | (0.2 | ) | | | (0.2 | ) | | | (0.4 | ) |
Post-employment benefits: | | | | | | | | | | | | | | | | | | | | | | | | |
– Net actuarial gain/(loss) | | | — | | | | — | | | | 34.5 | | | | 34.5 | | | | (1.1 | ) | | | 33.4 | |
– Effect of the asset ceiling | | | — | | | | — | | | | (37.8 | ) | | | (37.8 | ) | | | — | | | | (37.8 | ) |
| | | | | | | | | | | | | | | | | | | | | | | | |
| | | — | | | | — | | | | (3.3 | ) | | | (3.3 | ) | | | (1.1 | ) | | | (4.4 | ) |
| | | | | | | | | | | | | | | | | | | | | | | | |
Other comprehensive (loss)/income before tax | | | (62.8 | ) | | | (0.2 | ) | | | (3.3 | ) | | | (66.3 | ) | | | 3.2 | | | | (63.1 | ) |
Income tax (expense)/benefit | | | (0.8 | ) | | | 0.1 | | | | (4.0 | ) | | | (4.7 | ) | | | 0.5 | | | | (4.2 | ) |
| | | | | | | | | | | | | | | | | | | | | | | | |
Other comprehensive (loss)/income | | | (63.6 | ) | | | (0.1 | ) | | | (7.3 | ) | | | (71.0 | ) | | | 3.7 | | | | (67.3 | ) |
| | | | | | | | | | | | | | | | | | | | | | | | |
| | | | | | |
Q4 2010 | | | | | | | | | | | | | | | | | | | | | | | | |
Foreign currency translation: | | | | | | | | | | | | | | | | | | | | | | | | |
– Currency translation differences on foreign operations: | | | | | | | | | | | | | | | | | | | | | | | | |
Subsidiaries | | | 18.4 | | | | — | | | | — | | | | 18.4 | | | | 5.5 | | | | 23.9 | |
Associates | | | 0.3 | | | | — | | | | — | | | | 0.3 | | | | — | | | | 0.3 | |
– Loss on net investment hedges | | | (2.5 | ) | | | — | | | | — | | | | (2.5 | ) | | | — | | | | (2.5 | ) |
| | | | | | | | | | | | | | | | | | | | | | | | |
| | | 16.2 | | | | — | | | | — | | | | 16.2 | | | | 5.5 | | | | 21.7 | |
Available-for-sale investments: | | | | | | | | | | | | | | | | | | | | | | | | |
– Unrealized gain arising in the period | | | — | | | | 0.1 | | | | — | | | | 0.1 | | | | 0.1 | | | | 0.2 | |
| | | | | | | | | | | | | | | | | | | | | | | | |
| | | — | | | | 0.1 | | | | — | | | | 0.1 | | | | 0.1 | | | | 0.2 | |
Post-employment benefits: | | | | | | | | | | | | | | | | | | | | | | | | |
– Net actuarial gain | | | — | | | | — | | | | 69.7 | | | | 69.7 | | | | 0.4 | | | | 70.1 | |
– Effect of the asset ceiling | | | — | | | | — | | | | (20.2 | ) | | | (20.2 | ) | | | — | | | | (20.2 | ) |
| | | | | | | | | | | | | | | | | | | | | | | | |
| | | — | | | | — | | | | 49.5 | | | | 49.5 | | | | 0.4 | | | | 49.9 | |
| | | | | | | | | | | | | | | | | | | | | | | | |
Other comprehensive income before tax | | | 16.2 | | | | 0.1 | | | | 49.5 | | | | 65.8 | | | | 6.0 | | | | 71.8 | |
Income tax expense | | | — | | | | (0.1 | ) | | | (15.7 | ) | | | (15.8 | ) | | | (0.1 | ) | | | (15.9 | ) |
| | | | | | | | | | | | | | | | | | | | | | | | |
Other comprehensive income | | | 16.2 | | | | — | | | | 33.8 | | | | 50.0 | | | | 5.9 | | | | 55.9 | |
| | | | | | | | | | | | | | | | | | | | | | | | |
F-72
Pinafore Holdings B.V.
Group Financial Statements
NOTES TO THE CONSOLIDATED FINANCIAL STATEMENTS (CONTINUED)
| 40. | Analysis of other comprehensive income/(loss) continued |
| | | | | | | | | | | | | | | | | | | | | | | | |
PREDECESSOR | | Currency
translation
reserve
$ million | | | Available-for-sale
reserve
$ million | | | Accumulated
deficit
$ million | | | Total
shareholders’
equity
$ million | | | Non-
controlling
interests
$ million | | | Total
equity
$ million | |
9M 2010 | | | | | | | | | | | | | | | | | | | | | | | | |
Foreign currency translation: | | | | | | | | | | | | | | | | | | | | | | | | |
– Currency translation differences on foreign operations: | | | | | | | | | | | | | | | | | | | | | | | | |
Subsidiaries | | | 2.0 | | | | — | | | | — | | | | 2.0 | | | | 5.3 | | | | 7.3 | |
Associates | | | 0.6 | | | | — | | | | — | | | | 0.6 | | | | — | | | | 0.6 | |
– Gain on net investment hedges | | | 0.5 | | | | — | | | | — | | | | 0.5 | | | | — | | | | 0.5 | |
| | | | | | | | | | | | | | | | | | | | | | | | |
| | | 3.1 | | | | — | | | | — | | | | 3.1 | | | | 5.3 | | | | 8.4 | |
Available-for-sale investments: | | | | | | | | | | | | | | | | | | | | | | | | |
– Unrealized loss arising in the period | | | — | | | | (0.1 | ) | | | — | | | | (0.1 | ) | | | — | | | | (0.1 | ) |
| | | | | | | | | | | | | | | | | | | | | | | | |
| | | — | | | | (0.1 | ) | | | — | | | | (0.1 | ) | | | — | | | | (0.1 | ) |
Post-employment benefits: | | | | | | | | | | | | | | | | | | | | | | | | |
– Net actuarial loss | | | — | | | | — | | | | (30.8 | ) | | | (30.8 | ) | | | (0.5 | ) | | | (31.3 | ) |
– Effect of the asset ceiling | | | — | | | | — | | | | 0.3 | | | | 0.3 | | | | — | | | | 0.3 | |
| | | | | | | | | | | | | | | | | | | | | | | | |
| | | — | | | | — | | | | (30.5 | ) | | | (30.5 | ) | | | (0.5 | ) | | | (31.0 | ) |
| | | | | | | | | | | | | | | | | | | | | | | | |
Other comprehensive income/(loss) before tax | | | 3.1 | | | | (0.1 | ) | | | (30.5 | ) | | | (27.5 | ) | | | 4.8 | | | | (22.7 | ) |
Income tax benefit | | | — | | | | — | | | | 0.6 | | | | 0.6 | | | | 0.3 | | | | 0.9 | |
| | | | | | | | | | | | | | | | | | | | | | | | |
Other comprehensive income/(loss) | | | 3.1 | | | | (0.1 | ) | | | (29.9 | ) | | | (26.9 | ) | | | 5.1 | | | | (21.8 | ) |
| | | | | | | | | | | | | | | | | | | | | | | | |
| | | | | | |
Fiscal 2009 | | | | | | | | | | | | | | | | | | | | | | | | |
Foreign currency translation: | | | | | | | | | | | | | | | | | | | | | | | | |
– Currency translation differences on foreign operations: | | | | | | | | | | | | | | | | | | | | | | | | |
Subsidiaries | | | 81.5 | | | | — | | | | — | | | | 81.5 | | | | 2.4 | | | | 83.9 | |
Associates | | | (1.6 | ) | | | — | | | | — | | | | (1.6 | ) | | | — | | | | (1.6 | ) |
– Loss on net investment hedges | | | (3.1 | ) | | | — | | | | — | | | | (3.1 | ) | | | — | | | | (3.1 | ) |
| | | | | | | | | | | | | | | | | | | | | | | | |
| | | 76.8 | | | | — | | | | — | | | | 76.8 | | | | 2.4 | | | | 79.2 | |
Available-for-sale investments: | | | | | | | | | | | | | | | | | | | | | | | | |
– Unrealized gain arising in the period | | | — | | | | 0.2 | | | | — | | | | 0.2 | | | | 0.2 | | | | 0.4 | |
| | | | | | | | | | | | | | | | | | | | | | | | |
| | | — | | | | 0.2 | | | | — | | | | 0.2 | | | | 0.2 | | | | 0.4 | |
Post-employment benefits: | | | | | | | | | | | | | | | | | | | | | | | | |
– Net actuarial loss | | | — | | | | — | | | | (142.6 | ) | | | (142.6 | ) | | | (1.2 | ) | | | (143.8 | ) |
– Effect of the asset ceiling | | | — | | | | — | | | | 18.6 | | | | 18.6 | | | | — | | | | 18.6 | |
| | | | | | | | | | | | | | | | | | | | | | | | |
| | | — | | | | — | | | | (124.0 | ) | | | (124.0 | ) | | | (1.2 | ) | | | (125.2 | ) |
| | | | | | | | | | | | | | | | | | | | | | | | |
Other comprehensive income/(loss) before tax | | | 76.8 | | | | 0.2 | | | | (124.0 | ) | | | (47.0 | ) | | | 1.4 | | | | (45.6 | ) |
Income tax (expense)/benefit | | | (0.2 | ) | | | (0.1 | ) | | | 26.1 | | | | 25.8 | | | | 0.5 | | | | 26.3 | |
| | | | | | | | | | | | | | | | | | | | | | | | |
Other comprehensive income/(loss) | | | 76.6 | | | | 0.1 | | | | (97.9 | ) | | | (21.2 | ) | | | 1.9 | | | | (19.3 | ) |
| | | | | | | | | | | | | | | | | | | | | | | | |
F-73
Pinafore Holdings B.V.
Group Financial Statements
NOTES TO THE CONSOLIDATED FINANCIAL STATEMENTS (CONTINUED)
| 41. | Acquisition of businesses |
SUCCESSOR
A. Description of Successor acquisitions
Fiscal 2011
Industrial & Automotive
On October 31, 2011, the Group finalized the acquisition of the assets ofDu-Tex, Inc., a Texas-based distributor of products and services to the oil and gas industry. The assets were purchased for a cash consideration of $26.3 million, including $0.2 million contingent on the working capital settlement. Provisional goodwill of $21.8 million has been recognized which represents the expected benefits to the Group from the increased exposure to the high-growth oil and gas exploration market made possible by the acquisition. Management has not yet finalized its assessment of the fair value of certain identifiable intangible assets and items of property, plant and equipment.
Q4 2010
Acquisition of Tomkins
On September 24, 2010, Tomkins Acquisitions Limited (formerly Pinafore Acquisitions Limited), a wholly-owned subsidiary of the Company, acquired the entire issued ordinary share capital of Tomkins plc, the parent company of a global engineering and manufacturing group, for consideration of £3.25 per share.
Consideration payable on the acquisition of Tomkins amounted to $4,615.4 million, which was settled as to $4,535.0 million in cash, $45.5 million in loan notes and $34.9 million in options granted over B Shares. Based on the initial estimate of the fair value of the assets acquired and liabilities assumed at the date of acquisition, the Group recognized provisional goodwill of $1,742.1 million on the acquisition of Tomkins. During Fiscal 2011, management finalized its assessment of the fair values at the acquisition date of the acquired net assets of Tomkins and made a net adjustment to goodwill of $8.7 million. This adjustment is not considered to be material and comparative periods have therefore not been restated. An analysis by balance sheet line item is presented in note 20.
Goodwill recognized on the acquisition of Tomkins is principally attributable to expected future opportunities to increase sales and further enhance margins by further developing Tomkins’ product range and service capabilities (with an emphasis on the growing markets for energy-efficient and environmentally-friendly products), extending Tomkins’ global presence by further penetrating markets in the emerging economies, and by pursuing performance improvement initiatives. None of the goodwill is expected to be deductible for tax purposes.
Tomkins accounted for the Group’s entire sales and $270.2 million of its loss for the period ended December 31, 2010. If Tomkins had been acquired on September 1, 2010, when the Company was incorporated, the Group’s sales for the successor period would have been $386.6 million higher, at $1,675.8 million and the Group’s loss for the period would have been $10.0 million lower at $260.2 million.
B. Financial effect of Successor acquisitions
| | | | | | | | |
| | | Fiscal
2011
$ million | | | Q4 2010
$ million | |
Net assets acquired | | | | | | | | |
Identifiable intangible assets | | | 0.6 | | | | 2,301.9 | |
Property, plant and equipment | | | 0.8 | | | | 1,353.3 | |
Investment in associates | | | — | | | | 22.5 | |
Inventories | | | 1.7 | | | | 838.2 | |
Trade and other receivables | | | 2.3 | | | | 972.7 | |
– Gross contractual amounts receivable | | | 2.3 | | | | 986.9 | |
– Allowance for doubtful debts | | | — | | | | (14.2 | ) |
Income tax recoverable | | | — | | | | 6.6 | |
Deferred tax assets | | | — | | | | 4.4 | |
Available-for-sale investments | | | — | | | | 1.2 | |
Cash and cash equivalents | | | — | | | | 510.8 | |
| | | | | | | | |
| | | 5.4 | | | | 6,011.6 | |
| | | | | | | | |
Assets held for sale | | | — | | | | 32.8 | |
| | | | | | | | |
Total assets | | | 5.4 | | | | 6,044.4 | |
| | | | | | | | |
F-74
Pinafore Holdings B.V.
Group Financial Statements
NOTES TO THE CONSOLIDATED FINANCIAL STATEMENTS (CONTINUED)
| 41. | Acquisition of businesses continued |
B. Financial effect of Successor acquisitions (continued)
| | | | | | | | |
| | | Fiscal
2011
$ million | | | Q4 2010
$ million | |
Liabilities | | | | | | | | |
Bank overdrafts | | | — | | | | (19.7 | ) |
Bank and other loans | | | — | | | | (654.6 | ) |
Obligations under finance leases | | | — | | | | (3.6 | ) |
Trade and other payables | | | (0.9 | ) | | | (813.1 | ) |
Post-employment benefit obligations | | | — | | | | (338.3 | ) |
Income tax liabilities | | | — | | | | (105.5 | ) |
Deferred tax liabilities | | | — | | | | (820.5 | ) |
Provisions | | | — | | | | (102.3 | ) |
| | | | | | | | |
| | | (0.9 | ) | | | (2,857.6 | ) |
| | | | | | | | |
Liabilities directly associated with assets held for sale | | | — | | | | (9.0 | ) |
| | | | | | | | |
Total liabilities | | | (0.9 | ) | | | (2,866.6 | ) |
| | | | | | | | |
Net assets acquired | | | 4.5 | | | | 3,177.8 | |
| | | | | | | | |
Goodwill recognized was as follows:
| | | | | | | | |
| | | Fiscal
2011
$ million | | | Q4 2010
$ million | |
Consideration | | | 26.1 | | | | 4,615.4 | |
Contingent consideration | | | 0.2 | | | | — | |
Non-controlling interests | | | — | | | | 304.5 | |
| | | | | | | | |
| | | 26.3 | | | | 4,919.9 | |
Net assets acquired | | | (4.5 | ) | | | (3,177.8 | ) |
| | | | | | | | |
Goodwill | | | 21.8 | | | | 1,742.1 | |
| | | | | | | | |
Non-controlling interests in the acquired business have been measured at the non-controlling interest’s proportionate share of the identifiable assets and liabilities of the acquired business.
The net cash outflow on acquisitions during the period was as follows:
| | | | | | | | |
| | | Fiscal
2011
$ million | | | Q4 2010
$ million | |
Cash consideration paid on current period acquisitions | | | 26.1 | | | | 4,535.0 | |
Net cash and cash equivalents acquired | | | — | | | | (491.1 | ) |
Deferred consideration paid in respect of prior period acquisitions | | | 3.5 | | | | — | |
| | | | | | | | |
| | | 29.6 | | | | 4,043.9 | |
| | | | | | | | |
Acquisition-related costs of $0.6 million (Q4 2010: $78.2 million) were recognized and expensed during Fiscal 2011.
The business acquired during Fiscal 2011 contributed $3.1 million to the Group’s sales and increased the Group’s profit for the year by $0.2 million. If this business had been acquired at the beginning of Fiscal 2011, it is estimated that the Group’s sales from continuing operations would have been $12.1 million higher, at $4,602.8 million, in Fiscal 2011, but it is not practicable to estimate what the Group’s profit for the year would have been because the business did not prepare a balance sheet in accordance with IFRS as at 1 January 2011.
PREDECESSOR
C. Description of Predecessor acquisitions
9M 2010
Industrial & Automotive
Gates APAC
On April 13, 2010, the Group acquired a 100% interest inTransHose Corporation, a hydraulic hose supplier to the mining industry in Australia, for A$3.0 million in cash plus up to A$2.0 million in cash over three years contingent on the sales and profitability of the acquired business. Based on the initial estimate of the fair value of TransHose’s assets and liabilities at the date of acquisition, the Group recognized provisional goodwill of $2.9 million.
Gates EMEA
During 9M 2010, the Group completed the initial accounting for the acquisition ofHydrolink in July 2009 and reduced the attributable goodwill by $1.4 million to $15.2 million.
F-75
Pinafore Holdings B.V.
Group Financial Statements
NOTES TO THE CONSOLIDATED FINANCIAL STATEMENTS (CONTINUED)
| 41. | Acquisition of businesses continued |
C. Description of Predecessor acquisitions (continued)
Building Products
Air Distribution
On February 26, 2010, the Group acquired a 100% interest in Koch Filter Corporation (‘Koch’), a leading manufacturer of air filters for the non-residential filtration market in the US, for $35.5 million in cash. Based on the initial estimate of the fair value of Koch’s assets and liabilities at the date of acquisition, the Group recognized provisional goodwill of $21.4 million which represented the synergies expected from the acquisition.
On July 19, 2010, the Group acquired the net assets ofProVent, a designer and manufacturer of custom curb, ventilation and HVAC accessories in the US, for $0.5 million in cash plus up to $0.3 million contingent on ProVent’s sales in the first 14 months after the completion of the acquisition. Based on the initial estimate of the fair value of ProVent’s assets and liabilities at the date of acquisition, the Group recognized provisional goodwill of $0.2 million.
Fiscal 2009
Industrial & Automotive
Gates EMEA
On July 7, 2009, the Group acquired a 100% interest inHydrolink, a fluid engineering services provider to the oil and gas and marine sectors in the Middle East. Based on the initial estimate of the fair value of Hydrolink’s assets and liabilities at the date of acquisition, the Group recognized provisional goodwill of $16.5 million.
During Fiscal 2009, the Group completed the initial accounting for the acquisition ofA.E. Hydraulic (Pte) Ltd.In March 2008 and increased the attributable goodwill by $1.6 million to $9.7 million.
Building Products
Air Distribution
On July 7, 2009, the Group acquired the remaining 40% non-controlling interest inRolastar Pvt Ltd, a duct manufacturer based in India. Goodwill of $4.6 million was recognized on the acquisition of the non-controlling interest. Also during Fiscal 2009, the Group completed the initial accounting for the 60% interest in the business acquired in February 2008 and increased the attributable goodwill by $3.0 million to $3.9 million. Overall, the Group recognized goodwill of $8.5 million on the acquisition of its 100% interest in the business.
During Fiscal 2009, the Group completed the initial accounting for the acquisition ofTrion Inc. in June 2008 and increased the attributable goodwill by $1.1 million to $3.5 million.
D. Financial effect of Predecessor acquisitions
| | | | | | | | |
| | | PREDECESSOR | |
| | | 9M
2010
$ million | | | Fiscal
2009
$ million | |
Net assets acquired | | | | | | | | |
Identifiable intangible assets | | | 6.4 | | | | 5.9 | |
Property, plant and equipment | | | 4.2 | | | | 8.0 | |
Inventories | | | 5.2 | | | | 7.4 | |
Trade and other receivables | | | 5.6 | | | | 7.2 | |
Cash and cash equivalents | | | 0.3 | | | | 0.4 | |
Bank and other loans | | | — | | | | (7.4 | ) |
Obligations under finance leases | | | — | | | | (0.4 | ) |
Trade and other payables | | | (2.4 | ) | | | (10.3 | ) |
Income tax liabilities | | | (2.4 | ) | | | (0.4 | ) |
Deferred tax liabilities | | | — | | | | (6.9 | ) |
Non-controlling interest | | | — | | | | 6.6 | |
| | | | | | | | |
| | | 16.9 | | | | 10.1 | |
Goodwill on current year acquisitions | | | 24.5 | | | | 21.1 | |
Adjustments to goodwill on prior year acquisitions | | | (1.4 | ) | | | 5.7 | |
| | | | | | | | |
Consideration (including transaction costs) | | | 40.0 | | | | 36.9 | |
| | | | | | | | |
The net cash outflow on acquisitions during the period was as follows:
| | | | | | | | |
| | | PREDECESSOR | |
| | | 9M
2010
$ million | | | Fiscal
2009
$ million | |
Consideration paid on current period acquisitions | | | 39.1 | | | | 25.5 | |
Cash and cash equivalents acquired | | | (0.3 | ) | | | (0.4 | ) |
Deferred consideration | | | 2.4 | | | | 1.4 | |
| | | | | | | | |
| | | 41.2 | | | | 26.5 | |
| | | | | | | | |
F-76
Pinafore Holdings B.V.
Group Financial Statements
NOTES TO THE CONSOLIDATED FINANCIAL STATEMENTS (CONTINUED)
| 42. | Disposals of businesses |
A. Description of disposals
SUCCESSOR
Fiscal 2011
Industrial & Automotive
Powertrain
On August 2, 2011, the Group finalized the sale of itsStackpole business, which specializes in powder metal and engineered powertrain components. Stackpole is included in the Powertrain operating segment and operates predominantly in North America and Europe, generating annual sales of approximately $290 million. The business was sold for no net gain or loss to an affiliated investment fund of the Sterling Group, a Houston based private equity investment firm, for a cash consideration of $289.0 million.
Other I&A
On October 27, 2011, the Group finalized the sale ofIdeal, a leading manufacturer of gear clamps primarily for the automotive aftermarket, selling principally in the United States, Mexico and China under a variety of brands. Ideal is included in the Other Industrial & Automotive operating segment. The business was sold for a cash consideration of $158.7 million. A gain of $55.4 million was recognized on the disposal.
Dexter Chassis, a manufacturer of chassis components for the recreational vehicle and industrial and utility end markets in the US, was sold on August 22, 2011 to EA Technologies, LLC for a cash consideration of $14.3 million. The Group recognized a loss of $0.8 million on the disposal.
Plews Inc., a wholly-owned manufacturer of automotive lubrication products and repair tools that is included in the Other Industrial & Automotive operating segment, was sold on April 20, 2011, to a consortium of investors in the US led by the private equity firm, Eigen Capital LLC. The cash consideration of $25.0 million received on the disposal approximated to the carrying amount of the net assets sold.
Also during Fiscal 2011, the Group disposed of a minor business division for a cash consideration totaling $2.5 million.
The financial effect of disposals during Fiscal 2011 was as follows:
| | | | |
| | | SUCCESSOR | |
| | | Fiscal 2011
$ million | |
Proceeds: | | | | |
– Cash | | | 489.5 | |
| | | | |
| |
Net assets disposed of: | | | | |
Goodwill | | | 31.6 | |
Identifiable intangible assets | | | 65.0 | |
Property, plant and equipment | | | 238.0 | |
Investments in associates | | | 13.6 | |
Deferred tax assets | | | 3.7 | |
Inventories | | | 55.5 | |
Trade and other receivables | | | 107.9 | |
Cash and cash equivalents | | | 2.0 | |
Trade and other payables | | | (71.2 | ) |
Post-employment benefit obligations | | | (6.3 | ) |
Deferred tax liabilities | | | (19.6 | ) |
| | | | |
| | | 420.2 | |
Disposal costs | | | (14.7 | ) |
| | | | |
Gain on disposal | | | 54.6 | |
| | | | |
Q4 2010
During Q4 2010, the Group realized $4.0 million in relation to disposals that were recognized in previous years.
PREDECESSOR
9M 2010
During 9M 2010, the Group paid $4.0 million (including costs) to settle claims by the purchasers concerning the consideration payable on disposals that were recognized in previous years, of which $2.2 million was in relation to the disposal of discontinued operations.
Fiscal 2009
During Fiscal 2009, the Group received additional proceeds of $0.7 million on disposals that were recognized in previous years.
F-77
Pinafore Holdings B.V.
Group Financial Statements
NOTES TO THE CONSOLIDATED FINANCIAL STATEMENTS (CONTINUED)
| 42. | Disposals of businesses continued |
B. Net cash inflow/(outflow) on disposals
| | | | | | | | | | | | | | | | | | |
| | | SUCCESSOR | | | | | PREDECESSOR | |
| | | Fiscal
2011
$ million | | | Q4 2010
$ million | | | | | 9M
2010
$ million | | | Fiscal
2009
$ million | |
Proceeds received: | | | | | | | | | | | | | | | | | | |
– Disposals in the period | | | 489.5 | | | | — | | | | | | 0.2 | | | | — | |
– Disposals in previous periods | | | 2.7 | | | | 4.0 | | | | | | 0.4 | | | | 0.7 | |
Disposal costs paid | | | (14.5 | ) | | | — | | | | | | (4.6 | ) | | | — | |
Cash and cash equivalents disposed of | | | (2.0 | ) | | | — | | | | | | — | | | | — | |
| | | | | | | | | | | | | | | | | | |
| | | 475.7 | | | | 4.0 | | | | | | (4.0 | ) | | | 0.7 | |
| | | | | | | | | | | | | | | | | | |
The Group is, from time to time, party to legal proceedings and claims, which arise in the ordinary course of business, including, in Brazil, ongoing litigation with the State of Sao Paulo Tax Department in respect of tax paid, totaling approximately $29 million (including penalties and interest). Based on the success of work to date, and legal advice received, management is of the opinion that the Group is able to rigorously defend its position against virtually all of this particular claim, plus the associated penalty and interest. The Group has nevertheless been requested to pledge certain of its assets as collateral for the disputed amount while the case is heard. Management does not anticipate that the outcome of this, or of any other current proceedings or known claims, either individually or in aggregate, will have a material adverse effect upon the Group's financial position, results of operations or cash flows.
The Group rents certain office premises and plant, equipment and vehicles under operating lease arrangements. All leases are on a fixed repayment basis and no arrangements have been entered into for contingent rental payments. During Fiscal 2011, the operating lease rental expense was $52.3 million (Q4 2010: $13.5 million; 9M 2010: $37.7 million; Fiscal 2009: $59.5 million).
As at December 31, 2010, the Group had outstanding commitments under non-cancellable operating leases of $196.2 million (December 31, 2010: $220.1 million), falling due as follows:
| | | | | | | | |
| | | As at
December 31,
2011
$ million | | | As at
December 31,
2010
$ million | |
Payments to be made: | | | | | | | | |
– Within one year | | | 42.9 | | | | 45.1 | |
– In the second to fifth years, inclusive | | | 101.7 | | | | 108.6 | |
– After more than five years | | | 51.6 | | | | 66.4 | |
| | | | | | | | |
| | | 196.2 | | | | 220.1 | |
| | | | | | | | |
As at December 31, 2011, the Group had entered into contractual commitments for the purchase of property, plant and equipment amounting to $8.7 million (December 31, 2010: $19.7 million) and for the purchase of non-integral computer software amounting to $0.9 million (December 31, 2010: $0.9 million).
| 46. | Related party transactions |
Transactions between Group companies, which are related parties, have been eliminated on consolidation and, therefore, are not required to be disclosed in these financial statements. Details of transactions between the Group and other related parties are disclosed below.
A. Post-employment benefit plans
During Fiscal 2011, the Group paid employer’s contributions amounting to $97.4 million (Q4 2010: $21.1 million; 9M 2010: $54.1 million; Fiscal 2009: $86.2 million) to pension plans established for the benefit of its employees. As at December 31, 2011, contributions due to the plans amounting to $15.1 million (December 31, 2010: $16.1 million) were included in other payables. In addition, during Fiscal 2011, the Group paid benefits of $11.4 million (Q4 2010: $3.6 million; 9M 2010: $11.2 million; Fiscal 2009: $15.1 million) to other post-employment benefit plans.
F-78
Pinafore Holdings B.V.
Group Financial Statements
NOTES TO THE CONSOLIDATED FINANCIAL STATEMENTS (CONTINUED)
| 46. | Related party transactions continued |
B. Compensation and interests of key management personnel
Prior to the acquisition of Tomkins, the Group considered its key management personnel to be the Directors of Tomkins Limited together with those persons who, in accordance with the Listing Rules of the UKLA, were regarded as discharging management responsibility. Since the acquisition of Tomkins, the Group considers its key management personnel to be the Directors of the Company and the executive officers of Tomkins.
Compensation paid or payable to key management personnel in respect of their services to the Group was as follows:
| | | | | | | | | | | | | | | | | | |
| | | SUCCESSOR | | | | | PREDECESSOR | |
| | | Fiscal
2011
$’000s | | | Q4 2010
$’000s | | | | | 9M
2010
$’000s | | | Fiscal
2009
$’000s | |
Short-term employee benefits: | | | | | | | | | | | | | | | | | | |
– Salaries and fees | | | 4,755 | | | | 1,121 | | | | | | 3,230 | | | | 4,928 | |
– Bonus cash | | | 6,993 | | | | 2,609 | | | | | | 4,314 | | | | 3,397 | |
– Benefits-in-kind | | | 304 | | | | 71 | | | | | | 149 | | | | 168 | |
– Social security contributions | | | 26 | | | | 12 | | | | | | 27 | | | | 425 | |
– Termination benefits | | | 376 | | | | — | | | | | | — | | | | 755 | |
| | | | | | | | | | | | | | | | | | |
| | | 12,454 | | | | 3,813 | | | | | | 7,720 | | | | 9,673 | |
| | | | | | | | | | | | | | | | | | |
Share-based incentives: | | | | | | | | | | | | | | | | | | |
– Retention awards | | | — | | | | 3,080 | | | | | | — | | | | — | |
– ABIP | | | | | | | | | | | | | | | | | | |
Bonus shares | | | 910 | | | | — | | | | | | 557 | | | | 829 | |
Deferred shares | | | 1,821 | | | | — | | | | | | 1,113 | | | | 1,659 | |
– Gain on the vesting of PSP awards | | | — | | | | 14,979 | | | | | | — | | | | — | |
– Gain on the exercise of share options | | | 13,088 | | | | 1,306 | | | | | | 173 | | | | — | |
| | | | | | | | | | | | | | | | | | |
| | | 15,819 | | | | 19,365 | | | | | | 1,843 | | | | 2,488 | |
| | | | | | | | | | | | | | | | | | |
Pension contributions | | | 1,520 | | | | 355 | | | | | | 1,039 | | | | 1,260 | |
| | | | | | | | | | | | | | | | | | |
| | | 29,793 | | | | 23,533 | | | | | | 10,602 | | | | 13,421 | |
| | | | | | | | | | | | | | | | | | |
Details of the Group’s share-based incentive schemes are presented in note 36.
As a consequence of the acquisition of Tomkins, the share-based element of the ABIP was suspended and bonuses earned in the second, third and fourth quarters of 2010 were settled entirely in cash.
In the table above, the gain on the vesting of PSP awards during Q4 2010 represents the value of the PSP awards over ordinary shares in Tomkins plc held by key management personnel that vested on the acquisition of Tomkins. In addition, key management personnel chose to cancel PSP awards over ordinary shares in Tomkins plc with a value of $31.7 million in exchange for Replacement Options over B Shares in the Company. Any gain on the exercise of the Replacement Options will be recognized as compensation paid to key management personnel in the periods in which they are exercised.
C. Entities controlled by the members of Pinafore Coöperatief U.A.
Onex Partners Manager LP
On September 27, 2010, Onex Partners Manager LP entered into a management services agreement pursuant to which it provides Tomkins Acquisitions Limited, a subsidiary of the Company, with advisory, consulting and other services in relation to the operations of Tomkins Acquisitions Limited and its subsidiaries including strategic planning, marketing and financial oversight. In consideration of these oversight services, Tomkins Acquisitions Limited has agreed to pay Onex Partners Manager LP (or such other party as is designated by Onex Partners Manager LP) a fee of $1.8 million per annum plus reasonable out-of-pocket expenses. During Fiscal 2011, Tomkins Acquisitions Limited incurred $2.2 million (Q4 2010: $0.5 million) in respect of these oversight services and out-of-pocket expenses, of which $0.1 million was still owing at the year end (December 31, 2010: $0.2 million)
It was further acknowledged and agreed that, from time to time, Onex Partners Manager LP may be requested to provide consulting and other services to Tomkins Acquisitions Limited, including in relation to acquisitions and disposals or the sale of debt or equity interests in or any similar financing transactions. During Fiscal 2011, there were no amounts payable in respect of such additional services (Q4 2010: $nil).
During Q4 2010, Onex Partners Manager LP, a subsidiary of Onex Corporation, provided certain services to Tomkins Acquisitions Limited in connection with the acquisition of Tomkins Limited including arranging and negotiating the transaction and arranging and negotiating the funding for the transaction. In consideration for those services, Tomkins Acquisitions Limited paid Onex Partners Manager LP a fee of $25.0 million.
CPPIB Equity Investments Inc.
On September 27, 2010, CPPIB Equity Investments Inc. entered into a management services agreement pursuant to which it provides Tomkins Acquisitions Limited with advisory, consulting and other services in relation to the operations of Tomkins Acquisitions Limited and its subsidiaries including strategic planning, marketing and financial oversight. In consideration of these oversight services, Tomkins Acquisitions Limited has agreed to pay CPPIB Equity Investments Inc. (or such other party as is designated by CPPIB Equity Investments Inc.) a fee of $1.2 million per annum plus reasonable out-of-pocket expenses. During Fiscal 2011, Tomkins Acquisitions Limited accrued and paid $1.2 million (Q4 2010: accrued but not paid $0.2 million) in respect of these oversight services and out-of-pocket expenses.
F-79
Pinafore Holdings B.V.
Group Financial Statements
NOTES TO THE CONSOLIDATED FINANCIAL STATEMENTS (CONTINUED)
| 46. | Related party transactions continued |
C. Entities controlled by the members of Pinafore Coöperatief U.A. (continued)
It was further acknowledged and agreed that, from time to time, CPPIB Equity Investments Inc. may be requested to provide consulting and other services to Tomkins Acquisitions Limited, including in relation to acquisitions and disposals or the sale of debt or equity interests in or any similar financing transactions. During Fiscal 2011, there were no amounts payable in respect of such additional services (Q4 2010: $nil).
During Q4 2010, CPPIB Equity Investments Inc., a subsidiary of CPPIB, provided certain services to Tomkins Acquisitions Limited, in connection with the acquisition of Tomkins Limited including arranging and negotiating the transaction and arranging and negotiating the funding for the transaction. In consideration for those services, Tomkins Acquisitions Limited paid CPPIB Equity Investments Inc. a fee of $25.0 million.
D. Associates
Sales to and purchases from associates were as follows:
| | | | | | | | | | | | | | | | | | |
| | | SUCCESSOR | | | | | PREDECESSOR | |
| | | Fiscal
2011
$ million | | | Q4 2010
$ million | | | | | 9M
2010
$ million | | | Fiscal
2009
$ million | |
Sales | | | 4.1 | | | | 1.6 | | | | | | 4.2 | | | | 4.3 | |
Purchases | | | (12.5 | ) | | | (4.2 | ) | | | | | (12.7 | ) | | | (15.2 | ) |
Amounts outstanding in respect of these transactions were as follows:
| | | | | | | | |
| | | As at
December 31,
2011
$ million | | | As at
December 31,
2010
$ million | |
Receivables | | | 0.4 | | | | 0.1 | |
Payables | | | (0.5 | ) | | | (0.8 | ) |
E. Entities controlled by minority shareholders
Sales to and purchases from entities controlled by minority shareholders were as follows:
| | | | | | | | | | | | | | | | | | |
| | | SUCCESSOR | | | | | PREDECESSOR | |
| | | Fiscal
2011
$ million | | | Q4 2010
$ million | | | | | 9M
2010
$ million | | | Fiscal
2009
$ million | |
Sales | | | 64.7 | | | | 16.5 | | | | | | 39.0 | | | | 26.3 | |
Purchases | | | (46.6 | ) | | | (13.8 | ) | | | | | (35.5 | ) | | | (39.1 | ) |
Amounts outstanding in respect of these transactions were as follows:
| | | | | | | | |
| | | As at
December 31,
2011
$ million | | | As at
December 31,
2010
$ million | |
Receivables | | | 3.7 | | | | 3.7 | |
Payables | | | (3.3 | ) | | | (2.6 | ) |
F. Other related parties
Schrader Duncan
Schrader Duncan is an associate in which the Group holds a 50% interest. Tomkins Limited and Cosmopolitan Investments (a fellow shareholder in Schrader Duncan) have each issued a guarantee in favor of the State Bank of India in relation to any principal sum up to a maximum of 229 million Indian rupees ($4.2 million), together with interest and any other costs and charges due in respect of credit facilities provided to Schrader Duncan. Tomkins Limited and Cosmopolitan Investments are jointly and severally liable for the guaranteed amounts.
J.M. Koch
Koch Filter Corporation, a wholly-owned subsidiary of the Group, is party to a five-year lease of a storage building which is owned by J.M. Koch, the father of two executive officers at Koch. During 2011, both executives left the Company, and the related party relationship therefore ceased to exist. During the period that the executives were in office, Koch made rental payments of $84,000 under the lease agreement.
F-80
Pinafore Holdings B.V.
Group Financial Statements
NOTES TO THE CONSOLIDATED FINANCIAL STATEMENTS (CONTINUED)
| 47. | Condensed consolidating financial information |
The Senior Secured Credit Facilities and the Second Lien Notes were issued by Tomkins, Inc. and Tomkins, LLC (‘the Issuers’), which are both wholly-owned subsidiaries of the Company, and are jointly and severally, irrevocably and fully and unconditionally guaranteed by the Company and certain other of the Company’s wholly-owned subsidiaries (‘the Guarantors’).
Supplemental condensed consolidating financial information is presented below comprising the Group’s income statements and cash flow statements for Fiscal 2011, Q4 2010, 9M 2010 and Fiscal 2009 and its balance sheets as at December 31, 2011 and December 31, 2010, showing the amounts attributable to the Company, the Issuers and those of its other subsidiaries that were Guarantors separately from the amounts attributable to those of its subsidiaries that were not Guarantors. The condensed consolidating financial information is prepared in accordance with the Group’s accounting policies, except that investments in subsidiaries are accounted for by their parent company under the equity method of accounting. Under the equity method of accounting, the parent company’s income statement includes on one line its share of the profit or loss of its subsidiary undertakings and the parent company’s balance sheet includes on one line its share of the net assets of its subsidiary undertakings.
A. Consolidated income statement
| | | | | | | | | | | | | | | | | | | | | | | | |
Fiscal 2011 | | Company
$ million | | | Issuers
$ million | | | Other
guarantor
subsidiaries
$ million | | | Non-
guarantor
subsidiaries
$ million | | | Consolidation
adjustments
$ million | | | Total
Group
$ million | |
Continuing operations | | | | | | | | | | | | | | | | | | | | | | | | |
Sales | | | — | | | | — | | | | 2,998.1 | | | | 2,275.7 | | | | (683.1 | ) | | | 4,590.7 | |
Cost of sales | | | — | | | | — | | | | (2,149.0 | ) | | | (1,663.2 | ) | | | 684.2 | | | | (3,128.0 | ) |
| | | | | | | | | | | | | | | | | | | | | | | | |
Gross profit | | | — | | | | — | | | | 849.1 | | | | 612.5 | | | | 1.1 | | | | 1,462.7 | |
Distribution costs | | | — | | | | — | | | | (346.0 | ) | | | (162.0 | ) | | | — | | | | (508.0 | ) |
Administrative expenses | | | (1.9 | ) | | | (2.2 | ) | | | (450.6 | ) | | | (210.4 | ) | | | — | | | | (665.1 | ) |
Transaction costs | | | — | | | | — | | | | (0.6 | ) | | | — | | | | — | | | | (0.6 | ) |
Impairments | | | — | | | | — | | | | (37.6 | ) | | | (0.4 | ) | | | — | | | | (38.0 | ) |
Restructuring costs | | | — | | | | — | | | | (36.6 | ) | | | (3.6 | ) | | | — | | | | (40.2 | ) |
Net gain on disposals and on the exit of businesses | | | — | | | | — | | | | 60.4 | | | | 0.5 | | | | — | | | | 60.9 | |
Share of profit/(loss) of associates | | | — | | | | — | | | | 1.6 | | | | (0.4 | ) | | | — | | | | 1.2 | |
| | | | | | | | | | | | | | | | | | | | | | | | |
Operating (loss)/profit | | | (1.9 | ) | | | (2.2 | ) | | | 39.7 | | | | 236.2 | | | | 1.1 | | | | 272.9 | |
| | | | | | | | | | | | | | | | | | | | | | | | |
| | | | | | |
Interest expense | | | — | | | | (243.2 | ) | | | (311.2 | ) | | | (28.2 | ) | | | 265.0 | | | | (317.6 | ) |
Investment income | | | — | | | | 221.4 | | | | 91.4 | | | | 24.0 | | | | (265.0 | ) | | | 71.8 | |
Other finance (expense)/income | | | — | | | | (28.0 | ) | | | 1.5 | | | | (0.2 | ) | | | — | | | | (26.7 | ) |
Net finance costs | | | — | | | | (49.8 | ) | | | (218.3 | ) | | | (4.4 | ) | | | — | | | | (272.5 | ) |
Share of profits of subsidiaries under the equity method | | | 29.8 | | | | — | | | | 117.0 | | | | — | | | | (146.8 | ) | | | — | |
| | | | | | | | | | | | | | | | | | | | | | | | |
Profit/(loss) before tax | | | 27.9 | | | | (52.0 | ) | | | (61.6 | ) | | | 231.8 | | | | (145.7 | ) | | | 0.4 | |
Income tax benefit/(expense) | | | — | | | | 5.4 | | | | 59.3 | | | | (45.4 | ) | | | (0.1 | ) | | | 19.2 | |
| | | | | | | | | | | | | | | | | | | | | | | | |
Profit/(loss) for the period from continuing operations | | | 27.9 | | | | (46.6 | ) | | | (2.3 | ) | | | 186.4 | | | | (145.8 | ) | | | 19.6 | |
| | | | | | |
Discontinued operations | | | | | | | | | | | | | | | | | | | | | | | | |
Profit for the period from discontinued operations | | | — | | | | — | | | | 32.1 | | | | 5.5 | | | | — | | | | 37.6 | |
| | | | | | | | | | | | | | | | | | | | | | | | |
Profit/(loss) for the period | | | 27.9 | | | | (46.6 | ) | | | 29.8 | | | | 191.9 | | | | (145.8 | ) | | | 57.2 | |
Non-controlling interests | | | — | | | | — | | | | — | | | | (29.3 | ) | | | — | | | | (29.3 | ) |
| | | | | | | | | | | | | | | | | | | | | | | | |
Profit/(loss) for the period attributable to equity shareholders | | | 27.9 | | | | (46.6 | ) | | | 29.8 | | | | 162.6 | | | | (145.8 | ) | | | 27.9 | |
| | | | | | | | | | | | | | | | | | | | | | | | |
F-81
Pinafore Holdings B.V.
Group Financial Statements
NOTES TO THE CONSOLIDATED FINANCIAL STATEMENTS (CONTINUED)
| 47. | Condensed consolidating financial information continued |
B. Consolidated income statement
| | | | | | | | | | | | | | | | | | | | | | | | |
Q4 2010 | | Company
$ million | | | Issuers
$ million | | | Other
guarantor
subsidiaries
$ million | | | Non-
guarantor
subsidiaries
$ million | | | Consolidation
adjustments
$ million | | | Total
Group
$ million | |
Continuing operations | | | | | | | | | | | | | | | | | | | | | | | | |
Sales | | | — | | | | — | | | | 726.3 | | | | 633.6 | | | | (178.6 | ) | | | 1,181.3 | |
Cost of sales | | | — | | | | — | | | | (595.5 | ) | | | (519.5 | ) | | | 164.7 | | | | (950.3 | ) |
| | | | | | | | | | | | | | | | | | | | | | | | |
Gross profit | | | — | | | | — | | | | 130.8 | | | | 114.1 | | | | (13.9 | ) | | | 231.0 | |
Distribution costs | | | — | | | | — | | | | (93.6 | ) | | | (43.5 | ) | | | — | | | | (137.1 | ) |
Administrative expenses | | | (0.1 | ) | | | (0.1 | ) | | | (154.1 | ) | | | (63.0 | ) | | | — | | | | (217.3 | ) |
Transaction costs | | | (0.1 | ) | | | — | | | | (77.8 | ) | | | (0.3 | ) | | | — | | | | (78.2 | ) |
Restructuring costs | | | — | | | | — | | | | (2.6 | ) | | | (1.1 | ) | | | — | | | | (3.7 | ) |
Share of profit of associates | | | — | | | | — | | | | 0.2 | | | | 0.8 | | | | — | | | | 1.0 | |
| | | | | | | | | | | | | | | | | | | | | | | | |
Operating (loss)/profit | | | (0.2 | ) | | | (0.1 | ) | | | (197.1 | ) | | | 7.0 | | | | (13.9 | ) | | | (204.3 | ) |
| | | | | | | | | | | | | | | | | | | | | | | | |
| | | | | | |
Interest expense | | | — | | | | (68.2 | ) | | | (99.3 | ) | | | (7.8 | ) | | | 84.5 | | | | (90.8 | ) |
Investment income | | | — | | | | 71.4 | | | | 26.0 | | | | 5.8 | | | | (84.5 | ) | | | 18.7 | |
Other finance income/(expense) | | | — | | | | 22.9 | | | | (45.4 | ) | | | (4.6 | ) | | | — | | | | (27.1 | ) |
Net finance income/(costs) | | | — | | | | 26.1 | | | | (118.7 | ) | | | (6.6 | ) | | | — | | | | (99.2 | ) |
Share of (losses)/profits of subsidiaries under the equity method | | | (270.9 | ) | | | — | | | | 8.7 | | | | (1.9 | ) | | | 264.1 | | | | — | |
| | | | | | | | | | | | | | | | | | | | | | | | |
(Loss)/profit before tax | | | (271.1 | ) | | | 26.0 | | | | (307.1 | ) | | | (1.5 | ) | | | 250.2 | | | | (303.5 | ) |
Income tax (expense)/benefit | | | — | | | | (8.0 | ) | | | 35.1 | | | | 3.0 | | | | 4.0 | | | | 34.1 | |
| | | | | | | | | | | | | | | | | | | | | | | | |
(Loss)/profit for the period from continuing operations | | | (271.1 | ) | | | 18.0 | | | | (272.0 | ) | | | 1.5 | | | | 254.2 | | | | (269.4 | ) |
| | | | | | |
Discontinued operations | | | | | | | | | | | | | | | | | | | | | | | | |
Profit/(loss) for the period from discontinued operations | | | — | | | | — | | | | 1.1 | | | | (1.9 | ) | | | — | | | | (0.8 | ) |
| | | | | | | | | | | | | | | | | | | | | | | | |
(Loss)/profit for the period | | | (271.1 | ) | | | 18.0 | | | | (270.9 | ) | | | (0.4 | ) | | | 254.2 | | | | (270.2 | ) |
Non-controlling interests | | | — | | | | — | | | | — | | | | (0.9 | ) | | | — | | | | (0.9 | ) |
| | | | | | | | | | | | | | | | | | | | | | | | |
(Loss)/profit for the period attributable to equity shareholders | | | (271.1 | ) | | | 18.0 | | | | (270.9 | ) | | | (1.3 | ) | | | 254.2 | | | | (271.1 | ) |
| | | | | | | | | | | | | | | | | | | | | | | | |
C. Consolidated income statement
| | | | | | | | | | | | | | | | | | | | | | | | |
9M 2010 | | Company
$ million | | | Issuers
$ million | | | Other
guarantor
subsidiaries
$ million | | | Non-
guarantor
subsidiaries
$ million | | | Consolidation
adjustments
$ million | | | Total
Group
$ million | |
Continuing operations | | | | | | | | | | | | | | | | | | | | | | | | |
Sales | | | — | | | | — | | | | 2,086.9 | | | | 1,587.4 | | | | (403.9 | ) | | | 3,270.4 | |
Cost of sales | | | — | | | | — | | | | (1,461.6 | ) | | | (1,163.8 | ) | | | 401.6 | | | | (2,223.8 | ) |
| | | | | | | | | | | | | | | | | | | | | | | | |
Gross profit | | | — | | | | — | | | | 625.3 | | | | 423.6 | | | | (2.3 | ) | | | 1,046.6 | |
Distribution costs | | | — | | | | — | | | | (252.3 | ) | | | (109.7 | ) | | | — | | | | (362.0 | ) |
Administrative expenses | | | — | | | | — | | | | (222.8 | ) | | | (104.5 | ) | | | — | | | | (327.3 | ) |
Transaction costs | | | — | | | | — | | | | (41.1 | ) | | | (0.1 | ) | | | — | | | | (41.2 | ) |
Restructuring costs | | | — | | | | — | | | | (8.1 | ) | | | (1.9 | ) | | | — | | | | (10.0 | ) |
Net gain on disposals and on the exit of businesses | | | — | | | | — | | | | 5.5 | | | | 0.8 | | | | — | | | | 6.3 | |
Share of (loss)/profit of associates | | | — | | | | — | | | | 0.6 | | | | 0.2 | | | | — | | | | 0.8 | |
| | | | | | | | | | | | | | | | | | | | | | | | |
Operating profit | | | — | | | | — | | | | 107.1 | | | | 208.4 | | | | (2.3 | ) | | | 313.2 | |
| | | | | | | | | | | | | | | | | | | | | | | | |
| | | | | | |
Interest expense | | | — | | | | — | | | | (67.6 | ) | | | (25.2 | ) | | | 21.4 | | | | (71.4 | ) |
Investment income | | | — | | | | — | | | | 53.5 | | | | 15.9 | | | | (21.4 | ) | | | 48.0 | |
Other finance expense | | | — | | | | — | | | | (2.7 | ) | | | — | | | | — | | | | (2.7 | ) |
Net finance costs | | | — | | | | — | | | | (16.8 | ) | | | (9.3 | ) | | | — | | | | (26.1 | ) |
Share of profits of subsidiaries under the equity method | | | — | | | | — | | | | 119.0 | | | | 1.9 | | | | (120.9 | ) | | | — | |
| | | | | | | | | | | | | | | | | | | | | | | | |
Profit before tax | | | — | | | | — | | | | 209.3 | | | | 201.0 | | | | (123.2 | ) | | | 287.1 | |
Income tax expense | | | — | | | | — | | | | (7.3 | ) | | | (55.6 | ) | | | 0.4 | | | | (62.5 | ) |
| | | | | | | | | | | | | | | | | | | | | | | | |
Profit for the period from continuing operations | | | — | | | | — | | | | 202.0 | | | | 145.4 | | | | (122.8 | ) | | | 224.6 | |
| | | | | | | | | | | | | | | | | | | | | | | | |
| | | | | | |
Discontinued operations | | | | | | | | | | | | | | | | | | | | | | | | |
Loss for the period from discontinued operations | | | — | | | | — | | | | 15.4 | | | | 3.6 | | | | — | | | | 19.0 | |
| | | | | | | | | | | | | | | | | | | | | | | | |
Profit for the period | | | — | | | | — | | | | 217.4 | | | | 149.0 | | | | (122.8 | ) | | | 243.6 | |
Non-controlling interests | | | — | | | | — | | | | — | | | | (26.2 | ) | | | — | | | | (26.2 | ) |
| | | | | | | | | | | | | | | | | | | | | | | | |
Profit for the period attributable to equity shareholders | | | — | | | | — | | | | 217.4 | | | | 122.8 | | | | (122.8 | ) | | | 217.4 | |
| | | | | | | | | | | | | | | | | | | | | | | | |
F-82
Pinafore Holdings B.V.
Group Financial Statements
NOTES TO THE CONSOLIDATED FINANCIAL STATEMENTS (CONTINUED)
| 47. | Condensed consolidating financial information continued |
D. Consolidated income statement
| | | | | | | | | | | | | | | | | | | | | | | | |
Fiscal 2009 | | Company
$ million | | | Issuers
$ million | | | Other
guarantor
subsidiaries
$ million | | | Non-
guarantor
subsidiaries
$ million | | | Consolidation
adjustments
$ million | | | Total
Group
$ million | |
Continuing operations | | | | | | | | | | | | | | | | | | | | | | | | |
Sales | | | — | | | | — | | | | 2,519.4 | | | | 1,803.5 | | | | (456.4 | ) | | | 3,866.5 | |
Cost of sales | | | — | | | | — | | | | (1,827.3 | ) | | | (1,377.7 | ) | | | 456.8 | | | | (2,748.2 | ) |
| | | | | | | | | | | | | | | | | | | | | | | | |
Gross profit | | | — | | | | — | | | | 692.1 | | | | 425.8 | | | | 0.4 | | | | 1,118.3 | |
Distribution costs | | | — | | | | — | | | | (330.3 | ) | | | (111.4 | ) | | | — | | | | (441.7 | ) |
Administrative expenses | | | — | | | | — | | | | (266.5 | ) | | | (170.5 | ) | | | — | | | | (437.0 | ) |
Impairments | | | — | | | | — | | | | (43.8 | ) | | | (29.2 | ) | | | — | | | | (73.0 | ) |
Restructuring costs | | | — | | | | — | | | | (33.0 | ) | | | (107.9 | ) | | | — | | | | (140.9 | ) |
Net gain on disposals and on the exit of businesses | | | — | | | | — | | | | 0.2 | | | | — | | | | — | | | | 0.2 | |
Gain on amendment of post-employment benefits | | | — | | | | — | | | | 56.9 | | | | 6.1 | | | | — | | | | 63.0 | |
Share of (loss)/profit of associates | | | — | | | | — | | | | (1.3 | ) | | | 0.6 | | | | — | | | | (0.7 | ) |
| | | | | | | | | | | | | | | | | | | | | | | | |
Operating profit | | | — | | | | — | | | | 74.3 | | | | 13.5 | | | | 0.4 | | | | 88.2 | |
| | | | | | | | | | | | | | | | | | | | | | | | |
| | | | | | |
Interest expense | | | — | | | | — | | | | (110.5 | ) | | | (30.9 | ) | | | 30.4 | | | | (111.0 | ) |
Investment income | | | — | | | | — | | | | 71.7 | | | | 25.7 | | | | (30.4 | ) | | | 67.0 | |
Other finance (expense)/income | | | — | | | | — | | | | (1.2 | ) | | | 0.9 | | | | — | | | | (0.3 | ) |
Net finance costs | | | — | | | | — | | | | (40.0 | ) | | | (4.3 | ) | | | — | | | | (44.3 | ) |
Share of losses of subsidiaries under the equity method | | | — | | | | — | | | | (24.1 | ) | | | — | | | | 24.1 | | | | — | |
| | | | | | | | | | | | | | | | | | | | | | | | |
Profit before tax | | | — | | | | — | | | | 10.2 | | | | 9.2 | | | | 24.5 | | | | 43.9 | |
Income tax expense | | | — | | | | — | | | | (13.8 | ) | | | (10.9 | ) | | | (0.4 | ) | | | (25.1 | ) |
| | | | | | | | | | | | | | | | | | | | | | | | |
(Loss)/profit for the period from continuing operations | | | — | | | | — | | | | (3.6 | ) | | | (1.7 | ) | | | 24.1 | | | | 18.8 | |
| | | | | | | | | | | | | | | | | | | | | | | | |
| | | | | | |
Discontinued operations | | | | | | | | | | | | | | | | | | | | | | | | |
Loss for the period from discontinued operations | | | — | | | | — | | | | (12.0 | ) | | | (0.8 | ) | | | — | | | | (12.8 | ) |
| | | | | | | | | | | | | | | | | | | | | | | | |
(Loss)/profit for the period | | | — | | | | — | | | | (15.6 | ) | | | (2.5 | ) | | | 24.1 | | | | 6.0 | |
Non-controlling interests | | | — | | | | — | | | | — | | | | (21.6 | ) | | | — | | | | (21.6 | ) |
| | | | | | | | | | | | | | | | | | | | | | | | |
(Loss)/profit for the period attributable to equity shareholders | | | — | | | | — | | | | (15.6 | ) | | | (24.1 | ) | | | 24.1 | | | | (15.6 | ) |
| | | | | | | | | | | | | | | | | | | | | | | | |
F-83
Pinafore Holdings B.V.
Group Financial Statements
NOTES TO THE CONSOLIDATED FINANCIAL STATEMENTS (CONTINUED)
| 47. | Condensed consolidating financial information continued |
E. Consolidated cash flow statement
| | | | | | | | | | | | | | | | | | | | | | | | |
Fiscal 2011 | | Company
$ million | | | Issuers
$ million | | | Other
guarantor
subsidiaries
$ million | | | Non-
guarantor
subsidiaries
$ million | | | Consolidation
adjustments
$ million | | | Total
Group
$ million | |
Operating activities | | | | | | | | | | | | | | | | | | | | | | | | |
Cash (absorbed)/generated from operations | | | (1.5 | ) | | | (2.2 | ) | | | 261.5 | | | | 353.2 | | | | — | | | | 611.0 | |
Income taxes paid | | | — | | | | — | | | | (22.8 | ) | | | (81.6 | ) | | | — | | | | (104.4 | ) |
Income taxes received | | | — | | | | — | | | | 13.3 | | | | 2.0 | | | | — | | | | 15.3 | |
| | | | | | | | | | | | | | | | | | | | | | | | |
Net cash (outflow)/inflow from operating activities | | | (1.5 | ) | | | (2.2 | ) | | | 252.0 | | | | 273.6 | | | | — | | | | 521.9 | |
| | | | | | | | | | | | | | | | | | | | | | | | |
| | | | | | |
Investing activities | | | | | | | | | | | | | | | | | | | | | | | | |
Purchase of property, plant and equipment | | | — | | | | — | | | | (53.6 | ) | | | (57.6 | ) | | | 2.8 | | | | (108.4 | ) |
Purchase of computer software | | | — | | | | — | | | | (6.4 | ) | | | (1.4 | ) | | | — | | | | (7.8 | ) |
Capitalization of development costs | | | — | | | | — | | | | (1.8 | ) | | | — | | | | — | | | | (1.8 | ) |
Disposal of property, plant and equipment | | | — | | | | — | | | | 9.7 | | | | 10.6 | | | | (2.8 | ) | | | 17.5 | |
Investments in associates | | | — | | | | — | | | | (0.4 | ) | | | — | | | | — | | | | (0.4 | ) |
Purchase of interests in subsidiaries, net of cash acquired | | | — | | | | — | | | | (37.0 | ) | | | — | | | | 7.4 | | | | (29.6 | ) |
Sale of businesses and subsidiaries, net of cash disposed | | | — | | | | — | | | | 240.1 | | | | 236.9 | | | | (1.3 | ) | | | 475.7 | |
Interest received | | | 0.2 | | | | 228.3 | | | | 24.1 | | | | 14.8 | | | | (265.4 | ) | | | 2.0 | |
Dividends received from associates | | | — | | | | — | | | | 0.3 | | | | 0.2 | | | | — | | | | 0.5 | |
Dividends received from subsidiaries | | | — | | | | — | | | | 355.6 | | | | — | | | | (355.6 | ) | | | — | |
| | | | | | | | | | | | | | | | | | | | | | | | |
Net cash inflow from investing activities | | | 0.2 | | | | 228.3 | | | | 530.6 | | | | 203.5 | | | | (614.9 | ) | | | 347.7 | |
| | | | | | | | | | | | | | | | | | | | | | | | |
| | | | | | |
Financing activities | | | | | | | | | | | | | | | | | | | | | | | | |
Issue of shares | | | 1.8 | | | | — | | | | — | | | | 6.0 | | | | (7.8 | ) | | | — | |
Draw-down of bank and other loans | | | — | | | | — | | | | 1.2 | | | | 0.7 | | | | — | | | | 1.9 | |
Repayment of bank and other loans | | | — | | | | (346.4 | ) | | | (203.3 | ) | | | — | | | | — | | | | (549.7 | ) |
Loans from/(to) Group companies | | | 0.5 | | | | 455.8 | | | | (381.7 | ) | | | (74.6 | ) | | | — | | | | — | |
Receipts on foreign currency derivatives | | | — | | | | — | | | | 5.0 | | | | — | | | | — | | | | 5.0 | |
Premium on redemption of debt instruments | | | — | | | | (3.4 | ) | | | (0.4 | ) | | | — | | | | — | | | | (3.8 | ) |
Capital element of finance lease rental payments | | | — | | | | — | | | | (0.2 | ) | | | (0.3 | ) | | | — | | | | (0.5 | ) |
Interest element of finance lease rental payments | | | — | | | | — | | | | (0.2 | ) | | | — | | | | — | | | | (0.2 | ) |
Movement in collateralized cash | | | — | | | | — | | | | 30.5 | | | | — | | | | — | | | | 30.5 | |
Purchase of non-controlling interest | | | — | | | | — | | | | (13.1 | ) | | | — | | | | — | | | | (13.1 | ) |
Return of management investment | | | (0.7 | ) | | | — | | | | — | | | | — | | | | — | | | | (0.7 | ) |
Purchase of own shares | | | (0.3 | ) | | | — | | | | (1.7 | ) | | | — | | | | 1.7 | | | | (0.3 | ) |
Interest paid | | | — | | | | (198.5 | ) | | | (264.6 | ) | | | (17.3 | ) | | | 265.4 | | | | (215.0 | ) |
Financing costs paid | | | — | | | | (36.9 | ) | | | — | | | | — | | | | — | | | | (36.9 | ) |
Equity dividend paid | | | — | | | | — | | | | — | | | | (355.6 | ) | | | 355.6 | | | | — | |
Investment by a minority shareholder in a subsidiary | | | — | | | | — | | | | — | | | | 1.5 | | | | — | | | | 1.5 | |
Dividend paid to a minority shareholder in a subsidiary | | | — | | | | — | | | | — | | | | (64.4 | ) | | | — | | | | (64.4 | ) |
| | | | | | | | | | | | | | | | | | | | | | | | |
Net cash inflow/(outflow) from financing activities | | | 1.3 | | | | (129.4 | ) | | | (828.5 | ) | | | (504.0 | ) | | | 614.9 | | | | (845.7 | ) |
| | | | | | | | | | | | | | | | | | | | | | | | |
| | | | | | |
Increase/(decrease) in net cash and cash equivalents | | | — | | | | 96.7 | | | | (45.9 | ) | | | (26.9 | ) | | | — | | | | 23.9 | |
Net cash and cash equivalents at the beginning of the period | | | — | | | | 3.1 | | | | 226.1 | | | | 223.0 | | | | — | | | | 452.2 | |
Foreign currency translation | | | — | | | | — | | | | 10.7 | | | | (12.3 | ) | | | — | | | | (1.6 | ) |
| | | | | | | | | | | | | | | | | | | | | | | | |
Net cash and cash equivalents at the end of the period | | | — | | | | 99.8 | | | | 190.9 | | | | 183.8 | | | | — | | | | 474.5 | |
| | | | | | | | | | | | | | | | | | | | | | | | |
F-84
Pinafore Holdings B.V.
Group Financial Statements
NOTES TO THE CONSOLIDATED FINANCIAL STATEMENTS (CONTINUED)
| 47. | Condensed consolidating financial information continued |
F. Consolidated cash flow statement
| | | | | | | | | | | | | | | | | | | | | | | | |
Q4 2010 | | Company
$ million | | | Issuers
$ million | | | Other
guarantor
subsidiaries
$ million | | | Non-
guarantor
subsidiaries
$ million | | | Consolidation
adjustments
$ million | | | Total
Group
$ million | |
Operating activities | | | | | | | | | | | | | | | | | | | | | | | | |
Cash (absorbed)/generated from operations | | | — | | | | — | | | | (70.2 | ) | | | 136.5 | | | | — | | | | 66.3 | |
Income taxes paid | | | — | | | | (0.8 | ) | | | (6.2 | ) | | | (15.3 | ) | | | — | | | | (22.3 | ) |
Income taxes received | | | — | | | | — | | | | 1.4 | | | | — | | | | — | | | | 1.4 | |
| | | | | | | | | | | | | | | | | | | | | | | | |
Net cash (outflow)/inflow from operating activities | | | — | | | | (0.8 | ) | | | (75.0 | ) | | | 121.2 | | | | — | | | | 45.4 | |
| | | | | | | | | | | | | | | | | | | | | | | | |
| | | | | | |
Investing activities | | | | | | | | | | | | | | | | | | | | | | | | |
Purchase of property, plant and equipment | | | — | | | | — | | | | (29.6 | ) | | | (33.8 | ) | | | 3.2 | | | | (60.2 | ) |
Capitalization of development costs | | | — | | | | — | | | | (2.3 | ) | | | — | | | | — | | | | (2.3 | ) |
Disposal of property, plant and equipment | | | — | | | | — | | | | 1.3 | | | | 4.6 | | | | (3.2 | ) | | | 2.7 | |
Investments in associates | | | — | | | | — | | | | (0.5 | ) | | | — | | | | — | | | | (0.5 | ) |
Purchase of interests in subsidiaries, net of cash acquired | | | (2,124.7 | ) | | | — | | | | (4,391.7 | ) | | | 159.5 | | | | 2,313.0 | | | | (4,043.9 | ) |
Sale of businesses and subsidiaries, net of cash disposed | | | — | | | | — | | | | 4.3 | | | | 38.1 | | | | (38.4 | ) | | | 4.0 | |
Interest received | | | — | | | | 71.4 | | | | 10.5 | | | | 4.0 | | | | (84.5 | ) | | | 1.4 | |
Dividends received from subsidiaries | | | — | | | | — | | | | (0.2 | ) | | | — | | | | 0.2 | | | | — | |
| | | | | | | | | | | | | | | | | | | | | | | | |
Net cash (outflow)/inflow from investing activities | | | (2,124.7 | ) | | | 71.4 | | | | (4,408.2 | ) | | | 172.4 | | | | 2,190.3 | | | | (4,098.8 | ) |
| | | | | | | | | | | | | | | | | | | | | | | | |
| | | | | | |
Financing activities | | | | | | | | | | | | | | | | | | | | | | | | |
Issue of shares | | | 2,142.3 | | | | 149.8 | | | | 2,124.7 | | | | 0.1 | | | | (2,274.6 | ) | | | 2,142.3 | |
Draw-down of bank and other loans | | | — | | | | 3,150.0 | | | | — | | | | — | | | | — | | | | 3,150.0 | |
Repayment of bank and other loans | | | — | | | | (26.8 | ) | | | (433.3 | ) | | | (0.3 | ) | | | — | | | | (460.4 | ) |
Loans (to)/from Group companies | | | (17.6 | ) | | | (3,124.3 | ) | | | 3,206.4 | | | | (64.5 | ) | | | — | | | | — | |
Payments on foreign currency derivatives | | | — | | | | — | | | | (2.2 | ) | | | — | | | | — | | | | (2.2 | ) |
Premium on redemption of debt instruments | | | — | | | | — | | | | (4.6 | ) | | | — | | | | — | | | | (4.6 | ) |
Capital element of finance lease rental payments | | | — | | | | — | | | | — | | | | (0.2 | ) | | | — | | | | (0.2 | ) |
Movement in collateralized cash | | | — | | | | — | | | | (44.9 | ) | | | — | | | | — | | | | (44.9 | ) |
Interest paid | | | — | | | | (33.8 | ) | | | (101.3 | ) | | | (7.5 | ) | | | 84.5 | | | | (58.1 | ) |
Financing costs paid | | | — | | | | (182.4 | ) | | | — | | | | — | | | | — | | | | (182.4 | ) |
Equity dividend paid | | | — | | | | — | | | | — | | | | 0.2 | | | | (0.2 | ) | | | — | |
Investment by a minority shareholder in a subsidiary | | | — | | | | — | | | | 11.7 | | | | — | | | | — | | | | 11.7 | |
| | | | | | | | | | | | | | | | | | | | | | | | |
Net cash inflow/(outflow) from financing activities | | | 2,124.7 | | | | (67.5 | ) | | | 4,756.5 | | | | (72.2 | ) | | | (2,190.3 | ) | | | 4,551.2 | |
| | | | | | | | | | | | | | | | | | | | | | | | |
| | | | | | |
Increase in net cash and cash equivalents | | | — | | | | 3.1 | | | | 273.3 | | | | 221.4 | | | | — | | | | 497.8 | |
Net cash and cash equivalents at the beginning of the period | | | — | | | | — | | | | — | | | | — | | | | — | | | | — | |
Foreign currency translation | | | — | | | | — | | | | (47.2 | ) | | | 1.6 | | | | — | | | | (45.6 | ) |
| | | | | | | | | | | | | | | | | | | | | | | | |
Net cash and cash equivalents at the end of the period | | | — | | | | 3.1 | | | | 226.1 | | | | 223.0 | | | | — | | | | 452.2 | |
| | | | | | | | | | | | | | | | | | | | | | | | |
F-85
Pinafore Holdings B.V.
Group Financial Statements
NOTES TO THE CONSOLIDATED FINANCIAL STATEMENTS (CONTINUED)
| 47. | Condensed consolidating financial information continued |
G. Consolidated cash flow statement
| | | | | | | | | | | | | | | | | | | | | | | | |
9M 2010 | | Company
$ million | | | Issuers
$ million | | | Other
guarantor
subsidiaries
$ million | | | Non-
guarantor
subsidiaries
$ million | | | Consolidation
adjustments
$ million | | | Total
Group
$ million | |
Operating activities | | | | | | | | | | | | | | | | | | | | | | | | |
Cash generated from operations | | | — | | | | — | | | | 104.3 | | | | 110.9 | | | | — | | | | 215.2 | |
Income taxes paid | | | — | | | | — | | | | (40.1 | ) | | | (26.1 | ) | | | — | | | | (66.2 | ) |
Income taxes received | | | — | | | | — | | | | 43.5 | | | | 2.2 | | | | — | | | | 45.7 | |
| | | | | | | | | | | | | | | | | | | | | | | | |
Net cash inflow from operating activities | | | — | | | | — | | | | 107.7 | | | | 87.0 | | | | — | | | | 194.7 | |
| | | | | | | | | | | | | | | | | | | | | | | | |
| | | | | | |
Investing activities | | | | | | | | | | | | | | | | | | | | | | | | |
Purchase of property, plant and equipment | | | — | | | | — | | | | (45.0 | ) | | | (45.4 | ) | | | 0.4 | | | | (90.0 | ) |
Purchase of computer software | | | — | | | | — | | | | (4.3 | ) | | | (1.4 | ) | | | — | | | | (5.7 | ) |
Capitalization of development costs | | | — | | | | — | | | | (0.5 | ) | | | — | | | | — | | | | (0.5 | ) |
Disposal of property, plant and equipment | | | — | | | | — | | | | 17.7 | | | | 7.3 | | | | (0.4 | ) | | | 24.6 | |
Purchase of interests in subsidiaries, net of cash acquired | | | — | | | | — | | | | (46.8 | ) | | | (36.1 | ) | | | 41.7 | | | | (41.2 | ) |
Sale of businesses and subsidiaries, net of cash disposed | | | — | | | | — | | | | (4.1 | ) | | | 0.1 | | | | — | | | | (4.0 | ) |
Interest received | | | — | | | | — | | | | 24.3 | | | | 10.2 | | | | (21.2 | ) | | | 13.3 | |
Dividends received from associates | | | — | | | | — | | | | 0.3 | | | | 0.2 | | | | — | | | | 0.5 | |
Dividends received from subsidiaries | | | — | | | | — | | | | 74.3 | | | | — | | | | (74.3 | ) | | | — | |
| | | | | | | | | | | | | | | | | | | | | | | | |
Net cash inflow/(outflow) from investing activities | | | — | | | | — | | | | 15.9 | | | | (65.1 | ) | | | (53.8 | ) | | | (103.0 | ) |
| | | | | | | | | | | | | | | | | | | | | | | | |
| | | | | | |
Financing activities | | | | | | | | | | | | | | | | | | | | | | | | |
Issue of ordinary shares | | | — | | | | — | | | | 41.0 | | | | 6.2 | | | | (41.7 | ) | | | 5.5 | |
Repayment of bank and other loans | | | — | | | | — | | | | (0.8 | ) | | | — | | | | — | | | | (0.8 | ) |
Loans (to)/from Group companies | | | — | | | | — | | | | (24.7 | ) | | | 24.7 | | | | — | | | | — | |
Payments on foreign currency derivatives | | | — | | | | — | | | | (20.3 | ) | | | — | | | | — | | | | (20.3 | ) |
Settlement of interest rate swaps | | | — | | | | — | | | | 64.7 | | | | — | | | | — | | | | 64.7 | |
Capital element of finance lease rental payments | | | — | | | | — | | | | (0.3 | ) | | | (0.4 | ) | | | — | | | | (0.7 | ) |
Interest element of finance lease rental payments | | | — | | | | — | | | | (0.2 | ) | | | — | | | | — | | | | (0.2 | ) |
Purchase of own shares | | | — | | | | — | | | | (6.2 | ) | | | — | | | | — | | | | (6.2 | ) |
Interest paid | | | — | | | | — | | | | (20.6 | ) | | | (15.8 | ) | | | 21.2 | | | | (15.2 | ) |
Equity dividend paid | | | — | | | | — | | | | (56.9 | ) | | | (74.3 | ) | | | 74.3 | | | | (56.9 | ) |
Dividend paid to a minority shareholder in a subsidiary | | | — | | | | — | | | | (1.1 | ) | | | (10.9 | ) | | | — | | | | (12.0 | ) |
| | | | | | | | | | | | | | | | | | | | | | | | |
Net cash outflow from financing activities | | | — | | | | — | | | | (25.4 | ) | | | (70.5 | ) | | | 53.8 | | | | (42.1 | ) |
| | | | | | | | | | | | | | | | | | | | | | | | |
| | | | | | |
Increase/(decrease) in net cash and cash equivalents | | | — | | | | — | | | | 98.2 | | | | (48.6 | ) | | | — | | | | 49.6 | |
Net cash and cash equivalents at the beginning of the period | | | — | | | | — | | | | 236.6 | | | | 203.6 | | | | — | | | | 440.2 | |
Foreign currency translation | | | — | | | | — | | | | (3.1 | ) | | | 4.4 | | | | — | | | | 1.3 | |
| | | | | | | | | | | | | | | | | | | | | | | | |
Net cash and cash equivalents at the end of the period | | | — | | | | — | | | | 331.7 | | | | 159.4 | | | | — | | | | 491.1 | |
| | | | | | | | | | | | | | | | | | | | | | | | |
F-86
Pinafore Holdings B.V.
Group Financial Statements
NOTES TO THE CONSOLIDATED FINANCIAL STATEMENTS (CONTINUED)
| 47. | Condensed consolidating financial information continued |
H. Consolidated cash flow statement
| | | | | | | | | | | | | | | | | | | | | | | | |
Fiscal 2009 | | Company
$ million | | | Issuers
$ million | | | Other
guarantor
subsidiaries
$ million | | | Non-
guarantor
subsidiaries
$ million | | | Consolidation
adjustments
$ million | | | Total
Group
$ million | |
Operating activities | | | | | | | | | | | | | | | | | | | | | | | | |
Cash generated from operations | | | — | | | | — | | | | 291.0 | | | | 241.1 | | | | — | | | | 532.1 | |
Income taxes paid | | | — | | | | — | | | | (26.0 | ) | | | (24.3 | ) | | | — | | | | (50.3 | ) |
Income taxes received | | | — | | | | — | | | | 31.2 | | | | — | | | | — | | | | 31.2 | |
| | | | | | | | | | | | | | | | | | | | | | | | |
Net cash inflow from operating activities | | | — | | | | — | | | | 296.2 | | | | 216.8 | | | | — | | | | 513.0 | |
| | | | | | | | | | | | | | | | | | | | | | | | |
| | | | | | |
Investing activities | | | | | | | | | | | | | | | | | | | | | | | | |
Purchase of property, plant and equipment | | | — | | | | — | | | | (52.0 | ) | | | (64.8 | ) | | | 1.6 | | | | (115.2 | ) |
Purchase of computer software | | | — | | | | — | | | | (4.9 | ) | | | (2.9 | ) | | | — | | | | (7.8 | ) |
Capitalization of development costs | | | — | | | | — | | | | (0.6 | ) | | | — | | | | — | | | | (0.6 | ) |
Disposal of property, plant and equipment | | | — | | | | — | | | | 3.7 | | | | 10.8 | | | | (1.6 | ) | | | 12.9 | |
Investments in associates | | | — | | | | — | | | | (2.7 | ) | | | — | | | | — | | | | (2.7 | ) |
Purchase of interests in subsidiaries, net of cash acquired | | | — | | | | — | | | | (86.7 | ) | | | 0.7 | | | | 59.5 | | | | (26.5 | ) |
Sale of businesses and subsidiaries, net of cash disposed | | | — | | | | — | | | | 41.1 | | | | 3.4 | | | | (43.8 | ) | | | 0.7 | |
Interest received | | | — | | | | — | | | | 18.8 | | | | 15.4 | | | | (30.6 | ) | | | 3.6 | |
Dividends received from associates | | | — | | | | — | | | | 0.3 | | | | — | | | | — | | | | 0.3 | |
Dividends received from subsidiaries | | | — | | | | — | | | | 157.5 | | | | — | | | | (157.5 | ) | | | — | |
| | | | | | | | | | | | | | | | | | | | | | | | |
Net cash inflow/(outflow) from investing activities | | | — | | | | — | | | | 74.5 | | | | (37.4 | ) | | | (172.4 | ) | | | (135.3 | ) |
| | | | | | | | | | | | | | | | | | | | | | | | |
| | | | | | |
Financing activities | | | | | | | | | | | | | | | | | | | | | | | | |
Issue of ordinary shares | | | — | | | | — | | | | 0.1 | | | | 15.7 | | | | (15.7 | ) | | | 0.1 | |
Draw-down of bank and other loans | | | — | | | | — | | | | 1.8 | | | | 1.0 | | | | — | | | | 2.8 | |
Repayment of bank and other loans | | | — | | | | — | | | | (142.8 | ) | | | (21.6 | ) | | | — | | | | (164.4 | ) |
Loans (to)/from Group companies | | | — | | | | — | | | | (31.3 | ) | | | 31.3 | | | | — | | | | — | |
Receipts on foreign currency derivatives | | | — | | | | — | | | | 39.6 | | | | — | | | | — | | | | 39.6 | |
Capital element of finance lease rental payments | | | — | | | | — | | | | (0.4 | ) | | | (2.4 | ) | | | — | | | | (2.8 | ) |
Interest element of finance lease rental payments | | | — | | | | — | | | | (0.2 | ) | | | (0.2 | ) | | | — | | | | (0.4 | ) |
Movement in collateralized cash | | | — | | | | — | | | | — | | | | 2.1 | | | | — | | | | 2.1 | |
Purchase of own shares | | | — | | | | — | | | | (1.4 | ) | | | — | | | | — | | | | (1.4 | ) |
Interest paid | | | — | | | | — | | | | (48.5 | ) | | | (19.6 | ) | | | 30.6 | | | | (37.5 | ) |
Financing costs paid | | | — | | | | — | | | | (6.3 | ) | | | — | | | | — | | | | (6.3 | ) |
Equity dividend paid | | | — | | | | — | | | | (48.3 | ) | | | (157.5 | ) | | | 157.5 | | | | (48.3 | ) |
Investment by a minority shareholder in a subsidiary | | | — | | | | — | | | | — | | | | 4.7 | | | | — | | | | 4.7 | |
Dividend paid to a minority shareholder in a subsidiary | | | — | | | | — | | | | — | | | | (8.7 | ) | | | — | | | | (8.7 | ) |
| | | | | | | | | | | | | | | | | | | | | | | | |
Net cash outflow from financing activities | | | — | | | | — | | | | (237.7 | ) | | | (155.2 | ) | | | 172.4 | | | | (220.5 | ) |
| | | | | | | | | | | | | | | | | | | | | | | | |
| | | | | | |
Increase in net cash and cash equivalents | | | — | | | | — | | | | 133.0 | | | | 24.2 | | | | — | | | | 157.2 | |
Net cash and cash equivalents at the beginning of the period | | | — | | | | — | | | | 108.4 | | | | 169.8 | | | | — | | | | 278.2 | |
Foreign currency translation | | | — | | | | — | | | | (4.8 | ) | | | 9.6 | | | | — | | | | 4.8 | |
| | | | | | | | | | | | | | | | | | | | | | | | |
Net cash and cash equivalents at the end of the period | | | — | | | | — | | | | 236.6 | | | | 203.6 | | | | — | | | | 440.2 | |
| | | | | | | | | | | | | | | | | | | | | | | | |
F-87
Pinafore Holdings B.V.
Group Financial Statements
NOTES TO THE CONSOLIDATED FINANCIAL STATEMENTS (CONTINUED)
| 47. | Condensed consolidating financial information continued |
I. Consolidated balance sheet
| | | | | | | | | | | | | | | | | | | | | | | | |
As at December 31, 2011 | | Company
$ million | | | Issuers
$ million | | | Other
guarantor
subsidiaries
$ million | | | Non-
guarantor
subsidiaries
$ million | | | Consolidation
adjustments
$ million | | | Total
Group
$ million | |
Non-current assets | | | | | | | | | | | | | | | | | | | | | | | | |
Goodwill | | | — | | | | — | | | | 823.2 | | | | 762.2 | | | | — | | | | 1,585.4 | |
Other intangible assets | | | — | | | | — | | | | 1,239.2 | | | | 692.0 | | | | — | | | | 1,931.2 | |
Property, plant and equipment | | | — | | | | — | | | | 439.8 | | | | 463.1 | | | | — | | | | 902.9 | |
Investments in subsidiaries under the equity method | | | 2,058.6 | | | | — | | | | 2,612.5 | | | | — | | | | (4,671.1 | ) | | | — | |
Investments in associates | | | — | | | | — | | | | 4.3 | | | | 2.3 | | | | — | | | | 6.6 | |
Trade and other receivables | | | — | | | | 7.4 | | | | 9.0 | | | | 3.7 | | | | — | | | | 20.1 | |
Deferred tax assets | | | — | | | | — | | | | 3.3 | | | | 6.6 | | | | (2.0 | ) | | | 7.9 | |
Post-employment benefit surpluses | | | — | | | | — | | | | 6.7 | | | | — | | | | — | | | | 6.7 | |
| | | | | | | | | | | | | | | | | | | | | | | | |
| | | 2,058.6 | | | | 7.4 | | | | 5,138.0 | | | | 1,929.9 | | | | (4,673.1 | ) | | | 4,460.8 | |
| | | | | | | | | | | | | | | | | | | | | | | | |
Current assets | | | | | | | | | | | | | | | | | | | | | | | | |
Inventories | | | — | | | | — | | | | 359.7 | | | | 213.4 | | | | (1.4 | ) | | | 571.7 | |
Trade and other receivables | | | 17.6 | | | | 2,811.0 | | | | 893.3 | | | | 1,290.2 | | | | (4,283.7 | ) | | | 728.4 | |
Income tax recoverable | | | — | | | | — | | | | 11.0 | | | | 10.3 | | | | (0.8 | ) | | | 20.5 | |
Available-for-sale investments | | | — | | | | — | | | | — | | | | 1.1 | | | | — | | | | 1.1 | |
Cash and cash equivalents | | | — | | | | 99.8 | | | | 196.4 | | | | 183.8 | | | | — | | | | 480.0 | |
| | | | | | | | | | | | | | | | | | | | | | | | |
| | | 17.6 | | | | 2,910.8 | | | | 1,460.4 | | | | 1,698.8 | | | | (4,285.9 | ) | | | 1,801.7 | |
| | | | | | | | | | | | | | | | | | | | | | | | |
Assets held for sale | | | — | | | | — | | | | 388.8 | | | | 53.9 | | | | — | | | | 442.7 | |
| | | | | | | | | | | | | | | | | | | | | | | | |
Total assets | | | 2,076.2 | | | | 2,918.2 | | | | 6,987.2 | | | | 3,682.6 | | | | (8,959.0 | ) | | | 6,705.2 | |
| | | | | | | | | | | | | | | | | | | | | | | | |
| | | | | | |
Current liabilities | | | | | | | | | | | | | | | | | | | | | | | | |
Bank overdrafts | | | — | | | | — | | | | (5.5 | ) | | | — | | | | — | | | | (5.5 | ) |
Bank and other loans | | | — | | | | (19.8 | ) | | | (22.6 | ) | | | — | | | | — | | | | (42.4 | ) |
Obligations under finance leases | | | — | | | | — | | | | (0.2 | ) | | | — | | | | — | | | | (0.2 | ) |
Trade and other payables | | | (0.7 | ) | | | (1.9 | ) | | | (363.7 | ) | | | (331.2 | ) | | | 152.5 | | | | (545.0 | ) |
Income tax liabilities | | | — | | | | — | | | | (52.5 | ) | | | (33.9 | ) | | | 0.9 | | | | (85.5 | ) |
Provisions | | | — | | | | — | | | | (18.9 | ) | | | (15.0 | ) | | | — | | | | (33.9 | ) |
| | | | | | | | | | | | | | | | | | | | | | | | |
| | | (0.7 | ) | | | (21.7 | ) | | | (463.4 | ) | | | (380.1 | ) | | | 153.4 | | | | (712.5 | ) |
| | | | | | | | | | | | | | | | | | | | | | | | |
Non-current liabilities | | | | | | | | | | | | | | | | | | | | | | | | |
Bank and other loans | | | — | | | | (2,590.7 | ) | | | (20.4 | ) | | | (0.6 | ) | | | — | | | | (2,611.7 | ) |
Obligations under finance leases | | | — | | | | — | | | | (2.6 | ) | | | — | | | | — | | | | (2.6 | ) |
Trade and other payables | | | (0.6 | ) | | | (182.4 | ) | | | (3,723.8 | ) | | | (271.6 | ) | | | 4,131.2 | | | | (47.2 | ) |
Post-employment benefit obligations | | | — | | | | — | | | | (129.6 | ) | | | (67.5 | ) | | | — | | | | (197.1 | ) |
Deferred tax liabilities | | | — | | | | (1.8 | ) | | | (475.7 | ) | | | (175.4 | ) | | | 2.0 | | | | (650.9 | ) |
Provisions | | | — | | | | — | | | | (24.5 | ) | | | (0.8 | ) | | | — | | | | (25.3 | ) |
| | | | | | | | | | | | | | | | | | | | | | | | |
| | | (0.6 | ) | | | (2,774.9 | ) | | | (4,376.6 | ) | | | (515.9 | ) | | | 4,133.2 | | | | (3,534.8 | ) |
| | | | | | | | | | | | | | | | | | | | | | | | |
Liabilities directly associated with assets held for sale | | | — | | | | — | | | | (88.6 | ) | | | (25.7 | ) | | | — | | | | (114.3 | ) |
| | | | | | | | | | | | | | | | | | | | | | | | |
Total liabilities | | | (1.3 | ) | | | (2,796.6 | ) | | | (4,928.6 | ) | | | (921.7 | ) | | | 4,286.6 | | | | (4,361.6 | ) |
| | | | | | | | | | | | | | | | | | | | | | | | |
Net assets | | | 2,074.9 | | | | 121.6 | | | | 2,058.6 | | | | 2,760.9 | | | | (4,672.4 | ) | | | 2,343.6 | |
| | | | | | | | | | | | | | | | | | | | | | | | |
| | | | | | |
Capital and reserves | | | | | | | | | | | | | | | | | | | | | | | | |
Shareholders’ equity | | | 2,074.9 | | | | 121.6 | | | | 2,058.6 | | | | 2,492.2 | | | | (4,672.4 | ) | | | 2,074.9 | |
Non-controlling interests | | | — | | | | — | | | | — | | | | 268.7 | | | | — | | | | 268.7 | |
| | | | | | | | | | | | | | | | | | | | | | | | |
Total equity | | | 2,074.9 | | | | 121.6 | | | | 2,058.6 | | | | 2,760.9 | | | | (4,672.4 | ) | | | 2,343.6 | |
| | | | | | | | | | | | | | | | | | | | | | | | |
F-88
Pinafore Holdings B.V.
Group Financial Statements
NOTES TO THE CONSOLIDATED FINANCIAL STATEMENTS (CONTINUED)
| 47. | Condensed consolidating financial information continued |
J. Consolidated balance sheet
| | | | | | | | | | | | | | | | | | | | | | | | |
As at December 31, 2010 | | Company
$ million | | | Issuers
$ million | | | Other
guarantor
subsidiaries
$ million | | | Non-
guarantor
subsidiaries
$ million | | | Consolidation
adjustments
$ million | | | Total
Group
$ million | |
Non-current assets | | | | | | | | | | | | | | | | | | | | | | | | |
Goodwill | | | — | | | | — | | | | 809.2 | | | | 936.2 | | | | — | | | | 1,745.4 | |
Other intangible assets | | | — | | | | — | | | | 1,487.7 | | | | 780.8 | | | | — | | | | 2,268.5 | |
Property, plant and equipment | | | — | | | | — | | | | 669.9 | | | | 689.2 | | | | — | | | | 1,359.1 | |
Investments in subsidiaries under the equity method | | | 2,010.8 | | | | — | | | | 3,002.7 | | | | — | | | | (5,013.5 | ) | | | — | |
Investments in associates | | | — | | | | — | | | | 20.7 | | | | 2.9 | | | | — | | | | 23.6 | |
Trade and other receivables | | | — | | | | 10.1 | | | | 12.5 | | | | 3.6 | | | | — | | | | 26.2 | |
Deferred tax assets | | | — | | | | — | | | | — | | | | 31.9 | | | | (22.3 | ) | | | 9.6 | |
Post-employment benefit surpluses | | | — | | | | — | | | | — | | | | 3.6 | | | | — | | | | 3.6 | |
| | | | | | | | | | | | | | | | | | | | | | | | |
| | | 2,010.8 | | | | 10.1 | | | | 6,002.7 | | | | 2,448.2 | | | | (5,035.8 | ) | | | 5,436.0 | |
| | | | | | | | | | | | | | | | | | | | | | | | |
Current assets | | | | | | | | | | | | | | | | | | | | | | | | |
Inventories | | | — | | | | — | | | | 435.7 | | | | 271.6 | | | | (13.8 | ) | | | 693.5 | |
Trade and other receivables | | | 17.5 | | | | 3,223.6 | | | | 1,069.0 | | | | 1,424.5 | | | | (4,820.1 | ) | | | 914.5 | |
Income tax recoverable | | | — | | | | — | | | | 8.3 | | | | 2.7 | | | | — | | | | 11.0 | |
Available-for-sale investments | | | — | | | | — | | | | — | | | | 1.4 | | | | — | | | | 1.4 | |
Cash and cash equivalents | | | — | | | | 3.1 | | | | 228.5 | | | | 227.7 | | | | — | | | | 459.3 | |
| | | | | | | | | | | | | | | | | | | | | | | | |
| | | 17.5 | | | | 3,226.7 | | | | 1,741.5 | | | | 1,927.9 | | | | (4,833.9 | ) | | | 2,079.7 | |
| | | | | | | | | | | | | | | | | | | | | | | | |
Assets held for sale | | | — | | | | — | | | | 29.7 | | | | 6.9 | | | | — | | | | 36.6 | |
| | | | | | | | | | | | | | | | | | | | | | | | |
Total assets | | | 2,028.3 | | | | 3,236.8 | | | | 7,773.9 | | | | 4,383.0 | | | | (9,869.7 | ) | | | 7,552.3 | |
| | | | | | | | | | | | | | | | | | | | | | | | |
| | | | | | |
Current liabilities | | | | | | | | | | | | | | | | | | | | | | | | |
Bank overdrafts | | | — | | | | — | | | | (2.4 | ) | | | (4.7 | ) | | | — | | | | (7.1 | ) |
Bank and other loans | | | — | | | | (37.9 | ) | | | (217.8 | ) | | | — | | | | — | | | | (255.7 | ) |
Obligations under finance leases | | | — | | | | — | | | | (0.2 | ) | | | (0.3 | ) | | | — | | | | (0.5 | ) |
Trade and other payables | | | — | | | | (44.0 | ) | | | (436.5 | ) | | | (422.3 | ) | | | 198.4 | | | | (704.4 | ) |
Income tax liabilities | | | — | | | | — | | | | (68.0 | ) | | | (38.8 | ) | | | — | | | | (106.8 | ) |
Provisions | | | — | | | | — | | | | (25.5 | ) | | | (40.1 | ) | | | — | | | | (65.6 | ) |
| | | | | | | | | | | | | | | | | | | | | | | | |
| | | — | | | | (81.9 | ) | | | (750.4 | ) | | | (506.2 | ) | | | 198.4 | | | | (1,140.1 | ) |
| | | | | | | | | | | | | | | | | | | | | | | | |
Non-current liabilities | | | | | | | | | | | | | | | | | | | | | | | | |
Bank and other loans | | | — | | | | (2,872.3 | ) | | | (26.6 | ) | | | — | | | | — | | | | (2,898.9 | ) |
Obligations under finance leases | | | — | | | | — | | | | (2.8 | ) | | | — | | | | — | | | | (2.8 | ) |
Trade and other payables | | | — | | | | (107.5 | ) | | | (4,169.3 | ) | | | (410.4 | ) | | | 4,621.8 | | | | (65.4 | ) |
Post-employment benefit obligations | | | — | | | | — | | | | (204.6 | ) | | | (74.6 | ) | | | — | | | | (279.2 | ) |
Deferred tax liabilities | | | — | | | | (7.2 | ) | | | (578.5 | ) | | | (232.9 | ) | | | 25.3 | | | | (793.3 | ) |
Provisions | | | — | | | | — | | | | (22.8 | ) | | | (1.9 | ) | | | — | | | | (24.7 | ) |
| | | | | | | | | | | | | | | | | | | | | | | | |
| | | — | | | | (2,987.0 | ) | | | (5,004.6 | ) | | | (719.8 | ) | | | 4,647.1 | | | | (4,064.3 | ) |
| | | | | | | | | | | | | | | | | | | | | | | | |
Liabilities directly associated with assets held for sale | | | — | | | | — | | | | (8.1 | ) | | | — | | | | — | | | | (8.1 | ) |
| | | | | | | | | | | | | | | | | | | | | | | | |
Total liabilities | | | — | | | | (3,068.9 | ) | | | (5,763.1 | ) | | | (1,226.0 | ) | | | 4,845.5 | | | | (5,212.5 | ) |
| | | | | | | | | | | | | | | | | | | | | | | | |
Net assets | | | 2,028.3 | | | | 167.9 | | | | 2,010.8 | | | | 3,157.0 | | | | (5,024.2 | ) | | | 2,339.8 | |
| | | | | | | | | | | | | | | | | | | | | | | | |
| | | | | | |
Capital and reserves | | | | | | | | | | | | | | | | | | | | | | | | |
Shareholders’ equity | | | 2,028.3 | | | | 167.9 | | | | 2,010.8 | | | | 2,845.5 | | | | (5,024.2 | ) | | | 2,028.3 | |
Non-controlling interests | | | — | | | | — | | | | — | | | | 311.5 | | | | — | | | | 311.5 | |
| | | | | | | | | | | | | | | | | | | | | | | | |
Total equity | | | 2,028.3 | | | | 167.9 | | | | 2,010.8 | | | | 3,157.0 | | | | (5,024.2 | ) | | | 2,339.8 | |
| | | | | | | | | | | | | | | | | | | | | | | | |
F-89
Pinafore Holdings B.V.
Item 19
Item 19. Exhibits
| | |
Ref. | | Description |
| |
| 1.1 | | Articles of Association of Pinafore Holdings B.V. |
| |
| 1.2(1) | | Partial Amendment of the Articles of Association of Pinafore Holdings B.V. |
| |
| 1.3(1) | | Certificate of Incorporation of Tomkins, Inc. |
| |
| 1.4(1) | | Certificate of Amendment to Certificate of Incorporation of Tomkins, Inc. |
| |
| 1.5(1) | | Bylaws of Tomkins, Inc. |
| |
| 1.6(1) | | Certificate of Formation of Tomkins, LLC |
| |
| 1.7(1) | | Certificate of Amendment to Certificate of Formation of Tomkins, LLC |
| |
| 1.8(1) | | Amended and Restated Limited Liability Company Agreement of Tomkins, LLC |
| |
| 2.1(1) | | Indenture, dated as of September 29, 2010, among Pinafore, LLC (now Tomkins, LLC), Pinafore, Inc. (now Tomkins, Inc.), Pinafore holdings B.V., the note guarantors named therein and Wilmington Trust FSB, as trustee. |
| |
| 2.2(1) | | First Supplemental Indenture, dated as of November 18, 2010, among Tomkins Mauritius Company Limited, Schrader Electronics Limited, ACD Tridon Inc., Ruskin Company Canada Inc., Tomkins Automotive Canada Limited and Wilmington Trust FSB, as trustee. |
| |
| 2.3(1) | | Second Supplemental Indenture, dated as of December 21, 2010, among Gates Engineering & Services Ltd., Gates Fleximak Ltd., Gates CIS LLC, Eifeler Maschinenbau GMBH, Gates Holding GMBH, Gates Mectrol GMBH, Tridon Clamp Products GMBH, Trion (Deutschland) GMBH and Wilmington Trust FSB, as trustee. |
| |
| 2.4(1) | | Third Supplemental Indenture, dated as of December 23, 2010, among Gates Power Transmission Europe BVBA and Wilmington Trust FSB, as trustee. |
| |
| 2.5(1) | | Fourth Supplemental Indenture, dated as of January 20, 2011, among Gates Engineering & Services Australia Pty Ltd CAN 142 531 244 and Wilmington Trust FSB, as trustee. |
| |
| 2.6(1) | | Fifth Supplemental Indenture, dated as of February 23, 2011, among Schrader International Brasil Ltda., AMP Industrial Mexicana, S.A. de C.V., Aplicadores Mexicanos, S.A. de C.V., Auto Industrial de Partes, S.A. de C.V., Ruskin de México, S.A. de C.V., Tomkins Poly Belt Mexicana, S.A. de C.V., Gates Powertrain Plastik Metal Ve Makina Sanayii Ve Ticaret Limited Sirketi, Gates Guc Aktarim Sistemler Dagitim Sanayi Ve Ticaret Limited Sirketi, Gates Engineering & Services FZCO and Wilmington Trust FSB, as trustee. |
| |
| 2.7(1) | | Sixth Supplemental Indenture, dated as of February 24, 2011, among Gates Powertrain UK Limited and Wilmington Trust FSB, as trustee. |
| |
| 2.8(1) | | Seventh Supplemental Indenture, dated as of March 3, 2011, among Gates Engineering & Services Hamriyah FZE and Wilmington Trust FSB, as trustee. |
| |
| 2.9(1) | | Form of 9% Senior Secured Second Lien Note due 2018 (included in Exhibit 4.2). |
| |
| 2.10(1) | | Registration Rights Agreement, dated as of September 29, 2010, by and among Pinafore, LLC (now Tomkins, LLC), Pinafore, Inc. (now Pinafore, Inc.), Pinafore Acquisitions Limited (now Tomkins Acquisitions Limited), the other guarantors party thereto, Banc of America Securities LLC, Citigroup Global Markets Inc., Barclays Capital Inc., RBC Capital Markets Corporation and UBS Securities LLC. |
| |
| 2.11(1) | | Eighth Supplemental Indenture, dated as of August 18, 2011, among St. Augustine Real Estate Holding LLC and Wilmington Trust, National Association, as trustee. |
| |
| 2.12 | | Ninth Supplemental Indenture, dated as of December 27, 2011, among Du-Tex Properties, LLC and Wilmington Trust, National Association (as successor by merger to Wilmington Trust FSB), as trustee. |
| |
| 2.13 | | Tenth Supplemental Indenture, dated as of December 27, 2011, among Gates E&S North America, Inc. and Wilmington Trust, National Association (as successor by merger to Wilmington Trust FSB), as trustee. |
| |
| 4.1(1) | | Credit Agreement, dated as of July 27, 2010 as amended and restated on August 6, 2010 and as further amended and restated on September 21, 2010 among Pinafore, LLC, Pinafore, Inc., Pinafore Acquisitions Limited, the guarantors party hereto, Citibank, N.A., as Administrative Agent, Collateral Agent, L/C Issuer and Swing Line Lender, each lender from time to time party hereto, Banc of America Securities LLC, as Syndication Agent, Citigroup Global Markets Inc., Banc of America Securities LLC, Barclays Capital, RBC Capital Markets and UBS Securities LLC, as Joint Lead Arrangers and Joint Bookrunners, and Citigroup Global Markets Inc., Barclays Bank PLC, RBC Capital Markets and UBS Securities LLC, as Co-Documentation Agents. |
| |
| 4.2(1) | | Amendment No. 3 to the Credit Agreement, dated as of September 28, 2010, among Pinafore, LLC, Pinafore, Inc., Pinafore Acquisitions Limited, the guarantors party hereto, Citibank, N.A., as Administrative Agent, Collateral Agent, L/C Issuer and Swing Line Lender, each lender from time to time party hereto, Banc of America Securities LLC, as Syndication Agent, Citigroup Global Markets Inc., Banc of America Securities LLC, Barclays Capital, RBC Capital Markets and UBS Securities LLC, as Joint Lead Arrangers and Joint Bookrunners, and Citigroup Global Markets Inc., Barclays Bank PLC, RBC Capital Markets and UBS Securities LLC, as Co-Documentation Agents. |
| |
| 4.3(1) | | Amendment No. 4 to the Credit Agreement, dated as of February 17, 2011, among Tomkins, LLC, Tomkins, Inc., Pinafore Holdings B.V., the guarantors party hereto, Citibank, N.A., as Administrative Agent, L/C Issuer and Swing Line Lender, Citicorp USA Inc., as Collateral Agreement, each lender from time to time party hereto, Merrill Lynch, Pierce, Fenner & Smith Incorporation, as Syndication Agent, Citigroup Global Markets Inc., Merrill Lynch, Pierce, Fenner & Smith Incorporated, Barclays Capital, RBC Capital Markets and UBS Securities LLC, as Joint Lead Arrangers and Joint Bookrunners, and Citigroup Global Markets Inc., Barclays Bank PLC, RBC Capital Markets and UBS Securities LLC, as Co-Documentation Agents. |
| |
| 4.4(1) | | US Security Agreement, dated as of July 27, 2010, as amended and restated on September 21, 2010, among the grantors identified therein and Citicorp USA, Inc., as collateral agent. |
| |
| 4.5(1) | | Supplement No. 1 to the US Security Agreement, dated as of September 29, 2010, among the grantors identified therein and Citicorp USA, Inc., as collateral agent. |
| |
| 4.6(1) | | US Second Lien Notes Security Agreement, dated as of September 29, 2010, among the grantors identified therein and Wilmington Trust FSB, as collateral agent. |
Pinafore Holdings B.V.
Item 19
| | |
Ref. | | Description |
| |
| 4.7(1) | | Security Agreement, dated as of September 30, 2010, between the chargors named therein and Citicorp USA, Inc. |
| |
| 4.8(1) | | Security Agreement, dated as of September 30, 2010, between the chargors named therein and Wilmington Trust FSB, as collateral agent. |
| |
| 4.9(1) | | Amendment No. 5 to the Credit Agreement, dated as of June 30, 2011, among Tomkins, LLC, Tomkins, Inc., Pinafore Holdings B.V., the guarantors party hereto, Citibank, N.A., as Administrative Agent, L/C Issuer and Swing Line Lender, Citicorp USA Inc., as Collateral Agreement, each lender from time to time party hereto, Merrill Lynch, Pierce, Fenner & Smith Incorporation, as Syndication Agent, Citigroup Global Markets Inc., Merrill Lynch, Pierce, Fenner & Smith Incorporated, Barclays Capital, RBC Capital Markets and UBS Securities LLC, as Joint Lead Arrangers and Joint Bookrunners, and Citigroup Global Markets Inc., Barclays Bank PLC, RBC Capital Markets and UBS Securities LLC, as Co-Documentation Agents. |
| |
| 7.1 | | Statement of Computation of Ratio of Earnings to Fixed Charges. |
| |
| 8.1 | | List of principal trading subsidiaries of the Company. |
| |
| 12.1 | | Certification of Principal Executive Officer pursuant to Rule 13 (a) – 14(a) of the Securities Exchange Act of 1934. |
| |
| 12.2 | | Certification of Principal Financial Officer pursuant to Rule 13 (a) – 14(a) of the Securities Exchange Act of 1934. |
| |
| 13.1 | | Certification of Principal Executive Officer and Principal Financial Officer pursuant to Rule 13(a) – 14 (b) of the Securities Exchange Act of 1934 and 18 USC. Section 1350, as adopted pursuant to Section 906 of the Sarbanes-Oxley Act of 2002. |
| (1) | Incorporated by reference to the Registrant’s Registration Statement on Form F-4 (Registration number 333-175137). |
Pursuant to Rule 3-09 of SEC Regulation S-X, the Registrant is required to file with its Form 20-F financial statements of certain entities accounted for under the equity method. However, the Company is pursuing its ability to obtain relief from this requirement with the Staff of the SEC.
Pinafore Holdings B.V.
Glossary of terms
Glossary of terms
| | |
| £, pound sterling, pence, p | | Pound sterling (£) and pence, the currency of the United Kingdom |
| |
| $, US dollar, cents, c | | US dollar ($) and cents, the currency of the United States of America |
| |
| 2011 Notes | | 8% £150 million notes outstanding under Tomkins’s Euro Medium Term Note Programme repayable at par on December 20, 2011 |
| |
| 2015 Notes | | 6.125% £250 million notes outstanding under Tomkins’s Euro Medium Term Note Programme repayable at par on September 16, 2015 |
| |
| 9M 2010 | | 38-week Predecessor reporting period from January 3, 2010 to September 24, 2010 |
| |
| AAIA | | Automotive Aftermarket Industry Association |
| |
| ABIP | | The Tomkins Annual Bonus Incentive Plan |
| |
| ACEA | | European Automobile Manufacturers Association |
| |
| Acquisition | | The acquisition of Tomkins plc in September 2010 |
| |
| Adjusted EBITDA | | Operating profit from continuing operations before restructuring costs, gains and losses on the disposal and exit of businesses and the amortization of intangible assets arising on acquisition (a non-GAAP measure) |
| |
| ADRs | | American Depositary Receipts |
| |
| AIA | | Architects Industry Association |
| |
| Annual Report | | This document |
| |
| Applicant | | A shareholder in Pinafore Holdings B.V. that wishes to transfer shares |
| |
| Articles | | The current Memorandum and Articles of Association of Pinafore Holdings B.V. |
| |
| A Shares | | Preferred ‘A’ shares of €3,600 each in the capital of Pinafore Holdings B.V. |
| |
| ATC | | ATC Management B.V. |
| |
| Board or Management Board | | The management board of Pinafore Holdings B.V. |
| |
| B Shares | | Ordinary ‘B’ shares of one eurocent (€0.01) each in the capital of Pinafore Holdings B.V. |
| |
| CAGR | | Compound annual growth rate |
| |
| Canadian dollar | | The currency of Canada |
| |
| CEO | | Chief Executive Officer |
| |
| CFO | | Chief Financial Officer |
| |
| CGU | | Cash generating unit |
| |
| Code | | The Internal Revenue Code of 1986, as amended |
| |
| Companies Act 2006 | | The Companies Act of England and Wales 2006 |
| |
| the Company | | Pinafore Holdings B.V. unless the context otherwise requires |
| |
| the Co-operative | | Pinafore Coöperatief U.A. |
| |
| the Court | | The High Court of Justice in England and Wales |
| |
| CPPIB | | Canada Pension Plan Investment Board |
| |
| Depository Receipts | | Registered depository receipts of shares in the capital of Pinafore Holdings B.V. |
| |
| Dexter | | Dexter Axle Company Inc and its subsidiaries |
| |
| Director | | A managing director A, B or C on the board of directors of Pinafore Holdings B.V. |
| |
| Dodge | | Dodge Construction Potential Bulletin |
| |
| EBITDA | | Earnings before interest, tax, depreciation and amortization (a non-GAAP measure) |
| |
| ERP | | Enterprise Resource Planning |
| |
| Euro | | The currency of certain member states of the European Union |
| |
| Events | | • the Acquisition; • the incurrence of indebtedness under our senior secured credit facilities and the Second Lien Notes which was used to partially finance the Acquisition; • the tender offer to purchase the outstanding 2011 Notes and 2015 Notes that we made in September 2011 as a requirement of the senior secured credit facility agreement (settlement of the tendered notes occurred in October 2010); • the exercise by certain holders of our 2011 Notes and 2015 Notes of their right to put the notes to us that occurred in November 2010 (the put rights having arisen as a consequence of the ratings downgrade that resulted from the Acquisition); and • the tender offer to purchase the outstanding 2011 Notes that we made in December 2010 as a requirement of the senior secured credit facility agreement (settlement of the tendered notes took place in January 2011). |
Pinafore Holdings B.V.
Glossary of terms
| | |
| Exchange Act | | The Securities Exchange Act of 1934 |
| |
| Exited segments | | Those of the Group’s operating segments that have been exited but do not meet the conditions to be classified as discontinued operations under IFRS |
| |
| FCPA | | US Foreign Corrupt Practices Act of 1977, as amended |
| |
| Fiscal 2007 | | Year ended December 29, 2007 (Predecessor) |
| |
| Fiscal 2008 | | Year ended January 3, 2009 (Predecessor) |
| |
| Fiscal 2009 | | Year ended January 2, 2010 (Predecessor) |
| |
| Fiscal 2010 | | Year ended December 31, 2010 |
| |
| Fiscal 2011 | | Year ended December 31, 2011 (Successor) |
| |
| Fleximak | | Gates Fleximak Ltd |
| |
| Gates or the Gates group | | The Gates Corporation and its related businesses |
| |
| Gates APAC | | Gates Asia and the Pacific regions |
| |
| Gates EMEA | | Gates Europe, Middle East & Africa |
| |
| Gates NA | | Gates North America |
| |
| Gates SA | | Gates South America |
| |
| The General Meeting | | The body of Pinafore Holdings B.V. formed by shareholders and other persons entitled to vote |
| |
| GRDs | | Grilles, registers and diffusers |
| |
| Group | | Except as otherwise indicated or as the context otherwise indicates, in the periods prior to the Acquisition, Tomkins plc and its subsidiaries and, in the period subsequent to the Acquisition, Pinafore Holdings B.V. and its subsidiaries |
| |
| HVAC | | Heating, Ventilation and Air Conditioning |
| |
| I&A | | Industrial and Automotive |
| |
| IASB | | International Accounting Standards Board |
| |
| Ideal | | Epicor Industries Inc and its related businesses, trading as Ideal |
| |
| IFRS | | International Financial Reporting Standards |
| |
| IHS | | IHS Global Insight Inc. |
| |
| Initial Exercise Price | | $1,966.00 per ordinary ‘B’ share, being the exercise price of the first tier of Variable Options |
| |
| Interest coverage ratio | | The ratio of consolidated EBITDA (as defined under the credit agreement) to consolidated net interest (as defined under the credit agreement) |
| |
| IRS | | Internal Revenue Service |
| |
| The Issuers | | The entities that issued the Second Lien Notes, Tomkins, Inc. and Tomkins, LLC |
| |
| McGraw-Hill | | McGraw-Hill Companies |
| |
| Medium Term Notes | | Notes outstanding under Tomkins’ Euro Medium Term Note Programme, comprising the 2011 Notes and the 2015 Notes |
| |
| NAHB | | National Association of Home Builders |
| |
| Net debt | | Net debt (a non-GAAP measure) represents the net total of: • the principal amount of the Group’s borrowings (bank overdrafts and bank and other loans); • the carrying amount of finance lease obligations; • the carrying amount of cash and cash equivalents and collateralized cash (included in trade and other receivables); and • the fair value of the foreign currency derivatives that are held to hedge foreign currency translation exposures. |
| |
| Non-GAAP measure | | A measure of historical or future financial performance, financial position or cash flows which is adjusted to exclude or include amounts that would not be so adjusted in the most comparable measure prescribed by GAAP |
| |
| The Noteholders | | Holders of the Second Lien Notes |
| |
| NYSE | | The New York Stock Exchange |
| |
| OE | | Original equipment |
| |
| OEM | | Original Equipment Manufacturer |
| |
| Onex | | Onex Corporation, a Canadian private equity investor |
| |
| Ongoing segments | | Those of the Group’s operating segments that are ongoing, i.e. not classified as exited segments or classified as discontinued operations under IFRS |
| |
| Ordinary Shares | | Ordinary ‘B’ shares of 1 eurocent (€0.01) each in the capital of Pinafore Holdings B.V. |
| |
| Parallel Debt | | Parallel debt or analogous obligations |
| |
| PBGC | | US Pension Benefit Guarantee Corporation |
Pinafore Holdings B.V.
Glossary of terms
| | |
| Plews | | Plews Inc and its related businesses |
| |
| Predecessor | | The results of Tomkins plc and its subsidiaries for periods prior to the Acquisition on September 24, 2010 |
| |
| Principal Obligations | | The obligations of the Issuers under the indenture governing the Second Lien Notes and the Second Lien Notes. |
| |
| PSP | | The Tomkins 2006 Performance Share Plan |
| |
| Q4 2010 | | 14-week Successor reporting period from September 25, 2010 to December 31, 2010 |
| |
| R&R | | Repair and remodeling |
| |
| Registrant | | Pinafore Holdings B.V. |
| |
| Replacement Options | | As an alternative to the accelerated vesting and payment of outstanding PSP options as a result of the Acquisition, certain members of senior management who are employees and certain other employees who were not resident in the US elected to cancel their PSP awards in exchange for awards of options to purchase equity interests in the Company, termed Replacement Options. The shares covered by each Replacement Option had a market value at the time of the award equal to the market value of the shares subject to the cancelled PSP awards. Each Replacement Option has a nominal exercise price and was fully vested at grant. The Replacement Options will expire on the tenth anniversary of the grant date. |
| |
| Restructuring initiatives | | Major projects undertaken to rationalize and improve the cost competitiveness of the Group. Income and expenses classified as restructuring initiatives comprise expenses incurred in the course of strategic cost management and restructuring projects and gains and losses arising on the exit and disposal of businesses and assets as a result of restructuring initiatives |
| |
| Rolastar | | Rolastar Pvt Ltd |
| |
| Scheme | | The scheme of arrangement under Part 26 of the UK’s Companies Act 2006 used to implement the acquisition of Tomkins plc |
| |
| SEC | | US Securities and Exchange Commission |
| |
| Second Lien Notes | | The Group’s senior secured second lien notes due in 2018 |
| |
| SKUs | | Stock keeping units |
| |
| the SOX Act | | US Sarbanes-Oxley Act of 2002 |
| |
| Sponsors | | A consortium representing the interests of Onex Corporation, a Canadian private equity investor, Onex Partners III and various syndication participants, and the Canada Pension Plan Investment Board |
| |
| Stackpole | | The businesses and operations of Stackpole Limited |
| |
| Successor | | The results of Pinafore Holdings B.V. and its subsidiaries for the periods subsequent to the Acquisition |
| |
| Tomkins | | Tomkins plc and its subsidiaries |
| |
| Total leverage ratio | | the ratio of consolidated total debt (as defined under the credit agreement) to consolidated EBITDA (as defined under the credit agreement) |
| |
| TPMS | | Remote tire pressure monitoring system |
| |
| Trade Control laws | | Laws and regulations governing our international operations, including regulations administered by the US Department of Commerce’s Bureau of Industry and Security, the US Department of Treasury’s Office of Foreign Asset Control, and various non-US government entities, including applicable export control regulations, economic sanctions on countries and persons, customs requirements, currency exchange regulations, and transfer pricing regulations. |
| |
| UK or United Kingdom | | The United Kingdom of Great Britain and Northern Ireland |
| |
| US or United States | | The United States of America, its territories and possessions, any state of the United States and the District of Columbia |
| |
| US GAAP | | Generally accepted accounting principles in the United States of America |
| |
| Variable Options | | An equity incentive plan under which each of the members of senior management who is an employee, and certain other employees, received awards of options to purchase ‘B’ ordinary shares in the Company. Up to 15% of the ordinary share capital of the Company is available for such options on a fully diluted basis. The Variable Options are divided into three tiers with distinct escalating exercise prices for each tier, allowing the option holders to participate in the aggregate in 9%, 12% and 15%, respectively, of the gains of the Company’s equity investors above certain minimum return thresholds. |
Pinafore Holdings B.V.
Signature
Pinafore Holdings B.V. hereby certifies that it meets all of the requirements for filing on Form 20-F, and that it has duly caused and authorized the undersigned to sign this Annual Report on its behalf.
| | |
| Pinafore Holdings B. V. |
|
/s/ John Zimmerman |
|
| By: John Zimmerman |
|
| Principal Financial Officer |
March 8, 2012